icon-smart 2020
TRANSCRIPT
Introduction
The Faculty of Mathematics and Natural Sciences (FMIPA), Universitas Sam Ratulangi (UNSRAT), Manado, Indonesia,
is pleased to be the host of:
The International Conference on Natural Sciences, Mathematics, Applications,
Research, and Technology (ICON-SMART)
which is held virtually on 22-23 October 2020, with the theme: Modeling and Biotechnology for Education, Research, and Industry in the New Normal Era of COVID-19.
The theme of the conference has been chosen in view of the current revolution and rapid
developments in the race to make better, efficient, and sustainable things and productions, the manipulation of materials, the right model, and utilizes living cells and cellular materials to benefit education, research, industry, and society in the New Normal Era of COVID-19.
ICON-SMART 2020 is organised by FMIPA UNSRAT in collaboration with Universitas Pendidikan Ganesha (UNDIKSHA), Universitas Udayana, Universitas Mataram (UNRAM), and Institut Teknologi Sepuluh Nopember (ITS), Indonesia.
The aim is to provide a platform to researchers, academicians, professionals, educators, and industries to share and generate interests in cutting-edge research, applications, education, and technology as well as issues in the related areas of the theme.
Committee Advisory Committee Prof. Dr. Seiya Negami (Yokohama National University, Japan) Prof. Dr. M. Basyaruddin A. Rahman (Universiti Putra Malaysia, Malaysia) Prof. Dr. Prof. Dr. Benjamas Cheirsilp (Prince of Songkla University, Thailand) Prof. Dr. Heike Wagele (Zoologisches Forschungmuseum Alexander Koenig, Germany) Prof. Dr. Ken Seng Tan (University of Waterloo, Canada) Dr. Prasad Kaparaju (Griffith University, Australia) Ariel Liebman, Ph.D. (Monash University, Australia) Prof. Abdul Talib bin Bon (Universiti Tun Hussein Onn, Malaysia) Dr. Suppasil Maneerat (Prince of Songkla University, Thailand) Prof. Sudradjat Supian (Universitas Padjadjaran, Indonesia) Prof. Dr. Basuki Widodo (Institut Teknologi Sepuluh Nopember, Indonesia) Prof. Dr. I Nengah Suparta, M.Si (Universitas Pendidikan Ganesha, Indonesia) Dra. Ni Luh Watiniasih, M.Sc, Ph.D. (Universitas Udayana, Indonesia) Dr. Drs. G. K. Gandhiadi, MT. (Universitas Udayana, Indonesia) Dr. I Made Sukadana. (Universitas Udayana, Indonesia) Prof. Dr. I Wayan Gede Gunawan (Universitas Udayana, Indonesia) Prof. I Made Sudarma, Ph.D (Universitas Mataram, Indonesia) Drs. Dedy Suhendra, M.Si., Ph.D (Universitas Mataram, Indonesia) Prof. Dr. Benny Pinontoan, MSc (Universitas Sam Ratulangi, Indonesia) Scientific Committee Prof. Dr. Ir. John S. Kekenusa, MS (Universitas Sam Ratulangi, Indonesia) Prof. Dr. Mohammad Isa Irawan, MT (Institut Teknologi Sepuluh Nopember, Indonesia) Prof. Dr. Subiono, MS (Institut Teknologi Sepuluh Nopember, Indonesia) Prof. Sapto P. Putro, Ph.D. (Universitas Diponegoro, Indonesia) Dr. Wayan Sukra Warpala, M.Sc. (Universitas Pendidikan Ganesha, Indonesia) Dr. I Wayan Puja Astawa, S.Pd, M.Stat.Sci. (Universitas Pendidikan Ganesha, Indonesia) Prof. Drs. Sariyasa, M.Sc., Ph.D. (Universitas Pendidikan Ganesha, Indonesia) Dr. I Wayan Muderawan, M.S. (Universitas Pendidikan Ganesha, Indonesia) Prof. Dr. Ketut Suma, M.S. (Universitas Pendidikan Ganesha, Indonesia) Dr. Rahadi Wirawan (Universitas Mataram, Indonesia) Drs. Yan Ramona, M.App.Sc., Ph.D. (Universitas Udayana, Indonesia) Ir. I Komang Dharmawan, M.Math, Ph.D. (Universitas Udayana, Indonesia) Dra. Luh Putu Eswaryanti Kusuma Yuni, M.Sc, Ph.D. (Universitas Udayana, Indonesia) Prof. Dr. Herny E. I. Simbala, M.Si (Universitas Sam Ratulangi, Indonesia) Prof. Dr. Ir. Julius Pontoh, M.Sc. (Universitas Sam Ratulangi, Indonesia) Organizing Committee Chair: Ir. Feky R. Mantiri, M.Sc. Ph.D. (Universitas Sam Ratulangi, Indonesia) Co-chair: Dr. Gerald Tamuntuan, S.Si, M.Si. (Universitas Sam Ratulangi, Indonesia) Ni Putu Sri Ratna Dewi, S.Pd, M.Pd. (Universitas Pendidikan Ganesha, Indonesia) Secretary: Chriestie E.J.C. Montolalu, S.Si, M.Sc (Universitas Sam Ratulangi, Indonesia) Vice Secretary: Eneng Tita Tosida, M.Si, M.Kom (Universitas Pakuan, Indonesia)

Treasurer: Julia Titaley,S.Pd.,M.Si (Universitas Sam Ratulangi, Indonesia) Vice Treasurer: Dr. Eva L. Baideng, SP, M.Si (Universitas Sam Ratulangi, Indonesia) Secretariat: Dr. Dra. Sendy B. rondonuwu, M.Si (Universitas Sam Ratulangi, Indonesia) Dr. Stella D. Umboh, M.Si (Universitas Sam Ratulangi, Indonesia) Gayatri Citra Ayuningtyas, S.Far., M.Si, Apt (Universitas Sam Ratulangi, Indonesia) Dr. Ratna Siahaan, M.Si (Universitas Sam Ratulangi, Indonesia) Rinancy Tumilaar, S.Si, M.Si (Universitas Sam Ratulangi, Indonesia) Information Technology: Charles E. Mongi, S.Si, M.Si (Universitas Sam Ratulangi, Indonesia) Handy I.R. Mosey, S.Si, M.Si (Universitas Sam Ratulangi, Indonesia) Fernando D. Pongoh, S.Si, M.Si (Universitas Sam Ratulangi, Indonesia) Mans L. Mananohas, S.Si, M.Si (Universitas Sam Ratulangi, Indonesia) Stevi Tumilantow, SE (Universitas Sam Ratulangi, Indonesia) Sandy Lumintang (Universitas Sam Ratulangi, Indonesia) Millenia Lengkong (Universitas Sam Ratulangi, Indonesia) Angelo Nunumete (Universitas Sam Ratulangi, Indonesia) Mutia Da’I (Universitas Sam Ratulangi, Indonesia) Ghaza Hamid (Universitas Sam Ratulangi, Indonesia) Erin Wotulo (Universitas Sam Ratulangi, Indonesia) Yohanes Runtunuwu (Universitas Sam Ratulangi, Indonesia) Debora Manuputy (Universitas Sam Ratulangi, Indonesia) Mario Barahama (Universitas Sam Ratulangi, Indonesia) Fajar Tubagus (Universitas Sam Ratulangi, Indonesia) Vita Wahyuningsih (Universitas Sam Ratulangi, Indonesia) Hanna Rumengan (Universitas Sam Ratulangi, Indonesia) Jessica Tendean (Universitas Sam Ratulangi, Indonesia) Gilbert Tjakra (Universitas Sam Ratulangi, Indonesia) Graphic and Art Design: Vitrail Mairi (Universitas Sam Ratulangi, Indonesia) Steve Sahese (Universitas Sam Ratulangi, Indonesia) Silvester Marcelino (Universitas Sam Ratulangi, Indonesia) Ceremony: • Dr. Susan Marlein Mambu, SP, M.Si (Universitas Sam Ratulangi, Indonesia) • Luh Mitha Priyanka, S.Pd, M.Pd. (Universitas Pendidikan Ganesha, Indonesia) • Drs. Parluhutan Siahaan, M.Si (Universitas Sam Ratulangi, Indonesia) Proceeding: • Dr. Deiby T. Salaki, S.Si, M.Si. (Universitas Sam Ratulangi, Indonesia) • Prof. Dr. Toni Bakhtiar (Institut Pertanian Bogor, Indonesia) • Prof. Dr. Erna Apriliani (Institut Teknologi Sepuluh Nopember, Indonesia) • Dr. Firman Sukono (Universitas Padjadjaran, Indonesia) • Dr. Islamul Hadi. (Universitas Mataram, Indonesia) • I Putu Pasek Suryawan, S.Pd, M.Pd. (Universitas Pendidikan Ganesha, Indonesia) • Dr. I Gede Aris Gunadi, S.Si., M.Kom. (Universitas Pendidikan Ganesha, Indonesia) • Prof. Dr. I Made Sutajaya, M.Kes. (Universitas Pendidikan Ganesha, Indonesia) • Prof. Dr. Nyoman Wijana, M.Si. (Universitas Pendidikan Ganesha, Indonesia) • I Made Suarsana, S.Pd., M.Sc. (Universitas Pendidikan Ganesha, Indonesia)

• Prof. Dr. Ir. Hery Suyato, MT. (Universitas Udayana, Indonesia) • Dewa Ayu Swastini, S.F, M.Farm, Apt. (Universitas Udayana, Indonesia) • Dr. Drs. I Made Siaka, M.Sc. (Hons) (Universitas Udayana, Indonesia) • Aceng Sambas, M.Sc., Ph.D. (Universitas Muhammadiyah Tasikmalaya, Indonesia) • Altien J. Rindengan, S.Si, M.Kom. (Universitas Sam Ratulangi, Indonesia) • Dr. Farha N.D. Dapas, S.Si, M.Env.Stud (Universitas Sam Ratulangi, Indonesia) • Dr. Henry Aritonang, M.Si. (Universitas Sam Ratulangi, Indonesia) Publicity/Programme: • Prof. dr. Edwin de Queljoe, M.Sc.,Sp.And (Universitas Sam Ratulangi, Indonesia) • Dr. I Nyoman Dodik Prasetia (Universitas Pendidikan Ganesha, Indonesia) • Nurul Fitriyani, M.Si (Universitas Mataram) • Dr. Imam Mukhlash (Institut Teknologi Sepuluh Nopember, Indonesia) • I Ketut Gede Suhartana (Universitas Udayana, Indonesia) • Agus Muliantara, S.Kom, M.Kom. (Universitas Udayana, Indonesia) • Drs. Deny Suhernawan Yusup, M.Sc. (Universitas Udayana, Indonesia) • Dr. Max J. Runtuwene, M.Si (Universitas Sam Ratulangi, Indonesia) • Dr. Hanny F. Sangian, S.Pd, M.Si (Universitas Sam Ratulangi, Indonesia) • Dr. Dewa Katja, M.Si (Universitas Sam Ratulangi, Indonesia) • Dr. Rooije R.H. Rumende, S.Si., M.Kes (Universitas Sam Ratulangi, Indonesia) • Dr. Nelson Nainggolan, M.Si (Universitas Sam Ratulangi, Indonesia) • Paulina V.Y. Yamlean, S.farm., M.Si., Apt (Universitas Sam Ratulangi, Indonesia) Documentation: • Beivy J. Kolondam, S.Si, M.Si., MS (Universitas Sam Ratulangi, Indonesia) Transportation/General: • Verna Suoth, S.Si., M.Si (Universitas Sam Ratulangi, Indonesia) • Novrie Ingkiriwang (Universitas Sam Ratulangi, Indonesia) • Deisco Tuerah (Universitas Sam Ratulangi, Indonesia)
Foreword from the Dean
Faculty of Mathematics and Natural
Sciences, Universitas Sam Ratulangi.
Prof. Dr. Benny Pinontoan, M. Sc.
Welcome to The 1st International Conference On Natural
Sciences, Mathematics, Applications, Research, and
Technology (ICON-SMART) 2020 organized by the Faculty of
Mathematics and Natural Sciences, Universitas Sam Ratulangi
in collaborations with the faculties of mathematics and natural
sciences of Universitas Pendidikan Ganesha, Singaraja, Bali,
Universitas Udayana, Denpasar – Jimbaran, Bali, Universitas
Mataram, Mataram, Nusa Tenggara Barat, dan Institut
Teknologi Sepuluh Nopember, Surabaya, East Java.
Starting from Wuhan China in December 2019, Severe acute respiratory syndrome coronavirus 2
(SARS-CoV-2) has been terrorizing the world. This affects education, research, and industry. This
challenged us to look for suitable modeling and technology, in particular biotechnology, to
handle this problem optimally. This was the motivation to set up Modeling and Biotechnology
for Education, Research, and Industry in the New Normal Era of COVID-19 as the theme of the
event this year.
We have 5 prominent plenary speakers from Australia, Japan, Malaysia, and Thailand, as well as
4 deans and formal dean from partner universities as invited speakers. We have about 300
academicians, researchers, and students from about 70 universities and institutions from about
14 countries registered, which shows a wide range of interests on this topic. Hopefully all papers
can be published in either the IOP Proceeding or in international journals qualified Q2, Q3, or Q4
all indexed in Scopus.
We get full support from and therefore we thank the Rector of Universitas Sam Ratulangi. We
thank the speakers. We are grateful and appreciate the full collaborations of the deans and formal
dean from the partner universities, all participants, and students.
Finally, we hope that you enjoy The 1st ICON-SMART, which is done virtually via Zoom and
Youtube. We also hope that this pandemic caused by SARS CoV-19 will be over soon and we will
meet off line in the 2nd ICON-SMART.
Pakatuan wo Pakalawiden. God bless you.
Foreword from the Chairman of ICON-SMART 2020
Ir. Feky R. Mantiri, M.Sc. Ph.D
This book presents the abstracts of all the papers presented
at the first The International Conference of On Natural
Sciences, Mathematics, Applications, Research, and
Technology (ICON-SMART) 2020. This conference was
supposed to be held as an offline, conventional conference
in Bali. However, due to Covid-19 pandemic, it was modified in terms of the theme, location and
mode of delivery to adapt to existing circumstances as a virtual conference. Arround 200
participants attended the Conference via Zoom. The conference was also streamed live on
Youtube (https://www.youtube.com/watch?v=3705H2CE7EI). Around 185 abstracts for 6
thematical sessions and ten parallel events have been handed in.
The organisers of the conference, the Faculty of Mathematics and Natural Sciences, Sam
Ratulangi University (FMIPA UNSRAT) in collaboration with corresponding Faculties of partner
universities (University of Mataram (UNRAM), University of Udayana (UNUD), Ganesha University
of Education (UNDIKSHA), and Sepuluh Nopember Institute of Technology (UTS) is planning to
publish digital and printed proceedings versions after the conference. It is meant to document
the conference and to serve as a preparation for the second conference that will take place in
2022 in Bali.
All this has been possible thanks to your participation, to our collaborator’s support and to our
helpers involvement. We do hope that you enjoy your attendance at the ICON-SMART 2020!
PAPER LIST Page
Beans Functions, a Mathematical Model for Social Distance Seiya Negami 1
Optimisation, Machine Learning and AI for Rapid Grid Decarbonisation Ariel Liebman 2
Production of Biodiesel Feedstock from Lignocellulosic Biomass by Oleaginous Fungi and Yeasts Benjamas Cheirsilp, Rawitsara Intasit 3
Biomethane Production from Agricultural Crops and Residues for Vehicle Use Prasad Kaparaju 4
Embracing Molecular Simulation Solutions in Sustainable Biocatalysis Mohd Basyaruddin Abdul Rahman 5
On Some Countructions of Graceful Graphs I Nengah Suparta 6
Education Model and Its Challenge in New Normal Era Ni Luh Watiniasih 7
Hydroxamic Acid Derivatives Based Terminalia Catappa L. Seed Oil Dedy Suhendra 8
Magneto-Hydrodynamics (MHD) Viscous Fluid Flow through a Sliced Magnetic Sphere Affected by Mixed Convection Basuki Widodo 9
Phytochemical Screening and Antioxidant Activity of Hippobroma longiflora Extracts Ni Wayan Martiningsih, I Wayan Mudianta, Ida Ayu Putu Suryanti 10
Isolation of Biovanillin Producing Isolates from Decomposed Oil Palm Empty Fruit Bunch Mohamad Rusdi Hidayat, Haqqifizta Ratihwulan 12
The Effect of Coconut Water in Media and Biochemical Compounds of Chrysanthemum in vitro Jeany Mandang 14
PAPER LIST Page
Synthesis of Chitosan-Alginate Beads and Its Application for Alkyl Benzene Sulfonates (ABS) Adsorption Ni Putu Sri Ayuni, I Nyoman Sukarta, Putu Ayu Wulandari 16
Utilization of Khamir (Saccharomyces cerevisiae) as Adsorbent Remazol Red RB Textile Dyes I Nyoman Sukarta, I Dewa Ketut Sastrawidana 18
Utilization of Virgin Coconut Oil that has been Extracted in Phenolic Compounds as Resource of Diethanolamide Surfactants J.H. Mandei, Y.F. Assah, M. Edam 23
Antioxidant Activity and Total Fenol Content of White Saffron (Curcuma mangga Val) Siti Maryam, Ni Wayan Martiningsih 26
Plastic Waste Conversion Reinforced Rice Husk and Red Stone Powder as Partial Fine Aggregate Replacement on Paving Block Production I Dewa Ketut Sastrawidana 28
Ectoine-producing Halophilic Bacteria Isolated from Solar Saltern of Pejarakan Village, Buleleng Regency, Bali, Indonesia I Putu Parwata, Siti Maryam, I Nyoman Tika 30
The Effect of Various Mass Compositions of Fixator Nanopastes on Colour, Fastness, and Mechanical Properties of Cotton Yarns in Natural Green Colour Dyeing using Mangos Leaves Extract I Wayan Karyasa 32
Carbon Impregnated Oxalate (CImOx) to Treatment Chrome Ion (VI) Waste at Analytical Chemistry Laboratory I Ketut Lasia, I Ketut Budiada 34
Effect Of Storage And Ageing Time On Sensorical Quality And Composition Of Wine Phenolic Compounds Improved With Sacharomyces Cereviciae Local Hybrid I Nyoman Tika, I G.A.T. Agustiana, Luh Putu Desy Puspaningrat 36
Antioxidant Activity of Red Algae Macro Eucheuma Cottonii Doty Christy E. Rawis, Lidya I. Momuat, Julius Pontoh 39
Functional Amino Acids and Fatty Acids, and Antibacterial Activity for Enhancing Phytoadditive of Bitter Leaves (Vernonia amygdalina) for Broiler Chickens Jet Saartje Mandey 41
Antioxidant Activity of Red Algae Eucheuma Spinosum J.AGARDH from North Sulawesi Evany C.F. Paulus, Lidya I. Momuat, Julius Pontoh 43
PAPER LIST Page
Synthesis of Ag3PO4/HAp from Red Snapper Bone (Lutjanus spp.) For Photodegradation of Methylene Blue Vannia P.J. Lairah, Audy D. Wuntu, Henry F. Aritonang 46
Phytochemical and Antifungal Activity of Leaf Extract Chisocheton sp. Siska Fauziah, Dewa G. Katja, Lidya I. Momuat 48
Synthesis and Antibacterial Activity HAp/Zeolite-A/Ag of Skipjack Tuna Bones (Katsuwonus pelamis). Grasia Tresna S. Pepah, Audy D. Wuntu, Lidya I. Momuat 51
Production of fish oil rich in omega-3 fatty acids from the head of skipjack fish (Katsuwonus pelamis) Julius Pontoh, Desiree K. Marthin, Meyffi M. Jacobus, Ni M. Megasanti 53
Growth of Glycine Barium Nitrate (GBN) Crystal under Electric Field Effect and its Non-Linear Optical Nature Putu Septian Eka A.P 55
Molecular Docking Studies of(2E)‐1‐(1‐Methyl‐1H‐Indol‐3‐yl)-3-Phenylprop‐2‐en‐1‐one as Antimalarial and Its Synthesis Using Dimethylsulfate K. Mustikasari, J. E. Harap, T. B. Susilo, U.T. Santoso 57
Compositional characteristics and energy potential of livestock manure I M Gunamantha, I Putu Parwata, Made Vivi Oviantari 59
Toxicity Test with BSLT Methodof Sesewanua (Cleodendron squamantum Vahl.) Leaves from Separation of Column Chromatoography Chelsy Gloria Loway, Max R.J. Runtuwene, Vanda S. Kamu 61
Green Synthesis of Silver Nanoparticles using Lantana Camara Fresh Leaf Extract for Colorimetric Detection of Hg2+, Cu2+, Pb2+, and Mn2+ Henry F. Aritonang, Talita M.L. Kojong, Harry Koleangan 63
Chitosan/MgO/Ag Nanocomposite for Potential Antibacterial Application Henry F. Aritonang, Shintya Maryani, Vanda S. Kamu 65
Sangihe Tribe Traditional Medicinal Plants and Biological Activities Max R.J. Runtuwene, Maureen Kumaunang, Vanda S. Kamu, Paulina Veronika Y. Yamlean, Ratna Siahaan 67
The Effectiveness of the Absorption of CO, CH4, CO2, H2S and Pb Gasses by a Mixture of Sansiviera and Coffee Powder M.V. Oviantari, I.M. Gunamantha, I.A.P. Adinda Deviana Pratiwi 71
Absorption of Remazol Red Dye from Textille Waste using Activated Carbon from Coconut Shell Ni Luh Putu Ananda Saraswati, I Dewa Ketut Sastrawidana 73
PAPER LIST Page
Antioxidant and Cytotoxic Activity of Pakaturi (Breynia sp.) Leaves Extract Vanda S. Kamu, Chelsy Loway, Max R.J. Runtuwene, Maureen Kumaunang 75
Citrus Farmers Institutional Studies in Supporting the Role of PTKJS (Integrated Mangement of Healthy Citrus Farming) in Garut Regency Rita Indrasti, Jefny B. Markus Rawung, Noor Roufiq, Neng Risris Sudolar 77
Overproduction and Purification of Organomercuric Lyase (MerB) from Mercury-resistant Bacteria Pseudomonas aeruginosa Isolate 4B2. Fatimawali, Billy J. Kepel, Trina E. Tallei 79
Identification of Phenolic Compounds and Tests Antioxidant Activity from the Extract of Some Fractions Broken-bones Plants (Euphorbia tirucalli L.) Meiske S. Sangi, Jullius Pontoh, Farha N.J. Dapas 81
Increase in Maize Farm Income and Competitiveness in Allocating Labor in North Sulawesi Jefny B. Markus Rawung, Jantje G. Kindangen, Rita Indrasti, Supratman Sirih 83
Training and Implementation of Socio-Cultural Oriented Ergo-Entrepreneurship to Improve Entrepreneurship Attitudes and Health Quality of Serati Banten in Peliatan Village Ubud Gianyar Bali I Made Sutajaya, Desak Made Citrawathi, I Wayan Sukra Warpala 85
Bioprospecting of Culturable Endophytic Bacteria of Mangrove Plants in Manado, North Sulawesi as Potential Producers of Enzymes Agustina Monalisa Tangapo, Febby Ester Fany Kandou, Pience Veralyn Maabuat 88
Molecular-based Inhibition of SAR-CoV-2 RNA-dependent RNA Polymerase using Some Peptides of the Marine Microbal Symbionts I.F.M. Rumengan, H.A. Luntungan, J. Posangi 90
Existing Ascidian Species Associated with Photosyntetic Microbes in Manado Bay, North Sulawesi in 2020 I.F.M. Rumengan, A. Malintoi, M. Siby, V. Warouw, A.B. Rondonuwu 92
Abundance of Microbal Colony Number in Organic Waste with the Addition of Trichoderma spp. for Liquid Fertilizer Ida Ayu Putu Suryanti, I Made Pasek Anton Santiasa, Luh Putu Chandra Apriliani, I Kadek Sandiasa 94
Diversity of Visiting Birds in Rice Field of North Minahasa Regency, North Sulawesi as a Water Birds Protection and Birdwatching Area Saroyo, Parluhutan Siahaan 96
PAPER LIST Page
Murines Species Collected from East Lombok Islamul Hadi, Ye'Muh.Afrizal, Yuliadi Zamroni, Galuh Tresnani 98
Narrative Review: Combination of Bacillus, Aspergillus, and Larva Galleria Mellonella as Plastic Degrades Reka Safitri, Indah Saputri, Abdul Samad Ratuloly, Sukriani Kursia 100
Conservation of Useful Plant Species in the Bukit Kangin Forest, Tenganan Pegringsingan Traditional Village, Karang Asem, Bali Nyoman Wijana, Sanusi Mulyadiharja 103
Useful plant species in the forest of taman gumi banten, wanagiri village, suksada district buleleng, bali Nyoman Wijana, I Made Oka Riawan, I Wayan Sukrawarpala 106
Antibacterial Activities of Pseudomonas orientalis APD 16 Isolate Sponge-Associated Aplysina sp. Against Escherichia Coli And Staphylococcus aureus Delfiani Anggias Putri, Hizkia Puspa Pertiwi, Risky Hadi Wibowo, Sipriyadi, Welly Darwis, Choirul Muslim, Salprima Yudha 109
Distribution of Snakes in West Nusa Tenggara Yuliadi Zamroni, Tizar Gusli, I Wayan Suana, Islamul Hadi 111
Diversity And Activities Pattern Of Nocturnal Mosquitoes In Tegaldowo And Paweden Villages In Pekalongan Regency Central Java, Indonesia Riski Andrian Jasmi, Niken Satuti Nur Handayani, RC. Hidayat Soesilohadi, Raden Roro Upiek Ngesti Wibawaning Astuti 113
Hedonic Quality of Functional Chicken Meat Contains a Lot of Omega-3, and Low Cholesterol Jola J.M.R. Londok, John E.G. Rompis 116
Metal storage in mangrove sediments of bunaken national park James J.H. Paulus, Rignolda Djamaluddin, Hariyani Sambali 118
Coral Transplantation and Coral Fishes Presence in Artificial Substrates in Marine Coastalareas of Poopoh Village, Minahasa Regancy, North Sulawesi in 2020. Rembet U.N.W.J, Ari B. Rondonuwu, L.T.X. Lalamentik 121
Identification of pathogenic bacteria on carp (Cyprinus carpio) commodities at quality control and fishery product safety agency (BKIPM) of bengkulu Risky Hadi Wibowo, Sipriyadi, Welly Darwis, Ema Kurnia Putri, Nadya Rosianti, Della Indah Medani, Gustina Dwi Wulandari, Kukuh Andias Purbianto, Novi Susianti 123
Secondary Metabolite Compounds and Antibacterial Activityof Extracts Annella sp Sea Fans from Bunaken Waters Manado North Sulawesi Indonesia Febby Ester FanyKandou, Remy E.P. Mangindaan, Rizald M. Rompas, Herny I. Simbala, Agustina M. Tangapo, Pience V. Maabuat 125
PAPER LIST Page
Evaluation of The Artificial Substrates Applications in The coastal Areas of Kampung Ambon Village, East Likupang District, North Minahasa Regency (2018 – 2020). Rondonuwu A.B, R.Dj. Moningkey, J.L. Tombokan 128
Isolation and Identification of Cellulase-Producing Endophytic Bacteria from Yellow Root Plants (Arcangelisia flava (L.) Merr) from Enggano Island, Bengkulu Province Sipriyadi, Welly Darwis, Risky Hadi Wibowo, Rochmah Supriati, Stella Reformanda Sembiring, Resli Siboro 130
Threats to Riparian Ecosystem of Lowatag River, Southeast Minahasa Regency, North Sulawesi Province, Indonesia R. Siahaan, M. Mokoginta, C.I.A. Katuche 132
Phytosociology and Stand Biomass Related to Carbon Stock in MountPoteng Nature Tourism Area, West Kalimantan Rafdinal, Rizalinda, Adityo Raynaldo 134
A Preliminary Study on Sumatran Elephant's Fecal DNA in Elephant Training Canter, Way Kambas National Park Savira A. Pritania, Elly L. Rustati, Priyambodo, Eko A. Srihanto, Elisabeth D. Krismurniati, Sukatmoko, Diah E. Anggraini, Mahfud Handoko 136
The Growth of Cayenne Pepper (Capsicum frutescens L.) Using the Application of Mycorrhizae Glomus fasciculatum and Liquid Organic Fertilizer in Peat Soil Riza Linda, Rafdinal, Adityo Raynaldo 138
The Effect of Riparian Vegetation on Stabilize Strambank of Ranoyapo River, North Sulawesi Indonesia R. Siahaan, Nio Song Ai, Henny Lieke Rampe 140
Phytochemical Screening and Antioxidant Activity of Different Solvent Extracts from Phoenix roebelenii Leaves Carla F. Kairupan, Feky R. Mantiri 142
Karyotype Analysis of Onion (Allium ascalonicum L.) Variety Commonly Cultivated in North Sulawesi Marjam M. Toding, Langimanapa Demmassabu, Feky R. Mantiri 144
The Prevalence of Marine Debris in The Mangrove Forest at Pintu Kota, Bitung City Antonius P. Rumengan, Carolus P. Paruntu, James Paulus, Hengky J. Sinjal, Rene Ch. Kepel, Elvis Mandiangan 146
Phytochemical Compounds and Antibacterial Activity to Escherichia coli of Green Macro Algae Ulfa reticulata and Caulerpa racemosa Ketut Srie Marhaeni Julysih 149
PAPER LIST Page
Screening and Characterization of Hydrocarbonoclastic Bacteria from Soil Contaiminated with Used Engine Lubricants that Can Potentially be Used in Bioremediation Feky R. Mantiri, Carla F. Kairupan 151
Giving Tomato Fruit (Solanum lycopersicum) Yogurt on Mice (Mus musculus) toward Blood Cholesterol Ni Luh Putu Manik Widiyanti, I Made Pasek Anton Santiasa, Yeni Dina Puspasari 154
Selection and Breeding Value on Tropical Horses: Case Study Potential Breeding Development on Indonesian Racehorses Ben J. Takaendengan, Sri Adiani, Gertruida J.V. Assa 156
Mortality of Cabbage Crop Larvae (Crocidolomia pavonana) After Application Extract of Pangium sp. and Tithonia diversifolia Eva L. Baideng, Hanny H. Pontororing, Ventje V. Memah 159
The Content of Flavonoids, Tannis and Proteins in Sweet Potatoes (Ipomoea batatas L.) that been given Plant Growth Promoting Rhizobacteria (PGPR) Elicitors Henny L. Rampe, Sendy B. Rondonuwu, Rooije R. Rumende 161
Identification and Bioactivity Test of Padina sp. against Pathogen Bacteria Marina Flora Oktavine Singkoh, Deidy Yulius Katili, Marhaenus Johanis Rumondor 164
Potential Antidegenerative Hypercholesterolemia in Steeping Tea with Combination of Leaves of Pasote (Dysphania ambrosioides L.), Gedi (Abelmoschus Manihot L.), Tapak Dara (Catharanthus Roseus (L.) G. Don) Dingse Pandiangan, Nelson Nainggolan, Michael Vallery Loueis Tumbol, Charles L. Kaunang, Endang Pujiastuti, Hendra Pratama Mailangkay 166
Diversity of Pests and Natural Enemies in Rice Fields in Kiniar Village, East Tondano District, North Sulawesi Parluhutan Siahaan, Saroyo, Marnix L.D. Langoy, Arie J. Saimima 174
Histochemistry of Vegetative and Reproductive Organ Gyrinops versteegii var.brevistipis (Thymelaeaceae) in Lombok Island Tri Mulyaningsih, Ernin Hidayati, Kurniasih Sukenti, Aida Muspiah, Rina Kurnianingsih, Via Febriyanti 176
Concentration analysis of Pb (II) Enceng Gondok (Eichhornia crassipes), Kangkung Air (Ipomoea aquatica), and Kayu Apu (Pistisia stratiotes) in Lake Tempe, South Sulawesi Before Phytoremediation M Nasir, D Pandiangan, S M Mambu, R Irfandi, M Nur 178
Soil Nutrient Availability and Soil Microbes population as Affected by The Application of Organic Amendments in a Degraded Soil of Minahasa, North Sulawesi Susan Marlein Mambu, Agustina Monalisa Tangapo, Beivy Kolondam, Putri Kaharu 181
PAPER LIST Page
Protected and Endangered Butterfly Conservation in Wiau Duasudara Bitung Protected Forest Area, North Sulawesi Hanny H. Pontororing, Handri J. Lengkong, Eva L. Baideng 183
Pesticide Contamination in Phycomycetes Genus Mushrooms as an Indicator of Water Quality for the Sustainability of Tagfish (Oreochromis mossambicus) in Lake Mooat Waters, Modayag District Bolaang Mongondow District Deidy Y. Katili, Stella D. Umboh, Marina O.F. Singkoh 185
Analysis of Population and Diversity of Soil Fertilizer After the Application of Micoriza, Plant Growth Promoting Rhicobacteria (PGPR), and Green Fertilizer in Ubi Jalar Lalu Wahyudi, Stella D. Umboh, Deidy Y. Katili 188
Potential of Bacteria Bacillus sp., Pseudomonas aeruginosa, Pseudomonas sp., and Serratia marcescens, as Agents of Microbial Enhanced Oil Recovery (MEOR) Nia Rossiana, Mia Miranti R, Tasha Stevany 191
Product quality test of pasote tea bags leaves Pasote (Dysphania ambrosioides): Comparison of antioxidant activities of water extract with acetone extract Dingse Pandiangan, Paulina V. Y. Lamlean, Nelson Nainggolan 196
The Developing of Fuzzy System for Multiple Time Series Forecasting with Generated Rule Bases and Optimized Consequence Part Samingun Handoyo, Ying-Ping Chen 200
Determination of the Status of Utilization and Effort of Mackerel Scad (Decapterus spp) caught in the Manado Waters North Sulawesi John S. Kekenusa, Sendy B. Rondonuwu, Marline S. Paendong 204
Geographically and Temporally Weighted Regression (GTWR) Model with Gaussian Kernel Weighted Function and Bisquare Kernel Weighted Function Harianto, Waego Hadi Nugroho, Eni Sumarminingsih 211
Modeling Spatial Variation of Money Laundering Crime in Indonesia using Geographically Weighted Multinomial Logistic Regression A. Yulia, S. Astutik, U. Sa'adah 215
A Discrete Choice Model of Voters' Decision in the General Election 2019 using LASSO Regression Deni Irvani, Khairil Anwar Notodiputro, Bagus Sartono 217
PAPER LIST Page
Study on Generalized Prefer-Opposite (GPO) Algorithm for Construction the de Bruijn Binary Sequence Aisyah Nooravieta Setiawan, Mulia Astuti, Zulfia Memi Mayasari 219
COVID-19 Mathematical Epidemic Model for Impact Analysis of Large Scale Social Restriction: The Case Study of Indonesia Utti Marina Rifanti, Atika Ratna Dewi, Nurlaili, Santika Tri Hapsari 221
A Study on Group LASSO for Grouped Variable Selection in Regression Model E Sunandi, K A Notodoputro, B Sartono 224
GQC Codes Construction Using Gray Map Muhammad Irfan Hidayat, Irwansyah, I Gede Adhitya Wisnu Wardhana 226
Global Stability of a Fractional-Order Leslie-Gower Model including Beddington-DeAngelis Functional Response and Allee Effect in Predator Emli Rahmi, Isnani Darti, Agus Suryanto, Trisilowati 228
Topological Characters on Fuzzy Metric Space Masriani, Qurratul Aini 230
Some Properties of Abelian Code over Group Algebra Zn[G] Daisyah Alifian Fatahillah, Irwansyah, I Gede Adhitya Wisnu Wardhana 234
Some Characteristics Prime Cyclic Ideal On Modulo Gaussian Integer Modulo Ring Wahyu Ulyafandhie Misuki, I Gede Adhitya Wisnu Wardhana, Ni Wayan Switrayni 236
The Use of Pseudo Prior in Bayesian Hidden Markov Model (HMM) Modelling Based on Finite Mixtures of Regression Models Bima Anoraga, Suci Astutik, Ani Budi Astuti 238
Forecasting Indonesian Bank Companies’ Stock Prices using Geometric Brownian Motion Putu Kartika Dewi, I Gusti Nyoman Yudi Hartawan 240
Optimization the Schedule of Teaching and Learning at MI NW I Talun During Pandemic Covid-19 Kamalatul Azmi, Bulqis Nebulla Syechah, Ahmad Tedi Ruslan, Nurhabibah, Evi Yuniartika Asmarani, Ena Setiawana 243
Penalized Logistic Regression Model to Predict a Results of RT-PCR by Using Blood Laboratory Test A Dwinata, K A Notodiputro, B Sartono 245
Stability Analysis of HIV/AIDS Model withThree Control Strategies and Saturated Incidence Rate Marsudi, Trisilowati, Agus suryanto, Isnani Darti 247
PAPER LIST Page
Dynamical Behavior of an HIV/AIDS Epidemic Model with Saturated Incidence Rate and Treatment Marsudi, B. Sugandi, Darmajid 249
Mixed Spline Truncated and Kernel Nonparametric Regression Model on Population Growth Rate in West Nusa Tenggara Province Nurul Fitriyani, Mustika Hadijati, Lisa Harsyiah, Muhammad Sopian 251
Comparison of Spatial Weights in Modeling Inflation and Money Supply Using the Spatial Vector Autoregressive Model with Calendar Variations Eni Sumarminingsih, Setiawan, Agus Suharsono, Budi Nurani Ruchjana 253
Graceful labeling for variation of chain graph I N Budayana, I N Suparta, N K E Nilawati 256
Modeling the Poverty Percentage in Indonesia based on the Human Development Index using Penalized Basis SplinesNonparametric Regression Nurliza Hasanah, Syamsul Bahri, Nurul Fitriyani 258
Inflation Modelling in Indonesia Using Hybrid Autoregressive Integrated Moving Average (ARIMA)-Neural Network (NN) Deni Pratiwi, Mustika Hadijati, Marliadi Susanto 260
The Clique Numbers and Chromatic Numbers of Coprime Graph of Dihedral Group Abdul Gazir Syarifudin, I Gede Adhitya Wisnu Wardhana, Ni Wayan Switrayni, Qurratul Aini 262
IoT based Acid and Salinity Levels Controlling and Monitoring System for Koi Fish Pond Novia Indriani Putri, Damar Widjaja 264
IoT based Trash Can Monitoring System for Smart Garden Cleanliness Fridyastuti Dwi Moris, Damar Widjaja 266
IoT based Soil Moisture and Sun Light Monitoring for Smart Planting Jonathan, Damar Widjaja 268
IoT based Two Levels Feeding System forKoi Fish Pond Febby Lekswina, Damar Widjaja 270
Analysis of the effect of marker types and laminated marker media on the quality of augmented reality of igneous rocks with the marker base method Kadek Surya Adi Saputra, I GedeAris Gunadi, G.Indrawan 272
Intervention Model of IDX Finance Stock for The Period May 2010-May 2020 Due To The Effects Of The Corona Virus Riyana Utami, Mustika Hadijati, I Gede Adhitya Wisnu Wardhana 274
PAPER LIST Page
Sentiment Analys Using Support Vector Machine for Community Compliance Respresentation in the Covid-19 Pandemic Period Eneng Tita Tosida, Krisna, Erniyati 276
On The Representation of The Weight Enumerator of Code 𝒅𝒏+ Mans L. Mananohas, Charles E. Mongi, Dolfie Pandara, Mohammad P. M. M'o, Chriestie E. J. C. Montolalu 278
Edge Irregularity Strength of Some Chain Graphs Kadek Yoga Santhika, I Nengah Suparta 280
Edge Irregularity Strength of Chain Graph 𝐶[𝐶𝑛(𝑚)] for 𝑛 ≡ 1𝑚𝑜𝑑(4) and 𝑚 ≢3𝑚𝑜𝑑(4) Ni Luh Diah Fridayanti Sucita, I Nengah Suparta 283
Designing Nonparametric Spline and Fourier Series Regression Package in Pyhon Programming Language Lalu Abd Azis Mursy, Mustika Hadijati, Irwansyah, Bulqis Nebulla Syechah 285
Approximation Of The Change Point Of Local Stability In A One-Prey Two-Predatorssystem Using Bisection Method M. Putra Sani Hattamurahman, Marwan, Lailia Awalushaumi 287
Edge Irregularity Strength of Chain Graph 𝐶[𝐶𝑛(𝑚)] for 𝑛 = 5, 𝑚 ≢ 3 𝑚𝑜𝑑(4) and
𝑛 = 7, 𝑚 ≢ 1 𝑚𝑜𝑑(4) Ni Luh Putu Dinna Surya Narita, Nengah Suparta 289
Analysis of The Volatility of Fish Prices in Manado City Uses The Multivariate GARCH Model Nelson Nainggolan, Hanny A. H. Komalig, Tohap Manurung 291
Some Properties of The Coprime Graph of Square Matrices over Integer Modulo Qurratul Aini, I Gede Adhitya Wisnu Wardhana, Ni Wayan Switrayni, Irwansyah, Salwa 294
The Effectiveness of ARIMA and Multiscale Autoregressive (MAR) Models with MODWT Decomposition on Non-Stationary Data Puce Angreni, Rahma Fitriani, Suci Astutik 295
Optimal Intervention Model for the Extreme Ideology Transmission Dynamics in a Society Nur Azizah, Toni Bakhtiar, Paian Sianturi 297
Linear Operator on Squence Spaces (𝑁, 𝑞)0, (𝑁, 𝑞), and (𝑁, 𝑞)∞ Salwa, Supama 300

PAPER LIST Page
System Application for Measuring the Freshness Level of Several Consumption Fish in North Sulawesi based on Digital Images of Fish Eyes A J Rindengan, Yohanes A R Langi, Marline S Paendong, C E J C Montolalu, R Tumilaar 302
The Best Allometric Regresian Equations Models to Estimate Biomass and Carbon Stocks of Cempaka Tree at Agroforestry Stand of Minahasa District Yohanes A R Langi, A J Rindengan, C E Mongi, W Appi, M L Mananohas, C E J C Montolalu, F D Pongoh, R Tumilaar, Martina Langi 305
Floyd Warshall Numerical Approach in Optimization of Coral Reef Conservation (Case Study: Bunaken National Park) C E J C Montolalu, S E Chungdinata, L A Latumakulita, D T Salaki, A J Rindengan, Y A R Langi, M L Mananohas 307
Book Embeddings of 3-Crossing-critical Infinite Family of Graphs with Certain Maximum Degrees Benny Pinontoan, Jullia Titaley 309
Study of SEM, XRD, TGA and DSC of Cassava Bioplastics Catalyzed by Ethanol Hanny F. Sangian, Engellita Maneking, Seni H. J. Tongkukut, Handy I.R. Mosey, Verna Suoth, Hesky Kolibu, Adey Tanauma, Guntur Pasau, As'ari As'ari, Vecky A.J. Masinambow, Bayu Achill Sadjab 310
Empirical Attenuation Model for Predicting Peak Ground Acceleration in North Arm Sulawesi, Indonesia G. Pasau, G.H. Tamuntuan, A. Tanauma, D.P. Pandara, F. Ferdy, A. As'ari, C. Maramis 319
Features Extraction and Pattern Sound Analysis of Wijaaksara Script I Gede Aris Gunadi, Dewi Oktofa Rachmawati 321
RSEM Modelling for Eruption Precursors Investigation on Lokon Volcano Vivie Kaendung, Dolfie P. Pandara, Guntur Pasau, Maria D. Bobanto, Ferdi, Delpiero Tampemawas, Gilbert Abidjulu, Fingken Sagai, Richard Telleng 324
Preliminary study of Heat Distribution on Sweet Potatoes Heated by Microwave Gillbert V. Abidjulu, Dolfie P. Pandara, Gerald H. Tamuntuan, Maria D. Bobanto, Heski S. Kolibu, Delpiero Tampenawas, Vivie Kaendung, Fingken Sagai 326
Novel Circular MicrostripPatchAntennaWith Linear Polarization In C-Band Frequency For Communications Putu Artawan, Yono Hadi Pramono, Mashuri, Josaphat T. Sri Sumantyo, Farohaji Kurniawan 328
Grain Shape Analysis of the Volcanic Ash Particle from Soputan Volcano to Investigate Eruption Type Delpiero Tampenawas, Maria Bobanto, Dolfie Pandara, Guntur Pasau, Ferdi, Verna Suoth, Gilbert Abidjulu, Richard Telleng, Vivie Kaendung 331
PAPER LIST Page
Characterization of Volcanic Ash from Explosive Eruption at Soputan Volcano Maria D. Bobanto, Dolfie P. Pandara, Ferdy, Guntur Pasau, Delpiero Tampemawas, Gilbert Abidjuju 333
Surface Wind Pattern during Autonomous CTD Argo Float Movements in the Banda Sea 2017-2018 Alexander Yosep Elake, Moh Isa Rumbory, Pieldrie Nanlohy 335
Identify the Upwelling Area by Chlorophyl-A Variability, Sea Surface Temperature in Northern Sulawesi Waters through Ekman's Transport Jullia Titaley, Kurniati Kemer, Pieldrie Nanlohy 338
Preliminary Study of CNT Growth Through Numerical Analysis of Microwave and Graphite Interaction in MWO Dolfie P. Pandara, Kawilarang W.A. Masengi, Ping A. Angmalisang, Gerald H. Tamuntuan, Maria Bobanto, Gilbert Abidjulu, Fingken Sagai 340
Utilization of Cattle Waste as Raw Material for Making Biogas as Fuel Intended to Bailang Slaughterhouse Power Plant Glanny M C Mangindaan, Lily S. Patras, A Haris J O 342
Propagation and Model of Tsunami Wave in Lembeh Strait, North Sulawesi, Generated by an Earthquake in the Molucca Sea Gerald H. Tamuntuan, Brian B. Mambu, Guntur Pasau, Agnes T. Mandagi, Dolfie P. Pandara, Ferdy 343
Physical Properties of Biocomposite Board Filled with Shell Particle and Coconut Fiber Dewi Oktofa Rachmawati, Putu Widiarini 345
Increasing Antraquinone Compund on Callus Stem of Morinda citrifolia (L.) using Chitosan Elicitor of Shell Shrimps (Penaeus monodon) as Alternative Provicion Medicine W. Purwianingsih, A. Rahmat, I. Asrinah 347
Antioxidant Activity Test of Ethanol Extract Kembang Bulan Leaves and Stems (Thitonia diversifolia (Hemsley) A. Gray) with Various Test Methods Suwahyuni Mus, Syaharuddin Kasim, Enrica Rochmatul, Ni Nyoman Ayu Putri 350
Association of Lymphocyte to Monocyte Ratio with The Severity of Coronary Artery Disease in Elderly Patients Nikita Toding Labi, Frans Wantania 352
PAPER LIST Page
Is There A Need For Health Promotion Tools During The Covid-19 Pandemic To Achieve The Elimination Of Tuberculosis In 2050 Linda Augustien Makalew, Irza Nanda Ranti, DCN, M.Si, Tumartony Hiola, S.Pd, M.Kes. 354
The effect of ph variation on the results of antocianin isolation from dragon fruit using liquid biphasic electric partitioning system Luh Putu Desy Puspaningrat 356
Optimization of Ethanolic Extracts from Pinang Yaki, Gedi Leaves, Goroho Banana Peels Using the Simplex Latice Design Method as a Wound Healing Hydrogel Hosea Jaya Edy, Widya Astuty Lolo, Weny Indayany Wiyono, Mauritius Lambertus Edy Parwanto 359
The Comparison of Mean Platelet Volume and Platelet Lymphocyte Ratio in Medical Students With and Without Central Obesity Ribka Wowor 362
The anti-SARS CoV potential of the bioactive compounds of Moringa oleifera reviewed by in silico analysis Laurensi M. Sasube, Aldian H. Luntungan, Wilma Florencia, Dyta Anggerainy, Rakhmawati Agustina 364
Effect of Brisk Walking to Mean Platelet Volume and Apoliprotein B Levels in Young Adults Central Obese Frans Wantania, Linda Rotty 367
Effects of different drying methods on extractable polyphenol content and antibacterial activity from Anacardium occidentale dried leaves Sukriani Kursia, Reny Syahruni, Hamdayani L.A., Lukman, Amalia Athahira Insani, Silmiah, Sri Wahyuni 369
Analysis of Bioactive Compounds in Snake fruit as Anti-SARS-CoV-2 Lady Theresia Lombogia, Olvie Syenni Datu, Trina Ekawati Tallei 371
Systematic Review on Traditional Medicinal Plants used for the Treatment of Diabetic Mellitus in Kajang, Bulukumba, Indonesia Rian Wahyudi, Ahmad Fadly Perdana, Frilia Puspa, Lukman Muslimin 373
The Influence of Motivation and Work Discipline Towards Employee Performance of Pharmacy Department in Manembo-nembo Bitung Hospital, North Sulawesi, Indonesia G. Citraningtyas, I. Jayanto, R. Tampa'i 375
PAPER LIST Page
Designing Instructional Multimedia of Curved Three-dimensional Geometric Shapes in Junior High Schools throughout Gorontalo Province Nursiya Bito, Sumarno Ismail 377
The Validity of Learning Media in the Course of Assessment and Evaluation of Learning Based on Articulate Storyline 3 Made Juniantari, Gede Saindra Santyadiputra 382
The Effect of Inquiry-based Learning Models and Flipped Classroom on Learning Outcomes and Critical Thinking Skills N K Rapi, I W Suastra, P Widiarini 385
Students' Digital Literacy: A Case Study in the Bali Province, Indonesia I Wayan Redhana, Ida Bagus Nyoman Sudria, I Nyoman Suardana 387
Effect of Parents' Work on Environmental Literacy of High School Students Nyoman Ayu Amardini, Wayan Redhana, I Wayan Suja 389
The Effect of Online Learning on Students' Learning Achievement Ni Kadek Sri Sasmita, Wayan Redhana, Wayan Suja 391
Effect of Gender on Environmental Literacy of High School Students Ni Putu Ayu Parwati, I Wayan Redhana, I Nyoman Suardana 393
Mental Model for Prospective Chemistry Teachers on Electrolite and Nonelectrolite Solutions I Wayan Suja, I Ketut Sudiana, I Wayan Redhana 395
Students' Achievement on Basic Chemistry Concepts using Blended Learning with a Scientific Approach I Nyoman Suardana, I Gusti Lanang Wiratma 397
Improving the Critical Thingking Ability And Responsibility Character Of Learners with Blended Learning Based On Tri Hita Karana Ni Putu Sri Ratna Dewi, Made Oka Riawan 400
Development of Basic Chemistry Practicum I with Occupational Health and Safety (K3) To Prevent Work Accidents in Laboratory I Ketut Sudiana, I Wayan Suja 403
The Feasibility of Interactive Digital Mathematics Book with Multi Representations For Hearing Impaired Students I Made Suarsana, I Made Sugiarta, I K A A Juana Putra, Gede Pande Suarcita, Kadek Yasa Sumalasia, Made Dwiyana Putra 406
PAPER LIST Page
Designing a Problem-based Mathematics Learning with the Integration of Guided Discovery Method Nurhayati Abbas, Perry Zakaria 410
Undagi Bali Ethnomathematic Study in Penglipuran Village and Efforts to Acquire its Knowledge I Putu Pasek Suryawan, Made Juniantari 412
Preview-Review Bilingual Instructional Tools Development with Discovery Learning Model Setting for Enhancing Students’ Conceptual Understanding and Speaking Ability Luh Mitha Priyanka, I Nyoman Selamat 414
Implementation Of Stem Learning Based On Local Wisdom Of Bali “Tri Pramana” To Improve The Science Literation And Character Building Sanjayanti, NPAH, Darmayanti, NWS 416
The Effect of Creative Responsibility Based Learning (CTL) Model on Creative Thinking Skills Assessed From The Self Efficacy Of Grade IV Elementery School Students in Sains Learning I G.A.T. Agustiana, I Nyoman Tika, Made Citra Wibawa 419
STEM Educationthrough modeling in Analytic Geometry (the case of hyperbola) Gede Suweken 422
Initial Design Development of Performance Assessment Methods in Planimetry Lectures I Putu Wisna Ariawan, I Made Ardana 424
Need Assesments as a Foundation to Develop Learning Materials of the Introduction of Astronomy to Improve the Students’ Problem Solving and Generic Science Ability N M Pujani, I Suswandi, P P Juniartina, P H Sudewa 427
Lesson Study in Astrophysics to Improve the Quality of Learning N M Pujani, K Suma, P H Sudewa 430
Improving Student's Mathematical Problem-Solving Skills through Relating-Experiencing-Applying-Cooperating-Transferring Learning Strategy and Graphics Organizer Ni Putu Intan Cahyani, I Made Suarsana, Gusti Ayu Mahayukti 433
Mathematical Problem Solving Ability and Students Motivation in Learning Using Auditory, Intellectually, Repetition Models Ni Nyoman Parwati, I Gusti Putu Suharta 436
PAPER LIST Page
The Effect Of Students Residential Locations on Environmental Literation Profile of High School Students in Bali Province 2020 Ni Wayan Irena Karuni, I Wayan Redhana, I Nyoman Selamat 438
Development of Ethnomatematic Based Geometry Transformation Module to Improve Students Understanding of Concepts and Productive Dispositions N L H Purnamayanti, G Suweken, I W P Astawa 440
Empirical Study on Development and Utility of Media for Biology Instruction of Senior High School in the Singaraja City I Wayan Sukra Warpala, Ni Putu Sri Ratna Dewi 442
Practicality of Teaching Materials Developed by using Problem Based Learning based on PAKEM (Pembelajaran Aktif Kreatif Efektif Menyenangkan) Model on Fraction material in Elementary School Refnywidialistuti, D N Perdana 445
Analysis of Classification Ability as the Basis of Numeric Taxonomic Learning in Animal Biosistematic Lectures Hernawati, Yayan Sanjaya, Fransisca Sudargo, Any Aryani, Zamzam Nursani, Try K. Mutaqien, Dita Puspitasari, Rahadian D. Juansa 447
The Development of Interactive Video Lecture-Authentic Problem Oriented to Enhance Seventh Grade Students Social Arithmetic Concept Comprehension Putu Anita Wulandari 449
Student's Worksheet Practically by Using Discovery Learning Model to The Ability of Understanding Concept and Mathematics Problem Solving at Grade VII Grade of SMPN 38 Padang Teni Suriani, Dewi Devita 453
Intensifying Mathematical Problem Solving Through Scratch Coding in Grade 8th Students Gede Suweken 455
Affecting Addiction Online Game Factors for Private Senior High School Students in Padang City Nela Sari Yolanda, Yessy Marzona 457
Impact of Computer Simulation Assisted Virtual Experiment Module in Learning Hydrogen Atom in Senior High School Ida Bagus Putu Mardana 461
Self Regulated E-learning and Social Attitudes for Achieving Creative Thinking of Students in Learning Physics in High School I Wayan Santyasa, Gede Saindra Santyadiputra, Made Juniantari 463

PAPER LIST Page
Waste Bank : Model and Education Of Organic and Non Organic Waste Processing In Riau Province Prama Widayat, Budi Hamuddin, Heppi Syofya 466

1
Beans Functions, a Mathematical Model for Social Distance Seiya NEGAMI Yokohama National University
Define B(X, x) as the maximum number of points any pair of which have distance at least x in a metric space X. Each edge of a graph G has a unit length 1. The distance d(a, b) between two points a, b on G is defined as the shortest path length along G. B(G, x) (= BG(x) ) counts the maximum number of points placed on G with distance at least x. For example:
1,max),(x
n
n xCB
1),( 1 x
n
n xPB
)0(
)(
)(
)1(
1
1
),(
31
21
31
32
21
32
2)1(
2)1(
22)1(
2)1(
k
k
k
nk
xKB
nn
nn
nnn
nn
n
Since the beans function takes only a natural number as its value for each positive number x,
its graph is not continuous and looks like a step function, which consists of many horizontal line segments. Of course, the beans function is a decreasing function; that is, when x becomes bigger, then the value of the function becomes smaller and the graph goes down. To determine the beans function, we need to decide the height of these steps and dividing points along the x axis. However, there are infinitely many steps. How can we control them? To control them, we have already established a nicest formula. 𝐵𝐺 ( 𝑥1 + 𝑥) = 𝐵𝐺(𝑥) + |𝐸(𝐺)| (𝑥 ≤ 1)
Social distance along streets in a city! As you know, the network of streets or roads in a town or a city can be expressed by a graph with vertices and edges. Of course, each edge corresponds to a street and a vertex corresponds to a crossing of streets. Question is: How many people can stand in this city, keeping social distance? Usually, the social distance is 1 meter or 2 meters. It depends on the government decision against Corona virus infection. However, if we have the beans function of this city, we can answer to this question immediately for any decision of the government. Here you should recall that each edge of my graph has a unit length. Thus, they are supposed to have the same length. But, the streets in a real city will have different lengths in general. In such a case, it is enough to consider a network subdivided by a suitable small unit length.
2
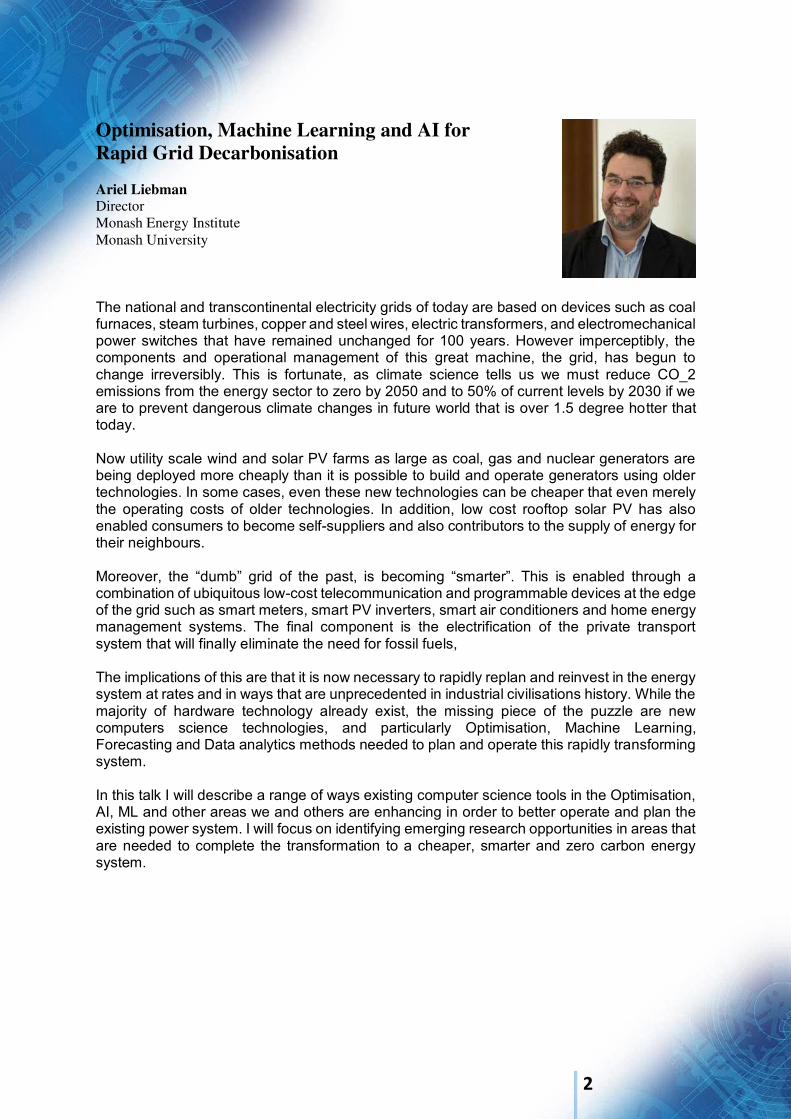
Optimisation, Machine Learning and AI for Rapid Grid Decarbonisation
Ariel Liebman Director Monash Energy Institute Monash University The national and transcontinental electricity grids of today are based on devices such as coal furnaces, steam turbines, copper and steel wires, electric transformers, and electromechanical power switches that have remained unchanged for 100 years. However imperceptibly, the components and operational management of this great machine, the grid, has begun to change irreversibly. This is fortunate, as climate science tells us we must reduce CO_2 emissions from the energy sector to zero by 2050 and to 50% of current levels by 2030 if we are to prevent dangerous climate changes in future world that is over 1.5 degree hotter that today. Now utility scale wind and solar PV farms as large as coal, gas and nuclear generators are being deployed more cheaply than it is possible to build and operate generators using older technologies. In some cases, even these new technologies can be cheaper that even merely the operating costs of older technologies. In addition, low cost rooftop solar PV has also enabled consumers to become self-suppliers and also contributors to the supply of energy for their neighbours. Moreover, the “dumb” grid of the past, is becoming “smarter”. This is enabled through a combination of ubiquitous low-cost telecommunication and programmable devices at the edge of the grid such as smart meters, smart PV inverters, smart air conditioners and home energy management systems. The final component is the electrification of the private transport system that will finally eliminate the need for fossil fuels, The implications of this are that it is now necessary to rapidly replan and reinvest in the energy system at rates and in ways that are unprecedented in industrial civilisations history. While the majority of hardware technology already exist, the missing piece of the puzzle are new computers science technologies, and particularly Optimisation, Machine Learning, Forecasting and Data analytics methods needed to plan and operate this rapidly transforming system. In this talk I will describe a range of ways existing computer science tools in the Optimisation, AI, ML and other areas we and others are enhancing in order to better operate and plan the existing power system. I will focus on identifying emerging research opportunities in areas that are needed to complete the transformation to a cheaper, smarter and zero carbon energy system.

3
Production of Biodiesel Feedstock from Lignocellulosic Biomass by Oleaginous Fungi and Yeasts
Benjamas Cheirsilp and Rawitsara Intasit Center of Excellence in Innovative Biotechnology for Sustainable Utilization of Bioresource, Program of Biotechnology, Faculty of Agro-Industry, Prince of Songkla University, Hat Yai, Songkhla, 90110 Thailand Lignocellulosic biomass are attractive feedstocks for production of biofuel due to their low cost, renewable nature and abundance. This study aimed to produce lipids as biodiesel feedstocks from lignocellulosic biomass by oleaginous fungi and yeasts. Oleaginous fungi could pretreat biomass and simultaneously produce lipids through solid state fermentation (SoSF). After pretreatment, the cellulose content in biomass was increased by 1.27 folds and the fungi also produced lipids at 147-169 mg/g-biomass. The fungal pretreated biomass was used for lipid production by the yeast in separate hydrolysis and fermentation (SHF) and simultaneous saccharification and fermentation (SSF). The yeast gave the maximum lipid yield of 46.7±1.5 mg/g-pretreated biomass through SHF and 52.8±1.26 mg/g-pretreated biomass through SSF. In order to combine the process of enzyme production and lipid production, the fungi was co-cultured with the yeast and this process gave comparable lipid yield of 32.5± 8.7 mg/g-pretreated biomass. The fungal-yeast lipids are composed of palmitic acid, oleic acid, linoleic acid, and stearic acid, which are suitable as biodiesel feedstocks. This study has shown that the promising process for bioconversion of biomass into biodiesel feedstocks.
4
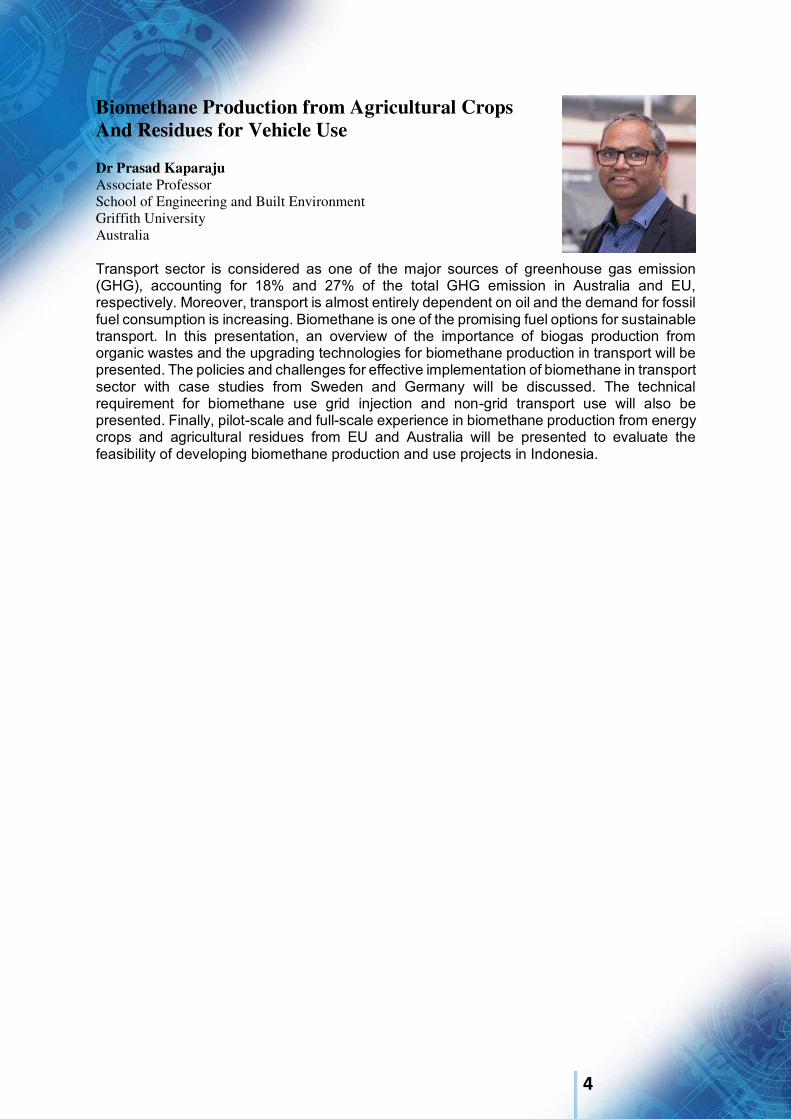
Biomethane Production from Agricultural Crops And Residues for Vehicle Use Dr Prasad Kaparaju Associate Professor School of Engineering and Built Environment Griffith University Australia Transport sector is considered as one of the major sources of greenhouse gas emission (GHG), accounting for 18% and 27% of the total GHG emission in Australia and EU, respectively. Moreover, transport is almost entirely dependent on oil and the demand for fossil fuel consumption is increasing. Biomethane is one of the promising fuel options for sustainable transport. In this presentation, an overview of the importance of biogas production from organic wastes and the upgrading technologies for biomethane production in transport will be presented. The policies and challenges for effective implementation of biomethane in transport sector with case studies from Sweden and Germany will be discussed. The technical requirement for biomethane use grid injection and non-grid transport use will also be presented. Finally, pilot-scale and full-scale experience in biomethane production from energy crops and agricultural residues from EU and Australia will be presented to evaluate the feasibility of developing biomethane production and use projects in Indonesia.
5
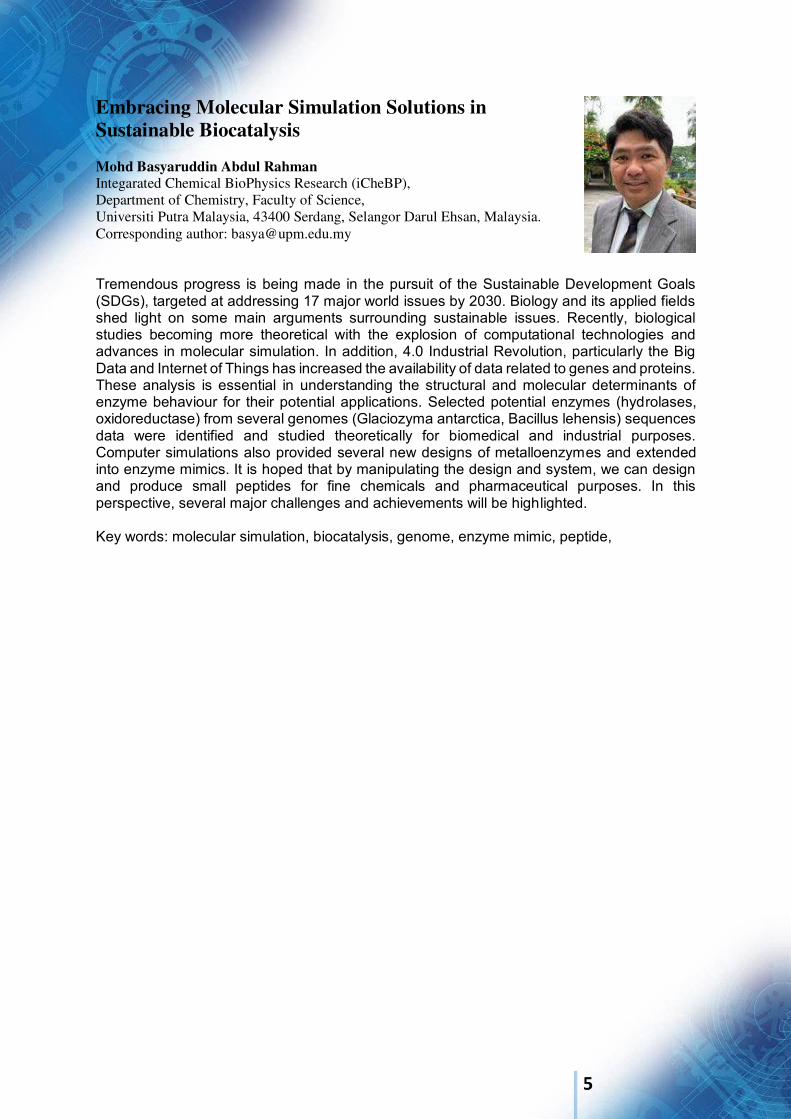
Embracing Molecular Simulation Solutions in Sustainable Biocatalysis Mohd Basyaruddin Abdul Rahman Integarated Chemical BioPhysics Research (iCheBP), Department of Chemistry, Faculty of Science, Universiti Putra Malaysia, 43400 Serdang, Selangor Darul Ehsan, Malaysia. Corresponding author: [email protected] Tremendous progress is being made in the pursuit of the Sustainable Development Goals (SDGs), targeted at addressing 17 major world issues by 2030. Biology and its applied fields shed light on some main arguments surrounding sustainable issues. Recently, biological studies becoming more theoretical with the explosion of computational technologies and advances in molecular simulation. In addition, 4.0 Industrial Revolution, particularly the Big Data and Internet of Things has increased the availability of data related to genes and proteins. These analysis is essential in understanding the structural and molecular determinants of enzyme behaviour for their potential applications. Selected potential enzymes (hydrolases, oxidoreductase) from several genomes (Glaciozyma antarctica, Bacillus lehensis) sequences data were identified and studied theoretically for biomedical and industrial purposes. Computer simulations also provided several new designs of metalloenzymes and extended into enzyme mimics. It is hoped that by manipulating the design and system, we can design and produce small peptides for fine chemicals and pharmaceutical purposes. In this perspective, several major challenges and achievements will be highlighted. Key words: molecular simulation, biocatalysis, genome, enzyme mimic, peptide,
6
On Some Countructions of Graceful Graphs I Nengah Suparta Department of Mathematics - Universitas Pendidikan Ganesha Jalan Udayana 11 Singaraja 81116 Bali - Indonesia Email: [email protected] (Joint work with D.M. Agus Ariawan)
Extended Abstract By a graph G(V,E), we mean finite undirected simple graphs. For a finite set X, |X| stands for the cardinality of X. An injective fucntion f from the set V into the set {0,1,...,|E|} is called graceful labeling, if the set {|f(u) − f(v)| : uv ∈ E,u =6 v} = {1,2,...,|E|}. Graph which admits some graceful labeling is called graceful graph. In general, for an edge uv ∈ E, one reffers the quantity |f(u) − f(v)| as the label of the edge uv. In general, graphs are not graceful. For example, the complete graph of five vertices and the cycle graph of n vertices, with n ≡ 1 and 2( mod 4), are not graceful [1]. However, some classes of graphs are known to be graceful. Paths, stars, and caterpillars, for instance, are graceful. A caterpillar is a graph which becomes
a path after removing all of its pendant vertices. However, the gracefulness of trees are a long standing conjecture [3]. Even, the gracefulness of lobsters, a specific class of trees, are not yet proven [2]. A lobster is a graph which produces caterpillar after deleting all of its pendant vertices. In this talk, we would like to introduce some constructions of graceful graphs. New classes of graceful graphs are introduced based on some of these constructions. Keywords: graceful graph, graceful labeling, constructions. References
[1] J. Pereira, Singh, T., and Arumugam, S., A New Measure for Gracefulness of Graphs, Elect. Notes in Discrete Math., vol. 48, (2015) 275-280.
[2] J.C. Bermond, Graceful graphs, radio antennae and French wind milles, Graph theory and combinatorics, In Research Notes in Math., (Edited by R.J. Wilson), Vol. 34, (1979) 18-39.
[3] A. Rosa, On certain valuations of the vertices of a graph, Theory of Graphs, Internat. Symp., Rome, 1966, (Ed.: P. Rosentiehl), Gordon and Breach, New York and Dunod, Paris, (1967) 349–355.
7
Education Model and Its Challenge in New Normal Era Ni Luh Watiniasih Faculty of Mahematics and Natural Sciences, Universitas Udayana Email: [email protected]
The 4th industrial revolution is transforming the manufacture and industrial activities connected by internet. All information are delivered in little time and can be accessed in one device on hand. Field of education is no exception, following the development of 4th industrial revolution. All activities and information of knowledge are conducted and accessed on internet based. During Covid-19 pandemic and new normal era, the availability of internet supporting the transfer of knowledge to students is mandatory, avoiding direct or close contact among people. There are several teaching methods that can be used, such as case based, project based, problem based learning systems, and others. However, there are some problems still persist. For example in the case of Universitas Udayana. Universitas Udayana has joined the Global Development Learning Network since 2005. In 2015, blended system of lecturing has been introduced with maximum 50% of lecturing can be delivered online, while the other 50% is delivered conventionally (meet in person in classroom). Yet, the readiness of human resources and financial support for students are still lingering. The aged lecturers are not all ready for the system. They may have the ability to operate the system, but not as fast as the young students. The extra financial support to buy the internet quotas for students, as well as the present of internet access from remote area should be considered. Fortunately, in this situation, the Indonesian Government has the initiative to support the students with free internet access for certain amount, and Universitas Udayana provides free internet access within the campus precinct. Due to the covid-19 pandemic and currently in new normal era with restricted access among people, the online learning system in education cannot be avoided. Keywords: industrial revolution, teaching methods, covid-19, new normal, online learning system.
8
HYDROXAMIC ACID DERIVATIVES BASED Terminalia Catappa L. SEED OIL Dedy Suhendra Chemistry Department, Faculty of Mathematics and Natural Sciences, Universitas Mataram, Mataram 83125, Indonesia; Email: [email protected]
Abstract: Fatty hydroxamic acids (FHA) and N-methyl fatty hydroxamic acid (N-MFHA), which are derivatives of hydroxamic acid (HA), was synthesized from ketapang seed oil (Terminalia catappa L.). In general, HA has wide applications due to their chelating properties and
biological activities. FHA and N-MFHA were synthesized using immobilized lipase (Lipozyme TL IM) in biphasic medium which was the ketapang seed oil dissolved in hexane, and hydroxylamine and N-methylhydroxylamine dissolved in water. The products were characterized through color testing and FT-IR spectroscopy after purification. Various factors affecting the enzyme activity investigated in the study included the efect of incubation time, the amount of lipase used, and the temperature. On the basis of these factors, the optimum conditions for the two synthesis reactions were obtained and the average conversion percentages for FHA and N-MFHA were 50% and 60%, respectively. Keywords: ketapang seed oil; fatty hydroxamic acids; N-methyl fatty hydroxamic acid; Lipozyme TL IM
9
Magneto-Hydrodynamics (MHD) Viscous Fluid Flow through a Sliced Magnetic Sphere Affected by Mixed Convection BASUKI WIDODO Department of Mathematics, Faculty of Science and Data Analytics Institut Teknologi Sepuluh Nopember, Surabaya-Indonesia Email: [email protected]
ABSTRACT We consider mathematical modelling of magneto-hydrodynamics viscous fluid flow through a magnetic sliced sphere which is affected by mixed convection force. We therefore develop dimensional governing equations of this problem using the law of the mass conservation, momentum conservation, and energy equation. The governing equations further are converted into non-dimensional equations by using non- dimensional variables. Further, by using similarity equations in which stream function is used to substitute the velocity components towards the axis, we obtain non-linear system equation. This non- linear equation further is solved numerically by using KellerBox scheme. We further take numerical computation to analyze velocity and temperature on front of the lower stagnation of the sliced magnetic sphere when various parameters are included, such as magnetic parameter, mixed convection parameter, Prandtl number, and sliced angle of the sphere. We further obtain numerical solution that when magnetic parameter increases then profile of fluid velocity decreases but the profile of fluid temperature increases. For the mixed convection parameter increases then the velocity profile of the fluid increases but the temperature profile of the fluid decreases. For the Prandtl number parameter increases then both of the velocity and temperature profiles of the fluid decreases, respectively. For the sliced angle parameter increases then the fluid velocity profile increases but the fluid temperature profile decreases. Keywords: Magnetic sliced sphere, viscous fluid, mixed convection and magnetohydrodynamics
10
International Conference on Natural Sciences, Mathematics, Applications, Research, and Technology
Manado, Indonesia, 22-23 October 2020
Phytochemical Screening and Antioxidant Activity of Hippobroma
longiflora Extracts Ni Wayan Martiningsih*1, I Wayan Mudianta2 and Ida Ayu Putu Suryanti3
1, 2 Department of Chemistry, Faculty of Mathematics and Natural Sciences, Universitas Pendidikan Ganesha, INDONESIA. (E-mail: [email protected], [email protected]) 3 Department of Biology and Marine Fisheries, Faculty of Mathematics and Natural Sciences, Universitas
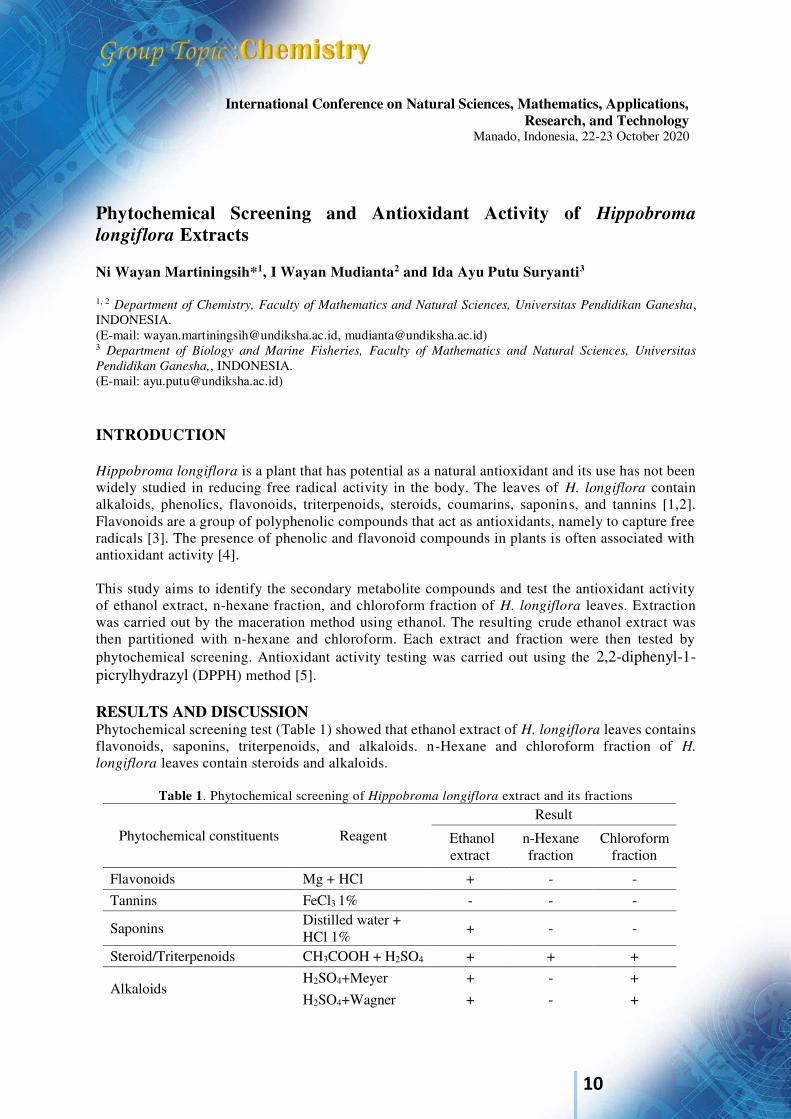
Pendidikan Ganesha,, INDONESIA. (E-mail: [email protected]) INTRODUCTION Hippobroma longiflora is a plant that has potential as a natural antioxidant and its use has not been widely studied in reducing free radical activity in the body. The leaves of H. longiflora contain alkaloids, phenolics, flavonoids, triterpenoids, steroids, coumarins, saponins, and tannins [1,2]. Flavonoids are a group of polyphenolic compounds that act as antioxidants, namely to capture free radicals [3]. The presence of phenolic and flavonoid compounds in plants is often associated with antioxidant activity [4]. This study aims to identify the secondary metabolite compounds and test the antioxidant activity of ethanol extract, n-hexane fraction, and chloroform fraction of H. longiflora leaves. Extraction was carried out by the maceration method using ethanol. The resulting crude ethanol extract was then partitioned with n-hexane and chloroform. Each extract and fraction were then tested by phytochemical screening. Antioxidant activity testing was carried out using the 2,2-diphenyl-1-picrylhydrazyl (DPPH) method [5]. RESULTS AND DISCUSSION Phytochemical screening test (Table 1) showed that ethanol extract of H. longiflora leaves contains flavonoids, saponins, triterpenoids, and alkaloids. n-Hexane and chloroform fraction of H.
longiflora leaves contain steroids and alkaloids.
Table 1. Phytochemical screening of Hippobroma longiflora extract and its fractions
Phytochemical constituents Reagent Result
Ethanol extract
n-Hexane fraction
Chloroform fraction
Flavonoids Mg + HCl + - -
Tannins FeCl3 1% - - -
Saponins Distilled water + HCl 1% + - -
Steroid/Triterpenoids CH3COOH + H2SO4 + + +
Alkaloids H2SO4+Meyer + - +
H2SO4+Wagner + - +
11
Phytochemical constituents Reagent Result
Ethanol extract
n-Hexane fraction
Chloroform fraction
H2SO4+Dragendroff + + + H2SO4+Bounchardat + + +
Based on the results of the antioxidant activity test (Table 2), it was found that the ethanol extract of H. longiflora leaves had very strong antioxidant activity (IC50 value was 9.57 g/mL), n-hexane fraction had strong antioxidant activity (IC50 value was 99.59 g/mL), and the chloroform fraction had very strong antioxidant activity (IC50 value was 48.54 g/mL). The results showed that the antioxidant activity of the ethanol extract was more potent than the n-hexane and chloroform fractions, but smaller than vitamin C.
Table 2. Antioxidant activity of Hippobroma longiflora extract and its fractions
Sample IC50(g/mL) Crude ethanol extract 9,57
n-Hexane fraction 99,59 Chloroform fractions 48,54
Ascorbic acid 4,30 Keywords: antioxidant, DPPH, Hippobroma longiflora, phytochemical screening. Acknowledgment This work was supported by Research and Community Service Institution Universitas Pendidikan Ganesha under Penelitian Dasar scheme 2020 (contract number: 579/UN48.16/LT/2020). References
1. S. Ibrahim, D.R. Rezki, and Afrizal, Isolation and Elucidation Structure of Triterpenoids from Hippobroma longiflora Leaf Extract and Tested of Antibacterial Activity, J. Chem. Pharm. Res., (2017), pp. 205-208.
2. A. Hapsari, D. Asti, Selviana, R. Hidayati, N. Kumalla and A. Suhendi, The Potency of Kitolod (Isotoma longiflora (L) Presl.) Herb Extract as a Cure for Cervical Cancer: an in Vitro Study of Hela Cells, Proceedings ISETH (International Conference on Science, Technology, and Humanity), (2016), pp. 109–114.
3. T. Sathish Kumar, M. Sampath, S.V. Sivachandran, S. Shanmugam, and P. Rajasekaran, Optimal process for the extraction and identification of flavonoids from the leaves of Polyalthia
longifolia using L16 Orthogonal design of experiment, Int. J. Biol. Chem. Sci., (2009), pp. 736-345.
4. M.P. Kähkönen, A.I. Hopia, H.J. Vuorela, J.P. Rauha, K. Pihlaja, T.S. Kujala, and M Heinonen, Antioxidant Activity of Plant Extracts Containing Phenolic Compounds, J. Agric. Food Chem., (1999), pp. 3954-3962.
5. P. Molyneux, The Use of the Stable Free Radical Diphenylpicryl-hidrazyl (DPPH) for Estimating Antioxidant Activity, Songklanakarin J. Sci. Technol., (2004), pp. 211-219.

12
International Conference on Natural Sciences, Mathematics, Applications,
Research, and Technology Manado, Indonesia, 22-23 October 2020
Isolation of Biovanillin Producing Isolates from Decomposed Oil Palm Empty Fruit Bunch Mohamad Rusdi Hidayat*1 and Haqqifizta Ratihwulan1
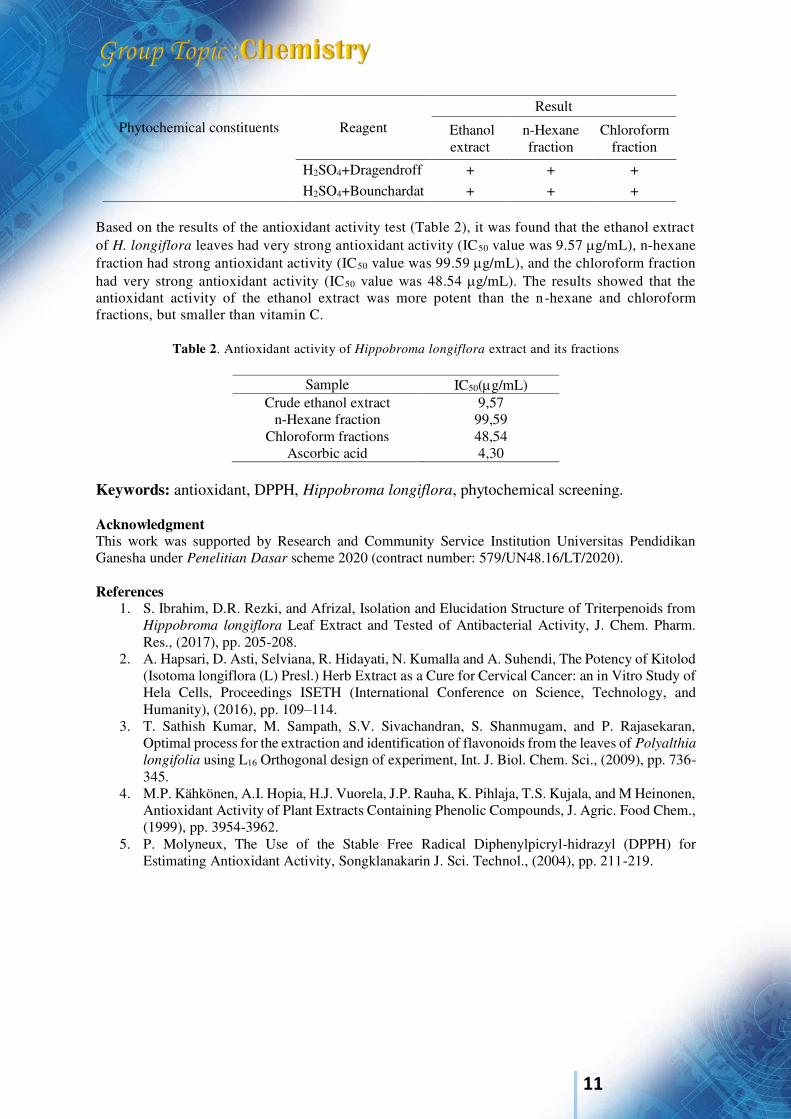
1Institute for Industrial Research and Standardization of Pontianak, Ministry of Industry, INDONESIA. (*E-mail: [email protected]) INTRODUCTION Vanillin (4-Hydroxy-3-methoxybenzaldehyde) is an aromatic compound that is naturally produced by vanilla pods of Vanilla planifolia, V. tahitiensis and V. pompona [1]. Global demand for this commodity is estimated more than 15,000 tonnes each year. Unfortunately, vanillin extracted from natural sources represents less than 1% of annual market demand. The rest of the demand is supplied by synthetic vanillin [2]. Biovanillin is an alternative natural vanillin produced from natural resources of biobased material that is considered safer than synthetic vanillin. Biovanillin is obtained by applying various biotechnological techniques such as microbial bioconversion of substrates like eugenol or ferulic acid. The components of biovanillin mostly consists of vanillin and vanillic acid [3]. Several microorganisms such as Delftia acidivorans [4], Escherichia coli strain JM109 [5], and Amycolatopsis sp. strain Zhp06 [6] have been reported as potential bacteria that can produce biovanillin from ferulic acid by bioconversion. The objective of this study was to isolate potential microbes that could produce biovanillin using ferulic acid as the substrate. Since ferulic acid biodegradation is expected higher in decaying lignocellulosic biomass, decomposed oil palm empty fruit bunch (OPEFB) and the soil beneath OPEFB composting sites were used as the source of the microbes. RESULTS AND DISCUSSION Ferulic acid degrading microbes screening and selection of the isolates capable of producing biovanillin were performed according to Zamzuri et al. (2013) [7] with modifications. A total of 13 isolates, that capable of consuming ferulic acid as a sole carbon source, were obtained. Of which, ten isolates were known could produce biovanillin from ferulic acid. Biovanillin producer is indicated by color changes from blue to yellow in the screening plate. It is assumed that the higher yellow color intensity of the colonies on the plate reflected higher production of vanillic acid [7]. Six potential isolates with the highest yellow color intensity then chosen to be checked for their optimal growth and biovanillin production. Optimum growth for the six isolates was ranging between 48-72 hours. Meanwhile, ferulic acid complete biodegradation occurred in 24-72 hours; except for isolates Vn.B and Vn.C1 that somehow could only degrade around 60% of the ferulic acid (Fig.1).
13
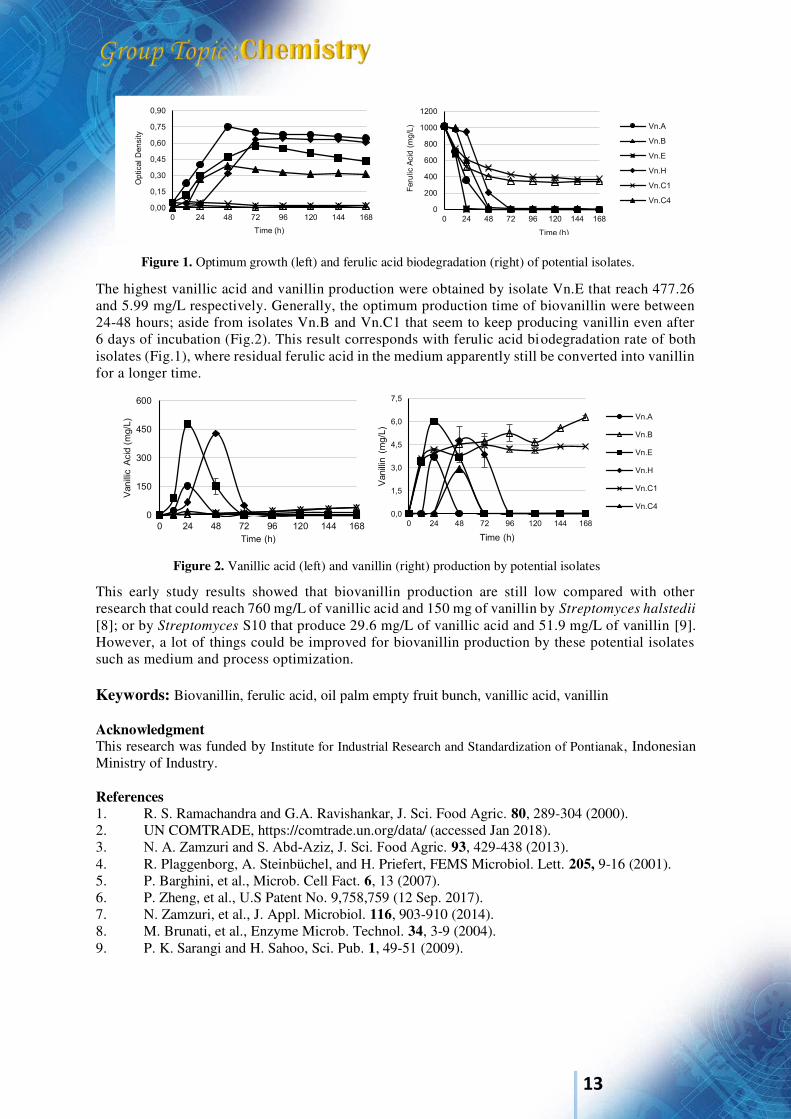
The highest vanillic acid and vanillin production were obtained by isolate Vn.E that reach 477.26 and 5.99 mg/L respectively. Generally, the optimum production time of biovanillin were between 24-48 hours; aside from isolates Vn.B and Vn.C1 that seem to keep producing vanillin even after 6 days of incubation (Fig.2). This result corresponds with ferulic acid biodegradation rate of both isolates (Fig.1), where residual ferulic acid in the medium apparently still be converted into vanillin for a longer time. This early study results showed that biovanillin production are still low compared with other research that could reach 760 mg/L of vanillic acid and 150 mg of vanillin by Streptomyces halstedii
[8]; or by Streptomyces S10 that produce 29.6 mg/L of vanillic acid and 51.9 mg/L of vanillin [9]. However, a lot of things could be improved for biovanillin production by these potential isolates such as medium and process optimization. Keywords: Biovanillin, ferulic acid, oil palm empty fruit bunch, vanillic acid, vanillin Acknowledgment This research was funded by Institute for Industrial Research and Standardization of Pontianak, Indonesian Ministry of Industry. References 1. R. S. Ramachandra and G.A. Ravishankar, J. Sci. Food Agric. 80, 289-304 (2000). 2. UN COMTRADE, https://comtrade.un.org/data/ (accessed Jan 2018). 3. N. A. Zamzuri and S. Abd‐Aziz, J. Sci. Food Agric. 93, 429-438 (2013). 4. R. Plaggenborg, A. Steinbüchel, and H. Priefert, FEMS Microbiol. Lett. 205, 9-16 (2001). 5. P. Barghini, et al., Microb. Cell Fact. 6, 13 (2007). 6. P. Zheng, et al., U.S Patent No. 9,758,759 (12 Sep. 2017). 7. N. Zamzuri, et al., J. Appl. Microbiol. 116, 903-910 (2014). 8. M. Brunati, et al., Enzyme Microb. Technol. 34, 3-9 (2004). 9. P. K. Sarangi and H. Sahoo, Sci. Pub. 1, 49-51 (2009).
0,00
0,15
0,30
0,45
0,60
0,75
0,90
0 24 48 72 96 120 144 168
Op
tical D
en
sity
Time (h)
0
200
400
600
800
1000
1200
0 24 48 72 96 120 144 168
Feru
lic A
cid
(m
g/L
)
Time (h)
Vn.A
Vn.B
Vn.E
Vn.H
Vn.C1
Vn.C4
Figure 1. Optimum growth (left) and ferulic acid biodegradation (right) of potential isolates.
0
150
300
450
600
0 24 48 72 96 120 144 168
Vanill
ic A
cid
(m
g/L
)
Time (h)
0,0
1,5
3,0
4,5
6,0
7,5
0 24 48 72 96 120 144 168
Vanill
in (
mg/L
)
Time (h)
Vn.A
Vn.B
Vn.E
Vn.H
Vn.C1
Vn.C4
Figure 2. Vanillic acid (left) and vanillin (right) production by potential isolates

14
International Conference on Natural Sciences, Mathematics, Applications, Research, and Technology
Manado, Indonesia, 22-23 October 2020
The effect of Coconut Water in Media and Biochemical compounds of Chrysanthemum in vitro 1Jeany Mandang
1Agronomy Department, Sam Ratulangi University, Indonesia (E-mail: [email protected]) INTRODUCTION The use of coconut water in tissue culture has been shown to promote plant growth. Furthermore, Mandang (1995) reported that coconut water of tenga variety have almost similar composition with Murasigh and Skoog (MS). Therefore, it is recommended to be used for media MS substitution to promote chrysanthemum growth (Mandang, 2017). This study aims to determine the characteristic of MS media added with coconut water, the nutrient efficiency, and the biochemical compound in chrysanthemum. This research adopted a randomized design which included experiment 1, the substitution of MS media with coconut water (0, 10, 20, 30, 40 and 50%). Experiment 2, MS media added with coconut water (0, 15 and 30%) combined with Plant growth regulator IAA (0, and 0.1 mg/l) and BAP (0 and 0.5 mg/l). The explant was clean chrysanthemum cultured in MS media without plant regulator. RESULT AND DISCUSSION The experiment 1 result showed that the high level of Murasighe and Skoog (MS) media substitution with coconut water decreased the changes in pH. At 50% substitution, the change in pH level was only 0.15 unit, while in the media without any replacement it was 1.3 unit. However, the buffer capacity of the media (at the 50% substitution) was higher compared to no substitution, 6.66 nM NaOH vs 0.77 mM NaOH respectively. In Experiment 2, the MS media added with coconut water increased Chrysanthemum growth. After 12 weeks of culture, it produced 0.15 g, while those without coconut water only produced 0.11 g dry weight / explant. The pH level of the MS media when the coconut water was added, changed after 12 weeks of culture, from 5.8 to 5.09, while without it, decreased to 4.07. The two experiments showed that coconut water treatment maintained the stability of the media's pH, since it contained several organic acids (malic, succinic, and citric). These results supported the findings of Chaleff (1983) in George and Sherrington (1984) that the presence of organic acid buffers prevents a decrease in media pH. Which also showed an increase in media buffer capacity with the use of coconut water (Table 1). Table 1. Changes in pH and buffer capacity of MS media substituted with coconut water
Coconut Water (level substitution %)
Changes in pH (after adding 1cc NaOH 1N)
Buffer Media Capacity (mM NaOH)
0 1.30 0.77 10 0.63 1.58 20 0.40 2.50 30 0.24 4.17 40 0.20 5.00 50 0.15 6.66 Coconut water 0.23 4.35
15
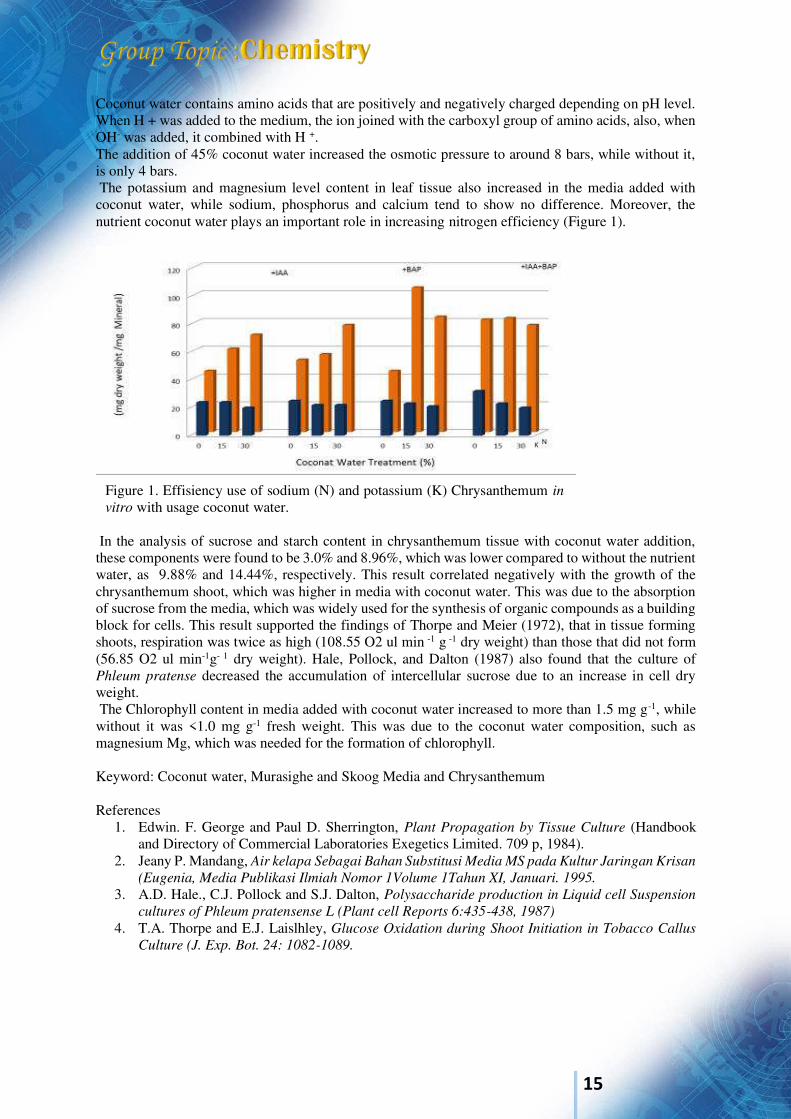
Coconut water contains amino acids that are positively and negatively charged depending on pH level. When H + was added to the medium, the ion joined with the carboxyl group of amino acids, also, when OH- was added, it combined with H +. The addition of 45% coconut water increased the osmotic pressure to around 8 bars, while without it, is only 4 bars. The potassium and magnesium level content in leaf tissue also increased in the media added with coconut water, while sodium, phosphorus and calcium tend to show no difference. Moreover, the nutrient coconut water plays an important role in increasing nitrogen efficiency (Figure 1).
Figure 1. Effisiency use of sodium (N) and potassium (K) Chrysanthemum in
vitro with usage coconut water. In the analysis of sucrose and starch content in chrysanthemum tissue with coconut water addition, these components were found to be 3.0% and 8.96%, which was lower compared to without the nutrient water, as 9.88% and 14.44%, respectively. This result correlated negatively with the growth of the chrysanthemum shoot, which was higher in media with coconut water. This was due to the absorption of sucrose from the media, which was widely used for the synthesis of organic compounds as a building block for cells. This result supported the findings of Thorpe and Meier (1972), that in tissue forming shoots, respiration was twice as high (108.55 O2 ul min -1 g -1 dry weight) than those that did not form (56.85 O2 ul min-1g- 1 dry weight). Hale, Pollock, and Dalton (1987) also found that the culture of Phleum pratense decreased the accumulation of intercellular sucrose due to an increase in cell dry weight. The Chlorophyll content in media added with coconut water increased to more than 1.5 mg g-1, while without it was <1.0 mg g-1 fresh weight. This was due to the coconut water composition, such as magnesium Mg, which was needed for the formation of chlorophyll. Keyword: Coconut water, Murasighe and Skoog Media and Chrysanthemum References
1. Edwin. F. George and Paul D. Sherrington, Plant Propagation by Tissue Culture (Handbook and Directory of Commercial Laboratories Exegetics Limited. 709 p, 1984).
2. Jeany P. Mandang, Air kelapa Sebagai Bahan Substitusi Media MS pada Kultur Jaringan Krisan
(Eugenia, Media Publikasi Ilmiah Nomor 1Volume 1Tahun XI, Januari. 1995. 3. A.D. Hale., C.J. Pollock and S.J. Dalton, Polysaccharide production in Liquid cell Suspension
cultures of Phleum pratensense L (Plant cell Reports 6:435-438, 1987) 4. T.A. Thorpe and E.J. Laislhley, Glucose Oxidation during Shoot Initiation in Tobacco Callus
Culture (J. Exp. Bot. 24: 1082-1089.
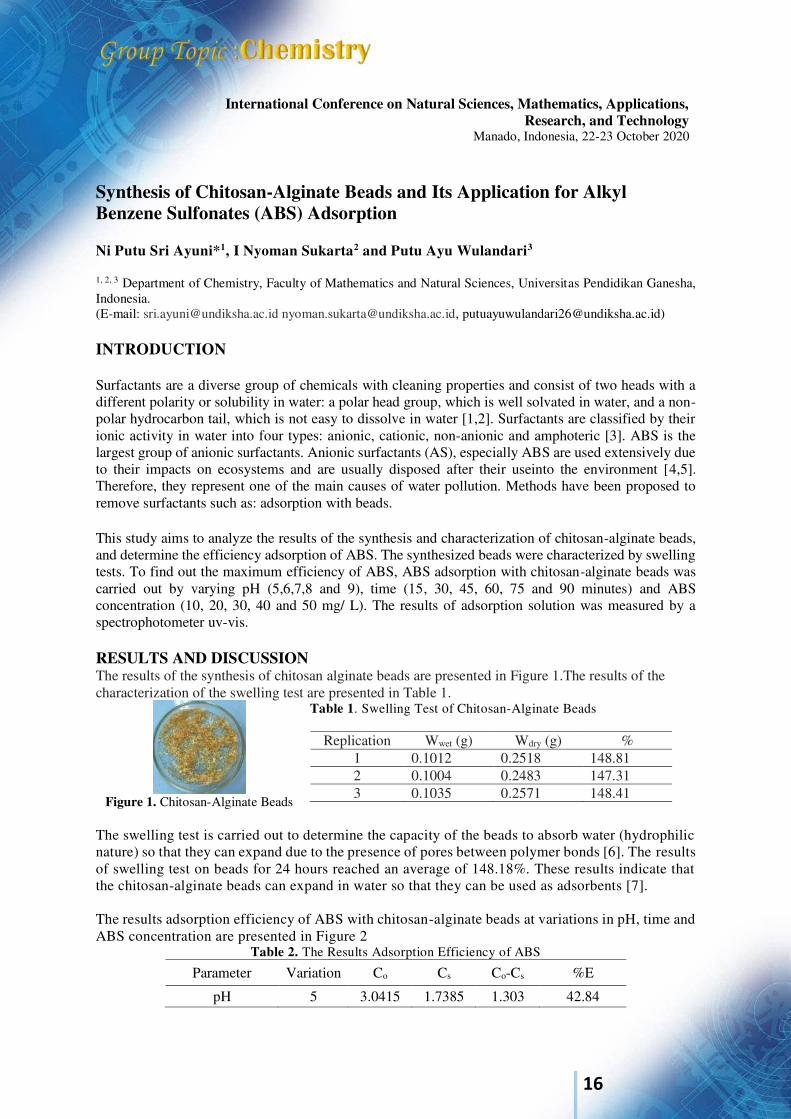
16
International Conference on Natural Sciences, Mathematics, Applications, Research, and Technology
Manado, Indonesia, 22-23 October 2020
Synthesis of Chitosan-Alginate Beads and Its Application for Alkyl Benzene Sulfonates (ABS) Adsorption Ni Putu Sri Ayuni*1, I Nyoman Sukarta2 and Putu Ayu Wulandari3
1, 2, 3 Department of Chemistry, Faculty of Mathematics and Natural Sciences, Universitas Pendidikan Ganesha, Indonesia. (E-mail: [email protected] [email protected], [email protected]) INTRODUCTION Surfactants are a diverse group of chemicals with cleaning properties and consist of two heads with a different polarity or solubility in water: a polar head group, which is well solvated in water, and a non-polar hydrocarbon tail, which is not easy to dissolve in water [1,2]. Surfactants are classified by their ionic activity in water into four types: anionic, cationic, non-anionic and amphoteric [3]. ABS is the largest group of anionic surfactants. Anionic surfactants (AS), especially ABS are used extensively due to their impacts on ecosystems and are usually disposed after their useinto the environment [4,5]. Therefore, they represent one of the main causes of water pollution. Methods have been proposed to remove surfactants such as: adsorption with beads. This study aims to analyze the results of the synthesis and characterization of chitosan-alginate beads, and determine the efficiency adsorption of ABS. The synthesized beads were characterized by swelling tests. To find out the maximum efficiency of ABS, ABS adsorption with chitosan-alginate beads was carried out by varying pH (5,6,7,8 and 9), time (15, 30, 45, 60, 75 and 90 minutes) and ABS concentration (10, 20, 30, 40 and 50 mg/ L). The results of adsorption solution was measured by a spectrophotometer uv-vis. RESULTS AND DISCUSSION The results of the synthesis of chitosan alginate beads are presented in Figure 1.The results of the characterization of the swelling test are presented in Table 1.
Figure 1. Chitosan-Alginate Beads
Table 1. Swelling Test of Chitosan-Alginate Beads
Replication Wwet (g) Wdry (g) % 1 0.1012 0.2518 148.81 2 0.1004 0.2483 147.31 3 0.1035 0.2571 148.41
The swelling test is carried out to determine the capacity of the beads to absorb water (hydrophilic nature) so that they can expand due to the presence of pores between polymer bonds [6]. The results of swelling test on beads for 24 hours reached an average of 148.18%. These results indicate that the chitosan-alginate beads can expand in water so that they can be used as adsorbents [7]. The results adsorption efficiency of ABS with chitosan-alginate beads at variations in pH, time and ABS concentration are presented in Figure 2
Table 2. The Results Adsorption Efficiency of ABS
Parameter Variation Co Cs Co-Cs %E
pH 5 3.0415 1.7385 1.303 42.84
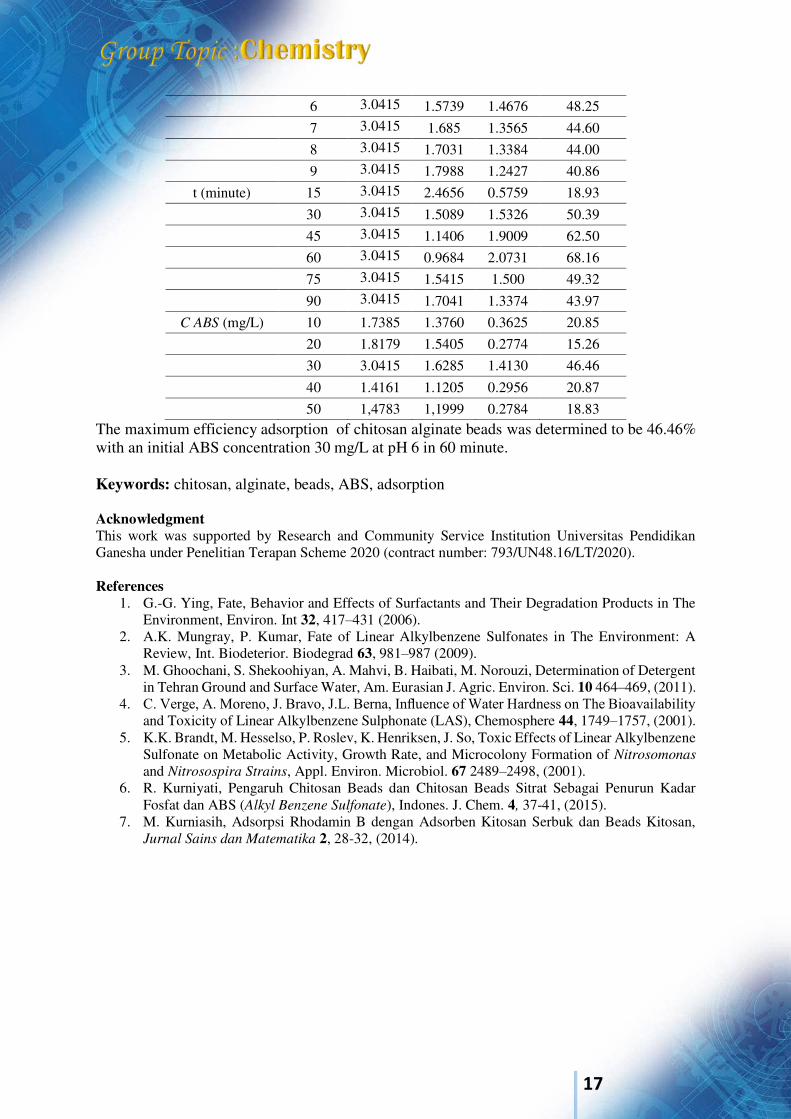
17
6 3.0415 1.5739 1.4676 48.25
7 3.0415 1.685 1.3565 44.60
8 3.0415 1.7031 1.3384 44.00
9 3.0415 1.7988 1.2427 40.86
t (minute) 15 3.0415 2.4656 0.5759 18.93
30 3.0415 1.5089 1.5326 50.39
45 3.0415 1.1406 1.9009 62.50
60 3.0415 0.9684 2.0731 68.16
75 3.0415 1.5415 1.500 49.32
90 3.0415 1.7041 1.3374 43.97
C ABS (mg/L) 10 1.7385 1.3760 0.3625 20.85
20 1.8179 1.5405 0.2774 15.26
30 3.0415 1.6285 1.4130 46.46
40 1.4161 1.1205 0.2956 20.87
50 1,4783 1,1999 0.2784 18.83 The maximum efficiency adsorption of chitosan alginate beads was determined to be 46.46% with an initial ABS concentration 30 mg/L at pH 6 in 60 minute. Keywords: chitosan, alginate, beads, ABS, adsorption Acknowledgment This work was supported by Research and Community Service Institution Universitas Pendidikan Ganesha under Penelitian Terapan Scheme 2020 (contract number: 793/UN48.16/LT/2020). References
1. G.-G. Ying, Fate, Behavior and Effects of Surfactants and Their Degradation Products in The Environment, Environ. Int 32, 417–431 (2006).
2. A.K. Mungray, P. Kumar, Fate of Linear Alkylbenzene Sulfonates in The Environment: A Review, Int. Biodeterior. Biodegrad 63, 981–987 (2009).
3. M. Ghoochani, S. Shekoohiyan, A. Mahvi, B. Haibati, M. Norouzi, Determination of Detergent in Tehran Ground and Surface Water, Am. Eurasian J. Agric. Environ. Sci. 10 464–469, (2011).
4. C. Verge, A. Moreno, J. Bravo, J.L. Berna, Influence of Water Hardness on The Bioavailability and Toxicity of Linear Alkylbenzene Sulphonate (LAS), Chemosphere 44, 1749–1757, (2001).
5. K.K. Brandt, M. Hesselso, P. Roslev, K. Henriksen, J. So, Toxic Effects of Linear Alkylbenzene Sulfonate on Metabolic Activity, Growth Rate, and Microcolony Formation of Nitrosomonas and Nitrosospira Strains, Appl. Environ. Microbiol. 67 2489–2498, (2001).
6. R. Kurniyati, Pengaruh Chitosan Beads dan Chitosan Beads Sitrat Sebagai Penurun Kadar Fosfat dan ABS (Alkyl Benzene Sulfonate), Indones. J. Chem. 4, 37-41, (2015).
7. M. Kurniasih, Adsorpsi Rhodamin B dengan Adsorben Kitosan Serbuk dan Beads Kitosan, Jurnal Sains dan Matematika 2, 28-32, (2014).
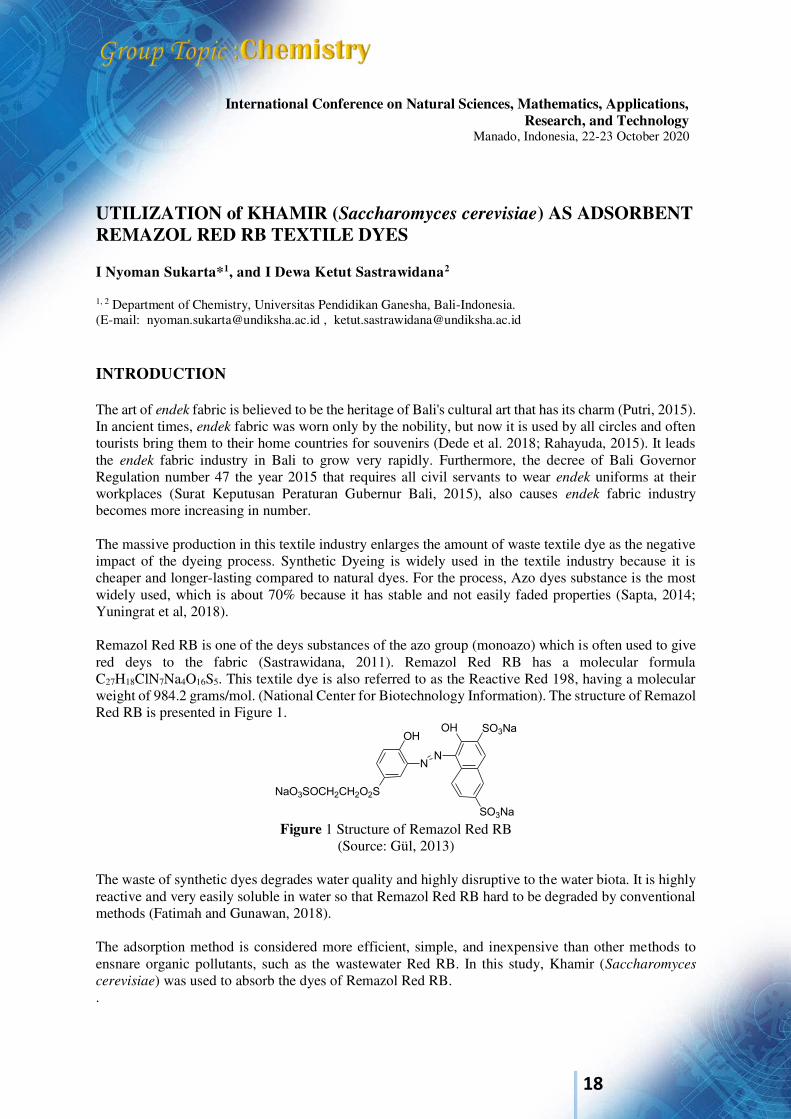
18
International Conference on Natural Sciences, Mathematics, Applications, Research, and Technology
Manado, Indonesia, 22-23 October 2020
UTILIZATION of KHAMIR (Saccharomyces cerevisiae) AS ADSORBENT REMAZOL RED RB TEXTILE DYES I Nyoman Sukarta*1, and I Dewa Ketut Sastrawidana2
1, 2 Department of Chemistry, Universitas Pendidikan Ganesha, Bali-Indonesia. (E-mail: [email protected] , [email protected] INTRODUCTION The art of endek fabric is believed to be the heritage of Bali's cultural art that has its charm (Putri, 2015). In ancient times, endek fabric was worn only by the nobility, but now it is used by all circles and often tourists bring them to their home countries for souvenirs (Dede et al. 2018; Rahayuda, 2015). It leads the endek fabric industry in Bali to grow very rapidly. Furthermore, the decree of Bali Governor Regulation number 47 the year 2015 that requires all civil servants to wear endek uniforms at their workplaces (Surat Keputusan Peraturan Gubernur Bali, 2015), also causes endek fabric industry becomes more increasing in number. The massive production in this textile industry enlarges the amount of waste textile dye as the negative impact of the dyeing process. Synthetic Dyeing is widely used in the textile industry because it is cheaper and longer-lasting compared to natural dyes. For the process, Azo dyes substance is the most widely used, which is about 70% because it has stable and not easily faded properties (Sapta, 2014; Yuningrat et al, 2018). Remazol Red RB is one of the deys substances of the azo group (monoazo) which is often used to give red deys to the fabric (Sastrawidana, 2011). Remazol Red RB has a molecular formula C27H18ClN7Na4O16S5. This textile dye is also referred to as the Reactive Red 198, having a molecular weight of 984.2 grams/mol. (National Center for Biotechnology Information). The structure of Remazol Red RB is presented in Figure 1.
OH
NaO3SOCH2CH2O2S
NN
OH SO3Na
SO3Na Figure 1 Structure of Remazol Red RB
(Source: Gül, 2013) The waste of synthetic dyes degrades water quality and highly disruptive to the water biota. It is highly reactive and very easily soluble in water so that Remazol Red RB hard to be degraded by conventional methods (Fatimah and Gunawan, 2018). The adsorption method is considered more efficient, simple, and inexpensive than other methods to ensnare organic pollutants, such as the wastewater Red RB. In this study, Khamir (Saccharomyces
cerevisiae) was used to absorb the dyes of Remazol Red RB. .
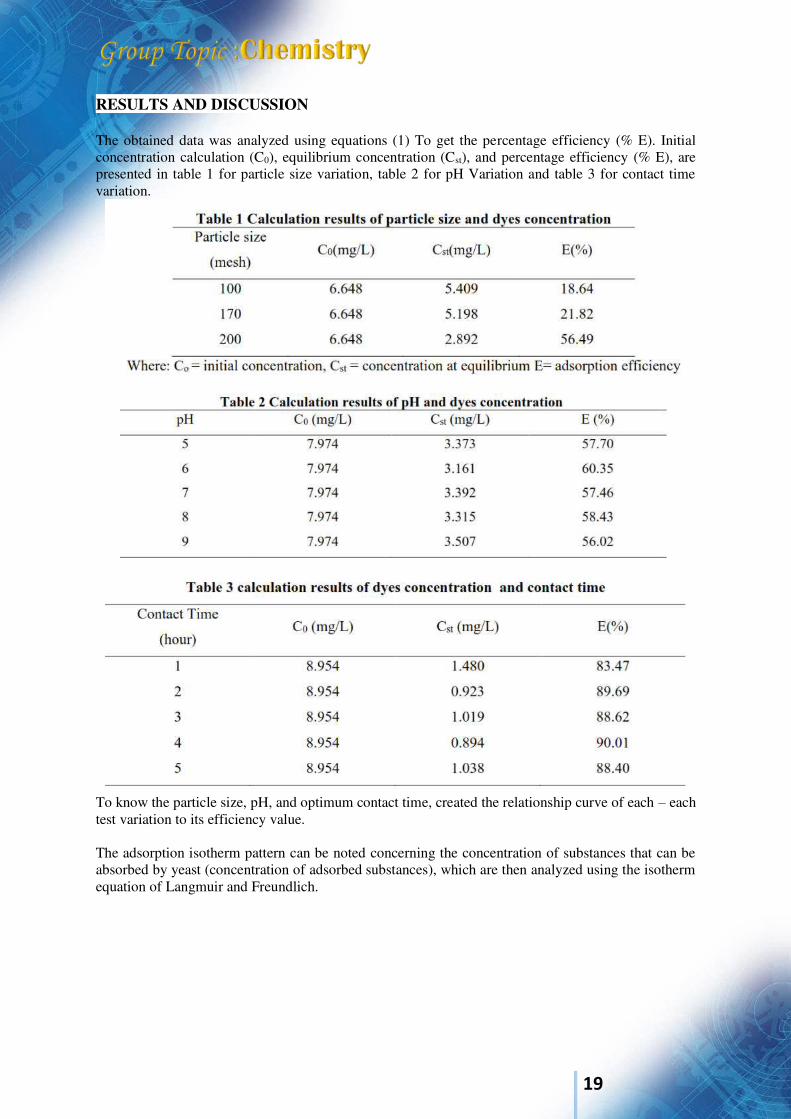
19
RESULTS AND DISCUSSION The obtained data was analyzed using equations (1) To get the percentage efficiency (% E). Initial concentration calculation (C0), equilibrium concentration (Cst), and percentage efficiency (% E), are presented in table 1 for particle size variation, table 2 for pH Variation and table 3 for contact time variation.
To know the particle size, pH, and optimum contact time, created the relationship curve of each – each test variation to its efficiency value.
The adsorption isotherm pattern can be noted concerning the concentration of substances that can be absorbed by yeast (concentration of adsorbed substances), which are then analyzed using the isotherm equation of Langmuir and Freundlich.
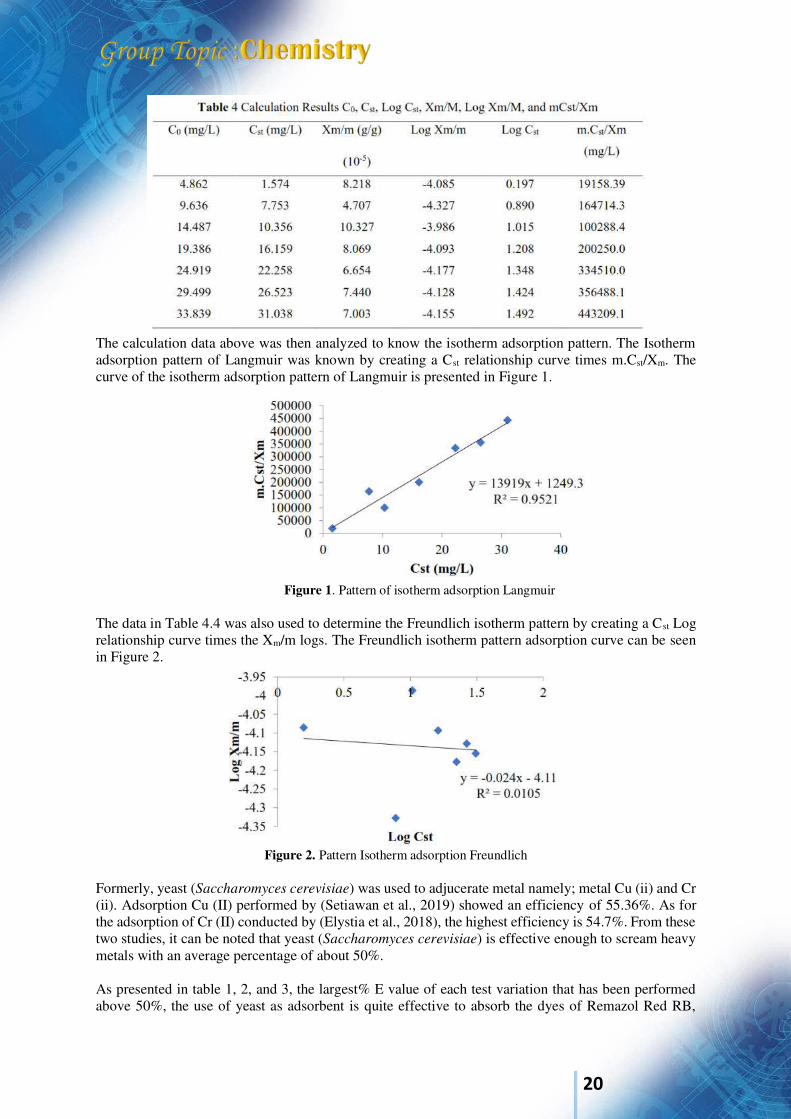
20
The calculation data above was then analyzed to know the isotherm adsorption pattern. The Isotherm adsorption pattern of Langmuir was known by creating a Cst relationship curve times m.Cst/Xm. The curve of the isotherm adsorption pattern of Langmuir is presented in Figure 1.
Figure 1. Pattern of isotherm adsorption Langmuir
The data in Table 4.4 was also used to determine the Freundlich isotherm pattern by creating a Cst Log relationship curve times the Xm/m logs. The Freundlich isotherm pattern adsorption curve can be seen in Figure 2.
Figure 2. Pattern Isotherm adsorption Freundlich
Formerly, yeast (Saccharomyces cerevisiae) was used to adjucerate metal namely; metal Cu (ii) and Cr (ii). Adsorption Cu (II) performed by (Setiawan et al., 2019) showed an efficiency of 55.36%. As for the adsorption of Cr (II) conducted by (Elystia et al., 2018), the highest efficiency is 54.7%. From these two studies, it can be noted that yeast (Saccharomyces cerevisiae) is effective enough to scream heavy metals with an average percentage of about 50%. As presented in table 1, 2, and 3, the largest% E value of each test variation that has been performed above 50%, the use of yeast as adsorbent is quite effective to absorb the dyes of Remazol Red RB,
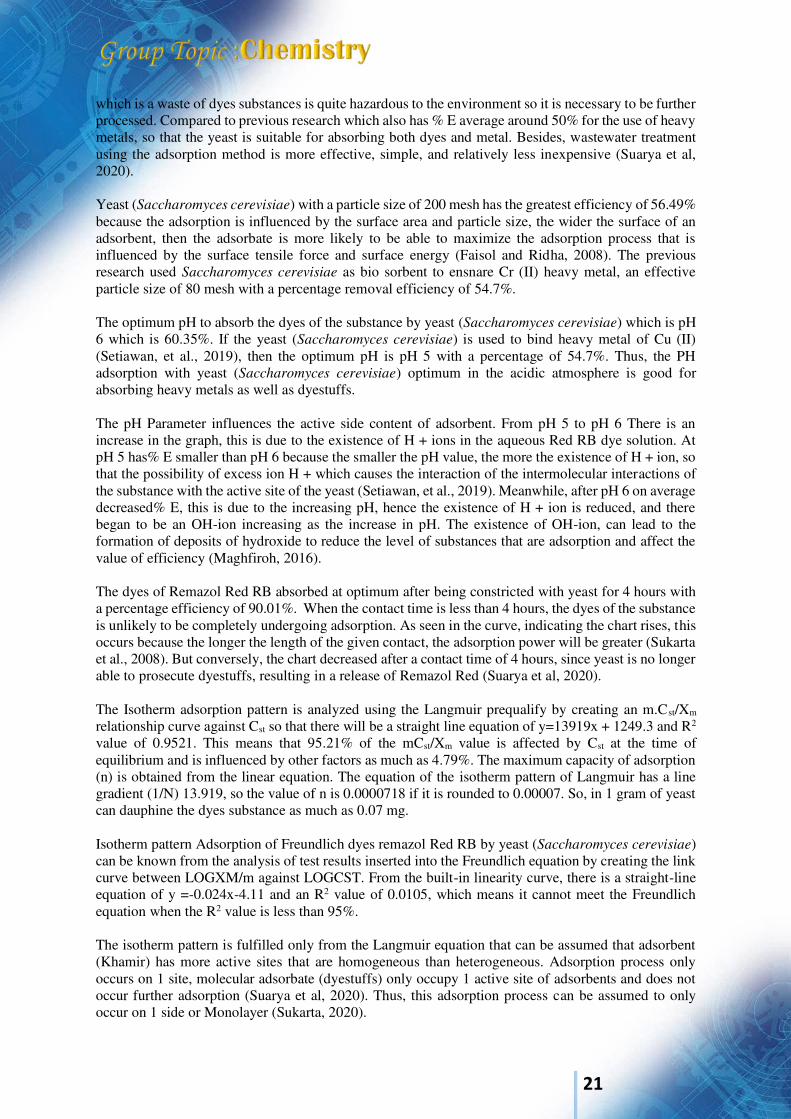
21
which is a waste of dyes substances is quite hazardous to the environment so it is necessary to be further processed. Compared to previous research which also has % E average around 50% for the use of heavy metals, so that the yeast is suitable for absorbing both dyes and metal. Besides, wastewater treatment using the adsorption method is more effective, simple, and relatively less inexpensive (Suarya et al, 2020). Yeast (Saccharomyces cerevisiae) with a particle size of 200 mesh has the greatest efficiency of 56.49% because the adsorption is influenced by the surface area and particle size, the wider the surface of an adsorbent, then the adsorbate is more likely to be able to maximize the adsorption process that is influenced by the surface tensile force and surface energy (Faisol and Ridha, 2008). The previous research used Saccharomyces cerevisiae as bio sorbent to ensnare Cr (II) heavy metal, an effective particle size of 80 mesh with a percentage removal efficiency of 54.7%. The optimum pH to absorb the dyes of the substance by yeast (Saccharomyces cerevisiae) which is pH 6 which is 60.35%. If the yeast (Saccharomyces cerevisiae) is used to bind heavy metal of Cu (II) (Setiawan, et al., 2019), then the optimum pH is pH 5 with a percentage of 54.7%. Thus, the PH adsorption with yeast (Saccharomyces cerevisiae) optimum in the acidic atmosphere is good for absorbing heavy metals as well as dyestuffs. The pH Parameter influences the active side content of adsorbent. From pH 5 to pH 6 There is an increase in the graph, this is due to the existence of H + ions in the aqueous Red RB dye solution. At pH 5 has% E smaller than pH 6 because the smaller the pH value, the more the existence of H + ion, so that the possibility of excess ion H + which causes the interaction of the intermolecular interactions of the substance with the active site of the yeast (Setiawan, et al., 2019). Meanwhile, after pH 6 on average decreased% E, this is due to the increasing pH, hence the existence of H + ion is reduced, and there began to be an OH-ion increasing as the increase in pH. The existence of OH-ion, can lead to the formation of deposits of hydroxide to reduce the level of substances that are adsorption and affect the value of efficiency (Maghfiroh, 2016). The dyes of Remazol Red RB absorbed at optimum after being constricted with yeast for 4 hours with a percentage efficiency of 90.01%. When the contact time is less than 4 hours, the dyes of the substance is unlikely to be completely undergoing adsorption. As seen in the curve, indicating the chart rises, this occurs because the longer the length of the given contact, the adsorption power will be greater (Sukarta et al., 2008). But conversely, the chart decreased after a contact time of 4 hours, since yeast is no longer able to prosecute dyestuffs, resulting in a release of Remazol Red (Suarya et al, 2020). The Isotherm adsorption pattern is analyzed using the Langmuir prequalify by creating an m.Cst/Xm relationship curve against Cst so that there will be a straight line equation of y=13919x + 1249.3 and R2 value of 0.9521. This means that 95.21% of the mCst/Xm value is affected by Cst at the time of equilibrium and is influenced by other factors as much as 4.79%. The maximum capacity of adsorption (n) is obtained from the linear equation. The equation of the isotherm pattern of Langmuir has a line gradient (1/N) 13.919, so the value of n is 0.0000718 if it is rounded to 0.00007. So, in 1 gram of yeast can dauphine the dyes substance as much as 0.07 mg. Isotherm pattern Adsorption of Freundlich dyes remazol Red RB by yeast (Saccharomyces cerevisiae) can be known from the analysis of test results inserted into the Freundlich equation by creating the link curve between LOGXM/m against LOGCST. From the built-in linearity curve, there is a straight-line equation of y =-0.024x-4.11 and an R2 value of 0.0105, which means it cannot meet the Freundlich equation when the R2 value is less than 95%. The isotherm pattern is fulfilled only from the Langmuir equation that can be assumed that adsorbent (Khamir) has more active sites that are homogeneous than heterogeneous. Adsorption process only occurs on 1 site, molecular adsorbate (dyestuffs) only occupy 1 active site of adsorbents and does not occur further adsorption (Suarya et al, 2020). Thus, this adsorption process can be assumed to only occur on 1 side or Monolayer (Sukarta, 2020).
22
Keywords: yeast (Saccharomyces cerevisiae), remazol red RB. References
1. Agustining, D. (2012). Daya Hambat Saccharomyces Cerevisiae Terhadap Pertumbuhan
Jamur Fusarium Oxysporum. Skripsi. Jurusan Pendidikan MIPA, Universitas Jember. 2. Dede, K., Kusuma, H., Purnawan, I. K. A., Kadek, N., & Rusjayanthi, D. (2018). "Aplikasi
Augmented Reality Informasi Corak Endek Bali Pada Platform Android".Merpati,6(1), 25–34. 3. Elystia, S., Putri, R. R., & Muria, S. R. (2018). "Biosorpsi Kromium (Cr) Pada Limbah Cair
Industri Elektroplating Menggunakan Biomassa Ragi Roti (Saccharomyces cerevisiae"). Jurnal Dampak, 15(1), 1.
4. Faisol Asip , Ridha Mardhiah, H. (2008). "Uji Efektifitas Cangkang Telur Dalam Mengadsorbsi Ion Fe Dengan Proses Batch".Teknik Kimia, 15(2), 22–26.
5. Fatimah, N., & Gunawan, R. (2018). Penurunan Intensitas Warna Remazol Red RB 133 Dalam Limbah Batik Dengan Elektrokoagulasi Menggunakan NaCl. Jurnal Atomik, 03(1).
6. Gül, Ü. D. (2013). "Treatment Of Dyeing Wastewater Including Reactive Dyes (Reactive Red Rb, Reactive Black B, Remazol Blue) And Methylene Blue By Fungal Biomass".Water SA, 39(5), 593–598.
7. Sastrawidana, I Dewa Ketut. (2011). "Studi Perombakan Zat Warna Tekstil Remazol Red Rb Secara Aerob Menggunakan Bakteri Enterobacter Aerogenes Yang Diisolasi Dari Lumpur Limbah Tekstil".Jurnal Kimia. 117–124.
8. Khuluk, R. H., Rahmat, A., Buhani, & Suharso. (2019). "Removal Of Methylene Blue By Adsorption Onto Activated Carbon From Coconut Shell ( Cocous nucifera L.)". Indonesian
Journal Of Science And Technology, 4(2), 229–240. 9. Kristianingrum, S. (2016). Spektroskopi Ultra Violet Dan Sinar Tampak (Spektroskopi Uv-Vis).
Yogyakarta: Universitas Negeri Yogyakarta. 10. Lellis, B., Fávaro-Polonio, C. Z., PampHile, J. A., & Polonio, J. C. (2019). "Effects Of Textile
Dyes On Health And The Environment And Bioremediation Potential Of Living Organisms". Biotechnology Research And Innovation, 3, 275-290.
11. Maghfiroh, L. (2016). Adsorpsi Zat Warna Tekstil Remazol Brilliant Blue Menggunakan Zeolit Yang Disintesis Dari Abu Layang Batubara. Skripsi. Jurusan Kimia, Universitas Negeri Semarang.
12. Manurung, R. (2017). Perombakan Zat Warna Azo Reaktif Secara Anaerob – Aerob.Sumatera: Universitas Sumatra Utara
13. Mughal, M. J., Saeed, R., Naeem, M., Ahmed, M. A., Yasmien, A., Siddiqui, Q., & Iqbal, M. (2011). "Dye Fixation And DeC0lourization Of Vinyl SulpHone Reactive Dyes By Using Dicyanidiamide Fixer In The Presence Of Ferric Chloride". Journal Of Saudi Chemical Society, 17(1), 23–28.
14. Putri, D. H. (2015). "Analisis Strategi Pemasaran Kain Endek Bali Sebagai Industri Pariwisata Kreatif ( Studi Kasus Denpasar )". Jurnal IPTA, 3(2), 7–12.
15. Rachmania Juliastuti, S., Putri Pranowo, P., & Yuliana Purbandi, R. (2015). "Separation Of Heavy Metals Copper (Cu) And Nickel (Ni) From Industrial Wastewater By Adsorption Using Chitosan Shrimp Shell".Modern Applied Science, 9(7), 86.
16. Rahayuda, I. G. S. (2015). "Texture Analysis On Image Motif Of Endek Bali Using K-Nearest Neighbor Classification Method". International Journal of Advanced Computer Science and
Applications,6(9), 205–211. 17. Sapta, I. W., Ariguna, P., Wiratini, N. M., & Sastrawidana, I. D. K. (2014). "Degradasi Zat
Warna Remazol Yellow FG Dan Limbah Tekstil Buatan Dengan Teknik Elektrooksidasi".Jurnal Kimia,2, 127–137.
18. Septiyani, E., Istirokhatun, T., & Susanto, H. (2017). "Penyisihan Kandungan Sulfida Dan Warna Dalam Limbah Industri Batik Berbahan Pewarna Dasar Remazol Red RB.C.I. Reactive Red 198 Menggunakan Teknologi Membran Nanofiltrasi". Jurnal Teknik Lingkungan,6(1).
19. Setianingrum, N. P., & Prasetya, A. (2017). "Pengurangan Zat Warna Remazol Red Rb Menggunakan Metode Elektrokoagulasi SecaraBatch". Jurnal Rekayasa Proses, 11(2), 78–85.
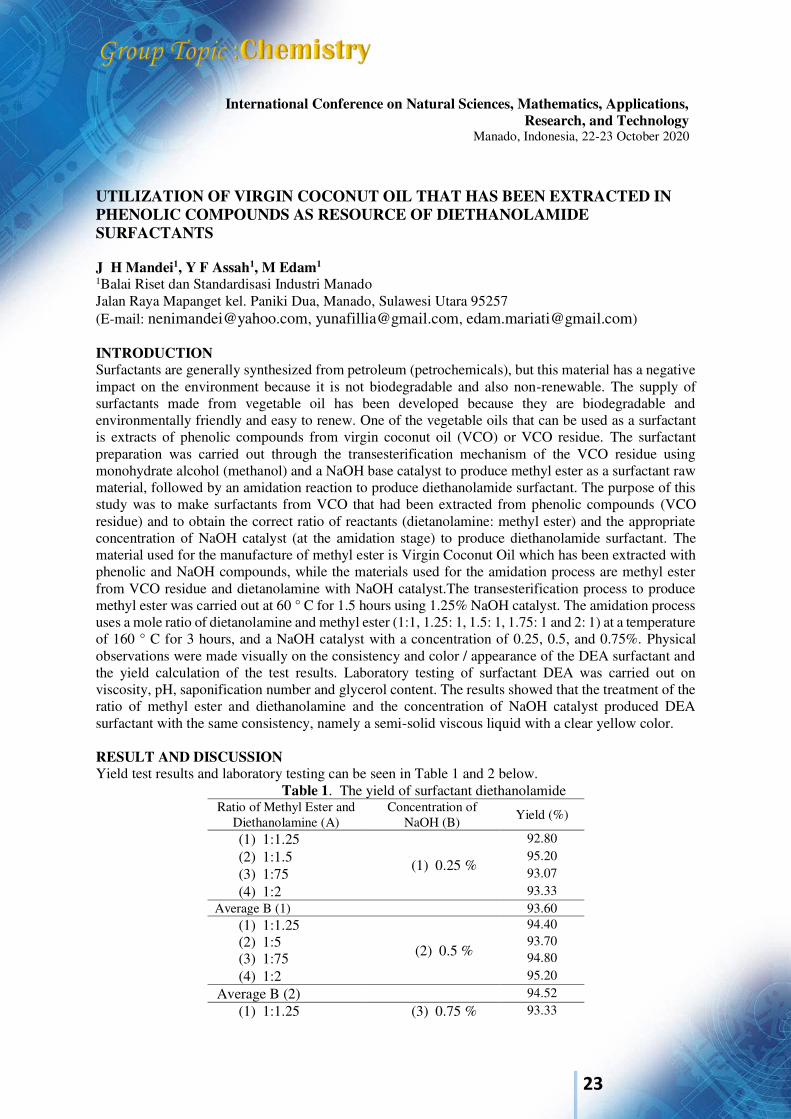
23
International Conference on Natural Sciences, Mathematics, Applications, Research, and Technology
Manado, Indonesia, 22-23 October 2020
UTILIZATION OF VIRGIN COCONUT OIL THAT HAS BEEN EXTRACTED IN PHENOLIC COMPOUNDS AS RESOURCE OF DIETHANOLAMIDE SURFACTANTS J H Mandei1, Y F Assah1, M Edam1 1Balai Riset dan Standardisasi Industri Manado Jalan Raya Mapanget kel. Paniki Dua, Manado, Sulawesi Utara 95257 (E-mail: [email protected], [email protected], [email protected]) INTRODUCTION Surfactants are generally synthesized from petroleum (petrochemicals), but this material has a negative impact on the environment because it is not biodegradable and also non-renewable. The supply of surfactants made from vegetable oil has been developed because they are biodegradable and environmentally friendly and easy to renew. One of the vegetable oils that can be used as a surfactant is extracts of phenolic compounds from virgin coconut oil (VCO) or VCO residue. The surfactant preparation was carried out through the transesterification mechanism of the VCO residue using monohydrate alcohol (methanol) and a NaOH base catalyst to produce methyl ester as a surfactant raw material, followed by an amidation reaction to produce diethanolamide surfactant. The purpose of this study was to make surfactants from VCO that had been extracted from phenolic compounds (VCO residue) and to obtain the correct ratio of reactants (dietanolamine: methyl ester) and the appropriate concentration of NaOH catalyst (at the amidation stage) to produce diethanolamide surfactant. The material used for the manufacture of methyl ester is Virgin Coconut Oil which has been extracted with phenolic and NaOH compounds, while the materials used for the amidation process are methyl ester from VCO residue and dietanolamine with NaOH catalyst.The transesterification process to produce methyl ester was carried out at 60 ° C for 1.5 hours using 1.25% NaOH catalyst. The amidation process uses a mole ratio of dietanolamine and methyl ester (1:1, 1.25: 1, 1.5: 1, 1.75: 1 and 2: 1) at a temperature of 160 ° C for 3 hours, and a NaOH catalyst with a concentration of 0.25, 0.5, and 0.75%. Physical observations were made visually on the consistency and color / appearance of the DEA surfactant and the yield calculation of the test results. Laboratory testing of surfactant DEA was carried out on viscosity, pH, saponification number and glycerol content. The results showed that the treatment of the ratio of methyl ester and diethanolamine and the concentration of NaOH catalyst produced DEA surfactant with the same consistency, namely a semi-solid viscous liquid with a clear yellow color. RESULT AND DISCUSSION Yield test results and laboratory testing can be seen in Table 1 and 2 below.
Table 1. The yield of surfactant diethanolamide Ratio of Methyl Ester and
Diethanolamine (A) Concentration of
NaOH (B) Yield (%)
(1) 1:1.25
(1) 0.25 %
92.80 (2) 1:1.5 95.20 (3) 1:75 93.07 (4) 1:2 93.33
Average B (1) 93.60 (1) 1:1.25
(2) 0.5 %
94.40 (2) 1:5 93.70 (3) 1:75 94.80 (4) 1:2 95.20
Average B (2) 94.52 (1) 1:1.25 (3) 0.75 % 93.33
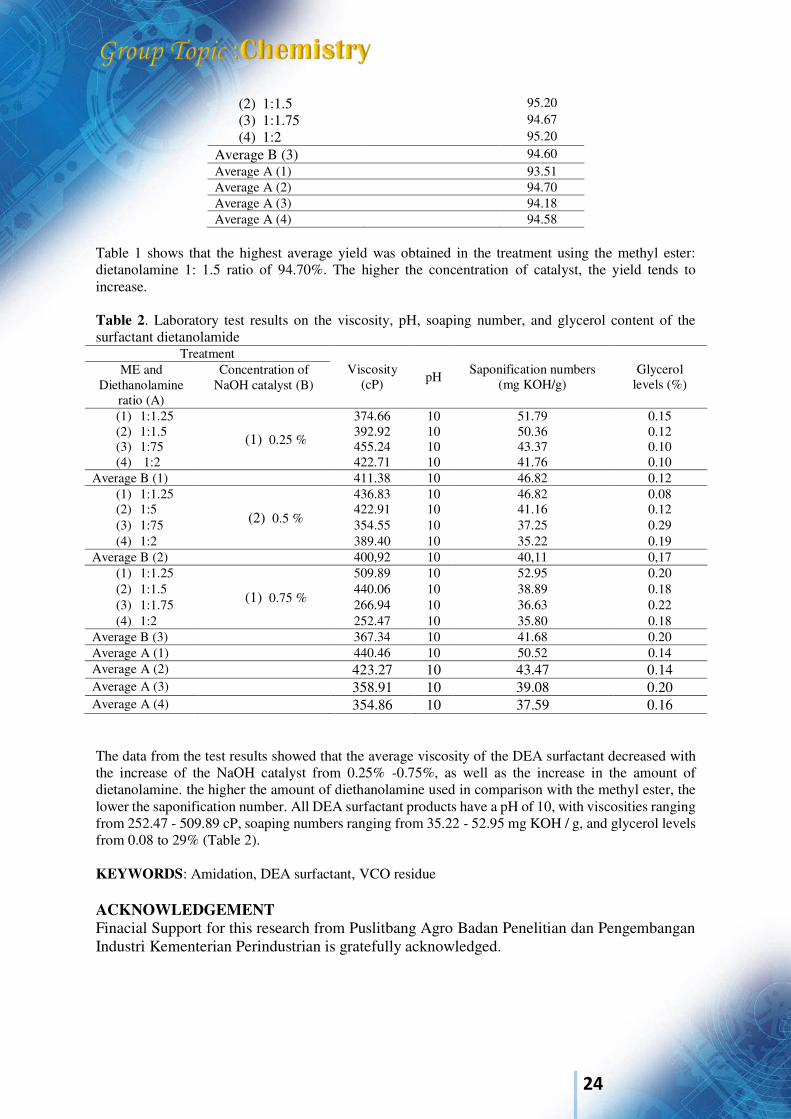
24
(2) 1:1.5 95.20 (3) 1:1.75 94.67 (4) 1:2 95.20
Average B (3) 94.60 Average A (1) 93.51 Average A (2) 94.70 Average A (3) 94.18 Average A (4) 94.58
Table 1 shows that the highest average yield was obtained in the treatment using the methyl ester: dietanolamine 1: 1.5 ratio of 94.70%. The higher the concentration of catalyst, the yield tends to increase. Table 2. Laboratory test results on the viscosity, pH, soaping number, and glycerol content of the surfactant dietanolamide
Treatment Viscosity
(cP) pH Saponification numbers (mg KOH/g)
Glycerol levels (%)
ME and Diethanolamine
ratio (A)
Concentration of NaOH catalyst (B)
(1) 1:1.25
(1) 0.25 %
374.66 10 51.79 0.15 (2) 1:1.5 392.92 10 50.36 0.12 (3) 1:75 455.24 10 43.37 0.10 (4) 1:2 422.71 10 41.76 0.10
Average B (1) 411.38 10 46.82 0.12 (1) 1:1.25
(2) 0.5 %
436.83 10 46.82 0.08 (2) 1:5 422.91 10 41.16 0.12 (3) 1:75 354.55 10 37.25 0.29 (4) 1:2 389.40 10 35.22 0.19
Average B (2) 400,92 10 40,11 0,17 (1) 1:1.25
(1) 0.75 %
509.89 10 52.95 0.20 (2) 1:1.5 440.06 10 38.89 0.18 (3) 1:1.75 266.94 10 36.63 0.22 (4) 1:2 252.47 10 35.80 0.18
Average B (3) 367.34 10 41.68 0.20 Average A (1) 440.46 10 50.52 0.14 Average A (2) 423.27 10 43.47 0.14 Average A (3) 358.91 10 39.08 0.20 Average A (4) 354.86 10 37.59 0.16 The data from the test results showed that the average viscosity of the DEA surfactant decreased with the increase of the NaOH catalyst from 0.25% -0.75%, as well as the increase in the amount of dietanolamine. the higher the amount of diethanolamine used in comparison with the methyl ester, the lower the saponification number. All DEA surfactant products have a pH of 10, with viscosities ranging from 252.47 - 509.89 cP, soaping numbers ranging from 35.22 - 52.95 mg KOH / g, and glycerol levels from 0.08 to 29% (Table 2). KEYWORDS: Amidation, DEA surfactant, VCO residue ACKNOWLEDGEMENT Finacial Support for this research from Puslitbang Agro Badan Penelitian dan Pengembangan Industri Kementerian Perindustrian is gratefully acknowledged.
25
REFERENCES 1. Arbianti R., Tania Surya Utami, dan Astri N.2008. Isolasi Metil Laurat dari Minyak Kelapa
Sebagai Bahan Baku Surfaktan Fatty Alcohol Sulfate (FAS). Makara, Teknologi, vol. 12, no. 2, hal: 61-64.
2. Ginting, C. H. 2012. Sintesis Etanolamida dan Dietanolamida Campuran dari Metil Ester Asam Lemak Bebas Minyak Kelapa dengan Senyawa Etanolamina dan Dietanolamina Menggunakan Katalis Natrium Metoksida, Skripsi. Universitas Sumatera Utara
3. Hambali, E. T. K Bunasor, A. Suryani dan G. A. Kusumah. 2005. Aplikasi Dietanolamida dari Asam laurat minyak inti sawit pada pembuatan sabun transparan, J. Tek. Ind. Pert. Vol. 15(2), 46-53.
4. Kabara JJ. 2000. Health oils from the tree of life. Nutritional and Health Aspects of Coconut Oil). Indian Coconut Journal. 31(8):2-8.
5. Marash, R., K. Gubler, K. L. Yagi. 2001. Fats and Oils Industry Overview, Chemical Handbook, SRI, Menlo Park, California.
6. Novianti, 2009. Sintesis ester metil kaprat dan kaprilat dari minyak kelapa murni. Skripsi, Fakultas Matematika dan Ilmu Pengetahuan Alam UNTAD, Palu.
7. Panji, T., H. Nashrianto dan A. Nurkania. 2015. Sintesis dan pemurnian surfaktan dietanolamida berbasis turunan minyak sawit (crude palm oil). Fakultas Matematika dan IPA Universitas Pakuan Bogor.
8. Pratiwi, D. A. 2015. Pengaruh Suhu dan Katalis CaO pada Sintesa Surfaktan Metil Ester
Sulfonat Berbasis Crude Palm Oil dengan Agen Sulfonasi NaHSO3. Politeknik Negeri Sriwijaya. Palembang.
9. Probowati, A., P. C. Giovanni dan D. Ikhsan. 2012. Pembuatan Surfaktan dari Minyak Kelapa Murni (VCO) melalui Proses Amisdasi dengan Katalis NaOH. Jurnal Teknologi Kimia dan Industri Vol 1 No. 1 Tahun 2012, p: 424-432.
10. Ratnasari, D. K. 2013. Optimasi Hasil Surfaktan dan Gliserol dari Minyak/Lemak Limbah
Industri Krimer Ditinjau dari Suhu Pemanasan, Konsentrasi Katalis dan Lama Pemanasan. Universitas Kristen Satya Wacana. Salatiga.
11. Wang, L. L, B.K.Yang, K.L. Parkin dan E.A. Johnson. 1993. Inhibition of by monoalcylglycerols synthesized from coconut oil and milk fat by lip.

26
International Conference on Natural Sciences, Mathematics, Applications, Research, and Technology
Manado, Indonesia, 22-23October 2020
ANTIOXIDANT ACTIVITY AND TOTAL FENOL CONTENT OF WHITE SAFFRON (Curcuma mangga Val) Siti Maryam*1, and Ni Wayan Martiningsih2
1, 2Department of Chemistry, Universitas Pendidikan Ganesha, INDONESIA. (E-mail: [email protected], [email protected]) INTRODUCTION White saffron (Curcuma mangga Val) is one of the rhizomes that currently used as a functional drink, because it is healthy due to its antioxidant content such as curcuminoids, flavonoids and total fenols (Jayaprakasya, 2006). The presence of fenolic groups in Curcuma compounds causes strong activity in biological systems (Ahsan, 2009). White saffron (Curcuma mangga Val) is a type of discovery that contains curcuminoids consisting of curcumin and its derivatives which include desmetoxicurcumin and bisdesmetoksicurcumin (Sanatombi R, 2017). The components that exist in each plant are strongly influenced by the place where each plant grows, this is because the content in the plant is highly dependent on the absorption of nutrients in the soil and the metabolic processes in plants (Sarifah et.al, 2013). This study aims to determine the antioxidant activity and total fenol content of white saffron (Curcuma mangga Val). In this study, the antioxidant activity of white saffron (Curcuma mangga Val) was measured by the DPPH method, while the total fenol content was measured by the Folin-ciocalteu method. The main ingredient of this research is white saffron rhizome (Curcuma mangga Val), which is obtained from Buleleng. Chemicals used: 2,2-diphenyl-1-picrylhydrazyl (DPPH), Folin-ciocalteu reagent, gallic acid, ethanol, methanol, acetone, acetic acid, distilled water, acid buffer, FeCl3, NaCO3, 10% NaNO2, 10% AlCl3.6H2O 10%, NaOH 10%, and quercetin. The research began with the production of white saffron powder (Curcuma mangga Val). White saffron powder is made through several steps including: 1) sorting white saffron rhizome, 2) thinly slicing white saffron rhizome, 3) drying rhizome slices by aerating it, 4) crushing dried white saffron rhizomes using a blender to form powder. After forming white saffron powder (Curcuma
mangga Val), white saffron powder is macerated at room temperature, in ethanol solution for 24 hours, then filtered with a vacuum filter to produce supernatant and evaporated with a rotary vacuum evaporator to obtain a concentrated extract. White saffron extract was analyzed for total fenol content and antioxidant activity using the DPPH method. The capacity of DPPH free radical scavenging was determined by the Xu and Chang method (Widyastuti,2010). Total phenol levels were determined by the FolinCiocalteu method, using gallic acid as the standard. The analysis was carried out 3 times each. The conclusion from this study is that the antioxidant activity of white saffron (Curcuma mangga
Val) is 60.61 ppm and a total fenol content of 87.73 mg/gr, so it is good to use in the prevention of diseases caused by free radicals. RESULTS AND DISCUSSION Antioxidant Activity and Total Fenol of White Saffron (Curcuma mango Val) The ability of a material to function as an antioxidant is determined by the presence of groups that act to scavenge free radicals. White saffron (Curcuma mangga Val) is a medicinal plant that contains bioactive compounds, which can be seen from its antioxidant activity and total fenol content. In this research, Table 1 shows that white saffron (Curcuma mangga Val) has an IC50 value of 60.61 ppm and a total phenol content of 87.73 mg/g.
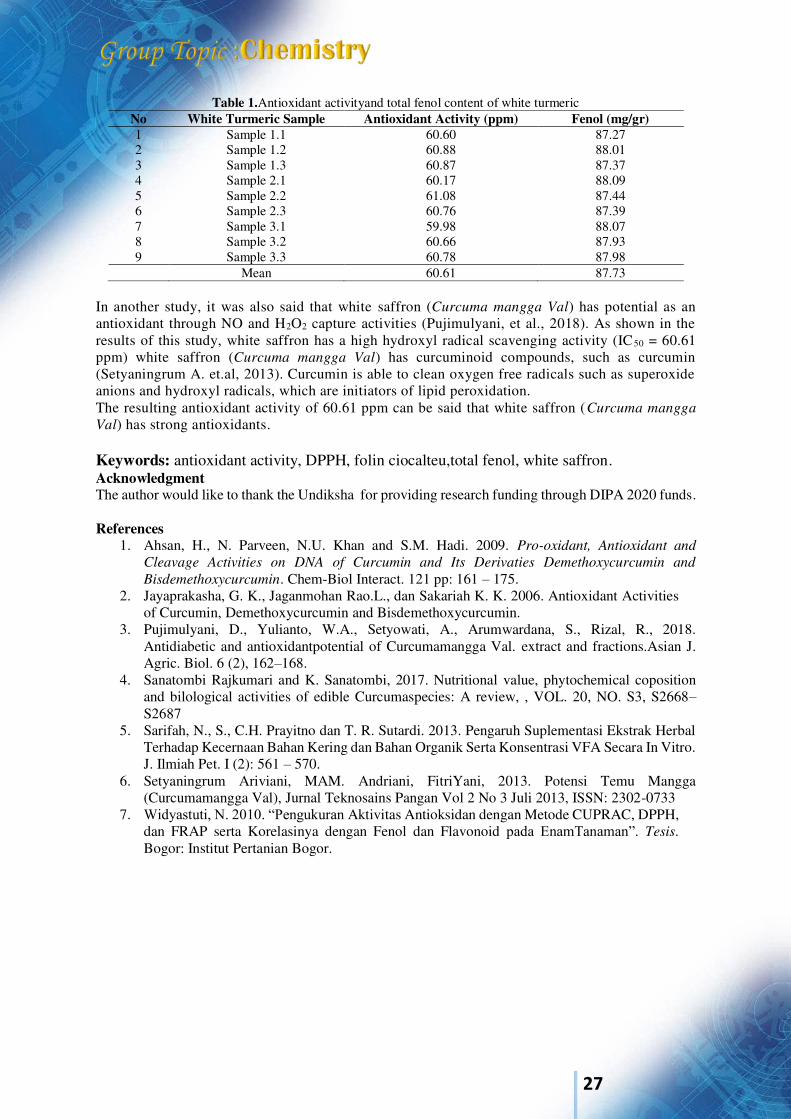
27
Table 1.Antioxidant activityand total fenol content of white turmeric No White Turmeric Sample Antioxidant Activity (ppm) Fenol (mg/gr) 1 Sample 1.1 60.60 87.27 2 Sample 1.2 60.88 88.01 3 Sample 1.3 60.87 87.37 4 Sample 2.1 60.17 88.09 5 Sample 2.2 61.08 87.44 6 Sample 2.3 60.76 87.39 7 Sample 3.1 59.98 88.07 8 Sample 3.2 60.66 87.93 9 Sample 3.3 60.78 87.98 Mean 60.61 87.73
In another study, it was also said that white saffron (Curcuma mangga Val) has potential as an antioxidant through NO and H2O2 capture activities (Pujimulyani, et al., 2018). As shown in the results of this study, white saffron has a high hydroxyl radical scavenging activity (IC50 = 60.61 ppm) white saffron (Curcuma mangga Val) has curcuminoid compounds, such as curcumin (Setyaningrum A. et.al, 2013). Curcumin is able to clean oxygen free radicals such as superoxide anions and hydroxyl radicals, which are initiators of lipid peroxidation. The resulting antioxidant activity of 60.61 ppm can be said that white saffron (Curcuma mangga
Val) has strong antioxidants. Keywords: antioxidant activity, DPPH, folin ciocalteu,total fenol, white saffron. Acknowledgment The author would like to thank the Undiksha for providing research funding through DIPA 2020 funds. References
1. Ahsan, H., N. Parveen, N.U. Khan and S.M. Hadi. 2009. Pro-oxidant, Antioxidant and
Cleavage Activities on DNA of Curcumin and Its Derivaties Demethoxycurcumin and
Bisdemethoxycurcumin. Chem-Biol Interact. 121 pp: 161 – 175. 2. Jayaprakasha, G. K., Jaganmohan Rao.L., dan Sakariah K. K. 2006. Antioxidant Activities
of Curcumin, Demethoxycurcumin and Bisdemethoxycurcumin. 3. Pujimulyani, D., Yulianto, W.A., Setyowati, A., Arumwardana, S., Rizal, R., 2018.
Antidiabetic and antioxidantpotential of Curcumamangga Val. extract and fractions.Asian J. Agric. Biol. 6 (2), 162–168.
4. Sanatombi Rajkumari and K. Sanatombi, 2017. Nutritional value, phytochemical coposition and bilological activities of edible Curcumaspecies: A review, , VOL. 20, NO. S3, S2668–S2687
5. Sarifah, N., S., C.H. Prayitno dan T. R. Sutardi. 2013. Pengaruh Suplementasi Ekstrak Herbal Terhadap Kecernaan Bahan Kering dan Bahan Organik Serta Konsentrasi VFA Secara In Vitro. J. Ilmiah Pet. I (2): 561 – 570.
6. Setyaningrum Ariviani, MAM. Andriani, FitriYani, 2013. Potensi Temu Mangga (Curcumamangga Val), Jurnal Teknosains Pangan Vol 2 No 3 Juli 2013, ISSN: 2302-0733
7. Widyastuti, N. 2010. “Pengukuran Aktivitas Antioksidan dengan Metode CUPRAC, DPPH, dan FRAP serta Korelasinya dengan Fenol dan Flavonoid pada EnamTanaman”. Tesis. Bogor: Institut Pertanian Bogor.
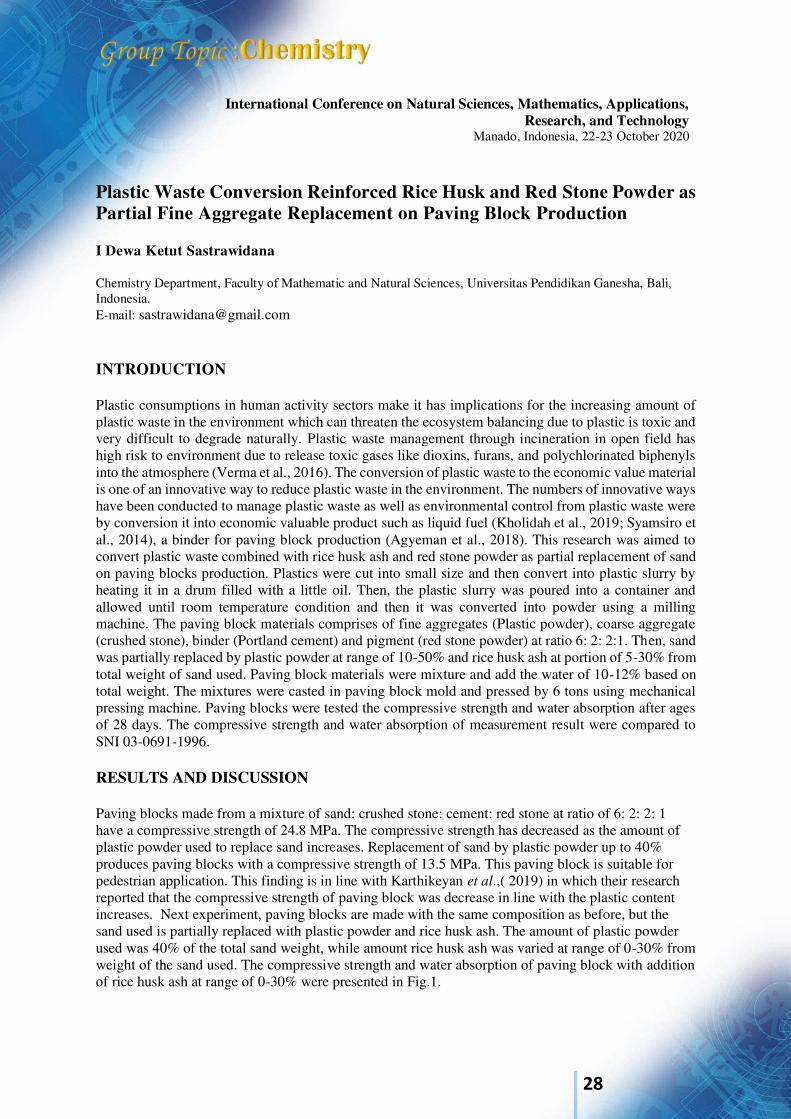
28
International Conference on Natural Sciences, Mathematics, Applications, Research, and Technology
Manado, Indonesia, 22-23 October 2020
Plastic Waste Conversion Reinforced Rice Husk and Red Stone Powder as Partial Fine Aggregate Replacement on Paving Block Production I Dewa Ketut Sastrawidana
Chemistry Department, Faculty of Mathematic and Natural Sciences, Universitas Pendidikan Ganesha, Bali, Indonesia. E-mail: [email protected] INTRODUCTION Plastic consumptions in human activity sectors make it has implications for the increasing amount of plastic waste in the environment which can threaten the ecosystem balancing due to plastic is toxic and very difficult to degrade naturally. Plastic waste management through incineration in open field has high risk to environment due to release toxic gases like dioxins, furans, and polychlorinated biphenyls into the atmosphere (Verma et al., 2016). The conversion of plastic waste to the economic value material is one of an innovative way to reduce plastic waste in the environment. The numbers of innovative ways have been conducted to manage plastic waste as well as environmental control from plastic waste were by conversion it into economic valuable product such as liquid fuel (Kholidah et al., 2019; Syamsiro et al., 2014), a binder for paving block production (Agyeman et al., 2018). This research was aimed to convert plastic waste combined with rice husk ash and red stone powder as partial replacement of sand on paving blocks production. Plastics were cut into small size and then convert into plastic slurry by heating it in a drum filled with a little oil. Then, the plastic slurry was poured into a container and allowed until room temperature condition and then it was converted into powder using a milling machine. The paving block materials comprises of fine aggregates (Plastic powder), coarse aggregate (crushed stone), binder (Portland cement) and pigment (red stone powder) at ratio 6: 2: 2:1. Then, sand was partially replaced by plastic powder at range of 10-50% and rice husk ash at portion of 5-30% from total weight of sand used. Paving block materials were mixture and add the water of 10-12% based on total weight. The mixtures were casted in paving block mold and pressed by 6 tons using mechanical pressing machine. Paving blocks were tested the compressive strength and water absorption after ages of 28 days. The compressive strength and water absorption of measurement result were compared to SNI 03-0691-1996. RESULTS AND DISCUSSION Paving blocks made from a mixture of sand: crushed stone: cement: red stone at ratio of 6: 2: 2: 1 have a compressive strength of 24.8 MPa. The compressive strength has decreased as the amount of plastic powder used to replace sand increases. Replacement of sand by plastic powder up to 40% produces paving blocks with a compressive strength of 13.5 MPa. This paving block is suitable for pedestrian application. This finding is in line with Karthikeyan et al.,( 2019) in which their research reported that the compressive strength of paving block was decrease in line with the plastic content increases. Next experiment, paving blocks are made with the same composition as before, but the sand used is partially replaced with plastic powder and rice husk ash. The amount of plastic powder used was 40% of the total sand weight, while amount rice husk ash was varied at range of 0-30% from weight of the sand used. The compressive strength and water absorption of paving block with addition of rice husk ash at range of 0-30% were presented in Fig.1.
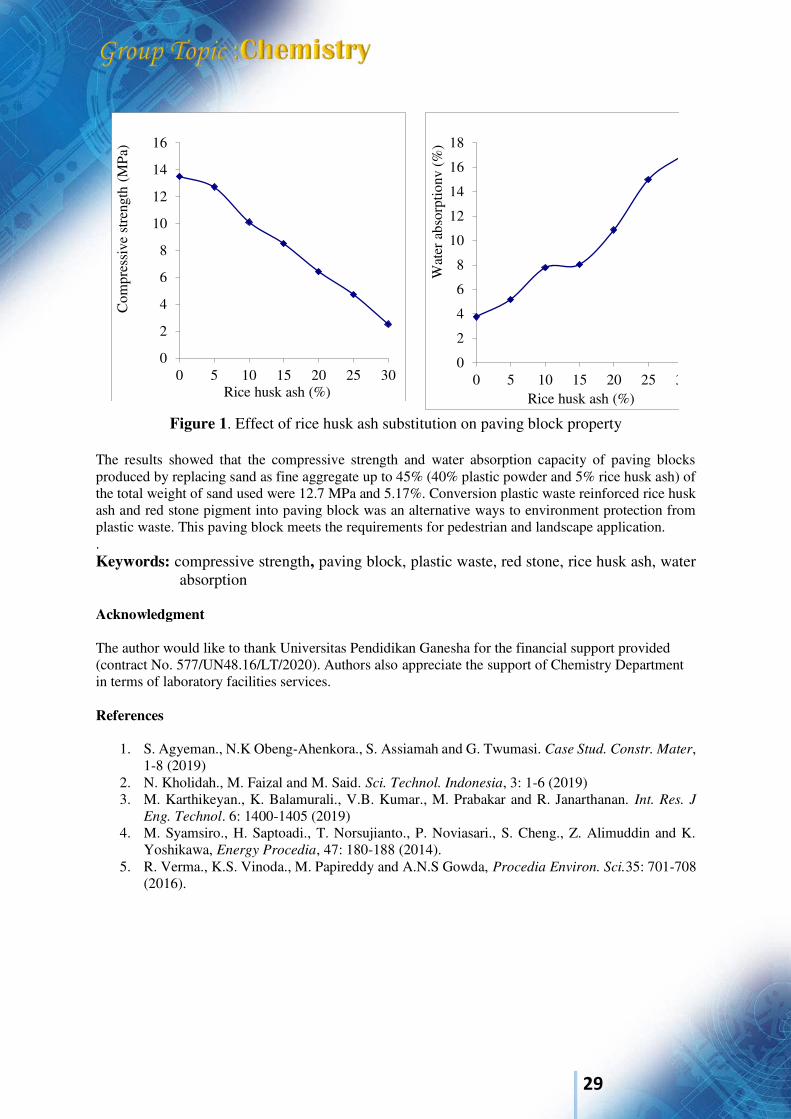
29
.
Figure 1. Effect of rice husk ash substitution on paving block property
The results showed that the compressive strength and water absorption capacity of paving blocks produced by replacing sand as fine aggregate up to 45% (40% plastic powder and 5% rice husk ash) of the total weight of sand used were 12.7 MPa and 5.17%. Conversion plastic waste reinforced rice husk ash and red stone pigment into paving block was an alternative ways to environment protection from plastic waste. This paving block meets the requirements for pedestrian and landscape application. . Keywords: compressive strength, paving block, plastic waste, red stone, rice husk ash, water
absorption Acknowledgment The author would like to thank Universitas Pendidikan Ganesha for the financial support provided (contract No. 577/UN48.16/LT/2020). Authors also appreciate the support of Chemistry Department in terms of laboratory facilities services. References
1. S. Agyeman., N.K Obeng-Ahenkora., S. Assiamah and G. Twumasi. Case Stud. Constr. Mater, 1-8 (2019)
2. N. Kholidah., M. Faizal and M. Said. Sci. Technol. Indonesia, 3: 1-6 (2019) 3. M. Karthikeyan., K. Balamurali., V.B. Kumar., M. Prabakar and R. Janarthanan. Int. Res. J
Eng. Technol. 6: 1400-1405 (2019) 4. M. Syamsiro., H. Saptoadi., T. Norsujianto., P. Noviasari., S. Cheng., Z. Alimuddin and K.
Yoshikawa, Energy Procedia, 47: 180-188 (2014). 5. R. Verma., K.S. Vinoda., M. Papireddy and A.N.S Gowda, Procedia Environ. Sci.35: 701-708
(2016).
0
2
4
6
8
10
12
14
16
18
0 5 10 15 20 25 30
Wat
er a
bsor
ptio
nv (%
)
Rice husk ash (%)
0
2
4
6
8
10
12
14
16
0 5 10 15 20 25 30
Com
pres
sive
str
engt
h (M
Pa)
Rice husk ash (%)

30
International Conference on Natural Sciences, Mathematics, Applications, Research, and Technology
Manado, Indonesia, 22-23 October 2020
Ectoine-producing Halophilic Bacteria Isolated from Solar Saltern of Pejarakan Village, Buleleng Regency, Bali Indonesia I Putu Parwata*1, Siti Maryam2 and I Nyoman Tika3
1, 2,3Department of Chemistry, Faculty of Mathematics and Natural Sciences, Universitas Pendidikan Ganesha, INDONESIA. (E-mail:[email protected], [email protected], [email protected]) INTRODUCTION Ectoine is a secondary metabolite produced by halophilic bacteria for the purpose to maintain survival in high salt habitat. This compatible osmolyte was able to protect biomolecules and cells from environmental stresses, such as heating, , drought, freezing, high salinity, and UV light1
. As a consequence, the molecule is widely used as a bioactive compound for various product of cosmetics and pharmaceuticals. Therefore, an effort to increase the capacity of ectoine production is essential to support the development of those industries. This study aimed to explore the potential ectoine-producing halophilic bacteria. The bacteria was isolated from the brine and the sediment samples obtained at the solar saltern of Pejarakan Village, Gerokgak District, Buleleng Regency, Bali-Indonesia. Initially, the bacteria were grown on solid Luria Bertani (LB) media containing (per liter): 5 g tryptone, 5 g yeast extract, 20 g agar, and varied amount of NaCl (100g, 150 g, and 200 g) at 37 °C for 24 hours. The salt tolerance of the bacteria was then determined by monitoring the growth of the bacteria in the LB media containing various concentrations of NaCl (0% to 27.5% w/v). The ectoine-producing candidate of the bacteria was investigated by monitoring the growth of the bacteria in the solid MM63 media composed of (per liter): 13.61 g KH2PO4, 4.21 g KOH, 1.98 g (NH4)2SO4, 0.25 g MgSO4.7H2O, 0.0011 gFeSO4.7H2O, 5 g Glucose.H2O, 20 g agar, and varied amount of NaCl (100 g, 150 g, and 200 g). Finally, ectoine concentration produced by the potential halophilic bacteria was determined using MM63 broth containing 12% w/v of NaCl. Our study has found several potential halophilic bacteria producing ectoine and hydroxyectoine, a molecule derivative of ectoine. RESULTS AND DISCUSSION The results showed that a total of 88 bacterial colonies have been isolated. Most of the bacteria were able to grow in a wide range of NaCl level from 0.5 to 20% w/v. Interestingly, some of them could grow at high level of NaCl 27.5% w/v, i.e. isolates K20 (1 to 4, and 6 to 16). Furthermore, several bacteria showed sufficient growth in media without NaCl addition, such as isolates K10 (6, 20, and 21). However, several of them, such as isolates K10 (5, 45, 47, 48, 50, 51) and isolates K20 (1 to 16) need a minimum salt level of 2.5 to 5% w/v to support its growth. Of the total of 88 bacteria tested, 86 isolates were able to grow in MM63 media containing varied level of NaCl (10%, 15%, and 20% w/v), suggesting the potential of the bacteria as an ectoine producer. Based on the growth level of the bacteria in MM63 media, ten isolates were than tested to determine the level of ectoine produced, i.e. isolates K10 (4, 14, 17, 21, 30, and 42), isolates K15 (4 and 9), and isolates K20 (4 and 15). All of the ten bacteria tested were able to produce ectoine with the productivity
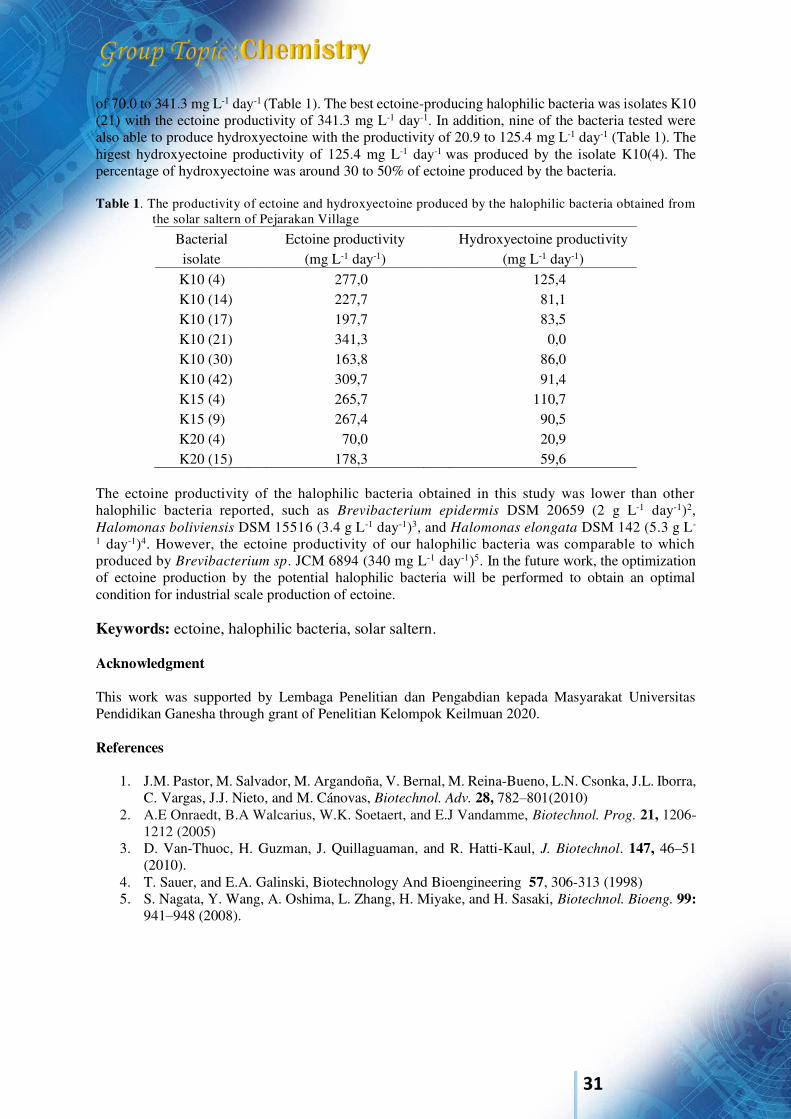
31
of 70.0 to 341.3 mg L-1 day-1 (Table 1). The best ectoine-producing halophilic bacteria was isolates K10 (21) with the ectoine productivity of 341.3 mg L-1 day-1. In addition, nine of the bacteria tested were also able to produce hydroxyectoine with the productivity of 20.9 to 125.4 mg L-1 day-1 (Table 1). The higest hydroxyectoine productivity of 125.4 mg L-1 day-1 was produced by the isolate K10(4). The percentage of hydroxyectoine was around 30 to 50% of ectoine produced by the bacteria. Table 1. The productivity of ectoine and hydroxyectoine produced by the halophilic bacteria obtained from
the solar saltern of Pejarakan Village
Bacterial Ectoine productivity Hydroxyectoine productivity isolate (mg L-1 day-1) (mg L-1 day-1) K10 (4) 277,0 125,4 K10 (14) 227,7 81,1 K10 (17) 197,7 83,5 K10 (21) 341,3 0,0 K10 (30) 163,8 86,0 K10 (42) 309,7 91,4 K15 (4) 265,7 110,7 K15 (9) 267,4 90,5 K20 (4) 70,0 20,9 K20 (15) 178,3 59,6
The ectoine productivity of the halophilic bacteria obtained in this study was lower than other halophilic bacteria reported, such as Brevibacterium epidermis DSM 20659 (2 g L-1 day-1)2, Halomonas boliviensis DSM 15516 (3.4 g L-1 day-1)3, and Halomonas elongata DSM 142 (5.3 g L-
1 day-1)4. However, the ectoine productivity of our halophilic bacteria was comparable to which produced by Brevibacterium sp. JCM 6894 (340 mg L-1 day-1)5. In the future work, the optimization of ectoine production by the potential halophilic bacteria will be performed to obtain an optimal condition for industrial scale production of ectoine. Keywords: ectoine, halophilic bacteria, solar saltern. Acknowledgment This work was supported by Lembaga Penelitian dan Pengabdian kepada Masyarakat Universitas Pendidikan Ganesha through grant of Penelitian Kelompok Keilmuan 2020. References
1. J.M. Pastor, M. Salvador, M. Argandoña, V. Bernal, M. Reina-Bueno, L.N. Csonka, J.L. Iborra, C. Vargas, J.J. Nieto, and M. Cánovas, Biotechnol. Adv. 28, 782–801(2010)
2. A.E Onraedt, B.A Walcarius, W.K. Soetaert, and E.J Vandamme, Biotechnol. Prog. 21, 1206-1212 (2005)
3. D. Van-Thuoc, H. Guzman, J. Quillaguaman, and R. Hatti-Kaul, J. Biotechnol. 147, 46–51 (2010).
4. T. Sauer, and E.A. Galinski, Biotechnology And Bioengineering 57, 306-313 (1998) 5. S. Nagata, Y. Wang, A. Oshima, L. Zhang, H. Miyake, and H. Sasaki, Biotechnol. Bioeng. 99:
941–948 (2008).
32
International Conference on Natural Sciences, Mathematics, Applications, Research, and Technology
Manado, Indonesia, 22-23 October 2020
THE EFFECT OF VARIOUS MASS COMPOSITIONS OF FIXATOR NANOPASTES ON COLOUR, FASTNESS AND MECHANICAL PROPERTIES OF COTTON YARNS IN NATURAL GREEN COLOUR DYEING USING MANGOS LEAVES EXTRACT I Wayan Karyasa
Department of Chemistry, Faculty of Math and Natural Sciences, Universitas Pendidikan Ganesha, INDONESIA. (E-mail: [email protected]; [email protected]) INTRODUCTION Natural colour dyeing today becomes taking high attention because of back to nature trend and high market demand of traditional as well as modern fabric crafts, however lack of colour quality and poor of moderate wash and light fastness properties of the natural dyes still become resistantly problems. Overcoming those problems people used fixator material to improve the colour and fastness properties[1,2]. Fixator nanopastes consisting of volcanic ash, rice husk ash silica, and ferrous as well as copper sulphates were applied in the natural colour dying of cotton yarn purposing to woven crafts. The effect of various mass compositions of the fixator nanopastes consisting of volcanic ash, rice husk ash silica and ferrous as well as copper sulphates on the colour quality and fastness properties of the resulted green colour dyeing of cotton yarn using mangos leaves extract was studied. RESULTS AND DISCUSSION The addition of ferrous sulphate (code sample of A) into the fixator nanopastes consisting of volcanic ash and rice husk ash silica gave better effect on colour quality (colour difference and colour deepness or colour reflectance), colour fastness properties, and yarn tensile as well as elastic strength properties than the addition than the addition of copper sulphate (code sample of B) in the natural green colour dyeing using mangos leaves extract (code sample of H). In term of colour fastness toward sun light, the use of additive ferrous sulphate in the nanopaste was more effective than the addition of copper sulphate, however both additive materials had similar effect on colour fastness towards moderate wash. Figure 1 and Figure 2 explain the effects of various nanopastes compositions (AH0 = AB0 where mass composition of volcanic ash: rice husk ash is 900:100; AH1, AH2, AH3, AH4, AH5 compositions consist of volcanic ash: rice husk ash: ferrous sulphate = 900: 90: 10; 900: 80: 20; 900: 70: 30; 900: 60: 40; and 900: 50: 50 respectively and those mass compositions are the same parallelly for the mass compositions of volcanic ash: rice husk ash silica: copper sulphate of BH1, BH2, BH3, BH4, and BH5. The results imply that the nanopastes could be applied in other fixation processes of natural dyeing of natural as well as synthetic fibers.
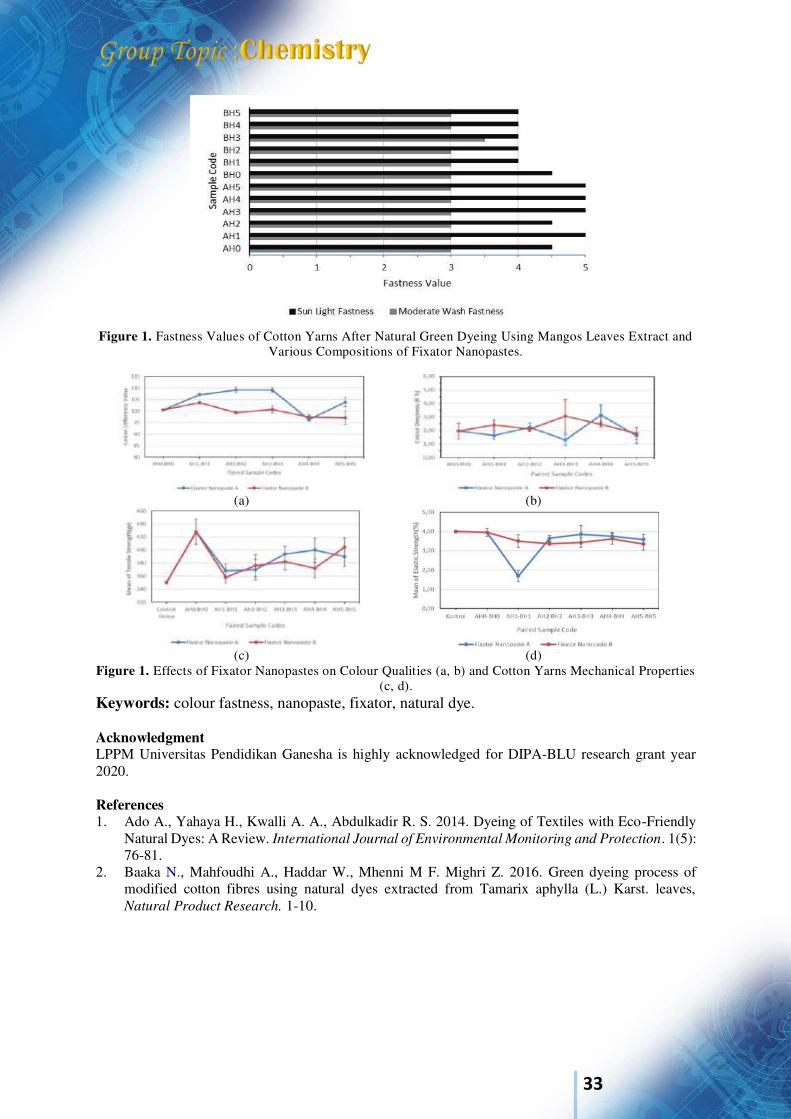
33
Figure 1. Fastness Values of Cotton Yarns After Natural Green Dyeing Using Mangos Leaves Extract and
Various Compositions of Fixator Nanopastes.
(a) (b)
(c) (d)
Figure 1. Effects of Fixator Nanopastes on Colour Qualities (a, b) and Cotton Yarns Mechanical Properties (c, d).
Keywords: colour fastness, nanopaste, fixator, natural dye. Acknowledgment LPPM Universitas Pendidikan Ganesha is highly acknowledged for DIPA-BLU research grant year 2020. References 1. Ado A., Yahaya H., Kwalli A. A., Abdulkadir R. S. 2014. Dyeing of Textiles with Eco-Friendly
Natural Dyes: A Review. International Journal of Environmental Monitoring and Protection. 1(5): 76-81.
2. Baaka N., Mahfoudhi A., Haddar W., Mhenni M F. Mighri Z. 2016. Green dyeing process of modified cotton fibres using natural dyes extracted from Tamarix aphylla (L.) Karst. leaves, Natural Product Research. 1-10.
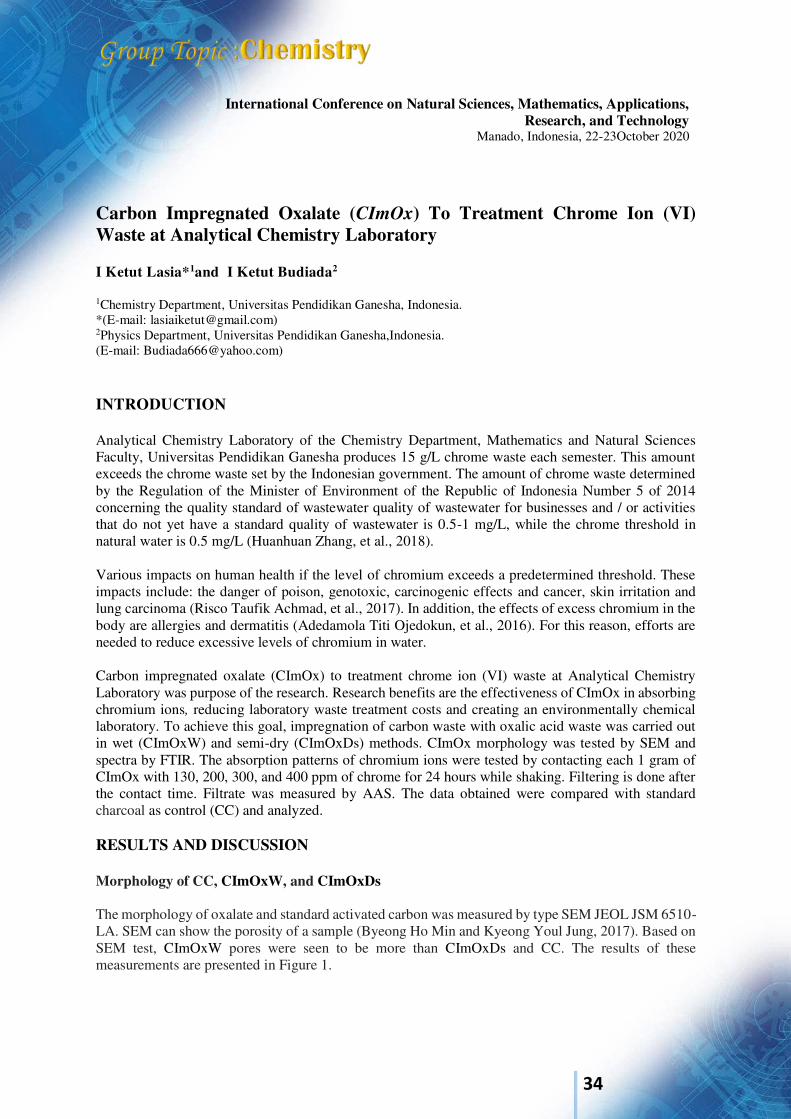
34
International Conference on Natural Sciences, Mathematics, Applications, Research, and Technology
Manado, Indonesia, 22-23October 2020
Carbon Impregnated Oxalate (CImOx) To Treatment Chrome Ion (VI) Waste at Analytical Chemistry Laboratory I Ketut Lasia*1and I Ketut Budiada2
1Chemistry Department, Universitas Pendidikan Ganesha, Indonesia. *(E-mail: [email protected]) 2Physics Department, Universitas Pendidikan Ganesha,Indonesia. (E-mail: [email protected]) INTRODUCTION Analytical Chemistry Laboratory of the Chemistry Department, Mathematics and Natural Sciences Faculty, Universitas Pendidikan Ganesha produces 15 g/L chrome waste each semester. This amount exceeds the chrome waste set by the Indonesian government. The amount of chrome waste determined by the Regulation of the Minister of Environment of the Republic of Indonesia Number 5 of 2014 concerning the quality standard of wastewater quality of wastewater for businesses and / or activities that do not yet have a standard quality of wastewater is 0.5-1 mg/L, while the chrome threshold in natural water is 0.5 mg/L (Huanhuan Zhang, et al., 2018). Various impacts on human health if the level of chromium exceeds a predetermined threshold. These impacts include: the danger of poison, genotoxic, carcinogenic effects and cancer, skin irritation and lung carcinoma (Risco Taufik Achmad, et al., 2017). In addition, the effects of excess chromium in the body are allergies and dermatitis (Adedamola Titi Ojedokun, et al., 2016). For this reason, efforts are needed to reduce excessive levels of chromium in water. Carbon impregnated oxalate (CImOx) to treatment chrome ion (VI) waste at Analytical Chemistry Laboratory was purpose of the research. Research benefits are the effectiveness of CImOx in absorbing chromium ions, reducing laboratory waste treatment costs and creating an environmentally chemical laboratory. To achieve this goal, impregnation of carbon waste with oxalic acid waste was carried out in wet (CImOxW) and semi-dry (CImOxDs) methods. CImOx morphology was tested by SEM and spectra by FTIR. The absorption patterns of chromium ions were tested by contacting each 1 gram of CImOx with 130, 200, 300, and 400 ppm of chrome for 24 hours while shaking. Filtering is done after the contact time. Filtrate was measured by AAS. The data obtained were compared with standard charcoal as control (CC) and analyzed. RESULTS AND DISCUSSION Morphology of CC, CImOxW, and CImOxDs The morphology of oxalate and standard activated carbon was measured by type SEM JEOL JSM 6510-LA. SEM can show the porosity of a sample (Byeong Ho Min and Kyeong Youl Jung, 2017). Based on SEM test, CImOxW pores were seen to be more than CImOxDs and CC. The results of these measurements are presented in Figure 1.
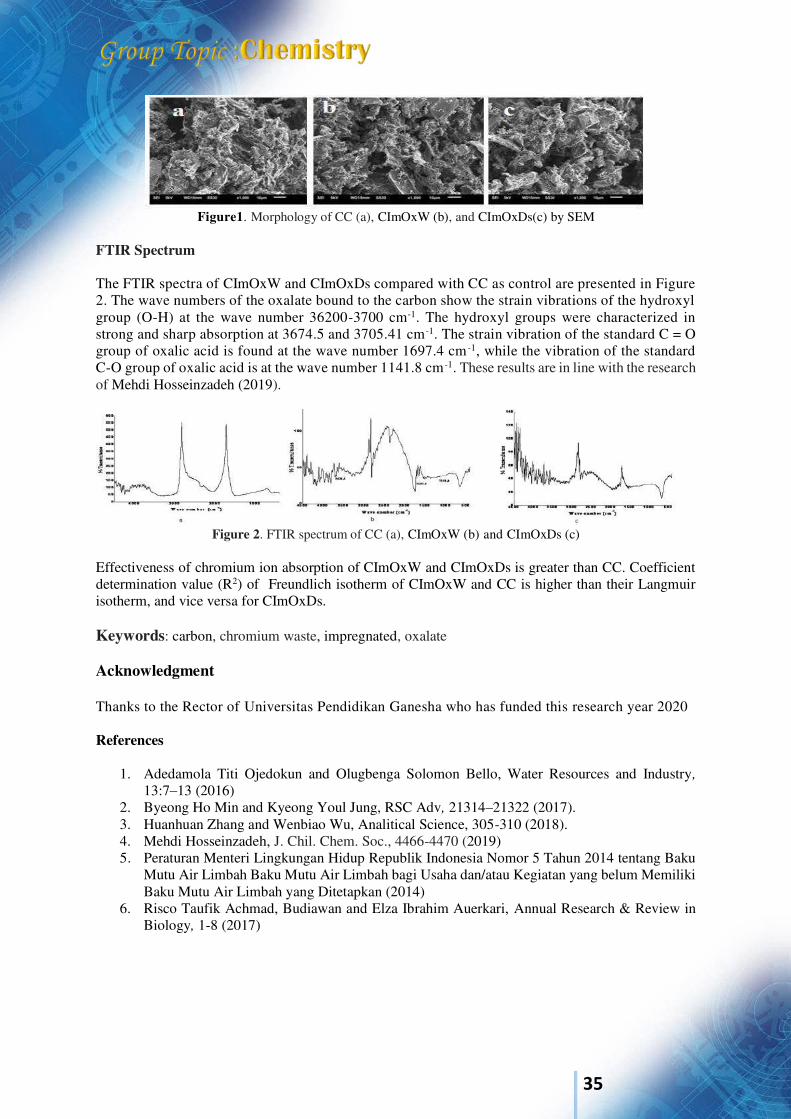
35
Figure1. Morphology of CC (a), CImOxW (b), and CImOxDs(c) by SEM
FTIR Spectrum The FTIR spectra of CImOxW and CImOxDs compared with CC as control are presented in Figure 2. The wave numbers of the oxalate bound to the carbon show the strain vibrations of the hydroxyl group (O-H) at the wave number 36200-3700 cm-1. The hydroxyl groups were characterized in strong and sharp absorption at 3674.5 and 3705.41 cm-1. The strain vibration of the standard C = O group of oxalic acid is found at the wave number 1697.4 cm -1, while the vibration of the standard C-O group of oxalic acid is at the wave number 1141.8 cm -1. These results are in line with the research of Mehdi Hosseinzadeh (2019).
Figure 2. FTIR spectrum of CC (a), CImOxW (b) and CImOxDs (c)
Effectiveness of chromium ion absorption of CImOxW and CImOxDs is greater than CC. Coefficient determination value (R2) of Freundlich isotherm of CImOxW and CC is higher than their Langmuir isotherm, and vice versa for CImOxDs. Keywords: carbon, chromium waste, impregnated, oxalate Acknowledgment Thanks to the Rector of Universitas Pendidikan Ganesha who has funded this research year 2020 References
1. Adedamola Titi Ojedokun and Olugbenga Solomon Bello, Water Resources and Industry, 13:7–13 (2016)
2. Byeong Ho Min and Kyeong Youl Jung, RSC Adv, 21314–21322 (2017). 3. Huanhuan Zhang and Wenbiao Wu, Analitical Science, 305-310 (2018). 4. Mehdi Hosseinzadeh, J. Chil. Chem. Soc., 4466-4470 (2019) 5. Peraturan Menteri Lingkungan Hidup Republik Indonesia Nomor 5 Tahun 2014 tentang Baku
Mutu Air Limbah Baku Mutu Air Limbah bagi Usaha dan/atau Kegiatan yang belum Memiliki Baku Mutu Air Limbah yang Ditetapkan (2014)
6. Risco Taufik Achmad, Budiawan and Elza Ibrahim Auerkari, Annual Research & Review in Biology, 1-8 (2017)
36
International Conference on Natural Sciences, Mathematics, Applications, Research, and Technology
Manado, Indonesia, 22-23 October 2020
EFFECT OF STORAGE AND AGEING TIME ON SENSORICAL QUALITY AND COMPOSITION OF WINE PHENOLIC COMPOUNDS IMPROVED WITH SACHAROMYCES CEREVICIAE LOCAL HYBRID I Nyoman Tika*1,and I G.A.T. Agustiana2 and Luh Putu Desy Puspaningrat3
1Department of Chemistry, Faculty of Mathematics and Natural Sciences, Universitas Pendidikan Ganesha-
2Department of Elementery School education, Faculty of Education, Universitas Pendidikan Ganesha-
Indonesia 3Departement of Farmacy, Institute of Health Science Buleleng Bali- Indonesia
Jl. Udayana no. 11 Singaraja 81116
*Corresponding author: [email protected] High quality wine can be produced by the perfect ageing process. The purpose of this study was to determine the effect of ageing process container on sensory quality and composition of phenolic compounds of wine fermented with local hybrid Sacharomyces cereviciae. The research design used a randomized block design with two factorials. The first factor is the materials for storing during the ageing process, namely plastic bottles, glass bottles and pottery barrels (from Banyuning). The second factor is ageing time, namely 1, 2, 3, 4 and 5 months. The experiment was carried out two times over so that 30 experimental units were obtained. The variables measured were phenolic compounds and sensory quality (aroma and taste, color, and turbidity level). The composition of the phenolic compounds was determined by gas chromatography-mass spectrometer (GC-MS) and sensory quality test using 15 trained fanelis. The results showed that the composition of the highest phenolic compound content was shown successively with containers: plastic bottles, glass and earthenware and the ageing time was 4 months. The content of phenolic compounds is Isoamyl alcohol (ISM), Isobutanol (ISB), n-propanol (PR), Acetaldehyde (ADE), 2,3 –Butanediol (BUT), Acetone (ACE), while the best sensory quality is using pottery. because it has better aroma and taste, lower turbidity level. Based on data analysis, it can be concluded that the length of time for the ageing process and the container during the ageing process has a significant effect on the quality and content of phenolic compounds in grape wine fermented with local hybrid Sacharomyces cereviciae. INTRODUCTION Wine is a fermented drink. The process of aging wine is an important process to produce high-quality wine (Ugliano, M. (2013). Traditionally, the process of aging wine uses oak barrels. At least 150 types of oak are used to improve the quality of wine (Dumitriu)., Et al., 2019 ). Various attempts were made to produce high quality wines in the aging process, namely using oak wood fragments, (Tao, et al., 2014)., Microoxygenation applications (Tao, et al., 2014), Treatment through increasing levels of lees (yeast waste ) which is made in high concentrations (Loira, et al., 2008) or the application of physical methods by replacing non-wooden containers (Dumitriu, et al., 2019). Various modifications are still problematic, namely a long time being inefficient, unhygienic, yeast activity is not disturbed, causing microbial damage to grow, so that the quality of wine decreases, and the esterification process is disturbed (Tao, et al., 2014) Another breakthrough, using materials that have an orthodoxy high, allows for rapid and homogeneous esterification, and resistance to other microbial contaminants (Martínez, et al., (2019). This condition can use hybrid yeast types that have stable properties, namely nutrient deficiencies and high alcohol content. between yeast Saccharomyces cerevisiae and microbes (Ugliano, M. (2013). This strategy has continued to be developed in the last decade, but the results have not been satisfactory (Martínez, et al., (2019). Yeast hybrid technology can be developed to produce wine, namely local hybrids of Saccharomyces cerevisiae (Tika., 2017) and has been applied to a structured fermentation method that can produce zero percent alcoholic wines (Patent, No S00202000017, I Nyoman Tika, 2020). Local hybrid
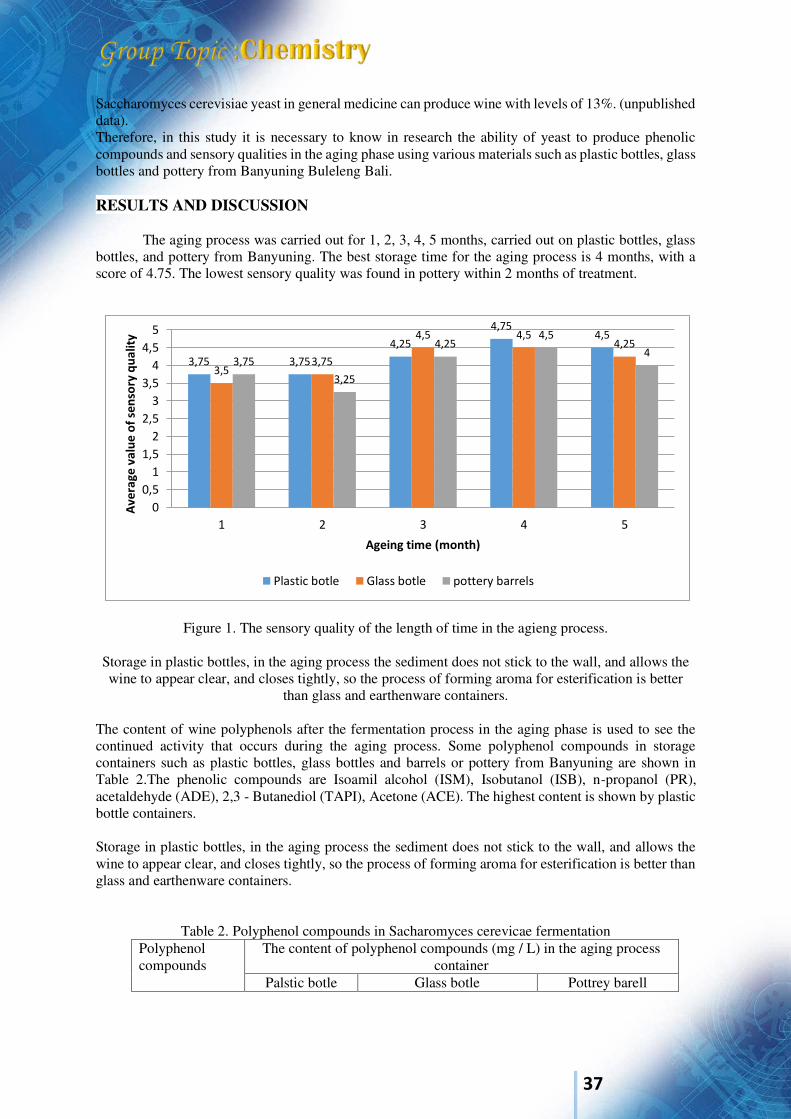
37
Saccharomyces cerevisiae yeast in general medicine can produce wine with levels of 13%. (unpublished data). Therefore, in this study it is necessary to know in research the ability of yeast to produce phenolic compounds and sensory qualities in the aging phase using various materials such as plastic bottles, glass bottles and pottery from Banyuning Buleleng Bali. RESULTS AND DISCUSSION
The aging process was carried out for 1, 2, 3, 4, 5 months, carried out on plastic bottles, glass
bottles, and pottery from Banyuning. The best storage time for the aging process is 4 months, with a score of 4.75. The lowest sensory quality was found in pottery within 2 months of treatment.
Figure 1. The sensory quality of the length of time in the agieng process. Storage in plastic bottles, in the aging process the sediment does not stick to the wall, and allows the wine to appear clear, and closes tightly, so the process of forming aroma for esterification is better
than glass and earthenware containers.
The content of wine polyphenols after the fermentation process in the aging phase is used to see the continued activity that occurs during the aging process. Some polyphenol compounds in storage containers such as plastic bottles, glass bottles and barrels or pottery from Banyuning are shown in Table 2.The phenolic compounds are Isoamil alcohol (ISM), Isobutanol (ISB), n-propanol (PR), acetaldehyde (ADE), 2,3 - Butanediol (TAPI), Acetone (ACE). The highest content is shown by plastic bottle containers. Storage in plastic bottles, in the aging process the sediment does not stick to the wall, and allows the wine to appear clear, and closes tightly, so the process of forming aroma for esterification is better than glass and earthenware containers.
Table 2. Polyphenol compounds in Sacharomyces cerevicae fermentation Polyphenol compounds
The content of polyphenol compounds (mg / L) in the aging process container
Palstic botle Glass botle Pottrey barell
3,75 3,75
4,25
4,754,5
3,53,75
4,5 4,54,25
3,75
3,25
4,254,5
4
0
0,5
1
1,5
2
2,5
3
3,5
4
4,5
5
1 2 3 4 5
Av
era
ge
va
lue
of
sen
sory
qu
ali
ty
Ageing time (month)
Plastic botle Glass botle pottery barrels
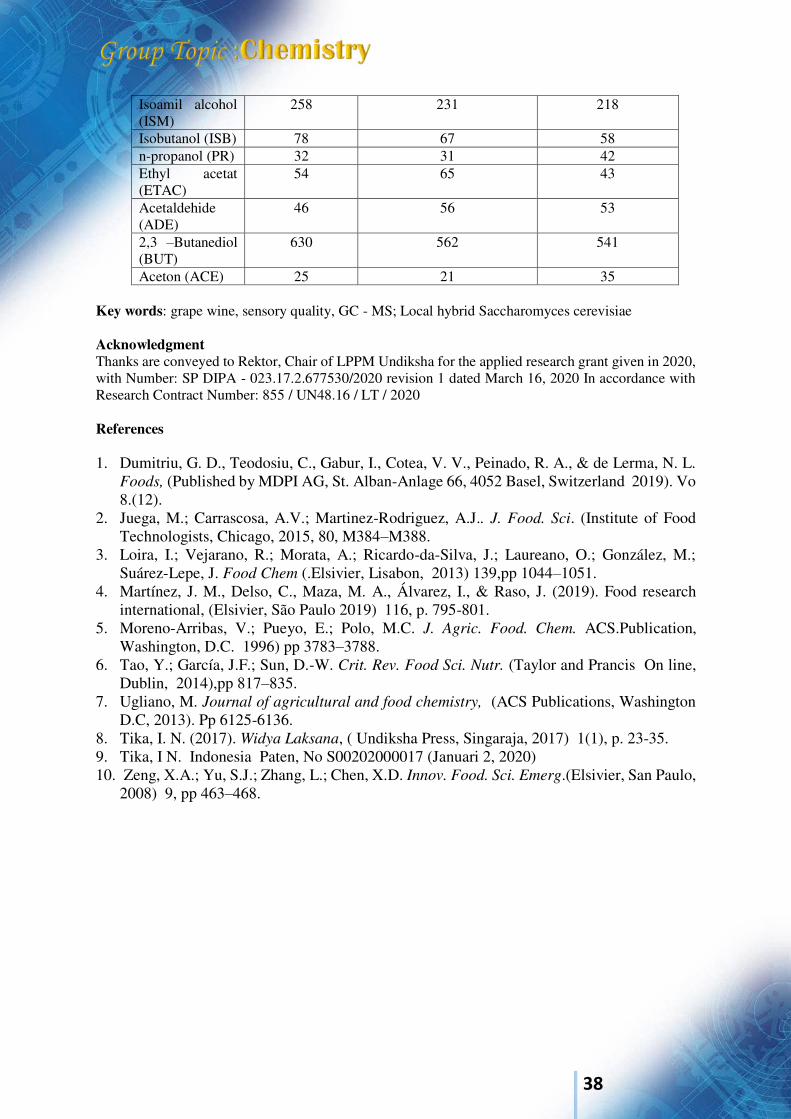
38
Isoamil alcohol (ISM)
258 231 218
Isobutanol (ISB) 78 67 58 n-propanol (PR) 32 31 42 Ethyl acetat (ETAC)
54 65 43
Acetaldehide (ADE)
46 56 53
2,3 –Butanediol (BUT)
630 562 541
Aceton (ACE) 25 21 35 Key words: grape wine, sensory quality, GC - MS; Local hybrid Saccharomyces cerevisiae Acknowledgment Thanks are conveyed to Rektor, Chair of LPPM Undiksha for the applied research grant given in 2020, with Number: SP DIPA - 023.17.2.677530/2020 revision 1 dated March 16, 2020 In accordance with Research Contract Number: 855 / UN48.16 / LT / 2020 References 1. Dumitriu, G. D., Teodosiu, C., Gabur, I., Cotea, V. V., Peinado, R. A., & de Lerma, N. L.
Foods, (Published by MDPI AG, St. Alban-Anlage 66, 4052 Basel, Switzerland 2019). Vo 8.(12).
2. Juega, M.; Carrascosa, A.V.; Martinez-Rodriguez, A.J.. J. Food. Sci. (Institute of Food Technologists, Chicago, 2015, 80, M384–M388.
3. Loira, I.; Vejarano, R.; Morata, A.; Ricardo-da-Silva, J.; Laureano, O.; González, M.; Suárez-Lepe, J. Food Chem (.Elsivier, Lisabon, 2013) 139,pp 1044–1051.
4. Martínez, J. M., Delso, C., Maza, M. A., Álvarez, I., & Raso, J. (2019). Food research international, (Elsivier, São Paulo 2019) 116, p. 795-801.
5. Moreno-Arribas, V.; Pueyo, E.; Polo, M.C. J. Agric. Food. Chem. ACS.Publication, Washington, D.C. 1996) pp 3783–3788.
6. Tao, Y.; García, J.F.; Sun, D.-W. Crit. Rev. Food Sci. Nutr. (Taylor and Prancis On line, Dublin, 2014),pp 817–835.
7. Ugliano, M. Journal of agricultural and food chemistry, (ACS Publications, Washington D.C, 2013). Pp 6125-6136.
8. Tika, I. N. (2017). Widya Laksana, ( Undiksha Press, Singaraja, 2017) 1(1), p. 23-35. 9. Tika, I N. Indonesia Paten, No S00202000017 (Januari 2, 2020) 10. Zeng, X.A.; Yu, S.J.; Zhang, L.; Chen, X.D. Innov. Food. Sci. Emerg.(Elsivier, San Paulo,
2008) 9, pp 463–468.
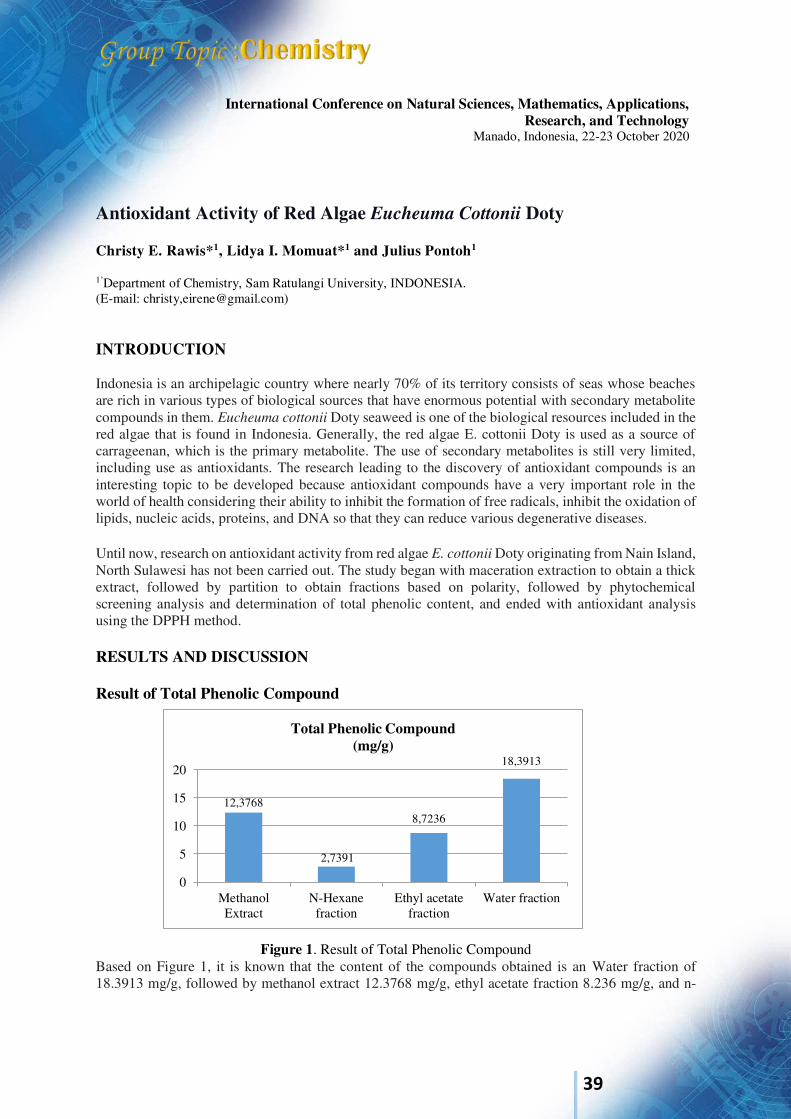
39
International Conference on Natural Sciences, Mathematics, Applications, Research, and Technology
Manado, Indonesia, 22-23 October 2020
Antioxidant Activity of Red Algae Eucheuma Cottonii Doty Christy E. Rawis*1, Lidya I. Momuat*1 and Julius Pontoh1
1’Department of Chemistry, Sam Ratulangi University, INDONESIA. (E-mail: christy,[email protected])
INTRODUCTION Indonesia is an archipelagic country where nearly 70% of its territory consists of seas whose beaches are rich in various types of biological sources that have enormous potential with secondary metabolite compounds in them. Eucheuma cottonii Doty seaweed is one of the biological resources included in the red algae that is found in Indonesia. Generally, the red algae E. cottonii Doty is used as a source of carrageenan, which is the primary metabolite. The use of secondary metabolites is still very limited, including use as antioxidants. The research leading to the discovery of antioxidant compounds is an interesting topic to be developed because antioxidant compounds have a very important role in the world of health considering their ability to inhibit the formation of free radicals, inhibit the oxidation of lipids, nucleic acids, proteins, and DNA so that they can reduce various degenerative diseases. Until now, research on antioxidant activity from red algae E. cottonii Doty originating from Nain Island, North Sulawesi has not been carried out. The study began with maceration extraction to obtain a thick extract, followed by partition to obtain fractions based on polarity, followed by phytochemical screening analysis and determination of total phenolic content, and ended with antioxidant analysis using the DPPH method. RESULTS AND DISCUSSION Result of Total Phenolic Compound
Figure 1. Result of Total Phenolic Compound
Based on Figure 1, it is known that the content of the compounds obtained is an Water fraction of 18.3913 mg/g, followed by methanol extract 12.3768 mg/g, ethyl acetate fraction 8.236 mg/g, and n-
12,3768
2,7391
8,7236
18,3913
0
5
10
15
20
MethanolExtract
N-Hexanefraction
Ethyl acetatefraction
Water fraction
Total Phenolic Compound(mg/g)

40
hexane fraction 2,7391 mg/g. Water solvents can dissolve more phenolic compounds, this indicates that most of the phenolic compounds in Eucheuma cottonii Doty are polar compounds. Result of Antioxidant Activity
Table 1. Result of Antioxidant Activity IC50
(𝝁g/mL) Methanol Extract 26,696 N-Hexane Fraction 12,496 Ethyl Acetate Fraction 7,505 Water Fraction 4,799 Vitamin C 1,668
The antioxidant activity is indicated by the IC50 value obtained. Based on table 1, the results of the calculation of the IC50 value show that the methanol extract has the highest IC50 value namely 26.696 μg/mL followed by the n-hexane fraction 12.496 μg / mL, ethyl acetate fraction 7.505 μg/mL, water fraction 4.799 μg / mL and vitamin C (ascorbic acid) 1,668 μg/mL. The lower the IC50 value, the better the antioxidant activity in the sample. A compound is said to have a very strong antioxidant activity when the IC50 is <50 ppm, strong if the IC50 is 50-100 ppm, while the IC50 is 101-250, and weak when the IC50 is 251-500 ppm. Based on the criteria for the value of the antioxidant activity, the methanol extract, n-hexane fraction, ethyl acetate fraction, water fraction, and vitamin C have very strong antioxidant categories. The results of antioxidant activity showed results that were not directly proportional to the results of the total phenolic content of the sample. This is presumably because the antioxidant activity of the red algae E. Cottonii Doty is largely influenced by the content of flavonoids. This is supported by Egwaikhide & Gimba (2007) in Eleanore (2013) which states that flavonoids are compounds that have more complex phenol groups with a higher degree of hydroxylation. The presence of hydroxyl groups in phenol and flavonoid compounds causes antioxidant activity. Keywords: Eucheuma Cottonii Doty, Red Algae, Antioxidant References Anggadiredja, J.T., Achmad, Z., Heri, P. and Sri, I. 2011. Rumput Laut. Jakarta: Penebar Swadaya. Hanani, E., Abdul, M. and Ryany, S. 2005 Identifikasi Senyawa Antioksidan Dalam Spons
Callyspongia SP Dari Kepulauan Seribu, Majalah Ilmu Kefarmasian. 2(3):127–133. Krishnaiah, D., Sarbatly, R. and Nithyanandam, R. 2011. A Review of The Antioxidant Potential of
Medicinal Plant Species Food Bioprod. Process, 89:217–233. Lantah, P.L., Montolalu, L.A.D.Y. and Reo. A.R. 2017. Kandungan Fitokimia Dan Aktivitas
Antioksidan Ekstrak Metanol Rumput Laut Kappaphycus Alvarezii. Jurnal Media Teknologi
Hasil Perikanan. 3:73-79. Mulangsri, D.A.K., Aqnes, B. and Endah, N. S. 2017. Aktivitas Antioksidan Fraksi Dietileter Buah
Mangga Arumanis (Mangifera indica L.) dengan Metode DPPH, Jurnal Pharmascience. 4(1):85 – 93.
Rizkayanti, Anang W., M, D. and Minarni, R. J. 2017. Uji Aktivitas Antioksidan Ekstrak Air Dan Ekstrak Etanol Daun Kelor (Moringa Oleifera Lam ), J. Akad. Kim. 6(2): 125-131.
Yuslianti, E.R. 2018. Pengantar Radikal Bebas dan Antioksidan. Yokyakarta: Deepublish.
41
International Conference on Natural Sciences, Mathematics, Applications, Research, and Technology
Manado, Indonesia, 22-23 October 2020
Functional Amino Acids and Fatty Acids, and Antibacterial Activity for Enhancing Phytoadditive of Bitter Leaves (Vernonia amygdalina) for Broiler Chickens Jet Saartje Mandey Animal Nutrition Department, Animal Husbandry Faculty, Sam Ratulangi University, Manado, North Sulawesi, Indonesia (E-mail: [email protected]) INTRODUCTION Modern feedstuff production is based on adding bioactives ingredients to feed. This should reduce the need for antibiotics and other medication, and positively influence animal health and welfare (Baltic, et al., 2017). In animal nutrition, more attention is now focused on competitive exclusion, probiotics, prebiotics, antibacterial peptides, yeast, and fatty acids (Baltic, et al., 2011). Beside their energy value, bioactive fatty acids such as medium chain fatty acids, linoleic acid (C18:2), and linolenic acid (C18:3) are the fatty acids which categorized as essential fatty acid. They have significance influence on human and animal health (Aluko, 2012). This study aimed to evaluate the functional amino acids and fatty acids of bitter leaves for enhancing phytoadditive and to determine the antibacterial activity of bitter leaves (Vernonia amygdalina) against the pathogen Escherichia coli and Staphylococcus aureus. Amino acids were analyzed by HPLC method, used Thermo Ultimate 3000 RS Fluorescence Detector. The fatty acid analysis was carried out by A.O.A.C. Official Methods 2012.13: 991.33 (fatty acid in oils and fats; preparation methyl ester). And analysis of fat content according to A.O.A.C 2012: 991.36. Antibacterial tests were carried out by disc diffusion method (Pal, et al., 2007). For antibacterial analysis, bitter leaves were prepared from fresh plants in three concentrations (2.5%, 5% and 10%), the positive control of chloramphenicol and the negative control of DMSO. Antibacterial activity was evaluated by measuring the zone of inhibition against the test organisms. All inhibitory tests were performed in triplicate. Growth bacteria were observed, and the zone of inhibition was calculated in millimetres carefully. Data were analyzed by descriptive method. RESULTS AND DISCUSSION Result showed that that dominant amino acids in bitter leaves were Phenylalanine (320.92 ppm), Serine (297.91 ppm), Isoleucine (138.65 ppm), Glycine (136.85 ppm), Arginine (111.43 ppm), Valine (27.58 ppm), and Lycine (6.31 ppm), moreover, dominant fatty acids in bitter leaves were Linolenic acid (C18:3n3), Linoleic acid (C18:2n6c), Palmitic acid (C16:0), Cis-13,16-Docosadienoic acid (C22:2), Oleic acid (C18:1n9c), Stearic acid (C18:0), Lauric acid (C12:0), Palmitoleic acid (C16:1), and fatty acid total was 38.55 % w/w, whereas fat content was 2.10 % w/w. Inhibition zone for E. coli at concentration between 2.5%, 5%, and 10% showed the same response (6 mm), and was lower than that of positive control chloramphenicol (8.96 mm), and, for S. aureus inhibition zone at concentration 5% (7.76 mm) and 10% (9.05 mm) were still lower than the positive control (11.57 mm), however, it can be seen for bitter leaves inhibition on S. aureus that the higher the concentration of the compound given, the greater the diameter of the inhibitory region formed. That were in good value. The antimicrobial properties of amino acids and fatty acids are well known and there is a close relationship between the

42
structure and their ability to function as antimicrobial agents. Saturated fatty acids are effective against microorganisms at lower chain lengths, while monounsaturated and polyunsaturated fatty acids with longer chain lengths are more effective. The position of double bonds is significant for long chain fatty acids (McGaw et al., 2002). Anzaku et al. (2017) reported that free fatty acids (FFA) of various chain lengths (C8 - C18) have antibacterial activity against a range of Gram-positive bacteria, but not against a number of Gram-negative bacteria. It can be concluded that bitter leaf was better as natural antimicrobials for S. aureus. So, bitter leaf can be used as feed additives in broiler diet. Keywords: Amino acids, Antibacterial; Bitter leaf, Fatty acid, Phytoadditive Acknowledgment The author would like to thank to the LPPM-UNSRAT for providing financial assistance of RTUU Project in this research. References
1. B. Baltic, M. Starcevic, J. Dordevic, B. Mrdovic and R.Marcovic, Importane of medium chain fatty acids in animal nutrition. IOP Conf. Series: Earth and Environmental Science 85 (2017) 012048 (2017).
2. Z. M. Baltic, R. Marcovic and V. Dordevic, Nutrition and meat quality. Technologija mesa 52: 154-159 (2011).
3. R. E. Aluko, Functional Food and Nutraceutical. Springer. New York. p. 22 (2012). 4. S. Pal, T. Y. Kyung and S. J. Myong, Does the antibacterial activity of silver nanoparticles
depend on the shape of the nanoparticle? A study of the gram-negative bacterium Escherichia
coli. Appl. Environ. Microbiol. 73 (6): 1712-1720 (2007). 5. L. J. McGaw, A. K. Jäger, J. Van Staden, Isolation of antibacterial fatty acids from Schotia
brachypetala. Fitoterapia. 73: 431-433 (2002). 6. A. A. Anzaku, J. I. Akyala, A. Juliet and C. E. Obianuju. Antibacterial activity of lauric acid
on some selected clinical isolates. Ann. of Clinic. and Lab. Res. 5 (2): 170-174 (2017).
43
International Conference on Natural Sciences, Mathematics, Applications, Research, and Technology
Manado, Indonesia, 22-23 October 2020
Antioxidant Activity of Red Algae Eucheuma Spinosum J.AGARDH From North Sulawesi Evany C.F. Paulus*1, Lidya I. Momuat*2 and Julius Pontoh3
1’Department of Chemistry, Sam Ratulangi University, INDONESIA. (E-mail: [email protected]) INTRODUCTION Indonesia with the largest marine biodiversity, which has various types of marine plants that can be used as food and medicines that are useful for maintaining health from disease attacks. Degenerative disease is a chronic non-communicable disease. The main contributor to chronic disease is an unhealthy lifestyle. The main cause of degenerative diseases is the presence of excess free radical activity in the body. Substances that can prevent and prevent oxidative damage due to free radicals are antioxidants. Sources of antioxidant compounds from cultivated plants need to be done to meet human needs for additional antioxidants. One of the biological resources that can be processed as foodstuffs as a source of antioxidants or secondary metabolites is marine algae. Eucheuma spinosum is a type of marine algae class Rhodophyceae (red algae). This type of algae also contains the main carrageenan polysaccharide ingredients. Carrageenan is a fiber that can lower blood cholesterol levels, which are primary metabolites. The utilization of biological sources as antioxidants is still very limited, considering its ability to inhibit the formation of free radicals. For this reason, research was carried out on the red algae species Eucheuma spinosum from Nain Island. The research was carried out to determine the total phenolic and antioxidant activity tests which were macerated with methanol as a solvent and partition using a solvent with multiple levels of polarity, namely n-hexane, ethyl acetate, and water RESULTS AND DISCUSSION
Result of Phenolic Total
In Figure 1. The highest total phenolic content is the ethyl acetate fraction with a value of 51,362 mg/g, followed by the n-hexane fraction 45,130 mg/g, the water fraction 41,652 mg/g, and the methanol extract 38,029 mg/g. Ethyl acetate fraction has a high value, this is because ethyl acetate solvent can dissolve more phenolic group compounds so that most of the phenolic compounds found in marine algae Eucheuma spinosum are semipolar compounds. In determining the total phenolic content, ethyl acetate extract can produce the highest phenol content, where ethyl acetate is more effective at dissolving phenolic compounds than methanol and n-hexane. Ethyl acetate is a solvent that is often used to extract phenolic compounds.
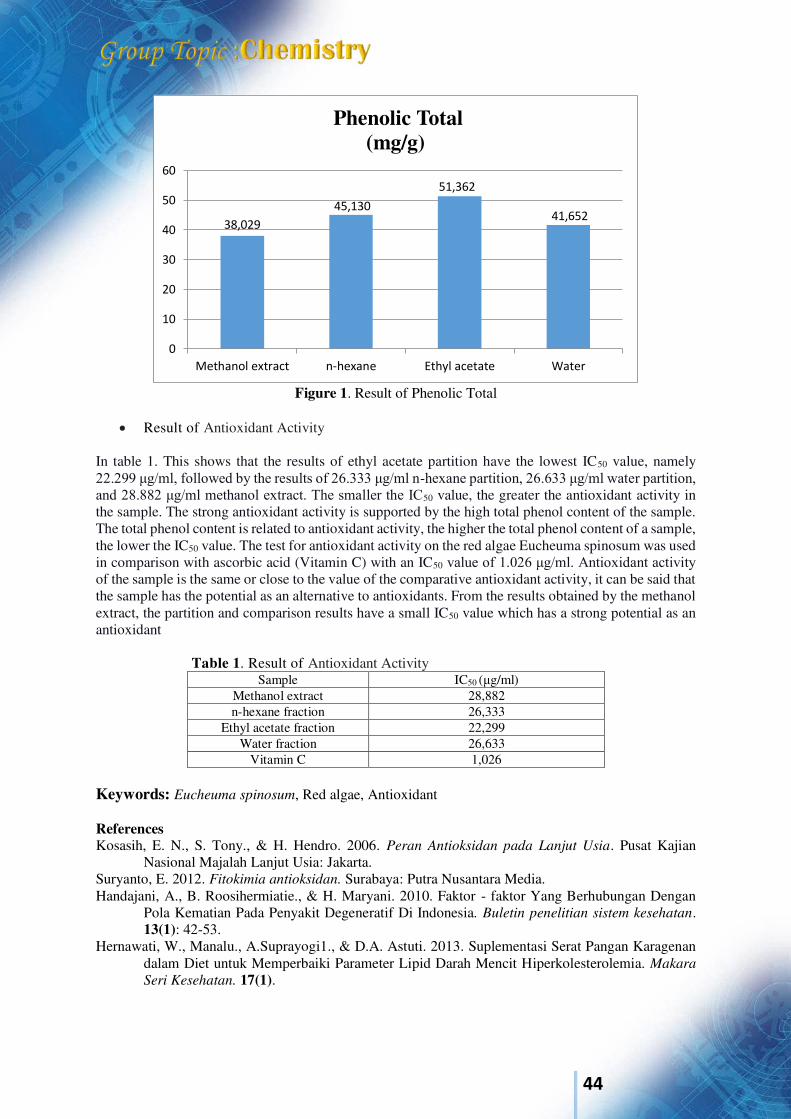
44
Figure 1. Result of Phenolic Total
Result of Antioxidant Activity
In table 1. This shows that the results of ethyl acetate partition have the lowest IC50 value, namely 22.299 μg/ml, followed by the results of 26.333 μg/ml n-hexane partition, 26.633 μg/ml water partition, and 28.882 μg/ml methanol extract. The smaller the IC50 value, the greater the antioxidant activity in the sample. The strong antioxidant activity is supported by the high total phenol content of the sample. The total phenol content is related to antioxidant activity, the higher the total phenol content of a sample, the lower the IC50 value. The test for antioxidant activity on the red algae Eucheuma spinosum was used in comparison with ascorbic acid (Vitamin C) with an IC50 value of 1.026 μg/ml. Antioxidant activity of the sample is the same or close to the value of the comparative antioxidant activity, it can be said that the sample has the potential as an alternative to antioxidants. From the results obtained by the methanol extract, the partition and comparison results have a small IC50 value which has a strong potential as an antioxidant
Table 1. Result of Antioxidant Activity Sample IC50 (μg/ml)
Methanol extract 28,882 n-hexane fraction 26,333
Ethyl acetate fraction 22,299 Water fraction 26,633
Vitamin C 1,026 Keywords: Eucheuma spinosum, Red algae, Antioxidant References Kosasih, E. N., S. Tony., & H. Hendro. 2006. Peran Antioksidan pada Lanjut Usia. Pusat Kajian
Nasional Majalah Lanjut Usia: Jakarta. Suryanto, E. 2012. Fitokimia antioksidan. Surabaya: Putra Nusantara Media. Handajani, A., B. Roosihermiatie., & H. Maryani. 2010. Faktor - faktor Yang Berhubungan Dengan
Pola Kematian Pada Penyakit Degeneratif Di Indonesia. Buletin penelitian sistem kesehatan. 13(1): 42-53.
Hernawati, W., Manalu., A.Suprayogi1., & D.A. Astuti. 2013. Suplementasi Serat Pangan Karagenan dalam Diet untuk Memperbaiki Parameter Lipid Darah Mencit Hiperkolesterolemia. Makara
Seri Kesehatan. 17(1).
38,029
45,130
51,362
41,652
0
10
20
30
40
50
60
Methanol extract n-hexane Ethyl acetate Water
Phenolic Total(mg/g)

45
Adawiyah, D. Sarastani dan D. Fardiaz. 2011. Kajian Aktivitas Antioksidan Biji Buah Atung (Parinarium glaberimum Hassk.). [Skripsi]. Fakultas Teknologi Pertanian, Institut Pertanian Bogor.
Fermanasari, D., Titin, A. Z., Muhammad, A. W. 2016. Uji Total Fenol Aktivitas Antioksidan dan Sitotoksitas Daun Akar Bambak ( Ipomoea sp.). JKK. 5(4): 68-73.
Yuliani, D. 2011. Kajian Aktivitas Antioksidan Fraksi Etanol Jintan Hitam (Nigella sativa, L.) [Skripsi]. Jurusan Kimia Fakultas Sains dan Teknologi, Universitas Islam Negeri Maulana Malik Ibrahim Malang.
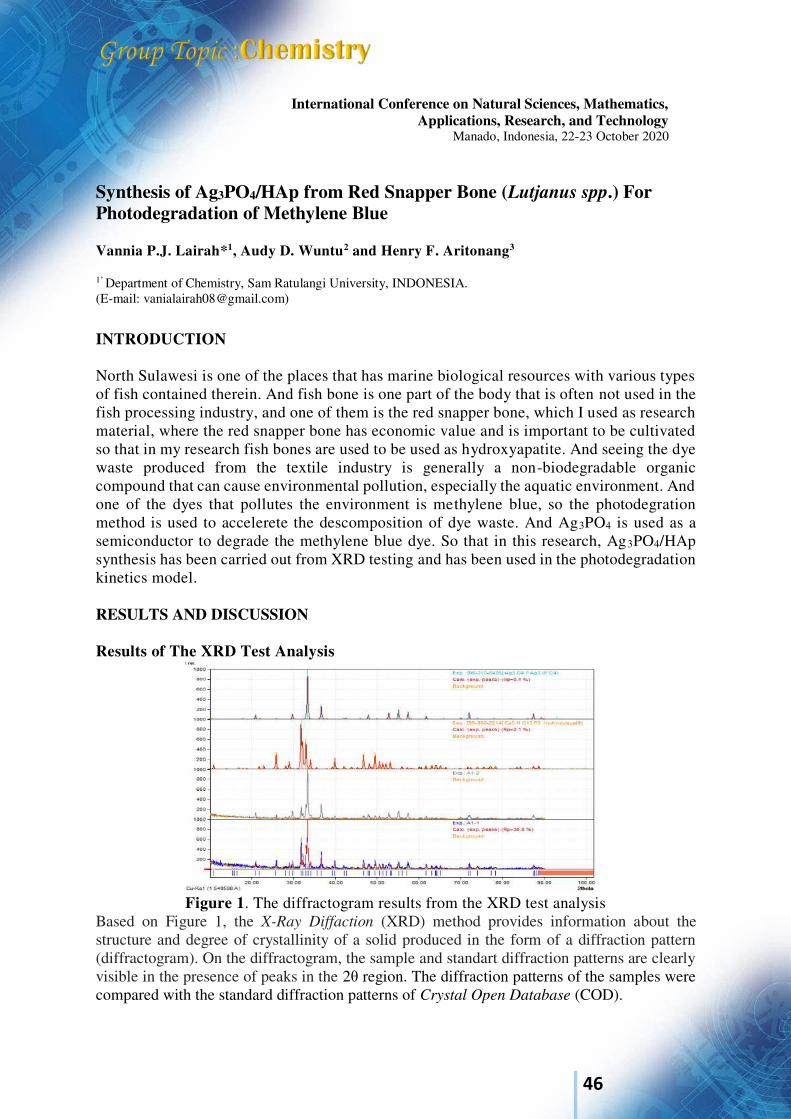
46
International Conference on Natural Sciences, Mathematics, Applications, Research, and Technology
Manado, Indonesia, 22-23 October 2020
Synthesis of Ag3PO4/HAp from Red Snapper Bone (Lutjanus spp.) For Photodegradation of Methylene Blue Vannia P.J. Lairah*1, Audy D. Wuntu2 and Henry F. Aritonang3
1’ Department of Chemistry, Sam Ratulangi University, INDONESIA. (E-mail: [email protected])
INTRODUCTION North Sulawesi is one of the places that has marine biological resources with various types of fish contained therein. And fish bone is one part of the body that is often not used in the fish processing industry, and one of them is the red snapper bone, which I used as research material, where the red snapper bone has economic value and is important to be cultivated so that in my research fish bones are used to be used as hydroxyapatite. And seeing the dye waste produced from the textile industry is generally a non-biodegradable organic compound that can cause environmental pollution, especially the aquatic environment. And one of the dyes that pollutes the environment is methylene blue, so the photodegration method is used to accelerete the descomposition of dye waste. And Ag3PO4 is used as a semiconductor to degrade the methylene blue dye. So that in this research, Ag3PO4/HAp synthesis has been carried out from XRD testing and has been used in the photodegradation kinetics model. RESULTS AND DISCUSSION Results of The XRD Test Analysis
Figure 1. The diffractogram results from the XRD test analysis
Based on Figure 1, the X-Ray Diffaction (XRD) method provides information about the structure and degree of crystallinity of a solid produced in the form of a diffraction pattern (diffractogram). On the diffractogram, the sample and standart diffraction patterns are clearly visible in the presence of peaks in the 2θ region. The diffraction patterns of the samples were compared with the standard diffraction patterns of Crystal Open Database (COD).
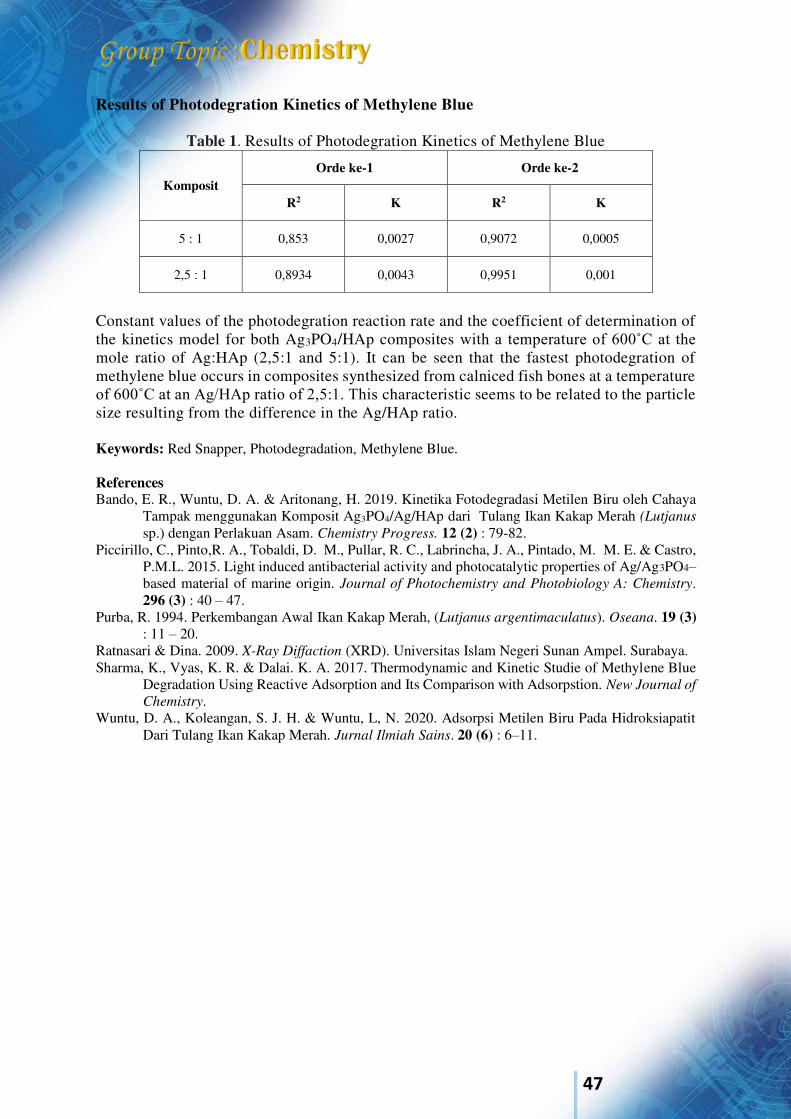
47
Results of Photodegration Kinetics of Methylene Blue
Table 1. Results of Photodegration Kinetics of Methylene Blue
Komposit Orde ke-1 Orde ke-2
R2 K R2 K
5 : 1 0,853 0,0027 0,9072 0,0005
2,5 : 1 0,8934 0,0043 0,9951 0,001
Constant values of the photodegration reaction rate and the coefficient of determination of the kinetics model for both Ag3PO4/HAp composites with a temperature of 600˚C at the mole ratio of Ag:HAp (2,5:1 and 5:1). It can be seen that the fastest photodegration of methylene blue occurs in composites synthesized from calniced fish bones at a temperature of 600˚C at an Ag/HAp ratio of 2,5:1. This characteristic seems to be related to the particle size resulting from the difference in the Ag/HAp ratio. Keywords: Red Snapper, Photodegradation, Methylene Blue. References Bando, E. R., Wuntu, D. A. & Aritonang, H. 2019. Kinetika Fotodegradasi Metilen Biru oleh Cahaya
Tampak menggunakan Komposit Ag3PO4/Ag/HAp dari Tulang Ikan Kakap Merah (Lutjanus
sp.) dengan Perlakuan Asam. Chemistry Progress. 12 (2) : 79-82. Piccirillo, C., Pinto,R. A., Tobaldi, D. M., Pullar, R. C., Labrincha, J. A., Pintado, M. M. E. & Castro,
P.M.L. 2015. Light induced antibacterial activity and photocatalytic properties of Ag/Ag3PO4– based material of marine origin. Journal of Photochemistry and Photobiology A: Chemistry. 296 (3) : 40 – 47.
Purba, R. 1994. Perkembangan Awal Ikan Kakap Merah, (Lutjanus argentimaculatus). Oseana. 19 (3) : 11 – 20.
Ratnasari & Dina. 2009. X-Ray Diffaction (XRD). Universitas Islam Negeri Sunan Ampel. Surabaya. Sharma, K., Vyas, K. R. & Dalai. K. A. 2017. Thermodynamic and Kinetic Studie of Methylene Blue
Degradation Using Reactive Adsorption and Its Comparison with Adsorpstion. New Journal of
Chemistry. Wuntu, D. A., Koleangan, S. J. H. & Wuntu, L, N. 2020. Adsorpsi Metilen Biru Pada Hidroksiapatit
Dari Tulang Ikan Kakap Merah. Jurnal Ilmiah Sains. 20 (6) : 6–11.

48
International Conference on Natural Sciences, Mathematics, Applications, Research, and Technology
Manado, Indonesia, 22-23 October 2020
Phytochemical and Antifungal Activity of Leaf Extract Chisocheton sp. Siska Fauziah*1, Dewa G. Katja2 and Lidya I. Momuat3
1’Department of Chemistry, Sam Ratulangi University, INDONESIA. (E-mail:[email protected]) INTRODUCTION Indonesian is one of the countries rich in plants are efficacious drugs. Medicine is traditionally the natural selection of the main to the effect of side drug traditionally are relatively small when use in appropriate and without abuse (Krisyanella, 2009). Fungi are one of the cause of infectious diseases that are closely related to the habits and the level of hygiene of individuals especially in countries tropical countries. The tropical climate with high humidity in Indonesia is very supportive of fungal growth. One of the pathogenic fungi in humans is Candida albicans. The fungi Candida albicans lives as saprophytes in the mucous membranes of the mouth, vagina and digestive tract. Candida albicans
can cause infection called candidiasis. The treatment of diseases that are caused by infection of the fungi has been done by using an antifungal synthetic like ketoconazole. The use antifungal can cause resistance and cause effects side are great for humans, so it should be considered an alternative theraphy in candidiasis. One of the alternatives that can be used namely by utilizing plants that many contain compounds active which is able to play a role as antifungal. One of the plants that are used as a source of medicine traditional of families Meliaceae. Familie Meliaceae have been isolated and produce compounds active neem (Azadirachta indica A. Juss). Compounds of this has the activity of insecticides, are as fungicidal, virucidal, nematocides and bactericides (Wood et al., 1995; Parmar, 1995). It is indicates the content of the compound or activity that is similar to the species is more in one family (Dewick, 2009). Plants Chisocheton is one of genus of the family Meliaceae. Spread widely in the areas of tropical and subtropical like in Indonesia. Reports first of compounds genus is that species Chisocheton paniculatus fruit as a compound of antifungal species meliacin (Bordoloi et al., 1993). The purpose of this study was to determine the results of phytochemical in the leaf of Chisocheton sp and the antifungal activity carried out using extraction of multistep used three different solvents of polar level, namely n-hexane, ethyl acetate, and methanol RESULTS AND DISCUSSION
Result of Phytochemical compound. In table 1. Table the results of identification of secondary metabolite compounds obtained the result that Chisocheton sp. leaf extract with n-hexane solvents contains compounds alkaloids, steroids, and tannins, with ethyl acetate solvents positively containing alkaloids, steroids, and tannins, with methanol solvents containing compounds alkaloids, flavonoids, saponins, and tannin.
49
Tabel 1. Phytochemical compound Chisocheton sp.
Result of Antifungal Activity In figure 1. Antifungal activity testing is carried out by experimental research using Kirby-Bauer disc difusion. The concentration of extracts used in this study is 10%, 20%, 40% and 80%. Negative controls (n-hexane solvents, ethyl acetate and methanol) and positive control (ketoconazole). The results showed that n-hexane extract had no resistance to the growth of candida albicans fungi. Results measurement of the zone inhibition showed that the extract of leaf Chioscheton sp. zone of inhibition supreme contained in the solvent methanol with concentration of 80% have inhibition zone values of 19,19 mm, while the solvent ethyl acetate of 12,26 mm, has a potential as the antifungal Candida albicans. In the solvent methanol concentration of 40%, 20% and 10% produce power resistor respectively 13,33 mm, 14,78 mm, and 15,15 mm is classified as a zone of inhibiton strong that even decreases with decreasing concentration, while the solvent ethyl acetate have inhibition zone values of 10,73, mm 10,76, mm and 5,67 mm so that they have moderate potential as an antifungal Candida
albicans. It is related to the amount of compound metabolites secondary that is dissolved in the extract that have activity of antifungal more slightly, making it less effective at inhibiting. The high concentration extract, the more also contain substances active in it, so that the activity of antifungal will be great.
Figure 1. Diameter of Candida albicans fungal growth zone.
Keywords: Chisocheton sp, Phytochemical, Antifungal References Bordoloi, M., Saikia, B., Mathur, R. K., & Goswami, B. N. 1993. A meliacin from Chisocheton
paniculatus. Phytochemistry. 34(1): 583–584. Dewick, P.M. 2009. Medicinal Natural Products A Biosynthetic Approach 3rd Edition. West Sussex,
United Kingdom: John Wiley & Sons Ltd. 3(2): 193-206.
5,67
10,76 10,7312,26
13,3314,78 15,15
19,19
8,67 8,67 8,67 8,67
0
5
10
15
20
25
10% 20% 40% 80%
Inh
ibit
ory
zo
ne
(m
m)
Extract concentration
Diameter of Candida albicans fungal growth zone
Ethyle acetate
Methanol
Control (+)Katoconazole
Metabolite Compounds Secondary
Reagent Extract n- hexane Ethyl acetate Methanol
Alkaloid
P. Mayer - + -
P. Dragendorff + + + P. Wagner + + +
Flavonoids - - + Saponins - - + Steroids + + - Triterpenoid - - - Tannins + + +

50
Krisyanella, D. Marlina. 2009. Karakterisasi Simplisia dan Ekstrak Serta Isolasi Senyawa Aktif Antibakteri dari Daun Karamunting (Rhodomyrtus tomentosa (W.Ait ) Hassk). Padang: Fakultas Farmasi Universitas Andalas.
Parmar, B.S. 1995. Result with commercial neem formulations produced in india. In H. Schmutterer (ed), The neem tree Azadiracdhta indica A. Juss and other Meliaceous plants. Tokyo: Sources of Meliaceous plants. Tokyo: Sources of unique natural products for integrate pest management.
Wood, T., W. Ruggero & R. Nelson. 1995. Performance profile for the neen-based insecticide ALIGNTM In The Neem Tree – Source of Unique Natural Products for Integrated Pest Management, Medicine, Industry and Other Purposes. pp. 445-453. VCH, Weinheim. New York : Basel Cambridge Institute.
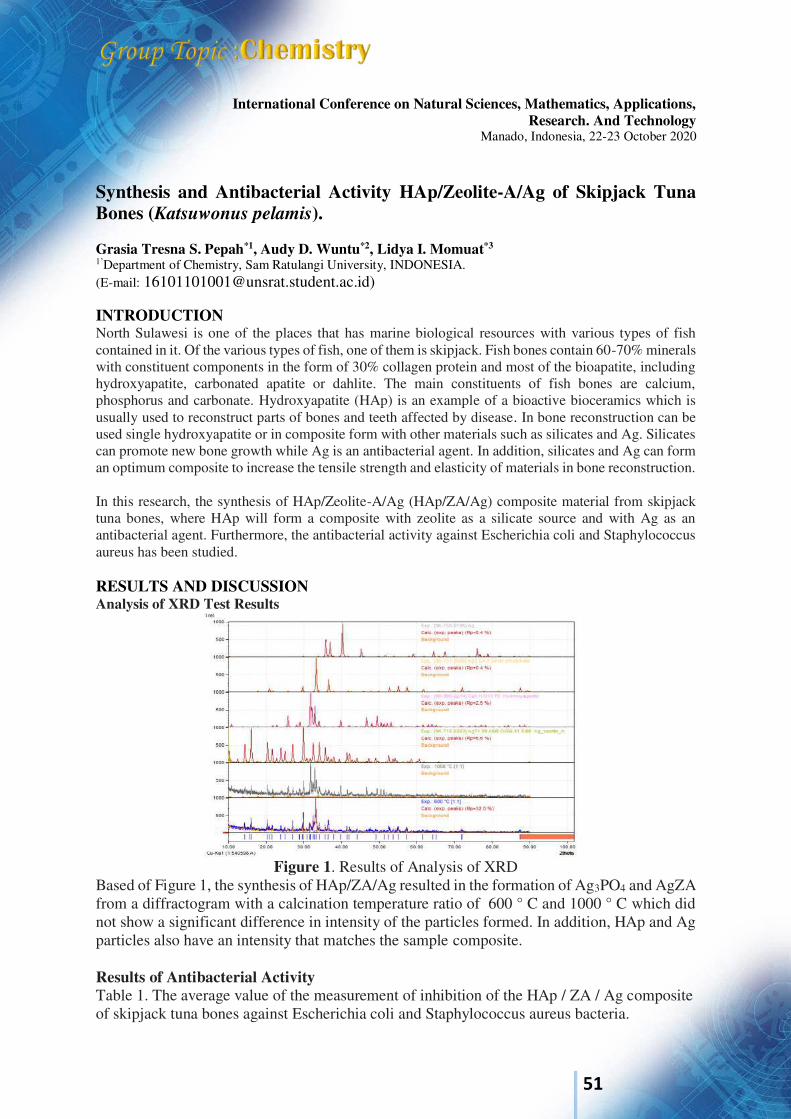
51
International Conference on Natural Sciences, Mathematics, Applications, Research. And Technology
Manado, Indonesia, 22-23 October 2020
Synthesis and Antibacterial Activity HAp/Zeolite-A/Ag of Skipjack Tuna Bones (Katsuwonus pelamis). Grasia Tresna S. Pepah*1, Audy D. Wuntu*2, Lidya I. Momuat*3 1’Department of Chemistry, Sam Ratulangi University, INDONESIA. (E-mail: [email protected])
INTRODUCTION North Sulawesi is one of the places that has marine biological resources with various types of fish contained in it. Of the various types of fish, one of them is skipjack. Fish bones contain 60-70% minerals with constituent components in the form of 30% collagen protein and most of the bioapatite, including hydroxyapatite, carbonated apatite or dahlite. The main constituents of fish bones are calcium, phosphorus and carbonate. Hydroxyapatite (HAp) is an example of a bioactive bioceramics which is usually used to reconstruct parts of bones and teeth affected by disease. In bone reconstruction can be used single hydroxyapatite or in composite form with other materials such as silicates and Ag. Silicates can promote new bone growth while Ag is an antibacterial agent. In addition, silicates and Ag can form an optimum composite to increase the tensile strength and elasticity of materials in bone reconstruction. In this research, the synthesis of HAp/Zeolite-A/Ag (HAp/ZA/Ag) composite material from skipjack tuna bones, where HAp will form a composite with zeolite as a silicate source and with Ag as an antibacterial agent. Furthermore, the antibacterial activity against Escherichia coli and Staphylococcus aureus has been studied. RESULTS AND DISCUSSION Analysis of XRD Test Results
Figure 1. Results of Analysis of XRD
Based of Figure 1, the synthesis of HAp/ZA/Ag resulted in the formation of Ag3PO4 and AgZA from a diffractogram with a calcination temperature ratio of 600 ° C and 1000 ° C which did not show a significant difference in intensity of the particles formed. In addition, HAp and Ag particles also have an intensity that matches the sample composite. Results of Antibacterial Activity Table 1. The average value of the measurement of inhibition of the HAp / ZA / Ag composite of skipjack tuna bones against Escherichia coli and Staphylococcus aureus bacteria.

52
Konsentrasi
Rata-rata Diameter Zona Hambat Pertumbuhan Bakteri (mm) E. Coli S. Aureus
600 °C 13.25 12.75 1000 °C 13.75 14
Kontrol (+) 31,25 29,5 Kontrol (-) 0 0
The criteria for the strength of the antibacterial power are as follows: the inhibition zone diameter of 5 mm or less is categorized as weak, the inhibition zone 5-10 mm is categorized as strong and the inhibition zone of 20 mm or more is categorized as very strong. This states that the larger the diameter of the bacterial growth inhibitory zone, the stronger the antibacterial inhibition of the sample used. Based of table 2, shows that the inhibition zone diameter of the 1000 ° C sample is greater than the 600 ° C sample in the two tested bacteria. Basically it can be said that the two samples tested showed the diameter of the inhibition zone which was in the strong category. Keywords : Skipjack fish, Hydroxyapatite, Antibacterial activity References Burhanuddin et al. 2016. Aplikasi Logam Magnesium dan Paduannya Sebagai Material Baut
Tulang Mampu Luruh. Proceeding Seminar Nasional Tahunan Teknik Mesin XV
(SNTTM XV). 34 : 727-732. Davis, W. W., & Stout, T. R. 1971. Disc Plate Methods of Microbiological Antibiotic Assay.
Microbiology. 22 : 659-665. Djide & Sartini. 2008. Dasar-Dasar Mikrobiologi farmasi. Lephas, Makassar. Riyanto et al. 2013. Material Biokeramik Berbasis Hidoksiapatit Tulang Ikan Tuna. JPHPI. 16
: 119-132. Trilaksani et al. 2006. Manfaat Limbah Tulang Ikan Tuna (Thunnus sp.) Sebagai Sumber
Kalsium Dengan Metode Hidrolisis Protein. Buletin Hasil Perikanan. 9 : 36-45.
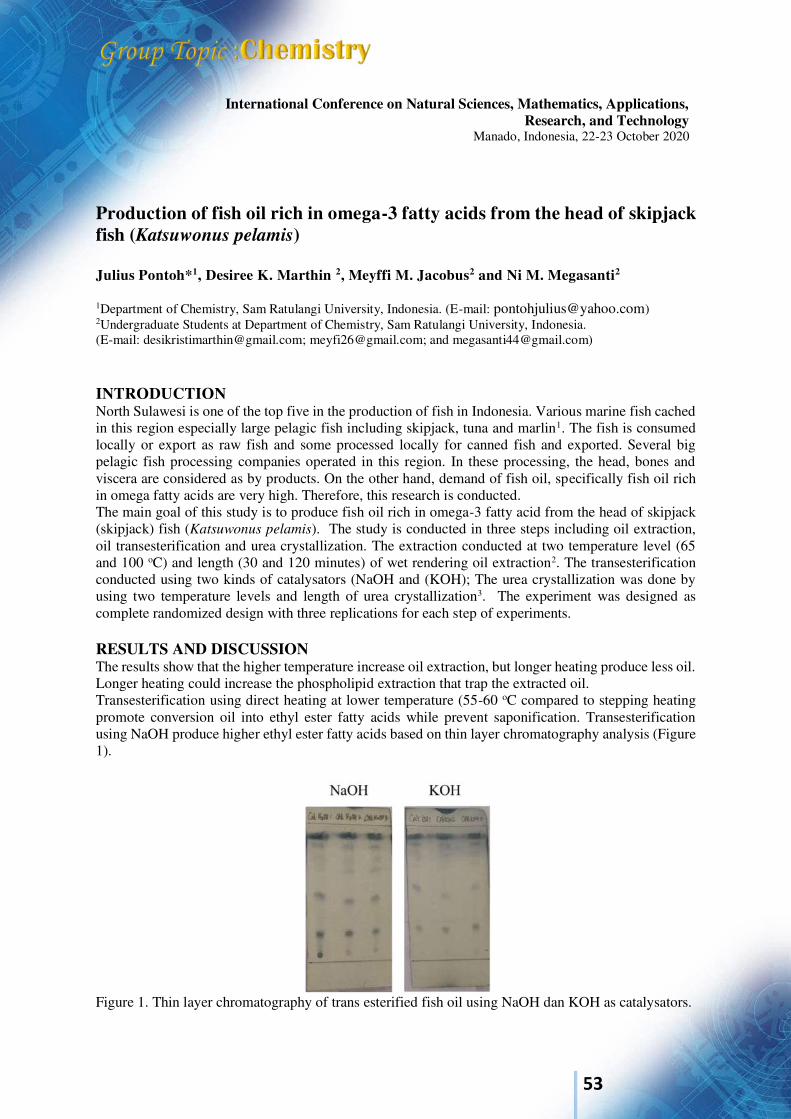
53
International Conference on Natural Sciences, Mathematics, Applications, Research, and Technology
Manado, Indonesia, 22-23 October 2020
Production of fish oil rich in omega-3 fatty acids from the head of skipjack fish (Katsuwonus pelamis) Julius Pontoh*1, Desiree K. Marthin 2, Meyffi M. Jacobus2 and Ni M. Megasanti2
1Department of Chemistry, Sam Ratulangi University, Indonesia. (E-mail: [email protected]) 2Undergraduate Students at Department of Chemistry, Sam Ratulangi University, Indonesia. (E-mail: [email protected]; [email protected]; and [email protected]) INTRODUCTION North Sulawesi is one of the top five in the production of fish in Indonesia. Various marine fish cached in this region especially large pelagic fish including skipjack, tuna and marlin1. The fish is consumed locally or export as raw fish and some processed locally for canned fish and exported. Several big pelagic fish processing companies operated in this region. In these processing, the head, bones and viscera are considered as by products. On the other hand, demand of fish oil, specifically fish oil rich in omega fatty acids are very high. Therefore, this research is conducted. The main goal of this study is to produce fish oil rich in omega-3 fatty acid from the head of skipjack (skipjack) fish (Katsuwonus pelamis). The study is conducted in three steps including oil extraction, oil transesterification and urea crystallization. The extraction conducted at two temperature level (65 and 100 oC) and length (30 and 120 minutes) of wet rendering oil extraction2. The transesterification conducted using two kinds of catalysators (NaOH and (KOH); The urea crystallization was done by using two temperature levels and length of urea crystallization3. The experiment was designed as complete randomized design with three replications for each step of experiments. RESULTS AND DISCUSSION The results show that the higher temperature increase oil extraction, but longer heating produce less oil. Longer heating could increase the phospholipid extraction that trap the extracted oil. Transesterification using direct heating at lower temperature (55-60 oC compared to stepping heating promote conversion oil into ethyl ester fatty acids while prevent saponification. Transesterification using NaOH produce higher ethyl ester fatty acids based on thin layer chromatography analysis (Figure 1).
Figure 1. Thin layer chromatography of trans esterified fish oil using NaOH dan KOH as catalysators.

54
Urea crystallization of transesterification oil has been increased omega-3 fatty acid based on the gas chromatographic analysis (Figure 2). . Figure 2. Fatty acid composition of oil before and after urea crystallization CONCLUSION Extraction of skipjack oil then transesterification using NaOH into ethyl ester fatty acids then separated by urea crystallization has been increase the EPA into 4 times while the DHA has been increase almost twice. References
1. Firdaus, M. 2018. Profil Perikanan Tuna dan Cakalang di Indopnesia. Buletin Ilmiah “MARINA” Sosial Ekonomi Kelautan dan Perikanan . 4 (1 ):23-32
2. FAO. 1986. The production of fish meal and oil. FAO Fisheries Technical Paper 142. FAO Fisheries Department. Food and Agriculture Organization of the United Nations. Rome, Italy.
3. Bispo, P., I. Batista, R.J. Bernardino dan N.M. Bandarra. 2014. Preparation of triacylglycerols Rich in Omega-3 Fatty Acids from Sardine Oil Using a Rhizomucor miehei
Lipase: Focus in the EPA/DHA Ratio. Appl. Biochem. Biotechnol. 172;1866-1881.
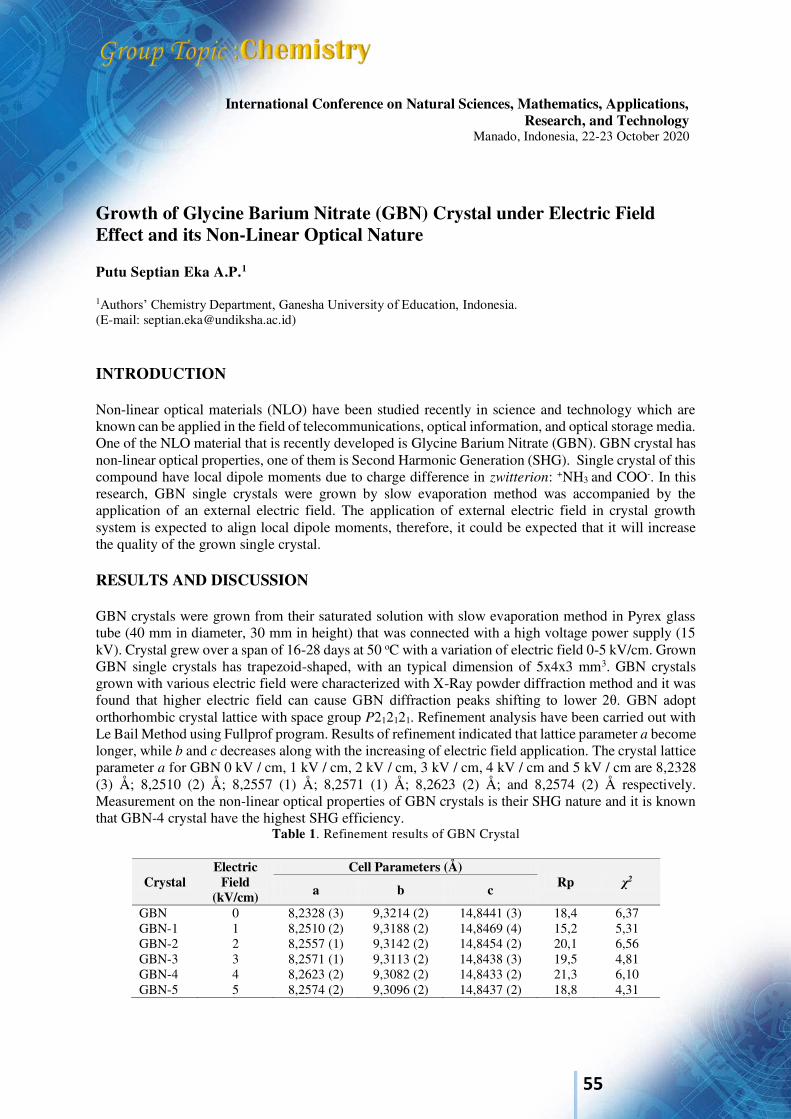
55
International Conference on Natural Sciences, Mathematics, Applications, Research, and Technology
Manado, Indonesia, 22-23 October 2020
Growth of Glycine Barium Nitrate (GBN) Crystal under Electric Field Effect and its Non-Linear Optical Nature Putu Septian Eka A.P.1
1Authors’ Chemistry Department, Ganesha University of Education, Indonesia. (E-mail: [email protected]) INTRODUCTION Non-linear optical materials (NLO) have been studied recently in science and technology which are known can be applied in the field of telecommunications, optical information, and optical storage media. One of the NLO material that is recently developed is Glycine Barium Nitrate (GBN). GBN crystal has non-linear optical properties, one of them is Second Harmonic Generation (SHG). Single crystal of this compound have local dipole moments due to charge difference in zwitterion: +NH3
and COO-. In this research, GBN single crystals were grown by slow evaporation method was accompanied by the application of an external electric field. The application of external electric field in crystal growth system is expected to align local dipole moments, therefore, it could be expected that it will increase the quality of the grown single crystal. RESULTS AND DISCUSSION GBN crystals were grown from their saturated solution with slow evaporation method in Pyrex glass tube (40 mm in diameter, 30 mm in height) that was connected with a high voltage power supply (15 kV). Crystal grew over a span of 16-28 days at 50 oC with a variation of electric field 0-5 kV/cm. Grown GBN single crystals has trapezoid-shaped, with an typical dimension of 5x4x3 mm3. GBN crystals grown with various electric field were characterized with X-Ray powder diffraction method and it was found that higher electric field can cause GBN diffraction peaks shifting to lower 2θ. GBN adopt orthorhombic crystal lattice with space group P212121. Refinement analysis have been carried out with Le Bail Method using Fullprof program. Results of refinement indicated that lattice parameter a become longer, while b and c decreases along with the increasing of electric field application. The crystal lattice parameter a for GBN 0 kV / cm, 1 kV / cm, 2 kV / cm, 3 kV / cm, 4 kV / cm and 5 kV / cm are 8,2328 (3) Å; 8,2510 (2) Å; 8,2557 (1) Å; 8,2571 (1) Å; 8,2623 (2) Å; and 8,2574 (2) Å respectively. Measurement on the non-linear optical properties of GBN crystals is their SHG nature and it is known that GBN-4 crystal have the highest SHG efficiency.
Table 1. Refinement results of GBN Crystal
Crystal Electric
Field (kV/cm)
Cell Parameters (Å) Rp χ2
a b c
GBN 0 8,2328 (3) 9,3214 (2) 14,8441 (3) 18,4 6,37 GBN-1 1 8,2510 (2) 9,3188 (2) 14,8469 (4) 15,2 5,31 GBN-2 2 8,2557 (1) 9,3142 (2) 14,8454 (2) 20,1 6,56 GBN-3 3 8,2571 (1) 9,3113 (2) 14,8438 (3) 19,5 4,81 GBN-4 4 8,2623 (2) 9,3082 (2) 14,8433 (2) 21,3 6,10 GBN-5 5 8,2574 (2) 9,3096 (2) 14,8437 (2) 18,8 4,31
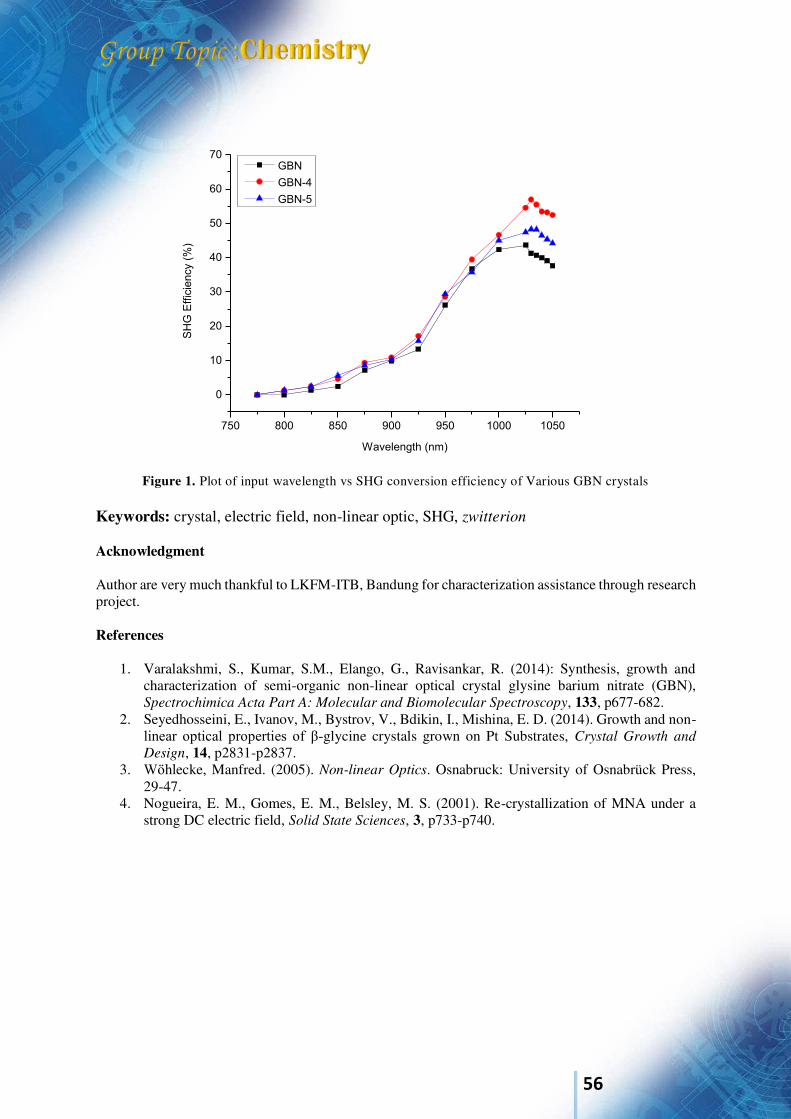
56
750 800 850 900 950 1000 1050
0
10
20
30
40
50
60
70
SH
G E
ffic
iency (
%)
Wavelength (nm)
GBN
GBN-4
GBN-5
Figure 1. Plot of input wavelength vs SHG conversion efficiency of Various GBN crystals
Keywords: crystal, electric field, non-linear optic, SHG, zwitterion Acknowledgment Author are very much thankful to LKFM-ITB, Bandung for characterization assistance through research project. References
1. Varalakshmi, S., Kumar, S.M., Elango, G., Ravisankar, R. (2014): Synthesis, growth and characterization of semi-organic non-linear optical crystal glysine barium nitrate (GBN), Spectrochimica Acta Part A: Molecular and Biomolecular Spectroscopy, 133, p677-682.
2. Seyedhosseini, E., Ivanov, M., Bystrov, V., Bdikin, I., Mishina, E. D. (2014). Growth and non-linear optical properties of β-glycine crystals grown on Pt Substrates, Crystal Growth and
Design, 14, p2831-p2837. 3. Wӧhlecke, Manfred. (2005). Non-linear Optics. Osnabruck: University of Osnabrück Press,
29-47. 4. Nogueira, E. M., Gomes, E. M., Belsley, M. S. (2001). Re-crystallization of MNA under a
strong DC electric field, Solid State Sciences, 3, p733-p740.
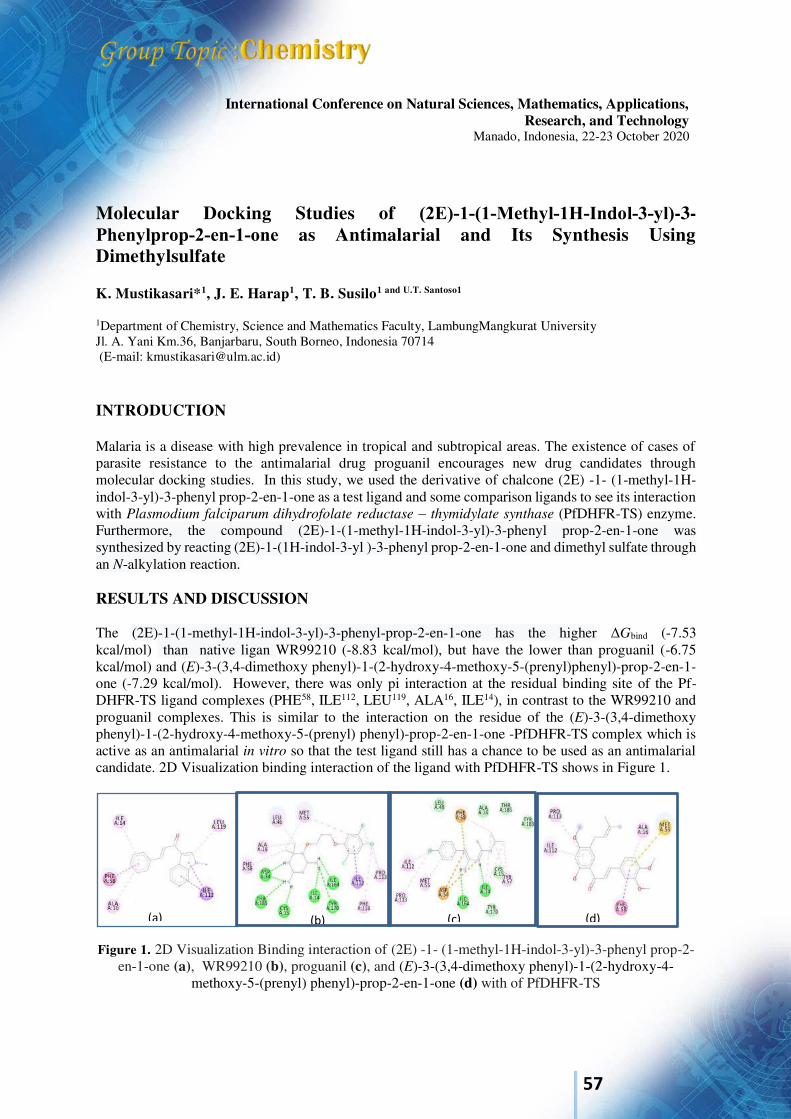
57
International Conference on Natural Sciences, Mathematics, Applications, Research, and Technology
Manado, Indonesia, 22-23 October 2020
Molecular Docking Studies of (2E)‐1‐(1‐Methyl‐1H‐Indol‐3‐yl)-3-Phenylprop‐2‐en‐1‐one as Antimalarial and Its Synthesis Using Dimethylsulfate K. Mustikasari*1, J. E. Harap1, T. B. Susilo1 and U.T. Santoso1
1Department of Chemistry, Science and Mathematics Faculty, LambungMangkurat University Jl. A. Yani Km.36, Banjarbaru, South Borneo, Indonesia 70714 (E-mail: [email protected])
INTRODUCTION Malaria is a disease with high prevalence in tropical and subtropical areas. The existence of cases of parasite resistance to the antimalarial drug proguanil encourages new drug candidates through molecular docking studies. In this study, we used the derivative of chalcone (2E) -1- (1-methyl-1H-indol-3-yl)-3-phenyl prop-2-en-1-one as a test ligand and some comparison ligands to see its interaction with Plasmodium falciparum dihydrofolate reductase – thymidylate synthase (PfDHFR-TS) enzyme. Furthermore, the compound (2E)-1-(1-methyl-1H-indol-3-yl)-3-phenyl prop-2-en-1-one was synthesized by reacting (2E)-1-(1H-indol-3-yl )-3-phenyl prop-2-en-1-one and dimethyl sulfate through an N-alkylation reaction. RESULTS AND DISCUSSION The (2E)-1-(1-methyl-1H-indol-3-yl)-3-phenyl-prop-2-en-1-one has the higher ΔGbind (-7.53 kcal/mol) than native ligan WR99210 (-8.83 kcal/mol), but have the lower than proguanil (-6.75 kcal/mol) and (E)-3-(3,4-dimethoxy phenyl)-1-(2-hydroxy-4-methoxy-5-(prenyl)phenyl)-prop-2-en-1-one (-7.29 kcal/mol). However, there was only pi interaction at the residual binding site of the Pf-DHFR-TS ligand complexes (PHE58, ILE112, LEU119, ALA16, ILE14), in contrast to the WR99210 and proguanil complexes. This is similar to the interaction on the residue of the (E)-3-(3,4-dimethoxy phenyl)-1-(2-hydroxy-4-methoxy-5-(prenyl) phenyl)-prop-2-en-1-one -PfDHFR-TS complex which is active as an antimalarial in vitro so that the test ligand still has a chance to be used as an antimalarial candidate. 2D Visualization binding interaction of the ligand with PfDHFR-TS shows in Figure 1.
Figure 1. 2D Visualization Binding interaction of (2E) -1- (1-methyl-1H-indol-3-yl)-3-phenyl prop-2-
en-1-one (a), WR99210 (b), proguanil (c), and (E)-3-(3,4-dimethoxy phenyl)-1-(2-hydroxy-4-methoxy-5-(prenyl) phenyl)-prop-2-en-1-one (d) with of PfDHFR-TS
(b) (a) (c) (d)
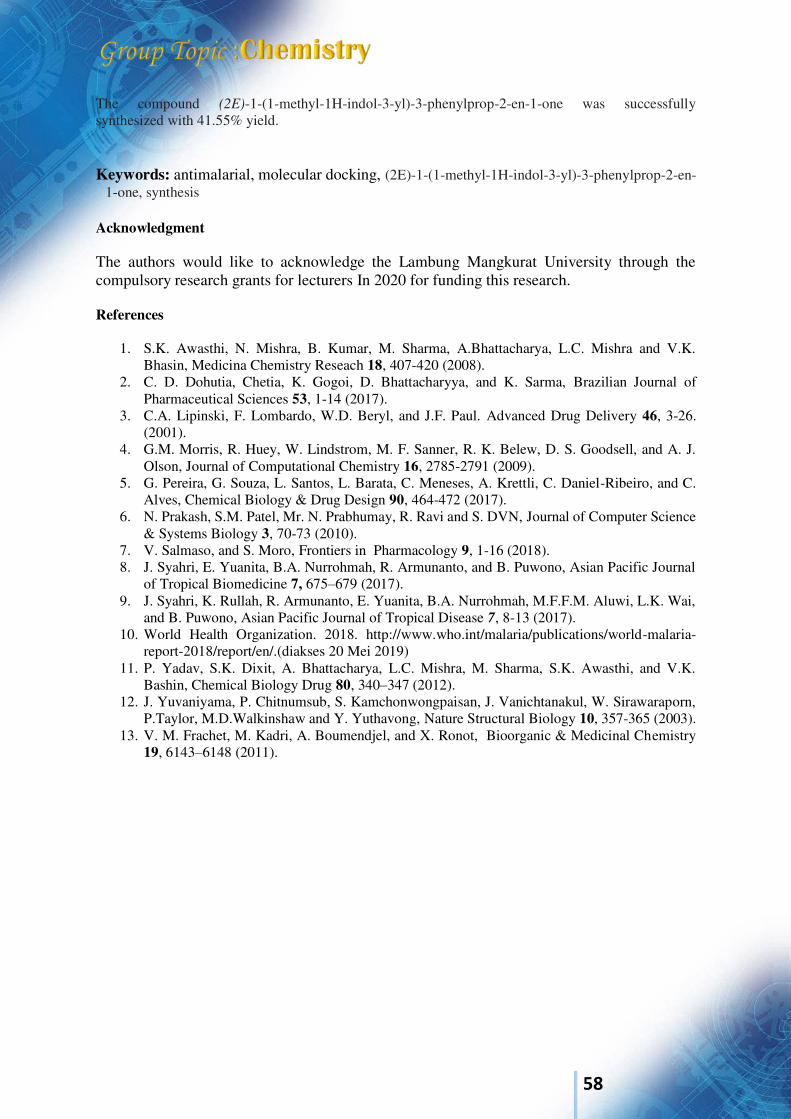
58
The compound (2E)-1-(1-methyl-1H-indol-3-yl)-3-phenylprop-2-en-1-one was successfully synthesized with 41.55% yield. Keywords: antimalarial, molecular docking, (2E)-1-(1-methyl-1H-indol-3-yl)-3-phenylprop-2-en-
1-one, synthesis Acknowledgment The authors would like to acknowledge the Lambung Mangkurat University through the compulsory research grants for lecturers In 2020 for funding this research. References
1. S.K. Awasthi, N. Mishra, B. Kumar, M. Sharma, A.Bhattacharya, L.C. Mishra and V.K. Bhasin, Medicina Chemistry Reseach 18, 407-420 (2008).
2. C. D. Dohutia, Chetia, K. Gogoi, D. Bhattacharyya, and K. Sarma, Brazilian Journal of Pharmaceutical Sciences 53, 1-14 (2017).
3. C.A. Lipinski, F. Lombardo, W.D. Beryl, and J.F. Paul. Advanced Drug Delivery 46, 3-26. (2001).
4. G.M. Morris, R. Huey, W. Lindstrom, M. F. Sanner, R. K. Belew, D. S. Goodsell, and A. J. Olson, Journal of Computational Chemistry 16, 2785-2791 (2009).
5. G. Pereira, G. Souza, L. Santos, L. Barata, C. Meneses, A. Krettli, C. Daniel-Ribeiro, and C. Alves, Chemical Biology & Drug Design 90, 464-472 (2017).
6. N. Prakash, S.M. Patel, Mr. N. Prabhumay, R. Ravi and S. DVN, Journal of Computer Science & Systems Biology 3, 70-73 (2010).
7. V. Salmaso, and S. Moro, Frontiers in Pharmacology 9, 1-16 (2018). 8. J. Syahri, E. Yuanita, B.A. Nurrohmah, R. Armunanto, and B. Puwono, Asian Pacific Journal
of Tropical Biomedicine 7, 675–679 (2017). 9. J. Syahri, K. Rullah, R. Armunanto, E. Yuanita, B.A. Nurrohmah, M.F.F.M. Aluwi, L.K. Wai,
and B. Puwono, Asian Pacific Journal of Tropical Disease 7, 8-13 (2017). 10. World Health Organization. 2018. http://www.who.int/malaria/publications/world-malaria-
report-2018/report/en/.(diakses 20 Mei 2019) 11. P. Yadav, S.K. Dixit, A. Bhattacharya, L.C. Mishra, M. Sharma, S.K. Awasthi, and V.K.
Bashin, Chemical Biology Drug 80, 340–347 (2012). 12. J. Yuvaniyama, P. Chitnumsub, S. Kamchonwongpaisan, J. Vanichtanakul, W. Sirawaraporn,
P.Taylor, M.D.Walkinshaw and Y. Yuthavong, Nature Structural Biology 10, 357-365 (2003). 13. V. M. Frachet, M. Kadri, A. Boumendjel, and X. Ronot, Bioorganic & Medicinal Chemistry
19, 6143–6148 (2011).

59
International Conference on Natural Sciences, Mathematics, Applications, Research, and Technology
Manado, Indonesia, 22-23 October 2020
Compositional characteristics and energy potential of livestock manure I M Gunamantha1, I Putu Parwata2 and Made Vivi Oviantari3
1, 2,3Chemistry Department, Universitas Pendidikan Ganesha, Indonesia. (E-mail: [email protected], [email protected], [email protected]) INTRODUCTION Livestock manure is an important biomass and as an attractive stored energy. The energy is stored in chemical bonds. When the bonds between adjacent carbon, hydrogen and oxygen molecules are broken by digestion, combustion, or decomposition, these substances release their stored, chemical/potential energy (McKendry, 2002). To recovery its energy potential depend on their chemical properties and heating value. There are several ways to characterize the potential energy utilization of biomass fuel, including by identifying; biochemical, proximate, or ultimate analysis, their heating value and ash composition. Biochemical analysis refers to the relative abundance of various biopolymers (e.g., cellulose, lignin, etc) in the biomass, whereas ultimate analysis refers to the relative abundance of individual elements (e.g., C, H, O, N, and S). Proximate analysis refers to moisture content (MC), volatile matter (VM), ash, and fixed carbon (FC). Heating value is the amount of heat produced by a complete combustion of fuel and it is measured as a unit of energy per unit mass or volume of substance (e.g., kcal/kg, kJ/kg, MJ/kg, J/mol and Btu/m³). ash chemical composition are elements such as silicon, calcium, aluminum, iron, magnesium, and sulphur oxides(Jenkins et al., 1998). The objective of this study was to evaluate the chemical properties and energy potential of livestock manure. Manure from four types of livestock, namely cows, chickens, ducks, and pigs was evaluated in this study. Chemical properties: proximate, ultimate, the higher heating value, and metal oxide of manure were determined in Tekmira Laboratory, Bandung. MC were determine according to ASTM D.3173, VM to ISO 562, ash to ASTM D.3174, and FC to ASTM D.3172. The carbon (C), hydrogen (H), and nitrogen (N) were determined according to ASTM D 5373 while oxygen (O) and sulfur (S) according to standard ASTM D 3176 and ASTM D 4239 respectively. The HHV was determined based on the standard ASTM D 5865 the chemical ash composition were determined by gravimetric method; spectrophotometry; and AAS depend on the oxides which determined. RESULTS AND DISCUSSION Prximate analysis data and analysis data were showed respectively in Fig 1a and 1b. The heating value was showed both in Fig 1a and 1b. Table 1 showed the potential of slag, fouling, and bed agglomeration in combustion facilities, it can be done by knowing the value of the alkaline index (AI), base to acid ratio(Rb/a), and bed agglomeration (BAI). For the proximate analysis data, the highest volatile matter and fixed carbon content is shown by cow dung, while the highest ash content is in duck dung. From the ultimate analysis data, the highest C, H, N content is shown by cow dung, while for the O and S content is shown by chicken manure. Both data are in line with the heating value of cow dung which is also the highest compared to the other three livestock manure. This indicates that the potential energy in cow manure has more potential to be utilized compared to chicken, duck and pig manure. However, the heating value is still much lower than other biomass. In addition, the use of livestock manure as a solid fuel in thermal conversion operations has the potential to cause slagging, fouling, and bed agglomeration.
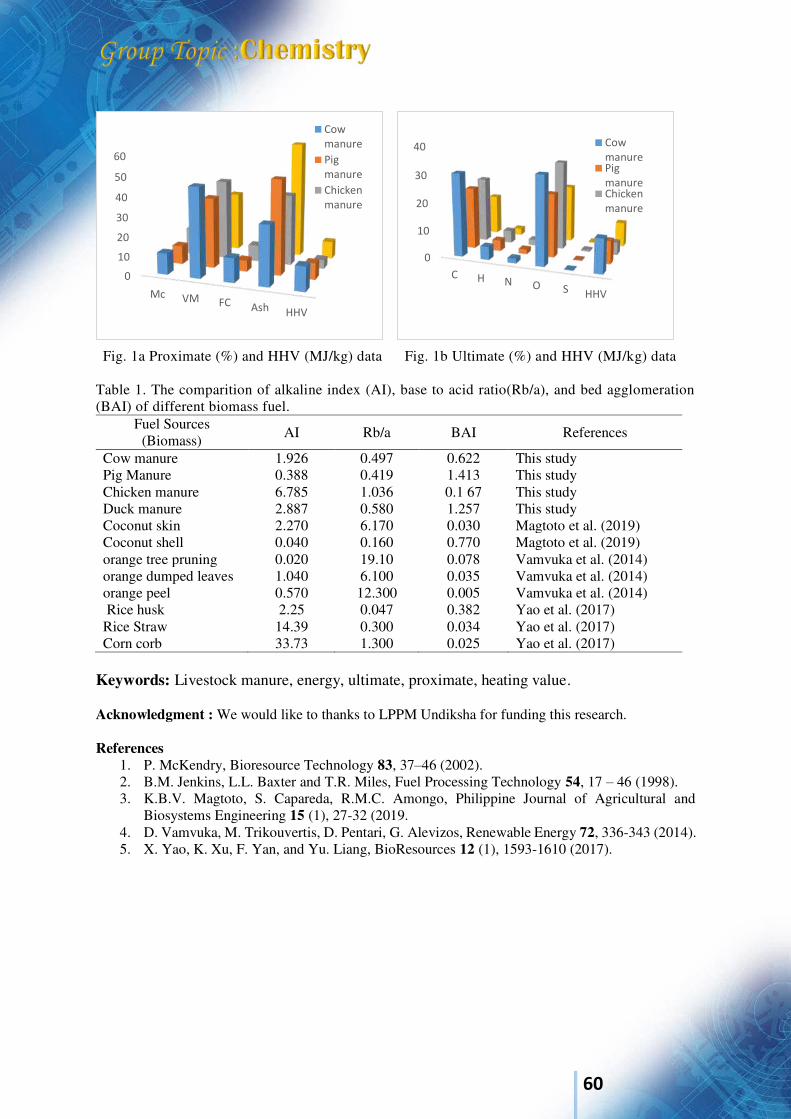
60
Fig. 1a Proximate (%) and HHV (MJ/kg) data Fig. 1b Ultimate (%) and HHV (MJ/kg) data Table 1. The comparition of alkaline index (AI), base to acid ratio(Rb/a), and bed agglomeration (BAI) of different biomass fuel.
Fuel Sources (Biomass) AI Rb/a BAI References
Cow manure 1.926 0.497 0.622 This study Pig Manure 0.388 0.419 1.413 This study Chicken manure 6.785 1.036 0.1 67 This study Duck manure 2.887 0.580 1.257 This study Coconut skin 2.270 6.170 0.030 Magtoto et al. (2019) Coconut shell 0.040 0.160 0.770 Magtoto et al. (2019) orange tree pruning 0.020 19.10 0.078 Vamvuka et al. (2014) orange dumped leaves 1.040 6.100 0.035 Vamvuka et al. (2014) orange peel 0.570 12.300 0.005 Vamvuka et al. (2014) Rice husk 2.25 0.047 0.382 Yao et al. (2017) Rice Straw 14.39 0.300 0.034 Yao et al. (2017) Corn corb 33.73 1.300 0.025 Yao et al. (2017)
Keywords: Livestock manure, energy, ultimate, proximate, heating value. Acknowledgment : We would like to thanks to LPPM Undiksha for funding this research. References
1. P. McKendry, Bioresource Technology 83, 37–46 (2002). 2. B.M. Jenkins, L.L. Baxter and T.R. Miles, Fuel Processing Technology 54, 17 – 46 (1998). 3. K.B.V. Magtoto, S. Capareda, R.M.C. Amongo, Philippine Journal of Agricultural and
Biosystems Engineering 15 (1), 27-32 (2019. 4. D. Vamvuka, M. Trikouvertis, D. Pentari, G. Alevizos, Renewable Energy 72, 336-343 (2014). 5. X. Yao, K. Xu, F. Yan, and Yu. Liang, BioResources 12 (1), 1593-1610 (2017).
0
10
20
30
40
50
60
Mc VM FC Ash HHV
Cow
manure
Pig
manure
Chicken
manure
0
10
20
30
40
C H N O S HHV
Cow
manurePig
manureChicken
manure
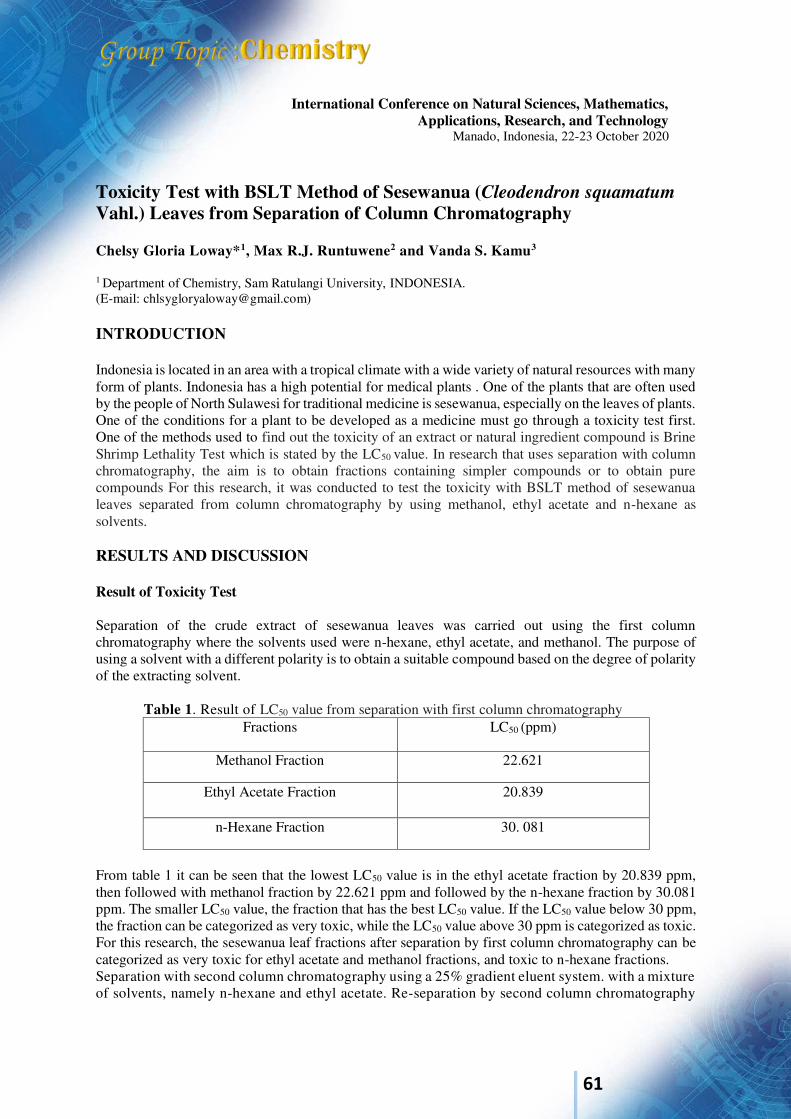
61
International Conference on Natural Sciences, Mathematics, Applications, Research, and Technology
Manado, Indonesia, 22-23 October 2020
Toxicity Test with BSLT Method of Sesewanua (Cleodendron squamatum Vahl.) Leaves from Separation of Column Chromatography Chelsy Gloria Loway*1, Max R.J. Runtuwene2 and Vanda S. Kamu3
1 Department of Chemistry, Sam Ratulangi University, INDONESIA. (E-mail: [email protected]) INTRODUCTION Indonesia is located in an area with a tropical climate with a wide variety of natural resources with many form of plants. Indonesia has a high potential for medical plants . One of the plants that are often used by the people of North Sulawesi for traditional medicine is sesewanua, especially on the leaves of plants. One of the conditions for a plant to be developed as a medicine must go through a toxicity test first. One of the methods used to find out the toxicity of an extract or natural ingredient compound is Brine Shrimp Lethality Test which is stated by the LC50 value. In research that uses separation with column chromatography, the aim is to obtain fractions containing simpler compounds or to obtain pure compounds For this research, it was conducted to test the toxicity with BSLT method of sesewanua leaves separated from column chromatography by using methanol, ethyl acetate and n-hexane as solvents. RESULTS AND DISCUSSION Result of Toxicity Test Separation of the crude extract of sesewanua leaves was carried out using the first column chromatography where the solvents used were n-hexane, ethyl acetate, and methanol. The purpose of using a solvent with a different polarity is to obtain a suitable compound based on the degree of polarity of the extracting solvent.
Table 1. Result of LC50 value from separation with first column chromatography
Fractions LC50 (ppm)
Methanol Fraction 22.621
Ethyl Acetate Fraction 20.839
n-Hexane Fraction 30. 081
From table 1 it can be seen that the lowest LC50 value is in the ethyl acetate fraction by 20.839 ppm, then followed with methanol fraction by 22.621 ppm and followed by the n-hexane fraction by 30.081 ppm. The smaller LC50 value, the fraction that has the best LC50 value. If the LC50 value below 30 ppm, the fraction can be categorized as very toxic, while the LC50 value above 30 ppm is categorized as toxic. For this research, the sesewanua leaf fractions after separation by first column chromatography can be categorized as very toxic for ethyl acetate and methanol fractions, and toxic to n-hexane fractions. Separation with second column chromatography using a 25% gradient eluent system. with a mixture of solvents, namely n-hexane and ethyl acetate. Re-separation by second column chromatography
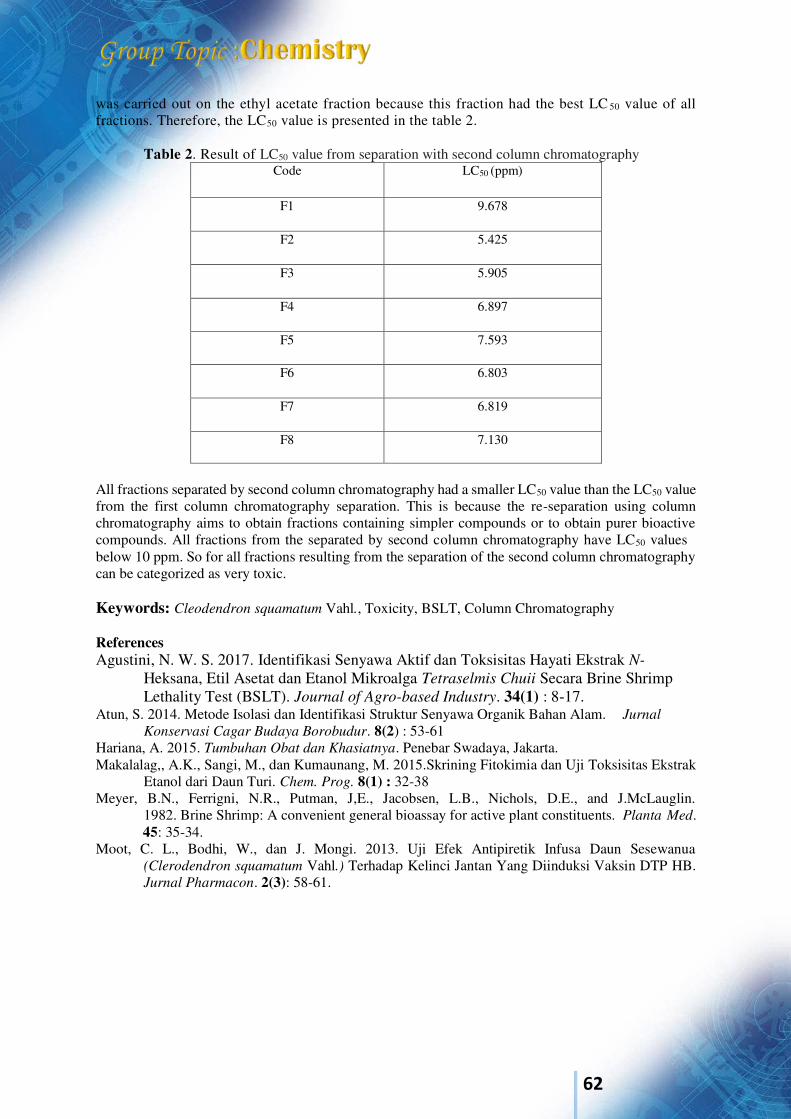
62
was carried out on the ethyl acetate fraction because this fraction had the best LC 50 value of all fractions. Therefore, the LC50 value is presented in the table 2.
Table 2. Result of LC50 value from separation with second column chromatography
Code LC50 (ppm)
F1 9.678
F2 5.425
F3 5.905
F4 6.897
F5 7.593
F6 6.803
F7 6.819
F8 7.130
All fractions separated by second column chromatography had a smaller LC50 value than the LC50 value from the first column chromatography separation. This is because the re-separation using column chromatography aims to obtain fractions containing simpler compounds or to obtain purer bioactive compounds. All fractions from the separated by second column chromatography have LC50 values below 10 ppm. So for all fractions resulting from the separation of the second column chromatography can be categorized as very toxic. Keywords: Cleodendron squamatum Vahl., Toxicity, BSLT, Column Chromatography References Agustini, N. W. S. 2017. Identifikasi Senyawa Aktif dan Toksisitas Hayati Ekstrak N-
Heksana, Etil Asetat dan Etanol Mikroalga Tetraselmis Chuii Secara Brine Shrimp Lethality Test (BSLT). Journal of Agro-based Industry. 34(1) : 8-17. Atun, S. 2014. Metode Isolasi dan Identifikasi Struktur Senyawa Organik Bahan Alam. Jurnal
Konservasi Cagar Budaya Borobudur. 8(2) : 53-61 Hariana, A. 2015. Tumbuhan Obat dan Khasiatnya. Penebar Swadaya, Jakarta. Makalalag,, A.K., Sangi, M., dan Kumaunang, M. 2015.Skrining Fitokimia dan Uji Toksisitas Ekstrak Etanol dari Daun Turi. Chem. Prog. 8(1) : 32-38 Meyer, B.N., Ferrigni, N.R., Putman, J,E., Jacobsen, L.B., Nichols, D.E., and J.McLauglin.
1982. Brine Shrimp: A convenient general bioassay for active plant constituents. Planta Med. 45: 35-34.
Moot, C. L., Bodhi, W., dan J. Mongi. 2013. Uji Efek Antipiretik Infusa Daun Sesewanua (Clerodendron squamatum Vahl.) Terhadap Kelinci Jantan Yang Diinduksi Vaksin DTP HB. Jurnal Pharmacon. 2(3): 58-61.
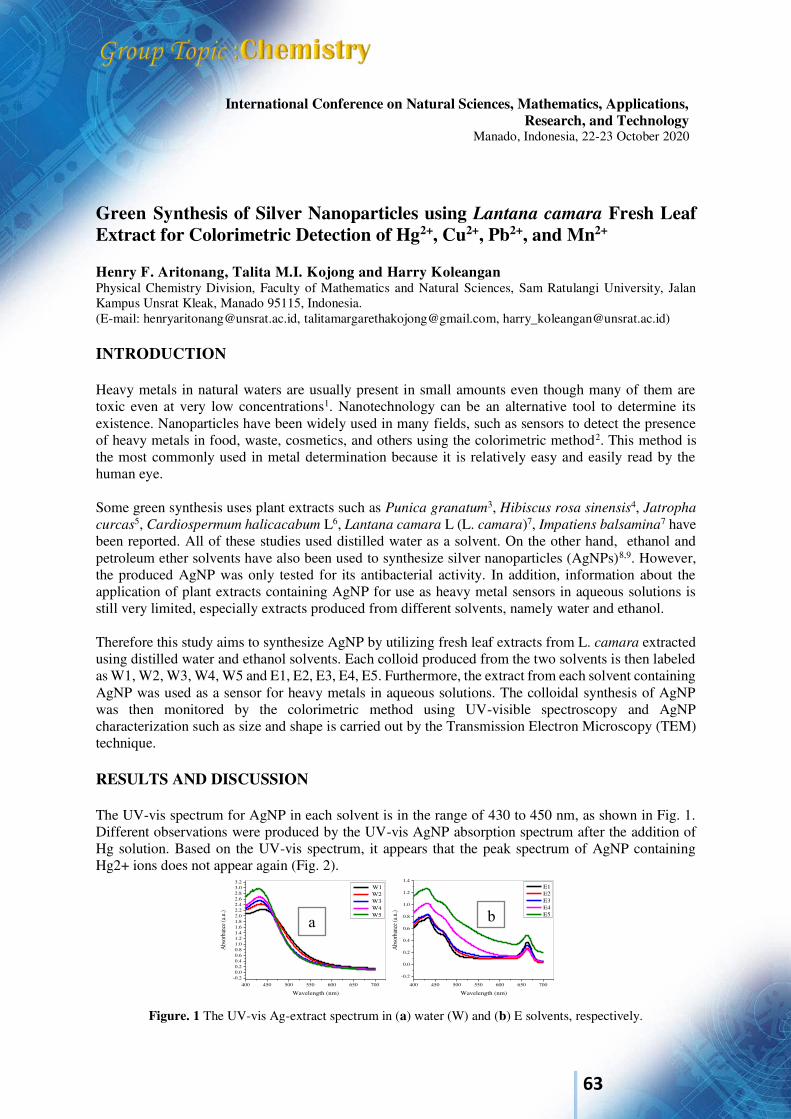
63
International Conference on Natural Sciences, Mathematics, Applications, Research, and Technology
Manado, Indonesia, 22-23 October 2020
Green Synthesis of Silver Nanoparticles using Lantana camara Fresh Leaf Extract for Colorimetric Detection of Hg2+, Cu2+, Pb2+, and Mn2+ Henry F. Aritonang, Talita M.I. Kojong and Harry Koleangan
Physical Chemistry Division, Faculty of Mathematics and Natural Sciences, Sam Ratulangi University, Jalan Kampus Unsrat Kleak, Manado 95115, Indonesia. (E-mail: [email protected], [email protected], [email protected]) INTRODUCTION Heavy metals in natural waters are usually present in small amounts even though many of them are toxic even at very low concentrations1. Nanotechnology can be an alternative tool to determine its existence. Nanoparticles have been widely used in many fields, such as sensors to detect the presence of heavy metals in food, waste, cosmetics, and others using the colorimetric method2. This method is the most commonly used in metal determination because it is relatively easy and easily read by the human eye. Some green synthesis uses plant extracts such as Punica granatum3, Hibiscus rosa sinensis4, Jatropha
curcas5, Cardiospermum halicacabum L6, Lantana camara L (L. camara)7, Impatiens balsamina7 have been reported. All of these studies used distilled water as a solvent. On the other hand, ethanol and petroleum ether solvents have also been used to synthesize silver nanoparticles (AgNPs)8,9. However, the produced AgNP was only tested for its antibacterial activity. In addition, information about the application of plant extracts containing AgNP for use as heavy metal sensors in aqueous solutions is still very limited, especially extracts produced from different solvents, namely water and ethanol. Therefore this study aims to synthesize AgNP by utilizing fresh leaf extracts from L. camara extracted using distilled water and ethanol solvents. Each colloid produced from the two solvents is then labeled as W1, W2, W3, W4, W5 and E1, E2, E3, E4, E5. Furthermore, the extract from each solvent containing AgNP was used as a sensor for heavy metals in aqueous solutions. The colloidal synthesis of AgNP was then monitored by the colorimetric method using UV-visible spectroscopy and AgNP characterization such as size and shape is carried out by the Transmission Electron Microscopy (TEM) technique. RESULTS AND DISCUSSION The UV-vis spectrum for AgNP in each solvent is in the range of 430 to 450 nm, as shown in Fig. 1. Different observations were produced by the UV-vis AgNP absorption spectrum after the addition of Hg solution. Based on the UV-vis spectrum, it appears that the peak spectrum of AgNP containing Hg2+ ions does not appear again (Fig. 2).
Figure. 1 The UV-vis Ag-extract spectrum in (a) water (W) and (b) E solvents, respectively.
400 450 500 550 600 650 700
-0.20.00.20.40.60.81.01.21.41.61.82.02.22.42.62.83.03.2
Abs
orba
nce (
a.u.)
Wavelength (nm)
W1 W2 W3 W4 W5a
400 450 500 550 600 650 700
-0.2
0.0
0.2
0.4
0.6
0.8
1.0
1.2
1.4
Abs
orba
nce (
a.u.)
Wavelength (nm)
E1 E2 E3 E4 E5b
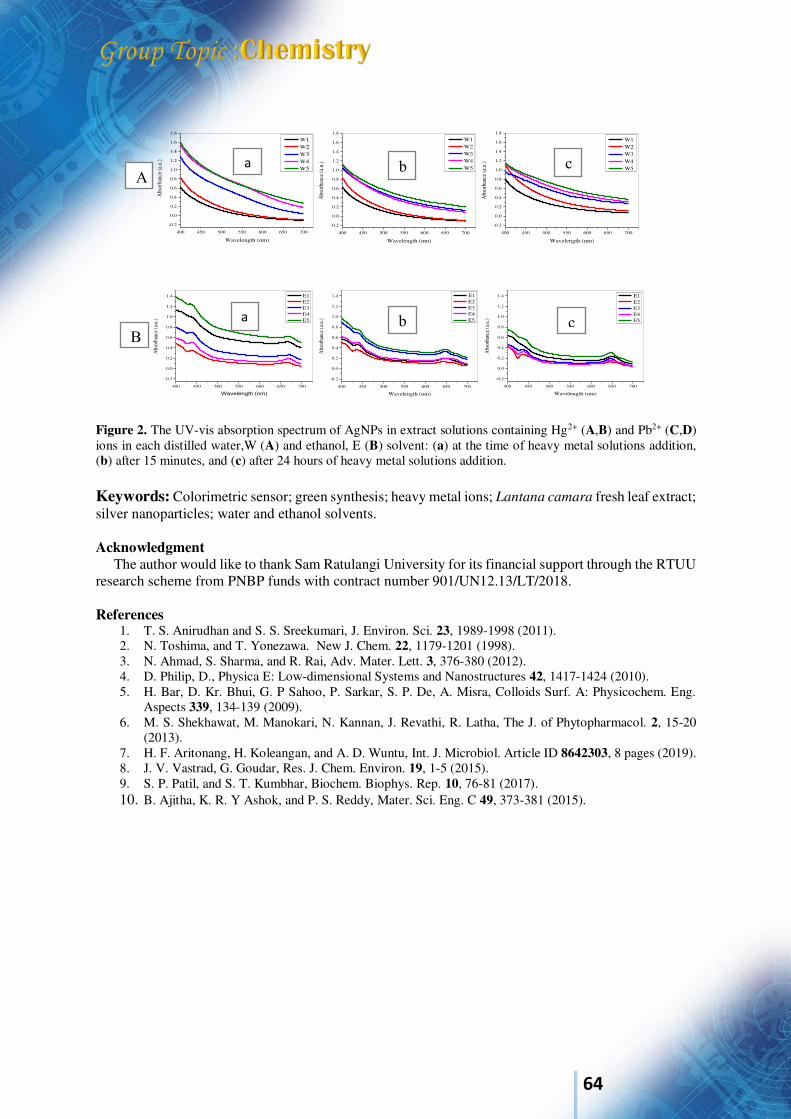
64
Figure 2. The UV-vis absorption spectrum of AgNPs in extract solutions containing Hg2+ (A,B) and Pb2+ (C,D) ions in each distilled water,W (A) and ethanol, E (B) solvent: (a) at the time of heavy metal solutions addition, (b) after 15 minutes, and (c) after 24 hours of heavy metal solutions addition. Keywords: Colorimetric sensor; green synthesis; heavy metal ions; Lantana camara fresh leaf extract; silver nanoparticles; water and ethanol solvents. Acknowledgment
The author would like to thank Sam Ratulangi University for its financial support through the RTUU research scheme from PNBP funds with contract number 901/UN12.13/LT/2018. References
1. T. S. Anirudhan and S. S. Sreekumari, J. Environ. Sci. 23, 1989-1998 (2011). 2. N. Toshima, and T. Yonezawa. New J. Chem. 22, 1179-1201 (1998). 3. N. Ahmad, S. Sharma, and R. Rai, Adv. Mater. Lett. 3, 376-380 (2012). 4. D. Philip, D., Physica E: Low-dimensional Systems and Nanostructures 42, 1417-1424 (2010). 5. H. Bar, D. Kr. Bhui, G. P Sahoo, P. Sarkar, S. P. De, A. Misra, Colloids Surf. A: Physicochem. Eng.
Aspects 339, 134-139 (2009). 6. M. S. Shekhawat, M. Manokari, N. Kannan, J. Revathi, R. Latha, The J. of Phytopharmacol. 2, 15-20
(2013). 7. H. F. Aritonang, H. Koleangan, and A. D. Wuntu, Int. J. Microbiol. Article ID 8642303, 8 pages (2019). 8. J. V. Vastrad, G. Goudar, Res. J. Chem. Environ. 19, 1-5 (2015). 9. S. P. Patil, and S. T. Kumbhar, Biochem. Biophys. Rep. 10, 76-81 (2017). 10. B. Ajitha, K. R. Y Ashok, and P. S. Reddy, Mater. Sci. Eng. C 49, 373-381 (2015).
400 450 500 550 600 650 700
-0.2
0.0
0.2
0.4
0.6
0.8
1.0
1.2
1.4
1.6
1.8
Abs
orba
nce (
a.u.)
Wavelength (nm)
W1
W2 W3 W4 W5a
400 450 500 550 600 650 700
-0.2
0.0
0.2
0.4
0.6
0.8
1.0
1.2
1.4
1.6
1.8
Abs
orba
nce (
a.u.
)
Wavelength (nm)
W1 W2 W3 W4 W5b
400 450 500 550 600 650 700
-0.2
0.0
0.2
0.4
0.6
0.8
1.0
1.2
1.4
1.6
1.8
Abs
orba
nce (
a.u.
)
Wavelength (nm)
W1 W2 W3 W4 W5c
A
400 450 500 550 600 650 700
-0.2
0.0
0.2
0.4
0.6
0.8
1.0
1.2
1.4
Abs
orba
nce (
a.u.)
Wavelength (nm)
E1 E2 E3 E4 E5
B a
400 450 500 550 600 650 700
-0.2
0.0
0.2
0.4
0.6
0.8
1.0
1.2
1.4
Abs
orba
nce (
a.u.)
Wavelength (nm)
E1 E2 E3 E4 E5b
400 450 500 550 600 650 700
-0.2
0.0
0.2
0.4
0.6
0.8
1.0
1.2
1.4
Abs
orba
nce (
a.u.)
Wavelength (nm)
E1 E2 E3 E4 E5c

65
International Conference on Natural Sciences, Mathematics, Applications,
Research, and Technology Manado, Indonesia, 22-23 October 2020
Chitosan/MgO/Ag Nanocomposite for Potential Antibacterial Application Henry F. Aritonang, Shintya Maryani and Vanda S. Kamu
Physical Chemistry Division, Faculty of Mathematics and Natural Sciences, Sam Ratulangi University, Jalan Kampus Unsrat Kleak, Manado 95115, Indonesia. (E-mail: [email protected], [email protected], [email protected])
INTRODUCTION Nanotechnology is a unique phenomenon that can be applied in the fields of information technology, pharmaceuticals and health, agriculture, industry, and others1. The development of nanotechnology itself is inseparable from research on nanomaterials because nano-sized materials have a number of physical and chemical properties that are superior to bulk materials2. Nanoparticles have many uses, including as sensors, catalysts, surface coating agents, and antibacterial agents3. There are several methods to synthesize these nanoparticles and coprecipitation is a promising method because the process uses low temperatures and is easy to control the particle size so that the time required is relatively shorter4. Akmaz et al.5 and Dananjaya et al.6 have used chitosan as a stabilizer for silver (Ag) particles in synthesizing chitosan/Ag nanoparticle composite materials using the coprecipitation method. Riyadh et al.7 has used chitosan as a stabilizer for magnesium oxide (MgO) nanoparticles in synthesizing chitosan/MgO nanoparticle composite. According to several researchers, MgO has shown its effectiveness as an antibacterial, both gram-negative and positive bacteria8,9. In addition to MgO nanoparticles in their single form, MgO/Ag nanocomposites have shown their effectiveness as antibacterial agents10. Based on the research results that have been reported, the researchers tried to synthesize chitosan/MgO/Ag nanocomposites because until now the nanocomposites have not been reported. The use of chitosan in this study is because chitosan is a polysaccharide biopolymer with excellent biocompatibility, biodegradability, and low toxicity11,12. To achieve the objectives of this study, variations in the amount of AgNO3 were carried out, namely 0.05 g, 0.1 g, 0.15 g, and 0.2 g. Furthermore, the types of test bacteria used were E. coli and S.aureus. RESULTS AND DISCUSSION Chitosan/MgO/Ag nanocomposite was obtained by coprecipitation method using magnesium nitrate hexahydrate (Mg(NO3)2.6H2O) and silver nitrate (AgNO3) precursors and assisted with NaOH base. The resulting nanocomposites are dark brown in color and covered in white granules, which indicates that Ag and MgO nanoparticles have been formed. To support the results obtained, nanocomposites have been characterized by XRD, TEM and tested for their activity against gram-negative and positive bacteria, as shown in Figures 1 and 2 below.
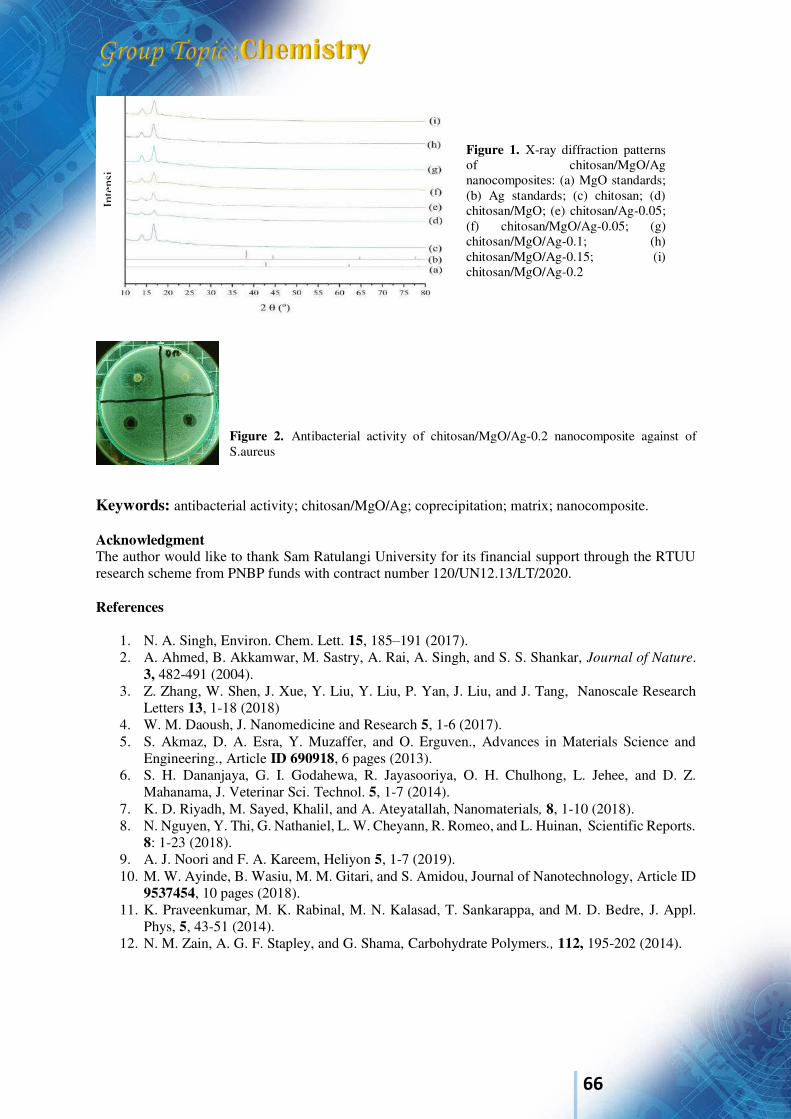
66
Figure 2. Antibacterial activity of chitosan/MgO/Ag-0.2 nanocomposite against of S.aureus
Keywords: antibacterial activity; chitosan/MgO/Ag; coprecipitation; matrix; nanocomposite. Acknowledgment The author would like to thank Sam Ratulangi University for its financial support through the RTUU research scheme from PNBP funds with contract number 120/UN12.13/LT/2020. References
1. N. A. Singh, Environ. Chem. Lett. 15, 185–191 (2017). 2. A. Ahmed, B. Akkamwar, M. Sastry, A. Rai, A. Singh, and S. S. Shankar, Journal of Nature.
3, 482-491 (2004). 3. Z. Zhang, W. Shen, J. Xue, Y. Liu, Y. Liu, P. Yan, J. Liu, and J. Tang, Nanoscale Research
Letters 13, 1-18 (2018) 4. W. M. Daoush, J. Nanomedicine and Research 5, 1-6 (2017). 5. S. Akmaz, D. A. Esra, Y. Muzaffer, and O. Erguven., Advances in Materials Science and
Engineering., Article ID 690918, 6 pages (2013). 6. S. H. Dananjaya, G. I. Godahewa, R. Jayasooriya, O. H. Chulhong, L. Jehee, and D. Z.
Mahanama, J. Veterinar Sci. Technol. 5, 1-7 (2014). 7. K. D. Riyadh, M. Sayed, Khalil, and A. Ateyatallah, Nanomaterials, 8, 1-10 (2018). 8. N. Nguyen, Y. Thi, G. Nathaniel, L. W. Cheyann, R. Romeo, and L. Huinan, Scientific Reports.
8: 1-23 (2018). 9. A. J. Noori and F. A. Kareem, Heliyon 5, 1-7 (2019). 10. M. W. Ayinde, B. Wasiu, M. M. Gitari, and S. Amidou, Journal of Nanotechnology, Article ID
9537454, 10 pages (2018). 11. K. Praveenkumar, M. K. Rabinal, M. N. Kalasad, T. Sankarappa, and M. D. Bedre, J. Appl.
Phys, 5, 43-51 (2014). 12. N. M. Zain, A. G. F. Stapley, and G. Shama, Carbohydrate Polymers., 112, 195-202 (2014).
Inte
nsi
Figure 1. X-ray diffraction patterns of chitosan/MgO/Ag nanocomposites: (a) MgO standards; (b) Ag standards; (c) chitosan; (d) chitosan/MgO; (e) chitosan/Ag-0.05; (f) chitosan/MgO/Ag-0.05; (g) chitosan/MgO/Ag-0.1; (h) chitosan/MgO/Ag-0.15; (i) chitosan/MgO/Ag-0.2
67
International Conference on Natural Sciences, Mathematics, Applications, Research, and Technology
Manado, Indonesia, 22-23 October 2020
Sangihe Tribe Traditional Medicinal Plants and Biological Activities Max R.J Runtuwene1,*), Maureen Kumaunang1) Vanda S Kamu1), Paulina Veronika Y Yamlean2), dan Ratna Siahaan3) 1)Chemistry Department, Faculty of Mathematics and Natural Sciences, Sam Ratulangi University 2)Pharmacy Department, Faculty of Mathematics and Natural Sciences, Sam Ratulangi University
3)Biology Department, Faculty of Mathematics and Natural Sciences, Sam Ratulangi University *Corresponding author: [email protected]
ABSTRACT The Sangihe tribe in North Sulawesi has local wisdom to use various types of plants to become medicinal plants. Information about medicinal plants used by the Sangihe tribe is still limited. The purpose of this research is to study plants that have been used as medicinal plants by the Sangihe people and to find out their biological activities. The research data were obtained through (1) structured interviews with Battra (respondents who practice traditional medicine using medicinal plants), (2) Testing of biological activity on several medicinal plants. There are 161 types of plants that have been used by Battra to treat 40 types of diseases / symptoms. Phytochemical testing showed that secondary metabolites such as alkaloids, flavonoids, phenols, saponins, and sterols were found in the medicinal plants being tested. High biological activity, there are several medicinal plants tested Keywords: Sangihe ethnic, Battra, Medicinal plants, Biological activity.
BACKGROUND OF THE STUDY The use of medicinal plants has been carried out thousands of years ago but has not been well documented (Widjaja et al., 2014. Sampurno (2003) states that western countries have 300 types of drugs, 40 of which are derived from plants. There are 45 important types of drugs in the United States. derived from tropical plants, and 14 types of plants from Indonesia. Some people believe that medicinal plants are relatively safe, although supporting scientific data is still lacking. Side effects of traditional medicine are relatively small compared to modern medicine. This is because the properties of medicinal plants are the result of fusion. the complexity of natural chemicals in medicinal plants The active ingredients of one medicinal plant work together with other substances, on the contrary, they can react with other active ingredients to keep it in balance The study of medicinal plants used by the Sangihe tribe in North Sulawesi is very limited. is to find out what medicinal plants have been h is used by the Sangihe tribe and its development as medicine in the future The Research Method The medicinal plant data used by the Sangihe tribe were collected and analyzed based on the procedure of Runtuwene, et al. (2016), in the order: Determining the location for data collection, determining the chosen Battra, interview structure, observation, documentation and analysis. Biological activities include making simplicia, making methanol extract, phytochemical and antioxidant activity testing.
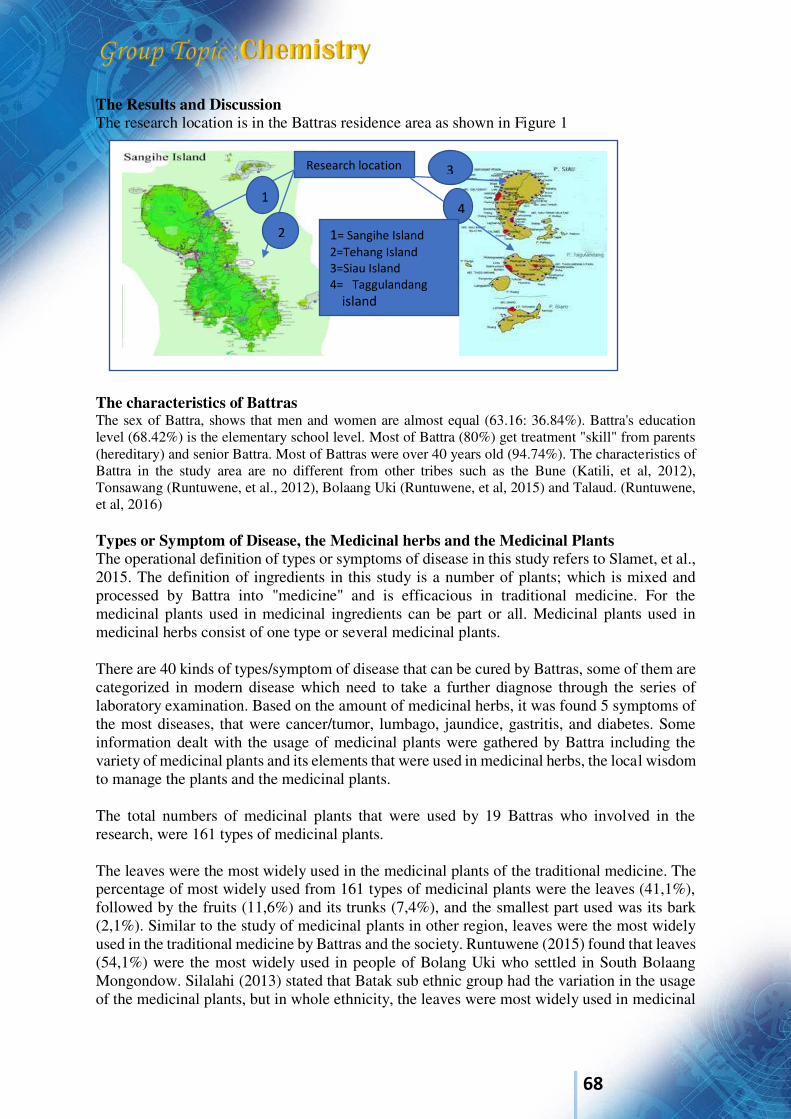
68
The Results and Discussion The research location is in the Battras residence area as shown in Figure 1
Picture 1. The location of the research The characteristics of Battras The sex of Battra, shows that men and women are almost equal (63.16: 36.84%). Battra's education level (68.42%) is the elementary school level. Most of Battra (80%) get treatment "skill" from parents (hereditary) and senior Battra. Most of Battras were over 40 years old (94.74%). The characteristics of Battra in the study area are no different from other tribes such as the Bune (Katili, et al, 2012), Tonsawang (Runtuwene, et al., 2012), Bolaang Uki (Runtuwene, et al, 2015) and Talaud. (Runtuwene, et al, 2016) Types or Symptom of Disease, the Medicinal herbs and the Medicinal Plants The operational definition of types or symptoms of disease in this study refers to Slamet, et al., 2015. The definition of ingredients in this study is a number of plants; which is mixed and processed by Battra into "medicine" and is efficacious in traditional medicine. For the medicinal plants used in medicinal ingredients can be part or all. Medicinal plants used in medicinal herbs consist of one type or several medicinal plants. There are 40 kinds of types/symptom of disease that can be cured by Battras, some of them are categorized in modern disease which need to take a further diagnose through the series of laboratory examination. Based on the amount of medicinal herbs, it was found 5 symptoms of the most diseases, that were cancer/tumor, lumbago, jaundice, gastritis, and diabetes. Some information dealt with the usage of medicinal plants were gathered by Battra including the variety of medicinal plants and its elements that were used in medicinal herbs, the local wisdom to manage the plants and the medicinal plants. The total numbers of medicinal plants that were used by 19 Battras who involved in the research, were 161 types of medicinal plants. The leaves were the most widely used in the medicinal plants of the traditional medicine. The percentage of most widely used from 161 types of medicinal plants were the leaves (41,1%), followed by the fruits (11,6%) and its trunks (7,4%), and the smallest part used was its bark (2,1%). Similar to the study of medicinal plants in other region, leaves were the most widely used in the traditional medicine by Battras and the society. Runtuwene (2015) found that leaves (54,1%) were the most widely used in people of Bolang Uki who settled in South Bolaang Mongondow. Silalahi (2013) stated that Batak sub ethnic group had the variation in the usage of the medicinal plants, but in whole ethnicity, the leaves were most widely used in medicinal
Research location
1
2
3
4
1= Sangihe Island
2=Tehang Island
3=Siau Island
4= Taggulandang
island
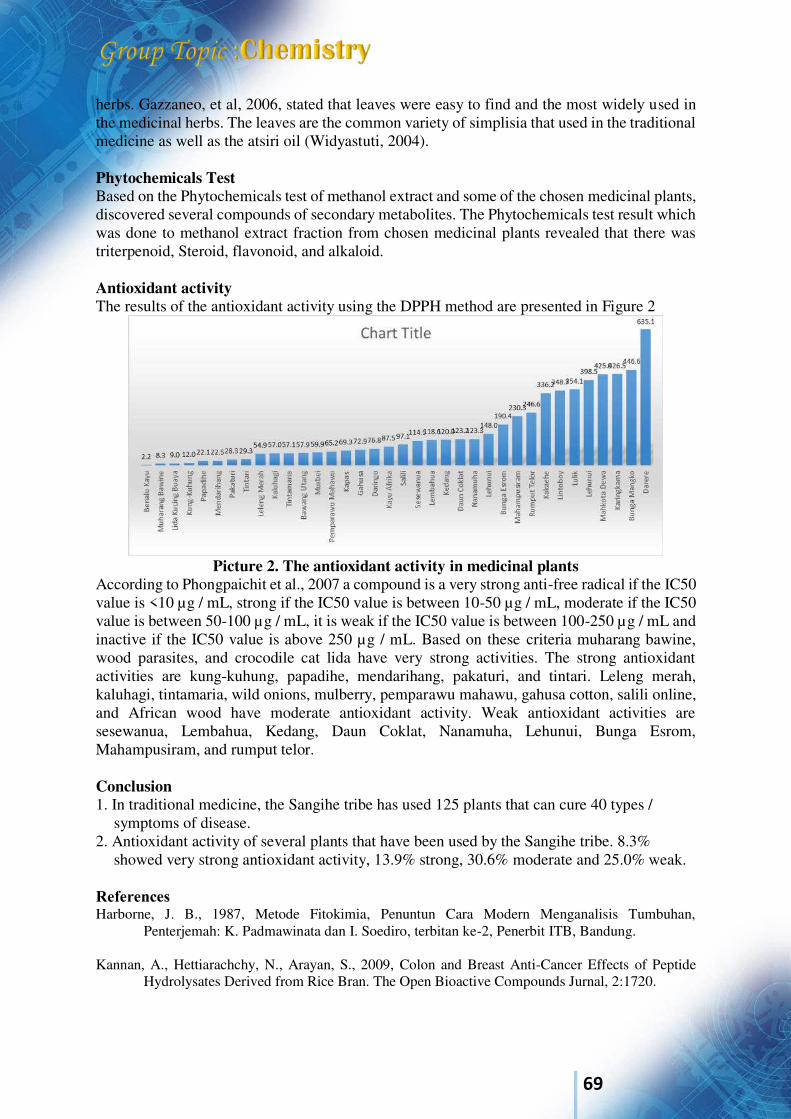
69
herbs. Gazzaneo, et al, 2006, stated that leaves were easy to find and the most widely used in the medicinal herbs. The leaves are the common variety of simplisia that used in the traditional medicine as well as the atsiri oil (Widyastuti, 2004). Phytochemicals Test Based on the Phytochemicals test of methanol extract and some of the chosen medicinal plants, discovered several compounds of secondary metabolites. The Phytochemicals test result which was done to methanol extract fraction from chosen medicinal plants revealed that there was triterpenoid, Steroid, flavonoid, and alkaloid. Antioxidant activity The results of the antioxidant activity using the DPPH method are presented in Figure 2
Picture 2. The antioxidant activity in medicinal plants
According to Phongpaichit et al., 2007 a compound is a very strong anti-free radical if the IC50 value is <10 µg / mL, strong if the IC50 value is between 10-50 µg / mL, moderate if the IC50 value is between 50-100 µg / mL, it is weak if the IC50 value is between 100-250 µg / mL and inactive if the IC50 value is above 250 µg / mL. Based on these criteria muharang bawine, wood parasites, and crocodile cat lida have very strong activities. The strong antioxidant activities are kung-kuhung, papadihe, mendarihang, pakaturi, and tintari. Leleng merah, kaluhagi, tintamaria, wild onions, mulberry, pemparawu mahawu, gahusa cotton, salili online, and African wood have moderate antioxidant activity. Weak antioxidant activities are sesewanua, Lembahua, Kedang, Daun Coklat, Nanamuha, Lehunui, Bunga Esrom, Mahampusiram, and rumput telor. Conclusion 1. In traditional medicine, the Sangihe tribe has used 125 plants that can cure 40 types /
symptoms of disease. 2. Antioxidant activity of several plants that have been used by the Sangihe tribe. 8.3%
showed very strong antioxidant activity, 13.9% strong, 30.6% moderate and 25.0% weak. References Harborne, J. B., 1987, Metode Fitokimia, Penuntun Cara Modern Menganalisis Tumbuhan,
Penterjemah: K. Padmawinata dan I. Soediro, terbitan ke-2, Penerbit ITB, Bandung. Kannan, A., Hettiarachchy, N., Arayan, S., 2009, Colon and Breast Anti-Cancer Effects of Peptide
Hydrolysates Derived from Rice Bran. The Open Bioactive Compounds Jurnal, 2:1720.
70
Phongpaichit, S., Nikom, J., Rungjindamai, N., Sakayaroj, J., Hutadilok Towatana, N., et al. (2007). Biological Activities of Extracts From Endophytic Fungi Isolated From Garcinia Plant. FEMS Immunology & Medical Microbiology, 51(3), 517 – 525.
Runtuwene, M.R.J., Malingkas., S., Lapian.M dan Tumbelaka, A. 2012. Laporan Riset Khusus
Eksplorasi Pengetahuan Lokal Etnomedisin Dan Tumbuhan Obat Berbasis Komunitas Di Indonesi. Etnis Tongsawang. Kabupaten Minahasa Tenggara. Kerjasama Universitas Sam Ratulangi dengan Balai Besar Penelitian Dan Pengembangan Tanaman Obat Dan Obat Tradisional. Kementerian Kesehatan RI
Runtuwene, M.R.J., Pealalu, J dan Abdulah, W. 2014. Tumbuhan Obat Yang Digunakan Sebagai
Antikanker Di Kabupaten Tidore Maluku Utara. Prosiding Seminar Nasional Pemanfaatan Dan Konservasi Sumberdaya Alam Dalam Prespektif Pembangunan Berkelanjutan. Kerjasama HKI-Sulut dan FMIPA Unsrat.
Runtuwene, M.R.J., Umboh, S., Suoth, S., Simbala, S dan Deny, Y. 2015. Laporan Riset Khusus
Eksplorasi Pengetahuan Lokal Etnomedisin Dan Tumbuhan Obat Berbasis Komunitas Di Indonesi. Etnis Bolaang Uki Kabupaten Bolaang Mongondow Selatan. Kerjasama Universitas Sam Ratulangi dengan Balai Besar Penelitian Dan Pengembangan Tanaman Obat Dan Obat Tradisional. Kementerian Kesehatan RI
Runtuwene.M.R.J., Lengkong, E dan Kamu, S.V. 2016. Tumbuhan Obat Tradisional Dari
Kabupaten Kepulauan Talaud Propinsi Sulawesi Utara. Penerbit. Gfrafindo Bandung Slamet Wahyono Rohmat Mujahid Nita Supriyati Wahyu Jojo Priyamboso Awal Prikhatin Kusumo
Dewi Nuning Rahmawati Sunu Pamadyo Tanjung Ismoyo 2015. Pedoman Pengumpulan Data. Riset Khusus Eksplorasi Pengetahuan Lokal Etnomedisin Dan Tumbuhan Obat Berbasis Komunitas Di Indonesia. Kementerian Kesehatan Republik Indonesia Badan Penelitian Dan Pengembangan Kesehatan
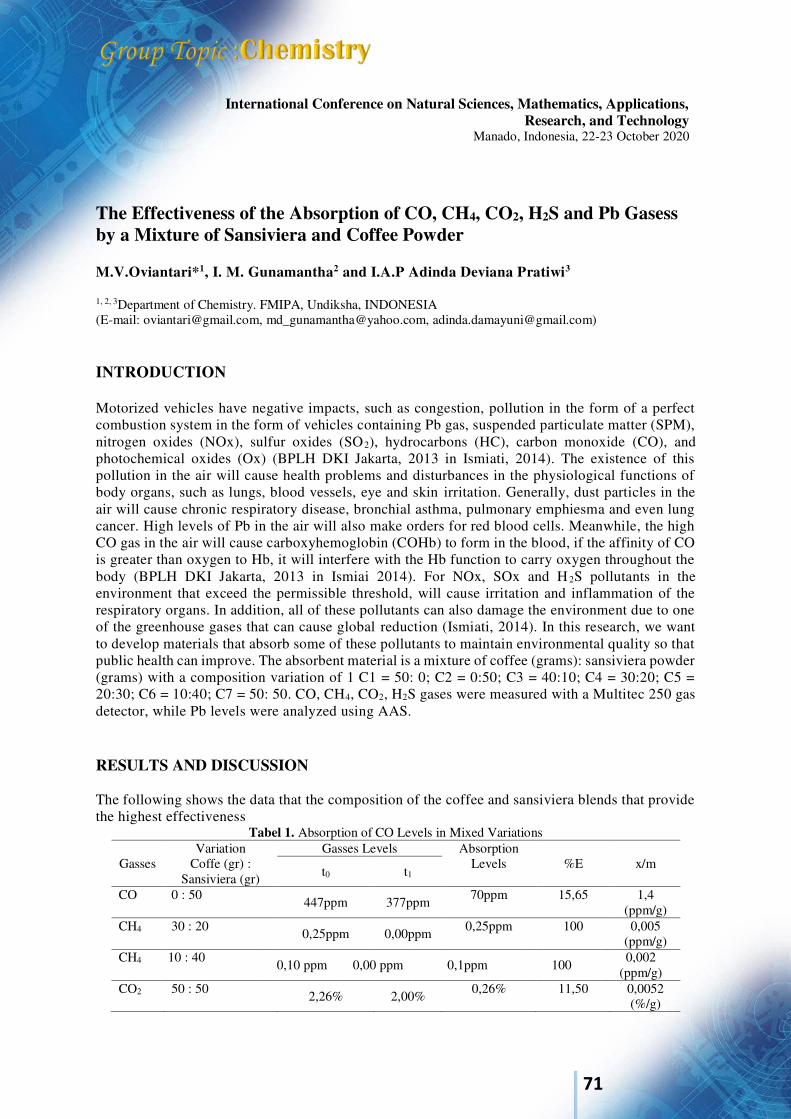
71
International Conference on Natural Sciences, Mathematics, Applications, Research, and Technology
Manado, Indonesia, 22-23 October 2020
The Effectiveness of the Absorption of CO, CH4, CO2, H2S and Pb Gasess by a Mixture of Sansiviera and Coffee Powder M.V.Oviantari*1, I. M. Gunamantha2 and I.A.P Adinda Deviana Pratiwi3
1, 2, 3Department of Chemistry. FMIPA, Undiksha, INDONESIA (E-mail: [email protected], [email protected], [email protected])
INTRODUCTION Motorized vehicles have negative impacts, such as congestion, pollution in the form of a perfect combustion system in the form of vehicles containing Pb gas, suspended particulate matter (SPM), nitrogen oxides (NOx), sulfur oxides (SO2), hydrocarbons (HC), carbon monoxide (CO), and photochemical oxides (Ox) (BPLH DKI Jakarta, 2013 in Ismiati, 2014). The existence of this pollution in the air will cause health problems and disturbances in the physiological functions of body organs, such as lungs, blood vessels, eye and skin irritation. Generally, dust particles in the air will cause chronic respiratory disease, bronchial asthma, pulmonary emphiesma and even lung cancer. High levels of Pb in the air will also make orders for red blood cells. Meanwhile, the high CO gas in the air will cause carboxyhemoglobin (COHb) to form in the blood, if the affinity of CO is greater than oxygen to Hb, it will interfere with the Hb function to carry oxygen throughout the body (BPLH DKI Jakarta, 2013 in Ismiai 2014). For NOx, SOx and H 2S pollutants in the environment that exceed the permissible threshold, will cause irritation and inflammation of the respiratory organs. In addition, all of these pollutants can also damage the environment due to one of the greenhouse gases that can cause global reduction (Ismiati, 2014). In this research, we want to develop materials that absorb some of these pollutants to maintain environmental quality so that public health can improve. The absorbent material is a mixture of coffee (grams): sansiviera powder (grams) with a composition variation of 1 C1 = 50: 0; C2 = 0:50; C3 = 40:10; C4 = 30:20; C5 = 20:30; C6 = 10:40; C7 = 50: 50. CO, CH4, CO2, H2S gases were measured with a Multitec 250 gas detector, while Pb levels were analyzed using AAS. RESULTS AND DISCUSSION The following shows the data that the composition of the coffee and sansiviera blends that provide the highest effectiveness
Tabel 1. Absorption of CO Levels in Mixed Variations
Gasses Variation
Coffe (gr) : Sansiviera (gr)
Gasses Levels Absorption Levels
%E x/m
t0 t1
CO 0 : 50 447ppm 377ppm 70ppm 15,65 1,4 (ppm/g)
CH4 30 : 20 0,25ppm 0,00ppm 0,25ppm 100 0,005 (ppm/g)
CH4 10 : 40 0,10 ppm 0,00 ppm 0,1ppm 100
0,002 (ppm/g)
CO2 50 : 50 2,26% 2,00% 0,26% 11,50 0,0052 (%/g)
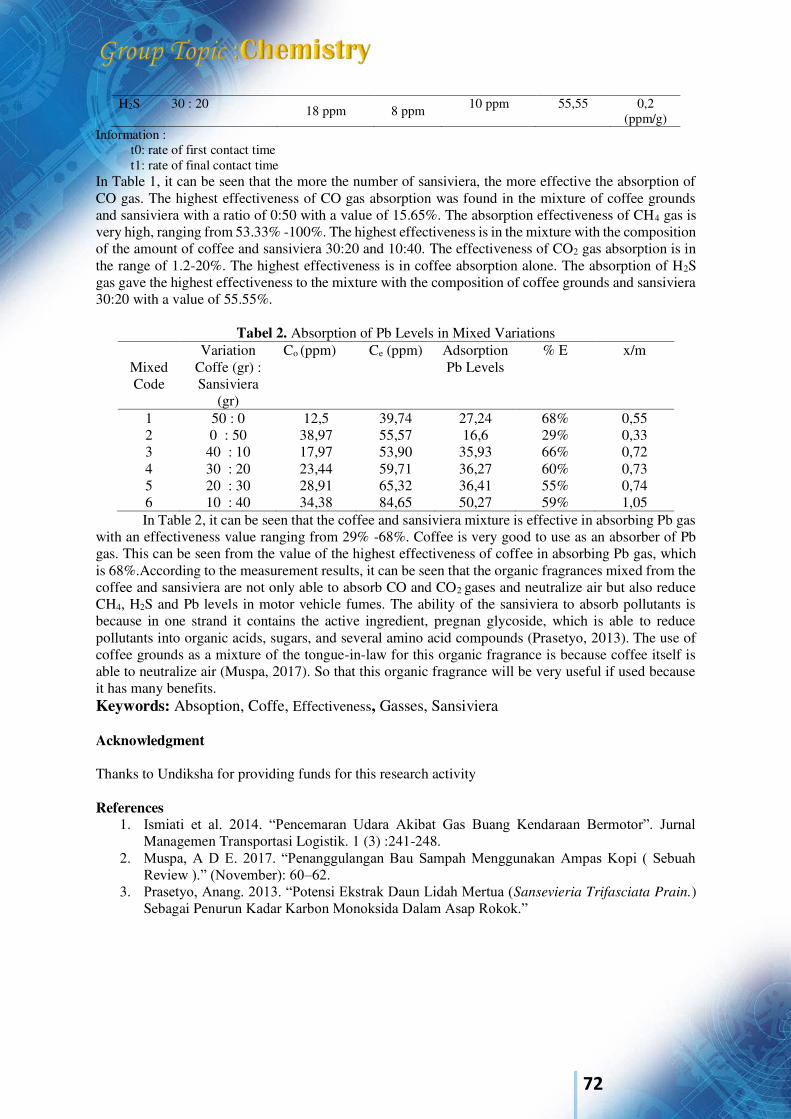
72
H2S 30 : 20 18 ppm 8 ppm 10 ppm 55,55 0,2 (ppm/g)
Information : t0: rate of first contact time t1: rate of final contact time
In Table 1, it can be seen that the more the number of sansiviera, the more effective the absorption of CO gas. The highest effectiveness of CO gas absorption was found in the mixture of coffee grounds and sansiviera with a ratio of 0:50 with a value of 15.65%. The absorption effectiveness of CH4 gas is very high, ranging from 53.33% -100%. The highest effectiveness is in the mixture with the composition of the amount of coffee and sansiviera 30:20 and 10:40. The effectiveness of CO2 gas absorption is in the range of 1.2-20%. The highest effectiveness is in coffee absorption alone. The absorption of H2S gas gave the highest effectiveness to the mixture with the composition of coffee grounds and sansiviera 30:20 with a value of 55.55%.
Tabel 2. Absorption of Pb Levels in Mixed Variations
Mixed Code
Variation Coffe (gr) : Sansiviera
(gr)
Co (ppm) Ce (ppm) Adsorption Pb Levels
% E
x/m
1 50 : 0 12,5 39,74 27,24 68% 0,55 2 0 : 50 38,97 55,57 16,6 29% 0,33 3 40 : 10 17,97 53,90 35,93 66% 0,72 4 30 : 20 23,44 59,71 36,27 60% 0,73 5 20 : 30 28,91 65,32 36,41 55% 0,74 6 10 : 40 34,38 84,65 50,27 59% 1,05 In Table 2, it can be seen that the coffee and sansiviera mixture is effective in absorbing Pb gas
with an effectiveness value ranging from 29% -68%. Coffee is very good to use as an absorber of Pb gas. This can be seen from the value of the highest effectiveness of coffee in absorbing Pb gas, which is 68%.According to the measurement results, it can be seen that the organic fragrances mixed from the coffee and sansiviera are not only able to absorb CO and CO2 gases and neutralize air but also reduce CH4, H2S and Pb levels in motor vehicle fumes. The ability of the sansiviera to absorb pollutants is because in one strand it contains the active ingredient, pregnan glycoside, which is able to reduce pollutants into organic acids, sugars, and several amino acid compounds (Prasetyo, 2013). The use of coffee grounds as a mixture of the tongue-in-law for this organic fragrance is because coffee itself is able to neutralize air (Muspa, 2017). So that this organic fragrance will be very useful if used because it has many benefits. Keywords: Absoption, Coffe, Effectiveness, Gasses, Sansiviera Acknowledgment Thanks to Undiksha for providing funds for this research activity References
1. Ismiati et al. 2014. “Pencemaran Udara Akibat Gas Buang Kendaraan Bermotor”. Jurnal Managemen Transportasi Logistik. 1 (3) :241-248.
2. Muspa, A D E. 2017. “Penanggulangan Bau Sampah Menggunakan Ampas Kopi ( Sebuah Review ).” (November): 60–62.
3. Prasetyo, Anang. 2013. “Potensi Ekstrak Daun Lidah Mertua (Sansevieria Trifasciata Prain.) Sebagai Penurun Kadar Karbon Monoksida Dalam Asap Rokok.”
73
International Conference on Natural Sciences, Mathematics, Applications, Research, and Technology
Manado, Indonesia, 22-23October 2020
Absorption of Remazol Red Dye from Textile Waste using Activated Carbon from Coconut Shell Ni Luh Putu Ananda Saraswati*1, I Dewa Ketut Sastrawidana2
1, 2Departement of Chemistry, Universitas Pendidikan Ganesha, INDONESIA. (E-mail: [email protected], [email protected]) INTRODUCTION The textile industry is currently known to provide the largest contribution to water pollution, far greater than the ink, paper, leather and printing industries1,2. This is due to the use of various synthetic dyes that will inevitably result in non-biodegradable waste which pollutes the aquatic ecosystems and create negative impact on human health3,4. One of the most widely used dyes in textile industry is Remazol Red, a water soluble compound that belongs to anthracene derivative group. Recently, various efforts, techniques, and methods have been developed to reduce the levels of this dye in textile industrial waste. Among them, adsorption is preferred due to its simple procedure with relatively low cost and abundant adsorbents availability. The trend of research that based on environmentally friendly materials gives major influence in the selection of the adsorbent. Activated carbon is one the powerful candidate mainly due to the abundant carbon sources in nature, both from plants and animals [7]. Bali as a coastal area which is rich in coconut plantation products has great potential in developing activated carbon-based absorbent from coconut shell. Adsorbents derived from natural materials generally have poor adsorption properties, thus it is necessary to carry out an activation process to obtain better surface characteristics, such as large surface area, number of pores, and pore size. Apart from these surface characteristics, the adsorption effectiveness is also influenced by contact time, solution concentration, and temperature. In general, the adsorption behavior of a system can be described well using an adsorption isotherm model. Choosing the right model will make it easier to determine the optimum conditions that can be achieved by the studied materials. In this research, activated carbons derived from coconut shell were synthesized and a series of analyzes were carried out to determine the suitable model for the adsorption of Remazol Red solution. The charcoals obtained from coconut shell were given two different treatment: without activation and with activation at 900 C. Remazol red solutions were made by dissolving certain amount of Remazol Red powder with distilled water. The study of isotherm adsorption model was carried out by mixing the charcoal with Remazol Red solution in various concentration and different contact time to obtain the optimum condition. The concentration of Remazol Red dye solutions after the adsorption were measured using UV-Vis spectrophotometry technique. RESULTS AND DISCUSSION The water content of coconut shell-based charcoal without and with activation is 22.52% and 9.49%, respectively. The adsorption process between these two charcoals with Remazol Red solution does not occur all at once, but gradually depending on the interaction between the charcoals and dyes. Both of the charcoals have optimum contact time for Remazol Red adsorption at 30 minutes. After this time,
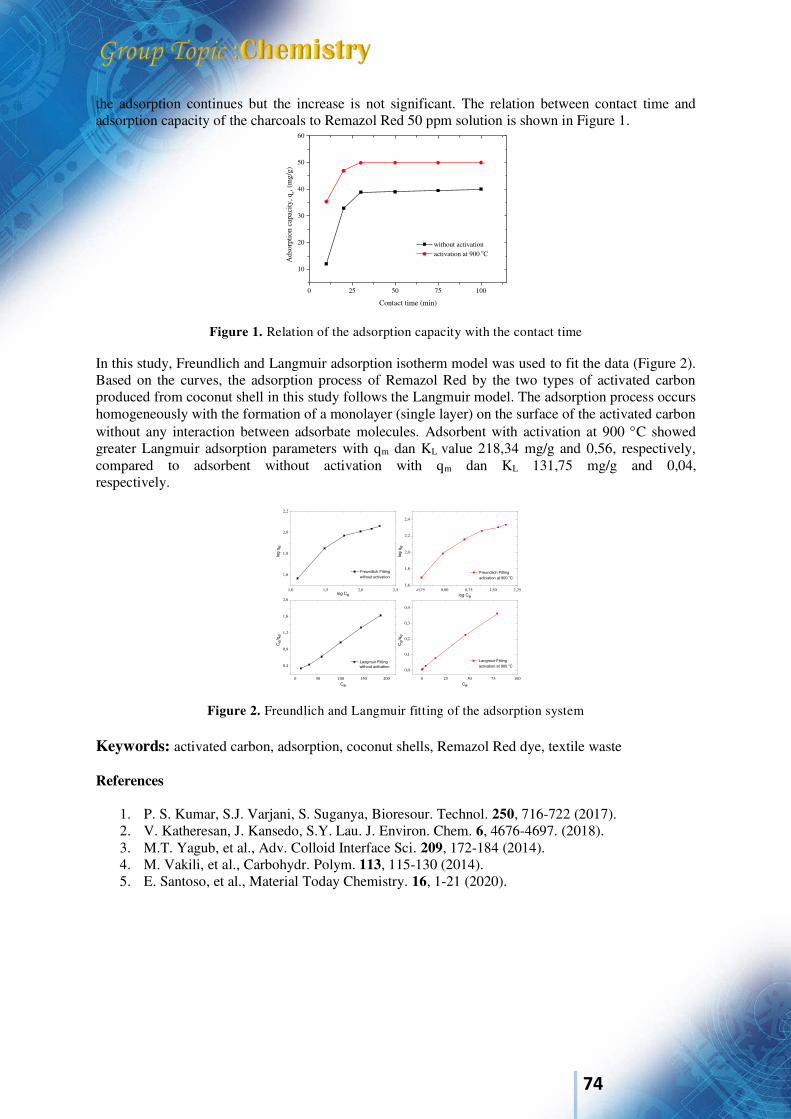
74
the adsorption continues but the increase is not significant. The relation between contact time and adsorption capacity of the charcoals to Remazol Red 50 ppm solution is shown in Figure 1.
Figure 1. Relation of the adsorption capacity with the contact time
In this study, Freundlich and Langmuir adsorption isotherm model was used to fit the data (Figure 2). Based on the curves, the adsorption process of Remazol Red by the two types of activated carbon produced from coconut shell in this study follows the Langmuir model. The adsorption process occurs homogeneously with the formation of a monolayer (single layer) on the surface of the activated carbon without any interaction between adsorbate molecules. Adsorbent with activation at 900 C showed greater Langmuir adsorption parameters with qm dan KL value 218,34 mg/g and 0,56, respectively, compared to adsorbent without activation with qm dan KL 131,75 mg/g and 0,04, respectively.
Figure 2. Freundlich and Langmuir fitting of the adsorption system
Keywords: activated carbon, adsorption, coconut shells, Remazol Red dye, textile waste References
1. P. S. Kumar, S.J. Varjani, S. Suganya, Bioresour. Technol. 250, 716-722 (2017). 2. V. Katheresan, J. Kansedo, S.Y. Lau. J. Environ. Chem. 6, 4676-4697. (2018). 3. M.T. Yagub, et al., Adv. Colloid Interface Sci. 209, 172-184 (2014). 4. M. Vakili, et al., Carbohydr. Polym. 113, 115-130 (2014). 5. E. Santoso, et al., Material Today Chemistry. 16, 1-21 (2020).
0 25 50 75 100
10
20
30
40
50
60
Ads
orpt
ion
capa
city
, qe,
(mg/
g)
Contact time (min)
without activation activation at 900 oC
1,0 1,5 2,0 2,5
1,6
1,8
2,0
2,2
Freundlich Fitting
without activation
log
qe
log Ce
-0,75 0,00 0,75 1,50 2,251,6
1,8
2,0
2,2
2,4
Freundlich Fitting
activation at 900 oC
log
qe
log Ce
0 50 100 150 200
0,4
0,8
1,2
1,6
2,0
Langmuir Fitting
without activation
Ce
/qe
Ce
0 25 50 75 100
0,0
0,1
0,2
0,3
0,4
Langmuir Fitting
activation at 900 oC
Ce
/qe
Ce
75
International Conference on Natural Sciences, Mathematics, Applications, Research, and Technology
Manado, Indonesia, 22-23 October 2020
Antioxidant and Cytotoxic Activity of Pakaturi (Breynia sp.) Leaves Extract Vanda S. Kamu*1, Chelsy Loway1, Max R.J. Runtuwene1, and Maureen Kumaunang1
1Department of Chemistry, Universitas Sam Ratulangi, Indonesia (E-mail: [email protected], [email protected], [email protected], [email protected]) INTRODUCTION Indonesia is widely known as a country with various biodiversity that has the potential to be developed as medicine or medicinal raw materials. Pakaturi (Breynia sp.) is a plant used by the Banggai people of the Central Sulawesi Island as traditional medicine. The leaves of Pakaturi (Breynia sp.) are believed to cure cancer, internal wounds and malaria medicine. The determination of antioxidant activity was carried out using the DPPH method. The results of the reaction between DPPH and antioxidant compounds can be observed by the color changing of DPPH from dark purple to yellow due to resonance of the DPPH structure [1]. The method used to determine the toxicity of an extract or natural ingredient compound is the Brine Shrimp Lethality Test. Toxic activity is known from the number of deaths of Artemia salina Leach larvae due to the influence of extracts or natural compounds at the given concentration [2]. The purpose of this study was to determine the total phenolic, flavonoid and tannin content of pakaturi (Breynia sp.) leaf extract. In addition, the antioxidant and cytotoxic activity of Pakaturi (Breynia sp.) leaf extract were also determined. The sample Breynia sp. leaves were obtained from Banggai islands. The research stages included extraction, fractionation, determination of secondary metabolite content, and biological activity testing. Determination of secondary metabolite content includes total phenolic, f lavonoids and tannins. The biological activity tests include antioxidant test and the cytotoxic test. The antioxidant activity test used 1,1-diphenyl-2picrylhidrazil (DPPH), while the cytotoxic test was carried out using the Brine Shrimp Lethality Test (BSLT) method. RESULTS AND DISCUSSION The results obtained as follows: the results of ethyl acetate partition have the highest yield, followed by the results of water partitioning, and the results of n-hexane partition (Table 1). The high yield indicated that the ethyl acetate solvent was able to extract more bioactive components with semi-polar properties from pakaturi leaf samples. The highest total phenolic value was in the ethyl acetate fraction with a value of 128.89 mg/g, meanwhile, the highest total flavonoid value was in the ethyl acetate fraction with a value of 105.79 mg/g. In addition, the highest total tannin was in the hexane fraction with a value of 35.43 mg/g. The best antioxidant test was obtained from the ethyl acetate fraction with an IC 50 value of 31.94 µg/mL and the best cytotoxic test was obtained from the ethyl acetate fraction with a value of 24.47 mg/L.

76
On the basis of all results, the highest total phenolic and total flavonoid contents were found in the ethyl acetate partition yield and the total content of condensed tannins in the n-hexane fraction. Ethyl acetate fraction has antioxidant activity. Ethyl acetate fraction has the best cytotoxic activity.
Table 1. Yield of partition of Pakaturi leaves extract
Partition Yield (g) Yield (%) FH 0.3419 6.84
FEA 2.3596 47.19 FA 1.7986 35.97
HF: hexane fraction; EAF: ethyl acetate fraction; WF: water fraction Keywords: antioxidant, cytotoxic, Breynia sp., Brine Shrimp Lethality Test (BSLT), Acknowledgment This research was funded by Research Grant RDUU by Institute of Research and Community Service (LPPM) of Universitas Sam Ratulangi. References
1. W. Abdullah, M. R. J. Runtuwene and V. S.Kamu, J. I. Sains 14, 95-99 (2014). 2. B. N.Meyer, N. R. Ferrigni, J. E. Putman, L. B. Jacobsen, D. E. Nichols and J.L. McLauglin,
Planta Med. 45, 35-34.
77
International Conference on Natural Sciences, Mathematics, Applications, Research, and Technology
Manado, Indonesia, 22-23 October 2020
Citrus Farmers Institutional Studies in Supporting the Role of PTKJS (Integrated Management of Healthy Citrus Farming) in Garut Regency Rita Indrasti*1, Jefny B. Markus Rawung 2, Noor Roufiq3 and Neng Risris Sudolar4
1Indonesian Center for Agricultural Technology Assessment and Development, INDONESIA. (E-mail: [email protected]) 2North Sulawesi Assessment Institute for Agricultural Technology, INDONESIA. (E-mail: [email protected]) 3Center for Horticultural Research and Development , INDONESIA. (E-mail: [email protected]) 4Jakarta Assessment Institute for Agricultural Technology, INDONESIA. (E-mail: [email protected]) INTRODUCTION Citrus is one of the fruits which very popular and become an important commodity. Citrus can support the economy either through domestic or export markets. Garut Regency has experienced its peak as a producer of citrus. At that time, the success of citrus could provide an economic contribution to the area. The large demand of citrus is a potential opportunity for the domestic market that can be fulfilled by national citrus production. Nevertheless, it cannot be denied that the CVPD (Citrus Vein Phloem Degenaration) attack had been caused damage to citrus plants in Garut Regency. One of the ways to prevent the citrus plantation from being attacked by CVPD is PTKJS, an integrated management of healthy citrus farming. The implementation of PTKJS namely (1) using citrus seeds labeled free from disease, (2) pest control using yellow trap technology, (3) sanitation component technology, planting embroidery with labeled seeds, (4) pruning technology, (5) garden management (Supriyanto, 2015). Supriyanto et al. (2003) stated that the use of citrus seeds labeled free of disease, especially CVPD, can minimize damage to citrus plants and ultimately the farmers also suffer huge losses. Symptoms / CVPD infection can cause symptoms of nutrient deficiency due to metabolic disorders in plant tissue. However, PTKJS management should be supported by skilled human resources and solid institutional. Institutions have a very important role to support a farming business in order to succeed. The existence of these institutions can get solutions in dealing with problems, this is supported by opinions (Gunawan, 1989). According to Taryoto, 1995 the institution itself is a tendency for interaction in socio-economic matters relating to two or more actors of social interaction which includes applicable rules to be agreed upon. In fact, the conditions of the farming institutions in Indonesia are very diverse and the farms in each location have very varied characteristics. Institutions have a very important role in the existence of farmer groups (poktan) and farmer group associations (gapoktan). Besides poktan institutions, there are several factors that can affect the citrus farming institutions, namely input institutions, the existence of citrus seed breeder groups and integrated pest control groups (IPM). Within the institution, the partnership between citrus farmers and several companies have been play an important role. The partnership pattern in citrus farming may refer to the nucleus-plasma pattern. The cooperation pattern in providing capital may be either through the Multipurpose Cooperative Institution which commonly called (KSU) or through the Village Credit Institution (LPD). Suci (2008) stated horticultural product procurement contract systems can be through suppliers and general trading patterns.
78
RESULTS AND DISCUSSION Within the institution, there are several parameters that are processed in relation to these farmer groups, namely active Poktan meetings, the benefits of Poktan, the number of problems in Poktan, and communication difficulties in Poktan. The farmer group performance displayed on Table 1. Table 1. Farmer Group Performance
No Activities Number of Respondents
Performance Significance Level1 Yes No
1. Active Poktan meetings 25 10 15 ** 2. The benefits of Poktan 25 17 8 ** 3. The number of problems in Poktan 25 7 18 ** 4. Communication difficulties in Poktan 25 8 17 **
1Test with binomial non-parametric method. * = significantly different, ** = very significantly different Source: Processed data (2017) The results showed that as much as 10 respondents stated that the farmer group meetings was active, while 15 respondents stated no because they thought that there was no problem in the group. They can solve the problem privately without involving other groups. However, the statement that the existence of farmer groups is considered to have benefits, was stated by 17 respondents out of 25 respondents. Whereas other eight respondents considered that it was useless because the farmer group itself does not want to join other farmer groups. There are still many citrus farmer groups that carry out their own management. 18 respondents stated that there was no problem, this was because the respondents were already independent and had broad insights. It is also stated that with low difficulty, 8 respondents stated that it was difficult to communicate. Respondents whose backgrounds are diverse, the possibility of responding to messages will be different too. Farmer groups or farmers should have and be able to take advantage of things that can support the existence of farmer groups. The role of the extension agent or assistant (HR) must be skilled in group coaching so that the institution can be sustainable. Citrus farmers must also understand PTKJS, this too must be supported by reliable and skilled human resources. The institutional aspect must get serious attention.
Keywords: Citrus, Garut, institutional, PTKJS. References
1. Gunawan, M dkk, 1989. Perubahan Kelembagaan Pertanian pada Pasca Adopsi. Prosiding Patanas. Evolusi Kelembagaan Pedesaan di Tengah Perkembangan Teknologi Pertanian. Pusat Penelitian Agro Ekonomi. Badan Penelitian dan Pengembangan Pertanian.
2. Taryoto, A.H. 1995. Analisis Kelembagaan dalam Penelitian Sosial Ekonomi Pertanian. Prosiding Pengembangan Hasil Penelitian. Kelembagan dan Prospek Pengembangan Beberapa Komoditas Pertanian.
3. Supriyanto, dkk. 2003, Pedoman Umum Penelitian dan Pengkajian Penerapan Pengelolaan Terpadu Tanaman (PTT) Jeruk. Puslibangtan Hortikultura. Badan Penelitian dan Pengembangan Pertanian. Jakarta.
4. Supriyanto, 2015. Potret dan Upaya Industrialisasi Perbenihan Jeruk di Kawasan Bangkinang, Kabupaten Kampar, Riau. Prosiding Seminar Nasional Perhorti 2015. Bogor.
5. Suci. K, 2008. Strategi Pengembangan Model Kelembagaan Kemitraan Agribisnis Hortikultura di Bali. Jurnal SOCA. Volume 8, No.2 Juli 2008.
79
International Conference on Natural Sciences, Mathematics, Applications, Research, and Technology
Manado, Indonesia, 22-23 October 2020
Overproduction and Purification of Organomercuric Lyase (MerB) from Mercury-resistant Bacteria Pseudomonas aeruginosa Isolate 4B2. Fatimawali1, Billy J Kepel2 and Trina E Tallei3
1Pharmacy Department, Faculty of Mathematic and Natural Sciences Sam Ratulangi University, INDONESIA. (E-mail: [email protected]) 2Chemistry Department, Faculty of Medicine Sam Ratulangi University, INDONESIA. (E-mail: [email protected]) 3Biology Department, Faculty of Mathematic and Natural Sciences Sam Ratulangi University, INDONESIA. (E-mail: [email protected]) INTRODUCTION Mercury is a very toxic element even though there is very little concentration in the body. Although all chemical forms of mercury are toxic, public health attention is focused on organic mercury which is the most toxic form of mercury. Organic mercury can, however, be detoxified by organomercuric lyase (MerB) protein derived from mercury resistant bacteria. This study aims to overproduce of MerB protein by transforming merB gene into E. coli BL-21(DE3). Nucleotide sequence of merB gene of mercury resistant bacteria Pseudomonas aeruginosa isolates 4B2, optimized by using gene program designers (www.dna20/com) then commercially synthesized and cloned in pET16b expression plasmid vector. Plasmid pET16b_merB (syntetic gene) was transformed into E. coli BL21(DE3) to produce MerB protein recombinant, induced with isopropyl-β-D-thiogalactopyranoside (IPTG) and purified by imidazol. MerB proteins were analyzed by 10% sodium dodecyl sulphate poly acrylamide gel electrophoresis (SDS PAGE). RESULTS AND DISCUSSION The Results of Transform of plasmid pET16b_merB to E. coli BL21 and E. coli Top10 Transformation of plasmid into E. coli BL21(DE3) and E. coli Top10 before overproduction was conducted, the presence of plasmid containing merB gene inside E. coli BL21 (DE3) was confirmed. Migration and restriction analyzes were performed to confirm the presence of the plasmid pET16b-merB in Transforman. The migration analysis shows a suitable result where the migration distance of pET16b-merB (6300 pb) in both Top10 and BL21 has a longer migration distance than Rtase (7300pb) as a comparison. The restriction analysis showed that the merB gene fragments in E. coli BL21 (DE3) matched the bands at 5700 bp and 630 bp sizes, although in Top10 it showed that the plasmid was not completely cut so that the 5700s still saw two bands. The transformation results was shown in Figure 1. The Resuls of Overproduction and Purification of MerB Protein Overproduction of 200 mL scale was carried out at optimum conditions, namely 37°C for 3 hours of incubation at 150 rpm with IPTG induction of 0.1 mM, to see the condition of the protein in a dissolved or undissolved state. Based on the SDS-PAGE results, it is known that the MerB protein is in a dissolved state which can be seen from the SDS band of MerB protein (25.6 kDa) in the supernatant and not present in the debris. Purification of affinity-tagged MerB protein expressed during overproduction was purified on Ni-NTA beads and eluted with washing buffers containing 25, 50, 100, 200 and 500 mM Imidazol, respectively. Approximately 25.6 kDa merB protein was detected after resolving on 10% SDS PAGE (Figure 2). The merB gene encodes for organomercury liase (MerB), an enzyme that plays a role in breaking the Hg-C bonds in organic mercury compounds into inorganic
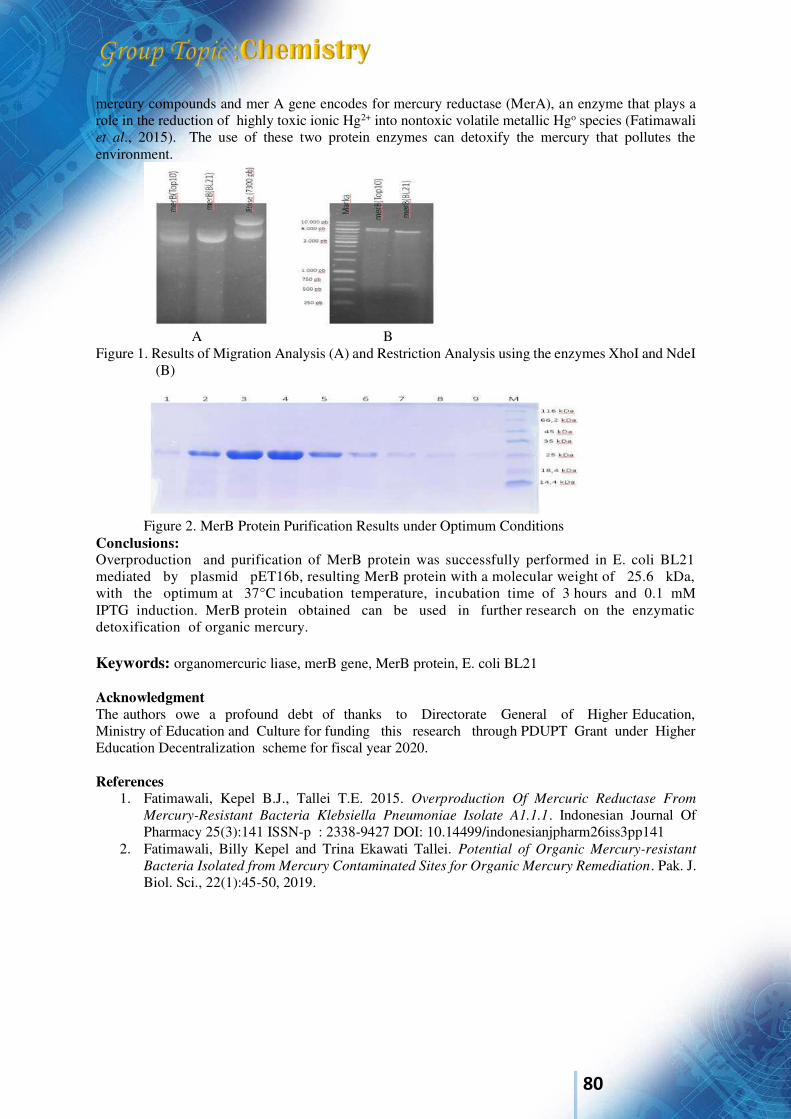
80
mercury compounds and mer A gene encodes for mercury reductase (MerA), an enzyme that plays a role in the reduction of highly toxic ionic Hg2+ into nontoxic volatile metallic Hgo species (Fatimawali et al., 2015). The use of these two protein enzymes can detoxify the mercury that pollutes the environment.
A B Figure 1. Results of Migration Analysis (A) and Restriction Analysis using the enzymes XhoI and NdeI
(B)
Figure 2. MerB Protein Purification Results under Optimum Conditions Conclusions: Overproduction and purification of MerB protein was successfully performed in E. coli BL21 mediated by plasmid pET16b, resulting MerB protein with a molecular weight of 25.6 kDa, with the optimum at 37°C incubation temperature, incubation time of 3 hours and 0.1 mM IPTG induction. MerB protein obtained can be used in further research on the enzymatic detoxification of organic mercury. Keywords: organomercuric liase, merB gene, MerB protein, E. coli BL21 Acknowledgment The authors owe a profound debt of thanks to Directorate General of Higher Education, Ministry of Education and Culture for funding this research through PDUPT Grant under Higher Education Decentralization scheme for fiscal year 2020. References
1. Fatimawali, Kepel B.J., Tallei T.E. 2015. Overproduction Of Mercuric Reductase From
Mercury-Resistant Bacteria Klebsiella Pneumoniae Isolate A1.1.1. Indonesian Journal Of Pharmacy 25(3):141 ISSN-p : 2338-9427 DOI: 10.14499/indonesianjpharm26iss3pp141
2. Fatimawali, Billy Kepel and Trina Ekawati Tallei. Potential of Organic Mercury-resistant
Bacteria Isolated from Mercury Contaminated Sites for Organic Mercury Remediation. Pak. J. Biol. Sci., 22(1):45-50, 2019.
81
International Conference on Natural Sciences, Mathematics, Applications, Research, and Technology
Manado, Indonesia, 22-23 October 2020
Identification of Phenolic Compounds and Tests Antioxidant Activity from the Extract of Some Fractions Broken-bones Plants (Euphorbia
tirucalli L.) Meiske S. Sangi*1, Julius Pontoh2 and Farha N.J. Dapas3
1, 2Department of Chemistry, Universitas Sam Ratulangi, Indonesia (E-mail: [email protected], [email protected]) 3Department of Biology, Universitas Sam Ratulangi, Indonesia (E-mail: [email protected]) INTRODUCTION Antioxidants are substances that can prevent and retard the oxidation process. Antioxidants have a function in repairing body cells that are damaged by free radicals. One source of natural antioxidants is phenolic compounds from plants. Some literature shows that phenolic compounds in plants have the potential to reduce the risk of heart disease, ageing and cancer. In addition, antioxidants have various pharmacological effects such as anti-inflammatory, anticancer, antibacterial, and antiviral [1]. One of the medicinal plants used by the community is the Broken-bones (Ephorbia tirucalli L.) plant which is one of the species of the family Euphorbiaceae. According to information from the Bitung society, this broken-bones plant is a medicinal plant used empirically to treat fractures due to accidents or fall accidently. The way to use it, plant stems finely ground and placed on the affected area. Broken-bones can also be used as an anticancer, anti-tumor, anti-inflammatory, skin disease, and treatment of syphilis [2]. According to Absor et al. (2006) [3], broken-bones branches have antibacterial activity against the bacteria Bacillus subtilis, Staphylococcus aureus, Escherichia coli, and Pseudomonas
aeruginosa. Furthermore, the results of preliminary research [4] phytochemical tests on broken-bone plants ethanol extracts found that it is containing flavonoids, steroids and tannins. To trace important compounds found in broken bones that are beneficial to health and function as medicine, further research is needed regarding the content of secondary metabolites, namely phenolic compounds that are active as antioxidants. The method used to test the antioxidant activity of medicinal plants is the test method using the 1,1-diphenyl-2-picrylhydrazyl (DPPH) method. Furthermore, the active fraction from the extracted samples were separated and purified to obtain pure active isolates and then determined the structure of the compounds as antioxidants through UV-Vis, IR, 1H-NMR dan 13C-NMR spectroscopic analysis. Based on the background above, the purposes of this study are extraction and fractionation of fracture plants with various types of solvents, determination of the total phenolic content in extracts from prospective fractions of fracture plants, determination of antioxidant activity with DPPH method, and determination of the compound structure of pure isolate fraction by UV-Vis, IR, MS, 1H-NMR and 13C-NMR spectroscopy.
82
RESULTS AND DISCUSSION The results showed as follows: - The yield of 32% ethanol extract fractures is brown, 38% ethyl acetate fraction is brown, 16%
hexane fraction is a brownish yellow, and 14% water fraction is brownish yellow - The highest total phenolic content was found from the water fraction 117.97 mg/mL followed by
the hexane, the ethyl acetate, and ethanol extract, respectively. - The IC50 which showed the most effective at counteracting free radicals by 50% was shown from
hexane fraction with the value of 17.04 µg/mL, while water extract was 17.07 µg/mL, and ethanol extract was 24.44 µg/mL. However, the ethyl acetate fraction was not effective.
- The results of the pure isolates of active fractions against antioxidants analyzed by UV-Vis, IR, 1H-NMR and 13C-NMR spectroscopy from broken-bone was obtained as triterpenoid compound structures, namely Euphol.
Keywords: antioxidant, phenolic compounds, broken-bones plant, Euphorbia tirucalli. Acknowledgment This research was funded by RDUU Research grant by DIPA Universitas Sam Ratulangi, Ministry of Research, Technology and Higher Education No.: SP DIPA - 042.01.2.400959/2019, December 5, 2018. References
1. Xu, D., Li, Y., Meng, X., Zhou, T., Zhou, Y., Zheng, J., Li, H. (2017). Natural antioxidants in foods and medicinal plants: Extraction, assessment and resources. International Journal of Molecular Sciences, 18 (96), 1-32.
2. Agral, O., Fatimawali., Yamlean, P. and Supriati, H.S. 2013. Formulation and Feasibility Test of Anti-Inflammatory Fracture Cream of Bone Broken Plants (Euphorbia tirucalli L.). Pharmacon Pharmaceutical Scientific Journal - UNSRAT. 2: 1-3.
3. Absor, U. 2006. Antibacterial Activity of Bone Broken Branches (Euphorbia tirucalli. Linn). [thesis]. FMIPA. Bogor.
4. Baud, GS, Sangi, MS Koleangan, HSJ. 2014. Analysis of Secondary Metabolite Compounds and Toxicity Tests of Ethanol Extracts of Broken Bone Stems (Euphorbia tirucalli L.) Using the Brine Shrimp Lethality Test (BSLT) Journal of Scientific Science (JIS), p -ISSN: 1412 - 3770; e-ISSN: 2540 - 9840, Vol 14, No.2.
83
International Conference on Natural Sciences, Mathematics, Applications, Research, and Technology
Manado, Indonesia, 22-23 October 2020
Increase In Maize Farm Income And Competitiveness In Allocating Labor In North Sulawesi Jefny B. Markus Rawung*1, Jantje G. Kindangen2, Rita Indrasti3 and Supratman Sirih4 1, 2, 4 The Assessment Institute for Agricultural Technology of North Sulawesi, Manado, INDONESIA. (Email: [email protected]; [email protected]; [email protected] ) 3 Centre of Assessment and Technology Agricultural Development, Bogor, West Java. INDONESIA (Email: [email protected] ) ABSTRACT This study aims to find the feasibility of a corn farming management system for consumption and seed production as well as the competitiveness of labor allocation in the management of corn farming. The research was conducted in Bolaang Mongondow and Southeast Minahasa, North Sulawesi Province in 2017, using survey and group discussion (FGD) methods. Data analysis was carried out using the approach of acceptance value, profit, financial feasibility, and real labor reward. The results showed that the management of the maize farming system for consumption maize production included traditional (10%), semi-intensive (80%), and intensive (10%) businesses. The three management systems for consumption maize farming in Southeast Minahasa and Bolaang Mongondow districts show that this business was relatively profitable but not optimal. In corn farming, the production of self-supporting business, input and soil processing assistance and self-help subsidies for prices in Southeast Minahasa District shows that the corn seed breeding business was feasible and provides optimal benefits. The real reward allocation for labor in 3 management systems for consumption corn farming only for intensive farming in Southeast Minahasa was greater than the real wage value of IDR 75,000/working day people (HOK). Meanwhile, in the breeding business, the real reward for labor was greater than the real wage value. The indication was that the labor allocated for the management of the seed breeding business was more competitived than the labor allocation for consumption corn farming. In seed breeding, the allocation of labor can be competitived with the value of wages in the industrial and service sectors. Keywords: Competitiveness, corn seed breeding, , financial feasibility, labor allocation, maize
farming INTRODUCTION
The corn commodity is an important and strategic food crop commodity in the development of the agricultural sector, especially to meet the growing needs for food and animal feed. The demand for corn from year to year continues to increase, as a result of not achieving self-sufficiency there has been a significant import of corn so far. In order to meet the demand for maize, since 2015 the government has launched efforts to increase maize production through many programs such as expanding the planting area in a number of potential areas, as well as encouraging farmers to use superior quality seeds. Almost all of the development of maize in North Sulawesi is cultivated on dry land, with a production of less than 4 tonnes / ha / planting season. while the production achievements of farmers who apply technology through the SL-PTT program are around 6-8 tonnes / ha / planting season. Debaeke and Aboudrare (2004) state that the constraints in the use of dry land include limited water availability, relatively low soil fertility and short and erratic rainy season periods. This condition affects the growth of plants with low yields (Abdurachman et al., 2008; Mulyani and Hidayat, 2009). The corn commodity development program has increased productivity by around 0.5 - 2 tonnes / ha / planting season. This productivity
84
gap is not only due to the limited use of superior seeds for farmers, but also due to the limited labor allocation and the high cost of rental labor.
To accelerate the spread of corn seeds, successful distribution through local seed captivity is needed. Hidajat and Saenong (2007) state that if captivity is carried out around the user, the exact number of seeds and corn varieties needed can be planned, so that captivity can be carried out properly. The research objective was to determine the feasibility of a management system for corn consumption and seed production as well as the competitiveness of labor allocation in the management of corn farming. RESULTS AND DISCUSSION In general, the application of the maize farming system has not applied the recommended technology. As a result, productivity gains are still low, only around 2-3 tonnes / ha / planting season. The application of the maize farming system in corn development centers is more dominant (60-65%) by monoculture, the rest is polyculture which is mostly cultivated in the area of coconut trees. farming systems, namely traditional farming systems (8.33%), semi intensive farming systems (83.33%) and intensive farming systems (8.33%). The results of the evaluation of farm performance in farming management through the use of input and production results show that there are 3 categories of farming systems, namely traditional farming systems (8.33%), semi-intensive farming systems (83.33%) and intensive farming systems (8.33%). %). Feriyanto (2014) states that the real wages of workers are a reflection of the decreasing purchasing power of workers, the main factor causing the low real wages of workers is due to, among others, the low level of ability (skill) of workers. Real labor rewards like this if the farmers persist with the farming system, each month the farmers will get an income below the UMP (provincial minimum wage).
References
1. Abdurachman, A., A. Dariah, dan A. Mulyani. 2008. Strategi dan teknologi lahan kering mendukung pangan nasional. Jurnal Penelitian dan Pengembangan Pertanian. 27(2):43-48.
2. Debaeke, P., and Aboudrare, A., 2004. Adaption of crop management to water-limeted enviroments. European Journal of Agronomy, 21:433-446.
3. Ferianto, N. 2014. Ekonomi sumber daya manusia, Dalam perspektif Indonesia, UPP STIM YKPN. 250 p
4. Mulyani, A. dan Hidayat. 2009. Peningkatan kapasitas produksi tanaman pangan pada lahan kering. Jurnal Sumberdaya Lahan Pertanian. Vol. 3(2):73-84.
5. Sarasutha, 2002. Kinerja Usahatani dan Pemasaran Jagung di Sentra Produksi. Jurnal Litbang Pertanian 21(2)
6. Saenong, S.M. dan S. Mas’ud. 2009. Keragaan hasil teknologi pengelolaan hama kumbang bubuk pada tanaman jagung dan sorgum. Prosiding Nasional Serealia, Balai Penelitian Tanaman Serealia, Maros.
7. Zubachtirodin, M.S. Pobbage, dan Subandi., 2007. Wilayah produksi dan potensi pengembangan jagung. Jagung, Teknik Produksi dan Pengembangan. Pusat Penelitian dan Pengembangan Tanaman Pangan. p 462 – 473.
85
International Conference on Natural Sciences, Mathematics, Applications, Research, and Technology
Manado, Indonesia, 22-23 October 2020
Training and Implementation of Socio-Cultural Oriented Ergo-Entrepreneurship to Improve Entrepreneurship Attitudes and Health Quality of Serati Banten in Peliatan Village Ubud Gianyar Bali I Made Sutajaya1), Desak Made Citrawathi2), and I Wayan Sukra Warpala3) 1,2,3) Department of Biology and Marine Fisheries Faculty of Mathematics and Natural Sciences, Ganesha University of Education, Bali-Indonesia (E-mail: [email protected])
INTRODUCTION The household industry in the form of manufacturing and selling religious ceremony facilities in Bali is now increasingly being cultivated by people who have expertise in this field. Along with the times, it turns out that people have a tendency to buy ceremonial facilities instead of making their own, because they are considered to be much more effective and more efficient, especially for those who really don't know how to make them. This opportunity is used by the Serati Banten (offerings craftsmen) who have special expertise in making Hindu religious ceremonies. The Serati
Banten have now formed a traditional household business group. Management which is very simple in nature generally does not take into account the ratio of profits to costs incurred. Their ignorance of these calculations made the business less developed, and even often suffered losses. For this reason, it is necessary to provide ergonomics-oriented entrepreneurship training called ergo-entrepreneurship. The aim is to improve the entrepreneurial attitude and quality of their health of Serati Banten. The health elements that need to be trained for Serati Banten are regarding workload and musculoskeletal complaints which have implications for the health of muscles and joints, the nervous system, and the cardiovascular system 1. Muscle and joint health can be maintained by always moving dynamically and training the musculoskeletal system 2, 3, 4. Through a systemic, holistic, interdisciplinary and participatory approach (SHIP), a healthy, safe, and comfortable environment will be created and physiologically does not cause musculoskeletal complaints, does not result in too heavy workloads and can slow down the appearance of fatigue and increase job satisfaction 5, 6, 7, 8, 9, 10. The application of ergonomics which strives for a person to always be in a healthy, safe, and comfortable condition, and free from stressful conditions in their activities is an urgent matter to be implemented and should be implemented as soon as possible 5,11, 12, 13. RESULTS AND DISCUSSION The empowerment of Serati Banten through training and implementation of ergo-entrepreneurship with a socio-cultural orientation can actually increase entrepreneurial attitudes by 45.9%. Socio -cultural orientation should be used as a whip for them to work better and more professionally so that their income can be increased. These findings are in synergy with the results of previous studies, namely: (1) 14found that the implementation of Tri Hita Karana with a Socio-Cultural Ergonomic orientation turned out to increase public awareness of the quality of their health by 31.09%, clean and healthy living habits by 27.39%, and public awareness to develop cultural tourism by 21.65. %, (2) 15 found that there was a significant increase in people's understanding of socio-cultural ergonomics by 38.21% and the synergy of Tri Kaya Parisudha with educational ergonomics by 32.35%, (3) 16 found that the implementation of Tri Mandala-oriented ergo-tourism can support rurung tourism in Peliatan Village Ubud, Gianyar Bali, one of which is to improve the entrepreneurial attitude of angkul-angkul culinary traders who sell in the Banjar Bucu area, (4) 17 found that improvements to ergonomics-oriented work mechanisms can increase the productivity of workers who make ceremonies by 53.93%, one of which is a result of the entrepreneurial attitude

86
of workers, and (5) 18 found that providing snacks and active rest can increase work motivation by 28.20 %, and the productivity of jaja gipang makers is 23.31%, one of which is caused by the high entrepreneurial attitude of the workers. Empowerment of Serati Banten can actually improve the quality of their health as seen from their decreased workload by 5.9%. These findings are in synergy with the results of previous studies, namely: (1) 18 found that providing snacks and active rest reduces fatigue by 27.27%, one of which is due to the success of workers in overcoming their workload, (2) 17 found that the mechanism of action was repair oriented ergonomics reduces work stress for workers making ceremonies by 29.90%, one of which is due to the success of workers in overcoming their workload, and (3) 19 found that the implementation of the Tri Datu program oriented to Ergo-entrepreneurship through training can be used as a way to track the quality of health seen from the increase in the workload of the community by 33.18% and fatigue by 54.17%. Empowerment of Serati Banten was able to improve the quality of her health as seen from her musculoskeletal complaints which decreased by 12.2%. These findings are in synergy with the results of previous research, namely: (1) 17 found that improving ergonomics-oriented work mechanisms can reduce musculoskeletal complaints of workers making upakara devices by 44.45%, (2) 19 found that the implementation of the Tri Datu program with Ergo-entrepreneurship oriented through training can be used as a way to trace the quality of health seen from an increase in community musculoskeletal complaints by 44.09%, and (3) 20 found that community empowerment through ergo-entrepreneurship training can improve health quality Significantly (p <0.05) seen from the decrease in musculoskeletal complaints of sculptor by 24.25%. Keywords: Ergo-entrepreneurship, Health Quality, Home Industry, and Entrepreneurial Attitudes Acknowledgment: this article is the result of community service recognized by the Undiksha Community Service Institute References
1. Sutajaya, I M. 2018. Ergonomi. Rajawali Pers, PT. Rajagrafindo Persada: Depok 2. Barro, D., Olinto, M. T. A., Macagnan, J. B. A., Henn, R.L., Pattussi, M. P., Faoro, M. W.,
Garcez, A. S. and Paniz, V. M. V. 2015. Job Characteristics and Musculoskeletal Pain among Shift Workers of a Poultry Processing Plant in Southern Brazil. Journal of Occupational
Health; 57: 448–456 3. Paksaichol, A., Lawsirirat, C. and Janwantanakul, P. 2015. Contribution of Biopsychosocial
Risk Factors to Nonspecific Neck Pain in Office Workers: A Path Analysis Model. Journal of
Occupational Health; 57: 100–109 4. Dianat, I. and Karimi, M.Ali. 2016. Musculoskeletal Symptoms among Handicraft Workers
Engaged in Hand Sewing Tasks. Journal of Occupational Health; 58: 644-652 5. Manuaba, A. 2015. Total Ergonomic Approach to Anticipate Multidimensional Development
Problems. Ergonomic Seminar 2015. Bali Udayana University. 6. Bahri, Salim, J., Susihono, W. 2013. Perbaikan Postur Kerja dengan Pendekatan Metode RULA
dan NIOSH di Bagian Produksi Mixer. Jurnal Teknik Industri, Vol. 1 No. 1, Maret 2013, pp 77-87. ISSN 2302-495X.
7. Tanjung, S. 2015. Analisis Postur Kerja untuk Mengurangi Risiko Muskuloskeletal Disorders Menggunakan Metode Rapid Upper Limb Assessment (RULA). Jurnal Ilmiah Universitas
Bakrie. Vol. 3. No. 3. Agustus. 8. Mokaya, S.O., Musau, J.L., Wagoki, J., Karanja, K., 2013. Effects of Organizational Work
Conditions on Employee Job Satisfaction in The Hotel Industry in Kenya. International
Journal of Arts and Commerce Vol.2. No.2. February. 9. Jayaweera, T. 2014. Impact of Work Environmental Factors on Job Performance, Mediating
Role of Work Motivation: A Study of Hotel Sector in England. International Journal of
Business and Management. Vol. 10.No. 3; ISSN 1833-3850 E-ISSN 1833-8119. Publish by Canadian Center of Science ad Education.
87
10. Ansari, N.A., Shende, P.N., Sheikh, M.J., Vaidya, R.D. 2013. Study and Justification of Body Posture of Workers Working in SSI by Using REBA. International Journal of Engineering and
Advanced Technology (IJEAT) ISSN: 2249-8958, Vol. 2, Issue 3. February. 11. Hsieh, Y., Apostolopoulos, Y, and Sonmez, S., 2013. World at Work: Hotel Cleanerss.
Occupational and Environmental Medicine Journal. 70(5) pp. 360-364. 12. Marchelia, V. 2014. Stres Kerja Ditinjau dari Shift Kerja pada Karyawan. Jurnal Ilmiah
Psikologi Terapan. ISSN: 2301-8267. Vol. 02. No. 01. Januari. 13. Agyemang, C.B., Nyanyofio, J.G. Gyamfi, G.D., 2014. Job, Stress, Sector of Work, and Shift-
Work Pattern as Correlates of Worker Health and Safety: A Study of a Manufacturing Company in Ghana. International Journal of Business and Management: Vol.9, No. 7: 2014. ISSN 1833-
3850 E-ISSN 1833-8119. Publish by Canadian Center of Science and Education. 14. Sutajaya, I M., Sukra Warpala, W., Oka Riawan, I M. dan Sri Ratna Dewi N. P., 2020.
Implementation of Tri Hita Karana with Socio-Cultural Ergonomic Oriented on the Kecak Dance Performance to Improve Community Health and Supporting Cultural Tourism in Peliatan Ubud Gianyar. Journal of Physics: Conference Series 1503 (2020) 012053 IOP Publishing doi:10.1088/1742-6596/1503/1/012053
15. Sutajaya, I M, Candiasa, I M, Sri Arnita, N. P,, dan Mia Lestari Devi, N.L.P. 2019. Implementasi Sinergitas Tri Kaya Parisudha dengan Ergonomi Pendidikan untuk Meningkatkan Pemahaman Masyarakat terhadap Socio-Cultural Ergonomic. Prosiding
Seminar Nasional 2019 Perhimpunan Ergonomi Indonesia. ISBN 978-623-92057-0-6. Surabaya.
16. Arnita, N.P. S, Sutajaya, I.M. dan Mia Lestari Devi, N.L.P. 2019. Implementasi Ergotourism Berorientasi Tri Mandala untuk Menunjang Wisata Rurung di Desa Peliatan Ubud Gianyar. Prosiding Seminar Nasional 2019 Perhimpunan Ergonomi Indonesia. ISBN 978-623-92057-0-6. Surabaya.
17. Arnita, N.P.S. 2020. Perbaikan Mekanisme Kerja Berorientasi Ergonomi Mengurangi Keluhan Muskuloskeletal dan Stres Kerja serta Meningkatkan Produktivitas Pekerja Pembuat Piranti Upakara di Desa Peliatan Ubud Gianyar. Tesis. Program Pascasarjana Program Studi S2 Ergonomi Fisiologi Kerja Universitas Udayana.
18. Mia, N.L.P. L.D. 2020. Pemberian Istirahat Aktif dan Kudapan Mengurangi Kelelahan dan Meningkatkan Motivasi Kerja serta Produktivitas Pembuat Jaja Gipang di Desa Sading Mengwi Badung. Tesis. Program Pascasarjana Program Studi S2 Ergonomi Fisiologi Kerja Universitas Udayana.
19. Sutajaya, I M. dan Ristiati, N.P. 2019. Implementasi Tri Datu Berorientasi Ergo-Entrepreneurship untuk Menunjang Wisata Rurung dan Meningkatkan Kualitas Kesehatan Sikap Kewirausahaan dan Kepedulian Masyarakat terhadap Kondisi Lingkungan di Desa Peliatan Ubud Gianyar. Laporan Penelitian Unggulan Perguruan Tinggi. Universitas Pendidikan Ganesha.
20. Sutajaya, I M. dan Arnyana, I.B.P. 2018. Pemberdayaan Masyarakat Melalui Pelatihan Ergo-Entrepreneurship untuk Meningkatkan Kualitas Kesehatan dan Sikap Kewirausahaan Pematung di Gianyar Bali. Laporan Penelitian Stategis Nasional. Universitas Pendidikan Ganesha.
88
International Conference on Natural Sciences, Mathematics, Applications, Research, and Technology
Manado, Indonesia, 22-23 October 2020
Bioprospecting of Culturable Endophytic Bacteria of Mangrove Plants in Manado, North Sulawesi as Potential Producers of Enzymes Agustina Monalisa Tangapo*1, Febby Ester Fany Kandou1 and Pience Veralyn Maabuat1
1Biology Department, Faculty of Mathematic and Natural Sciences, Sam Ratulangi University, INDONESIA. (E-mail: [email protected]; [email protected]; [email protected]) INTRODUCTION Endophytes are microorganisms that colonize the intercellular space in the plant tissues, without causing any harm to the particular plant (Schulz and Boyle, 2006). They are ubiquitous and colonize in almost all plants. Each plant is considered to be a host for one or more of these endophytes. They exhibit complex interactions with their hosts which involves mutualism or commensalisms (Ryan et al., 2008). Endophytes produce several compounds that promote growth of plants. Their diversity depends on the species of plant, age of the plant, and the climatic condition of a particular region (Compant et al., 2010). Improvement of endophytes resources could bring us a variety of benefits, such as novel bioactive compounds. Mangrove is vegetation lives in the coastal ecosystem of the tropics and subtropics area. This ecosystem is rich in organic matter. Mangroves are among the most productive ecosystems. The mangroves ecosystem has very high floral, faunal, and microbial diversity. In Indonesia, mangroves are the most extensive mangrove forest in the world, both regarding area (± 42,550 km2) and the number of mangroves species (± 45 species) (Bengen, 2001). This study aimed to isolate endophytic bacteria and to screening the endophtytic bacteria of mangrove which able to produce amylase, cellulose, protease, and gelatinase enzyme. This research was conducted with several stages ie: sampling and sample preparation, isolation and characterization endophytic bacteria, and evaluation of enzyme production such as amylase, protease, cellulose and gelatinase. . RESULTS AND DISCUSSION In our study, leaves sample of mangrove were collected from three areas: Mangrove Park Bahowo, Tongkaina; Meras; and Molas Manado. The samples were taken aseptically from the sampling site transferred and processed immediately in the lab for the isolation of endophytic bacteria. The samples were serially diluted and spread plated on agar. Further colonies were purified on nutrient agar plates and screening for enzymatic activity. All bacterial isolates were studied for their morphological characteristics viz. shape, color, elevation and margin. The results obtained the endophytic bacteria isolates were able to produce amylase, cellulose, protease and gelatinase (Fig.1). The selected isolates in our study exhibited high hydrolytic enzyme activity in substrate amended agar. The isolates were preliminary identified on the basis of their morphology and biochemical characters. The present study reported that these bacterial isolates have the ability to produce extracellular enzymes. Therefore the untapped resources like mangrove ecosystem have gained greatest importance in discovering new sources of enzymes and other economically valuable natural products.
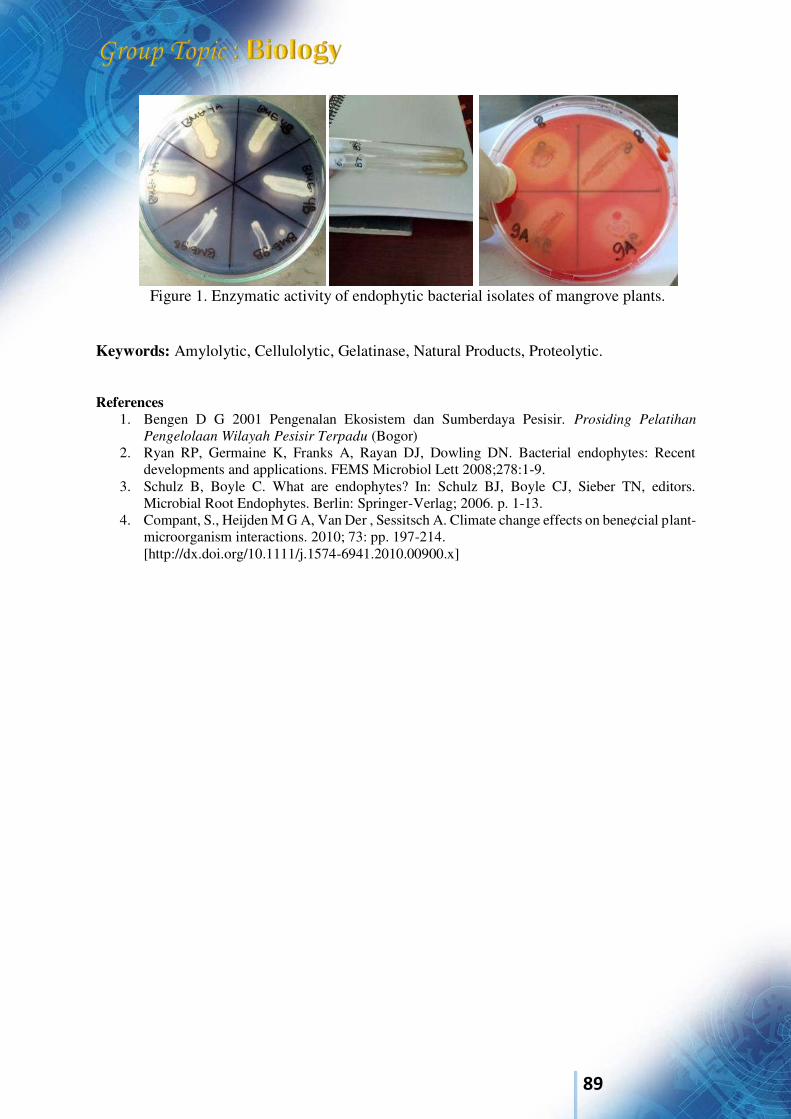
89
Figure 1. Enzymatic activity of endophytic bacterial isolates of mangrove plants.
Keywords: Amylolytic, Cellulolytic, Gelatinase, Natural Products, Proteolytic. References
1. Bengen D G 2001 Pengenalan Ekosistem dan Sumberdaya Pesisir. Prosiding Pelatihan
Pengelolaan Wilayah Pesisir Terpadu (Bogor) 2. Ryan RP, Germaine K, Franks A, Rayan DJ, Dowling DN. Bacterial endophytes: Recent
developments and applications. FEMS Microbiol Lett 2008;278:1-9. 3. Schulz B, Boyle C. What are endophytes? In: Schulz BJ, Boyle CJ, Sieber TN, editors.
Microbial Root Endophytes. Berlin: Springer-Verlag; 2006. p. 1-13. 4. Compant, S., Heijden M G A, Van Der , Sessitsch A. Climate change effects on bene¢cial plant-
microorganism interactions. 2010; 73: pp. 197-214. [http://dx.doi.org/10.1111/j.1574-6941.2010.00900.x]
90
International Conference on Natural Sciences, Mathematics, Applications, Research, and Technology
Manado, Indonesia, 22-23 October 2020
Molecular-based Inhibition of SAR-CoV-2 RNA-dependent RNA Polymerase Using Some Peptides of The Marine Microbial Symbionts I.F.M. Rumengan*1, H.A. Luntungan2 and J. Posangi3
1’Departmen of Marine Science, Faculty of Fisheries and Marine Science, Sam Ratulangi University, INDONESIA. (E-mail: [email protected]) 2Health Department, North Sulawesi Province, INDONESIA. (E-mail: [email protected]) 3Departmen of Pharmacology and Therapy, Medical School of Sam Ratulangi University, INDONESIA. (E-mail: [email protected]) INTRODUCTION The rapid escalation of COVID-19 within three months after the outbreak began in Wuhan, China, has pursued WHO to announce the pandemic Covid-19 on March 12, 2020. The causative agent is very contagious, and was named as SAR-CoV-2. Therapeutic agents are obviously in desperate need, as a consequency it is important to fully comprehend the molecular structure and function of the virus. This virus is an RNA-based genome (30 kb) encoding four main structural proteins (33%) and nonstructural proteins (67%) (1). One of the non structural proteins is RNA-dependent RNA polymerase (RdRP) which catalyzes the viral RNA replication and transcription process (2). Therefore, this enzyme is considered as a promising target for developing drug candidates. The purpose of this study is to develop anti-SAR-CoV-2 agents by computer simulation to inhibit the SAR-CoV-2 polymerase using peptides of the marine microbial symbionts. The chosen peptides as main ligands are ulithiacyclamide, patellamide F, C, A and E, naturally produced by microbes that associated with ascidian Tunicates especially Prochloron didemni (3). This microbe has been reported found in Manado Bay North Sulawesi (4), culturable away from its host (5) and producing cytotoxic agents (6). As comparative ligands, remdesevir as a nucleotide analogous drug (1), chloroquin and some phytochemicals are used. In this study the RdRP as a receptor was downloaded from www.rcsb.org (PDB 7BW4) where was deposited by Peng and co-workers (7), and the ligands from www.pubchem.ncbi.nlm.nih.gov/. RESULTS AND DISCUSSION The results of molecular-based inhibition of the viral RdRP using peptides produced by marine microbial symbionts along with the suggested drugs for COVID-19, remdesevir and some therapeutic agents (lauric acid, citric acid, xanthon and chloroquine) are shown in Table 1. The intermolecular interaction present in the compounds are indicated in the calculated negative Gibbs free energy (∆G) as affinity scores. The stronger affinity is associated with the lower ∆G scores. Among the main ligands, patellamide F shows the strongest interaction (−17.6 kcal/mol) with the RdRP as target molecule. All main ligands have shown stronger affinity toward RdRP than those of remdesevir, chloroquin and the phytochemicals. The recent study provides promising insight for developing natural drug candidates against covid-19 produced by marine microbes that associated with ascidian Tunicate. Its implication in drug discovery should be elaborated with more molecular-dynamics study along with metabolic engineering approach to ensure the mechanisms of inhibition.
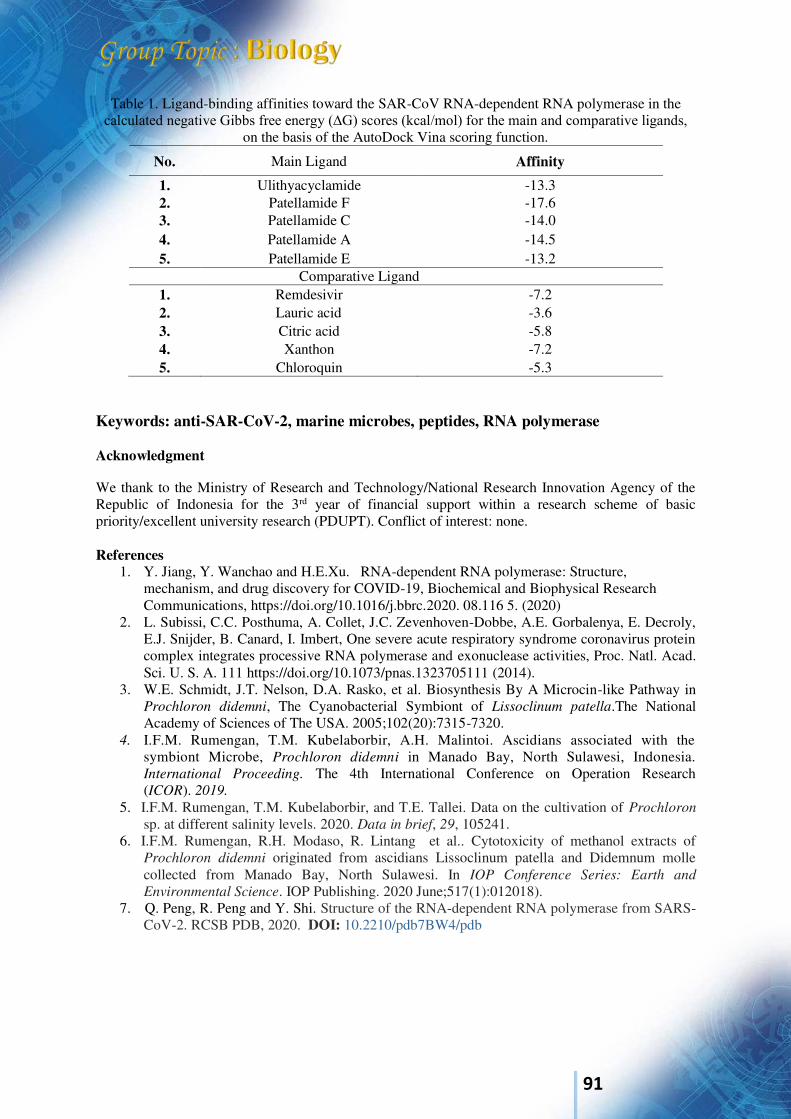
91
Table 1. Ligand-binding affinities toward the SAR-CoV RNA-dependent RNA polymerase in the calculated negative Gibbs free energy (∆G) scores (kcal/mol) for the main and comparative ligands,
on the basis of the AutoDock Vina scoring function.
No. Main Ligand Affinity
1. Ulithyacyclamide -13.3 2. Patellamide F -17.6 3. Patellamide C -14.0 4. Patellamide A -14.5 5. Patellamide E -13.2
Comparative Ligand 1. Remdesivir -7.2 2. Lauric acid -3.6 3. Citric acid -5.8 4. Xanthon -7.2 5. Chloroquin -5.3
Keywords: anti-SAR-CoV-2, marine microbes, peptides, RNA polymerase Acknowledgment We thank to the Ministry of Research and Technology/National Research Innovation Agency of the Republic of Indonesia for the 3rd year of financial support within a research scheme of basic priority/excellent university research (PDUPT). Conflict of interest: none. References
1. Y. Jiang, Y. Wanchao and H.E.Xu. RNA-dependent RNA polymerase: Structure, mechanism, and drug discovery for COVID-19, Biochemical and Biophysical Research Communications, https://doi.org/10.1016/j.bbrc.2020. 08.116 5. (2020)
2. L. Subissi, C.C. Posthuma, A. Collet, J.C. Zevenhoven-Dobbe, A.E. Gorbalenya, E. Decroly, E.J. Snijder, B. Canard, I. Imbert, One severe acute respiratory syndrome coronavirus protein complex integrates processive RNA polymerase and exonuclease activities, Proc. Natl. Acad. Sci. U. S. A. 111 https://doi.org/10.1073/pnas.1323705111 (2014).
3. W.E. Schmidt, J.T. Nelson, D.A. Rasko, et al. Biosynthesis By A Microcin-like Pathway in Prochloron didemni, The Cyanobacterial Symbiont of Lissoclinum patella.The National Academy of Sciences of The USA. 2005;102(20):7315-7320.
4. I.F.M. Rumengan, T.M. Kubelaborbir, A.H. Malintoi. Ascidians associated with the symbiont Microbe, Prochloron didemni in Manado Bay, North Sulawesi, Indonesia. International Proceeding. The 4th International Conference on Operation Research (ICOR). 2019.
5. I.F.M. Rumengan, T.M. Kubelaborbir, and T.E. Tallei. Data on the cultivation of Prochloron sp. at different salinity levels. 2020. Data in brief, 29, 105241.
6. I.F.M. Rumengan, R.H. Modaso, R. Lintang et al.. Cytotoxicity of methanol extracts of Prochloron didemni originated from ascidians Lissoclinum patella and Didemnum molle collected from Manado Bay, North Sulawesi. In IOP Conference Series: Earth and
Environmental Science. IOP Publishing. 2020 June;517(1):012018). 7. Q. Peng, R. Peng and Y. Shi. Structure of the RNA-dependent RNA polymerase from SARS-
CoV-2. RCSB PDB, 2020. DOI: 10.2210/pdb7BW4/pdb
92
International Conference on Natural Sciences, Mathematics, Applications, Research, and Technology
Manado, Indonesia, 22-23 October 2020
Existing Ascidian Species Associated with Photosynthetic Microbes in Manado Bay, North Sulawesi in 2020 I.F.M. Rumengan1, A. Malintoi2, M. Siby3, V. Warouw4 and A.B. Rondonuwu5 1-5Department of Aquatic Resources Management, Faculty of Fisheries and Marine Science, Sam Ratulangi University, INDONESIA (E-mail: [email protected]) 2 E-mail:[email protected]; 3 E-mail: [email protected]; 4 E-mail: [email protected]; 5 E-mail: [email protected]
INTRODUCTION Ascidians (Phylum: Chordata, sub-phyllum Tunicata,Class: Ascidiacea) are sessile organisms with more than 3000 species described (1). They inhabit diverse ecological niches, from shallow water to the deep sea (1), many of them associated with diverse microbial communities, including the prokaryotic photosynthetic microbes that produce potential biologically active compounds (2). In 2019, some species have been found in a shallow water in Malalayang Coast, Manado Bay, North Sulawesi (3), just behind the small restaurants along the coast. Their habitat is at risk to be anthrophogenically contaminated. Therefore, it is important to know the present condition of the ascidian community in the same location. This work aims at investigating the recent existing ascidian species associated with photosynthetic microbes in Manado Bay, North Sulawesi compared to those of 2019. Field surveys were performed on October 2020 in Malalayang Coast of the bay at 1o29’35N 124o50’28.54” E. RESULTS AND DISCUSSION Figure 1 shows the recent finding on the existing ascidian species in the study area. In this survey, by morphological identification (4) six species belong to Family Demdenidae were observed. They are Didemnum mole, Diplosoma simile, Lissoclinum bistratum, D. virens, Lissoclinum patella,
and Atriolum robustum. Microbial cell suspension was collected from the tunic of each species for further laboratory examination. The observed 4 species in recent survey (D. mole, L. patella, L. bistratum, and D. virens) were also observed in 2019 (3). The two species observed in 2020 (D. simile and A. robustum) were not detected in 2019. In turn two species (D. viridis,and Trididemnum cyclops) observed in 2019, were not detected in 2020. From ecological point of view, the unseen specimen at a certain period of survey does not meant to disappear. The field condition is dynamics, due to some environmental factors including weather condition. Certain bioecological phenomena, such as recruitment and species replacement might occurred along past one year. There are most possible 8 ascidian species with microbial symbionts occurring in the sampling area within 2019-2020. It is then remaining to confirm for future study in 2021. Annual data over five years would be necessary for confirmation the species occurrence especially for sessile organisms like ascidians. Interestingly, some microbial cells from the hosts, mainly L. patella were culturable in laborastory condition (5). The potential compounds synthesized from this association could be then explored for pharmaceutical purposes.
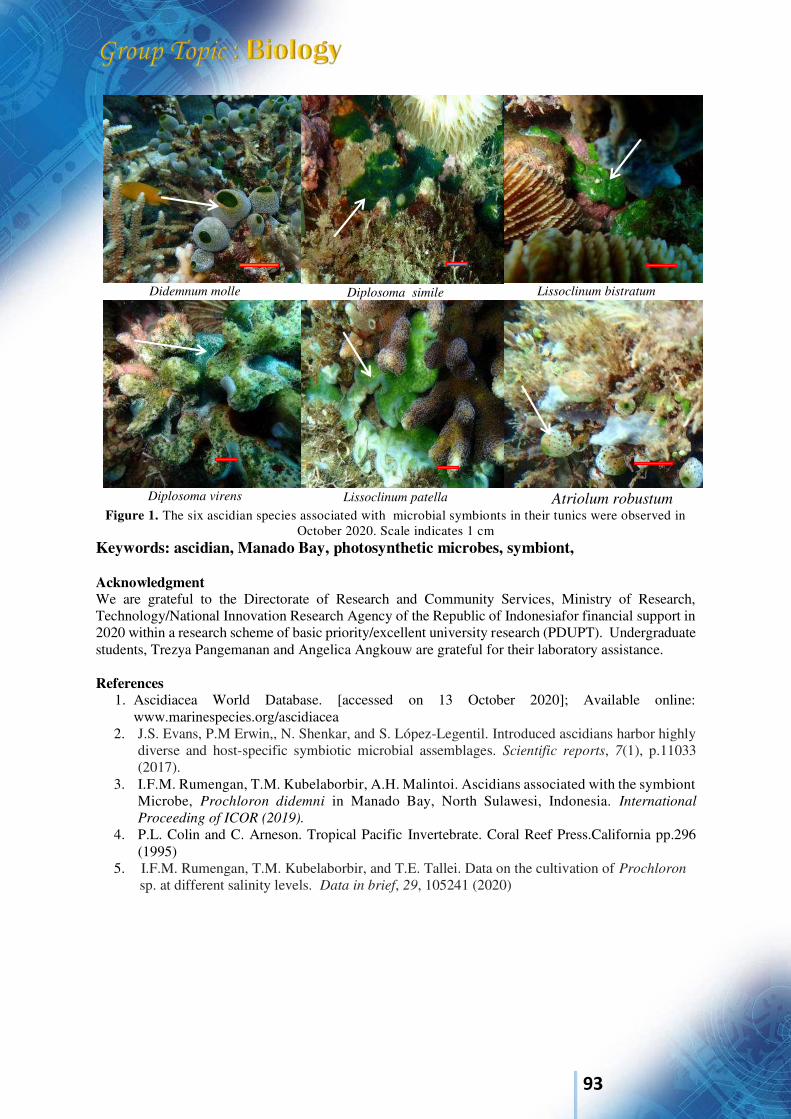
93
Didemnum molle Diplosoma simile Lissoclinum bistratum
Diplosoma virens Lissoclinum patella Atriolum robustum Figure 1. The six ascidian species associated with microbial symbionts in their tunics were observed in
October 2020. Scale indicates 1 cm Keywords: ascidian, Manado Bay, photosynthetic microbes, symbiont, Acknowledgment We are grateful to the Directorate of Research and Community Services, Ministry of Research, Technology/National Innovation Research Agency of the Republic of Indonesiafor financial support in 2020 within a research scheme of basic priority/excellent university research (PDUPT). Undergraduate students, Trezya Pangemanan and Angelica Angkouw are grateful for their laboratory assistance. References
1. Ascidiacea World Database. [accessed on 13 October 2020]; Available online: www.marinespecies.org/ascidiacea
2. J.S. Evans, P.M Erwin,, N. Shenkar, and S. López-Legentil. Introduced ascidians harbor highly diverse and host-specific symbiotic microbial assemblages. Scientific reports, 7(1), p.11033 (2017).
3. I.F.M. Rumengan, T.M. Kubelaborbir, A.H. Malintoi. Ascidians associated with the symbiont Microbe, Prochloron didemni in Manado Bay, North Sulawesi, Indonesia. International
Proceeding of ICOR (2019).
4. P.L. Colin and C. Arneson. Tropical Pacific Invertebrate. Coral Reef Press.California pp.296 (1995)
5. I.F.M. Rumengan, T.M. Kubelaborbir, and T.E. Tallei. Data on the cultivation of Prochloron sp. at different salinity levels. Data in brief, 29, 105241 (2020)
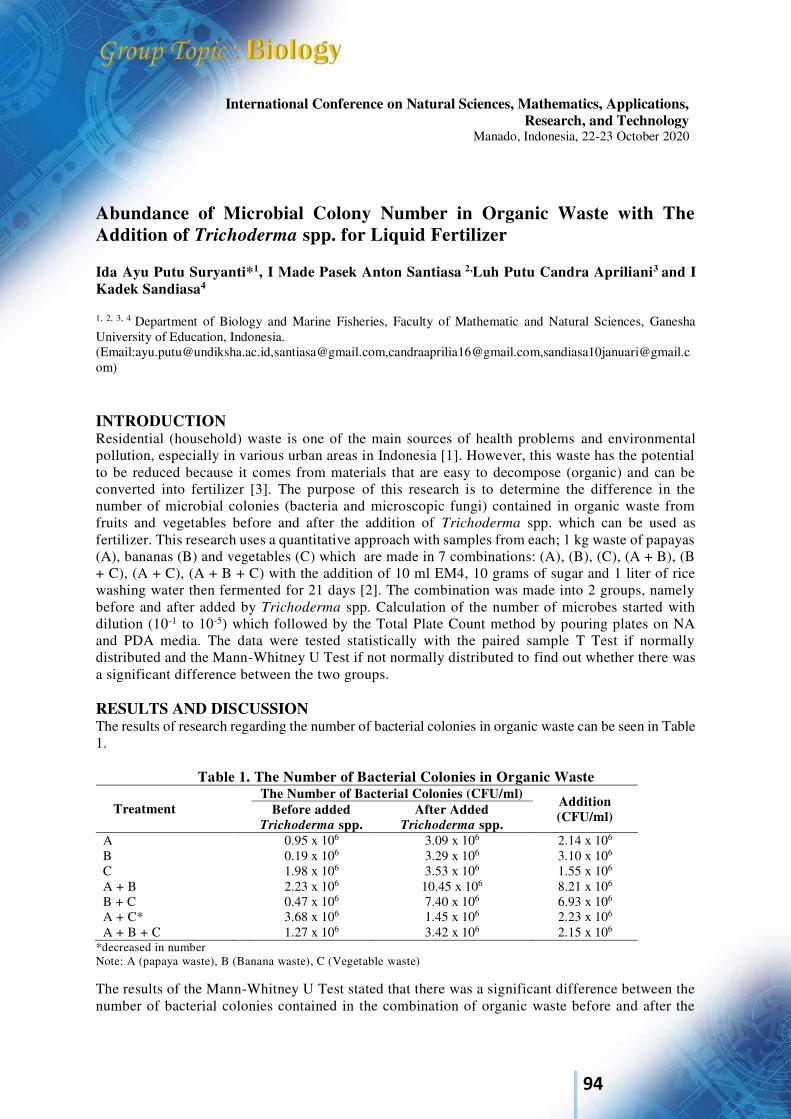
94
International Conference on Natural Sciences, Mathematics, Applications, Research, and Technology
Manado, Indonesia, 22-23 October 2020
Abundance of Microbial Colony Number in Organic Waste with The Addition of Trichoderma spp. for Liquid Fertilizer Ida Ayu Putu Suryanti*1, I Made Pasek Anton Santiasa 2,Luh Putu Candra Apriliani3 and I Kadek Sandiasa4
1, 2, 3, 4 Department of Biology and Marine Fisheries, Faculty of Mathematic and Natural Sciences, Ganesha University of Education, Indonesia. (Email:[email protected],[email protected],[email protected],[email protected]) INTRODUCTION Residential (household) waste is one of the main sources of health problems and environmental pollution, especially in various urban areas in Indonesia [1]. However, this waste has the potential to be reduced because it comes from materials that are easy to decompose (organic) and can be converted into fertilizer [3]. The purpose of this research is to determine the difference in the number of microbial colonies (bacteria and microscopic fungi) contained in organic waste from fruits and vegetables before and after the addition of Trichoderma spp. which can be used as fertilizer. This research uses a quantitative approach with samples from each; 1 kg waste of papayas (A), bananas (B) and vegetables (C) which are made in 7 combinations: (A), (B), (C), (A + B), (B + C), (A + C), (A + B + C) with the addition of 10 ml EM4, 10 grams of sugar and 1 liter of rice washing water then fermented for 21 days [2]. The combination was made into 2 groups, namely before and after added by Trichoderma spp. Calculation of the number of microbes started with dilution (10-1 to 10-5) which followed by the Total Plate Count method by pouring plates on NA and PDA media. The data were tested statistically with the paired sample T Test if normally distributed and the Mann-Whitney U Test if not normally distributed to find out whether there was a significant difference between the two groups. RESULTS AND DISCUSSION The results of research regarding the number of bacterial colonies in organic waste can be seen in Table 1.
Table 1. The Number of Bacterial Colonies in Organic Waste
Treatment The Number of Bacterial Colonies (CFU/ml)
Addition (CFU/ml) Before added
Trichoderma spp. After Added
Trichoderma spp. A 0.95 x 10⁶ 3.09 x 10⁶ 2.14 x 10⁶ B 0.19 x 10⁶ 3.29 x 10⁶ 3.10 x 10⁶ C 1.98 x 10⁶ 3.53 x 10⁶ 1.55 x 10⁶ A + B 2.23 x 10⁶ 10.45 x 10⁶ 8.21 x 10⁶ B + C 0.47 x 10⁶ 7.40 x 10⁶ 6.93 x 10⁶ A + C* 3.68 x 10⁶ 1.45 x 10⁶ 2.23 x 10⁶ A + B + C 1.27 x 10⁶ 3.42 x 10⁶ 2.15 x 10⁶
*decreased in number Note: A (papaya waste), B (Banana waste), C (Vegetable waste)
The results of the Mann-Whitney U Test stated that there was a significant difference between the number of bacterial colonies contained in the combination of organic waste before and after the
95
addition of Trichoderma spp. (70.57 %). The highest number of bacterial colonies was found in the combination of papaya and banana waste added by Trichoderma spp. i.e. 10.45 x 10⁶ CFU/ml. This was also supported by the increase in the largest number of colonies, namely 8.21 x 10 6 CFU/ml in this combination (Table 1).
Table 2 The Number of Microscopic Fungal Colonies in Organic Waste
Treatment The Number of Microscopic Fungus (CFU/ml)
Addition (CFU/ml) Before Added
Trichoderma spp. After Added Trichoderma
spp. A* 2.62 x 10⁶ 1.82 x 10⁶ 0.80 x 106 B* 3.41 x 106 2.65 x 10⁶ 0.76 x 10⁶ C 3.70 x 10⁶ 15.07 x 10⁶ 1.,37 x 106 A + B 2.85 x 10⁶ 12.26 x 10⁶ 9.41 x 10⁶ B + C 3.48 x 10⁶ 15.63 x 10⁶ 1.15 x 10⁶ A + C 3.98 x 10⁶ 17.45 x 10⁶ 13.47 x 10⁶ A + B + C 1.68 x 10⁶ 17.11 x 10⁶ 15.43 x 10⁶
*decreased in number Note: A (papaya waste), B (banana waste), C (vegetable waste) Based on the results of the paired sample T test, the data in Table 2 shows that there is a significant difference between the number of microscopic fungal colonies in the combination of organic waste (67.14 %). The highest amount is found in the combination of papaya and vegetable waste added by Trichoderma spp, which is 17.45 x 10⁶ CFU / ml. The conclusion of this research is the microbial colony number of each bacterial and microscopic fungus before and after added by Trichoderma spp. has a significant difference i.e 70.57 % for the number of bacterial colonies and 67.14 % for microscopic fungus. Keywords: bacteria, colony number, microscopic fungus, organic waste, Trichoderma spp. Acknowledgment We would like to express our special thanks of gratitude for Research and Community Service Institution in Ganesha University of Education who encouraged us for financial and motivation supports. References
1. B M. Dwiyanto. Model peningkatan Partisipasi Masyarakat dan Penguatan Sinergi Dalam
pengelolaan sampah perkotaan (Models for increasing community participation and
strengthening synergy in urban waste management), Techno Journal (Exact Science Journal) Vol.06 (2). (Khairun University, 2017), pp.45-53.
2. P. Widiyaningrum and Lisdiana. Efektivitas Proses Pengomposan Sampah Daun Dengan Tiga
Sumber Aktivator yang Berbeda (The Effectiveness of the Leaf Litter Composting Process with
Three Different Activator Sources),Rekayasa Journal Vol.13(2). (Semarang State University, 2015), pp. 107-113.
3. R.Windraswara and D.A.B Prihastuti, Analisis Potensi Reduksi Sampah Rumah Tangga untuk
Peningkatan Kualitas Kesehatan Lingkungan (Analysis of the Potential of Household Waste
Reduction to Improve the Quality of Environmental Health), Unnes Journal of Public Health Vol 6(2). (Semarang State University, 2017), pp. 123–128.
96
International Conference on Natural Sciences, Mathematics, Applications, Research, and Technology
Manado, Indonesia, 22-23 October 2020
Diversity of Visiting Birds In Rice Field of North Minahasa Regency, North Sulawesi as a Water Birds Protection and Birdwaching Area Saroyo*1 and Parluhutan Siahaan1
1Biology Study Program, Faculty of Mathematics and Natural Scienc, Sam Ratulangi University, Indonesia INTRODUCTION The high diversity of bird species on the island of Sulawesi is partly due to the variety of habitat types for birds. One type of bird habitat is rice fields. Data from the Agricultural Research and Development Agency for 2012 (Hikmatullah & Suryani, 2014) that irrigated and non-irrigated rice fields in North Sulawesi are 56,181 ha. Paddy soil is land used for lowland rice farming activities, whether carried out continuously throughout the year or alternately with secondary crops (Hardjowigeno et al., 2004). The term wetland land is not a taxonomic term, but is a general term such as forest land, plantation land, agricultural land and so on. As an ecosystem, rice fields are habitats that have various biotic and abiotic f actors that support the lives of many species of living things, even though there is a cycle of land cultivation, the main purpose of which is indeed rice farming. The rice field habitat also supports the life of several bird species, although they are not birds that live in these habitats, but rather function as locations to find food. As previously explained, there are processing phases in paddy fields, namely the land processing phase, planting, vegetative phase, mature generative phase (ready to harvest), and post-harvest. Each phase has different habitat conditions with other phases, both the biotic component and the abiotic component. Therefore, each phase will provide different types of natural food for birds so that there are variations in bird species in each phase. This article discusses bird species found in rice fields in North Minahasa Regency, North Sulawesi province. Given that the processing stages are not homogeneous, surveys observations are observed in all phases of rice cultivation. RESULTS AND DISCUSSION Survey was already conducted on September to October 2020. Location in Kalawat District, North Minahasa Regency, North Sulawesi Province. The observation point includes two locations, namely radius 100 m from coordinates 1o28'5.656'N; 124o56'11.687'E and radius 100 m from coordinates 1o28'7.732'N; 124o56'4.705'E. The observed habitat is rice paddy fields with all stages of cultivation, namely land management, planting, vegetative phase, mature generative phase (ready to harvest), and post-harvest. The bird species observed and identified during the survey are presented in the appendix. From this appaendix, it is known that the number of bird species found in rice fields in North Minahasa Regency, North Sulawesi Province are 33 species from 21families, those are Artamidae, Passeridae, Estrildidae, Cisticolidae, Phylloscopidae, Nectariniidae, Pycnonotidae, Columbidae, Alcedinidae, Cuculidae, Apodidae, Accipitridae, Ardeidae, Recurvirostridae, Rallidae, Scolopacidae, Charadriidae, Corvidae, Phasianidae , Motascillidae, and Sturnidae.
97
Sulawesi is an area that has high biodiversity with many endemic species, including birds. The diversity of birds in this rice field area can be used for several purposes, including education and tourism. For educational purposes, rice fields can be a laboratory and bird watching practice, while as a tourism area it can become a birdwatching area. With these benefits, this area should be protected from various damages, especially land conversion into housing. Keywords: biodiversity of visiting birds, rice field, North Minahasa Regency, North Sulawesi Acknowledgment References 1. Andrew, P. (1992) The birds of Indonesia: a checklist (Peters’ sequence). Jakarta: Indonesian
Ornithological Society (Checklist No. 1). 2. Aviabase - Bird Checklists of the World Sulawesi (Mainland). https://avibase.bsc-
eoc.org/checklist.jsp?region=IDslsl. Akses 13-9-2020. 3. Bappenas. 2016. Indonesian Biodiversity Strategy and Action Palan 2015-2020. Kementerian
Bappenas. 4. Coates, B. J. and Bishop, K. D. 1997. A guide to the birds of Wallacea:Sulawesi, the Moluccas and
Lesser Sunda islands, Indonesia. Alderley, Queensland: Dove Publications. 5. Data Zone. http://datazone.birdlife.org/species/factsheet/eurasian-tree-sparrow-passer-montanus.
Akses 13-9-2020. 6. Hardjowigeno, S., H. Subagyo, & M. L. Rayes. 2004. Morfologi dan Klasifikasi Tanah Sawah. in
Tanah Sawah dan Teknologi Pengolahannya. Penerbit Pusat Penelitian dan Pengembangan Tanah dan Agroklimat (Puslitbangtanak).
7. Hikmatullah & E. Suryani. 2014. Potensi Sumberdaya Lahan Pulau Sulawesi Mendukung Peningkatan Produksi Padi, Jagung, dan Kedele. Jurnal Sumberdaya Lahan Edisi Khusus, Desember 2014; 41-56.
8. http://www.birdlife.org/. Akses 13-9-2020. 9. Sujatnika, Jepson, P., Soehartono, T. R., Crosby, M. J. and Mardiastuti, A. 1995. Conserving
Indonesia biodiversity: The Endemic Bird Area approach. Jakarta: PHPA/BirdLife International-Indonesia Programme.
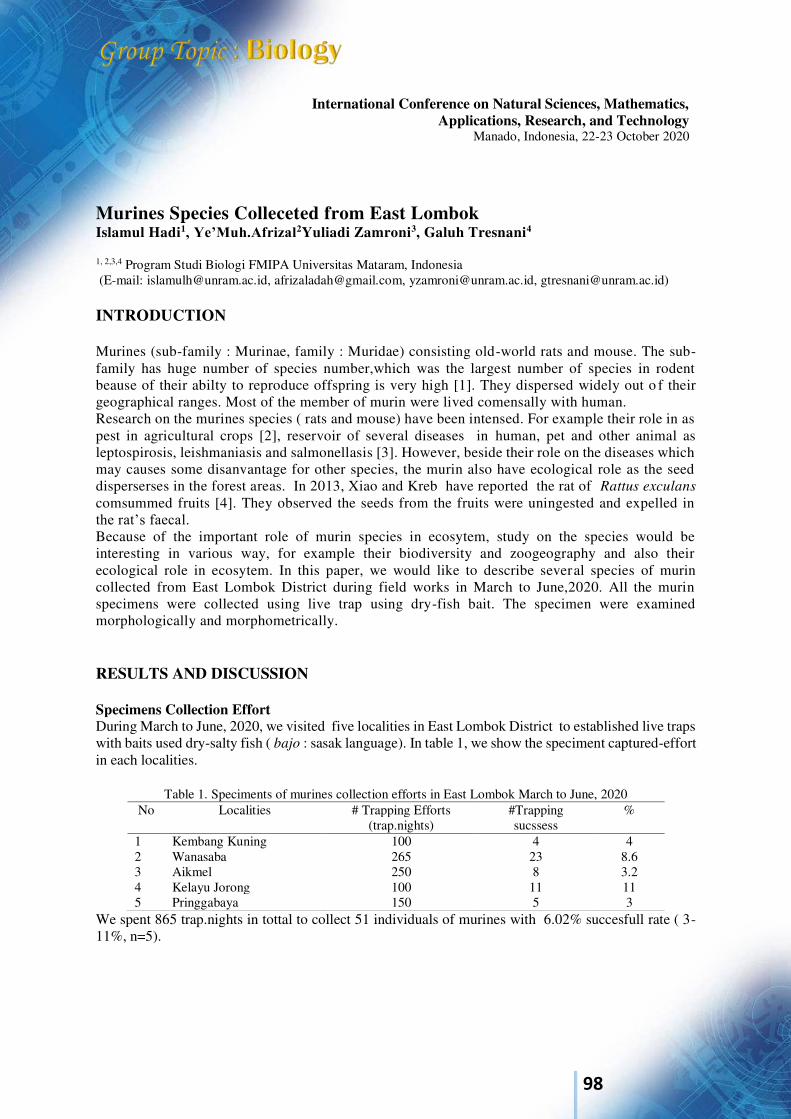
98
International Conference on Natural Sciences, Mathematics, Applications, Research, and Technology
Manado, Indonesia, 22-23 October 2020
Murines Species Colleceted from East Lombok Islamul Hadi1, Ye’Muh.Afrizal2Yuliadi Zamroni3, Galuh Tresnani4
1, 2,3,4 Program Studi Biologi FMIPA Universitas Mataram, Indonesia (E-mail: [email protected], [email protected], [email protected], [email protected]) INTRODUCTION Murines (sub-family : Murinae, family : Muridae) consisting old-world rats and mouse. The sub-family has huge number of species number,which was the largest number of species in rodent beause of their abilty to reproduce offspring is very high [1]. They dispersed widely out o f their geographical ranges. Most of the member of murin were lived comensally with human. Research on the murines species ( rats and mouse) have been intensed. For example their role in as pest in agricultural crops [2], reservoir of several diseases in human, pet and other animal as leptospirosis, leishmaniasis and salmonellasis [3]. However, beside their role on the diseases which may causes some disanvantage for other species, the murin also have ecological role as the seed disperserses in the forest areas. In 2013, Xiao and Kreb have reported the rat of Rattus exculans comsummed fruits [4]. They observed the seeds from the fruits were uningested and expelled in the rat’s faecal. Because of the important role of murin species in ecosytem, study on the species would be interesting in various way, for example their biodiversity and zoogeography and also their ecological role in ecosytem. In this paper, we would like to describe several species of murin collected from East Lombok District during field works in March to June,2020. All the murin specimens were collected using live trap using dry-fish bait. The specimen were examined morphologically and morphometrically. RESULTS AND DISCUSSION Specimens Collection Effort During March to June, 2020, we visited five localities in East Lombok District to established live traps with baits used dry-salty fish ( bajo : sasak language). In table 1, we show the speciment captured-effort in each localities.
Table 1. Speciments of murines collection efforts in East Lombok March to June, 2020 No Localities # Trapping Efforts
(trap.nights) #Trapping sucssess
%
1 Kembang Kuning 100 4 4 2 Wanasaba 265 23 8.6 3 Aikmel 250 8 3.2 4 Kelayu Jorong 100 11 11 5 Pringgabaya 150 5 3
We spent 865 trap.nights in tottal to collect 51 individuals of murines with 6.02% succesfull rate ( 3-11%, n=5).
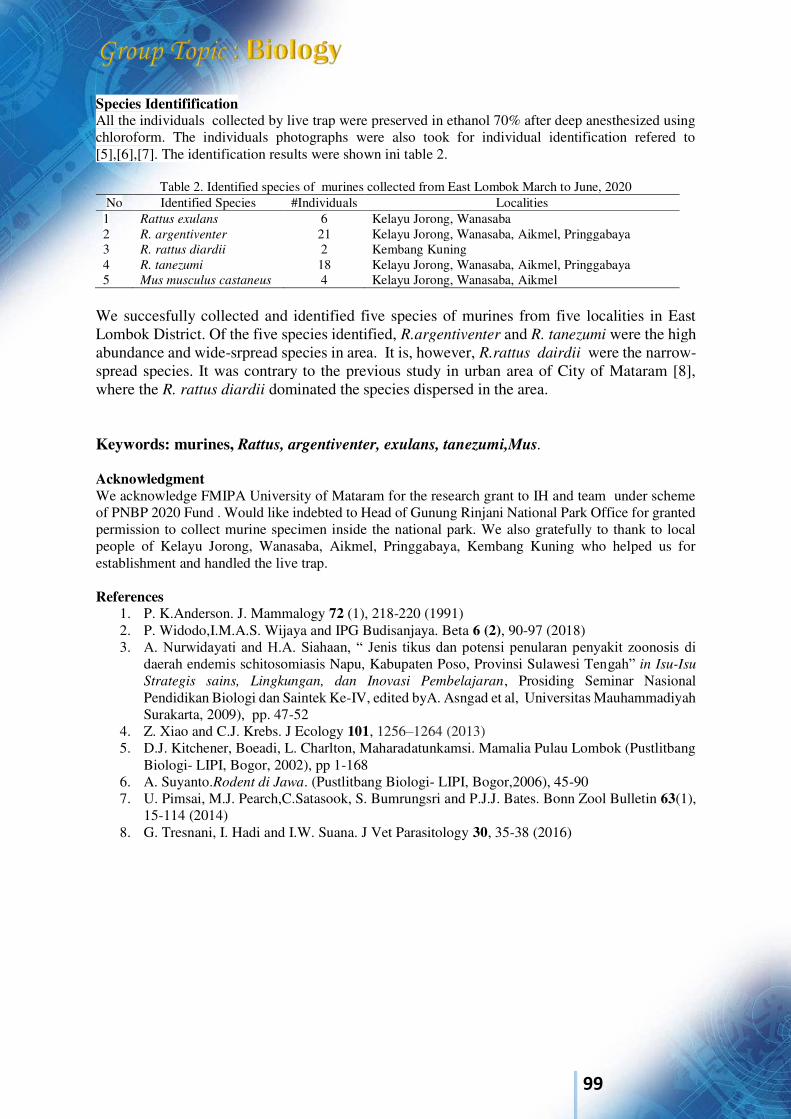
99
Species Identifification All the individuals collected by live trap were preserved in ethanol 70% after deep anesthesized using chloroform. The individuals photographs were also took for individual identification refered to [5],[6],[7]. The identification results were shown ini table 2.
Table 2. Identified species of murines collected from East Lombok March to June, 2020 No Identified Species #Individuals Localities 1 Rattus exulans 6 Kelayu Jorong, Wanasaba 2 R. argentiventer 21 Kelayu Jorong, Wanasaba, Aikmel, Pringgabaya 3 R. rattus diardii 2 Kembang Kuning 4 R. tanezumi 18 Kelayu Jorong, Wanasaba, Aikmel, Pringgabaya 5 Mus musculus castaneus 4 Kelayu Jorong, Wanasaba, Aikmel
We succesfully collected and identified five species of murines from five localities in East Lombok District. Of the five species identified, R.argentiventer and R. tanezumi were the high abundance and wide-srpread species in area. It is, however, R.rattus dairdii were the narrow-spread species. It was contrary to the previous study in urban area of City of Mataram [8], where the R. rattus diardii dominated the species dispersed in the area. Keywords: murines, Rattus, argentiventer, exulans, tanezumi,Mus. Acknowledgment We acknowledge FMIPA University of Mataram for the research grant to IH and team under scheme of PNBP 2020 Fund . Would like indebted to Head of Gunung Rinjani National Park Office for granted permission to collect murine specimen inside the national park. We also gratefully to thank to local people of Kelayu Jorong, Wanasaba, Aikmel, Pringgabaya, Kembang Kuning who helped us for establishment and handled the live trap. References
1. P. K.Anderson. J. Mammalogy 72 (1), 218-220 (1991) 2. P. Widodo,I.M.A.S. Wijaya and IPG Budisanjaya. Beta 6 (2), 90-97 (2018) 3. A. Nurwidayati and H.A. Siahaan, “ Jenis tikus dan potensi penularan penyakit zoonosis di
daerah endemis schitosomiasis Napu, Kabupaten Poso, Provinsi Sulawesi Tengah” in Isu-Isu
Strategis sains, Lingkungan, dan Inovasi Pembelajaran, Prosiding Seminar Nasional Pendidikan Biologi dan Saintek Ke-IV, edited byA. Asngad et al, Universitas Mauhammadiyah Surakarta, 2009), pp. 47-52
4. Z. Xiao and C.J. Krebs. J Ecology 101, 1256–1264 (2013) 5. D.J. Kitchener, Boeadi, L. Charlton, Maharadatunkamsi. Mamalia Pulau Lombok (Pustlitbang
Biologi- LIPI, Bogor, 2002), pp 1-168 6. A. Suyanto.Rodent di Jawa. (Pustlitbang Biologi- LIPI, Bogor,2006), 45-90 7. U. Pimsai, M.J. Pearch,C.Satasook, S. Bumrungsri and P.J.J. Bates. Bonn Zool Bulletin 63(1),
15-114 (2014) 8. G. Tresnani, I. Hadi and I.W. Suana. J Vet Parasitology 30, 35-38 (2016)

100
International Conference on Natural Sciences, Mathematics, Applications, Research, and Technology
Manado, Indonesia, 22-23 October 2020
NARRATIVE REVIEW: COMBINATION OF BACILLUS, ASPERGILLUS, AND LARVA GALLERIA MELLONELLA AS PLASTIC DEGRADERS Reka Safitri, Indah Saputri, Abdul Samad Ratuloly, and Sukriani Kursia Sekolah Tinggi Ilmu Farmasi Makassar Jl. Perintis Kemerdekaan km 13.5, Daya, Makassar, 90242, Indonesia e-mail : [email protected]
ABSTRACT Plastics are used globally with an important role in everyday life, due to their low cost, excellent oxygen / moisture barrier properties, and light weight, which are why they are used as packaging materials. In 2016, plastic production reached 335 million tons. In addition, it is estimated that plastic production will double over the next 20 years and nearly quadruple by 2050.The types of plastics that are often produced are polyvinyl chloride (PVC), polyethylene (PE), polypropylene (PP), polystyrene (PS), polyethylene terephthalate (PET), polyurethane (PUR).There are four main treatment solutions for plastic waste disposal: stockpiling, incineration, recycling and biodegradation. Biodegradation by microorganisms is undertaken to overcome the limitations associated with conventional burning and stockpiling methods. The purpose of this research is to find and explore secondary data sources related to efforts to deal with the problem of plastic waste through the use of microorganisms. The research method used is a narrative review system by digging up information in the form of secondary data from data sources, namely Pubmed, Google scholar and Science direct. Based on the literature study that has been done, it is found that the microorganisms Asperigillus, Bacillus and Galleria mellonella and Pseudomonas are able to degrade plastic.
RESULTS AND DISCUSSION Biodegradation is a process of breaking down a complex compound into simpler compounds such as water and carbon dioxide. The decomposition process takes advantage of the activity of microorganisms so that changes in molecular integrity occur. Each microorganism has different characteristics, so that the degradation process that occurs will be different or vary from one microorganism to another (Fadlilah and Maya Shovitri, 2014). In general, the degradation process occurs because these compounds are used by microorganisms as a source of nutrition for their growth. The speed of the biodegradation process is influenced by several factors. These factors include humidity, type of microorganism, temperature, pH, polymer type, and polymer thickness. Biodegradation conditions which include pH, temperature, nutrients, minerals, oxygen, and humidity must adjust to the types of microbes that will be used as biodegraders. Polymer materials released into the environment will undergo physical, chemical and biological decomposition or a combination depending on the presence of moisture, air, temperature, light (photo-degradation), high energy radiation (UV, γ-radiation) or by the presence of microorganisms (bacteria or fungi) (Sumarsono 2011). According to Webb (2013), there are four mechanisms for biodegradation of plastics in the environment, namely photodegradation or a process of decomposition using light, oxidative biodegradation or degradation processes using heat, hydrolytic degradation and biodegradation by
101
microorganisms. Plastic waste degrading microorganisms convert the carbon in polymer chains into carbon dioxide or introduce it into biomolecules. The biodegradation process that occurs results in plastic waste becoming brittle and breaking into smaller pieces, so that the polymer chains in plastic waste have a molecular weight low enough to be metabolized by microorganisms. Several degradation approaches exist in nature to tackle increasing plastic waste. Among these approaches, biodegradation by microorganisms has emerged as a natural way, which is favored by many environmentally conscious societies. To facilitate the study of plastic biodegradation, an online resource has been developed, the Plastic Microbial Biodegradation Database (PMBD) to collect and present information on the biodegradation of plastic microbes. Biodegradation of plastics involves the initial depolymerization and further degradation of small molecules which are essential for differentiating between several enzymes. Different plastic degradation requires different enzyme sequences, most plastics are polyester whose degradation is catalyzed by enzymes such as cutinase or esterase. In addition, it was found that the target compound was PLA beyond the predictions of the protease database. In the process of PLA degradation, the first thing to be degraded is a long polymer chain using depolymerization. Then, the database also reports that there are several serine protease enzymes such as K protease and trypsin which can degrade low molecular weight plastics. It has also been reported that there are several microorganisms such as Amycolatopsis,
Saccharothrix, Pseudonocardia, Asperigillus fumingatus, Pseudomonas fluoroscens, Periculosum,
Rhodococcus ruber, Comamonas acidovorans and Pseudomonas aeruginosa which can degrade plastic types PLA, PCL, PET, PBS, PE, PU dan PHB. So far, only 79 enzymes are confirmed to be responsible for plastic degradation, as little has been studied on the mechanisms of degradation activity. Most of the mechanisms of plastic-degrading enzymes work by breaking the hydrolysis bonds of the plastic and binding to the surface of the plastic polymer until it reaches the enzyme active site. Keywords: Plastics, Biodegradation, Microorganisms, Asperigillus, Bacillus, Galleria
mellonella
References 1. Afreen, B., Nouman Rasoo, NR and Saima, I. (2020) 'Characterization of plastic degrading
bacteria isolated from landfill sites', International Journal of Clinical Microbiology and Biochemical Technology, 4 (1), pp. 30–35. doi: 10.29328 / journal.ijcmbt.1001013.
2. Al-Salem, SM et al. (2019) 'On the kinetics of degradation reaction determined post accelerated weathering of polyolefin plastic waste blends', International Journal of Environmental Research and Public Health, 16 (3). doi: 10.3390 / ijerph16030395.
3. Bombelli, P., Howe, CJ and Bertocchini, F. (2017) 'Polyethylene bio-degradation by caterpillars of the wax moth Galleria mellonella', Current Biology, 27 (8), pp. R292 – R293. doi: 10.1016 / j.cub.2017.02.060.
4. Butbunchu, N. and Pathom-Aree, W. (2019) 'Actinobacteria as Promising Candidate for Polylactic Acid Type Bioplastic Degradation', Frontiers in Microbiology, 10 (December). doi: 10.3389 / fmicb.2019.02834.
5. Cassone, BJ et al. (2020) 'Role of the intestinal microbiome in low-density polyethylene degradation by caterpillar larvae of the greater wax moth, Galleria mellonella', Proceedings of the Royal Society B: Biological Sciences, 287 (1922), pp. 9–11. doi: 10.1098 / rspb.2020.0112.
6. Dang, TCH et al. (2018) 'Plastic degradation by thermophilic Bacillus sp. BCBT21 isolated from composting agricultural residual in Vietnam ', Advances in Natural Sciences: Nanoscience and Nanotechnology, 9 (1). doi: 10.1088 / 2043-6254 / aaabaf.
7. Danso, D., Chow, J. and Streita, WR (2019) 'Plastics: Environmental and biotechnological perspectives on microbial degradation', Applied and Environmental Microbiology, 85 (19), pp. 1–14. doi: 10.1128 / AEM.01095-19.
8. Das, MP and Kumar, S. (2015) 'An approach to low-density polyethylene biodegradation by Bacillus amyloliquefaciens', 3 Biotech, 5 (1), pp. 81–86. doi: 10.1007 / s13205-014-0205-1.
102
9. Dwicania, E. (2019) 'Biodegradation of Plastic Waste by Microorganisms'. doi: 10.31227 / osf.io / j842v.
10. Erlambang, BPD, Oktarianti, R. and Wathon, S. (2019) 'Potential Microorganisms as Biological Agents to Degrade Plastic Waste', Bio Trends, 10 (2), pp. 18–26.
11. Fadlilah, FR and Shovitri, M. (2014) 'Potential of Bacillus Bacteria Isolates in Degradation of Plastics by the Winogradsky Column Method', Pomits Engineering Journal, 3 (2), pp. 2337–3539.
12. Gajendiran, A., Krishnamoorthy, S. and Abraham, J. (2016) 'Microbial degradation of low-density polyethylene (LDPE) by Aspergillus clavatus strain JASK1 isolated from landfill soil', 3 Biotech, 6 (1), pp. 1–6. doi: 10.1007 / s13205-016-0394-x.
13. Gan, Z. and Zhang, H. (2019) 'PMBD: a Comprehensive Plastics Microbial Biodegradation Database', Database: the journal of biological databases and curation, 2019, pp. 1–11. doi: 10.1093 / database / baz119.
14. Gewert, B., Plassmann, MM and Macleod, M. (2015) 'Pathways for degradation of plastic polymers floating in the marine environment', Environmental Sciences: Processes and Impacts, 17 (9), pp. 1513–1521. doi: 10.1039 / c5em00207a.
15. Ghosh, SK, Pal, S. and Ray, S. (2013) 'Study of microbes having potentiality for biodegradation of plastics.', Environmental science and pollution research international, 20 (7), pp. 4339–4355. doi: 10.1007 / s11356-013-1706-x.
16. Hidayah, A. (2017) 'Journal of Research and Reasoning', Journal of Research and Reasoning, 4 (2), pp. 701–711.
17. Indumathi, A. et al. (2016) 'Plastic Degrading ability of Aspergillus oryzae isolated from the garbage dumping sites of Thanjavur, India', Ijcmas, 3 (3), pp. 8–13.
18. Islami, AN (2019) 'Biodegradation of Plastics by Microorganisms'. doi: 10.31227 / osf.io / rfkpy.
19. Jaiswal, S., Sharma, B. and Shukla, P. (2020) 'Integrated approaches in microbial degradation of plastics', Environmental Technology and Innovation, 17, p. 100567.doi: 10.1016 / j.eti.2019.100567.
20. Lou, Y. et al. (2020) 'Biodegradation of Polyethylene and Polystyrene by Greater Wax Moth Larvae (Galleria mellonella L.) and the Effect of Co-diet Supplementation on the Core Gut Microbiome', Environmental Science and Technology, 54 (5), pp. 2821–2831. doi: 10.1021 / acs.est.9b07044.
21. Mohan, SK and Suresh, B. (2015) 'Studies on biodegradation of plastics by aspergillus Sp. Isolated from dye effluent ', Indo Am J Pharm Sci, 2 (12), pp. 1639–1639.
22. Mohapatra, S. et al. (2017) 'Bacillus and biopolymer: Prospects and challenges', Biochemistry and Biophysics Reports, 12, pp. 206–213. doi: 10.1016 / j.bbrep.2017.10.001.
23. Norma Sainstika Pangestu, AB and MIR (2016) 'Isolation, Identification of 16s rRNA and Morphological Characterization of Polyethylene (Pe) Plastic Degradation Bacteria', Journal of Biology, 5 (1), pp. 1–5.
24. North, EJ and Halden, RU (2013) 'Plastics and environmental health: The road ahead', Reviews on Environmental Health, 28 (1), pp. 1–8. doi: 10.1515 / reveh-2012-0030.
25. Nowak, B. et al. (2011) 'Microorganisms participating in the biodegradation of modified polyethylene films in different soils under laboratory conditions', International Biodeterioration and Biodegradation, 65 (6), pp. 757–767. doi: 10.1016 / j.ibiod.2011.04.007.
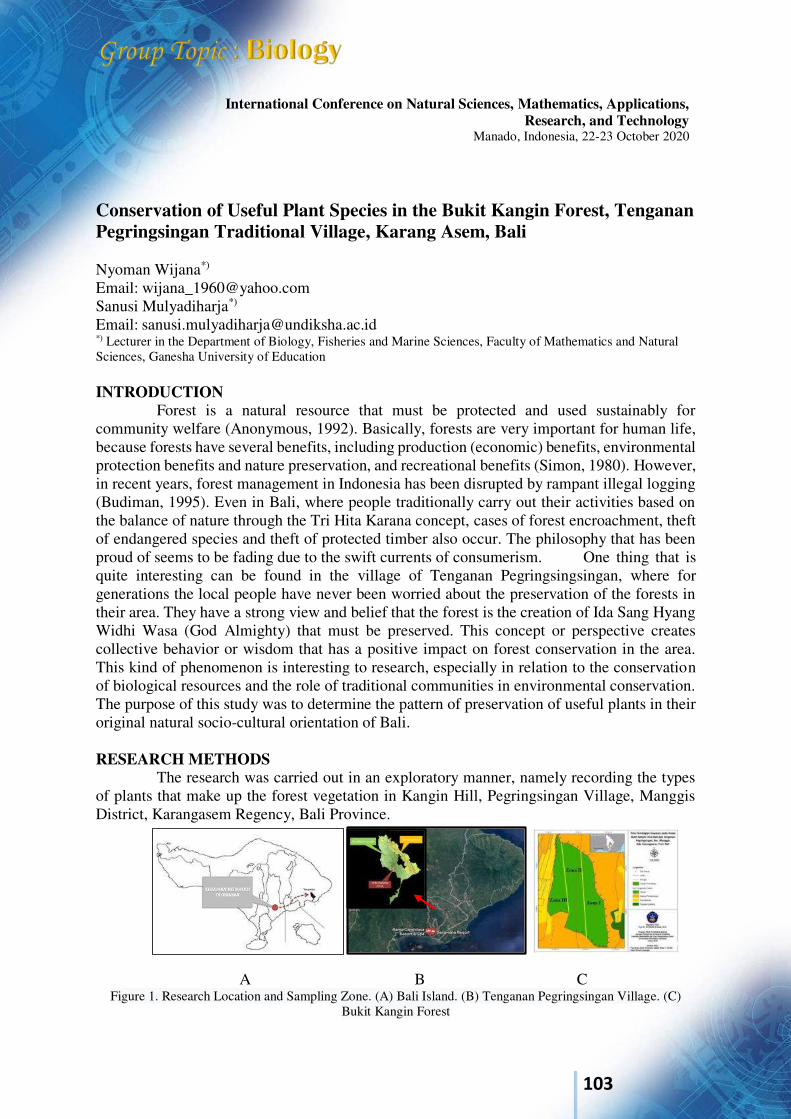
103
International Conference on Natural Sciences, Mathematics, Applications, Research, and Technology
Manado, Indonesia, 22-23 October 2020
Conservation of Useful Plant Species in the Bukit Kangin Forest, Tenganan Pegringsingan Traditional Village, Karang Asem, Bali Nyoman Wijana*)
Email: [email protected] Sanusi Mulyadiharja*) Email: [email protected] *) Lecturer in the Department of Biology, Fisheries and Marine Sciences, Faculty of Mathematics and Natural Sciences, Ganesha University of Education INTRODUCTION Forest is a natural resource that must be protected and used sustainably for community welfare (Anonymous, 1992). Basically, forests are very important for human life, because forests have several benefits, including production (economic) benefits, environmental protection benefits and nature preservation, and recreational benefits (Simon, 1980). However, in recent years, forest management in Indonesia has been disrupted by rampant illegal logging (Budiman, 1995). Even in Bali, where people traditionally carry out their activities based on the balance of nature through the Tri Hita Karana concept, cases of forest encroachment, theft of endangered species and theft of protected timber also occur. The philosophy that has been proud of seems to be fading due to the swift currents of consumerism. One thing that is quite interesting can be found in the village of Tenganan Pegringsingsingan, where for generations the local people have never been worried about the preservation of the forests in their area. They have a strong view and belief that the forest is the creation of Ida Sang Hyang Widhi Wasa (God Almighty) that must be preserved. This concept or perspective creates collective behavior or wisdom that has a positive impact on forest conservation in the area. This kind of phenomenon is interesting to research, especially in relation to the conservation of biological resources and the role of traditional communities in environmental conservation. The purpose of this study was to determine the pattern of preservation of useful plants in their original natural socio-cultural orientation of Bali. RESEARCH METHODS The research was carried out in an exploratory manner, namely recording the types of plants that make up the forest vegetation in Kangin Hill, Pegringsingan Village, Manggis District, Karangasem Regency, Bali Province.
A B C Figure 1. Research Location and Sampling Zone. (A) Bali Island. (B) Tenganan Pegringsingan Village. (C)
Bukit Kangin Forest
104
Observations were made using the quadratic method, which was made by stretching the squares in the direction of the contour or cutting the contour. The sample determination is based on a systematic sampling method (Mueller-Dombois & Ellenberg, 1974; Barbour, et al., 1987). The square size is 20x20 m2 with the number of squares at each research location, both the stations that cut the contour and those in the direction of the contour are 60 squared. RESULTS AND DISCUSSION 1. There are about 46 species of plants. Of the 46 plant species, including 40 families, with a
total of 2,574 individual species. Furthermore, from the 46 plant species found, based on interviews, literature studies, and field observations, 46 plant species were obtained which were used by the local community traditionally.
2. The majority (60%) of these plants is used by the local community and 40% are not traditionally used by the local community. Useful plants traditionally utilized by local communities are for the purposes of religious ceremonial material (Hindu) as many as 29 plant species (35.80%), for medicinal purposes as many as 18 plant species (27.70%), as many as 17 plant species food ( 20.99%), the need for board materials is 13 plant species (16.05%), the need for clothing and industrial materials is 2 plant species (2.47%).
3. The management of forest and land classification in the Tenganan Pegringsingan Traditional Village are regulated by awig-awig (traditional rules).
4. Tri Hita Karana as one of the philosophies of the Balinese people, including the people of the village of Tenganan Pegringsingan. Tri Hita Karana means that there are three factors causing happiness that must be carried out by the Balinese people.
5. According to folklore, King Bedahul lost one of Onceswara's horses and people searched the East for it. The holy places associated with the death of the Onceswara horse can be seen until now.
The model of plant use grouping varies according to research interests. In this study, Heyne's (1988) grouping model is used because it is considered more general and in accordance with the habits of the local community. Astuti's (2000) grouping model emphasizes more specific uses, such as medical, religious ceremonies, dyes / dyes, edible, ornamental, gamelan instruments, and weaving tools. However, not all of these utilization criteria can be found in the villages around Bukit Kangin awig-awig (traditional rules). The traditional rules (awig-
awig) regarding the utilization of forest products which are quite "complex" are related to the historical story of the birth of the Tenganan Pegringsingan Traditional Village which was able to shape wisdom and awareness that the area they occupy was given by Ida Sang Hyang Widhi Wasa (God), so it should be respected, maintained and preserved. This myth is believed to have contributed significantly to the preservation of Tenganan Pegringsingan Village (Windia, 2002a and 2002b). CONCLUSION The conclusions of this study are (1) In Bukit Kangin, there are about 46 species of useful plants which are used by the people of the Tenganan Pegringsingan Traditional Village. Useful plants traditionally utilized by local communities are for the purposes of religious ceremonial material (Hindu) as many as 29 plant species (35.80%), for medicinal purposes as many as 18 plant pecies (27.70%), as many as 17 plant species food ( 20.99%), the need for board materials is 13 plant species (16.05%), the need for clothing and industrial materials is 2 plant species (2.47%). Forest management efforts carried out by the people of the Tenganan Pegringsingan Traditional Village are based on traditional rules (awig-awig) which reflect local wisdom and respect for religious principles and myths that are believed from generation to generation. This effort has proven to be quite effective in maintaining the preservation of the richness of plant species in the area.
105
REFERENCES Anonimus. 1992. Economic and Busnises Review Indonesian. No. 5. Anonimous. 2001. Awig-Awig Desa Adat Tenganan. Tidak diterbitkan. Anonimous. 2006. Desa Adat Tenganan. http//www.navigasi.net/go.php?g=art&a=budsteng.
Diakses tanggal 14 Februari 2006. Astuti, T.I.P. 2007. Awig-awig sebagai Sarana Pelestarian Lingkungan Hidup. Dalam Buku
Kearifan Lokal Dalam Pengelolaan Lingkungan Hidup. Denpasar : UNUD. Astuti, I.P., S. Hidayat, dan I.B.K. Arinasa. 2000. Traditional Plant Usage in Four Villages of
Bali Aga: Tenganan, Sepang, Tigawasa, and Sembiran Bali Indonesia. Bogor. The John D. and Catherine T. MacArthur Foundation.
Barbour, M.G., J.H. Burk and W.D. Pitts. 1987. Terrestrial Plant Ecology. The Benjamin/Cummmings Publishing Company, Inc. California :
Breguet, G. dan R. Ney. 1985. Tenganan Project : Follow-Up 1978-1985. Final Report to The
Indonesian Institute of Sciences. Tidak diterbitkan. Budiman, A. 1995. Teori Pembangunan Dunia Ketiga. Gramedia. Jakarta. Desmukh, I. 1992. Ekologi dan Biologi Tropika. Yayasan Obor Indonesia. Jakarta. Gautama, B. W. 2005. Dharma Pamacul Tuntunan Para Petani (Menurut Lontar). Paramita.
Surabaya Harsojo. 1999. Pengantar Antropologi. Putra A. Badrin. Bandung. Heyne, K. 1987. Tumbuhan Berguna Indonesia. Badan Penelitian dan Pengembangan Hutan.
Departemen Kehutanan. Jakarta. Mulller-Dombois, D. and H. Ellenberg. 1974. Aims and Methods of Vegetation Ecology.:
W.H.Freeman and Company. Sanfransisco. Polunin, H. 1960. Introduction to Plant Geography and Some Related Science.: Green and Co
Ltd. London. Simon. 1980. Pengantar Ilmu Kehutanan. Yogyakarta : Faklutas Kehutanan UGM. Widia, M.I.W. 2002a. Tradisi dalam Melestarikan Lingkungan dengan Awig-Awig di Desa
Adat Tenganan Pegrinsingan Kecamatan Manggis, Kabupaten Karangasem, Propinsi Bali. Makalah disampaikan dalam lokakarya di Jakarta tanggal 7 Maret 2002.
Widia, M.I.W. 2002b. Selayang Pandang Desa Tenganan Pegringsingan Kecamatan Manggis, Kabupaten Karangasem. Dokumen Desa. Tidak diterbitkan.
Wijana, N. 2002. Analisis Vegetasi dan Kontribusi Masyarakat Setempat dalam Konservasi Hutan di Desa Tenganan Pegringsingan Kecamatan Manggis Kabupaten Karangasem. Laporan Penelitian. Tidak diterbitkan.
106
International Conference on Natural Sciences, Mathematics, Applications, Research, and Technology
Manado, Indonesia, 22-23 October 2020
USEFUL PLANT SPECIES IN THE FOREST OF TAMAN GUMI BANTEN, WANAGIRI VILLAGE, SUKSADA DISTRICT BULELENG, BALI By Nyoman Wijana*) Email: [email protected] I Made Oka Riawan*) Email: [email protected] I Wayan Sukrawarpala*) Email: [email protected] *) Lecturer in the Department of Biology, Fisheries and Marine Sciences, Faculty of Mathematics and Natural Sciences, Ganesha University of Education Introduction Geographically and administratively Wanagiri Village is one of 129 villages in Buleleng Regency, and has an area of 15.75 km2. Topographically, it is located at an altitude of 1,220 meters above sea level (asl). The position of Wanagiri village is hilly which is located in the southern part of Sukasada District, Buleleng Regency. Based on the Decree of the Buleleng Regent Number 430/405 / HK / 2017, regarding the Tourism Village of Buleleng Regency, there are 31 villages designated as tourist villages, one of which is Wanagiri village as a tourist village. In addition, this village has quite interesting objects, namely waterfall tourism objects, namely Banyumala waterfall, Banyuwana Amertha waterfall, Pucak Manik waterfall, and Cemara waterfall (Wijana, and Sanusi 2020. Wijana and Rahmawati, 2019). Based on the Decree of the Governor of Bali No. 2017/03-L / HK / 2005 dated 30 October 2015 concerning Village Forest Management Rights (HPHD) granted an area of 30,041 ha managed by Village-Owned Enterprises (BUMDES). Meanwhile, Wanagiri village as one of the villages in the Sukasada District area is entrusted with managing 250 ha of forest (Wijana and Sanusi 2020. Wijana and Rahmawati, 2019). The Taman Gumi Banten forest, as a part of the forest in Wanagiri village, is in the same condition as other forests in Wanagiri village. Previously, illegal logging had been carried out by irresponsible people. The condition of the forest is very worrying. In 2017, there was also replanting using mahogany plants. The community is allowed to plant coffee, banana, durian and other cultivated plants. In subsequent developments, along with the development of tourist villages, the forest area was designed to be developed into a tourist attraction with special plant characteristics in the form of banten (offerings, facilities and infrastructure for Hindu religious ceremonies in Bali). Therefore the forest is called the Taman Gumi Banten forest. RESEARCH METHODS The implementation of this research can generally be stated that it is located in the village of Wanagiri, Sukasada District, Buleleng Regency, Bali Province. Specifically, the location of this research is in two places, namely in the village of Wanagiri and in the forest of Taman Gumi Banten. The population of this study consisted of ecosystem (vegetation) and sociocytem aspects. From the ecosystem (vegetation) aspect, the population is all plant species in the forest of Taman Gumi Banten, Wanagiri village. Meanwhile, from the sociosystem aspect, the population is the entire community in Wanagiri village. Research samples from the
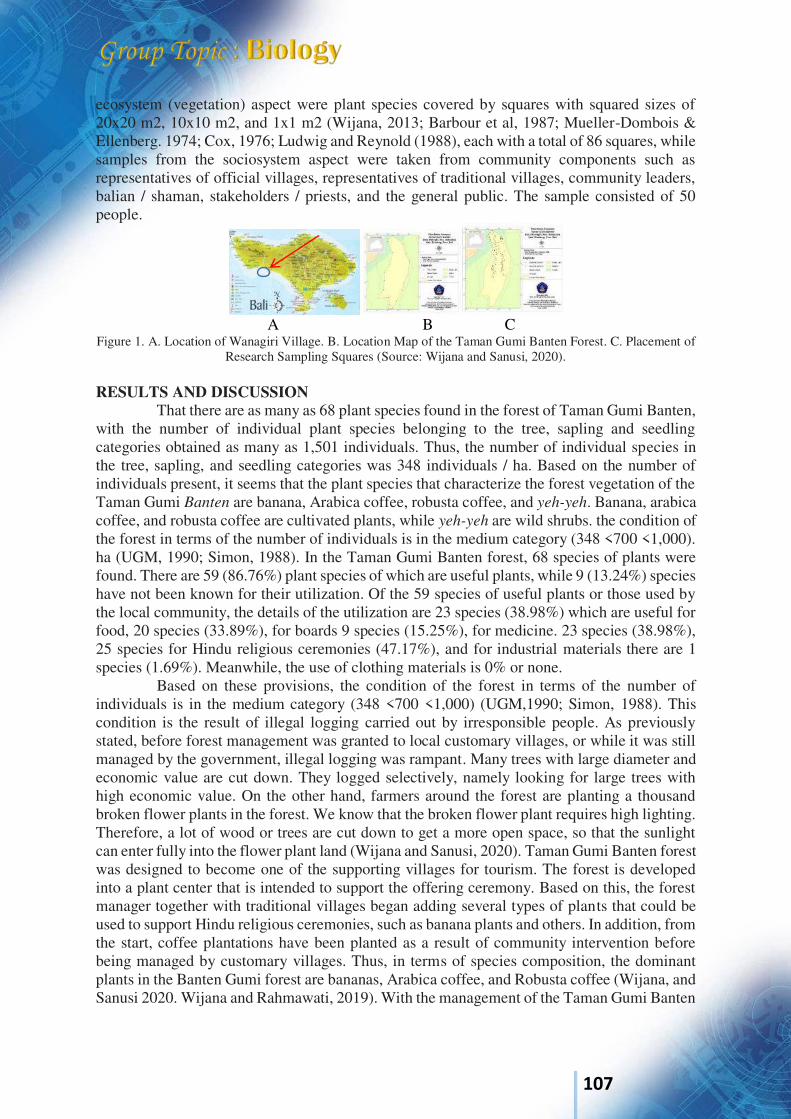
107
ecosystem (vegetation) aspect were plant species covered by squares with squared sizes of 20x20 m2, 10x10 m2, and 1x1 m2 (Wijana, 2013; Barbour et al, 1987; Mueller-Dombois & Ellenberg. 1974; Cox, 1976; Ludwig and Reynold (1988), each with a total of 86 squares, while samples from the sociosystem aspect were taken from community components such as representatives of official villages, representatives of traditional villages, community leaders, balian / shaman, stakeholders / priests, and the general public. The sample consisted of 50 people.
A B C Figure 1. A. Location of Wanagiri Village. B. Location Map of the Taman Gumi Banten Forest. C. Placement of
Research Sampling Squares (Source: Wijana and Sanusi, 2020). RESULTS AND DISCUSSION That there are as many as 68 plant species found in the forest of Taman Gumi Banten, with the number of individual plant species belonging to the tree, sapling and seedling categories obtained as many as 1,501 individuals. Thus, the number of individual species in the tree, sapling, and seedling categories was 348 individuals / ha. Based on the number of individuals present, it seems that the plant species that characterize the forest vegetation of the Taman Gumi Banten are banana, Arabica coffee, robusta coffee, and yeh-yeh. Banana, arabica coffee, and robusta coffee are cultivated plants, while yeh-yeh are wild shrubs. the condition of the forest in terms of the number of individuals is in the medium category (348 <700 <1,000). ha (UGM, 1990; Simon, 1988). In the Taman Gumi Banten forest, 68 species of plants were found. There are 59 (86.76%) plant species of which are useful plants, while 9 (13.24%) species have not been known for their utilization. Of the 59 species of useful plants or those used by the local community, the details of the utilization are 23 species (38.98%) which are useful for food, 20 species (33.89%), for boards 9 species (15.25%), for medicine. 23 species (38.98%), 25 species for Hindu religious ceremonies (47.17%), and for industrial materials there are 1 species (1.69%). Meanwhile, the use of clothing materials is 0% or none. Based on these provisions, the condition of the forest in terms of the number of individuals is in the medium category (348 <700 <1,000) (UGM,1990; Simon, 1988). This condition is the result of illegal logging carried out by irresponsible people. As previously stated, before forest management was granted to local customary villages, or while it was still managed by the government, illegal logging was rampant. Many trees with large diameter and economic value are cut down. They logged selectively, namely looking for large trees with high economic value. On the other hand, farmers around the forest are planting a thousand broken flower plants in the forest. We know that the broken flower plant requires high lighting. Therefore, a lot of wood or trees are cut down to get a more open space, so that the sunlight can enter fully into the flower plant land (Wijana and Sanusi, 2020). Taman Gumi Banten forest was designed to become one of the supporting villages for tourism. The forest is developed into a plant center that is intended to support the offering ceremony. Based on this, the forest manager together with traditional villages began adding several types of plants that could be used to support Hindu religious ceremonies, such as banana plants and others. In addition, from the start, coffee plantations have been planted as a result of community intervention before being managed by customary villages. Thus, in terms of species composition, the dominant plants in the Banten Gumi forest are bananas, Arabica coffee, and Robusta coffee (Wijana, and Sanusi 2020. Wijana and Rahmawati, 2019). With the management of the Taman Gumi Banten
108
forest by traditional villages, so that forest conservation is maintained, like other customary forests in Bali (Wijana, and Setiawan, 2019a; 2019b; 2019c; 2018; 2017); Wijana and Sumardika, (2009); Wijana and Wesnawa, (2018); Wijana, (2008) and outside Bali (Johan and Iskandar, (2017); Pare, et al, (2016); Dejene, et al, (2020); Hasanah, (2011); Sood, et al, (2001) ; and Park, et al, (2012); Sofowora, 1982); Park, et al, (2012); Arsana, (2019); Arsana, et al, (2019). CONCLUSION From the results of this study it can be concluded (1) There are 68 plant species in the entire forest of Taman Gumi Banten, (2) The number of individual species of tree, sapling, and seedling categories is 348 individuals / Ha which are included in the moderate category. (3) Based on the number of individuals present, plant species that characterize the forest vegetation of Taman Gumi Banten are banana, arabica coffee, robusta coffee, and yeh-yeh. (4) Of the 68 existing plant species, as many as 59 (86.76%) of the plant species were useful plants, while 9 (13.24%) of them were unknown. (5) The use of plants by the local community is 23 species (38.98%) for food, 20 species (33.89%) for boards, 9 species (15.25%) for medicine, 25 species (47.17%) ) for Hindu religious ceremonies, and for industrial materials there are 1 species (1.69%). Meanwhile, the utilization of clothing materials is 0% or none.. REFERENCES Wijana, Nyoman dan Sanusi Mulyadiharja. 2020. Pemetaan Vegetasi, Kajian Ekologi,
Etnobotani, Dan Penyusunan Ensiklopedia Tumbuhan Berguna Di Taman Gumi Banten Desa Wanagiri, Kecamatan Sukasada, Buleleng. Laporan Hasil Penelitian.
Wijana, Nyoman dan Indah Rahmawati. 2019. Analisis Kualitas Lingkungan Hidup dan Daya Dukung Lingkungan Dalam Rangka Pengembangan Desa Wana Giri, Buleleng Sebagai Desa Wisata
Barbour, M. G; J. H. Burk and W. D. Pitts. 1987. Terrestrial Plant Ecology. Inc. California : The Benjamin/ cummings Publishing Company.
Mueller-Dombois, D., H. Ellenberg. 1974. Aims and Methods of Vegetation Ecology. Sanfransisco : W. H. Freeman and Company.
Cox, G.W. 1976. Laboratory Manual of General Ecology. WM. C. Brown Company Publisher, USA.
Ludwig, Jhon. A. and Reynolds, James F.. 1988. Statistical Ecology. New York :Jhon Willey and Sons.
Heyne, K. 1987. Tumbuhan Berguna Indonesia I-IV. Badan Litbang Kehutanan. Jakarta: Yayasan Sarana Wana Jaya. (Useful Plants Indonesia I-IV. Forestry Research and Development Agency. Jakarta: Sarana Wana Jaya Foundation). Translation from: de Nuttige Planten van Indonesia.
UGM, 1990. Tim Eksplorasi Taman Nasional Bali barat. Laporan Kegiatan. Simon. 1980. Pengantar Ilmu Kehutanan. Yogyakarta : Faklutas Kehutanan UGM.
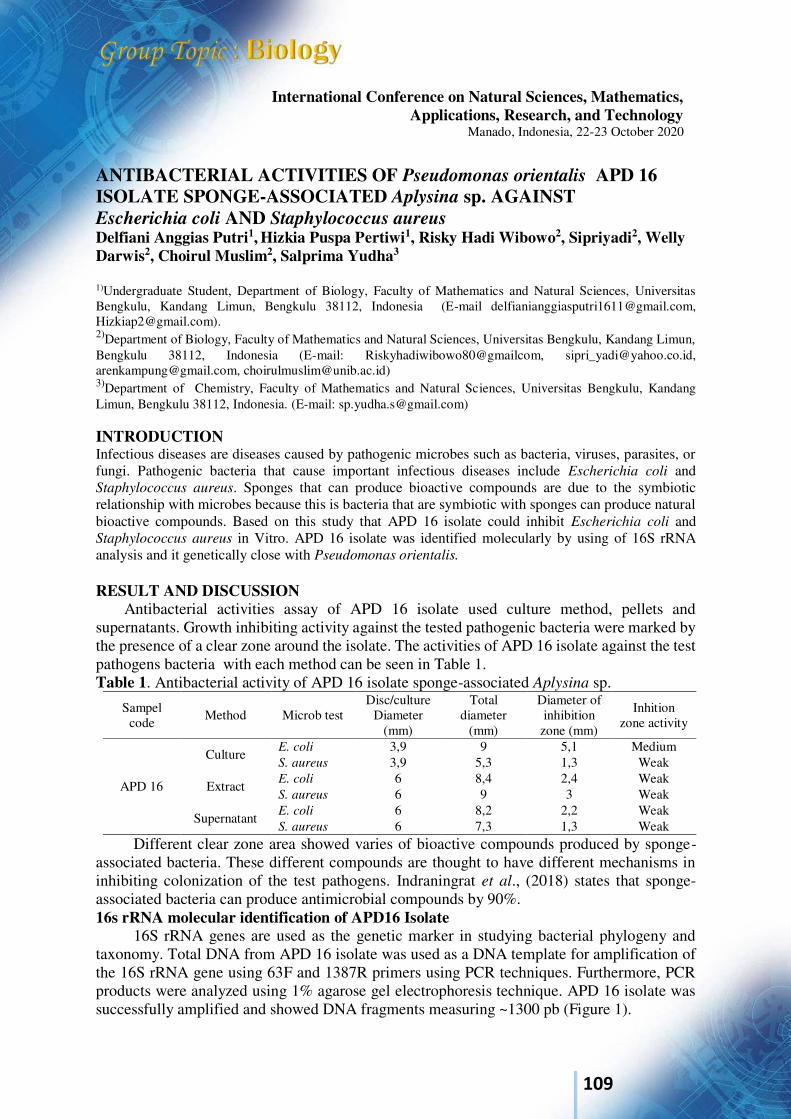
109
ANTIBACTERIAL ACTIVITIES OF Pseudomonas orientalis APD 16 ISOLATE SPONGE-ASSOCIATED Aplysina sp. AGAINST Escherichia coli AND Staphylococcus aureus Delfiani Anggias Putri1, Hizkia Puspa Pertiwi1, Risky Hadi Wibowo2, Sipriyadi2, Welly Darwis2, Choirul Muslim2, Salprima Yudha3
1)Undergraduate Student, Department of Biology, Faculty of Mathematics and Natural Sciences, Universitas Bengkulu, Kandang Limun, Bengkulu 38112, Indonesia (E-mail [email protected], [email protected]). 2)Department of Biology, Faculty of Mathematics and Natural Sciences, Universitas Bengkulu, Kandang Limun, Bengkulu 38112, Indonesia (E-mail: Riskyhadiwibowo80@gmailcom, [email protected], [email protected], [email protected]) 3)Department of Chemistry, Faculty of Mathematics and Natural Sciences, Universitas Bengkulu, Kandang Limun, Bengkulu 38112, Indonesia. (E-mail: [email protected])
INTRODUCTION Infectious diseases are diseases caused by pathogenic microbes such as bacteria, viruses, parasites, or fungi. Pathogenic bacteria that cause important infectious diseases include Escherichia coli and Staphylococcus aureus. Sponges that can produce bioactive compounds are due to the symbiotic relationship with microbes because this is bacteria that are symbiotic with sponges can produce natural bioactive compounds. Based on this study that APD 16 isolate could inhibit Escherichia coli and Staphylococcus aureus in Vitro. APD 16 isolate was identified molecularly by using of 16S rRNA analysis and it genetically close with Pseudomonas orientalis. RESULT AND DISCUSSION
Antibacterial activities assay of APD 16 isolate used culture method, pellets and supernatants. Growth inhibiting activity against the tested pathogenic bacteria were marked by the presence of a clear zone around the isolate. The activities of APD 16 isolate against the test pathogens bacteria with each method can be seen in Table 1. Table 1. Antibacterial activity of APD 16 isolate sponge-associated Aplysina sp.
Sampel code Method Microb test
Disc/culture Diameter
(mm)
Total diameter
(mm)
Diameter of inhibition
zone (mm)
Inhition zone activity
APD 16
Culture E. coli 3,9 9 5,1 Medium S. aureus 3,9 5,3 1,3 Weak
Extract E. coli 6 8,4 2,4 Weak S. aureus 6 9 3 Weak
Supernatant E. coli 6 8,2 2,2 Weak S. aureus 6 7,3 1,3 Weak
Different clear zone area showed varies of bioactive compounds produced by sponge-associated bacteria. These different compounds are thought to have different mechanisms in inhibiting colonization of the test pathogens. Indraningrat et al., (2018) states that sponge-associated bacteria can produce antimicrobial compounds by 90%. 16s rRNA molecular identification of APD16 Isolate
16S rRNA genes are used as the genetic marker in studying bacterial phylogeny and taxonomy. Total DNA from APD 16 isolate was used as a DNA template for amplification of the 16S rRNA gene using 63F and 1387R primers using PCR techniques. Furthermore, PCR products were analyzed using 1% agarose gel electrophoresis technique. APD 16 isolate was successfully amplified and showed DNA fragments measuring ~1300 pb (Figure 1).
International Conference on Natural Sciences, Mathematics, Applications, Research, and Technology
Manado, Indonesia, 22-23 October 2020
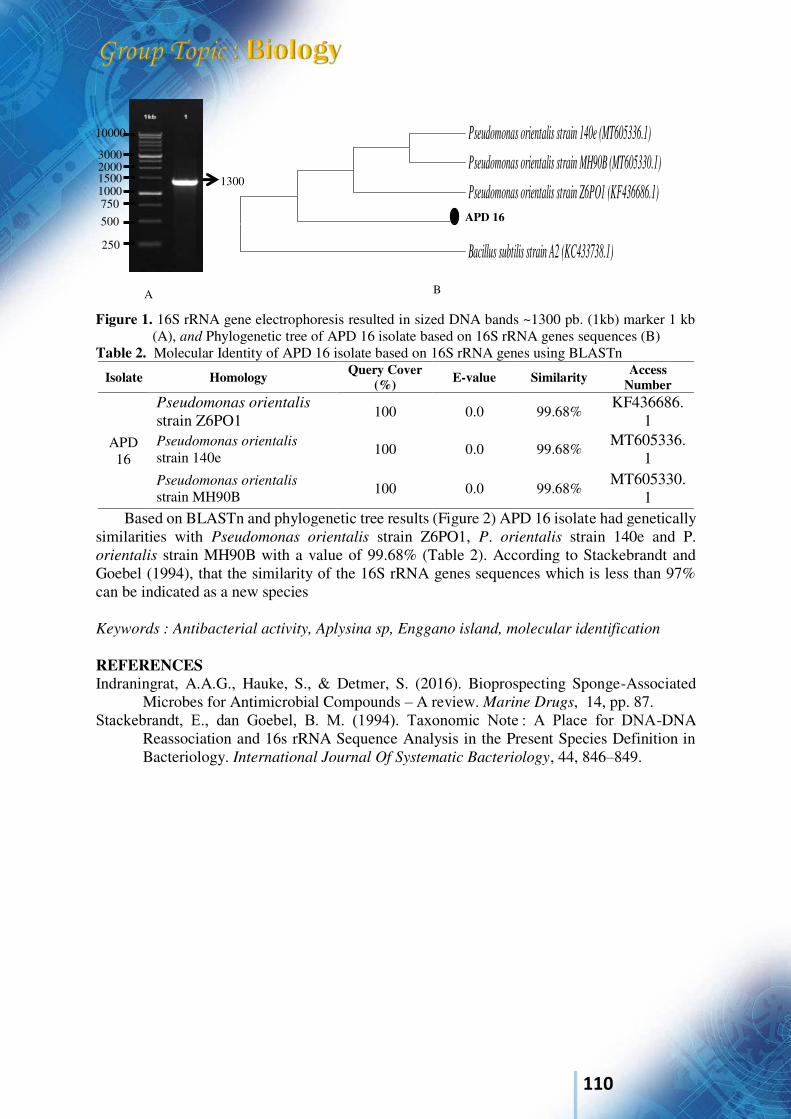
110
Figure 1. 16S rRNA gene electrophoresis resulted in sized DNA bands ~1300 pb. (1kb) marker 1 kb
(A), and Phylogenetic tree of APD 16 isolate based on 16S rRNA genes sequences (B) Table 2. Molecular Identity of APD 16 isolate based on 16S rRNA genes using BLASTn
Isolate Homology Query Cover
(%) E-value Similarity Access
Number
APD 16
Pseudomonas orientalis strain Z6PO1
100 0.0 99.68% KF436686.
1
Pseudomonas orientalis strain 140e
100 0.0 99.68% MT605336.
1
Pseudomonas orientalis strain MH90B 100 0.0 99.68%
MT605330.1
Based on BLASTn and phylogenetic tree results (Figure 2) APD 16 isolate had genetically similarities with Pseudomonas orientalis strain Z6PO1, P. orientalis strain 140e and P. orientalis strain MH90B with a value of 99.68% (Table 2). According to Stackebrandt and Goebel (1994), that the similarity of the 16S rRNA genes sequences which is less than 97% can be indicated as a new species
Keywords : Antibacterial activity, Aplysina sp, Enggano island, molecular identification
REFERENCES Indraningrat, A.A.G., Hauke, S., & Detmer, S. (2016). Bioprospecting Sponge-Associated
Microbes for Antimicrobial Compounds – A review. Marine Drugs, 14, pp. 87. Stackebrandt, E., dan Goebel, B. M. (1994). Taxonomic Note : A Place for DNA-DNA
Reassociation and 16s rRNA Sequence Analysis in the Present Species Definition in Bacteriology. International Journal Of Systematic Bacteriology, 44, 846–849.
250
500
750 1000 1500 2000 3000
10000
1300
Pseudomonas orientalis strain 140e (MT605336.1)
Pseudomonas orientalis strain MH90B (MT605330.1)
Pseudomonas orientalis strain Z6PO1 (KF436686.1)
APD 16
Bacillus subtilis strain A2 (KC433738.1)
APD 16
B A
111
International Conference on Natural Sciences, Mathematics, Applications, Research, and Technology
Manado, Indonesia, 22-23October 2020
Distribution of Snakes in West Nusa Tenggara Yuliadi Zamroni1, Tizar Gusli2, I Wayan Suana3 and Islamul Hadi4
1, 2, 3, 4Biology Study Program, Faculty of Mathematics and Natural Sciences, Universitas Mataram, INDONESIA. (E-mail: [email protected], [email protected], [email protected], [email protected]) INTRODUCTION Among the herpetofaunas, snakes are the top predators that can prey insects, fish, amphibians, other reptiles, birds, and/or other small mammals. It made snakes are important organisms for the stabilization of fauna community structure in their ecosystem. Other than that snake also have a wide distribution and various types of habitat. In the previous studies, snakes distribution usually reported generally such as island, district and other general location types, they not reported detailly in their locality encountred. This study aimed to record the distribution of snake in West Nusa Tenggara and the encounter oportunity of snakes in their environmental. The distribution data of snake has been recorded using two methods, (a) first, record the locality of snakes using Visual Encounter Survey (VES) method. In this method, snakes were collected directly use hooks during an encounter on the observation tract. The observation was focused on the snakes habitas such as trees, bushes, litter piles, wood piles and around rivers in each locations. The (b) second, questionnaire and interview method. We showing the photograph of snakes from the first method and other snakes who have been reported found in Lesser Sunda islands to the respondents and ask them which species they have been encountered. To validated their answer, we ask them more about their ecounter event with the snake, such as, where (habitat and habit) and when (time) they found the snakes and the snake characters RESULTS AND DISCUSSION This study reported 17 species of snakes including to 15 genera and 9 families in West Nusa Tenggara based on both fieldwork and interview methods. They are Ahaetulla prasina, Cerberus
schneiderii, Coleognathus subradiatus, Cylindrophis opisthorhodus, Dendrelaphis pictus,
Gonyosoma oxycephalum, Lycodon capucinus, Lycodon subcinctus, Naja sputatrix, Pareas
carinatus, Phyton bivittatus, Phyton reticulatus, Psammosynastes pulverulentus, Ptyas corros,
Ramphotyphlops braminus, Sybinophis geminates and Trimeresurus insularis.
Three species of that snakes (Ahaetulla prasina, Dendrelaphis pictus, and Trimeresurus
insularis) are common encontered based on both observation and interview. Naja sputatrix and Phyton reticulatus are common encontered in observation but medium reported by respondents, whereas Ramphotyphlops braminus are common reported by respondents but rarely found by researchers. In other side, four species of the snakes are rarely record in both observation and interview, they are Sybinophis geminatus, Cylindrophis opisthorhodus,
Psammosynastes pulverulentus and Phyton bivittatus.
112
During this study,We found three preference habitat of snakes, they are arboreal, teressterial and aquatic. Arboreal snakes have both diurnal and nocturnal characteristic, they could be found on the tree of fruit plantations and rice field. The teressterial species commonly found passing the house yard and sometime entering the house. They also found in the rice field and hiding on the litters of forest floor. Whereas the aquatic species usually found in the edge of river and estuary of mangrove forests. These snakes usualy preying frogs and fishes. Keywords: Lombok, Sumbawa, Serpentes, Distribution, Lesser Sunda. Acknowledgment We acknowledged FMIPA Universitas Mataram for the research grant to IH and team under scheme of PNBP 2020 Fund . We indebted to all respondents for their valuable information during online survey of serpents species of West Nusa Tenggara. References
1. R. D. Lang, The Snakes of The Lesser Sunda Islands (Nusa Tenggara), Asian Herpetological Research, 2011, 2(1): 46-54.
2. K. A. Monk, Y. D. Fretes, and G. R. Lilley, Ekologi Nusa Tenggara dan Maluku, Prenhallindo, Jakarta, 2000.
3. J. C. Murphy, H. K. Voris, and D. R. Karns, The dog-faced wáter snakes, a revision of the
genus Cerberus Cuvier, (Squamata, Serpentes, Homalopsidae), with the description of a new
species, Zootaxa, 2012, 1-34. 4. G. Ramadhan, D. T. Iskandar and D. R. Subasri, A New Species of Cat Snake
(Serpentes: Colubridae) Morphologically Similar to Boiga cynodon from The Nusa
Tenggara Islands Indonesia, Asian Herpetological Research, 2010, 1(1): 22-30. 5. R. Somaweera, A Naturalist’s Guide to The Reptiles & Amhibians of Bali. John Beaufoy
Publishing Ltd, Inggris, 2017.
113
International Conference on Natural Sciences, Mathematics, Applications, Research, and Technology
Manado, Indonesia, 22-23 October 2020
Diversity And Activities Pattern Of Nocturnal Mosquitoes In Tegaldowo And Paweden Villages In Pekalongan Regency Central Java, Indonesia Riski Andrian Jasmi1,2, Niken Satuti Nur Handayani3, RC. Hidayat Soesilohadi4, and Raden Roro Upiek Ngesti Wibawaning Astuti 5* 1 Postgraduate Study Program at the Faculty of Biology,Universitas Gadjah Mada, INDONESIA 2Faculty of Sains Biology Study Program, Universitas Islam Negeri Sultan Maulana Hassanuddin, Banten, INDONESIA (E-mail: [email protected]) 3Genetics and Breeding Laboratory, Faculty of Biology, Universitas Gadjah Mada, INDONESIA (E-mail: [email protected]) 4 Laboratory of Entomology, Faculty of Biology, Universitas Gadjah Mada, INDONESIA (E-mail: [email protected]) 5 Parasitology Division, Laboratory of Animal Systematics, Faculty of Biology, Universitas Gadjah Mada, INDONESIA (E-mail: [email protected]) INTRODUCTION Each species of mosquitoes have specific pattern of activities and habitat. There was low of information and data on the diversity and nocturnal activities of mosquito in such filariasis endemic areas as in Tegaldowo and Paweden Villages. The study aimed was to examine the diversity and nocturnal mosquitoes activities in Tegaldowo and Paweden Villages Pekalongan Regency Central Java. The study aimed was to examine the diversity and nocturnal mosquitoes activities in Tegaldowo and Paweden Villages Pekalongan Regency Central Java. Hand net and aspirator were used for collecting the mosquitoes and was done in one hour period from 6 pm to 6 am. Active and resting of indoor and outdoor mosquitoes were collected. The environmental parameter was observed during the collection RESULTS AND DISCUSSION
Result showed that there was 4 species of mosquitoes have identified, it was Culex quinquefasciatus, Culex tritaeniorhynchus, Anopheles subpictus, and Armigeres subalbatus (Table 1). The nocturnal activities of Cx. tritaeniorhynchus was tend in the early night (6-7 pm), Cx. quinquefasciatus tend to active in around the midlle of the night up to early morning (11 pm-3 am), An. subpictus was active on midnight and Ar. subalbatus on twilight (Table 2). In Paweden villages, Cx. quinquefasciatus mosquito becomes dominant (97.3%), on the other hand in Tegaldowo Village, Cx. tritaeniorhynchus as the dominant species (84.6%). This condition may because of the source of blood. In Tegaldowo Village was more in number and divers of domestic animals. The Cx. tritaeniorhynchus was known as anthopozoofilic mosquito, it more likes animal blood rather than human blood, so it was abundant near the animal cages. The mosquitoes activities were affected by temperature and the humidity. Moderate negative correlation (-0.6636 - -0.6091) and moderate positive correlation (0.5830-0.7474) were showed only for Cx. quinquefasciatus activities in temperature and humidity respectively.
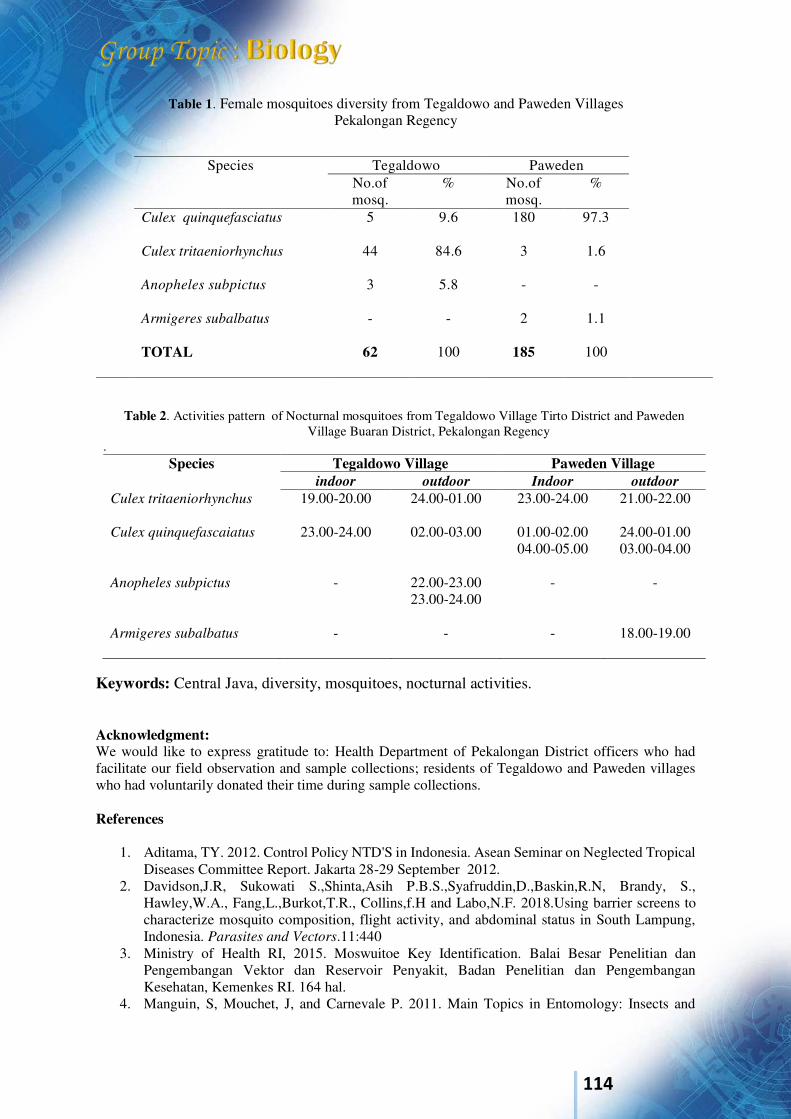
114
Table 1. Female mosquitoes diversity from Tegaldowo and Paweden Villages Pekalongan Regency
Species Tegaldowo Paweden No.of mosq.
% No.of mosq.
%
Culex quinquefasciatus
5 9.6 180 97.3
Culex tritaeniorhynchus
44 84.6 3 1.6
Anopheles subpictus
3 5.8 - -
Armigeres subalbatus
- - 2 1.1
TOTAL
62 100 185 100
Table 2. Activities pattern of Nocturnal mosquitoes from Tegaldowo Village Tirto District and Paweden Village Buaran District, Pekalongan Regency
. Species Tegaldowo Village Paweden Village
indoor outdoor Indoor outdoor Culex tritaeniorhynchus
19.00-20.00 24.00-01.00 23.00-24.00 21.00-22.00
Culex quinquefascaiatus
23.00-24.00 02.00-03.00 01.00-02.00 04.00-05.00
24.00-01.00 03.00-04.00
Anopheles subpictus
- 22.00-23.00 23.00-24.00
- -
Armigeres subalbatus
- - - 18.00-19.00
Keywords: Central Java, diversity, mosquitoes, nocturnal activities. Acknowledgment: We would like to express gratitude to: Health Department of Pekalongan District officers who had facilitate our field observation and sample collections; residents of Tegaldowo and Paweden villages who had voluntarily donated their time during sample collections. References
1. Aditama, TY. 2012. Control Policy NTD'S in Indonesia. Asean Seminar on Neglected Tropical Diseases Committee Report. Jakarta 28-29 September 2012.
2. Davidson,J.R, Sukowati S.,Shinta,Asih P.B.S.,Syafruddin,D.,Baskin,R.N, Brandy, S., Hawley,W.A., Fang,L.,Burkot,T.R., Collins,f.H and Labo,N.F. 2018.Using barrier screens to characterize mosquito composition, flight activity, and abdominal status in South Lampung, Indonesia. Parasites and Vectors.11:440
3. Ministry of Health RI, 2015. Moswuitoe Key Identification. Balai Besar Penelitian dan Pengembangan Vektor dan Reservoir Penyakit, Badan Penelitian dan Pengembangan Kesehatan, Kemenkes RI. 164 hal.
4. Manguin, S, Mouchet, J, and Carnevale P. 2011. Main Topics in Entomology: Insects and

115
Disease Vector, Green Trends in Insect Control, Chapter 1. ed: Lopez, O and Fernandez-Balanos J. RSC Green Chemintry No. 11. Royal Society of Chemistry. www.rsc.org. p: 1-16
5. Pemola Devi N, dan Jauhari R. 2007. Mosquito species associated within some Western Himalayas phytogeographic zones in the Garhwal region of India. J. Insect Sci. 7: 1-10.
6. Vithylingam, I. 2016. Mosquitoes of Public Health Important: Mosquitoes and Public Health. Labert Academic Publisher.
7. Paramasivan, R., S.P. Philip and P. R. Selvaraj. 2015. Biting rhythm of vector mosquitoes in a rural ecosystem of south India. IJMR. 2(3): 106-113.
8. Price, P.W., Denno R.F., Eubanks, N.D., Finke, D.I., dan Kaplan, I., 2011. Insect Ecology:
Behaviour, Populations and Communities. Cambridge University Press 9. Schultz, G.W. 1992. Biting Activity of Mosquitos (Diptera: Culicidae) at A Malarious Site in
Palawan, Republic of The Philippines. Southeast Asean J Trop Med Public Health. 23 (3): 464-469.
116
International Conference on Natural Sciences, Mathematics, Applications, Research, and Technology
Manado, Indonesia, 22-23 October 2020
Hedonic Quality of Functional Chicken Meat Contains a Lot of Omega-3, and Low Cholesterol Jola J.M.R. Londok*1, and John E.G. Rompis2
1Animal Nutrition and Feed Department, Faculty of Animal Husbandry, Sam Ratulangi University, INDONESIA. (E-mail: [email protected]) 2Animal Production Department, Faculty of Animal Husbandry, Sam Ratulangi University, INDONESIA. (E-mail: [email protected]) INTRODUCTION Meat that has been damaged by bacteria is characterized by odor deviations and the appearance of mucus. Functional meat is meat which, apart from having high nutritional value, also contains compounds that can maintain the health of humans who consume it. Fast growth of broiler tends to result in fatty or fat accumulation in broilers due to high appetite (Jahanpour et al., 2015). The resulting functional meat needs to be tested for its hedonic quality after being stored for 90 days in the refrigerator. The functional chicken meat as a result of this study is widely preferred because it is more chewy and muscular, has less fat like broiler chickens. In Indonesia, many consume free-range chicken as a processed menu because the meat is not easily destroyed. Meat from chicken contains amino acids (21.88% non-essential and 19.96% essential). Carcass is the main product of slaughtering livestock which has high economic value (Soeparno, 1992). The most expensive component of carcass is meat and the largest part of the meat is found in the breast, so that the size of the breast is used as a measure to compare the quality of meat in broilers (Muchtadi et al., 2010). Body parts affect the amount of fat, breast meat is relatively lower than thigh meat (Pane 2006). This study was conducted with the aim of measuring hedonic quality of functional chicken meat contains a lot of omega-3 fatty acids and low cholesterol.
The study was conducted on 240 day-old broilers with an average body weight of Lohman strain of 44.16 ± 3.72 grams using a 3x2 factorial completely randomized design with 4 replications. As factor A is a source of oil, namely A1 fish canning waste oil (FO), A2 coconut oil (CO), and A3 pure lauric acid (LA). Factor B is the level of oil on ration, namely B1 5%, and B2 8%. 6 treatment combinations apply. The feed was given until day 35. At the end of the study the chickens were fasted for 8 hours (all night) and the next morning the chicken was slaughtered for variable measurement. Slaughter was carried out on 1 broiler for each experimental unit. The preparation of breast meat samples was then stored in a refrigerator at -20oC, for 90 days. Furthermore, for the hedonic test using chicken breast meat. Half-trained panelists tested the hedonic quality of chicken meat. Data analysis used Minitab version 16. If there are significant differences between treatment combinations and their interactions or at least one treatment combination and their interactions are significantly different, it is followed by an honest real difference test (BNJ). RESULTS AND DISCUSSION The result showed that the real interaction was shown in the tenderness and texture variables. Tenderness and texture of broiler breast meat can be seen significantly by the level of crude fiber, while oil extract and flavor can be seen significantly by the source of oil. There was no interaction between the source of oil and fiber levels on chicken meat color.
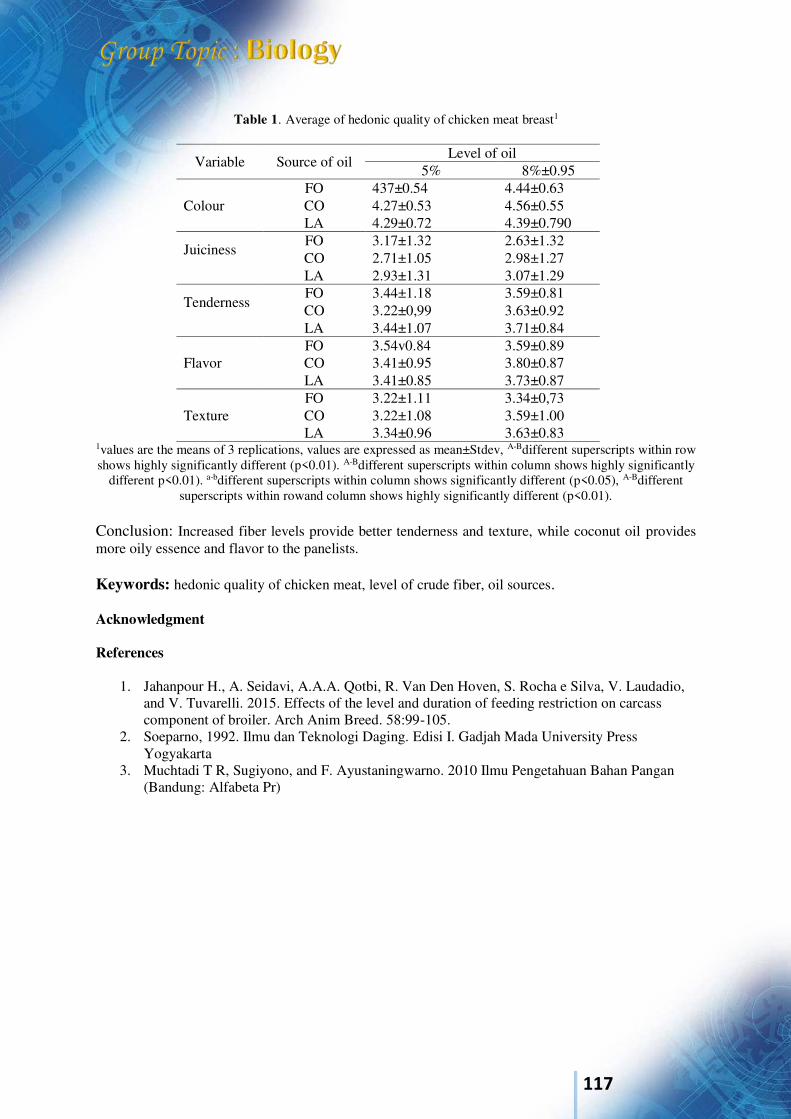
117
Table 1. Average of hedonic quality of chicken meat breast1
Variable Source of oil Level of oil
5% 8%±0.95
Colour FO 437±0.54 4.44±0.63 CO 4.27±0.53 4.56±0.55 LA 4.29±0.72 4.39±0.790
Juiciness
FO 3.17±1.32 2.63±1.32 CO 2.71±1.05 2.98±1.27 LA 2.93±1.31 3.07±1.29
Tenderness
FO 3.44±1.18 3.59±0.81 CO 3.22±0,99 3.63±0.92 LA 3.44±1.07 3.71±0.84
Flavor FO 3.54v0.84 3.59±0.89 CO 3.41±0.95 3.80±0.87 LA 3.41±0.85 3.73±0.87
Texture FO 3.22±1.11 3.34±0,73 CO 3.22±1.08 3.59±1.00 LA 3.34±0.96 3.63±0.83
1values are the means of 3 replications, values are expressed as mean±Stdev, A-Bdifferent superscripts within row shows highly significantly different (p<0.01). A-Bdifferent superscripts within column shows highly significantly
different p<0.01). a-bdifferent superscripts within column shows significantly different (p<0.05), A-Bdifferent superscripts within rowand column shows highly significantly different (p<0.01).
Conclusion: Increased fiber levels provide better tenderness and texture, while coconut oil provides more oily essence and flavor to the panelists. Keywords: hedonic quality of chicken meat, level of crude fiber, oil sources. Acknowledgment References
1. Jahanpour H., A. Seidavi, A.A.A. Qotbi, R. Van Den Hoven, S. Rocha e Silva, V. Laudadio, and V. Tuvarelli. 2015. Effects of the level and duration of feeding restriction on carcass component of broiler. Arch Anim Breed. 58:99-105.
2. Soeparno, 1992. Ilmu dan Teknologi Daging. Edisi I. Gadjah Mada University Press Yogyakarta
3. Muchtadi T R, Sugiyono, and F. Ayustaningwarno. 2010 Ilmu Pengetahuan Bahan Pangan (Bandung: Alfabeta Pr)
118
International Conference on Natural Sciences, Mathematics, Applications, Research, and Technology
Manado, Indonesia, 22-23 October 2020
METAL STORAGE IN MANGROVE SEDIMENTS OF BUNAKEN NATIONAL PARK James J.H. Paulus 1, Rignolda Djamaluddin2 and Hariyani Sambali 3
. 1, 2,3Authors’ Faculty of Fisheries and Marine Science, Sam Ratulangi University, Manado, North Sulawesi, Indonesia. (E-mail: [email protected]) INTRODUCTION Minahasa Peninsula in North Sulawesi Province has recognized as the suitable region mangrove along the coast. Biodiversity at the coastal zone makes some certain área as an attractive diving spot, such as the Bunaken National Park. The importance of managing Bunaken National Park for comprehensive study and maintenance. This study aims to determine the presence of heavy metals containing As, Pb, Cd, and Hg in mangrove sediments. Traced the metal's presence were began at the eastern part of the island of Bunaken as the first part to receive the Indonesian main stream (ARLINDO), and headed to the south stream also as the prefer point for diving. Sediment sample were analyze with ICP-MS, ICP-OES, CV-AFS, APHA 2012. Beneficial Mutual interaction of mangroves, seagrass communities, and coral reefs require integrated management. Bunaken National Park as a targeted area for tourism is importantly to take a point for conservation. Increasingly of human activity and population around Bunaken island also could increase stressed to the Bunaken specifically sinking the solid material to the sediment . As beautiful área that can support local and national income for developing our economics, the maintenance and supervisor of national parks from the pressure of polluting materials is very important to implement. The lack of data and information about the presence of toxic metals in sediments is also a limitation in conducting comprehensive scientific studies. Mangrove presence is very important in maintaining environmental pressure due to human activity. At the eastern part of Bunaken national park there is no mangrove and characterized as white sandy beach, and this is as a natural condition. At the middle part of Bunaken Island there are many mangroves with a type of muddy sediment. Increased human activity either in Manado city and the natural events surrounding areas or with the presence of several rivers facing Bunaken Island will also be recorded in the presence of metal in sediment. Research is needed to determine the presence of toxic metals arsenic, cadmium, lead, and mercury in the sediment. RESULTS AND DISCUSSION Sediment samples were taken at three different substrate types. The first as point A characterized by sandy substrate, the second as point B the muddy sand substrate, and C the thirds is the muddy substrate. The type of that sediment is shown in figure 1.
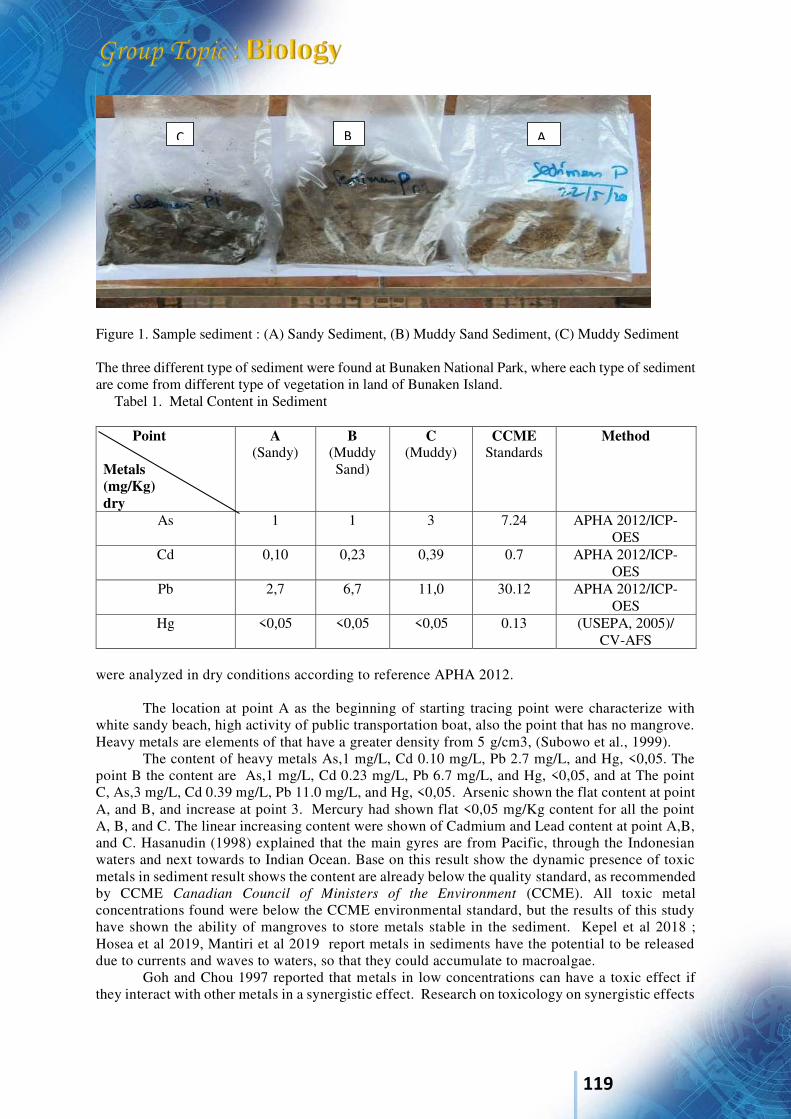
119
Figure 1. Sample sediment : (A) Sandy Sediment, (B) Muddy Sand Sediment, (C) Muddy Sediment The three different type of sediment were found at Bunaken National Park, where each type of sediment are come from different type of vegetation in land of Bunaken Island. Tabel 1. Metal Content in Sediment
Point Metals (mg/Kg) dry
A (Sandy)
B (Muddy Sand)
C (Muddy)
CCME Standards
Method
As 1 1 3 7.24 APHA 2012/ICP-OES
Cd 0,10 0,23 0,39 0.7 APHA 2012/ICP-OES
Pb 2,7 6,7 11,0 30.12 APHA 2012/ICP-OES
Hg <0,05 <0,05 <0,05 0.13 (USEPA, 2005)/ CV-AFS
were analyzed in dry conditions according to reference APHA 2012.
The location at point A as the beginning of starting tracing point were characterize with
white sandy beach, high activity of public transportation boat, also the point that has no mangrove. Heavy metals are elements of that have a greater density from 5 g/cm3, (Subowo et al., 1999).
The content of heavy metals As,1 mg/L, Cd 0.10 mg/L, Pb 2.7 mg/L, and Hg, <0,05. The point B the content are As,1 mg/L, Cd 0.23 mg/L, Pb 6.7 mg/L, and Hg, <0,05, and at The point C, As,3 mg/L, Cd 0.39 mg/L, Pb 11.0 mg/L, and Hg, <0,05. Arsenic shown the flat content at point A, and B, and increase at point 3. Mercury had shown flat <0,05 mg/Kg content for all the point A, B, and C. The linear increasing content were shown of Cadmium and Lead content at point A,B, and C. Hasanudin (1998) explained that the main gyres are from Pacific, through the Indonesian waters and next towards to Indian Ocean. Base on this result show the dynamic presence of toxic metals in sediment result shows the content are already below the quality standard, as recommended by CCME Canadian Council of Ministers of the Environment (CCME). All toxic metal concentrations found were below the CCME environmental standard, but the results of this study have shown the ability of mangroves to store metals stable in the sediment. Kepel et al 2018 ; Hosea et al 2019, Mantiri et al 2019 report metals in sediments have the potential to be released due to currents and waves to waters, so that they could accumulate to macroalgae.
Goh and Chou 1997 reported that metals in low concentrations can have a toxic effect if they interact with other metals in a synergistic effect. Research on toxicology on synergistic effects
A B C
120
that can have adverse effects on organisms is very important, such as the information on several metals in this study.
Paulus et al (2014) ; Paulus et al (2020) reported the high content of cadmium at Likupang also accumulated to the mangrove root up to the leaf and to the insect that uses mangrove as a host. Darmono (1995) listed of the highest order of metal toxicity to the lowest here Hg2+ > Cd2+ >Ag2+ > Ni2+ > Pb 2+ > As2+ > Cr2+ Sn2+ > Zn2+. The presence of a substrate such as sediment with muddy characteristics will further interact with mangroves and can affect their growth patterns. Djamaluddin R. 2019. Growth pattern in tropical mangrove trees of Bunaken National Park, References American Public Health Association (APHA), 2012. Standard methods for the examination of water
and wastewater. amer. 22th Edition. New York Health Association. Darmono., 1995. Logam Dalam Sistem Biologi Makhluk Hidup. Jakarta. Penerbit
Universitas Indonesia. Djamaluddin R. 2019. Growth pattern in tropical mangrove trees of Bunaken National Park, North
Sulawesi, Indonesia. BIODIVERSITAS ISSN: 1412-033X Volume 20, Number 6, June 2019 E-ISSN: 2085-4722 Pages: 1713-1720
Hasanudin M. 1998 Arus Lintas Indonesia (ARLINDO). Oseana, Vol XXIII, ISSN 0216 1877.Balai Penelitian Biologi Laut. Pusat Penelitian dan Pengembangan Oseanologi – LIPI. JakartaNo 2 ; 1 – 9 .
Kepel R.C., Mantiri D.M.H., Paransa D. S. J. Paulus J. J. H. Nasprianto, Wagey B.T., 2018. Arsenic content, cell structure, and pigment of Ulva sp. from Totok Bay and Blongko waters, North Sulawesi, Indonesia. AACL Bioflux, 2018, Volume 11, Issue 3. http://www.bioflux.com.ro/aacl
Mantiri. D.M.H.,Kepel, R.C., Manoppo H, Paulus J.J.H., Paransa D.S., Nasprianto. 2019. Metals in seawater, sediment and Padina australis (Hauck, 1887) algae in the waters of North Sulawesi. AACL Bioflux, 2019, Volume 12, Issue 3. http://www.bioflux.com.ro/aacl
Paulus J.J.H., Pelealu J., Tulung M., Gerung G. 2015. Barcode of a New Species Insect in Mangrove Ecosystem at Likupang Village, North Minahasa Regency, North Sulawesi Province, Indonesia. International Journal of Research in Engineering and Science (IJRES) ISSN (Online): 2320-9364, ISSN (Print): 2320-9356 www.ijres.org Volume 3 Issue 5 ǁ May 2015 ǁ PP.46-49
Subowo, Kurniansyah, A.M., & Sukristiyonubowo., 1999. Pengaruh Logam Berat Pb dalam Tanah
terhadap Kandungan Pb, Pertumbuhan dan asil Tanam Caisem (Brassica rapa). Prosiding Seminar Sumber Daya Tanah, Iklim dan Pupuk. Puslittanak. Bogor. Hosea F., Mantiri, D. M H., Paulus, James J H., Rompas, Rizald M., Lumoindong F., Mudeng J. D.
2019. Analisis Logam Timbal (Pb) Pada Kappaphycus alvarezii (Doty) Alga Merah Yang di Budidaya di Teluk Totok Minahasa Tenggara, Sulawesi Utara. Vol 7, No 3. https://ejournal.unsrat.ac.id/index.php/jplt/article/view/24430/24098
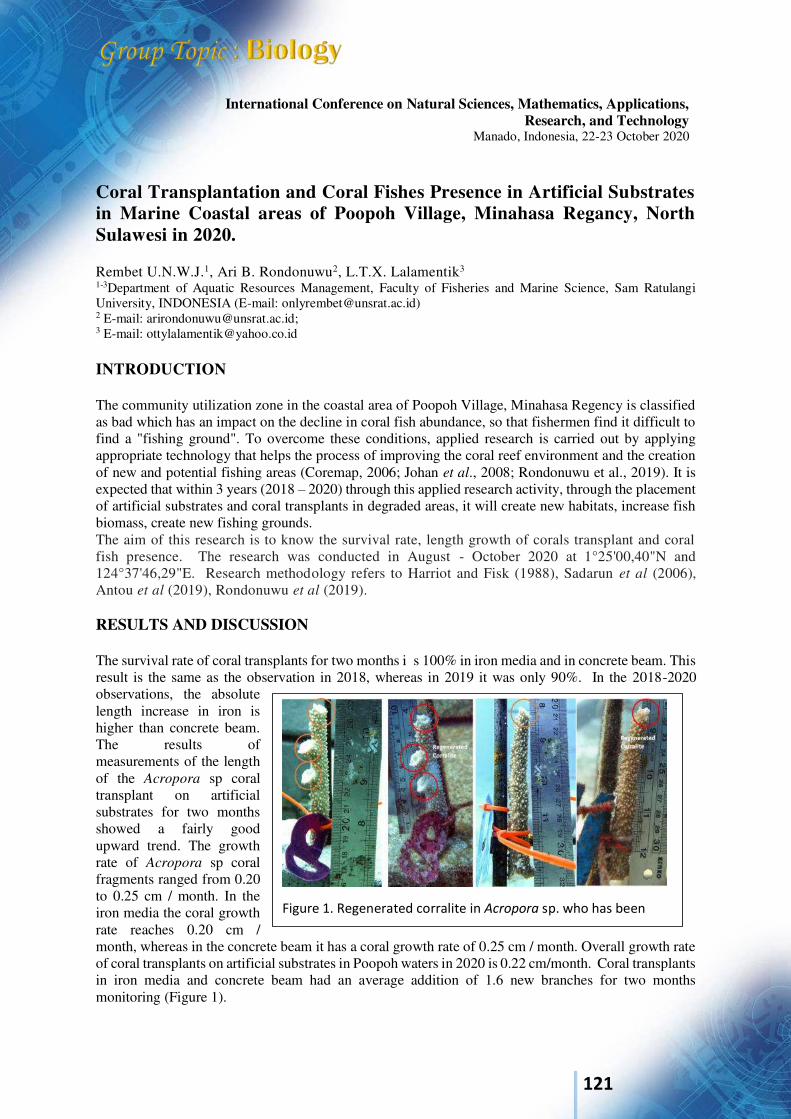
121
International Conference on Natural Sciences, Mathematics, Applications, Research, and Technology
Manado, Indonesia, 22-23 October 2020
Coral Transplantation and Coral Fishes Presence in Artificial Substrates in Marine Coastal areas of Poopoh Village, Minahasa Regancy, North Sulawesi in 2020. Rembet U.N.W.J.1, Ari B. Rondonuwu2, L.T.X. Lalamentik3 1-3Department of Aquatic Resources Management, Faculty of Fisheries and Marine Science, Sam Ratulangi University, INDONESIA (E-mail: [email protected]) 2 E-mail: [email protected]; 3 E-mail: [email protected] INTRODUCTION The community utilization zone in the coastal area of Poopoh Village, Minahasa Regency is classified as bad which has an impact on the decline in coral fish abundance, so that fishermen find it difficult to find a "fishing ground". To overcome these conditions, applied research is carried out by applying appropriate technology that helps the process of improving the coral reef environment and the creation of new and potential fishing areas (Coremap, 2006; Johan et al., 2008; Rondonuwu et al., 2019). It is expected that within 3 years (2018 – 2020) through this applied research activity, through the placement of artificial substrates and coral transplants in degraded areas, it will create new habitats, increase fish biomass, create new fishing grounds. The aim of this research is to know the survival rate, length growth of corals transplant and coral fish presence. The research was conducted in August - October 2020 at 1°25'00,40"N and 124°37'46,29"E. Research methodology refers to Harriot and Fisk (1988), Sadarun et al (2006), Antou et al (2019), Rondonuwu et al (2019). RESULTS AND DISCUSSION The survival rate of coral transplants for two months i s 100% in iron media and in concrete beam. This result is the same as the observation in 2018, whereas in 2019 it was only 90%. In the 2018-2020 observations, the absolute length increase in iron is higher than concrete beam. The results of measurements of the length of the Acropora sp coral transplant on artificial substrates for two months showed a fairly good upward trend. The growth rate of Acropora sp coral fragments ranged from 0.20 to 0.25 cm / month. In the iron media the coral growth rate reaches 0.20 cm / month, whereas in the concrete beam it has a coral growth rate of 0.25 cm / month. Overall growth rate of coral transplants on artificial substrates in Poopoh waters in 2020 is 0.22 cm/month. Coral transplants in iron media and concrete beam had an average addition of 1.6 new branches for two months monitoring (Figure 1).
Figure 1. Regenerated corralite in Acropora sp. who has been
transplanted.
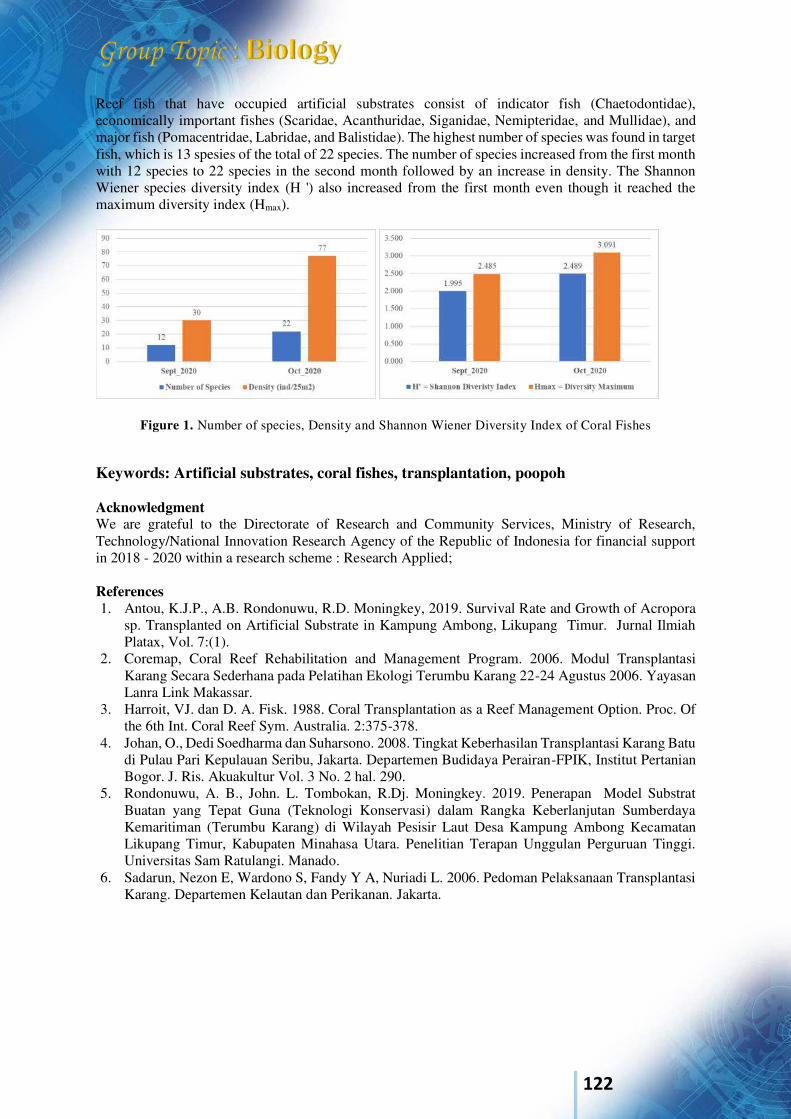
122
Reef fish that have occupied artificial substrates consist of indicator fish (Chaetodontidae), economically important fishes (Scaridae, Acanthuridae, Siganidae, Nemipteridae, and Mullidae), and major fish (Pomacentridae, Labridae, and Balistidae). The highest number of species was found in target fish, which is 13 spesies of the total of 22 species. The number of species increased from the first month with 12 species to 22 species in the second month followed by an increase in density. The Shannon Wiener species diversity index (H ') also increased from the first month even though it reached the maximum diversity index (Hmax).
Figure 1. Number of species, Density and Shannon Wiener Diversity Index of Coral Fishes
Keywords: Artificial substrates, coral fishes, transplantation, poopoh Acknowledgment We are grateful to the Directorate of Research and Community Services, Ministry of Research, Technology/National Innovation Research Agency of the Republic of Indonesia for financial support in 2018 - 2020 within a research scheme : Research Applied; References 1. Antou, K.J.P., A.B. Rondonuwu, R.D. Moningkey, 2019. Survival Rate and Growth of Acropora
sp. Transplanted on Artificial Substrate in Kampung Ambong, Likupang Timur. Jurnal Ilmiah Platax, Vol. 7:(1).
2. Coremap, Coral Reef Rehabilitation and Management Program. 2006. Modul Transplantasi Karang Secara Sederhana pada Pelatihan Ekologi Terumbu Karang 22-24 Agustus 2006. Yayasan Lanra Link Makassar.
3. Harroit, VJ. dan D. A. Fisk. 1988. Coral Transplantation as a Reef Management Option. Proc. Of the 6th Int. Coral Reef Sym. Australia. 2:375-378.
4. Johan, O., Dedi Soedharma dan Suharsono. 2008. Tingkat Keberhasilan Transplantasi Karang Batu di Pulau Pari Kepulauan Seribu, Jakarta. Departemen Budidaya Perairan-FPIK, Institut Pertanian Bogor. J. Ris. Akuakultur Vol. 3 No. 2 hal. 290.
5. Rondonuwu, A. B., John. L. Tombokan, R.Dj. Moningkey. 2019. Penerapan Model Substrat Buatan yang Tepat Guna (Teknologi Konservasi) dalam Rangka Keberlanjutan Sumberdaya Kemaritiman (Terumbu Karang) di Wilayah Pesisir Laut Desa Kampung Ambong Kecamatan Likupang Timur, Kabupaten Minahasa Utara. Penelitian Terapan Unggulan Perguruan Tinggi. Universitas Sam Ratulangi. Manado.
6. Sadarun, Nezon E, Wardono S, Fandy Y A, Nuriadi L. 2006. Pedoman Pelaksanaan Transplantasi Karang. Departemen Kelautan dan Perikanan. Jakarta.
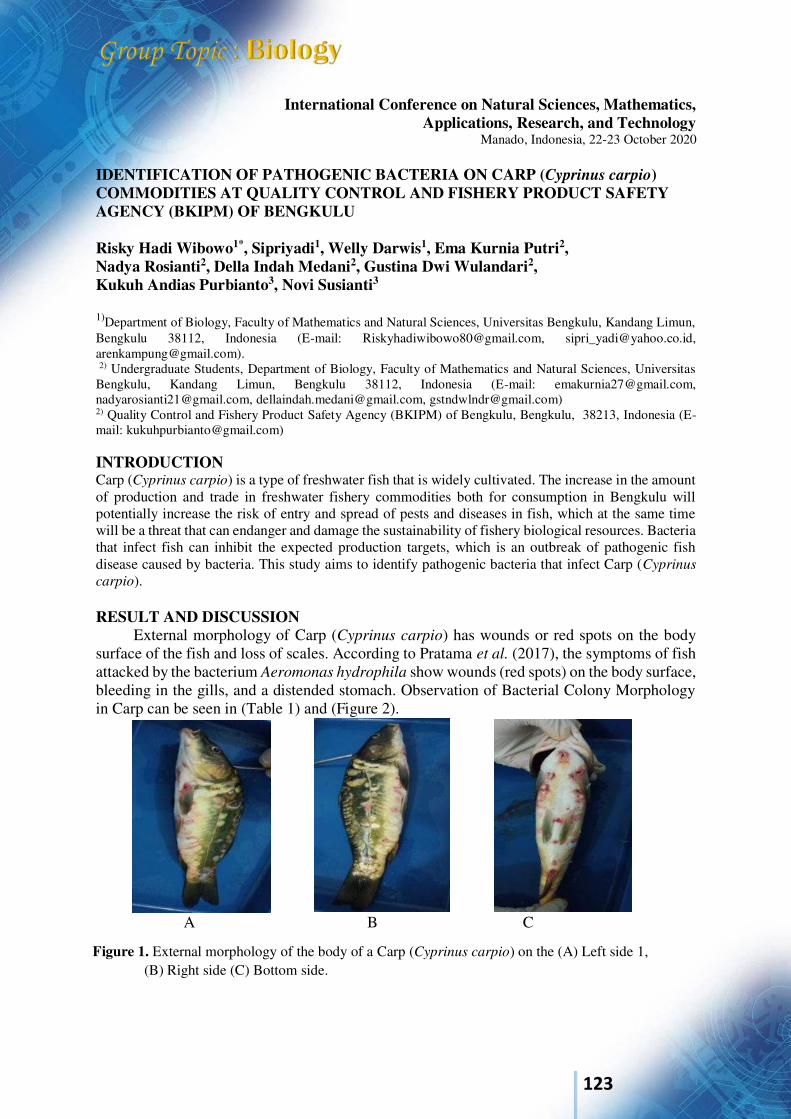
123
International Conference on Natural Sciences, Mathematics, Applications, Research, and Technology
Manado, Indonesia, 22-23 October 2020
IDENTIFICATION OF PATHOGENIC BACTERIA ON CARP (Cyprinus carpio) COMMODITIES AT QUALITY CONTROL AND FISHERY PRODUCT SAFETY AGENCY (BKIPM) OF BENGKULU Risky Hadi Wibowo1*, Sipriyadi1, Welly Darwis1, Ema Kurnia Putri2, Nadya Rosianti2, Della Indah Medani2, Gustina Dwi Wulandari2, Kukuh Andias Purbianto3, Novi Susianti3
1)Department of Biology, Faculty of Mathematics and Natural Sciences, Universitas Bengkulu, Kandang Limun, Bengkulu 38112, Indonesia (E-mail: [email protected], [email protected], [email protected]). 2) Undergraduate Students, Department of Biology, Faculty of Mathematics and Natural Sciences, Universitas Bengkulu, Kandang Limun, Bengkulu 38112, Indonesia (E-mail: [email protected], [email protected], [email protected], [email protected]) 2) Quality Control and Fishery Product Safety Agency (BKIPM) of Bengkulu, Bengkulu, 38213, Indonesia (E-mail: [email protected])
INTRODUCTION Carp (Cyprinus carpio) is a type of freshwater fish that is widely cultivated. The increase in the amount of production and trade in freshwater fishery commodities both for consumption in Bengkulu will potentially increase the risk of entry and spread of pests and diseases in fish, which at the same time will be a threat that can endanger and damage the sustainability of fishery biological resources. Bacteria that infect fish can inhibit the expected production targets, which is an outbreak of pathogenic fish disease caused by bacteria. This study aims to identify pathogenic bacteria that infect Carp (Cyprinus
carpio). RESULT AND DISCUSSION
External morphology of Carp (Cyprinus carpio) has wounds or red spots on the body surface of the fish and loss of scales. According to Pratama et al. (2017), the symptoms of fish attacked by the bacterium Aeromonas hydrophila show wounds (red spots) on the body surface, bleeding in the gills, and a distended stomach. Observation of Bacterial Colony Morphology in Carp can be seen in (Table 1) and (Figure 2).
A B C
Figure 1. External morphology of the body of a Carp (Cyprinus carpio) on the (A) Left side 1, (B) Right side (C) Bottom side.
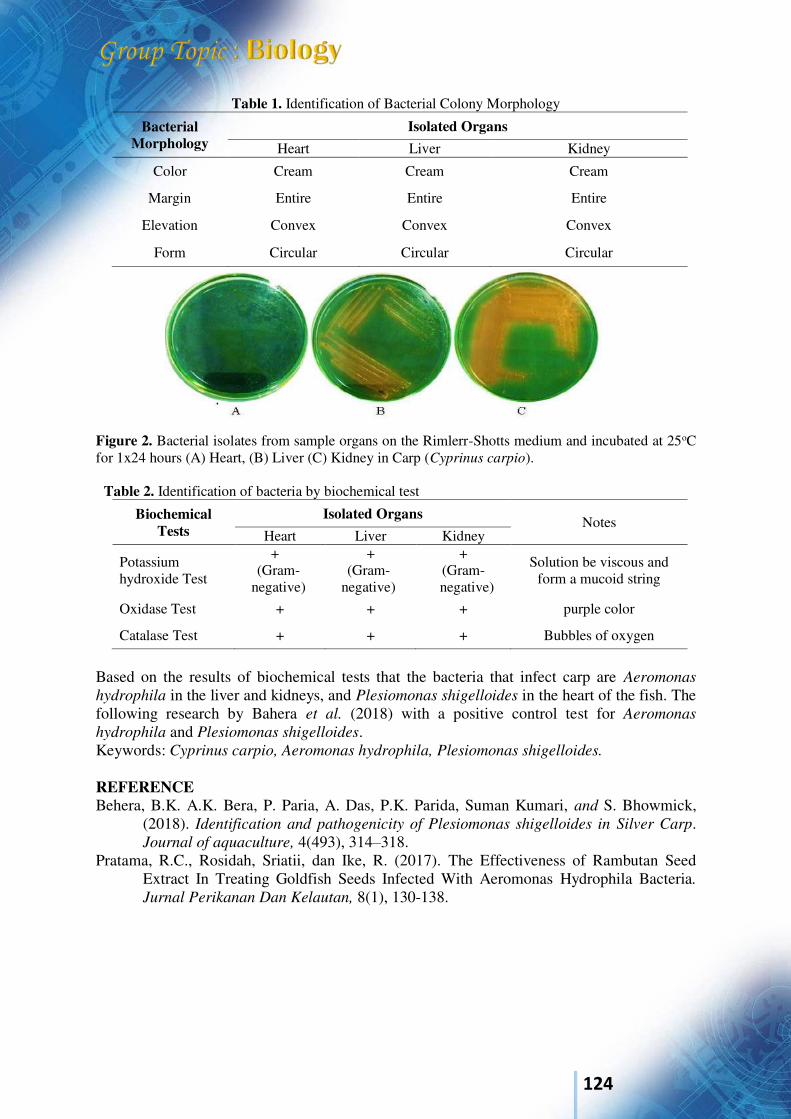
124
Table 1. Identification of Bacterial Colony Morphology
Bacterial Morphology
Isolated Organs
Heart Liver Kidney
Color Cream Cream Cream
Margin Entire Entire Entire
Elevation Convex Convex Convex
Form Circular Circular Circular
Figure 2. Bacterial isolates from sample organs on the Rimlerr-Shotts medium and incubated at 25oC for 1x24 hours (A) Heart, (B) Liver (C) Kidney in Carp (Cyprinus carpio). Table 2. Identification of bacteria by biochemical test
Biochemical Tests
Isolated Organs Notes
Heart Liver Kidney
Potassium hydroxide Test
+ (Gram-
negative)
+ (Gram-
negative)
+ (Gram-negative)
Solution be viscous and form a mucoid string
Oxidase Test + + + purple color
Catalase Test + + + Bubbles of oxygen
Based on the results of biochemical tests that the bacteria that infect carp are Aeromonas
hydrophila in the liver and kidneys, and Plesiomonas shigelloides in the heart of the fish. The following research by Bahera et al. (2018) with a positive control test for Aeromonas
hydrophila and Plesiomonas shigelloides. Keywords: Cyprinus carpio, Aeromonas hydrophila, Plesiomonas shigelloides. REFERENCE Behera, B.K. A.K. Bera, P. Paria, A. Das, P.K. Parida, Suman Kumari, and S. Bhowmick,
(2018). Identification and pathogenicity of Plesiomonas shigelloides in Silver Carp. Journal of aquaculture, 4(493), 314–318.
Pratama, R.C., Rosidah, Sriatii, dan Ike, R. (2017). The Effectiveness of Rambutan Seed Extract In Treating Goldfish Seeds Infected With Aeromonas Hydrophila Bacteria.
Jurnal Perikanan Dan Kelautan, 8(1), 130-138.
125
International Conference on Natural Sciences, Mathematics, Applications, Research, and Technology
Manado, Indonesia, 22-23 October 2020
Secondary Metabolite Compounds and Antibacterial Activity of Extracts Annella sp Sea Fans from Bunaken Waters Manado North Sulawesi Indonesia Febby Ester Fany Kandou*1, Remy E.P. Mangindaan2, Rizald M. Rompas3 and Herny I. Simbala4, Agustina M. Tangapo5, Pience V. Maabuat6
1,5,6Departement of Biology, Faculty of Mathematics and Natural Science, Sam Ratulangi University INDONESIA (Email: [email protected]) 2,3Departement of Marine Science, Faculty of Fisheries and Marine Science, Sam Ratulangi University INDONESIA 4Departement of Pharmacy, Faculty of Mathematics and Natural Science, Sam Ratulangi University INDONESIA INTRODUCTION Marine organisms have been found that have a number of metabolite compounds with pharmacological potential such as polyketides, alkaloids, terpenoids, peptides, proteins, lipids, shikimate, glycosides, and isoprenoids that have biological activity (Rateb and Ebel, 2011). The products of metabolite compounds derived from mangroves, algae, seagrass, sponges and other marine organisms have potential as anticancer agents (Mangindaan et al. 2013; Ravikumar et al. 2012; Bringmann, 2007; Liu, 2005), anti-tumor (Piel, 2004; Zheng, 2000), antimalarial (Ravikumar et al. 2011; Ang, 2000), antibacterial (Ravikumar, 2016; Sulistiyani, 2015; Bara et al. 2013), antifungal (Han, 2009; Schmidt, 2000), antiviral (Perry , 1988). The Anthozoa class with 10 orders has approximately 7500 species, the Alcyonacea order and the Gorgonacea order have a number of promising bioactive compounds (Appeltans et al. (2010) cited by Rocha et al. (2011)). According to Rocha et al. (2011), the potential of the Anthozoa as a producer of bioactive compounds in the last decade shows that the Alcyonacea order is around 45% and the Gorgonacea order is about 35% higher than the other orders. Sea fans are known to contain high and varied bioactive compounds in the discovery of new compounds. Over the last three decades there have been numerous studies reported describing the isolation of novel compounds sesquiterpens, terpenes, and other chemical defense products from the fatty acid metabolism of marine fans. These secondary metabolites have potential in the pharmaceutical field. Based on the literature, it is reported that the Gorgonacea order has a large enough potential to be developed by looking at the secondary metabolites produced which have a number of bioactivity. Rodriguez et al. (2003) and Rodriguez et al. (2000) reported that ileabetoxazol, homopseudopteroxazol, karibenol A and B and elisapterosin B from sea fans Pseudopterogorgia elisabethae and bipinapterolid B from Pseudopterogorgia bipinnata could inhibit Mycobacterium tuberculosis bacteria. Fuganti and Serra (2000) reported that curcufenol, curququinone and curquidroquinone isolated from sea fans Pseudopterogorgia rigida showed antibacterial properties against Staphylococcus aureus and Vibrio
anguillarum. Research on secondary metabolite compounds and the antibacterial activity of Annella sp sea fans living in Bunaken waters Manado has not been reported so that research is very potential to obtain scientific information that can be further developed. The aim of this research was to determine the secondary
126
metabolite compound and to test the antibacterial activity of methanol and ethylacetate extracts from sea fan Annella sp against pathogenic bacteria. MATERIAL AND METHODS Sea fan samples were taken at Bunaken waters Manado. The gorgonian samples obtained were cleaned then put into sterile plastic without seawater and immediately stored in a 40C cool box to be brought to the laboratory. Then, the procedures were extraction, secondary metabolite compound screening (alkaloid, flavonoids, triterpenoids/steroids, saponins, tannins), and antibacterial assay using the Kirby-Bauer method (agar diffusion). RESULTS AND DISCUSSION The secondary metabolite components produced differ between methanol extract and ethylacetate extract. It was detected that the polar methanol extract has secondary metabolite components, namely alkaloids, flavonoids, saponins, steroids and terpenoids. While the semi-polar ethylacetate extract has secondary metabolite components, namely alkaloids, saponins, steroids and terpenoids. According to Manuputty (2008), active compounds present in octocoral animal tissue are used as defense, rapid colony formation and expansion as well as in an effort to fight over land for living for colony expansion. The other side of octokoralia animal life is that it has allelopathic properties. This property is beneficial for these animals but detrimental to other animals around them because it can inhibit growth and even kill other animals, especially those that live attached to them (Sammarco, et al. 1983 in Manuputty, 1990). This deadly method is done by removing toxic substances consisting of organic compounds. Furthermore, the two sample extracts, methanol extract and ethylacetate extract, were tested for antibacterial activity against Gram-positive Staphylococcus aureus and Gram-negative Escherichia coli. The results of measuring the inhibition zone diameter for ethyl acetate extract and methanol extract can be seen Staphylococcus aureus at ethyl acetate extract 13.3 ± 0.76 strong level and methanol extract 7.2 ± 0.29 moderate level. Escherichia coli ethyl acetate extract 14.0 ± 1.32 strong level and metanol extract 7.3 ± 0.58 moderate level, positive control 18.5 ± 0.76.
The existence of secondary metabolites through their mechanism of action is an important factor in inhibiting bacterial growth. The compounds contained in the Annella sp extract are responsible for inhibiting the growth of the tested bacteria Staphylococcus aureus and Escherichia coli.
Keywords:, antibacterial, Annella sp, Bunaken waters, phytochemical, sea fans Acknowledgment References Ang, K.K.H., M.J. Holmes, T. Higa, M.T Hamann, U.A.K Kara. 2000. In vivo Antimalarial Activity
of the Beta-carboline Alkaloid Manzamine A. Antimicrob Agents Chemother. 44: 1645–1649
Bringmann, G., T.A.M. Gulder, G. Lang, S. Schmitt, R. Stöhr, J. Wiese, K. Nagel, J.F. Imhoff. 2007. Large–scale Biotechnological Production of the Antileukemic Marine Natural Product
Sorbicillactone A. Mar Drugs 5: 23–30 Bara, R.A., I. Zerfaß, D. Lai1, W. Lin, A. Debbab, Heike Brötz-Oesterelt, and P. Proksch. 2013.
New Natural Product from Botryosphaeria australis, an Endophyte from Mangrove Avicennia
marina. Squalen Bulletin of Marine & Fisheries Postharvest & Biotechnology, 8 (3): 139-145 Fuganti, C. and S. Serra. 2000. Baker’s Yeast-mediated Enantioselective Synthesis of the Bisabolane
Sesquiterpenes (+)-curcuphenol, (+)-xanthorrhizol, (-)-curcuquinone and (+)-
curcuhydroquinone. J. Chem. Soc Perkin Trans. 1: 3758 Han, Y., B. Yang, F. Zhang, X. Miao, Z. Li. 2009. Characterization of Antifungal chitinase from
Marine Streptomyces sp. DA11 Associated with South China Sea Sponge Craniella
australiensis. Mar Biotechnol 11: 132–140
127
Liu, R., C. Cui, L. Duan, Q. Gu, W. Zhu. 2005. Potent in Vitro Anticancer Activity of
Metacycloprodigiosin and Undecylprodigiosin from a Sponge-Derived
Actinomycete Saccharopolyspora sp nov. Arch Pharm Res. 28: 1341–1344 Manuputty, A.E.W. 1990. Senyawa terpen dalam karang lunak (Octocorallia: Alcyonacea). Oseana 15
(2): 77-84 Mangindaan, R.E.P. dan R.Y. Taroreh. 2013. Pengujian Aktivitas Larvasida dari Ekstrak Ascidian
Lissoclinum patella terhadap Larva Nyamuk Aedes aegypti. Jurnal Pesisir dan Laut Tropis 3 (1):13-17
Piel, J., D. Hui, G. Wen, D. Butzke, M. Platzer, N. Fusetani, S. Matsunaga. 2004. Antitumor
Polyketide Biosynthesis by an Uncultivated Bacterial Symbiont of The Marine
Sponge Theonella swinhoei. Proc Natl Acad Sci. 101: 16222–16227 Perry, N.B., J.W Blunt, M.H.G. Munro. 1988. Mycalamide A, an Antiviral Compound from a New
Zealand Sponge of the Genus Mycale. J Am Chem Soc 110: 4850–4851 Ravikumar, S., G. Uma, R. Gokulakrishnan. 2016. Antibacterial Property of Halobacterial
Carotenoids against Human Bacterial Pathogens. Journal of Scientific and Industrial Research 75: 253-257
Ravikumar, S., M. Fredimoses, M. Gnanadesigan. 2012. Anticancer Property of Sediment
Actinomycetes against MCF-7 and MDA-MB-231 cell lines. Asian Pac. J. Trop. Biomed. 2 (2): 92-96
Rateb, M.E. and R. Ebel. 2011. Secondary Metabolites of Fungi from Marine Habitats. Nat. Prod. Rep. 28: 290-344
Ravikumar, S., S.J. Inbaneson, P. Suganthi, R. Gokulakrishnan, M. Venkatesan. 2011. In vitro
Antiplasmodial Activity of Ethanolic Extract of Seaweed Macroalgae against Plasmodium
falciparum. Parasitol. Res. 108: 1411-1416 Rocha, J., L. Peixe, N.C.M. Gomes, R. Calado. 2011. Cnidarians as a Source of New Marine Bioactive
Compounds - An Overview of the Last Decade and Future Steps for Bioprospecting. Mar. Drugs 9: 1860-1886
Rodríguez, I.I. and A.D. Rodríguez. 2003. Homopseudopteroxazole, a new Antimycobacterial
Diterpene Alkaloid from Pseudopterogorgia elisabethae. J. Nat. Prod. 66: 855–857 Rodriguez, A.D., C. Ramirez, I.I. Rodriguez, C.L. Barnes. 2000. Novel Terpenoids from the West Indian
Sea Whip Pseudopterogorgia elisabethae (Bayer). Elisapterosins A and B: Rearranged
Diterpenes Possessing an Unprecedented Cagelike Framework. J. Org. Chem. 65: 1390–1398 Sulistiyani, H.W., O.K. Radjasa, A. Sabdono, M.M. Khoeri, E. Karyana. 2015. Antimycobacterial
Activities from Seagrass Enhalus sp. Associated Bacteria against Multi Drug Resistance
Tuberculosis (MDR TB) Bacteria. Procedia Environmental Sciences 23: 253-259 Schmidt, E.W., A.Y. Obraztsova, S.K. Davidson, D.J. Faulkner, M.G. Haygood. 2000. Identification
of the Antifungal Peptide-containing Symbiont of the Marine Sponge Theonella swinhoei as
a Novel δ-Proteobacterium Candidatus Entotheonella palauensis. Mar. Biol. 136: 969–977
Zheng, Z., W. Zeng, Y. Huang, Z. Yang, J. Li, H. Cai, W. Su. 2000. Detection of Antitumor and
Antimicrobial Activities in Marine Organism Associated Actinomycetes Isolated from the
Taiwan Strait, China. FEMS Microbiol Lett. 188: 87–91
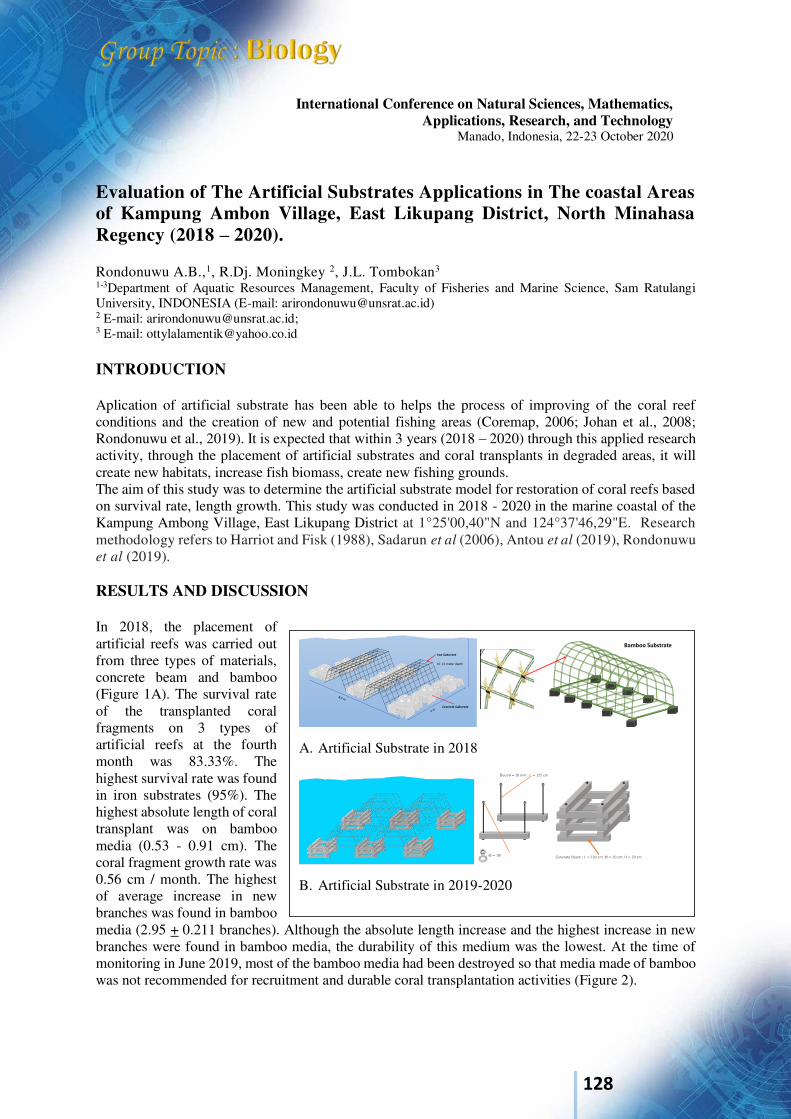
128
International Conference on Natural Sciences, Mathematics, Applications, Research, and Technology
Manado, Indonesia, 22-23 October 2020
Evaluation of The Artificial Substrates Applications in The coastal Areas of Kampung Ambon Village, East Likupang District, North Minahasa Regency (2018 – 2020). Rondonuwu A.B.,1, R.Dj. Moningkey 2, J.L. Tombokan3 1-3Department of Aquatic Resources Management, Faculty of Fisheries and Marine Science, Sam Ratulangi University, INDONESIA (E-mail: [email protected]) 2 E-mail: [email protected]; 3 E-mail: [email protected] INTRODUCTION Aplication of artificial substrate has been able to helps the process of improving of the coral reef conditions and the creation of new and potential fishing areas (Coremap, 2006; Johan et al., 2008; Rondonuwu et al., 2019). It is expected that within 3 years (2018 – 2020) through this applied research activity, through the placement of artificial substrates and coral transplants in degraded areas, it will create new habitats, increase fish biomass, create new fishing grounds. The aim of this study was to determine the artificial substrate model for restoration of coral reefs based on survival rate, length growth. This study was conducted in 2018 - 2020 in the marine coastal of the Kampung Ambong Village, East Likupang District at 1°25'00,40"N and 124°37'46,29"E. Research methodology refers to Harriot and Fisk (1988), Sadarun et al (2006), Antou et al (2019), Rondonuwu et al (2019). RESULTS AND DISCUSSION In 2018, the placement of artificial reefs was carried out from three types of materials, concrete beam and bamboo (Figure 1A). The survival rate of the transplanted coral fragments on 3 types of artificial reefs at the fourth month was 83.33%. The highest survival rate was found in iron substrates (95%). The highest absolute length of coral transplant was on bamboo media (0.53 - 0.91 cm). The coral fragment growth rate was 0.56 cm / month. The highest of average increase in new branches was found in bamboo media (2.95 + 0.211 branches). Although the absolute length increase and the highest increase in new branches were found in bamboo media, the durability of this medium was the lowest. At the time of monitoring in June 2019, most of the bamboo media had been destroyed so that media made of bamboo was not recommended for recruitment and durable coral transplantation activities (Figure 2).
A. Artificial Substrate in 2018
B. Artificial Substrate in 2019-2020
Figure 1. Application of Artificial Substrates in 2018-2020
10 -12 meter depth
Concrete Substrate
Iron Substrate
Bamboo Substrate
Concrate Beam : L = 100 cm; W = 20 cm; H = 20 cm
Bout = 16 mm : L = 125 cm
( = 16)
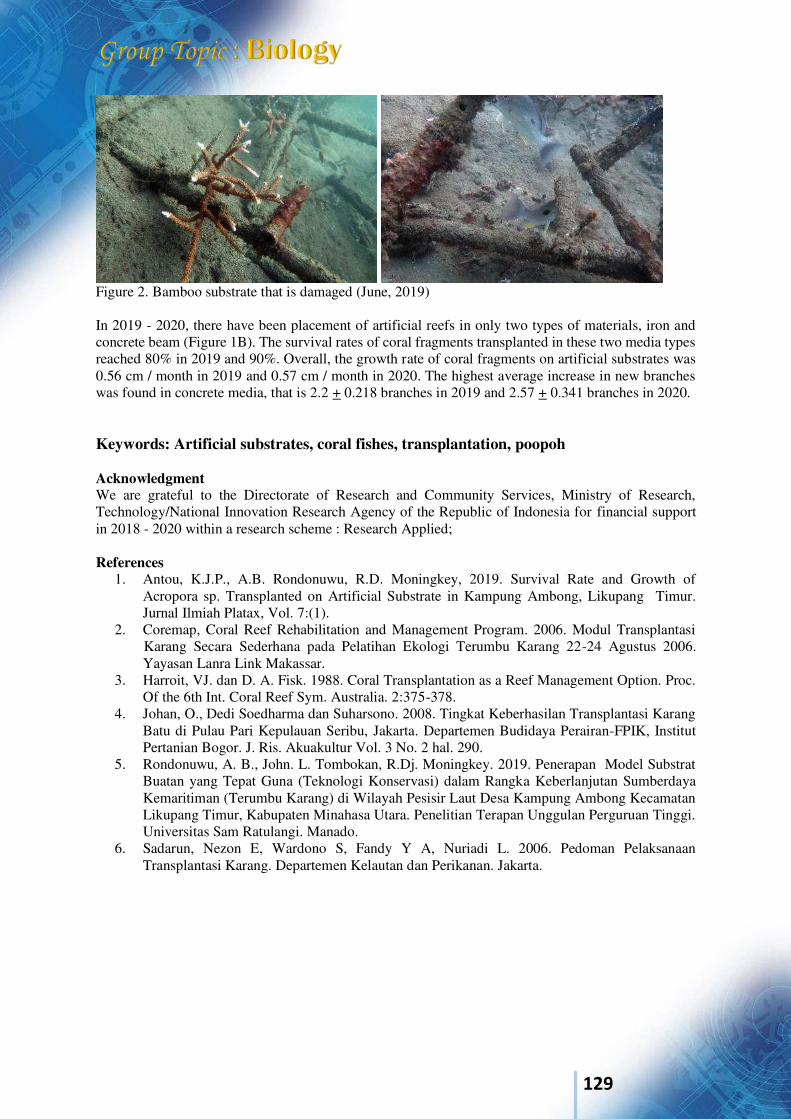
129
Figure 2. Bamboo substrate that is damaged (June, 2019) In 2019 - 2020, there have been placement of artificial reefs in only two types of materials, iron and concrete beam (Figure 1B). The survival rates of coral fragments transplanted in these two media types reached 80% in 2019 and 90%. Overall, the growth rate of coral fragments on artificial substrates was 0.56 cm / month in 2019 and 0.57 cm / month in 2020. The highest average increase in new branches was found in concrete media, that is 2.2 + 0.218 branches in 2019 and 2.57 + 0.341 branches in 2020. Keywords: Artificial substrates, coral fishes, transplantation, poopoh Acknowledgment We are grateful to the Directorate of Research and Community Services, Ministry of Research, Technology/National Innovation Research Agency of the Republic of Indonesia for financial support in 2018 - 2020 within a research scheme : Research Applied; References
1. Antou, K.J.P., A.B. Rondonuwu, R.D. Moningkey, 2019. Survival Rate and Growth of Acropora sp. Transplanted on Artificial Substrate in Kampung Ambong, Likupang Timur. Jurnal Ilmiah Platax, Vol. 7:(1).
2. Coremap, Coral Reef Rehabilitation and Management Program. 2006. Modul Transplantasi Karang Secara Sederhana pada Pelatihan Ekologi Terumbu Karang 22-24 Agustus 2006. Yayasan Lanra Link Makassar.
3. Harroit, VJ. dan D. A. Fisk. 1988. Coral Transplantation as a Reef Management Option. Proc. Of the 6th Int. Coral Reef Sym. Australia. 2:375-378.
4. Johan, O., Dedi Soedharma dan Suharsono. 2008. Tingkat Keberhasilan Transplantasi Karang Batu di Pulau Pari Kepulauan Seribu, Jakarta. Departemen Budidaya Perairan-FPIK, Institut Pertanian Bogor. J. Ris. Akuakultur Vol. 3 No. 2 hal. 290.
5. Rondonuwu, A. B., John. L. Tombokan, R.Dj. Moningkey. 2019. Penerapan Model Substrat Buatan yang Tepat Guna (Teknologi Konservasi) dalam Rangka Keberlanjutan Sumberdaya Kemaritiman (Terumbu Karang) di Wilayah Pesisir Laut Desa Kampung Ambong Kecamatan Likupang Timur, Kabupaten Minahasa Utara. Penelitian Terapan Unggulan Perguruan Tinggi. Universitas Sam Ratulangi. Manado.
6. Sadarun, Nezon E, Wardono S, Fandy Y A, Nuriadi L. 2006. Pedoman Pelaksanaan Transplantasi Karang. Departemen Kelautan dan Perikanan. Jakarta.
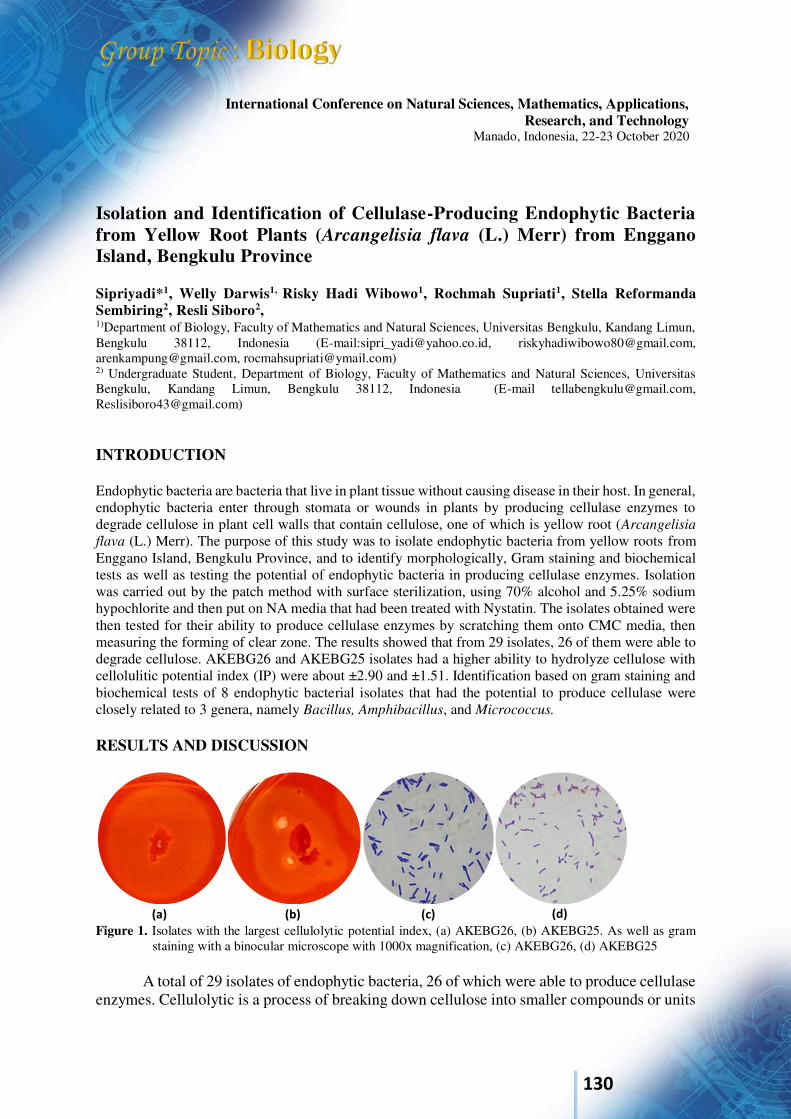
130
International Conference on Natural Sciences, Mathematics, Applications, Research, and Technology
Manado, Indonesia, 22-23 October 2020
Isolation and Identification of Cellulase-Producing Endophytic Bacteria from Yellow Root Plants (Arcangelisia flava (L.) Merr) from Enggano Island, Bengkulu Province Sipriyadi*1, Welly Darwis1, Risky Hadi Wibowo1, Rochmah Supriati1, Stella Reformanda Sembiring2, Resli Siboro2, 1)Department of Biology, Faculty of Mathematics and Natural Sciences, Universitas Bengkulu, Kandang Limun, Bengkulu 38112, Indonesia (E-mail:[email protected], [email protected], [email protected], [email protected]) 2) Undergraduate Student, Department of Biology, Faculty of Mathematics and Natural Sciences, Universitas Bengkulu, Kandang Limun, Bengkulu 38112, Indonesia (E-mail [email protected], [email protected])
INTRODUCTION Endophytic bacteria are bacteria that live in plant tissue without causing disease in their host. In general, endophytic bacteria enter through stomata or wounds in plants by producing cellulase enzymes to degrade cellulose in plant cell walls that contain cellulose, one of which is yellow root (Arcangelisia
flava (L.) Merr). The purpose of this study was to isolate endophytic bacteria from yellow roots from Enggano Island, Bengkulu Province, and to identify morphologically, Gram staining and biochemical tests as well as testing the potential of endophytic bacteria in producing cellulase enzymes. Isolation was carried out by the patch method with surface sterilization, using 70% alcohol and 5.25% sodium hypochlorite and then put on NA media that had been treated with Nystatin. The isolates obtained were then tested for their ability to produce cellulase enzymes by scratching them onto CMC media, then measuring the forming of clear zone. The results showed that from 29 isolates, 26 of them were able to degrade cellulose. AKEBG26 and AKEBG25 isolates had a higher ability to hydrolyze cellulose with cellolulitic potential index (IP) were about ±2.90 and ±1.51. Identification based on gram staining and biochemical tests of 8 endophytic bacterial isolates that had the potential to produce cellulase were closely related to 3 genera, namely Bacillus, Amphibacillus, and Micrococcus. RESULTS AND DISCUSSION
Figure 1. Isolates with the largest cellulolytic potential index, (a) AKEBG26, (b) AKEBG25. As well as gram
staining with a binocular microscope with 1000x magnification, (c) AKEBG26, (d) AKEBG25 A total of 29 isolates of endophytic bacteria, 26 of which were able to produce cellulase
enzymes. Cellulolytic is a process of breaking down cellulose into smaller compounds or units
(a) (b) (c) (d)
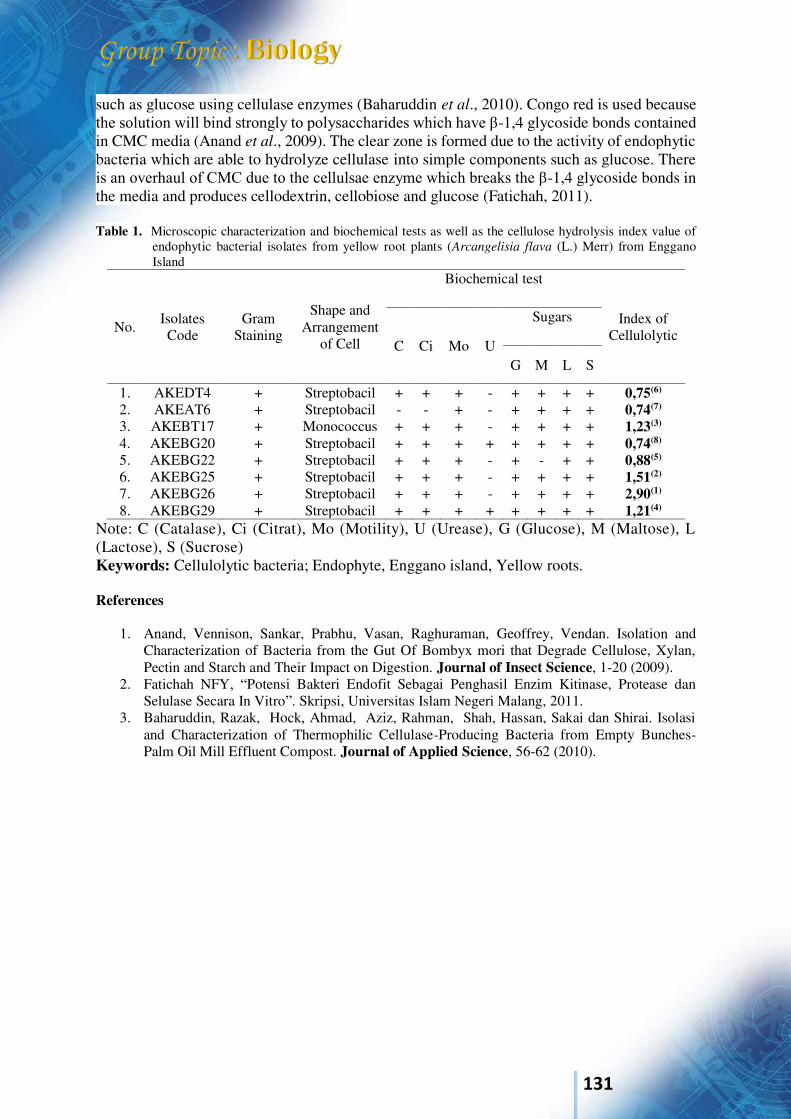
131
such as glucose using cellulase enzymes (Baharuddin et al., 2010). Congo red is used because the solution will bind strongly to polysaccharides which have β-1,4 glycoside bonds contained in CMC media (Anand et al., 2009). The clear zone is formed due to the activity of endophytic bacteria which are able to hydrolyze cellulase into simple components such as glucose. There is an overhaul of CMC due to the cellulsae enzyme which breaks the β-1,4 glycoside bonds in the media and produces cellodextrin, cellobiose and glucose (Fatichah, 2011). Table 1. Microscopic characterization and biochemical tests as well as the cellulose hydrolysis index value of
endophytic bacterial isolates from yellow root plants (Arcangelisia flava (L.) Merr) from Enggano Island
No. Isolates Code
Gram Staining
Shape and
Arrangement of Cell
Biochemical test
Index of Cellulolytic
C Ci Mo U
Sugars
G M L S
1. AKEDT4 + Streptobacil + + + - + + + + 0,75(6) 2. AKEAT6 + Streptobacil - - + - + + + + 0,74(7) 3. AKEBT17 + Monococcus + + + - + + + + 1,23(3) 4. AKEBG20 + Streptobacil + + + + + + + + 0,74(8) 5. AKEBG22 + Streptobacil + + + - + - + + 0,88(5) 6. AKEBG25 + Streptobacil + + + - + + + + 1,51(2) 7. AKEBG26 + Streptobacil + + + - + + + + 2,90(1) 8. AKEBG29 + Streptobacil + + + + + + + + 1,21(4)
Note: C (Catalase), Ci (Citrat), Mo (Motility), U (Urease), G (Glucose), M (Maltose), L (Lactose), S (Sucrose) Keywords: Cellulolytic bacteria; Endophyte, Enggano island, Yellow roots. References
1. Anand, Vennison, Sankar, Prabhu, Vasan, Raghuraman, Geoffrey, Vendan. Isolation and Characterization of Bacteria from the Gut Of Bombyx mori that Degrade Cellulose, Xylan, Pectin and Starch and Their Impact on Digestion. Journal of Insect Science, 1-20 (2009).
2. Fatichah NFY, “Potensi Bakteri Endofit Sebagai Penghasil Enzim Kitinase, Protease dan Selulase Secara In Vitro”. Skripsi, Universitas Islam Negeri Malang, 2011.
3. Baharuddin, Razak, Hock, Ahmad, Aziz, Rahman, Shah, Hassan, Sakai dan Shirai. Isolasi and Characterization of Thermophilic Cellulase-Producing Bacteria from Empty Bunches-Palm Oil Mill Effluent Compost. Journal of Applied Science, 56-62 (2010).
132
International Conference on Natural Sciences, Mathematics, Applications, Research, and Technology
Manado, Indonesia, 22-23 October 2020
Threats to Riparian Ecosystem of Lowatag River, Southeast Minahasa Regency, North Sulawesi Province, Indonesia R. Siahaan*1, M.Mokoginta2 and C.I.A.Katuche3
1, Department Biology, Faculty of mathematics and Natural Sciences, Universitas Sam Ratulangi, INDONESIA; University Centre of Excellence in Biotechnology and Conservation of Wallacea, Universitas Sam Ratulangi, INDONESIA (E-mail: [email protected]) 2, 3Department Biology, Faculty of mathematics and Natural Sciences, Universitas Sam Ratulangi, INDONESIA INTRODUCTION Lowatag River is one of the tributaries of the Ranoyapo River, Ranoyapo Watershed. The Ranoyapo River plays an important role for the community, including being a source of water for agriculture and households. The management efforts of Ranoyapo River cannot be separated from efforts to manage its tributaries including the Lowatag River. Riparian ecosystems have long been reported by various researchers as ecosystems that has important role in providing ecological services for humans, for example maintaining river water quality1,2,3, habitat of organisms4 and river stability5. Human population growth requires land and food has become a source of threat to riparian sustainability. Generally, in agricultural areas, riparian ecosystems are converted into agricultural land. This study aimed to analyze the threat of human activities against the riparian and Lowatag River, Southeast Minahasa Regency, North Sulawesi Province, Indonesia. RESULTS AND DISCUSSION The riparian ecosystem of the Lowatag River provides various habitat for various organisms including insects, birds and amphibians. Riparian vegetation were found in various levels from understorey, shrubs, small to large trees. The upper Lowatag River is a small river which has wide ranging from 2 m - 7 m. Canopies of various trees covered the river's water bodies. This is a good thing because vegetation plays an important role in river water quality by maintaining water temperature and providing material to the river, and also protecting river bank. The results showed that similar threats to other riparian in the Ranoyapo Watershed. Threats include the land conversion of riparian to be agricultural land and settlements and tree logging. This results in fragmentation of riparian ecosystems, presence of invasive species such as Micania cordata and Piper aduncum and river bank landslides. The presence of these invasive species can interfere with the presence of native species that will affect other organisms in the food web. The tree logging in riparian and even in terrestrial areas has a negative impact on the Lowatag River. Riparian trees, through their root system, can maintain river bank stability. Cliff landslides occur when river cliffs are not protected by riparian vegetation6. The lost of big canopy trees will greatly affect the decline in river water quality due to changes in river water temperature. Large tree canopies are better in maintaining river water quality7. These threats could give negative impacts on the ecological function of riparian. The water quality of the Lowatag River will be disturbed due to the very strong relationship between the water quality of the Lowatag River and its riparians. Another negative impact can be in the form of biodiversity decreasing both in the Lowatag River, riparian ecosystem and even terrestrial. Organisms in rivers,
133
riparian and even terrestrial are often closely related because many of these organisms in their life cycle occupy different ecosystems. A good riparian will be able to maintain organic biodiversity 7. Riparian conservation efforts need to be done immediately, especially in the upper Lowatag River. The regulations should be implemented to maintain river quality. Keywords: Lowatag River, Riparian Threats, Riparian Vegetation. References
1. R. Lawrence, R. Todd, J. Fadil, O. Hendrickson , R.Leonard, and L. Amussen, “Riparian forest as nutrient filters in agricultural watersheds”. Bioscience 34(6), 74-377(1984).
2. R.H. Waring, W.H.Schlesinger, Forest Ecosystems: Concepts and Management. San Diego: Academic Press, Inc., (1985(.
3. P.M. Mayer, S.K. Reynolds, T.J. Canfield, and M.D. McCutchen, Riparian Buffer Width,
Vegetative Cover and Nitrogen Removal Effectiveness: a Review of Current Science and
Regulations. EPA/600/R-05/118. Cincinnatti: EPA, (2005). 4. A.J. Castelle, A.W. Johnson, and C. Conolly, “Wetland and stream buffer size requirements: a
review, J Environ Qual., 23, 878 – 882 (1994). 5. E.B.D. Jones, G.S. Helfman, J.O. Harper, P.V.Bolstad, “Effects of riparian forest removal on
fish assemblages in southern appalachian streams”, Conservation Biology, 13(6), 1454-1465 (1999).
6. F.S.R.Holanda, L.G.da C.Santos, C.M.dos Santos, A.P.B.Casado, A.Pedrotti, and G.T.Ribeiro,
“Riparian vegetation affected by bank erosion in the Lower São Francisco River, Northeastern Brazil”, R. Árvore, Viçosa-MG, 29, 327-336 (2005)
7. S.H. Luke, E.M. Slade, C.L. Gray, K.V. Annammala, J.Drewer, J.Williamson, A.L. Agama, M.Ationg, S.L. Mitchell, C.S.Vairappan, and M.J.Struebig, “Riparian buffers in tropical agriculture: ccientific support, effectiveness and directions for policy”, J Appl Ecol., 56, 85–92 (2019).
134
International Conference on Natural Sciences, Mathematics, Applications, Research, and Technology
Manado, Indonesia, 22-23 October 2020
Phytosociology and Stand Biomass Related to Carbon Stock in Mount Poteng Nature Tourism Area, West Kalimantan Rafdinal*1, Rizalinda2 and Adityo Raynaldo3
1, 2Department of Biology, Tanjungpura University, INDONESIA. (E-mail: [email protected], [email protected]) 3Department of Marine Science, OSO University, INDONESIA. (E-mail: [email protected]) INTRODUCTION Tropical forests have a contribution to reducing the concentration of CO2 in the atmosphere through the carbon sequestration process1-. The result of carbon assimilation in forest ecosystems is sunk in aboveground biomass, belowground biomass, litter, and forest soil2. In tropical forests, approximately 50 percent of the contribution of the carbon pool was from standing biomass, though this value is influenced by the composition and structure of the forest vegetation3. Kalimantan Island is known as one of the largest tropical forest areas and has a high diversity of plant species. Mount Poteng natural tourism area located in West Kalimantan, has potential tropical rainforest with an area of 3,700 ha and remains a conservation area that has been included in the Raya Pasi nature reserve since 1978. The Mount Poteng area has an important role in hydrological function as a catchment area for the watershed in Singkawang City, West Kalimantan. This study aims to obtain information about phytosociological aspects and stand biomass related to carbon stocks around the Mount Poteng tourism area. RESULTS AND DISCUSSION Through observations of stand phytosociology, 60 plant species were observed from 20 sub-plots of various growth levels and found 20 trees species. The stand density ranged from 65-125 individual ha-
1 (average 134 individual ha-1). The basal area of the stands ranged from 15.30 to 59.97 m2 ha-1 with an average of 38.71 m2 ha-1. The results showed that of the 20 tree species with a diameter of ≥ 20 cm in all locations, there were 11 dominant tree species with an IVI value of> 5%. The stands in the study area were dominated by Arenga pinnata, Durio zibethinus, Alstonia angustiloba and Hevea brasiliensis. The total stand density found at the research location in the Mount Poteng tourism area was higher than the stand density in the Mount Gede Pangrango National Park area, West Java4, and the species diversity found more diverse in this location. However, the total stand density at the site was still lower than the Danau Sentarum National Park, as was the number of species found5. From the analysis, we found the average standing biomass was 147.98 tonnes ha-1 and the average carbon stock was 73.99 tonnes C ha-1. Alstonia angustiloba contributed the highest carbon stock in the location of Mount Poeteng, with a value of 102.99 tonnes C ha-1and a percentage of 27.84%. After that, Alstonia spatulata with a value of 100.19 tonnes C ha-1 (27.08%), Durio zibethinus with a value of 63.94 tonnes C ha-1 (17.28%) and Arenga pinnata with a value of 30.99 tonnes C ha-1 (8.38%). Stand diameter classes varied, generally concentrating on diameter classes above 60 cm. The AGB carbon stocks at each study location showed that the largest contribution was determined by stands with a
135
diameter class above 60 cm, with a contribution value of more than 50%. AGB carbon stocks are generally concentrated in the highest diameter class such as in the study location, because the higher the diameter of the trees found, the higher the value of biomass and carbon stock6. Tree density in the highest diameter class is generally quite large at each location so that the distribution of standing carbon stocks tends to be concentrated in the highest diameter class7. These results indicate that the anthropogenic impact is still not a cause for concern in Mount Poteng nature tourism area. Keywords: Aboveground biomass, carbon pool, important value index, tropical forests. Acknowledgment This research was funded by the Directorate of Research and Community Service, Directorate General of Higher Education, Ministry of Education and Culture through DIPA FMIPA Tanjungpura University number 337/UN22.8/PP/2018. The author would like to thank Riko, Harmono and Tirta Sari for their assistance in the field. Hopefully this research can be useful for all of us. References
1. IPCC, The physical science basis. Contribution of working group I to the fourth assessment
report of intergovernmental panel on climate change (Cambridge University Press, Cambridge, 2007).
2. G.E. Kindermann, I. McCallum, S. Fritz, M. Obersteiner, A Global Forest Growing Stock, Biomass and Carbon Map based on FAO Statistics. Silva Fennica 42, 387-396 (2008).
3. P. G. Jarvis, A. Ibrom, S. Linder, Carbon forestry: Managing forests to conserve carbon. In:
Griffiths H. Jarvis PG (eds) The Carbon balance of forest biomes (Taylor & Francis, UK, 2005), pp. 331-349.
4. B. Dendang and W. Handayani, Struktur dan Komposisi Tegakan Hutan di Taman Nasional
Gunung Gede Pangrango, Jawa Barat, Prosiding Seminar Nasional Masyarakat Biodiversitas Indonesia 1(4), 691-695 (2015).
5. C. Kusmana, B. H. Saharjo, B. Sumawinata, Onrizal and T. Kato, Komposisi Jenis dan Struktur Hutan Hujan Tropika Dataran Rendah di Taman Nasional Danau Sentarum, Kalimantan Barat, Jurnal Ilmu Pertanian Indonesia 14(3), 149-157 (2009).
6. J. Chave, C. Andalo, S. Brown, M.A Cairns, J. Q. Chambers, D. Eamus, H. Folster, F. Fromard, N. Higuchi, T. Kira, J. P. Lescure, B.W. Nelson, H. Ogawa, H. Puig, B. Riéra, B and T. Yamakura, Tree Allometry and Improved Estimation of Carbon Stocks and Balance in Tropical Forests’, Oecologia, 145, 87-99 (2005).
7. S. Brown, Estimating Biomass and Biomass Change of Tropical Forests: a Primer (FAO Forestry Paper134, Rome, 1997).
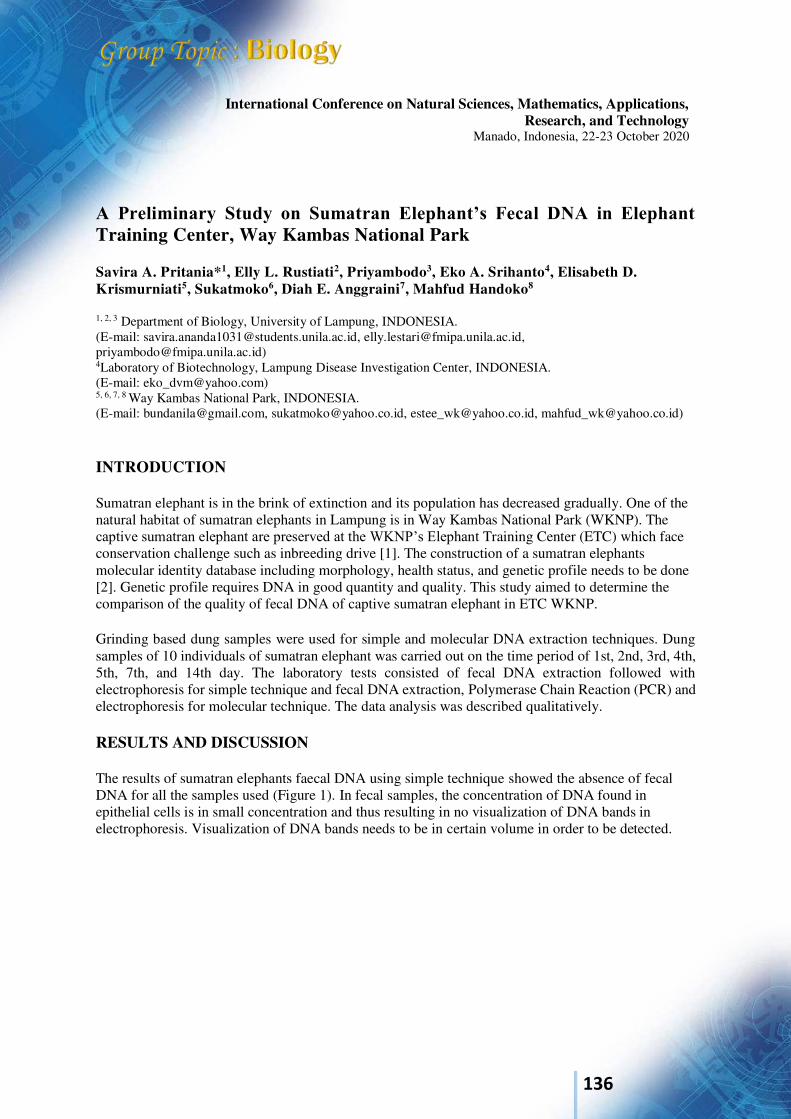
136
International Conference on Natural Sciences, Mathematics, Applications, Research, and Technology
Manado, Indonesia, 22-23 October 2020
A Preliminary Study on Sumatran Elephant’s Fecal DNA in Elephant Training Center, Way Kambas National Park Savira A. Pritania*1, Elly L. Rustiati2, Priyambodo3, Eko A. Srihanto4, Elisabeth D. Krismurniati5, Sukatmoko6, Diah E. Anggraini7, Mahfud Handoko8
1, 2, 3 Department of Biology, University of Lampung, INDONESIA. (E-mail: [email protected], [email protected], [email protected]) 4Laboratory of Biotechnology, Lampung Disease Investigation Center, INDONESIA. (E-mail: [email protected]) 5, 6, 7, 8 Way Kambas National Park, INDONESIA. (E-mail: [email protected], [email protected], [email protected], [email protected]) INTRODUCTION Sumatran elephant is in the brink of extinction and its population has decreased gradually. One of the natural habitat of sumatran elephants in Lampung is in Way Kambas National Park (WKNP). The captive sumatran elephant are preserved at the WKNP’s Elephant Training Center (ETC) which face conservation challenge such as inbreeding drive [1]. The construction of a sumatran elephants molecular identity database including morphology, health status, and genetic profile needs to be done [2]. Genetic profile requires DNA in good quantity and quality. This study aimed to determine the comparison of the quality of fecal DNA of captive sumatran elephant in ETC WKNP. Grinding based dung samples were used for simple and molecular DNA extraction techniques. Dung samples of 10 individuals of sumatran elephant was carried out on the time period of 1st, 2nd, 3rd, 4th, 5th, 7th, and 14th day. The laboratory tests consisted of fecal DNA extraction followed with electrophoresis for simple technique and fecal DNA extraction, Polymerase Chain Reaction (PCR) and electrophoresis for molecular technique. The data analysis was described qualitatively. RESULTS AND DISCUSSION The results of sumatran elephants faecal DNA using simple technique showed the absence of fecal DNA for all the samples used (Figure 1). In fecal samples, the concentration of DNA found in epithelial cells is in small concentration and thus resulting in no visualization of DNA bands in electrophoresis. Visualization of DNA bands needs to be in certain volume in order to be detected.
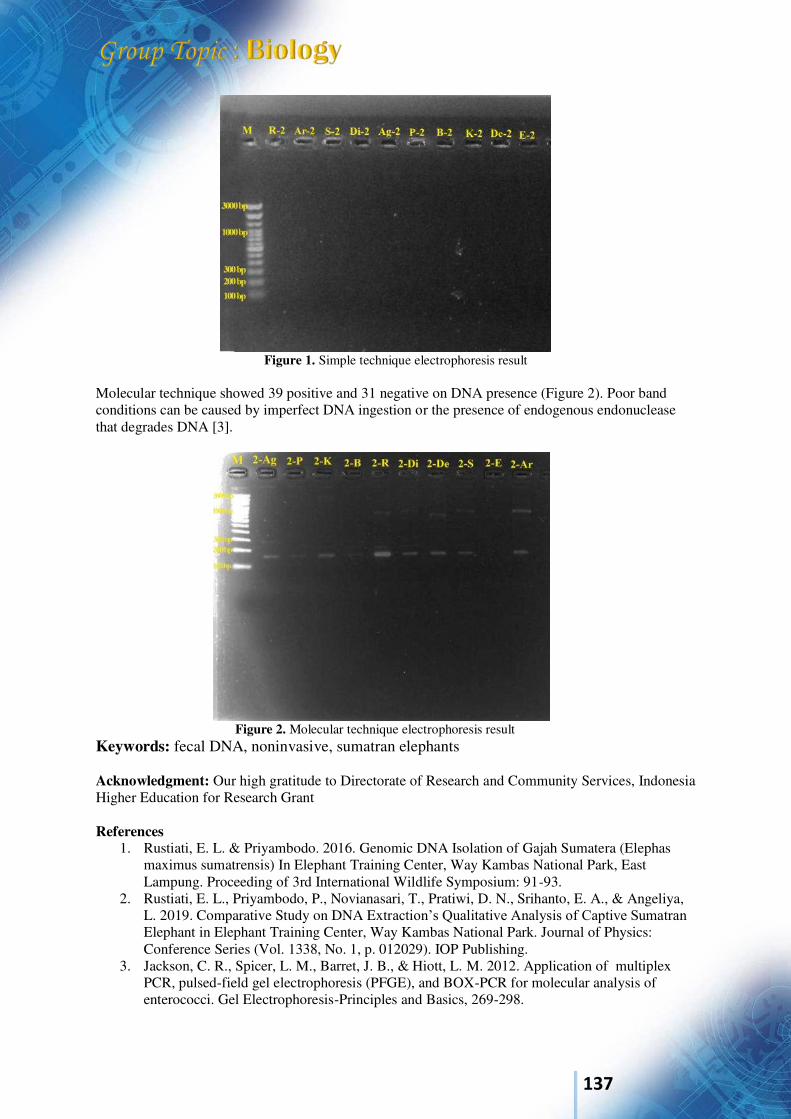
137
Figure 1. Simple technique electrophoresis result
Molecular technique showed 39 positive and 31 negative on DNA presence (Figure 2). Poor band conditions can be caused by imperfect DNA ingestion or the presence of endogenous endonuclease that degrades DNA [3].
Figure 2. Molecular technique electrophoresis result Keywords: fecal DNA, noninvasive, sumatran elephants Acknowledgment: Our high gratitude to Directorate of Research and Community Services, Indonesia Higher Education for Research Grant References
1. Rustiati, E. L. & Priyambodo. 2016. Genomic DNA Isolation of Gajah Sumatera (Elephas maximus sumatrensis) In Elephant Training Center, Way Kambas National Park, East Lampung. Proceeding of 3rd International Wildlife Symposium: 91-93.
2. Rustiati, E. L., Priyambodo, P., Novianasari, T., Pratiwi, D. N., Srihanto, E. A., & Angeliya, L. 2019. Comparative Study on DNA Extraction’s Qualitative Analysis of Captive Sumatran Elephant in Elephant Training Center, Way Kambas National Park. Journal of Physics: Conference Series (Vol. 1338, No. 1, p. 012029). IOP Publishing.
3. Jackson, C. R., Spicer, L. M., Barret, J. B., & Hiott, L. M. 2012. Application of multiplex PCR, pulsed-field gel electrophoresis (PFGE), and BOX-PCR for molecular analysis of enterococci. Gel Electrophoresis-Principles and Basics, 269-298.
138
International Conference on Natural Sciences, Mathematics, Applications, Research, and Technology
Manado, Indonesia, 22-23 October 2020
The Growth of Cayenne Pepper (Capsicum frutescens L.) Using the Application of Mycorrhizae Glomus fasciculatum and Liquid Organic Fertilizer in Peat Soil Riza Linda*1, Rafdinal2 and Adityo Raynaldo3
1, 2Department of Biology, Tanjungpura University, INDONESIA. (E-mail: [email protected], [email protected]) 3Department of Marine Science, OSO University, INDONESIA. (E-mail: [email protected]) INTRODUCTION Cayenne pepper (Capsicum frutescens) is a commodity that has a high economic value in Indonesia. The Cayenne pepper crop production in West Kalimantan is still relatively low is due to the low soil fertility of peat soil. Peat soil has high acidity and low P absorption. Improvement of peat soil fertility is usually done by adding fertilizers1. Utilization of the vascular Arbuscular Mycorrhizal Fungi (AMF) and liquid organic fertilizer may be effective in treating soil acid problems and have a low environmental risk2. Giving several types of mycorrhizal fungi can increase fertility and plant growth. Liquid organic fertilizer is more effective and efficient by spraying through the leaves of the plant. The application of foliar fertilizers can improve growth, accelerate harvest, extend the period or age of production, and can increase crop yields. The objective of this research was to determine the growth of Cayenne pepper in peat soil inoculated with G. fasciculatum vesicle Arbuscular Mycorrhizal Fungi (AMF) and Liquid Organic Fertilizer (LOF) on peat soil. The research was conducted in the Biology Laboratory and greenhouse facility in the Faculty of Mathematics and Natural Science, Tanjungpura University Pontianak. The experiment was carried out from March to September 2020. The experimental design used a Randomized Block Design (RBD) factorial pattern and three replications. The treatments as the first factor were four levels of arbuscular vesicular mycorrhiza fungi Glomus
fasciculatum were dosage 0 gr/polybag (control), 5 g/polybag, 10 g/polybag, and 15 g/polybag; and as the second factor were four levels of concentration of liquid organic fertilizers obtained from mangrove litter ie 0 cc/L, 10 cc/L, 15 cc/L, and 20 cc/L. Each treatment has 4 replication, so there were 64 experimental units. The data were obtained analyzed statistically by using the F (ANOVA) test with a 5% confidence level. Duncan test was used to compare means among treatments. Parameters observed were plant height, number of leaves per plant, wet weight and dry weight, root and shoot ratio, number of fruit and fruit weight, percentage of infected mycorrhizae3. RESULTS AND DISCUSSION Based on the results of soil analysis, it is known that the pH value of the soil is 4.35 (acid), an optimum pH for Cayenne pepper growth is 6-6.54. Based on the comparison of levels of C-organic (24.20%) and N-total (1.32%), P2O5 available (Bray I) 70.99 ppm (low). Meanwhile, the analysis of mangrove litter before making POC was; organic C 51.35, total N 1.12, C / N ratio 45.85, and P percentage was 0.16%. After being made into POC, there was an increase in nutrient N from 0.2 to 1%, and the P element increased by 4.03%. After litter fermented for 4 weeks, organic fertilizer liquid contains 0.64% N nutrient, P is 0.27% and C / N ratio is 6.66. This increase in nutrients is caused by microbial activity that breaks down organic matter during the fermentation process5. Microorganisms as bio-activators accelerate the decomposition process of organic matter.
139
VAM treatment and liquid organic fertilizer (LOF) litter fermented for 4 weeks are able to provide nutrients N, P, and K, contains 0.64% N nutrient, P is 0.27% which can be used by plants for growth. However, from the growth parameters, it can be seen that a combination of MVA treatment and liquid organic fertilizers (LOF) do not have an interaction effect on plant height, leaf numbers, wet weight and total dry weight, percentage of infected mycorrhizae, age of flowering, fruit weight, and yield of fresh fruit. The independent treatment of 5 g/polybag MVA and treatment of 20 cc/L of liquid organic fertilizer had a better effect on leaf numbers, wet weight and dry weight total, percentage of infected mycorrhizae, age of flowering, fruit weight, and yield of fresh fruit, except for plant height. In conclusion, treatment of 20 cc / L liquid organic fertilizers and 5 g / polybag G. fasciculatum fungi is the optimum dosage to increase the growth and yields of Cayenne peppers in peat soil. Keywords: Cayenne peppers (Capsicum frutescens), G. fasciculatum, liquid organic fertilizers, peat soil. Acknowledgment This research was funded by the Directorate of Research and Community Service, Directorate General of Higher Education, Ministry of Education and Culture through DIPA FMIPA Tanjungpura University number 337/UN22.8/PP/2020. References
1. A. Haraguchi, H. Kojima, C. Hasegawa, Y. Takahashi, T. Iyobe, Decomposition of organic matter in peat soil in a minerotrophic mire. European Journal of Soil Biology 38, 89-95 (2002).
2. J. L. Harley and S. E. Smith, Mycorrhizal Symbiosis (Academic Press, New York, 1983). 3. Balai Penelitian Tanah. Syarat Mutu Pupuk Anorganik dan Organik (Balitbangtan Kementan,
Jakarta, 2018). 4. Sumarno, Perkembangan Teknologi Budidaya Kedelai di Lahan Sawah. Iptek Tanaman Pangan
6 (2), 139-151 (2011). 5. E. D. Hastuti, R. B. Hastuti, R. Hariyat, Potential Re-utilization of Composted Mangrove Litters
forPond Environment Quality Improvement. Journal of Physics: Conference Series 1025, 1-5 (2017).
140
International Conference on Natural Sciences, Mathematics, Applications, Research, and Technology
Manado, Indonesia, 22-23 October 2020
The Effect of Riparian Vegetation on Stabilize Streambank of Ranoyapo River, North Sulawesi - Indonesia R. Siahaan*1, Nio Song Ai2 and Henny Lieke Rampe3
1, Department Biology, Faculty of Mathematics and Natural Sciences, Universitas Sam Ratulangi, INDONESIA; University Centre of Excellence in Biotechnology and Conservation of Wallacea, Universitas Sam Ratulangi, INDONESIA *E-mail: [email protected] 2, 3Department Biology, Faculty of Mathematics and Natural Sciences, Universitas Sam Ratulangi, INDONESIA INTRODUCTION
It is important to maintain the quality of river water for sustanaible benefits and functions of the river. One of the causes of the decline in river water quality is river bank erosion. The sediment increasing into river can be caused by cliff erosion. Cliff erosion contributes up to 80 percent of the sediment that enters the river1. Therefore, river bank erosion needs to be controlled in order to reduce the total sediment load in the river. The land use convertion can increases surface runwater into rivers. This causes river water velocity to increase rapidly thereby increasing pressure on river bank2. Riparian vegetation acts as a buffer that reduces cliff erosion.
Various researchers have reported that riparian vegetation can stabilize cliffs. The stability of riverbanks could be as indicator for riparian health. River cliffs with lost riparian vegetation will be more prone to erosion when the river water discharge is high3. This study aimed to analyze the ecological ability of riparian vegetation in stabilizing the upstream riverbanks of the Ranoyapo River, North Sulawesi - Indonesia. RESULTS AND DISCUSSION The riparian vegetation of the upstream Ranoyapo River is found to be diverse in various lifeforms. Riparian vegetation of the Ranoyapo River such as Ficus and Syzigium trees4 were also found at the study sites. The riparian ecosystem faced human activities such as land convertion from forest into agricultura land and tree logging. These two things pose a big threat to riparian ecosystems in carrying out their ecological functions in stabilizing .river bank of Ranoyapo River. Cliff landslides were found in all research locations. The worst landslides were on river banks that were not protected by riparian trees. Cliff erosion also occurred despite the presence of tree riparian vegetation. This is because the function of riparian vegetation is closely related to the function of the watershed. Forest fragmentation due to land conversion and tree logging could reduce the function of riparian vegetation. The ability of trees decrease to hold and to penétrate rainwater that falls into the watersehd. This surface run wáter can immediately enter the river body and increase the volume of river water and increase the velocity of river currents. The strong river currents can increase the erosion ability of river water. The root system of riparian vegetation is not strong enough to withstand this very strong river flow, especially during the rainy season. Evidence in the field showed that cliff erosion even though the root systems of riparian vegetation trees have the ability to bind large rocks but not the soil particles. Cliff erosion still occured even though vegetated riverbanks although erosion was greater than unvegetated streambank5. The conservation efforts need to be implemented to reduce the cliff erosion of the Ranoyapo River.

141
Keywords: Ranoyapo River, Riparian, Riparian Vegetation, cliff erosion Acknowledgment This research was funded by the Directorate of Research and Community Service, Directorate General of Higher Education, Ministry of Education and Culture through Riset Dasar Unggulan Universitas Sam Ratulangi. References
1. G.N. Zaimes GN, R.C.Schultz, and T.M.Isenhart, Riparian land uses and precipitation influences on stream bank erosion in Central Iowa. Journal of the American Water Resources Association (JAWRA). 83-97, (2006).
2. P. Price and S. Lovett. Streambank stability. Fact Sheet 2, Land & Water Australia, Canberra, 2002.
3. C. Rhyne, Landowners can use techniques to stabilize riparian areas. Natural Resources Conservation Service in Casper. Wyoming, 2006.
4. R. Siahaan, S.A. Nio, and P. Siahaan, Ecological functions of vegetation of riparian in preventing landslide of upper Ranoyapo River, North Sulawesi – Indonesia. Bioscience Research. 16(2), 1638-1640 (2019).
5. E. R. Micheli and J. W. Kirchner, Effects of wet meadow riparian vegetation on streambank erosion. 2. Measurements of vegetated bank strength and consequences for failure mechanics . Earth Surf. Process. Landforms 27, 687–697 (2002)
142
International Conference on Natural Sciences, Mathematics, Applications, Research, and Technology
Manado, Indonesia, 22-23 October 2020
Phytochemical Screening and Antioxidant Activity of Different Solvent Extracts from Phoenix roebelenii Leaves Carla F. Kairupan*1 and Feky R. Mantiri2
1*Bagian Patologi Anatomi, Universitas Sam Ratulangi, INDONESIA. (E-mail: [email protected]) 2Jurusan Biologi, Universitas Sam Ratulangi, INDONESIA. (E-mail: [email protected]) INTRODUCTION Phytochemicals are biologically active, naturally occurring chemical compounds found in plants that work with nutrients and dietary fiber to protect against diseases. Depending upon their biosynthetic origin, phytochemicals can be divided into several categories such as alkaloids, phenolics, flavonoids, steroids, terpenes, saponins, etc. The last several decades have seen increased research attention of potential phytochemicals from plants for therapeutic uses. This is because many phytochemicals have been demonstrated to have antioxidant activities and reduce the risk of many diseases, especially diseases that are related to oxidative stress such as cardiovascular diseases and cancer. The Phoenix roebelenii, tree of the palm family (Arecaceae), is one of the finest of the dwarf palms, pygmy date palm slowly reaches 6 to 12 feet in height and has an upright or curving, single trunk topped with a dense, full crown of gracefully arching, three-foot-long leaves. The insignificant flower clusters, hidden by the foliage, are present periodically throughout the year and produce small, jet-black dates which ripen to a deep red. Pygmy date palm is quite popular as a specimen planting or in containers, especially attractive at poolside [1-2]. The purpose of this study was to investigate the phytochemical contents and antioxidant activity of different solvent extract of Phoenix
roebelenii leaves. RESULTS AND DISCUSSION In this study, different solvents were used to obtain the leave extract of Phoenix roebelenii. After the successful conventional hot Soxhlet extraction of Phoenix roebelenii leaves in investigation, the preliminary phytochemical study revealed that the methanol and ethanol extract of Phoenix roebelenii leaves contains alkaloids, saponins, flavonoids, steroids, phenols, terpenes and tannins (Table 1), while n-hexan extract contained all except for terpenes and tannins. These phytochemical compounds are known to support bioactivity [3-7], thus responsible for the antioxidant activities.
Tabel 1. Qualitative screening of phytochemicals from different solvents extract of Phoenix roebelenii leaves
Senyawa fitokimia Methanol Ethanol n-Heksan Alkaloid: -Meyer -Dragendorf -Wagner
+ + +
+ + +
+ + +
143
Triterpenoid + + + Tanin + + + Flavonoid + + - Saponin + + - Fenolik + + -
Keywords: antioxidant, DPPH, FRAP, Phoenix roebelenii, phytochemical, Acknowledgment This research was supported by fund from The University of Sam Ratulangi through Lembaga Penelitian dan Pengabdian Masyarakat. References
1. Barrow, S., 1994. In search of Phoenix roebelenii: the Xishuangbanna Palm. Principes 38 177-181
2. Jaizme-Vega, M., Díaz-Pérez, M., 1997. Effect of Glomus intraradices on Phoenix roebelenii during the nursery stage, II International Symposium on Ornamental Palms & other Monocots from the Tropics 486 199-202.
3. Adebiyi, O. E., Olayemi, F. O., Ning-Hua, T., & Guang-Zhi, Z. In vitro antioxidant activity, total phenolic and flavonoid contents of ethanol extract of stem and leaf of Grewia carpinifolia Beni-Suef University Journal of Basic and Applied Sciences 6 1 10-14
4. Bhattacharyya, P., Kumaria, S., Bose, B., Paul, P., & Tandon, P. 2017 Evaluation of genetic stability and analysis of phytomedicinal potential in micropropagated plants of Rumex nepalensis – A medicinally important source of pharmaceutical biomolecules Journal of Applied Research on Medicinal and Aromatic Plants 6 80-91B. R. Jackson and T. Pitman, U.S. Patent No. 6,345,224 (8 July 2004)
5. Amari, N. O., Bouzouina, M., Berkani, A., & Lotmani B. 2014 Phytochemical screening and antioxidant capacity of the aerial parts of Thymelaea hirsuta L Asian
Pacific Journal of Tropical Disease 4 2 104-109 6. Boniface, P. K., Baptista, F. S., & Roland, K. C. 2006 Current state of knowledge on
the traditional uses, phytochemistry, and pharmacology of the genus Hymenaea Journal
of Ethnopharmacology 206 193-223 7. Abbasi, A. M., Shah, M. H., Li, T., Fu, X., Guo, X., & Liu R. H. 2015 Ethnomedicinal
values, phenolic contents and antioxidant properties of wild culinary vegetables Journal of Ethnopharmacology 162 333-345
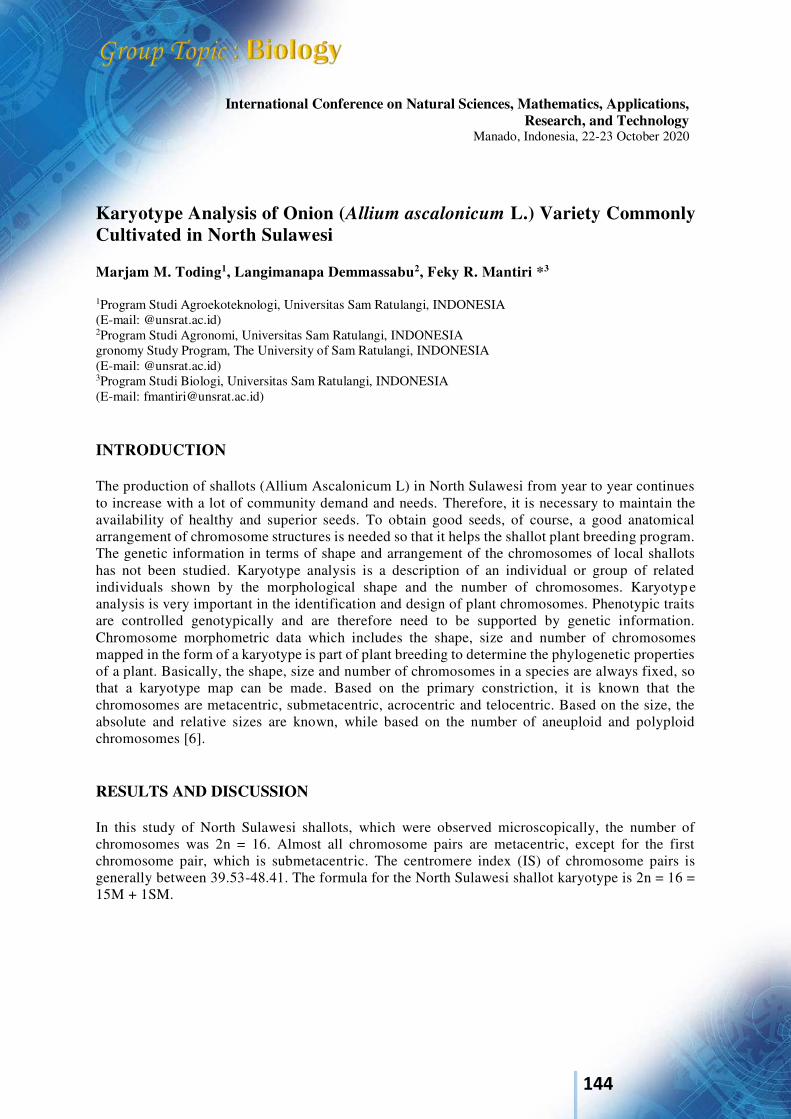
144
International Conference on Natural Sciences, Mathematics, Applications, Research, and Technology
Manado, Indonesia, 22-23 October 2020
Karyotype Analysis of Onion (Allium ascalonicum L.) Variety Commonly Cultivated in North Sulawesi Marjam M. Toding1, Langimanapa Demmassabu2, Feky R. Mantiri *3
1Program Studi Agroekoteknologi, Universitas Sam Ratulangi, INDONESIA (E-mail: @unsrat.ac.id) 2Program Studi Agronomi, Universitas Sam Ratulangi, INDONESIA gronomy Study Program, The University of Sam Ratulangi, INDONESIA (E-mail: @unsrat.ac.id) 3Program Studi Biologi, Universitas Sam Ratulangi, INDONESIA (E-mail: [email protected]) INTRODUCTION The production of shallots (Allium Ascalonicum L) in North Sulawesi from year to year continues to increase with a lot of community demand and needs. Therefore, it is necessary to maintain the availability of healthy and superior seeds. To obtain good seeds, of course, a good anatomical arrangement of chromosome structures is needed so that it helps the shallot plant breeding program. The genetic information in terms of shape and arrangement of the chromosomes of local shallots has not been studied. Karyotype analysis is a description of an individual or group of related individuals shown by the morphological shape and the number of chromosomes. Karyotyp e analysis is very important in the identification and design of plant chromosomes. Phenotypic traits are controlled genotypically and are therefore need to be supported by genetic information. Chromosome morphometric data which includes the shape, size and number of chromosomes mapped in the form of a karyotype is part of plant breeding to determine the phylogenetic properties of a plant. Basically, the shape, size and number of chromosomes in a species are always fixed, so that a karyotype map can be made. Based on the primary constriction, it is known that the chromosomes are metacentric, submetacentric, acrocentric and telocentric. Based on the size, the absolute and relative sizes are known, while based on the number of aneuploid and polyploid chromosomes [6]. RESULTS AND DISCUSSION In this study of North Sulawesi shallots, which were observed microscopically, the number of chromosomes was 2n = 16. Almost all chromosome pairs are metacentric, except for the first chromosome pair, which is submetacentric. The centromere index (IS) of chromosome pairs is generally between 39.53-48.41. The formula for the North Sulawesi shallot karyotype is 2n = 16 = 15M + 1SM.
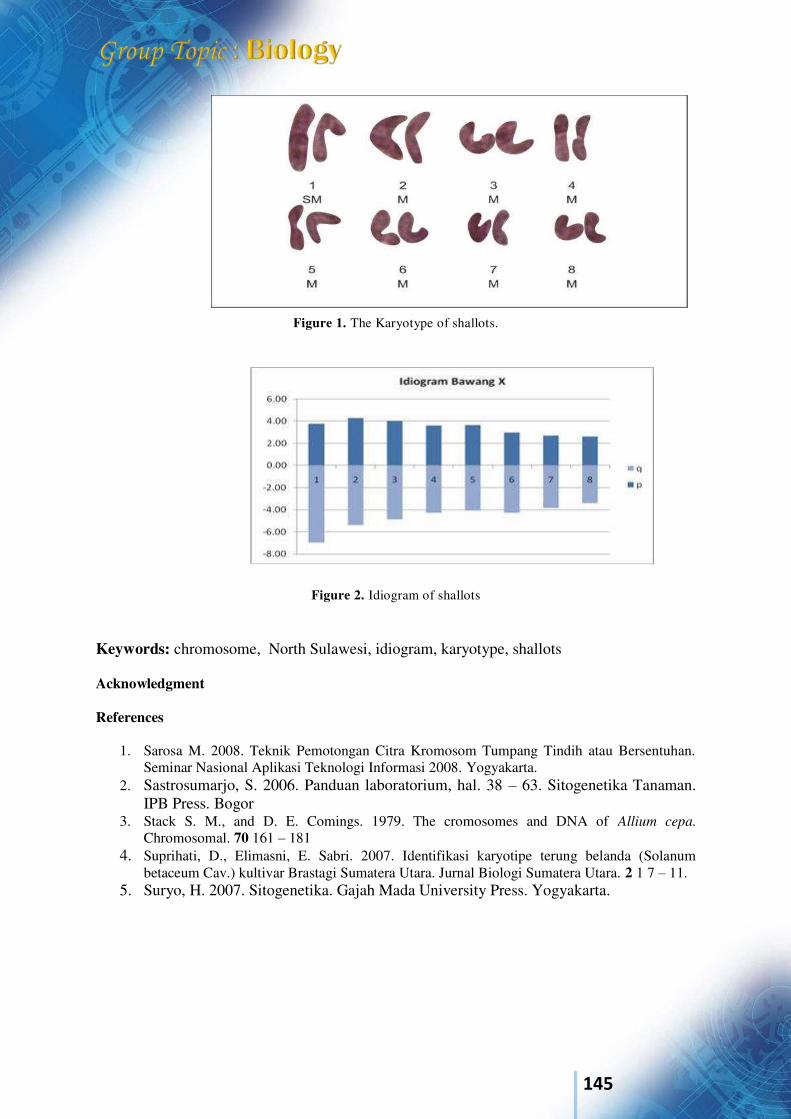
145
Figure 1. The Karyotype of shallots.
Figure 2. Idiogram of shallots Keywords: chromosome, North Sulawesi, idiogram, karyotype, shallots Acknowledgment References
1. Sarosa M. 2008. Teknik Pemotongan Citra Kromosom Tumpang Tindih atau Bersentuhan. Seminar Nasional Aplikasi Teknologi Informasi 2008. Yogyakarta.
2. Sastrosumarjo, S. 2006. Panduan laboratorium, hal. 38 – 63. Sitogenetika Tanaman. IPB Press. Bogor
3. Stack S. M., and D. E. Comings. 1979. The cromosomes and DNA of Allium cepa. Chromosomal. 70 161 – 181
4. Suprihati, D., Elimasni, E. Sabri. 2007. Identifikasi karyotipe terung belanda (Solanum betaceum Cav.) kultivar Brastagi Sumatera Utara. Jurnal Biologi Sumatera Utara. 2 1 7 – 11.
5. Suryo, H. 2007. Sitogenetika. Gajah Mada University Press. Yogyakarta.
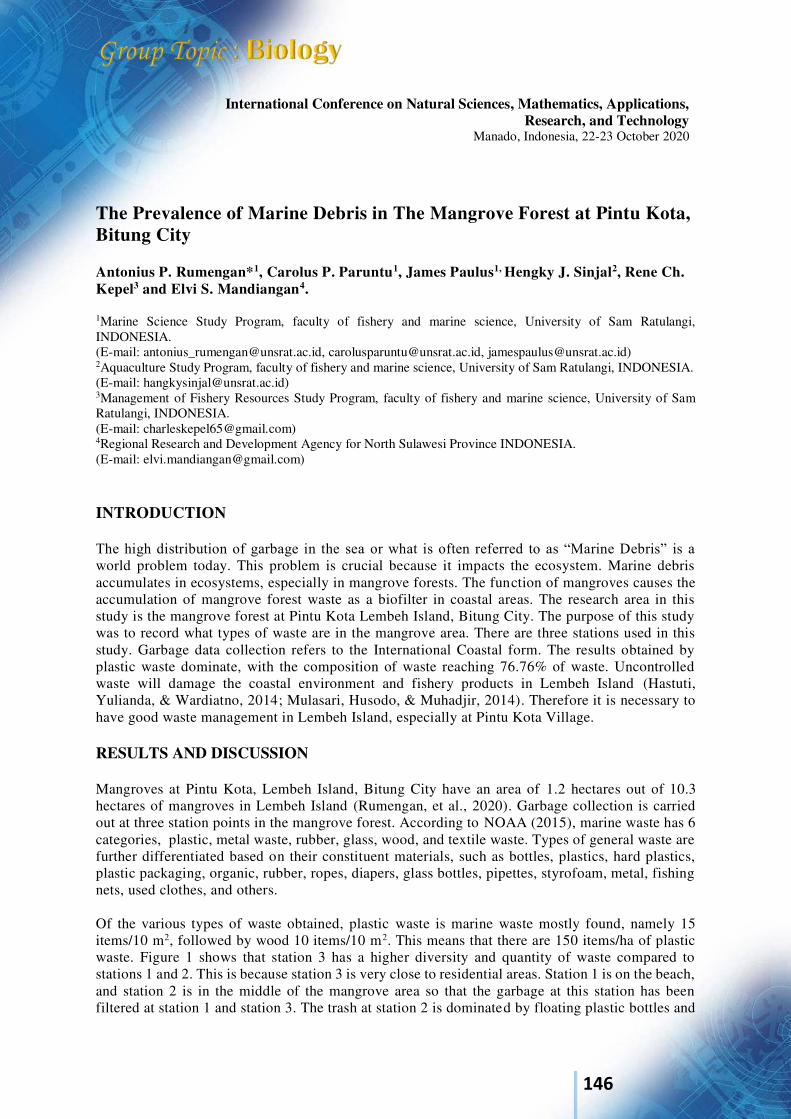
146
International Conference on Natural Sciences, Mathematics, Applications, Research, and Technology
Manado, Indonesia, 22-23 October 2020
The Prevalence of Marine Debris in The Mangrove Forest at Pintu Kota, Bitung City Antonius P. Rumengan*1, Carolus P. Paruntu1, James Paulus1, Hengky J. Sinjal2, Rene Ch. Kepel3 and Elvi S. Mandiangan4.
1Marine Science Study Program, faculty of fishery and marine science, University of Sam Ratulangi, INDONESIA. (E-mail: [email protected], [email protected], [email protected]) 2Aquaculture Study Program, faculty of fishery and marine science, University of Sam Ratulangi, INDONESIA. (E-mail: [email protected]) 3Management of Fishery Resources Study Program, faculty of fishery and marine science, University of Sam Ratulangi, INDONESIA. (E-mail: [email protected]) 4Regional Research and Development Agency for North Sulawesi Province INDONESIA. (E-mail: [email protected]) INTRODUCTION The high distribution of garbage in the sea or what is often referred to as “Marine Debris” is a world problem today. This problem is crucial because it impacts the ecosystem. Marine debris accumulates in ecosystems, especially in mangrove forests. The function of mangroves causes the accumulation of mangrove forest waste as a biofilter in coastal areas. The research area in this study is the mangrove forest at Pintu Kota Lembeh Island, Bitung City. The purpose of this study was to record what types of waste are in the mangrove area. There are three stations used in this study. Garbage data collection refers to the International Coastal form. The results obtained by plastic waste dominate, with the composition of waste reaching 76.76% of waste. Uncontrolled waste will damage the coastal environment and fishery products in Lembeh Island (Hastuti, Yulianda, & Wardiatno, 2014; Mulasari, Husodo, & Muhadjir, 2014). Therefore it is necessary to have good waste management in Lembeh Island, especially at Pintu Kota Village. RESULTS AND DISCUSSION Mangroves at Pintu Kota, Lembeh Island, Bitung City have an area of 1.2 hectares out of 10.3 hectares of mangroves in Lembeh Island (Rumengan, et al., 2020). Garbage collection is carried out at three station points in the mangrove forest. According to NOAA (2015), marine waste has 6 categories, plastic, metal waste, rubber, glass, wood, and textile waste. Types of general waste are further differentiated based on their constituent materials, such as bottles, plastics, hard plastics, plastic packaging, organic, rubber, ropes, diapers, glass bottles, pipettes, styrofoam, metal, fishing nets, used clothes, and others. Of the various types of waste obtained, plastic waste is marine waste mostly found, namely 15 items/10 m2, followed by wood 10 items/10 m2. This means that there are 150 items/ha of plastic waste. Figure 1 shows that station 3 has a higher diversity and quantity of waste compared to stations 1 and 2. This is because station 3 is very close to residential areas. Station 1 is on the beach, and station 2 is in the middle of the mangrove area so that the garbage at this station has been filtered at station 1 and station 3. The trash at station 2 is dominated by floating plastic bottles and
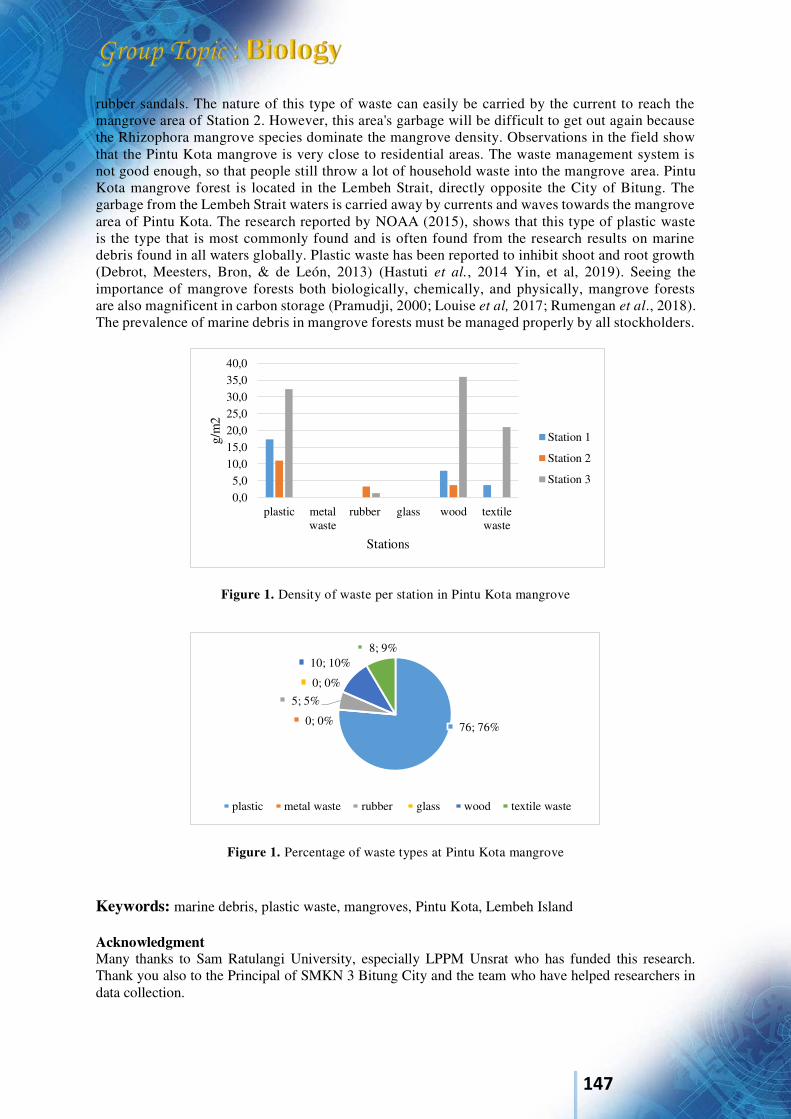
147
rubber sandals. The nature of this type of waste can easily be carried by the current to reach the mangrove area of Station 2. However, this area's garbage will be difficult to get out again because the Rhizophora mangrove species dominate the mangrove density. Observations in the field show that the Pintu Kota mangrove is very close to residential areas. The waste management system is not good enough, so that people still throw a lot of household waste into the mangrove area. Pintu Kota mangrove forest is located in the Lembeh Strait, directly opposite the City of Bitung. The garbage from the Lembeh Strait waters is carried away by currents and waves towards the mangrove area of Pintu Kota. The research reported by NOAA (2015), shows that this type of plastic waste is the type that is most commonly found and is often found from the research results on marine debris found in all waters globally. Plastic waste has been reported to inhibit shoot and root growth (Debrot, Meesters, Bron, & de León, 2013) (Hastuti et al., 2014 Yin, et al, 2019). Seeing the importance of mangrove forests both biologically, chemically, and physically, mangrove forests are also magnificent in carbon storage (Pramudji, 2000; Louise et al, 2017; Rumengan et al., 2018). The prevalence of marine debris in mangrove forests must be managed properly by all stockholders.
Figure 1. Density of waste per station in Pintu Kota mangrove
Figure 1. Percentage of waste types at Pintu Kota mangrove Keywords: marine debris, plastic waste, mangroves, Pintu Kota, Lembeh Island Acknowledgment Many thanks to Sam Ratulangi University, especially LPPM Unsrat who has funded this research. Thank you also to the Principal of SMKN 3 Bitung City and the team who have helped researchers in data collection.
0,05,0
10,015,020,025,030,035,040,0
plastic metalwaste
rubber glass wood textilewaste
g/m
2
Stations
Station 1
Station 2
Station 3
76; 76%0; 0%
5; 5%
0; 0%
10; 10%8; 9%
plastic metal waste rubber glass wood textile waste
148
References Debrot, A. O., Meesters, H. W. G., Bron, P. S., & de León, R. (2013). Marine debris in mangroves
and on the seabed: Largely-neglected litter problems. Marine Pollution Bulletin, 72(1), 1. https://doi.org/10.1016/j.marpolbul.2013.03.023
Hastuti, A. Y. U. R., Yulianda, F., & Wardiatno, Y. (2014). Distribusi spasial sampah laut di ekosistem mangrove Pantai Indah Kapuk. Bonorowo Wetlands 4 (2): 94-107, December 2014, 4(December), 94–107. https://doi.org/10.13057/bonorowo/w040203
Mulasari, S. A., Husodo, A. H., & Muhadjir, N. (2014). Kebijakan Pemerintah dalam Pengelolaan Sampah Domestik. Kesmas: National Public Health Journal, 8(8), 404–410. https://doi.org/10.21109/kesmas.v8i8.412
NOAA. (2015). Turning The Tide On Trash a Learning Guide on Marine Debris (S. B. McPherson, ed.). Retrieved from https://marinedebris.noaa.gov/sites/default/files/publications-files/2015_TurningTideonTrash_HiRes_Final.pdf
Pramudji. (2000). Dampak Perilaku Manusia pada Ekosistem Hutan Mangrove Di Indonesia. Oseana, 15(2), 13–20.
Rumengan, A. P., Paruntu, C. P., Paransa, D., & Rumengan, S. H. (2020). Study on mangrove canopy cover in Lembeh Island, North Sulawesi. IOP Conference Series: Earth and Environmental
Science, 441(1). https://doi.org/10.1088/1755-1315/441/1/012118 Rumengan, Antonius P., Mantiri, D. M. H., Rompas, R., Hutahaean, A., Kepel, T. L., Paruntu, C. P.,
… Gerung, G. S. (2018). Carbon stock assessment of mangrove ecosystem in totok bay, southeast minahasa regency, north sulawesi, indonesia. AACL Bioflux, 11(4), 1280–1288.
Terry Louise, K., Devi Dwiyanti, S., Nur Afi Ati, R., Hadiwijaya Lesmana, S., & Andreas Albertio, H. (2017). Nilai Penting Dan Estimasi Ekonomi Simpanan Karbon Vegetasi Mangrove Di Kecamatan Kema, Sulawesi Utara. Jurnal Kelautan Nasional, 12(1), 19. https://doi.org/10.15578/jkn.v12i1.6170
Yin, C. S., Chai, Y. J., Carey, D., Yusup, Y., & Gallagher, J. B. (2019). Anthropogenic marine debris
and its dynamics across peri-urban and urban mangroves on Penang Island, Malaysia. https://doi.org/10.1101/756106
149
International Conference on Natural Sciences, Mathematics, Applications, Research, and Technology
Manado, Indonesia, 22-23 October 2020
PHYTOCHEMICAL COMPOUNDS AND ANTIBACTERIAL ACTIVITY TO Escherichia coli OF GREEN MACRO ALGAE Ulfa reticulata AND Caulerpa racemosa
Ketut Srie Marhaeni Julyasih
Department of Marine Biology and Fisheries, Faculty of Mathematics and Natural Sciences, University of Ganesha Education, Singaraja Bali, Indonesia Email : [email protected]
INTRODUCTION Escherichia coli is a bacteria found in the large intestine of humans as a normal flora. It's unique because it can cause primary infection in the intestine such as diarrhea in children. Diarrhea sufferers use drugs derived from chemicals and herbal plants. (Bachtiar et al., 2012). Furthermore it is important to examine of the marine biological resources such as seaweed to be an alternative treatment for diarrhea. Development of seaweed as an antibacterial is one alternative that needs to be realized. Antibacterial compounds must be effective in controlling bacterial growth and the problem of resistance to materials used, especially bacteria that harm humans. The use of seaweed as an antibacterial is an alternative that needs to be realized. Based on the description above,this research purpose to examine phytochemical compound of several types of green macro algae and antibacterial activity to inhibit the growth of E.coli bacteria.The study used of Ulva reticulata and Caulerpa racemosa. RESULTS AND DISCUSSION The analyse of phytochemical compound in Ulva reticulata contain of terpenoid, alkaloid, and phenolic. Pytochemical compound in Caulerpa racemosa contain of terpenoid, alkaloid, and phenolic, and flavonoid. The research results showed that Ulva reticulata and Caulerpa racemosa had the ability to inhibit E.coli bacteria growth with a inhibition zone diameter of U.reticulata about 6.0 mm and C.
racemosa about 12.0 mm. The potential inhibition of seaweed against E.coli bacteria is likely due to the presence of phenol compounds and their derivatives (flavonoids) contained in each type of seaweed. Phenol compounds and their derivatives (flavonoids) are one of the antibacterials that works by disrupting the function of the cytoplasmic membrane. The presence of these phenolic compounds can cause damage to the cytoplasm. The H-ion of the phenol compound and its derivatives will attack the polar group (phosphate group) so that the phospholipid molecule on the bacterial cell wall will break down into glycerol, carboxylic acid, and phosphoric acid. Phospholida is unable to maintain the shape of the cytoplasmic membrane. As a result, the cytoplasmic membrane will leak and bacteria will experience growth inhibitions and even death. Flavonoids prevent the formation of energy in the cytoplasmic membrane and inhibit bacterial motility, which also plays a role in antimicrobial action (Chalyyn et al., 2017). The group of alkaloid compounds, flavonoids, steroids / triterpenoids and tannins found in crude seaweed extracts are thought to be active as antifungal and antibacterial compounds (Wiyanto, 2010). The main chemical compounds which have antibacterial properties are phenols, alcohols, halogens, heavy metals, dyestuffs, detergents, quaternary compounds, acids and bases. Phenol compounds can interact with the components of the bacterial cell wall so as to cause permeability in bacterial cells and can also diffuse into cells so that bacterial growth is inhibited or dead, besides this compound can also penetrate the membrane and interact with genetic material so that bacteria undergo mutation (Siregar et al ., 2012).
150
Keywords :macro algae, Eschericia coli, antibacterial, phyochemical, phenolic, alkaloid, flavonoid, terpenoid Acknowledgements. We thank you for all team that have been support this research
References 1. Bachtiar, S.Y., W. Tjahyaningsih., dan N.Sianita. 2012. Effect of Algae Brown
(Sargassum sp.) Ekstract Againts Bacterial Growth of Escherichia coli. Journal of Marine and Coastal Sciences ,1(1):53-60
2. Chalyyn, Pakidi dan Hidayat. 2017. Potensi dan Pemanfaatan Bahan aktif Alga Coklat sargassum sp. Octopus Jurnal Ilmu Perikanan. Vol 6 No 1 3. Cox,S.,Ghanam,N., Gupta,S. 2010. An assesment of the Antioxidant and Antimicrobial activity of six species of Edible Irish Seaweeds. International Food Research Journal 17: 205-220 4. Eahamban,K and J. Marimuthu. 2012. Preliminary Phytochemicals, UV-VIS HPLC and Antibacterial Studies on Gracilaria corticata. Asian Pasific Journal of Tropical Biomedicine. 5540- 5574 5. Siregar, A.F., S. Agus dan P. Delianis. 2012. Potensi Anti Bakteri Ekstrak Rumput Laut Terhadap Bakteri Penyakit Kulit Pseudomonas aeruginosa, Staphylococcus epidermides, dan Micrococcus luteus. Journal of Marine Research . Volume 1 No 2. Hal 152-160
151
International Conference on Natural Sciences, Mathematics, Applications, Research, and Technology
Manado, Indonesia, 22-23 October 2020
Screening and Characterization of Hydrocarbonoclastic Bacteria from Soil Contaminated with Used Engine Lubricants that Can Potentially be Used in Bioremediation Feky R. Mantiri*1 and Carla F. Kairupan2
1*Jurusan Biologi, Universitas Sam Ratulangi, INDONESIA. (E-mail: [email protected]) 2Bagian Patologi Anatomi, Universitas Sam Ratulangi, INDONESIA. (E-mail: [email protected]) INTRODUCTION Engine lubricating oils (oils) are produced in various formulations for various applications. Most of the oil used in motor vehicle engines, and there are more than one billion motorized vehicles worldwide [1]. Used lubricating oil has experienced high temperature and high mechanical pressure in the car engine process [2]. Used lubricating oil is a dark brown liquid and is very thick due to contamination with dirt, water, salt, metals, incomplete combustion products, and other materials during equipment operation [3]. Chemically used lubricating oil is a complex mixture of various chemicals, including linear and branched paraffins, cyclic alkanes, polycyclic aromatic hydrocarbons (PAHs), lubricant additives, and heavy metals [4]. These chemicals can endanger human health and are mutagens and carcinogens [5]. From many studies, bacteria are proven to be the main hydrocarbon degradation agents in the environment [6], and bacteria that decompose hydrocarbons are everywhere. The researchers suggest that more than 20 genera of hydrocarbon degrading bacteria have been described. Since one species is usually only able to degrade a certain number of compounds found in used lubricating oil waste, a consortium consisting of several different species of bacteria is required in the degradation of used lubricating oil (oil) waste. There have been many researches to find hydrocarbon degrading microorganisms, however most of them focus on oil pollution in the sea. Research on hydrocarbon degrading bacteria in land contaminated with used oil has not been widely carried out. The small number of studies on hydrocarbonoclastic bacteria that have been conducted have focused on one or two bacterial species. In fact, one species is usually only able to degrade a certain number of compounds found in used lubricating oil waste. Therefore the main problem raised in this proposed study is to isolate, screen and characterize a consortium of bacterial strains capable of degrading different hydrocarbon compounds from land contaminated with used lubricating oil. RESULTS AND DISCUSSION Bacterial samples were obtain from three traditional automotive repair shops where proper handling of used lubricating oil is not available. The samples were firstly incubated in Nutrient Agar media (Figure 1). Fifty six isolates were obtained and were grown in Nutrient broth containing 1% used lubricating oil. Of the 56 isolates, 35 isolates were able to grow in Nutrient Broth containing used lubricating oil.
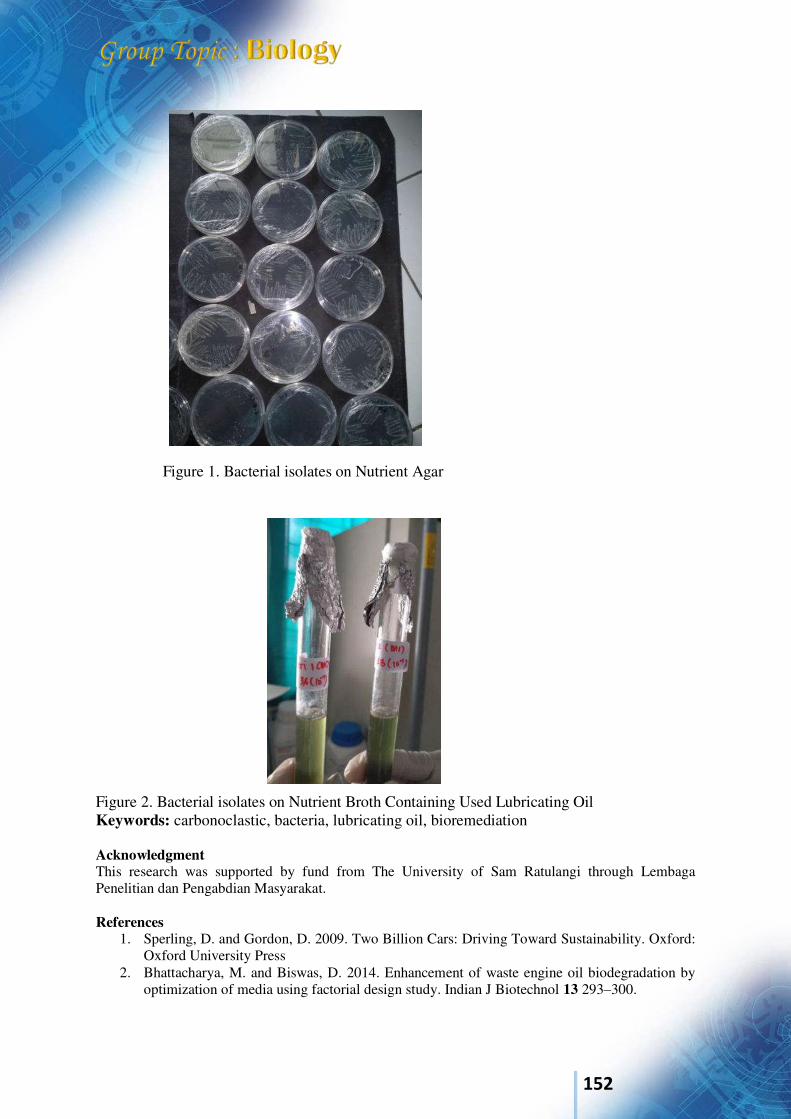
152
Figure 1. Bacterial isolates on Nutrient Agar Figure 2. Bacterial isolates on Nutrient Broth Containing Used Lubricating Oil Keywords: carbonoclastic, bacteria, lubricating oil, bioremediation Acknowledgment This research was supported by fund from The University of Sam Ratulangi through Lembaga Penelitian dan Pengabdian Masyarakat. References
1. Sperling, D. and Gordon, D. 2009. Two Billion Cars: Driving Toward Sustainability. Oxford: Oxford University Press
2. Bhattacharya, M. and Biswas, D. 2014. Enhancement of waste engine oil biodegradation by optimization of media using factorial design study. Indian J Biotechnol 13 293–300.

153
3. Ali, S.M.W., Ripin, A., Ahmad, A. 2010. Adsorption of heavy metal from recovered base oil using zeolite. J Appl Sci 10 21 2688–2692
4. Dike, B.U., Okoro, B.C., Nwakwasi, N.N., Agbo, K.C. 2013. Remediation of used motor engine oil contaminated soil: A soil washing treatment approach. J Civil Environ Eng 3 1 1–32017
5. Haritash, A.K., Kaushik, C.P. 2009. Biodegradation aspects of polycyclic aromatic hydrocarbons (PAHs): A review. J Hazard Mater 169 1–152014
6. Leahy, J. G., and R. R. Colwell. 1990. Microbial degradation of hydrocarbons in the environment. Microbiol. Rev 54 305–315
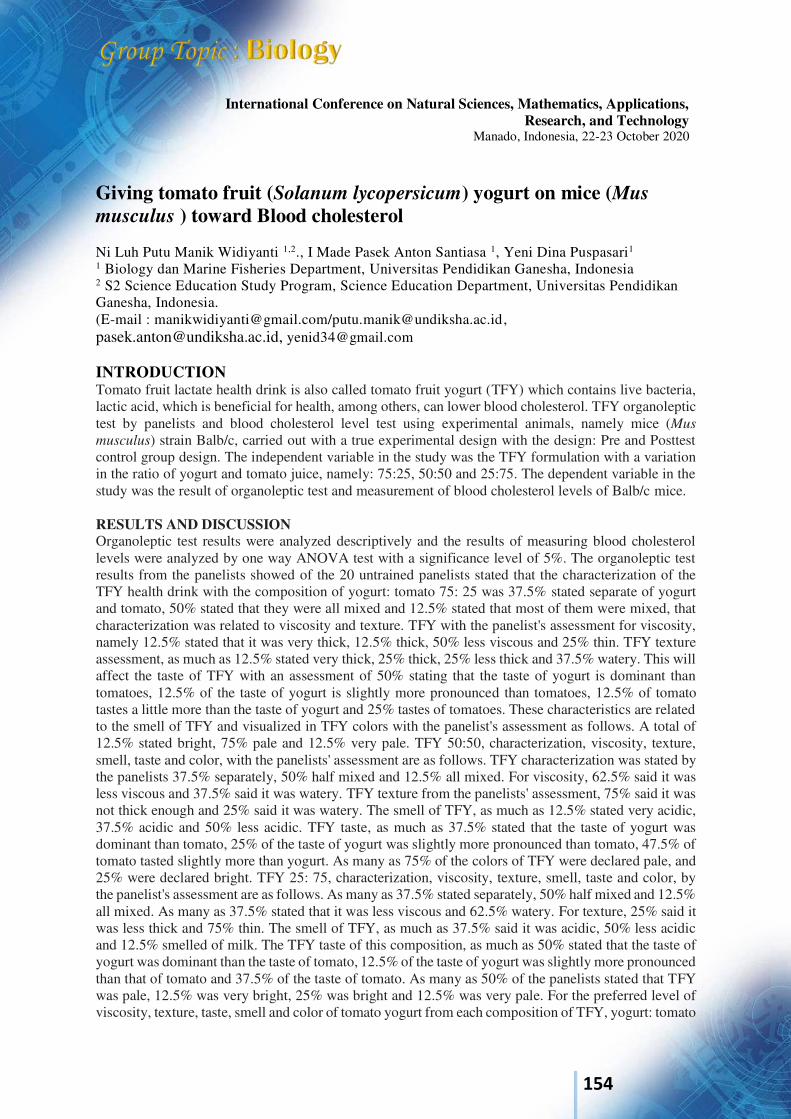
154
International Conference on Natural Sciences, Mathematics, Applications, Research, and Technology
Manado, Indonesia, 22-23 October 2020
Giving tomato fruit (Solanum lycopersicum) yogurt on mice (Mus
musculus ) toward Blood cholesterol Ni Luh Putu Manik Widiyanti 1,2., I Made Pasek Anton Santiasa 1, Yeni Dina Puspasari1
1 Biology dan Marine Fisheries Department, Universitas Pendidikan Ganesha, Indonesia 2 S2 Science Education Study Program, Science Education Department, Universitas Pendidikan Ganesha, Indonesia. (E-mail : [email protected]/[email protected], [email protected], [email protected]
INTRODUCTION Tomato fruit lactate health drink is also called tomato fruit yogurt (TFY) which contains live bacteria, lactic acid, which is beneficial for health, among others, can lower blood cholesterol. TFY organoleptic test by panelists and blood cholesterol level test using experimental animals, namely mice (Mus
musculus) strain Balb/c, carried out with a true experimental design with the design: Pre and Posttest control group design. The independent variable in the study was the TFY formulation with a variation in the ratio of yogurt and tomato juice, namely: 75:25, 50:50 and 25:75. The dependent variable in the study was the result of organoleptic test and measurement of blood cholesterol levels of Balb/c mice. RESULTS AND DISCUSSION Organoleptic test results were analyzed descriptively and the results of measuring blood cholesterol levels were analyzed by one way ANOVA test with a significance level of 5%. The organoleptic test results from the panelists showed of the 20 untrained panelists stated that the characterization of the TFY health drink with the composition of yogurt: tomato 75: 25 was 37.5% stated separate of yogurt and tomato, 50% stated that they were all mixed and 12.5% stated that most of them were mixed, that characterization was related to viscosity and texture. TFY with the panelist's assessment for viscosity, namely 12.5% stated that it was very thick, 12.5% thick, 50% less viscous and 25% thin. TFY texture assessment, as much as 12.5% stated very thick, 25% thick, 25% less thick and 37.5% watery. This will affect the taste of TFY with an assessment of 50% stating that the taste of yogurt is dominant than tomatoes, 12.5% of the taste of yogurt is slightly more pronounced than tomatoes, 12.5% of tomato tastes a little more than the taste of yogurt and 25% tastes of tomatoes. These characteristics are related to the smell of TFY and visualized in TFY colors with the panelist's assessment as follows. A total of 12.5% stated bright, 75% pale and 12.5% very pale. TFY 50:50, characterization, viscosity, texture, smell, taste and color, with the panelists' assessment are as follows. TFY characterization was stated by the panelists 37.5% separately, 50% half mixed and 12.5% all mixed. For viscosity, 62.5% said it was less viscous and 37.5% said it was watery. TFY texture from the panelists' assessment, 75% said it was not thick enough and 25% said it was watery. The smell of TFY, as much as 12.5% stated very acidic, 37.5% acidic and 50% less acidic. TFY taste, as much as 37.5% stated that the taste of yogurt was dominant than tomato, 25% of the taste of yogurt was slightly more pronounced than tomato, 47.5% of tomato tasted slightly more than yogurt. As many as 75% of the colors of TFY were declared pale, and 25% were declared bright. TFY 25: 75, characterization, viscosity, texture, smell, taste and color, by the panelist's assessment are as follows. As many as 37.5% stated separately, 50% half mixed and 12.5% all mixed. As many as 37.5% stated that it was less viscous and 62.5% watery. For texture, 25% said it was less thick and 75% thin. The smell of TFY, as much as 37.5% said it was acidic, 50% less acidic and 12.5% smelled of milk. The TFY taste of this composition, as much as 50% stated that the taste of yogurt was dominant than the taste of tomato, 12.5% of the taste of yogurt was slightly more pronounced than that of tomato and 37.5% of the taste of tomato. As many as 50% of the panelists stated that TFY was pale, 12.5% was very bright, 25% was bright and 12.5% was very pale. For the preferred level of viscosity, texture, taste, smell and color of tomato yogurt from each composition of TFY, yogurt: tomato
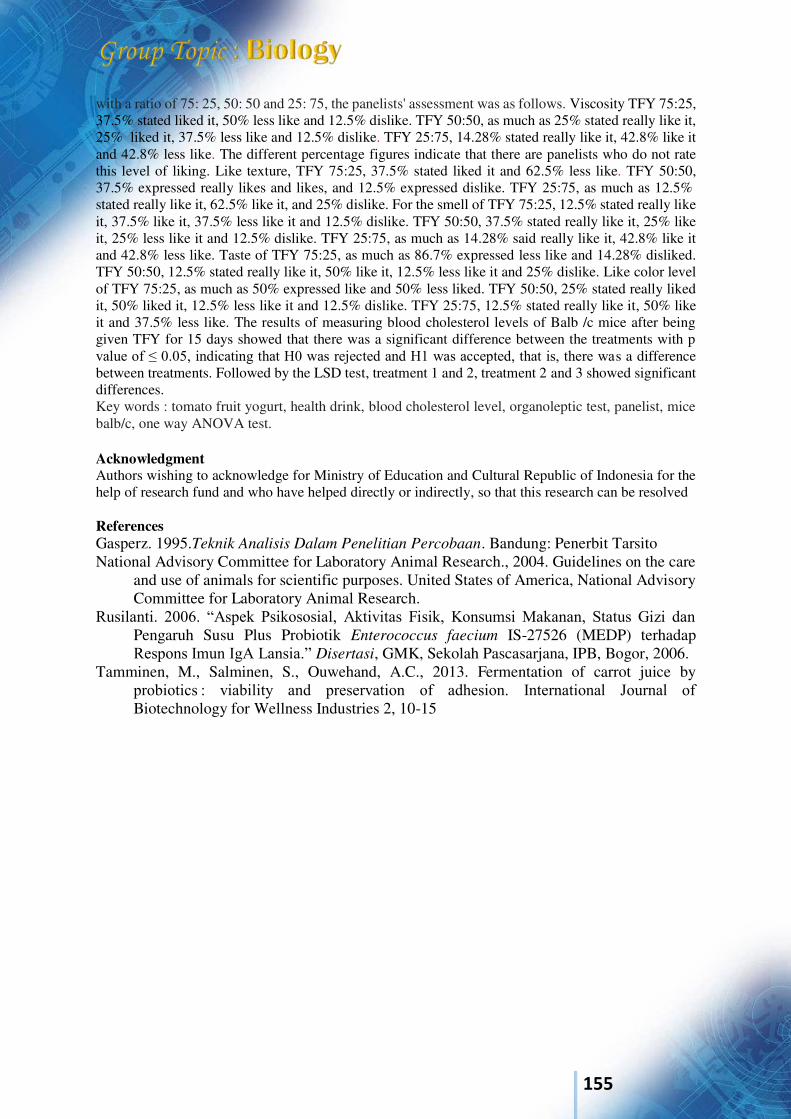
155
with a ratio of 75: 25, 50: 50 and 25: 75, the panelists' assessment was as follows. Viscosity TFY 75:25, 37.5% stated liked it, 50% less like and 12.5% dislike. TFY 50:50, as much as 25% stated really like it, 25% liked it, 37.5% less like and 12.5% dislike. TFY 25:75, 14.28% stated really like it, 42.8% like it and 42.8% less like. The different percentage figures indicate that there are panelists who do not rate this level of liking. Like texture, TFY 75:25, 37.5% stated liked it and 62.5% less like. TFY 50:50, 37.5% expressed really likes and likes, and 12.5% expressed dislike. TFY 25:75, as much as 12.5% stated really like it, 62.5% like it, and 25% dislike. For the smell of TFY 75:25, 12.5% stated really like it, 37.5% like it, 37.5% less like it and 12.5% dislike. TFY 50:50, 37.5% stated really like it, 25% like it, 25% less like it and 12.5% dislike. TFY 25:75, as much as 14.28% said really like it, 42.8% like it and 42.8% less like. Taste of TFY 75:25, as much as 86.7% expressed less like and 14.28% disliked. TFY 50:50, 12.5% stated really like it, 50% like it, 12.5% less like it and 25% dislike. Like color level of TFY 75:25, as much as 50% expressed like and 50% less liked. TFY 50:50, 25% stated really liked it, 50% liked it, 12.5% less like it and 12.5% dislike. TFY 25:75, 12.5% stated really like it, 50% like it and 37.5% less like. The results of measuring blood cholesterol levels of Balb /c mice after being given TFY for 15 days showed that there was a significant difference between the treatments with p value of ≤ 0.05, indicating that H0 was rejected and H1 was accepted, that is, there was a difference between treatments. Followed by the LSD test, treatment 1 and 2, treatment 2 and 3 showed significant differences. Key words : tomato fruit yogurt, health drink, blood cholesterol level, organoleptic test, panelist, mice balb/c, one way ANOVA test. Acknowledgment Authors wishing to acknowledge for Ministry of Education and Cultural Republic of Indonesia for the help of research fund and who have helped directly or indirectly, so that this research can be resolved References Gasperz. 1995.Teknik Analisis Dalam Penelitian Percobaan. Bandung: Penerbit Tarsito National Advisory Committee for Laboratory Animal Research., 2004. Guidelines on the care
and use of animals for scientific purposes. United States of America, National Advisory Committee for Laboratory Animal Research.
Rusilanti. 2006. “Aspek Psikososial, Aktivitas Fisik, Konsumsi Makanan, Status Gizi dan Pengaruh Susu Plus Probiotik Enterococcus faecium IS-27526 (MEDP) terhadap Respons Imun IgA Lansia.” Disertasi, GMK, Sekolah Pascasarjana, IPB, Bogor, 2006.
Tamminen, M., Salminen, S., Ouwehand, A.C., 2013. Fermentation of carrot juice by probiotics : viability and preservation of adhesion. International Journal of Biotechnology for Wellness Industries 2, 10-15
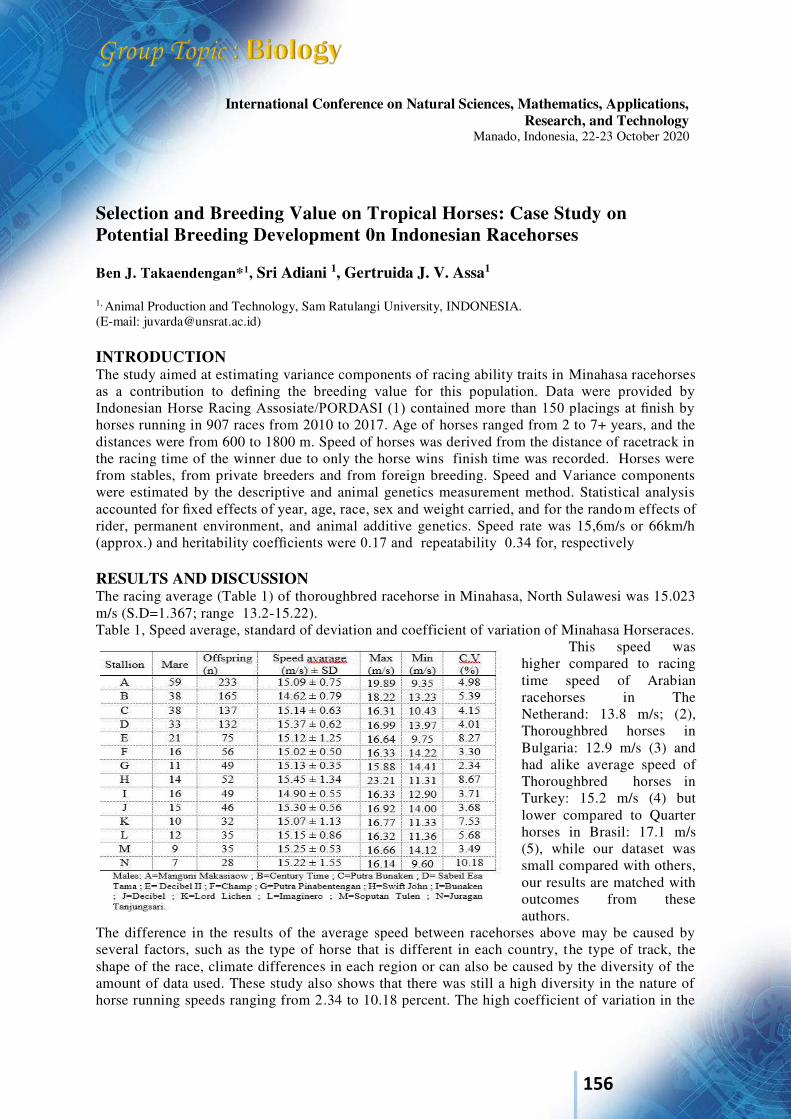
156
International Conference on Natural Sciences, Mathematics, Applications, Research, and Technology
Manado, Indonesia, 22-23 October 2020
Selection and Breeding Value on Tropical Horses: Case Study on Potential Breeding Development 0n Indonesian Racehorses Ben J. Takaendengan*1, Sri Adiani 1, Gertruida J. V. Assa1
1, Animal Production and Technology, Sam Ratulangi University, INDONESIA. (E-mail: [email protected]) INTRODUCTION The study aimed at estimating variance components of racing ability traits in Minahasa racehorses as a contribution to defining the breeding value for this population. Data were provided by Indonesian Horse Racing Assosiate/PORDASI (1) contained more than 150 placings at finish by horses running in 907 races from 2010 to 2017. Age of horses ranged from 2 to 7+ years, and the distances were from 600 to 1800 m. Speed of horses was derived from the distance of racetrack in the racing time of the winner due to only the horse wins finish time was recorded. Horses were from stables, from private breeders and from foreign breeding. Speed and Variance components were estimated by the descriptive and animal genetics measurement method. Statistical analysis accounted for fixed effects of year, age, race, sex and weight carried, and for the random effects of rider, permanent environment, and animal additive genetics. Speed rate was 15,6m/s or 66km/h (approx.) and heritability coefficients were 0.17 and repeatability 0.34 for, respectively RESULTS AND DISCUSSION The racing average (Table 1) of thoroughbred racehorse in Minahasa, North Sulawesi was 15.023 m/s (S.D=1.367; range 13.2-15.22). Table 1, Speed average, standard of deviation and coefficient of variation of Minahasa Horseraces.
This speed was higher compared to racing time speed of Arabian racehorses in The Netherand: 13.8 m/s; (2), Thoroughbred horses in Bulgaria: 12.9 m/s (3) and had alike average speed of Thoroughbred horses in Turkey: 15.2 m/s (4) but lower compared to Quarter horses in Brasil: 17.1 m/s (5), while our dataset was small compared with others, our results are matched with outcomes from these authors.
The difference in the results of the average speed between racehorses above may be caused by several factors, such as the type of horse that is different in each country, the type of track, the shape of the race, climate differences in each region or can also be caused by the diversity of the amount of data used. These study also shows that there was still a high diversity in the nature of horse running speeds ranging from 2.34 to 10.18 percent. The high coefficient of variation in the
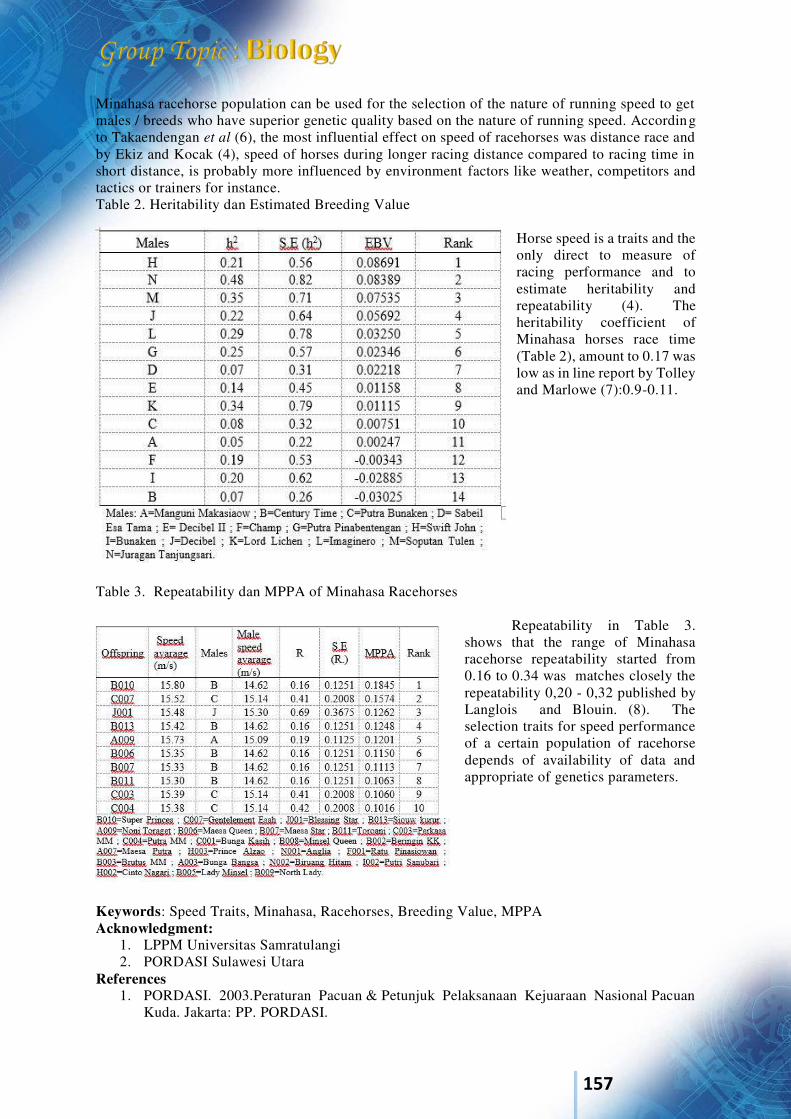
157
Minahasa racehorse population can be used for the selection of the nature of running speed to get males / breeds who have superior genetic quality based on the nature of running speed. According to Takaendengan et al (6), the most influential effect on speed of racehorses was distance race and by Ekiz and Kocak (4), speed of horses during longer racing distance compared to racing time in short distance, is probably more influenced by environment factors like weather, competitors and tactics or trainers for instance. Table 2. Heritability dan Estimated Breeding Value
Horse speed is a traits and the only direct to measure of racing performance and to estimate heritability and repeatability (4). The heritability coefficient of Minahasa horses race time (Table 2), amount to 0.17 was low as in line report by Tolley and Marlowe (7):0.9-0.11.
Table 3. Repeatability dan MPPA of Minahasa Racehorses
Repeatability in Table 3. shows that the range of Minahasa racehorse repeatability started from 0.16 to 0.34 was matches closely the repeatability 0,20 - 0,32 published by Langlois and Blouin. (8). The selection traits for speed performance of a certain population of racehorse depends of availability of data and appropriate of genetics parameters.
Keywords: Speed Traits, Minahasa, Racehorses, Breeding Value, MPPA Acknowledgment:
1. LPPM Universitas Samratulangi 2. PORDASI Sulawesi Utara
References 1. PORDASI. 2003.Peraturan Pacuan & Petunjuk Pelaksanaan Kejuaraan Nasional Pacuan
Kuda. Jakarta: PP. PORDASI.

158
2. Schurink A, M.C.J. Theunissen, B.J. Ducro, P. Bijma, & E.M. van Grevenhof., 2009. Identification of environmental factors affecting the speed of purebred Arabian racehorses in The Netherlands. Livestock Science Journal 125 (2009):97–100.
3. Sabeva, I., 2000a. Sources of specific variance and heritability of race time and speed in horses from thoroughbred Arabian breed. Bulg. J. Agric. Sci. 6 (2000):223–226.
4. Ekiz, B., & Koçak, Ö., 2007. Estimates of genetic parameters for racing times of Thoroughbred horses. Turk. J. Vet. Anim. Sci. 31(2007):1–5.
5. Corrêa, M.J.M., Mota, M.D.S., 2007. Genetic evaluation of performance traits in Brazilian Quarter Horse. J. Appl. Genet. 48(2007):145–151.
6. Takaendengan B.J., S. Adiani, & R.R. Noor. 2011.Morphometric Characterization of Minahasa Horse for Breeding and Conservation Purposes. Media Peternakan, Agustus 2011, hlm. 99-104 EISSN 2087-4634.
7. Tolley E.A., D.R. Notter, & T. J. Marlowe 1983. Heritability and Repitability Of Speed For 2- and 3-Year-Old Standardbred Racehorses. Virginia Polytechnic Institute and State University 3, Blacksburg 24061.
8. Langlois B. & C. Blouin. 2007. Annual, career or single race records for breeding value estimation in race horses. Livestock Science 107 (2007):132-147.
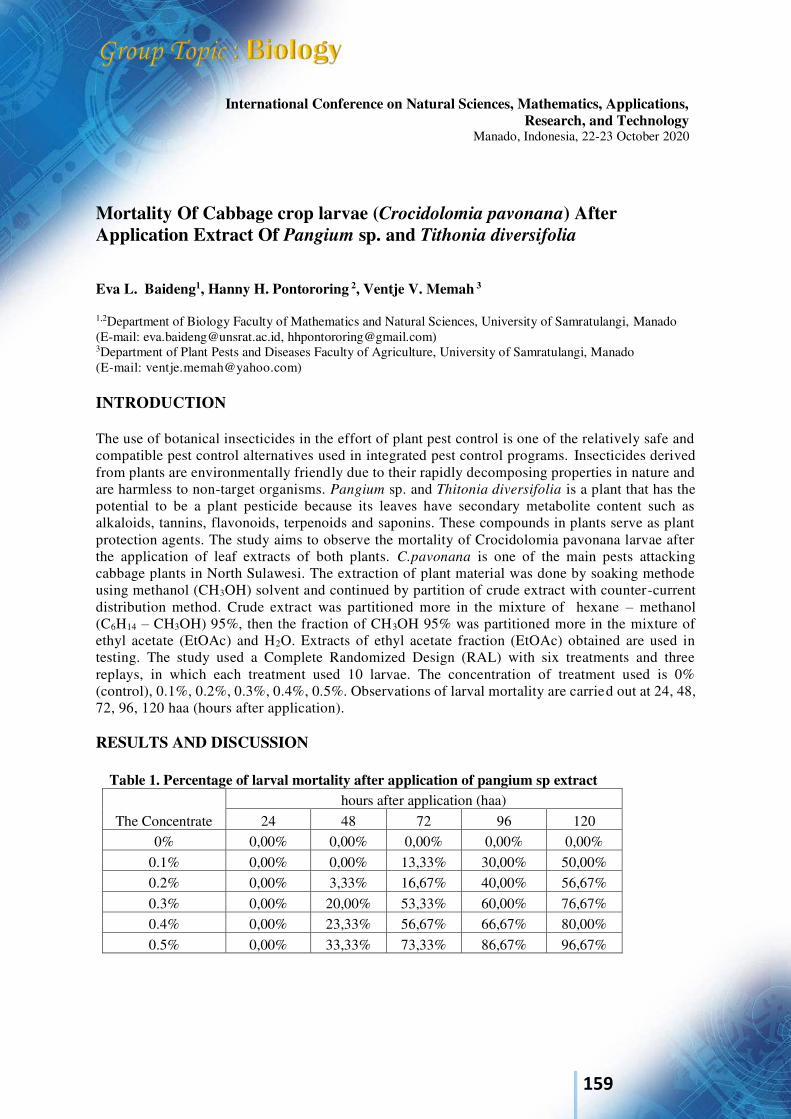
159
International Conference on Natural Sciences, Mathematics, Applications, Research, and Technology
Manado, Indonesia, 22-23 October 2020
Mortality Of Cabbage crop larvae (Crocidolomia pavonana) After Application Extract Of Pangium sp. and Tithonia diversifolia Eva L. Baideng1, Hanny H. Pontororing 2, Ventje V. Memah 3
1,2Department of Biology Faculty of Mathematics and Natural Sciences, University of Samratulangi, Manado (E-mail: [email protected], [email protected]) 3Department of Plant Pests and Diseases Faculty of Agriculture, University of Samratulangi, Manado (E-mail: [email protected]) INTRODUCTION The use of botanical insecticides in the effort of plant pest control is one of the relatively safe and compatible pest control alternatives used in integrated pest control programs. Insecticides derived from plants are environmentally friendly due to their rapidly decomposing properties in nature and are harmless to non-target organisms. Pangium sp. and Thitonia diversifolia is a plant that has the potential to be a plant pesticide because its leaves have secondary metabolite content such as alkaloids, tannins, flavonoids, terpenoids and saponins. These compounds in plants serve as plant protection agents. The study aims to observe the mortality of Crocidolomia pavonana larvae after the application of leaf extracts of both plants. C.pavonana is one of the main pests attacking cabbage plants in North Sulawesi. The extraction of plant material was done by soaking methode using methanol (CH3OH) solvent and continued by partition of crude extract with counter-current distribution method. Crude extract was partitioned more in the mixture of hexane – methanol (C6H14 – CH3OH) 95%, then the fraction of CH3OH 95% was partitioned more in the mixture of ethyl acetate (EtOAc) and H2O. Extracts of ethyl acetate fraction (EtOAc) obtained are used in testing. The study used a Complete Randomized Design (RAL) with six treatments and three replays, in which each treatment used 10 larvae. The concentration of treatment used is 0% (control), 0.1%, 0.2%, 0.3%, 0.4%, 0.5%. Observations of larval mortality are carried out at 24, 48, 72, 96, 120 haa (hours after application). RESULTS AND DISCUSSION
Table 1. Percentage of larval mortality after application of pangium sp extract
The Concentrate hours after application (haa)
24 48 72 96 120 0% 0,00% 0,00% 0,00% 0,00% 0,00%
0.1% 0,00% 0,00% 13,33% 30,00% 50,00% 0.2% 0,00% 3,33% 16,67% 40,00% 56,67% 0.3% 0,00% 20,00% 53,33% 60,00% 76,67% 0.4% 0,00% 23,33% 56,67% 66,67% 80,00% 0.5% 0,00% 33,33% 73,33% 86,67% 96,67%
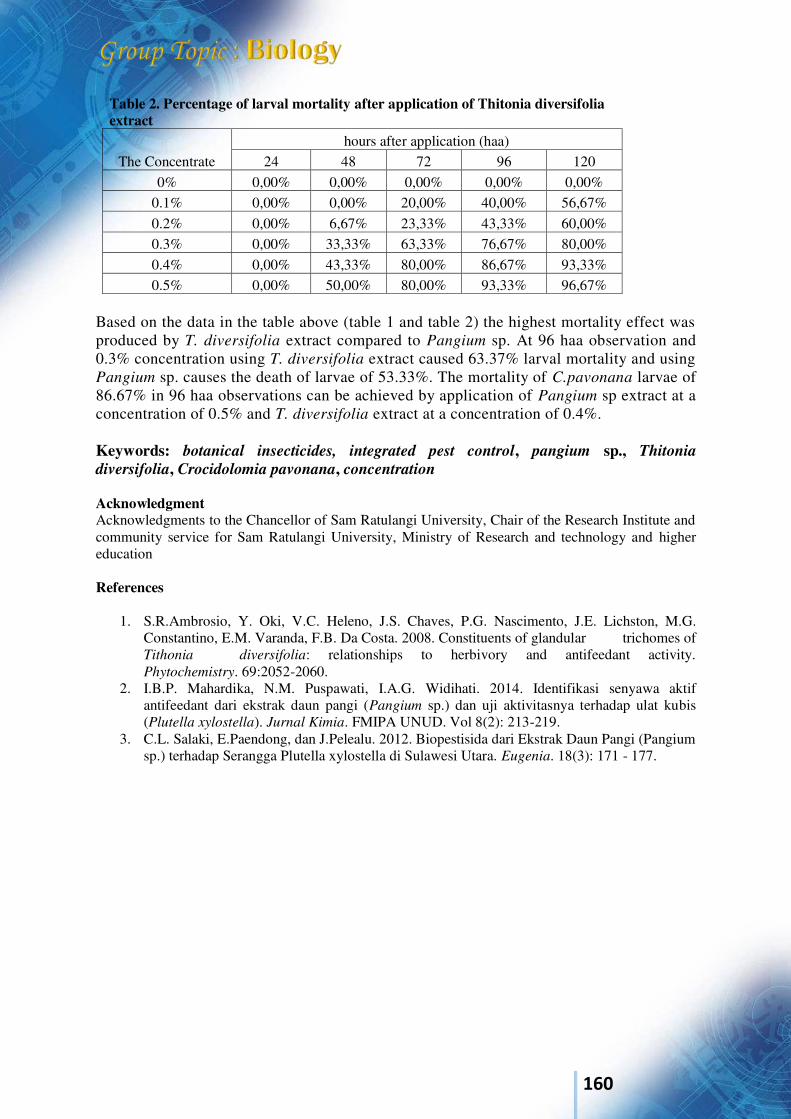
160
Table 2. Percentage of larval mortality after application of Thitonia diversifolia extract
The Concentrate hours after application (haa)
24 48 72 96 120 0% 0,00% 0,00% 0,00% 0,00% 0,00%
0.1% 0,00% 0,00% 20,00% 40,00% 56,67% 0.2% 0,00% 6,67% 23,33% 43,33% 60,00% 0.3% 0,00% 33,33% 63,33% 76,67% 80,00% 0.4% 0,00% 43,33% 80,00% 86,67% 93,33% 0.5% 0,00% 50,00% 80,00% 93,33% 96,67%
Based on the data in the table above (table 1 and table 2) the highest mortality effect was produced by T. diversifolia extract compared to Pangium sp. At 96 haa observation and 0.3% concentration using T. diversifolia extract caused 63.37% larval mortality and using Pangium sp. causes the death of larvae of 53.33%. The mortality of C.pavonana larvae of 86.67% in 96 haa observations can be achieved by application of Pangium sp extract at a concentration of 0.5% and T. diversifolia extract at a concentration of 0.4%. Keywords: botanical insecticides, integrated pest control, pangium sp., Thitonia
diversifolia, Crocidolomia pavonana, concentration Acknowledgment Acknowledgments to the Chancellor of Sam Ratulangi University, Chair of the Research Institute and community service for Sam Ratulangi University, Ministry of Research and technology and higher education References
1. S.R.Ambrosio, Y. Oki, V.C. Heleno, J.S. Chaves, P.G. Nascimento, J.E. Lichston, M.G. Constantino, E.M. Varanda, F.B. Da Costa. 2008. Constituents of glandular trichomes of Tithonia diversifolia: relationships to herbivory and antifeedant activity. Phytochemistry. 69:2052-2060.
2. I.B.P. Mahardika, N.M. Puspawati, I.A.G. Widihati. 2014. Identifikasi senyawa aktif antifeedant dari ekstrak daun pangi (Pangium sp.) dan uji aktivitasnya terhadap ulat kubis (Plutella xylostella). Jurnal Kimia. FMIPA UNUD. Vol 8(2): 213-219.
3. C.L. Salaki, E.Paendong, dan J.Pelealu. 2012. Biopestisida dari Ekstrak Daun Pangi (Pangium sp.) terhadap Serangga Plutella xylostella di Sulawesi Utara. Eugenia. 18(3): 171 - 177.
161
International Conference on Natural Sciences, Mathematics, Applications, Research, and Technology
Manado, Indonesia, 22-23 October 2020 The Content of Flavonoids, Tannins and Proteins in Sweet Potatoes (Ipomoea batatas L.) that been given Plant Growth Promoting Rhizobacteria (PGPR) Elicitors Henny L. Rampe *1, Sendy B. Rondonuwu*1 dan Rooije R. Rumende*1 1,2,3 Biology Department of Mathematics and Natural Science Faculty, Sam Ratulangi University,
Indonesia E-mail : [email protected]; [email protected] dan [email protected] INTRODUCTION The diversity of vegetation in the protected forest area of Mount Mahawu can be a source of Rhizobacteria elicitor, which can lead to plant resistance. Rhizobacteria are group of bacteria that live in the blood of the rhizosphere and been used as biological agents. Rhizobacteria which are Plant Growth Promoting Rhizobacteria (PGPR) can act as biofertilizer, biopesticides and bioprotectant [1], can stimulate plant growth, produce antibiotics and induce plant resistance [2][3]. Rhizobacteria can be potential as elicitors that induce plant resistance [4]. Rhizobacteria, which are potential as PGPR, can influence the availability, mobilization or facilitate the absorption of various nutrients in the soil, as well as synthesizing and changing the concentration of various growth-promoting phytohormones. The indirect effect of PGPR's ability is to suppress pathogenic activity by producing various compounds or metabolites such as antibiotics and siderophores [5]. Research on the potential elicitor of the rhizobacteria Pseudomonas sp. and Bacillus sp. on ten peanut varieties originating from Mount Masarang. The results showed that there was an increase in the content of flavonoids, tannins and protein in plants that were applied with rhizobacteria [6]. The nature of plant resistance can be seen from the ability of plants to synthesize primary metabolites such as protein and secondary metabolites such as flavonoids and tannins. This study used a completely randomized factorial design with 3 repetitions. Treatment of sweet potatoes varieties (U): Shi Royutaka (U1), Jago (U2), Antin 2 (U3) and Cilembu (U4). Rhizobacteria (R): Control (R1) and PGPR Pseudomonas sp. and Bacillus sp. (R2). PGPR application was given 2 times, where the plants were 15 days after planting (DAP) and 30 DAP. Observations were made after the plants were 2 months old. The parameters observed were: 1) The content of flavonoid with a spectrometer [7]. 2) Tannin content, through a qualitative test with the Gelatin Test and Test
for Chlorogenic Acid [8], and the total content of tannin, was calculated as the equivalent of gallic acid (Gallic Acid Equivalent/GAE); and 3) Protein content, with the Lowry method with Folin-Ciocalteu reagent with a spectrometer [9] [10]. RESULTS AND DISCUSSION Plant resistance to pests and diseases can be seen from the ability of these plants to synthesize primary metabolites such as protein and secondary metabolites such as flavonoids and tannins. PGPR Pseudomonas sp. and Bacillus sp. can induce the growth including synthesis of metabolite compounds. Data on the content of flavonoids, tannins and protein that been given PGPR Pseudomonas sp. and Bacillus sp. on sweet potatoes is shown in Table 1.
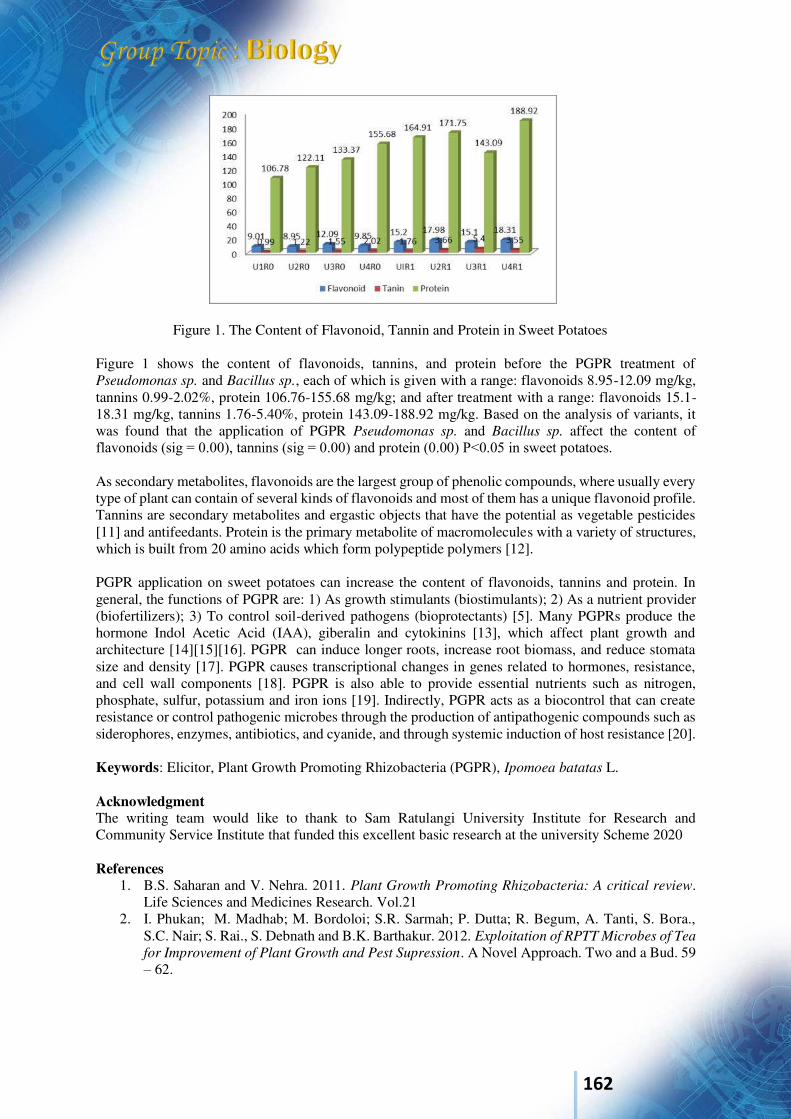
162
Figure 1. The Content of Flavonoid, Tannin and Protein in Sweet Potatoes Figure 1 shows the content of flavonoids, tannins, and protein before the PGPR treatment of Pseudomonas sp. and Bacillus sp., each of which is given with a range: flavonoids 8.95-12.09 mg/kg, tannins 0.99-2.02%, protein 106.76-155.68 mg/kg; and after treatment with a range: flavonoids 15.1-18.31 mg/kg, tannins 1.76-5.40%, protein 143.09-188.92 mg/kg. Based on the analysis of variants, it was found that the application of PGPR Pseudomonas sp. and Bacillus sp. affect the content of flavonoids (sig = 0.00), tannins (sig = 0.00) and protein (0.00) P˂0.05 in sweet potatoes. As secondary metabolites, flavonoids are the largest group of phenolic compounds, where usually every type of plant can contain of several kinds of flavonoids and most of them has a unique flavonoid profile. Tannins are secondary metabolites and ergastic objects that have the potential as vegetable pesticides [11] and antifeedants. Protein is the primary metabolite of macromolecules with a variety of structures, which is built from 20 amino acids which form polypeptide polymers [12]. PGPR application on sweet potatoes can increase the content of flavonoids, tannins and protein. In general, the functions of PGPR are: 1) As growth stimulants (biostimulants); 2) As a nutrient provider (biofertilizers); 3) To control soil-derived pathogens (bioprotectants) [5]. Many PGPRs produce the hormone Indol Acetic Acid (IAA), giberalin and cytokinins [13], which affect plant growth and architecture [14][15][16]. PGPR can induce longer roots, increase root biomass, and reduce stomata size and density [17]. PGPR causes transcriptional changes in genes related to hormones, resistance, and cell wall components [18]. PGPR is also able to provide essential nutrients such as nitrogen, phosphate, sulfur, potassium and iron ions [19]. Indirectly, PGPR acts as a biocontrol that can create resistance or control pathogenic microbes through the production of antipathogenic compounds such as siderophores, enzymes, antibiotics, and cyanide, and through systemic induction of host resistance [20]. Keywords: Elicitor, Plant Growth Promoting Rhizobacteria (PGPR), Ipomoea batatas L. Acknowledgment The writing team would like to thank to Sam Ratulangi University Institute for Research and Community Service Institute that funded this excellent basic research at the university Scheme 2020 References
1. B.S. Saharan and V. Nehra. 2011. Plant Growth Promoting Rhizobacteria: A critical review. Life Sciences and Medicines Research. Vol.21
2. I. Phukan; M. Madhab; M. Bordoloi; S.R. Sarmah; P. Dutta; R. Begum, A. Tanti, S. Bora., S.C. Nair; S. Rai., S. Debnath and B.K. Barthakur. 2012. Exploitation of RPTT Microbes of Tea
for Improvement of Plant Growth and Pest Supression. A Novel Approach. Two and a Bud. 59 – 62.
163
3. M. Tombe. 2013. Potential of Plant Growth-Enhancing Rhizobacteria as Environmentally Friendly Agents for Biological Control of Plantation Plant Diseases. Perspective 12 (2): 91-100.
4. Y. Bektas and T. Eulgem. 2014. Synthetic plant defense elicitors. Front Plant Science 5, 804. 5. E.Husen, R. Saraswati dan R. D. Hastuti. 2019. Organic Fertilizer and Biological Fertilizer:
Plant Growth Enhancing Rhizobacteria. Pages 191-209. (Accessed, October 29, 2019). 6. H.L. Rampe ; R. Siahaan dan J.A. Rorong. 2019. Induction of Peanut (Arachis hypogaea L.)
Resistance with Plant Extract Elicitors and Rhizobacteria. Superior basic research for higher education 2019.
7. Meda, A., C. E. Lamien, M. Romito, J. Milliogo and O. G. Nacoulina. 2005. Determination of
Total Phenolic, Flavonoid and Proline Contents in Burkina Fasan Honey, as well as their
Radical Scavenging Activity. Food Chemistry Vol. 91 (3): 571-577. 8. Trease G.E. and W.C. Evan. 1996. Pharmacognosy 14th eds. Sanders Company London. 9. Harborne. 1987. Phytochemical Method. Guide to Modern Methods of Analyzing Plants.
Translate K. Padmawinata and I. Soediro. Bandung Institute of Technology. Bandung. 354 p. 10. Tranggono and B. Setiaji. 1989. Food Biochemistry. Inter-University Center for Food and
Nutrition. Gajah Mada University. Yogyakarta 11. A. Firdauzi, T.A. Siawoyo and S. Wiryadiputra. 2013. Identification of Potential Tannin-
protein Complex Producing Plants for Inhibition of α-amylase Activity as Vegetable Pesticides. Pelita Perkebunan 29 (1): 31-43
12. N.A. Campbell, J. B. Reece and L. G. Mitchell. 1999. Biology. Benjamin Cummings. California.
13. G. Gupta, S. Parihar, N. K. Ahirwar, S.K. Snehi and V. Singh. 2015. Plant Growth-Promoting
Rhizobacteria (PGPR): Current and Future Prospects for Development of Sustainable
Agriculture. Microbial & Biochemical Technology, 7(2), 96-102. 14. J. Vacheron, G. Desbrosses, M.L. Bouffaud, B. Touraine, Y. Moënne-Loccoz, D. Muller, L.
Legendre, F. Wisniewski-Dyé, and C. Prigent-Combaret. 2013. Plant Growth-Promoting
Rhizobacteria and Root System Functioning. Frontier Plant Science, 4(356). 1-19. 15. C.K. Jha, C.K., and M. Saraf. 2015. Plant Growth Promoting Rhizobacteria (PGPR): A Review.
J. Agric.Res.Dev. 5 : 108-119 16. M. Ruzzi and R. Aroca. 2015. Plant Growth Promoting Rhizobacteria Act as Biostimulans on
Horticulture. Sci.Hortic. 196: 124-134. 17. B.E. Llorente, M.A. Alasia and E.E. Larraburu. 2016. Biofertilization with Azospirillum
brasilense Improves in Vitro Culture of Handroanthus ochaceus, a Forestry, ornamental and
Medical Plant. N. Biotechnol. 33:32-40. 18. S. Spaepen, S. Bossuyt, K. Engelen, K. Marchal, and J. Vanderleyden. 2014. Phenotypical and
Molecular Responses of Arabidopsis thaliana Roots as a Result of Inoculation with the Auxin-
Producing Bacterium Azospirillum brasilense. New Phytol 201:850-861. 19. O.M. Viveros, M.A. Jorquera, D.E. Crowley, G. Gajard and M.L. Mora. 2010. Mechanisms
and Practical Considerations Involved In Plant Growth Promotion by Rhizobacteria. Journal of Soil Science Plant Nutrient 10 (3): 293–319.
20. A.V. Sturz and J. Nowak. 2000. Endophytic communities of rhizobacteria and the strategies
required to create yield enhancing associations with crops. Applied Soil Ecology 15, 183 – 190.
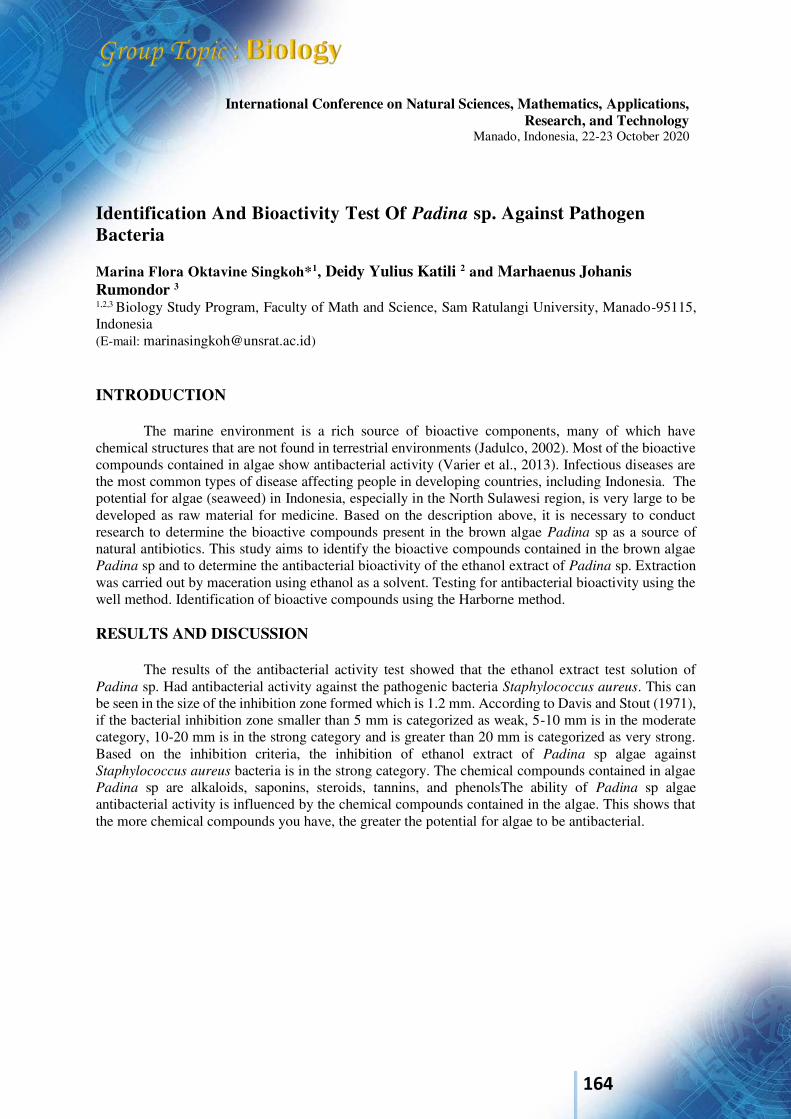
164
International Conference on Natural Sciences, Mathematics, Applications, Research, and Technology
Manado, Indonesia, 22-23 October 2020
Identification And Bioactivity Test Of Padina sp. Against Pathogen Bacteria Marina Flora Oktavine Singkoh*1, Deidy Yulius Katili 2 and Marhaenus Johanis Rumondor 3
1,2,3 Biology Study Program, Faculty of Math and Science, Sam Ratulangi University, Manado-95115, Indonesia (E-mail: [email protected]) INTRODUCTION
The marine environment is a rich source of bioactive components, many of which have chemical structures that are not found in terrestrial environments (Jadulco, 2002). Most of the bioactive compounds contained in algae show antibacterial activity (Varier et al., 2013). Infectious diseases are the most common types of disease affecting people in developing countries, including Indonesia. The potential for algae (seaweed) in Indonesia, especially in the North Sulawesi region, is very large to be developed as raw material for medicine. Based on the description above, it is necessary to conduct research to determine the bioactive compounds present in the brown algae Padina sp as a source of natural antibiotics. This study aims to identify the bioactive compounds contained in the brown algae Padina sp and to determine the antibacterial bioactivity of the ethanol extract of Padina sp. Extraction was carried out by maceration using ethanol as a solvent. Testing for antibacterial bioactivity using the well method. Identification of bioactive compounds using the Harborne method. RESULTS AND DISCUSSION
The results of the antibacterial activity test showed that the ethanol extract test solution of Padina sp. Had antibacterial activity against the pathogenic bacteria Staphylococcus aureus. This can be seen in the size of the inhibition zone formed which is 1.2 mm. According to Davis and Stout (1971), if the bacterial inhibition zone smaller than 5 mm is categorized as weak, 5-10 mm is in the moderate category, 10-20 mm is in the strong category and is greater than 20 mm is categorized as very strong. Based on the inhibition criteria, the inhibition of ethanol extract of Padina sp algae against Staphylococcus aureus bacteria is in the strong category. The chemical compounds contained in algae Padina sp are alkaloids, saponins, steroids, tannins, and phenolsThe ability of Padina sp algae antibacterial activity is influenced by the chemical compounds contained in the algae. This shows that the more chemical compounds you have, the greater the potential for algae to be antibacterial.
165
Keywords: Algae, Bioactive, Antibacterial
Acknowledgment References
1. Atta-ur-Rahman dan M. Iqbal Choudhary.2001. Bioactive natural products as a potential
sourceof new pharmacophores. A theory of memory. Pure Appl. Chem.73 (3) : 555–560. 2. Bansemir A, Blume M, Schröder S, dan Lindequist U. 2006. Screening of Cultivated Seaweeds
for Antibacterial Activity Against Fish Pathogenic Bacteria. Aquaculture 252: 79-84. 3. Davis, W., dan Stout, T.1971. Disc PITE Methods of Microbiological Antibiotic Assay.
Microbiology. Vol 22(4):659-665. 4. Harborne, J. B. 1987. Metode Fitokimia. Terjemahan dari Phytochemical Methods oleh Kosasih
Padmawinata & Iwang Soediro. Bandung. Penerbit ITB. 5. Jadulco, R. C. 2002, Isolation and Structure Elucidation of Bioactive Secondary Metabolites
from Marine Sponges and Sponge-derived Fungi [Dissertation of Doktorgrades] University of Wuerzburg, Wuerzberg.
6. Kusmayati dan Agustini, N. W. R. 2007. Uji Aktivitas Senyawa Antibakteri dari Mikroalga (Porphyridium cruentum). Biodiversitas. 8(1) : 48-53.
7. Varier, K.M., Miltan, M.C., Arulvasu, C., and Gajendran, B. 2013. Evaluation of Antibacterial
Properties of Selected Red Seaweeds from Rameshwaram Tamil Nadu India. Journal of
Academia and Industrial Research. 1(11): 667-670.
166
International Conference on Natural Sciences, Mathematics, Applications, Research, and Technology
Manado, Indonesia, 22-23 October 2020
Potential Antidegenerative Hypercholesterolemia in Steeping Tea with Combination of leaves of Pasote (Dysphania ambrosioides L.), Gedi (Abelmoschus Manihot L.), Tapak Dara (Catharanthus Roseus (L.) G. Don). Dingse Pandiangan1), Nelson Nainggolan2), Michael Vallery Loueis Tumbol3, Charles L. Kaunang4, Endang Pujiastuti5, Hendra Pratama Maliangkay6
1)Department of Biology FMIPA, Sam Ratulangi University, Manado, North Sulawesi, Indonesia Email [email protected] 2Department of Mathemathic FMIPA, Sam Ratulangi University, Manado, North Sulawesi, Indonesia E-mail: [email protected] 3Technology Laboratory Medic Study Program of Poltekes Kemenkes Manado, Indonesia Email [email protected] 4Faculty of Animal Science Sam Ratulangi University Manado, North Sulawesi, Indonesia E-mail: [email protected] 5Faculty of Animal Science Sam Ratulangi University Manado, North Sulawesi, Indonesia E-mail: [email protected]
ABSTRACT
Most of the Covid 19 victims were aged 50-70 years because at that age they had complications with degenerative diseases. Curing degenerative diseases by utilizing traditional medicinal plants to increase resistance to Covid 2019 infection can heal itself into a new breakthrough. It is hoped that the use of anti-degenerative supplements will also cure Covid 2019. Therefore, the development of this anti-degenerative supplement is very important as an immunomodulator, especially during the Covid 2019 outbreak. Cholesterol in the blood is needed by the body, but consumption of foods that contain excessive saturated fat will increase. cholesterol in the blood, causing hypercholesterolemia which is also the cause of plaque in the coronary heart. This study aims to analyze the potential of several traditional medicinal plants by providing a combination of tea with Pasote (Dysphania ambrosioides), Gedi (Abelmoschus manihot) and Tapak dara (Catharanthus roseus) blood cholesterol levels on blood cholesterol levels of white rats (Rattus novergicus). The research method used is experimental. The mice were induced with high fat for 2 weeks, then their blood cholesterol content was measured with Lipidpro, then treated with single steeping water and a combination of steeping water accompanied by negative and positive controls. The results showed that cholesterol levels increased after administration of fat (initial cholesterol) and after treatment the cholesterol content decreased in all treatments. The results of statistical tests indicate that the reduction in cholesterol levels in the treatment is significantly or significantly different at the 95% confidence level. The highest reduction in cholesterol content was in the cholesterol levels of white rats that had been given a combination of steeping water of tapak dara, gedi and pasote leaf powder to 44.61% of the control, while the lowest reduction was the combination of Pasote and Tapak dara which was only 0.9% of the control. The combination of Pasote, Gedi and Tapak Dara has the potential to be used as an anti-degenerative supplement, especially for reducing high cholesterol levels in patients with hypertension and hypercholesterolemia. INTRODUCTION Coronary heart disease, including a degenerative disease, also called non-communicable disease (PTM), is the number 1 killer of WHO data (2020). This disease was not a cause for concern in the past compared to infectious diseases in Indonesia or the COVID-19 Pandemic. This degenerative
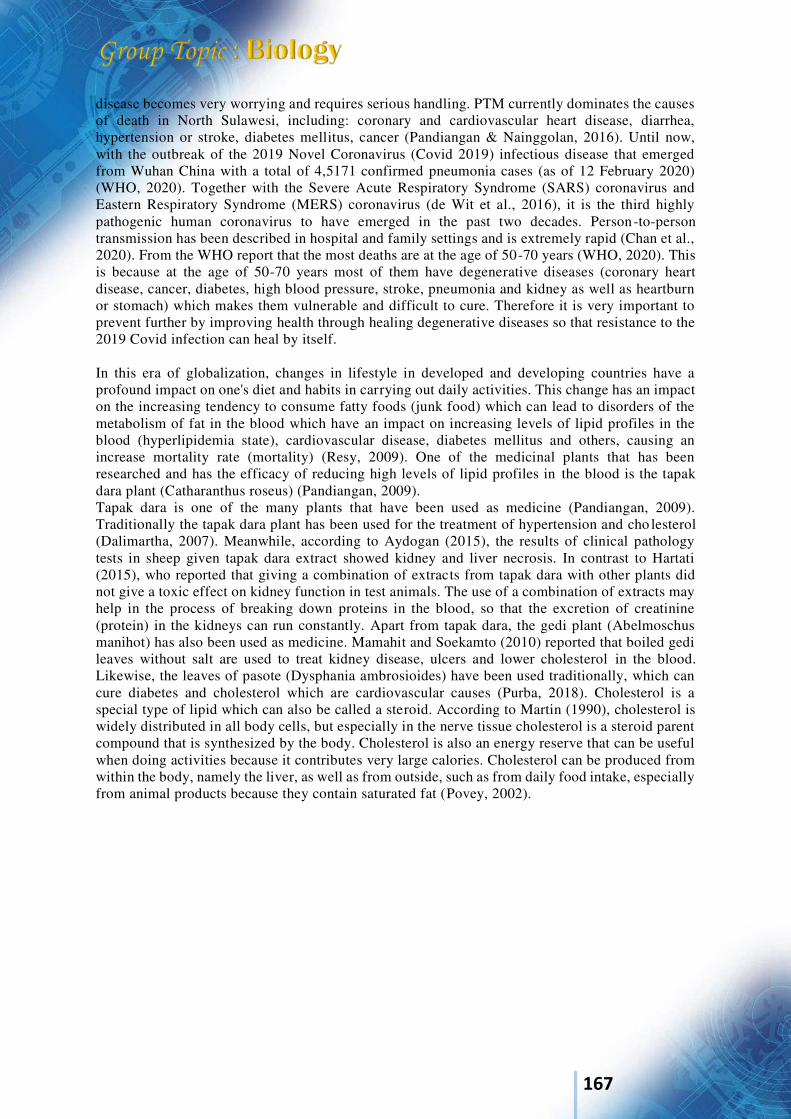
167
disease becomes very worrying and requires serious handling. PTM currently dominates the causes of death in North Sulawesi, including: coronary and cardiovascular heart disease, diarrhea, hypertension or stroke, diabetes mellitus, cancer (Pandiangan & Nainggolan, 2016). Until now, with the outbreak of the 2019 Novel Coronavirus (Covid 2019) infectious disease that emerged from Wuhan China with a total of 4,5171 confirmed pneumonia cases (as of 12 February 2020) (WHO, 2020). Together with the Severe Acute Respiratory Syndrome (SARS) coronavirus and Eastern Respiratory Syndrome (MERS) coronavirus (de Wit et al., 2016), it is the third highly pathogenic human coronavirus to have emerged in the past two decades. Person-to-person transmission has been described in hospital and family settings and is extremely rapid (Chan et al., 2020). From the WHO report that the most deaths are at the age of 50-70 years (WHO, 2020). This is because at the age of 50-70 years most of them have degenerative diseases (coronary heart disease, cancer, diabetes, high blood pressure, stroke, pneumonia and kidney as well as heartburn or stomach) which makes them vulnerable and difficult to cure. Therefore it is very important to prevent further by improving health through healing degenerative diseases so that resistance to the 2019 Covid infection can heal by itself. In this era of globalization, changes in lifestyle in developed and developing countries have a profound impact on one's diet and habits in carrying out daily activities. This change has an impact on the increasing tendency to consume fatty foods (junk food) which can lead to disorders of the metabolism of fat in the blood which have an impact on increasing levels of lipid profiles in the blood (hyperlipidemia state), cardiovascular disease, diabetes mellitus and others, causing an increase mortality rate (mortality) (Resy, 2009). One of the medicinal plants that has been researched and has the efficacy of reducing high levels of lipid profiles in the blood is the tapak dara plant (Catharanthus roseus) (Pandiangan, 2009). Tapak dara is one of the many plants that have been used as medicine (Pandiangan, 2009). Traditionally the tapak dara plant has been used for the treatment of hypertension and cho lesterol (Dalimartha, 2007). Meanwhile, according to Aydogan (2015), the results of clinical pathology tests in sheep given tapak dara extract showed kidney and liver necrosis. In contrast to Hartati (2015), who reported that giving a combination of extracts from tapak dara with other plants did not give a toxic effect on kidney function in test animals. The use of a combination of extracts may help in the process of breaking down proteins in the blood, so that the excretion of creatinine (protein) in the kidneys can run constantly. Apart from tapak dara, the gedi plant (Abelmoschus manihot) has also been used as medicine. Mamahit and Soekamto (2010) reported that boiled gedi leaves without salt are used to treat kidney disease, ulcers and lower cholesterol in the blood. Likewise, the leaves of pasote (Dysphania ambrosioides) have been used traditionally, which can cure diabetes and cholesterol which are cardiovascular causes (Purba, 2018). Cholesterol is a special type of lipid which can also be called a steroid. According to Martin (1990), cholesterol is widely distributed in all body cells, but especially in the nerve tissue cholesterol is a steroid parent compound that is synthesized by the body. Cholesterol is also an energy reserve that can be useful when doing activities because it contributes very large calories. Cholesterol can be produced from within the body, namely the liver, as well as from outside, such as from daily food intake, especially from animal products because they contain saturated fat (Povey, 2002).
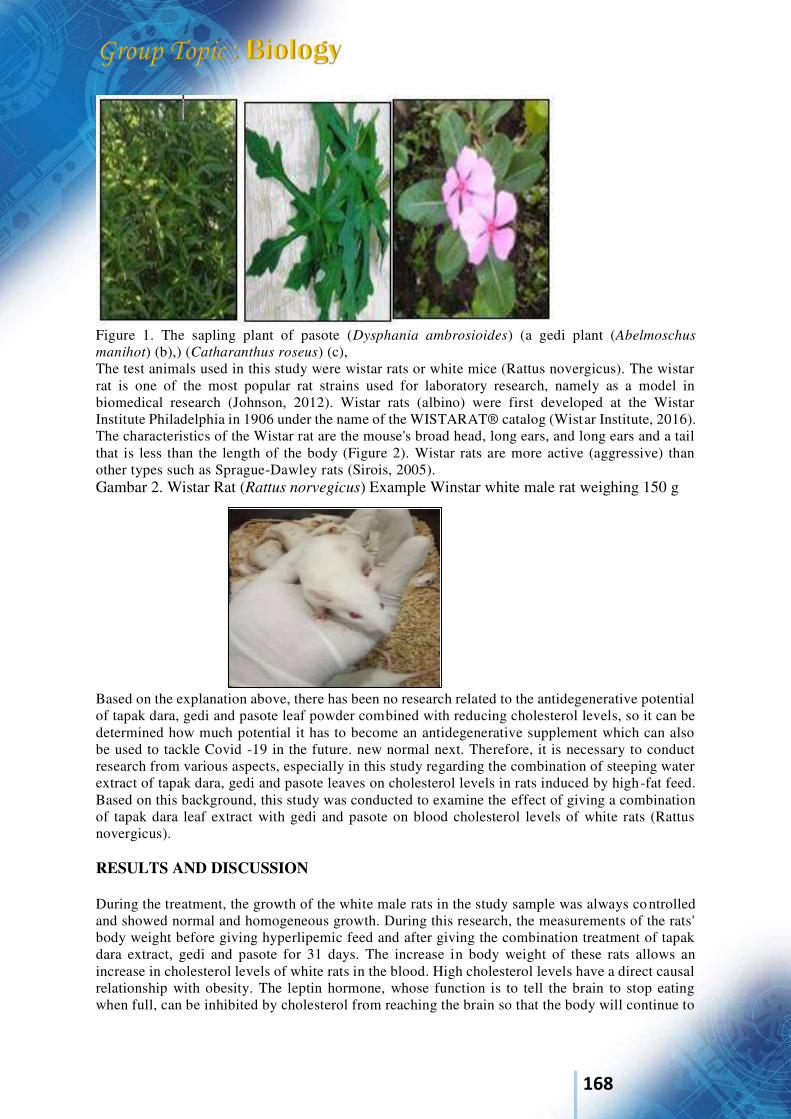
168
Figure 1. The sapling plant of pasote (Dysphania ambrosioides) (a gedi plant (Abelmoschus
manihot) (b),) (Catharanthus roseus) (c), The test animals used in this study were wistar rats or white mice (Rattus novergicus). The wistar rat is one of the most popular rat strains used for laboratory research, namely as a model in biomedical research (Johnson, 2012). Wistar rats (albino) were first developed at the Wistar Institute Philadelphia in 1906 under the name of the WISTARAT® catalog (Wistar Institute, 2016). The characteristics of the Wistar rat are the mouse's broad head, long ears, and long ears and a tail that is less than the length of the body (Figure 2). Wistar rats are more active (aggressive) than other types such as Sprague-Dawley rats (Sirois, 2005). Gambar 2. Wistar Rat (Rattus norvegicus) Example Winstar white male rat weighing 150 g
Based on the explanation above, there has been no research related to the antidegenerative potential of tapak dara, gedi and pasote leaf powder combined with reducing cholesterol levels, so it can be determined how much potential it has to become an antidegenerative supplement which can also be used to tackle Covid -19 in the future. new normal next. Therefore, it is necessary to conduct research from various aspects, especially in this study regarding the combination of steeping water extract of tapak dara, gedi and pasote leaves on cholesterol levels in rats induced by high-fat feed. Based on this background, this study was conducted to examine the effect of giving a combination of tapak dara leaf extract with gedi and pasote on blood cholesterol levels of white rats (Rattus novergicus). RESULTS AND DISCUSSION During the treatment, the growth of the white male rats in the study sample was always controlled and showed normal and homogeneous growth. During this research, the measurements of the rats' body weight before giving hyperlipemic feed and after giving the combination treatment of tapak dara extract, gedi and pasote for 31 days. The increase in body weight of these rats allows an increase in cholesterol levels of white rats in the blood. High cholesterol levels have a direct causal relationship with obesity. The leptin hormone, whose function is to tell the brain to stop eating when full, can be inhibited by cholesterol from reaching the brain so that the body will continue to
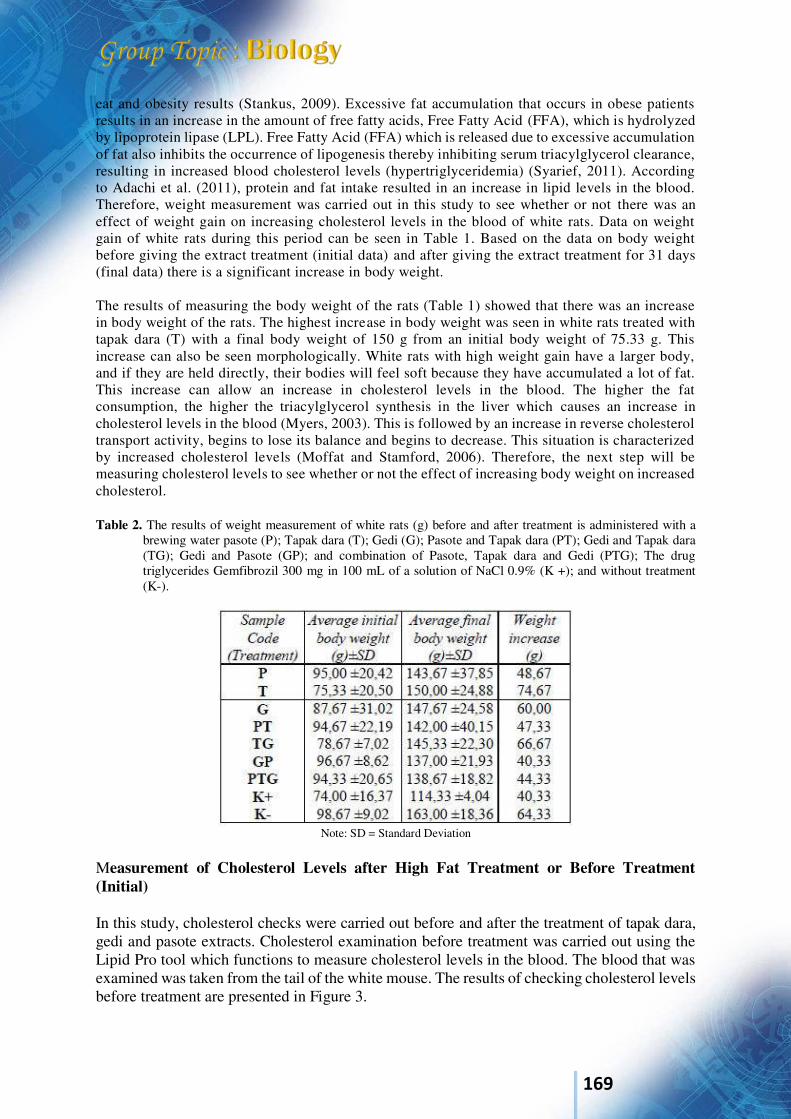
169
eat and obesity results (Stankus, 2009). Excessive fat accumulation that occurs in obese patients results in an increase in the amount of free fatty acids, Free Fatty Acid (FFA), which is hydrolyzed by lipoprotein lipase (LPL). Free Fatty Acid (FFA) which is released due to excessive accumulation of fat also inhibits the occurrence of lipogenesis thereby inhibiting serum triacylglycerol clearance, resulting in increased blood cholesterol levels (hypertriglyceridemia) (Syarief, 2011). According to Adachi et al. (2011), protein and fat intake resulted in an increase in lipid levels in the blood. Therefore, weight measurement was carried out in this study to see whether or not there was an effect of weight gain on increasing cholesterol levels in the blood of white rats. Data on weight gain of white rats during this period can be seen in Table 1. Based on the data on body weight before giving the extract treatment (initial data) and after giving the extract treatment for 31 days (final data) there is a significant increase in body weight. The results of measuring the body weight of the rats (Table 1) showed that there was an increase in body weight of the rats. The highest increase in body weight was seen in white rats treated with tapak dara (T) with a final body weight of 150 g from an initial body weight of 75.33 g. This increase can also be seen morphologically. White rats with high weight gain have a larger body, and if they are held directly, their bodies will feel soft because they have accumulated a lot of fat. This increase can allow an increase in cholesterol levels in the blood. The higher the fat consumption, the higher the triacylglycerol synthesis in the liver which causes an increase in cholesterol levels in the blood (Myers, 2003). This is followed by an increase in reverse cholesterol transport activity, begins to lose its balance and begins to decrease. This situation is characterized by increased cholesterol levels (Moffat and Stamford, 2006). Therefore, the next step will be measuring cholesterol levels to see whether or not the effect of increasing body weight on increased cholesterol. Table 2. The results of weight measurement of white rats (g) before and after treatment is administered with a
brewing water pasote (P); Tapak dara (T); Gedi (G); Pasote and Tapak dara (PT); Gedi and Tapak dara (TG); Gedi and Pasote (GP); and combination of Pasote, Tapak dara and Gedi (PTG); The drug triglycerides Gemfibrozil 300 mg in 100 mL of a solution of NaCl 0.9% (K +); and without treatment (K-).
Note: SD = Standard Deviation
Measurement of Cholesterol Levels after High Fat Treatment or Before Treatment (Initial) In this study, cholesterol checks were carried out before and after the treatment of tapak dara, gedi and pasote extracts. Cholesterol examination before treatment was carried out using the Lipid Pro tool which functions to measure cholesterol levels in the blood. The blood that was examined was taken from the tail of the white mouse. The results of checking cholesterol levels before treatment are presented in Figure 3.
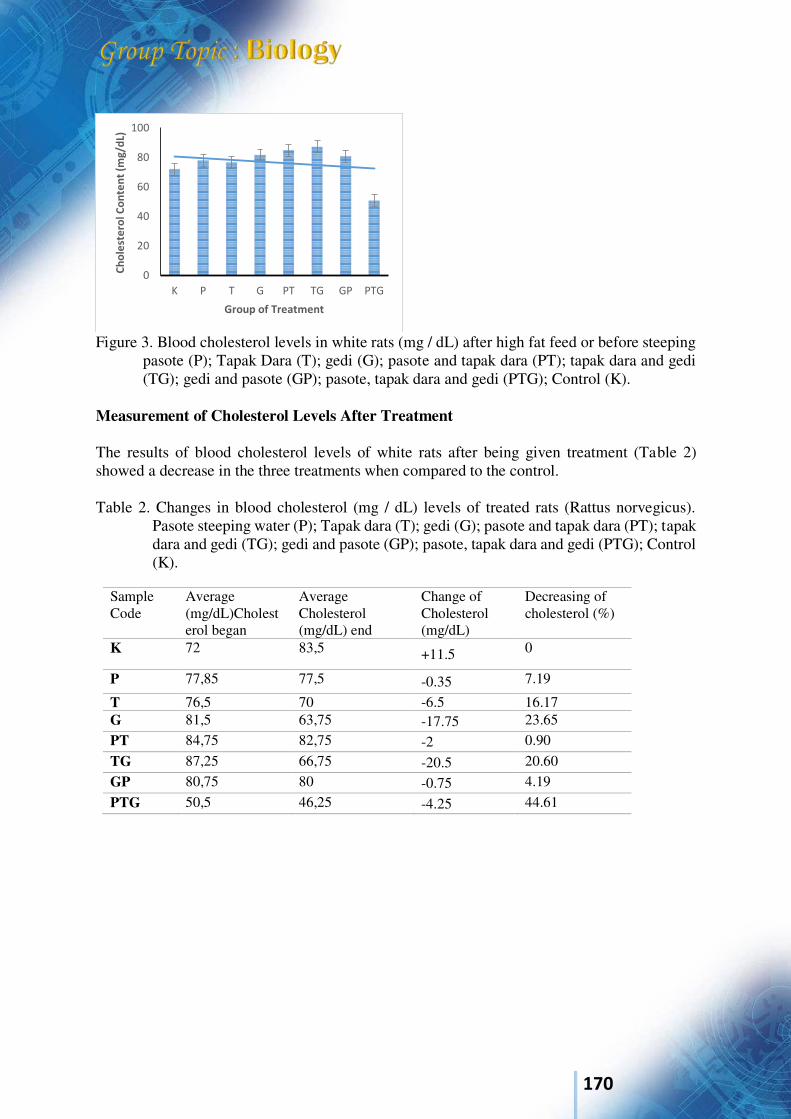
170
Figure 3. Blood cholesterol levels in white rats (mg / dL) after high fat feed or before steeping
pasote (P); Tapak Dara (T); gedi (G); pasote and tapak dara (PT); tapak dara and gedi (TG); gedi and pasote (GP); pasote, tapak dara and gedi (PTG); Control (K).
Measurement of Cholesterol Levels After Treatment The results of blood cholesterol levels of white rats after being given treatment (Table 2) showed a decrease in the three treatments when compared to the control.
Table 2. Changes in blood cholesterol (mg / dL) levels of treated rats (Rattus norvegicus).
Pasote steeping water (P); Tapak dara (T); gedi (G); pasote and tapak dara (PT); tapak dara and gedi (TG); gedi and pasote (GP); pasote, tapak dara and gedi (PTG); Control (K).
0
20
40
60
80
100
K P T G PT TG GP PTG
Ch
ole
ste
rol
Co
nte
nt
(mg
/dL)
Group of Treatment
Sample Code
Average (mg/dL)Cholesterol began
Average Cholesterol (mg/dL) end
Change of Cholesterol (mg/dL)
Decreasing of cholesterol (%)
K 72 83,5 +11.5 0
P 77,85 77,5 -0.35 7.19
T 76,5 70 -6.5 16.17 G 81,5 63,75 -17.75 23.65 PT 84,75 82,75 -2 0.90 TG 87,25 66,75 -20.5 20.60 GP 80,75 80 -0.75 4.19 PTG 50,5 46,25 -4.25 44.61
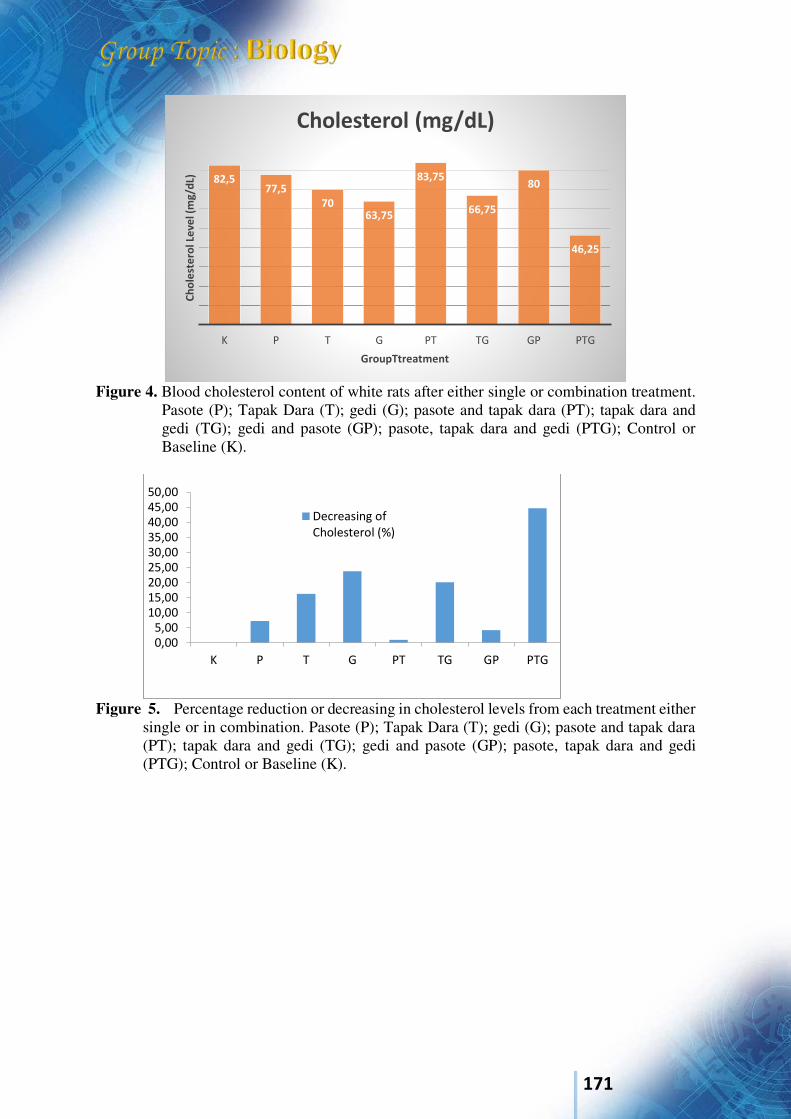
171
Figure 4. Blood cholesterol content of white rats after either single or combination treatment.
Pasote (P); Tapak Dara (T); gedi (G); pasote and tapak dara (PT); tapak dara and gedi (TG); gedi and pasote (GP); pasote, tapak dara and gedi (PTG); Control or Baseline (K).
Figure 5. Percentage reduction or decreasing in cholesterol levels from each treatment either
single or in combination. Pasote (P); Tapak Dara (T); gedi (G); pasote and tapak dara (PT); tapak dara and gedi (TG); gedi and pasote (GP); pasote, tapak dara and gedi (PTG); Control or Baseline (K).
82,577,5
7063,75
83,75
66,75
80
46,25
K P T G PT TG GP PTG
Ch
ole
ste
rol
Lev
el (
mg
/dL)
GroupTtreatment
Cholesterol (mg/dL)
0,00
5,00
10,00
15,00
20,00
25,00
30,00
35,00
40,00
45,00
50,00
K P T G PT TG GP PTG
Decreasing of
Cholesterol (%)
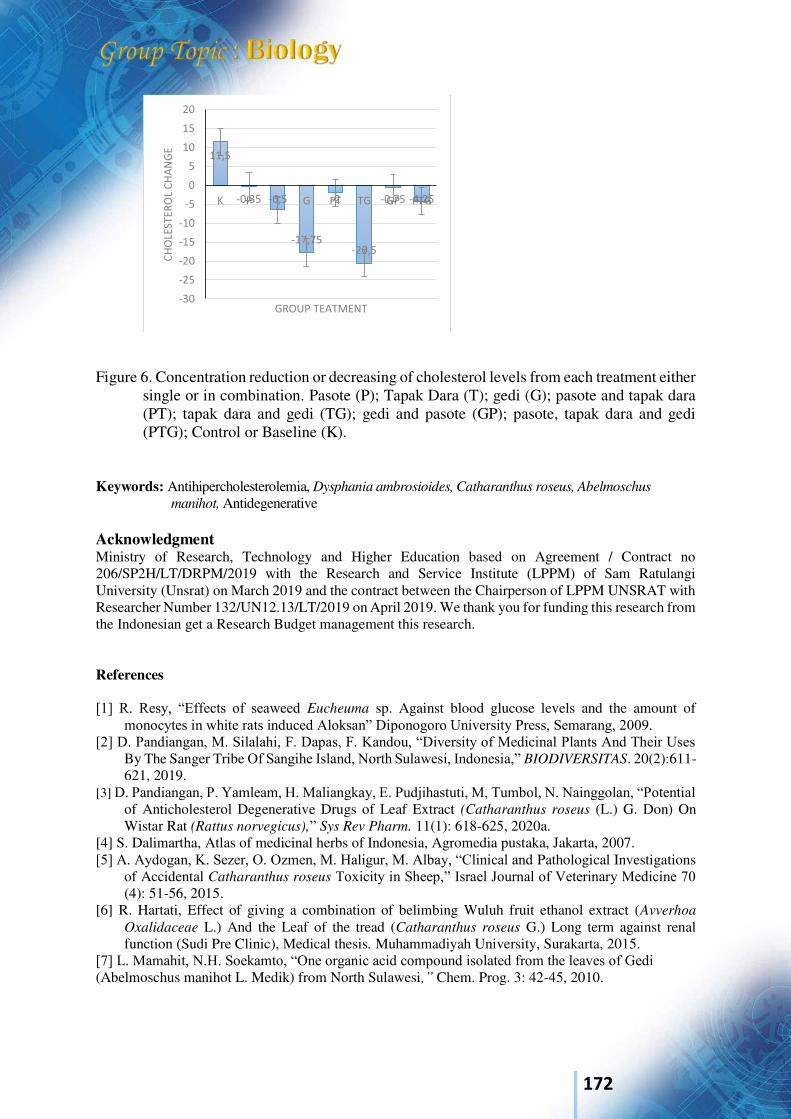
172
Figure 6. Concentration reduction or decreasing of cholesterol levels from each treatment either
single or in combination. Pasote (P); Tapak Dara (T); gedi (G); pasote and tapak dara (PT); tapak dara and gedi (TG); gedi and pasote (GP); pasote, tapak dara and gedi (PTG); Control or Baseline (K).
Keywords: Antihipercholesterolemia, Dysphania ambrosioides, Catharanthus roseus, Abelmoschus
manihot, Antidegenerative Acknowledgment Ministry of Research, Technology and Higher Education based on Agreement / Contract no 206/SP2H/LT/DRPM/2019 with the Research and Service Institute (LPPM) of Sam Ratulangi University (Unsrat) on March 2019 and the contract between the Chairperson of LPPM UNSRAT with Researcher Number 132/UN12.13/LT/2019 on April 2019. We thank you for funding this research from the Indonesian get a Research Budget management this research. References [1] R. Resy, “Effects of seaweed Eucheuma sp. Against blood glucose levels and the amount of
monocytes in white rats induced Aloksan” Diponogoro University Press, Semarang, 2009. [2] D. Pandiangan, M. Silalahi, F. Dapas, F. Kandou, “Diversity of Medicinal Plants And Their Uses
By The Sanger Tribe Of Sangihe Island, North Sulawesi, Indonesia,” BIODIVERSITAS. 20(2):611-621, 2019.
[3] D. Pandiangan, P. Yamleam, H. Maliangkay, E. Pudjihastuti, M, Tumbol, N. Nainggolan, “Potential of Anticholesterol Degenerative Drugs of Leaf Extract (Catharanthus roseus (L.) G. Don) On Wistar Rat (Rattus norvegicus),” Sys Rev Pharm. 11(1): 618-625, 2020a.
[4] S. Dalimartha, Atlas of medicinal herbs of Indonesia, Agromedia pustaka, Jakarta, 2007. [5] A. Aydogan, K. Sezer, O. Ozmen, M. Haligur, M. Albay, “Clinical and Pathological Investigations
of Accidental Catharanthus roseus Toxicity in Sheep,” Israel Journal of Veterinary Medicine 70 (4): 51-56, 2015.
[6] R. Hartati, Effect of giving a combination of belimbing Wuluh fruit ethanol extract (Avverhoa
Oxalidaceae L.) And the Leaf of the tread (Catharanthus roseus G.) Long term against renal function (Sudi Pre Clinic), Medical thesis. Muhammadiyah University, Surakarta, 2015.
[7] L. Mamahit, N.H. Soekamto, “One organic acid compound isolated from the leaves of Gedi (Abelmoschus manihot L. Medik) from North Sulawesi,” Chem. Prog. 3: 42-45, 2010.
11,5
-0,35 -6,5
-17,75
-2
-20,5
-0,75 -4,25
-30
-25
-20
-15
-10
-5
0
5
10
15
20
K P T G PT TG GP PTG
CH
OLE
ST
ER
OL
CH
AN
GE
GROUP TEATMENT
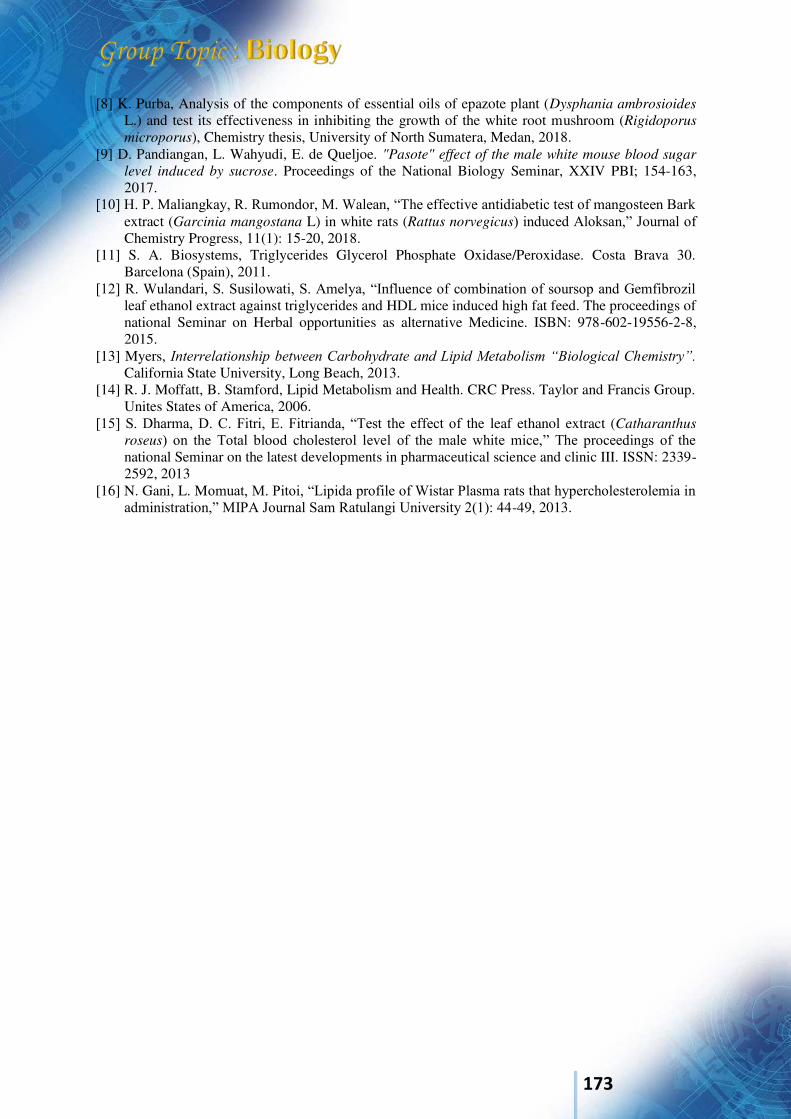
173
[8] K. Purba, Analysis of the components of essential oils of epazote plant (Dysphania ambrosioides
L.) and test its effectiveness in inhibiting the growth of the white root mushroom (Rigidoporus
microporus), Chemistry thesis, University of North Sumatera, Medan, 2018. [9] D. Pandiangan, L. Wahyudi, E. de Queljoe. "Pasote" effect of the male white mouse blood sugar
level induced by sucrose. Proceedings of the National Biology Seminar, XXIV PBI; 154-163, 2017.
[10] H. P. Maliangkay, R. Rumondor, M. Walean, “The effective antidiabetic test of mangosteen Bark extract (Garcinia mangostana L) in white rats (Rattus norvegicus) induced Aloksan,” Journal of Chemistry Progress, 11(1): 15-20, 2018.
[11] S. A. Biosystems, Triglycerides Glycerol Phosphate Oxidase/Peroxidase. Costa Brava 30. Barcelona (Spain), 2011.
[12] R. Wulandari, S. Susilowati, S. Amelya, “Influence of combination of soursop and Gemfibrozil leaf ethanol extract against triglycerides and HDL mice induced high fat feed. The proceedings of national Seminar on Herbal opportunities as alternative Medicine. ISBN: 978-602-19556-2-8, 2015.
[13] Myers, Interrelationship between Carbohydrate and Lipid Metabolism “Biological Chemistry”. California State University, Long Beach, 2013.
[14] R. J. Moffatt, B. Stamford, Lipid Metabolism and Health. CRC Press. Taylor and Francis Group. Unites States of America, 2006.
[15] S. Dharma, D. C. Fitri, E. Fitrianda, “Test the effect of the leaf ethanol extract (Catharanthus
roseus) on the Total blood cholesterol level of the male white mice,” The proceedings of the national Seminar on the latest developments in pharmaceutical science and clinic III. ISSN: 2339-2592, 2013
[16] N. Gani, L. Momuat, M. Pitoi, “Lipida profile of Wistar Plasma rats that hypercholesterolemia in administration,” MIPA Journal Sam Ratulangi University 2(1): 44-49, 2013.
174
International Conference on Natural Sciences, Mathematics, Applications, Research, and Technology
Manado, Indonesia, 22-23 October 2020
Diversity of Pests and Natural Enemies in Rice Fields in Kiniar Village, East Tondano District, North Sulawesi Parluhutan Siahaan1*, Saroyo1, Marnix L. D. Langoy1 dan Arie J. Saimima1
1) Biology Department, Sam Ratulangi University. INDONESIA *(E-mail: [email protected]) INTRODUCTION Kiniar Village is located in Tondano Timur district, Minahasa Regency which is one of the rice production sites. One of the problems in rice cultivation in this area is pest attack. Insect pest attack is a serious problem that has caused large yield losses, resulting in large losses for farmers as well. Pest attacks can be minimized if natural enemies are in abundance thus studying the abundance and diversity of pests in comparison to the abundance of their natural enemies is important. Information regarding the diversity and abundance of insect pests as well as the diversity and abundance of natural enemies in the village of Kiniar can be used as an aspect of consideration in determining the best way to control pests, especially control using local natural enemies. The research was conducted from April 2020 to June 2020 by using purposive random sampling method. Three rice fields were sampled with the same age of rice plants. Each rice field area is made of 10 plots measuring 1x1 meter as a sampling area. Any insects and spiders found are taken using a sweep net and then taken to the laboratory for identification. The collected insects and spiders were analyzed to determine the diversity index, species abundance and dominance index RESULTS AND DISCUSSION The results showed that there were 40 species of insects and spiders from 29 families, and eight orders which were divided into two classes in local rice cultivation with a composition of 20 species of pests and 20 species of natural enemies. For insects, Hemiptera was the order that was most commonly found followed by the order Lepidoptera while the order Odonata and Hymenoptera were the ones that were rarely found. For spiders, there were four species belonging to the Order Araneae. In the order Hemiptera, Leptocorisa acuta (Alydidae) was the species that had the highest number of individuals, namely 155 individuals or an average of 5.17 individuals / m 2 with an abundance of 20.21%. In the order Lepidoptera, Nyimphula depunctalis (Crambidae) was the species with the highest number of individuals, namely 104 individuals or an average of 3.47 individuals / m2 with an abundance of 13.56%. In the order Odonata, Agriocnemis femina oryzae (Agrionidae) had 15 individuals or an average of 0.5 individuals / m2 with an abundance of 1.96%. In the order Hymenoptera, Dolichoderus Sp. (Formicidae) had 11 individuals or an average of 0.37 individuals / m2 with an abundance of 1.43%. So that the Leptocorisa acuta species was the species most commonly found in rice fields in Kiniar Village followed by Nyimphula depunctalis and Tetraghnata Sp. The results of data analysis on natural enemies showed that Ordo Araneae, Tetraghnata Sp. (Tetragnathidae) had the largest number of individuals (74 individuals) with an abundance index
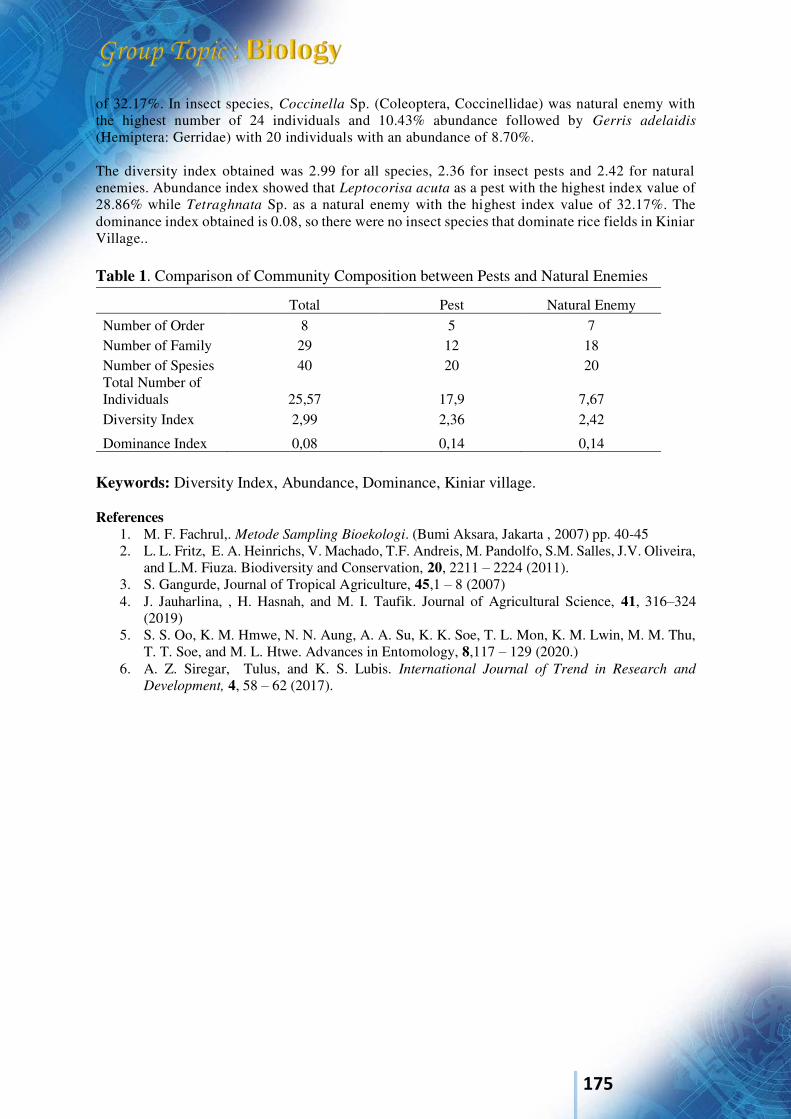
175
of 32.17%. In insect species, Coccinella Sp. (Coleoptera, Coccinellidae) was natural enemy with the highest number of 24 individuals and 10.43% abundance followed by Gerris adelaidis (Hemiptera: Gerridae) with 20 individuals with an abundance of 8.70%. The diversity index obtained was 2.99 for all species, 2.36 for insect pests and 2.42 for natural enemies. Abundance index showed that Leptocorisa acuta as a pest with the highest index value of 28.86% while Tetraghnata Sp. as a natural enemy with the highest index value of 32.17%. The dominance index obtained is 0.08, so there were no insect species that dominate rice fields in Kiniar Village..
Keywords: Diversity Index, Abundance, Dominance, Kiniar village. References
1. M. F. Fachrul,. Metode Sampling Bioekologi. (Bumi Aksara, Jakarta , 2007) pp. 40-45 2. L. L. Fritz, E. A. Heinrichs, V. Machado, T.F. Andreis, M. Pandolfo, S.M. Salles, J.V. Oliveira,
and L.M. Fiuza. Biodiversity and Conservation, 20, 2211 – 2224 (2011). 3. S. Gangurde, Journal of Tropical Agriculture, 45,1 – 8 (2007) 4. J. Jauharlina, , H. Hasnah, and M. I. Taufik. Journal of Agricultural Science, 41, 316–324
(2019) 5. S. S. Oo, K. M. Hmwe, N. N. Aung, A. A. Su, K. K. Soe, T. L. Mon, K. M. Lwin, M. M. Thu,
T. T. Soe, and M. L. Htwe. Advances in Entomology, 8,117 – 129 (2020.) 6. A. Z. Siregar, Tulus, and K. S. Lubis. International Journal of Trend in Research and
Development, 4, 58 – 62 (2017).
Table 1. Comparison of Community Composition between Pests and Natural Enemies
Total Pest Natural Enemy Number of Order 8 5 7 Number of Family 29 12 18 Number of Spesies 40 20 20 Total Number of Individuals 25,57 17,9 7,67 Diversity Index 2,99 2,36 2,42
Dominance Index 0,08 0,14 0,14
176
International Conference on Natural Sciences, Mathematics, Applications, Research, and Technology
Manado, Indonesia, 22-23 October 2020
Histochemistry of Vegetative and Reproductive Organ Gyrinops
versteegii var. brevistipis (Thymelaeaceae) in Lombok Island Tri Mulyaningsih*1, Ernin Hidayati1, Kurniasih Sukenti1, Aida Muspiah1, Rina Kurnianingsih1, Via Febriyanti1
1Biology Program Study, Mathematics and Natural Sciences, Mataram University, Mataram NTB. INDONESIA. (E-mail: *[email protected]) (E-mail: *[email protected]) (E-mail: *[email protected] ) (E-mail: * [email protected]) (E-mail: *[email protected]) (E-mail: * [email protected]) INTRODUCTION Ketimunan tree (Gyrinops versteegii (Gilg.) Domke,) one of aloes-producing tree that grows on the island of Lombok has 5 infraspecifics, one of which is G. versteegii var. brevistipis. This variety of aloeswood has the advantage of agarwood which has the best quality, black agarwood, soft fragrance and xylem tissues constituent cells are the densest among other varieties. In addition, the young stems are reddish in color and red spots bark, ovate fruit, short stipes, same as the length of calyx tube [1,2]. According to ethnobotany studies in each country, the agarwood has a slightly different variation of uses. Like gaharu in China it is used as a medicine for indigestion, aphrodisiac, anodyne (pain reliever), and is used to treat asthma, thyroid cancer, lung tumors, colic, diarrhea, kidney disease, and is used as a tonic and in India it is used as a medicine for the intestine[1]. In Japan it is used for a mixture of various drugs (in Kampo medicine, as a sedative, analgesic and digestion), as a traditional medicine such as a sedative, protecting the operation of vital organs such as the heart. , lungs and liver, stomach health, helps sore throats, and body detoxification, kodo and as the main ingredient for making incense [3,1]. The histochemical studies of vegetative organs (lamina, midrib, petioles and stem) and reproductive organs (seed, fruit peels, stipes and calyx) of Gyrinops versteegii var. brevistipis are medicinally and aromatic resin producer important plants of Lombok Island. For histochemical studies using the free hand sections method, for vegetative organs and reproductive were taken and treated with the respective reagent in localize components, e.g. alkaloid, flavonoid, fat, lignin, protein total, sesquiterpene, tannin, and terpenoid in those tissues [4]. RESULTS AND DISCUSSION The results show that in the vegetative and reproductive organs were found ergastic compound such as alkaloid, starch, Ca oxalate crystal, flavonoid, lignin, protein, sesquiterpene, tannin and terpenoid, except in calyx, one of those ergastic substances: starch were not found in these tissues; in lamina and seeds were not contained sesquiterpene lactone and crystal oxalate were not found in the seed tissues. The three organs that indicate do not contain saponins namely lamina, calyx and seed.
177
Starch deposition occurs extensively in the plant body, but the most common sites of accumulation are seeds, parenchyma of secondary vessel tissue in stems and roots, tubers, rhizomes and maize. Starch and protein are the main ergastic substances of protoplasts. Tannins are a heterogeneous group of phenol derivatives, usually associated with glucosides. Tannins are very abundant in the leaves (xylem) of many plants. (Saponins are a rare occurrence). Fats are widely distributed in the plant body and they may occur in small amounts in any plant cell. Fat is a common reserve material in seeds, spores and embryos in meristematic cells. Alkaloids are degradation products protein [4]. In the phytochemical test of G. versteegii leaves, it shows that the leaves contain flavonoids, phenols, terpenoids, and free radicals [5,6], because of its content, gaharu leaves have the potential as an herbal drink and used as medicine. According to Yuliani [7] G. versteegii fruit peels contain compounds of palmitic acid, oleic acid, oleic acid, stearic acid, bis- (2-ethylhexyl) phthalate, 2,3-dihydro-3,5-dihidroxy-6-methyl-4H-piran- 4-on, metal octadeka-9-enoate, squalene derivatives and 2-monopalmitin derivatives. Keywords: Gyrinops versteegii, histochemistry, Lombok, secondary metabolites. Acknowledgment I would like to appreciate with colleagues who faithfully support laboratory research. We want to thank to Rector, Chairman and staff of the Institute for Research and Community Services, Mataram University, Lombok, NTB and staff on the funds provided to finance the research. References
1. Mulyaningsih, T., D. Marsono, Sumardi and I. Yamada. 2014 Selection of Superior Breeding Infraspecies Gaharu of Gyrinops versteegii (Gilg) Domke, Journal of Agricultural Science and
Technology B, 4: 485-92. 2. Mulyaningsih, T., D. Marsono, Sumardi and I. Yamada. 2017b. Keragaman Infraspesifik Gaharu
(Gyrinops versteegii (Gilg.) Domke) Di Pulau Lombok Bagian Barat. Journal Penelitian Hutan dan Konservasi Alam, (2017), 14 (1): 57-66
3. Kristanti, A.N., M. Tanjung, O. P. Rahayu, E. Herdiana. 2017. Phenolic compounds from Aquilaria microcarpa stem bark. Journal of Chemical Technology and Metallurgy, 52(6): 1111-
1115. 4. Momin, R.K. and V.B. Kadam 2011. Histochemical investigation of different organce of genus
sesbania of marathwada region in Maharashtra. Journal of Phytology, 3(12): 31-34. 5. Nuringtyas, T.R., R. Isromarina, Y. Septia, L. Hidayati, N. Wijayanti, and S. Moeljopawiro.
2018. The antioxidant and cytotoxic activities of the chloroform extract of agarwood (Gyrinops
versteegii (Gilg.) Domke) leaves on HeLa cell lines. AIP Conference Proceedings 2002, 020067 (2018), doi: 10.1063/1.5050163.
6. Parwata, A., Laksmiwati, Sudiarta, M. N. Dina1 and S. Yasa. 2018. The Contents of Phenol and Flavonoid Compounds in Water Extract of Gyrinops versteegii Leaves have Potentially as Natural Antioxidants and Hypoglicemic in Hyperglycemic Wistar Rats. Biomedical &
Pharmacology Journal, 11(3): 1543-1552. 7. Yuliani, 2019. Fitokimia kulit buah Gyrinops versteegii var. brevistipis. [Skripsi] Program
Studi Biologi FMIPA, Universitas Mataram, Mataram.

178
International Conference on Natural Sciences, Mathematics, Applications, Research, and Technology
Manado, Indonesia, 22-23 October 2020
Concentration analysis of Pb (II) Enceng Gondok (Eichhornia crassipes), Kangkung Air (Ipomoea aquatica), and Kayu Apu (Pistisia stratiotes) in Lake Tempe, South Sulawesi Before Phytoremediation
M Nasir1*, D Pandiangan2, S M Mambu3, R Irfandi4, M Nur5
1,4,5Department of Biology Education, Faculty of Teacher Training and Education, Universitas Puangrimaggalatung, Sengkang, South Sulawesi Indonesia 2,3Department of Biology, FMIPA Universitas Sam Ratulangi, Manado North Sulawesi Indonesia Email. [email protected] Corresponding author: [email protected] Abstract. Tempe lake waters are very vulnerable to the risk of environmental pollution due to anthropogenic activities, including marine transportation activities, industry, burning waste, and waste disposal from the community. One of the pollution in the waters is the entry of heavy metal ions such as Pb. Increased levels of heavy metals in the waters will be followed by an increase in levels of these substances in aquatic organisms such as shellfish, seaweed and other marine biota. The use of these organisms as food ingredients will endanger human health. The purpose of this study was to determine the initial concentration of Pb in Enceng Gondok, Kangkung Air, and Kayu Apu in the tempe lake waters. The method used was the Pb concentration analysis using AAS. The results showed that the Pb concentration of water Enceng Gondok was 20.4922 mg / kg and the Pb concentration of Kangkung air was 28.6234 mg / kg, and the Pb concentration of water Kayu Apu was 14.3154 mg / kg. The concentration of Pb in Enceng Gondok, Kangkung Air, and Kayu Apu in the waters of the tempe lake has exceeded a predetermined threshold based on the Decree of the Director General of POM No: 03725 / B / SK / VII / 89 concerning the Maximum Limit of Heavy Metal Pb Contamination in plants, namely 0.2 mg / kg. Phytoremediation step with these plants is very possible to be developed.
. 1. Introduction
Lake Tempe is one of the lakes in South Sulawesi which is a type of flood exposure lake with coordinates between 3º39' – 4º16 'latitude and 119º 53' – 120º 27' east longitude. Lake Tempe, which has an area of 14,406 hectares, is located in three districts, namely Wajo (8,510 ha), Soppeng (3,000 ha), Sidrap (2,896 ha). In the rainy season, the area of Lake Tempe is around 45,000 hectares, and the dry season is around 1,000 hectares (Unru, 2010). The geographical location of Lake Tempe affects the biota that lives in it. Apart from fish, planton and birds living in Lake Tempe, aquatic plants or aquatic plants are also commonly found in water bodies. In the last 10 years or so, a problem has emerged caused by the explosion of aquatic plants. The explosion of aquatic plants is an indicator that there has been an abundance of nutrients or eutrophication in the waters. Acute plants according to Odum and Barrett (2005) are plants that function as energy producers in an ecosystem.
Based on data from the Department of Marine Affairs and Fisheries of Wajo Regency (2005), there are many types of aquatic plants in the waters of the lake, some of which are intentionally kept by fishermen as bunka toddo, namely water plants as protection/trapping of fish. The dominant types are Enceng Gondok (Eichhornia crassipes), kiambang / Kayu Apu (Pistisia stratiotes) and kangkong Air (Ipomoea aquatica) (Nugraha, et al, 2019). The most common aquatic plant species are water hyacinth (Eichhornia crassipes) and the dominant aquatic plant species is emergent (Nasir & Nur, 2018).
Lake water and surrounding rivers are used by the community as a source of clean water, but people do not know the level of water pollution and also the need for clean water for MCK (Bathing, Washing, Toilet) only relies on river and lake water. The Bappedalda (2000) report shows that there are at least 3 sources of polluting lake water, namely 1) Household activities that produce organic waste, processed food waste (fish, meat), chemical waste (from soap, detergent, shampoo, and other cleaning
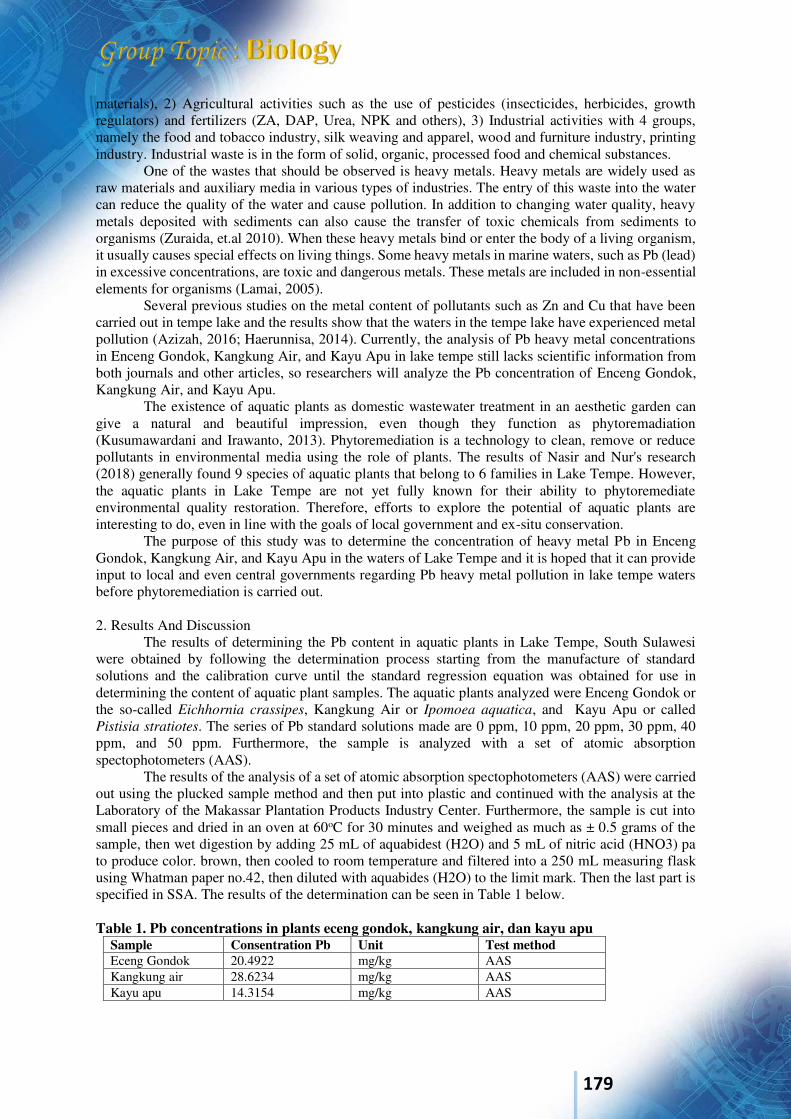
179
materials), 2) Agricultural activities such as the use of pesticides (insecticides, herbicides, growth regulators) and fertilizers (ZA, DAP, Urea, NPK and others), 3) Industrial activities with 4 groups, namely the food and tobacco industry, silk weaving and apparel, wood and furniture industry, printing industry. Industrial waste is in the form of solid, organic, processed food and chemical substances.
One of the wastes that should be observed is heavy metals. Heavy metals are widely used as raw materials and auxiliary media in various types of industries. The entry of this waste into the water can reduce the quality of the water and cause pollution. In addition to changing water quality, heavy metals deposited with sediments can also cause the transfer of toxic chemicals from sediments to organisms (Zuraida, et.al 2010). When these heavy metals bind or enter the body of a living organism, it usually causes special effects on living things. Some heavy metals in marine waters, such as Pb (lead) in excessive concentrations, are toxic and dangerous metals. These metals are included in non-essential elements for organisms (Lamai, 2005).
Several previous studies on the metal content of pollutants such as Zn and Cu that have been carried out in tempe lake and the results show that the waters in the tempe lake have experienced metal pollution (Azizah, 2016; Haerunnisa, 2014). Currently, the analysis of Pb heavy metal concentrations in Enceng Gondok, Kangkung Air, and Kayu Apu in lake tempe still lacks scientific information from both journals and other articles, so researchers will analyze the Pb concentration of Enceng Gondok, Kangkung Air, and Kayu Apu.
The existence of aquatic plants as domestic wastewater treatment in an aesthetic garden can give a natural and beautiful impression, even though they function as phytoremadiation (Kusumawardani and Irawanto, 2013). Phytoremediation is a technology to clean, remove or reduce pollutants in environmental media using the role of plants. The results of Nasir and Nur's research (2018) generally found 9 species of aquatic plants that belong to 6 families in Lake Tempe. However, the aquatic plants in Lake Tempe are not yet fully known for their ability to phytoremediate environmental quality restoration. Therefore, efforts to explore the potential of aquatic plants are interesting to do, even in line with the goals of local government and ex-situ conservation.
The purpose of this study was to determine the concentration of heavy metal Pb in Enceng Gondok, Kangkung Air, and Kayu Apu in the waters of Lake Tempe and it is hoped that it can provide input to local and even central governments regarding Pb heavy metal pollution in lake tempe waters before phytoremediation is carried out.
2. Results And Discussion
The results of determining the Pb content in aquatic plants in Lake Tempe, South Sulawesi were obtained by following the determination process starting from the manufacture of standard solutions and the calibration curve until the standard regression equation was obtained for use in determining the content of aquatic plant samples. The aquatic plants analyzed were Enceng Gondok or the so-called Eichhornia crassipes, Kangkung Air or Ipomoea aquatica, and Kayu Apu or called Pistisia stratiotes. The series of Pb standard solutions made are 0 ppm, 10 ppm, 20 ppm, 30 ppm, 40 ppm, and 50 ppm. Furthermore, the sample is analyzed with a set of atomic absorption spectophotometers (AAS).
The results of the analysis of a set of atomic absorption spectophotometers (AAS) were carried out using the plucked sample method and then put into plastic and continued with the analysis at the Laboratory of the Makassar Plantation Products Industry Center. Furthermore, the sample is cut into small pieces and dried in an oven at 60oC for 30 minutes and weighed as much as ± 0.5 grams of the sample, then wet digestion by adding 25 mL of aquabidest (H2O) and 5 mL of nitric acid (HNO3) pa to produce color. brown, then cooled to room temperature and filtered into a 250 mL measuring flask using Whatman paper no.42, then diluted with aquabides (H2O) to the limit mark. Then the last part is specified in SSA. The results of the determination can be seen in Table 1 below. Table 1. Pb concentrations in plants eceng gondok, kangkung air, dan kayu apu
Sample Consentration Pb Unit Test method Eceng Gondok 20.4922 mg/kg AAS Kangkung air 28.6234 mg/kg AAS Kayu apu 14.3154 mg/kg AAS
180
The results of determining the Pb content in aquatic plants in Table 1 show that the aquatic plants which are often used by the surrounding community as food have exceeded the threshold. The results showed that the Pb concentration of water Enceng Gondok was 20.4922 mg / kg and the Pb concentration of Kangkung air was 28.6234 mg / kg, and the Pb concentration of water Kangkung air was 14.3154 mg / kg. The concentration of Pb in Enceng Gondok, Kangkung Air, and Kayu Apu in the waters of the Tempe Lake in South Sulawesi has exceeded the threshold determined based on the decision of the Director General of POM No: 03725 / B / SK / VII / 89. The maximum limit of Pb contamination in plants in the decision of the Director General of POM on food is 0.2 mg / kg of plants. The Pb content found in the waters of Lake Tempe is already dangerous for the surrounding community if it is used as a vegetable or food plant. Keywords: Water Hyacinth “Enceng Gondok”, Water Spinach “Kangkung Air”, Apu Wood “Kayu
Apu”, Pb (II), Heavy Metal Acknowledgments Ministry of Research, Technology and Higher Education based on Agreement/Contract no 206/SP2H/LT/DRPM/2019 with the Research and Service Institute (LPPM) of Sam Ratulangi University (Unsrat) on March 2019 and the contract between the Chairperson of LPPM UNSRAT with Researcher Number 132/UN12.13/LT/2019 on April 2019, and contract between the Head Of The IX Region Higher Education Service (L2DIKTI) and the rector of the Puangrimaggalatung University with number 2559 / LL9 / PG / 2020. We thank you for funding this research from the Indonesian get a Research Budget management this research. References [1] Azizah, Nur Hasyim. 2016. Potensi Fitoremediasi Eceng Gondok (Eichornia Crassipes)
Dalam Mereduksi Logam Berat Seng (Zn) Dari Perairan Danau Tempe Kabupaten Wajo, Skripsi Jurusan Sains Biologi Universitas Islam Alauddin Makassar.
[2] Bappedal Kabupaten Wajo. 2000. Penataan Aktivitas Masyarakat Dalam Rangka Pengendalian Kerusakan Dan Pemulihan Lingkungan Perairan Danau Tempe, Sulawesi Selatan. Draf. Laporan Akhir Bappedal Regional III. Kabupaten Wajo
[3] Dinas Kelautan dan Perikanan Kabupaten Wajo. 2005. Laporan tahunan Kelautan dan Perikanan Kabupaten Wajo. Kabupaten Wajo
[4] Haerunnisa. 2014. Penggunaan Eceng Gondok (Eichornia Crassipes) Dalam Penurunan Kadar Logam Tembaga (Cu) Pada Perairan Danau Tempe Kabupaten Wajo, Jurnal Galung
Tropika. 3 (2) Mei. ISSN 2302 – 4178. [5] Lamai, C., Maleeya. K., Prayad. P., E. Suchart.U. dan Varasaya. S. 2005. Toxicity and
Accumulation of Lead and Cadmium In The Filamenous Green Algae Cladopora fracta (O. F. Muller ex Vahl) Kutzing. A Laboratory Study. Scienceasia. Vol 31, 121-127
[6] Nasir. M & Nur. M. 2018. Composition of Aquatic Plants in Tempe Lake Wajo Regency and Utilization as Learning Media Plant Ecology. Prosiding Seminar Nasional Biologi
dan Pembelajarannya. hal. 509-514 [7] Nugraha. M. F. I., Julzarika. Atriyon, Radjamuddin. Alias , Reflinur, Yunit Rossa, Wening.
Enggarini, dan Novita. Hessy, Study of aquatic plants and ecological- physics Tempe Lake, Sulawesi Selatan. Torani Journal of Fisheries and Marine Science. Volume 2 (2) June 2019: 105-115.
[8] Odum, E. P., dan G. W. Barrett. 2005. Fundamentals of Ecology. 5th Edition. Thomson Learning, United States.
[9] Unru, A.B. 2010. Pengelolaan Sumber Daya Ikan di Danau Tempe. Kabupaten Wajo:Dinas Kelautan dan Perikanan Kabupaten Wajo.
181
International Conference on Natural Sciences, Mathematics, Applications, Research, and Technology
Manado, Indonesia, 22-23 October 2020
Soil Nutrient Availability and Soil Microbes population as Affected by The Application of Organic Amendments in a Degraded Soil of Minahasa, North Sulawesi Susan Marlein Mambu*1, Agustina MonalisaTangapo1, Beivy Kolondam1, Putri Kaharu1
1Department of Biology, Faculty of Mathematics and Natural Sciences, Sam Ratulangi University, Indonesia (E-mail: [email protected]; [email protected]; [email protected]; [email protected]) INTRODUCTION Long-term chemical fertilizer input causes soil organic matter losses, structural compaction, and changes in soil water and nutrient availability, which have been subdued in the most of dry farmland around the world. Many studies have observed that organic amendments (OA) help to improve soil physical, chemical and biological properties, thus improve nutrient availability to crops, even in tropical croplands (Sangakkara et al., 2004, Bokhtiar and Sakurai, 2005, Mabuza et al., 2016; Mambu et al., 2018). However, Physico-chemical properties and biological composition of rhizosphere are also important, for affecting the plant growth. Root exudates directly influence the nutrient availability or have indirect effects through interaction with rhizosphere microorganisms, to promote the circulation of plant nutrients, and reduce the need of chemical fertilisers as much as possible. Soil productivity can be enhanced by incorporating organic matter. One-way to improve soil organic matter is the application of green manure, that improves soil structure, helps control runoff and erosion, and also recommended for increasing number of canes that planted in soils with low organic matter and N content (Prammaneeet al.,1995; Ambrosano et al., 2013). Biological methods and the use of organic matter are among the most important ones. Soil microbes can significantly contribute to the availability of soil nutrients for plant use, which is of economical and environmental importance. Plants can also affect the availability of soil nutrients, especially by their root activities. Production of different compounds such as organic acids by plant roots influences the solubility and hence availability of nutrients. Such products can affect rhizosphere properties and hence soil nutrient availability by altering rhizosphere pH and the activity of microbes including PGPR (Van der Heijden 2010; Johnson et al. 2010). RESULTS AND DISCUSSION This experiment was conducted to evaluate the beneficial effects of different levels of composted maize on soil microbial and soil nutrient properties. The ameliorant organic fertilizer was applied 2 weeks before planting, while urea was applied at the time of planting, which applied to each plot with a predetermined dose. Soil sampling was carried out in a composite way, which was combining soil samples obtained from several different points with the same depth (Ekamaida, 2017). Soil samples were taken at the soil surface (0-15 cm) 4 times. Results revealed that soil nutrients; nitrogen (Figure 1), phosphorus and carbon availability in soil were increased by the application of organic amendments irrespective of the source. Likewise organic amendments substantially improved the plant height, number of leafs and leaf diameter. This improved growth, was mainly due to increased soil nutrient availability and uptake by plants.
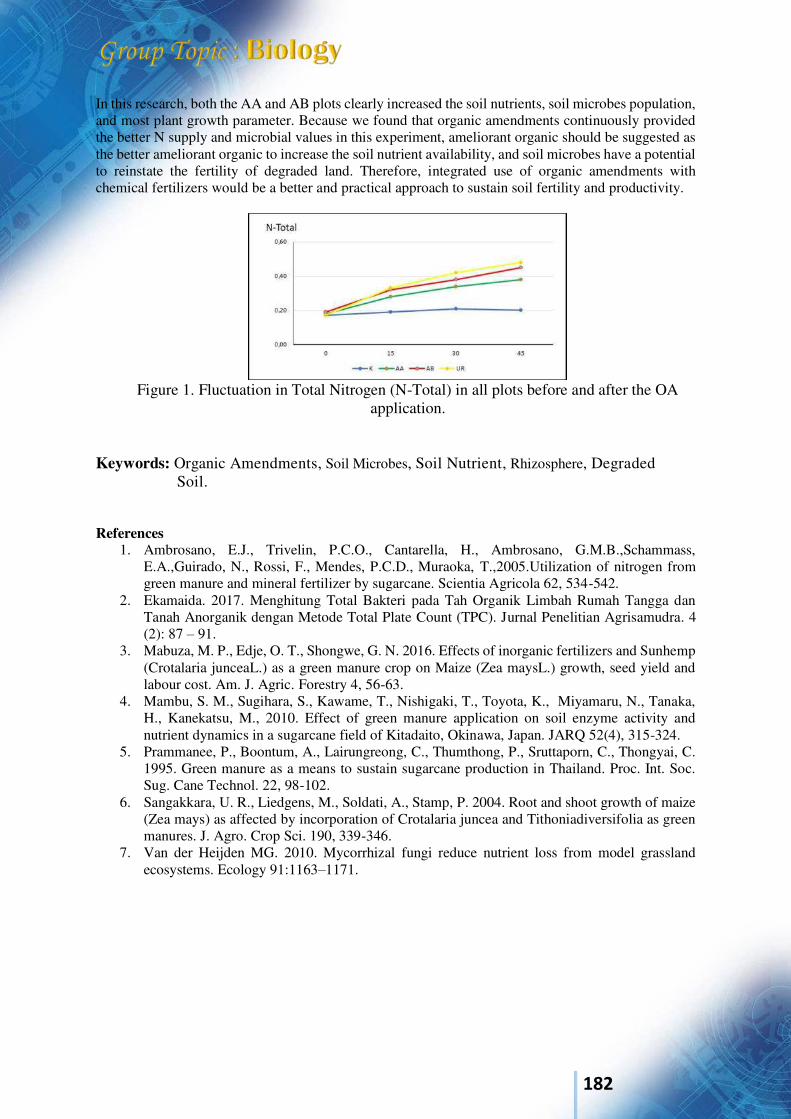
182
In this research, both the AA and AB plots clearly increased the soil nutrients, soil microbes population, and most plant growth parameter. Because we found that organic amendments continuously provided the better N supply and microbial values in this experiment, ameliorant organic should be suggested as the better ameliorant organic to increase the soil nutrient availability, and soil microbes have a potential to reinstate the fertility of degraded land. Therefore, integrated use of organic amendments with chemical fertilizers would be a better and practical approach to sustain soil fertility and productivity.
Figure 1. Fluctuation in Total Nitrogen (N-Total) in all plots before and after the OA
application. Keywords: Organic Amendments, Soil Microbes, Soil Nutrient, Rhizosphere, Degraded
Soil. References
1. Ambrosano, E.J., Trivelin, P.C.O., Cantarella, H., Ambrosano, G.M.B.,Schammass, E.A.,Guirado, N., Rossi, F., Mendes, P.C.D., Muraoka, T.,2005.Utilization of nitrogen from green manure and mineral fertilizer by sugarcane. Scientia Agricola 62, 534-542.
2. Ekamaida. 2017. Menghitung Total Bakteri pada Tah Organik Limbah Rumah Tangga dan Tanah Anorganik dengan Metode Total Plate Count (TPC). Jurnal Penelitian Agrisamudra. 4 (2): 87 – 91.
3. Mabuza, M. P., Edje, O. T., Shongwe, G. N. 2016. Effects of inorganic fertilizers and Sunhemp (Crotalaria junceaL.) as a green manure crop on Maize (Zea maysL.) growth, seed yield and labour cost. Am. J. Agric. Forestry 4, 56-63.
4. Mambu, S. M., Sugihara, S., Kawame, T., Nishigaki, T., Toyota, K., Miyamaru, N., Tanaka, H., Kanekatsu, M., 2010. Effect of green manure application on soil enzyme activity and nutrient dynamics in a sugarcane field of Kitadaito, Okinawa, Japan. JARQ 52(4), 315-324.
5. Prammanee, P., Boontum, A., Lairungreong, C., Thumthong, P., Sruttaporn, C., Thongyai, C. 1995. Green manure as a means to sustain sugarcane production in Thailand. Proc. Int. Soc. Sug. Cane Technol. 22, 98-102.
6. Sangakkara, U. R., Liedgens, M., Soldati, A., Stamp, P. 2004. Root and shoot growth of maize (Zea mays) as affected by incorporation of Crotalaria juncea and Tithoniadiversifolia as green manures. J. Agro. Crop Sci. 190, 339-346.
7. Van der Heijden MG. 2010. Mycorrhizal fungi reduce nutrient loss from model grassland ecosystems. Ecology 91:1163–1171.
183
International Conference on Natural Sciences, Mathematics, Applications, Research, and Technology
Manado, Indonesia, 22-23 October 2020
Protected and Endangered Butterfly Conservation in Wiau Duasudara Bitung Protected Forest Area, North Sulawesi
Hanny H. Pontororing*1, Handri J. Lengkong2, Eva L. Baideng3 1, 2,3Authors’ Biologi FMIPA Universitas Sam Ratulangi, Manado, Indonesia [email protected], [email protected], [email protected]
INTRODUCTION Sulawesi has four species of Troides which are protected and endangered butterflies namely Troides haliphron, Troides hypolitus, Troides helena and Troides dohertyi one which is endemic to Sangihe and Talaud whose existence is of great concern due to habitat destruction. Butterfly (Lepidoptera) is one of the insects that live in protected forest areas in North Sulawesi. These insects have a very important role as pollinators that encourage pollination in plants. Butterflies can also be used as bioindicators of changes in environmental quality. Like other animals, butterflies also face the threat of scarcity and extinction, mainly due to forest conversion.The purpose of this study was to establish a protected and endangered species butterfly conservation area in the protected forest area of Wiau Duasudara Bitung, North Sulawesi The existence of the Troides species in North Sulawesi is very concerning, so it is necessary to conduct a research on the conservation of Troides butterfly species in North Sulawesi as a basis for butterfly management / protection so that it can be used as a butterfly conservation management area in North Sulawesi. The research materials were butterfly species Troides and aristolochia plants and nectarproducing plants. The research method is as follows (1) The discovery of Triodes species in the field. The research method used in finding Triodes butterflies in the field is by using literature and direct observation in the field (2) discovery of host plants in the field by following the behavior of butterflies (3) location of discovery of host plants (4) multiplication of host plants (ex-situ ), (5) Establishment of a Conservation Area in the Wiau Duasudara Bitung Protected Forest Area (in-situ) RESULTS AND DISCUSSION Based on the results of research, the butterfly found in the Wiau Protected Forest Area is a butterfly species Troids helena which is one of the four types of helena troides found in Sulawesi. The host plant for the butterfly species Troides helena is Aristolocia tagala. The discovery of aristolocia plants in the field by following the flying behavior of the butterfly species Troides helena and the location where the host plant was found was used as a conservation location, which is located at position N 01031'15.63 "and 125008'15.10" and is at 410m above sea level. The host plants found exsitually propagated and then conserved ex-situ with the nectar-producing plants, then the area found and reproduced is designated as a butterfly conservation area for the Troides helena species Keywords: Protected, Endangered, Conservation, Butterfly, in-situ, Duasudara. References
1. Departemen Kehutanan. 1990. Undang-undang Republik Indonesia Nomor 5 Tahun 1990 tentang Konservasi Sumberdaya Alam Hayati dan Ekosistemnya. Jakarta.
2. M, J. Samways, Insect DiversityConservation, Cambridge University Press, 2010 3. O.T. Lewis, Effect of Experimental Selective Logging on Tropical Butterflies, Conservation
biology 15:389-400, 2001.

184
4. Peggie, Dj. 2011.Precius and Protected Indonesian Butterflies (Kupu-kupu Indonesia yang Bernilai dan Dilindungi.PT Binamitra Megawarna, Jakarta, Indonesia.
5. Tsukada, E. 1990. Butterflies of South East Asia Islands. Journal of Lepidopterist Society (Online) 44(2):107-110. Diakses 21 Februari 2016.
6. Vane-Wright, R.I &R. D. Jong. 2003. The Butterflies of Sulawesi: annotated Checklist for a Critical Island Fauna. Zool.Vern. Leiden.fig 1-14, pls 1-16-ISSN 0024-1652/ IsBN 90-73239-877
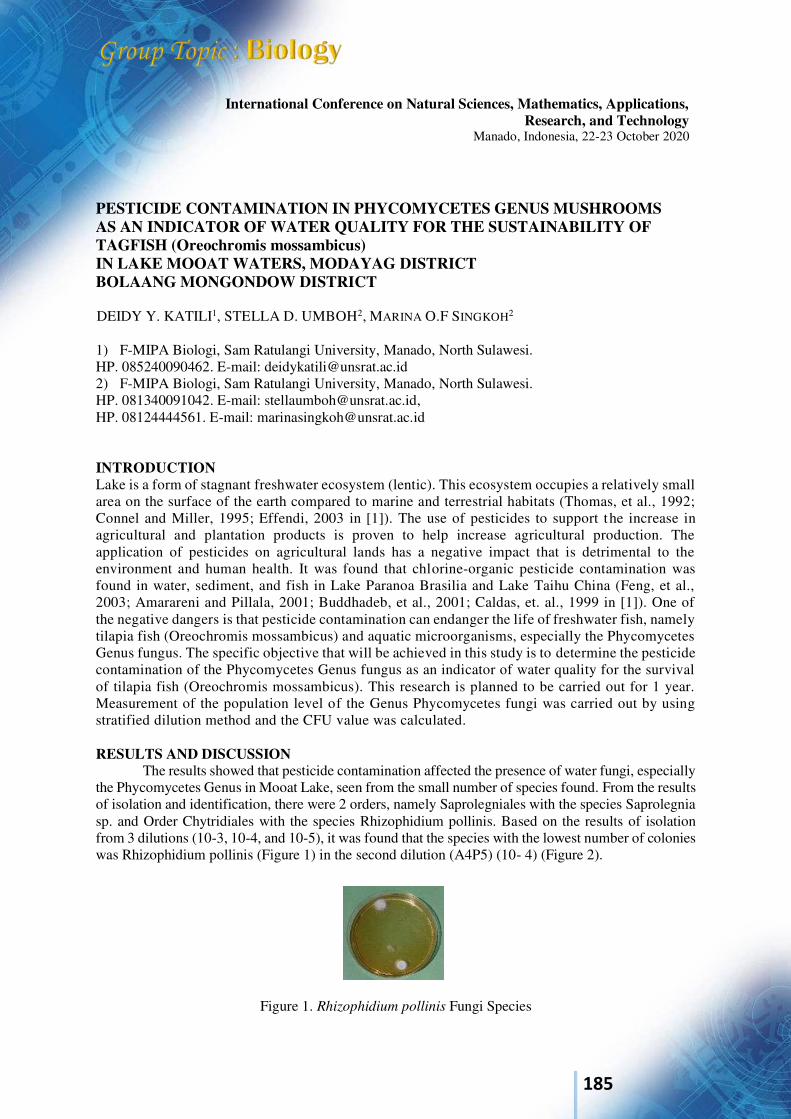
185
International Conference on Natural Sciences, Mathematics, Applications, Research, and Technology
Manado, Indonesia, 22-23 October 2020
PESTICIDE CONTAMINATION IN PHYCOMYCETES GENUS MUSHROOMS AS AN INDICATOR OF WATER QUALITY FOR THE SUSTAINABILITY OF TAGFISH (Oreochromis mossambicus) IN LAKE MOOAT WATERS, MODAYAG DISTRICT BOLAANG MONGONDOW DISTRICT DEIDY Y. KATILI1, STELLA D. UMBOH2, MARINA O.F SINGKOH2
1) F-MIPA Biologi, Sam Ratulangi University, Manado, North Sulawesi. HP. 085240090462. E-mail: [email protected] 2) F-MIPA Biologi, Sam Ratulangi University, Manado, North Sulawesi. HP. 081340091042. E-mail: [email protected], HP. 08124444561. E-mail: [email protected]
INTRODUCTION Lake is a form of stagnant freshwater ecosystem (lentic). This ecosystem occupies a relatively small area on the surface of the earth compared to marine and terrestrial habitats (Thomas, et al., 1992; Connel and Miller, 1995; Effendi, 2003 in [1]). The use of pesticides to support the increase in agricultural and plantation products is proven to help increase agricultural production. The application of pesticides on agricultural lands has a negative impact that is detrimental to the environment and human health. It was found that chlorine-organic pesticide contamination was found in water, sediment, and fish in Lake Paranoa Brasilia and Lake Taihu China (Feng, et al., 2003; Amarareni and Pillala, 2001; Buddhadeb, et al., 2001; Caldas, et. al., 1999 in [1]). One of the negative dangers is that pesticide contamination can endanger the life of freshwater fish, namely tilapia fish (Oreochromis mossambicus) and aquatic microorganisms, especially the Phycomycetes Genus fungus. The specific objective that will be achieved in this study is to determine the pesticide contamination of the Phycomycetes Genus fungus as an indicator of water quality for the survival of tilapia fish (Oreochromis mossambicus). This research is planned to be carried out for 1 year. Measurement of the population level of the Genus Phycomycetes fungi was carried out by using stratified dilution method and the CFU value was calculated. RESULTS AND DISCUSSION
The results showed that pesticide contamination affected the presence of water fungi, especially the Phycomycetes Genus in Mooat Lake, seen from the small number of species found. From the results of isolation and identification, there were 2 orders, namely Saprolegniales with the species Saprolegnia sp. and Order Chytridiales with the species Rhizophidium pollinis. Based on the results of isolation from 3 dilutions (10-3, 10-4, and 10-5), it was found that the species with the lowest number of colonies was Rhizophidium pollinis (Figure 1) in the second dilution (A4P5) (10- 4) (Figure 2).
Figure 1. Rhizophidium pollinis Fungi Species
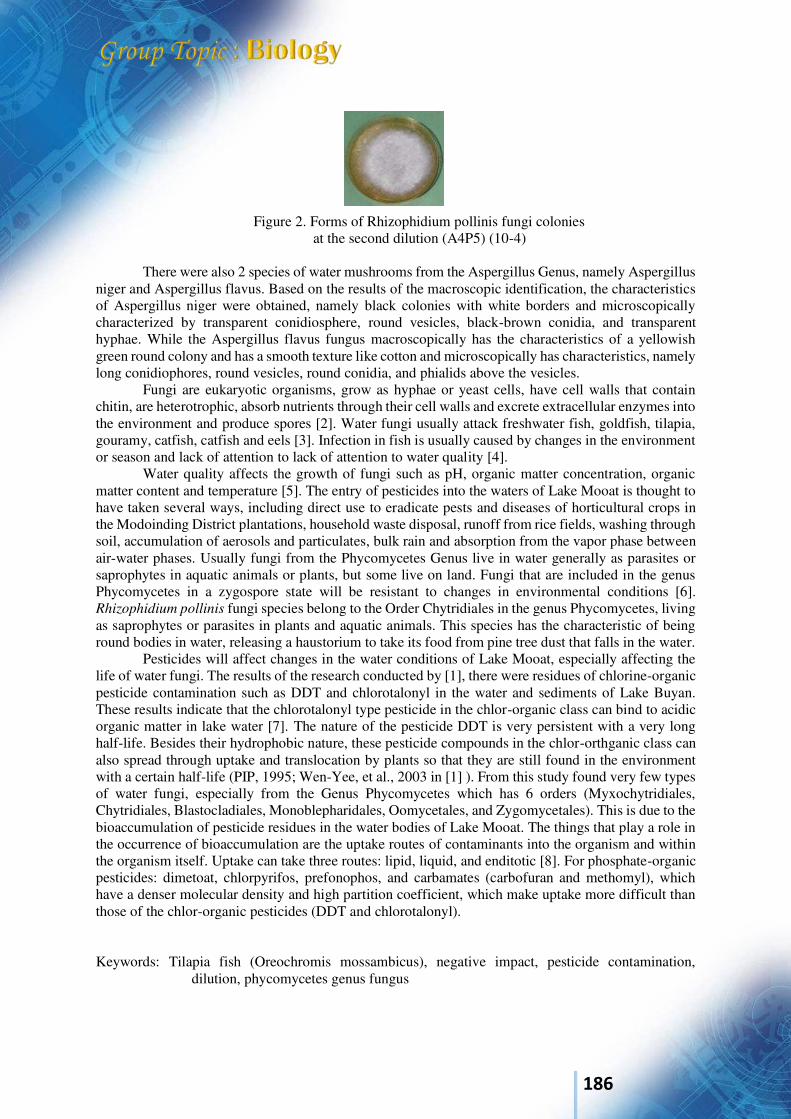
186
Figure 2. Forms of Rhizophidium pollinis fungi colonies at the second dilution (A4P5) (10-4)
There were also 2 species of water mushrooms from the Aspergillus Genus, namely Aspergillus
niger and Aspergillus flavus. Based on the results of the macroscopic identification, the characteristics of Aspergillus niger were obtained, namely black colonies with white borders and microscopically characterized by transparent conidiosphere, round vesicles, black-brown conidia, and transparent hyphae. While the Aspergillus flavus fungus macroscopically has the characteristics of a yellowish green round colony and has a smooth texture like cotton and microscopically has characteristics, namely long conidiophores, round vesicles, round conidia, and phialids above the vesicles.
Fungi are eukaryotic organisms, grow as hyphae or yeast cells, have cell walls that contain chitin, are heterotrophic, absorb nutrients through their cell walls and excrete extracellular enzymes into the environment and produce spores [2]. Water fungi usually attack freshwater fish, goldfish, tilapia, gouramy, catfish, catfish and eels [3]. Infection in fish is usually caused by changes in the environment or season and lack of attention to lack of attention to water quality [4].
Water quality affects the growth of fungi such as pH, organic matter concentration, organic matter content and temperature [5]. The entry of pesticides into the waters of Lake Mooat is thought to have taken several ways, including direct use to eradicate pests and diseases of horticultural crops in the Modoinding District plantations, household waste disposal, runoff from rice fields, washing through soil, accumulation of aerosols and particulates, bulk rain and absorption from the vapor phase between air-water phases. Usually fungi from the Phycomycetes Genus live in water generally as parasites or saprophytes in aquatic animals or plants, but some live on land. Fungi that are included in the genus Phycomycetes in a zygospore state will be resistant to changes in environmental conditions [6]. Rhizophidium pollinis fungi species belong to the Order Chytridiales in the genus Phycomycetes, living as saprophytes or parasites in plants and aquatic animals. This species has the characteristic of being round bodies in water, releasing a haustorium to take its food from pine tree dust that falls in the water.
Pesticides will affect changes in the water conditions of Lake Mooat, especially affecting the life of water fungi. The results of the research conducted by [1], there were residues of chlorine-organic pesticide contamination such as DDT and chlorotalonyl in the water and sediments of Lake Buyan. These results indicate that the chlorotalonyl type pesticide in the chlor-organic class can bind to acidic organic matter in lake water [7]. The nature of the pesticide DDT is very persistent with a very long half-life. Besides their hydrophobic nature, these pesticide compounds in the chlor-orthganic class can also spread through uptake and translocation by plants so that they are still found in the environment with a certain half-life (PIP, 1995; Wen-Yee, et al., 2003 in [1] ). From this study found very few types of water fungi, especially from the Genus Phycomycetes which has 6 orders (Myxochytridiales, Chytridiales, Blastocladiales, Monoblepharidales, Oomycetales, and Zygomycetales). This is due to the bioaccumulation of pesticide residues in the water bodies of Lake Mooat. The things that play a role in the occurrence of bioaccumulation are the uptake routes of contaminants into the organism and within the organism itself. Uptake can take three routes: lipid, liquid, and enditotic [8]. For phosphate-organic pesticides: dimetoat, chlorpyrifos, prefonophos, and carbamates (carbofuran and methomyl), which have a denser molecular density and high partition coefficient, which make uptake more difficult than those of the chlor-organic pesticides (DDT and chlorotalonyl). Keywords: Tilapia fish (Oreochromis mossambicus), negative impact, pesticide contamination,
dilution, phycomycetes genus fungus
187
Acknowledgement
The research team wants to express a great appreciation to the Rector of Sam Ratulangi University, the leader of Community Service Institution Sam Ratulangi University, for funding our research through Scheme of RDUU PNBP funds of 2019 fiscal year. References 1. Manuaba Ida Bagus Putra., 2006. Pesticide Contamination in Water and Sediment and Fish
Bioaccumulation: As a basis for Seeking a Safe Level of Fish Consumption in Buyan Lake, Bali. Dissertation. Graduate program. Udayana University. Denpasar.
2. Subandi, 2010. Microbiology. PT Remaja Rosdakarya. Bandung. Pg 91. 3. Hapsari Amalia, 2014. Isolation and Identification of Fungi in Goldfish (Carassius auratus) at the
Gunung Sari Ornamental Fish Exchange, Surabaya, East Java. Thesis. Aquaculture S-1 Study Program. Faculty of Fisheries and Marine, Airlangga University. http://repository.unair.ac.id/26342/1/HAPSARI%2C%20AMALIA.pdf (Accessed on 22 October 2020).
4. Fadaeifard, F.M. Raissy., H. Bahrami., E. Rahmi., A. Najafipoor., 2011. Freshwater Fungi Isolated from Eggs and Broodstock with an Emphasis on Saprolegnia in rainbow trout in West Iran. Microbio 4 (22): 3647-3651.
5. Willoughby, L.G, 1994. Fungi and Fish Disease. Pisces Stirling. 57 P. 6. Anonymous, 2013. Phycomycetes and Lhicenes.
http://putrisulamtina23.blogspot.com/2013/05/phycomycetes-dan-lichenes.html (Accessed 22 October 2020).
7. Caroline C, 1997. Chlorothalonil. Journal of Pesticide Reform. Vol. 17. No.4. p14-20. 8. Newman, M.C., Unger, M.A., 2003. Fundamentals of Ecotoxicology. 2nd ed. New York: Lewis
Publisher.
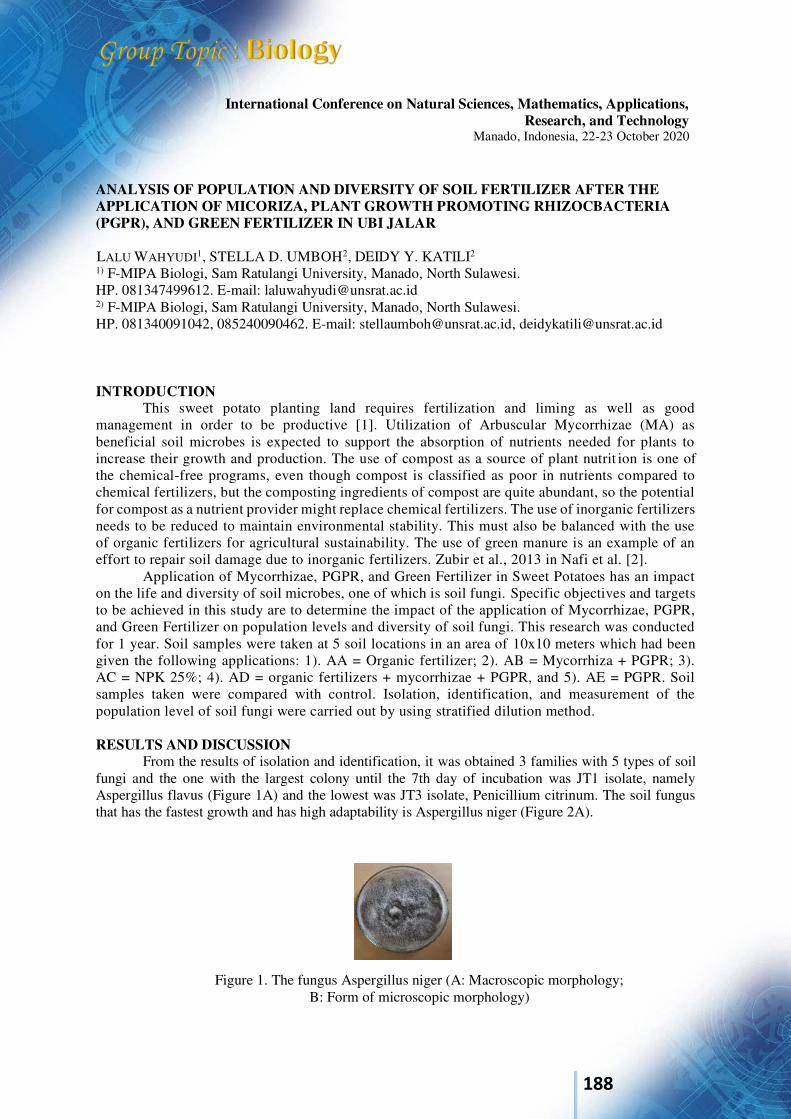
188
International Conference on Natural Sciences, Mathematics, Applications, Research, and Technology
Manado, Indonesia, 22-23 October 2020
ANALYSIS OF POPULATION AND DIVERSITY OF SOIL FERTILIZER AFTER THE APPLICATION OF MICORIZA, PLANT GROWTH PROMOTING RHIZOCBACTERIA (PGPR), AND GREEN FERTILIZER IN UBI JALAR LALU WAHYUDI1, STELLA D. UMBOH2, DEIDY Y. KATILI2 1) F-MIPA Biologi, Sam Ratulangi University, Manado, North Sulawesi. HP. 081347499612. E-mail: [email protected] 2) F-MIPA Biologi, Sam Ratulangi University, Manado, North Sulawesi. HP. 081340091042, 085240090462. E-mail: [email protected], [email protected]
INTRODUCTION
This sweet potato planting land requires fertilization and liming as well as good management in order to be productive [1]. Utilization of Arbuscular Mycorrhizae (MA) as beneficial soil microbes is expected to support the absorption of nutrients needed for plants to increase their growth and production. The use of compost as a source of plant nutrit ion is one of the chemical-free programs, even though compost is classified as poor in nutrients compared to chemical fertilizers, but the composting ingredients of compost are quite abundant, so the potential for compost as a nutrient provider might replace chemical fertilizers. The use of inorganic fertilizers needs to be reduced to maintain environmental stability. This must also be balanced with the use of organic fertilizers for agricultural sustainability. The use of green manure is an example of an effort to repair soil damage due to inorganic fertilizers. Zubir et al., 2013 in Nafi et al. [2].
Application of Mycorrhizae, PGPR, and Green Fertilizer in Sweet Potatoes has an impact on the life and diversity of soil microbes, one of which is soil fungi. Specific objectives and targets to be achieved in this study are to determine the impact of the application of Mycorrhizae, PGPR, and Green Fertilizer on population levels and diversity of soil fungi. This research was conducted for 1 year. Soil samples were taken at 5 soil locations in an area of 10x10 meters which had been given the following applications: 1). AA = Organic fertilizer; 2). AB = Mycorrhiza + PGPR; 3). AC = NPK 25%; 4). AD = organic fertilizers + mycorrhizae + PGPR, and 5). AE = PGPR. Soil samples taken were compared with control. Isolation, identification, and measurement of the population level of soil fungi were carried out by using stratified dilution method. RESULTS AND DISCUSSION
From the results of isolation and identification, it was obtained 3 families with 5 types of soil fungi and the one with the largest colony until the 7th day of incubation was JT1 isolate, namely Aspergillus flavus (Figure 1A) and the lowest was JT3 isolate, Penicillium citrinum. The soil fungus that has the fastest growth and has high adaptability is Aspergillus niger (Figure 2A).
Figure 1. The fungus Aspergillus niger (A: Macroscopic morphology; B: Form of microscopic morphology)
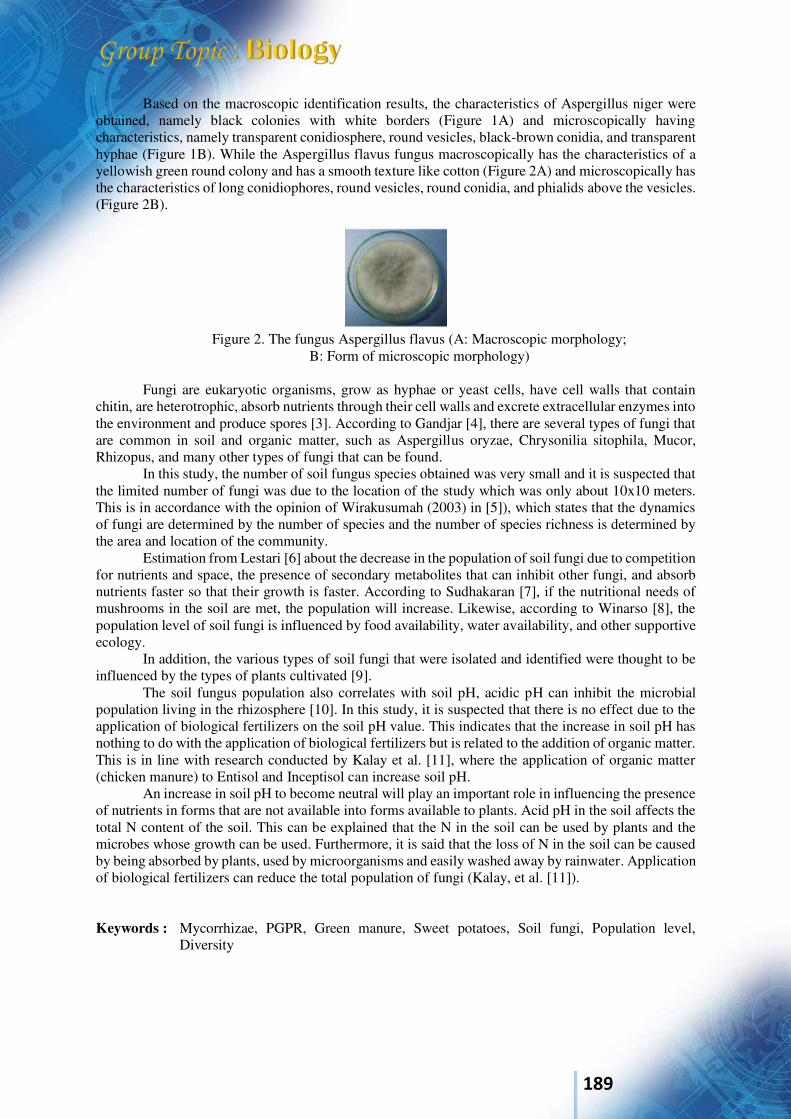
189
Based on the macroscopic identification results, the characteristics of Aspergillus niger were obtained, namely black colonies with white borders (Figure 1A) and microscopically having characteristics, namely transparent conidiosphere, round vesicles, black-brown conidia, and transparent hyphae (Figure 1B). While the Aspergillus flavus fungus macroscopically has the characteristics of a yellowish green round colony and has a smooth texture like cotton (Figure 2A) and microscopically has the characteristics of long conidiophores, round vesicles, round conidia, and phialids above the vesicles. (Figure 2B).
Figure 2. The fungus Aspergillus flavus (A: Macroscopic morphology; B: Form of microscopic morphology)
Fungi are eukaryotic organisms, grow as hyphae or yeast cells, have cell walls that contain
chitin, are heterotrophic, absorb nutrients through their cell walls and excrete extracellular enzymes into the environment and produce spores [3]. According to Gandjar [4], there are several types of fungi that are common in soil and organic matter, such as Aspergillus oryzae, Chrysonilia sitophila, Mucor, Rhizopus, and many other types of fungi that can be found.
In this study, the number of soil fungus species obtained was very small and it is suspected that the limited number of fungi was due to the location of the study which was only about 10x10 meters. This is in accordance with the opinion of Wirakusumah (2003) in [5]), which states that the dynamics of fungi are determined by the number of species and the number of species richness is determined by the area and location of the community.
Estimation from Lestari [6] about the decrease in the population of soil fungi due to competition for nutrients and space, the presence of secondary metabolites that can inhibit other fungi, and absorb nutrients faster so that their growth is faster. According to Sudhakaran [7], if the nutritional needs of mushrooms in the soil are met, the population will increase. Likewise, according to Winarso [8], the population level of soil fungi is influenced by food availability, water availability, and other supportive ecology.
In addition, the various types of soil fungi that were isolated and identified were thought to be influenced by the types of plants cultivated [9].
The soil fungus population also correlates with soil pH, acidic pH can inhibit the microbial population living in the rhizosphere [10]. In this study, it is suspected that there is no effect due to the application of biological fertilizers on the soil pH value. This indicates that the increase in soil pH has nothing to do with the application of biological fertilizers but is related to the addition of organic matter. This is in line with research conducted by Kalay et al. [11], where the application of organic matter (chicken manure) to Entisol and Inceptisol can increase soil pH.
An increase in soil pH to become neutral will play an important role in influencing the presence of nutrients in forms that are not available into forms available to plants. Acid pH in the soil affects the total N content of the soil. This can be explained that the N in the soil can be used by plants and the microbes whose growth can be used. Furthermore, it is said that the loss of N in the soil can be caused by being absorbed by plants, used by microorganisms and easily washed away by rainwater. Application of biological fertilizers can reduce the total population of fungi (Kalay, et al. [11]).
Keywords : Mycorrhizae, PGPR, Green manure, Sweet potatoes, Soil fungi, Population level, Diversity
190
Acknowledgement The research team wants to express a great appreciation to the Rector of Sam Ratulangi
University, the leader of Community Service Institution Sam Ratulangi University, for funding our research through Scheme of RTUU PNBP funds of 2019 fiscal year. References 1. Hardjowigeno, S. 1987. Soil Science. Mediyatama Sarana Perkasa. Jakarta. 237 p. 2. Nafi Rifqi, Eko Widaryanto, Titin Sumarni., 2017. Effect of Green Fertilizer (Crotalaria juncea L.
and Tithonia diversifolia) and Trichoderma sp. On the growth and yield of Sweet Corn (Zea Mays saccharata Sturt).
3. Subandi, 2010. Microbiology. PT Remaja Rosdakarya. Bandung. Pg 91. 4. Gandjar, I., Samson, R.A., Vermenlen, K.V.D.T., Santoso, I. 1999. Introduction to General Tropical
Fungi. University of Indonesia, Jakarta.Pangestu, D. 2009. Isolasi, Identifikasi, Dinamika, dan Skrinning Pertumbuhan Jamur dari Biokonservasi Palm Kernel Meal. Makalah I. FMIPA UI, 2009. http://lontar.ui.ac.id/file?=digital/130041-T%2027083-Isolasi,%20identifikasi-analisis.pdf [12/05/2019].
5. Lestari Isna, Stella D. Umboh, Johanis J. Pelealu., 2018. Population Levels of Soil Fungus due to Mankozeb Fungicide Treatment in Cabbage Vegetable Planting (Brassica oleracea var.capitata) Modoinding District, South Minahasa Regency, North Sulawesi (The Population Level of Soil Fungi under Mankozeb Fungicides Application in the Cabbage (Brassica oleracea var.capitata) Plantation of Modoinding Subdistrict, South Minahasa District, North Sulawesi). Bioslogos Journal, February 2018, Vol. 8 Number 1.Sudhakaran, M., D. Pamamoorty., S. R. Kumar. 2013. Impact of Conventional, Sustainable and Organic Farming System on Soil Microbial Population and Soil Biochemical Properties, Puducherry, India. International Journal Of Environmental Sciences. Sci. (4)1.
6. Winarso, S. 2005. Soil Fertility: Basis for Soil Health and Quality. Gava Media, Yogyakarta.Rao, N. S. S. 1994. Mikroorganisme Tanah dan Pertumbuhan Tanaman. Universitas Indonesia Press, Jakarta.
7. Widyati, E. 2013). Understanding Plant Microbial Interactions - Understanding on Plants-Microbes Interaction. Plantation Techno 6 (1): 13 – 20.
8. Kalay A. Marthin, Alexander Sesa, Adelina Siregar1, Abraham Talahaturuson Effects of Biofertilizer Applications on Microbial Populations and Availability of Macro Nutrients in Entisol Soil file: /// C: / Users / user / Downloads / 1011-2283-1- SM.pdf. AGROLOGIA: Volume 8, Number 2, October 2019, pages 63-70 p-ISSN 2301-7287; e-ISSN 2580-9636.
191
International Conference on Natural Sciences, Mathematics, Applications, Research, and Technology
Manado, Indonesia, 22-23 October 2020
POTENTIAL OF BACTERIA Bacillus sp., Pseudomonas aeruginosa, Pseudomonas sp., AND Serratia marcescens, AS AGENTS OF Microbial Enhanced Oil Recovery (MEOR)
Nia Rossiana *1, Mia Miranti R2, Tasha Stevany 3
1,2Universitas Padjajaran; Jln. Raya Bandung-Sumedang Km. 21, (022) 84288828 3Departement Biology, Faculty of Mathematics dan Natural Science, Universitas Padjajaran, Jatinangor, Sumedang Regency, West Java 45363 E-mail : 1* [email protected], 2 [email protected] , 3 [email protected]
Abstract
Bacillus sp., Pseudomonas aeruginosa, Pseudomonas sp., and Serratia marcescens were tested for their
potential as MEOR agents. This research was conducted with a descriptive exploratory method
consisting of the screening stage of biosurfactant-producing bacteria with a blood hemolysis test,
calculation of the bacterial population (cfu / mL) with a Total Plate Count (TPC) method, and a
biosurfactant activity test by measuring surface tension using a tensiometer Du-Nuoy and measurement
of emulsification index. Biosurfactants produced by bacteria were characterized using Fourier
Transform Infra Red (FTIR) and Thin Layer Chromatography (TLC). The results showed that the most
potential bacteria were Pseudomonas sp., And Serratia marcescens which could produce biosurfactants
with the ability to hemolize blood with clear zone diameters of 6.5mm and 8mm respectively.
Emulsification ability of Pseudomonas sp. and Serratia marcescens 69% and 77%, respectively. The
ability to reduce the surface tension of Pseudomonas sp is 4dyne / cm and Serratia marcescens is 3dyne
/ cm. In the FTIR and TLC tests, the characteristics of biosurfactants produced by Pseudomonas sp.
shows the polar nature and is dominated by alkane groups, while the biosurfactant produced by Serratia
marcescens shows the polar nature and is dominated by acid groups. Based on this, biosurfactants
produced by Pseudomonas sp. is the most potential for MEOR agents, while biosurfactants from
Serratia marcescens are more suitable as biodegradation agents.
Keyword : Biosurfactants, Emulsification index, FTIR, MEOR, Surface tension, TLC
INTRODUCTION The need for oil in Indonesia is increasing every year. Agustina et al. (2018) stated that the demand for petroleum is expected to increase three times from 300 million barrels in 2014 to 967 million barrels in 2050. The search for oil wells is always carried out by foreign oil producers, as well as domestic oil producers. This is done as an effort to meet the energy needs of the people. Ikhwani (2017) states that these oil wells still have potential and save oil reserves. The MEOR method is a way to increase the acquisition of petroleum by utilizing microbes. Microbial enhanced oil recovery (MEOR) method causes optimization of oil wells can be done, so that excavation for new wells can be minimized. This study will test the potential of the bacteria Bacillus sp., Pseudomonas sp., Pseudomonas
aeruginosa, and Serratia marcescens will be tested for their ability to produce biosurfactants, with clear zone diameter parameters, emulsification index values and the ability to reduce surface tension. Then the biosurfactant produced was characterized using FTIR and TLC.
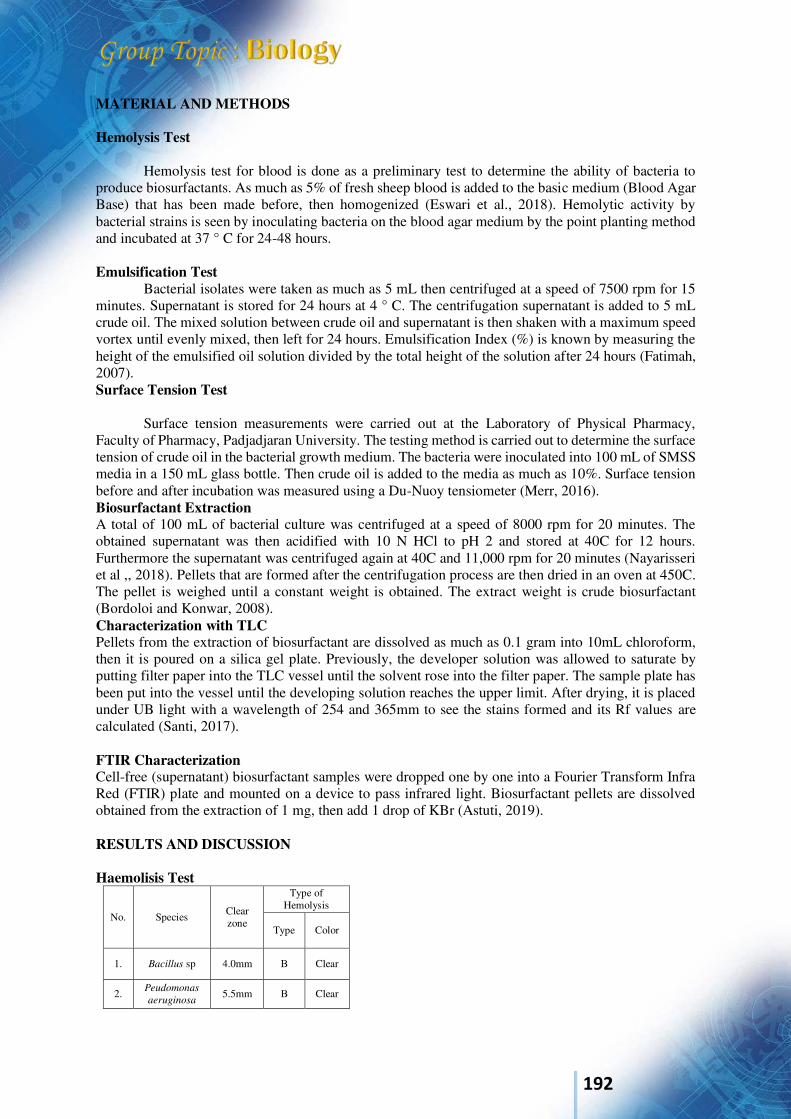
192
MATERIAL AND METHODS Hemolysis Test
Hemolysis test for blood is done as a preliminary test to determine the ability of bacteria to
produce biosurfactants. As much as 5% of fresh sheep blood is added to the basic medium (Blood Agar Base) that has been made before, then homogenized (Eswari et al., 2018). Hemolytic activity by bacterial strains is seen by inoculating bacteria on the blood agar medium by the point planting method and incubated at 37 ° C for 24-48 hours. Emulsification Test
Bacterial isolates were taken as much as 5 mL then centrifuged at a speed of 7500 rpm for 15 minutes. Supernatant is stored for 24 hours at 4 ° C. The centrifugation supernatant is added to 5 mL crude oil. The mixed solution between crude oil and supernatant is then shaken with a maximum speed vortex until evenly mixed, then left for 24 hours. Emulsification Index (%) is known by measuring the height of the emulsified oil solution divided by the total height of the solution after 24 hours (Fatimah, 2007). Surface Tension Test
Surface tension measurements were carried out at the Laboratory of Physical Pharmacy, Faculty of Pharmacy, Padjadjaran University. The testing method is carried out to determine the surface tension of crude oil in the bacterial growth medium. The bacteria were inoculated into 100 mL of SMSS media in a 150 mL glass bottle. Then crude oil is added to the media as much as 10%. Surface tension before and after incubation was measured using a Du-Nuoy tensiometer (Merr, 2016). Biosurfactant Extraction A total of 100 mL of bacterial culture was centrifuged at a speed of 8000 rpm for 20 minutes. The obtained supernatant was then acidified with 10 N HCl to pH 2 and stored at 40C for 12 hours. Furthermore the supernatant was centrifuged again at 40C and 11,000 rpm for 20 minutes (Nayarisseri et al ,, 2018). Pellets that are formed after the centrifugation process are then dried in an oven at 450C. The pellet is weighed until a constant weight is obtained. The extract weight is crude biosurfactant (Bordoloi and Konwar, 2008). Characterization with TLC Pellets from the extraction of biosurfactant are dissolved as much as 0.1 gram into 10mL chloroform, then it is poured on a silica gel plate. Previously, the developer solution was allowed to saturate by putting filter paper into the TLC vessel until the solvent rose into the filter paper. The sample plate has been put into the vessel until the developing solution reaches the upper limit. After drying, it is placed under UB light with a wavelength of 254 and 365mm to see the stains formed and its Rf values are calculated (Santi, 2017). FTIR Characterization Cell-free (supernatant) biosurfactant samples were dropped one by one into a Fourier Transform Infra Red (FTIR) plate and mounted on a device to pass infrared light. Biosurfactant pellets are dissolved obtained from the extraction of 1 mg, then add 1 drop of KBr (Astuti, 2019). RESULTS AND DISCUSSION Haemolisis Test
No. Species Clear zone
Type of Hemolysis
Type Color
1. Bacillus sp 4.0mm Β Clear
2. Peudomonas
aeruginosa 5.5mm Β Clear
193
3. Pseudomonas
sp 6.5mm Β Clear
4. Serratia
marcescens 8.0mm Β Clear
In blood hemolysis tests, clear zone diameters of more than 5mm indicate that the species has
the potential to produce Biosurfactants. Clear zone formed indicates the presence of lysed red blood cells due to bacterial metabolic activity. In this study, Serratia marcescens produced the largest clear zone diameter of 8mm. This shows that Serratia marcescens is able to produce the most potential biosurfactants. Ansah et al., (2018), stated that the principle of biosurfactant activity is based on the ability of bacteria to form micelles around the components of red blood cells and cause cell lysis.
Emulsification test
No. Species Emulsification index (%)
1. Bacillus sp 55%
2. Peudomonas
aeruginosa 65%
3. Pseudomonas sp 69%
4. Serratia marcescens 77%
it can be seen that all four bacteria have an emulsification index value> 50%, which means biosurfactants in the supernatant of the four bacterial isolates are able to emulsify crude oil. It can be seen that the bacterium Serratia marcescens has the ability to emulsify oil better than other bacteria, because it shows the highest percentage of emulsification index which is 77%. Emulsification of oil caused by biosurfactants has an amphiphatic molecular structure that is has a molecular structure consisting of hydrophilic groups and hydrophobic groups. Biosurfactants produced by bacteria will be absorbed into the surface of oil and water particles, the hydrophobic group will attract oil and the hydrophilic group will attract water, so that both will be easier to homogeneous (Santos et al., 2017). Surface Tension
no.
Nama Speci
es
Tegangan Permukaan
Before incubatio
n (dyne/cm)
After Incubati
on (dyne/cm
) 1.
Bacillus sp 30 28
2.
Peudomonas
aeruginosa 30 27
3.
Pseudomonas sp 30 27
4.
Serratia
marcescens 30 26
A decrease in the surface tension value indicates bacterial activity that can reduce oil viscosity,
so that the surface tension of the oil decreases. Serratia marcescens is known to be able to reduce the surface tension of the highest crude oil, which is 4 dyne / cm. Furthermore Serratia marcescens and Pseudomonas aeruginosa were able to reduce surface tension by 3 dyne / cm, while Bacillus sp. able to reduce surface tension by 2dyne / cm. According to Araujo et al., (2019) when biosurfactants are produced, the viscosity of crude oil will decrease. Decreased viscosity of crude oil will cause oil and media to mix, so that the solubility becomes more stable. The stability of the two different phases will cause the interface tension between crude oil and liquid media to decrease. When the emulsification value is high, the surface tension number will decrease.
194
Characterization of Biosurfactants with FTIR In the extraction process, the biosurfactant results from Bacillus sp. does not meet the standards for the number of samples, so it cannot be tested. Extracted biosurfactants were characterized using FTIR instruments to determine functional groups contained in biosurfactants.
Pseudomonas aeruginosa Biosurfactants Analysis with FTIR
Pseudomonas sp Bisurfactants analysis with FTIR
Serratia marcescens Biosurfactants Anaysis with FTIR The existence of the haloalkane group (C-I) allows the type of biosurfactant produced by Pseudomonas
aeruginosa to have advantages, namely melting and boiling points which are higher than ordinary alkane types (Benet, 2017). However, the shortcomings of compounds containing haloalkanes are usually incompatible with solvents in the form of water, because they are unable to bind hydrogen. Biosurfactants with this type of group are not suitable for use in water-based reservoirs (Kosaric, 2014). According to Balan et al., (2017) the presence of alkenes in a solution causes the properties of these compounds to be non-polar. However, the primary aliphatic amine group (S = O) is a group that can cause a basic compound, and this basic property is suitable for dissolving crude oil (Nayarisseri et al., 2018). Characterization of Biosurfactants with TLC
No. Species Nilai Rf
1. Bacillus sp 0.38
2. Pseudomonas
aeruginosa 0.60
3. Pseudomonas sp 0.65
4. Serratia
marcescens 0.60
It is known that the bacteria Pseudomonas sp., Pseudomonas aeruginosa and Serratia marcescens have an Rf value between 0.60-0.65. This shows that, biosurfactants produced by these three bacteria have the potential to help mobilize oil. The Rf value expresses the speed of biosurfactant migration in the stationary phase whose displacement is assisted by the eluent. The higher the value of Rf produced, the polarity of biosurfactants will be higher (Spangenberg et al., 2011).
195
CONCLUSION 1.Pseudomonas sp., And Serratia marcescens could produce biosurfactants with the ability to hemolize blood with clear zone diameters of 6.5mm and 8mm 2.. Emulsification ability of Pseudomonas sp. and Serratia marcescens 69% and 77% 3.The ability to reduce the surface tension of Pseudomonas sp is 4dyne / cm and Serratia marcescens is 3dyne / cm. 4 In the FTIR and TLC tests, the characteristics of biosurfactants produced by Pseudomonas sp. shows the polar nature and is dominated by alkane groups, Serratia marcescens shows the polar nature and is dominated by acid groups.
REFERENCE Ansah, E. O., Sugai, Y., Nguele, R., & Sasaki, K. 2018. Integrated microbial enhanced oil recovery
(MEOR) simulation: Main influencing parameters and uncertainty assessment. Journal of
Petroleum Science and Engineering, 171, 784–793. doi:10.1016/j.petrol.2018.08.005 Araújo, H. W. C., Andrade, R. F. S., Montero-Rodríguez, D., Rubio-Ribeaux, D., Alves da Silva, C.
A., & Campos-Takaki, G. M. 2019. Sustainable biosurfactant produced by Serratia marcescens
UCP 1549 and its suitability for agricultural and marine bioremediation applications. Microbial
Cell Factories. 18(1). doi:10.1186/s12934-018-1046-0 Astuti, D.I., Purwasena I.A., Putri R.E., A.Maghfirotul, & Sugai Y. 2019. Screening and
Characterization of Biosurfactant produced by Pseudoxanthomonas sp.G3 and its aplicability for enchanced oil recovery. Journal of Petroleum Exploration and Production Technology. 9:2279–2289 https://doi.org/10.1007/s13202-019-0619-8
Balan, S. S., Kumar, C. G., & Jayalakshmi, S. 2017. Aneurinifactin, a new lipopeptide biosurfactant produced by a marine Aneurini Bacillus aneurinilyticus SBP-11 isolated from Gulf of Mannar: Purification, characterization and its biological evaluation. Microbiological Research. 194 (11): 1–9. doi:10.1016/j.micres.2016.10.005
Benet, I. 2017. Genetic programming of catalytic Pseudomonas spp. for boosting Oil Production. Metabolic Engineering. 33(2): 109–118. doi:10.1016/j.ymben.
Bordoloi, N. K., & Konwar, B. K. 2008. Microbial surfactantenhanced mineral oil recovery under laboratory conditions. Colloids and Surfaces. B, Biointerfaces, 63(1), 73–82. doi:10.1016/j.colsurfb.2007.11.006
Eswari, J.S., D. Swasti, & P.Mishra. 2018. Biosurfactant Assisted Silver Nanoparticle Stnthesis: a critical analysis of Its drug design aspects. Advances in Natural Sciences: Nanoscience and Nanotechnology. 9(8):1-17. https://doi.org/10.1088/2043-6254/aaec0e.
Kosaric, N. 2014. Biosurfactants: Production and Utilization-Processes, Technologies, and Economics. London : CRC Press
Merr, Lin. 2016. Book of Technical Microbiology. United States: Chemington Publisher. Nayarisseri, A., Singh, P., & Singh, S. K. 2018. Screening, isolation and characterization of
biosurfactant producing Bacillus subtilis strain ANSKLAB03. Bioinformation. 14(6):44-53. doi:10.6026/9732
Nayarisseri, A., Singh, P., & Singh, S. K. 2018. Screening, isolation and characterization of biosurfactant producing Bacillus subtilis strain ansklab03. Bioinformation. 14(6):44-53. doi:10.6026/9732
Santos, A. P. P., Silva, M. D. S., Costa, E. V. L., Rufino, R. D., Santos, V. A., Ramos, C. S., Porto, A. L. F. 2017. Production and characterization of a biosurfactant produced by Streptomyces sp. DPUA 1559 isolated from lichens of the Amazon region. Brazilian Journal of Medical and Biological
Research. 51(2). doi:10.1590/1414-431x20176657
196
International Conference on Natural Sciences, Mathematics, Applications, Research, and Technology
Manado, Indonesia, 22-23 October 2020
Product quality test of pasote tea bags leaves Pasote (Dysphania
ambrosioides): Comparison of antioxidant activities of water extract with acetone extract Dingse Pandiangan*1, Paulina V. Y. Lamlean2, Nelson Nainggolan3 1 Department of Biology, Faculty Mathematics and Natural Sciences, Sam Ratulangi University, Manado, North Sulawesi, INDONESIA (E-mail: [email protected]) 2 Study Program of Pharmacy, Faculty Mathematics and Natural Sciences, Sam Ratulangi University, Manado, North Sulawesi, INDONESIA (E-mail: [email protected]) 3 Department of Mathematics Faculty Mathematics and Natural Sciences, Sam Ratulangi University, Manado, North Sulawesi, INDONESIA (E-mail: [email protected]) INTRODUCTION One of the natural medicinal plants which is well known in Indonesia, especially the people of North Sulawesi, is the Pasote plant (Dysphania ambrosioides L.).The genus Dysphania is known to contain flavonoids, terpenes, sesquiterpenes, pigmol, xylosides, coumarin and essential oils. Pasote plants are also known to have biological activities such as antimicrobials, cytoxicity, antioxidants, larvacides, antidiabetic, antiparasitic, antiviral and molluscidal1. Extraction of compounds and to determine the presence of biological activity in pasote plants can be done through an extraction process. To get a thorough extraction and obtain compounds that have pharmacological activity, the selection of the solvent used for extraction is an important factor2. The ideal solvent that is often used is alcohol or its mixture with water because it is the best extracting solvent for almost all low molecular weight compounds such as saponins and flavonoids3. In a study conducted by P Maningkas4 it was found that pasote leaves extracted using methanol solvent had a strong category of anticancer activity with an IC50 value of 53.37 µg / mL and a strong antioxidant activity with an IC50 value of 50.13 µg / mL. In this study, the extraction of pasote leaves by maceration method using water and acetone as a solvent. Water is considered a solvent because it is easy to obtain, cheap, non-toxic, non-volatile and non-flammable. Meanwhile, acetone is considered a solvent because it is a well-known compound in the manufacture of pharmaceuticals and other chemical compounds5. Therefore, in this study, it is necessary to examine the anti-cholesterol test and improve the quality of Dysphania ambrosioides L products that have been packaged in tea bags against Wistar rats with improved taste with the addition of brown sugar and presentation RESULTS AND DISCUSSION Pasote leaf extraction results The extraction that is done is extraction by maceration method. The Pasote leaf powder that has been put into a tea bag as much as two grams per bag is soaked in water and acetone as a solvent with 200 mL of each solvent for 30 minutes, so that the extract obtained is an extract in liquid form. It is known that each extract solution has a concentration of 10000 µg / mL with a final concentration of 196 µg / mL in tube 1, 384 µg / mL in tube 2, 754 µg / mL in tube 3 and 1481 µg / mL in tube 4. The formula
197
for calculating the concentration of the final solution is obtained by using the initial solution concentration (C1) multiplied by the initial volume of the solution (V1) and divided by the final volume of the solution (V2). The calculation of the final concentration of the extract solution can be seen in Table 1.
Table 1. Calculation of the final concentration of Pasote leaf extract in each solvent
Tube V1 (mL) C1 (µg/mL)
V2 (mL) C2 (µg/mL)
A
B
C
D
E
0 0,1 0,2 0,4 0,8
0 10000 10000 10000 10000
5 5,1 5,2 5,3 5,4
0 196 384 754 1481
Results of determination of percent inhibition antioxidants from leaves of pasote (D.
Ambrosioides) The macerated liquid extract of Pasote leaves obtained two types of extract solutions, namely aqueous extract solutions and acetone extracts from the Pasote leaves. From each variant of the extract solution, its antioxidant activity was tested against DPPH. The process of testing for antioxidant activity or inhibition was carried out using a visible spectrophotometer with a wavelength of 517 nm. The use of a visible spectrophotometer is because testing with this method is carried out based on the absorption of visible light against a colored solution4,6. The reaction between the pasote extract of the two types of solvents against DPPH resulted in a purple to yellowish compound which degraded according to its antioxidant activity. With the appearance of this color reaction, this test can be carried out using a visible spectrophotometer. The darker the color, the lower the inhibitory activity of DPPH, and vice versa, the brighter to the yellowish color, the higher the inhibitory activity of DPPH, in other words, the higher the antioxidant activity. From the two variants tested, it was seen that at the same concentration the type of water solvent had better inhibitory power than the acetone solvent. With an initial sample concentration of 10000 µg / mL, acetone solution had percent inhibition (% IC) of 38.77% and water solution had percent inhibition of 46.96%. The percentage of inhibition of water is greater than the percentage of inhibition of acetone. This means that the water-soluble pasote extract contains bioactive compounds that can inhibit DPPH better than the acetone-solvent extract of pasote. This shows that the water compounds have polarity properties that are relatively the same as the compounds found in Pasote leaves. So it can be concluded that the antioxidant compounds that act as DPPH inhibitors from Pasote leaves can be extracted well if using a water solvent. IC50 Results in Pasote Leaf Water Extract in Inhibiting DPPH After it was known that the water extract of Pasote leaves had the best inhibitory ability, then the IC50 was determined from the extract. IC50 or 50% Inhibitor Concentration is a concentration of inhibitors that can inhibit enzyme activity by as much as 50%. A compound is known to be a very strong antioxidant compound if the IC50 value is <10 µg / mL, strong if the IC50 value ranges from 10-50 µg / mL, while if the IC50 value ranges from 50-100 µg / mL, it is weak if the IC50 value ranges between 100-250 µg / mL and is inactive when the IC50 value is above 250 µg / mL7. To obtain the IC50 value from the water extract of Pasote leaves, linear regression calculations were carried out at several concentrations of 196 µg / mL, 384 µg / mL, 754 µg / mL and 1481 µg / mL against the percent inhibition. The results obtained can be seen in Table 2.
198
Tabel 2. Test results of pasote leaf brew water extract
Replication Inhibitor Concentration (µg/mL)
Percent Inhibition
I
196 384 754 1481
45,62 46,23 47,00 51,15
II
196 384 754 1481
42,38 43,00 46,23 51,00
Furthermore, the calculation is carried out using the regression equation formula IC50 = y + bx, y = IC50 = 50.The results of the IC50 calculation for the water extract of Pasote leaves based on the regression equation formula can be seen in Table 3. The results of the calculation of the linear regression equation showed that the IC50 value of the water extract of the leaves was 1.32 µg / mL. Knowing that the IC50 value in the water extract of Pasote leaves is 1.32 µg / mL, indicating that the antioxidant compounds in the water extract of Pasote leaves have a very strong inhibitory power against DPPH.
Table 3. IC50 calculation results based on the regression equation
Replication Linear Equation IC50 SD X
I
y=0.0043x+44.459
(r=0.96)
1,29 µg/mL 0,04 1,32
µg/mL
II y=0.0069x+40.782
(r=0.99) 1,34
µg/mL 0,04 1,32 µg/mL
Based on the results of the research that has been obtained, it can be concluded that the best solvent that can extract antioxidant compounds in pasote leaves is water, and water extract of pasote leaves has the most effective antioxidant activity or inhibitory power with an IC50 value of 1.32 µg / mL. Keywords: Acetone, Antioxidant, Dysphania ambrosioides, Quality test, Water extract Acknowledgment Our gratitude to the Rector of Sam Ratulangi University and the Head of Research Institutions and Community Service Sam Ratulangi University who have assigned us to carry out this Superior Elementary Research with assignment letter number 777 /UN12.13/LTPNBP/2020 on April 1, 2020 with PNBP funds. References
1. Ghareeb MA, Saad AM, Abdou AM, Refahy LAG, Ahmed WS. A new kaempferol glycoside with antioxidant activity from Chenopodium ambrosioides growing in Egypt. Orient J Chem. 2016;32(6):3053-3061. doi:10.13005/ojc/320626
2. Arifianti L, Oktarina RD, Kusumawati I. Pengaruh Jenis Pelarut Pengektraksi Terhadap Kadar Sinensetin Dalam Ekstrak Daun Orthosiphon stamineus Benth. Pengaruh Jenis Pelarut
Pengektraksi E-Journal Planta Husada. 2014;2(1):1-4. Accessed October 25, 2020. http://journal.unair.ac.id/download-fullpapers-ph44bbad3916full.pdf
3. Wijesekera ROB. The Medicinal Plant Industry. 1st ed. Routledge; 1991. doi:10.1201/9780203736395

199
4. Maningkas P, Pandiangan D, Kandou F. Uji Antikanker dan Antioksidan Ekstrak Metanol Daun Pasote (Dysphania ambrosioides L.) Anticancer and Antioxidant Test of Methanol Extract of Epazote leaves (Dysphania ambrosioides L.). J BIOS LOGOS. 2019;9(2):102. doi:10.35799/jbl.9.2.2019.24556
5. L. G. Wade J. Organic Chemistry.; 2006. 6. Al-Ash’ary* MN, Supriyanti FMT, Zackiyah. Penentuan Pelarut Terbaik Dalam Mengekstraksi
Senyawa Bioaktif Dari Kulit Batang Artocarpus Heterophyllus. Sains dan Teknol Kim. 2010;1(2):150-158. Accessed October 25, 2020. http://jurnal.upi.edu/stk/view/1012/penentuan-pelarut-terbaik-dalam-mengekstraksi-senyawa-bioaktif-dari-kulit-batang-artocarpus-heterophyllus.html
7. Handayani V, Ahmad AR, Sudir M. Uji Aktivitas Antioksidan Ekstrak Metanol Bunga dan Daun Patikala (Etlingera elatior (Jack) R.M.Sm) Menggunakan Metode DPPH. Pharm Sci Res. 2014;1(2):86-93. doi:10.7454/psr.v1i2.3321
200
International Conference on Natural Sciences, Mathematics, Applications, Research, and Technology
Manado, Indonesia, 22-23 October 2020
The Developing of Fuzzy System for Multiple Time Series Forecasting with Generated Rule Bases and Optimized Consequence Part Samingun Handoyo1, Ying-Ping Chen2
1Department of Statistics, Faculty of Mathematics and Natural Science, Brawijaya University, INDONESIA, EECS International Graduate Program, National Chiao Tung University, TAIWAN, ([email protected]) 2Departmrnt of Computer Science, National Chiao Tung University, TAIWAN, ([email protected]) ABSTRACT The paper has the goals of building and implementing an predictive model called fuzzy system which the fuzzy rule bases component is generated by using the input-output data pairs and it’s consequence part is optimized by using ordinary least square. The initial structure model is needed for creating of the input-output data pairs based on the multiple time series. The rule bases is generated by using table lookup schema which each input-output pairs has contribution as a candidate rule. The obtaining rule base is modified to be an efficient one by optimizing of it’s consequence part. As a case study is used 2 time series assumed which they have causality affect of one to other. The data are the soybean price of both domestic and aboard. The developed fuzzy system is used in the forecasting of the domestic soybean price. The performance of the fuzzy system is very satisfied which it is assessed according to the R-squared and mean squared error of criteria. Key words: times series forecasting, fuzzy system, optimized rule bases, predictive model. RESULTS AND DISCUSSION
Table 1. Gaussian parameter of both series
Domestic Price Aboard Price
Fuzzy Set Mean Stdev Mean Stdev
Small_3(S3) 91.91667 8398 94.66667 7885
Small_2(S2) 91.91667 8581.833 94.66667 8074.333
Small_1(S1) 91.91667 8765.667 94.66667 8263.667
Normal(N) 91.91667 8949.5 94.66667 8453
Big_1(B1) 91.91667 9133.333 94.66667 8642.333
Big_2(B2) 91.91667 9317.167 94.66667 8831.667
B9g_4(B3) 91.91667 9501 94.66667 9021 Transform each observation points to be membership degree and it’s fuzzy set which it has maximum degree
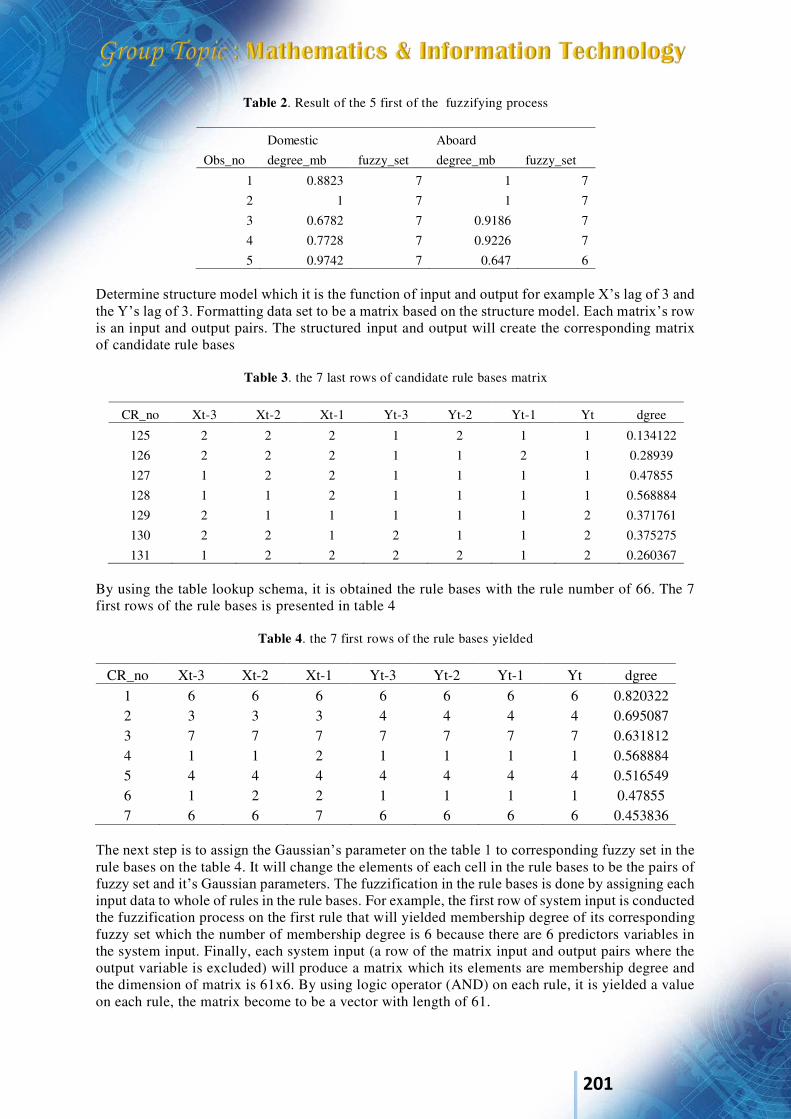
201
Table 2. Result of the 5 first of the fuzzifying process
Domestic Aboard
Obs_no degree_mb fuzzy_set degree_mb fuzzy_set
1 0.8823 7 1 7
2 1 7 1 7
3 0.6782 7 0.9186 7
4 0.7728 7 0.9226 7
5 0.9742 7 0.647 6 Determine structure model which it is the function of input and output for example X’s lag of 3 and the Y’s lag of 3. Formatting data set to be a matrix based on the structure model. Each matrix’s row is an input and output pairs. The structured input and output will create the corresponding matrix of candidate rule bases
Table 3. the 7 last rows of candidate rule bases matrix
CR_no Xt-3 Xt-2 Xt-1 Yt-3 Yt-2 Yt-1 Yt dgree
125 2 2 2 1 2 1 1 0.134122
126 2 2 2 1 1 2 1 0.28939
127 1 2 2 1 1 1 1 0.47855
128 1 1 2 1 1 1 1 0.568884
129 2 1 1 1 1 1 2 0.371761
130 2 2 1 2 1 1 2 0.375275
131 1 2 2 2 2 1 2 0.260367 By using the table lookup schema, it is obtained the rule bases with the rule number of 66. The 7 first rows of the rule bases is presented in table 4
Table 4. the 7 first rows of the rule bases yielded
CR_no Xt-3 Xt-2 Xt-1 Yt-3 Yt-2 Yt-1 Yt dgree 1 6 6 6 6 6 6 6 0.820322 2 3 3 3 4 4 4 4 0.695087 3 7 7 7 7 7 7 7 0.631812 4 1 1 2 1 1 1 1 0.568884 5 4 4 4 4 4 4 4 0.516549 6 1 2 2 1 1 1 1 0.47855 7 6 6 7 6 6 6 6 0.453836
The next step is to assign the Gaussian’s parameter on the table 1 to corresponding fuzzy set in the rule bases on the table 4. It will change the elements of each cell in the rule bases to be the pairs of fuzzy set and it’s Gaussian parameters. The fuzzification in the rule bases is done by assigning each input data to whole of rules in the rule bases. For example, the first row of system input is conducted the fuzzification process on the first rule that will yielded membership degree of its corresponding fuzzy set which the number of membership degree is 6 because there are 6 predictors variables in the system input. Finally, each system input (a row of the matrix input and output pairs where the output variable is excluded) will produce a matrix which its elements are membership degree and the dimension of matrix is 61x6. By using logic operator (AND) on each rule, it is yielded a value on each rule, the matrix become to be a vector with length of 61.
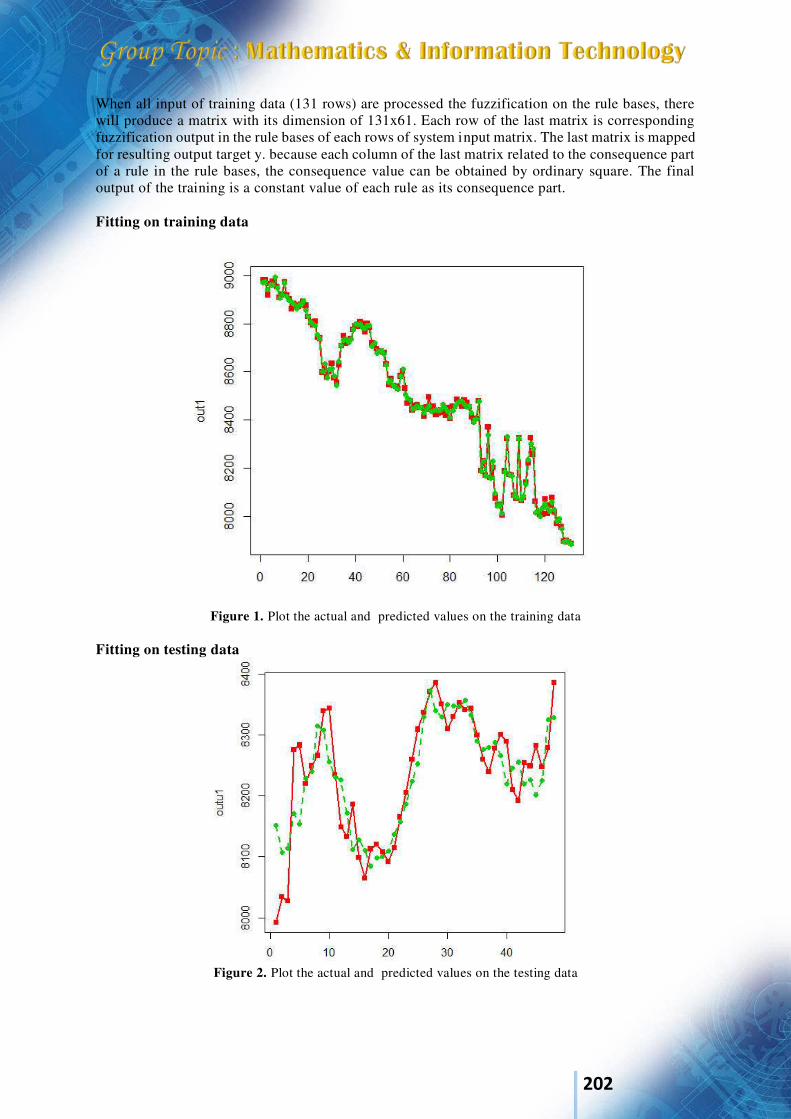
202
When all input of training data (131 rows) are processed the fuzzification on the rule bases, there will produce a matrix with its dimension of 131x61. Each row of the last matrix is corresponding fuzzification output in the rule bases of each rows of system input matrix. The last matrix is mapped for resulting output target y. because each column of the last matrix related to the consequence part of a rule in the rule bases, the consequence value can be obtained by ordinary square. The final output of the training is a constant value of each rule as its consequence part. Fitting on training data
Figure 1. Plot the actual and predicted values on the training data Fitting on testing data
Figure 2. Plot the actual and predicted values on the testing data

203
References
1. S. Handoyo, Marji. The Fuzzy Inference System with Least Square Optimization for Time Series Forecasting. Indonesian Journal ofElectrical Engineering and Computer Science (IJEECS). 2018, Vol. 7(No. 3), pp. 1015-1026.
2. S. Handoyo, Marji, I..N. Purwanto, F. Jie. The Fuzzy Inference System with Rule Bases Generated by using the Fuzzy C-Means to Predict Regional Minimum Wage in Indonesia. International J. of Opers. and Quant. Management (IJOQM). 2018, 24(4):277-292.
3. A. Efendi, S. Handoyo, A.P.S. Prasojo, and Marji. The Implementation Of The Optimal Rule Bases Generated By Hybrid Fuzzy C-Mean And Particle Swarm Optimization”, “ Journal of Theoretical & Applied Information Technology. 2019. 97(16): 4453-4453.
4. H. Kusdarwati, and S. Handoyo, System for Prediction of Non Stationary Time Series based on the Wavelet Radial Bases Function Neural Network Model . Int J Elec & Comp Eng
(IJECE). 2018, Vol. 8(No. 4) pp. 2327-2337. 5. S. Handoyo , H. Kusdarwati. Implementation of Fuzzy Inference System for Classification of
Dengue Fever on the villages in Malang. In IOP Conference Series: Materials Science and Engineering 2019 Jun (Vol. 546, No. 5, p. 052026). IOP Publishing.
6. W.H. Nugroho, S. Handoyo, and Y.J. Akri. An Influence of Measurement Scale of Predictor Variable on Logistic Regression Modeling and Learning Vector Quantization Modeling for Object Classification. International Journal of Electrical and Computer Engineering.
(IJECE), 8(1), 2018, pp: 333-343. 7. H. Kusdarwati, S. Handoyo. Modeling Treshold Liner in Transfer Function to Overcome Non
Normality of the Errors. In IOP Conference Series: Materials Science and Engineering 2019 Jun (Vol. 546, No. 5, p. 052039). IOP Publishing
204
International Conference on Natural Sciences, Mathematics, Applications, Research, and Technology
Manado, Indonesia, 22-23 October 2020
Determination of the status of utilization and effort of mackerel scad (Decapterus spp) caught in the Manado waters North Sulawesi John S. Kekenusa1, Sendy B. Rondonuwu2, Marline S. Paendong1
1, 3 Mathematics Department, Sam Ratulangi University, Manado - North Sulawesi, Indonesia (Email : [email protected], [email protected]) 2 Biology Department, Sam Ratulangi University, Manado - North Sulawes, Indonesia (Email : [email protected]) INTRODUCTION
The simplest model of the dynamics of fish populations is Surplus Production Model (SPM), by treating the fish as a single biomass that can not be divided, which is subject to the rules of simple increases and decreases in biomass. This model, commonly used in the assessment of fish stocks using only the data of catch and fishing effort generally available.
This study aims to get the best SPM, as well as knowing how much the result of maximum sustainable yields (MSY), utilization level, and the level of effort scad mackerel (Decapterus spp) classified as pelagic fishery resource is important and one of the non-oil export commodity in North Sulawesi. Scad mackerel in North Sulawesi (including Manado waters) in 2016 reached 50,000 tons per year, with a value of about 100 billion rupiahs [1]. Research on scad mackerel gererally discuss the exploitation in increase production, not much research on the status of utilization (including aspects of sustainability and efficiency) resources. Data on the level of utilization of the fish resources are very important, as it will determine whether the resource use is less than optimal, optimal, or excessive. Excessive utilization of fish resources would threaten its sustainability. By knowing the level of resource utilization on the scad mackerel, is expected to be done in a planned and suatainable management of scad mackerel in the Manado waters.
The simplest model of the dynamics of fish populations is a surplus production model that treats the fish population as a single biomass that can not be divided, which is subject to the simple rules of the rise and decline. The production model is dependent on the amount of four kinds, namely: biomass population at a given time t (Bt), catches for a certain time t (Ct), fishing effort at a certain time t (Et), and the natural growth rate constant (r) [2]. This model was first developed by Schaefer, who was initially the same as the form of logistic growth model. According to Coppola and Pascoe [3], equation surplus consists of several constants that are affected by natural growth, the ability of fishing gear, and carrying capacity. Constants allegedly using models of biological parameter estimators of surplus production equation, namely the model: Equilibrium Schaefer, Schaefer Disequilibrium, Schnute, and Walter - Hilborn. Based on the four models were selected the most appropriate or best fit of the estimation of others. According to Sparre and Venema [4], formulas surplus production model is valid only if the slope parameter (b) is negative, which means the addition of fishing effort will lead to a decrease in the catch per fishing effort. If the parameter b positive value, then it can not be done estimating the optimum amount of stock and effort, but it can only be concluded that the addition of fishing effort is still possible to increase the catch.
Prediction of optimum fishing effort (Eopt) and the maximum sustainable catch (CMSY) approached the surplus production model. Between the catch per unit of effort (CPUE) and fishing effort can be either linear or exponential relationship [5]. Surplus Production Model consists of two models, namely basic model of Schaefer (linear relationship) and the Gompertz model developed by Fox with forms exponential relationship [5].

205
Surplus production models first developed by Schaefer, who was initially the same as the form of logistic growth model. The model is as follows:
dt
dBt = G(Bt) = r Bt ( 1 - K
Bt ) (1)
This equation does not include the effect of the catching, so Schaefer wrote back to :
dt
dBt = r Bt ( 1 - K
Bt ) - Ct (2)
K is the carrying capacity of the marine environment, and Ct is the catch that can be written as:
Ct = q Et Bt (3) catchability, and Et indicates fishing effort. This equation can be written as:
t
t
E
C = q Bt = CPUE (4)
From the differential equation (2), the optimum catchment can be calculated at the time dt
dBt
= 0, also called settlement at the point of balance (equilibrium), in the form of:
r Bt ( 1 - K
Bt ) - Ct = 0 , or
Ct = r Bt ( 1 - K
Bt ) = q Et Bt
(5) From equation (3) and (5), find value of Bt obtained as follows :
Bt = K ( 1 - r
qEt ) (6)
So that equation (5) becomes :
Ct = q K Et ( 1 - r
qEt )
= q K Et - r
Kq 2
Et2 (7)
Equation (7) is simplified further by Schaefer becomes:
t
t
E
C = a - b Et , or
Ct = a Et - b Et2 (8)
while the a = q K and b =.r
Kq 2
This linear relationship is used widely for calculating CMSY through the determination of the first derivative of Ct with Et to find optimal solutions, both to catch and fishing effort. The first
derivative of Ct to Et is : t
t
dE
dC = a - 2b Et, in order to obtain the alleged Eopt (optimum fishing effort)
and CMSY (maximum sustainable yields) respectively :
Eopt = b
a
2 =
q
r
2 (9)
by entering the value of Eopt in equation (8), will be obtained CMSY as follows: CMSY = a Et - b Et
2

206
= a (b
a
2) - b (
b
a
2)2
= b
a
4
2
by substituting a = qK and b = r
Kq 2
will be obtained,
CMSY = b
a
4
2
= rKq
Kq
/4 2
22
= 4
rK (10)
The values of a and b are estimated by the least squares method approach that is commonly used to estimate the coefficient of a simple regression equation. Furthermore, by including the value of Eopt in equation (6) is obtained optimum biomass (BMSY) as follows :
BMSY = K - optE
r
Kq
= K - r
Kq (
q
r
2)
= K - 2K
=2K
(11)
The values of the parameter q, K, and r can be calculated using the Fox algorithm, as referenced in Sularso [6], as follows:
qt = ln )/(1
/1 1
11
zb
zUb
zU tt
(12)
where z = - (a / b) / E *, E * = (Et + Et + 1) / 2, Ut = t
t
E
C and the value of q is the geometric mean of the
value of qt. From the values of a, b, and q, can then be calculated values of K and r. Model of Fox has several characteristics that are different from the model Schaefer, that it
biomass growth following the Gompertz growth model [7]. The relation of CPUE with effort (E) follows a negative exponential pattern :
Ct = Et . exp(a - b Et) (13) Efforts optimum is obtained by equating the first derivative of Ct to Et equal to zero and find :
Eopt = b
1 (14)
The maximum sustainable yields of catch (CMSY) is obtained by inserting the value of the optimum effort into equation (13), and obtained:
CMSY = b
1 ea-1 (15)
Model of Schnute [8], suggests another version of the surplus production model is dynamic and deterministic. Schnute method is considered as a modification of the model in the form of discrete Schaefer (Roff, 1983, referred by Tinungki) [9],
ln(t
t
U
U 1 ) = r - qK
r (
21 tt UU
) - q (2
1 tt EE)

207
= a - b (2
1 tt UU) - c (
21 tt EE
) (16)
where a = r, b = qK
r, and c = q, is the regression coefficient estimators.
Walter and Hilborn (1976) referred by Tinungki [9], to develop other types of surplus production model, known as the regression model. Walter - Hilborn Model, using a simple differential equation, by the following equation :
t
t
U
U 1 - 1 = r - Kq
rUt - q Et
= a - b Ut - c Et (17)
where a = r, b = Kq
r, and c = q, is the regression coefficient estimators.
Estimation of biological parameters for the surplus production model can also be done through estimation techniques proposed by Clarke, Yoshimoto, and Pooley (CYP) [9, 10]. The parameters which allegedly is r, K, and q, the model is expressed as follows:
)(
2)ln(
22
)ln(22
)ln( 11
tttt EE
r
qU
r
rqK
r
rU (18)
where : r
ra
22
' , )ln(' qKaa , r
rb
22
, r
qc
2
thus equation (18) can be written in the form : )()ln()ln(')ln( 11 tttt EEcUbqKaU
)()ln( 1 ttt EEcUba (19)
RESULTS AND DISCUSSION Catches of scad mackerel fisheries in the Manado waters fluctuate from year to year. Data catching in 1998-2017, are presented in Table 1.
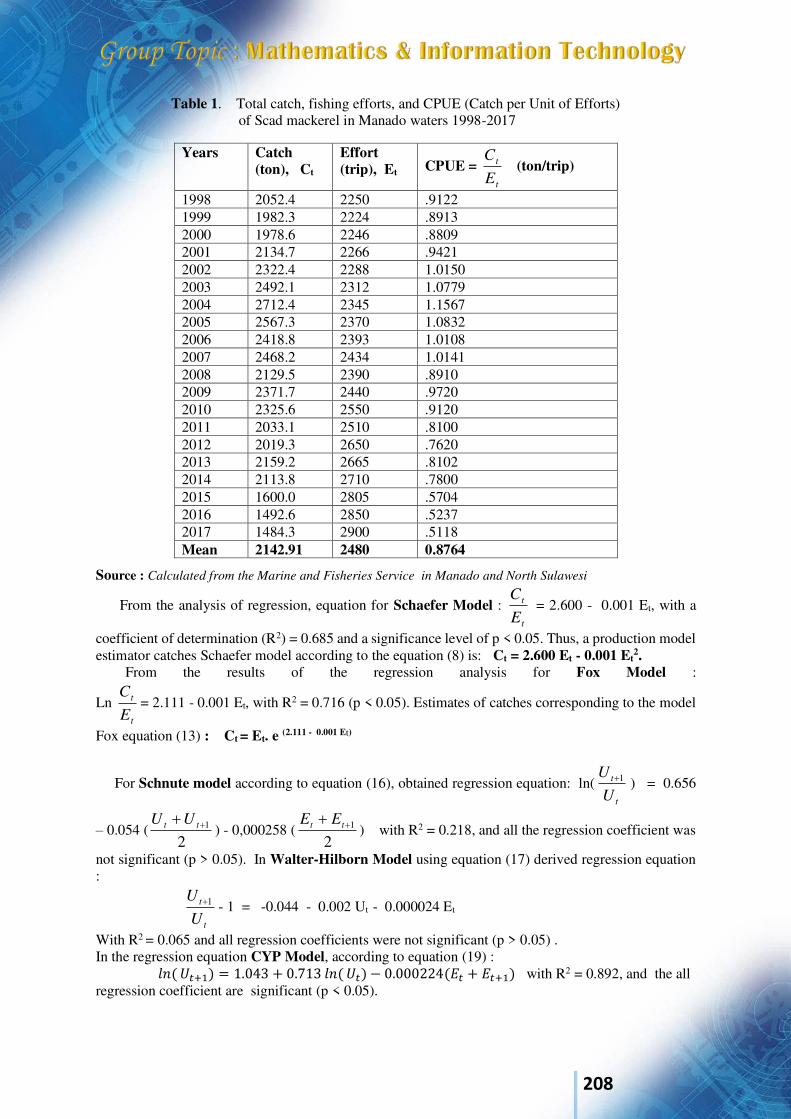
208
Table 1. Total catch, fishing efforts, and CPUE (Catch per Unit of Efforts) of Scad mackerel in Manado waters 1998-2017 Source : Calculated from the Marine and Fisheries Service in Manado and North Sulawesi
From the analysis of regression, equation for Schaefer Model : t
t
E
C = 2.600 - 0.001 Et, with a
coefficient of determination (R2) = 0.685 and a significance level of p < 0.05. Thus, a production model estimator catches Schaefer model according to the equation (8) is: Ct = 2.600 Et - 0.001 Et
2. From the results of the regression analysis for Fox Model :
Ln t
t
E
C= 2.111 - 0.001 Et, with R2 = 0.716 (p < 0.05). Estimates of catches corresponding to the model
Fox equation (13) : Ct = Et. e (2.111 - 0.001 Et)
For Schnute model according to equation (16), obtained regression equation: ln(t
t
U
U 1 ) = 0.656
– 0.054 (2
1 tt UU) - 0,000258 (
21 tt EE
) with R2 = 0.218, and all the regression coefficient was
not significant (p > 0.05). In Walter-Hilborn Model using equation (17) derived regression equation :
t
t
U
U 1 - 1 = -0.044 - 0.002 Ut - 0.000024 Et
With R2 = 0.065 and all regression coefficients were not significant (p > 0.05) . In the regression equation CYP Model, according to equation (19) : 𝑙𝑛( 𝑈𝑡+1) = 1.043 + 0.713 𝑙𝑛( 𝑈𝑡) − 0.000224(𝐸𝑡 + 𝐸𝑡+1) with R2 = 0.892, and the all regression coefficient are significant (p < 0.05).
Years Catch (ton), Ct
Effort (trip), Et CPUE =
t
t
E
C (ton/trip)
1998 2052.4 2250 .9122 1999 1982.3 2224 .8913 2000 1978.6 2246 .8809 2001 2134.7 2266 .9421 2002 2322.4 2288 1.0150 2003 2492.1 2312 1.0779 2004 2712.4 2345 1.1567 2005 2567.3 2370 1.0832 2006 2418.8 2393 1.0108 2007 2468.2 2434 1.0141 2008 2129.5 2390 .8910 2009 2371.7 2440 .9720 2010 2325.6 2550 .9120 2011 2033.1 2510 .8100 2012 2019.3 2650 .7620 2013 2159.2 2665 .8102 2014 2113.8 2710 .7800 2015 1600.0 2805 .5704 2016 1492.6 2850 .5237 2017 1484.3 2900 .5118 Mean 2142.91 2480 0.8764
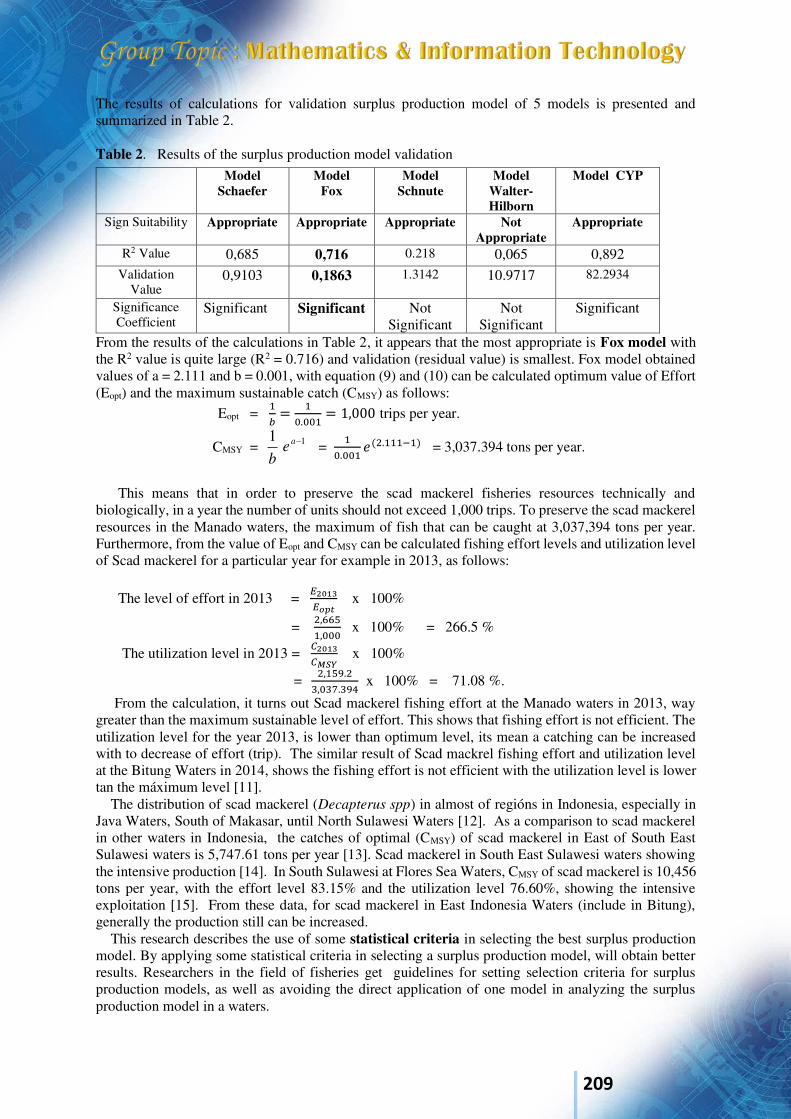
209
The results of calculations for validation surplus production model of 5 models is presented and summarized in Table 2. Table 2. Results of the surplus production model validation
From the results of the calculations in Table 2, it appears that the most appropriate is Fox model with the R2 value is quite large (R2 = 0.716) and validation (residual value) is smallest. Fox model obtained values of a = 2.111 and b = 0.001, with equation (9) and (10) can be calculated optimum value of Effort (Eopt) and the maximum sustainable catch (CMSY) as follows:
Eopt = 1𝑏 = 10.001 = 1,000 trips per year.
CMSY = 11 ae
b = 10.001 𝑒(2.111−1) = 3,037.394 tons per year.
This means that in order to preserve the scad mackerel fisheries resources technically and biologically, in a year the number of units should not exceed 1,000 trips. To preserve the scad mackerel resources in the Manado waters, the maximum of fish that can be caught at 3,037,394 tons per year. Furthermore, from the value of Eopt and CMSY can be calculated fishing effort levels and utilization level of Scad mackerel for a particular year for example in 2013, as follows: The level of effort in 2013 = 𝐸2013𝐸𝑜𝑝𝑡 x 100%
= 2,6651,000 x 100% = 266.5 %
The utilization level in 2013 = 𝐶2013𝐶𝑀𝑆𝑌 x 100%
= 2,159.23,037.394 x 100% = 71.08 %.
From the calculation, it turns out Scad mackerel fishing effort at the Manado waters in 2013, way greater than the maximum sustainable level of effort. This shows that fishing effort is not efficient. The utilization level for the year 2013, is lower than optimum level, its mean a catching can be increased with to decrease of effort (trip). The similar result of Scad mackrel fishing effort and utilization level at the Bitung Waters in 2014, shows the fishing effort is not efficient with the utilization level is lower tan the máximum level [11]. The distribution of scad mackerel (Decapterus spp) in almost of regións in Indonesia, especially in Java Waters, South of Makasar, until North Sulawesi Waters [12]. As a comparison to scad mackerel in other waters in Indonesia, the catches of optimal (CMSY) of scad mackerel in East of South East Sulawesi waters is 5,747.61 tons per year [13]. Scad mackerel in South East Sulawesi waters showing the intensive production [14]. In South Sulawesi at Flores Sea Waters, CMSY of scad mackerel is 10,456 tons per year, with the effort level 83.15% and the utilization level 76.60%, showing the intensive exploitation [15]. From these data, for scad mackerel in East Indonesia Waters (include in Bitung), generally the production still can be increased. This research describes the use of some statistical criteria in selecting the best surplus production model. By applying some statistical criteria in selecting a surplus production model, will obtain better results. Researchers in the field of fisheries get guidelines for setting selection criteria for surplus production models, as well as avoiding the direct application of one model in analyzing the surplus production model in a waters.
Model Schaefer
Model Fox
Model Schnute
Model Walter- Hilborn
Model CYP
Sign Suitability Appropriate Appropriate Appropriate Not Appropriate
Appropriate
R2 Value 0,685 0,716 0.218 0,065 0,892
Validation Value
0,9103 0,1863 1.3142 10.9717
82.2934
Significance Coefficient
Significant Significant Not Significant
Not Significant
Significant

210
Reference [1] [DKP] Dinas Kelautan dan Perikanan Provinsi Sulawesi Utara. 2017. Statistik Perikanan Tangkap
Provinsi Sulawesi Utara Tahun 2016. [2] M. Boer dan K.A. Azis. 1995. Prinsip-prinsip Dasar Pengelolaan Sumberdaya Perikanan Melalui
Pendekatan Bio-Ekonomi. Jurnal Ilmu-ilmu Perairan dan Perikanan III(2):109-119. [3] G. Coppola and S. Pascoe. 1996. A Surplus Production Model with a non-linear Catch-Effort
Relationship. (Research Paper 105) Center for the Economics and Managemant of Aquatic Resources University of Portsmouth.
[4] P. Sparre and S.C. Venema. 1999. Introduksi Pengkajian Stok Ikan Tropis. Buku 1 Manual. (Terjemahan J. Widodo. I.G.S. Merta, S. Nurhakim, dan M. Badrudin). Pusat Penelitian dan Pengembangan Perikanan, Badan Penelitian dan Pengembangan Pertanian (Kerjasama dengan Organisasi Pangan dan Pertanian Perserikatan Bangsa-bangsa). Jakarta. 438 hal.
[5] J.A. Gulland. 1983. Fishing and Stock of Fish at Iceland. Mui.`Agric. Fish Food, Invest. (Ser.2)
23(4): 52 – 70. [6] A. Sularso. 2005. Alternatif Pengelolaan Perikanan Udang di Laut Arafura. Disertasi (Tidak
Dipublikasikan). Sekolah Pascasarjana Institut Pertanian Bogor. Bogor. 130 hal. [7] W.W. Fox. 1970. An Exponential Surplus Yield Model for Optimazing Exploited Fish Population.
Trans. Am. Fish Soc. 99(1):80-88. [8] J. Schnute. 1977. Improved Estimates from the Schaefer Production Models : Theoretical
Considerations : J. Fish. Res. Board Can., 34:583-663. [9] G.M. Tinungki. 2005. Evaluasi Model Produksi Surplus dalam Menduga Hasil Tangkapan
Maksimum Lestari untuk Menunjang Pengelolaan Perikanan Lemuru Di Selat Bali. Disertasi (Tidak Dipublikasikan). Sekolah Pascasarjana Institut Pertanian Bogor. Bogor. 207 hal.
[10] A. Fauzi dan S. Anna. 2005. Pemodelan Sumberdaya Perikanan dan Kelautan untuk Analisis Kebijakan. PT. Gramedia Pustaka Utama, Jakarta
[11] J.S. Kekenusa, S. B. Rondonuwu, and M. S. Paendong. 2019. Determination of the Utilization and effort level of Mackerel Scad (Decapterus spp) in Bitung Waters North Sulawesi. Sci. J. of Applied Mathematics and Statistics 2019; 7(6):103-111.
[12] Sumarsono dan A. Zamroni. 2013. Sebaran Unit Stok Ikan Layang (Decapterus spp) dan Risiko PengelolaanIkan Pelagis Kecil di Laut Jawa. Jurnal Kebijakan perikanan Indonesia. Vol 5 No.1 Mei 2013:17-24.
[13] Safrudin. 2013. Distribusi Ikan Layang (Decapterus spp) Hubungannya dengan Kondisi Oseanografi di Perairan Kabupaten Pangkep Sulawesi Selatan. Torani (Jurnal Ilmu Kelautan dan Perikanan). Vol 23(3) Des 2013:150-156.
[14] Mahmud, A., R.L. Bubun. 2015. Potensi Lestari Ikan Layang (Decapterus spp) Berdasarkan Hasil Tangkapan Pukat Cincin di Perairan Timur Sulawesi Tenggara. Jurnal Teknologi Perikanan dan Kelautan Vol 6 No 2 2015:159-168. E-journal http://dx.doi.org/10.24319/jtpk.6 10 Agustus 2018.
[15] Latukonsina, H. 2010. Pendugaan Potensi dan Tingkat Pemanfaatan Ikan Layang (Decapterus spp) di Perairan Laut Flores Sulawesi Selatan. Jurnal Ilmiah Agribisnis dan Perikanan. Vol 3 Ed 2 Okt 2010. Http://ejournal.stipwunaraha.ac.id 09 Agustus 2018.
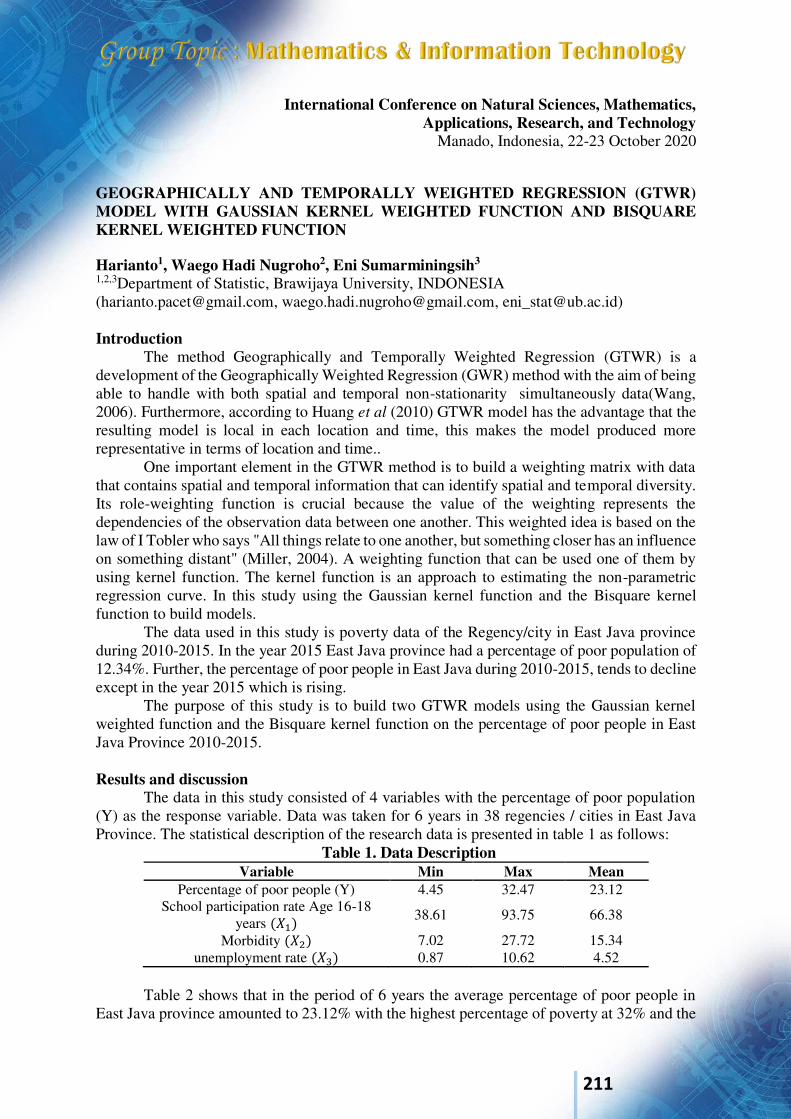
211
International Conference on Natural Sciences, Mathematics, Applications, Research, and Technology
Manado, Indonesia, 22-23 October 2020 GEOGRAPHICALLY AND TEMPORALLY WEIGHTED REGRESSION (GTWR) MODEL WITH GAUSSIAN KERNEL WEIGHTED FUNCTION AND BISQUARE KERNEL WEIGHTED FUNCTION
Harianto1, Waego Hadi Nugroho2, Eni Sumarminingsih3 1,2,3Department of Statistic, Brawijaya University, INDONESIA ([email protected], [email protected], [email protected]) Introduction
The method Geographically and Temporally Weighted Regression (GTWR) is a development of the Geographically Weighted Regression (GWR) method with the aim of being able to handle with both spatial and temporal non-stationarity simultaneously data(Wang, 2006). Furthermore, according to Huang et al (2010) GTWR model has the advantage that the resulting model is local in each location and time, this makes the model produced more representative in terms of location and time..
One important element in the GTWR method is to build a weighting matrix with data that contains spatial and temporal information that can identify spatial and temporal diversity. Its role-weighting function is crucial because the value of the weighting represents the dependencies of the observation data between one another. This weighted idea is based on the law of I Tobler who says "All things relate to one another, but something closer has an influence on something distant" (Miller, 2004). A weighting function that can be used one of them by using kernel function. The kernel function is an approach to estimating the non-parametric regression curve. In this study using the Gaussian kernel function and the Bisquare kernel function to build models.
The data used in this study is poverty data of the Regency/city in East Java province during 2010-2015. In the year 2015 East Java province had a percentage of poor population of 12.34%. Further, the percentage of poor people in East Java during 2010-2015, tends to decline except in the year 2015 which is rising.
The purpose of this study is to build two GTWR models using the Gaussian kernel weighted function and the Bisquare kernel function on the percentage of poor people in East Java Province 2010-2015. Results and discussion
The data in this study consisted of 4 variables with the percentage of poor population (Y) as the response variable. Data was taken for 6 years in 38 regencies / cities in East Java Province. The statistical description of the research data is presented in table 1 as follows:
Table 1. Data Description Variable Min Max Mean
Percentage of poor people (Y) 4.45 32.47 23.12 School participation rate Age 16-18
years (𝑋1) 38.61 93.75 66.38
Morbidity (𝑋2) 7.02 27.72 15.34 unemployment rate (𝑋3) 0.87 10.62 4.52
Table 2 shows that in the period of 6 years the average percentage of poor people in
East Java province amounted to 23.12% with the highest percentage of poverty at 32% and the
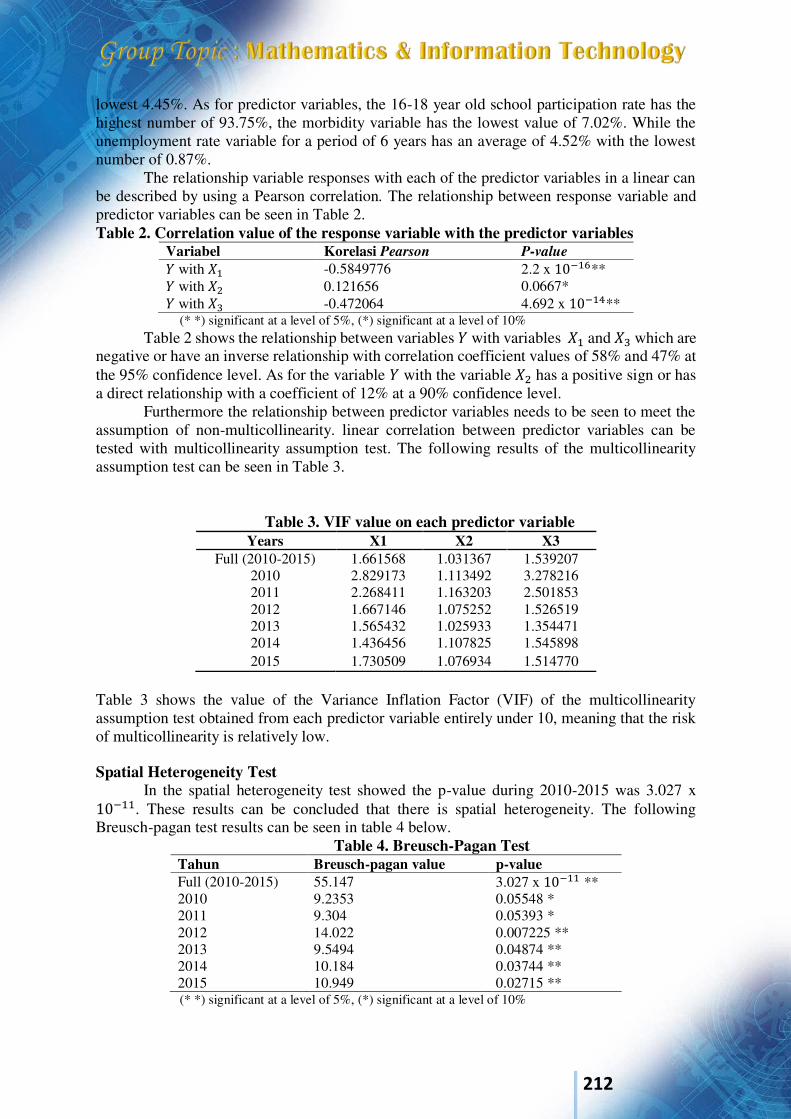
212
lowest 4.45%. As for predictor variables, the 16-18 year old school participation rate has the highest number of 93.75%, the morbidity variable has the lowest value of 7.02%. While the unemployment rate variable for a period of 6 years has an average of 4.52% with the lowest number of 0.87%.
The relationship variable responses with each of the predictor variables in a linear can be described by using a Pearson correlation. The relationship between response variable and predictor variables can be seen in Table 2. Table 2. Correlation value of the response variable with the predictor variables
Variabel Korelasi Pearson P-value 𝑌 with 𝑋1 -0.5849776 2.2 x 10⁻¹⁶** 𝑌 with 𝑋2 0.121656 0.0667* 𝑌 with 𝑋3 -0.472064 4.692 x 10⁻¹⁴** (* *) significant at a level of 5%, (*) significant at a level of 10%
Table 2 shows the relationship between variables 𝑌 with variables 𝑋1 and 𝑋3 which are negative or have an inverse relationship with correlation coefficient values of 58% and 47% at the 95% confidence level. As for the variable 𝑌 with the variable 𝑋2 has a positive sign or has a direct relationship with a coefficient of 12% at a 90% confidence level.
Furthermore the relationship between predictor variables needs to be seen to meet the assumption of non-multicollinearity. linear correlation between predictor variables can be tested with multicollinearity assumption test. The following results of the multicollinearity assumption test can be seen in Table 3.
Table 3. VIF value on each predictor variable Years X1 X2 X3
Full (2010-2015) 1.661568 1.031367 1.539207 2010 2.829173 1.113492 3.278216 2011 2.268411 1.163203 2.501853 2012 1.667146 1.075252 1.526519 2013 1.565432 1.025933 1.354471 2014 1.436456 1.107825 1.545898 2015 1.730509 1.076934 1.514770
Table 3 shows the value of the Variance Inflation Factor (VIF) of the multicollinearity assumption test obtained from each predictor variable entirely under 10, meaning that the risk of multicollinearity is relatively low.
Spatial Heterogeneity Test
In the spatial heterogeneity test showed the p-value during 2010-2015 was 3.027 x 10⁻¹¹. These results can be concluded that there is spatial heterogeneity. The following Breusch-pagan test results can be seen in table 4 below.
Table 4. Breusch-Pagan Test Tahun Breusch-pagan value p-value Full (2010-2015) 55.147 3.027 x 10⁻¹¹ ** 2010 9.2353 0.05548 * 2011 9.304 0.05393 * 2012 14.022 0.007225 ** 2013 9.5494 0.04874 ** 2014 10.184 0.03744 ** 2015 10.949 0.02715 ** (* *) significant at a level of 5%, (*) significant at a level of 10%
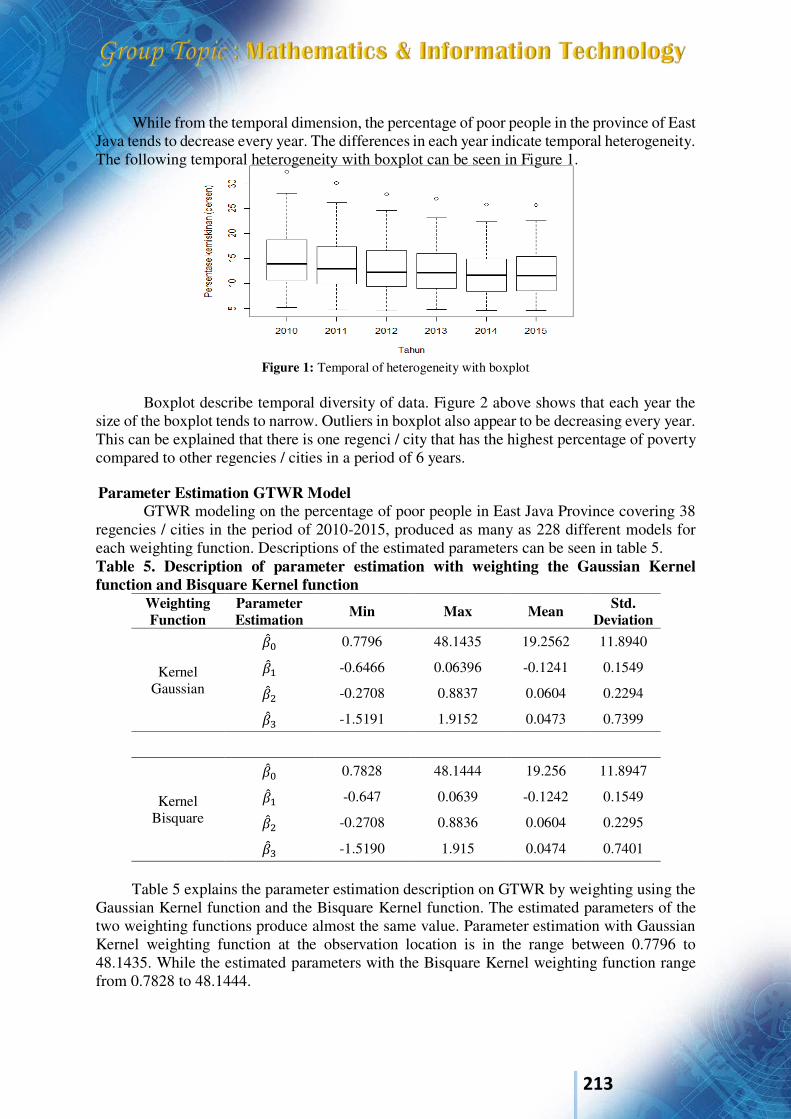
213
While from the temporal dimension, the percentage of poor people in the province of East
Java tends to decrease every year. The differences in each year indicate temporal heterogeneity. The following temporal heterogeneity with boxplot can be seen in Figure 1.
Figure 1: Temporal of heterogeneity with boxplot Boxplot describe temporal diversity of data. Figure 2 above shows that each year the
size of the boxplot tends to narrow. Outliers in boxplot also appear to be decreasing every year. This can be explained that there is one regenci / city that has the highest percentage of poverty compared to other regencies / cities in a period of 6 years.
Parameter Estimation GTWR Model
GTWR modeling on the percentage of poor people in East Java Province covering 38 regencies / cities in the period of 2010-2015, produced as many as 228 different models for each weighting function. Descriptions of the estimated parameters can be seen in table 5. Table 5. Description of parameter estimation with weighting the Gaussian Kernel function and Bisquare Kernel function
Weighting Function
Parameter Estimation
Min Max Mean Std. Deviation
Kernel Gaussian
�̂�0 0.7796 48.1435 19.2562 11.8940 �̂�1 -0.6466 0.06396 -0.1241 0.1549 �̂�2 -0.2708 0.8837 0.0604 0.2294 �̂�3 -1.5191 1.9152 0.0473 0.7399
Kernel Bisquare
�̂�0 0.7828 48.1444 19.256 11.8947 �̂�1 -0.647 0.0639 -0.1242 0.1549 �̂�2 -0.2708 0.8836 0.0604 0.2295 �̂�3 -1.5190 1.915 0.0474 0.7401
Table 5 explains the parameter estimation description on GTWR by weighting using the
Gaussian Kernel function and the Bisquare Kernel function. The estimated parameters of the two weighting functions produce almost the same value. Parameter estimation with Gaussian Kernel weighting function at the observation location is in the range between 0.7796 to 48.1435. While the estimated parameters with the Bisquare Kernel weighting function range from 0.7828 to 48.1444.
214
In the predictor variable, the two weighting functions have the same average ie the school participation rate of 16-18 years old has a negative average value. This means that every time there is a decrease in the participation rate of schools aged 16-18 years will cause an increase in the percentage of the poor population in East Java. while the average morbidity and unemployment rate has a positive average value which means that each increase in morbidity and unemployment will cause an increase in the percentage of poor people in East Java
The value of 𝑅2 on the GTWR model using the two weighting functions is also almost the same. The Gaussian Kernel weighting function has an 𝑅2 value of 98.994% and the Bisquare Kernel weighting function has an 𝑅2 value of 98.987%.
Keywords: Bisquare Kernel function, Gaussian kernel function, Geographically and
Temporally weighted regression, Weighted least square, Percentage of poor people
References 1. Anselin, L. 1988. Spatial Econometrics: Methods and Models. Kluwer Academic
Publishers. Netherlands. 2. Badan Pusat Statistik Jawa Timur. 2020. Konsep Kemiskinan. Surabaya. 3. Badan Pusat Statistik Jawa Timur. 2020. Konsep Kesehatan. Surabaya. 4. Badan Pusat Statistik Jawa Timur. 2020. Konsep Pendidikan. Surabaya. 5. Badan Pusat Statistik Jawa Timur. 2020. Konsep Tenaga Kerja. Surabaya. 6. Brunsdon C, Fotheringham AS, Charlton M. 1999. Some Notes on Parametric
Significance Test for Geographically Weighted Regression. Journal of Regional Science. 39 (3) : 497-524.
7. Fotheringham AS, Crespo R, Yao J. 2015. Geographically and Temporally Weighted
Regression (GTWR). Geographical Analysis. The Ohio State University : Hlm 1-22. 8. Huang B, Wu B, Barry M. 2010. Geographically and Temporally Weighted Regression
for Modeling Spatio-Temporal Variation in House Prices. International Journal of Geographical Information Science. 24 (3) : 383-401.
9. Liu, J., Zhao, Y., Yang, Y., Xu, S., Zhang, F., Zhang, X., Shi, L., Qiu, A. 2017. A Mixed
Geographically and Temporally Weighted Regression: Exploring Spatial-Temporal
Variations from Global and Local Perspectives. Article Entropy MDPI. 53 (19) : 1-20. 10. Mei, C.I. 2005. Geographically Weighted Regression Technique for Spatial Data
Analysis. School of Science Xi’an, Jiaotong University. 11. Miller, H. J., 2004. Tobler’s First Law and Spatial Analysis. Annals of the Association
of America Geographers, 94(2), hal.284-289. 12. Wang, P. 2006. Exploring spatial effects on housing price: the case study of the city of
Calgary. Master dissertation. University of Calgary, Canada.
215
International Conference on Natural Sciences, Mathematics, Applications, Research, and Technology
Manado, Indonesia, 22-23 October 2020
Modeling Spatial Variation of Money Laundering Crime in Indonesia Using Geographically Weighted Multinomial Logistic Regression A. Yulia1, S. Astutik2 and U. Sa’adah3 1,2Faculty of Mathematics and Natural Sciences, Brawijaya University, INDONESIA. (E-mail: [email protected], [email protected]) 3 Faculty of Mathematics and Natural Sciences, Brawijaya University, INDONESIA. (E-mail: [email protected]) INTRODUCTION This document presents the mapping of crime in Indonesia. Crime is a real threat that needs to be optimally handled which increases significantly and it is very detrimental to the country's economy. The crime that occurred created another more serious crime, namely Money Laundering Crime. The impact of Money Laundering Crime is the flow of illicit fund through the payment system to financial service providers as well as providers of goods and services. The perpetrator of Money Laundering crime is a player who is shrewd and familiar with the state financial system, so that the flow of funds does not involve a region but will expand to other areas in a country. This study analyses the spatial variations in the factors causing the Money Laundering crime in Indonesia by using a Geographically Weighted Multinomial Logistic Regression (GWMLR) technique. RESULTS AND DISCUSSION Money Laundering is an act of any person who places, transfers, switches, spends, pays, grants, entrusts, carries funds abroad, changes forms, exchanges currency or securities or other acts of assets that he knows or should suspect constitutes proceeds of predicate offenses with the aim of hiding or disguising the origin of said assets1. Criminal cases in this document use spatial data, namely data on the occurrence of crimes from 34 provinces in Indonesia. In spatial data, regression analysis began to be developed by considering the effect of location or geographic location, which was later called the GWR (model Geographically Weighted Regression)2. GWMLR (Geographically Weighted Multinomial Logistic Regression) is a combination of GWR and multinomial logistic regression which is a logistic regression using response variables from more than two categories with a nominal scale3. In this document, the GWMLR method is used to model the Money Laundering Crime and its explanatory variables by considering the effect of geographic location using the Adaptive Kernel
1 Law No. 8/2020 concerning about Preventing and Eradicating of Money Laundering Crime 2 Brunsdon, dkk. 1996. Geographically Weighted Regression : A Method for Exploring Spatial Nonstationary 3 Luo and Kanala. 2008. Modeling Urban Growth with Geographically Weighted Multinomial Logistic Regression. The
Built Environment and Its Dynamics

216
weighting function. The response variables were divided into four categories with nominal scales by combining the general criminal case and money laundering crime. The model approach GWMLR examines the factors that influence poverty, unemployment rates, population density, higher education enrollment rates, per capita expenditure, human development index, and households having access to decent housing. Furthermore, the province is grouped based on predictor variables that have a significant effect. From the results of this grouping, it is found that the mapping of the distribution of areas has a significant influence on the Criminal Case of Money Laundering in Indonesia. Keywords: GWMLR, Regression, Spatial, Money Laundering, Crime. References
1. Law No. 8/2020 concerning about Preventing and Eradicating of Money Laundering Crime; 2. Brunsdon, C., Fotheringham, A.S., and Charlton, M. E. 1996. Geographically Weighted
Regression : A Method for Exploring Spatial Nonstationary. Ohio State University Press. 3. Luo, J. dan Kanala, N. K. 2008. Modeling Urban Growth with Geographically Weighted
Multinomial Logistic Regression. The Built Environment and Its Dynamics. Proc of SPIE. Vol. 7144.
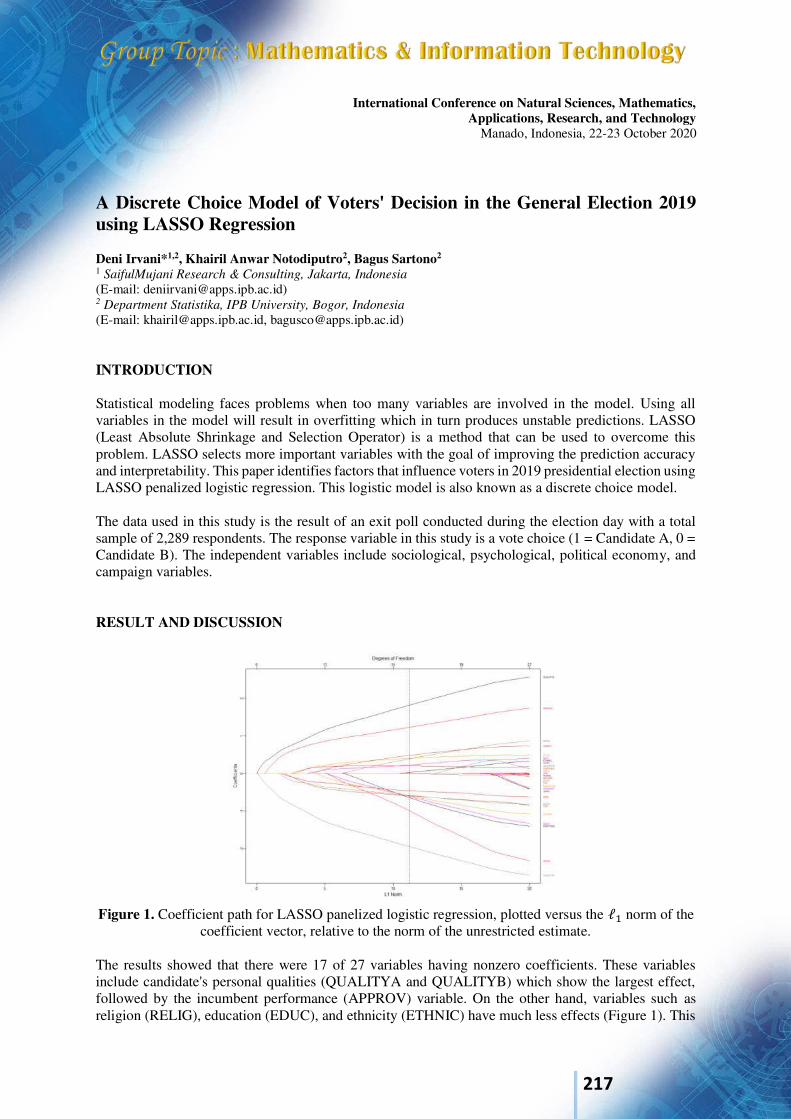
217
International Conference on Natural Sciences, Mathematics, Applications, Research, and Technology
Manado, Indonesia, 22-23 October 2020
A Discrete Choice Model of Voters' Decision in the General Election 2019 using LASSO Regression Deni Irvani*1,2, Khairil Anwar Notodiputro2, Bagus Sartono2 1 SaifulMujani Research & Consulting, Jakarta, Indonesia
(E-mail: [email protected]) 2 Department Statistika, IPB University, Bogor, Indonesia (E-mail: [email protected], [email protected]) INTRODUCTION Statistical modeling faces problems when too many variables are involved in the model. Using all variables in the model will result in overfitting which in turn produces unstable predictions. LASSO (Least Absolute Shrinkage and Selection Operator) is a method that can be used to overcome this problem. LASSO selects more important variables with the goal of improving the prediction accuracy and interpretability. This paper identifies factors that influence voters in 2019 presidential election using LASSO penalized logistic regression. This logistic model is also known as a discrete choice model. The data used in this study is the result of an exit poll conducted during the election day with a total sample of 2,289 respondents. The response variable in this study is a vote choice (1 = Candidate A, 0 = Candidate B). The independent variables include sociological, psychological, political economy, and campaign variables. RESULT AND DISCUSSION
Figure 1. Coefficient path for LASSO panelized logistic regression, plotted versus the ℓ1 norm of the
coefficient vector, relative to the norm of the unrestricted estimate.
The results showed that there were 17 of 27 variables having nonzero coefficients. These variables include candidate's personal qualities (QUALITYA and QUALITYB) which show the largest effect, followed by the incumbent performance (APPROV) variable. On the other hand, variables such as religion (RELIG), education (EDUC), and ethnicity (ETHNIC) have much less effects (Figure 1). This
218
implies that the psychological and political economy factors played more important role than the sociological factor in determining voters’s decision. Based on this finding the prospective candidate in the future election should focus their campaign strategy on enhancing positive images (empathy, integrity and capability) as well as offering better programs to convince voters. Keywords: lasso, logistic regression, presidential election, vote choice, voting behavior Acknowledgment The authors would like to thank SMRC, IPB University, and all persons who contributed to the improvement of this paper: Muhlis Ardiansyah, Etis Sunandi, Asep Rusyana, Alona Dwinata, Embay Rohaeti. References 1. Cantoni E and Pons V. (2019). Does Context Trump Individual Drivers of Voting Behavior?
Evidence from U.S. Movers. Harvard Business School Working Paper 19-025. 2. Chen S, Notodiputro KA, Rahardiantoro S. (2019). Penerapan Analisis LASSO dan Group LASSO
dalam Mengindentifikasi Faktor-faktor yang Berhubungan dengan Tuberkulosis di Jawa Barat. Indonesian Journal of Statistics and Its Applications 4(1).
3. Efron B dan Tibshirani R. (1993). An Introduction to the Bootstrap. Chapman & Hall, London. 4. Friedman J, Hastie T, Tibshirani R. (2010). Regularization Paths for Generalized Linear Models
via Coordinate Descent. Journal of Statistical Software, 33(1), 1-22. 5. Hastie T, Tibshirani R, Wainwright M. 2016. Statistical Learning with Sparsity. Florida (US): CRC
Press. 6. Hillygus DS. (2010). Campaign Effects on Vote Choice. in Oxford Handbook of American
Elections and Political Behavior, ed. JE Leighley, pp. 326–45. Oxford, UK: Oxford Univ. Press. 7. Kristensen JB, Albrechtsen T, Dahl-Nielsen E, Jensen M, Skovrind M, Bornakke T. (2017).
Parsimonious data: How a single Facebook like predicts voting behavior in multiparty systems. PLoS ONE, 12(9): e0184562.
8. Mujani S, Liddle RW, Ambardi K. (2018). Voting behavior in Indonesia since democratization:
critical democrats. Cambridge University Press, Cambridge. 9. Peterson DAM. (2009). Campaign Learning and Vote Determinant. American Journal of Political
Science, Vol. 53, No. 2, Pp. 445-460. 10. Tibshirani R. (1996). Regression shrinkage and selection via the LASSO. Journal of the Royal
Statistical Society, Series B (Methodological). 58(1):267-288. 11. Zimmermann F and Kohring M. (2019). Mistrust, Disinforming News, and Vote Choice: A Panel
Survey on the Origins and Consequences of Believing Disinformation in the 2017 German Parliamentary Election. Political Communication, 37:215–237
219
International Conference on Natural Sciences, Mathematics, Applications, Research, and Technology
Manado, Indonesia, 22-23 October 2020
STUDY ON GENERALIZED PREFER-OPPOSITE (GPO) ALGORITHM FOR CONSTRUCTION THE DE BRUIJN BINARY SEQUENCE Aisyah Nooravieta Setiawan1, Mulia Astuti2, and Zulfia Memi Mayasari3
1,2,3 Department of Mathematics, Faculty of Mathematics and Natural Science, University of Bengkulu, Indonesia. (Email: [email protected], [email protected], [email protected]) INTRODUCTION The advancement of information technology in the millennial era allows us to access and input data on a national or international scale, private or public, and visual or audio form. Therefore, we need a security for assets, especially those related to the secrets of a state, agency or something that is private. This is the starting point for the development of data security systems. Cryptography is defined as a mathematical study related to information security such as secrecy, data integrity, systems, message authentication, tagging and validation and so on [10]. In the field of cryptography there is a sequence, called the de Bruijn sequence that firstly introduced by De Bruijn in 1946, which can be used to produce information that has a security quantity. This sequence combines the alphabet zero and one. The binary sequence de Bruijn 𝑆𝑛 of order 𝑛, is a string of bit 𝑠𝑖 ∈ {0,1} = {𝑠1, … , 𝑠2𝑛}, so that any string of length 𝑛, {𝑎1, … , 𝑎𝑛} ∈ {0,1}𝑛, appears exactly once. De bruijn states that there are 22𝑛−1−𝑛 kinds of binary sequences de bruijn of order n [3]. De Bruijn binary sequence can be built by using the Generalized Prefer-Opposite (GPO) algorithm [3]. The GPO algorithm is based on the Feedback Shift Register (FSR), which is a clock-regulated circuit with 𝑛 sequential storage units. In running the algorithm, we need input consisting of the feedback function 𝑓(𝑥0, 𝑥1, … , 𝑥𝑛−1) and initial state 𝒃 = 𝑏0, 𝑏1, … , 𝑏𝑛−1. There are many combinations of feedback functions and initial conditions that can be used, then grouped into three families namely family one, family two and family three [3]. The purpose of this research is studying the GPO algorithm which use the feedback function from family two 𝑓(𝑥0, . . , 𝑥𝑛−1) = 1 + ∏ 𝑥𝑖𝑛−1𝑖=𝑡 , 0 < 𝑡 < 𝑛, 𝑡 = 2 , 𝑛 = 4 and initial state 𝑏 = 1100 in constructing the de Bruijn binary sequence. RESULTS AND DISCUSSION In this section, it is shown that with the Generalized Prefer-Opposite (GPO) algorithm where the feedback function used is the family two 𝑓(𝑥0, . . , 𝑥𝑛−1) = 1 + ∏ 𝑥𝑖𝑛−1𝑖=𝑡 , 0 < 𝑡 < 𝑛, 𝑡 = 2 , 𝑛 = 4 and initial state 𝑏 = 1100, de Bruijn binary sequence can be constructed. Running Algorithm GPO on input 𝑓 and 𝑏 = 1110 yields the following sequence of states : b=1100→1000→0000→0001→0010→0100→1001→0011→0111→1111→1110→1101→1010→0101→1011→0110→1100. We obtain that the de Bruijn sequence of order 4 is 𝑺𝟒 ∶= (1100 0010 0111 1010).

220
Keywords: De Bruijn Binary Sequence, Prefer-Opposite Algorithm. Acknowledgment References 1. Bondy, J.A and Murty, U.S.R., 1976, Graph Theory with Application, Elsevier Science, United State
of America. 2. Bruijn, N.G.D., 1946, A Combinatorial Problem, Proc. Kon. Ned. Akad. Wet, Vol. 49, pp.758-764. 3. Chang, Z., Ezerman, M.F., Fahreza, A.A., 2019, On Greedy Algorithm for Binary de Bruijn
Sequences, Diakses pada tanggal 17 Febuari 2020. https://arxiv.org/abs/1902.08744v1. 4. Edgar, G dan Michel, M., 1998, Discrete Mathematics with Graph Theory, Prentice Hall, United
State of America. 5. Golomb, S.W., 2017, Shift Register Sequences 3rd Edition, World Scientific. United State of
America. 6. Martin, M and Moreno, E., 2004, Minimal Eulerian Trail in a Labeled Digraph, LATIN 2006:
Theoretical Informatics, Vol.3887, pp.737-744. 7. Rouhonen, K., 2008, Graph Theory, (translated by : Janne Tamminen, Kung-Chung Lee and Robert
Piche), Tampere University of Technology, Tampere. 8. Song, H.Y., 2003, Feedback Shift Register Sequences, Wiley Encyclopedia of Telecommunication,
Vol.1, pp.789-801. 9. Suwanty dan Pribadi,O., 2015, Metode AVL Tree untuk Penyeimbangan Binary Tree, TIMES,
Vol.4, pp.61-65. 10. Trappe, W dan Washinggton, L., 2006, Introduction to Cryptography with Coding Theory, Prentice
Hall, London. 11. Tutte,W., 2001, Graph Theory, Cambridge University Press, Britania Raya.
221
International Conference on Natural Sciences, Mathematics, Applications, Research, and Technology
Manado, Indonesia, 22-23 October 2020
COVID-19 Mathematical Epidemic Model for Impact Analysis of Large Scale Social Restriction: The Case Study of Indonesia Utti Marina Rifanti1, Atika Ratna Dewi2, Nurlaili1, Santika Tri Hapsari1
1Department of Telecommunication and Electrical Engineering, Institut Teknologi Telkom Purwokerto, D.I Panjaitan 128 Purwokerto, INDONESIA. 2Department of Informatics Engineering, Institut Teknologi Telkom Purwokerto, D.I Panjaitan 128 Purwokerto, INDONESIA. (Corresponding author: [email protected]) INTRODUCTION Coronavirus disease 2019 (COVID-19) from Wuhan, China, is an infectious disease caused by Severe Acute Respiratory Syndrome Coronavirus 2 (SARS-CoV-2)[1]. It has spread widely to 215 countries in the world. Till September 15, 2020, there have been 28.918.900 confirmed cases of COVID-19, including 922.252 deaths, reported to WHO. There have been 218.382 confirmed cases of COVID-19, including 8.723 deaths in Indonesia [2]. The first confirmed positive COVID-19 case in Indonesia was announced on March 2, 2020, by President Joko Widodo [3]. At that time, the Indonesian Government implemented a lockdown policy under Law Number 6 of 2018 on Health Quarantine in anticipation of the spread of COVID-19 [4]. To fight Covid-19, the Indonesian Government modified the lockdown policy to become a large-scale social restriction (LSSR) according to the pandemic level in each region. The LSSR was implemented in DKI Jakarta on April 10, 2020, the epicenter of the Covid-19 outbreak in Indonesia. Technically, the types of community activities regulated in the LSSR Guidelines for the acceleration of handling COVID-19 include dismissing schools (school from home) and workplaces (work from home), restrictions on religious, public places, and socio-cultural activities, and restrictions on transportation modes. After three months of passing through the emergency response period and LSSR, the Indonesia Government began to explore implementing a new normal life and loosening the LSSR [5]. In this study, we proposed SIHR (Susceptible-Infected-Hospitalized-Recovered) model to analyze the impact of LSSR on epidemic conditions and predict the long-term dynamic COVID-19 in Indonesia. This study extends the SIR model by adding a hospitalized. Then we simulate the results about advancing or postponing, reinforcing, or weakening relevant systems. Through mapping the containment policies into measurable interval coefficients to observe their influence on the epidemic, the results of our model introduce statistical pieces of evidence that such systems can effectively suppress or even block the outbreak of COVID-19. RESULTS AND DISCUSSION Several studies have been conducted to study the spread of COVID-19. Mathematical models have been proposed by authors in their research in several countries, such as China [6], India [7], Italy [8], Mexico [9], Indonesia [11] [12][13]. The compartment model uses a system of differential equations that tracks the population as a function of time and groups them into different groups based on infection status. The purpose of this study was to analyze the impact of LSSR on epidemic conditions and predict the long-term dynamic COVID-19 in Indonesia. To achieve this goal, we divide the human population into four categories based on their health status as follows
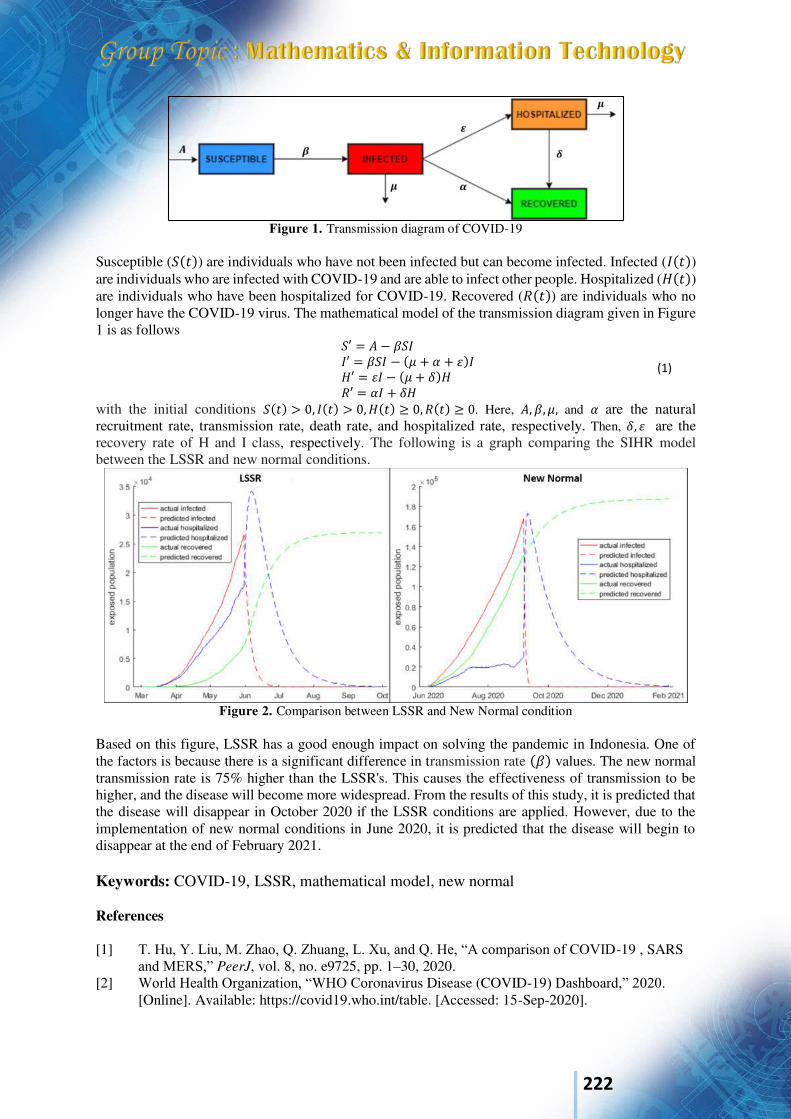
222
(1)
Figure 1. Transmission diagram of COVID-19
Susceptible (𝑆(𝑡)) are individuals who have not been infected but can become infected. Infected (𝐼(𝑡)) are individuals who are infected with COVID-19 and are able to infect other people. Hospitalized (𝐻(𝑡)) are individuals who have been hospitalized for COVID-19. Recovered (𝑅(𝑡)) are individuals who no longer have the COVID-19 virus. The mathematical model of the transmission diagram given in Figure 1 is as follows 𝑆′ = 𝐴 − 𝛽𝑆𝐼 𝐼′ = 𝛽𝑆𝐼 − (𝜇 + 𝛼 + 𝜀)𝐼 𝐻′ = 𝜀𝐼 − (𝜇 + 𝛿)𝐻 𝑅′ = 𝛼𝐼 + 𝛿𝐻 with the initial conditions 𝑆(𝑡) > 0, 𝐼(𝑡) > 0, 𝐻(𝑡) ≥ 0, 𝑅(𝑡) ≥ 0. Here, 𝐴, 𝛽, 𝜇, and 𝛼 are the natural recruitment rate, transmission rate, death rate, and hospitalized rate, respectively. Then, 𝛿, 𝜀 are the recovery rate of H and I class, respectively. The following is a graph comparing the SIHR model between the LSSR and new normal conditions.
Figure 2. Comparison between LSSR and New Normal condition
Based on this figure, LSSR has a good enough impact on solving the pandemic in Indonesia. One of the factors is because there is a significant difference in transmission rate (𝛽) values. The new normal transmission rate is 75% higher than the LSSR's. This causes the effectiveness of transmission to be higher, and the disease will become more widespread. From the results of this study, it is predicted that the disease will disappear in October 2020 if the LSSR conditions are applied. However, due to the implementation of new normal conditions in June 2020, it is predicted that the disease will begin to disappear at the end of February 2021. Keywords: COVID-19, LSSR, mathematical model, new normal References [1] T. Hu, Y. Liu, M. Zhao, Q. Zhuang, L. Xu, and Q. He, “A comparison of COVID-19 , SARS
and MERS,” PeerJ, vol. 8, no. e9725, pp. 1–30, 2020. [2] World Health Organization, “WHO Coronavirus Disease (COVID-19) Dashboard,” 2020.
[Online]. Available: https://covid19.who.int/table. [Accessed: 15-Sep-2020].

223
[3] R. Nuraini, “Kasus Covid-19 Pertama, Masyarakat Jangan Panik,” Portal Informasi Indonesia, 2020. [Online]. Available: https://indonesia.go.id/narasi/indonesia-dalam-angka/ekonomi/kasus-covid-19-pertama-masyarakat-jangan-panik. [Accessed: 11-Sep-2020].
[4] N. R. Yunus and A. Rezki, “Kebijakan Pemberlakuan Lockdown Sebagai Antisipasi Penyebaran Corona Virus Covid-19,” J. Sos. dan Budaya Syar-i, vol. 7, no. 3, pp. 227–238, 2020.
[5] Muhiyiddin, “Covid-19, New Normal dan Perencanaan Pembangunan di Indonesia,” Indones.
J. Dev. Plan., vol. IV, no. 2, pp. 240–252, 2020. [6] N. Chen et al., “Epidemiological and clinical characteristics of 99 cases of 2019 novel
coronavirus pneumonia in Wuhan , China : a descriptive study,” Lancet, vol. 6736, no. 20, pp. 30211–30217, 2020.
[7] A. Mahajan, N. A. Sivadas, and R. Solanki, “An epidemic model SIPHERD and its application for prediction of the spread of COVID-19 infection in India,” Chaos , Solitons Fractals, vol. 140, no. 2020, pp. 1–6, 2020.
[8] Y. Ding and L. Gao, “An evaluation of COVID-19 in Italy : A data-driven modeling analysis,” Infect. Dis. Model., vol. 5, no. 2020, pp. 495–501, 2020.
[9] U. A. De León, Á. G. C. Pérez, and E. Avila-vales, “An SEIARD epidemic model for COVID-19 in Mexico : Mathematical analysis and state-level forecast,” Chaos , Solitons Fractals, vol. 140, no. 2020, pp. 1–23, 2020.
[10] S. Setiati and M. K. Azwar, “COVID-19 and Indonesia,” Acta Medica Indones. – Indones. J.
Intern. Med., vol. 52, no. 1, pp. 84–89, 2020. [11] D. Aldila et al., “A mathematical study on the spread of COVID-19 considering social
distancing and rapid assessment : The case of Jakarta , Indonesia,” Chaos, Solitons and
Fractals, vol. 139, no. 2020, pp. 1–14, 2020. [12] F. Adi Kusumo, N. Susyanto, I. Endrayanto, and A. Meliala, “SIR-Based Model In Predicting
The Early Outbreak Of Covid-19 In The Special Region Of Yogyakarta (DIY),” J. Mat.
Thales, vol. 02, no. 01, pp. 1–10, 2020. [13] A. Sulaiman, “On Dynamical Analysis of the Data-Driven SIR model,” medrxiv, vol. June, pp.
1–14, 2020.

224
International Conference on Natural Sciences, Mathematics, Applications, Research, and Technology
Manado, Indonesia, 22-23 October 2020
A Study on Group LASSO for Grouped Variable Selection in Regression Model E Sunandi*1,2, K A Notodoputro2, B Sartono2
1 Statistics Program, Department of Mathematics, Bengkulu University, Bengkulu, Indonesia 2Department of Statistics, IPB University, Bogor, INDONESIA (Email: [email protected], [email protected], [email protected]) INTRODUCTION Regression analysis is the most common method to examine the relationship between some explanatory variables (X) and a response variable (Y) [ 1 ] . The analyists frequently use least squares (LS) method which works to find model estimate by minimizing the sum of the squared errors. If X is the design matrix from the dataset, LS can be implemented when the X'X matrix is nonsingular [2]. For the case when the number of variables exceed the number of observation, it is impossible to have non-singular X’X so that LS could not work any longer. One way to solve this problem is the penalized regression method which estimaties the parameters by minimizing of the sum of squared errors that are penalized [3]. The well-known penalized regression methods is the LASSO (Least Absolute Shrinkage and Selection Operator) method which was popularized by Tibshirani [4]. LASSO works by adding constraints to the LS method. The LASSO shrinks the solution of LS to zero even right to zero especially for the coefficients of less important variables. Therefore LASSO could works as selection procedure to result simpler and easier modelto interpret. However, this approach lead some bias in the estimation. The original version of LASSO method has a limitation in the precision when it is applied in data with grouped variable. Yuan and Lin [5], introduced a new method called Group LASSO to handle this situation. This study provided a study of the performance of the Group LASSO method through a simulation with three different scenarios. We also implemented the Group LASSO method to the Human Development Index (HDI) data of Bengkulu Province in 2019 which includes several groups of
variables as explanatory variables. Those variables are Expenditure Per Capita Per Month (ECM), Expected Years of Schooling (EYS), Gross Regional Domestic Product (GRDP), and Life Expectancy Rate (LER) in
Bengkulu Province [6]. Goodness of fit measures used in this study are Mean Squared Error of Prediction
(MSEP), R-squared (R2), False Discovery Rate (FDR), and False Negative Rate (FNR). RESULTS AND DISCUSSION In simulation 1, all beta generated are non-zero beta at condition 𝑝 < 𝑛. Based on the simulation results can be seen that FDR and FNR values in the LASSO and Group LASSO analysis are the same, i.e 0%. Group LASSO and LASSO estimated all beta values that are not equal to zero. If seen from the R-Squared value, both analyzes have the same ability to explain the diversity of the response variables very well (𝑅2 = 98%). Meanwhile, when viewed from the MSEP value, the Group LASSO analysis has a smaller value (MSEP = 1.76) than compared to LASSO. In simulation 2 at the condition of 𝑝 < 𝑛, the beta parameter is set as non-zero beta and zero beta, with a ratio of 50:50. The results of simulation 2 are different from simulation 1. For the Group LASSO analysis, the FDR and FNR values are similar, i.e 37.50%. it means, the Group LASSO is quite capable
225
of classifying the beta estimator according to the true beta conditions. Meanwhile, LASSO is very good estimating the non-zero beta correctly. This is indicated by the FDR value of 0%. The FNR value is still relatively large (42.86%). This indicates that LASSO is weak in estimating zero beta correctly. Furthermore, when viewed from the MSEP value, the Group LASSO analysis has a much smaller MSEP value (MSEP = 18.49%) than compared to LASSO (MSEP = 28.75%) with the same R-squared value (𝑅2 = 96 %). Simulation 3 is designed to be analogous to simulation 2, but the condition is 𝑝 > 𝑛. In LASSO analysis, the probability of non-zero beta error estimated correctly is small (FDR = 6.25%). However, the probability of non-zero beta estimated incorrectly is quite large (53.13%). This indicates that LASSO has limitations in estimating zero beta. Furthermore, it can been seen from the R-Squared value, the Group LASSO analysis has a slightly larger value (𝑅2 = 85%) than LASSO (𝑅2 = 83%). Also, similar to simulations 1 and 2, the Group LASSO analysis has a much smaller MSEP value, even half of the LASSO MSEP value. Overall in 3 simulations, analysis Group LASSO has better performance than LASSO. For HDI data, MSEP value of the Group LASSO analysis is 0.25. This value is smaller than LASSO (𝑀𝑆𝐸𝑃 = 1.40). Meanwhile, the R-squared value of Group LASSO was 98%. This means that through Group LASSO analysis the variables used are able to explain HDI diversity very well. Based on the Group LASSO results of the 10-fold cross validation, the best lambda value that minimizes the MSEP value is 0.178. In this further discussion, the GRDP group not being included in the Group LASSO model. These results also indicate that the group order of the most important variables on HDI score in Bengkulu Province is Expenditure Per Capita Per Month (ECM), Expected Years of Schooling (EYS),
and Life Expectancy Rate (LER).
Keywords: Group LASSO, LASSO, MSEP, Regression
References 1. N.R. Draper, H. Smith, Applied Regression Analysis, 3rd Edition (John Wiley Sons, New York,
1998). 2. S. Setiawan, S. Sutikno, Bayes Wavelet Regression Approach to Solve Problems in
Multivariable Calibration Modeling, IPTEK J. Technol. Sci. 21 (2010). 3. T. Hastie, R. Tibshirani, M. Wainwright, Statistical learning with sparsity: The lasso and
generalizations, (CRC Press, California, 2015) 4. R. Tibshirani, Regression Shrinkage and Selection Via the Lasso, J. R. Stat. Soc. Ser. B 58
(1996) 5. M. Yuan, Y. Lin, Model selection and estimation in regression with grouped variables, J. R.
Stat. Soc. Ser. B Stat. Methodol 68, 49-67 (2006) 6. BPS, Provinsi Bengkulu Dalam Angka 2020, BPS Provinsi Bengkulu. (2020).
https://bengkulu.bps.go.id/ (accessed October 7, 2020).
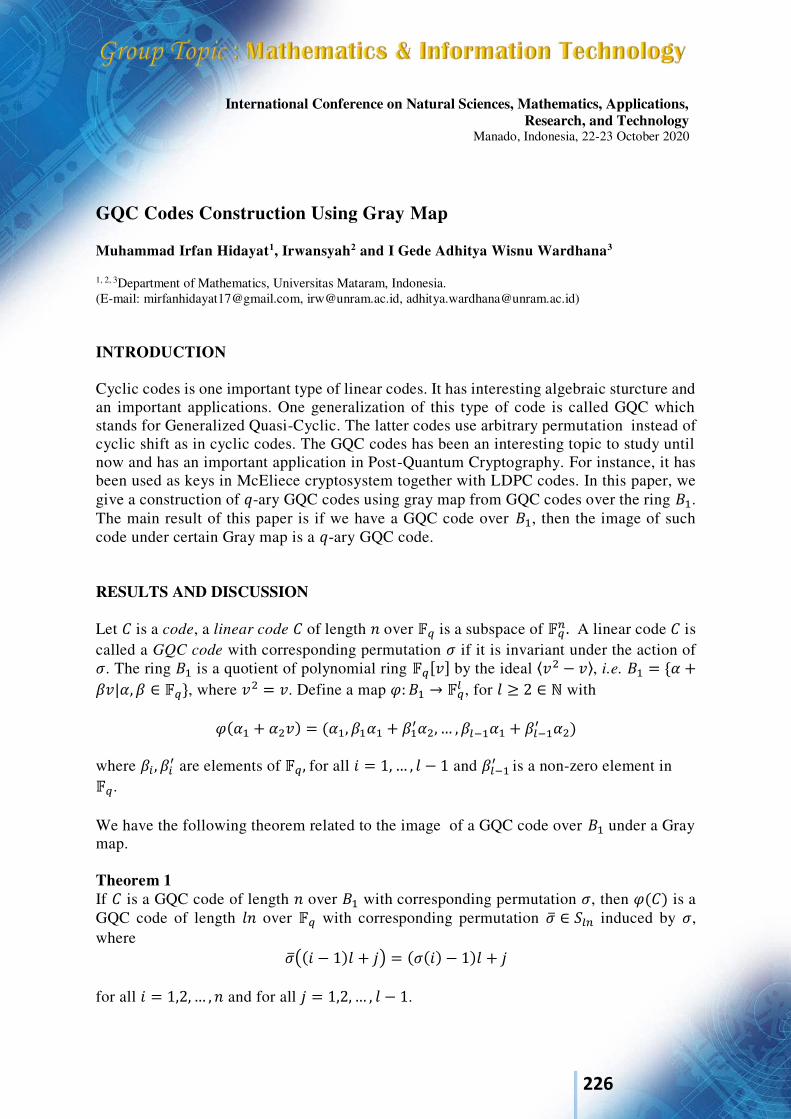
226
International Conference on Natural Sciences, Mathematics, Applications, Research, and Technology
Manado, Indonesia, 22-23 October 2020
GQC Codes Construction Using Gray Map Muhammad Irfan Hidayat1, Irwansyah2 and I Gede Adhitya Wisnu Wardhana3
1, 2, 3Department of Mathematics, Universitas Mataram, Indonesia. (E-mail: [email protected], [email protected], [email protected])
INTRODUCTION Cyclic codes is one important type of linear codes. It has interesting algebraic sturcture and an important applications. One generalization of this type of code is called GQC which stands for Generalized Quasi-Cyclic. The latter codes use arbitrary permutation instead of cyclic shift as in cyclic codes. The GQC codes has been an interesting topic to study until now and has an important application in Post-Quantum Cryptography. For instance, it has been used as keys in McEliece cryptosystem together with LDPC codes. In this paper, we give a construction of 𝑞-ary GQC codes using gray map from GQC codes over the ring 𝐵1. The main result of this paper is if we have a GQC code over 𝐵1, then the image of such code under certain Gray map is a 𝑞-ary GQC code. RESULTS AND DISCUSSION Let 𝐶 is a code, a linear code 𝐶 of length 𝑛 over 𝔽𝑞 is a subspace of 𝔽𝑞𝑛. A linear code 𝐶 is called a GQC code with corresponding permutation 𝜎 if it is invariant under the action of 𝜎. The ring 𝐵1 is a quotient of polynomial ring 𝔽𝑞[𝑣] by the ideal ⟨𝑣2 − 𝑣⟩, i.e. 𝐵1 = {𝛼 +𝛽𝑣|𝛼, 𝛽 ∈ 𝔽𝑞}, where 𝑣2 = 𝑣. Define a map 𝜑: 𝐵1 → 𝔽𝑞𝑙 , for 𝑙 ≥ 2 ∈ ℕ with 𝜑(𝛼1 + 𝛼2𝑣) = (𝛼1, 𝛽1𝛼1 + 𝛽1′𝛼2, … , 𝛽𝑙−1 𝛼1 + 𝛽𝑙−1′ 𝛼2) where 𝛽𝑖 , 𝛽𝑖′ are elements of 𝔽𝑞, for all 𝑖 = 1, … , 𝑙 − 1 and 𝛽𝑙−1 ′ is a non-zero element in 𝔽𝑞. We have the following theorem related to the image of a GQC code over 𝐵1 under a Gray map. Theorem 1 If 𝐶 is a GQC code of length 𝑛 over 𝐵1 with corresponding permutation 𝜎, then 𝜑(𝐶) is a GQC code of length 𝑙𝑛 over 𝔽𝑞 with corresponding permutation �̅� ∈ 𝑆𝑙𝑛 induced by 𝜎, where �̅�((𝑖 − 1)𝑙 + 𝑗) = (𝜎(𝑖) − 1)𝑙 + 𝑗 for all 𝑖 = 1,2, … , 𝑛 and for all 𝑗 = 1,2, … , 𝑙 − 1.

227
We have the following consequences of Theorem 1. Corollary 1 If 𝐶 is a GQC code of length 𝑛 over 𝐵1 with corresponding permutation 𝜎 =(1 2)(3 4) ⋯ (𝑛 − 1 𝑛), then 𝜑(𝐶) is a GQC code of length 𝑙𝑛 over 𝔽𝑞 with corresponding permutation �̅� ∈ 𝑆𝑙𝑛, where �̅�((𝑖 − 1)𝑙 + 𝑗) = { 𝑖𝑙 + 𝑗, 𝑖𝑓 𝑖 ≡ 1 𝑚𝑜𝑑 2(𝑖 − 2)𝑙 + 𝑗, 𝑖𝑓 𝑖 ≡ 0 𝑚𝑜𝑑 2
for all 𝑖 = 1,2, … , 𝑛 and for all 𝑗 = 1,2, … , 𝑙 − 1. Corrollary 2 If 𝐶 is a GQC code of length 𝑛 over 𝐵1 with corresponding permutation 𝜎 =(1 2 3)(4 5 6) ⋯ (𝑛 − 2 𝑛 − 1 𝑛), then 𝜑(𝐶) is a GQC code of length 𝑙𝑛 over 𝔽𝑞 with corresponding permutation �̅� ∈ 𝑆𝑙𝑛, where �̅�((𝑖 − 1)𝑙 + 𝑗) = { 𝑖𝑙 + 𝑗, 𝑖𝑓 𝑖 ≡ 1 𝑚𝑜𝑑 3(𝑖 + 1)𝑙 + 𝑗, 𝑖𝑓 𝑖 ≡ 2 𝑚𝑜𝑑 3(𝑖 − 3)𝑙 + 𝑗, 𝑖𝑓 𝑖 ≡ 0 𝑚𝑜𝑑 2
for all 𝑖 = 1,2, … , 𝑛 and for all 𝑗 = 1,2, … , 𝑙 − 1. Keywords: Algebra, Codes, Coding Theory, Gray Map Acknowledgment Special Thanks to KPBI Matematika Murni of Universitas Mataram and Gamatika Research Club for their advice and support. References
1. Irwansyah, Barra, A., Dougherty, S. T., Muchlis, A., Muchtadi-Alamsyah, I., Solé, P., Yemen, O. (2016). ΘS-cyclic codes over Ak. International Journal of Computer
Mathematics: Computer Systems Theory, 1(1), 14–31. https://doi.org/10.1080/23799927.2016.1146800
2. Irwansyah, & Suprijanto, D. (2018). Structure of linear codes over the ring Bk. Journal of
Applied Mathematics and Computing, 58(1–2), 755–775. https://doi.org/10.1007/s12190-018-1165-0
3. Ling, S., & Xhing, C. (2004). Coding Theory A First Course. New York: Cambridge University Press.
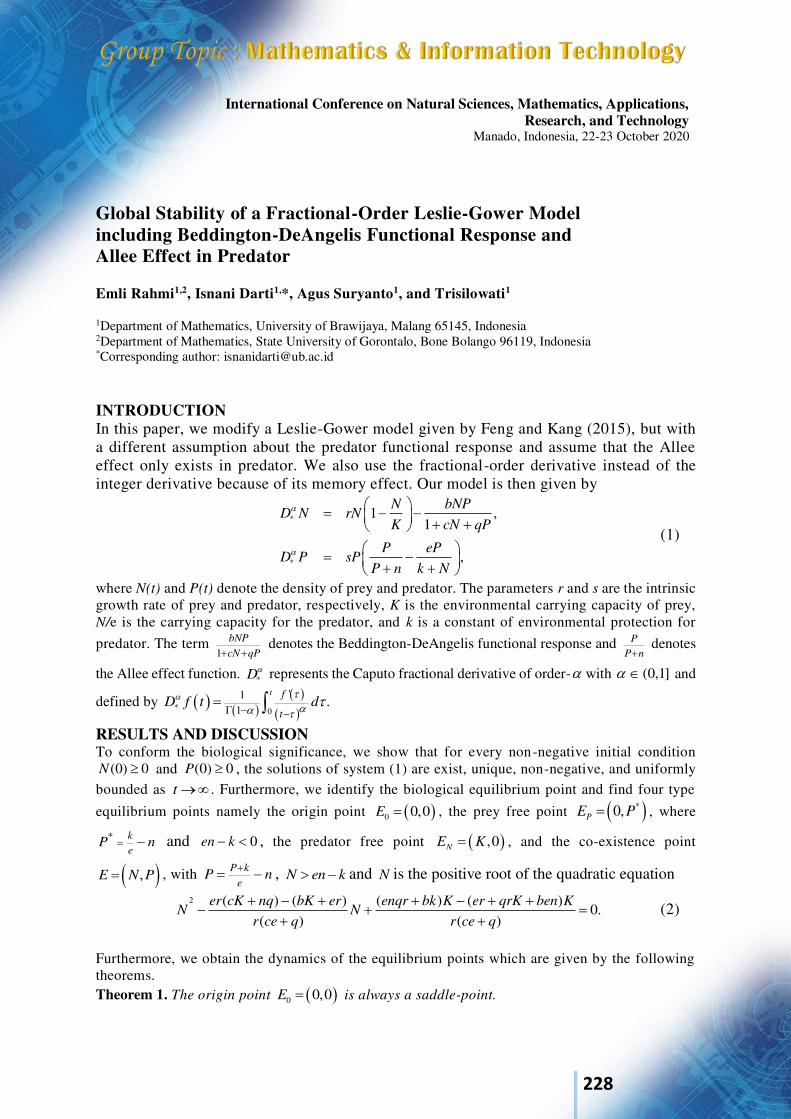
228
International Conference on Natural Sciences, Mathematics, Applications, Research, and Technology
Manado, Indonesia, 22-23 October 2020
Global Stability of a Fractional-Order Leslie-Gower Model including Beddington-DeAngelis Functional Response and Allee Effect in Predator Emli Rahmi1,2, Isnani Darti1,*, Agus Suryanto1, and Trisilowati1
1Department of Mathematics, University of Brawijaya, Malang 65145, Indonesia 2Department of Mathematics, State University of Gorontalo, Bone Bolango 96119, Indonesia *Corresponding author: [email protected] INTRODUCTION In this paper, we modify a Leslie-Gower model given by Feng and Kang (2015), but with a different assumption about the predator functional response and assume that the Allee effect only exists in predator. We also use the fractional-order derivative instead of the integer derivative because of its memory effect. Our model is then given by
*
*
1 ,1
,
N bNPD N rN
K cN qP
P ePD P sP
P n k N
(1)
where N(t) and P(t) denote the density of prey and predator. The parameters r and s are the intrinsic growth rate of prey and predator, respectively, K is the environmental carrying capacity of prey, N/e is the carrying capacity for the predator, and k is a constant of environmental protection for
predator. The term 1
bNP
cN qP denotes the Beddington-DeAngelis functional response and P
P n denotes
the Allee effect function. *D represents the Caputo fractional derivative of order- with (0,1] and
defined by
* 0
'11
.t f
tD f t d
RESULTS AND DISCUSSION To conform the biological significance, we show that for every non-negative initial condition
(0) 0N and (0) 0P , the solutions of system (1) are exist, unique, non-negative, and uniformly bounded as t . Furthermore, we identify the biological equilibrium point and find four type
equilibrium points namely the origin point 0 0,0E , the prey free point *0,PE P , where
* k
eP n and 0en k , the predator free point ,0NE K , and the co-existence point
,E N P , with P k
eP n
, N en k and N is the positive root of the quadratic equation
2 ( ) ( ) ( ) ( )
0.( ) ( )
er cK nq bK er enqr bk K er qrK ben KN N
r ce q r ce q
(2)
Furthermore, we obtain the dynamics of the equilibrium points which are given by the following theorems. Theorem 1. The origin point 0 0,0E is always a saddle-point.

229
Theorem 2. The prey free point *0,PE P is globally asymptotically stable in the region
2
1 2*
*: ( , ) | k N
P P
N P P P
.
Theorem 3. The predator free point ,0NE K is a non-hyperbolic point.
Theorem 4. The co-existence point ,E N P is globally asymptotically stable in the region
22 : ( , ) | 0N P N N e P P .
According to the existence of equilibrium points and their global stability conditions, we conclude some biological circumstances. We notice that the extinction of both prey and predator in model (1) will never be accomplished. If the region 1 is obtained, for some 0t satisfies 1( ( ), ( )) ,N t P t prey becomes extinct while the existence of predator is maintained as t . To protect both prey and predator from extinction, the region 2 should be exists, and the population 2( ( ), ( )) ,N t P t for some
0t . Keywords : Allee effect, Beddington-DeAngelis, Caputo Fractional-Order, Global Stability,
Leslie-Gower References 1. A. Suryanto, I. Darti and S. Anam, International Journal of Mathematics and Mathematical
Sciences, 1-9 (2017). 2. A. Suryanto, I. Darti, H. S. Panigoro and A. Kilicman, Mathematics 7(11),1100 (2019). 3. A. J. Terry, Journal of Mathematical Modelling 71, 1325-1352 (2015). 4. C.Vargas-De-Leon, Communications in Nonlinear Science and Numerical Simulation 24(1-3), 75-
85 (2015). 5. P. Feng and Y. Kang, Nonlinear Dynamics 80, 1051-1062 (2015) 6. F. Chourchamp, L. Berec and J. Gascoigne, Allee effect in ecology and conservation (Oxford
University Press Inc., New York, United States, 2008). 7. H. L. Li, L. Zhang, C. Hu, Y. L. Jiang and Z. Teng, Journal of Applied Mathematic and Computing
54 (1-2), 435-449 (2017). 8. I. Petras, Fractional-Order Nonlinear Systems (Springer, 2011). 9. J. R. Beddington, The Journal of Animal Ecology 44, 331 (1975). 10. J. Huo, H. Zhao and L. Zhu, Nonlinear Analysis: Real World Applications 26,289-305 (2015). 11. P. Feng and Y. Kang, Nonlinear Dynamics 80, 1051-1062 (2015). 12. S. Yu, Advances in Difference Equations 1, 84 (2014). 13. W. C. Allee, Animal aggregations, a study in general sociology (The University of Chicago Press,
Chicago, 1931).
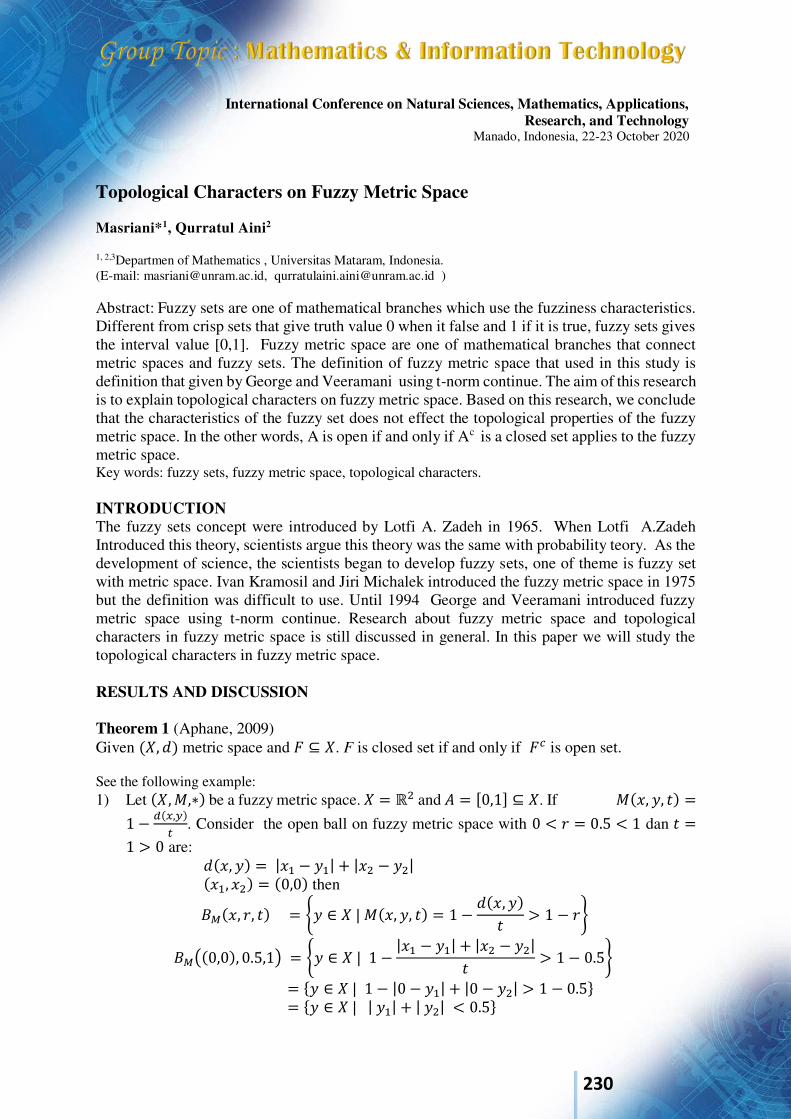
230
International Conference on Natural Sciences, Mathematics, Applications, Research, and Technology
Manado, Indonesia, 22-23 October 2020
Topological Characters on Fuzzy Metric Space Masriani*1, Qurratul Aini2
1, 2,3Departmen of Mathematics , Universitas Mataram, Indonesia. (E-mail: [email protected], [email protected] )
Abstract: Fuzzy sets are one of mathematical branches which use the fuzziness characteristics. Different from crisp sets that give truth value 0 when it false and 1 if it is true, fuzzy sets gives the interval value [0,1]. Fuzzy metric space are one of mathematical branches that connect metric spaces and fuzzy sets. The definition of fuzzy metric space that used in this study is definition that given by George and Veeramani using t-norm continue. The aim of this research is to explain topological characters on fuzzy metric space. Based on this research, we conclude that the characteristics of the fuzzy set does not effect the topological properties of the fuzzy metric space. In the other words, A is open if and only if Ac is a closed set applies to the fuzzy metric space. Key words: fuzzy sets, fuzzy metric space, topological characters. INTRODUCTION The fuzzy sets concept were introduced by Lotfi A. Zadeh in 1965. When Lotfi A.Zadeh Introduced this theory, scientists argue this theory was the same with probability teory. As the development of science, the scientists began to develop fuzzy sets, one of theme is fuzzy set with metric space. Ivan Kramosil and Jiri Michalek introduced the fuzzy metric space in 1975 but the definition was difficult to use. Until 1994 George and Veeramani introduced fuzzy metric space using t-norm continue. Research about fuzzy metric space and topological characters in fuzzy metric space is still discussed in general. In this paper we will study the topological characters in fuzzy metric space.
RESULTS AND DISCUSSION Theorem 1 (Aphane, 2009) Given (𝑋, 𝑑) metric space and 𝐹 ⊆ 𝑋. F is closed set if and only if 𝐹𝑐 is open set. See the following example: 1) Let (𝑋, 𝑀,∗) be a fuzzy metric space. 𝑋 = ℝ2 and 𝐴 = [0,1] ⊆ 𝑋. If 𝑀(𝑥, 𝑦, 𝑡) =1 − 𝑑(𝑥,𝑦)𝑡 . Consider the open ball on fuzzy metric space with 0 < 𝑟 = 0.5 < 1 dan 𝑡 =1 > 0 are: 𝑑(𝑥, 𝑦) = |𝑥1 − 𝑦1| + |𝑥2 − 𝑦2| (𝑥1, 𝑥2) = (0,0) then 𝐵𝑀(𝑥, 𝑟, 𝑡) = {𝑦 ∈ 𝑋 | 𝑀(𝑥, 𝑦, 𝑡) = 1 − 𝑑(𝑥, 𝑦)𝑡 > 1 − 𝑟} 𝐵𝑀((0,0), 0.5,1) = {𝑦 ∈ 𝑋 | 1 − |𝑥1 − 𝑦1| + |𝑥2 − 𝑦2|𝑡 > 1 − 0.5} = {𝑦 ∈ 𝑋 | 1 − |0 − 𝑦1| + |0 − 𝑦2| > 1 − 0.5} = {𝑦 ∈ 𝑋 | | 𝑦1| + | 𝑦2| < 0.5}

231
𝐴 = [0,1] is closed set, because ∀ 𝑥 ∉ [0,1], 𝑥 not limit point [0,1]. 𝑥 ∉ [0,1] then ∃ 0 <𝑟 < 1 dan 𝑡 = 12 > 0 so that 𝐵𝑀(𝑥, 𝑟, 𝑡) ∩ [0,1] − {𝑥} = ∅. Eventually, x not a limit point
of [0,1]. Therefore, we have [0,1] is closed set. 𝐴𝑐 = (−∞, 0) ∪ (1, ∞) ⊆ 𝑋 is ope set. Take any 𝑥 ∈ 𝐴𝑐, will be shown that 𝑥 is 𝐴𝑐 interior point. Because 𝑥 ∈ 𝐴𝑐 then ∃ 0 <𝑟 < 1 and 𝑡 = 12 > 0, there exist open ball 𝐵𝑀(𝑥, 𝑟, 𝑡) thus 𝐵𝑀(𝑥, 𝑟, 𝑡) ⊆ 𝐴𝑐. thus x is 𝐴𝑐 interior point. Therefore it can be concluded that 𝐴𝑐 is open set.
2) Let (𝑋, 𝑀,∗) be a fuzzy metric space. 𝑋 = ℝ and 𝑀(𝑥, 𝑦, 𝑡) = 𝑡𝑡 + 𝑑(𝑥,𝑦). Consider the
open ball on fuzzy metric space with center 𝑥 = 0, 0 < 𝑟 = 0.5 < 1 and 𝑡 = 3 > 0. 𝑑(𝑥, 𝑦) = |𝑥 − 𝑦|
𝐵𝑀(𝑥, 𝑟, 𝑡) = {𝑦 ∈ 𝑋 | 𝑀(𝑥, 𝑦, 𝑡) = 𝑡𝑡+𝑑(𝑥,𝑦) > 1 − 𝑟}
𝐵𝑀(0,0.5,3) = {𝑦 ∈ 𝑋 | 33+|0−𝑦| > 1 − 0.5}
= {𝑦 ∈ 𝑋 | 33+|𝑦| > 0.5}
= {𝑦 ∈ 𝑋 | |𝑦| < 3} ={𝑦 ∈ 𝑋 | − 3 < 𝑦 < 3}
-4 -3 -2 -1 0 1 2 3 4
𝐵𝑀(0,0.5,3) 𝐴 = (−∞, 0) ∪ (1, ∞) open ball. Will be shown that ∀𝑥 ∈ 𝐴, 𝑥 is intrior point of 𝐴. Because 𝑥 ∈ 𝐴 then ∃ 0 < 𝑟 = 0.5 < 1 and 𝑡 = 1 so that 𝐵𝑀(𝑥, 𝑟, 𝑡) ⊆ 𝐴. Therefore x is interior point of A. therefore, we have A is open set. 𝐴𝑐 = [0,1] ⊆ 𝑋 is closed set for every 0 < 𝑟 < 1 and 𝑡 > 0.

232
Will be shown that ∀𝑥 limit poit of 𝐴𝑐. 𝑥 ∈ 𝐴𝑐. Because x is limit point of 𝐴𝑐 then ∀ 0 <𝑟 < 1 and 𝑡 = 1 > 0 so that 𝐵𝑀(𝑥, 𝑟, 𝑡) ∩ [0,1] − {𝑥} ≠ ∅. The implies 𝐵𝑀(𝑥, 𝑟, 𝑡) ⊈(−∞, 0) ∪ (1, ∞). Because (−∞, 0) ∪ (1, ∞) is open set then 𝑥 ∉ (−∞, 0) ∪ (1, ∞) so that 𝑥 ∈ [0,1]. Therefore, we have [0,1] is closed set.
3) Let (𝑋, 𝑀,∗) be a fuzzy metric space. 𝑋 = ℕ and 𝑀(𝑥, 𝑦, 𝑡) = { 1𝑥𝑦 𝑗𝑖𝑘𝑎 𝑥 ≠ 𝑦1 𝑗𝑖𝑘𝑎 𝑥 = 𝑦 . Consider
the open ball on fuzzy metric space with center 𝑥 = 4 and 0 < 𝑟 = 0.8 < 1, 𝑡 > 0. 𝐵𝑀(𝑥, 𝑟, 𝑡) = {𝑦 ∈ 𝑋| 𝑀(𝑥, 𝑦, 𝑡) = 1𝑥𝑦 > 1 − 𝑟} 𝐵𝑀(4,0.8, 𝑡) = {𝑦 ∈ 𝑋 | 14𝑦 > 1 − 0.8} = {𝑦 ∈ 𝑋 | 14𝑦 > 15} = {𝑦 ∈ 𝑋 | 4𝑦 < 5} = {𝑦 ∈ 𝑋 | 𝑦 = 1} 0 1 2 3 4
𝐵𝑀(4,0.8, 𝑡)
𝐴 = {𝑥} is open set. Will be shown that ∀ 𝑥 ∈ 𝐴. 𝑥 is interior point of 𝐴. Take any 𝑥 ∈ 𝐴 ∃ 0 < 𝑟 = 0.5 < 1 and 𝑡 = 1 > 0 obtained 𝐵𝑀(𝑥, 𝑟, 𝑡) = {𝑥}. So that 𝐵𝑀(𝑥, 𝑟, 𝑡) ⊆ {𝑥}. further 𝑥 is interior point of A. Thus {𝑥} is open set. 𝐴𝑐 = ℕ \ {𝑥} is closed set ∀ 0 < 𝑟 < 1 dan 𝑡 > 0. Will be shown that ∀𝑦 ∉ 𝐴𝑐, 𝑦 is not limit point of 𝐴𝑐. Take any 𝑦 ∉ 𝐴𝑐, 𝑦 ∈ 𝐴. ∃ 0 < 𝑟 = 12 < 1 and 𝑡 = 12 > 0 we have 𝐵𝑀(𝑦, 𝑟, 𝑡) = {𝑦 ∈ 𝐴 | 𝑀(𝑦, 𝑧, 𝑡) = 1 > 1 − 12} 𝐵𝑀 (𝑦, 12 , 𝑡) = {𝑦 ∈ 𝐴 | 𝑦 = 𝑥}
Consequence 𝐵𝑀(𝑦, 𝑟, 𝑡) ∩ 𝐴 − {𝑥} = ∅. Therefore we have x is not a limit point of 𝐴. can be concluded that 𝐴 is closed set.
From some of the examples above it can be concluded that: Theorem 2 Let (𝑋, 𝑀,∗) be a fuzzy metric spaces and 𝐴 ⊆ 𝑋. A is open set if and only if 𝐴𝑐 is closed set. . Proof Given A is open set, will be shown that 𝐴𝑐is closed set. Will be shown that ∀𝑥 limit point of 𝐴𝑐, then 𝑥 ∈ 𝐴𝑐. Take any 𝑥 limit point of 𝐴𝑐, suppose 𝑥 ∉ 𝐴𝑐 then 𝑥 ∈ 𝐴. Because A is open set then 𝑥 is interior point of A, so there exist 0 < 𝑟 < 1 and 𝑡 > 0 so that 𝐵𝑀(𝑥, 𝑟, 𝑡) ⊆ 𝐴. consquence
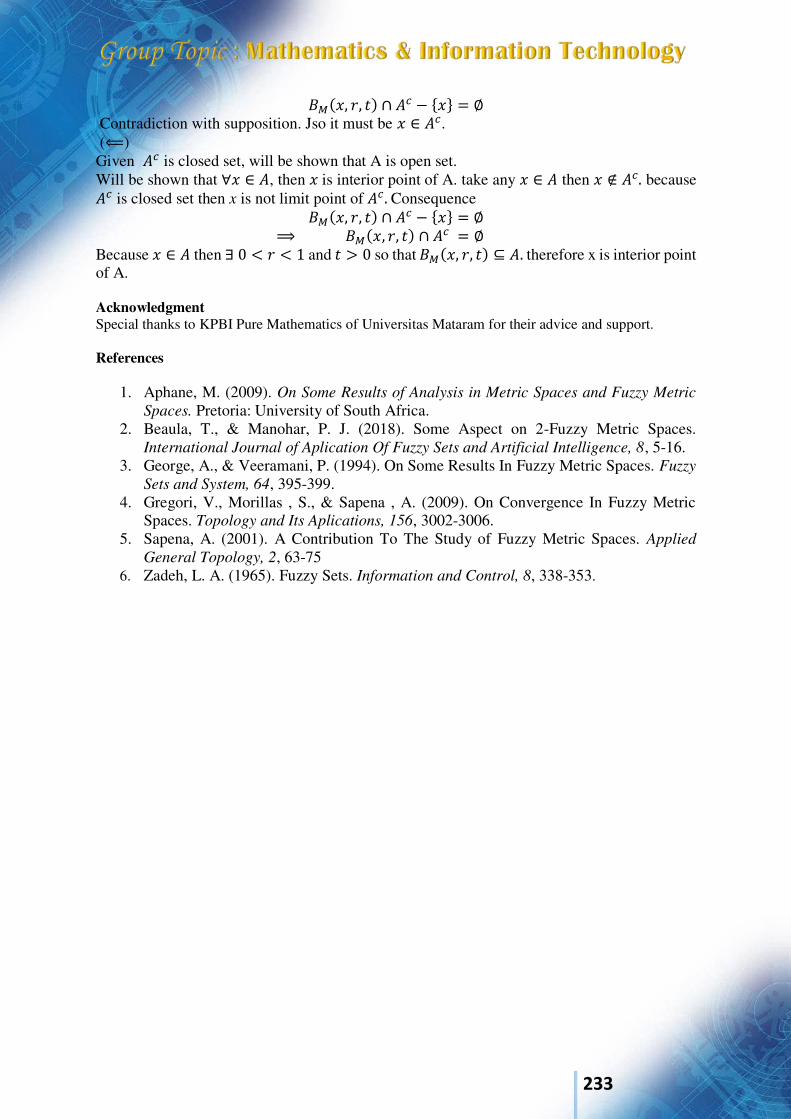
233
𝐵𝑀(𝑥, 𝑟, 𝑡) ∩ 𝐴𝑐 − {𝑥} = ∅ Contradiction with supposition. Jso it must be 𝑥 ∈ 𝐴𝑐. (⟸) Given 𝐴𝑐 is closed set, will be shown that A is open set. Will be shown that ∀𝑥 ∈ 𝐴, then 𝑥 is interior point of A. take any 𝑥 ∈ 𝐴 then 𝑥 ∉ 𝐴𝑐. because 𝐴𝑐 is closed set then x is not limit point of 𝐴𝑐. Consequence 𝐵𝑀(𝑥, 𝑟, 𝑡) ∩ 𝐴𝑐 − {𝑥} = ∅ ⟹ 𝐵𝑀(𝑥, 𝑟, 𝑡) ∩ 𝐴𝑐 = ∅ Because 𝑥 ∈ 𝐴 then ∃ 0 < 𝑟 < 1 and 𝑡 > 0 so that 𝐵𝑀(𝑥, 𝑟, 𝑡) ⊆ 𝐴. therefore x is interior point of A. Acknowledgment Special thanks to KPBI Pure Mathematics of Universitas Mataram for their advice and support. References
1. Aphane, M. (2009). On Some Results of Analysis in Metric Spaces and Fuzzy Metric
Spaces. Pretoria: University of South Africa. 2. Beaula, T., & Manohar, P. J. (2018). Some Aspect on 2-Fuzzy Metric Spaces.
International Journal of Aplication Of Fuzzy Sets and Artificial Intelligence, 8, 5-16. 3. George, A., & Veeramani, P. (1994). On Some Results In Fuzzy Metric Spaces. Fuzzy
Sets and System, 64, 395-399. 4. Gregori, V., Morillas , S., & Sapena , A. (2009). On Convergence In Fuzzy Metric
Spaces. Topology and Its Aplications, 156, 3002-3006. 5. Sapena, A. (2001). A Contribution To The Study of Fuzzy Metric Spaces. Applied
General Topology, 2, 63-75 6. Zadeh, L. A. (1965). Fuzzy Sets. Information and Control, 8, 338-353.
234
International Conference on Natural Sciences, Mathematics, Applications, Research, and Technology
Manado, Indonesia, 22-23 October 2020
Some Properties of Abelian Code over Group Algebra 𝒁𝒏[𝑮] Daisyah Alifian Fatahillah1, Irwansyah2 and I Gede Adhitya Wisnu Wardhana3
1, 2, 3 Department of Mathematics, Universitas Mataram, INDONESIA. (E-mail: [email protected], [email protected], [email protected]) INTRODUCTION Abelian codes are ideals in a group algebra 𝑅[𝐺], where 𝑅 is a commutative ring and 𝐺 is a finite Abelian group. The study of Abelian code has been done in [6], where 𝑅 is a field. In this paper, we describe some properties of Abelian codes over group algebra 𝑅[𝐺], where 𝐺 is a cyclic group and 𝑅 =𝑍𝑛. First, we prove that 𝑍𝑝2[𝐺] is a Principal Ideal Group Algebra (PIGA). Second, let 𝜋 be a mapping from 𝑍𝑛[𝐺] to 𝑅[𝐵], where 𝜋 ring isomorphism and 𝐵 is the sylow p-subgroup of 𝐺. We show that the map 𝜋 induces one-to-one correspondence between Abelian code in 𝑍𝑛[𝐺] and Abelian code in 𝑅[𝐵]. Moreover, in this paper, we describe Euclidean and Hermitian dualities in Abelian codes over 𝑍𝑛[𝐺]. RESULTS AND DISCUSSION Any 𝑢 ∈ 𝑍𝑛[𝐺], can be written as 𝑢 = ∑ 𝛼𝑔𝑌𝑔𝑔∈𝐺 , for 𝛼𝑔 ∈ 𝑍𝑛. If 𝐺 has an order of 𝑝𝑚1 . 𝑚2, where 𝑝 ∤𝑚2, then 𝐺 has a subgroup of order 𝑝𝑚1. This corresponding subgroup called sylow 𝑝 − subgroup. Moreover, 𝐺 can be written as 𝐺 = 𝐴 ⊕ 𝐵, where 𝐵 is the sylow p-subgroup of 𝐺. Proposition 1 If 𝐺 is a cyclic group, then 𝑍𝑝2[𝐺] is a Pricipal Ideal Group Algebra (PIGA). Definition 1 Let 𝑅 ∶= 𝑍𝑛[𝐴]. Define a map 𝜋: 𝑍𝑛[𝐺] → 𝑅[𝐵] given by 𝜋 (∑ ∑ 𝛼𝑎+𝑏𝑌𝑎+𝑏𝑏∈𝐵𝑎∈𝐴 ) = ∑ 𝛼𝑏(𝑌)𝑌𝑏𝑏∈𝐵
for 𝛼𝑏(𝑌) = ∑ 𝛼𝑎+𝑏𝑌𝑎𝑎∈𝐴 ∈ 𝑅. The following results describe properties of the map 𝜋. Proposition 2 The map 𝜋 is a ring isomorphism between 𝑍𝑛[𝐺] and 𝑅[𝐵]. Proposition 3 The map 𝜋 induces a one-to-one corespondence between abelian code in 𝑍𝑛[𝐺] and abelian code in 𝑅[𝐵]. In addition, if 𝑍𝑛[𝐺] is PIGA, then 𝜋 induces a one-to-one corespondences between Abelian code in 𝑍𝑛[𝐺] and cyclic code in 𝑅[𝐵].
235
Definition 2 Let [. , . ] ∶ 𝑅[𝐵] × 𝑅[𝐵] → 𝑅 be a map defined by [𝑥, 𝑦] ≔ ∑ 𝑥𝑏(𝑌)𝑦𝑏(𝑌)̅̅ ̅̅ ̅̅ ̅̅𝑏∈𝐵
For all 𝑥, 𝑦 ∈ 𝑅[𝐵]. Proposition 4 Let 𝑢, 𝑣 ∈ 𝑍𝑛[𝐺]. Then ⟨𝑌𝑎𝑢, 𝑣⟩𝐸 = 0, for all 𝑎 ∈ 𝐴 if and only if [𝜋(𝑢), 𝜋(𝑣)] = 0. Proposition 5 Let 𝑢, 𝑣 ∈ 𝑍𝑛[𝐺]. Then ⟨𝑌𝑔𝑢, 𝑣⟩𝐸 = 0, for all 𝑔 ∈ 𝐺 if and only if [𝑌𝑏𝜋(𝑢), 𝜋(𝑣)] = 0. Definition 3 Let 𝐶 be an Abelian code in 𝑍𝑛[𝐺], then define Euclidean dual of 𝐶 as 𝐶⊥𝐸 = {𝑢 ∈ 𝑍𝑛[𝐺]| ⟨𝑢, 𝑣⟩𝐸 = 0, ∀𝑣 ∈ 𝐶}. Definition 4 Let 𝐶 be an Abelian code in 𝑅[𝐵] and 𝐶⊥∗ be the dual of 𝐶, then 𝐶⊥∗ defined with respect to [. , . ], i.e., 𝐶⊥∗: = {𝑥 ∈ 𝑅[𝐵] | [𝑥, 𝑦] = 0, ∀𝑦 ∈ 𝐶}
. Corollary 1 Let 𝐶 be an Abelian code in 𝑍𝑛[𝐺]. Then 𝜋(𝐶)⊥∗ = 𝜋(𝐶⊥𝐸). In particular, 𝐶 is self-orthogonal (respectively, self-dual) with respect to the Euclidean inner product if and only if 𝜋(𝐶) is self-orthogonal (respectively, self dual) with respect to [. , . ]. Keywords: Abelian codes, cyclic codes, group algebra, isomorfism, sylow 𝑝 −subgroup. Acknowledgment Special thanks to KPBI Matematika Murni of Universitas Mataram for their support. References
1. Rotman, Joseph J., 2015, A First Course In Abstract Algebra With Applications,
Third Edition. University Of Illinois. 2. San, Ling and Xing, C., 2004, Coding Theory, Cambridge University. 3. Anton, Howart.,1995, Aljabar linier Elementer edisi ke- 5, Terjemahan Pantur
Silababan dan I Nyoman Susila, Erlangga, Jakarta. 4. Switrayni, N. W.,2015, Buku Ajar Pengantar Teori Modul, Unram press, Mataram. 5. Arifin, Achmad.,2017. Aljabar Linier Edisi-2, ITB Press, Bandung. 6. Jitman, S., dkk,.2013, Abelian Code in Principsl Ideal Group Algebra’s, IEEE
Transactions on Information Theory 59(5): 0018-9448.

236
International Conference on Natural Sciences, Mathematics, Applications, Research, and Technology
Manado, Indonesia, 22-23 October 2020
Some Characteristics Prime Cyclic Ideal On Modulo Gaussian Integer Modulo Ring Wahyu Ulyafandhie Misuki*1, I Gede Adhitya Wisnu Wardhana2, Ni Wayan Switrayni3
1, 2, 3 Department of Mathematics, Universitas Mataram, Indonesia. (E-mail: [email protected], [email protected], [email protected]) INTRODUCTION Prime numbers are a topic of interest to mathematicians today. Many people conduct research in this field, such as Dedekind 1871, which provides an abstraction of prime numbers, namely the prime ideal [1], and Bhatwadekar 2009 about the abstraction of the prime ideal, which is the ideal almost prime [3]. Previously, Fariz et al. (2019) had found the properties of the ideal prime and almost ideal prime in the Gaussian integer ring [2]. This research will discuss the prime cyclic ideal in the Gaussian integer modulo. RESULTS AND DISCUSSION Gaussian modulo integer is a complex number 𝑎 + 𝑖𝑏 where 𝑎, 𝑏 ∈ ℤ𝑛. For more details, here are some examples of Gaussian modulo integer.
ℤ2[𝑖] = {0̅, 1̅, 𝑖,̅ 1 + 𝑖̅̅ ̅̅ ̅̅ } ℤ3[𝑖] = {0̅, 1̅, 2̅, 𝑖,̅ 1 + 𝑖̅̅ ̅̅ ̅̅ , 2 + 𝑖̅̅ ̅̅ ̅̅ , 2�̅�, 1 + 2𝑖̅̅ ̅̅ ̅̅ ̅̅ , 2 + 2𝑖̅̅ ̅̅ ̅̅ ̅̅ }
Every non-zero ring R has at least two ideals, the improper ideal R and a trivial ideal {0}. The ideal constructed by 0 of the Gaussian integer ring is a prime ideal and an almost prime ideal. However, this does not necessarily apply to Gaussian modulo integers. For example Ideal ⟨0̅⟩ is ideal prime in ℤ3[𝑖] but ⟨0̅⟩ is not an ideal prime in ℤ2[𝑖] because (1 + 𝑖̅̅ ̅̅ ̅̅ )(1 + 𝑖̅̅ ̅̅ ̅̅ ) = 0̅ ∈ ⟨0̅⟩ but (1 + 𝑖̅̅ ̅̅ ̅̅ ) ∉ ⟨0̅⟩. Theorem 1 Let 𝐼 = ⟨�̅�⟩ non-zero ideal in ℤ𝑛[𝑖]. If (𝑎, 𝑛) = 𝑝 is Gauss Prime then 𝐼 = ⟨�̅�⟩ is a prime ideal. From that, here are some examples of ideal prime and not ideal prime in Gaussian modulo integers.
Ideal 𝐼 = ⟨3̅⟩ is a prime ideal in ℤ6[𝑖] Ideal 𝐼 = ⟨3̅⟩ is not a prime ideal in ℤ5[𝑖] because ⟨3̅⟩ = ℤ5[𝑖] Ideal 𝐼 = ⟨2̅⟩ is not a prime ideal in ℤ4[𝑖] because (1 + 𝑖̅̅ ̅̅ ̅̅ )(1 + 𝑖̅̅ ̅̅ ̅̅ ) = 2𝑖 ∈ ⟨2⟩ but (1 + 𝑖) ∉ ⟨2⟩ Ideal 𝐼 = ⟨1 + 𝑖̅̅ ̅̅ ̅̅ ⟩ is prime ideal in ℤ2[𝑖].
Keywords: Gaussian Modulo Integer, Ideal Prime, Prime Gauss Numbers Acknowledgment Special thanks to KPBI Matematika Murni of Universitas Mataram for their advice and support.

237
References
1. I. G. A. W. Wardhana, Astuti, P. Muchtadi, I. Alamsyah, On Almost Prime Submodule of a
finitely Generated Module Over Principal Ideal Domain, JP Journal of Algebra, Number Theory and Applications: 121-128.pp. 121-128.
2. F. Maulana, I. G. A. W. Wardhana, N. W. Switrayni, Ekivalensi Ideal Hampir Prima dan Ideal
Prima pada Bilangan Bulat Gauss, (Eigen Mathematics Journal, Mataram, 2019), pp. 1-5. 3. S. M. Bhatwadekar and P. K. Sharma, Unique Factorization and Birth of Almost Prime,
Communication in Algebra, 2009, pp. 43-49. 4. J. B. Fraleigh, A First Course in Abstract Algebra Seventh Edition(Pearson Education Limited,
United States of America, 2014).
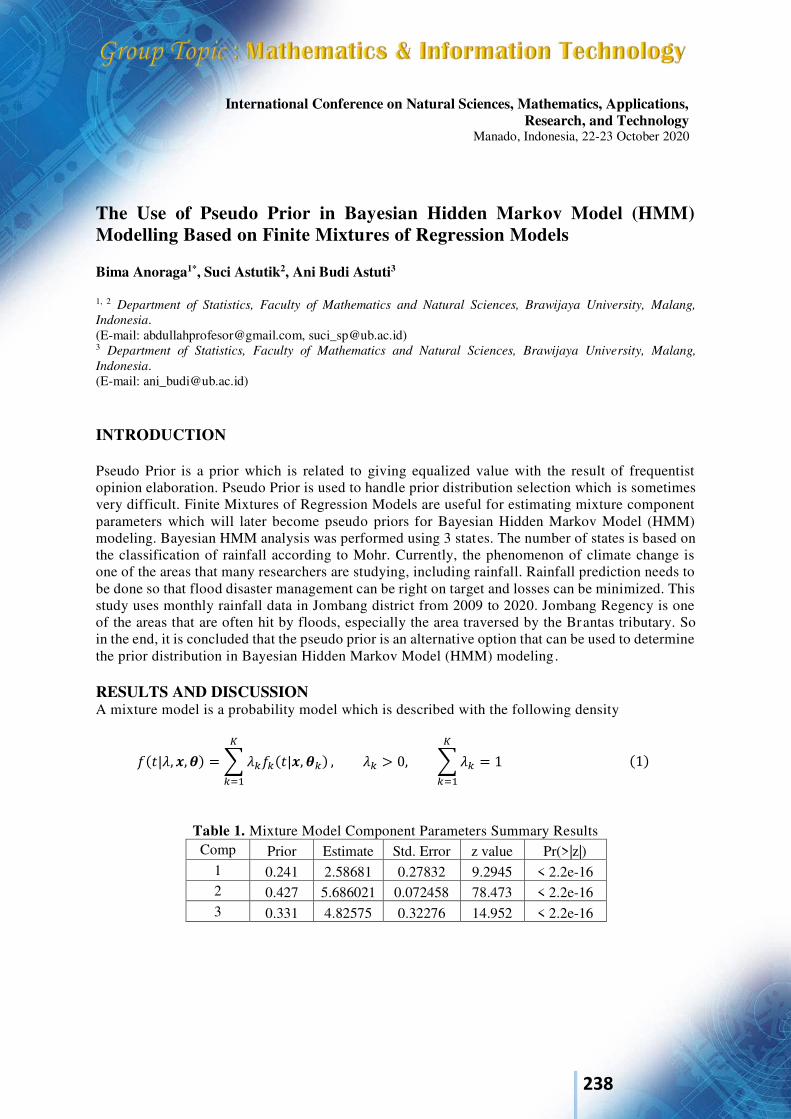
238
International Conference on Natural Sciences, Mathematics, Applications, Research, and Technology
Manado, Indonesia, 22-23 October 2020
The Use of Pseudo Prior in Bayesian Hidden Markov Model (HMM) Modelling Based on Finite Mixtures of Regression Models Bima Anoraga1*, Suci Astutik2, Ani Budi Astuti3
1, 2 Department of Statistics, Faculty of Mathematics and Natural Sciences, Brawijaya University, Malang,
Indonesia. (E-mail: [email protected], [email protected]) 3 Department of Statistics, Faculty of Mathematics and Natural Sciences, Brawijaya University, Malang,
Indonesia. (E-mail: [email protected]) INTRODUCTION Pseudo Prior is a prior which is related to giving equalized value with the result of frequentist opinion elaboration. Pseudo Prior is used to handle prior distribution selection which is sometimes very difficult. Finite Mixtures of Regression Models are useful for estimating mixture component parameters which will later become pseudo priors for Bayesian Hidden Markov Model (HMM) modeling. Bayesian HMM analysis was performed using 3 states. The number of states is based on the classification of rainfall according to Mohr. Currently, the phenomenon of climate change is one of the areas that many researchers are studying, including rainfall. Rainfall prediction needs to be done so that flood disaster management can be right on target and losses can be minimized. This study uses monthly rainfall data in Jombang district from 2009 to 2020. Jombang Regency is one of the areas that are often hit by floods, especially the area traversed by the Brantas tributary. So in the end, it is concluded that the pseudo prior is an alternative option that can be used to determine the prior distribution in Bayesian Hidden Markov Model (HMM) modeling. RESULTS AND DISCUSSION A mixture model is a probability model which is described with the following density
𝑓(𝑡|𝜆, 𝒙, 𝜽) = ∑ 𝜆𝑘𝑓𝑘(𝑡|𝒙, 𝜽𝑘)𝐾𝑘=1 , 𝜆𝑘 > 0, ∑ 𝜆𝑘𝐾
𝑘=1 = 1 (1)
Table 1. Mixture Model Component Parameters Summary Results Comp Prior Estimate Std. Error z value Pr(>|z|)
1 0.241 2.58681 0.27832 9.2945 < 2.2e-16 2 0.427 5.686021 0.072458 78.473 < 2.2e-16 3 0.331 4.82575 0.32276 14.952 < 2.2e-16
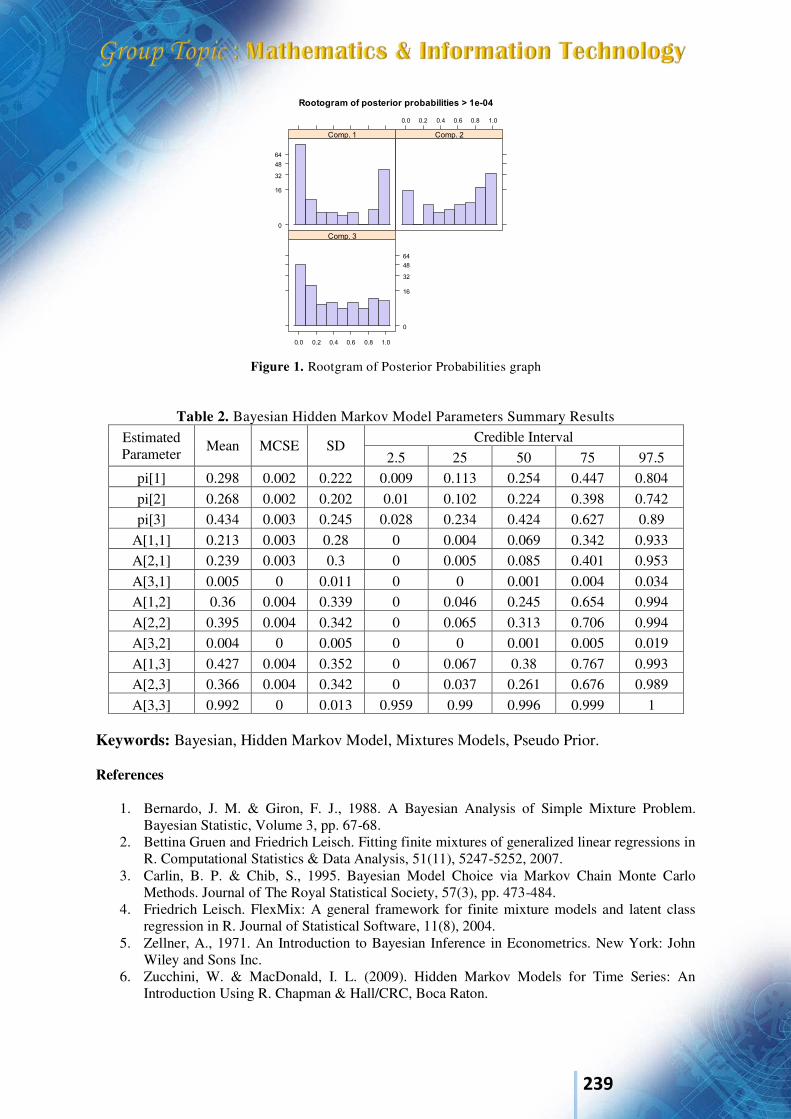
239
Figure 1. Rootgram of Posterior Probabilities graph
Table 2. Bayesian Hidden Markov Model Parameters Summary Results Estimated Parameter Mean MCSE SD
Credible Interval 2.5 25 50 75 97.5
pi[1] 0.298 0.002 0.222 0.009 0.113 0.254 0.447 0.804 pi[2] 0.268 0.002 0.202 0.01 0.102 0.224 0.398 0.742 pi[3] 0.434 0.003 0.245 0.028 0.234 0.424 0.627 0.89
A[1,1] 0.213 0.003 0.28 0 0.004 0.069 0.342 0.933 A[2,1] 0.239 0.003 0.3 0 0.005 0.085 0.401 0.953 A[3,1] 0.005 0 0.011 0 0 0.001 0.004 0.034 A[1,2] 0.36 0.004 0.339 0 0.046 0.245 0.654 0.994 A[2,2] 0.395 0.004 0.342 0 0.065 0.313 0.706 0.994 A[3,2] 0.004 0 0.005 0 0 0.001 0.005 0.019 A[1,3] 0.427 0.004 0.352 0 0.067 0.38 0.767 0.993 A[2,3] 0.366 0.004 0.342 0 0.037 0.261 0.676 0.989 A[3,3] 0.992 0 0.013 0.959 0.99 0.996 0.999 1
Keywords: Bayesian, Hidden Markov Model, Mixtures Models, Pseudo Prior. References
1. Bernardo, J. M. & Giron, F. J., 1988. A Bayesian Analysis of Simple Mixture Problem. Bayesian Statistic, Volume 3, pp. 67-68.
2. Bettina Gruen and Friedrich Leisch. Fitting finite mixtures of generalized linear regressions in R. Computational Statistics & Data Analysis, 51(11), 5247-5252, 2007.
3. Carlin, B. P. & Chib, S., 1995. Bayesian Model Choice via Markov Chain Monte Carlo Methods. Journal of The Royal Statistical Society, 57(3), pp. 473-484.
4. Friedrich Leisch. FlexMix: A general framework for finite mixture models and latent class regression in R. Journal of Statistical Software, 11(8), 2004.
5. Zellner, A., 1971. An Introduction to Bayesian Inference in Econometrics. New York: John Wiley and Sons Inc.
6. Zucchini, W. & MacDonald, I. L. (2009). Hidden Markov Models for Time Series: An Introduction Using R. Chapman & Hall/CRC, Boca Raton.
Rootogram of posterior probabilities > 1e-04
0
16
32
48
64
Comp. 1
0.0 0.2 0.4 0.6 0.8 1.0
Comp. 2
0.0 0.2 0.4 0.6 0.8 1.0
0
16
32
48
64
Comp. 3
240
International Conference on Natural Sciences, Mathematics, Applications, Research, and Technology
Manado, Indonesia, 22-23October 2020
Forecasting Indonesian Bank Companies’ Stock Prices using Geometric Brownian Motion Putu Kartika Dewi* and I Gusti Nyoman Yudi Hartawan
Mathematics Department, Universitas Pendidikan Ganesha, INDONESIA
(E-mail: [email protected], [email protected])
INTRODUCTION Most of the millennial generation no longer make real investments by buying land, houses or gold. Millennials are starting to look to financial investments such as bonds and stocks. To increase the interest of the younger generation to invest in the capital market, the Indonesian stock exchange (IDX) is promoting a stock saving campaign. This aims to increase the number of domestic investors who can improve the Indonesian economy (Indonesia Stock Exchange, 2020c). The advantage of saving in stocks over ordinary savings is that it can overcome inflation, so it is very suitable for long-term investment. However, saving on stocks is not a risk-free investment. Stock investors do not know the exact results they will get in the future (Sandri, Samsiah, & Rahmayanti, 2019). Investments in saving stocks have a high risk, because stock prices are volatile and stochastic (Karlina, Azam, & Sartono, 2018). Stock prices can change in seconds or minutes. This rapid up and down movement of stock prices is known as stock price volatility. The volatility of stock prices causes the risk faced by investors to be large, because investors cannot know with certainty the stock price in the future. The banking subsector is one of the subsectors traded on the capital market. There are 43 banks that are members of the Indonesian stock exchange (BEI), including: BBCA (Bank Central Asia), BBRI (Bank Rakyat Indonesia), and BMRI (Bank Mandiri) (Indonesia Stock Exchange, 2020a). The Geometric Brownian Motion stock price model assumes that past stock returns are normally distributed. Research related to this has been carried out by (DAI Maruddani & Ispriyanti, 2017) regarding stock price modeling with Geometric Brownian Motion and PT Ciputra Development Tbk's value at risk, (DIAI Maruddani, 2017) regarding the valuation of the share price of PT Aneka Tambang Tbk as IDX Best Blue 2016 winner. This study aims to determine a model to forecast some Indonesian bank companies stock prices. Assuming the stock return are normally distributed, the stock prices will be modeled using Geometric Brownian Motion. RESULTS AND DISCUSSION Based on the stock return formula
1
lni
ii
tS
tStR
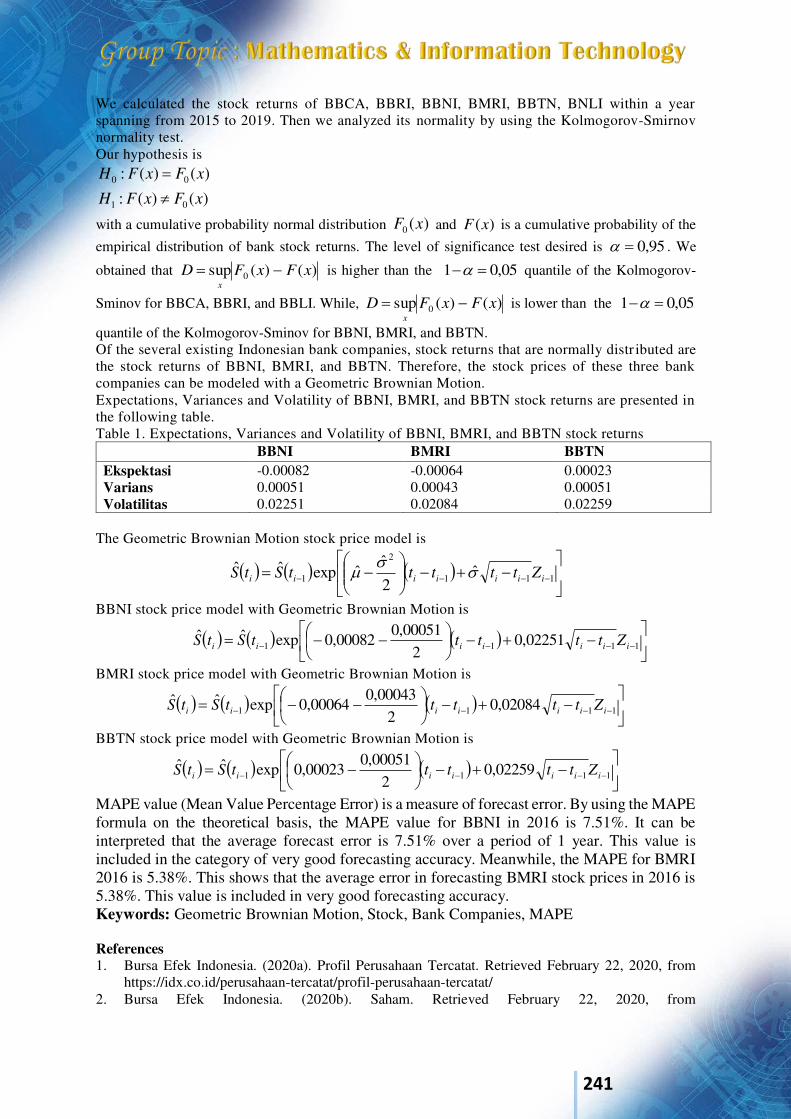
241
We calculated the stock returns of BBCA, BBRI, BBNI, BMRI, BBTN, BNLI within a year spanning from 2015 to 2019. Then we analyzed its normality by using the Kolmogorov-Smirnov normality test. Our hypothesis is
)()(: 00 xFxFH
)()(: 01 xFxFH
with a cumulative probability normal distribution )(0 xF and )(xF is a cumulative probability of the
empirical distribution of bank stock returns. The level of significance test desired is 95,0 . We
obtained that )()(sup 0 xFxFDx
is higher than the 05,01 quantile of the Kolmogorov-
Sminov for BBCA, BBRI, and BBLI. While, )()(sup 0 xFxFDx
is lower than the 05,01
quantile of the Kolmogorov-Sminov for BBNI, BMRI, and BBTN. Of the several existing Indonesian bank companies, stock returns that are normally distr ibuted are the stock returns of BBNI, BMRI, and BBTN. Therefore, the stock prices of these three bank companies can be modeled with a Geometric Brownian Motion. Expectations, Variances and Volatility of BBNI, BMRI, and BBTN stock returns are presented in the following table. Table 1. Expectations, Variances and Volatility of BBNI, BMRI, and BBTN stock returns
BBNI BMRI BBTN Ekspektasi -0.00082 -0.00064 0.00023 Varians 0.00051 0.00043 0.00051 Volatilitas 0.02251 0.02084 0.02259
The Geometric Brownian Motion stock price model is
111
2
1 ˆ2ˆˆexpˆˆ
iiiiiii ZtttttStS
BBNI stock price model with Geometric Brownian Motion is
1111 02251,0
200051,0
00082,0expˆˆiiiiiii ZtttttStS
BMRI stock price model with Geometric Brownian Motion is
1111 02084,0
200043,0
00064,0expˆˆiiiiiii ZtttttStS
BBTN stock price model with Geometric Brownian Motion is
1111 02259,0
200051,0
00023,0expˆˆiiiiiii ZtttttStS
MAPE value (Mean Value Percentage Error) is a measure of forecast error. By using the MAPE formula on the theoretical basis, the MAPE value for BBNI in 2016 is 7.51%. It can be interpreted that the average forecast error is 7.51% over a period of 1 year. This value is included in the category of very good forecasting accuracy. Meanwhile, the MAPE for BMRI 2016 is 5.38%. This shows that the average error in forecasting BMRI stock prices in 2016 is 5.38%. This value is included in very good forecasting accuracy. Keywords: Geometric Brownian Motion, Stock, Bank Companies, MAPE References 1. Bursa Efek Indonesia. (2020a). Profil Perusahaan Tercatat. Retrieved February 22, 2020, from
https://idx.co.id/perusahaan-tercatat/profil-perusahaan-tercatat/ 2. Bursa Efek Indonesia. (2020b). Saham. Retrieved February 22, 2020, from

242
https://idx.co.id/produk/saham/ 3. Bursa Efek Indonesia. (2020c). Yuk Nabung Saham. Retrieved February 19, 2020, from
http://yuknabungsaham.idx.co.id/ 4. Karlina, L., Azam, N., & Sartono, B. (2018). Pemodelan Volatilitas Return Saham : Studi Kasus
Pasar Saham Asia Modelling Volatility of Return Stock Index : Evidence from Asian Countries. Jurnal Ekonomi Dan Pembangunan Indonesia, 18(1), 35–52.
5. Lawrence, K. D., & Lawrence S. M. 2009. Fundamental of forecasting using excel. Washington: Industrial Press Inc.
6. Maruddani, D. A. I., & Ispriyanti, D. (2017). Pemodelan Harga Saham dengan Geometric Brownian Motion Dan Value At Risk PT Ciputra Development Tbk. Jurnal Gaussian, 6, 261–270.
7. Maruddani, D. I. A. I. (2017). Valuasi Harga Saham PT Aneka Tambang Tbk sebagai Peraih IDX Best Blue 2016. Statistika, 17(1), 33–43.
8. Sandri, S . H., Samsiah, S., & Rahmayanti, S. (2019). Investasi saham bagi pemula. Jurnal
Pengabdian UMRI, 3(1), 40–45.
243
International Conference on Natural Sciences, Mathematics, Applications, Research, and Technology
Manado, Indonesia, 22-23October 2020
Optimization The Schedule of Teaching and Learning at MI NW I Talun During Pandemic Covid-19 Kamalatul Azmi1, Bulqis Nebulla Syechah2, Ahmad Tedi Ruslan3, Nurhabibah4, Evi Yuniartika Asmarani5, and Ena Setiawana6
1, 2,3,4,5,6Departement of Mathemathic, Universitas Mataram, INDONESIA (E-mail: [email protected], [email protected], [email protected], [email protected], [email protected], [email protected]) INTRODUCTION Pandemic Covid-19 give impacts to many areas of life, include education in Indonesia. After government of Indonesia implement lockdown in few months, now we are in new normal era that is era where everyone can do any activities based on protocol covid-19. In New Normal Era students and teachers allowed to doing activities of Teaching and Learning by offline system based on protocol Covid-19, that is make the schedule not effective, such as at MI NW 1 Talun. At this school, every class have schedule to do activities of learning three times in a week. From that, in this research authors will offer a schedule that formulated based on variables teacher, students, class, classroom, days and time and also protocol covid-19. The methods of this research is genetic algorithm that is the method of optimization based on natural selection. The result of this research show that the new schedule more effective than before and every student or teacher can do activites of teaching and learning maximally and protected from covid-19. Genetic algorithm work based genetic principles and natural selection. The basic elements of natural genetic is reproduction, crossever and mutation. These elements that used in genetic algorithm such as TSP, VRP, crew-scheduling untul control problem. By determined procedure such as mutation, selection and crossever, finally will found the optimal solution [1]. RESULTS AND DISCUSSION The first step of genetic algorithm is formulate chromosomes. The formulation of chromosome consist of full schedule and expected schedule. The schedule consist of column that is class and row that is class periods. Based on protocol covid-19, every classroom not allowed more then 20 students, so every class will devide in class A and B. The schedule of class A is Monday, Tuesday and Wednesday, and the schedule of class B is Thursday, Friday and Saturday. Gen of that chromosome is code of subjects and code of teachers. There are 13 teachers that will teach during pandemic covid-19. The next step is define fitness and fitness of each chromosome. The value of fitness that expected is 1. And then select 4 chromosomes randomly as parent and do the crossever to get offspring, and then select gens that will be mutation. In this research we use mutation change position that is row and 7 will be change. After that we will get new population and count the fitness. Do the iterations until we get chromosome with fitness is 1 and that chromosome is the effective schedule.
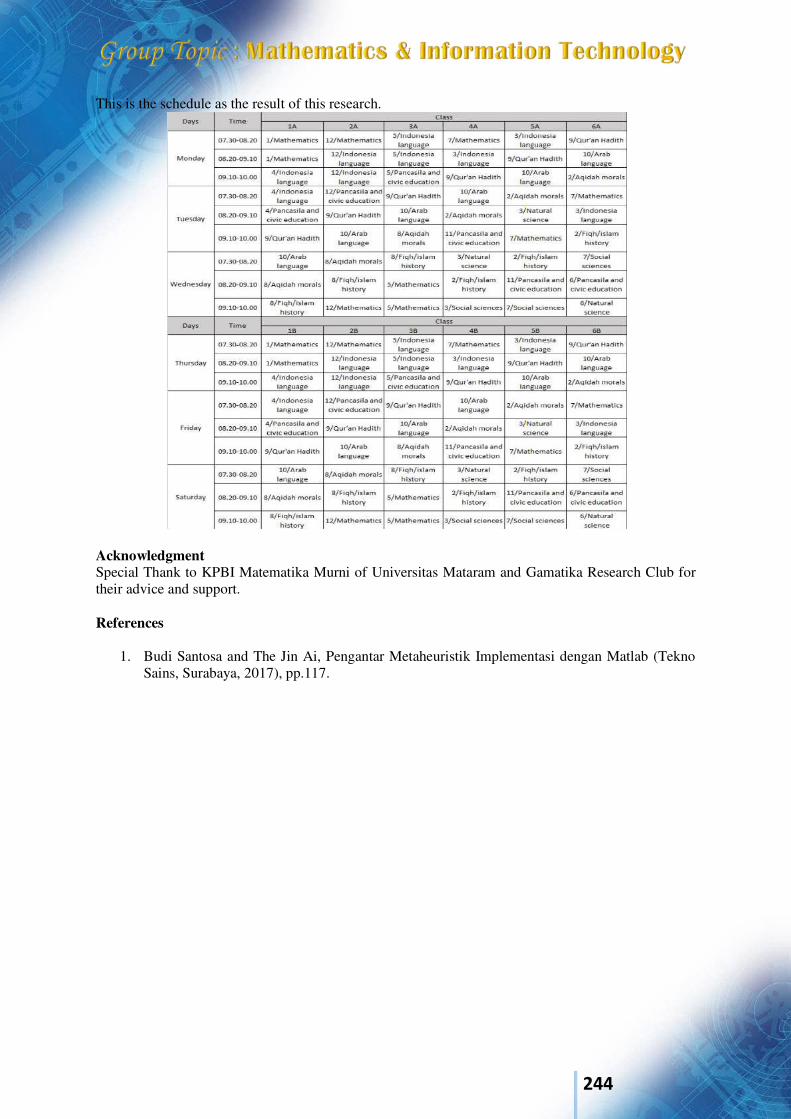
244
This is the schedule as the result of this research.
Acknowledgment Special Thank to KPBI Matematika Murni of Universitas Mataram and Gamatika Research Club for their advice and support. References
1. Budi Santosa and The Jin Ai, Pengantar Metaheuristik Implementasi dengan Matlab (Tekno Sains, Surabaya, 2017), pp.117.
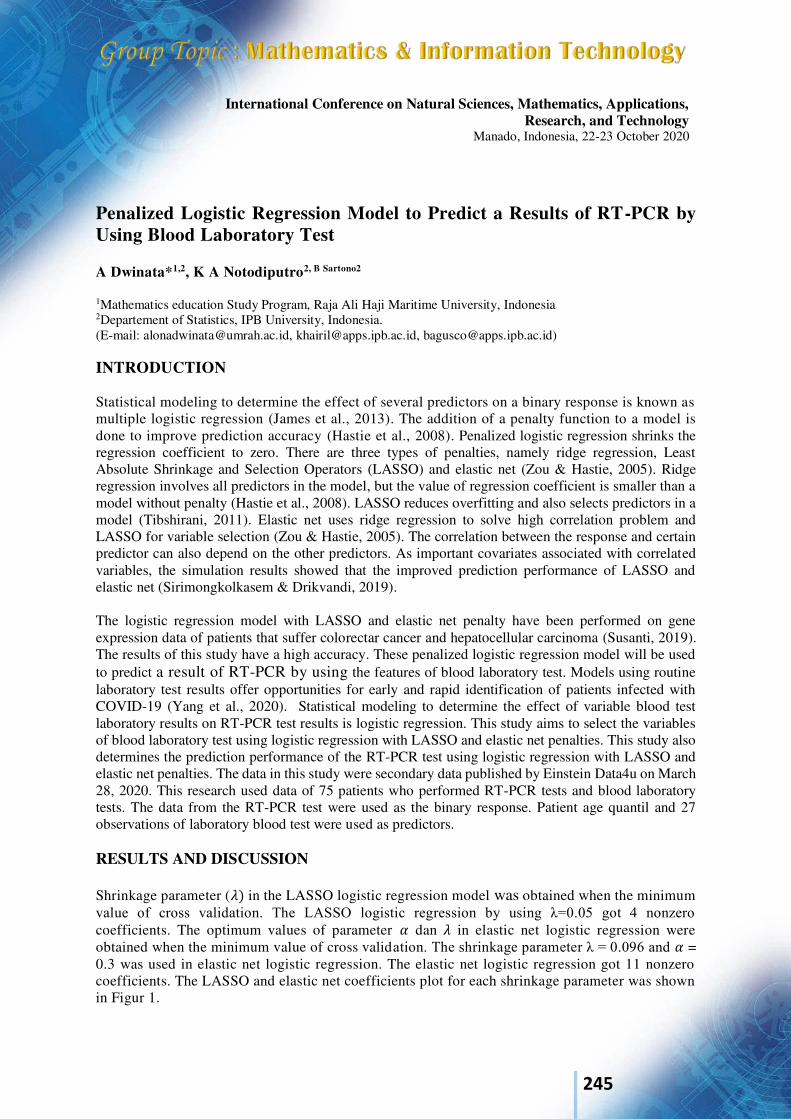
245
International Conference on Natural Sciences, Mathematics, Applications, Research, and Technology
Manado, Indonesia, 22-23 October 2020
Penalized Logistic Regression Model to Predict a Results of RT-PCR by Using Blood Laboratory Test A Dwinata*1,2, K A Notodiputro2, B Sartono2
1Mathematics education Study Program, Raja Ali Haji Maritime University, Indonesia 2Departement of Statistics, IPB University, Indonesia. (E-mail: [email protected], [email protected], [email protected]) INTRODUCTION Statistical modeling to determine the effect of several predictors on a binary response is known as multiple logistic regression (James et al., 2013). The addition of a penalty function to a model is done to improve prediction accuracy (Hastie et al., 2008). Penalized logistic regression shrinks the regression coefficient to zero. There are three types of penalties, namely ridge regression, Least Absolute Shrinkage and Selection Operators (LASSO) and elastic net (Zou & Hastie, 2005). Ridge regression involves all predictors in the model, but the value of regression coefficient is smaller than a model without penalty (Hastie et al., 2008). LASSO reduces overfitting and also selects predictors in a model (Tibshirani, 2011). Elastic net uses ridge regression to solve high correlation problem and LASSO for variable selection (Zou & Hastie, 2005). The correlation between the response and certain predictor can also depend on the other predictors. As important covariates associated with correlated variables, the simulation results showed that the improved prediction performance of LASSO and elastic net (Sirimongkolkasem & Drikvandi, 2019). The logistic regression model with LASSO and elastic net penalty have been performed on gene expression data of patients that suffer colorectar cancer and hepatocellular carcinoma (Susanti, 2019). The results of this study have a high accuracy. These penalized logistic regression model will be used to predict a result of RT-PCR by using the features of blood laboratory test. Models using routine laboratory test results offer opportunities for early and rapid identification of patients infected with COVID-19 (Yang et al., 2020). Statistical modeling to determine the effect of variable blood test laboratory results on RT-PCR test results is logistic regression. This study aims to select the variables of blood laboratory test using logistic regression with LASSO and elastic net penalties. This study also determines the prediction performance of the RT-PCR test using logistic regression with LASSO and elastic net penalties. The data in this study were secondary data published by Einstein Data4u on March 28, 2020. This research used data of 75 patients who performed RT-PCR tests and blood laboratory tests. The data from the RT-PCR test were used as the binary response. Patient age quantil and 27 observations of laboratory blood test were used as predictors. RESULTS AND DISCUSSION Shrinkage parameter (𝜆) in the LASSO logistic regression model was obtained when the minimum value of cross validation. The LASSO logistic regression by using λ=0.05 got 4 nonzero coefficients. The optimum values of parameter 𝛼 dan 𝜆 in elastic net logistic regression were obtained when the minimum value of cross validation. The shrinkage parameter λ = 0.096 and 𝛼 = 0.3 was used in elastic net logistic regression. The elastic net logistic regression got 11 nonzero coefficients. The LASSO and elastic net coefficients plot for each shrinkage parameter was shown in Figur 1.
246
Figur 1. The LASSO and elastic net coefficients plot for each shrinkage parameter
The prediction performance of a RT-PCR test using logistic regression with LASSO and elastic net penalties with the significance level 5% showed that the average value of accuracy and AUC of LASSO was better than elastic net. The LASSO logistic regression model had a better performance for predicting the RT-PCR test with 88% accuracy and 93% AUC. Based on the result of LASSO logistic regression model, the features of laboratory blood tests that affect a RT-PCR test were leukocytes, basophils, RDW and C-reactive protein. The leukocytes odds ratio was 0.4. It means that an increase in leukocytes (103/𝜇l) will decrease the chances of a positive RT-PCR test 0.4 times compared to before the increase. The basophils odds ratio was 0.64. It means that an increase in 1% basophils will decrease the chances of a positive RT-PCR test 0.64 times compared to before the increase. The RDW odds ratio was 0.99. It means that an increase in 1% RDW will decrease the chances of a RT-PCR test is positive 0.99 times compared to before the increase. The C-reactive protein odds ratio was 1.48. It means that a positive change of one milligram of C-reactive protein per liter of blood (mg/L) will increase the chances of a positive RT-PCR test 1.48 times compared to before a positive change. Keywords: Logistic Regression, LASSO, Elastic Net, COVID-19. Acknowledgment The authors would like to thank to all persons who contributed to the improvement of this paper. References
1. Hastie, T., Tibshirani, R., & Friedman, J. (2008). Springer Series in Statistics. In The Elements
of Statistical Learning (Vol. 27, Issue 2). Springer New York. https://doi.org/10.1007/b94608 2. James, G., Witten, D., Hastie, T., & Tibishirani, R. (2013). An Introduction to Statistical
Learning with Applications in R (older version). In Springer Texts in Statistics. 3. Sirimongkolkasem, T., & Drikvandi, R. (2019). On Regularisation Methods for Analysis of
High Dimensional Data. Annals of Data Science, 6(4), 737–763. https://doi.org/10.1007/s40745-019-00209-4
4. Susanti, A. (2019). Perbandingan Metode Regresi Logistik Terpenalti Pada Data Ekspresi Gen. Thesis. Institut Pertanian Bogor.
5. Tibshirani, R. (2011). Regression shrinkage and selection via the lasso: A retrospective. Journal
of the Royal Statistical Society. Series B: Statistical Methodology, 73(3), 273–282. https://doi.org/10.1111/j.1467-9868.2011.00771.x
6. Yang, H. S., Hou, Y., Vasovic, L. V, Steel, P., Chadburn, A., Racine-Brzostek, S. E., Velu, P., Cushing, M. M., Loda, M., Kaushal, R., Zhao, Z., & Wang, F. (2020). Routine laboratory blood tests predict SARS-CoV-2 infection using machine learning. Clinical Chemistry. https://doi.org/10.1093/clinchem/hvaa200
7. Zou, H., & Hastie, T. (2005). Regularization and variable selection via the elastic net. Journal
of the Royal Statistical Society. Series B: Statistical Methodology, 67(2), 301–320. https://doi.org/10.1111/j.1467-9868.2005.00503.x

247
International Conference on Natural Sciences, Mathematics, Applications, Research, and Technology
Manado, Indonesia, 22-23 October 2020
Stability Analysis of HIV/AIDS Model with Three Control Strategies and Saturated Incidence Rate Marsudi*1, Trisilowati2, Agus Suryanto and Isnani Darti3
1, 2, 3Mathematics Department, University of Brawijaya, Malang, INDONESIA. (E-mail: [email protected], [email protected], [email protected], [email protected]) INTRODUCTION The development of the HIV/AIDS epidemic in the world has made HIV/AIDS a global problem and is increasingly becoming a public health problem in the world. To accelerate HIV/AIDS prevention efforts, it is very important to combine prevention control between behaviour strategy and biomedical strategy [1]. Mathematical models have been used extensively to study the dynamics of HIV/AIDS transmission. The models [2, 3] include behaviour control through disease information campaigns given to the public as a control. A model of HIV/AIDS screening of unaware infective and treatment (therapy) is presented in [4, 5] and it concluded that the screening of unaware infective and treatment of screened infective can be reduce the spread of the HIV/AIDS. In the formulation of epidemic models, some authors include the incidence rate of a disease (see 6, 7] and the references therein). The incidence rate of disease is the rate at which new cases of infection appear in a population due to existence significant contacts between susceptible individuals and infected individuals. RESULTS AND DISCUSSION The total population (N) is devided into seven compartments of susceptibles (S), susceptible who the abstinence, be faithful (AB) behavior due to education campaign (S1), susceptible who use condom (C) behavior due to education campaign (S2), unaware infected (I1), aware (screened) infected (I2), treated (T), and full-blown AIDS (A). The dynamics of HIV/AIDS with three control measures and saturated incidence rate can be represented by the following system of nonlinear ODE’s:
1 2
11 1 1 1
22 2 2 2
11 1 2 2 1 1
21 2 2
2 3
1 1 2 2 3
( )
(1 )
(1 )
(1 ) (1 ) ( )
( )
( )
( )
dSE E S S
dtdS
E S S Sdt
dSE S S S
dtdI
S S S IdtdI
I IdtdT
I TdtdA
I I T Adt
(1)
248
where 1 1 2 2 1 2( ) (1 ( )).I I T I I T The model (1) has a disease-free equilibrium is
given by 1 20
1 2 1 2 1 2
, , , 0, 0, 0 .( ) ( )
E EE
E E E E E E
Using the next-
generation operator ([8]), the basic reproduction number 0R is given by
1 20
P PPR
QK QKL QKLM
(2)
where 1 1 2 2 1 2 1 2, , , ,P k E k E Q E E K L
3 1 1 2 2, , 1 , 1 .M W k k The second of equilibria of the model (1) is the existence of endemic equilibrium
* * * * * * *! 1 2 1 2, , , , , ,E S S S I I T A which have been obtained from the steady states of the model (1).
Components of 1E the can are expressed in the terms of * from the unique positive real root of the cubic polynomial. Theoretical results show that the disease-free equilibrium 0E is locally and globally asymptotically stable when 0 1.R The endemic equilibrium 1E is globally asymptotically stable for a special case when 0 1R and we have proven by use Lyapunov direct method as presented by [9]. Furthermore, using the normalised forward sensitivity index method show that the model parameter effective contact rates of susceptible with infected individuals ( ) and recruitment rate of susceptible into the sexually active population ( ) are most sensitive parameters to HIV/AIDS transmission. Keywords: HIV/AIDS model; basic reproduction number; saturated incidence; global stability; Lyapunov function; sensitivity analysis. Acknowledgment This work was partially supported by the University of Brawijaya on the doctoral program in mathematics at the University of Brawijaya. References
1. L. G. Bekker, C. Beyrer and T. C. Quinn, Cold Spring Harb Perspect Med., 2, 1-23 (2012). 2. H. R., Joshi, S. Lenhart, S. Hota and F. Agusto, Electronic Journal of Differential Equations,
2015, 1-14 (2015). 3. Marsudi, Trisilowati, A. Suryanto and I. Darti, IOP Conf. Series: Journal of Physics: Conf.
Series, 1227 (2019), 012034. 4. K. O. Okosun, O. D. Makinde and I. Takaidza, Applied Mathematical Modelling, 37, 3802-
3820 (2013). 5. R. Safiel, E. S. Massawe and O. D. Makinde, American Journal of Mathematics and Statistics,
2, 75-88 (2012). 6. O. Sharomi, C. N. Podder, A. B. Gumel, E. H. Elbasha and J. Watmough, Mathematical
Biosciences, 210 (2), 436–463 (2007). 7. E. L. Kateme, J. M. Tchuenche, S. D. Hove-Musekwa, ISRN Applied Mathematics,
Article ID 864795 (2012). 8. P. van den Driessche and J. Watmough, Mathematical Biosciences, 180, 29–48 (2002). 9. M. A. Safi, Mathematics, 7, 350 (2019).
249
International Conference on Natural Sciences, Mathematics, Applications, Research, and Technology
Manado, Indonesia, 22-23 October 2020
Dynamical Behavior of an HIV/AIDS Epidemic Model with Saturated Incidence Rate and Treatment Marsudi*1, B. Sugandi2 and Darmajid3
1, 2, 3Mathematics Department, University of Brawijaya, Malang, INDONESIA. (E-mail: [email protected], [email protected], [email protected])
INTRODUCTION Mathematical modelling plays an essential role in the management and control of an epidemic of infectious diseases such as HIV/AIDS. HIV/AIDS has become a global problem and has become a real public health problem in the world. The incidence rate of a disease is the rate at which new cases of infection appear in a population and has a vital role in studying epidemiological mathematics [1]. The incidence rate of infection states the number of new cases of infection due to interactions between susceptible individuals and infected individuals. The rationale for using the saturation incidence rates is that many significant contacts between susceptible individuals and infected individuals saturate at high levels due to changes in the behavior or population of infected individuals (see [2-5] and the references therein). A model of HIV/AIDS screening of unaware infective and treatment (therapy) is presented in [6-9] and it concluded that the screening of unaware infective and treatment (therapy) of screened infective has the effect of reducing the spread of the HIV/AIDS transmission. In this paper, an HIV/AIDS epidemic model with saturated incidence rate and treatment is formulated. We study the stability of the disease-free equilibrium and the unique endemic equilibrium associated with the basic reproduction number. The numerical simulations are carried out to verify the analytical results. RESULTS AND DISCUSSION We consider a sexually active population and the total population (N) is divided into five distinct subclasses: susceptibles individuals (S), infective individuals (I), pre-AIDS individuals (P), treated individuals (T), and AIDS individuals (A). We establish the following HIV/AIDS epidemic model of ordinary differential equations.
1
1 2
3
2 3
( , , )
( , , ) ( )
( )
( )
( )
dSI P T S S
dt
dII P T S I
dt
dPI P
dt
dTP T
dt
dAP T A
dt
(1)

250
where 1 2( , , ) ( ) (1 ( ))I P T I k P k T I P T . The system (1) will be analyzed in a
suitable feasible region 5( , , , , ) .S I P T A R S I P T A
Using the next-generation
matrix method as described in [10], we find the basic reproduction number of the system (1).
1 1 2 10 .
k kR
Q QK QKL
(2)
where 1 2 3, , , .Q K L M
Model (1) has mainly two equilibrium: the disease-free equilibrium 0 ,0,0,0,0E and the
endemic equilibrium * * * * *1 , , , ,E S I P T A ,
* *** * * *1 1
* *, , , ,
( )
I IS I P T
K KLQ
** 1 2 3 1( )
,L I
AKLM
and *
01 2
1 .(1 )
QR
w w Q
In this paper, we formulated an HIV/AIDS epidemic model with saturation incidence rate and treatment. Some of the theoretical and epidemiological findings of the study are as follows: (i) If 0 1,R the disease-free equilibrium 0E of the system (1) is locally asymptotically stable and
unstable if 0 1.R
(ii) If 0 1,R the disease-free equilibrium 0E of the system (1) is globally asymptotically stable.
(iii) If 01 1,R the endemic equilibrium 1E of the system (1) with 0 is globally asymptotically stable in 0\ .
Hence, 01 0 0R R and 50 ( , , , , ) 0 .S I P T A I P T A R The model (1) with 0 has
the same unique endemic equilibrium as the system (1). Keywords: HIV/AIDS model; saturation incidence; basic reproduction number; global stability; treatment. Acknowledgment This work was part of DPP/SPP research in Faculty of MIPA which supported by the University of Brawijaya with Contract No. 38/UN10.F09.1/ PN/2020, dated April 23, 2020. References
1. J. Zhang and Z. Ma, Math. Biosci., 185, 15-32 (2003). 2. V. Capasso and G. Serio, Mathematical Biosciences, 42, 43-61 (1978). 3. Z. Jiang and J. Wei, Chaos, Solitons and Fractals, Vol. 35, 609-619 (2008). 4. S. Ruan and W. Wang, J. Differ. Equ., 188, 135-163 (2003). 5. O. Sharomi, C. N. Podder, A. B. Gumel, E. H. Elbasha and J. Watmough, Mathematical
Biosciences, 210 (2), 436–463 (2007). 6. R. Safiel, E. S. Massawe and O. D. Makinde, American Journal of Mathematics and Statistics,
2, 75-88 (2012). 7. K. O. Okosun, O. D. Makinde and I. Takaidza, Applied Mathematical Modelling, 37, 3802-
3820 (2013). 8. Hai-Feng Huo and Li-Xiang Feng, Applied Mathematical Modelling, 37, 1480-1489 (2013) 9. Marsudi, Marjono and A. Andari, Applied Mathematical Sciences, 8, 7749-7763 (2014). 10. P. van den Driessche and J. Watmough, Mathematical Biosciences, 180, 29–48 (2002).
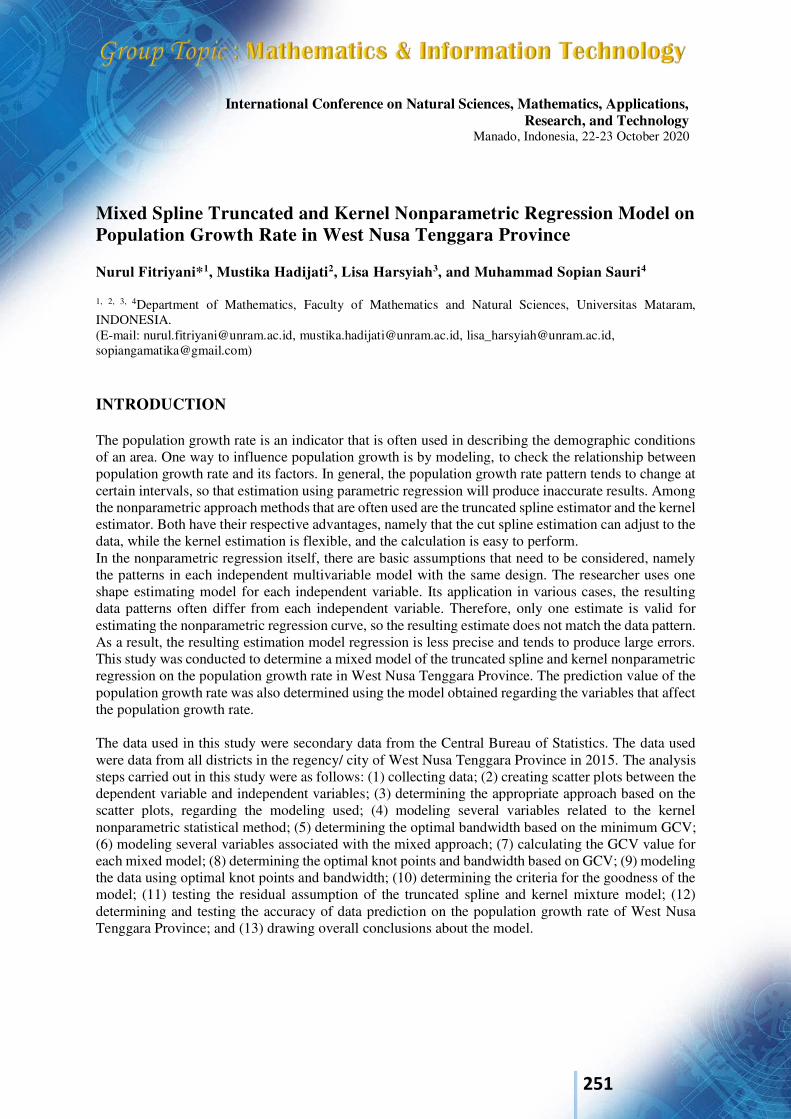
251
International Conference on Natural Sciences, Mathematics, Applications, Research, and Technology
Manado, Indonesia, 22-23 October 2020
Mixed Spline Truncated and Kernel Nonparametric Regression Model on Population Growth Rate in West Nusa Tenggara Province Nurul Fitriyani*1, Mustika Hadijati2, Lisa Harsyiah3, and Muhammad Sopian Sauri4
1, 2, 3, 4Department of Mathematics, Faculty of Mathematics and Natural Sciences, Universitas Mataram, INDONESIA. (E-mail: [email protected], [email protected], [email protected], [email protected]) INTRODUCTION The population growth rate is an indicator that is often used in describing the demographic conditions of an area. One way to influence population growth is by modeling, to check the relationship between population growth rate and its factors. In general, the population growth rate pattern tends to change at certain intervals, so that estimation using parametric regression will produce inaccurate results. Among the nonparametric approach methods that are often used are the truncated spline estimator and the kernel estimator. Both have their respective advantages, namely that the cut spline estimation can adjust to the data, while the kernel estimation is flexible, and the calculation is easy to perform. In the nonparametric regression itself, there are basic assumptions that need to be considered, namely the patterns in each independent multivariable model with the same design. The researcher uses one shape estimating model for each independent variable. Its application in various cases, the resulting data patterns often differ from each independent variable. Therefore, only one estimate is valid for estimating the nonparametric regression curve, so the resulting estimate does not match the data pattern. As a result, the resulting estimation model regression is less precise and tends to produce large errors. This study was conducted to determine a mixed model of the truncated spline and kernel nonparametric regression on the population growth rate in West Nusa Tenggara Province. The prediction value of the population growth rate was also determined using the model obtained regarding the variables that affect the population growth rate. The data used in this study were secondary data from the Central Bureau of Statistics. The data used were data from all districts in the regency/ city of West Nusa Tenggara Province in 2015. The analysis steps carried out in this study were as follows: (1) collecting data; (2) creating scatter plots between the dependent variable and independent variables; (3) determining the appropriate approach based on the scatter plots, regarding the modeling used; (4) modeling several variables related to the kernel nonparametric statistical method; (5) determining the optimal bandwidth based on the minimum GCV; (6) modeling several variables associated with the mixed approach; (7) calculating the GCV value for each mixed model; (8) determining the optimal knot points and bandwidth based on GCV; (9) modeling the data using optimal knot points and bandwidth; (10) determining the criteria for the goodness of the model; (11) testing the residual assumption of the truncated spline and kernel mixture model; (12) determining and testing the accuracy of data prediction on the population growth rate of West Nusa Tenggara Province; and (13) drawing overall conclusions about the model.
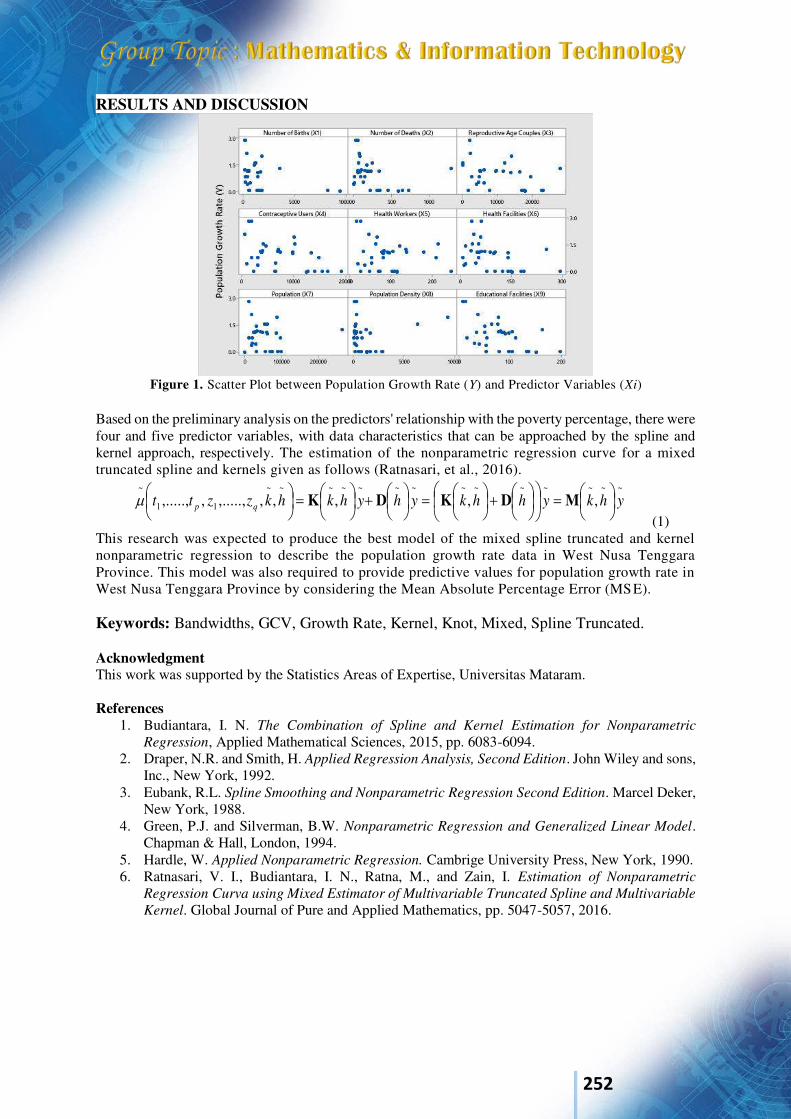
252
RESULTS AND DISCUSSION
Figure 1. Scatter Plot between Population Growth Rate (Y) and Predictor Variables (Xi)
Based on the preliminary analysis on the predictors' relationship with the poverty percentage, there were four and five predictor variables, with data characteristics that can be approached by the spline and kernel approach, respectively. The estimation of the nonparametric regression curve for a mixed truncated spline and kernels given as follows (Ratnasari, et al., 2016).
~~~~~~~~~~~~~~
11
~
,,,,,,.....,,,....., yhkyhhkyhyhkhkzztt qp
MDKDK
(1) This research was expected to produce the best model of the mixed spline truncated and kernel nonparametric regression to describe the population growth rate data in West Nusa Tenggara Province. This model was also required to provide predictive values for population growth rate in West Nusa Tenggara Province by considering the Mean Absolute Percentage Error (MSE). Keywords: Bandwidths, GCV, Growth Rate, Kernel, Knot, Mixed, Spline Truncated. Acknowledgment This work was supported by the Statistics Areas of Expertise, Universitas Mataram. References
1. Budiantara, I. N. The Combination of Spline and Kernel Estimation for Nonparametric
Regression, Applied Mathematical Sciences, 2015, pp. 6083-6094. 2. Draper, N.R. and Smith, H. Applied Regression Analysis, Second Edition. John Wiley and sons,
Inc., New York, 1992. 3. Eubank, R.L. Spline Smoothing and Nonparametric Regression Second Edition. Marcel Deker,
New York, 1988. 4. Green, P.J. and Silverman, B.W. Nonparametric Regression and Generalized Linear Model.
Chapman & Hall, London, 1994. 5. Hardle, W. Applied Nonparametric Regression. Cambrige University Press, New York, 1990. 6. Ratnasari, V. I., Budiantara, I. N., Ratna, M., and Zain, I. Estimation of Nonparametric
Regression Curva using Mixed Estimator of Multivariable Truncated Spline and Multivariable
Kernel. Global Journal of Pure and Applied Mathematics, pp. 5047-5057, 2016.
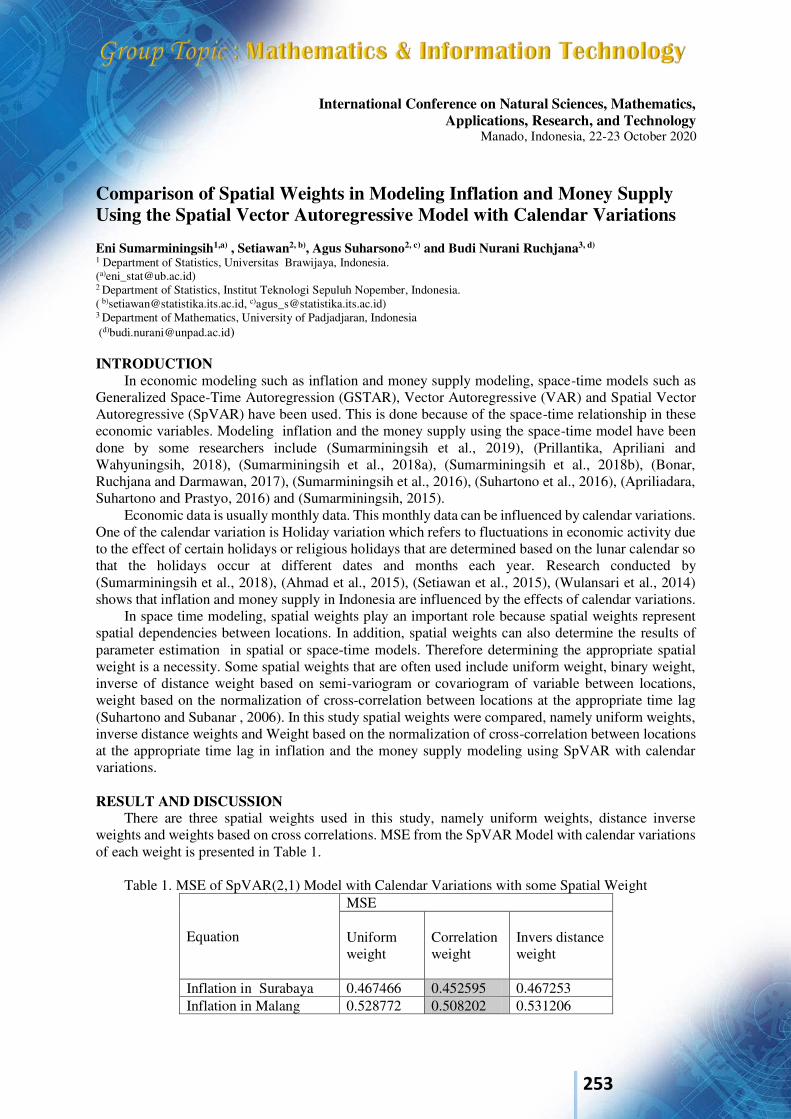
253
International Conference on Natural Sciences, Mathematics, Applications, Research, and Technology
Manado, Indonesia, 22-23 October 2020
Comparison of Spatial Weights in Modeling Inflation and Money Supply Using the Spatial Vector Autoregressive Model with Calendar Variations Eni Sumarminingsih1,a) , Setiawan2, b), Agus Suharsono2, c) and Budi Nurani Ruchjana3, d) 1 Department of Statistics, Universitas Brawijaya, Indonesia. (a)[email protected]) 2 Department of Statistics, Institut Teknologi Sepuluh Nopember, Indonesia. ( b)[email protected], c)[email protected]) 3 Department of Mathematics, University of Padjadjaran, Indonesia (d)[email protected]) INTRODUCTION
In economic modeling such as inflation and money supply modeling, space-time models such as Generalized Space-Time Autoregression (GSTAR), Vector Autoregressive (VAR) and Spatial Vector Autoregressive (SpVAR) have been used. This is done because of the space-time relationship in these economic variables. Modeling inflation and the money supply using the space-time model have been done by some researchers include (Sumarminingsih et al., 2019), (Prillantika, Apriliani and Wahyuningsih, 2018), (Sumarminingsih et al., 2018a), (Sumarminingsih et al., 2018b), (Bonar, Ruchjana and Darmawan, 2017), (Sumarminingsih et al., 2016), (Suhartono et al., 2016), (Apriliadara, Suhartono and Prastyo, 2016) and (Sumarminingsih, 2015).
Economic data is usually monthly data. This monthly data can be influenced by calendar variations. One of the calendar variation is Holiday variation which refers to fluctuations in economic activity due to the effect of certain holidays or religious holidays that are determined based on the lunar calendar so that the holidays occur at different dates and months each year. Research conducted by (Sumarminingsih et al., 2018), (Ahmad et al., 2015), (Setiawan et al., 2015), (Wulansari et al., 2014) shows that inflation and money supply in Indonesia are influenced by the effects of calendar variations.
In space time modeling, spatial weights play an important role because spatial weights represent spatial dependencies between locations. In addition, spatial weights can also determine the results of parameter estimation in spatial or space-time models. Therefore determining the appropriate spatial weight is a necessity. Some spatial weights that are often used include uniform weight, binary weight, inverse of distance weight based on semi-variogram or covariogram of variable between locations, weight based on the normalization of cross-correlation between locations at the appropriate time lag (Suhartono and Subanar , 2006). In this study spatial weights were compared, namely uniform weights, inverse distance weights and Weight based on the normalization of cross-correlation between locations at the appropriate time lag in inflation and the money supply modeling using SpVAR with calendar variations. RESULT AND DISCUSSION
There are three spatial weights used in this study, namely uniform weights, distance inverse weights and weights based on cross correlations. MSE from the SpVAR Model with calendar variations of each weight is presented in Table 1.
Table 1. MSE of SpVAR(2,1) Model with Calendar Variations with some Spatial Weight
Equation
MSE
Uniform weight
Correlation weight
Invers distance
weight
Inflation in Surabaya 0.467466 0.452595 0.467253 Inflation in Malang 0.528772 0.508202 0.531206
254
Inflation in Kediri 0.925423 0.924263 0.926935 Inflation in Jember 0.64156 0.633298 0.644928 Money Supply in Surabaya 0.732718 0.737825 0.734882
Money Supply in Malang 0.056566 0.057929 0.056964
Money Supply in Kediri 0.123183 0.124271 0.123245 Money Supply in Jember 0.026587 0.027222 0.026522
Total MSE 3.502275 3.465605 3.511935 According to Table 1, the SpVAR (2,1) model with calendar variation with correlation weights has
four equations that has the smallest MSE. While the SpVAR(2,1) model with calendar variation with uniform weights has one equation that has the smallest MSE and the SpVAR (2.1) model with calendar variation with inverse distance weight has three equations with the smallest MSE. The smallest total MSE is owned by the SpVAR (2.1) model with calendar variation with correlation weights, so this model is chosen as the best model. However, it should be noted that the MSE values of the three models are almost the same, the difference is smaller than 1 percent. Keywords: Spatial Vector Autoregressive, Inflation, Money Supply, Spatio-Temporal, Spatial weight, Calendar Variation Reference 1. Ahmad, I. S. et al. (2015) ‘Forecasting of monthly inflow and outflow currency using time series
regression and ARIMAX: The Idul Fitri effect’, in AIP Conference Proceedings 1691. AIP Publishing. doi: 10.1063/1.4937084.
2. Apriliadara, M., Suhartono and Prastyo, D. D. (2016) ‘VARI-X Model for Currency Inflow and Outflow Forecasting with Eid Fitr Effect in Indonesia’, in AIP Conference Proceedings 1746. doi: 10.1063/1.4953966.
3. Bonar, H., Ruchjana, B. N. and Darmawan, G. (2017) ‘Development of generalized space time autoregressive integrated with ARCH error (GSTARI – ARCH) model based on consumer price index phenomenon at several cities in North Sumatera province’, in AIP Conference Proceedings
1827. AIP Publishing. doi: 10.1063/1.4979425. 4. Di Giacinto, V. (2010) ‘On Vector Autoregressive Modeling in Space and Time’, Journal of
Geographical Systems, 12, pp. 125–154. 5. Eksiandayani, S., Suhartono and Prastyo, D. D. (2015) ‘Hybrid ARIMAX-NN Model for Forecasting
Inflation’, in International Conference on Science, Technology and Humanity, pp. 181–187. 6. Gul, S. and Iqbal, H. (2011) ‘The Impact of money supply on Inflation in Pakistan’, Interdisciplinary
Journal of Contemporary Research in Business, 3(8), pp. 398–423. 7. Levin, A., Lin, C. F. and Chu, C.-S. . (2002) ‘Unit root tests in panel data: Asymptotic and finite
sample properties’, Journal of Econometrics, 108, pp. 1–22. 8. Prillantika, J. R., Apriliani, E. and Wahyuningsih, N. (2018) ‘Comparison between GSTAR and
GSTAR-Kalman Filter models on inflation rate forecasting in East Java’, Journal of Physics:
Conference Series. IOP Publishing, 974(012039), pp. 1–10. doi: 10.1088/1742-6596/974/1/012039. 9. Setiawan et al. (2015) ‘Configuring calendar variation based on time series regression method for
forecasting of monthly currency inflow and outflow in Central Java’, in AIP Conference Proceedings
1691. AIP Publishing, pp. 050024-1-050024-8. 10. Simwaka, K. et al. (2012) ‘Money Supply and Inflation in Malawi: An Econometric Investigation’,
The International Journal of Applied Economics and Finance, 6(3), pp. 74–88. 11. Sola, O. and Peter, A. (2013) ‘Money Supply and Inflation in Nigeria : Implications for National
Development’, Modern Economy, 4(March), pp. 161–170. 12. Suhartono et al. (2016) ‘GSTARX-GLS Model for Spatio-Temporal Data Forecasting’, Malaysian
Journal of Mathematical Sciences, 10(S), pp. 91–103.

255
13. Suhartono and Subanar (2006) ‘The Optimal Determination of Space Weight in GSTAR Model by using Cross-correlation Inference’, Quantitative Methods, 2(2), pp. 45–53.
14. Sumarminingsih, E. (2015) ‘Spatio – Temporal Analysis of Inflation Rate in East Java , Indonesia : Vector Autoregressive Approach’, International Journal of Applied Mathematics and Statistics, 53(5), pp. 16–23.
15. Sumarminingsih, E. et al. (2016) ‘Spatio-Temporal Analysis of Inflation Rate : Vector Autoregressive Approach with Calendar Effect’, in International Conference on Theoretical and
Applied Statistics. Surabaya. 16. Sumarminingsih, E. et al. (2018) ‘Spatial Vector Autoregressive Model with Calendar Variation for
East Java Inflation and Money Supply’, Applied Mathematics & Information Sciences, 12(6), pp. 1157–1163. doi: 10.18576/amis/120610.
17. Sumarminingsih, E. et al. (2019) ‘Modeling Inflation and Money Supply using Spatial Vector Autoregressive Model with Calendar Variation : Restricted vs Non- restricted Coefficient Modeling Inflation and Money Supply using Spatial Vector Autoregressive Model with Calendar Variation : Restr’, in IOP Conference Series: Material Science and Engineering 546 (052075). doi: 10.1088/1757-899X/546/5/052075.
19. Wulansari, R. E. et al. (2014) ‘Penerapan Time Series Regression with Calendar Variation Effect pada Data Netflow Uang Karta Bank Indonesia Sebagai Solusi Kontrol Likuiditas Perbankan di Indonesia’, STATISTIKA: Forum Teori dan Aplikasi Statistika, 14(2).
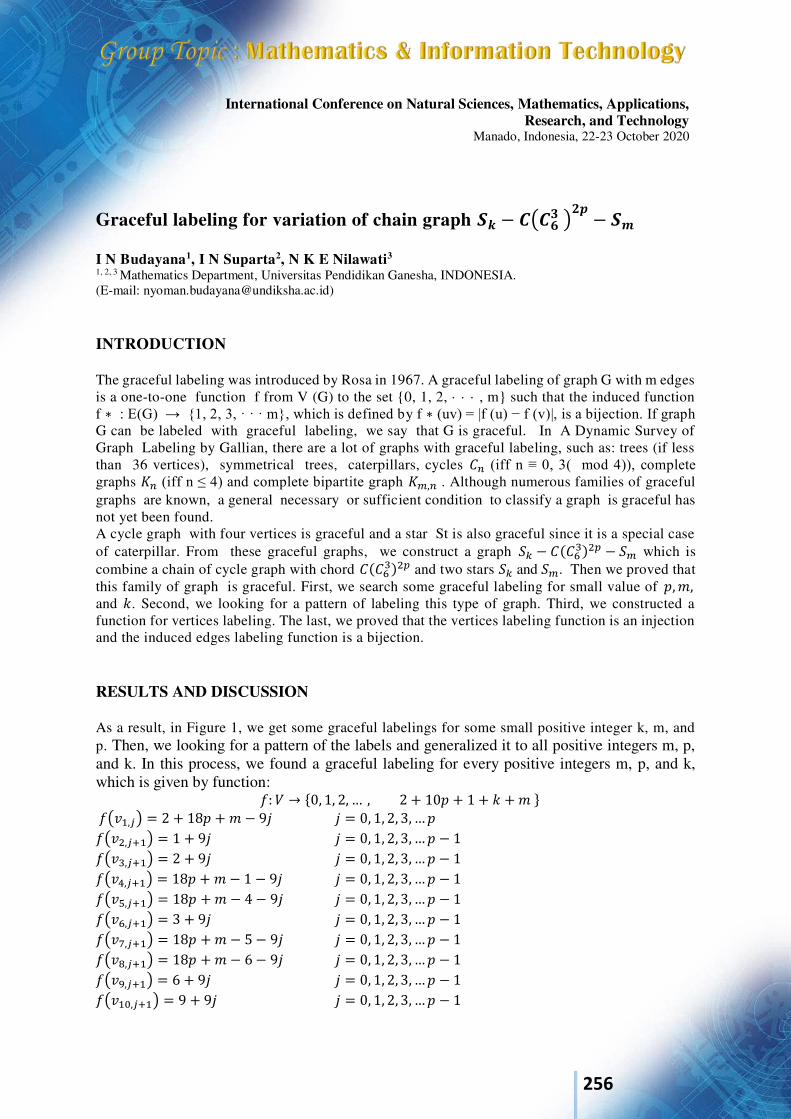
256
International Conference on Natural Sciences, Mathematics, Applications, Research, and Technology
Manado, Indonesia, 22-23 October 2020
Graceful labeling for variation of chain graph 𝑺𝒌 − 𝑪(𝑪𝟔𝟑 )𝟐𝒑 − 𝑺𝒎 I N Budayana1, I N Suparta2, N K E Nilawati3
1, 2, 3 Mathematics Department, Universitas Pendidikan Ganesha, INDONESIA. (E-mail: [email protected]) INTRODUCTION The graceful labeling was introduced by Rosa in 1967. A graceful labeling of graph G with m edges is a one-to-one function f from V (G) to the set {0, 1, 2, · · · , m} such that the induced function f ∗ : E(G) → {1, 2, 3, · · · m}, which is defined by f ∗ (uv) = |f (u) − f (v)|, is a bijection. If graph G can be labeled with graceful labeling, we say that G is graceful. In A Dynamic Survey of Graph Labeling by Gallian, there are a lot of graphs with graceful labeling, such as: trees (if less than 36 vertices), symmetrical trees, caterpillars, cycles 𝐶𝑛 (iff n ≡ 0, 3( mod 4)), complete graphs 𝐾𝑛 (iff n ≤ 4) and complete bipartite graph 𝐾𝑚,𝑛 . Although numerous families of graceful graphs are known, a general necessary or sufficient condition to classify a graph is graceful has not yet been found. A cycle graph with four vertices is graceful and a star St is also graceful since it is a special case of caterpillar. From these graceful graphs, we construct a graph 𝑆𝑘 − 𝐶(𝐶63)2𝑝 − 𝑆𝑚 which is combine a chain of cycle graph with chord 𝐶(𝐶63)2𝑝 and two stars 𝑆𝑘 and 𝑆𝑚. Then we proved that this family of graph is graceful. First, we search some graceful labeling for small value of 𝑝, 𝑚, and 𝑘. Second, we looking for a pattern of labeling this type of graph. Third, we constructed a function for vertices labeling. The last, we proved that the vertices labeling function is an injection and the induced edges labeling function is a bijection. RESULTS AND DISCUSSION As a result, in Figure 1, we get some graceful labelings for some small positive integer k, m, and p. Then, we looking for a pattern of the labels and generalized it to all positive integers m, p, and k. In this process, we found a graceful labeling for every positive integers m, p, and k, which is given by function: 𝑓: 𝑉 → {0, 1, 2, … , 2 + 10𝑝 + 1 + 𝑘 + 𝑚 } 𝑓(𝑣1,𝑗) = 2 + 18𝑝 + 𝑚 − 9𝑗 𝑗 = 0, 1, 2, 3, … 𝑝 𝑓(𝑣2,𝑗+1) = 1 + 9𝑗 𝑗 = 0, 1, 2, 3, … 𝑝 − 1 𝑓(𝑣3,𝑗+1) = 2 + 9𝑗 𝑗 = 0, 1, 2, 3, … 𝑝 − 1 𝑓(𝑣4,𝑗+1) = 18𝑝 + 𝑚 − 1 − 9𝑗 𝑗 = 0, 1, 2, 3, … 𝑝 − 1 𝑓(𝑣5,𝑗+1) = 18𝑝 + 𝑚 − 4 − 9𝑗 𝑗 = 0, 1, 2, 3, … 𝑝 − 1 𝑓(𝑣6,𝑗+1) = 3 + 9𝑗 𝑗 = 0, 1, 2, 3, … 𝑝 − 1 𝑓(𝑣7,𝑗+1) = 18𝑝 + 𝑚 − 5 − 9𝑗 𝑗 = 0, 1, 2, 3, … 𝑝 − 1 𝑓(𝑣8,𝑗+1) = 18𝑝 + 𝑚 − 6 − 9𝑗 𝑗 = 0, 1, 2, 3, … 𝑝 − 1 𝑓(𝑣9,𝑗+1) = 6 + 9𝑗 𝑗 = 0, 1, 2, 3, … 𝑝 − 1 𝑓(𝑣10,𝑗+1) = 9 + 9𝑗 𝑗 = 0, 1, 2, 3, … 𝑝 − 1
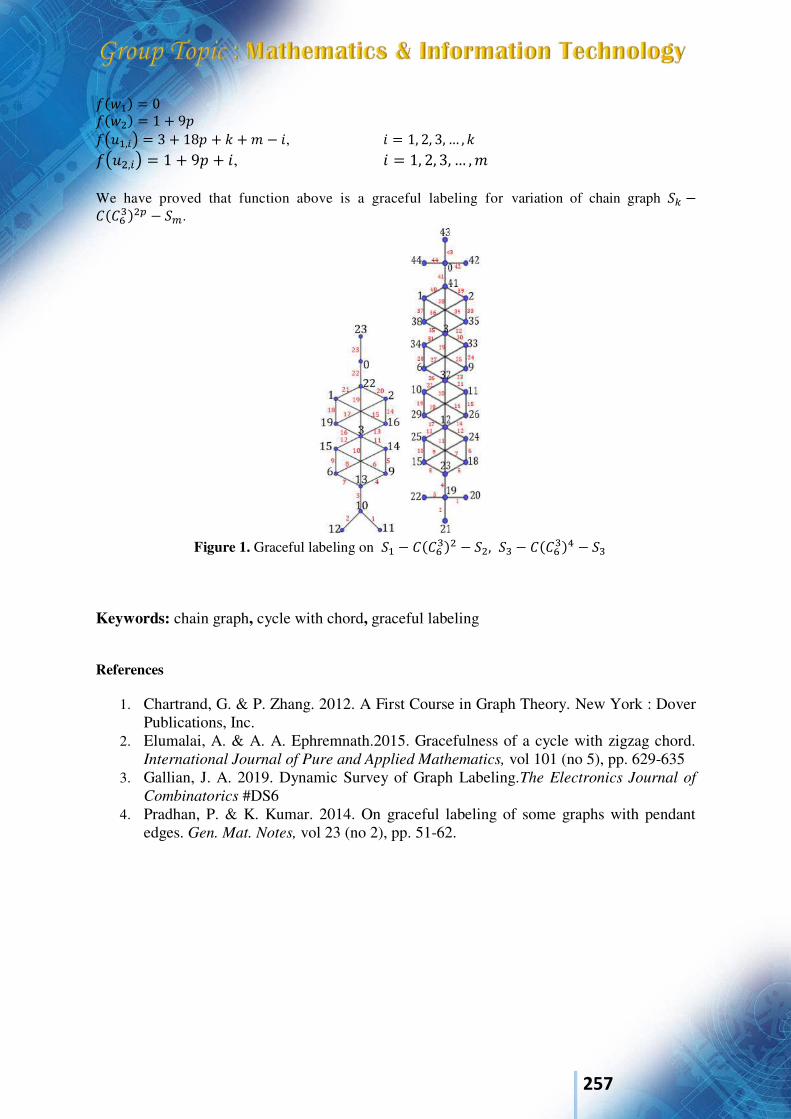
257
𝑓(𝑤1) = 0 𝑓(𝑤2) = 1 + 9𝑝 𝑓(𝑢1,𝑖) = 3 + 18𝑝 + 𝑘 + 𝑚 − 𝑖, 𝑖 = 1, 2, 3, … , 𝑘 𝑓(𝑢2,𝑖) = 1 + 9𝑝 + 𝑖, 𝑖 = 1, 2, 3, … , 𝑚 We have proved that function above is a graceful labeling for variation of chain graph 𝑆𝑘 −𝐶(𝐶63)2𝑝 − 𝑆𝑚.
Figure 1. Graceful labeling on 𝑆1 − 𝐶(𝐶63)2 − 𝑆2, 𝑆3 − 𝐶(𝐶63)4 − 𝑆3
Keywords: chain graph, cycle with chord, graceful labeling References
1. Chartrand, G. & P. Zhang. 2012. A First Course in Graph Theory. New York : Dover Publications, Inc.
2. Elumalai, A. & A. A. Ephremnath.2015. Gracefulness of a cycle with zigzag chord. International Journal of Pure and Applied Mathematics, vol 101 (no 5), pp. 629-635
3. Gallian, J. A. 2019. Dynamic Survey of Graph Labeling.The Electronics Journal of
Combinatorics #DS6 4. Pradhan, P. & K. Kumar. 2014. On graceful labeling of some graphs with pendant
edges. Gen. Mat. Notes, vol 23 (no 2), pp. 51-62.
258
International Conference on Natural Sciences, Mathematics, Applications, Research, and Technology
Manado, Indonesia, 22-23 October 2020
Modeling the Poverty Percentage in Indonesia based on the Human Development Index using Penalized Basis Splines Nonparametric Regression Nurliza Hasanah*1, Syamsul Bahri2 and Nurul Fitriyani3
1,2,3 Department of Mathematics, Universitas Mataram, INDONESIA. (E-mail: [email protected], [email protected], [email protected]) INTRODUCTION Poverty is an issue of particular concern to various countries in the world, including Indonesia. Indonesia is a country with a high poverty rate, with more than 10% of Indonesia's population is categorized as poor (Sukesi, 2015). Based on several previous studies, we can see that the Human Development Index (HDI) significantly affects poverty levels (Siregar and Jatmiko, 2019). The impact of the HDI on poverty can be determined by analyzing the relationship between the two variables. A nonparametric regression approach can be used to estimate the model. This method is not bound by assumptions and has high flexibility because estimating the regression curve adjusts the data without being influenced by the researcher's subjectivity factor (Eubank, 1999). Some of the nonparametric regression approaches that have been developed are spline, kernel, MARS, Fourier series, wavelet, and others. According to Eubank (1999), a spline is a polynomial slice that has segmented properties that are joined by knot points and can explain the character of the data. The advantages of spline regression in Wulandari's (2014) study are that the model will tend to seek its estimation wherever the data moves. It can overcome fluctuating data patterns with knot points and produces relatively smooth curves (Saputri et al., 2015). The spline model's weakness during high order and the selection of a large number of knots can be overcome by using the B-splines basis, namely by building a base based on the knot point. The problem in creating the B-spline's basic function is the knots' determination and placement, namely the place where the polynomial pieces are connected to the B-splines (Siregar and Jatmiko, 2019) P-splines contains a function that takes into account smoothing parameters (Siregar and Jatmiko, 2019). The P-splines consists of two components: the B-splines component and the distinction penalty. The B-splines is developed into a P-splines that is finished using the B-splines with the same knot distance, called the PB-splines (Eilers et al., 2015). Optimizing the number and placement of knots is resolved by first determining the number of knots used on the B-splines. Furthermore, the knots' order is carried out with the concept of equal space knots, which is to adjust the knots' position so that the distance between the knots is the same. Then to increase the smoothness, a differentiating penalty is given (Tonah et al., 2009). This study aims to model the percentage of poverty based on HDI using PB-splines nonparametric regression. The secondary data used were quantitative, obtained from the Central Bureau of Statistics year 2018. The analysis steps were: (1) determining the base order of the B-splines function on the linear PB-splines estimator and knots; (2) modeling the dependent variable using linear PB-splines regression with knots points obtained from quantile samples; (3) calculating the GCV value for
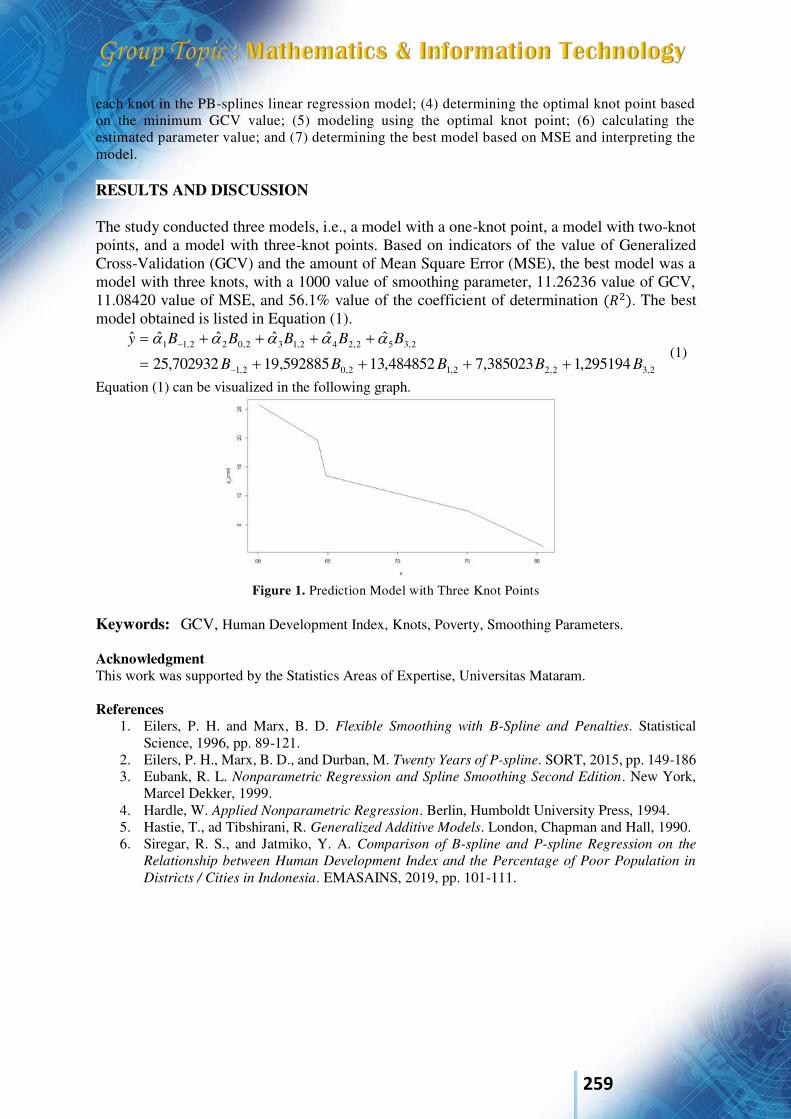
259
each knot in the PB-splines linear regression model; (4) determining the optimal knot point based on the minimum GCV value; (5) modeling using the optimal knot point; (6) calculating the estimated parameter value; and (7) determining the best model based on MSE and interpreting the model. RESULTS AND DISCUSSION The study conducted three models, i.e., a model with a one-knot point, a model with two-knot points, and a model with three-knot points. Based on indicators of the value of Generalized Cross-Validation (GCV) and the amount of Mean Square Error (MSE), the best model was a model with three knots, with a 1000 value of smoothing parameter, 11.26236 value of GCV, 11.08420 value of MSE, and 56.1% value of the coefficient of determination (𝑅2). The best model obtained is listed in Equation (1).
2,32,22,12,02,1
2,352,242,132,022,11
295194,1385023,7484852,13592885,19702932,25
ˆˆˆˆˆˆBBBBB
BBBBBy
(1)
Equation (1) can be visualized in the following graph.
Figure 1. Prediction Model with Three Knot Points
Keywords: GCV, Human Development Index, Knots, Poverty, Smoothing Parameters. Acknowledgment This work was supported by the Statistics Areas of Expertise, Universitas Mataram. References
1. Eilers, P. H. and Marx, B. D. Flexible Smoothing with B-Spline and Penalties. Statistical Science, 1996, pp. 89-121.
2. Eilers, P. H., Marx, B. D., and Durban, M. Twenty Years of P-spline. SORT, 2015, pp. 149-186 3. Eubank, R. L. Nonparametric Regression and Spline Smoothing Second Edition. New York,
Marcel Dekker, 1999. 4. Hardle, W. Applied Nonparametric Regression. Berlin, Humboldt University Press, 1994. 5. Hastie, T., ad Tibshirani, R. Generalized Additive Models. London, Chapman and Hall, 1990. 6. Siregar, R. S., and Jatmiko, Y. A. Comparison of B-spline and P-spline Regression on the
Relationship between Human Development Index and the Percentage of Poor Population in
Districts / Cities in Indonesia. EMASAINS, 2019, pp. 101-111.
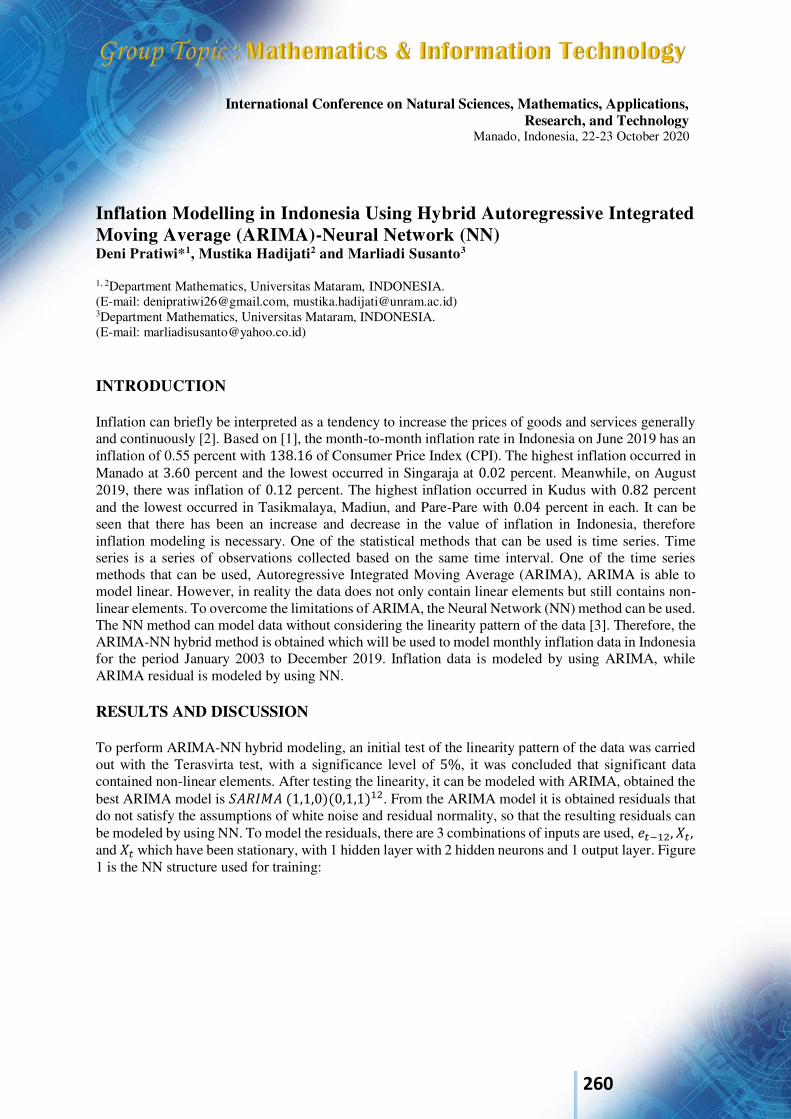
260
International Conference on Natural Sciences, Mathematics, Applications, Research, and Technology
Manado, Indonesia, 22-23 October 2020
Inflation Modelling in Indonesia Using Hybrid Autoregressive Integrated Moving Average (ARIMA)-Neural Network (NN) Deni Pratiwi*1, Mustika Hadijati2 and Marliadi Susanto3
1, 2Department Mathematics, Universitas Mataram, INDONESIA. (E-mail: [email protected], [email protected]) 3Department Mathematics, Universitas Mataram, INDONESIA. (E-mail: [email protected]) INTRODUCTION Inflation can briefly be interpreted as a tendency to increase the prices of goods and services generally and continuously [2]. Based on [1], the month-to-month inflation rate in Indonesia on June 2019 has an inflation of 0.55 percent with 138.16 of Consumer Price Index (CPI). The highest inflation occurred in Manado at 3.60 percent and the lowest occurred in Singaraja at 0.02 percent. Meanwhile, on August 2019, there was inflation of 0.12 percent. The highest inflation occurred in Kudus with 0.82 percent and the lowest occurred in Tasikmalaya, Madiun, and Pare-Pare with 0.04 percent in each. It can be seen that there has been an increase and decrease in the value of inflation in Indonesia, therefore inflation modeling is necessary. One of the statistical methods that can be used is time series. Time series is a series of observations collected based on the same time interval. One of the time series methods that can be used, Autoregressive Integrated Moving Average (ARIMA), ARIMA is able to model linear. However, in reality the data does not only contain linear elements but still contains non-linear elements. To overcome the limitations of ARIMA, the Neural Network (NN) method can be used. The NN method can model data without considering the linearity pattern of the data [3]. Therefore, the ARIMA-NN hybrid method is obtained which will be used to model monthly inflation data in Indonesia for the period January 2003 to December 2019. Inflation data is modeled by using ARIMA, while ARIMA residual is modeled by using NN. RESULTS AND DISCUSSION To perform ARIMA-NN hybrid modeling, an initial test of the linearity pattern of the data was carried out with the Terasvirta test, with a significance level of 5%, it was concluded that significant data contained non-linear elements. After testing the linearity, it can be modeled with ARIMA, obtained the best ARIMA model is 𝑆𝐴𝑅𝐼𝑀𝐴 (1,1,0)(0,1,1)12. From the ARIMA model it is obtained residuals that do not satisfy the assumptions of white noise and residual normality, so that the resulting residuals can be modeled by using NN. To model the residuals, there are 3 combinations of inputs are used, 𝑒𝑡−12, 𝑋𝑡 , and 𝑋𝑡 which have been stationary, with 1 hidden layer with 2 hidden neurons and 1 output layer. Figure 1 is the NN structure used for training:
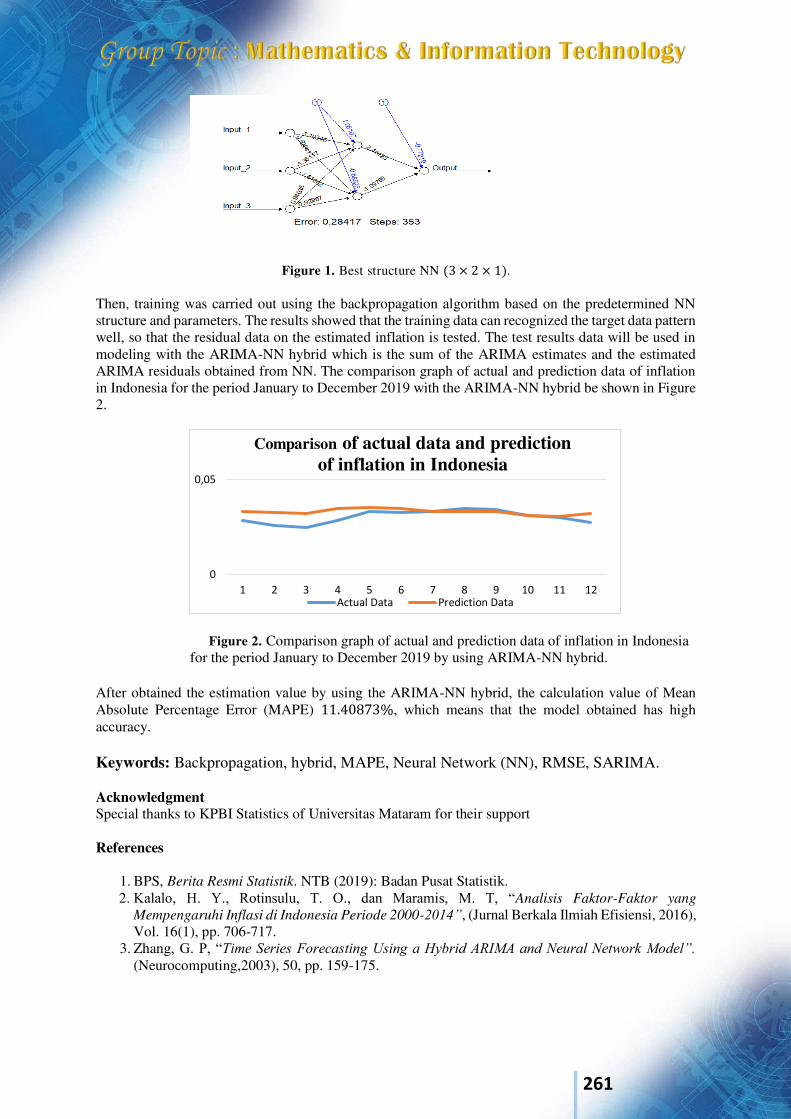
261
Figure 1. Best structure NN (3 × 2 × 1). Then, training was carried out using the backpropagation algorithm based on the predetermined NN structure and parameters. The results showed that the training data can recognized the target data pattern well, so that the residual data on the estimated inflation is tested. The test results data will be used in modeling with the ARIMA-NN hybrid which is the sum of the ARIMA estimates and the estimated ARIMA residuals obtained from NN. The comparison graph of actual and prediction data of inflation in Indonesia for the period January to December 2019 with the ARIMA-NN hybrid be shown in Figure 2.
Figure 2. Comparison graph of actual and prediction data of inflation in Indonesia for the period January to December 2019 by using ARIMA-NN hybrid.
After obtained the estimation value by using the ARIMA-NN hybrid, the calculation value of Mean Absolute Percentage Error (MAPE) 11.40873%, which means that the model obtained has high accuracy. Keywords: Backpropagation, hybrid, MAPE, Neural Network (NN), RMSE, SARIMA. Acknowledgment Special thanks to KPBI Statistics of Universitas Mataram for their support References
1. BPS, Berita Resmi Statistik. NTB (2019): Badan Pusat Statistik. 2. Kalalo, H. Y., Rotinsulu, T. O., dan Maramis, M. T, “Analisis Faktor-Faktor yang
Mempengaruhi Inflasi di Indonesia Periode 2000-2014”, (Jurnal Berkala Ilmiah Efisiensi, 2016), Vol. 16(1), pp. 706-717.
3. Zhang, G. P, “Time Series Forecasting Using a Hybrid ARIMA and Neural Network Model”. (Neurocomputing,2003), 50, pp. 159-175.
0
0,05
1 2 3 4 5 6 7 8 9 10 11 12
Comparison of actual data and prediction of inflation in Indonesia
Actual Data Prediction Data
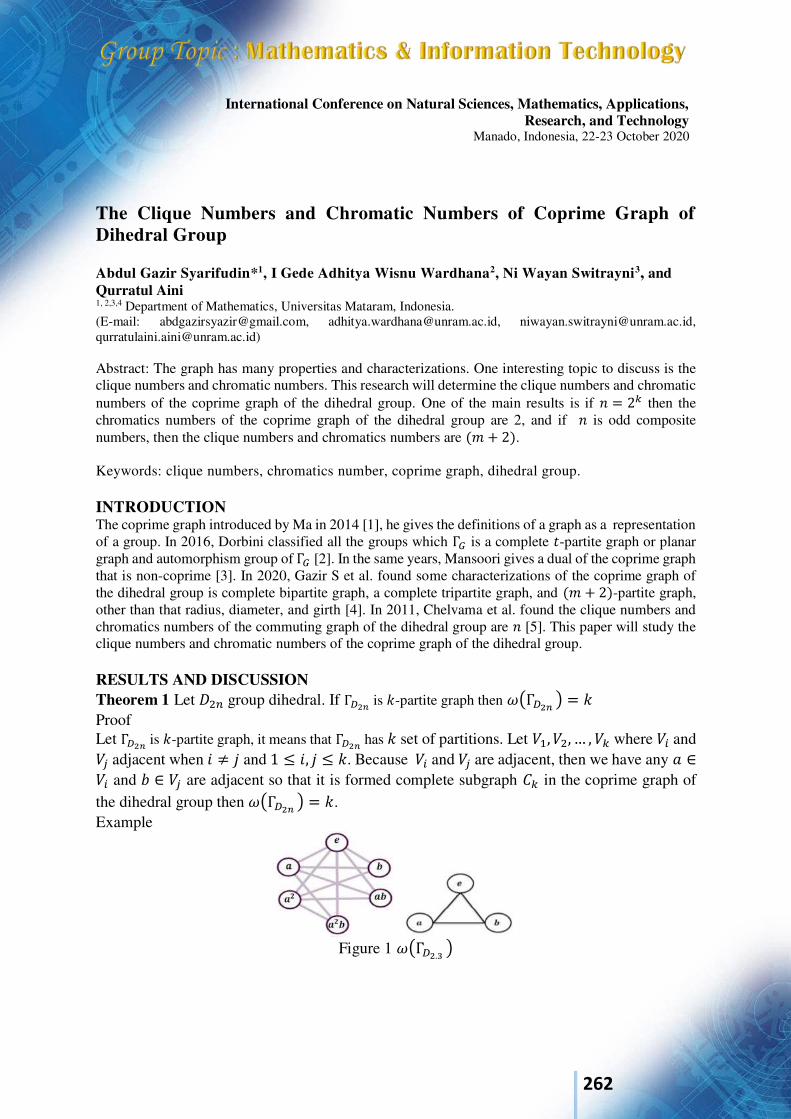
262
International Conference on Natural Sciences, Mathematics, Applications, Research, and Technology
Manado, Indonesia, 22-23 October 2020
The Clique Numbers and Chromatic Numbers of Coprime Graph of Dihedral Group Abdul Gazir Syarifudin*1, I Gede Adhitya Wisnu Wardhana2, Ni Wayan Switrayni3, and Qurratul Aini
1, 2,3,4 Department of Mathematics, Universitas Mataram, Indonesia. (E-mail: [email protected], [email protected], [email protected], [email protected])
Abstract: The graph has many properties and characterizations. One interesting topic to discuss is the clique numbers and chromatic numbers. This research will determine the clique numbers and chromatic numbers of the coprime graph of the dihedral group. One of the main results is if 𝑛 = 2𝑘 then the chromatics numbers of the coprime graph of the dihedral group are 2, and if 𝑛 is odd composite numbers, then the clique numbers and chromatics numbers are (𝑚 + 2). Keywords: clique numbers, chromatics number, coprime graph, dihedral group. INTRODUCTION The coprime graph introduced by Ma in 2014 [1], he gives the definitions of a graph as a representation of a group. In 2016, Dorbini classified all the groups which Γ𝐺 is a complete 𝑡-partite graph or planar graph and automorphism group of Γ𝐺 [2]. In the same years, Mansoori gives a dual of the coprime graph that is non-coprime [3]. In 2020, Gazir S et al. found some characterizations of the coprime graph of the dihedral group is complete bipartite graph, a complete tripartite graph, and (𝑚 + 2)-partite graph, other than that radius, diameter, and girth [4]. In 2011, Chelvama et al. found the clique numbers and chromatics numbers of the commuting graph of the dihedral group are 𝑛 [5]. This paper will study the clique numbers and chromatic numbers of the coprime graph of the dihedral group. RESULTS AND DISCUSSION Theorem 1 Let 𝐷2𝑛 group dihedral. If Γ𝐷2𝑛 is 𝑘-partite graph then 𝜔(Γ𝐷2𝑛 ) = 𝑘 Proof Let Γ𝐷2𝑛 is 𝑘-partite graph, it means that Γ𝐷2𝑛 has 𝑘 set of partitions. Let 𝑉1, 𝑉2, … , 𝑉𝑘 where 𝑉𝑖 and 𝑉𝑗 adjacent when 𝑖 ≠ 𝑗 and 1 ≤ 𝑖, 𝑗 ≤ 𝑘. Because 𝑉𝑖 and 𝑉𝑗 are adjacent, then we have any 𝑎 ∈𝑉𝑖 and 𝑏 ∈ 𝑉𝑗 are adjacent so that it is formed complete subgraph 𝐶𝑘 in the coprime graph of the dihedral group then 𝜔(Γ𝐷2𝑛 ) = 𝑘. Example
Figure 1 𝜔(Γ𝐷2.3 )
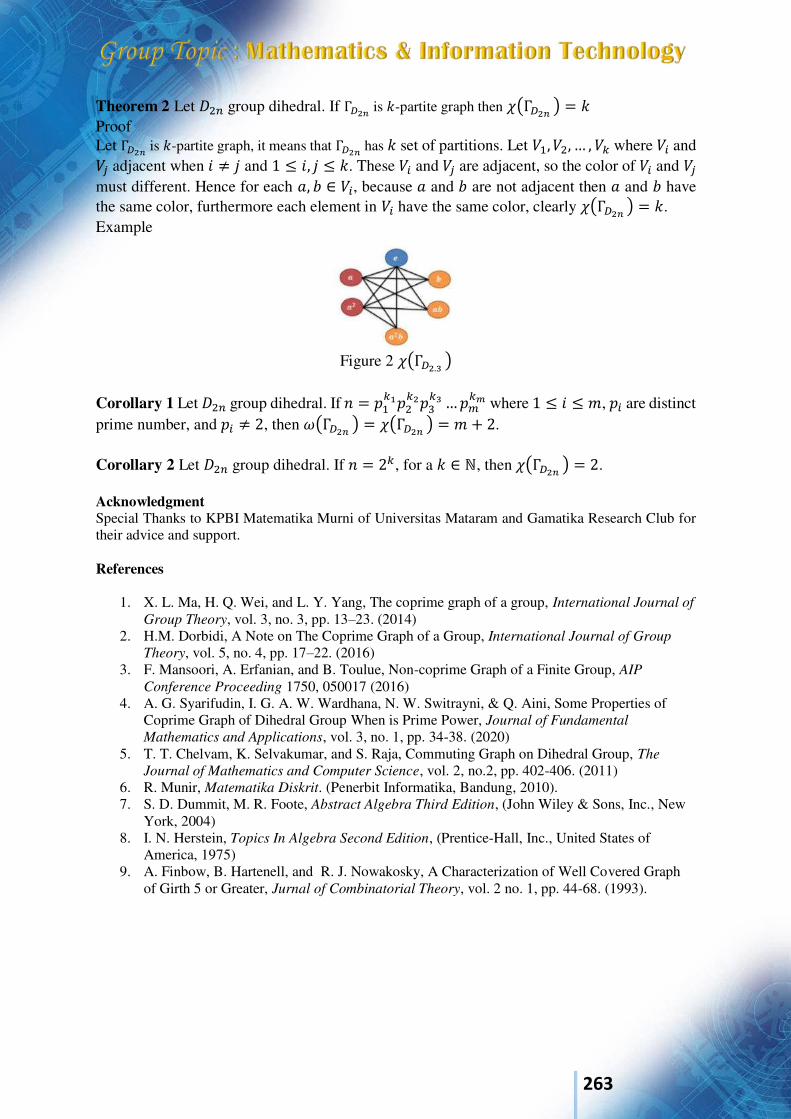
263
Theorem 2 Let 𝐷2𝑛 group dihedral. If Γ𝐷2𝑛 is 𝑘-partite graph then 𝜒(Γ𝐷2𝑛 ) = 𝑘 Proof Let Γ𝐷2𝑛 is 𝑘-partite graph, it means that Γ𝐷2𝑛 has 𝑘 set of partitions. Let 𝑉1, 𝑉2, … , 𝑉𝑘 where 𝑉𝑖 and 𝑉𝑗 adjacent when 𝑖 ≠ 𝑗 and 1 ≤ 𝑖, 𝑗 ≤ 𝑘. These 𝑉𝑖 and 𝑉𝑗 are adjacent, so the color of 𝑉𝑖 and 𝑉𝑗 must different. Hence for each 𝑎, 𝑏 ∈ 𝑉𝑖, because 𝑎 and 𝑏 are not adjacent then 𝑎 and 𝑏 have the same color, furthermore each element in 𝑉𝑖 have the same color, clearly 𝜒(Γ𝐷2𝑛 ) = 𝑘. Example
Figure 2 𝜒(Γ𝐷2.3 )
Corollary 1 Let 𝐷2𝑛 group dihedral. If 𝑛 = 𝑝1𝑘1𝑝2𝑘2𝑝3𝑘3 … 𝑝𝑚𝑘𝑚 where 1 ≤ 𝑖 ≤ 𝑚, 𝑝𝑖 are distinct prime number, and 𝑝𝑖 ≠ 2, then 𝜔(Γ𝐷2𝑛 ) = 𝜒(Γ𝐷2𝑛 ) = 𝑚 + 2. Corollary 2 Let 𝐷2𝑛 group dihedral. If 𝑛 = 2𝑘, for a 𝑘 ∈ ℕ, then 𝜒(Γ𝐷2𝑛 ) = 2. Acknowledgment Special Thanks to KPBI Matematika Murni of Universitas Mataram and Gamatika Research Club for their advice and support. References
1. X. L. Ma, H. Q. Wei, and L. Y. Yang, The coprime graph of a group, International Journal of
Group Theory, vol. 3, no. 3, pp. 13–23. (2014) 2. H.M. Dorbidi, A Note on The Coprime Graph of a Group, International Journal of Group
Theory, vol. 5, no. 4, pp. 17–22. (2016) 3. F. Mansoori, A. Erfanian, and B. Toulue, Non-coprime Graph of a Finite Group, AIP
Conference Proceeding 1750, 050017 (2016) 4. A. G. Syarifudin, I. G. A. W. Wardhana, N. W. Switrayni, & Q. Aini, Some Properties of
Coprime Graph of Dihedral Group When is Prime Power, Journal of Fundamental
Mathematics and Applications, vol. 3, no. 1, pp. 34-38. (2020) 5. T. T. Chelvam, K. Selvakumar, and S. Raja, Commuting Graph on Dihedral Group, The
Journal of Mathematics and Computer Science, vol. 2, no.2, pp. 402-406. (2011) 6. R. Munir, Matematika Diskrit. (Penerbit Informatika, Bandung, 2010). 7. S. D. Dummit, M. R. Foote, Abstract Algebra Third Edition, (John Wiley & Sons, Inc., New
York, 2004) 8. I. N. Herstein, Topics In Algebra Second Edition, (Prentice-Hall, Inc., United States of
America, 1975) 9. A. Finbow, B. Hartenell, and R. J. Nowakosky, A Characterization of Well Covered Graph
of Girth 5 or Greater, Jurnal of Combinatorial Theory, vol. 2 no. 1, pp. 44-68. (1993).
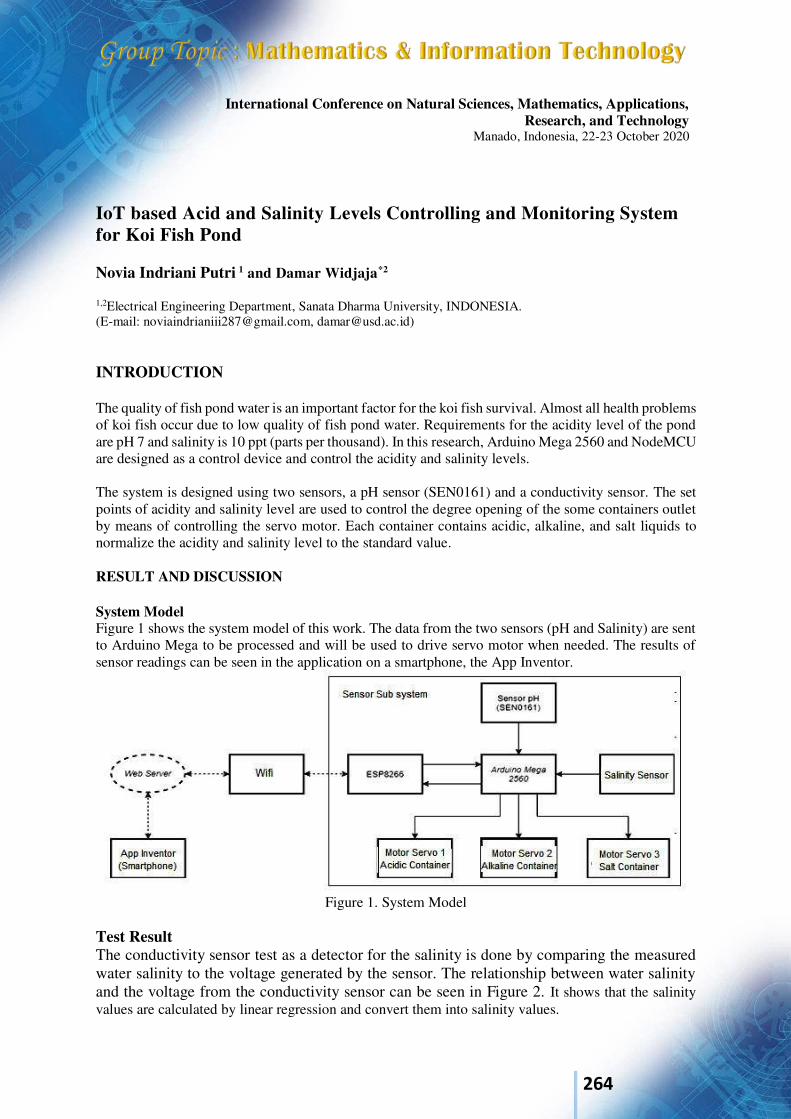
264
International Conference on Natural Sciences, Mathematics, Applications, Research, and Technology
Manado, Indonesia, 22-23 October 2020
IoT based Acid and Salinity Levels Controlling and Monitoring System for Koi Fish Pond Novia Indriani Putri 1 and Damar Widjaja*2
1,2Electrical Engineering Department, Sanata Dharma University, INDONESIA. (E-mail: [email protected], [email protected]) INTRODUCTION The quality of fish pond water is an important factor for the koi fish survival. Almost all health problems of koi fish occur due to low quality of fish pond water. Requirements for the acidity level of the pond are pH 7 and salinity is 10 ppt (parts per thousand). In this research, Arduino Mega 2560 and NodeMCU are designed as a control device and control the acidity and salinity levels. The system is designed using two sensors, a pH sensor (SEN0161) and a conductivity sensor. The set points of acidity and salinity level are used to control the degree opening of the some containers outlet by means of controlling the servo motor. Each container contains acidic, alkaline, and salt liquids to normalize the acidity and salinity level to the standard value. RESULT AND DISCUSSION System Model Figure 1 shows the system model of this work. The data from the two sensors (pH and Salinity) are sent to Arduino Mega to be processed and will be used to drive servo motor when needed. The results of sensor readings can be seen in the application on a smartphone, the App Inventor.
Figure 1. System Model
Test Result The conductivity sensor test as a detector for the salinity is done by comparing the measured water salinity to the voltage generated by the sensor. The relationship between water salinity and the voltage from the conductivity sensor can be seen in Figure 2. It shows that the salinity values are calculated by linear regression and convert them into salinity values.
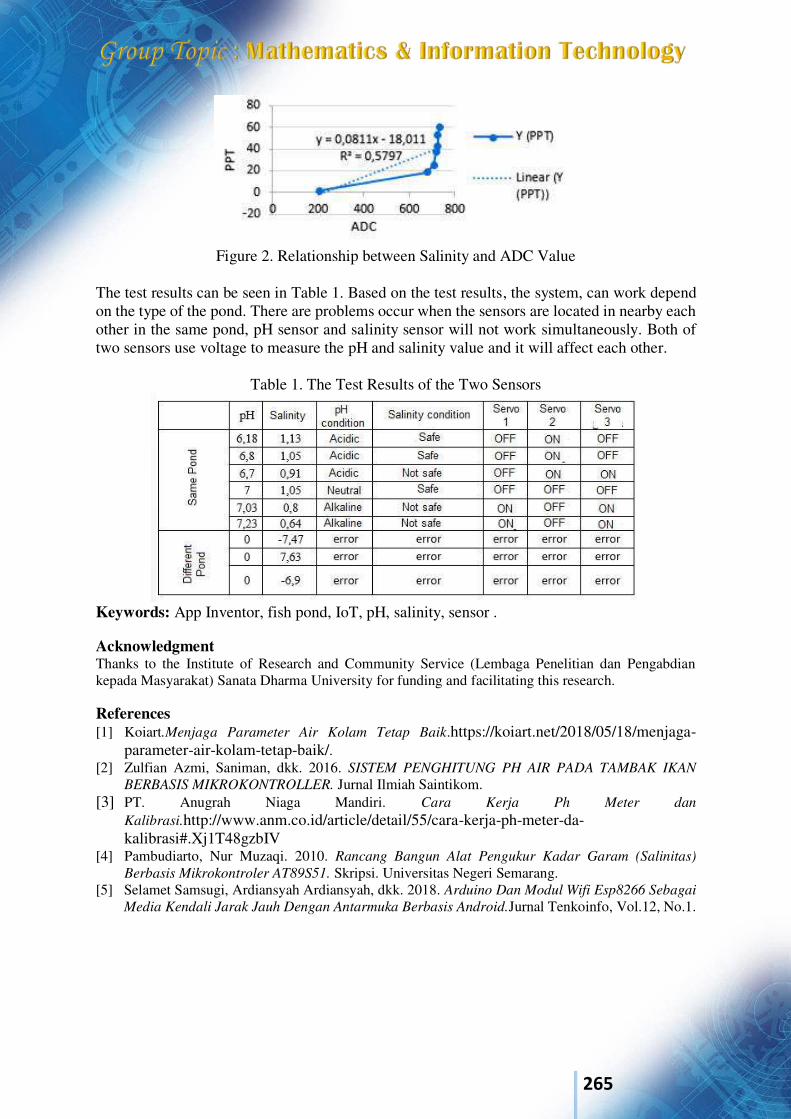
265
Figure 2. Relationship between Salinity and ADC Value
The test results can be seen in Table 1. Based on the test results, the system, can work depend on the type of the pond. There are problems occur when the sensors are located in nearby each other in the same pond, pH sensor and salinity sensor will not work simultaneously. Both of two sensors use voltage to measure the pH and salinity value and it will affect each other.
Table 1. The Test Results of the Two Sensors
Keywords: App Inventor, fish pond, IoT, pH, salinity, sensor . Acknowledgment Thanks to the Institute of Research and Community Service (Lembaga Penelitian dan Pengabdian kepada Masyarakat) Sanata Dharma University for funding and facilitating this research. References [1] Koiart.Menjaga Parameter Air Kolam Tetap Baik.https://koiart.net/2018/05/18/menjaga-
parameter-air-kolam-tetap-baik/. [2] Zulfian Azmi, Saniman, dkk. 2016. SISTEM PENGHITUNG PH AIR PADA TAMBAK IKAN
BERBASIS MIKROKONTROLLER. Jurnal Ilmiah Saintikom. [3] PT. Anugrah Niaga Mandiri. Cara Kerja Ph Meter dan
Kalibrasi.http://www.anm.co.id/article/detail/55/cara-kerja-ph-meter-da-kalibrasi#.Xj1T48gzbIV
[4] Pambudiarto, Nur Muzaqi. 2010. Rancang Bangun Alat Pengukur Kadar Garam (Salinitas)
Berbasis Mikrokontroler AT89S51. Skripsi. Universitas Negeri Semarang. [5] Selamet Samsugi, Ardiansyah Ardiansyah, dkk. 2018. Arduino Dan Modul Wifi Esp8266 Sebagai
Media Kendali Jarak Jauh Dengan Antarmuka Berbasis Android.Jurnal Tenkoinfo, Vol.12, No.1.

266
International Conference on Natural Sciences, Mathematics, Applications, Research, and Technology
Manado, Indonesia, 22-23 October 2020
IoT based Trash Can Monitoring System for Smart Garden Cleanliness Fridyastuti Dwi Moris 1 and Damar Widjaja*2
1, 2Electrical Engineering Department, Sanata Dharma University, INDONESIA. (E-mail: [email protected], [email protected]) INTRODUCTION Garbage is something that is close to human life. Everyday garbage is produced, both waste from organic substances (vegetables, meat, leaves, etc.) or from inorganic substances (plastic, glass, paper, rubber, metal and so on) [1]. At this time, disposing of garbage is still a problem that is quite concerning the government and people who care about environmental cleanliness. Lack of awareness to dispose of garbage in its place and uncoordinated trash cans also need attention. Uncoordinated trash bins by officers cause people tend to litter because when they want to throw garbage it turns out that the trash can is full. Therefore, a study was made on remote monitoring of trash can contents and automatic trash can lid openers to increase public awareness in making trash in its place and make it easier for cleaning officers to monitor the contents of the trash. This study uses two controlled trash bins to differentiate the location, NodeMCU as the microcontroller used, Thingspeak as monitoring server, two ultrasonic sensors to detect the height of trash and object detection, two servo motors as the activator for the top cover and automatic disposal cap, and the solenoid as a disposal cap locking system in every trash can. RESULT AND DISCUSSION System Model Figure 1 shows the system model of this study. The system input comes from the ultrasonic sensor for object detection and the height of the waste and then processed by NodeMCU. The data read by NodeMCU is then used to drive the actuator. The actuator consists of a top servo motor to drive the top cover of the trash can based on object detection sensor data. Then the data on the height of the trash is used to drive the servo motor when the garbage is full for 3 minutes. Red and green LEDs are used for the indicator of the waste height. Waste height data will be sent and displayed on Thingspeak for monitoring. Test Result Table 1 shows the test result data of the whole system. This test is used to measure the success rate of the trash bin system. Testing the whole system is done by filling the trash can from empty to full, and testing the top cover opening. The testing includes opening the top cover, manual and automatic disposal covers, and finally testing the data transmission to Thingspeak. All the experiments show that the system was able to work in every condition as designed.
267
Figure 1. System Model
Table 1. Overall System Test Results Trash Can Indicator
Object Status Automatic Disposal
Cover Upper Cover Send Data
Location 1
Location 2 Location 1 Location 2 Location 1 Location
2 Location
1 Location
2 Location
1 Location 2
Full Not Full Not Detected Not Detected Yes No Closed Closed Yes Yes
Full Not Full Not Detected Detected Yes No Closed Opened Yes Yes
Not Full Full Not Detected Not Detected No Yes Closed Closed Yes Yes
Not Full Full Detected Not Detected
No Yes Opened Closed Yes Yes
Not Full Not Full Detected Not Detected No No Opened Closed Yes Yes
Not Full Not Full Not Detected Detected No No Closed Opened Yes Yes Not Full Full Detected Detected No No Opened Opened Yes Yes
Full Not Full Detected Detected No No Opened Opened Yes Yes
Full Full Not Detected Not Detected Yes Yes Closed Closed Yes Yes
Full Full Not Detected Not Detected Yes Yes Closed Closed Yes Yes
Keywords: IoT, Thingspeak, trash can, ultrasonic sensor, . Acknowledgment Thanks to the Institute of Research and Community Service (Lembaga Penelitian dan Pengabdian kepada Masyarakat) Sanata Dharma University for funding and facilitating this research. References 1. Jejak belantara. Sampah Rumah Tangga dan Definisi.
https://jejakbelantara.blogspot.com/2016/01/sampah-rumah-tangga-definisi-dan.html 2. Imam, Joy. Undang – Undang No 18 Tahun 2008 Tentang Pengelolaan Sampah.
Jakarta.http://www.sanitasi.net/undang-undang-no-18-tahun-2008-tentang-pengelolaan-sampah.html.
3. Nainggolan, Omry Deroyen. 2018. “Sistem Pemantau Isi Tempat Sampah Berbasis GSM”. Skripsi, FST, Teknik Elektro, Universitas Sanatha Dharma, Yogyakarta.
Thingspeak
Wifi
Node MCU
Node MCU
Sensor
Indikator
Actuator
Sensor
Indikator
Actuator
Trash Can 1
Trash Can 2
268
International Conference on Natural Sciences, Mathematics, Applications, Research, and Technology
Manado, Indonesia, 22-23 October 2020
IoT based Soil Moisture and Sun Light Monitoring for Smart Planting Jonathan 1 and Damar Widjaja*2
1, 2Electrical Engineering Department, Sanata Dharma University, INDONESIA. (E-mail: [email protected], [email protected]) INTRODUCTION In everyday life, plant enthusiasts and entrepreneurs and farmers must have more than one plant that needs to be cared every day. One of the most important treatments is to provide water with sprinklers. Lack of watering can cause serious problem for plant if the owner have to leave the plant for a long time. The other factor to provide a good environment for plant to grow is the sun light intensity. Sufficient water and adequate sun light are important factors in carrying out photosynthetic activities. If this is not considered, the plants will quickly wither and die. An IoT based automatic plant sprinkler and cover system that can be monitored and controlled remotely makes it easier for users to monitor the condition of these plants anywhere and anytime. RESULT AND DISCUSSION System Model The system is using a remote control via the Blynk application embedded in smartphone. This tool uses a soil moisture sensor to determine the moisture content in the soil and an LDR sensor to determine the intensity of sun light. DC motor is used as actuator to open and close of the curtains as plant cover from the intense sun light. DC water pump is used for watering the plants. The data that has been obtained from each sensor will be sent to the Blynk application. This system uses ESP32 microcontroller to control all actuators. Figure 1 shows the system model of this work. Soil moisture sensor will detect three condition; dry, humid and wet. If the soil is dry, it esults an output with a range> 3500, the relay will turn on then the DC water pump will water the plants. If the soil is in a humid condition with a range > 1600 and <3500 or wet with a range < 1600, the relay will not turn on and the DC water pump will not flush. The LDR sensor will work if the sunlight intensity is too hot and it results an output with a range < 1500 and the DC motor will close the plant curtains. Likewise, when the sunlight intensity is not too hot and an output has range> 1500, the DC motor will open the plant curtains. Test Result Table 1 shows the results of the data from the system testing used to measure the success rate of the watering system. System testing is carried out in several types, the sensor which is soil moisture able to detect soil, dry, damp and wet conditions. The LDR sensor is able to detect light intensity. The actuator in plant sprinklers in the form of a DC motor is able to open and close plant curtains and a water pump can water plants then the data obtained is sent to Blynk.
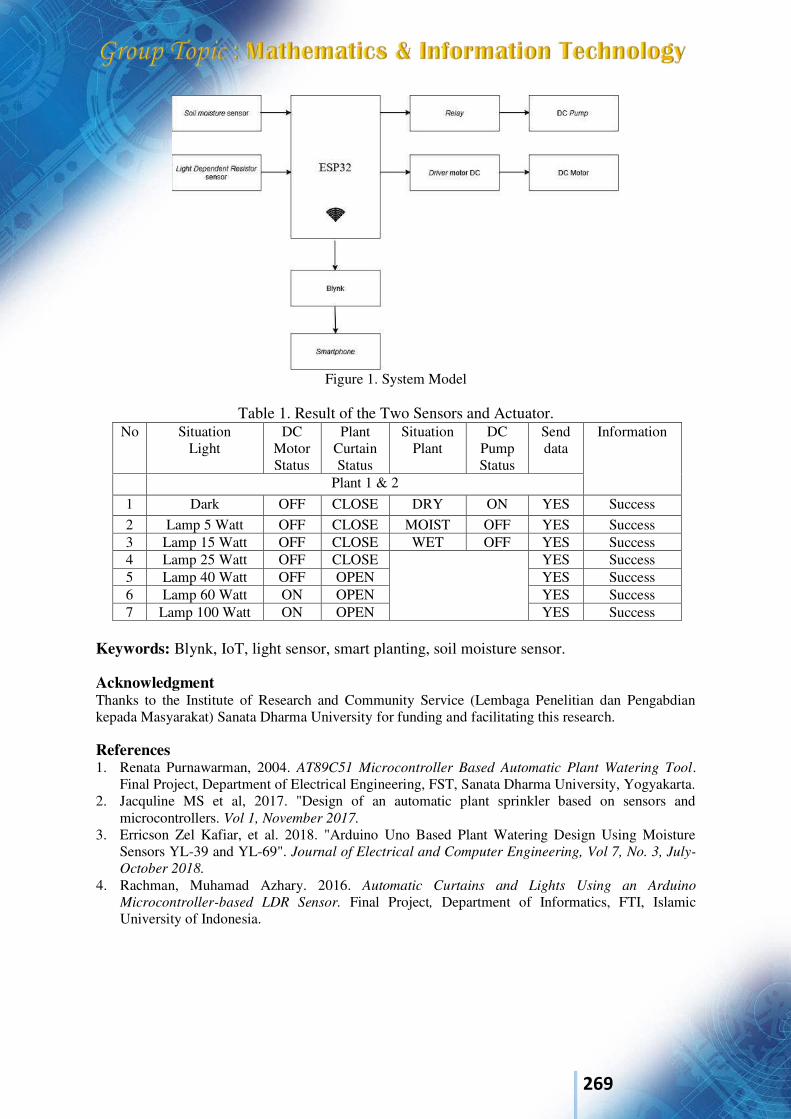
269
Figure 1. System Model
Table 1. Result of the Two Sensors and Actuator.
No Situation Light
DC Motor Status
Plant Curtain Status
Situation Plant
DC Pump Status
Send data
Information
Plant 1 & 2
1 Dark OFF CLOSE DRY ON YES Success 2 Lamp 5 Watt OFF CLOSE MOIST OFF YES Success 3 Lamp 15 Watt OFF CLOSE WET OFF YES Success 4 Lamp 25 Watt OFF CLOSE YES Success 5 Lamp 40 Watt OFF OPEN YES Success 6 Lamp 60 Watt ON OPEN YES Success 7 Lamp 100 Watt ON OPEN YES Success
Keywords: Blynk, IoT, light sensor, smart planting, soil moisture sensor. Acknowledgment Thanks to the Institute of Research and Community Service (Lembaga Penelitian dan Pengabdian kepada Masyarakat) Sanata Dharma University for funding and facilitating this research. References 1. Renata Purnawarman, 2004. AT89C51 Microcontroller Based Automatic Plant Watering Tool.
Final Project, Department of Electrical Engineering, FST, Sanata Dharma University, Yogyakarta. 2. Jacquline MS et al, 2017. "Design of an automatic plant sprinkler based on sensors and
microcontrollers. Vol 1, November 2017. 3. Erricson Zel Kafiar, et al. 2018. "Arduino Uno Based Plant Watering Design Using Moisture
Sensors YL-39 and YL-69". Journal of Electrical and Computer Engineering, Vol 7, No. 3, July-
October 2018. 4. Rachman, Muhamad Azhary. 2016. Automatic Curtains and Lights Using an Arduino
Microcontroller-based LDR Sensor. Final Project, Department of Informatics, FTI, Islamic University of Indonesia.
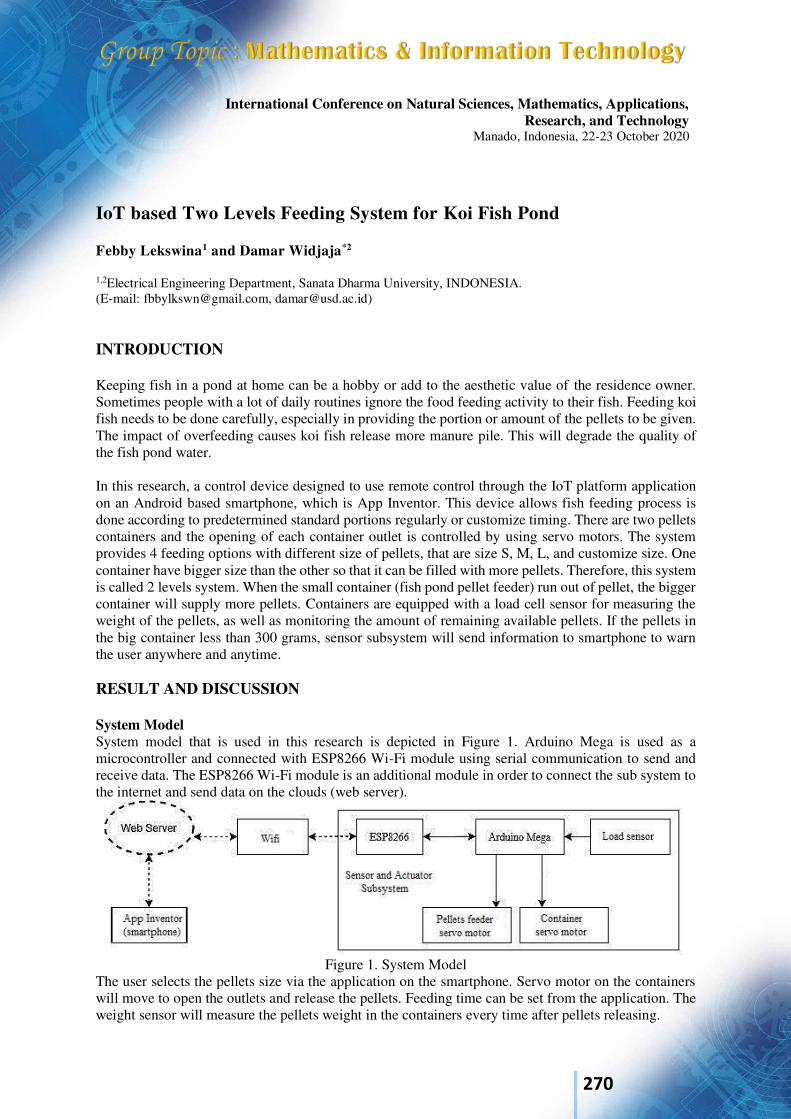
270
International Conference on Natural Sciences, Mathematics, Applications, Research, and Technology
Manado, Indonesia, 22-23 October 2020
IoT based Two Levels Feeding System for Koi Fish Pond Febby Lekswina1 and Damar Widjaja*2
1,2Electrical Engineering Department, Sanata Dharma University, INDONESIA. (E-mail: [email protected], [email protected]) INTRODUCTION Keeping fish in a pond at home can be a hobby or add to the aesthetic value of the residence owner. Sometimes people with a lot of daily routines ignore the food feeding activity to their fish. Feeding koi fish needs to be done carefully, especially in providing the portion or amount of the pellets to be given. The impact of overfeeding causes koi fish release more manure pile. This will degrade the quality of the fish pond water. In this research, a control device designed to use remote control through the IoT platform application on an Android based smartphone, which is App Inventor. This device allows fish feeding process is done according to predetermined standard portions regularly or customize timing. There are two pellets containers and the opening of each container outlet is controlled by using servo motors. The system provides 4 feeding options with different size of pellets, that are size S, M, L, and customize size. One container have bigger size than the other so that it can be filled with more pellets. Therefore, this system is called 2 levels system. When the small container (fish pond pellet feeder) run out of pellet, the bigger container will supply more pellets. Containers are equipped with a load cell sensor for measuring the weight of the pellets, as well as monitoring the amount of remaining available pellets. If the pellets in the big container less than 300 grams, sensor subsystem will send information to smartphone to warn the user anywhere and anytime. RESULT AND DISCUSSION System Model System model that is used in this research is depicted in Figure 1. Arduino Mega is used as a microcontroller and connected with ESP8266 Wi-Fi module using serial communication to send and receive data. The ESP8266 Wi-Fi module is an additional module in order to connect the sub system to the internet and send data on the clouds (web server).
Figure 1. System Model
The user selects the pellets size via the application on the smartphone. Servo motor on the containers will move to open the outlets and release the pellets. Feeding time can be set from the application. The weight sensor will measure the pellets weight in the containers every time after pellets releasing.
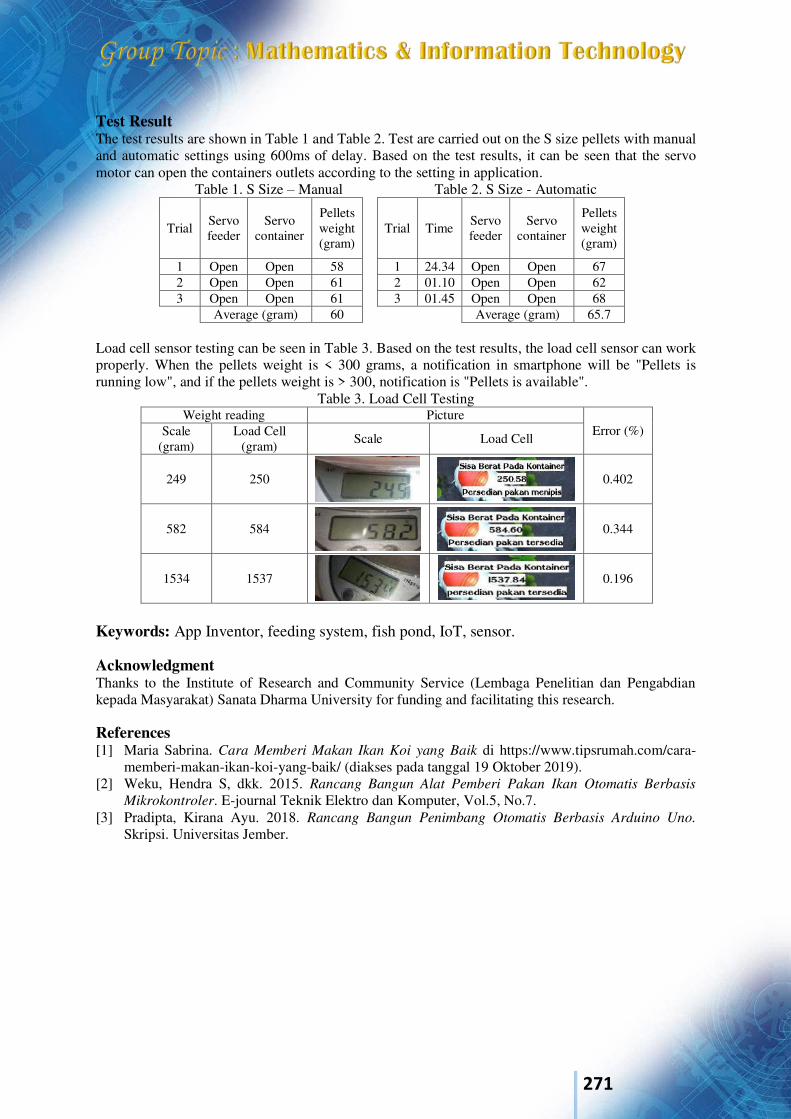
271
Test Result The test results are shown in Table 1 and Table 2. Test are carried out on the S size pellets with manual and automatic settings using 600ms of delay. Based on the test results, it can be seen that the servo motor can open the containers outlets according to the setting in application.
Table 1. S Size – Manual Table 2. S Size - Automatic
Trial Servo feeder
Servo container
Pellets weight (gram)
Trial Time Servo feeder
Servo container
Pellets weight (gram)
1 Open Open 58 1 24.34 Open Open 67 2 Open Open 61 2 01.10 Open Open 62 3 Open Open 61 3 01.45 Open Open 68 Average (gram) 60 Average (gram) 65.7
Load cell sensor testing can be seen in Table 3. Based on the test results, the load cell sensor can work properly. When the pellets weight is < 300 grams, a notification in smartphone will be "Pellets is running low", and if the pellets weight is > 300, notification is "Pellets is available".
Table 3. Load Cell Testing Weight reading Picture
Error (%) Scale (gram)
Load Cell (gram) Scale Load Cell
249 250
0.402
582 584
0.344
1534 1537
0.196
Keywords: App Inventor, feeding system, fish pond, IoT, sensor. Acknowledgment Thanks to the Institute of Research and Community Service (Lembaga Penelitian dan Pengabdian kepada Masyarakat) Sanata Dharma University for funding and facilitating this research. References [1] Maria Sabrina. Cara Memberi Makan Ikan Koi yang Baik di https://www.tipsrumah.com/cara-
memberi-makan-ikan-koi-yang-baik/ (diakses pada tanggal 19 Oktober 2019). [2] Weku, Hendra S, dkk. 2015. Rancang Bangun Alat Pemberi Pakan Ikan Otomatis Berbasis
Mikrokontroler. E-journal Teknik Elektro dan Komputer, Vol.5, No.7. [3] Pradipta, Kirana Ayu. 2018. Rancang Bangun Penimbang Otomatis Berbasis Arduino Uno.
Skripsi. Universitas Jember.
272
International Conference on Natural Sciences, Mathematics, Applications, Research, and Technology
Manado, Indonesia, 22-23 October 2020
Analysis of the effect of marker types and laminated marker media on the quality of augmented reality of igneous rocks with the marker base method Kadek Surya Adi Saputra1, I Gede Aris Gunadi2, G.Indrawan3 1,2,3Department of Computer Science, Ganesha Singaraja University of Education, Indonesia Corresponding author: 1 [email protected], 2 [email protected], 3
[email protected] Abstract. There are several obstacles in the detection of markers in Augmented Reality Book of Igneous Rock, especially on the type of marker and laminate media used, this study aims to find 1) if the marker is laminated whether the marker will be detected. 2) if different types of markers and lamination media have an influence in creating three-dimensional objects and 3) How long it takes for 3D objects to appear compared to the different marker types and laminate media used. There are 12 types of igneous rock and 240 cases in this study, where the detection between marker and lamination media is displayed via a smartphone to match the marker with the 3D object. The data in this study were collected using direct observation methods by testing different types of markers and lamination media. The types of markers used in this study were black and white markers and colored markers, while for lamination media used doff and glossy types as AR Book . The test focuses scanning on different marker types and laminated media using predetermined minimum and maximum distances and light, the data obtained from this study were then classified into tables and graphs. Where the answer is found in this study that it is true that there is an influence between the type of marker and the laminate media on the appearance time of the 3D object, and based on 240 cases, black and white marker and doff lamination are the most efficient combination in creating 3D objects.
1. Introduction Time to time development gave rise to a new technology called Augmented Reality in attempt to combine real and virtual world. Its appearance makes the boundary between real and virtual world thinner, where users can access object they want in real time [1]. However the application of technology especially in this research still experiencing some problems especially in the application of marker types on laminated media which in turn raises question 1) if the marker is laminated whether the marker will be detected. 2) if different types of markers and lamination media have an influence in creating three-dimensional objects and 3) How long it takes for 3D objects to appear compared to the different marker types and laminate media used. The method used in this research is marker based tracking which is the marker is an object marker that has a pattern that will be read by a computer via a webcam or camera connected to a computer, usually a black and white illustration with a thick black border and white background [2]. The test material in this study uses black-and-white and colored markers with glossy and matte lamination media. As a container for bringing up three-dimensional objects used in augmented reality [3]. This study aims to measure the percentage (%) and time (ms) of the effect of marker types and laminate media on the appearance of three-dimensional igneous rock objects, where igneous rock is used as a three-dimensional object. Igneous rocks were chosen because these rocks are considered the ancestors of other rocks because they are the history of the formation of the earth [4]. Also, by making igneous rocks into three-dimensional (3D) objects, it can make it easier for general users to learn detailed shapes, as well as other information about igneous rocks [5]. It is hoped that it will benefit both marker types and lamination media in making augmented reality and as a learning medium about igneous rock.
273
2. Result and Discussion In some tests there are several three-dimensional objects that cannot appear on the detection, while in other rocks can be scanned properly by the system and several tests on the distance variable used three-dimensional objects cannot appear. Based on the results of these observations and classifications, it can be concluded that it is true that the presence of marker types and materials or the laminated augmented reality book material or igneous rock has an influence in bringing up three-dimensional (3D) objects, and by selecting the appropriate marker and lamination type, three-dimensional objects can appear well on the application. The speed range in bringing up objects (3D) is in the range of 00.600 seconds to 01.063 seconds based on the results of comparison and classification of the types of markers and lamination media. The best results for bringing up three-dimensional objects based on time and percentage are black and white marker and matte lamination. A good and ideal distance vulnerability for scanning is 40cm to 50cm, because at a distance of 10cm to 25cm the object is too close to the camera and at a distance of 50cm to 100cm the object is too far from the camera which will make three-dimensional objects cannot be scanned. For future development, features can be added that can improve the performance of igneous augmented reality and it is still possible if it is developed by testing based on the size of the marker used to determine whether or not it affects the appearance of three-dimensional objects based on the type of marker size. . Keywords: Augmented Reality, Geology, Information System, Igneous Rocks, Science Education. Acknowledgment References [1] D. Noor, Pengantar geologi. Deepublish, 2014. [2] D. Noor, “GEOLOGI.” [3] R. T. Azuma, “A survey of augmented reality,” Presence Teleoperators Virtual Environ., vol.
6, no. 4, pp. 355–385, 1997. [4] S. Siltanen, “Theory and applications of marker-based augmented reality: Licentiate thesis,”
2012. [5] K. R. Wahyu and J. Jalinas, “ANALISIS PENGARUH PENGGUNAAN MARKER
TERHADAP KEMUNCULAN OBJEK PADA APLIKASI AUGMENTED REALITY,” SEMNASTEKNOMEDIA ONLINE, vol. 4, no. 1, p. 2, 2016.
274
International Conference on Natural Sciences, Mathematics, Applications, Research, and Technology
Manado, Indonesia, 22-23October 2020
Intervention Model of IDX Finance Stock for The Period May 2010-May 2020 Due To The Effects Of The Corona Virus Riyana Utami*1, Mustika Hadijati2 and I Gede Adhitya Wisnu Wardhana3
1, 2 Department Mathematic, Universitas Mataram, INDONESIA. (E-mail: [email protected], [email protected]) 3 Department Mathematic, Universitas Mataram, INDONESIA. (E-mail: [email protected]) INTRODUCTION Since the determination of the coronavirus (covid-19) as a global pandemic by the WHO Direct-General, Dr. Tedros Adhanom Ghebreyesus, on March 11, 2020 (WHO.int, 2020), Covid-19 intervened in all fields, one of which was in the economic sector. The extremely fast spread of the coronavirus in China to various countries has sparked concern among market players. Indonesia as one of the affected countries feels the consequences. The domestic stock market has been hit by negative sentiments from the coronavirus (corona effect), one of which is the shares of the Indonesia Stock Exchange (IDX) in the financial sector. To model the financial sectoral IDX stock data (IDX Finance) which was intervened by the coronavirus (covid-19), an intervention model was used to describe or explain the effects of the coronavirus affecting the data. The intervention model will be said to be appropriate to describe the corona effect that occurs in the IDX finance stock data if the parameters of the model are significant and meet the residual assumptions that are normally distributed (white noise) and identical-independent. To obtain significant parameters, parameter assessment is necessary. The method of estimating parameters that are often used is the maximum likelihood method because the maximum likelihood method is closely related to numerical abilities, especially in producing a solution point in an equation (Yendra and Noviadi, 2015). RESULTS AND DISCUSSION Based on Figure 1, where data has been intervened by the coronavirus since January 2020, it was found that the data can be modeled with an intervention model. By looking at the effect, it can be concluded that the data has a step function with the best pre-intervention model, namely ARIMA (2,1,2). To estimate the ARIMA parameter (2,1,2) using the maximum likelihood method, it is obtained as follows :
tt a
BB
BBZ
2
2
8732,07176,119506.08361,11
(1)
After identifying the order of intervention from the ARIMA residual graph (2,1,2) it is found that the order 0b , 0s , and 0r , then the intervention model can be written as follows :

275
t
T
tt aBB
BBSZ
221
221)(
0 ˆˆ1
ˆˆ1ˆ
(2)
Based on this model, there are several possibilities that the data does not contain intervention or the data is used too little to identify the order of intervention.
Figure 1. time series plot of IDX Finance stock prices
for the period May 2010-May 2020. Keywords: Time Series, Intervention model, ARIMA, Stock Price, IDX Finance. Acknowledgment: Special thanks to KPBI Statistika of Universitas Mataram for their support. References
1. Yendra, R. dan Elsa T. N., “Perbandingan Estimasi Parameter Pada Distribusi Eksponensial
Dengan Menggunakan Metode Maksimum Likelihood Dan Metode Bayesian”, (Jurnal Sains Matematika dan Statistika, 2015) Vol. 1(2), pp. 62-72.
2. WHO.int. (2020, 27 April). Archieved : WHO Timeline – COVID-19. Diakses pada 11 Oktober
2020, dari https://www.who.int/news/item/27-04-2020-who-timeline---covid-19
276
International Conference on Natural Sciences, Mathematics, Applications, Research, and Technology
Manado, Indonesia, 22-23 October 2020
Sentiment Analysis Using Support Vector Machine for Community Compliance Representation in The Covid-19 Pandemic Period Eneng Tita Tosida*1, Krisna2, Erniyati3
1, 2, 3 Computer Science Department, FMIPA, Universitas Pakuan, INDONESIA. (E-mail: [email protected], [email protected], [email protected]) INTRODUCTION Currently, the world is faced with a plague that has claimed many lives. The disease outbreak is Covid-19 or commonly known as the coronavirus. Coronaviruses are a large family of viruses that can cause disease in animals or humans. In humans, the coronavirus is known to cause respiratory infections ranging from the common cold to more severe illnesses such as Middle East Respiratory Syndrome (MERS) and Severe Acute Respiratory Syndrome (SARS) [1]. Every day the data on positive cases and deaths in Indonesia is increasing. Various efforts have been made by the government to reduce the rate of transmission and spread of the Covid-19 virus so as not to add positive victims and deaths in various regions in Indonesia, various efforts that have been made at this time are physical distancing and large-scale social restriction (LSSR). However, there are still many people who have not complied with the rules that have been made by the government to prevent the transmission and spread of the Covid-19 virus. This study aims to implement Sentiment Analysis using a Support Vector Machine (SVM) for representation of public compliance during the Covid-19 pandemic. In this study, the data used are taken from social media (twitter) with the keywords "obey LSSR study at home", "comply with PSBB WFH", "comply with LSSR transportation" and "comply with physical distancing". The data is processed using the Knowledge Discovery and Data Mining (KDD) method and text mining. Text mining is a technology used to analyze unstructured data in the form of text. In-text mining analysis, there are two main phases, namely preprocessing and integration of unstructured data. The second is a statistical analysis of data that has been preprocessed to extract content from what is contained in the text [2]. The word weighting is carried out using the TF-IDF method. SVM classification is carried out which is a learning system using space in the form of linear functions in feature space with high dimensions trained using learning algorithms based on optimization theory by implementing learning bias[3]. SVM is a method in machine learning that works with the principle of Structural Risk Minimization (SRM) intending to find the best hyperplane that separates two classes in the input space. The main principle of using SVM is to find the best hyperline that functions as a separator of two classes in the input space. The hyperline can be a line in two dimensions and can be a flat plane in multiple planes. The input in SVM is vector data consisting of real numbers. The benefits of this study are to determine the level of compliance of the Indonesian people with government regulations in handling the spread and transmission of Covid-19, applying the SVM method in classifying sentiment analysis to represent community compliance during the Covid-19 pandemic, and to find out the accuracy of the method.
RESULTS AND DISCUSSION This research was conducted using the KDD approach [4]. The research stages included data preprocessing (data cleaning and integration, selection and data transformation), data mining, pattern evaluation, and knowledge presentation. The total amount of data obtained from the results of crawling to comply with physical distancing is 500 data, comply with LSSR study at home 1961 data, comply with LSSR WFH, namely 610 data and comply with LSSR for transportation, namely 726 data. After the data has been collected, preprocessing is carried out using the TF-IDF method. After the preprocessing was carried out, the classification stage was carried out using the SVM
277
method. SVM is proposed as an alternative to standard SVM which has proven to be more efficient than traditional SVM in processing large-scale data. The accuracy of this model tested by confusion matrix and then this model validated using a linguist jugment. The model implementation is done using R Studio. The results of the model implementation are presented in the form of web -based visualization, with a user-friendly interface. The classification are divided into two classess, namely obedience and disobedience. In classifying a good comment for transportation LSSR, study at home LSSR, WFH LSSR, and physical distancing. A corpus is made which is obtained from interviews with linguists. From the results of the sentiment analysis towards WFH compliance, 326 and 135 obedient and disobedient sentiments were obtained with an accuracy of 98%. Then for the results of the sentiment analysis towards complying with the LSSR learning at home, the results of the sentiment being obedient and not obeying the LSRR study at home were 880 and 524 comments from the overall results with an accuracy value of 93%. Whereas for the results of the sentiment analysis on obedient transportation that has been carried out, there are 239 and 237 comments of obedient and disobedient sentiments from the overall results with an accuracy value of 88% and for the results of the sentiment analysis towards obedient physical distancing, there are 339 obedient and disobedient sentiments 80 comments from the overall result with an accuracy value of 90%. Keywords : Text Mining, KDD, SVM, Covid-19. References [1] World Health Organization. ‘Pneumonia of unknown cause – China’, Emergencies preparedness,
response, Disease outbreak news, World Health Organization (WHO). 2020. https://www.who.int/csr/don/05-january-2020-pneumonia-ofunkown-cause-china/en/
[2] Flynn, M., & Francis, L. 2010. Text Mining Handbrook. In Casuality Actuarial Society E-Forum. [3] Huang, Chia-Hui, Keng-CHieh, Yang, dan Kao, Han-Ying. “Analyzing Big Data With The Hybrid
Interval Regression Methods”. The Scientific World Journal. 2014. [4] Han, J. & Kamber, M. 2012. Data Mining Concepts and Techniques Second Edition. Morgan Kauffman, San Francisco.
278
International Conference on Natural Sciences, Mathematics, Applications, Research, and Technology
Manado, Indonesia, 22-23 October 2020
On The Representation of The Weight Enumerator of Code 𝒅𝒏+ Mans L. Mananohas *1, Charles E. Mongi1, Dolfie Pandara2, Mohammad P.M. Mo'o 1and Chriestie E.J.C. Montolalu1
1Mathematics Department, Sam Ratulangi University , Indonesia. (E-mail: [email protected], [email protected]) 2Phisics Department, Sam Ratulangi University , Indonesia. (E-mail: [email protected]) INTRODUCTION The weight enumerator plays an important role in the development of coding theory. In this paper we only focused on binary self-dual doubly-even (Type II, for short) codes in genus 1. It is known that the weight enumerator of all Type II codes can be written uniquely as isobaric polynomials in 𝑊𝑑8+ (𝑥, 𝑦) =𝑥8 + 14𝑥4𝑦4 + 𝑦8 and 𝜑24(𝑥, 𝑦) = 𝑥4𝑦4(𝑥4 − 𝑦4)4 with integer coefficients [1,4]. We recall the code 𝑑𝑛+ is characterized as 𝑑𝑛+ = {(𝛼1 + 𝛽, 𝛼1, 𝛼2 + 𝛽, 𝛼2, … , 𝛼𝑛/2+𝛽, 𝛼𝑛/2): 𝛼1, … , 𝛼𝑛/2, 𝛽 ∈ Ϝ2, 𝛼1 +⋯+ 𝛼𝑛/2 = 0}. We know that the weight enumerator of the code 𝑑𝑛+ , 𝑊𝑑𝑛+ (𝑥, 𝑦), is an element of the polynomial ring ℤ [ 𝑊𝑑8+ (𝑥, 𝑦), 𝜑24(𝑥, 𝑦)]. Since 𝑑𝑛+ is an element of type II codes, all weight enumerators of the code 𝑑𝑛+ in genus 1 are elements of the polynomial ring 𝐶 [ 𝑊𝑑8+ ,𝑊𝑑24+ ], as shown by Fujii and Oura [2].
Indeed we show that 𝐶 = ℤ[ 124]. Here we have a claim that the weight enumerator of the code 𝑑𝑛+ can
be represented as an element of the polynomial ring ℤ [ 𝑊𝑑8+ , 𝜑24] and ℤ[ 124] [ 𝑊𝑑8+ ,𝑊𝑑24+ ]. RESULTS AND DISCUSSION We have the following results: Teorema 1 𝑊𝑑𝑛+ (𝑥, 𝑦) is an element of the polynomial ring ℤ[ 124] [𝑊𝑑8+ (𝑥, 𝑦),𝑊𝑑24+ (𝑥, 𝑦)]. In particular, we have 𝑊𝑑𝑛+ (𝑥, 𝑦) = 𝑏0 (𝑊𝑑8+ )𝑛8 +∑𝑏𝑖 (𝑊𝑑8+ )𝑛8−3𝑖 (𝑊𝑑24+ )𝑖𝑘
𝑖=1
where 𝑏0 = (1 +∑(−1)𝑖 𝑎𝑖24𝑖𝑘𝑖=1 ) , 𝑏𝑖 = (∑(−1)𝑗−𝑖 (𝑗𝑖)𝑘
𝑗=𝑖𝑎𝑗24𝑗) for 𝑖 = 1,2, … , 𝑘
and 𝑎𝑖 ∈ ℤ is the coefficient of (𝑊𝑑8+ )𝑛8−3𝑖 (𝜑24)𝑖 in the representation of 𝑊𝑑𝑛+ (𝑥, 𝑦) as an element of
ring ℤ [ 𝑊𝑑8+ , 𝜑24]. Corollary 2 Let 𝑎𝑖 and 𝑏𝑖 as defined in theorem 1. For all 𝑖, we have 𝑏𝑖 ∈ ℤ if and only if 24𝑖|𝑎𝑖 .

279
Teorema 3 There exist no weight enumerators of Type II code generated by 𝑊𝑒8 and 𝜑24 that can be written uniquely as isobaric polynomial in five homogeneous polynomial elements of degrees 8, 24, 24, 24, 24. Keywords: Weight Enumerator; Type II code; polynomial ring. Acknowledgment This research was supported by Research and Community Service Institute, UNSRAT. References
1. Gleason, A. M., Weight polynomials of self-dual codes and the MacWilliams identities, Actes du Congr`es International des Mathmaticiens (Nice, 1970), Tome 3, 211–215. Gauthier-Villars, Paris, 1971..
2. M. Fujii and M. Oura. Ring of the weight enumerators of 𝑑𝑛+ . Tsukuba. J. math. 42(1)(2018), 53-63..
3. M.Oura. On the integral ring spanned by genus two weight enumerators. Discrete Mathematics. 308(16)(2008), 3722-3725 .
4. Rains, E.M., Sloane, N.J.A., Self-dual codes, in Handbook of coding theory ed. by Pless, V.S. et al., Amsterdam:Elsevier, 177-294 (1998).
5. Conway, J. H., Sloane, N. J. A., Sphere packings, lattices and groups, Third edition, Grundlehren der Mathematischen Wissenschaften 290, Springer-Verlag, New York, 1999.
6. Nebe, G., Rains, E.M., Sloane, N.J.A., Self-dual codes and invariant theory, Algorithms and Computation in Mathematics 17, Springer-Verlag, Berlin, 2006.
7. Duke, W., On codes and Siegel modular forms, Internat. Math. Res. Notices 1993, no. 5, 125–136.
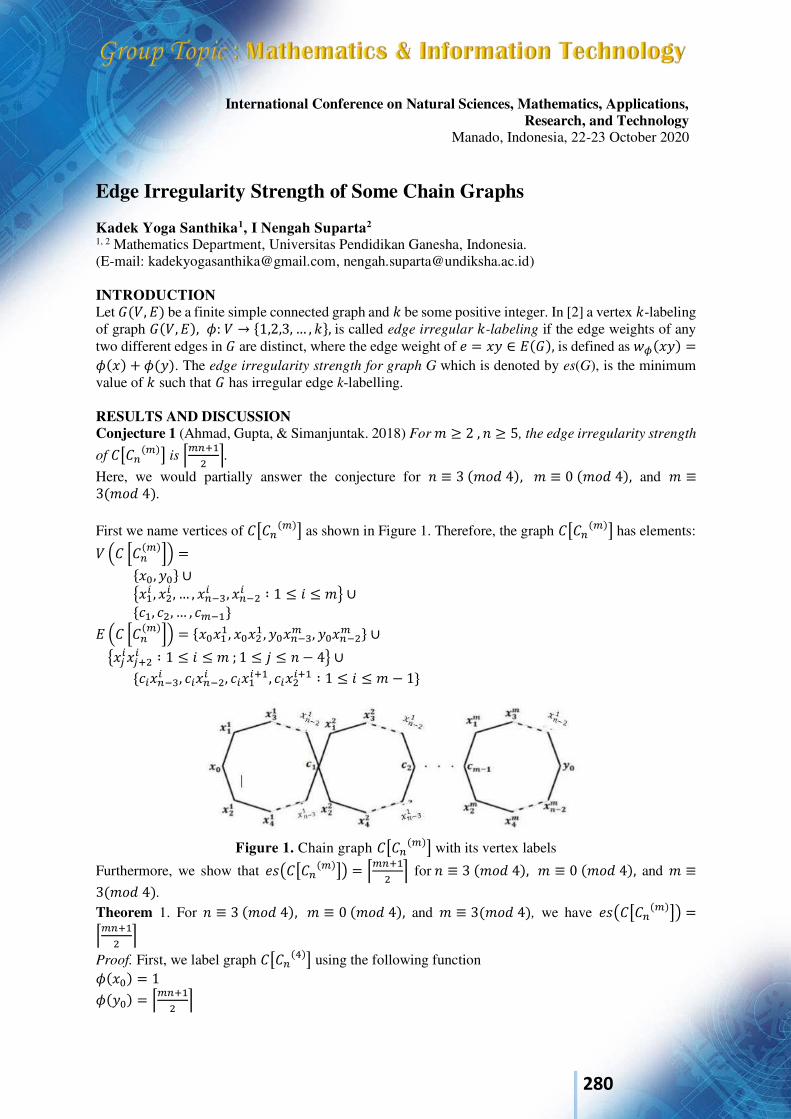
280
International Conference on Natural Sciences, Mathematics, Applications, Research, and Technology
Manado, Indonesia, 22-23 October 2020
Edge Irregularity Strength of Some Chain Graphs Kadek Yoga Santhika1, I Nengah Suparta2
1, 2 Mathematics Department, Universitas Pendidikan Ganesha, Indonesia. (E-mail: [email protected], [email protected]) INTRODUCTION Let 𝐺(𝑉, 𝐸) be a finite simple connected graph and 𝑘 be some positive integer. In [2] a vertex 𝑘-labeling of graph 𝐺(𝑉, 𝐸), 𝜙: 𝑉 → {1,2,3, … , 𝑘}, is called edge irregular 𝑘-labeling if the edge weights of any two different edges in 𝐺 are distinct, where the edge weight of 𝑒 = 𝑥𝑦 ∈ 𝐸(𝐺), is defined as 𝑤𝜙(𝑥𝑦) =𝜙(𝑥) + 𝜙(𝑦). The edge irregularity strength for graph G which is denoted by es(G), is the minimum value of 𝑘 such that 𝐺 has irregular edge k-labelling. RESULTS AND DISCUSSION Conjecture 1 (Ahmad, Gupta, & Simanjuntak. 2018) For 𝑚 ≥ 2 , 𝑛 ≥ 5, the edge irregularity strength
of 𝐶[𝐶𝑛(𝑚)] is ⌈𝑚𝑛+12 ⌉. Here, we would partially answer the conjecture for 𝑛 ≡ 3 (𝑚𝑜𝑑 4), 𝑚 ≡ 0 (𝑚𝑜𝑑 4), and 𝑚 ≡3(𝑚𝑜𝑑 4). First we name vertices of 𝐶[𝐶𝑛(𝑚)] as shown in Figure 1. Therefore, the graph 𝐶[𝐶𝑛(𝑚)] has elements: 𝑉 (𝐶 [𝐶𝑛(𝑚)]) = {𝑥0, 𝑦0} ∪ {𝑥1𝑖 , 𝑥2𝑖 , … , 𝑥𝑛−3𝑖 , 𝑥𝑛−2𝑖 ∶ 1 ≤ 𝑖 ≤ 𝑚} ∪ {𝑐1, 𝑐2, … , 𝑐𝑚−1} 𝐸 (𝐶 [𝐶𝑛(𝑚)]) = {𝑥0𝑥11, 𝑥0𝑥21, 𝑦0𝑥𝑛−3𝑚 , 𝑦0𝑥𝑛−2𝑚 } ∪ {𝑥𝑗𝑖𝑥𝑗+2𝑖 ∶ 1 ≤ 𝑖 ≤ 𝑚 ; 1 ≤ 𝑗 ≤ 𝑛 − 4} ∪ {𝑐𝑖𝑥𝑛−3𝑖 , 𝑐𝑖𝑥𝑛−2𝑖 , 𝑐𝑖𝑥1𝑖+1, 𝑐𝑖𝑥2𝑖+1 ∶ 1 ≤ 𝑖 ≤ 𝑚 − 1}
Figure 1. Chain graph 𝐶[𝐶𝑛(𝑚)] with its vertex labels
Furthermore, we show that 𝑒𝑠(𝐶[𝐶𝑛(𝑚)]) = ⌈𝑚𝑛+12 ⌉ for 𝑛 ≡ 3 (𝑚𝑜𝑑 4), 𝑚 ≡ 0 (𝑚𝑜𝑑 4), and 𝑚 ≡3(𝑚𝑜𝑑 4). Theorem 1. For 𝑛 ≡ 3 (𝑚𝑜𝑑 4), 𝑚 ≡ 0 (𝑚𝑜𝑑 4), and 𝑚 ≡ 3(𝑚𝑜𝑑 4), we have 𝑒𝑠(𝐶[𝐶𝑛(𝑚)]) =⌈𝑚𝑛+12 ⌉ Proof. First, we label graph 𝐶[𝐶𝑛(4)] using the following function 𝜙(𝑥0) = 1 𝜙(𝑦0) = ⌈𝑚𝑛+12 ⌉

281
𝜙(𝑐1) = 𝑛+54 𝜙(𝑐2) = 𝑛+52 𝜙(𝑐3) = 5𝑛+54
𝜙(𝑥𝑗1) ={ 1, 𝑗 = 1𝑛+32 , 𝑗 = 2𝑛+12 , 𝑗 = 4 𝑗+54 , 𝑗 ∈ 𝐾3(𝑗+34 ) , 𝑗 ∈ 𝐾5𝑛−2𝑗+64 , 𝑗 ∈ 𝐾6𝑛−2𝑗+94 , 𝑗 ∈ 𝐾8
𝜙(𝑥𝑗2) ={ 3𝑛−14 , 𝑗 = 1 3𝑛+114 , 𝑗 = 2𝑛+134 , 𝑗 = 35𝑛−34 , 𝑗 = 43𝑛+2+𝑗4 , 𝑗 ∈ 𝐾53𝑛+9−𝑗4 , 𝑗 ∈ 𝐾6𝑛+10+𝑗4 , 𝑗 ∈ 𝐾75𝑛+1−𝑗4 , 𝑗 ∈ 𝐾8
𝜙(𝑥𝑗3) ={ 5𝑛+54 , 𝑗 = 𝑛 − 25𝑛+14 , 𝑗 = 𝑛 − 4, 𝑛 − 63𝑛−32 , 𝑗 = 1(6𝑛+4−𝑗)4 , 𝑗 ∈ 𝐾28𝑛+7−𝑗4 , 𝑗 ∈ 𝐾36𝑛+6−𝑗4 , 𝑗 ∈ 𝐾46𝑛−5−𝑗4 , 𝑗 ∈ 𝐾5
𝜙(𝑥𝑗4) ={ 7𝑛+2+𝑗4 , 𝑗 ∈ 𝐾17𝑛+5+𝑗4 , 𝑗 ∈ 𝐾27𝑛+4+14 , 𝑗 ∈ 𝐾35𝑛+5+𝑗4 , 𝑗 ∈ 𝐾4
Where 𝐾𝑖 is a set of integer that satisfy 𝐾𝑖 = 𝑖 + 4𝑘, 𝑘 = 0,1,2,3…Using the above function, we obtained the weight of edges pattern for 𝐶[𝐶𝑛(4)] as a set of different integer {2,3,4,… ,𝑚𝑛 + 1}. So 𝑓
is edge irregular ⌈𝑚𝑛+12 ⌉-labeling for 𝐶[𝐶𝑛(4)]. Remark: 𝐶[𝐶𝑛(𝑚)]′ is a derivative graph which is all of its vertices are added by a constant 𝑒𝑠(𝐶[𝐶𝑛(4)]) − 1.

282
For 𝑚 ≡ 0 (𝑚𝑜𝑑 4) and 𝑚 ≡ 3(𝑚𝑜𝑑 4), we do amalgamation process between 𝐶[𝐶𝑛(4)] and 𝐶[𝐶𝑛(3)]′ or 𝐶[𝐶𝑛(4)]′ to construct a chain graph with the length of 𝑚 blocks 𝐶𝑛(4) with irregular ⌈𝑚𝑛+12 ⌉-labeling..
Figure 2. Chain graph 𝐶[𝐶11(7)] with edge irregular 39-labeling
Keywords: edge irregular k-labeling, edge irregularity strength. References
1. A. Ahmad, A. Gupta, & R. Simanjuntak. (2018). Computing the Edge Irregularity Strengths of
Chain Graphs and the Join of Two Graphs. Electronic Journal of Graph Theory and Applications, 6(1), 201–207.
2. Suparta, I. N., & Suharta, I. G. P. A Note on Edge Irregularity Strength of Some Graphs. Indonesian Journal of Combinatorics, 4(1), 10-20

283
International Conference on Natural Sciences, Mathematics, Applications, Research, and Technology
Manado, Indonesia, 22-23 October 2020
Edge Irregularity Strength of Chain Graph 𝐶[𝐶𝑛(𝑚)] for 𝑛 ≡ 1 𝑚𝑜𝑑 (4) and 𝑚 ≢ 3 𝑚𝑜𝑑 (4) Ni Luh Diah Fridayanti Sucita1, I Nengah Suparta2
1, 2 Mathematics Department, Universitas Pendidikan Ganesha, INDONESIA (E-mail: [email protected], [email protected]) INTRODUCTION For finite simple and connected graph 𝐺(𝑉, 𝐸) with the vertex set V and the edge set E, a vertex k-labeling 𝜙 ∶ 𝑉 → {1,2,… , 𝑘}, is defined to be an edge irregular k-labeling of the graph G if for any two different edges e and f their weights are not equal, 𝑤𝜙(𝑒) ≠ 𝑤𝜙(𝑓), where the weight of an edge 𝑒 = 𝑥𝑦 ∈ 𝐸(𝐺) is 𝑤𝜙(𝑥𝑦) = 𝜙(𝑥) + 𝜙(𝑦). The minimum value of k such that the graph G has an edge irregular k-labeling is called the edge irregularity strength of G which is denoted by es(G). Our work here is based on the conjecture of Ahmad, Gupta, and Simanjuntak [1] saying that
For 𝑚 ≥ 2, 𝑛 ≥ 5 the edge irregularity strength of 𝐶[𝐶𝑛(𝑚)] is ⌈𝑚𝑛+12 ⌉. In this note, we determine the edge irregularity strength of some chain graphs 𝐶[𝐶𝑛(𝑚)] for all postive integers 𝑛 ≡ 1 mod (4) and 𝑚 ≢ 3 mod (4), and therefore, give a partial answer for the conjecture. RESULTS AND DISCUSSION Following [5], we mean a block of a graph is a maximal subgraph with no cut vertex. A graph H is called a block-cut-vertex graph of graph G if the vertices of graph H are blocks and cut-vertices of G, and two vertices in H are adjacent whenever one vertex is a block in G and the other one is a cut-vertex in G belonging to the block. The chain graph which is denoted by 𝐶[𝐵1, 𝐵2, … , 𝐵𝑚], is a graph with blocks 𝐵1, 𝐵2, … 𝐵𝑚 such that for every i, 𝐵𝑖 dan 𝐵𝑖+1, 1 ≤ i ≤ 𝑚 − 1, have a common vertex in such a way that the block-cut-vertex graph is a path. If 𝐵1 = 𝐵2 = ⋯ = 𝐵𝑚, then 𝐶[𝐵1, 𝐵2, … , 𝐵𝑛] is denoted by 𝐶[𝐵(𝑚)]. Therefore, by the definition, we have 𝐶[𝐶𝑛(𝑚)] is a chain graph with m blocks of graph 𝐶𝑛. For instance, figure 1 shown chain graph 𝐶[𝐶5(4)].
Figure 1. Chain graph 𝐶[𝐶5(4)]
Here, we show that for all 𝑛 ≡ 1 𝑚𝑜𝑑 (4) and 𝑚 ≢ 3 𝑚𝑜𝑑(4), 𝑒𝑠 (𝐶 [𝐶𝑛(𝑚)]) = ⌈𝑚𝑛+12 ⌉. This result is
formulated as the following theorem
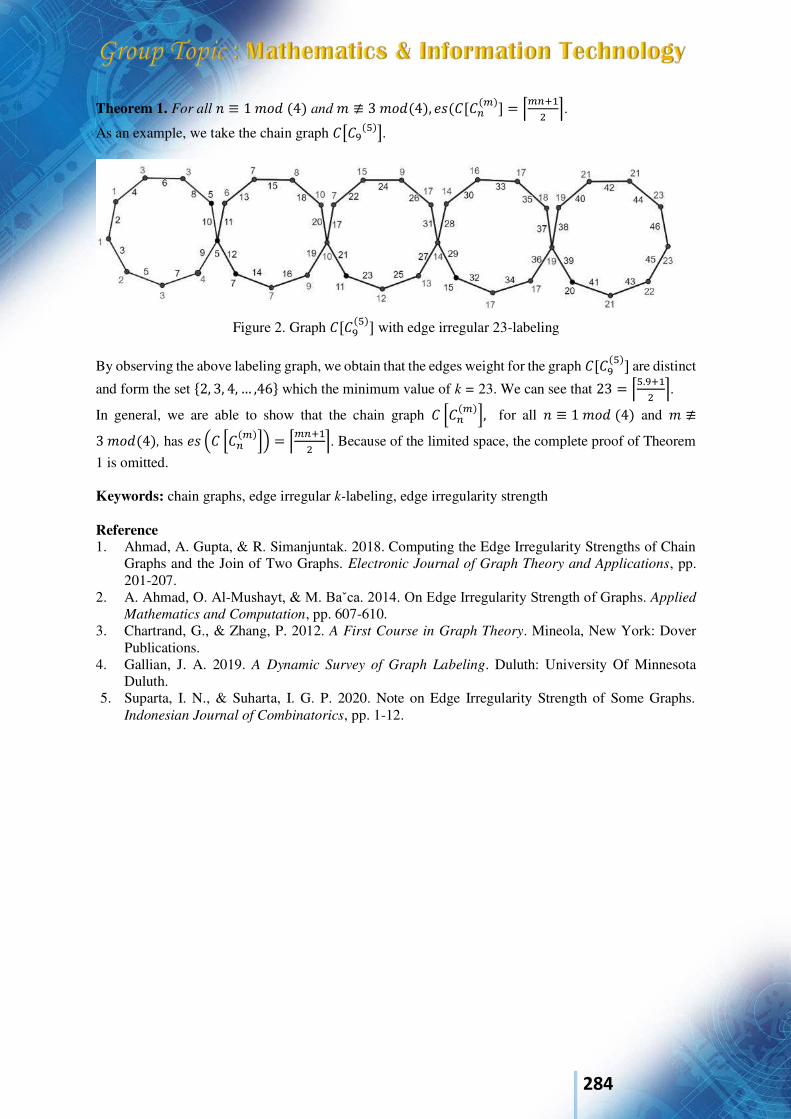
284
Theorem 1. For all 𝑛 ≡ 1 𝑚𝑜𝑑 (4) and 𝑚 ≢ 3 𝑚𝑜𝑑(4), 𝑒𝑠(𝐶[𝐶𝑛(𝑚)] = ⌈𝑚𝑛+12 ⌉. As an example, we take the chain graph 𝐶[𝐶9(5)].
Figure 2. Graph 𝐶[𝐶9(5)] with edge irregular 23-labeling
By observing the above labeling graph, we obtain that the edges weight for the graph 𝐶[𝐶9(5)] are distinct
and form the set {2, 3, 4, … ,46} which the minimum value of k = 23. We can see that 23 = ⌈5.9+12 ⌉. In general, we are able to show that the chain graph 𝐶 [𝐶𝑛(𝑚)], for all 𝑛 ≡ 1 𝑚𝑜𝑑 (4) and 𝑚 ≢3 𝑚𝑜𝑑(4), has 𝑒𝑠 (𝐶 [𝐶𝑛(𝑚)]) = ⌈𝑚𝑛+12 ⌉. Because of the limited space, the complete proof of Theorem
1 is omitted. Keywords: chain graphs, edge irregular k-labeling, edge irregularity strength Reference 1. Ahmad, A. Gupta, & R. Simanjuntak. 2018. Computing the Edge Irregularity Strengths of Chain
Graphs and the Join of Two Graphs. Electronic Journal of Graph Theory and Applications, pp. 201-207.
2. A. Ahmad, O. Al-Mushayt, & M. Baˇca. 2014. On Edge Irregularity Strength of Graphs. Applied
Mathematics and Computation, pp. 607-610. 3. Chartrand, G., & Zhang, P. 2012. A First Course in Graph Theory. Mineola, New York: Dover
Publications. 4. Gallian, J. A. 2019. A Dynamic Survey of Graph Labeling. Duluth: University Of Minnesota
Duluth. 5. Suparta, I. N., & Suharta, I. G. P. 2020. Note on Edge Irregularity Strength of Some Graphs.
Indonesian Journal of Combinatorics, pp. 1-12.
285
International Conference on Natural Sciences, Mathematics, Applications, Research, and Technology
Manado, Indonesia, 22-23 October 2020
Designing Nonparametric Spline and Fourier Series Regression Package in Python Programming Language Lalu Abd Azis Mursy*1, Mustika Hadijati2, Irwansyah3 and Bulqis Nebulla Syechah4
1, 2 Department Mathematic, Universitas Mataram, INDONESIA. (E-mail: [email protected], [email protected]) 3, 4 Department Mathematic, Universitas Mataram, INDONESIA. (E-mail: [email protected], [email protected]) INTRODUCTION Research using a nonparametric approach method has been very widely used and applied in several problems. However, at this time still using some software whose use is not specific to the nonparametric approach. Therefore, a special software for a nonparametric approach is needed in order to facilitate further research in determining the regression model with a nonparametric approach which is more specialized in determining the optimal point of knots in spline method and number of knots in Fourier series method. One of the criteria to determine the optimal point of knots and number of knots is to minimize the value of the Generalized Cross Validation (GCV). One of the algorithms used to minimize the GCV value is the Simulated Annealing algorithm. Therefore, in this research, nonparametric spline and Fourier series regression package was built in the python programming language. RESULTS AND DISCUSSION The package that has been made is tested using poverty data in West Nusa Tenggara Province in 2017 for the spline method and rainfall data in Mataram City in 2009-2018 for the Fourier series method. From the experimental results, it is obtained the optimal knot point, the optimal number of knots and the minimum GCV with the Simulated Annealing algorithm as in the following table and curves.
Table 1. Nilai Optimal knot point and minimum GCV Optimal knot point (1 knot) Minimum GCV
113,766 33,824 2,602 7,978
The regression curve for estimated data and actual data on poverty in West Nusa Tenggara Province in 2017 can be seen in Figure 1.
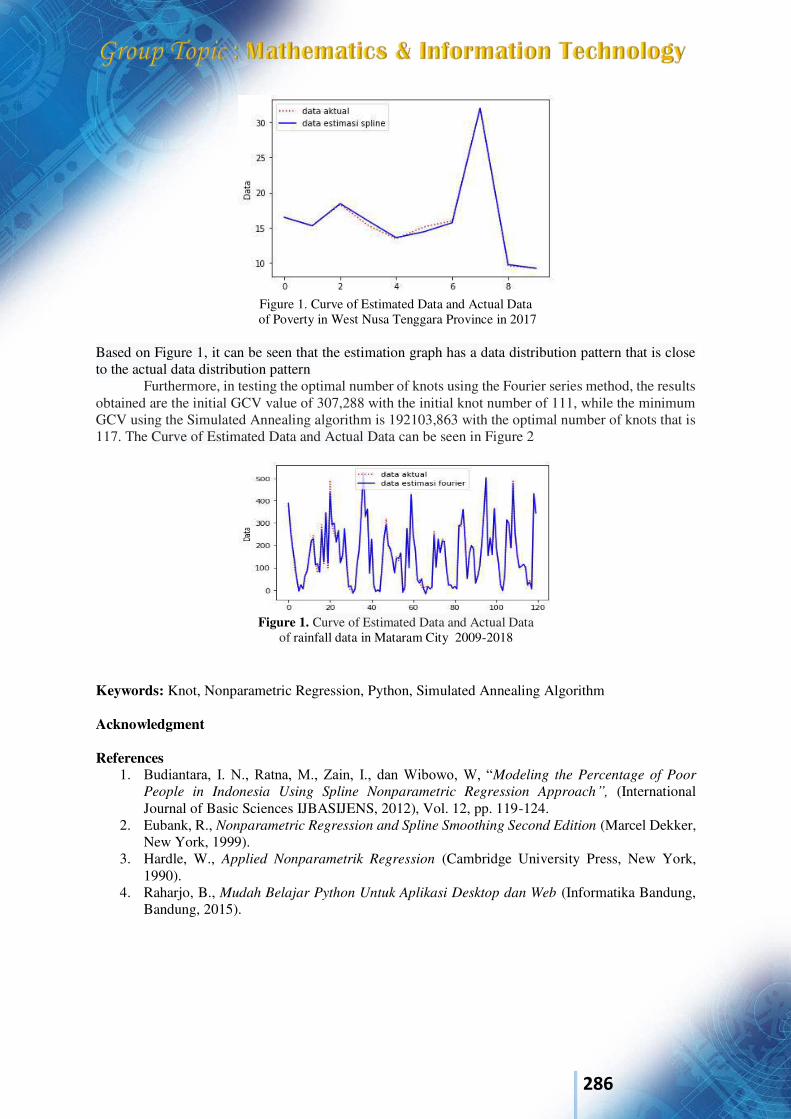
286
Figure 1. Curve of Estimated Data and Actual Data
of Poverty in West Nusa Tenggara Province in 2017
Based on Figure 1, it can be seen that the estimation graph has a data distribution pattern that is close to the actual data distribution pattern
Furthermore, in testing the optimal number of knots using the Fourier series method, the results obtained are the initial GCV value of 307,288 with the initial knot number of 111, while the minimum GCV using the Simulated Annealing algorithm is 192103,863 with the optimal number of knots that is 117. The Curve of Estimated Data and Actual Data can be seen in Figure 2
Figure 1. Curve of Estimated Data and Actual Data
of rainfall data in Mataram City 2009-2018 Keywords: Knot, Nonparametric Regression, Python, Simulated Annealing Algorithm Acknowledgment References
1. Budiantara, I. N., Ratna, M., Zain, I., dan Wibowo, W, “Modeling the Percentage of Poor
People in Indonesia Using Spline Nonparametric Regression Approach”, (International Journal of Basic Sciences IJBASIJENS, 2012), Vol. 12, pp. 119-124.
2. Eubank, R., Nonparametric Regression and Spline Smoothing Second Edition (Marcel Dekker, New York, 1999).
3. Hardle, W., Applied Nonparametrik Regression (Cambridge University Press, New York, 1990).
4. Raharjo, B., Mudah Belajar Python Untuk Aplikasi Desktop dan Web (Informatika Bandung, Bandung, 2015).
287
International Conference on Natural Sciences, Mathematics, Applications, Research, and Technology
Manado, Indonesia, 22-23 October 2020
APPROXIMATION OF THE CHANGE POINT OF LOCAL STABILITY IN A ONE-PREY TWO-PREDATORS SYSTEM USING BISECTION METHOD M. Putra Sani Hattamurrahman1, Marwan2 and Lailia Awalushaumi3
Department of Mathematics, Universitas Mataram, INDONESIA. ([email protected], [email protected], [email protected]) INTRODUCTION Stability of dynamical system is one of the most important issues to study. In this article, we show numerically that the change point of local stability a system namely a one-prey two-predator system can be approached using the bisection method. The system includes square root response function and the prey harvest factor which develops from Abadi et al. (2013). We focus on two parameters of the system that influence its stability, i.e. the efficiency factors of the conversión the prey relate to birth of first and second predator its symbolized by 𝜇1 and 𝜇2, respectively. The stability analaysis begin from linearization using the Jacobian matrix in the vicinity of the equilibrium points system from Hale and Koçak (1991). By varying the parameter system we derive the interval where the system change in stability. The bisection method is adapted from Epperson (2013) to find the change point of stability in an interval of parameter system in which has diference type of stability. RESULTS AND DISCUSSION We consider a one-prey two-predator system model with the square root response function and the prey harvest factor as follows. �̇� = 𝛼𝑥 (1 − 𝑥𝑁) − 𝛽1√𝑥1+𝑡ℎ1𝛽1√𝑥 𝑦1 − 𝛽2√𝑥1+𝑡ℎ2𝛽2√𝑥 𝑦2 − 𝑥𝑑𝐸 𝑦1̇ = −𝜔1𝑦1 + 𝜇1𝛽1√𝑥1 + 𝑡ℎ1𝛽1√𝑥 𝑦1 (1 − 𝑦1𝛽1√𝑥)
𝑦2̇ = −𝜔2𝑦2 + 𝜇2𝛽2√𝑥1 + 𝑡ℎ2𝛽2√𝑥 𝑦2 (1 − 𝑦2𝛽2√𝑥)
System (1) is analyzed for the stability of the equilibrium point of local by linearization method using the Jacobi matrix with the value variables and parameters i.e. 𝑥(0) = 0.6, 𝑦1(0) = 0.3, 𝑦2(0) = 0.3, 𝛼 = 0.75, 𝜔1 = 0.15, 𝜔2 = 020, 𝑁 = 0.80, 𝛽1 = 0.65, 𝛽2 = 0.75, 𝜇1 = 0.83, 𝜇2 = 0.82, 𝑡ℎ1 =0.0005, and 𝑡ℎ2 = 0.0004. Based on system (1) we obtained 4 equilibrium point of local i.e. 𝐸1 =(0.78, 0, 0), 𝐸2 = (0.47, 0, 0.27), 𝐸3 = (0.51, 0.28, 0), and 𝐸4 = (0.31, 0.18, 0.17). The results of numerical analysis show that at the equilibrium point of local 𝐸4 = (0.31, 0.18, 0.17) with 𝜇1 = 0.83 and 𝜇2 = 0.82 shows asymptotic stable conditions. Furthermore, the bisection method is used to find the change point of stability by selecting an interval of parameter system in which has diference type of stability, i.e. 𝜇1 = 0.83 and 𝜇2 = 0.82 in stable condition and 𝜇1 = 0.83 and 𝜇2 = 0.35 in unstable condition. So, in an interval of 𝜇2 we applied the bisection method to approach the position of stability change with the following results.
(1)
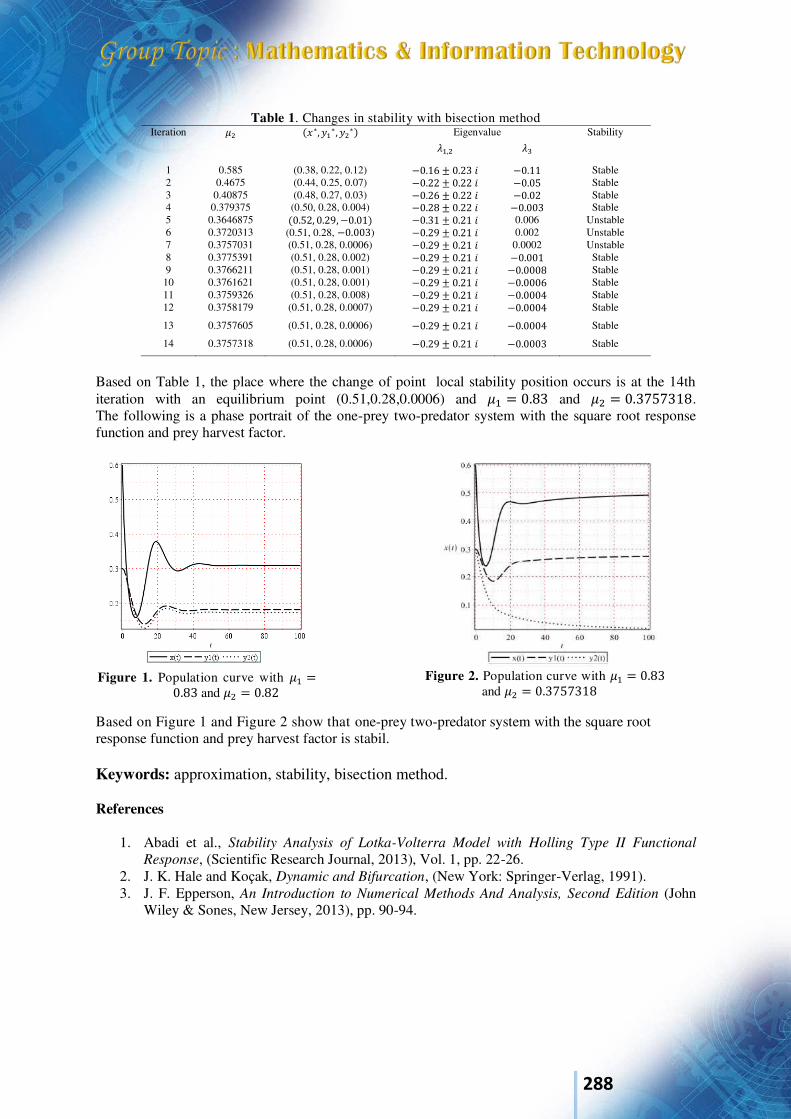
288
Table 1. Changes in stability with bisection method
Iteration 𝜇2 (𝑥∗, 𝑦1∗, 𝑦2∗) Eigenvalue Stability 𝜆1,2 𝜆3 1 0.585 (0.38, 0.22, 0.12) −0.16 ± 0.23 𝑖 −0.11 Stable 2 0.4675 (0.44, 0.25, 0.07) −0.22 ± 0.22 𝑖 −0.05 Stable 3 0.40875 (0.48, 0.27, 0.03) −0.26 ± 0.22 𝑖 −0.02 Stable 4 0.379375 (0.50, 0.28, 0.004) −0.28 ± 0.22 𝑖 −0.003 Stable 5 0.3646875 (0.52, 0.29, −0.01) −0.31 ± 0.21 𝑖 0.006 Unstable 6 0.3720313 (0.51, 0.28, −0.003) −0.29 ± 0.21 𝑖 0.002 Unstable 7 0.3757031 (0.51, 0.28, 0.0006) −0.29 ± 0.21 𝑖 0.0002 Unstable 8 0.3775391 (0.51, 0.28, 0.002) −0.29 ± 0.21 𝑖 −0.001 Stable 9 0.3766211 (0.51, 0.28, 0.001) −0.29 ± 0.21 𝑖 −0.0008 Stable 10 0.3761621 (0.51, 0.28, 0.001) −0.29 ± 0.21 𝑖 −0.0006 Stable 11 0.3759326 (0.51, 0.28, 0.008) −0.29 ± 0.21 𝑖 −0.0004 Stable 12 0.3758179 (0.51, 0.28, 0.0007) −0.29 ± 0.21 𝑖 −0.0004 Stable 13 0.3757605 (0.51, 0.28, 0.0006) −0.29 ± 0.21 𝑖 −0.0004 Stable 14 0.3757318 (0.51, 0.28, 0.0006) −0.29 ± 0.21 𝑖 −0.0003 Stable
Based on Table 1, the place where the change of point local stability position occurs is at the 14th iteration with an equilibrium point (0.51,0.28,0.0006) and 𝜇1 = 0.83 and 𝜇2 = 0.3757318. The following is a phase portrait of the one-prey two-predator system with the square root response function and prey harvest factor.
Based on Figure 1 and Figure 2 show that one-prey two-predator system with the square root response function and prey harvest factor is stabil. Keywords: approximation, stability, bisection method. References
1. Abadi et al., Stability Analysis of Lotka-Volterra Model with Holling Type II Functional
Response, (Scientific Research Journal, 2013), Vol. 1, pp. 22-26. 2. J. K. Hale and Koçak, Dynamic and Bifurcation, (New York: Springer-Verlag, 1991). 3. J. F. Epperson, An Introduction to Numerical Methods And Analysis, Second Edition (John
Wiley & Sones, New Jersey, 2013), pp. 90-94.
Figure 1. Population curve with 𝜇1 =0.83 and 𝜇2 = 0.82
Figure 2. Population curve with 𝜇1 = 0.83 and 𝜇2 = 0.3757318
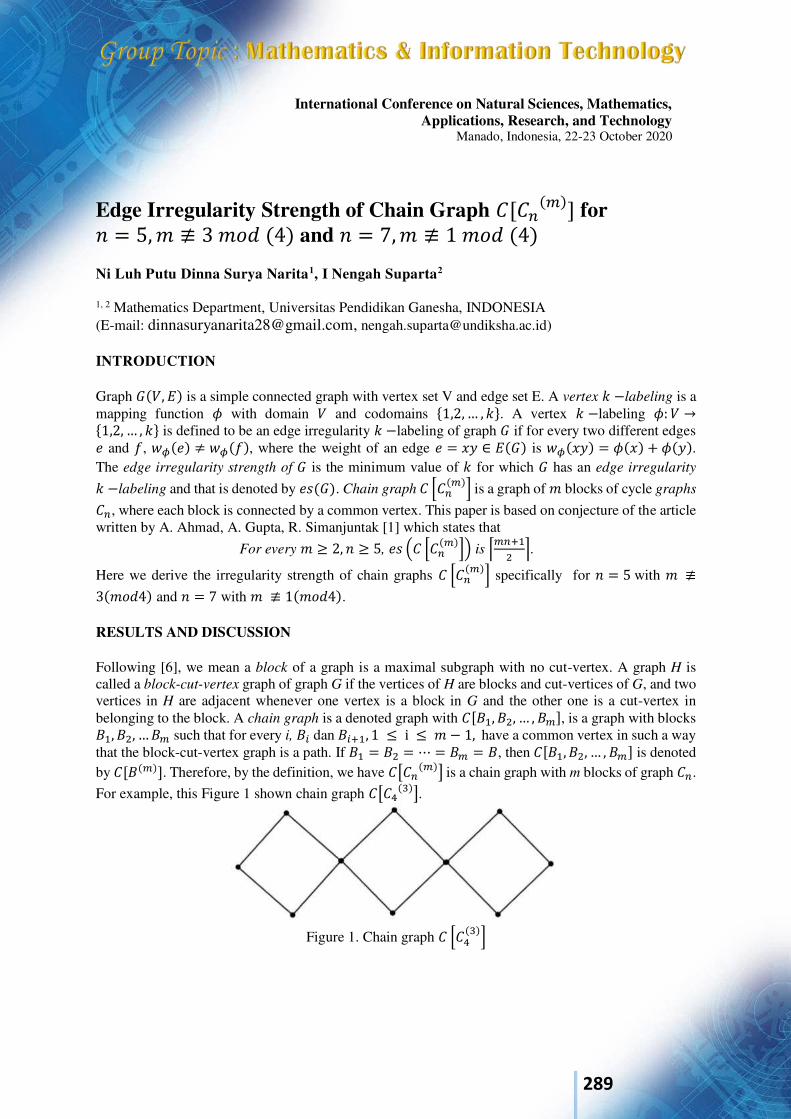
289
International Conference on Natural Sciences, Mathematics, Applications, Research, and Technology
Manado, Indonesia, 22-23 October 2020
Edge Irregularity Strength of Chain Graph 𝐶[𝐶𝑛(𝑚)] for 𝑛 = 5,𝑚 ≢ 3 𝑚𝑜𝑑 (4) and 𝑛 = 7,𝑚 ≢ 1 𝑚𝑜𝑑 (4) Ni Luh Putu Dinna Surya Narita1, I Nengah Suparta2
1, 2 Mathematics Department, Universitas Pendidikan Ganesha, INDONESIA (E-mail: [email protected], [email protected]) INTRODUCTION Graph 𝐺(𝑉, 𝐸) is a simple connected graph with vertex set V and edge set E. A vertex 𝑘 −labeling is a mapping function 𝜙 with domain 𝑉 and codomains {1,2,… , 𝑘}. A vertex 𝑘 −labeling 𝜙: 𝑉 →{1,2, … , 𝑘} is defined to be an edge irregularity 𝑘 −labeling of graph 𝐺 if for every two different edges 𝑒 and 𝑓, 𝑤𝜙(𝑒) ≠ 𝑤𝜙(𝑓), where the weight of an edge 𝑒 = 𝑥𝑦 ∈ 𝐸(𝐺) is 𝑤𝜙(𝑥𝑦) = 𝜙(𝑥) + 𝜙(𝑦). The edge irregularity strength of 𝐺 is the minimum value of 𝑘 for which 𝐺 has an edge irregularity 𝑘 −labeling and that is denoted by 𝑒𝑠(𝐺). Chain graph 𝐶 [𝐶𝑛(𝑚)] is a graph of 𝑚 blocks of cycle graphs 𝐶𝑛, where each block is connected by a common vertex. This paper is based on conjecture of the article written by A. Ahmad, A. Gupta, R. Simanjuntak [1] which states that
For every 𝑚 ≥ 2, 𝑛 ≥ 5, 𝑒𝑠 (𝐶 [𝐶𝑛(𝑚)]) is ⌈𝑚𝑛+12 ⌉. Here we derive the irregularity strength of chain graphs 𝐶 [𝐶𝑛(𝑚)] specifically for 𝑛 = 5 with 𝑚 ≢3(𝑚𝑜𝑑4) and 𝑛 = 7 with 𝑚 ≢ 1(𝑚𝑜𝑑4). RESULTS AND DISCUSSION Following [6], we mean a block of a graph is a maximal subgraph with no cut-vertex. A graph H is called a block-cut-vertex graph of graph G if the vertices of H are blocks and cut-vertices of G, and two vertices in H are adjacent whenever one vertex is a block in G and the other one is a cut-vertex in belonging to the block. A chain graph is a denoted graph with 𝐶[𝐵1, 𝐵2, … , 𝐵𝑚], is a graph with blocks 𝐵1, 𝐵2, …𝐵𝑚 such that for every i, 𝐵𝑖 dan 𝐵𝑖+1, 1 ≤ i ≤ 𝑚 − 1, have a common vertex in such a way that the block-cut-vertex graph is a path. If 𝐵1 = 𝐵2 = ⋯ = 𝐵𝑚 = 𝐵, then 𝐶[𝐵1, 𝐵2, … , 𝐵𝑚] is denoted by 𝐶[𝐵(𝑚)]. Therefore, by the definition, we have 𝐶[𝐶𝑛(𝑚)] is a chain graph with m blocks of graph 𝐶𝑛. For example, this Figure 1 shown chain graph 𝐶[𝐶4(3)].
Figure 1. Chain graph 𝐶 [𝐶4(3)]
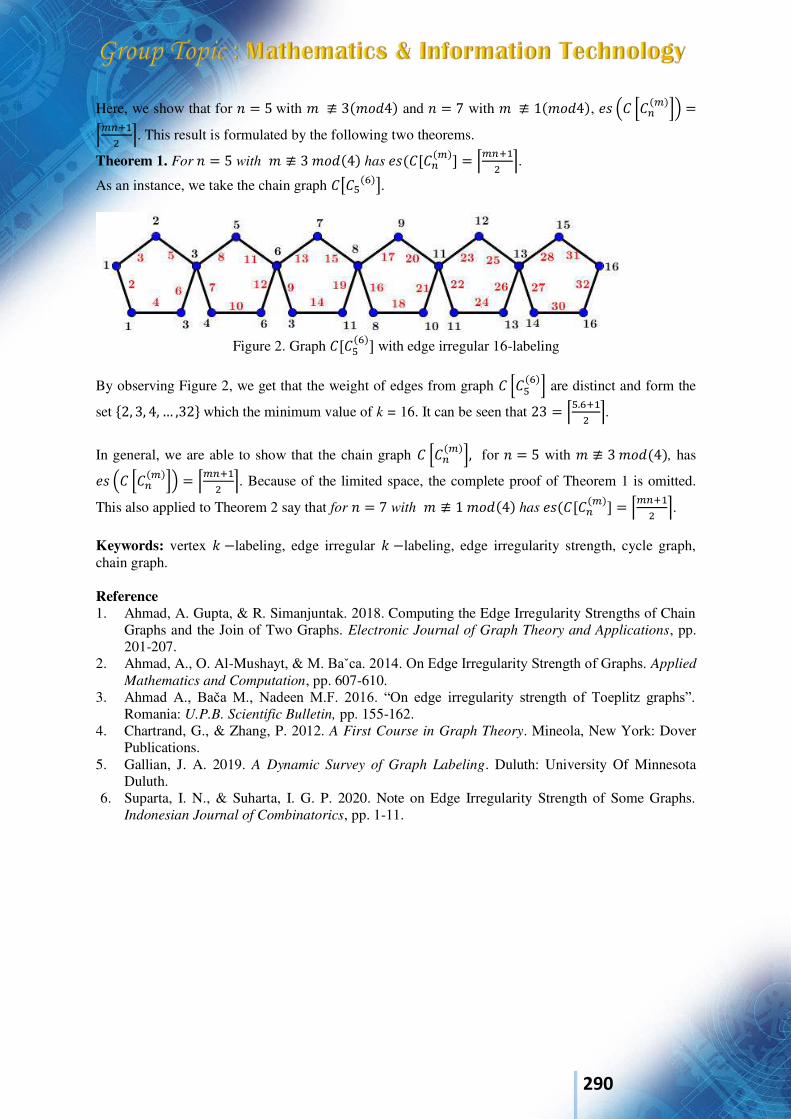
290
Here, we show that for 𝑛 = 5 with 𝑚 ≢ 3(𝑚𝑜𝑑4) and 𝑛 = 7 with 𝑚 ≢ 1(𝑚𝑜𝑑4), 𝑒𝑠 (𝐶 [𝐶𝑛(𝑚)]) =⌈𝑚𝑛+12 ⌉. This result is formulated by the following two theorems.
Theorem 1. For 𝑛 = 5 with 𝑚 ≢ 3 𝑚𝑜𝑑(4) has 𝑒𝑠(𝐶[𝐶𝑛(𝑚)] = ⌈𝑚𝑛+12 ⌉. As an instance, we take the chain graph 𝐶[𝐶5(6)].
Figure 2. Graph 𝐶[𝐶5(6)] with edge irregular 16-labeling
By observing Figure 2, we get that the weight of edges from graph 𝐶 [𝐶5(6)] are distinct and form the
set {2, 3, 4, … ,32} which the minimum value of k = 16. It can be seen that 23 = ⌈5.6+12 ⌉.
In general, we are able to show that the chain graph 𝐶 [𝐶𝑛(𝑚)], for 𝑛 = 5 with 𝑚 ≢ 3 𝑚𝑜𝑑(4), has 𝑒𝑠 (𝐶 [𝐶𝑛(𝑚)]) = ⌈𝑚𝑛+12 ⌉. Because of the limited space, the complete proof of Theorem 1 is omitted.
This also applied to Theorem 2 say that for 𝑛 = 7 with 𝑚 ≢ 1 𝑚𝑜𝑑(4) has 𝑒𝑠(𝐶[𝐶𝑛(𝑚)] = ⌈𝑚𝑛+12 ⌉. Keywords: vertex 𝑘 −labeling, edge irregular 𝑘 −labeling, edge irregularity strength, cycle graph, chain graph. Reference 1. Ahmad, A. Gupta, & R. Simanjuntak. 2018. Computing the Edge Irregularity Strengths of Chain
Graphs and the Join of Two Graphs. Electronic Journal of Graph Theory and Applications, pp. 201-207.
2. Ahmad, A., O. Al-Mushayt, & M. Baˇca. 2014. On Edge Irregularity Strength of Graphs. Applied
Mathematics and Computation, pp. 607-610. 3. Ahmad A., Bača M., Nadeen M.F. 2016. “On edge irregularity strength of Toeplitz graphs”.
Romania: U.P.B. Scientific Bulletin, pp. 155-162. 4. Chartrand, G., & Zhang, P. 2012. A First Course in Graph Theory. Mineola, New York: Dover
Publications. 5. Gallian, J. A. 2019. A Dynamic Survey of Graph Labeling. Duluth: University Of Minnesota
Duluth. 6. Suparta, I. N., & Suharta, I. G. P. 2020. Note on Edge Irregularity Strength of Some Graphs.
Indonesian Journal of Combinatorics, pp. 1-11.
291
International Conference on Natural Sciences, Mathematics, Applications, Research, and Technology
Manado, Indonesia, 22-23 October 2020
Analysis of The volatility of Fish Prices in Manado City Uses The Multivariate GARCH Model Nelson Nainggolan*1, Hanny A. H. Komalig2 and Tohap Manurung3
1, 2, 3 Departement of Mathematics, Faculty of Mathematics and Natural Sciences, Sam Ratulangi University, Indonesia. ([email protected], [email protected], [email protected]) INTRODUCTION Volatility is a measure that shows how much the price fluctuates over a period of time. Volatility is estimated by calculating the variance and standard deviation of price changes over a period of time which determines how fast the data changes with randomness [1]. ARCH (Autoregressive Conditional Heteroscedasticity) model is a model that takes into account the heteroscedasticity element in time series analysis. The assumption of constant varians is an ideal assumption rarely encountered in real situations, especially related to the financial field [4]. Therefore a model developed with the assumption of not constant variance is known as heteroskedasticity model [3]. The ARCH model was first introduced by Engle [2]. The ARCH model is used to model the residual variance depending on the residual squares in the previous period in autoregressive. Multivariate GARCH model is a development of the univariate GARCH model. The multivariate GARCH model can be viewed as a conditional heteroskedasticity model in a multivariate time series. This paper discusses the parameterization of covariance matrices such as Vech model representation, BEEK model and Constant Correlation model. For parameter estimation the maximum likelihood method is used. Furthermore, multivariate GARCH model application is applied for bivariate model. RESULTS AND DISCUSSION Time series data modeling is generally performed using the assumption of homoscedasticity or residual variance that is constant over time. However, the homoscedasticity assumption cannot answer the problem of volatility in economic and business time series data, because generally data on economics and business have residual variances that always change over time or heteroscedasticity. In conventional time series models such as the autoregressive moving average (ARMA) model it is assumed that the error variance (t) is constant, ie Var (t) = 2. Suppose the conditional variance of 𝜺𝒕 is not constant, then the variance of Yt conditional on Yt-1 is not constant, 𝑽𝒂𝒓 (𝜺𝟏) = 𝝈𝒕𝟐 = 𝒉𝒕. One strategy is to model conditional variance as AR(q) process through the preceding error square, ie: 𝒉𝒕 = 𝜶𝟎 + 𝜶𝟏𝜺𝒕−𝟏𝟐 +⋯+ 𝜶𝒕−𝒒𝜺𝒕−𝒒𝟐 (1) For this reason, (1) is called an autoregressive conditional heteroscedastic (ARCH) model [3]. Furthermore, if the ARCH(q) process is included lag of σt
2 then obtained model GARCH (p,q) [2], namely ℎ𝑡 = 𝛼0 + 𝛽1ℎ1 +⋯+ 𝛽𝑝ℎ𝑡−𝑝 + 𝛼1𝜀𝑡−12 +⋯+ 𝛼𝑞𝜀𝑡−𝑞2
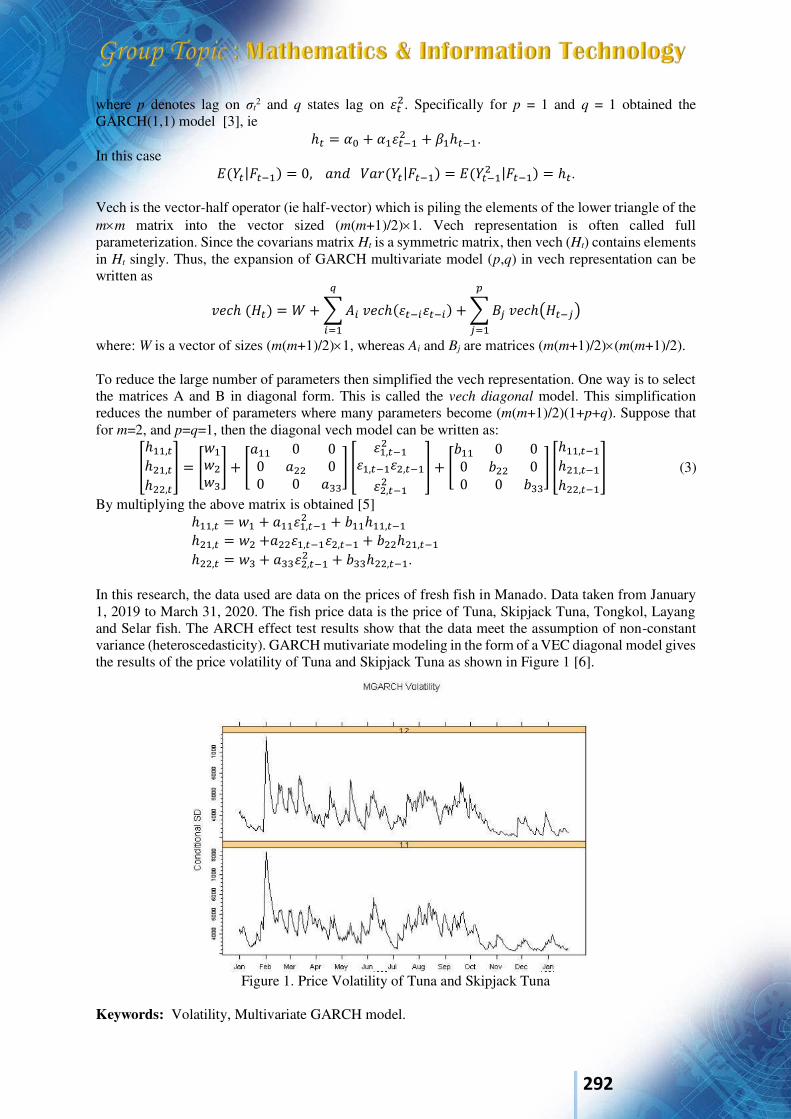
292
where p denotes lag on σt2 and q states lag on 𝜀𝑡2. Specifically for p = 1 and q = 1 obtained the
GARCH(1,1) model [3], ie ℎ𝑡 = 𝛼0 + 𝛼1𝜀𝑡−12 + 𝛽1ℎ𝑡−1. In this case 𝐸(𝑌𝑡|𝐹𝑡−1) = 0, 𝑎𝑛𝑑 𝑉𝑎𝑟(𝑌𝑡|𝐹𝑡−1) = 𝐸(𝑌𝑡−12 |𝐹𝑡−1) = ℎ𝑡.
Vech is the vector-half operator (ie half-vector) which is piling the elements of the lower triangle of the mm matrix into the vector sized (m(m+1)/2)1. Vech representation is often called full parameterization. Since the covarians matrix Ht is a symmetric matrix, then vech (Ht) contains elements in Ht singly. Thus, the expansion of GARCH multivariate model (p,q) in vech representation can be written as 𝑣𝑒𝑐ℎ (𝐻𝑡) = 𝑊 +∑𝐴𝑖 𝑣𝑒𝑐ℎ(𝜀𝑡−𝑖𝜀𝑡−𝑖) +∑𝐵𝑗 𝑣𝑒𝑐ℎ(𝐻𝑡−𝑗)𝑝
𝑗=1𝑞𝑖=1
where: W is a vector of sizes (m(m+1)/2)1, whereas Ai and Bj are matrices (m(m+1)/2)(m(m+1)/2).
To reduce the large number of parameters then simplified the vech representation. One way is to select the matrices A and B in diagonal form. This is called the vech diagonal model. This simplification reduces the number of parameters where many parameters become (m(m+1)/2)(1+p+q). Suppose that for m=2, and p=q=1, then the diagonal vech model can be written as: [ℎ11,𝑡ℎ21,𝑡ℎ22,𝑡] = [𝑤1𝑤2𝑤3] + [𝑎11 0 00 𝑎22 00 0 𝑎33] [ 𝜀1,𝑡−12𝜀1,𝑡−1𝜀2,𝑡−1𝜀2,𝑡−12 ] + [𝑏11 0 00 𝑏22 00 0 𝑏33] [ℎ11,𝑡−1ℎ21,𝑡−1ℎ22,𝑡−1] (3)
By multiplying the above matrix is obtained [5] ℎ11,𝑡 = 𝑤1 + 𝑎11𝜀1,𝑡−12 + 𝑏11ℎ11,𝑡−1 ℎ21,𝑡 = 𝑤2 +𝑎22𝜀1,𝑡−1𝜀2,𝑡−1 + 𝑏22ℎ21,𝑡−1 ℎ22,𝑡 = 𝑤3 + 𝑎33𝜀2,𝑡−12 + 𝑏33ℎ22,𝑡−1.
In this research, the data used are data on the prices of fresh fish in Manado. Data taken from January 1, 2019 to March 31, 2020. The fish price data is the price of Tuna, Skipjack Tuna, Tongkol, Layang and Selar fish. The ARCH effect test results show that the data meet the assumption of non-constant variance (heteroscedasticity). GARCH mutivariate modeling in the form of a VEC diagonal model gives the results of the price volatility of Tuna and Skipjack Tuna as shown in Figure 1 [6].
Figure 1. Price Volatility of Tuna and Skipjack Tuna
Keywords: Volatility, Multivariate GARCH model.

293
Acknowledgment The authors would like to thank the Ministry of Research Technology and Higher Education of Indonesia for funding this research through PNBP Sam Ratulangi University 2020. References
1. E. Junaidi, Analisis Volatilitas Harga Minyak Sawit dan Harga Minyak Goreng. Thesis. (Institut Pertanian Bogor, 2013)
2. R. F. Engle, Autoregressive Conditional Heteroscedasticity with Estimates of the Variance of United Kingdom Inflation. Econometrica 50, (1982), 987–1008.
3. T. Bollerslev, Generalized Autoregressive Conditional Heteroscedasticity. Journal of
Econometrics, 31, (1986), 307-327. 4. N. Nainggolan, B. N. Ruchjana, S. Darwis, R. E. Siregar, GSTAR Models With ARCH Errors
and The Simulations. Proceeding of The Third International Conference on Mathematics and
Natural Sciences (ICMNS) 2010. (Bandung, 23-25 November 2010), 1075-1084. 5. N. Nainggolan, H. Komalig, T. Manurung, Multivariate GARCH Model and Its Application to
Bivariate Model. IJRTE 8, No. 2S7, (2019), 111-114. 6. E. Zivot, and J. Wang, (2002). Modelling Financial Time Series with S-PLUS. (Springer
Science+Business Media, LLC, USA, 2002)
294
International Conference on Natural Sciences, Mathematics, Applications, Research, and Technology
Manado, Indonesia, 22-23 October 2020
Some Properties of The Coprime Graph of Square Matrices over Integer Modulo. Qurratul Aini1, I Gede Adhitya Wisnu Wardhana2, Ni Wayan Switrayni3, Irwansyah4,
Salwa5
1, 2, 3, 4, 5 Department of Mathematics, Universitas Mataram, Indonesia. (E-mail: [email protected], [email protected], [email protected], [email protected], [email protected]) INTRODUCTION Ma et al. introduced The coprime graph of a group in 2014 [1]. The coprime graph’s vertices consist of every element of a group, and two.eleemnt are said to be adjacent if its order is relative prime. In 2020 some studied conduct on more specific groups; first, Juliana et al. studied on the coprime graph of integer modulo group [2]; second Gazir S et al. studied on the coprime graph of a dihedral group [3]. This paper will give some properties of the coprime graph of square matrices over integer modulo. RESULTS AND DISCUSSION One attractive property of the coprime graph of square matrices over integer modulo ℤ𝑛 is the graph is always a star graph whenever 𝑛 is prime. Theorem 1. For 𝑛 is a prime number, the coprime graph of square matrices 𝑀𝑘(ℤ𝑛) is a star graph 𝐾(1,𝑛𝑘2−1). Keywords: Integer Modulo, Matrices, The Coprime Graph Acknowledgment This research is supported by PNBP Universitas Mataram 2020. References
1. X. L. Ma, H. Q. Wei, and L. Y. Yang, The coprime graph of a group, International Journal of Group Theory, vol. 3, no. 3, pp. 13–23. (2014).
2. R. Juliana, I. G. A. W. Wardhana, Irwansyah, Coprime graph of integers modulo n group and
its subgroups, Journal of Fundamental Mathematics and Applications, vol. 3, no. 1, pp. 34-38. (2020). 3. A. Gazir S, I. G. A. W. Wardhana, N. W. Switrayni, & Q. Aini, Some Properties of
Coprime Graph of Dihedral Group When is Prime Power, Journal of Fundamental Mathematics and Applications, vol. 3, no. 1, pp. 34-38. (2020).
295
International Conference on Natural Sciences, Mathematics, Applications, Research, and Technology
Manado, Indonesia, 22-23 October 2020
The Effectiveness of ARIMA and Multiscale Autoregressive (MAR) Models with MODWT Decomposition on Non-Stationary Data Puce Angreni1*, Rahma Fitriani2* and Suci Astutik3*
1,2,3Faculty of Mathematics and Natural Sciences, Brawijaya University, INDONESIA. (E-mail: [email protected]) INTRODUCTION An exchange rate or exchange rate is a comparison between the price of a country's currency and another country's currency. Thus, rupiah exchange rate is a comparison between the currency value of a country and another country. The exchange rate reflects the balance of demand and supply against domestic currencies as well as foreign $ US. The slump in the rupiah reflects the decline in public demand for rupiah due to the declining role of the national economy or due to the increasing demand for foreign $US as an international means of payment. The strengthening of the rupiah to some extent means that the performance in the money market is increasingly showing improvement. As a result of the rising rate of inflation, the domestic exchange rate is weakening against foreign currencies. This results in a decrease in a company's performance and reduced investment in the capital market. The exchange rate of rupiah against foreign currencies also has a negative influence on the economy and capital markets. By decreasing the rupiah exchange rate against foreign currencies will result in increased import costs of raw materials to be used for production and also increase interest rates. Although declining exchange rates can also encourage companies to export. Time series data is a set of data obtained from the observation of a phenomenon that occurs based on a time index with a fixed or equal time interval1. This research examines the forecasting of the best and most suitable time series models used in rupiah exchange rate predictions against the US Dollar2. RESULTS AND DISCUSSION The classic Box-Jenkins method or better known as the ARIMA (Autoregressive Integrated Moving Average) model is still often used for non-stationary time series analysis. Whereas research on non-stationary time series analysis has been done a lot, one of them is wavelet transformation, namely by forming a Multiscale Autoregressive (MAR) model3. The predictors used in MAR modeling are wavelet and scale coefficients that are the result of decomposition using the Maximal Overlap Discrete Wavelet Transform (MODWT) method4. MODWT works to decipher data based on the level of each wavelet filter (family). The wavelet filter used in this study is Haar. In this study the data will be processed through two ways, namely detrending (trend separation) and differencing which are further decomposed with MODWT method so that mar modeling can be done. This study examined the role of wavelet models in which mar models are contained, to predict data on
1 Cryer, J. D., dan Chan, K. S. 2008. Time Series Analysis with Application in R. Second Edition. Spinger Science dan Business Media., USA 2 Gujarati. Damodar. 2003. Ekonometri Dasar. Terjemahan: Sumarno Zain. Jakarta:Erlangga. 3 Renaud, O., Starck, J. L dan Murtagh, F. 2003. Prediction Based on a Multiscale Decomposition. International
Journal of Wavelets, Multiresolution and Information Processing. 1(2), 217-232 4 Percival, D. B. dan Walden, A. T. (2000). Wavelet Methods for Time Series Analysis. Cambridge University Press, Cambridge

296
time series that are not stationary. The selected MAR model is a model that meets the assumptions of normality and white-noise. By forming a wavelet forecasting model, the forecasting of the next few periods can be applied to rupiah exchange rate data. This research aims to apply arima and MAR models with MODWT decomposition to the data of the daily time series of rupiah exchange rate against the US Dollar which is herein called Exchange Rate in 2014-2019, then analyze what model is best used for forecasting Exchange Rate data in the next period. It is expected that this method can be one of the alternatives in predicting rupiah exchange rate against US Dollar in the coming period. The research will analyze the data Exchange rate model which is best used is the mar model which is best is the MAR model in accordance with the proposal Renaund et al with rmse value. Keywords: Nonstasioner, ARIMA, MAR, MODWT References 1. Cryer, J. D., dan Chan, K. S. 2008. Time Series Analysis with Application in R. Second Edition.
Spinger Science dan Business Media., USA 2. Gujarati. Damodar. 2003. Ekonometri Dasar. Terjemahan: Sumarno Zain. Jakarta:Erlangga 3. Renaud, O., Starck, J. L dan Murtagh, F. 2003. Prediction Based on a Multiscale Decomposition.
International Journal of Wavelets, Multiresolution and Information Processing. 1(2), 217-232 4. Percival, D. B. dan Walden, A. T. (2000). Wavelet Methods for Time Series Analysis. Cambridge
University Press, Cambridge
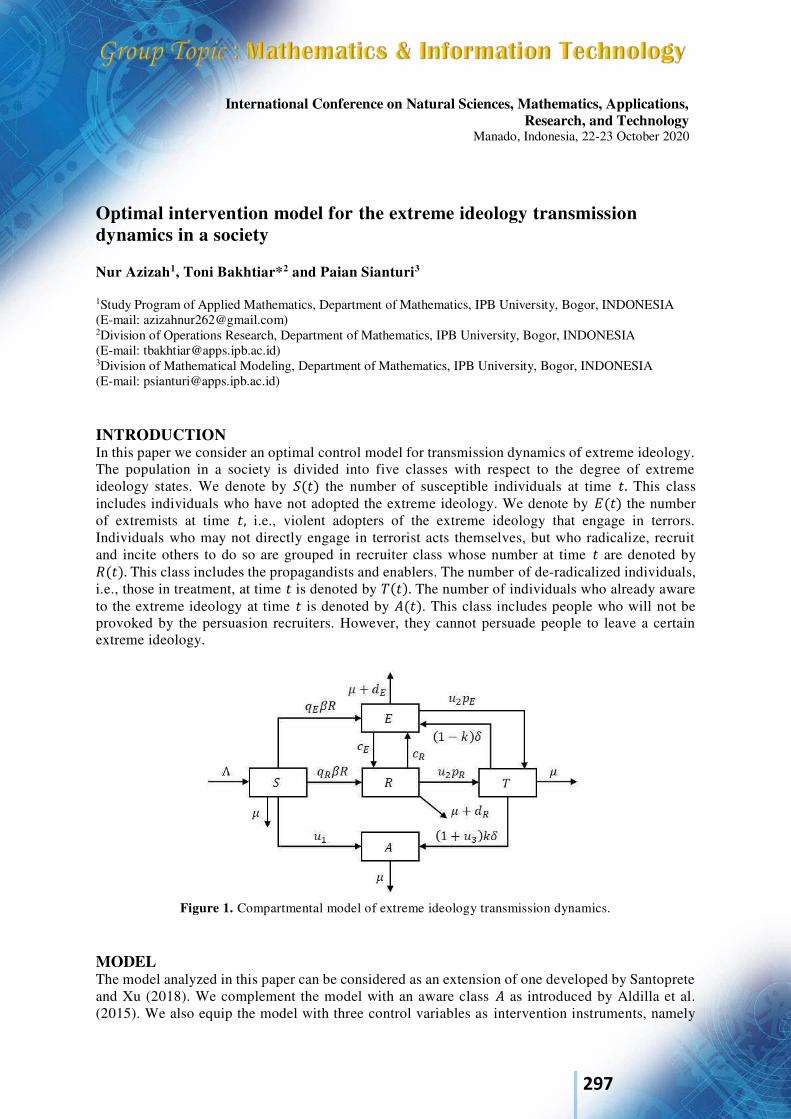
297
International Conference on Natural Sciences, Mathematics, Applications, Research, and Technology
Manado, Indonesia, 22-23 October 2020
Optimal intervention model for the extreme ideology transmission dynamics in a society Nur Azizah1, Toni Bakhtiar*2 and Paian Sianturi3
1Study Program of Applied Mathematics, Department of Mathematics, IPB University, Bogor, INDONESIA (E-mail: [email protected]) 2Division of Operations Research, Department of Mathematics, IPB University, Bogor, INDONESIA (E-mail: [email protected]) 3Division of Mathematical Modeling, Department of Mathematics, IPB University, Bogor, INDONESIA (E-mail: [email protected]) INTRODUCTION In this paper we consider an optimal control model for transmission dynamics of extreme ideology. The population in a society is divided into five classes with respect to the degree of extreme ideology states. We denote by 𝑆(𝑡) the number of susceptible individuals at time 𝑡. This class includes individuals who have not adopted the extreme ideology. We denote by 𝐸(𝑡) the number of extremists at time 𝑡, i.e., violent adopters of the extreme ideology that engage in terrors. Individuals who may not directly engage in terrorist acts themselves, but who radicalize, recruit and incite others to do so are grouped in recruiter class whose number at time 𝑡 are denoted by 𝑅(𝑡). This class includes the propagandists and enablers. The number of de-radicalized individuals, i.e., those in treatment, at time 𝑡 is denoted by 𝑇(𝑡). The number of individuals who already aware to the extreme ideology at time 𝑡 is denoted by 𝐴(𝑡). This class includes people who will not be provoked by the persuasion recruiters. However, they cannot persuade people to leave a certain extreme ideology.
Figure 1. Compartmental model of extreme ideology transmission dynamics.
MODEL The model analyzed in this paper can be considered as an extension of one developed by Santoprete and Xu (2018). We complement the model with an aware class 𝐴 as introduced by Aldilla et al. (2015). We also equip the model with three control variables as intervention instruments, namely

298
prevention (𝑢1), disengagement (𝑢2), and deradicalization (𝑢3). We mean by prevention all preventive efforts aimed at susceptible individuals for avoiding an extreme ideology, such as by means of antiterrorism campaign. Disengagement programs attempt to stop or control radicalization as it is occurring. These actions are aimed at extremists and recruiters. Deradicalization control actions include the deradicalization programs aimed at convicted extremists, recruiters or terrorists to undergo the programs. Deradicalization programs attempt to alter an individual extremist beliefs and violent behavior with the aim to reintegrate him into society. The compartmental control model of the extreme ideology transmission dynamics is depicted in Figure 1. The compartmental model in Figure 1 can equivalently then be represented by the following nonlinear ordinary differential equation system: 𝑑𝑆𝑑𝑡 = Λ − 𝛽𝑅𝑆 − (𝜇 + 𝑢1)𝑆 𝑑𝐸𝑑𝑡 = 𝑞𝐸𝛽𝑅𝑆 − (𝜇 + 𝑑𝐸 + 𝑐𝐸 + 𝑢2𝑝𝐸)𝐸 + 𝑐𝑅𝑅 + (1 − 𝑘)𝛿𝑇 𝑑𝑅𝑑𝑡 = 𝑞𝑅𝛽𝑅𝑆 + 𝑐𝐸𝐸 − (𝜇 + 𝑑𝑅 + 𝑐𝑅 + 𝑢2𝑝𝑅)𝑅 𝑑𝑇𝑑𝑡 = 𝑢2(𝑝𝐸𝐸 + 𝑝𝑅𝑅) − (1 + 𝑢3𝑘)𝛿𝑇 − 𝜇𝑇 𝑑𝐴𝑑𝑡 = (1 + 𝑢3)𝑘𝛿𝑇 − 𝜇𝐴 + 𝑢1𝑆. The primary objective of this study is to characterize the optimal intervention strategies with respect to a certain performance index. In particular we aim to determine the optimal control variables 𝑢1, 𝑢2, and 𝑢3 such that minimize the following objective functional: 𝐽 = ∫ (𝐴1𝐸(𝑡) + 𝐴2𝑅(𝑡) + 12𝐵1𝑢12(𝑡) + 12𝐵2𝑢22(𝑡) + 12𝐵3𝑢32(𝑡)) 𝑑𝑡,𝑡𝑓0
where 𝐴𝑖 and 𝐵𝑗 are balancing cost weights incurred by the size and the relative importance among compartments and controls. OPTIMALITY CONDITIONS The necessary optimality condition for the existence of optimal control 𝑢∗(𝑡) is provided by the Pontryagin maximum principle. Let 𝑢∗(𝑡) be a piecewise continuous control defined on [0, 𝑡𝑓] which solves the control problem and let 𝑥∗(𝑡) be the associated optimal path. Then there exists a continuous and piecewise continuously differentiable function 𝑝(𝑡) such that for all 𝑡 ∈ [0, 𝑡𝑓]: 1. Optimal control 𝑢∗(𝑡) maximizes 𝐻(𝑥∗(𝑡), 𝑢(𝑡), 𝑝(𝑡), 𝑡) for all admissible controls 𝑢(𝑡), that is 𝐻(𝑥∗(𝑡), 𝑢∗(𝑡), 𝑝(𝑡), 𝑡) ≥ 𝐻(𝑥∗(𝑡), 𝑢(𝑡), 𝑝(𝑡), 𝑡). This condition can be achieved by solving 𝐻𝑢 =0. 2. State variable 𝑥(𝑡) and adjoin variable 𝑝(𝑡) satisfy the differential equations system �̇� = 𝐻𝑝 and �̇� = −𝐻𝑥. We call the former dynamical system and the later adjoin system. 3. The following transversality condition is satisfied: (𝑆𝑥 − 𝑝)𝛿𝑥|𝑡𝑓 + (𝐻 + 𝑆𝑡)𝛿𝑡|𝑡𝑓 = 0. In the case
of 𝑥(𝑡𝑓) is free and 𝑆 ≡ 0, then the transversaility condition is reduced to 𝑝(𝑡𝑓) = 0. By implementing the first principle of Pontryagin and by considering bounded control policies 0 ≤𝑢𝑖 ≤ �̅�𝑖 we obtain the following optimal control variables: 𝑢1∗ = min {�̅�1, max {0, (𝑝1 − 𝑝5)𝑆𝐶1 }}, 𝑢2∗ = min {�̅�2, max {0, (𝑝2 − 𝑝4)𝑝𝐸𝐸 + (𝑝3 − 𝑝4)𝑝𝑅𝑅𝐶2 }}, 𝑢3∗ = min {�̅�3, max {0, (𝑝4 − 𝑝5)𝑘𝛿𝑇𝐶3 }}. In addition to the dynamical system, the following adjoin system should also be satisfied for optimality:

299
𝑑𝑝1𝑑𝑡 = 𝑝1(𝛽𝑅 + 𝜇 + 𝑢1) − (𝑝2𝑞𝐸 + 𝑝3𝑞𝑅)𝛽𝑅 − 𝑝5𝑢1, 𝑑𝑝2𝑑𝑡 = −𝐵1 + 𝑝2(𝜇 + 𝑑𝐸) + (𝑝2 − 𝑝3)𝑐𝐸 + (𝑝2 − 𝑝4)𝑢2𝑝𝐸 , 𝑑𝑝3𝑑𝑡 = −𝐵2 + (𝑝1 − 𝑝2𝑞𝐸 − 𝑝3𝑞𝑅)𝛽𝑆 + 𝑝3(𝜇 + 𝑑𝑅 + 𝑐𝑅) + (𝑝3 − 𝑝4)𝑢2𝑝𝑅 , 𝑑𝑝4𝑑𝑡 = −𝑝2(1 − 𝑘)𝛿 + 𝑝4𝜇 + (𝑝4 − 𝑝5)(1 + 𝑢3)𝑘𝛿, 𝑑𝑝5𝑑𝑡 = 𝑝5𝜇. Keywords: deradicalization, extreme ideology, optimal control, Pontryagin maximum principle. References 1. Aldila, D., Nuraini, N., & Soewono, E. (2015). Mathematical model for the spread of extreme
ideology. AIP Conference Proceeding, 1651, 33–39. DOI: 10.1063/1.4914429. 2. Goyal, A., Shukla, J. B., Misra, A. K., & Shukla, A. (2014). Modeling the role of government
efforts in controlling extremism in a society. Mathematical Methods in the Applied Sciences, 38(17), 4300–4316. DOI:10.1002/mma.3368.
3. Santonja, F. J., Tarazona, A. C., & Villanueva, R. J. (2008). A mathematical model of the pressure of an extreme ideology on a society. Computers & Mathematics with Applications, 56(3), 836–846. DOI: 10.1016/j.camwa.2008.01.001.
4. Santoprete, M., & Xu, F. (2018). Global stability in a mathematical model of de-radicalization. Physica A: Statistical Mechanics and Its Applications, 509, 151–161. DOI: 10.1016/j.physa. 2018.06.027

300
International Conference on Natural Sciences, Mathematics, Applications, Research, and Technology
Manado, Indonesia, 22-23 October 2020
Linear Operator On Squence Spaces (�̅�, 𝒒)𝟎, (�̅�, 𝒒) and (�̅�, 𝒒)∞ Salwa1, Supama2 1, Departemen of Mathematics, Universitas Mataram, Indonesia. (E-mail: [email protected],) 2Departemen of Mathematics , UGM, Indonesia (E-mail: [email protected]) INTRODUCTION By the completeness of norm spaces we mean that every Chaucy sequence converges. Some classical sequence spaces are 𝑙∞ = {𝑥 ∈ 𝜔: sup|𝑥𝑛| < ∞}, 𝑐0 = {𝑥 ∈ 𝜔: lim𝑛→∞𝑥𝑛 = 0}, 𝑐 = {𝑥 ∈ 𝜔: lim𝑛→∞ 𝑥𝑛 = 𝑙 𝑓𝑜𝑟 𝑠𝑜𝑚𝑒 𝑙 ∈ 𝑅} Of all bounded, null
sequences and convergen sequence spaces. RESULTS AND DISCUSSION Let (𝑞𝑘) be positif sequence, 𝑄 be the sequence with 𝑄𝑛 = ∑ 𝑞𝑘𝑛𝑘=1 (𝑛 ∈ ℕ) and the matrix 𝑁𝑞̅̅̅̅ be defined by (�̅�𝑞)𝑛,𝑘 = {𝑞𝑘𝑄𝑛 , (1 ≤ 𝑘 ≤ 𝑛)0, (𝑘 > 𝑛) (𝑛 ∈ ℕ) Then we define the set (�̅�, 𝑞)0 = (𝑐0)�̅�𝑞, (�̅�, 𝑞) = 𝑐�̅�𝑞 and (�̅�, 𝑞)∞ = (𝑙∞)�̅�𝑞 of sequence that are (�̅�, 𝑞) summable to naught, summable and bounded, respectively. For any 𝑥 ∈ 𝑋, we write 𝜏 = 𝜏(𝑥) for sequence defined by 𝜏𝑛 = (�̅�𝑞)𝑛(𝑥) = 1𝑄𝑛∑𝑞𝑘𝑥𝑘𝑛
𝑘=1 (𝑛 ∈ ℕ) And 𝜏 is called the sequence of the �̅�𝑞 or weighted means of 𝑥. Each of the set (�̅�, 𝑞)0, (�̅�, 𝑞) and (�̅�, 𝑞)∞ is BK spaces with ‖𝑥‖�̅�𝑞 = 𝑠𝑢𝑝𝑛 | 1𝑄𝑛∑𝑞𝑘𝑥𝑘𝑛
𝑘=1 | We defined the operator ∆+: 𝜔 → 𝜔 by ∆+𝑥 = ((∆+𝑥)𝑘)𝑘=1∞ = (𝑥𝑘 − 𝑥𝑘+1)𝑘=1∞ . Let 𝑞 = (𝑞𝑘)𝑘=1∞ be
positif sequence with 𝑄𝑛 = ∑ 𝑞𝑘𝑛𝑘=0 (𝑛 ∈ ℕ). We writen 1𝑞 = (1 𝑞𝑛⁄ )𝑛=1∞, and 𝑀1 = {𝑎 ∈𝜔: 𝑄(∆+𝑎) ∈ 𝑙1}, 𝒩0 = (1 𝑞⁄ )−1 ∗ (𝑀1 ∩ (𝑄−1 ∗ 𝑙∞)), 𝒩 = (1 𝑞⁄ )−1 ∗ (𝑀1 ∩ (𝑄−1 ∗ 𝑐)) and 𝒩∞ = (1 𝑞⁄ )−1 ∗ (𝑀1 ∩ (𝑄−1 ∗ 𝑐0)) then (�̅�, 𝑞)0𝛽 = 𝒩0 (�̅�, 𝑞)𝛽 = 𝒩 and (�̅�, 𝑞)∞𝛽 = 𝒩∞.
Keyword: Sequence Spaces, BK Spaces, Linear Operator Acknowledgment This research is supported by Kementerian Agama 2012

301
References 1. Malkowsky, E.G, Nis, RV., Measure Of noncompactness Of Linear Operator Between Spaces
Of Sequences that (�̅�, 𝑞) Summable or Bounded, Czechosvak Mathematical Journal, 51 (126) pp. 505-509 (2001)
2. Malkowsky, E.G, Nis, RV., Introductions Into The Theory Of noncompactness, Czechosvak Mathematical Journal, pp. 197-200 (2001)
3. Wilansky, A., Summability Through Functional Analysis, North Holland Mathematics Studies 85, New York. pp 60-65 (1984)

302
International Conference on Natural Sciences, Mathematics, Applications, Research, and Technology
Manado, Indonesia, 22-23 October 2020
System Application For Measuring the Freshness Level of Several Consumption Fish in North Sulawesi Based on Digital Images of Fish Eyes A J Rindengan*1, Yohanes A R Langi 2, Marline S. Paendong 3, C E J C Montolalu4, and R Tumilaar 5
1, 2,3,4,5 Mathematics Department, Sam Ratulangi University, INDONESIA. (E-mail: [email protected])
INTRODUCTION The decline in fish quality can be seen from changes in fish skin color, eyes, gills, and fish meat texture. These changes are caused by the activity of enzymes, chemicals, and bacteria in it so that the fish is not suitable for trade, also for human consumption. In this research, a system application for measuring the freshness of the fish will be built using the digital image processing method of the fish eye with the polynomial regression method. The aim of this research is to build a system application for measuring the freshness of several consumption fish in North Sulawesi based on digital fish eye images. The data used were 10 image samples of each fish, namely skipjack, tuna (yellowfin), tude and malalugis which are often consumed by the people of North Sulawesi. . RESULTS AND DISCUSSION The fish were photographed every 1 hour for 10 hours and 100 image data were obtained, namely 10 fish images at 1 hour, 10 fish images at 2 hours, and so on until the 10th hour. The stored fish image then processed by digital image analysis. The first process begins with image processing by cropping on the edge of the original image eye and then followed by resizing image pixels. After the image has been processed, then the calculation of the average value of the color of the fish eye image in the form of RGB (red, green, blue) and grayscale for each observation hour. This data is stored as training data in the application system. Once the image has been processed then the image is input into the system then the image data will be displayed RGB and grayscale histograms and then the calculation is done by the curve fitting method. A polynomial regression equation will be obtained which will be the basis for measuring the freshness level of the fish for new input data. The final process is to match the test image with the image stored as training data and obtain a conclusion on how long each fish has been stored / at room temperature since the fish was caught from the sea. The result of this research is that an easy-to-use computer-based system for determining the level of freshness of skipjack tuna, tuna, tude and malalugis based on fish eye images has been obtained.
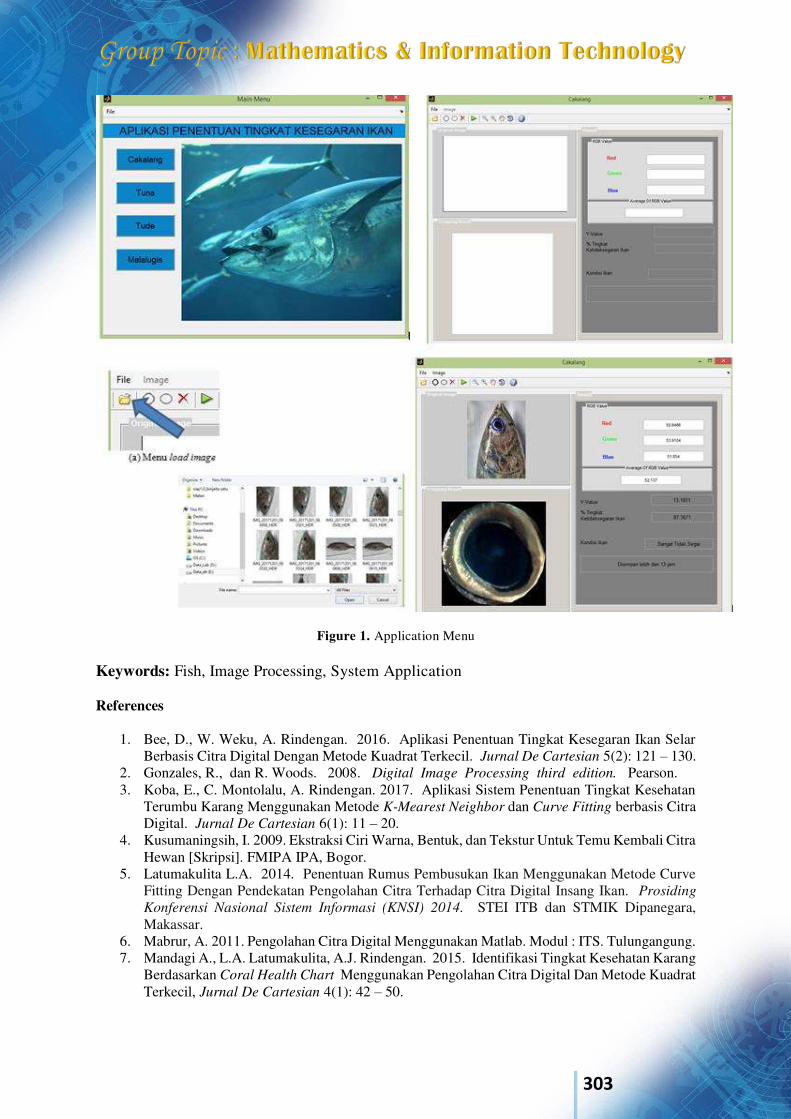
303
Figure 1. Application Menu
Keywords: Fish, Image Processing, System Application References
1. Bee, D., W. Weku, A. Rindengan. 2016. Aplikasi Penentuan Tingkat Kesegaran Ikan Selar Berbasis Citra Digital Dengan Metode Kuadrat Terkecil. Jurnal De Cartesian 5(2): 121 – 130.
2. Gonzales, R., dan R. Woods. 2008. Digital Image Processing third edition. Pearson. 3. Koba, E., C. Montolalu, A. Rindengan. 2017. Aplikasi Sistem Penentuan Tingkat Kesehatan
Terumbu Karang Menggunakan Metode K-Mearest Neighbor dan Curve Fitting berbasis Citra Digital. Jurnal De Cartesian 6(1): 11 – 20.
4. Kusumaningsih, I. 2009. Ekstraksi Ciri Warna, Bentuk, dan Tekstur Untuk Temu Kembali Citra Hewan [Skripsi]. FMIPA IPA, Bogor.
5. Latumakulita L.A. 2014. Penentuan Rumus Pembusukan Ikan Menggunakan Metode Curve Fitting Dengan Pendekatan Pengolahan Citra Terhadap Citra Digital Insang Ikan. Prosiding
Konferensi Nasional Sistem Informasi (KNSI) 2014. STEI ITB dan STMIK Dipanegara, Makassar.
6. Mabrur, A. 2011. Pengolahan Citra Digital Menggunakan Matlab. Modul : ITS. Tulungangung. 7. Mandagi A., L.A. Latumakulita, A.J. Rindengan. 2015. Identifikasi Tingkat Kesehatan Karang
Berdasarkan Coral Health Chart Menggunakan Pengolahan Citra Digital Dan Metode Kuadrat Terkecil, Jurnal De Cartesian 4(1): 42 – 50.

304
8. McAndrew, A. 2004. An introduction to Digital Image Processing with MATLAB. Victoria University of Technology. Australia.
9. Rindengan, A.J., M. Mananohas. 2017. Perancangan Sistem Penentuan Tingkat Kesegaran Ikan Cakalang Menggunakan Metode Curve Fitting Berbasis Citra Digital Mata Ikan. Jurnal
Ilmiah Sain 17(2):161 – 167.
305
International Conference on Natural Sciences, Mathematics, Applications, Research, and Technology
Manado, Indonesia, 22-23 October 2020
The Best Allometric Rergresian Equations Models to Estimate Biomass and Carbon Stocks of Cempaka Tree at Agroforestry Stand of Minahasa Distric Yohanes A R Langi *1, A J Rindengan2, C E Mongi3, W Appi4, M L Mananohas5, C E J C Montolalu6, F D Pongoh7, R Tumilaar 8 and Martina Langi 9 1, 2,3,4,5,6,7,8 Mathematics Department, Sam Ratulangi University, INDONESIA. (E-mail: [email protected]) 9Department of Forestry, Sam Ratulangi University, INDONESIA. INTRODUCTION Good tree management in social forestry such as agroforestry, private forestry can mitigate greenhouse gas (GHG) emission under the Kyoto Protocol. Agroforestry system is a better option in climate change mitigation than terrestrial option because of the secondary benefits such as helping to attain food security, increasing farm income, maintaining above-ground and below-ground, biodiversity, soil conservation [1]; reduce emission [2], and expand forest. Cempaka tree (Elmerillia Sp) is one of the endemic trees in Minahasa. This study aims to determine the best carbon estimator model based on bound carbon in the cempaka tree, produce a knowledge base with an estimator model, as well as sustainable harvesting, produce a new model for measuring tree volume and carbon stock of cempaka trees in community forest stands in Minahasa District. A total of 35 trees were selected as samples. As a basis for designing a model of cempaka biomass and carbon estimation. The sample selection was carried out by stratified random sampling at community forest stands in Minahasa District. RESULTS AND DISCUSSION Cempaka tree biomass is grouped according to its parts, namely stem biomass, branch biomass, twig biomass, leaf biomass, fruit biomass and total biomass. This research will only compile allometric equations for estimating stem biomass and total biomass of cempaka trees. The following will describe the allometric equations for estimating stem biomass and total biomass of cempaka trees. The compilation of the allometric equations is based on data from 35 sample trees with the existing variables. The best stem biomass estimator allometric equation is determined through trials on several linear and non-linear regression equations with one or more independent variables. The best allometric equation for stem biomass estimator: LogB_Btg = 1.623 + 0.7579 Log Dbh - 0.102 Log H. The best allometric equation for total biomass estimator: LogB_Tot = 1.279 + 1.234 Log Dbh – 0.113. Keywords: Allometric Regression, Biomass, Cempaka Tree, Estimator Model. References
1. P. K. R. Nair, Agroforestry System in Tropics. Netherlands: Kluwer Academic Publishers, 1989.

306
2. D. N. Pandey, “Carbon sequestration in agroforestry systems”, Climate policy, vol. 2, no. 4, pp. 367-377, 2002.
3. P. K. R. Nair and D. V. Nair, “Carbon Sequestration in Agroforestry System”, 2002. http://www.Idd.go.th./Wcss2002/papers/0989.pdf. [ Acces 17 Maret 2005].
4. S. Brown, Guidelines for Inventory and Monitoring Carbon Offsets in Forest-Based Projects. Airlington: Winrock International, 1999.
5. Ministry of Environment Republic of Indonesia, National Strategy Study on DCM in Forestry Sector, Final Report, 2003.
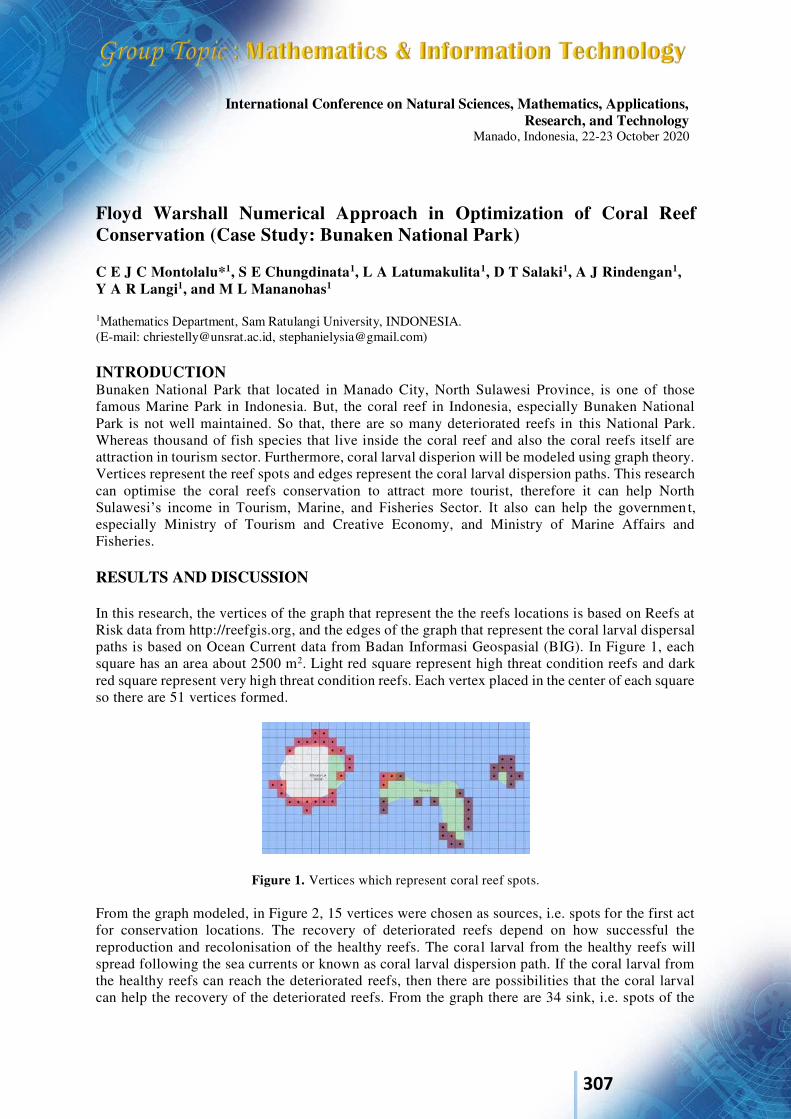
307
International Conference on Natural Sciences, Mathematics, Applications, Research, and Technology
Manado, Indonesia, 22-23 October 2020
Floyd Warshall Numerical Approach in Optimization of Coral Reef Conservation (Case Study: Bunaken National Park) C E J C Montolalu*1, S E Chungdinata1, L A Latumakulita1, D T Salaki1, A J Rindengan1, Y A R Langi1, and M L Mananohas1
1Mathematics Department, Sam Ratulangi University, INDONESIA. (E-mail: [email protected], [email protected]) INTRODUCTION Bunaken National Park that located in Manado City, North Sulawesi Province, is one of those famous Marine Park in Indonesia. But, the coral reef in Indonesia, especially Bunaken National Park is not well maintained. So that, there are so many deteriorated reefs in this National Park. Whereas thousand of fish species that live inside the coral reef and also the coral reefs itself are attraction in tourism sector. Furthermore, coral larval disperion will be modeled using graph theory. Vertices represent the reef spots and edges represent the coral larval dispersion paths. This research can optimise the coral reefs conservation to attract more tourist, therefore it can help North Sulawesi’s income in Tourism, Marine, and Fisheries Sector. It also can help the governmen t, especially Ministry of Tourism and Creative Economy, and Ministry of Marine Affairs and Fisheries. RESULTS AND DISCUSSION In this research, the vertices of the graph that represent the the reefs locations is based on Reefs at Risk data from http://reefgis.org, and the edges of the graph that represent the coral larval dispersal paths is based on Ocean Current data from Badan Informasi Geospasial (BIG). In Figure 1, each square has an area about 2500 m2. Light red square represent high threat condition reefs and dark red square represent very high threat condition reefs. Each vertex placed in the center of each square so there are 51 vertices formed.
Figure 1. Vertices which represent coral reef spots. From the graph modeled, in Figure 2, 15 vertices were chosen as sources, i.e. spots for the first act for conservation locations. The recovery of deteriorated reefs depend on how successful the reproduction and recolonisation of the healthy reefs. The coral larval from the healthy reefs will spread following the sea currents or known as coral larval dispersion path. If the coral larval from the healthy reefs can reach the deteriorated reefs, then there are possibilities that the coral larval can help the recovery of the deteriorated reefs. From the graph there are 34 sink, i.e. spots of the
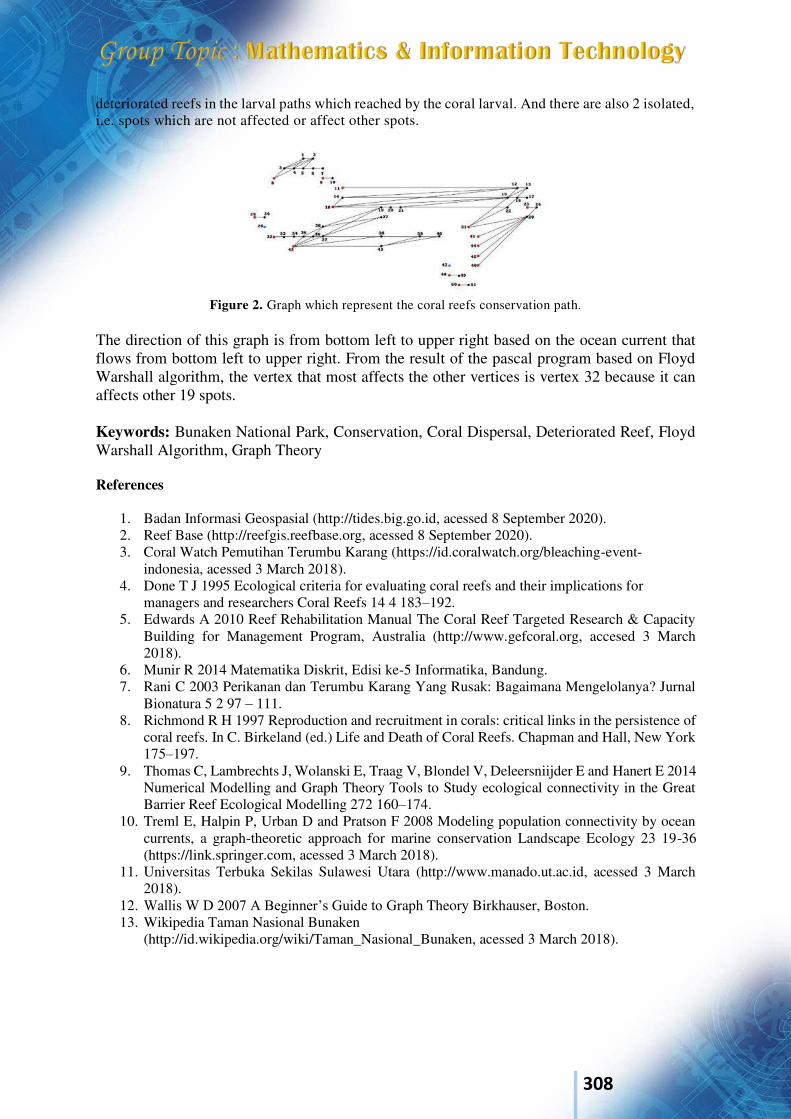
308
deteriorated reefs in the larval paths which reached by the coral larval. And there are also 2 isolated, i.e. spots which are not affected or affect other spots.
Figure 2. Graph which represent the coral reefs conservation path.
The direction of this graph is from bottom left to upper right based on the ocean current that flows from bottom left to upper right. From the result of the pascal program based on Floyd Warshall algorithm, the vertex that most affects the other vertices is vertex 32 because it can affects other 19 spots. Keywords: Bunaken National Park, Conservation, Coral Dispersal, Deteriorated Reef, Floyd Warshall Algorithm, Graph Theory References
1. Badan Informasi Geospasial (http://tides.big.go.id, acessed 8 September 2020). 2. Reef Base (http://reefgis.reefbase.org, acessed 8 September 2020). 3. Coral Watch Pemutihan Terumbu Karang (https://id.coralwatch.org/bleaching-event-
indonesia, acessed 3 March 2018). 4. Done T J 1995 Ecological criteria for evaluating coral reefs and their implications for
managers and researchers Coral Reefs 14 4 183–192. 5. Edwards A 2010 Reef Rehabilitation Manual The Coral Reef Targeted Research & Capacity
Building for Management Program, Australia (http://www.gefcoral.org, accesed 3 March 2018).
6. Munir R 2014 Matematika Diskrit, Edisi ke-5 Informatika, Bandung. 7. Rani C 2003 Perikanan dan Terumbu Karang Yang Rusak: Bagaimana Mengelolanya? Jurnal
Bionatura 5 2 97 – 111. 8. Richmond R H 1997 Reproduction and recruitment in corals: critical links in the persistence of
coral reefs. In C. Birkeland (ed.) Life and Death of Coral Reefs. Chapman and Hall, New York 175–197.
9. Thomas C, Lambrechts J, Wolanski E, Traag V, Blondel V, Deleersniijder E and Hanert E 2014 Numerical Modelling and Graph Theory Tools to Study ecological connectivity in the Great Barrier Reef Ecological Modelling 272 160–174.
10. Treml E, Halpin P, Urban D and Pratson F 2008 Modeling population connectivity by ocean currents, a graph-theoretic approach for marine conservation Landscape Ecology 23 19-36 (https://link.springer.com, acessed 3 March 2018).
11. Universitas Terbuka Sekilas Sulawesi Utara (http://www.manado.ut.ac.id, acessed 3 March 2018).
12. Wallis W D 2007 A Beginner’s Guide to Graph Theory Birkhauser, Boston. 13. Wikipedia Taman Nasional Bunaken
(http://id.wikipedia.org/wiki/Taman_Nasional_Bunaken, acessed 3 March 2018).
309
International Conference on Natural Sciences, Mathematics, Applications, Research, and Technology
Manado, Indonesia, 22-23 October 2020
Book Embeddings of 3-Crossing-critical Infinite Family of Graphs with Certain Maximum Degrees Benny Pinontoan*1 and Jullia Titaley2
1, 2Mathematics Department, Sam Ratulangi University, INDONESIA. (E-mail: [email protected], [email protected]) INTRODUCTION The degree deg(v) of a vertex v of graph G is the number of edges incident with v. A graph G has maximum degree d if the maximum degree over all vertices of G is d. The crossing number
of graph G is the minimum pairwise edge-crossings of G when drawn on the plane [3]. A graph G with crossing number k is k-crossing critical if deleting any edge decreasing its crossing number.
A book consists of a spine and pages. An embedding of graph G into a book is drawing a G such that its vertices are put on the spine and the edges on pages without crossing. The least number of pages needed among all possible embeddings of G into a book is called the pagenumber of G. The pagenumber problem is an NP-complete problems [1]. It was introduced by Kainen [2].
In this paper, we consider some infinite families of 3-crossing-critical graphs with certain maximum degrees. We embed these graphs into a book and determine their pagenumbers. RESULTS AND DISCUSSION We embed some infinite families of 3-crossing-critical graphs with certain maximum degrees into books and show that their pagenumbers are 3. Keywords: book embedding, pagenumber, crossing-critical graph References
1. F.R.T. Chung, F.T. Leighton, and A.L. Rosenberg, Embedding graphs in books: a layout problem with applications to VLSI design, SIAM Journal on Algebraic and
Discrete Methods 8 (1) pp 33-58 (1987). 2. P.C. Kainen, An introduction to topological graph theory, in Graphs and
Combinatorics, R. Bari and F. Harary, Eds., Springer, New York, pp. 76-108 (1974). 3. B. Pinontoan and R.B. Richter, Crossing numbers of sequences of graphs II: planar tiles. J.
Graph Theory 42. Pp 332-341 (2003).
310
International Conference on Natural Sciences, Mathematics, Applications, Research, and Technology
Manado, Indonesia, 22-23 October 2020
Study of SEM, XRD, TGA, and DSC of Cassava Bioplastics Catalyzed by Ethanol Hanny F. Sangian1*, Engellita Maneking1, Seni H. J. Tongkukut1, Handy I. R. Mosey1, Verna Suoth1, Hesky Kolibu1, Adey Tanauma1, Guntur Pasau1, As’ari As’ari1, Vecky A. J. Masinambow2, Bayu Achil Sadjab3
1Department of Physics, Sam Ratulangi University, 95115 Manado, Indonesia 2Department of Economic Development, Sam Ratulangi University, 95115 Manado, Indonesia 3Department of Physics, Halmahera University, 97762 Tobelo, Indonesia Corresponding author: [email protected]
Abstract. This study aims at preparing and characterizing of bioplastics that utilized cassava biomass which was available abundantly in Indonesia. The bioplastic synthesis was conducted with two variations of the reactant, namely cassava + starch + glycerol + water + acetic acid (vinegar) and cassava + starch + glycerol + water + acetic acid + ethanol. Bioplastic obtained was characterized by employing scanning electron microscopic (SEM), X-Ray diffraction (XRD), Fourier transform infra-red (FTIR), thermogravimetric analysis (TGA), and differential scanning calorimetric (DSC). The results show that bioplastics with the second combination have a high degree of degradation, whereby they were consistent with XRD analysis, appearing a low crystallinity value. The functional groups have shown IR spectra presented the existence of C-H alkanes, C = O esters, and C-H alkene groups. While the surface morphology displayed a flat surface, which was relatively comparable to both samples and the reduction of sample mass during heating was at 2.32 mg. Keywords: Bioplastics, cassava starch, ethanol, glycerol
1. Introduction Plastic is one type of material formed by the polymerization process, which is the process of combining several simple molecules (monomers) through a chemical process into more complex molecules [1]. This material is widely used in modern society for has several advantages such as durable, lightweight, waterproof, and the price is relatively low. Every year around 265,000,000 tons of plastic are produced and used worldwide for industrial and household [2]. However, plastic currently that massively is utilized a synthetic polymer which cannot be decomposed in a short time, causing environmental problems. Plastic waste tends to create a buildup of soil pollution, causing land degradation, environmental damage, and floods [3].
Recently, scientists have been giving more attention to the development of renewable resources, such as starch, lignocellulose, and ethanol [4-7]. Those materials could be improved, becoming the bioplastics that can be decomposed by microorganisms [8]. The development of bioplastics has focused on starch, which is available abundantly in nature [9]. The potential for bioplastic development is immense because the raw material is available in the environment. The bioplastics have been reported by authors in which they were processed from great range sources, such as cassava [10].
The present study utilized the cassava (Manihot esculenta) as the raw material with some considerations. Indonesia is the third-largest cassava producing country in the world with production capacity in 2014, reaching 26 million tons, meanwhile based on the FAO report in 2017, the world capacity attained at 278.0 Million Tons. The huge cassava is an excellent opportunity to increase its value, becoming bioplastic.
As described previously, that bioplastics had been prepared from many biomass. It was known generally that bioplastic was obtained by reacting reactants, cassava, glycerin, which is enhanced by a catalyst. Meanwhile, the properties and improvement of bioplastic also were reported by many authors. The deficiencies of this material from starch were low mechanical properties (tensile strength, strain, and young modulus) and hydrophilic nature. The increase of bioplastic quality was the addition of
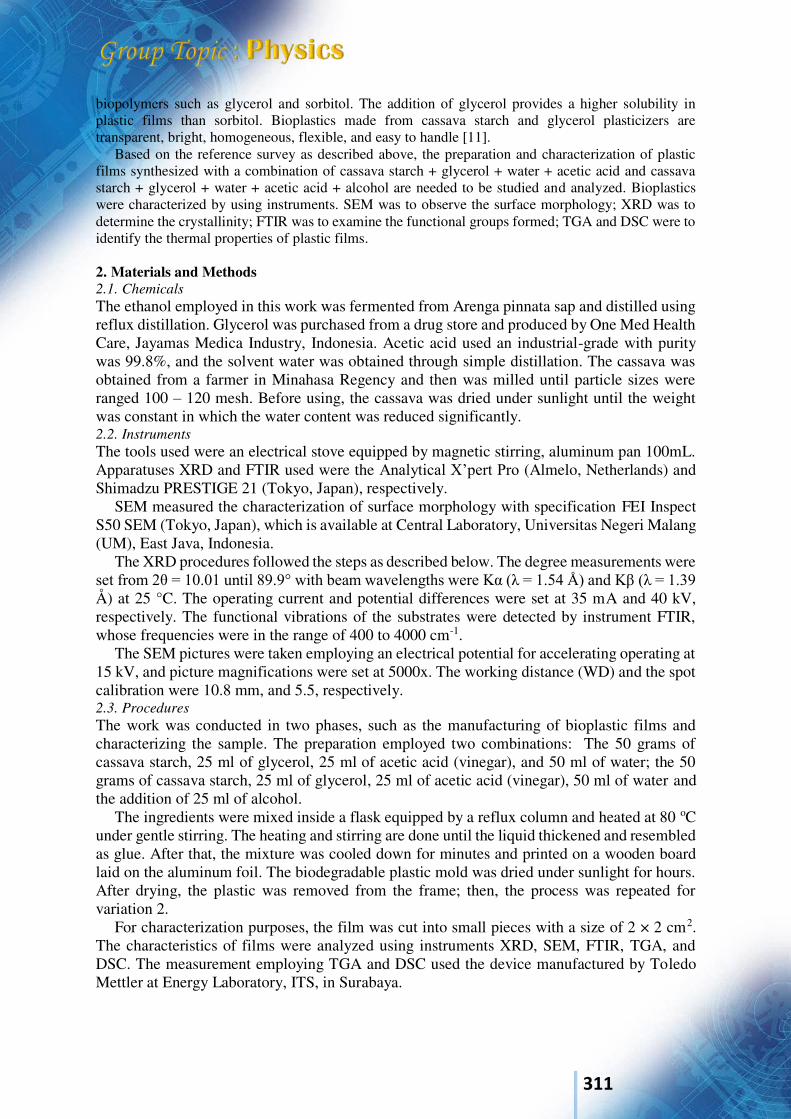
311
biopolymers such as glycerol and sorbitol. The addition of glycerol provides a higher solubility in plastic films than sorbitol. Bioplastics made from cassava starch and glycerol plasticizers are transparent, bright, homogeneous, flexible, and easy to handle [11].
Based on the reference survey as described above, the preparation and characterization of plastic films synthesized with a combination of cassava starch + glycerol + water + acetic acid and cassava starch + glycerol + water + acetic acid + alcohol are needed to be studied and analyzed. Bioplastics were characterized by using instruments. SEM was to observe the surface morphology; XRD was to determine the crystallinity; FTIR was to examine the functional groups formed; TGA and DSC were to identify the thermal properties of plastic films.
2. Materials and Methods 2.1. Chemicals
The ethanol employed in this work was fermented from Arenga pinnata sap and distilled using reflux distillation. Glycerol was purchased from a drug store and produced by One Med Health Care, Jayamas Medica Industry, Indonesia. Acetic acid used an industrial-grade with purity was 99.8%, and the solvent water was obtained through simple distillation. The cassava was obtained from a farmer in Minahasa Regency and then was milled until particle sizes were ranged 100 – 120 mesh. Before using, the cassava was dried under sunlight until the weight was constant in which the water content was reduced significantly. 2.2. Instruments
The tools used were an electrical stove equipped by magnetic stirring, aluminum pan 100mL. Apparatuses XRD and FTIR used were the Analytical X’pert Pro (Almelo, Netherlands) and Shimadzu PRESTIGE 21 (Tokyo, Japan), respectively.
SEM measured the characterization of surface morphology with specification FEI Inspect S50 SEM (Tokyo, Japan), which is available at Central Laboratory, Universitas Negeri Malang (UM), East Java, Indonesia.
The XRD procedures followed the steps as described below. The degree measurements were set from 2θ = 10.01 until 89.9° with beam wavelengths were Kα (λ = 1.54 Å) and Kβ (λ = 1.39 Å) at 25 °C. The operating current and potential differences were set at 35 mA and 40 kV, respectively. The functional vibrations of the substrates were detected by instrument FTIR, whose frequencies were in the range of 400 to 4000 cm-1.
The SEM pictures were taken employing an electrical potential for accelerating operating at 15 kV, and picture magnifications were set at 5000x. The working distance (WD) and the spot calibration were 10.8 mm, and 5.5, respectively. 2.3. Procedures
The work was conducted in two phases, such as the manufacturing of bioplastic films and characterizing the sample. The preparation employed two combinations: The 50 grams of cassava starch, 25 ml of glycerol, 25 ml of acetic acid (vinegar), and 50 ml of water; the 50 grams of cassava starch, 25 ml of glycerol, 25 ml of acetic acid (vinegar), 50 ml of water and the addition of 25 ml of alcohol.
The ingredients were mixed inside a flask equipped by a reflux column and heated at 80 oC under gentle stirring. The heating and stirring are done until the liquid thickened and resembled as glue. After that, the mixture was cooled down for minutes and printed on a wooden board laid on the aluminum foil. The biodegradable plastic mold was dried under sunlight for hours. After drying, the plastic was removed from the frame; then, the process was repeated for variation 2.
For characterization purposes, the film was cut into small pieces with a size of 2 × 2 cm2. The characteristics of films were analyzed using instruments XRD, SEM, FTIR, TGA, and DSC. The measurement employing TGA and DSC used the device manufactured by Toledo Mettler at Energy Laboratory, ITS, in Surabaya.
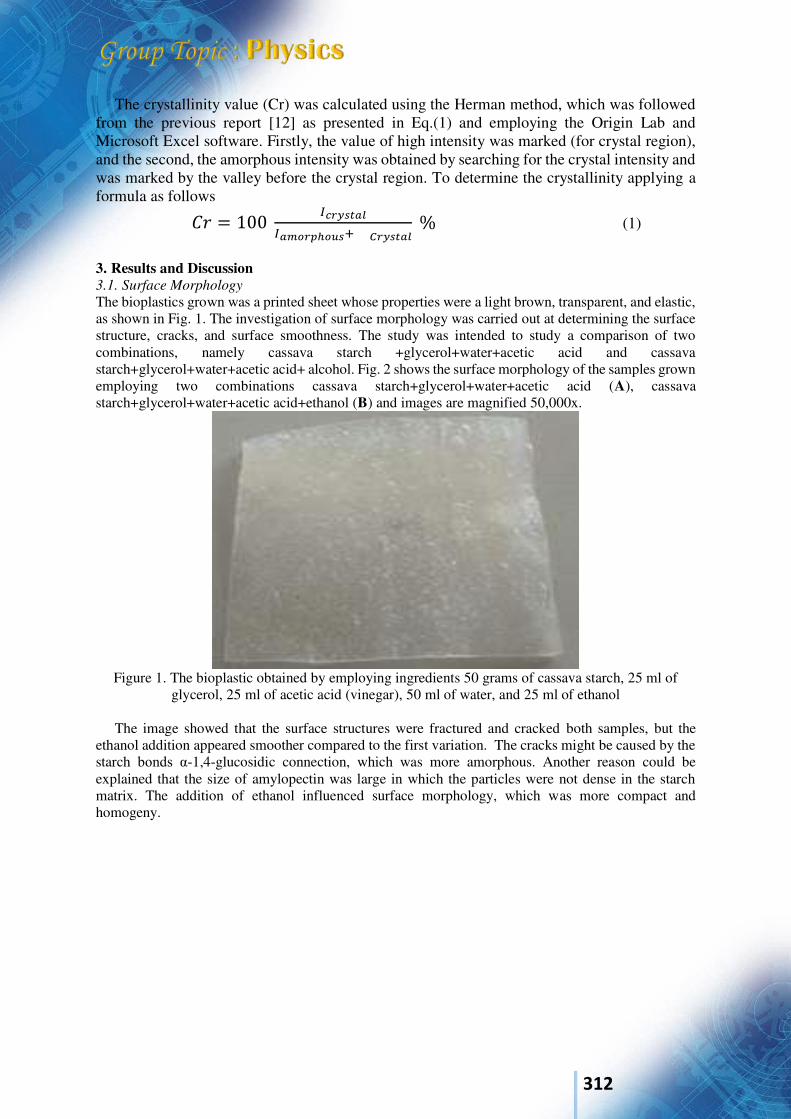
312
The crystallinity value (Cr) was calculated using the Herman method, which was followed from the previous report [12] as presented in Eq.(1) and employing the Origin Lab and Microsoft Excel software. Firstly, the value of high intensity was marked (for crystal region), and the second, the amorphous intensity was obtained by searching for the crystal intensity and was marked by the valley before the crystal region. To determine the crystallinity applying a formula as follows 𝐶𝑟 = 100 𝐼𝑐𝑟𝑦𝑠𝑡𝑎𝑙𝐼𝑎𝑚𝑜𝑟𝑝ℎ𝑜𝑢𝑠+ 𝐶𝑟𝑦𝑠𝑡𝑎𝑙 % (1)
3. Results and Discussion 3.1. Surface Morphology
The bioplastics grown was a printed sheet whose properties were a light brown, transparent, and elastic, as shown in Fig. 1. The investigation of surface morphology was carried out at determining the surface structure, cracks, and surface smoothness. The study was intended to study a comparison of two combinations, namely cassava starch +glycerol+water+acetic acid and cassava starch+glycerol+water+acetic acid+ alcohol. Fig. 2 shows the surface morphology of the samples grown employing two combinations cassava starch+glycerol+water+acetic acid (A), cassava starch+glycerol+water+acetic acid+ethanol (B) and images are magnified 50,000x.
Figure 1. The bioplastic obtained by employing ingredients 50 grams of cassava starch, 25 ml of
glycerol, 25 ml of acetic acid (vinegar), 50 ml of water, and 25 ml of ethanol
The image showed that the surface structures were fractured and cracked both samples, but the ethanol addition appeared smoother compared to the first variation. The cracks might be caused by the starch bonds α-1,4-glucosidic connection, which was more amorphous. Another reason could be explained that the size of amylopectin was large in which the particles were not dense in the starch matrix. The addition of ethanol influenced surface morphology, which was more compact and homogeny.
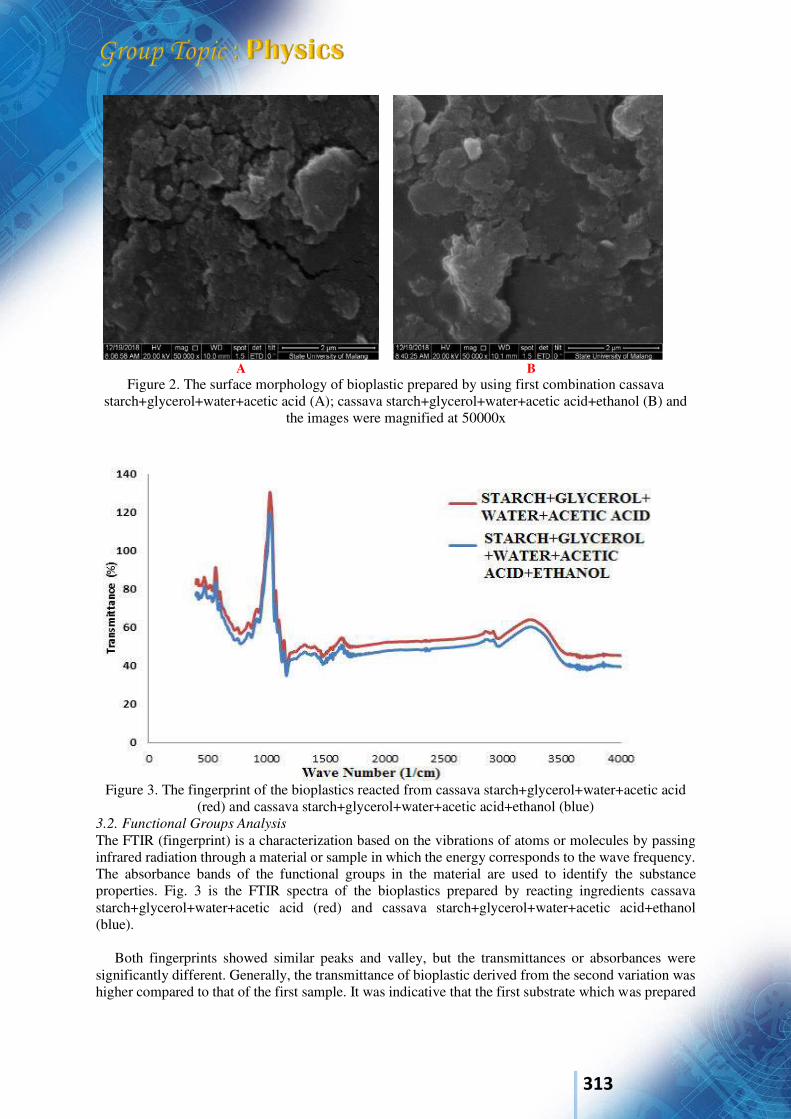
313
A B
Figure 2. The surface morphology of bioplastic prepared by using first combination cassava starch+glycerol+water+acetic acid (A); cassava starch+glycerol+water+acetic acid+ethanol (B) and
the images were magnified at 50000x
Figure 3. The fingerprint of the bioplastics reacted from cassava starch+glycerol+water+acetic acid
(red) and cassava starch+glycerol+water+acetic acid+ethanol (blue) 3.2. Functional Groups Analysis
The FTIR (fingerprint) is a characterization based on the vibrations of atoms or molecules by passing infrared radiation through a material or sample in which the energy corresponds to the wave frequency. The absorbance bands of the functional groups in the material are used to identify the substance properties. Fig. 3 is the FTIR spectra of the bioplastics prepared by reacting ingredients cassava starch+glycerol+water+acetic acid (red) and cassava starch+glycerol+water+acetic acid+ethanol (blue).
Both fingerprints showed similar peaks and valley, but the transmittances or absorbances were significantly different. Generally, the transmittance of bioplastic derived from the second variation was higher compared to that of the first sample. It was indicative that the first substrate which was prepared
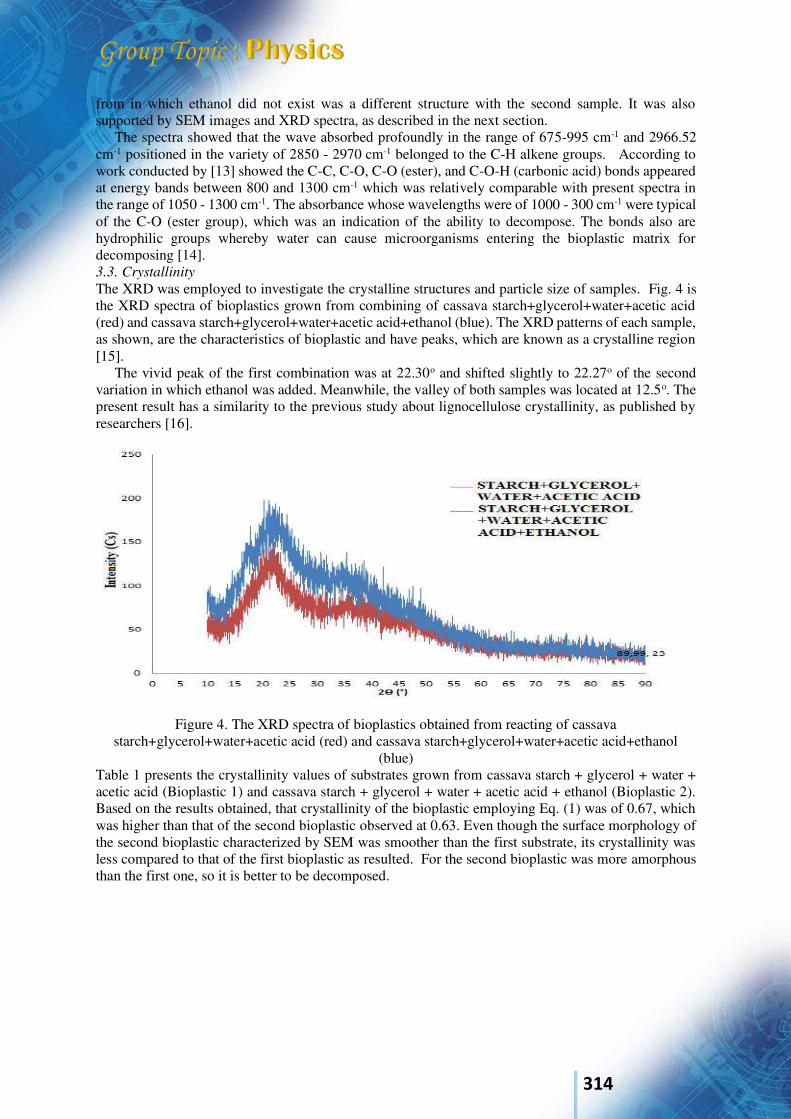
314
from in which ethanol did not exist was a different structure with the second sample. It was also supported by SEM images and XRD spectra, as described in the next section.
The spectra showed that the wave absorbed profoundly in the range of 675-995 cm-1 and 2966.52 cm-1 positioned in the variety of 2850 - 2970 cm-1 belonged to the C-H alkene groups. According to work conducted by [13] showed the C-C, C-O, C-O (ester), and C-O-H (carbonic acid) bonds appeared at energy bands between 800 and 1300 cm-1 which was relatively comparable with present spectra in the range of 1050 - 1300 cm-1. The absorbance whose wavelengths were of 1000 - 300 cm-1 were typical of the C-O (ester group), which was an indication of the ability to decompose. The bonds also are hydrophilic groups whereby water can cause microorganisms entering the bioplastic matrix for decomposing [14]. 3.3. Crystallinity
The XRD was employed to investigate the crystalline structures and particle size of samples. Fig. 4 is the XRD spectra of bioplastics grown from combining of cassava starch+glycerol+water+acetic acid (red) and cassava starch+glycerol+water+acetic acid+ethanol (blue). The XRD patterns of each sample, as shown, are the characteristics of bioplastic and have peaks, which are known as a crystalline region [15].
The vivid peak of the first combination was at 22.30o and shifted slightly to 22.27o of the second variation in which ethanol was added. Meanwhile, the valley of both samples was located at 12.5o. The present result has a similarity to the previous study about lignocellulose crystallinity, as published by researchers [16].
Figure 4. The XRD spectra of bioplastics obtained from reacting of cassava starch+glycerol+water+acetic acid (red) and cassava starch+glycerol+water+acetic acid+ethanol
(blue) Table 1 presents the crystallinity values of substrates grown from cassava starch + glycerol + water + acetic acid (Bioplastic 1) and cassava starch + glycerol + water + acetic acid + ethanol (Bioplastic 2). Based on the results obtained, that crystallinity of the bioplastic employing Eq. (1) was of 0.67, which was higher than that of the second bioplastic observed at 0.63. Even though the surface morphology of the second bioplastic characterized by SEM was smoother than the first substrate, its crystallinity was less compared to that of the first bioplastic as resulted. For the second bioplastic was more amorphous than the first one, so it is better to be decomposed.
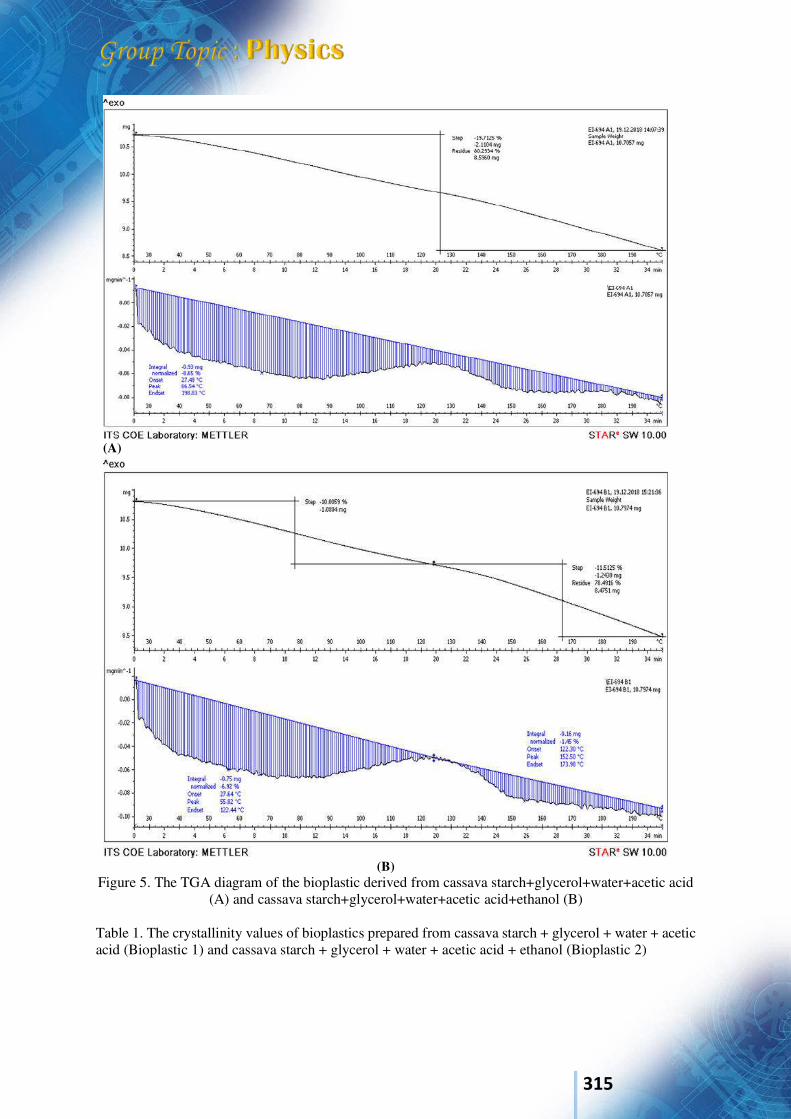
315
(A)
(B)
Figure 5. The TGA diagram of the bioplastic derived from cassava starch+glycerol+water+acetic acid (A) and cassava starch+glycerol+water+acetic acid+ethanol (B)
Table 1. The crystallinity values of bioplastics prepared from cassava starch + glycerol + water + acetic acid (Bioplastic 1) and cassava starch + glycerol + water + acetic acid + ethanol (Bioplastic 2)
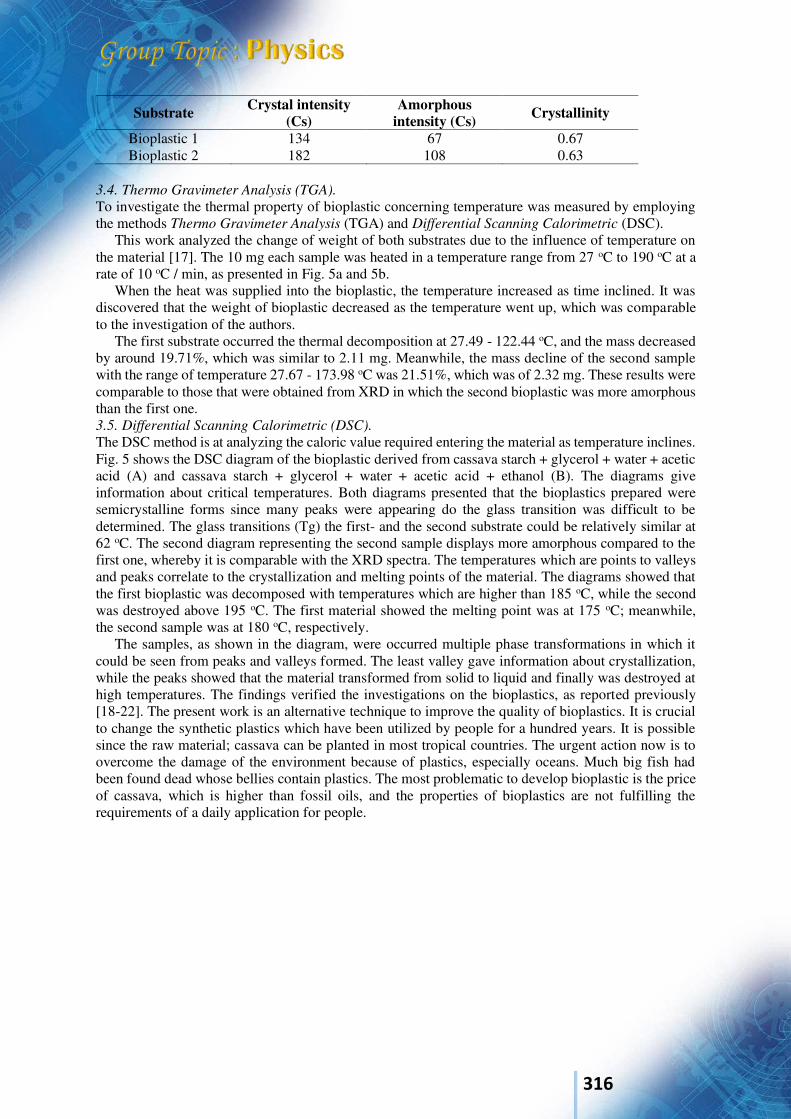
316
Substrate Crystal intensity (Cs)
Amorphous intensity (Cs)
Crystallinity
Bioplastic 1 134 67 0.67 Bioplastic 2 182 108 0.63
3.4. Thermo Gravimeter Analysis (TGA).
To investigate the thermal property of bioplastic concerning temperature was measured by employing the methods Thermo Gravimeter Analysis (TGA) and Differential Scanning Calorimetric (DSC).
This work analyzed the change of weight of both substrates due to the influence of temperature on the material [17]. The 10 mg each sample was heated in a temperature range from 27 oC to 190 oC at a rate of 10 oC / min, as presented in Fig. 5a and 5b.
When the heat was supplied into the bioplastic, the temperature increased as time inclined. It was discovered that the weight of bioplastic decreased as the temperature went up, which was comparable to the investigation of the authors.
The first substrate occurred the thermal decomposition at 27.49 - 122.44 oC, and the mass decreased by around 19.71%, which was similar to 2.11 mg. Meanwhile, the mass decline of the second sample with the range of temperature 27.67 - 173.98 oC was 21.51%, which was of 2.32 mg. These results were comparable to those that were obtained from XRD in which the second bioplastic was more amorphous than the first one. 3.5. Differential Scanning Calorimetric (DSC).
The DSC method is at analyzing the caloric value required entering the material as temperature inclines. Fig. 5 shows the DSC diagram of the bioplastic derived from cassava starch + glycerol + water + acetic acid (A) and cassava starch + glycerol + water + acetic acid + ethanol (B). The diagrams give information about critical temperatures. Both diagrams presented that the bioplastics prepared were semicrystalline forms since many peaks were appearing do the glass transition was difficult to be determined. The glass transitions (Tg) the first- and the second substrate could be relatively similar at 62 oC. The second diagram representing the second sample displays more amorphous compared to the first one, whereby it is comparable with the XRD spectra. The temperatures which are points to valleys and peaks correlate to the crystallization and melting points of the material. The diagrams showed that the first bioplastic was decomposed with temperatures which are higher than 185 oC, while the second was destroyed above 195 oC. The first material showed the melting point was at 175 oC; meanwhile, the second sample was at 180 oC, respectively.
The samples, as shown in the diagram, were occurred multiple phase transformations in which it could be seen from peaks and valleys formed. The least valley gave information about crystallization, while the peaks showed that the material transformed from solid to liquid and finally was destroyed at high temperatures. The findings verified the investigations on the bioplastics, as reported previously [18-22]. The present work is an alternative technique to improve the quality of bioplastics. It is crucial to change the synthetic plastics which have been utilized by people for a hundred years. It is possible since the raw material; cassava can be planted in most tropical countries. The urgent action now is to overcome the damage of the environment because of plastics, especially oceans. Much big fish had been found dead whose bellies contain plastics. The most problematic to develop bioplastic is the price of cassava, which is higher than fossil oils, and the properties of bioplastics are not fulfilling the requirements of a daily application for people.
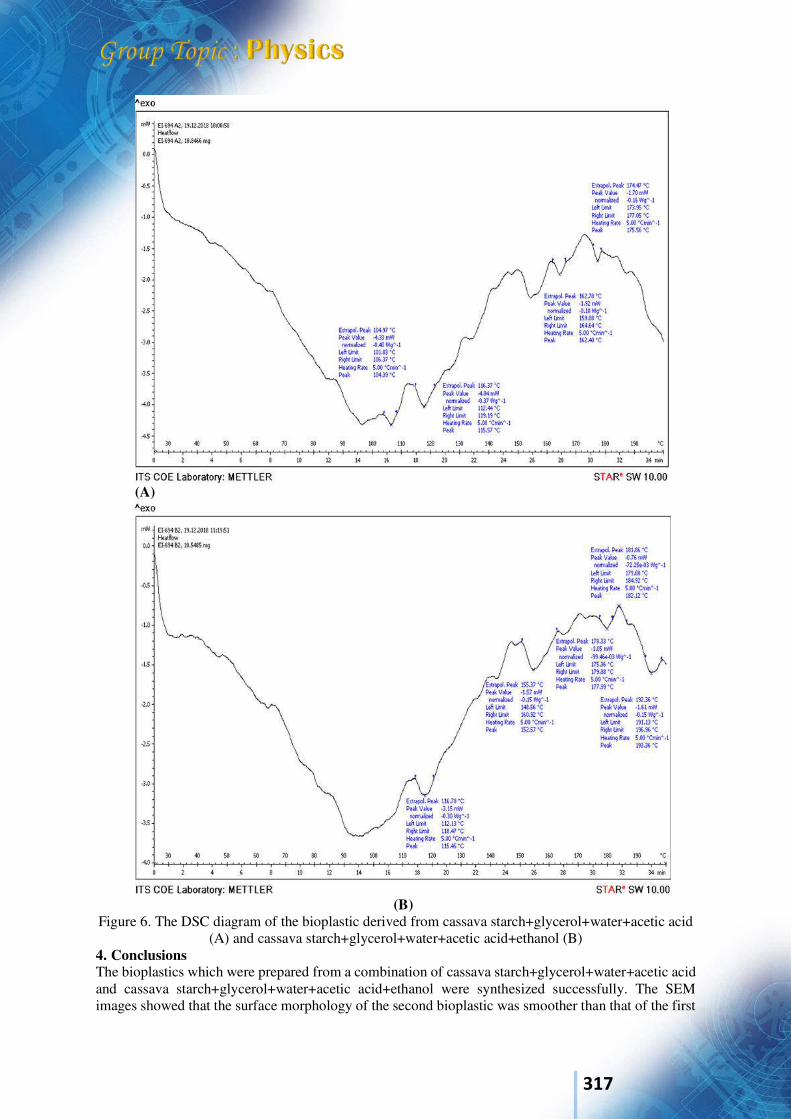
317
(A)
(B) Figure 6. The DSC diagram of the bioplastic derived from cassava starch+glycerol+water+acetic acid
(A) and cassava starch+glycerol+water+acetic acid+ethanol (B) 4. Conclusions The bioplastics which were prepared from a combination of cassava starch+glycerol+water+acetic acid and cassava starch+glycerol+water+acetic acid+ethanol were synthesized successfully. The SEM images showed that the surface morphology of the second bioplastic was smoother than that of the first
318
one. The XRD presented that the bioplastic employing the second combination was more amorphous in which TGA and DSC measurements supported the claim. The Cr value of the first sample was 0.66, while the second was recorded at 0.63. The biodegradable material was established since the existence of the functional ester, which was easily trimmed by micro-organisms. The bioplastic obtained was semi-crystalline structure and was occurred multiple phase changes. Make sure that your Microsoft Equation Editor or MathType fonts, including sizes, are set up to match the text of your document. Acknowledgments The authors would like to acknowledge the Higher Education Department of the Indonesian Government and Sam Ratulangi University (UNSRAT Manado) for financial support. We thank Professor Benny Pinontoan as a Dean of Fac. Mathematics and Sciences who provided the facility and instrument and assisted the authors in work. References [1] Kumar A A, Karthick K and Arumugam K P 2011 Int. J. Chem. Eng. Appl. 2 164 [2] Kipngetich T E and Hillary M 2013 International Journal of Green and Herbal Chemistry.
2 15 [3] Davis G and Song J H 2006. Ind. Crops Prod. 23 147 [4] Sangian H F, Aruan I, Tamuntuan G H, Bobanto M D, Sadjab B A, Purwadi R, Zulnazri
Z, Masinambow V J and Gunawan G 2019 BioResources 14 8212 [5] Widjaja A, Agnesty S Y, Sangian H F and Gunawan S 2015 Bull. Chem. React. Eng. Catal.
10 70 [6] Sangian H F, Telleng R, Aruan I ,Mosey H I R and Tamuntuan G H 2018 Food Sci.
Technol. 38 215 [7] Sangian H F, Tamuntuan G H, Mosey H I R, Suoth V and Manialup B H 2017 ARPN J
Eng Appl Sci.12 7039 [8] Bourtoom T 2008 Int. Food Res. J. 15 237 [9] Liu L, Kerry J F and Kerry J P 2005 J. Food Agric. Environ. 3 51 [10] Ezeoha S L and Ezenwanne J N 2013 IOSR Journal of Engineering (IOSRJEN) 3 14 [11] Phan D, Debeaufort F. Luu D and Voilley A 2005 J. Agric. Food Chem. 53 973 [12] Bansal P, Hall, M.J, Realff J H, Lee A S, and Bommarius 2010 Biores. Technol. 101 4461 [13] Huang C B, Jeng R, Sain M, Saville B A and Hubbes M 2006 Bioresources, 1 257 [14] Harry T F, Joel O F, Ademiluyi F T, and Oduola K 2016 Ajer 5 111 [15] Sangian H. F and Widjaja A. 2017 BioResources 12 8030 [16] Zhaosheng Y, Xiaoqian M and Ao L 2008 Biomass Bioenerg 32 1046 [17] Agustin M B, Ahmad B, Alonzo S M M and Patriana F M 2014 J. Reinf. Plast. Comp. 33
2205 [18] Edhirej E, Sapuan S M, Jawaid M and Sahari N I 2015 Polym Composites. 1 1 [19] Liu H, Sale K L, Holmes B M, Simmons B A, Singh S 2010 J Phys Chem 114 4293 [20] Singh V, Ali S Z, Somashekar R, Mukherjee P S 2006 Int J Food Prop 9 845 [21] Slopiecka K, Bartocci P and Fantozzi F 2012 Applied Energy 97 491 [22] Zuraida A, Hazleen A and Yusliza Y 2011 Key Eng 471 397
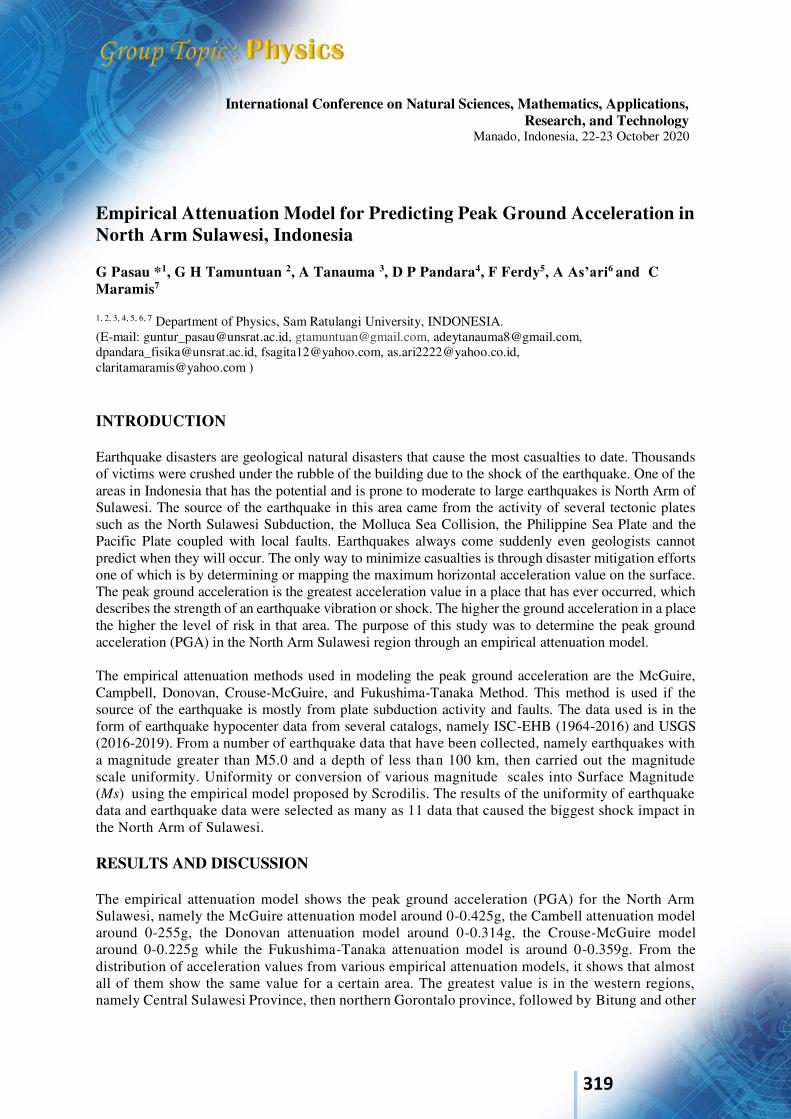
319
International Conference on Natural Sciences, Mathematics, Applications, Research, and Technology
Manado, Indonesia, 22-23 October 2020
Empirical Attenuation Model for Predicting Peak Ground Acceleration in North Arm Sulawesi, Indonesia G Pasau *1, G H Tamuntuan 2, A Tanauma 3, D P Pandara4, F Ferdy5, A As’ari6 and C Maramis7
1, 2, 3, 4, 5, 6, 7 Department of Physics, Sam Ratulangi University, INDONESIA. (E-mail: [email protected], [email protected], [email protected], [email protected], [email protected], [email protected], [email protected] ) INTRODUCTION Earthquake disasters are geological natural disasters that cause the most casualties to date. Thousands of victims were crushed under the rubble of the building due to the shock of the earthquake. One of the areas in Indonesia that has the potential and is prone to moderate to large earthquakes is North Arm of Sulawesi. The source of the earthquake in this area came from the activity of several tectonic plates such as the North Sulawesi Subduction, the Molluca Sea Collision, the Philippine Sea Plate and the Pacific Plate coupled with local faults. Earthquakes always come suddenly even geologists cannot predict when they will occur. The only way to minimize casualties is through disaster mitigation efforts one of which is by determining or mapping the maximum horizontal acceleration value on the surface. The peak ground acceleration is the greatest acceleration value in a place that has ever occurred, which describes the strength of an earthquake vibration or shock. The higher the ground acceleration in a place the higher the level of risk in that area. The purpose of this study was to determine the peak ground acceleration (PGA) in the North Arm Sulawesi region through an empirical attenuation model. The empirical attenuation methods used in modeling the peak ground acceleration are the McGuire, Campbell, Donovan, Crouse-McGuire, and Fukushima-Tanaka Method. This method is used if the source of the earthquake is mostly from plate subduction activity and faults. The data used is in the form of earthquake hypocenter data from several catalogs, namely ISC-EHB (1964-2016) and USGS (2016-2019). From a number of earthquake data that have been collected, namely earthquakes with a magnitude greater than M5.0 and a depth of less than 100 km, then carried out the magnitude scale uniformity. Uniformity or conversion of various magnitude scales into Surface Magnitude (Ms) using the empirical model proposed by Scrodilis. The results of the uniformity of earthquake data and earthquake data were selected as many as 11 data that caused the biggest shock impact in the North Arm of Sulawesi. RESULTS AND DISCUSSION The empirical attenuation model shows the peak ground acceleration (PGA) for the North Arm Sulawesi, namely the McGuire attenuation model around 0-0.425g, the Cambell attenuation model around 0-255g, the Donovan attenuation model around 0-0.314g, the Crouse-McGuire model around 0-0.225g while the Fukushima-Tanaka attenuation model is around 0-0.359g. From the distribution of acceleration values from various empirical attenuation models, it shows that almost all of them show the same value for a certain area. The greatest value is in the western regions, namely Central Sulawesi Province, then northern Gorontalo province, followed by Bitung and other
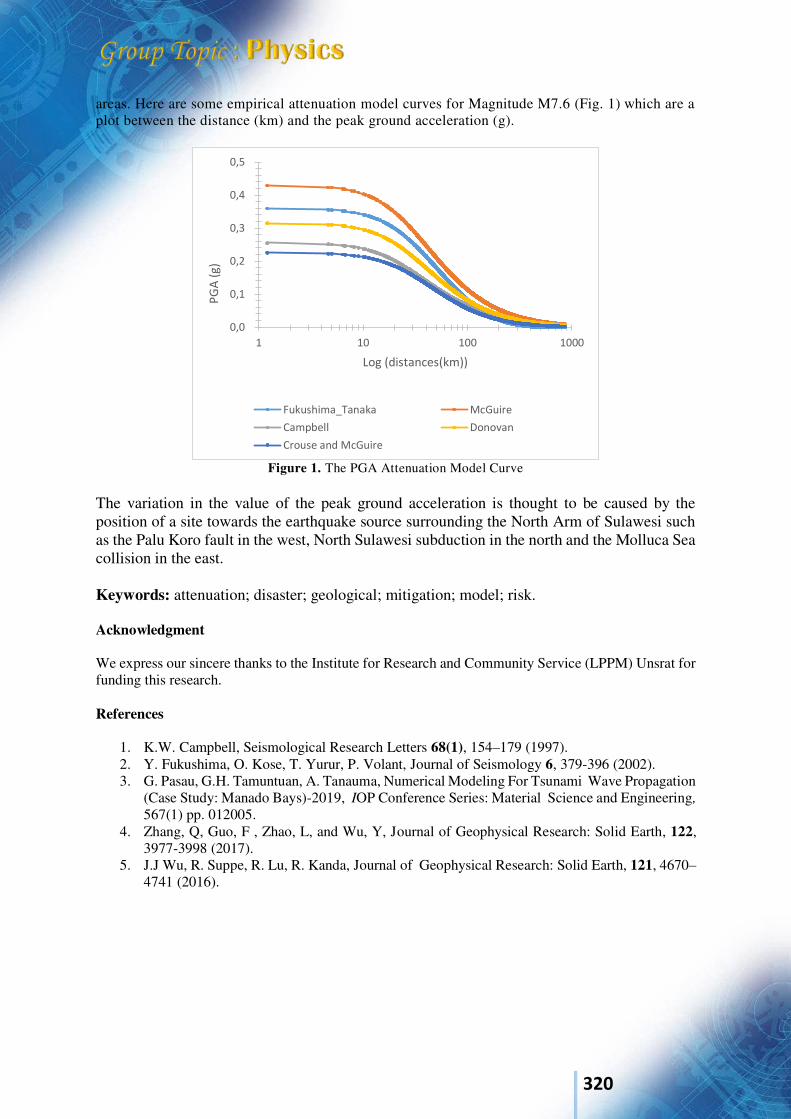
320
areas. Here are some empirical attenuation model curves for Magnitude M7.6 (Fig. 1) which are a plot between the distance (km) and the peak ground acceleration (g).
Figure 1. The PGA Attenuation Model Curve
The variation in the value of the peak ground acceleration is thought to be caused by the position of a site towards the earthquake source surrounding the North Arm of Sulawesi such as the Palu Koro fault in the west, North Sulawesi subduction in the north and the Molluca Sea collision in the east. Keywords: attenuation; disaster; geological; mitigation; model; risk. Acknowledgment We express our sincere thanks to the Institute for Research and Community Service (LPPM) Unsrat for funding this research. References
1. K.W. Campbell, Seismological Research Letters 68(1), 154–179 (1997). 2. Y. Fukushima, O. Kose, T. Yurur, P. Volant, Journal of Seismology 6, 379-396 (2002). 3. G. Pasau, G.H. Tamuntuan, A. Tanauma, Numerical Modeling For Tsunami Wave Propagation
(Case Study: Manado Bays)-2019, IOP Conference Series: Material Science and Engineering,
567(1) pp. 012005. 4. Zhang, Q, Guo, F , Zhao, L, and Wu, Y, Journal of Geophysical Research: Solid Earth, 122,
3977-3998 (2017). 5. J.J Wu, R. Suppe, R. Lu, R. Kanda, Journal of Geophysical Research: Solid Earth, 121, 4670–
4741 (2016).
0,0
0,1
0,2
0,3
0,4
0,5
1 10 100 1000
PG
A (
g)
Log (distances(km))
Fukushima_Tanaka McGuire
Campbell Donovan
Crouse and McGuire
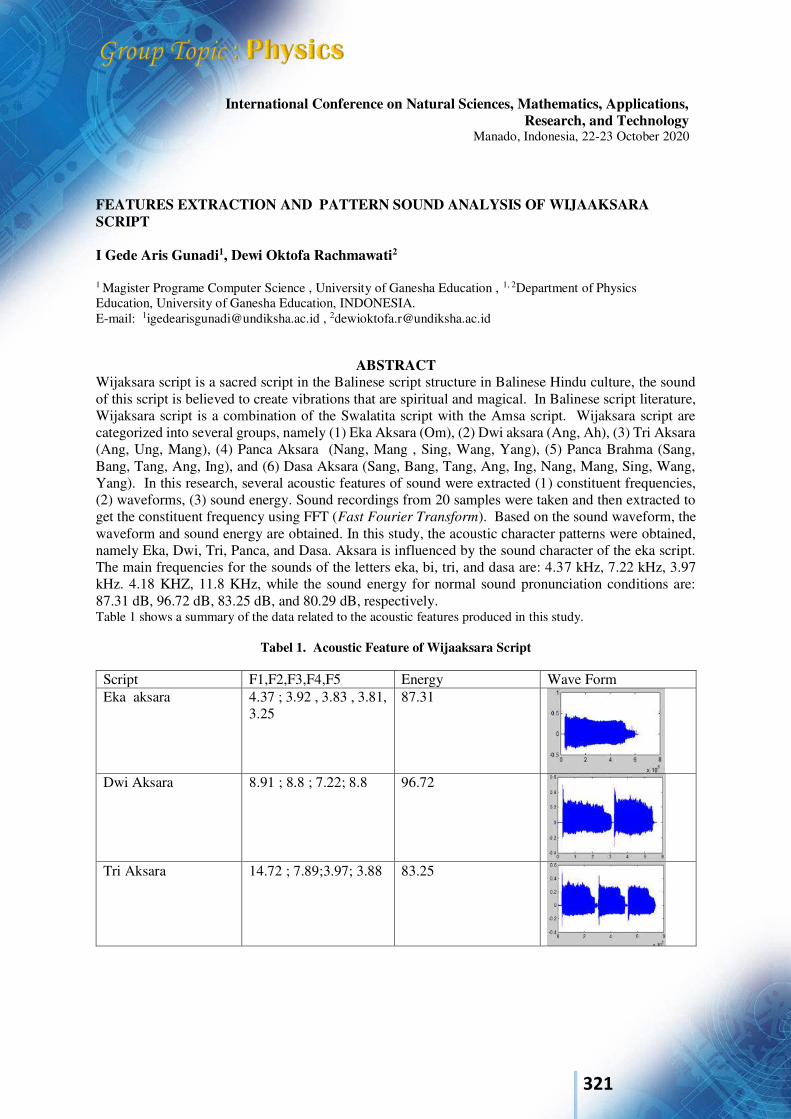
321
International Conference on Natural Sciences, Mathematics, Applications, Research, and Technology
Manado, Indonesia, 22-23 October 2020
FEATURES EXTRACTION AND PATTERN SOUND ANALYSIS OF WIJAAKSARA SCRIPT I Gede Aris Gunadi1, Dewi Oktofa Rachmawati2
1 Magister Programe Computer Science , University of Ganesha Education , 1, 2Department of Physics Education, University of Ganesha Education, INDONESIA. E-mail: [email protected] , [email protected]
ABSTRACT Wijaksara script is a sacred script in the Balinese script structure in Balinese Hindu culture, the sound of this script is believed to create vibrations that are spiritual and magical. In Balinese script literature, Wijaksara script is a combination of the Swalatita script with the Amsa script. Wijaksara script are categorized into several groups, namely (1) Eka Aksara (Om), (2) Dwi aksara (Ang, Ah), (3) Tri Aksara (Ang, Ung, Mang), (4) Panca Aksara (Nang, Mang , Sing, Wang, Yang), (5) Panca Brahma (Sang, Bang, Tang, Ang, Ing), and (6) Dasa Aksara (Sang, Bang, Tang, Ang, Ing, Nang, Mang, Sing, Wang, Yang). In this research, several acoustic features of sound were extracted (1) constituent frequencies, (2) waveforms, (3) sound energy. Sound recordings from 20 samples were taken and then extracted to get the constituent frequency using FFT (Fast Fourier Transform). Based on the sound waveform, the waveform and sound energy are obtained. In this study, the acoustic character patterns were obtained, namely Eka, Dwi, Tri, Panca, and Dasa. Aksara is influenced by the sound character of the eka script. The main frequencies for the sounds of the letters eka, bi, tri, and dasa are: 4.37 kHz, 7.22 kHz, 3.97 kHz. 4.18 KHZ, 11.8 KHz, while the sound energy for normal sound pronunciation conditions are: 87.31 dB, 96.72 dB, 83.25 dB, and 80.29 dB, respectively. Table 1 shows a summary of the data related to the acoustic features produced in this study.
Tabel 1. Acoustic Feature of Wijaaksara Script
Script F1,F2,F3,F4,F5 Energy Wave Form Eka aksara 4.37 ; 3.92 , 3.83 , 3.81,
3.25 87.31
Dwi Aksara 8.91 ; 8.8 ; 7.22; 8.8 96.72
Tri Aksara 14.72 ; 7.89;3.97; 3.88 83.25
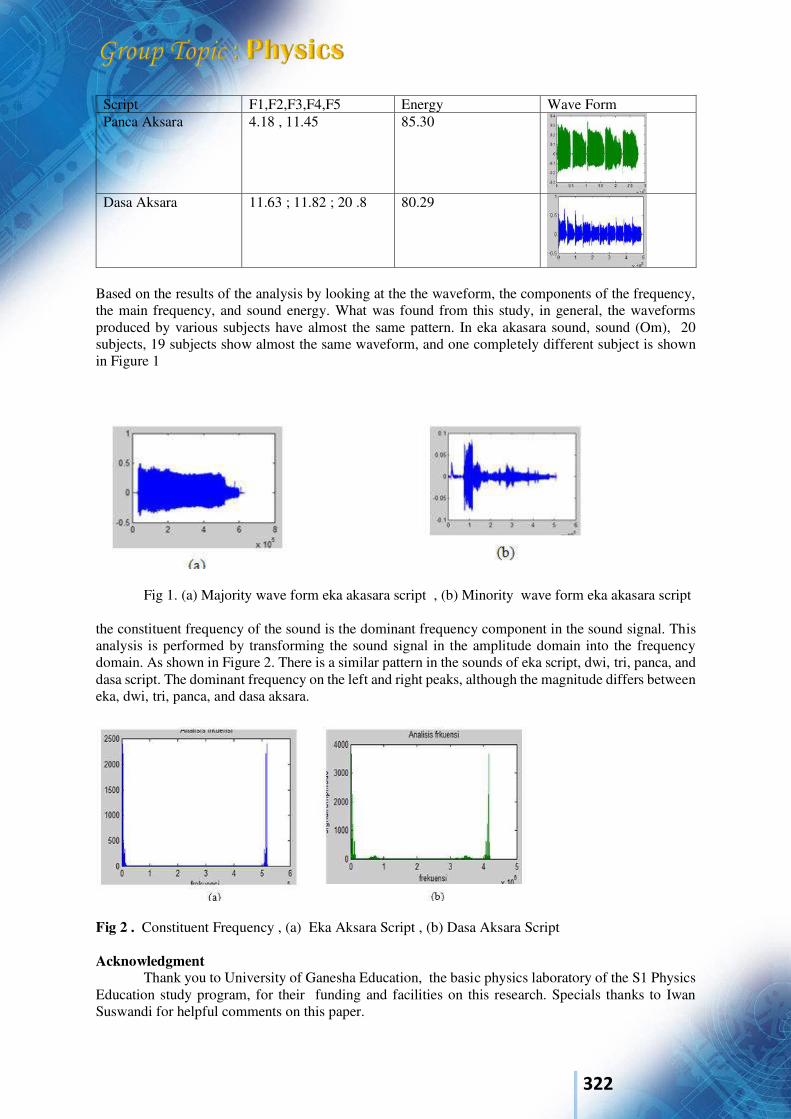
322
Script F1,F2,F3,F4,F5 Energy Wave Form Panca Aksara 4.18 , 11.45 85.30
Dasa Aksara 11.63 ; 11.82 ; 20 .8 80.29
Based on the results of the analysis by looking at the the waveform, the components of the frequency, the main frequency, and sound energy. What was found from this study, in general, the waveforms produced by various subjects have almost the same pattern. In eka akasara sound, sound (Om), 20 subjects, 19 subjects show almost the same waveform, and one completely different subject is shown in Figure 1
Fig 1. (a) Majority wave form eka akasara script , (b) Minority wave form eka akasara script the constituent frequency of the sound is the dominant frequency component in the sound signal. This analysis is performed by transforming the sound signal in the amplitude domain into the frequency domain. As shown in Figure 2. There is a similar pattern in the sounds of eka script, dwi, tri, panca, and dasa script. The dominant frequency on the left and right peaks, although the magnitude differs between eka, dwi, tri, panca, and dasa aksara.
Fig 2 . Constituent Frequency , (a) Eka Aksara Script , (b) Dasa Aksara Script Acknowledgment Thank you to University of Ganesha Education, the basic physics laboratory of the S1 Physics Education study program, for their funding and facilities on this research. Specials thanks to Iwan Suswandi for helpful comments on this paper.

323
Keywords : Wijakasara Script, Signal Processing, Feature of Sound. Refrences Effendi, T. (2007). Meditasi : Jalan Meningkatkan Kehidupan Anda. (E. M. Komputindo, Ed.).
Jakarta. Gunadi, I. G. A., Ngurah, I. G., & Hartawan, Y. (2018). Ekstraksi Fitur Akustik Bentuk Gelombang
dan Energi Bunyi Pada Suara Genta. In Senari 2018 (pp. 250–255). Haryati, S. (1985). Jnanasiddhanta. Jakarta: Djambatan. Medicine, A. (2004). Reiki. Retrieved from http://www.pittsburgh-counseling.com/behavioral-health-
therapy/REIKI.pdf Nala, N. (2006). Akasara Bali Dalam Usada. Surabaya: Paramitha. Rienstra, S. W., & Hirschberg, A. (2017). An Introduction to Acoustics (1st ed.). Eindhoven:
Eindhoven University Technology. Simpen, W. (1995). Pasang Aksara Bali. Vira. (1956). Svara Vyanjana. NagaPur: International Academy of Indian Culture.
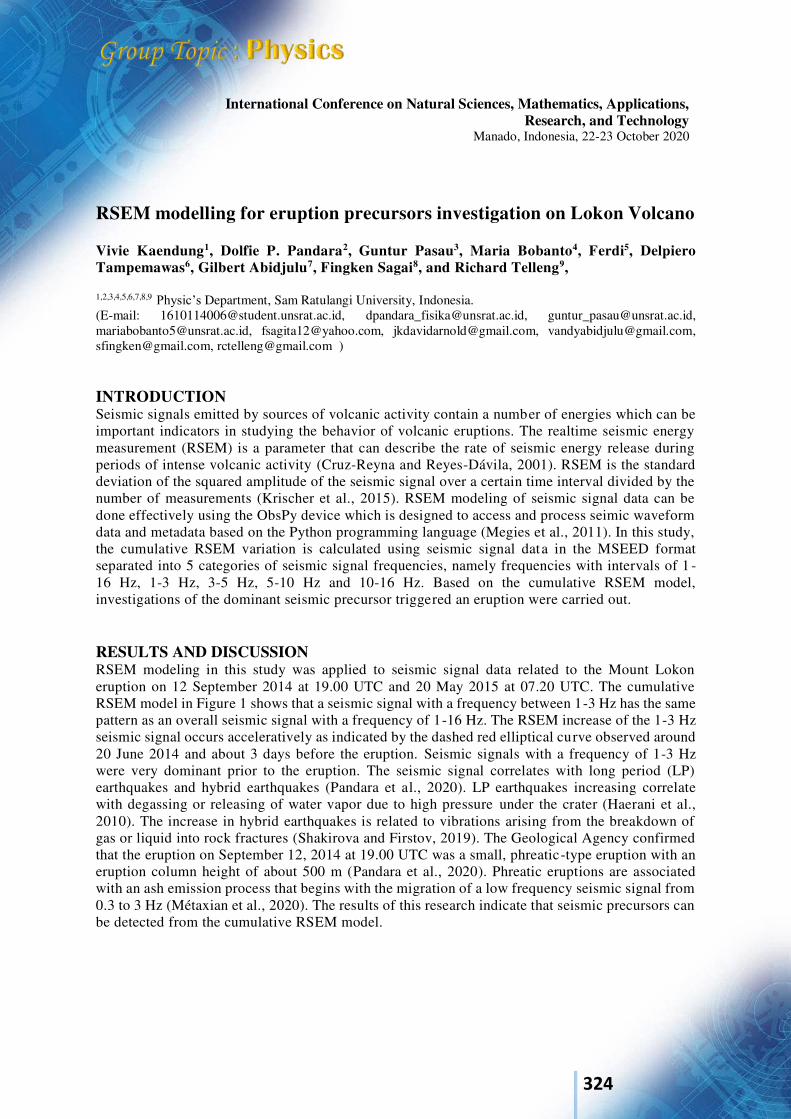
324
International Conference on Natural Sciences, Mathematics, Applications, Research, and Technology
Manado, Indonesia, 22-23 October 2020
RSEM modelling for eruption precursors investigation on Lokon Volcano Vivie Kaendung1, Dolfie P. Pandara2, Guntur Pasau3, Maria Bobanto4, Ferdi5, Delpiero Tampemawas6, Gilbert Abidjulu7, Fingken Sagai8, and Richard Telleng9,
1,2,3,4,5,6,7,8,9 Physic’s Department, Sam Ratulangi University, Indonesia. (E-mail: [email protected], [email protected], [email protected], [email protected], [email protected], [email protected], [email protected], [email protected], [email protected] ) INTRODUCTION Seismic signals emitted by sources of volcanic activity contain a number of energies which can be important indicators in studying the behavior of volcanic eruptions. The realtime seismic energy measurement (RSEM) is a parameter that can describe the rate of seismic energy release during periods of intense volcanic activity (Cruz-Reyna and Reyes-Dávila, 2001). RSEM is the standard deviation of the squared amplitude of the seismic signal over a certain time interval divided by the number of measurements (Krischer et al., 2015). RSEM modeling of seismic signal data can be done effectively using the ObsPy device which is designed to access and process seimic waveform data and metadata based on the Python programming language (Megies et al., 2011). In this study, the cumulative RSEM variation is calculated using seismic signal data in the MSEED format separated into 5 categories of seismic signal frequencies, namely frequencies with intervals of 1 -16 Hz, 1-3 Hz, 3-5 Hz, 5-10 Hz and 10-16 Hz. Based on the cumulative RSEM model, investigations of the dominant seismic precursor triggered an eruption were carried out. RESULTS AND DISCUSSION RSEM modeling in this study was applied to seismic signal data related to the Mount Lokon eruption on 12 September 2014 at 19.00 UTC and 20 May 2015 at 07.20 UTC. The cumulative RSEM model in Figure 1 shows that a seismic signal with a frequency between 1-3 Hz has the same pattern as an overall seismic signal with a frequency of 1-16 Hz. The RSEM increase of the 1-3 Hz seismic signal occurs acceleratively as indicated by the dashed red elliptical curve observed around 20 June 2014 and about 3 days before the eruption. Seismic signals with a frequency of 1-3 Hz were very dominant prior to the eruption. The seismic signal correlates with long period (LP) earthquakes and hybrid earthquakes (Pandara et al., 2020). LP earthquakes increasing correlate with degassing or releasing of water vapor due to high pressure under the crater (Haerani et al., 2010). The increase in hybrid earthquakes is related to vibrations arising from the breakdown of gas or liquid into rock fractures (Shakirova and Firstov, 2019). The Geological Agency confirmed that the eruption on September 12, 2014 at 19.00 UTC was a small, phreatic-type eruption with an eruption column height of about 500 m (Pandara et al., 2020). Phreatic eruptions are associated with an ash emission process that begins with the migration of a low frequency seismic signal from 0.3 to 3 Hz (Métaxian et al., 2020). The results of this research indicate that seismic precursors can be detected from the cumulative RSEM model.
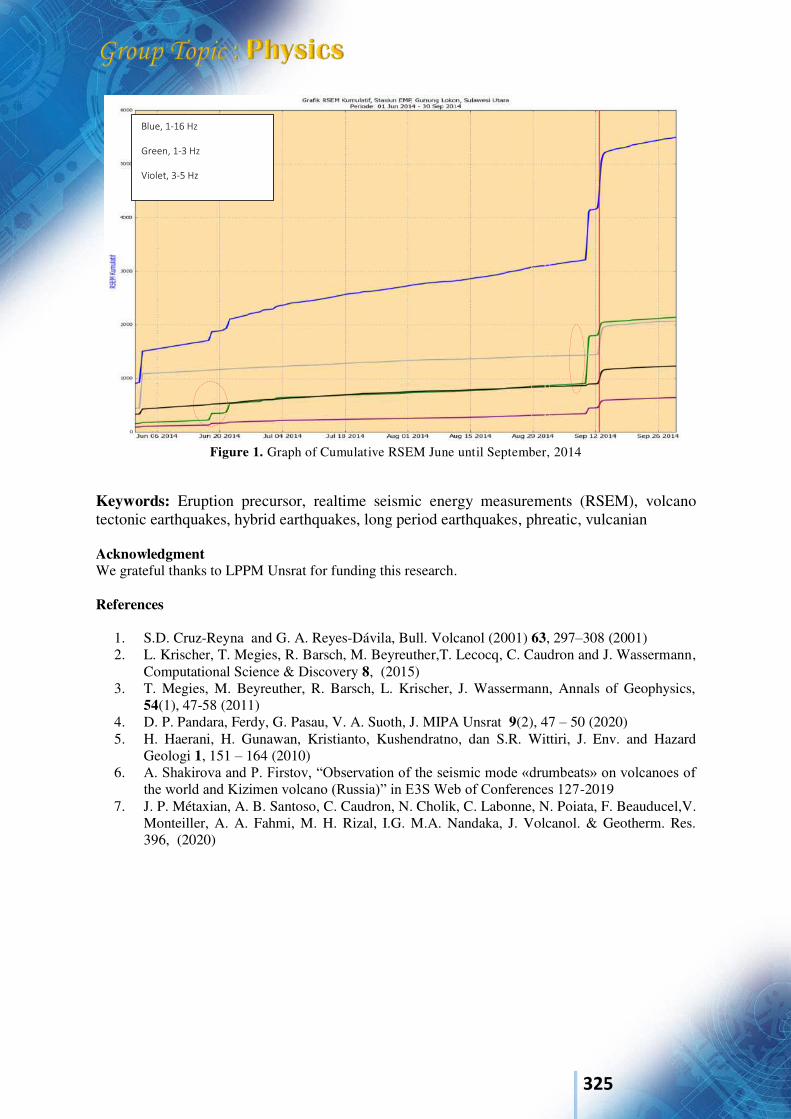
325
Figure 1. Graph of Cumulative RSEM June until September, 2014
Keywords: Eruption precursor, realtime seismic energy measurements (RSEM), volcano tectonic earthquakes, hybrid earthquakes, long period earthquakes, phreatic, vulcanian Acknowledgment We grateful thanks to LPPM Unsrat for funding this research. References
1. S.D. Cruz-Reyna and G. A. Reyes-Dávila, Bull. Volcanol (2001) 63, 297–308 (2001) 2. L. Krischer, T. Megies, R. Barsch, M. Beyreuther,T. Lecocq, C. Caudron and J. Wassermann,
Computational Science & Discovery 8, (2015) 3. T. Megies, M. Beyreuther, R. Barsch, L. Krischer, J. Wassermann, Annals of Geophysics,
54(1), 47-58 (2011) 4. D. P. Pandara, Ferdy, G. Pasau, V. A. Suoth, J. MIPA Unsrat 9(2), 47 – 50 (2020) 5. H. Haerani, H. Gunawan, Kristianto, Kushendratno, dan S.R. Wittiri, J. Env. and Hazard
Geologi 1, 151 – 164 (2010) 6. A. Shakirova and P. Firstov, “Observation of the seismic mode «drumbeats» on volcanoes of
the world and Kizimen volcano (Russia)” in E3S Web of Conferences 127-2019 7. J. P. Métaxian, A. B. Santoso, C. Caudron, N. Cholik, C. Labonne, N. Poiata, F. Beauducel,V.
Monteiller, A. A. Fahmi, M. H. Rizal, I.G. M.A. Nandaka, J. Volcanol. & Geotherm. Res. 396, (2020)
Blue, 1-16 Hz
Green, 1-3 Hz
Violet, 3-5 Hz
Black, 5-10 Hz
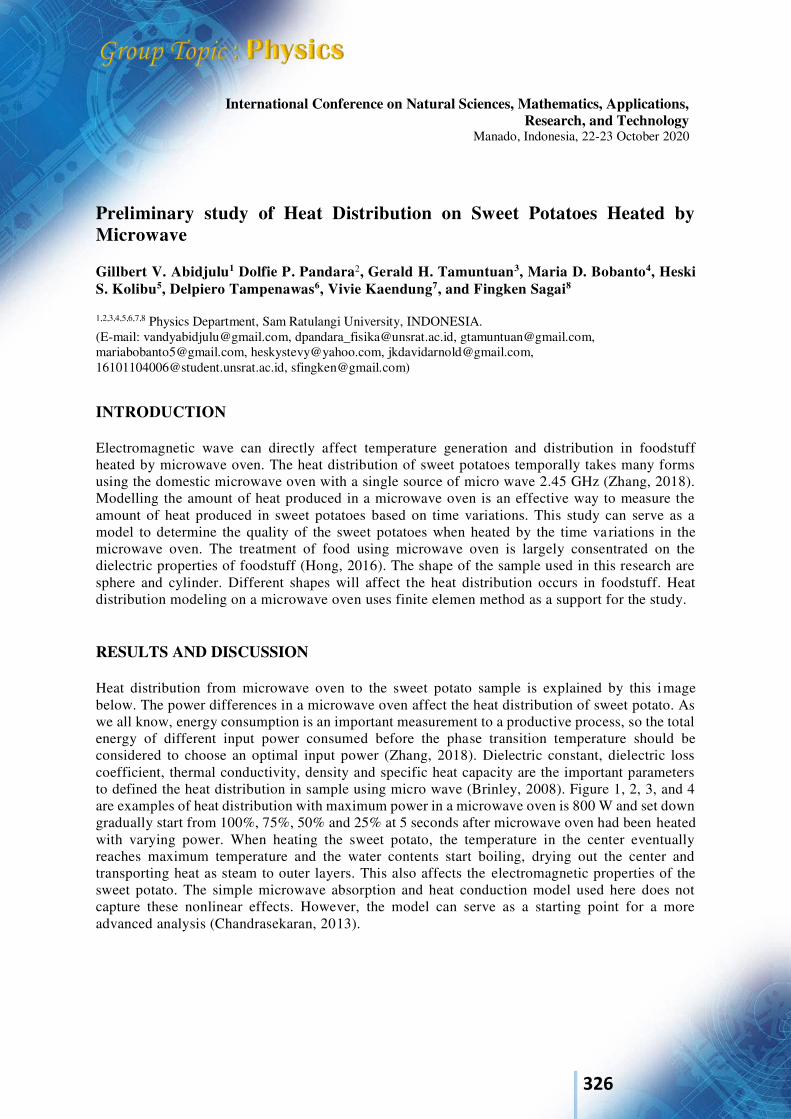
326
International Conference on Natural Sciences, Mathematics, Applications, Research, and Technology
Manado, Indonesia, 22-23 October 2020
Preliminary study of Heat Distribution on Sweet Potatoes Heated by Microwave Gillbert V. Abidjulu1 Dolfie P. Pandara2, Gerald H. Tamuntuan3, Maria D. Bobanto4, Heski S. Kolibu5, Delpiero Tampenawas6, Vivie Kaendung7, and Fingken Sagai8
1,2,3,4,5,6,7,8 Physics Department, Sam Ratulangi University, INDONESIA. (E-mail: [email protected], [email protected], [email protected], [email protected], [email protected], [email protected], [email protected], [email protected])
INTRODUCTION Electromagnetic wave can directly affect temperature generation and distribution in foodstuff heated by microwave oven. The heat distribution of sweet potatoes temporally takes many forms using the domestic microwave oven with a single source of micro wave 2.45 GHz (Zhang, 2018). Modelling the amount of heat produced in a microwave oven is an effective way to measure the amount of heat produced in sweet potatoes based on time variations. This study can serve as a model to determine the quality of the sweet potatoes when heated by the time variations in the microwave oven. The treatment of food using microwave oven is largely consentrated on the dielectric properties of foodstuff (Hong, 2016). The shape of the sample used in this research are sphere and cylinder. Different shapes will affect the heat distribution occurs in foodstuff. Heat distribution modeling on a microwave oven uses finite elemen method as a support for the study. RESULTS AND DISCUSSION Heat distribution from microwave oven to the sweet potato sample is explained by this image below. The power differences in a microwave oven affect the heat distribution of sweet potato. As we all know, energy consumption is an important measurement to a productive process, so the total energy of different input power consumed before the phase transition temperature should be considered to choose an optimal input power (Zhang, 2018). Dielectric constant, dielectric loss coefficient, thermal conductivity, density and specific heat capacity are the important parameters to defined the heat distribution in sample using micro wave (Brinley, 2008). Figure 1, 2, 3, and 4 are examples of heat distribution with maximum power in a microwave oven is 800 W and set down gradually start from 100%, 75%, 50% and 25% at 5 seconds after microwave oven had been heated with varying power. When heating the sweet potato, the temperature in the center eventually reaches maximum temperature and the water contents start boiling, drying out the center and transporting heat as steam to outer layers. This also affects the electromagnetic properties of the sweet potato. The simple microwave absorption and heat conduction model used here does not capture these nonlinear effects. However, the model can serve as a starting point for a more advanced analysis (Chandrasekaran, 2013).
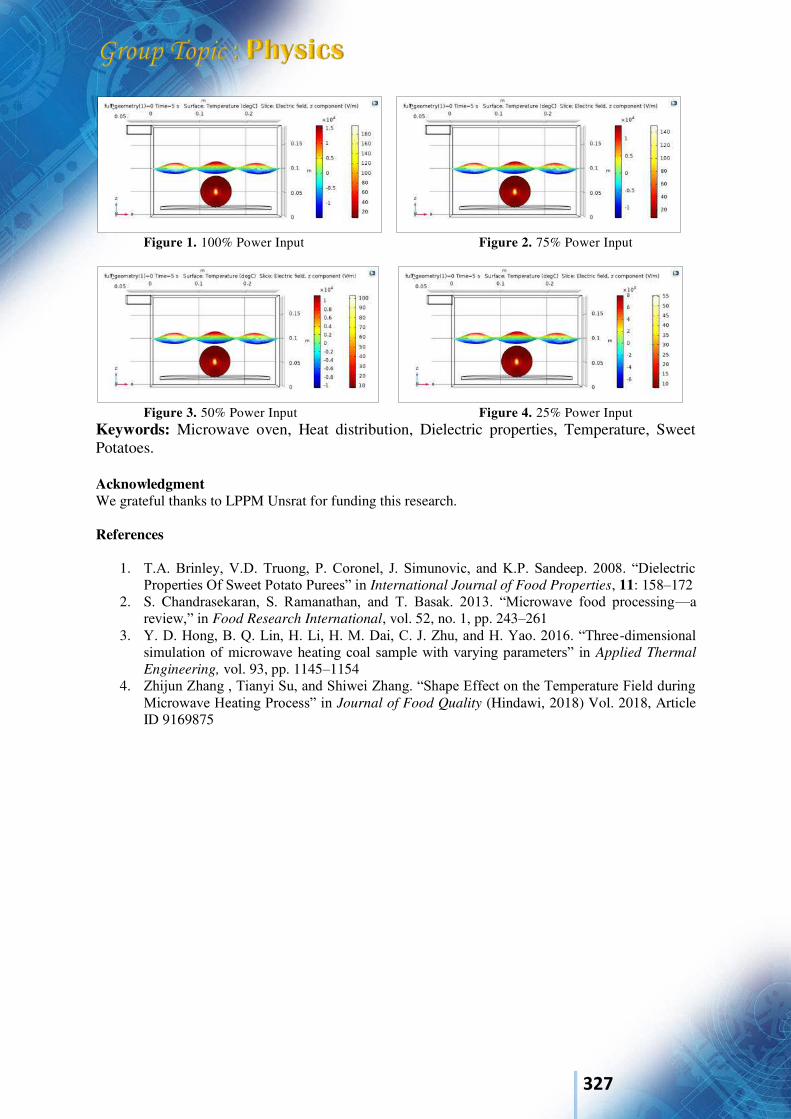
327
Figure 1. 100% Power Input Figure 2. 75% Power Input
Figure 3. 50% Power Input Figure 4. 25% Power Input
Keywords: Microwave oven, Heat distribution, Dielectric properties, Temperature, Sweet Potatoes. Acknowledgment We grateful thanks to LPPM Unsrat for funding this research. References
1. T.A. Brinley, V.D. Truong, P. Coronel, J. Simunovic, and K.P. Sandeep. 2008. “Dielectric Properties Of Sweet Potato Purees” in International Journal of Food Properties, 11: 158–172
2. S. Chandrasekaran, S. Ramanathan, and T. Basak. 2013. “Microwave food processing—a review,” in Food Research International, vol. 52, no. 1, pp. 243–261
3. Y. D. Hong, B. Q. Lin, H. Li, H. M. Dai, C. J. Zhu, and H. Yao. 2016. “Three-dimensional simulation of microwave heating coal sample with varying parameters” in Applied Thermal
Engineering, vol. 93, pp. 1145–1154 4. Zhijun Zhang , Tianyi Su, and Shiwei Zhang. “Shape Effect on the Temperature Field during
Microwave Heating Process” in Journal of Food Quality (Hindawi, 2018) Vol. 2018, Article ID 9169875
328
International Conference on Natural Sciences, Mathematics, Applications, Research, and Technology
Manado, Indonesia, 22-23 October 2020
Novel Circular Microstrip Patch Antenna With Linear Polarization In C-Band Frequency For Communications Putu Artawan1, 2, *, Yono Hadi Pramono1, Mashuri1, Josaphat T. Sri Sumantyo3, Farohaji Kurniawan3 1, Physics Department, Faculty of Scientics, Institut Teknologi Sepuluh Nopember (ITS), Surabaya, Indonesia (E-mail: [email protected]; [email protected]; [email protected] ) 2, Physics Education Department, Faculty of Natural Sciences, Universitas Pendidikan Ganesha (Undiksha), Singaraja, Bali, Indonesia 3, Josaphat Microwave Remote Sensing Laboratory, Center for Environmental Remote Sensing (CEReS) Chiba University, 1-33 Yayoi-cho, Inage-ku, Chiba 263-8522-Japan (E-mail: [email protected]; [email protected]) Abstract-This research evaluates the design of a novel linearly polarized microstrip circular patch antenna in C-Band frequency in communications. The circular patch was characterized by a truncate square and feeding technique in the stripline, and adopted in the antenna design, with a total size of 40mm x 40mm. The result showed a Voltage Standing Wave Ratio (VSWR≤2) of 1.06, bandwidth of 740.0MHz (5.18GHz–5.92GHz), reflection coefficient is 0.03 and return loss of -30.69dB. Furthermore, the antenna achieved a stable radiation performance, with a maximum gain of 7.46dB in the C-Band operating frequency. Therefore, novel linearly polarized microstrip circular patch antenna with 50 Ohm impedance and easy integration enhance the suitability of this model for C-Band frequency (4GHz-8GHz) satellite communication applications. The proposed design and results are subsequently presented and discussed in details. Introduction-Various studies have been conducted on microstrip antenna type [1,2,8,10,11,12,13,14,16], among which is to perform a wide variety of designs and shapes microstrip antenna, by giving the slot [11,12] and patch microstrip antenna and adding to the number of the array [15,16]. Dual polarized microstrip patch antennas excite two orthogonal modes, which generate vertically polarized electric field and horizontally polarized electric field. Therefore, dual polarized antennas added information by providing two co-polarizations and two cross-polarizations. Microstrip patch antenna have good potential with the characteristics of a thin cross-section for making dual-polarized antennas due to their several attractive features including low profile, the mass that is light weight, low cost, easy to make, compatibility with Microwave Integrated Circuits (MICs) technology and can be made to multifrequency. Microstrip patch antennas have been widely used in high performance satellite. Several works have been reported to overcome drawbacks of the conventional microstrip antenna such as low efficiency and narrow bandwidth. The main problem designing the microstrip antenna is to widening bandwidth and optimizing the gain. In this research, the truncated in circular patch side is a one of the solution to reach wide in bandwidth and optimise in gain performance. Besides, to arranges the electricity field current distribution in vertical polarization. There are several solutions have been proposed to achieve the polarized antenna with wide bandwidth, and optimising the gain. One of the most common solutions consists of using monopol feeding [11,12]. Other solutions using feedline coaxial waveguide in microstrip panel [14] have been reported. The various array technic in microstrip patch antena [15,16,17,18 ,19] have been proposed to improve polarized antenna with wide bandwidth. Despite the excellent performances, these structures require in array structure which increase the complexity. In this
329
work, a simple feeding structure and truncate circular patch antenna for vertical linear polarization is presented. One type of antenna that will be designed to have the characteristics in question are novel linear polarized microstrip circular patch antenna design [5]. In this study, linear polarized microstrip circular patch antenna design is propose to develope in C-Band frequency for many satellite communications transmisions, wi-fi devices which can be used in WLAN applications. The advantages of C-Band are weatherproof, high throughput (easily support voice/data/imagery/HD video, excels with small antennas, low cost (extremely high MHz-Mbps efficiency), high link availability, and low probability of interference. The C-Band ranges from 4GHz to 8GHz and is used primarily for radar applications. C-Band used in radar applications including continuous-wave, pulsed, single-polarization, dual-polarization, synthetic aperture radar and phased arrays. C-Band radar frequency sub-bands are used in civil, military and government institutions for weather monitoring, air traffic control, maritime vessel traffic control, defense tracking and vehicle speed detection for law enforcement. The proposed novel linearly polarized microstrip circular patch antenna is afford to operate in [16] C-Band frequency in range 4GHz to 8GHz. The target of novel linearly polarized microstrip circular patch antenna is in 5.5 GHz center frequency, bandwidth more than 5.0%, return loss (S11 parameter) less than –10dB, Voltage Standing Wave Ratio (VSWR) less than 2, gain more than 5dB, and in linear polarization, respectively. Table 1. Target of The Antenna Parameter.
PARAMETERS SPECIFICATION Center Frequency 5.5 GHz Bandwidth >5.0% S11 (Return Loss) < -10dB VSWR < 2 Gain > 5dB Polarization Linear (Vertical)
Conclusion-Linearly polarized microstrip patch antenna with truncate square in circular patch and feeding stripline has been demonstrated in this study. The circular patch with truncate square and feeding technique makes it possible to have a bandwidth of 13.43% and linear polarization at C-Band. It covers the frequency ranges from 5.18GHz–5.92GHz in 5.51GHz center frequency. This antenna can be easily fabricated on substrate material due to its small size and thickness. The results of characteristic antenna parameter in this paper indicate t hats the novel circular microstrip patch antenna with linear polarization can be used in C -Band frequency application and capable supporting satellite communication system. Keywords: circular patch, C-Band, linearly polarized, microstrip,
satellite communication Acknowledgment The authors would like to thank the Indonesian Ministry of Research, Technology and Higher Education through LPDP and PKPI (Sandwich-like) scholarships, Center for Environmental Remote Sensing (CEReS), Josaphat Tetuko Sri Sumantyo (JMRSL Chiba University), Promotor Yono Hadi Pramono and Mashuri (Physics Department, ITS Surabaya), and Ganesha University of Education. References 1. Artawan. Fabrikasi dan Karakterisasi Antena Mikrostrip Tapered Patch Untuk Aplikasi Antena
Panel Pada Frekuensi 2,4GHz. Tesis Magister, Jurusan Fisika, Fakultas Matematika dan Ilmu Pengetahuan Alam, Institut Teknologi Sepuluh Nopember (ITS), Surabaya, 2011.
2. Artawan, Hadi Pramono, Yono. Perancangan Antena Panel Mikrostrip Horn Array 2x2 Untuk
Komunikasi Wi-Fi Pada Frekuensi 2,4GHz. Prosiding Simposium Fisika Nasional (SFN), ITS, Surabaya, 2010.
330
3. Balanis, C.A. Antena Theory Analysis and Design. Second Edition, John Wiley and Sons, New York, 1997.
4. Edward, Terry. Foundation For Microstrip Circuit Design. Knaresborough England, 1991. 5. Shafai. Microstrip Antena Design Handbook. Profesor University Of Manitoba, Wimmipeg,
Canada, 2001. 6. Kraus, John, D. Electromagnetics. Third Edition, McGraw-Hill, New York, 1984. 7. Ohri, V, Amin, O, Gebremariam, H Dubois, B. Microwave Microstrip Horn Antena Design and
Test System. San Jose State University, 2003. 8. Masduki, K. Desain, Fabrikasi dan Karakterisasi Antena Mikrostrip Biquad dengan CPW
(Coplanar Waveguide) pada Frekuensi Kerja 2,4GHz. Program Magister Bidang Keahlian Optoelektronika Jurusan Fisika, FMIPA-ITS: Surabaya. 2009.
9. Hund, E. Microwave Communications, Component and Circuit. McGraw Hill, New York, 1989. 10. Hadi Pramono, Yono. Karakterisasi Antena Mikrostip Patch 3GHz Secara Simulasi FDTD (Finite
Difference Time Domain) Dan Eksperimen. Jurnal Fisika. Institut Teknologi Sepuluh Nopember. Surabaya, 2005.
11. Hadi Pramono,Yono. Prototipe Antenna Bi-Mikrostrip Tapered Patch dengan Dua Arah Pola
Radiasi Dan Satu Feeding Monopole Beroperasi Pada Freq.2,4GHz. Prosiding T.Informatika, UPN. Yogyakarta, 2009.
12. Hidayah, Ifa. Desain dan Fabrikasi Antena Bi-Mikrostrip Tapered Patch dengan Dua Arah
Radiasi dan Satu Feeding Monopole Untuk Komunikasi Wi-fi. Tesis Magister. Institut Tekologi Sepuluh Nopember. Surabaya, 2009.
13. Naqiah, Hawaun. Fabrikasi dan Karakterisasi Antena Mikrostrip Loopline untuk Komunikasi
Wireless Local Area Network (WLAN). Program Magister Bidang Keahlian Optoelektronika Jurusan Fisika FMIPA-ITS: Surabaya, 2009.
14. Risfaula, Erna. Antena Mikrostrip Panel Berisi 5 Larik Dipole dengan Feedline Koaksial
Waveguide untuk Komunikasi 2,4GHz. Program Keahlian Optoelektronika Jurusan Fisika FMIPA-ITS: Surabaya, 2011.
15. Haider Raad, “An UWB Antenna Array for Flexible IoT Wireless System,” Progress In Electromagnetics Research, Vol. 162, 109-121, 2018.
16. Kumar Dwivedi M, Srivastava Pragati. “Microstrip Patch Array Antenna for X-Band Application”. Antenna Test and Measurement Society (ATMS India-16), 01-03 Feb, 2016.
17. Ranjani M.N, Sivakumar B. “Analysis of Linearly and Circularly Polarized Microstrip Patch Antenna Array”. International Journal Of Electrical, Electronics And Data Communication, ISSN: 2320-2084, Volume-4, Issue-7, Jul.2016.
18. Reddy Vishnu Vardhana C, Rana Rahul. “Design Of Linearly Polarized Rectangular Microstrip Patch Antenna Using IE3D/PSO”. Thesis. Bachelor Technology in Electronics and Communication Engineering. Department of Electronics and Communication Engineering. National Institute of Technology. Rourkela. 2009.
19. Madhav, B.T.P, Sai Gupta, G, Rahul, M, Lahari Krishna, Sameera, M. “Linearly Polarized Microstrip Planar Filtenna for X and Ku Band Communication System”. Indian Journal of Science
and Technology, Vol. 9 (38), DOI:10.17485/ijst/2016/v9i38/97115, October. 2016.
331
International Conference on Natural Sciences, Mathematics, Applications, Research, and Technology
Manado, Indonesia, 22-23 October 2020
Grain Shape Analysis of the Volcanic Ash Particle from Soputan Volcano to Investigate Eruption Type Delpiero Tampenawas1, Maria Bobanto2, Dolfie Pandara3, Guntur Pasau4, Ferdi5, Verna Suoth6, Gilbert Abidjulu7, Richard Telleng8, Vivie Kaendung9
1,2,3,4,5,6,7,8,9 Physics Department, Sam Ratulangi University, INDONESIA. (E-mail: [email protected], [email protected], dpandara_fisika@unsrat,ac.id, [email protected], [email protected], [email protected], [email protected], [email protected], [email protected]) INTRODUCTION Volcanic ash showcases a diverse spectrum of shapes, each with different physical properties and behaviours ( Liu,2015 ).Those properties and behaviours are often linked with fragmentation process of the magma inside the volcano Thus, analyzing the shape of a volcanic ash can give us valuable information behind the magma formation and the eruption style of a volcano . This research are conducted in hope to find implication between volcanic ash grain size and the eruption style of mount Soputan. Sample from Mt.Soputan eruption are choosed because of the danger the mountain holds to the populated area that sorrounds it ( Kushendratno, 2012 ) Samples from three different eruption date are collected and being examined by image analysis software ImageJ to determine the shape parameters needed in order to find the eruption type. Manual observation are also conducted to support the result from software analysis. RESULTS AND DISCUSSION Results from the research conducted by using image analysis software ImageJ produces number of shape perimeters essential for determining eruption style such as area of particle, perime ter, width, height, ferret, roundness, and and solidity. The perimeter form factor obtained from manual calculation using area of particle and perimeter ( Schmit, 2017 ). The area size obtained from ImageJ processing showcases a wide range of size varying from the 140.076 to 223.034 μm2. The area size parameter obtained itself can not be the sole parameter to determine the type of eruption and thus needs to be compared with other parameters to be able to determine the type of eruption better. The numbers obtained from the shape parameter analysis and result from manual observation shows that most of the ash particle have blocky and blocky vesicular shape which implicates a phreatomagmatic eruption ( Shoji, 2018 ) . Phreatomagmatic are driven from thermal contraction of magma when it comes in contact with water. This temperature difference between the two causes violent water-lava interactions that make up the eruption. The products of phreatomagmatic eruptions are believed to be more regular in shape and finer grained than the products of magmatic eruptions because of the differences in eruptive mechanisms ( Heiken, 1985 ).
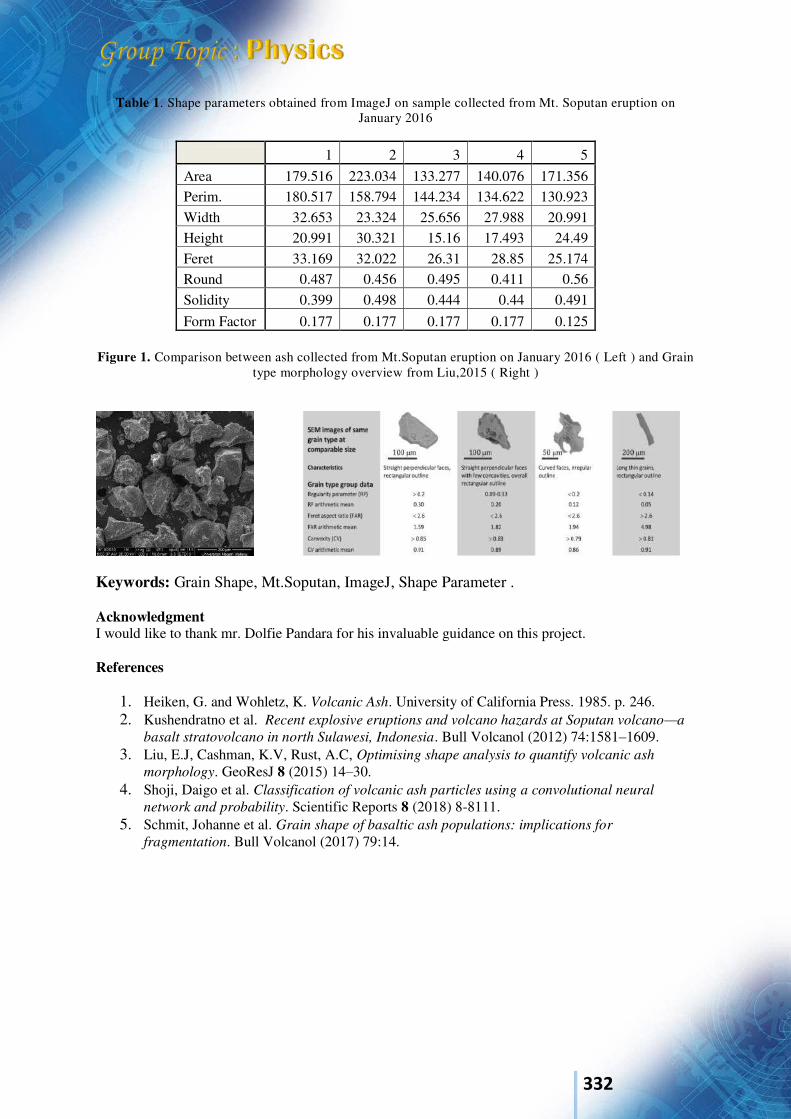
332
Table 1. Shape parameters obtained from ImageJ on sample collected from Mt. Soputan eruption on January 2016
1 2 3 4 5 Area 179.516 223.034 133.277 140.076 171.356 Perim. 180.517 158.794 144.234 134.622 130.923 Width 32.653 23.324 25.656 27.988 20.991 Height 20.991 30.321 15.16 17.493 24.49 Feret 33.169 32.022 26.31 28.85 25.174 Round 0.487 0.456 0.495 0.411 0.56 Solidity 0.399 0.498 0.444 0.44 0.491
Form Factor 0.177 0.177 0.177 0.177 0.125
Figure 1. Comparison between ash collected from Mt.Soputan eruption on January 2016 ( Left ) and Grain type morphology overview from Liu,2015 ( Right )
Keywords: Grain Shape, Mt.Soputan, ImageJ, Shape Parameter . Acknowledgment I would like to thank mr. Dolfie Pandara for his invaluable guidance on this project. References
1. Heiken, G. and Wohletz, K. Volcanic Ash. University of California Press. 1985. p. 246. 2. Kushendratno et al. Recent explosive eruptions and volcano hazards at Soputan volcano—a
basalt stratovolcano in north Sulawesi, Indonesia. Bull Volcanol (2012) 74:1581–1609. 3. Liu, E.J, Cashman, K.V, Rust, A.C, Optimising shape analysis to quantify volcanic ash
morphology. GeoResJ 8 (2015) 14–30. 4. Shoji, Daigo et al. Classification of volcanic ash particles using a convolutional neural
network and probability. Scientific Reports 8 (2018) 8-8111. 5. Schmit, Johanne et al. Grain shape of basaltic ash populations: implications for
fragmentation. Bull Volcanol (2017) 79:14.
333
International Conference on Natural Sciences, Mathematics, Applications, Research, and Technology
Manado, Indonesia, 22-23 October 2020
Characterization of Volcanic Ash from Explosive Eruption at Soputan Volcano Maria D. Bobanto1, Dolfie P Pandara2, Ferdy3, Guntur Pasau4, Delpiero Tampemawas5, and Gilbert Abidjulu6
1, 2,3,4,5,6 Physic’s Department, Sam Ratulangi University, Indonesia. (E-mail: [email protected], [email protected], [email protected], [email protected], [email protected], [email protected]) 1. INTRODUCTION
Mount Soputan is one of the most active basaltic volcanoes in Indonesia and a part of the Sempu-Soputan volcanic complex located south of the Tondano Caldera (Kushendratno et al., 2012). Mount Soputan eruptions can be explosive eruptions with ash columns can reach 13 km, the formation of ephemeral lava domes and in some cases pyroclastic flows with run outs of up to 5.5 km (Kunrat, 2017). Typical explosives for volcanoes with a basaltic magma composition are not common. Spectroscopic characterization of volcanic ash is expected to extract important information related to the character of the Soputan eruption. Microanalysis of the geochemical structure and composition of volcanic ash can provide an understanding of eruption-related processes such as mineralization, crystallization, vecularization and fragmentation (Minami et al., 2016; Pandara, 2017). The characterization of volcanic ash in this study focused on eruption ash samples on January 4, 2016, February 6, 2016 and October 3, 2018. Before characterizing ash particles are separated into three fractions: rough fraction (> 125 μm), medium (125 -70 μm), and fine (<70 μm). Furthermore, ash samples were characterised using X-ray difractometers (XRD), SEM-EDX and FTIR in the Central Laboratory of Malang State University.
2. RESULTS AND DISCUSSION
Results of the analysis and comparison of XRD spectral peaks state that Soputan ash contains several types of minerals namely olivine forsterite (Ol), diopside(Di), augite (Au), maghemite (Ma), alkali feldspar (Af), feldspar plagioclase (Fp), anorthite (An), allophane (Al) and amorfous phase as shown in Figure 1 (Kushendratno et al., 2012; Ndjock et al., 2020). The anorthite content as a plagioclase mineral in ash samples supports that Soputan magma is a new magma derived from a shallower magma storage (Preece et al.,2013). The spectral characteristics of XRD indicate that Soputan ash is microcrystal-rich ash which means magma from all three eruptions is also rich in crystals (Kushendratno et al., 2012). The crystal content in magma will increase the viscosity of magma (Kunrat, 2017) and can form crystalline tissues in liquid magma that will inhibit the growth of gas bubbles and encourage fragmentation (Namiki and Mango, 2008). EDX spectroscopy results indicate that Soputan magma is an alumina-rich basaltic magma (Kushendratno et al., 2012). The FTIR spectrum supports basaltic properties in the absence of Si–O and Al-O clusters in bands 1134 cm-1 and 989 cm-1, while the O-H group and the H-O-H clusters in bands 3388 cm-1 and 1527 cm-1 are related to the absence of water molecules in magma that represent vesicles in magma (Miwa and Toramaru, 2013). Sem photos confirm that the Soputan ash is a vesicular block type with a slight cavity. Soputan magma in the eruptions of January 2016, February 2016 and October 2018 is a more degassed magma due to the gas bubbles and rich crystals and comes from shallower areas ready to start a new explosive eruption (Kunrat, 2017).
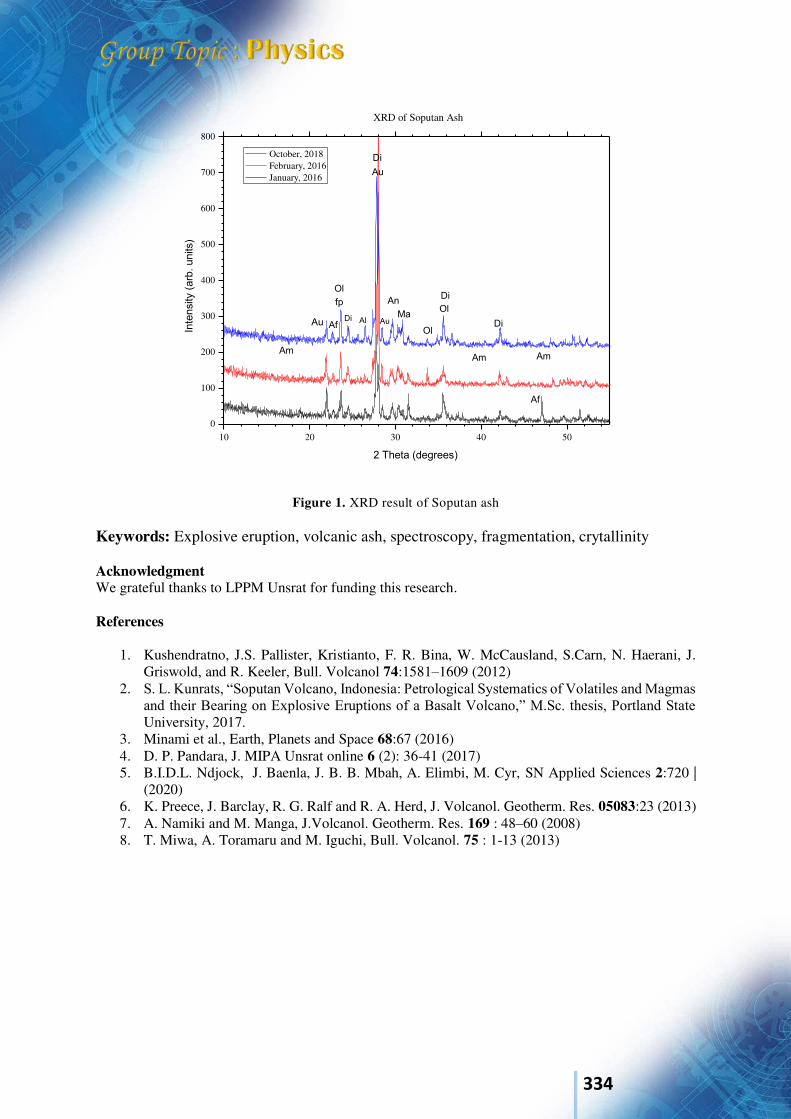
334
10 20 30 40 500
100
200
300
400
500
600
700
800
Ol
XRD of Soputan Ash
Inte
nsity (
arb
. units)
2 Theta (degrees)
October, 2018 February, 2016 January, 2016
Au Af
fp
Di Al
Di
Au
An
Ma
Ol
Di
Di
Af
AmAm
Ol
Am
Au
Figure 1. XRD result of Soputan ash
Keywords: Explosive eruption, volcanic ash, spectroscopy, fragmentation, crytallinity Acknowledgment We grateful thanks to LPPM Unsrat for funding this research. References
1. Kushendratno, J.S. Pallister, Kristianto, F. R. Bina, W. McCausland, S.Carn, N. Haerani, J. Griswold, and R. Keeler, Bull. Volcanol 74:1581–1609 (2012)
2. S. L. Kunrats, “Soputan Volcano, Indonesia: Petrological Systematics of Volatiles and Magmas and their Bearing on Explosive Eruptions of a Basalt Volcano,” M.Sc. thesis, Portland State University, 2017.
3. Minami et al., Earth, Planets and Space 68:67 (2016) 4. D. P. Pandara, J. MIPA Unsrat online 6 (2): 36-41 (2017) 5. B.I.D.L. Ndjock, J. Baenla, J. B. B. Mbah, A. Elimbi, M. Cyr, SN Applied Sciences 2:720 |
(2020) 6. K. Preece, J. Barclay, R. G. Ralf and R. A. Herd, J. Volcanol. Geotherm. Res. 05083:23 (2013) 7. A. Namiki and M. Manga, J.Volcanol. Geotherm. Res. 169 : 48–60 (2008) 8. T. Miwa, A. Toramaru and M. Iguchi, Bull. Volcanol. 75 : 1-13 (2013)
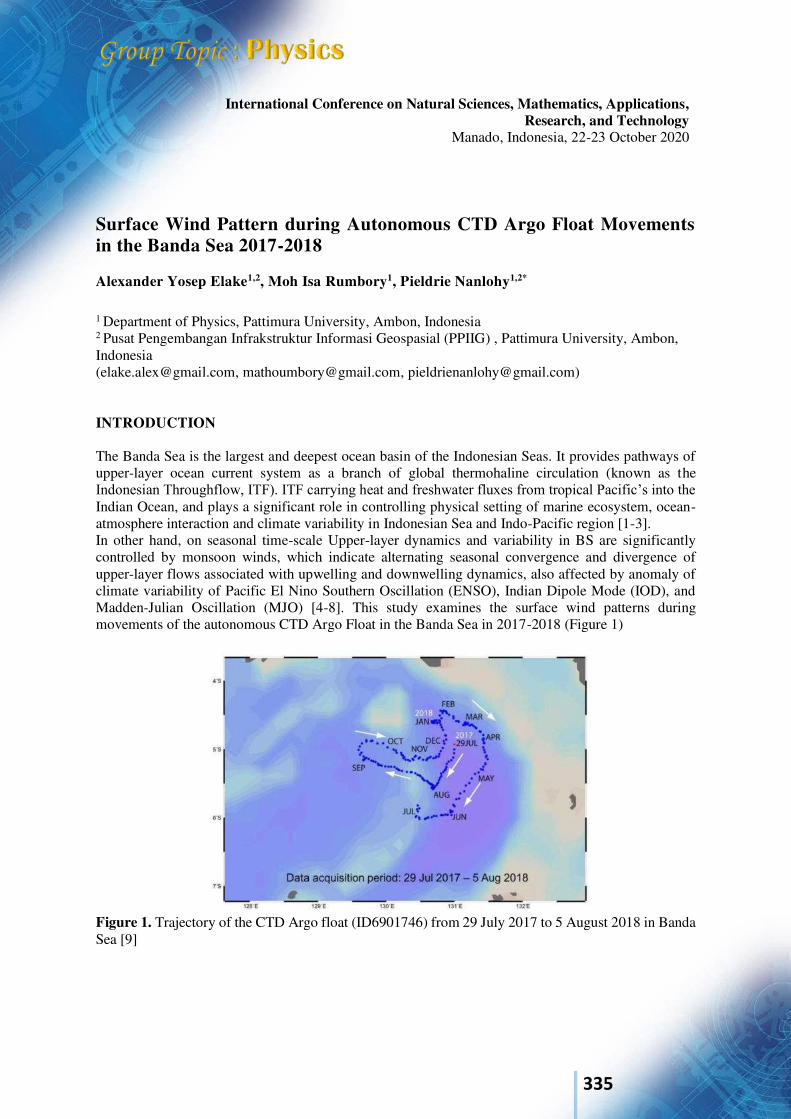
335
International Conference on Natural Sciences, Mathematics, Applications, Research, and Technology
Manado, Indonesia, 22-23 October 2020
Surface Wind Pattern during Autonomous CTD Argo Float Movements in the Banda Sea 2017-2018 Alexander Yosep Elake1,2, Moh Isa Rumbory1, Pieldrie Nanlohy1,2*
1 Department of Physics, Pattimura University, Ambon, Indonesia 2 Pusat Pengembangan Infrakstruktur Informasi Geospasial (PPIIG) , Pattimura University, Ambon, Indonesia ([email protected], [email protected], [email protected]) INTRODUCTION The Banda Sea is the largest and deepest ocean basin of the Indonesian Seas. It provides pathways of upper-layer ocean current system as a branch of global thermohaline circulation (known as the Indonesian Throughflow, ITF). ITF carrying heat and freshwater fluxes from tropical Pacific’s into the Indian Ocean, and plays a significant role in controlling physical setting of marine ecosystem, ocean-atmosphere interaction and climate variability in Indonesian Sea and Indo-Pacific region [1-3]. In other hand, on seasonal time-scale Upper-layer dynamics and variability in BS are significantly controlled by monsoon winds, which indicate alternating seasonal convergence and divergence of upper-layer flows associated with upwelling and downwelling dynamics, also affected by anomaly of climate variability of Pacific El Nino Southern Oscillation (ENSO), Indian Dipole Mode (IOD), and Madden-Julian Oscillation (MJO) [4-8]. This study examines the surface wind patterns during movements of the autonomous CTD Argo Float in the Banda Sea in 2017-2018 (Figure 1)
Figure 1. Trajectory of the CTD Argo float (ID6901746) from 29 July 2017 to 5 August 2018 in Banda Sea [9]
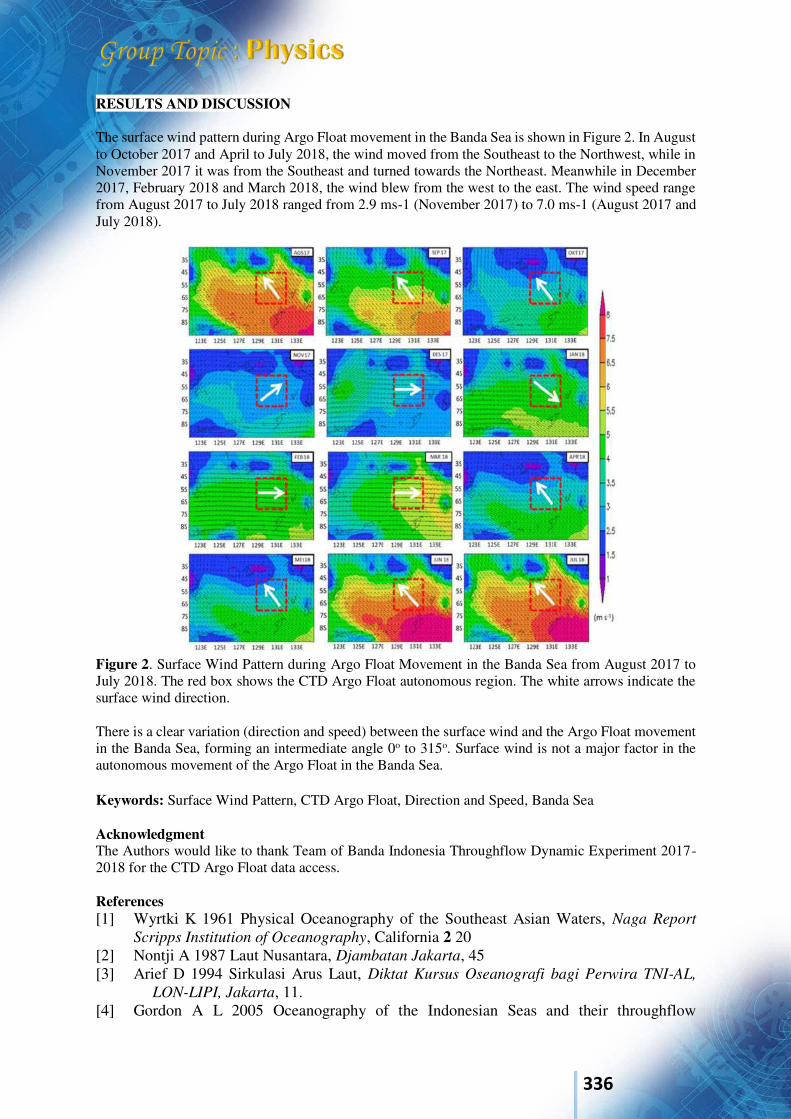
336
RESULTS AND DISCUSSION The surface wind pattern during Argo Float movement in the Banda Sea is shown in Figure 2. In August to October 2017 and April to July 2018, the wind moved from the Southeast to the Northwest, while in November 2017 it was from the Southeast and turned towards the Northeast. Meanwhile in December 2017, February 2018 and March 2018, the wind blew from the west to the east. The wind speed range from August 2017 to July 2018 ranged from 2.9 ms-1 (November 2017) to 7.0 ms-1 (August 2017 and July 2018).
Figure 2. Surface Wind Pattern during Argo Float Movement in the Banda Sea from August 2017 to July 2018. The red box shows the CTD Argo Float autonomous region. The white arrows indicate the surface wind direction. There is a clear variation (direction and speed) between the surface wind and the Argo Float movement in the Banda Sea, forming an intermediate angle 0o to 315o. Surface wind is not a major factor in the autonomous movement of the Argo Float in the Banda Sea. Keywords: Surface Wind Pattern, CTD Argo Float, Direction and Speed, Banda Sea Acknowledgment The Authors would like to thank Team of Banda Indonesia Throughflow Dynamic Experiment 2017-2018 for the CTD Argo Float data access. References [1] Wyrtki K 1961 Physical Oceanography of the Southeast Asian Waters, Naga Report
Scripps Institution of Oceanography, California 2 20 [2] Nontji A 1987 Laut Nusantara, Djambatan Jakarta, 45 [3] Arief D 1994 Sirkulasi Arus Laut, Diktat Kursus Oseanografi bagi Perwira TNI-AL,
LON-LIPI, Jakarta, 11. [4] Gordon A L 2005 Oceanography of the Indonesian Seas and their throughflow
337
Oceanography 4 14–27 [5] Atmadipoera A, Molcard R., Madec G, Wijffels S, Sprintall J, Koch-Larrouy A and
Supangat A 2009 Characteristics and variability of the Indonesian throughflow water at the outflow straits. Deep Sea Research Part I: Oceanographic Research Papers 11 1942–1954
[6] Gordon A L and Susanto R D 2001 Banda Sea surface-layer divergence, Ocean
Dynamics 52 2-10 [7] Horhoruw SM, Atmadipoera A, Nanlohy P, Nurjaya IW 2017 Anomaly of surface
circulation and Ekman transport in Banda Sea during ‘normal’ and ENSO episode (2008-2011), IOP Conf. Series: Earth and Environmental Sciences 54 1–10
[8] Balbeid N, Atmadipoera A S and Koropitan A F 2015 Response of Sea Surface Temperature (SST) and Chlorophyll-a on Madden Julian Oscillation (MJO) in Indonesian Seas JITKT 7 553-572
[9] Atmadipoera A, Prartono T, Jaya I, Nugroho D, Harsono G, Nanlohy P, Koch-Larrouy A 2019 Seasonal variaton of the upper-layer seawater properties in the Banda Sea: observed from an autonomous CTD Argo float, IOP Conf. Series: Earth and
Environmental Sciences 278 1–11
338
International Conference on Natural Sciences, Mathematics, Applications, Research, and Technology
Manado, Indonesia, 22-23 October 2020
Identify The Upwelling Area By Chlorophyl-A Variability, Sea Surface Temperature in Northern Sulawesi Waters through Ekman’s Transport Jullia Titaley*1, Kurniati Kemer2 and Pieldrie Nanlohy3,4
1Mathematics Department, Sam Ratulangi University, Indonesia. E-mail: [email protected] 2Marine Science Department, Sam Ratulangi University, Indonesia 3 Physics Department, Pattimura University, Indonesia 4 Pusat Pengembangan Infrakstruktur Informasi Geospasial (PPIIG) Ambon, Indonesia INTRODUCTION The waters of North Sulawesi (SL) are quite unique because they are part of the main axis of the Indonesian Through Flow (ITF) which carries the Pacific Ocean water mass to the Indian Ocean which has a strong current vector along its trajectory, has a cyclonic circulation in the southern part and anticyclonic. in the north. It is one of the relatively rich waters in Indonesia. That is because due to upwelling / downwelling and mixing of water masse [1]. Theoretically, the upwelling phenomenon is associated with Ekman pumping and Ekman transport which is generated by a stable and strong wind field and Ekman Transport plays an important role in transporting water masses far from the center of the upwelling area [2] . Besides Ekman transport, Ekman pumping which driven by the wind convergence or divergence increase local upwelling significantly [3][4][5]. Ekman pumping process moves wind divergence in surface water and lifted the water mass rise to surface. Compared to Ekman transport, Ekman pumping give the same or even greater contribution to the upwelling procces in many regions [4][5][6][7]. Driving factors of coastal upwelling is analyzed through Ekman transport and Ekman pumping values. Meanwhile, the impact of coastal upwelling is analyzed through the distribution of SST and chlorophylla concentration in surface water [8]. This study aims to understand the water mass character of North Sulawesi waters during upwelling and downwelling and to analyze upwelling and downwelling events in northern Sulawesi waters through the Ekman transport method. Sea surface temperature (SST) data, chlorophyll-a of the study area for 2003-2018 were downloaded from the website http: //oceancolor.gsfc.nasa.gov/ and analyzed so that a description of the surface conditions of North Sulawesi waters in average 2003-2018 was obtained. . Data of wind for the 2003-2018 research area came from the European Center for Medium Range Forecast (ECMWF) which was analyzed using the Ekman approach so that the Ekman transport value, vertical velocity, and Ekman depth were obtained. RESULTS AND DISCUSSION Distribution of average sea surface temperature around 29° C - 31° C and Chlorophyll-a around 0.3 mg / liter to 0.9 mg / liter in northern Sulawesi waters Evolution of SST over a span of a year and surface chlorophyll-a shows spatial and temporal changes SPL and Chlorophyll-a are related to the upwelling

339
process, but the changes are not too big. During the upwelling event the minimum SST value in the study area was recorded at around 290 C, on the other hand, surface chlorophyll-a reached a maximum value of around 0.4 mg / liter to 0.9 mg / liter which coincided with the eastern monsoon.
Upwelling analysis shows the average wind speed during the upwelling event on the north coast is around 3.5 m / s to 4.5 m / s. The value of vertical velocity during the upwelling event is 0.5 x 10⁻⁴ m / s to 1.5x 10⁻⁴ m / s with mass transport leaving the coast during upwelling around 1600 kg / ms to 4000 kg / s. Keywords: The Waters of North Sulawesi, Upwelling, Downwelling, Ekmans Transport Acknowledgment References
1. A. S. Atmadipoera and G. L. Mubarag, Struktur dan Variabilitas Arlindo di Laut Sulawesi
Jurnal Keautan Nasional, Vol 11, No. 3, 2016, pp. 159–174. 2. M. S. Horhoruw, A. S. Atmadipoera, P. Nanlohy, W. I. Nurjaya, Anomaly of surface
circulation and Ekman transporr in Banda Sea during ‘Normal’ and ENSO episode (2008-
2011). IOP Conference Series : Earth and Environmental Science, 2017. 3. Enriquez A G, Friehe C A 1995 Effects of wind stress and wind stress curl variability on
coastal upwelling J Phys Oceanogr 25 1651-1671 4. Pickett M H, Paduan J D 2003 Ekman transport and pumping in the California Current based
on the US Navy’s high-resolution at-mospheric model (COAMPS) Journal of Geophyscal Research: Oceans 108
5. Castelao R M, Barth J A 2006 Upwelling around Cabo Frio Brazil: The importance of wind stress curl Geophys Res Lett 33
6. Croquette M, Eldin G, Grados C, et al. 2007 On differences in satellite wind products and their effects in estimating coastal upwelling processes in the south-east pacific Geophys Res Lett 34
7. Jing Z Y, Qi Y Q, Hua Z L, Zhang H 2009 Numerical study on the summer upwelling system in the northern continental shelf of the South China Sea Continental Shelf Research 29 467-478
8. Yunwei Y, Zheng L, Changlin C 2015 Winter coastal upwelling off northwest Borneo in the South China Sea Acta Oceanol.Sin 34 3-10
340
International Conference on Natural Sciences, Mathematics, Applications, Research, and Technology
Manado, Indonesia, 22-23 October 2020
Preliminary Studi of CNT Growth Through Numerical Analysis of Microwave and Graphite Interaction in MWO Dolfie P Pandara1, Kawilarang W.A. Masengi2, Ping A. Angmalisang3, Gerald H. Tamuntuan4, Maria Bobanto5, Gilbert Abidjulu6 and Fingken Sagai7
1, 4,5,6,7 Phyics Deparment at Sam Ratulangi University, INDONESIA. (E-mail:, [email protected], [email protected], [email protected], [email protected], [email protected]) 2,3 Marine and Fishery Faculty, Sam Ratulangi University, INDONESIA. (E-mail: [email protected], [email protected]) INTRODUCTION The rapid growth of Carbon Nanotubes (CNT) using microwave radiation is a new, effective and inexpensive method of CNT synthesis for its wide application in various fields (Liu et al., 2019). The use of microwaves (MW) in CNT synthesis has several advantages, including the heating is uniform volumetric, internal, selective and without direct contact of the target mater ial with the heat source and does not require a high external voltage or heat source (Xiao, et al., 2012) . The implementation of CNT synthesis by microwave heating has been carried out using a Domestic Microwave Oven (MWO) (Asnawi et al., 2018). The interaction between microwaves and carbon-based target materials like as graphite greatly determines the CNT growth mechanism at low temperatures. The effectiveness of microwave heating can be understood if the distribution of the electric field in the MWO cavity and the heat conduction process due to microwave in the target material can be simulated. The implementation of Maxwell's equations and Fourier equations in numerical form can simulate heat distribution in target materials such as graphite (Zhang et al. , 2018; Du et al., 2019). RESULTS AND DISCUSSION Graphite is one of potentially carbon sources for CNT synthesis. Numerical simulation of heating MW on graphite was carried out using the Comsol 5.5 trial version software. The physical parameters of graphite used are a density of 2260 kg/m3, a heat capacity of 707 J/(kg.K), a thermal conductivity of around 25 - 470 W/(mK), an electrical conductivity of 2.85 S/m, a relative permeability of 1 and the complex relative permittivity is 15-131j*.The simulation results show that heating with microwaves starts at the center of mass of the graphite and then evolves towards the outer part. Figure 1 shows the distribution of the electric field and temperature at 100 seconds after heating. The temperature increase in graphite occurs exponentially where in 100 s the temperature of the graphite becomes around 5300C in the inner and outer parts of around 5200C. The temperature increase in a short time is very suitable for the rapid growth of CNTs.

341
a.Electric field distribution at 100 s b. Temperature distribution at 100 s
Figure 1. Electric field and temperature distribution
Keywords: Heat simulation, microwave, carbon nanotubes, graphite Acknowledgment We grateful thanks to Physics Department at Unsrat for supporting this research. References
1. Y. Liu, N. Guo, P. Yin, C. Zhang, Nanoscale Adv. 1: 4546–4559 (2019) 2. H. Xiao, H. Peng, S. Deng, X. Yang, Y. Zhang, Y. Li, Bioresour. Technol. 111: 127–133
(2012) 3. M. Asnawi, S. Azhari , M. N. Hamidon, I. Ismail, and I. Helina.. J. of Nanomaterials 2: 1-5.
2018 4. Z. Zhang, T. Su, and S. Zhang, Hindawi, J. of Food Quality. Vol. 2018, Article ID 9169875: 1-
24 (2018) 5. Z. Du, Z. Wu, W. Gan, G. Liu, X.Z.J. Liu and B. Zeng, IEEE 7 : 184726- 184733 (2019)
342
International Conference on Natural Sciences, Mathematics, Applications, Research, and Technology
Manado, Indonesia, 22-23 October 2020
Utilization of cattle waste as raw material for making biogas as fuel intended to Bailang slaughterhouse power plant Glanny M C Mangindaan*1, Lily S Patras1, A Haris J O1
1Department of electrical engineering, Faculty of engineering, Sam Ratulangi University, Indonesia (E-mail: [email protected]) INTRODUCTION The applied biogas technology for processing cattle waste to generate electricity. Using this technology with naturally available microorganisms for processing of various organic waste from slaughterhouse placed in an anaerobic room. As well as the results of waste processing according to the concept of the result will be a product that is useful as biogas, good quality of solid and liquid organic fertilizers. The interesting thing about biogas technology is its ability to produce biogas from cattle rumen waste, the amount of which depends on the number of cows to be slaughtered. Variations in biochemical properties cause biogas production to also vary. Any number of organic matter can be used together with some requirements for gas production or normal growth of suitable methane bacteria. Another advantage of biogas energy is that it can replace fuel, especially kerosene or LPG, through an outlet that can be used directly for cooking. In addition, the biogas production process produced from the biogas digestion tank can be used as organic fertilizer either in the form of solids or liquids. Utilization of waste from ordinary biogas digester as fertilizer can increase plant production. This differs from chemical and synthetic fertilizers which in continuously use can reduce crop production. Another advantage is that the fertilizer produced does not cause residues in fields. RESULTS AND DISCUSSION In the research conducted, it was found that the cattle waste used as the raw material for making biogas at the research location at the slaughterhouse location. Numbers of cattle of slaughterhouse in Bailang there are about 16 cows. A cow can produce 10 kg of waste, and can produce 0.47 m3 per day of biogas, so that if calculated, the biogas produced from the cattle farm is 3.29 m3 per week. The income for gas production for 1 month if calculated as per week is 13.16 m3 of biogas. Keywords: biogas, power plant, slaughterhouse. References
1. Arifin, M., Saepudin, A., Santosa, A., 2011. Kajian Biogas Sebagai Sumber Pembangkit Tenaga Listrik di Pesantren Saung Balong Al-Barokah, Majalengka, Jawa Barat. Journal of Mechatronics, Electrical Power, and Vehicular Technology, 2(2), 73-78.
2. Fitriyah, Q., Irawan, D., Wahyudi, M.P.E., 2018. Pembangkit Listrik Tenaga Biogas dengan Digester Tipe Balon di Peternakan Sei Temiang Batam. Jurnal Integrasi 2(10), 64-67.
3. Hambali, E., Mujdalifah, S., Tambunan, A.H., 2007. Teknologi Bioenergi. Jakarta: Agro Media Pustaka
4. Harikishan, S., 2008. Biogas Processing and Utilization as an Energy Source. In: Khanal, Samir Khumal (ed). Anaerobic for Bioenergy Production. Iowa: Wiley-Blackwell, 267-291.
343
International Conference on Natural Sciences, Mathematics, Applications, Research, and Technology
Manado, Indonesia, 22-23 October 2020
Propagation and Model of Tsunami Wave in Lembeh Strait, North Sulawesi, Generated by an Earthquake in the Molucca Sea Gerald H. Tamuntuan*1, Brian B. Mambu1, Guntur Pasau1, Agnes T. Mandagi2, Dolfie P. Pandara1, and Ferdy1
1Physics Department, Faculty of Mathematics and Natural Sciences, Sam Ratulangi University, INDONESIA. (E-mail: [email protected], [email protected], [email protected], [email protected], [email protected]) 2Department of Civil Engineering, Faculty of Engineering, Sam Ratulangi University, INDONESIA. (E-mail: [email protected]) INTRODUCTION One of the regions with a high seismic intensity in Indonesia is Sulawesi and its surroundings, including the Molucca Sea [1]. Submarine earthquakes that occurred in the double subduction zone of Molucca Sea often potentially trigger a tsunami [2]. Bitung is one of the important port cities in Indonesia which is not directly facing the Molucca Sea due to the existence of Lembeh Island. The characteristics of tsunami wave in the Lembeh Strait, a strait between Lembeh Island and Bitung City, has never been studied before. The purpose of this study was to analyze the propagation and model of tsunami wave in Lembeh Strait generated by an earthquake in the Molucca Sea. Modeling was performed by using TUNAMI-N2 [3]. RESULTS AND DISCUSSION Tsunami modeling with TUNAMI-N2 was assumed to be triggered by an earthquake with a magnitude of 8 SR at the coordinates 125.925 E and 1.221 N. The findings of this modeling indicate that the tsunami arrival time in the Bitung area (tide gauge 1) was approximately 810 seconds after the earthquake. The wave height reach around 17 m in the area facing directly to the Molucca Sea, while the wave height in the part of Bitung city along the Lembeh Strait was only about 4.8 to 11.6 m (Figure 1). Due to interference events, the tsunami wave model along the Lembeh Strait has different characteristics from those occurring outside the strait. Water level fluctuations along the strait remained above the still water level for a longer time, indicating that parts of the city around the strait would be inundated for longer (Figure 2). Keywords: Lembeh strait, Molucca sea double collision zone, tsunami simulation References
1. A. Abu Bakar, D. Mardiatno and M.A. Marfai, Arab J Geosci 10, 553 (2017). https://doi.org/10.1007/s12517-017-3286-4A.
2. L. Hamzah, N.T. Puspito and F. Imamura, Journal of Natural Disaster Science 22(1), 25-43 (2000).
3. F. Imamura, A.C. Yalciner and G. Ozyurt. Tsunami Modelling Manual (TUNAMI) (Tohoku University, Japan, 2006).
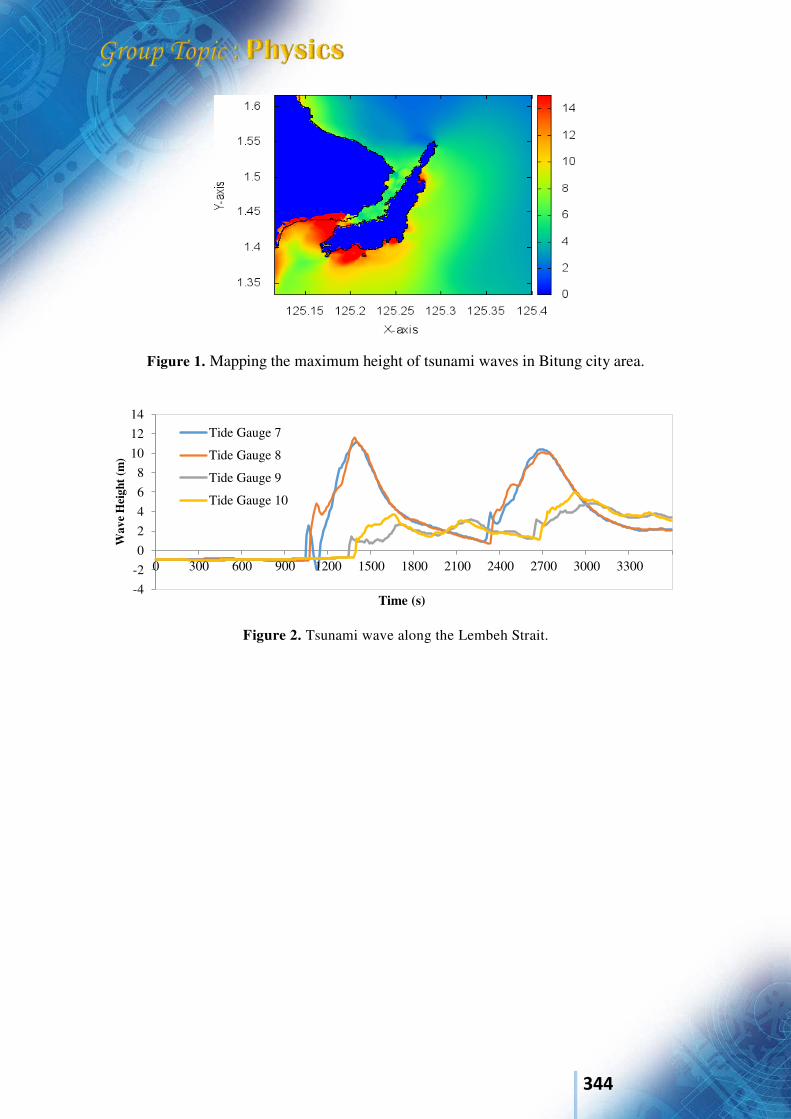
344
Figure 1. Mapping the maximum height of tsunami waves in Bitung city area.
Figure 2. Tsunami wave along the Lembeh Strait.
-4
-2
0
2
4
6
8
10
12
14
0 300 600 900 1200 1500 1800 2100 2400 2700 3000 3300
Wav
e H
eigh
t (m
)
Time (s)
Tide Gauge 7
Tide Gauge 8
Tide Gauge 9
Tide Gauge 10
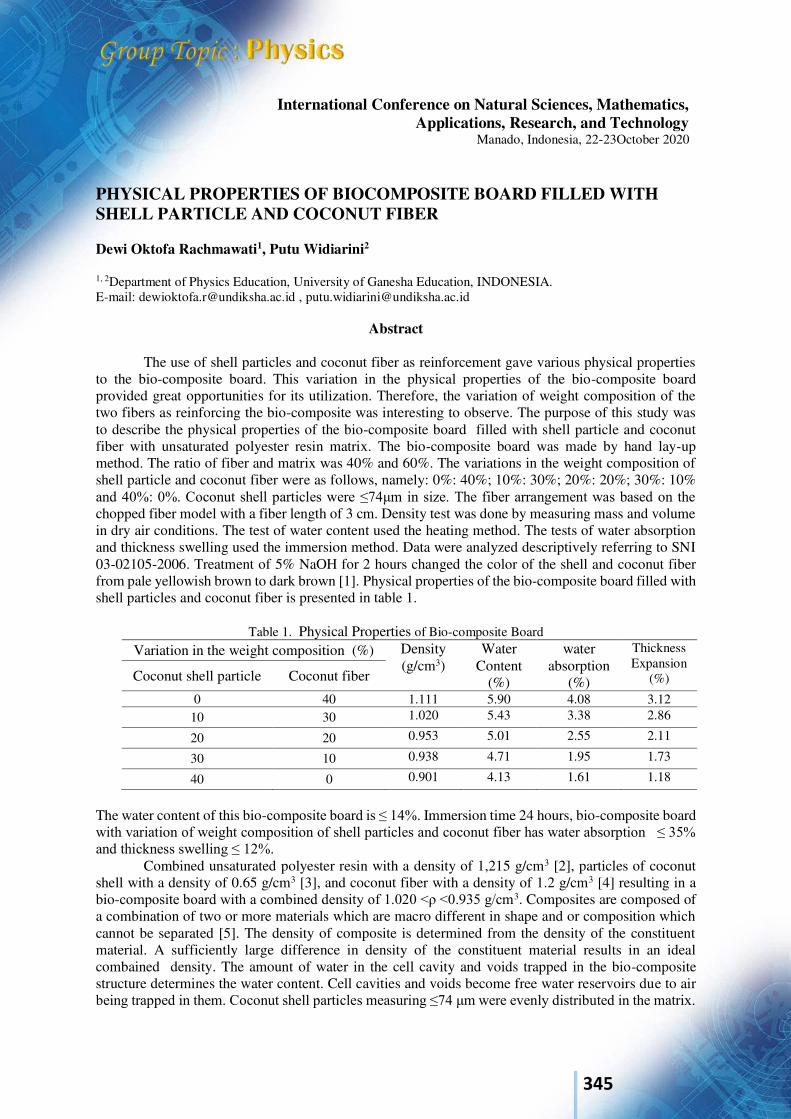
345
International Conference on Natural Sciences, Mathematics, Applications, Research, and Technology
Manado, Indonesia, 22-23October 2020
PHYSICAL PROPERTIES OF BIOCOMPOSITE BOARD FILLED WITH SHELL PARTICLE AND COCONUT FIBER Dewi Oktofa Rachmawati1, Putu Widiarini2
1, 2Department of Physics Education, University of Ganesha Education, INDONESIA. E-mail: [email protected] , [email protected]
Abstract
The use of shell particles and coconut fiber as reinforcement gave various physical properties to the bio-composite board. This variation in the physical properties of the bio-composite board provided great opportunities for its utilization. Therefore, the variation of weight composition of the two fibers as reinforcing the bio-composite was interesting to observe. The purpose of this study was to describe the physical properties of the bio-composite board filled with shell particle and coconut fiber with unsaturated polyester resin matrix. The bio-composite board was made by hand lay-up method. The ratio of fiber and matrix was 40% and 60%. The variations in the weight composition of shell particle and coconut fiber were as follows, namely: 0%: 40%; 10%: 30%; 20%: 20%; 30%: 10% and 40%: 0%. Coconut shell particles were ≤74μm in size. The fiber arrangement was based on the chopped fiber model with a fiber length of 3 cm. Density test was done by measuring mass and volume in dry air conditions. The test of water content used the heating method. The tests of water absorption and thickness swelling used the immersion method. Data were analyzed descriptively referring to SNI 03-02105-2006. Treatment of 5% NaOH for 2 hours changed the color of the shell and coconut fiber from pale yellowish brown to dark brown [1]. Physical properties of the bio-composite board filled with shell particles and coconut fiber is presented in table 1.
Table 1. Physical Properties of Bio-composite Board Variation in the weight composition (%) Density
(g/cm3) Water
Content (%)
water absorption
(%)
Thickness Expansion
(%) Coconut shell particle Coconut fiber
0 40 1.111 5.90 4.08 3.12 10 30 1.020 5.43 3.38 2.86
20 20 0.953 5.01 2.55 2.11
30 10 0.938 4.71 1.95 1.73
40 0 0.901 4.13 1.61 1.18
The water content of this bio-composite board is ≤ 14%. Immersion time 24 hours, bio-composite board with variation of weight composition of shell particles and coconut fiber has water absorption ≤ 35% and thickness swelling ≤ 12%. Combined unsaturated polyester resin with a density of 1,215 g/cm3 [2], particles of coconut shell with a density of 0.65 g/cm3 [3], and coconut fiber with a density of 1.2 g/cm3 [4] resulting in a bio-composite board with a combined density of 1.020 <ρ <0.935 g/cm3. Composites are composed of a combination of two or more materials which are macro different in shape and or composition which cannot be separated [5]. The density of composite is determined from the density of the constituent material. A sufficiently large difference in density of the constituent material results in an ideal combained density. The amount of water in the cell cavity and voids trapped in the bio-composite structure determines the water content. Cell cavities and voids become free water reservoirs due to air being trapped in them. Coconut shell particles measuring ≤74 μm were evenly distributed in the matrix.
346
Increasing the weight of coconut shell particles decreased the number of cell cavities and voids. The lignocellulose content of coconut fiber is greater than coconut shell particle [3,4]. The hygroscopic nature of lignocellulose has the ability to absorb water. Small amounts of unsaturated polyester resin cannot completely wet or coat the entire surface of the coconut fiber. The fibers are not perfectly adhered to one another. Unsaturated polyester resin also absorbs water because its ester groups can bind water. The absorption of water by the fibers is great when soaking. The fibers in the high-density bio-composite board receive the most pressure when pressing. The cavity of the fiber cells shrink as a result of applying pressure. Unsaturated polyester resin is unable to enter the very small fiber cavities during the pressing process. If the coconut fiber is not fully bonded to other fibers, it makes it easier for the fibers to break free from the remaining pressure. During immersion, the absorption of water by lignocellulose causes fiber recovery. The cell wall or fiber cavity size expands to its original dimension. The moisture content, water absorption capacity and thickness expansion of this bio-composite board corresponding with SNI of number: 03-02105-2006 Key words: density, water content, thickness expansion, water absorption Acknowledgment Thank you to University of Ganesha Education, the basic physics laboratory of the S1 Physics Education study program, for their funding and facilities on this research. Specials thanks to Iwan Suswandi for helpful comments on this paper. References [1] L. Mishra and G. Basu, “Coconut fiber : its structure, properties and applications”, Handbook of
Natural Fibers-Volume 1: Types, Properties and Factors Affecting Breeding and Cultivation (Woodhead, Kolkata,2020), pp.1-26.
[2] P. N. E. Naveen and R. V. Prasad, 2013, “Evaluation Of Mechanical Properties Of Coconut Coir/Bamboo Fiber Reinforced Polymer Matrix Composites”, International Journal of Metallurgical & Material Science and Engineering, pp. 15-22.
[3] Suhardiyono L, “Coconut Plant, Cultivation and Utilization”, (Kanisius, Yogyakarta, 1988), pp.153-156.
[4] _____, “The Encyclopedia of wood”, (Sterling, 1980), pp. 68-75. [5] Schwartz M.M, “Composite Materials Handbook”, (McGraw-Hill, New York, 1984), pp. 14.
347
International Conference on Natural Sciences, Mathematics, Applications, Research, and Technology
Manado, Indonesia, 22-23 October 2020
Increasing Antraquinone Compound on Callus Stem of Morinda citrifolia (L.) using Chitosan Elicitor of Shell Shrimps (Penaeus monodon) as Alternative Provicion Medicine W Purwianingsih1, A Rahmat2, I Asrinah3 1Department of Biology Education, Faculty of Mathematics and Science Education Universitas Pendidikan Indonesia, Bandung, Indonesia (E-mail: [email protected]) 2Department of Biology Education, Faculty of Mathematics and Science Education Universitas Pendidikan Indonesia, Bandung, Indonesia ([email protected]) Corresponding author: [email protected] INTRODUCTION Morinda citrifolia (L.) or noni is a medicinal plant that has potential to produce many bioactive compounds. Among the bioactive compounds produced by these plants, anthraquinone is one of the important compounds because it is widely used in industry and medicine. The important role and requirements of these compounds encourage the development of effective and efficient methods of producing these compounds. One of the methods that can be used as an alternative to producing medicinal compounds, especially in the form of secondary metabolites, is tissue culture method, in this case the elicitation method. Elicitation can use a biotic elicitor in the form of chitosan which can be obtained from the shell shrimp (Panaeus monodon). The aim of this study was to increase the secondary metabolite content of anthraquinones on callus stem of Morinda citrifolia using elicitation method. M.
citrifolia callus derived from explants of young stems grown on Murashige and Skoog (MS) medium with addition of 2,4-D 1.75 ppm and kinetin 1.5 ppm. The elicitor concentration used was 0.25; 0.5; 0.75; 1 mg / ml and control (0 mg / ml). The elicitation times used were 0, 2, 4, and 6 days after elicitation. Analysis of anthraquinone content was carried out using a spectrophotometer RESULTS AND DISCUSSION Callus was successfully grown in Murashige and Skoog (MS) media with the addition of ZPT 2.4 D 1.75 mg / L and Kinetin 1.5 mg / L, as shown in Figure 3.1. Many studies have been carried out, as reported [1] that with the addition of 2.4-D growth regulators can stimulate callus growth and cell enlargement in explants so as to trigger callus formation. This is also reinforced by [2] that auxin can induce callus formation which begins with the process of dedifferentiation and cytokines can induce callus by cell division and cell differentiation. Callus is formed, then subculture on the same medium and after 2 weeks of callus when is ready to be elicitate. Along with preparing callus for elicitation, also prepared the elicitor form of chitosan. Callus before and after elicitation can be seen in Figure 3.2. The callus color of M. citrifolia (L.) without elicitor was not changed, while the callus that was quenched experienced a slight change. Callus undergoes browning along with increased elicitor concentration and elicitation. According [3], elicitated callus was darker (brown / yellowish) (Figure 3.2). This is thought to be a hypersensitive response shown by the tissue due to stress. According [4], hypersensitivity response is a good mechanism to limit the spread of pathogens. This hypersensitive response is a mechanism to kill cells infected with pathogens (in this case the elicitor) so as not to spread to other cells. After experiencing elicitation, the callus is then harvested according to the harvesting time determined, then the anthraquinone content is analysed. The results of the measurement of anthraquinone content in elicitation callus can be seen in Table 3.1.
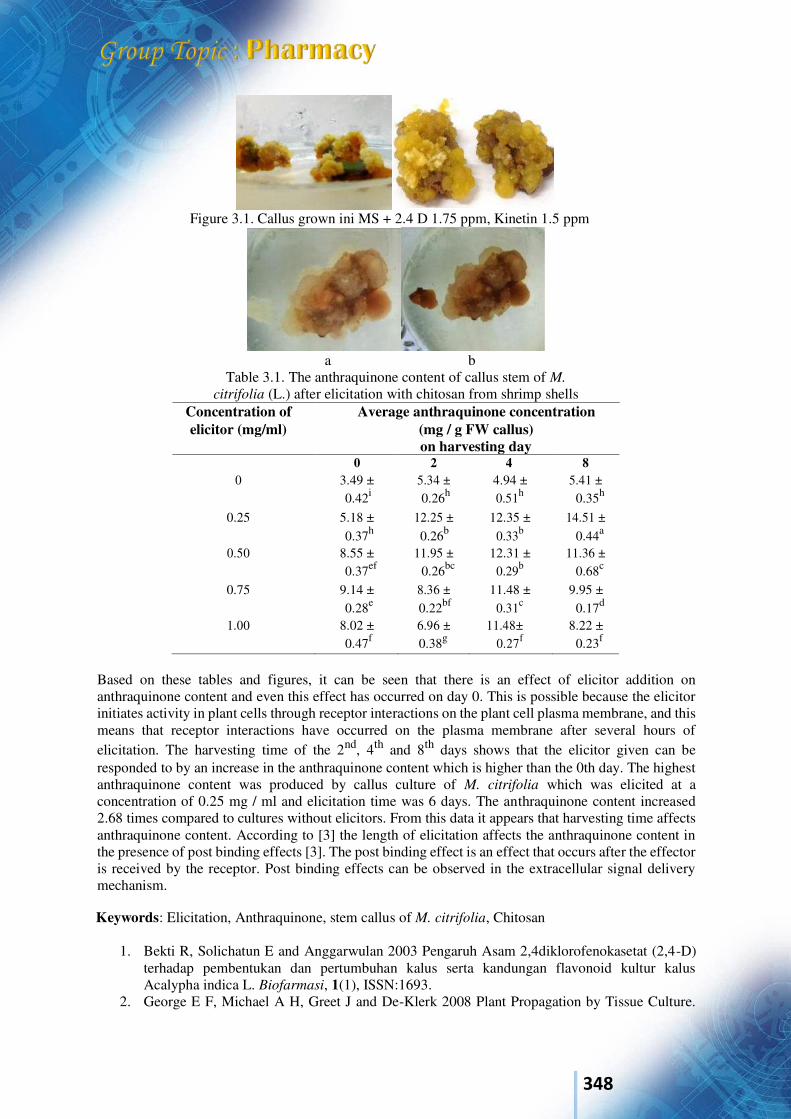
348
Figure 3.1. Callus grown ini MS + 2.4 D 1.75 ppm, Kinetin 1.5 ppm
a b
Table 3.1. The anthraquinone content of callus stem of M.
citrifolia (L.) after elicitation with chitosan from shrimp shells Concentration of Average anthraquinone concentration elicitor (mg/ml) (mg / g FW callus)
on harvesting day 0 2 4 8
0 3.49 ± 5.34 ± 4.94 ± 5.41 ± 0.42i 0.26h 0.51h 0.35h
0.25 5.18 ± 12.25 ± 12.35 ± 14.51 ± 0.37h 0.26b 0.33b 0.44a
0.50 8.55 ± 11.95 ± 12.31 ± 11.36 ± 0.37ef 0.26bc 0.29b 0.68c
0.75 9.14 ± 8.36 ± 11.48 ± 9.95 ± 0.28e 0.22bf 0.31c 0.17d
1.00 8.02 ± 6.96 ± 11.48± 8.22 ± 0.47f 0.38g 0.27f 0.23f
Based on these tables and figures, it can be seen that there is an effect of elicitor addition on anthraquinone content and even this effect has occurred on day 0. This is possible because the elicitor initiates activity in plant cells through receptor interactions on the plant cell plasma membrane, and this means that receptor interactions have occurred on the plasma membrane after several hours of elicitation. The harvesting time of the 2nd, 4th and 8th days shows that the elicitor given can be responded to by an increase in the anthraquinone content which is higher than the 0th day. The highest anthraquinone content was produced by callus culture of M. citrifolia which was elicited at a concentration of 0.25 mg / ml and elicitation time was 6 days. The anthraquinone content increased 2.68 times compared to cultures without elicitors. From this data it appears that harvesting time affects anthraquinone content. According to [3] the length of elicitation affects the anthraquinone content in the presence of post binding effects [3]. The post binding effect is an effect that occurs after the effector is received by the receptor. Post binding effects can be observed in the extracellular signal delivery mechanism. Keywords: Elicitation, Anthraquinone, stem callus of M. citrifolia, Chitosan
1. Bekti R, Solichatun E and Anggarwulan 2003 Pengaruh Asam 2,4diklorofenokasetat (2,4-D) terhadap pembentukan dan pertumbuhan kalus serta kandungan flavonoid kultur kalus Acalypha indica L. Biofarmasi, 1(1), ISSN:1693.
2. George E F, Michael A H, Greet J and De-Klerk 2008 Plant Propagation by Tissue Culture.

349
(Netherland: Springer). 3. Sitinjak M A, Maayta N I and Siti F 2015 Induksi Eksplan Daun keladi Tikus (Typhonium sp.)
dengan Perlakuan 2.4-D dan kinetin.ISBN, 32. 4. Wojtaszek P 1997 Oxidative Burst: An Early Plant Response to Pathogen Infection. Biochem
Journal 322 681-692.
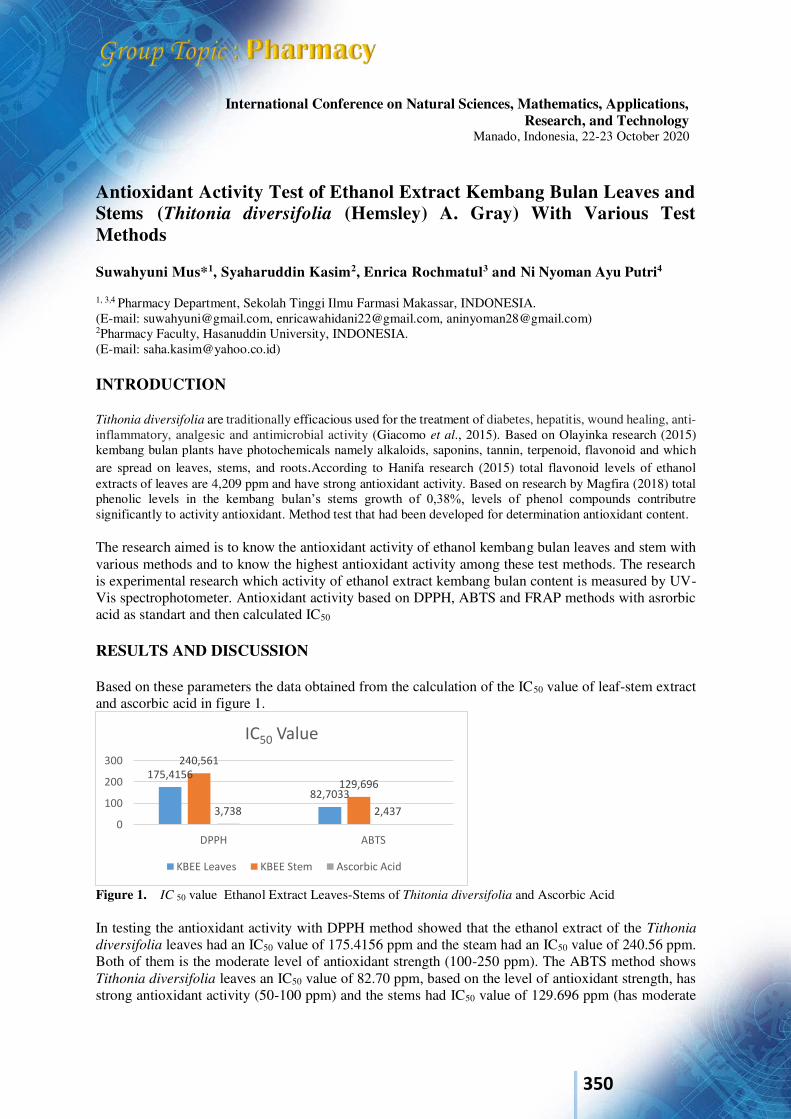
350
International Conference on Natural Sciences, Mathematics, Applications, Research, and Technology
Manado, Indonesia, 22-23 October 2020
Antioxidant Activity Test of Ethanol Extract Kembang Bulan Leaves and Stems (Thitonia diversifolia (Hemsley) A. Gray) With Various Test Methods Suwahyuni Mus*1, Syaharuddin Kasim2, Enrica Rochmatul3 and Ni Nyoman Ayu Putri4
1, 3,4 Pharmacy Department, Sekolah Tinggi Ilmu Farmasi Makassar, INDONESIA. (E-mail: [email protected], [email protected], [email protected]) 2Pharmacy Faculty, Hasanuddin University, INDONESIA. (E-mail: [email protected]) INTRODUCTION Tithonia diversifolia are traditionally efficacious used for the treatment of diabetes, hepatitis, wound healing, anti-inflammatory, analgesic and antimicrobial activity (Giacomo et al., 2015). Based on Olayinka research (2015) kembang bulan plants have photochemicals namely alkaloids, saponins, tannin, terpenoid, flavonoid and which are spread on leaves, stems, and roots.According to Hanifa research (2015) total flavonoid levels of ethanol extracts of leaves are 4,209 ppm and have strong antioxidant activity. Based on research by Magfira (2018) total phenolic levels in the kembang bulan’s stems growth of 0,38%, levels of phenol compounds contributre significantly to activity antioxidant. Method test that had been developed for determination antioxidant content. The research aimed is to know the antioxidant activity of ethanol kembang bulan leaves and stem with various methods and to know the highest antioxidant activity among these test methods. The research is experimental research which activity of ethanol extract kembang bulan content is measured by UV-Vis spectrophotometer. Antioxidant activity based on DPPH, ABTS and FRAP methods with asrorbic acid as standart and then calculated IC50 RESULTS AND DISCUSSION Based on these parameters the data obtained from the calculation of the IC50 value of leaf-stem extract and ascorbic acid in figure 1.
Figure 1. IC 50 value Ethanol Extract Leaves-Stems of Thitonia diversifolia and Ascorbic Acid In testing the antioxidant activity with DPPH method showed that the ethanol extract of the Tithonia
diversifolia leaves had an IC50 value of 175.4156 ppm and the steam had an IC50 value of 240.56 ppm. Both of them is the moderate level of antioxidant strength (100-250 ppm). The ABTS method shows Tithonia diversifolia leaves an IC50 value of 82.70 ppm, based on the level of antioxidant strength, has strong antioxidant activity (50-100 ppm) and the stems had IC50 value of 129.696 ppm (has moderate
175,4156
82,7033
240,561
129,696
3,738 2,437
0
100
200
300
DPPH ABTS
IC50 Value
KBEE Leaves KBEE Stem Ascorbic Acid
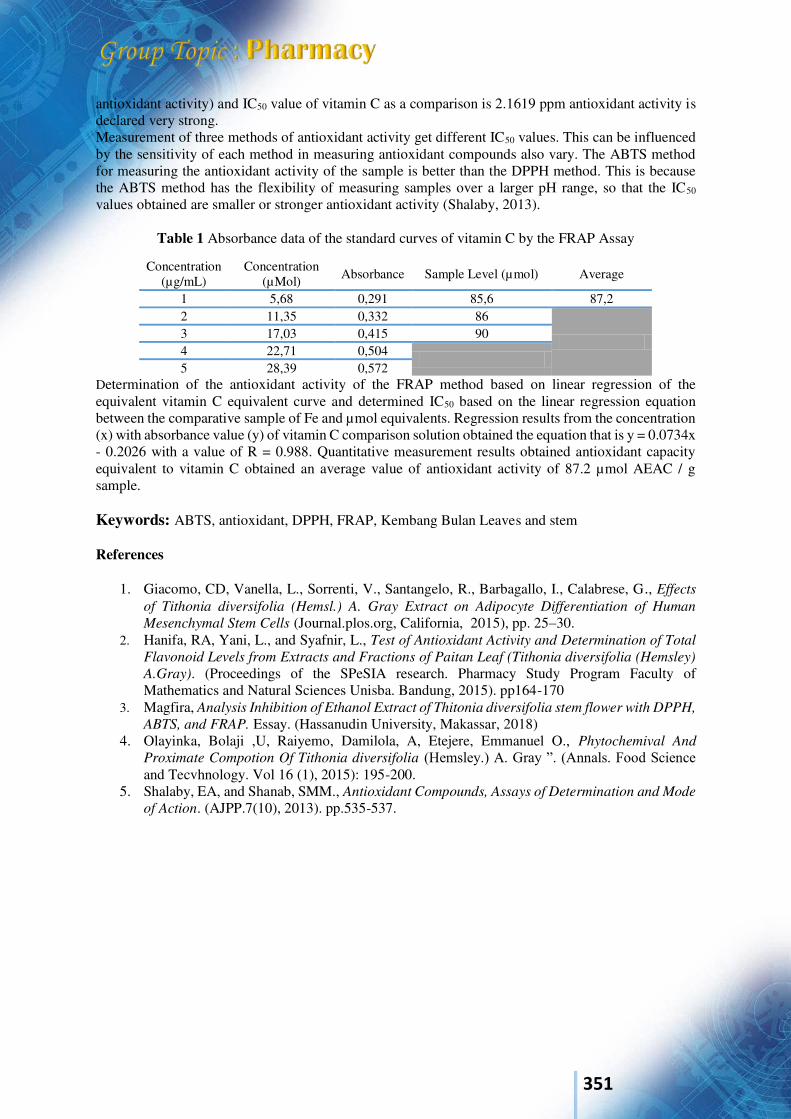
351
antioxidant activity) and IC50 value of vitamin C as a comparison is 2.1619 ppm antioxidant activity is declared very strong. Measurement of three methods of antioxidant activity get different IC50 values. This can be influenced by the sensitivity of each method in measuring antioxidant compounds also vary. The ABTS method for measuring the antioxidant activity of the sample is better than the DPPH method. This is because the ABTS method has the flexibility of measuring samples over a larger pH range, so that the IC50 values obtained are smaller or stronger antioxidant activity (Shalaby, 2013).
Table 1 Absorbance data of the standard curves of vitamin C by the FRAP Assay
Determination of the antioxidant activity of the FRAP method based on linear regression of the equivalent vitamin C equivalent curve and determined IC50 based on the linear regression equation between the comparative sample of Fe and µmol equivalents. Regression results from the concentration (x) with absorbance value (y) of vitamin C comparison solution obtained the equation that is y = 0.0734x - 0.2026 with a value of R = 0.988. Quantitative measurement results obtained antioxidant capacity equivalent to vitamin C obtained an average value of antioxidant activity of 87.2 µmol AEAC / g sample. Keywords: ABTS, antioxidant, DPPH, FRAP, Kembang Bulan Leaves and stem
References
1. Giacomo, CD, Vanella, L., Sorrenti, V., Santangelo, R., Barbagallo, I., Calabrese, G., Effects
of Tithonia diversifolia (Hemsl.) A. Gray Extract on Adipocyte Differentiation of Human
Mesenchymal Stem Cells (Journal.plos.org, California, 2015), pp. 25–30. 2. Hanifa, RA, Yani, L., and Syafnir, L., Test of Antioxidant Activity and Determination of Total
Flavonoid Levels from Extracts and Fractions of Paitan Leaf (Tithonia diversifolia (Hemsley)
A.Gray). (Proceedings of the SPeSIA research. Pharmacy Study Program Faculty of Mathematics and Natural Sciences Unisba. Bandung, 2015). pp164-170
3. Magfira, Analysis Inhibition of Ethanol Extract of Thitonia diversifolia stem flower with DPPH,
ABTS, and FRAP. Essay. (Hassanudin University, Makassar, 2018) 4. Olayinka, Bolaji ,U, Raiyemo, Damilola, A, Etejere, Emmanuel O., Phytochemival And
Proximate Compotion Of Tithonia diversifolia (Hemsley.) A. Gray ”. (Annals. Food Science and Tecvhnology. Vol 16 (1), 2015): 195-200.
5. Shalaby, EA, and Shanab, SMM., Antioxidant Compounds, Assays of Determination and Mode
of Action. (AJPP.7(10), 2013). pp.535-537.
Concentration (µg/mL)
Concentration (µMol) Absorbance Sample Level (µmol) Average
1 5,68 0,291 85,6 87,2 2 11,35 0,332 86
3 17,03 0,415 90 4 22,71 0,504
5 28,39 0,572
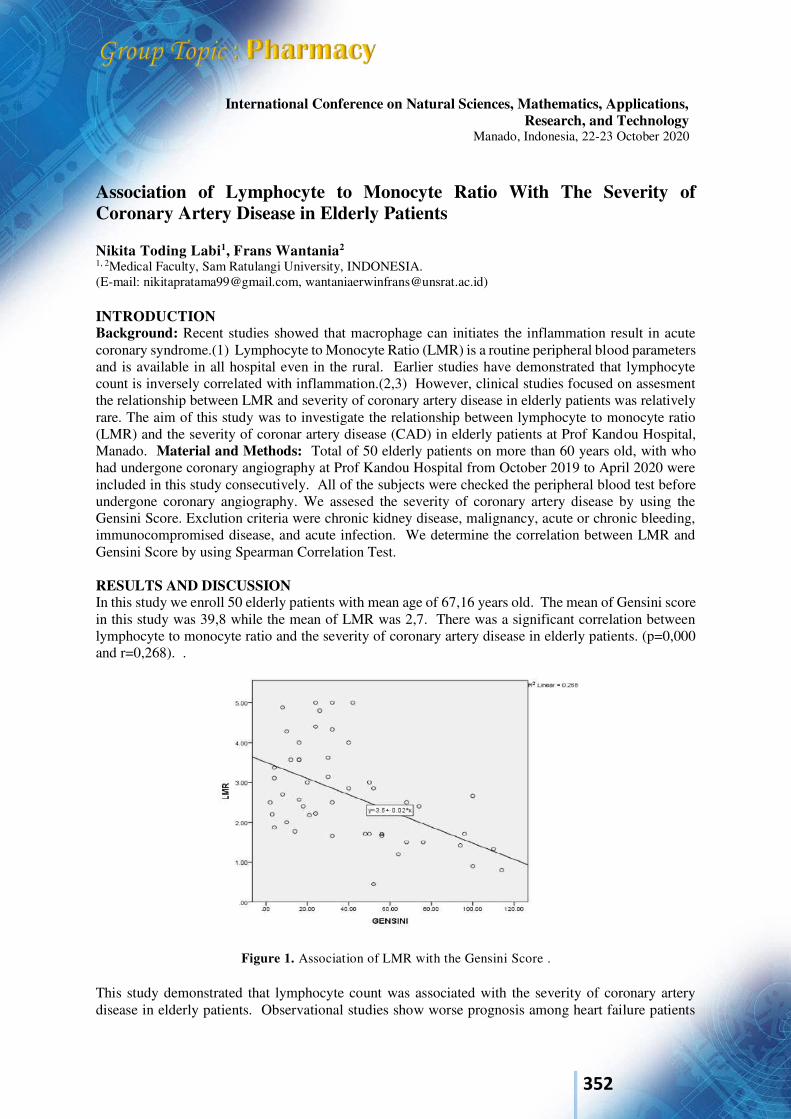
352
International Conference on Natural Sciences, Mathematics, Applications, Research, and Technology
Manado, Indonesia, 22-23 October 2020
Association of Lymphocyte to Monocyte Ratio With The Severity of Coronary Artery Disease in Elderly Patients Nikita Toding Labi1, Frans Wantania2
1, 2Medical Faculty, Sam Ratulangi University, INDONESIA. (E-mail: [email protected], [email protected]) INTRODUCTION Background: Recent studies showed that macrophage can initiates the inflammation result in acute coronary syndrome.(1) Lymphocyte to Monocyte Ratio (LMR) is a routine peripheral blood parameters and is available in all hospital even in the rural. Earlier studies have demonstrated that lymphocyte count is inversely correlated with inflammation.(2,3) However, clinical studies focused on assesment the relationship between LMR and severity of coronary artery disease in elderly patients was relatively rare. The aim of this study was to investigate the relationship between lymphocyte to monocyte ratio (LMR) and the severity of coronar artery disease (CAD) in elderly patients at Prof Kandou Hospital, Manado. Material and Methods: Total of 50 elderly patients on more than 60 years old, with who had undergone coronary angiography at Prof Kandou Hospital from October 2019 to April 2020 were included in this study consecutively. All of the subjects were checked the peripheral blood test before undergone coronary angiography. We assesed the severity of coronary artery disease by using the Gensini Score. Exclution criteria were chronic kidney disease, malignancy, acute or chronic bleeding, immunocompromised disease, and acute infection. We determine the correlation between LMR and Gensini Score by using Spearman Correlation Test. RESULTS AND DISCUSSION In this study we enroll 50 elderly patients with mean age of 67,16 years old. The mean of Gensini score in this study was 39,8 while the mean of LMR was 2,7. There was a significant correlation between lymphocyte to monocyte ratio and the severity of coronary artery disease in elderly patients. (p=0,000 and r=0,268). .
Figure 1. Association of LMR with the Gensini Score . This study demonstrated that lymphocyte count was associated with the severity of coronary artery disease in elderly patients. Observational studies show worse prognosis among heart failure patients
353
with low lymphocyte counts.(4,5) Absolute Lymphocyte Count is associated with immune suppression and malnutrition.(6) Previous studies also have shown that is associated with poor prognosis in ST elevation MI patients.(7) Lymphocytopenia is common in hospitalized patients and has been observed in different cardiovascular disease. Wildimer et al observed patient with acute myocardial infarction have a lower lymphocyte.(8) It may have a role in the clinical management ACS patients for its easy and minimal expense or time to evaluation process. Lymphocyte in ACS patients group was lower due the fact that lymphocytopenia may be result of a severe systemic responses that induced by ACS. Cortisol and catecholamines as a marker of physiological stress response can induce lymphocyte apoptosis and down regulate lymphocyte proliferation and differentiation.(9) However further studies are needed to confirm the association between increase level of neurohormones with the reduction of lymphocyte. Conclusion: We found that LMR was correlates inversely with the severity of coronary artery disease in elderly patients. Keywords: Lymphocyte, Monocyte, Coronary Artery Disease, Elderly Acknowledgment We gratefully acknowledge all of the people who participated in this study and Prof Kandou General Hospital for creating the possibility to perform this study. References
1. Libby P. Changing concepts of atherogenesis. J. Intern Med. 2000; 247:349-58 2. Ommen SR, Gibbons RJ, Hodge DO, et al. Usefulness of the lymphocyte concentration as a
prognostic marker in coronary artery disease. Am J Cardiol 1997;79:812-4 3. Horne BD, Anderson JL, John JM, et al. Which white blood cell subtypes predict increased
cardiovascular risk. J Am Coll Cardiol 2005;45:1638-43 4. Vaduganathan M, Ambrosy AP, Greene SJ, et al. The predictive value of low relative
lymphocyte count in patients hospitalized for heart failure with reduced ejection fraction: insights from the EVEREST trial. Circ Heart Fail 2012;5:750-8
5. Acanfora D, Gheorghiade M, Trojano L, et al. Relative lymphocyte count: a prognostic indicator of mortality in elderly patients with congestive heart failure. Am Heart J
2001;142:167-73 6. Vaduganathan M, Greene SJ, Butler J, et al. The immunological axis in heart failure:
importance of the leukocyte differential. Heart Fail Rev 2013;18:835-45 7. Nunez J, Nunez E, Bodi V, et al. Low lymphocyte count in acute phase of ST-segment
elevation myocardial infarction predicts long-term recurrent myocardial infarction. Coron Artery Dis 2010;21:1-7
8. Wildimer A, Lindka AZ, Attenhofer. Mechanical Complications After Myocardial Infarction Reliably Predicted Using C-Reactive Protein Levels and Lymphocytopenia. Journal ofCardiology.2003;99:25-31
9. Bian C, Wu Y, Shi Y. Predictive Value of The Relative Lymphocyte Count in Coronary Heart Disease. Journal of Heart Vessels. 2010;25:469-473.
354
International Conference on Natural Sciences, Mathematics, Applications, Research, and Technology
Manado, Indonesia, 22-23 October 2020
Is There A Need For Health Promotion Tools During The Covid-19 Pandemic To Achieve The Elimination Of Tuberculosis In 2050
Linda Augustien Makalew1; Irza Nanda Ranti, DCN, M.Si.2 and Tumartony Hiola, S.Pd, M.Kes.3
1 Lecturer of Health Analyst, Manado of Polytechnic of Health, Jl. R. W. Monginsidi Malalayang
Manado, Indonesia 95263 ( [email protected] )
2 Lecturer of Nutrition, Manado of Polytechnic of Health, Jl. R. W. Monginsidi Malalayang Manado, Indonesia 95263 ( [email protected] )
3 Lecturer of Environmental Health, Gorontalo of Polytechnic of Health, Jln, Tamalate, Kota Tim., Kota Gorontalo, Gorontalo 9613 ([email protected] )
INTRODUCTION
The Covid-19 pandemic is very beneficial in the tuberculosis (TB) elimination program in Indonesia in 2050. Movement of using masks, washing hands is very helpful in stopping the transmission of tuberculosis. However, this is a challenge for microscopic officers and the Pulmonary Tuberculosis Prevention and Control Program (P2Tb) at the Microscopic Referral Center for Public Health (MRC) in treating tuberculosis patients who are currently being treated. TB sufferers apart from taking the drug, they are required to make 4 (four) visits to clarify the presence of the Mycobacterium tuberculosis (M.tb) germ, which is the first time they have a cough for more than 2 (two) weeks (supect), the second is during the second month of treatment. -2, the third is during the 5th month of treatment and when the patient has finished treatment for 6 (six). Intensive communication is needed with people with pulmonary tuberculosis, starting from taking sputum collection pots; collect pots; perform Acid Resistant Basil (BTA) examination. Everything is so that sufferers can get messages about how to get purulent phlegm, do the right cough, take medication regularly and return to the checkup for further treatment. This encountered a problem during the Covid-19 Pandemic. Communication plays an important role in establishing intra and extra personal relationships, both personally and in groups, so that messages can be received and understood clearly. One of the existing communications, namely visual communication, is a series of processes to convey information or messages to other parties using depiction media that is only read by the sense of sight, often used in delivering messages that make it easier without having to speak directly. This study aims to create a visual communication media with a duration of one minute and a half as much as the arrival time, which has been tested on patients through pre and post tests by taking samples of pulmonary tuberculosis patients in 3 MRC in Manado City, namely MRC Wonasa, MRC Tuminting and MRC Tikala Baru. and 1 MRC in Gorontalo District, namely MRC Telaga.
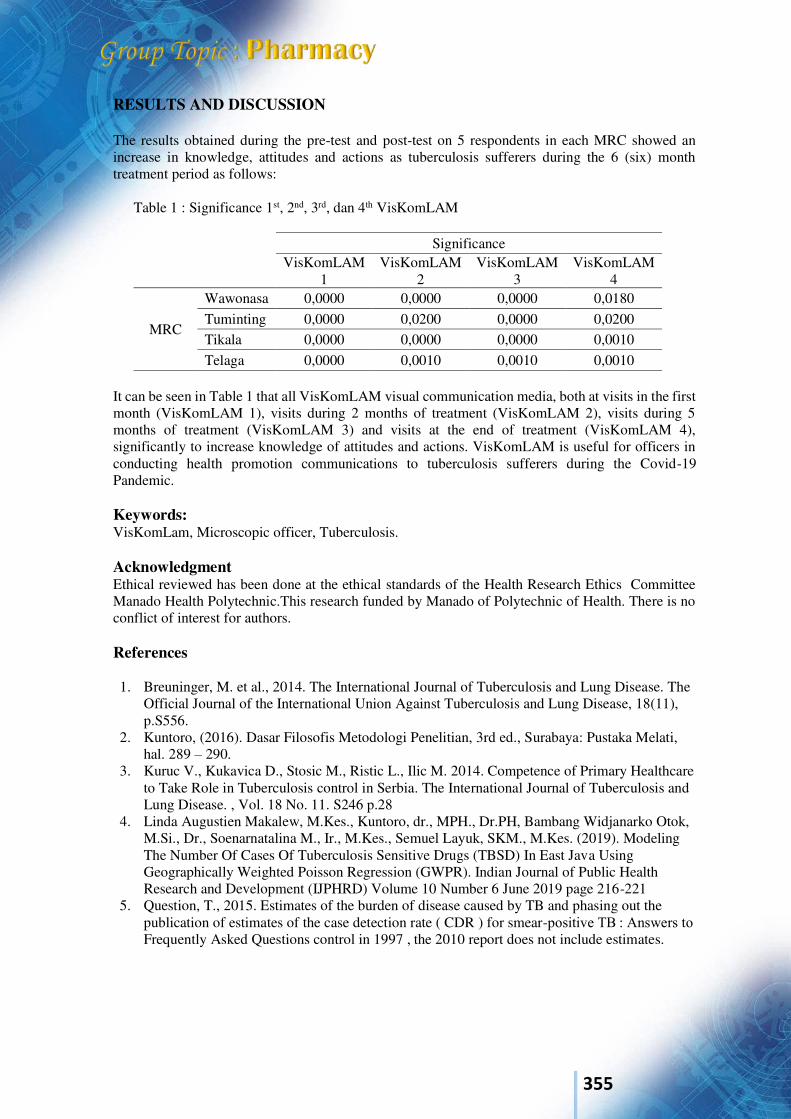
355
RESULTS AND DISCUSSION
The results obtained during the pre-test and post-test on 5 respondents in each MRC showed an increase in knowledge, attitudes and actions as tuberculosis sufferers during the 6 (six) month treatment period as follows:
Table 1 : Significance 1st, 2nd, 3rd, dan 4th VisKomLAM
Significance
VisKomLAM
1 VisKomLAM
2 VisKomLAM
3 VisKomLAM
4
MRC
Wawonasa 0,0000 0,0000 0,0000 0,0180 Tuminting 0,0000 0,0200 0,0000 0,0200 Tikala 0,0000 0,0000 0,0000 0,0010 Telaga 0,0000 0,0010 0,0010 0,0010
It can be seen in Table 1 that all VisKomLAM visual communication media, both at visits in the first month (VisKomLAM 1), visits during 2 months of treatment (VisKomLAM 2), visits during 5 months of treatment (VisKomLAM 3) and visits at the end of treatment (VisKomLAM 4), significantly to increase knowledge of attitudes and actions. VisKomLAM is useful for officers in conducting health promotion communications to tuberculosis sufferers during the Covid-19 Pandemic.
Keywords: VisKomLam, Microscopic officer, Tuberculosis.
Acknowledgment Ethical reviewed has been done at the ethical standards of the Health Research Ethics Committee Manado Health Polytechnic.This research funded by Manado of Polytechnic of Health. There is no conflict of interest for authors.
References
1. Breuninger, M. et al., 2014. The International Journal of Tuberculosis and Lung Disease. The
Official Journal of the International Union Against Tuberculosis and Lung Disease, 18(11), p.S556.
2. Kuntoro, (2016). Dasar Filosofis Metodologi Penelitian, 3rd ed., Surabaya: Pustaka Melati, hal. 289 – 290.
3. Kuruc V., Kukavica D., Stosic M., Ristic L., Ilic M. 2014. Competence of Primary Healthcare to Take Role in Tuberculosis control in Serbia. The International Journal of Tuberculosis and Lung Disease. , Vol. 18 No. 11. S246 p.28
4. Linda Augustien Makalew, M.Kes., Kuntoro, dr., MPH., Dr.PH, Bambang Widjanarko Otok, M.Si., Dr., Soenarnatalina M., Ir., M.Kes., Semuel Layuk, SKM., M.Kes. (2019). Modeling The Number Of Cases Of Tuberculosis Sensitive Drugs (TBSD) In East Java Using Geographically Weighted Poisson Regression (GWPR). Indian Journal of Public Health Research and Development (IJPHRD) Volume 10 Number 6 June 2019 page 216-221
5. Question, T., 2015. Estimates of the burden of disease caused by TB and phasing out the publication of estimates of the case detection rate ( CDR ) for smear-positive TB : Answers to Frequently Asked Questions control in 1997 , the 2010 report does not include estimates.
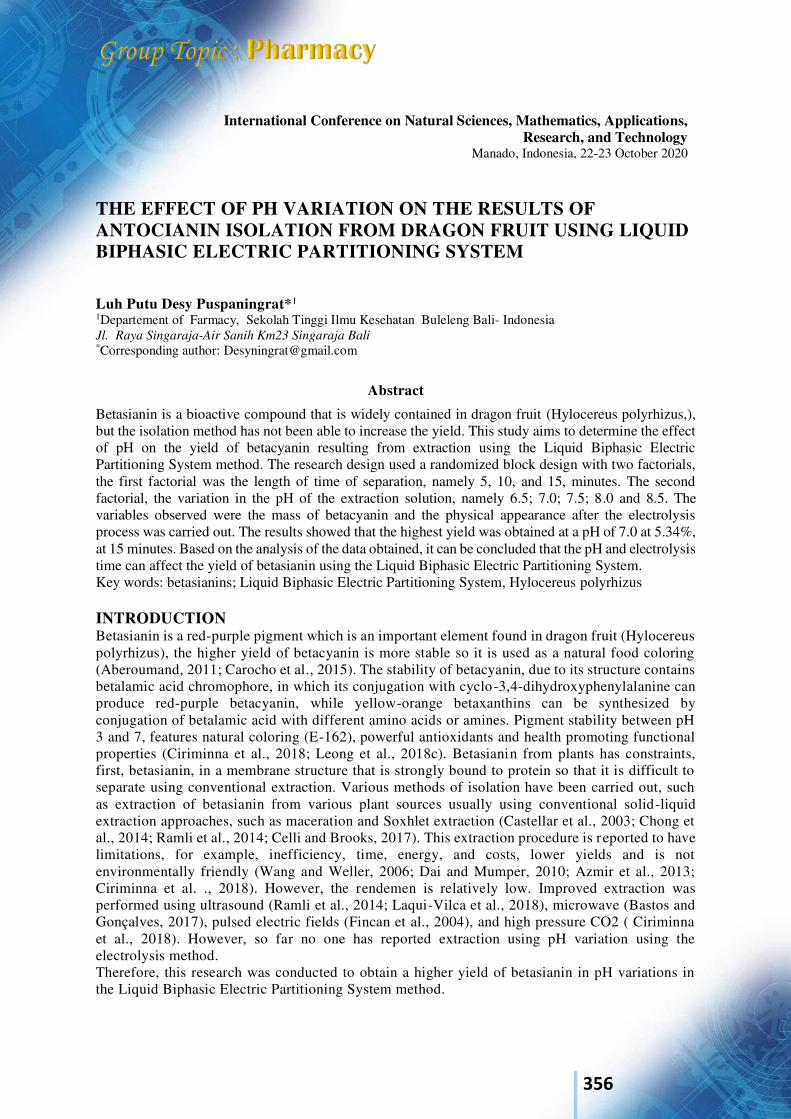
356
International Conference on Natural Sciences, Mathematics, Applications,
Research, and Technology Manado, Indonesia, 22-23 October 2020
THE EFFECT OF PH VARIATION ON THE RESULTS OF ANTOCIANIN ISOLATION FROM DRAGON FRUIT USING LIQUID BIPHASIC ELECTRIC PARTITIONING SYSTEM Luh Putu Desy Puspaningrat*1
1Departement of Farmacy, Sekolah Tinggi Ilmu Kesehatan Buleleng Bali- Indonesia Jl. Raya Singaraja-Air Sanih Km23 Singaraja Bali *Corresponding author: [email protected]
Abstract
Betasianin is a bioactive compound that is widely contained in dragon fruit (Hylocereus polyrhizus,), but the isolation method has not been able to increase the yield. This study aims to determine the effect of pH on the yield of betacyanin resulting from extraction using the Liquid Biphasic Electric Partitioning System method. The research design used a randomized block design with two factorials, the first factorial was the length of time of separation, namely 5, 10, and 15, minutes. The second factorial, the variation in the pH of the extraction solution, namely 6.5; 7.0; 7.5; 8.0 and 8.5. The variables observed were the mass of betacyanin and the physical appearance after the electrolysis process was carried out. The results showed that the highest yield was obtained at a pH of 7.0 at 5.34%, at 15 minutes. Based on the analysis of the data obtained, it can be concluded that the pH and electrolysis time can affect the yield of betasianin using the Liquid Biphasic Electric Partitioning System. Key words: betasianins; Liquid Biphasic Electric Partitioning System, Hylocereus polyrhizus INTRODUCTION Betasianin is a red-purple pigment which is an important element found in dragon fruit (Hylocereus polyrhizus), the higher yield of betacyanin is more stable so it is used as a natural food coloring (Aberoumand, 2011; Carocho et al., 2015). The stability of betacyanin, due to its structure contains betalamic acid chromophore, in which its conjugation with cyclo-3,4-dihydroxyphenylalanine can produce red-purple betacyanin, while yellow-orange betaxanthins can be synthesized by conjugation of betalamic acid with different amino acids or amines. Pigment stability between pH 3 and 7, features natural coloring (E-162), powerful antioxidants and health promoting functional properties (Ciriminna et al., 2018; Leong et al., 2018c). Betasianin from plants has constraints, first, betasianin, in a membrane structure that is strongly bound to protein so that it is difficult to separate using conventional extraction. Various methods of isolation have been carried out, such as extraction of betasianin from various plant sources usually using conventional solid-liquid extraction approaches, such as maceration and Soxhlet extraction (Castellar et al., 2003; Chong et al., 2014; Ramli et al., 2014; Celli and Brooks, 2017). This extraction procedure is reported to have limitations, for example, inefficiency, time, energy, and costs, lower yields and is not environmentally friendly (Wang and Weller, 2006; Dai and Mumper, 2010; Azmir et al., 2013; Ciriminna et al. ., 2018). However, the rendemen is relatively low. Improved extraction was performed using ultrasound (Ramli et al., 2014; Laqui-Vilca et al., 2018), microwave (Bastos and Gonçalves, 2017), pulsed electric fields (Fincan et al., 2004), and high pressure CO2 ( Ciriminna et al., 2018). However, so far no one has reported extraction using pH variation using the electrolysis method. Therefore, this research was conducted to obtain a higher yield of betasianin in pH variations in the Liquid Biphasic Electric Partitioning System method.
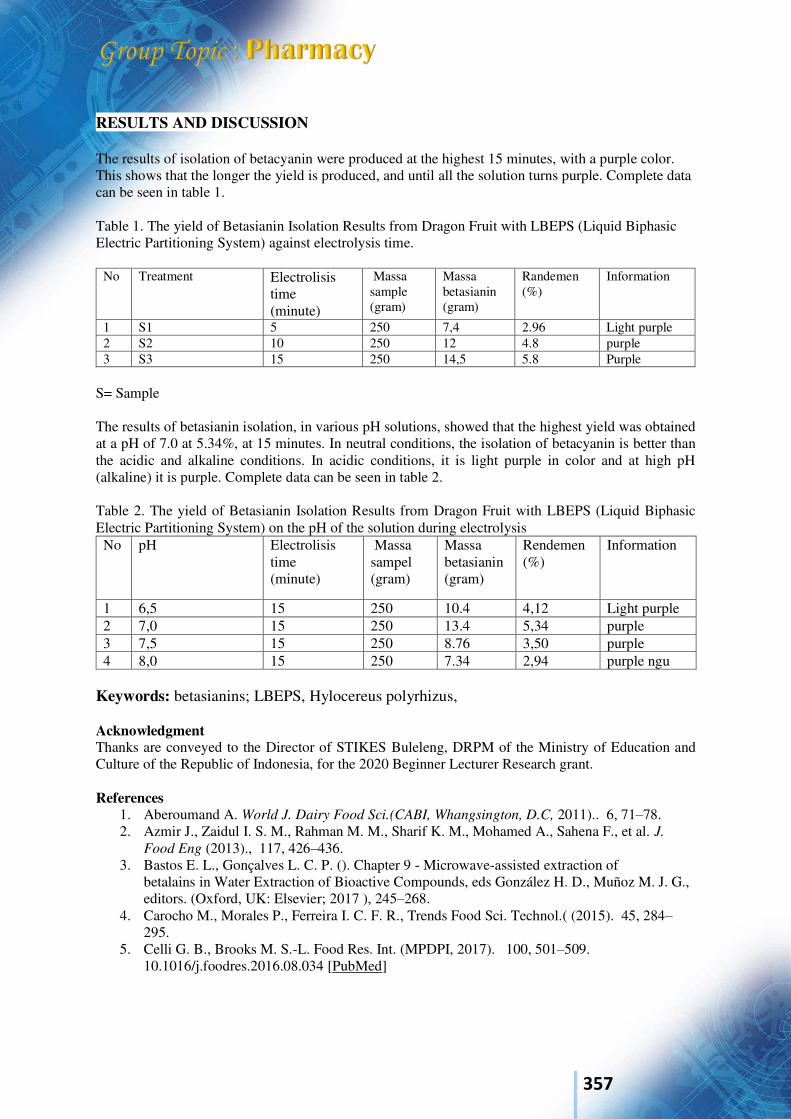
357
RESULTS AND DISCUSSION The results of isolation of betacyanin were produced at the highest 15 minutes, with a purple color. This shows that the longer the yield is produced, and until all the solution turns purple. Complete data can be seen in table 1. Table 1. The yield of Betasianin Isolation Results from Dragon Fruit with LBEPS (Liquid Biphasic Electric Partitioning System) against electrolysis time.
No Treatment Electrolisis time (minute)
Massa sample (gram)
Massa betasianin (gram)
Randemen (%)
Information
1 S1 5 250 7,4 2.96 Light purple 2 S2 10 250 12 4.8 purple 3 S3 15 250 14,5 5.8 Purple
S= Sample The results of betasianin isolation, in various pH solutions, showed that the highest yield was obtained at a pH of 7.0 at 5.34%, at 15 minutes. In neutral conditions, the isolation of betacyanin is better than the acidic and alkaline conditions. In acidic conditions, it is light purple in color and at high pH (alkaline) it is purple. Complete data can be seen in table 2. Table 2. The yield of Betasianin Isolation Results from Dragon Fruit with LBEPS (Liquid Biphasic Electric Partitioning System) on the pH of the solution during electrolysis
No pH Electrolisis time (minute)
Massa sampel (gram)
Massa betasianin (gram)
Rendemen (%)
Information
1 6,5 15 250 10.4 4,12 Light purple 2 7,0 15 250 13.4 5,34 purple 3 7,5 15 250 8.76 3,50 purple 4 8,0 15 250 7.34 2,94 purple ngu
Keywords: betasianins; LBEPS, Hylocereus polyrhizus, Acknowledgment Thanks are conveyed to the Director of STIKES Buleleng, DRPM of the Ministry of Education and Culture of the Republic of Indonesia, for the 2020 Beginner Lecturer Research grant. References
1. Aberoumand A. World J. Dairy Food Sci.(CABI, Whangsington, D.C, 2011).. 6, 71–78. 2. Azmir J., Zaidul I. S. M., Rahman M. M., Sharif K. M., Mohamed A., Sahena F., et al. J.
Food Eng (2013)., 117, 426–436. 3. Bastos E. L., Gonçalves L. C. P. (). Chapter 9 - Microwave-assisted extraction of
betalains in Water Extraction of Bioactive Compounds, eds González H. D., Muñoz M. J. G., editors. (Oxford, UK: Elsevier; 2017 ), 245–268.
4. Carocho M., Morales P., Ferreira I. C. F. R., Trends Food Sci. Technol.( (2015). 45, 284–295.
5. Celli G. B., Brooks M. S.-L. Food Res. Int. (MPDPI, 2017). 100, 501–509. 10.1016/j.foodres.2016.08.034 [PubMed]

358
6. Ciriminna R., Fidalgo A., Danzì C., Timpanaro G., Ilharco L. M., Pagliaro M. (2018). Betanin: a bioeconomy insight into a valued betacyanin. ACS Sust. Chem. Eng. 6, 2860–2865. 10.1021/acssuschemeng.7b04163 [CrossRef] [Google Scholar]
7. Dai J., Mumper R. J. (2010). Plant phenolics: extraction, analysis and their antioxidant and anticancer properties. Molecules 15, 7313–7352. 10.3390/molecules15107313 [PMC free article] [PubMed] [CrossRef] [Google Scholar]
8. Fincan M., DeVito F., Dejmek P. (2004). Pulsed electric field treatment for solid–liquid extraction of red beetroot pigment. J. Food Eng. 64, 381–388. 10.1016/j.jfoodeng.2003.11.006 [CrossRef] [Google Scholar]
9. Leong H. Y., Ooi C. W., Law C. L., Julkifle A. L., Ling T. C., Show P. L. (2018a). Application of liquid biphasic flotation for betacyanins extraction from peel and flesh of Hylocereus polyrhizus and antioxidant activity evaluation. Separat. Purif. Technol. 201, 156–166. 10.1016/j.seppur.2018.03.008 [CrossRef] [Google Scholar]
10. Ramli N. S., Ismail P., Rahmat A. (2014). Influence of conventional and ultrasonic-assisted extraction on phenolic contents, betacyanin contents, and antioxidant capacity of red dragon fruit (Hylocereus polyrhizus). Scient. World J. 2014:964731. 10.1155/2014/964731 [PMC free article] [PubMed] [CrossRef] [Google Scholar]
11. Wang L., Weller C. L. (2006). Recent advances in extraction of nutraceuticals from plants. Trends Food Sci. Technol. 17, 300–312. 10.1016/j.tifs.2005.12.004 [CrossRef] [Google Scholar]
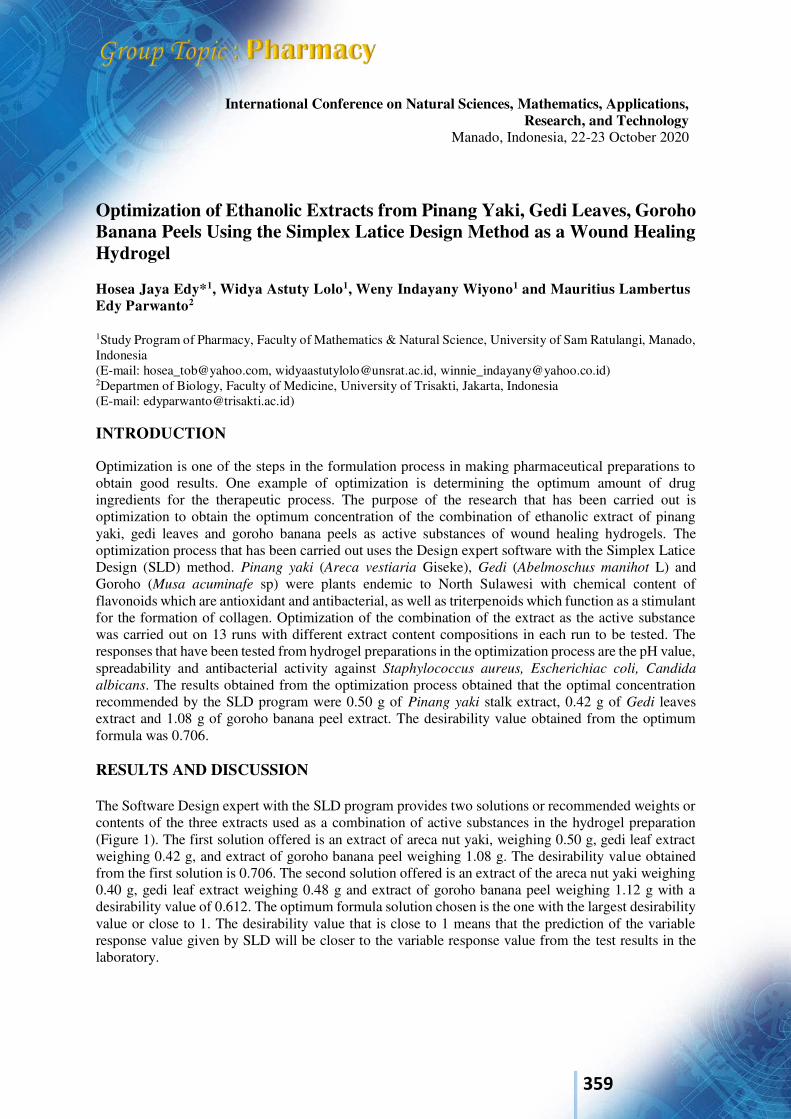
359
International Conference on Natural Sciences, Mathematics, Applications, Research, and Technology
Manado, Indonesia, 22-23 October 2020
Optimization of Ethanolic Extracts from Pinang Yaki, Gedi Leaves, Goroho Banana Peels Using the Simplex Latice Design Method as a Wound Healing Hydrogel Hosea Jaya Edy*1, Widya Astuty Lolo1, Weny Indayany Wiyono1 and Mauritius Lambertus Edy Parwanto2
1Study Program of Pharmacy, Faculty of Mathematics & Natural Science, University of Sam Ratulangi, Manado, Indonesia (E-mail: [email protected], [email protected], [email protected]) 2Departmen of Biology, Faculty of Medicine, University of Trisakti, Jakarta, Indonesia (E-mail: [email protected]) INTRODUCTION Optimization is one of the steps in the formulation process in making pharmaceutical preparations to obtain good results. One example of optimization is determining the optimum amount of drug ingredients for the therapeutic process. The purpose of the research that has been carried out is optimization to obtain the optimum concentration of the combination of ethanolic extract of pinang yaki, gedi leaves and goroho banana peels as active substances of wound healing hydrogels. The optimization process that has been carried out uses the Design expert software with the Simplex Latice Design (SLD) method. Pinang yaki (Areca vestiaria Giseke), Gedi (Abelmoschus manihot L) and Goroho (Musa acuminafe sp) were plants endemic to North Sulawesi with chemical content of flavonoids which are antioxidant and antibacterial, as well as triterpenoids which function as a stimulant for the formation of collagen. Optimization of the combination of the extract as the active substance was carried out on 13 runs with different extract content compositions in each run to be tested. The responses that have been tested from hydrogel preparations in the optimization process are the pH value, spreadability and antibacterial activity against Staphylococcus aureus, Escherichiac coli, Candida
albicans. The results obtained from the optimization process obtained that the optimal concentration recommended by the SLD program were 0.50 g of Pinang yaki stalk extract, 0.42 g of Gedi leaves extract and 1.08 g of goroho banana peel extract. The desirability value obtained from the optimum formula was 0.706. RESULTS AND DISCUSSION The Software Design expert with the SLD program provides two solutions or recommended weights or contents of the three extracts used as a combination of active substances in the hydrogel preparation (Figure 1). The first solution offered is an extract of areca nut yaki, weighing 0.50 g, gedi leaf extract weighing 0.42 g, and extract of goroho banana peel weighing 1.08 g. The desirability value obtained from the first solution is 0.706. The second solution offered is an extract of the areca nut yaki weighing 0.40 g, gedi leaf extract weighing 0.48 g and extract of goroho banana peel weighing 1.12 g with a desirability value of 0.612. The optimum formula solution chosen is the one with the largest desirability value or close to 1. The desirability value that is close to 1 means that the prediction of the variable response value given by SLD will be closer to the variable response value from the test results in the laboratory.
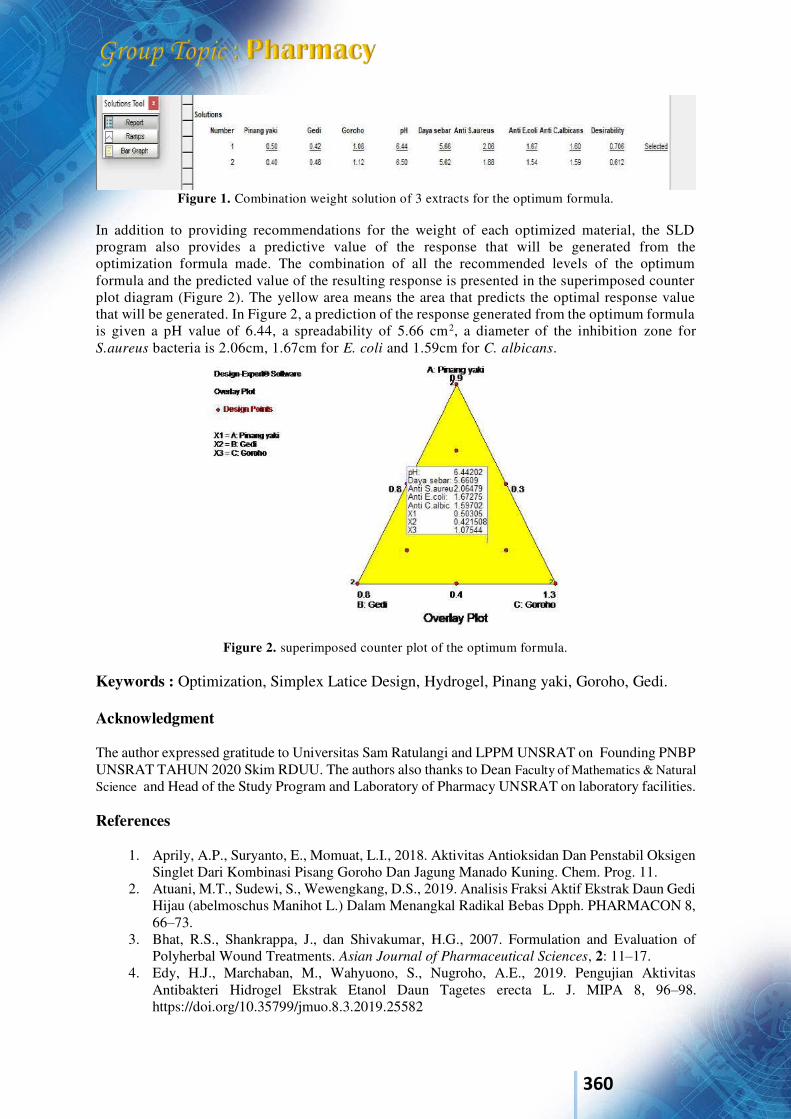
360
Figure 1. Combination weight solution of 3 extracts for the optimum formula.
In addition to providing recommendations for the weight of each optimized material, the SLD program also provides a predictive value of the response that will be generated from the optimization formula made. The combination of all the recommended levels of the optimum formula and the predicted value of the resulting response is presented in the superimposed counter plot diagram (Figure 2). The yellow area means the area that predicts the optimal response value that will be generated. In Figure 2, a prediction of the response generated from the optimum formula is given a pH value of 6.44, a spreadability of 5.66 cm2, a diameter of the inhibition zone for S.aureus bacteria is 2.06cm, 1.67cm for E. coli and 1.59cm for C. albicans.
Figure 2. superimposed counter plot of the optimum formula.
Keywords : Optimization, Simplex Latice Design, Hydrogel, Pinang yaki, Goroho, Gedi. Acknowledgment The author expressed gratitude to Universitas Sam Ratulangi and LPPM UNSRAT on Founding PNBP UNSRAT TAHUN 2020 Skim RDUU. The authors also thanks to Dean Faculty of Mathematics & Natural Science and Head of the Study Program and Laboratory of Pharmacy UNSRAT on laboratory facilities. References
1. Aprily, A.P., Suryanto, E., Momuat, L.I., 2018. Aktivitas Antioksidan Dan Penstabil Oksigen Singlet Dari Kombinasi Pisang Goroho Dan Jagung Manado Kuning. Chem. Prog. 11.
2. Atuani, M.T., Sudewi, S., Wewengkang, D.S., 2019. Analisis Fraksi Aktif Ekstrak Daun Gedi Hijau (abelmoschus Manihot L.) Dalam Menangkal Radikal Bebas Dpph. PHARMACON 8, 66–73.
3. Bhat, R.S., Shankrappa, J., dan Shivakumar, H.G., 2007. Formulation and Evaluation of Polyherbal Wound Treatments. Asian Journal of Pharmaceutical Sciences, 2: 11–17.
4. Edy, H.J., Marchaban, M., Wahyuono, S., Nugroho, A.E., 2019. Pengujian Aktivitas Antibakteri Hidrogel Ekstrak Etanol Daun Tagetes erecta L. J. MIPA 8, 96–98. https://doi.org/10.35799/jmuo.8.3.2019.25582
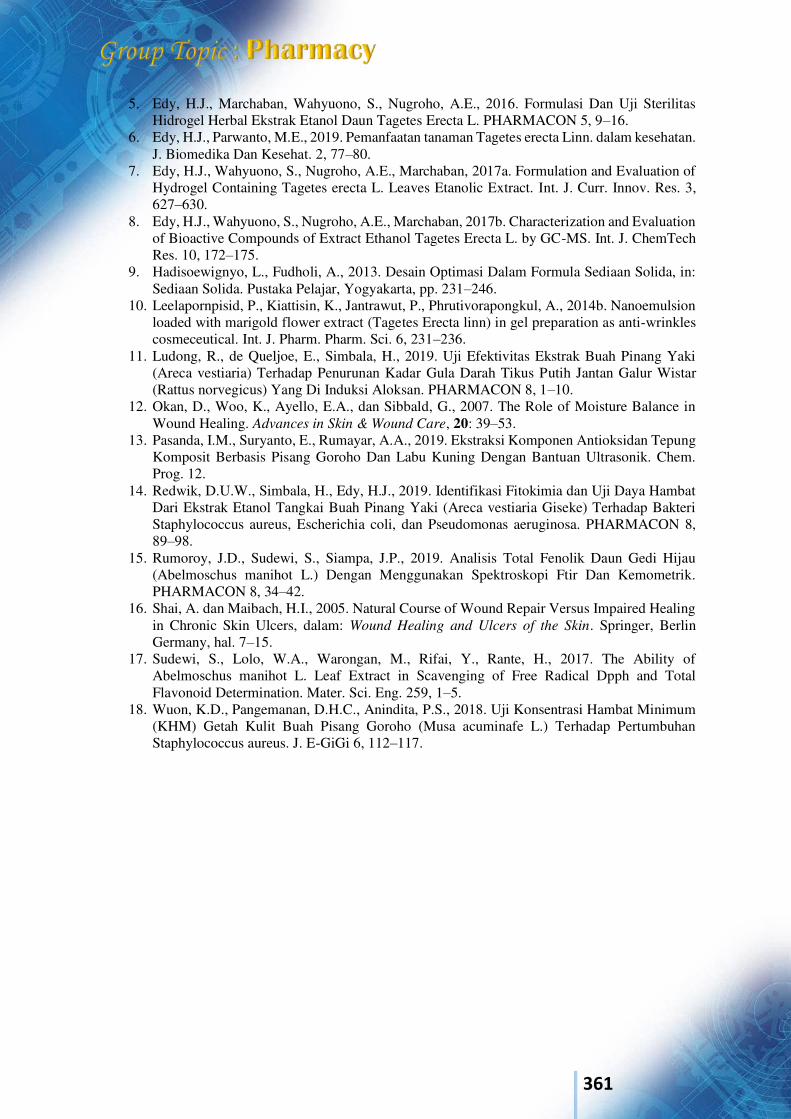
361
5. Edy, H.J., Marchaban, Wahyuono, S., Nugroho, A.E., 2016. Formulasi Dan Uji Sterilitas Hidrogel Herbal Ekstrak Etanol Daun Tagetes Erecta L. PHARMACON 5, 9–16.
6. Edy, H.J., Parwanto, M.E., 2019. Pemanfaatan tanaman Tagetes erecta Linn. dalam kesehatan. J. Biomedika Dan Kesehat. 2, 77–80.
7. Edy, H.J., Wahyuono, S., Nugroho, A.E., Marchaban, 2017a. Formulation and Evaluation of Hydrogel Containing Tagetes erecta L. Leaves Etanolic Extract. Int. J. Curr. Innov. Res. 3, 627–630.
8. Edy, H.J., Wahyuono, S., Nugroho, A.E., Marchaban, 2017b. Characterization and Evaluation of Bioactive Compounds of Extract Ethanol Tagetes Erecta L. by GC-MS. Int. J. ChemTech Res. 10, 172–175.
9. Hadisoewignyo, L., Fudholi, A., 2013. Desain Optimasi Dalam Formula Sediaan Solida, in: Sediaan Solida. Pustaka Pelajar, Yogyakarta, pp. 231–246.
10. Leelapornpisid, P., Kiattisin, K., Jantrawut, P., Phrutivorapongkul, A., 2014b. Nanoemulsion loaded with marigold flower extract (Tagetes Erecta linn) in gel preparation as anti-wrinkles cosmeceutical. Int. J. Pharm. Pharm. Sci. 6, 231–236.
11. Ludong, R., de Queljoe, E., Simbala, H., 2019. Uji Efektivitas Ekstrak Buah Pinang Yaki (Areca vestiaria) Terhadap Penurunan Kadar Gula Darah Tikus Putih Jantan Galur Wistar (Rattus norvegicus) Yang Di Induksi Aloksan. PHARMACON 8, 1–10.
12. Okan, D., Woo, K., Ayello, E.A., dan Sibbald, G., 2007. The Role of Moisture Balance in Wound Healing. Advances in Skin & Wound Care, 20: 39–53.
13. Pasanda, I.M., Suryanto, E., Rumayar, A.A., 2019. Ekstraksi Komponen Antioksidan Tepung Komposit Berbasis Pisang Goroho Dan Labu Kuning Dengan Bantuan Ultrasonik. Chem. Prog. 12.
14. Redwik, D.U.W., Simbala, H., Edy, H.J., 2019. Identifikasi Fitokimia dan Uji Daya Hambat Dari Ekstrak Etanol Tangkai Buah Pinang Yaki (Areca vestiaria Giseke) Terhadap Bakteri Staphylococcus aureus, Escherichia coli, dan Pseudomonas aeruginosa. PHARMACON 8, 89–98.
15. Rumoroy, J.D., Sudewi, S., Siampa, J.P., 2019. Analisis Total Fenolik Daun Gedi Hijau (Abelmoschus manihot L.) Dengan Menggunakan Spektroskopi Ftir Dan Kemometrik. PHARMACON 8, 34–42.
16. Shai, A. dan Maibach, H.I., 2005. Natural Course of Wound Repair Versus Impaired Healing in Chronic Skin Ulcers, dalam: Wound Healing and Ulcers of the Skin. Springer, Berlin Germany, hal. 7–15.
17. Sudewi, S., Lolo, W.A., Warongan, M., Rifai, Y., Rante, H., 2017. The Ability of Abelmoschus manihot L. Leaf Extract in Scavenging of Free Radical Dpph and Total Flavonoid Determination. Mater. Sci. Eng. 259, 1–5.
18. Wuon, K.D., Pangemanan, D.H.C., Anindita, P.S., 2018. Uji Konsentrasi Hambat Minimum (KHM) Getah Kulit Buah Pisang Goroho (Musa acuminafe L.) Terhadap Pertumbuhan Staphylococcus aureus. J. E-GiGi 6, 112–117.
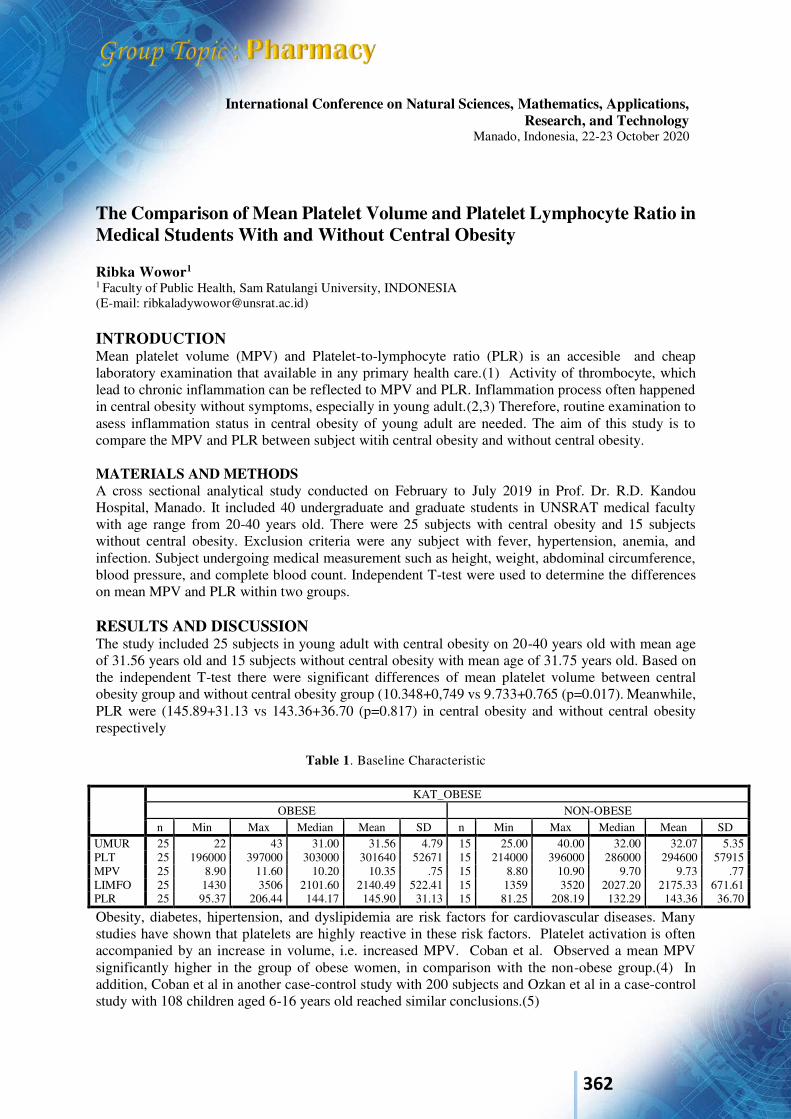
362
International Conference on Natural Sciences, Mathematics, Applications, Research, and Technology
Manado, Indonesia, 22-23 October 2020
The Comparison of Mean Platelet Volume and Platelet Lymphocyte Ratio in Medical Students With and Without Central Obesity Ribka Wowor1
1 Faculty of Public Health, Sam Ratulangi University, INDONESIA (E-mail: [email protected]) INTRODUCTION Mean platelet volume (MPV) and Platelet-to-lymphocyte ratio (PLR) is an accesible and cheap laboratory examination that available in any primary health care.(1) Activity of thrombocyte, which lead to chronic inflammation can be reflected to MPV and PLR. Inflammation process often happened in central obesity without symptoms, especially in young adult.(2,3) Therefore, routine examination to asess inflammation status in central obesity of young adult are needed. The aim of this study is to compare the MPV and PLR between subject witih central obesity and without central obesity. MATERIALS AND METHODS A cross sectional analytical study conducted on February to July 2019 in Prof. Dr. R.D. Kandou Hospital, Manado. It included 40 undergraduate and graduate students in UNSRAT medical faculty with age range from 20-40 years old. There were 25 subjects with central obesity and 15 subjects without central obesity. Exclusion criteria were any subject with fever, hypertension, anemia, and infection. Subject undergoing medical measurement such as height, weight, abdominal circumference, blood pressure, and complete blood count. Independent T-test were used to determine the differences on mean MPV and PLR within two groups. RESULTS AND DISCUSSION The study included 25 subjects in young adult with central obesity on 20-40 years old with mean age of 31.56 years old and 15 subjects without central obesity with mean age of 31.75 years old. Based on the independent T-test there were significant differences of mean platelet volume between central obesity group and without central obesity group (10.348+0,749 vs 9.733+0.765 (p=0.017). Meanwhile, PLR were (145.89+31.13 vs 143.36+36.70 (p=0.817) in central obesity and without central obesity respectively
Table 1. Baseline Characteristic
KAT_OBESE OBESE NON-OBESE
n Min Max Median Mean SD n Min Max Median Mean SD UMUR 25 22 43 31.00 31.56 4.79 15 25.00 40.00 32.00 32.07 5.35 PLT 25 196000 397000 303000 301640 52671 15 214000 396000 286000 294600 57915 MPV 25 8.90 11.60 10.20 10.35 .75 15 8.80 10.90 9.70 9.73 .77 LIMFO 25 1430 3506 2101.60 2140.49 522.41 15 1359 3520 2027.20 2175.33 671.61 PLR 25 95.37 206.44 144.17 145.90 31.13 15 81.25 208.19 132.29 143.36 36.70
Obesity, diabetes, hipertension, and dyslipidemia are risk factors for cardiovascular diseases. Many studies have shown that platelets are highly reactive in these risk factors. Platelet activation is often accompanied by an increase in volume, i.e. increased MPV. Coban et al. Observed a mean MPV significantly higher in the group of obese women, in comparison with the non-obese group.(4) In addition, Coban et al in another case-control study with 200 subjects and Ozkan et al in a case-control study with 108 children aged 6-16 years old reached similar conclusions.(5)
363
The number and size of the originating plateletes depend on the ploidy degree of megakaryocytes. The greater the ploidy of the megakaryocytes nucleus, the more cytoplasm and specific platelet structures it has.(6) Platelets are not a homogenous, but those with elevated MPV are often younger and characterized by higher reactivity than those with normal MPV. That platelet is associated with marked activation of megakaryocytes, which increases the ploidy of these celss and enhances the release of large platelets.(7) Conclusion: There were significant differences in mean MPV between central obesity group and without central obesity in UNSRAT medical faculty students. Keywords:. Platelets, Lymphocyte, Central Obese Acknowledgment We gratefully acknowledge all of the people who participated in this study. References
1. Wang N and Tall AR. Cholesterol in platelet biogenesis and activation. Blood 2016;127(6):1949-53
2. Santili F, Vazzana N, Liani R, Guagnano MT, Davi G. Platelet activation in obesity and metabolic syndrome. Obes Rev. 2012: 13:27-42
3. Guiterez-Fisac JL, Guallar-Castillon P, Leon-Munoz LM, Graciani A, Banegas JR, Rodriguez-Artalejo F, et al. Prevalence of general and abdominal obesity in the adult population of Spain, 2008-2010: the ENRICA study. Obes Rev. 2012;13:388-92
4. Coban E, Ozdogan M, Yazicioglu G, Akcit F. The mean platelet volume in patients with obesity. Int J Clin Pract 2005; 59:981-2
5. Coban E, Yilmaz A, and Sari R. The effect of weight loss on the mean platelet volume in obese patients. Platelets 2007; 18:212-6
6. Patel SR, Hartwig JH, and Italiano JR. The biogenesis of platelets from megakaryocyte proplatelets. Journal of Clinical Investigations. 2005; (115);12: 3348-54
7. Burstein SA, Downs T, Friese P, et al. Thrombocytopoiesis in normal and sublethaly irradiated dogs: response to human interleukin-6. Blood. 1992; (80); 2:420-8
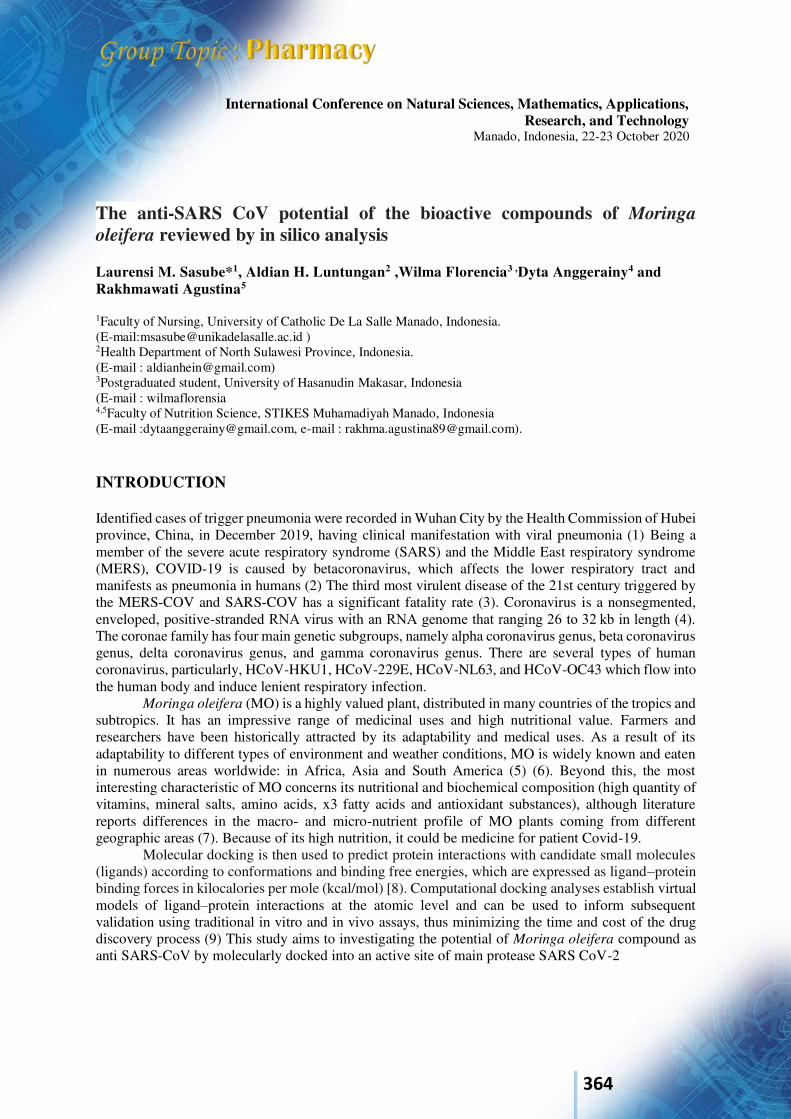
364
International Conference on Natural Sciences, Mathematics, Applications, Research, and Technology
Manado, Indonesia, 22-23 October 2020
The anti-SARS CoV potential of the bioactive compounds of Moringa
oleifera reviewed by in silico analysis Laurensi M. Sasube*1, Aldian H. Luntungan2 ,Wilma Florencia3 ,Dyta Anggerainy4 and Rakhmawati Agustina5
1Faculty of Nursing, University of Catholic De La Salle Manado, Indonesia. (E-mail:[email protected] ) 2Health Department of North Sulawesi Province, Indonesia. (E-mail : [email protected]) 3Postgraduated student, University of Hasanudin Makasar, Indonesia (E-mail : wilmaflorensia 4,5Faculty of Nutrition Science, STIKES Muhamadiyah Manado, Indonesia (E-mail :[email protected], e-mail : [email protected]). INTRODUCTION Identified cases of trigger pneumonia were recorded in Wuhan City by the Health Commission of Hubei province, China, in December 2019, having clinical manifestation with viral pneumonia (1) Being a member of the severe acute respiratory syndrome (SARS) and the Middle East respiratory syndrome (MERS), COVID-19 is caused by betacoronavirus, which affects the lower respiratory tract and manifests as pneumonia in humans (2) The third most virulent disease of the 21st century triggered by the MERS-COV and SARS-COV has a significant fatality rate (3). Coronavirus is a nonsegmented, enveloped, positive-stranded RNA virus with an RNA genome that ranging 26 to 32 kb in length (4). The coronae family has four main genetic subgroups, namely alpha coronavirus genus, beta coronavirus genus, delta coronavirus genus, and gamma coronavirus genus. There are several types of human coronavirus, particularly, HCoV-HKU1, HCoV-229E, HCoV-NL63, and HCoV-OC43 which flow into the human body and induce lenient respiratory infection.
Moringa oleifera (MO) is a highly valued plant, distributed in many countries of the tropics and subtropics. It has an impressive range of medicinal uses and high nutritional value. Farmers and researchers have been historically attracted by its adaptability and medical uses. As a result of its adaptability to different types of environment and weather conditions, MO is widely known and eaten in numerous areas worldwide: in Africa, Asia and South America (5) (6). Beyond this, the most interesting characteristic of MO concerns its nutritional and biochemical composition (high quantity of vitamins, mineral salts, amino acids, x3 fatty acids and antioxidant substances), although literature reports differences in the macro- and micro-nutrient profile of MO plants coming from different geographic areas (7). Because of its high nutrition, it could be medicine for patient Covid-19.
Molecular docking is then used to predict protein interactions with candidate small molecules (ligands) according to conformations and binding free energies, which are expressed as ligand–protein binding forces in kilocalories per mole (kcal/mol) [8). Computational docking analyses establish virtual models of ligand–protein interactions at the atomic level and can be used to inform subsequent validation using traditional in vitro and in vivo assays, thus minimizing the time and cost of the drug discovery process (9) This study aims to investigating the potential of Moringa oleifera compound as anti SARS-CoV by molecularly docked into an active site of main protease SARS CoV-2
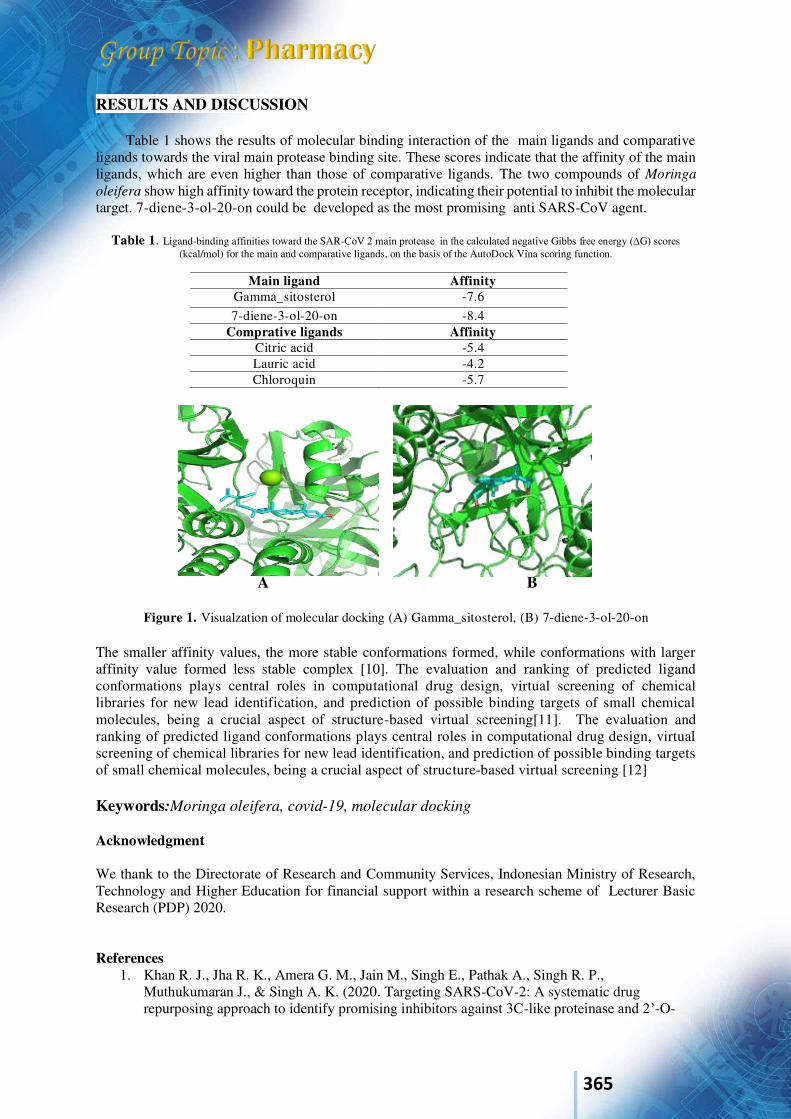
365
RESULTS AND DISCUSSION
Table 1 shows the results of molecular binding interaction of the main ligands and comparative ligands towards the viral main protease binding site. These scores indicate that the affinity of the main ligands, which are even higher than those of comparative ligands. The two compounds of Moringa
oleifera show high affinity toward the protein receptor, indicating their potential to inhibit the molecular target. 7-diene-3-ol-20-on could be developed as the most promising anti SARS-CoV agent.
Table 1. Ligand-binding affinities toward the SAR-CoV 2 main protease in the calculated negative Gibbs free energy (∆G) scores (kcal/mol) for the main and comparative ligands, on the basis of the AutoDock Vina scoring function.
Main ligand Affinity Gamma_sitosterol -7.6 7-diene-3-ol-20-on -8.4
Comprative ligands Affinity Citric acid -5.4 Lauric acid -4.2 Chloroquin -5.7
A B
Figure 1. Visualzation of molecular docking (A) Gamma_sitosterol, (B) 7-diene-3-ol-20-on The smaller affinity values, the more stable conformations formed, while conformations with larger affinity value formed less stable complex [10]. The evaluation and ranking of predicted ligand conformations plays central roles in computational drug design, virtual screening of chemical libraries for new lead identification, and prediction of possible binding targets of small chemical molecules, being a crucial aspect of structure-based virtual screening[11]. The evaluation and ranking of predicted ligand conformations plays central roles in computational drug design, virtual screening of chemical libraries for new lead identification, and prediction of possible binding targets of small chemical molecules, being a crucial aspect of structure-based virtual screening [12] Keywords:Moringa oleifera, covid-19, molecular docking Acknowledgment We thank to the Directorate of Research and Community Services, Indonesian Ministry of Research, Technology and Higher Education for financial support within a research scheme of Lecturer Basic Research (PDP) 2020. References
1. Khan R. J., Jha R. K., Amera G. M., Jain M., Singh E., Pathak A., Singh R. P., Muthukumaran J., & Singh A. K. (2020. Targeting SARS-CoV-2: A systematic drug repurposing approach to identify promising inhibitors against 3C-like proteinase and 2’-O-

366
ribose methyltransferase. Journal of Biomolecular Structure & Dynamics, 38, 1–40. 10.1080/07391102.2020.1753577 [PMC free article] [PubMed] [CrossRef] [Google Scholar]
2. Sohrabi, C.; Alsafi, Z.; O’Neill, N.; Khan, M.; Kerwan, A.; Jabir, A.A.; Losifidis, C.; Agha, R. World Health Organization declares global emergency: A review of the 2019 novel coronavirus (COVID-19). Int. J. Surg. 2020, 76, 71–76. [CrossRef] [PubMed]
3. Khan S. A., Zia K., Ashraf S., Uddin R., & Ul-Haq Z. (2020). Identification of chymotrypsin-like protease inhibitors of SARS-CoV-2 via integrated computational approach. Journal of
Biomolecular Structure and Dynamics, 38, 1–10. 10.1080/07391102.2020.1751298 [PubMed] [CrossRef]
4. Wu J. T., Leung K., & Leung G. M. (2020). Nowcasting and forecasting the potential domestic and international spread of the 2019-nCoV outbreak originating in Wuhan, China: A modelling study. The Lancet, 395(10225), 689–697. 10.1016/S0140-6736(20)30260-9 [PMC free article] [PubMed] [CrossRef] [Google Scholar]
5. (Leone A, Fiorillo G, Criscuoli F, Ravasenghi S, Santagostini L, Fico G, Spadafranca A, Battezzati A, Schiraldi A, Pozzi F, et al. 2015a. Nutritional characterization and phenolic profiling of Moringa oleifera leaves grown in Chad, Sahrawi Refugee Camps, and Haiti. Int J Mol Sci. 16:18923–18937.
6. Leone A, Spada A, Battezzati A, Schiraldi A, Aristil J, Bertoli S. 2015b. Cultivation, genetic, ethnopharmacology, phytochemistry and pharmacology of Moringa oleifera leaves: an overview. Int J Mol Sci. 16:12791–12835.)
7. Stohs SJ, Hartman MJ. 2015. Review of the safety and efficacy of Moringa oleifera. Phytother Res. 29:796–804.)
8. Forli S, Huey R, Pique M E, Sanner M, Goodsell D S and Olson A J 2016 Computational protein-ligand docking and virtual drug screening with the AutoDock suite Nat. Protoc. 11 905–19
9. Meng,XY,ZhangHX,MezeiMandCuiM2011 Molecular docking: a powerful approach for structure-based drug discovery Curr.Comput.Aided.Drug.Des.7146–57
10. (Rauf, M. A., Zubair, S., & Azhar, A. (2015). Ligand docking and binding site analysis with pymol and autodock/vina. International Journal of Basic and Applied Sciences, 4(2), 168.)
11. [20] (Yunta,M.J.R. 2016. Docking and ligand binding affinity : Uses and Pitfalls American
Journal of Modeling and Optimization. Vol. 4, No. 3, 2016, pp 74-114. doi: 10.12691/ajmo-4-3-2)
12. Yunta,M.J.R. 2016. Docking and ligand binding affinity : Uses and Pitfalls American Journal
of Modeling and Optimization. Vol. 4, No. 3, 2016, pp 74-114. doi: 10.12691/ajmo-4-3-2)

367
International Conference on Natural Sciences, Mathematics, Applications, Research, and Technology
Manado, Indonesia, 22-23 October 2020
Effect of Brisk Walking to Mean Platelet Volume and Apoliprotein B Levels in Young Adults Central Obese Frans Wantania*1, Linda Rotty2
1, 2Medical Faculty, Sam Ratulangi University, INDONESIA. (E-mail: [email protected], [email protected]) INTRODUCTION Obesity is one of the risk factors of various cardiovascular diseases. Inflammation that occurs in obesity plays an important role in metabolic abnormalities since the beginning, they become the basis of cardiovascular abnormalities.(1) Mean Platelet Volume is one of the signs of chronic inflammation. Increased MPV in obesity is closely related to the increase in pro-inflammatory cytokines such as Interleukin-6.(2) Subjects with central obesity tend to be reluctant to initiate physical activity because it is too tiring for them. Brisk Walking is a physical activities that is easy to do and no risk of injury because basically it is the same as walking. Aim of this study is to determine the effect of brisk walking to Mean Platelet Volume and ApoB levels in Young Adults Central Obese
MATERIAL AND METHODS: This research is a prospective cohort study with pre and post treatment without control. The population of this study are postgraduate students in Faculty of Medicine Sam Ratulangi who meet the inclusion criteria. The inclusion criteria are men with central obesity and under the age of 40. The exclusion criteria are anemia, fever, hypertension, renal failure, and diabetes mellitus. The sample of 20 people were enrolled consecutively and this study was conducted in March to August 2020. The blood sampling carried out by a Private Laboratory Clinic that meets ISO standards, namely complete peripheral blood examination and ApoB before and after 2 weeks of brisk walking. Brisk walking is done using a Treadmill at a speed of 4.5 km per hour for 30 minutes, twice a week for 2 consecutive weeks. Analysis of this research data using the mean difference between MPV and ApoB before and after doing Brisk Walking for 2 weeks RESULTS AND DISCUSSION We enrolled 20 subjects consecutively for this study. All of the subjects were central obese (waist circumferences more than 90 cm) and aged less than 40 years old. From this study, it was found the mean MPV difference between before and after doing brisk walking for 2 weeks (p=0,000), while there were no significant ApoB differences. However, there were 5 subjects (out of 20 subjects) who experienced a decrease in their ApoB levels even though they had only done brisk walking for 2 weeks. Brisk walking is useful for weight control, reducie body fat, control blood pressure, reduce the risk of cardiovascular disease, reduce the risk of depression, and improve the quality of sleep and life.(3,4) Brisk walking can improve muscle strength, flexibility for knee extensions, and grading kinematics and prevent falls among middle-aged and elderly people.(5,6)

368
Figure 1. .Differences between MPV pre and post 2 weeks of brisk walking
Decreased levels of Apo B by increasing activity in physical such as brisk walking exercise thought to be caused by the activity of the lipoprotein lipase in striated muscle. This causing the catabolism of chylomicrons and VLDL and also the increase in the activity of lecithin-cholesterol acyltransferase. Therefore an increase in the activity physically will be able to lower Apo B levels.(7) Conclusion: In young adults central obese from this study, Brisk walking can reduce the Mean Platelet Volume Keywords: Platelet, ApoB, Brisk Walking, Obese Acknowledgment We gratefully acknowledge all of the people who participated in this study and Prof Kandou General Hospital for creating the possibility to perform this study References
1. Skinner AC, Perrin EM, Moss LA, Skelton JA. Cardiometabolic risks and severity of obesity in children and young adults. New England Journal of Medicine. 2015;373(14):1307-17
2. Yuri GA, Ayvazyan L, Mikhailidis D, Kitas G. Mean platelet volume: a link between thrombosis and inflammation? Current pharmaceutical design. 2011;17(1):47-58
3. Boone HJ, Evenson KR, Taber DR, Gordon LP. Walking for Prevention of Cardiovascular
Disease in Men and Women: A Systematic Review of Observational Studies. Obesity Reviews. 2010. Volume 10(2), P. 204—217.
4. Kraemer JM, Marquez DX. Psychosocial correlates and outcomes of yoga or walking among
older adults. Journal of Psychology. 2009. Volume 143(4), P. 390-404. 5. Okubo Y, Osuka Y, Jung S, Rafael F, Tsujimoto T, Aiba T, et al. Walking Can be more
Effective than Balance Training in Fall Prevention among Community Dwelling Older Adults. Geriatrics and Gerontology International. 2015. http://onlinelibrary.wiley.com/doi/10.1111/ggi.12444/epdf
6. Barnes DE, Whitmer RA, Yaffe K. Physical Activity and Dementia: The Need for Prevention
Trials. Exercise and Sport Sciences Reviews. 2007. Volume 35(1), P. 24-29. 7. Holme I, Høstmark AT, Anderssen SA. ApoB but not LDL-cholesterol is reduced by exercise
training in overweight healthy men. Results from the 1-year randomized Oslo Diet and Exercise Study. J Intern Med. 2007 ; 262 (2): 235–43.
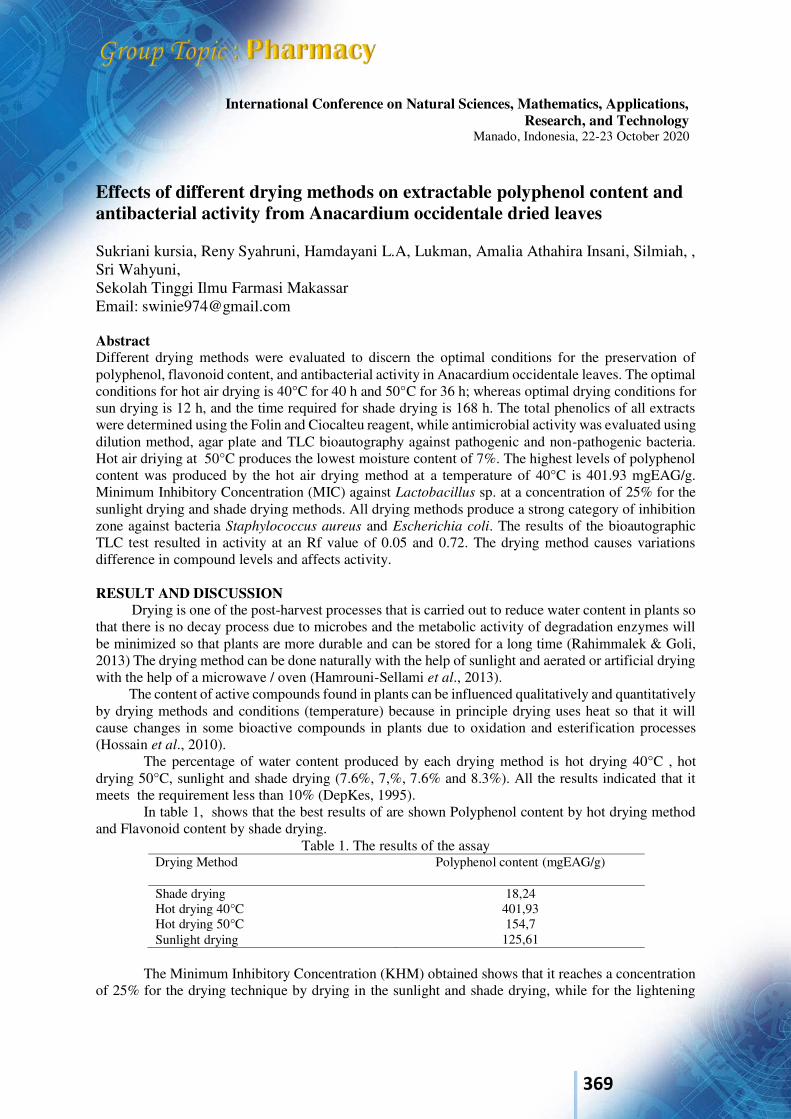
369
International Conference on Natural Sciences, Mathematics, Applications, Research, and Technology
Manado, Indonesia, 22-23 October 2020
Effects of different drying methods on extractable polyphenol content and antibacterial activity from Anacardium occidentale dried leaves Sukriani kursia, Reny Syahruni, Hamdayani L.A, Lukman, Amalia Athahira Insani, Silmiah, , Sri Wahyuni, Sekolah Tinggi Ilmu Farmasi Makassar Email: [email protected] Abstract Different drying methods were evaluated to discern the optimal conditions for the preservation of polyphenol, flavonoid content, and antibacterial activity in Anacardium occidentale leaves. The optimal conditions for hot air drying is 40°C for 40 h and 50°C for 36 h; whereas optimal drying conditions for sun drying is 12 h, and the time required for shade drying is 168 h. The total phenolics of all extracts were determined using the Folin and Ciocalteu reagent, while antimicrobial activity was evaluated using dilution method, agar plate and TLC bioautography against pathogenic and non-pathogenic bacteria. Hot air driying at 50°C produces the lowest moisture content of 7%. The highest levels of polyphenol content was produced by the hot air drying method at a temperature of 40°C is 401.93 mgEAG/g. Minimum Inhibitory Concentration (MIC) against Lactobacillus sp. at a concentration of 25% for the sunlight drying and shade drying methods. All drying methods produce a strong category of inhibition zone against bacteria Staphylococcus aureus and Escherichia coli. The results of the bioautographic TLC test resulted in activity at an Rf value of 0.05 and 0.72. The drying method causes variations difference in compound levels and affects activity. RESULT AND DISCUSSION
Drying is one of the post-harvest processes that is carried out to reduce water content in plants so that there is no decay process due to microbes and the metabolic activity of degradation enzymes will be minimized so that plants are more durable and can be stored for a long time (Rahimmalek & Goli, 2013) The drying method can be done naturally with the help of sunlight and aerated or artificial drying with the help of a microwave / oven (Hamrouni-Sellami et al., 2013). The content of active compounds found in plants can be influenced qualitatively and quantitatively by drying methods and conditions (temperature) because in principle drying uses heat so that it will cause changes in some bioactive compounds in plants due to oxidation and esterification processes (Hossain et al., 2010).
The percentage of water content produced by each drying method is hot drying 40°C , hot drying 50°C, sunlight and shade drying (7.6%, 7,%, 7.6% and 8.3%). All the results indicated that it meets the requirement less than 10% (DepKes, 1995).
In table 1, shows that the best results of are shown Polyphenol content by hot drying method and Flavonoid content by shade drying.
Table 1. The results of the assay Drying Method Polyphenol content (mgEAG/g)
Shade drying 18,24 Hot drying 40°C 401,93 Hot drying 50°C 154,7 Sunlight drying 125,61
The Minimum Inhibitory Concentration (KHM) obtained shows that it reaches a concentration
of 25% for the drying technique by drying in the sunlight and shade drying, while for the lightening
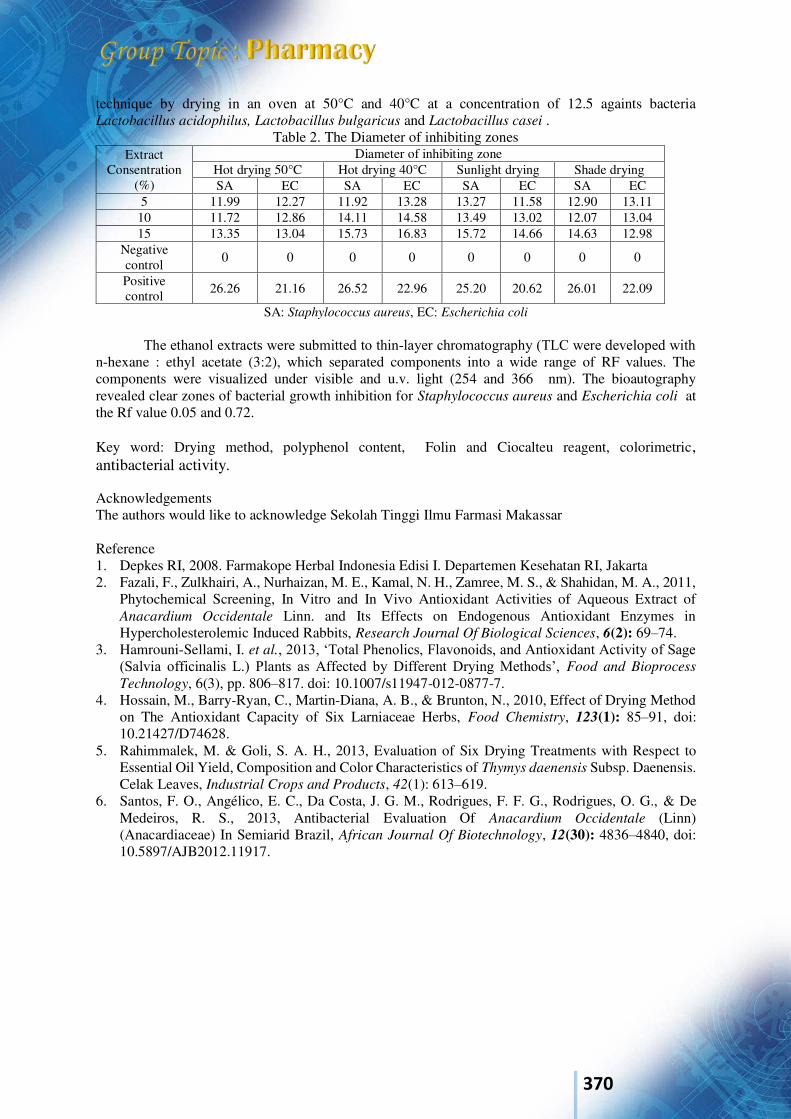
370
technique by drying in an oven at 50°C and 40°C at a concentration of 12.5 againts bacteria Lactobacillus acidophilus, Lactobacillus bulgaricus and Lactobacillus casei .
Table 2. The Diameter of inhibiting zones
Extract Consentration
(%)
Diameter of inhibiting zone Hot drying 50°C Hot drying 40°C Sunlight drying Shade drying SA EC SA EC SA EC SA EC
5 11.99 12.27 11.92 13.28 13.27 11.58 12.90 13.11 10 11.72 12.86 14.11 14.58 13.49 13.02 12.07 13.04 15 13.35 13.04 15.73 16.83 15.72 14.66 14.63 12.98
Negative control 0 0 0 0 0 0 0 0
Positive control 26.26 21.16 26.52 22.96 25.20 20.62 26.01 22.09
SA: Staphylococcus aureus, EC: Escherichia coli
The ethanol extracts were submitted to thin‐layer chromatography (TLC were developed with
n-hexane : ethyl acetate (3:2), which separated components into a wide range of RF values. The components were visualized under visible and u.v. light (254 and 366 nm). The bioautography revealed clear zones of bacterial growth inhibition for Staphylococcus aureus and Escherichia coli at the Rf value 0.05 and 0.72.
Key word: Drying method, polyphenol content, Folin and Ciocalteu reagent, colorimetric, antibacterial activity. Acknowledgements The authors would like to acknowledge Sekolah Tinggi Ilmu Farmasi Makassar Reference 1. Depkes RI, 2008. Farmakope Herbal Indonesia Edisi I. Departemen Kesehatan RI, Jakarta 2. Fazali, F., Zulkhairi, A., Nurhaizan, M. E., Kamal, N. H., Zamree, M. S., & Shahidan, M. A., 2011,
Phytochemical Screening, In Vitro and In Vivo Antioxidant Activities of Aqueous Extract of Anacardium Occidentale Linn. and Its Effects on Endogenous Antioxidant Enzymes in Hypercholesterolemic Induced Rabbits, Research Journal Of Biological Sciences, 6(2): 69–74.
3. Hamrouni-Sellami, I. et al., 2013, ‘Total Phenolics, Flavonoids, and Antioxidant Activity of Sage (Salvia officinalis L.) Plants as Affected by Different Drying Methods’, Food and Bioprocess
Technology, 6(3), pp. 806–817. doi: 10.1007/s11947-012-0877-7. 4. Hossain, M., Barry-Ryan, C., Martin-Diana, A. B., & Brunton, N., 2010, Effect of Drying Method
on The Antioxidant Capacity of Six Larniaceae Herbs, Food Chemistry, 123(1): 85–91, doi: 10.21427/D74628.
5. Rahimmalek, M. & Goli, S. A. H., 2013, Evaluation of Six Drying Treatments with Respect to Essential Oil Yield, Composition and Color Characteristics of Thymys daenensis Subsp. Daenensis. Celak Leaves, Industrial Crops and Products, 42(1): 613–619.
6. Santos, F. O., Angélico, E. C., Da Costa, J. G. M., Rodrigues, F. F. G., Rodrigues, O. G., & De Medeiros, R. S., 2013, Antibacterial Evaluation Of Anacardium Occidentale (Linn) (Anacardiaceae) In Semiarid Brazil, African Journal Of Biotechnology, 12(30): 4836–4840, doi: 10.5897/AJB2012.11917.

371
International Conference on Natural Sciences, Mathematics, Applications, Research, and Technology
Manado, Indonesia, 22-23 October 2020
Analysis of Bioactive Compounds in Snake fruit as Anti-SARS-CoV-2 Lady Theresia Lombogia*1, Olvie Syenni Datu2 and Trina Ekawati Tallei3
1, 2Pharmacy Study Program, Faculty of Mathematics and Natural Sciences, Sam Ratulangi University, Kampus UNSRAT Manado 95115, Indonesia. (E-mail: [email protected], [email protected]) 3Department of Biology, Faculty of Mathematics and Natural Sciences, Sam Ratulangi University, Kampus UNSRAT Manado 95115, Indonesia. (E-mail: [email protected])
ABSTRACT Snake or salak fruit (Salacca zalacca) is believed by people to have good properties for the
health of the body. The processing of salak fruit continues to be developed and used as a variety of products with economic value. This study aimed to investigate the potential of phytoconstituents of snake fruit as anti-SARS-CoV-2 using molecular docking approach. The docking was performed using Autodock Vina. The results revealed that proanthocyanidins, chlorogenic acid, quercetin, β-carotene and epicatechin had the highest binding affinity to SARS-CoV-2. In this study, it can be concluded that the 5 best compounds contained in salak fruit have the potential to be studied further as Anti-SARS-CoV-2. Keywords : Salacca zalacca, SARS-CoV-2, molecular docking, phytoconstituent, snake fruit INTRODUCTION
The SARS-CoV-2 (Severe Acute Respiratory Syndromes Coronavirus 2) infection, which is currently becoming a pandemic, causes respiratory problems, fever, indigestion, and even serious symptoms such as shortness of breath, chest pain and decreased consciousness. So far, the management of SARS-CoV-2 infection has been carried out by administering drugs as a curative effort. Preclinical studies of other CoV that are genetically very close to SARS-Cov-2 suggest that COVID-19 patients can be treated using several drugs including alpha-interferon, chloroquine phosphate, arabinol, remdesivir, lopinavir / ritonavir, and anti-inflammatory drugs [4]. Several researchers have also studied the benefits of bioactive compounds from plants as anti-SARS-CoV-2 lead compounds.
One of the potential sources of active compounds to be studied is snake fruit. Snake fruit is in
demand by the public and is generally used as dried fruit, pickles, chips, canned fruit in syrup, and so on [2]. Some people in Indonesia use this snake fruit as a traditional medicine. Some parts of the snake fruit that are used as medicinal ingredients include the flesh, seeds, and peel [1]. This study examined the potential of several compounds contained in zalacca fruit as anti-SARS-CoV-2 through a molecular docking approach. RESULTS AND DISCUSSION The results of molecular docking of the compounds contained in the fruit showed free binding (ΔG ) between -7.1 kcal / mol to -9.5 kcal/mol (Tabel 1). These results indicate that these compounds have the potential to be studied further as antiviral agents. In the binding of ligands and receptors, the lowest ΔG is considered to have the highest binding affinity [3]. This is because if the ΔG value is getting more negative, it shows the bond is getting more stable.
This affinity value does not necessarily represent the activity that will occur. So, it is necessary to do further experimental validation, either by in vitro or in vivo tests. Nonetheless, molecular docking
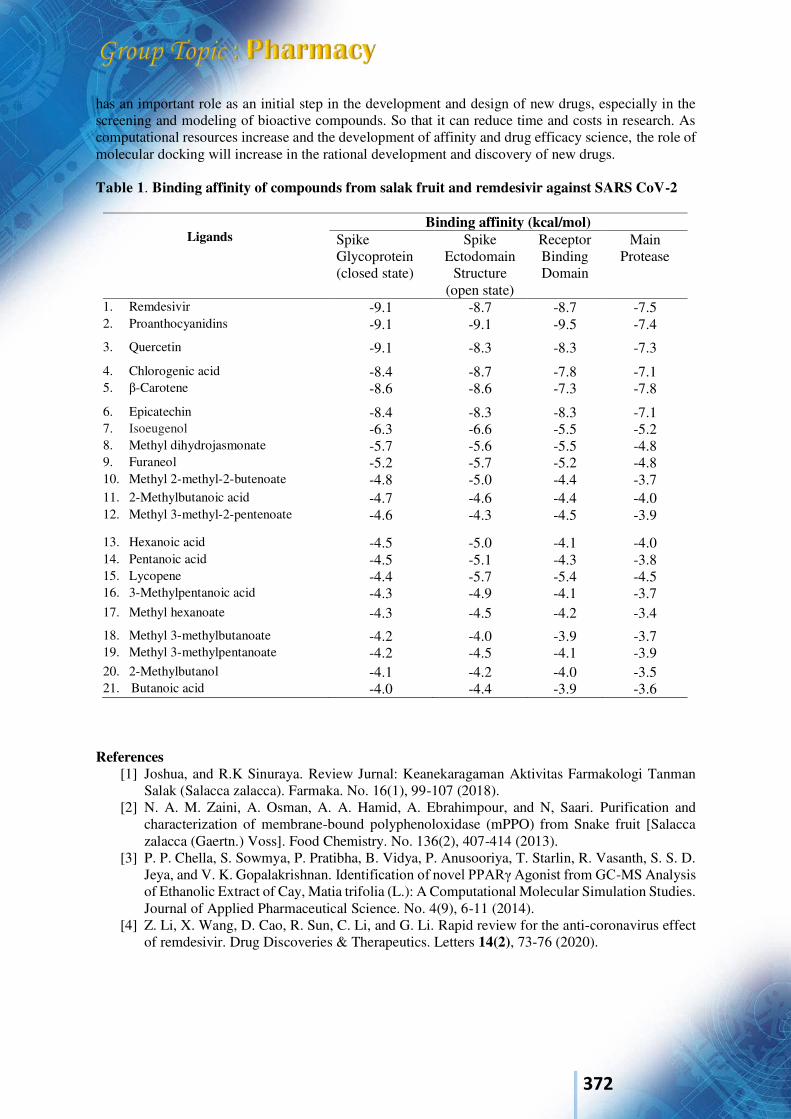
372
has an important role as an initial step in the development and design of new drugs, especially in the screening and modeling of bioactive compounds. So that it can reduce time and costs in research. As computational resources increase and the development of affinity and drug efficacy science, the role of molecular docking will increase in the rational development and discovery of new drugs. Table 1. Binding affinity of compounds from salak fruit and remdesivir against SARS CoV-2
Ligands
Binding affinity (kcal/mol) Spike Glycoprotein (closed state)
Spike Ectodomain
Structure (open state)
Receptor Binding Domain
Main Protease
1. Remdesivir -9.1 -8.7 -8.7 -7.5 2. Proanthocyanidins -9.1 -9.1 -9.5 -7.4
3. Quercetin -9.1 -8.3 -8.3 -7.3
4. Chlorogenic acid -8.4 -8.7 -7.8 -7.1 5. β-Carotene -8.6 -8.6 -7.3 -7.8
6. Epicatechin -8.4 -8.3 -8.3 -7.1 7. Isoeugenol -6.3 -6.6 -5.5 -5.2 8. Methyl dihydrojasmonate -5.7 -5.6 -5.5 -4.8 9. Furaneol -5.2 -5.7 -5.2 -4.8 10. Methyl 2-methyl-2-butenoate -4.8 -5.0 -4.4 -3.7 11. 2-Methylbutanoic acid -4.7 -4.6 -4.4 -4.0 12. Methyl 3-methyl-2-pentenoate -4.6 -4.3 -4.5 -3.9
13. Hexanoic acid -4.5 -5.0 -4.1 -4.0 14. Pentanoic acid -4.5 -5.1 -4.3 -3.8 15. Lycopene -4.4 -5.7 -5.4 -4.5 16. 3-Methylpentanoic acid -4.3 -4.9 -4.1 -3.7 17. Methyl hexanoate -4.3 -4.5 -4.2 -3.4
18. Methyl 3-methylbutanoate -4.2 -4.0 -3.9 -3.7 19. Methyl 3-methylpentanoate -4.2 -4.5 -4.1 -3.9 20. 2-Methylbutanol -4.1 -4.2 -4.0 -3.5 21. Butanoic acid -4.0 -4.4 -3.9 -3.6
References
[1] Joshua, and R.K Sinuraya. Review Jurnal: Keanekaragaman Aktivitas Farmakologi Tanman Salak (Salacca zalacca). Farmaka. No. 16(1), 99-107 (2018).
[2] N. A. M. Zaini, A. Osman, A. A. Hamid, A. Ebrahimpour, and N, Saari. Purification and characterization of membrane-bound polyphenoloxidase (mPPO) from Snake fruit [Salacca zalacca (Gaertn.) Voss]. Food Chemistry. No. 136(2), 407-414 (2013).
[3] P. P. Chella, S. Sowmya, P. Pratibha, B. Vidya, P. Anusooriya, T. Starlin, R. Vasanth, S. S. D. Jeya, and V. K. Gopalakrishnan. Identification of novel PPARγ Agonist from GC-MS Analysis of Ethanolic Extract of Cay, Matia trifolia (L.): A Computational Molecular Simulation Studies. Journal of Applied Pharmaceutical Science. No. 4(9), 6-11 (2014).
[4] Z. Li, X. Wang, D. Cao, R. Sun, C. Li, and G. Li. Rapid review for the anti-coronavirus effect of remdesivir. Drug Discoveries & Therapeutics. Letters 14(2), 73-76 (2020).
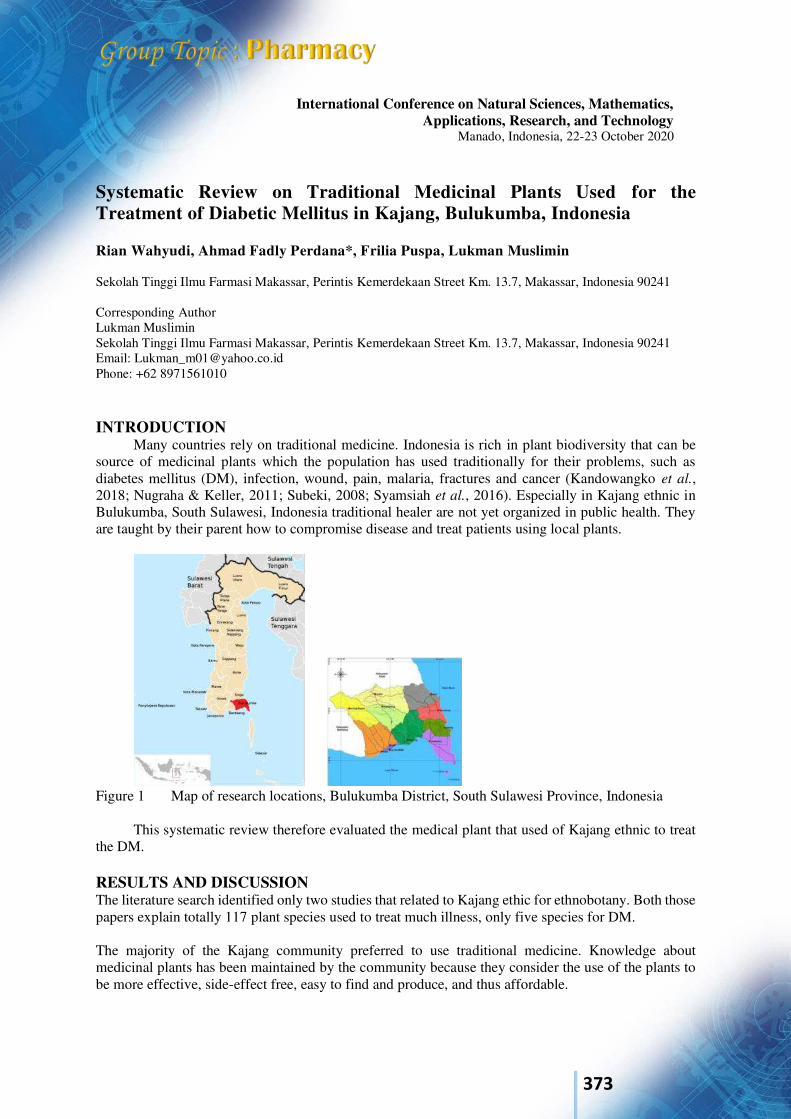
373
International Conference on Natural Sciences, Mathematics, Applications, Research, and Technology
Manado, Indonesia, 22-23 October 2020
Systematic Review on Traditional Medicinal Plants Used for the Treatment of Diabetic Mellitus in Kajang, Bulukumba, Indonesia Rian Wahyudi, Ahmad Fadly Perdana*, Frilia Puspa, Lukman Muslimin
Sekolah Tinggi Ilmu Farmasi Makassar, Perintis Kemerdekaan Street Km. 13.7, Makassar, Indonesia 90241 Corresponding Author Lukman Muslimin Sekolah Tinggi Ilmu Farmasi Makassar, Perintis Kemerdekaan Street Km. 13.7, Makassar, Indonesia 90241 Email: [email protected] Phone: +62 8971561010 INTRODUCTION
Many countries rely on traditional medicine. Indonesia is rich in plant biodiversity that can be source of medicinal plants which the population has used traditionally for their problems, such as diabetes mellitus (DM), infection, wound, pain, malaria, fractures and cancer (Kandowangko et al., 2018; Nugraha & Keller, 2011; Subeki, 2008; Syamsiah et al., 2016). Especially in Kajang ethnic in Bulukumba, South Sulawesi, Indonesia traditional healer are not yet organized in public health. They are taught by their parent how to compromise disease and treat patients using local plants.
Figure 1 Map of research locations, Bulukumba District, South Sulawesi Province, Indonesia
This systematic review therefore evaluated the medical plant that used of Kajang ethnic to treat
the DM. RESULTS AND DISCUSSION The literature search identified only two studies that related to Kajang ethic for ethnobotany. Both those papers explain totally 117 plant species used to treat much illness, only five species for DM. The majority of the Kajang community preferred to use traditional medicine. Knowledge about medicinal plants has been maintained by the community because they consider the use of the plants to be more effective, side-effect free, easy to find and produce, and thus affordable.
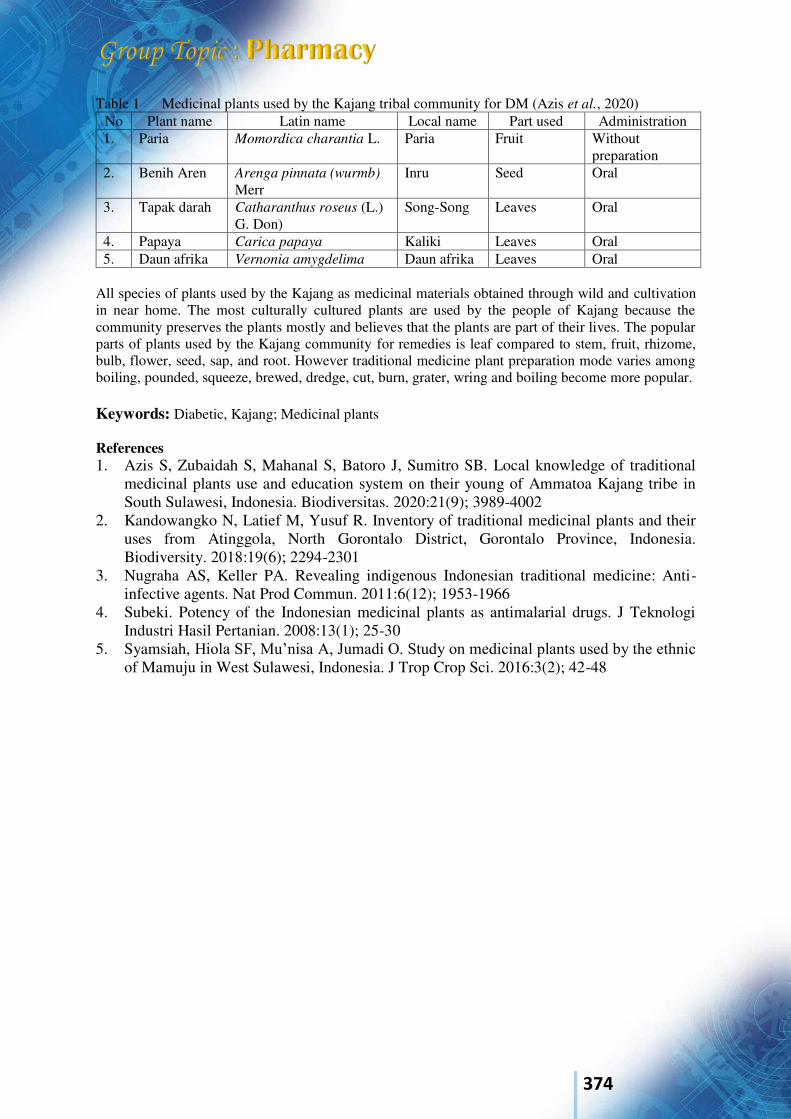
374
Table 1 Medicinal plants used by the Kajang tribal community for DM (Azis et al., 2020) No Plant name Latin name Local name Part used Administration 1. Paria Momordica charantia L. Paria Fruit Without
preparation 2. Benih Aren Arenga pinnata (wurmb)
Merr Inru Seed Oral
3. Tapak darah Catharanthus roseus (L.) G. Don)
Song-Song Leaves Oral
4. Papaya Carica papaya Kaliki Leaves Oral 5. Daun afrika Vernonia amygdelima Daun afrika Leaves Oral
All species of plants used by the Kajang as medicinal materials obtained through wild and cultivation in near home. The most culturally cultured plants are used by the people of Kajang because the community preserves the plants mostly and believes that the plants are part of their lives. The popular parts of plants used by the Kajang community for remedies is leaf compared to stem, fruit, rhizome, bulb, flower, seed, sap, and root. However traditional medicine plant preparation mode varies among boiling, pounded, squeeze, brewed, dredge, cut, burn, grater, wring and boiling become more popular. Keywords: Diabetic, Kajang; Medicinal plants
References 1. Azis S, Zubaidah S, Mahanal S, Batoro J, Sumitro SB. Local knowledge of traditional
medicinal plants use and education system on their young of Ammatoa Kajang tribe in South Sulawesi, Indonesia. Biodiversitas. 2020:21(9); 3989-4002
2. Kandowangko N, Latief M, Yusuf R. Inventory of traditional medicinal plants and their uses from Atinggola, North Gorontalo District, Gorontalo Province, Indonesia. Biodiversity. 2018:19(6); 2294-2301
3. Nugraha AS, Keller PA. Revealing indigenous Indonesian traditional medicine: Anti-infective agents. Nat Prod Commun. 2011:6(12); 1953-1966
4. Subeki. Potency of the Indonesian medicinal plants as antimalarial drugs. J Teknologi Industri Hasil Pertanian. 2008:13(1); 25-30
5. Syamsiah, Hiola SF, Mu’nisa A, Jumadi O. Study on medicinal plants used by the ethnic of Mamuju in West Sulawesi, Indonesia. J Trop Crop Sci. 2016:3(2); 42-48
375
International Conference on Natural Sciences, Mathematics, Applications, Research, and Technology
Manado, Indonesia, 22-23 October 2020
The Influence of Motivation and Work Discipline Towards Employee Performance of Pharmacy Department in Manembo-nembo Bitung Hospital, North Sulawesi, Indonesia G. Citraningtyas*1, I. Jayanto2 and R. Tampa’i3
1, 2Pharmacy Department, Sam Ratulangi University, INDONESIA. (E-mail: [email protected], [email protected]) 3PharmacyDepartment. Tomohon Indonesia Christian University,INDONESIA. (E-mail: [email protected]) INTRODUCTION Human power is the back bone for the provision of quality health care for the population. Health services are affected by many factors such as human resources. Despite individualized education and competency development of pharmacist are important but skills, behavior, and attitudes values thereby receive real significant through experience in practice. Several factors such as motivation and work discipline from within the organization itself have different effects on performance of pharmaceutical personnel. The performance of a pharmacist as the implementer of pharmaceutical services is an important issue that must be studied to increase the quality of hospital services. A good performance of a pharmacist is an indicator of health services. From point of view of human resources, motivation and work discipline are the main factors which influence on a pharmacist performance. The objective of this research was to evaluate the effect of motivation and work discipline on pharmacist performance in pharmacy department. A cross-sectional study was conducted in June 2020. The respondent is all of the pharmacist in pharmacy department as many as 25 people. Questionnaire is used as measuring tool which consist of three variables namely motivation, work discipline and performance. The data was processed using SPPS version 23 for windows. Validity and reliability test was conducted on respondents answer, followed with multiple linier regression test. RESULTS AND DISCUSSION This test uses the Kolmogorov-Smirnov analysis of the residual data that appears in the data view after the first linear regression analysis [4]. Values obtained normality test indicates the data are normally distributed or not.This will determine the researcher to select parametric or nonparametric statistical calculations.The results of the normality test can be seen from the Asymp value. Sig. (2-tailed) = 0.189. A model is said to free their multikolinearitas if there is a variable X (independent) may not be correlated. This can be seen from the tolerance and VIF (Varian Inflation Factor) values. The value of tolerance that the majority of the variables around the number 1 and VIF (Varian Inflation Factor) can not exceed the number 10 [5]. The multicollinearity value is calculated from the VIF value in the Collinearity Statistics column with a number <10. The result of the calculation, 1,998 VIF value that indicates that there is no multicollinearity. Tolerance value of 0.501 is more than 0.1, which means that
376
there is no multicollinearity so that the regression results can be said to be precise between the independent and dependent variables. The value of the independent variables (discipline and motivation) has a Sig value, namely 0.071 and 0.06. There is no heteroscedasticity if all independent variables have a Sig. more than 0.05. These results indicate that the independent variable is > 0.05, meaning that there is no heteroscedasticity in this multiple regression test [6]. The independent variable affects the dependent variable if the Sig value is less than 0.05. Calculations researchers showed that the Sig. 0,00 so that discipline and motivation variables have a significant effect on performance. The calculation results obtained the number 0.704 or 70.4%.So that the effect of work discipline and motivation on performance is 70.4%. The value of the two independent variables shows a positive sign with the Sig. <0.05. The influence of each independent variable can be seen on the previous partial Correlations column squared first. The values of motivation and work discipline have an effect of 0.350 and 0.654, respectively. These results should be squared first be 0.123 and 0.428. So that the value of motivation and the value of work discipline have an effect on the performance value of 12.3% and 42.8%. Keywords: Employee Performance, Motivation, Work Discipline Acknowledgment We would like to thank the Director of Manembo-nembo Bitung Hospital who giving the research permission and all pharmacy installation employees who have helped in research activities. We are also grateful to Sam Ratulangi University who has helped provide research funding. References 1. Stella, G, Pasquale, S, Gueli, Am. 2020. Statistical Approach For Equivalent Dose Determination In
Historical Mortars Dating, International Journal Of Conservation Science, 11 (1) : 345 – 352. 2. Tatliyer, A, Bas, S, Yagci, S. 2019. Use of Factor Scores in Multiple Regression for Predicting Live
Weight in Indigenous Savak Akkaraman Lambs, Pakistan J. Zool., 51 (3) : 1035 – 1040. 3. Klein, AG, Gerhard, C, Büchner, RD, Diestel, S, Schermelleh-Engel, K. 2016. The
Detection Of Heteroscedasticity InRegression Models For Psychological Data, Psychological Test and Assessment Modeling, 58 (4) : 567 – 592. R. C. Mikkelson (private communication).
377
International Conference on Natural Sciences, Mathematics, Applications, Research, and Technology
Manado, Indonesia, 22-23October 2020
Designing Instructional Multimedia of Curved Three-dimensional Geometric Shapes in Junior High Schools Throughout Gorontalo Province Nursiya Bito*1, Sumarno Ismail2
1.2 Mathematics Department, Gorontalo State University, INDONESIA. (E-mail: [email protected], [email protected]) INTRODUCTION
Math learning serves as a process that is designed and emphasized on exploration and investigation to familiarize students to use science in solving problems. The students are prepared to become competitive, adaptive, and self-contained human resources. Accordingly, it is essential to enhance learning quality, relevance, renewal, and innovation in a planned, directed, and sustainable manner.
Innovations in math learning are attempted through the utilization of information and communication technology (ICT). Multimedia are among the forms of ICT apps employed in the learning process. Multimedia refer to the combination of two or more elements, including text, graph, audio, visual, or animation [1]. In the same tune, [2] mention the characteristics of instructional multimedia, as follows:
1. Featuring more than one convergent media, e.g., bringing together the audio and visual elements.
2. Having an interactive quality and capability of accommodating user response. 3. Being autonomous, user-friendly, and content-complete in such a way that the user can
use the media single-handedly. Utilizing instructional multimedia enables students to be more engaged in the classroom,
making the teachers not become the only learning source. Animation in multimedia makes it attractive and able to increase student learning outcomes.
The benefits of instructional multimedia, according to Newby, Stepich, Lehman, and Russell [3], consist of (1) realistic, in which students can listen to actual events as what has been received; (2) motivating students to better their positive attitude; (3) effective for all types of learning; (4) interactive, multimedia are able to present information, feedback, and evaluation; (5) consistent, all students can carry out the procedures and stages; (6) controlled, every student can use the multimedia; (7) personal, each student is able to control the learning process as in accordance with their level of understanding; (8) making the lesson more fascinating; (9) suitable for various learning types. For such reasons, the math learning process gets more interactive, interesting, and great fun.
Using multimedia in the classroom will create a significant learning condition as the students take different opportunities of learning with the designed multimedia that are relevant to learning objectives.
Several previous studies show that interactive multimedia are capable of increasing student learning outcomes at all levels of education. Computer-based multimedia presentation is more successful than the conventional method [4]. Further, [5] points out that a traditional approach prepares students only to sit passively while looking forward to the information; thus, they lack motivation. If teachers present a substantial and unique learning environment, the
378
students will find the lesson easier and more efficacious. Learning topics can be adjusted to students’ characteristics and give opportunities for them to study with their own styles and comprehensions. [6] investigates the effect of multimedia apps supported by instructional software; it reveals that using multimedia apps contributes to students’ learning process and positively affects their behavior towards science. On top of that, a study conducted by [7] concludes that multimedia-based teaching and learning process can change students’ behavior. Such a process is more organized and understandable. As multimedia are useful tools for teaching, those previous studies come to the conclusion that the multimedia-based learning process is more working than the conventional one. [8], in her study, discovers that the use of multimedia is more worthwhile compared to the traditional method at the level of knowledge, understanding, and application. Multimedia also make an enormous contribution to mathematics learning outcomes in the topic of geometry [9].
The objective of this study was to develop character-based instructional multimedia of curved three-dimensional geometric shapes in the ninth grade of junior high schools throughout Gorontalo province. The development model referred to the 4-D Model (Define, Design, Develop and Disseminate) proposed by Thiagarajan, Semmel and Semmel [10] RESULTS AND DISCUSSION Expert Validation
The validity of instructional multimedia of curved three-dimensional geometric shapes comprises many assessment parameters, including material/topic (content, language, and legibility) and design. Validity results revolve around qualitative suggestions and assessment sheets. Qualitative suggestions are treated as a reference to revise the instructional multimedia.
Based on the result of expert validation involving teachers and lecturers, the achievement percentage arrives at 90.88% with an excellent qualification (revision is unnecessary). Accordingly, the content, language, and legibility of the curved three-dimensional geometric shapes multimedia can be applied in the learning process.
From the assessment of the design expert, the developed multimedia fall under an excellent qualification, as proven by the percentage of the achievement of curved three-dimensional geometric shapes multimedia by 92.22%. On that ground, the multimedia feature the first-class design in terms of display and interactivity and are applicable in the classroom.
Instructional multimedia draw students’ attention to study better rather than the traditional method of teaching [11]. Koehnert’s theory brings out the fact that the more senses involved in the learning process, the more successful the process itself. Once students stand in an effective situation to study and involve more senses to absorb information, it will be much easier for them to grasp the lesson. Product Trial
1. The response and implementation of the learning process utilizing the multimedia of curved three-dimensional geometric shapes.
It is shown in the observation result regarding learning implementation with instructional multimedia that the interactive multimedia of curved three-dimensional geometric shapes are practical to use.
Table 1 Analysis of Learning Implementation by Employing Curved Three-Dimensional Geometric Shapes Multimedia
Junior High Schools Percentage of Learning Implementation (%)
Criteria
SMPN 1 Duhiadaa 89.73% Excellent SMPN 2 Gorontalo SMPN 1 Tapa
93.82% 91.40%
Excellent Excellent
379
MTsN 2 Gorontalo Regency MTsN 2 Boalemo MTs Alkhairaat North Gorontalo Regency
90.22% 90.18% 91.72%
Excellent Excellent Excellent
Drew on the analysis result of learning implementation in the site area, the multimedia of curved three-dimensional geometric shapes can help teachers perform the lesson and achieve learning objectives. It has something to do with the fact that the learning process is much more enticing, interactive, and time-saving. Teachers play a role as a facilitator in the learning process, guiding group activities, and offering feedback towards learning evaluation that is designed in the multimedia.
Provided in Table 2 are students’ responses to interactive multimedia encompassing the aspects of motivation, interest, practicality, and clarity.
Table 2. Average Percentage of Students’ Responses
Classes Students’ Responses (%) Criteria
SMPN 1 Duhiadaa 85.29% Excellent SMPN 2 Gorontalo SMPN 1 Tapa MTsN 2 Gorontalo Regency MTsN 2 Boalemo MTs Alkhairaat North Gorontalo Regency
89.12% 85.00% 87.52% 85.15% 85.22%
Excellent Excellent Excellent Excellent Excellent
Table 2 indicates that students’ responses to the interactive multimedia of curved three-
dimensional geometric shapes fall under excellent criteria. Simply put, they respond positively to the application of multimedia in the classroom. The students are very keen to study, as shown by their interest and attention during the lesson because the multimedia are attractive, user-friendly, and clear for them. This is in line with a study conducted by [12] on the linkage between media and computer technology towards students’ learning motivation. It is found that learning motivation is of major importance in the learning process. Computer-based technology and media are able to drive the students to study effectively and even to study independently.
Similarly, [3] claim the benefits of instructional multimedia, including (1) realistic, in which students can listen to real events as what has been received; (2) motivating students to better their positive attitude; (3) effective for all types of learning; (4) interactive, multimedia are able to present information, feedback of materials, and evaluation; (5) consistent, the procedures and stages can be carried out by all students; (6) controlled, every student can use the multimedia; (7) personal, each student is able to control the learning process as in accordance with their level of understanding; (8) making the lesson more fascinating.
In addition, the test of cognitive learning outcomes obtains the following data.
Table 3. Average Percentage of Student Learning Outcomes
Classes classical outcome mastery (%) Criteria
SMPN 1 Duhiadaa 85.19% Excellent SMPN 2 Gorontalo SMPN 1 Tapa MTsN 2 Gorontalo Regency MTsN 2 Boalemo MTs Alkhairaat North Gorontalo Regency
87.22% 85.88% 85.60% 85.44% 85.12%
Excellent Excellent Excellent Excellent Excellent
Table 3 illustrates that student learning outcomes reach excellent criteria, meaning that
the application of curved three-dimensional geometric shapes multimedia positively contributes to increasing their learning outcomes. The aforementioned multimedia facilitate the
380
students to comprehend math concepts. Interactive multimedia-based learning process can help students improve conceptual understanding. Furthermore, [9], in their study, sum up that multimedia have a huge impact on mathematics learning outcomes, and the delivery of geometry topic becomes more actual and is able to influence students’ memory. [13] also strengthens this idea, in which studying geometry through multimedia can motivate students to overcome abstract and complicated problems and concepts.
Keywords : curved three dimensional geometric, instructional multimedia. Acknowledgements:
The authors sincere thanks to Trans Bahasa, Gorontalo for editing a draft of this manuscript, Kemenkumham Indonesia for HKI of this multimedia, and gratitude to the PDD Scholarship of The Indonesia Goverment for Financial Support (Recearch Grant No.071SP2H/LT/DRPM/2019). The authors would also like to acknowledge the help of the anonymous reviewers. References [1] Ziden, Azidah Abu. Rahman, Muhammad Faizal Abdul. 2013. The Effectiveness of Web-
Based Multimedia Applications Simulation in Teaching and Learning. International Journal of Instruction. Vol.6 No.2. e-ISSN: 1308-1470. p-ISSN: 1694-609X
[2] Ariani, Niken and Haryanto, Dani. 2010. Pembelajaran Multimedia Di Sekolah Pedoman Pembelajaran Inspiratif, Konstruktif dan Prospektif [Multimedia Learning in School: Guidelines of Inspiring, Constructive, and Prospective Learning]. Jakarta: Prestasi Pustaka
[3] Newby, Timothy J, et al. 2000. Instructional Technology for Teaching and Learning. Upper Saddle River. New Jersey: Prentice-Hall. Inc. Pearson Education.
[4] Olori, Abiola Lateef and Igbosanu, Adekunle Olusegun. 2016. Effect of Computer-Based Multimedia Presentation on Senior Secondary Students’ Achievement in Agricultural Science. Journal of Education and Practice ISSN 2222-1735 (paper) ISSN: 2222-288X (online). Vol. 7, No.31. hal 31-38
[5] Ercan, Orhan. 2014. The Effects of Multimedia Learning Material on Students, Academic Achievement and Attitudes Towards Science Courses. Journal of Baltic Science Education. ISSN: 1648-3898. Hal: 608-621
[6] Su, K.D. 2008. An Integrated Science Course Designed with Information Communication Technologies to Enhance University Students, Learning Performance. Computer & Education , 50(4), 1411-1422
[7] Yohannes, Haftamu Menker Gebre, Bhatti, Abdul Hadi. Hasan, Raza. 2016. Impact of Multimedia in Teaching Mathematics. International Journal of Mathematics Trends and Technology (IJMTT). Vol.39 No.1 November 2016.
[8] Sharma, Nidhi. 2017. Impact of Multimedia Against Single Medium of Teaching on Learning Outcomes. Kaav International Journal OFeconomics, Commerce & Business Management KIJECBM/Jul-Sep 2017/Vol.4. ISS-3/18 hal: 116-121. ISSN: 2348-4969 Impact Factor (2017)-7.8902
[9] Andinny, Yuan. Lestari, Indah. 2016. Pengaruh Pembelajaran Multimedia terhadap Hasil Belajar Matematika [The Effect of Multimedia Learning on Mathematics Learning Outcomes]. Jurnal Kajian Pendidikan Matematika (JKPM).Vol.01 No.02, 01 June 2016. Hal.169-179
[10] Thiagarajan, Sivasailam. Dorothy S. Semmel dan Melvyn I. Semmel. 1974. Instructional Development for Training Teachers of Exceptional Children. A Sourse Book. Blomingtn: Central for Innovation on Teaching Handicappedp

381
[11] Mayer, M.R. 2009. Multimedia Learning, translated by Baroto Tavip Indrojarwo. Yogyakarta: Pustaka Pelajar.
[12] Odera, F.Y. 2011. Motivation: The most ignored factor in classroom instruction in Kenya secondary schools. International Journal of Science and Technology. 1 (6) 283-288. Available at: http://ejournalofscience.org/archive/vol1no6/vol1no6-15.pdf
[13] Clement, D. H. 1989. Computers in Elementary Mathematics Education. New Jersey: Prantice Hall, Inc.
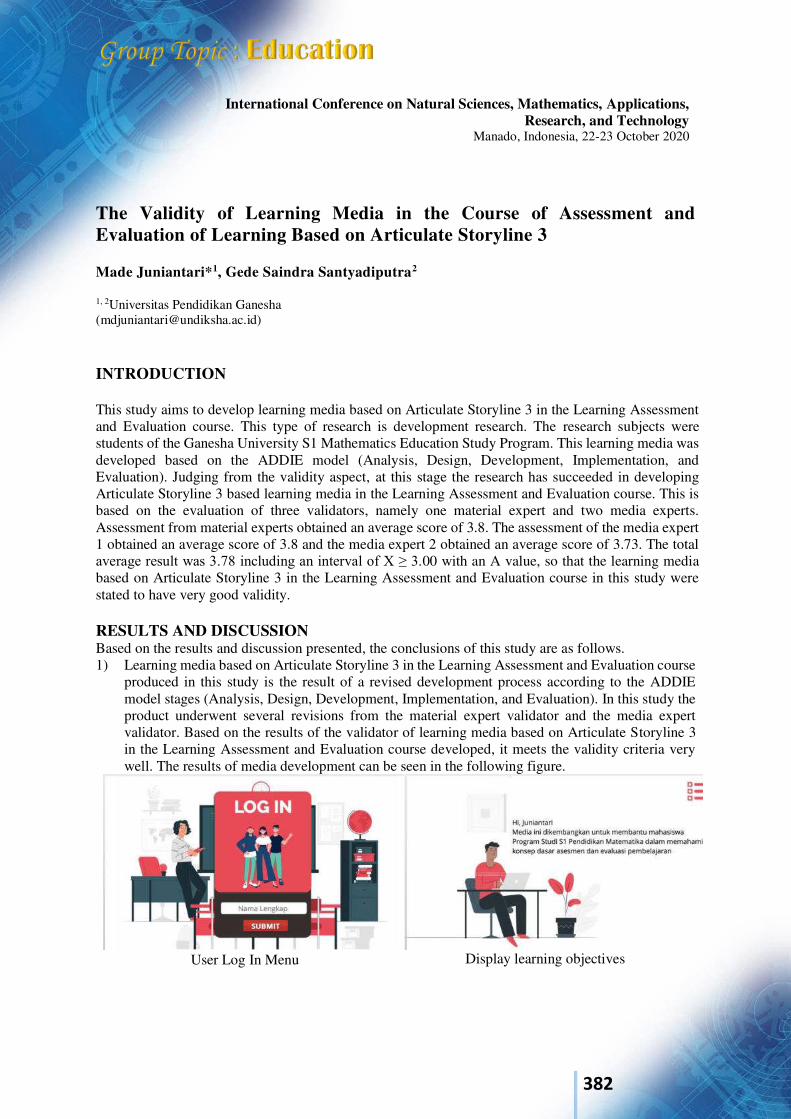
382
International Conference on Natural Sciences, Mathematics, Applications, Research, and Technology
Manado, Indonesia, 22-23 October 2020
The Validity of Learning Media in the Course of Assessment and Evaluation of Learning Based on Articulate Storyline 3 Made Juniantari*1, Gede Saindra Santyadiputra2
1, 2Universitas Pendidikan Ganesha ([email protected]) INTRODUCTION This study aims to develop learning media based on Articulate Storyline 3 in the Learning Assessment and Evaluation course. This type of research is development research. The research subjects were students of the Ganesha University S1 Mathematics Education Study Program. This learning media was developed based on the ADDIE model (Analysis, Design, Development, Implementation, and Evaluation). Judging from the validity aspect, at this stage the research has succeeded in developing Articulate Storyline 3 based learning media in the Learning Assessment and Evaluation course. This is based on the evaluation of three validators, namely one material expert and two media experts. Assessment from material experts obtained an average score of 3.8. The assessment of the media expert 1 obtained an average score of 3.8 and the media expert 2 obtained an average score of 3.73. The total average result was 3.78 including an interval of X ≥ 3.00 with an A value, so that the learning media based on Articulate Storyline 3 in the Learning Assessment and Evaluation course in this study were stated to have very good validity. RESULTS AND DISCUSSION Based on the results and discussion presented, the conclusions of this study are as follows. 1) Learning media based on Articulate Storyline 3 in the Learning Assessment and Evaluation course
produced in this study is the result of a revised development process according to the ADDIE model stages (Analysis, Design, Development, Implementation, and Evaluation). In this study the product underwent several revisions from the material expert validator and the media expert validator. Based on the results of the validator of learning media based on Articulate Storyline 3 in the Learning Assessment and Evaluation course developed, it meets the validity criteria very well. The results of media development can be seen in the following figure.
User Log In Menu Display learning objectives
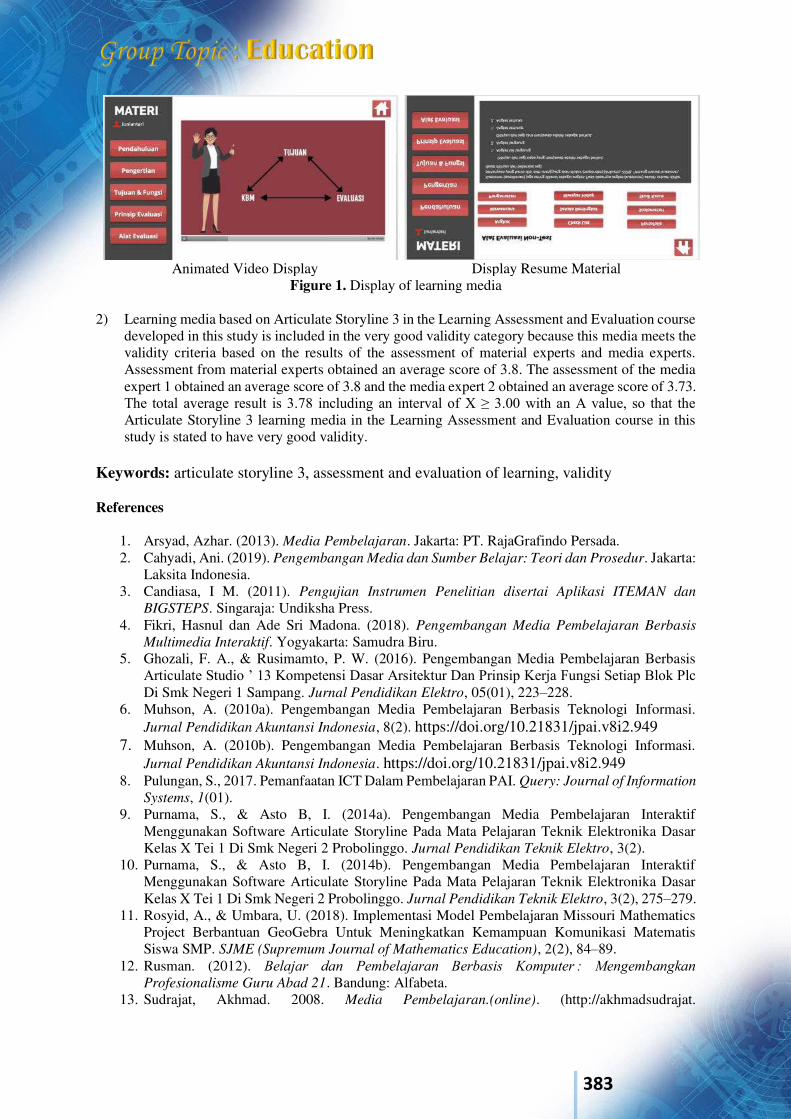
383
Animated Video Display Display Resume Material Figure 1. Display of learning media
2) Learning media based on Articulate Storyline 3 in the Learning Assessment and Evaluation course
developed in this study is included in the very good validity category because this media meets the validity criteria based on the results of the assessment of material experts and media experts. Assessment from material experts obtained an average score of 3.8. The assessment of the media expert 1 obtained an average score of 3.8 and the media expert 2 obtained an average score of 3.73. The total average result is 3.78 including an interval of X ≥ 3.00 with an A value, so that the Articulate Storyline 3 learning media in the Learning Assessment and Evaluation course in this study is stated to have very good validity.
Keywords: articulate storyline 3, assessment and evaluation of learning, validity References
1. Arsyad, Azhar. (2013). Media Pembelajaran. Jakarta: PT. RajaGrafindo Persada. 2. Cahyadi, Ani. (2019). Pengembangan Media dan Sumber Belajar: Teori dan Prosedur. Jakarta:
Laksita Indonesia. 3. Candiasa, I M. (2011). Pengujian Instrumen Penelitian disertai Aplikasi ITEMAN dan
BIGSTEPS. Singaraja: Undiksha Press. 4. Fikri, Hasnul dan Ade Sri Madona. (2018). Pengembangan Media Pembelajaran Berbasis
Multimedia Interaktif. Yogyakarta: Samudra Biru. 5. Ghozali, F. A., & Rusimamto, P. W. (2016). Pengembangan Media Pembelajaran Berbasis
Articulate Studio ’ 13 Kompetensi Dasar Arsitektur Dan Prinsip Kerja Fungsi Setiap Blok Plc Di Smk Negeri 1 Sampang. Jurnal Pendidikan Elektro, 05(01), 223–228.
6. Muhson, A. (2010a). Pengembangan Media Pembelajaran Berbasis Teknologi Informasi. Jurnal Pendidikan Akuntansi Indonesia, 8(2). https://doi.org/10.21831/jpai.v8i2.949
7. Muhson, A. (2010b). Pengembangan Media Pembelajaran Berbasis Teknologi Informasi. Jurnal Pendidikan Akuntansi Indonesia. https://doi.org/10.21831/jpai.v8i2.949
8. Pulungan, S., 2017. Pemanfaatan ICT Dalam Pembelajaran PAI. Query: Journal of Information
Systems, 1(01). 9. Purnama, S., & Asto B, I. (2014a). Pengembangan Media Pembelajaran Interaktif
Menggunakan Software Articulate Storyline Pada Mata Pelajaran Teknik Elektronika Dasar Kelas X Tei 1 Di Smk Negeri 2 Probolinggo. Jurnal Pendidikan Teknik Elektro, 3(2).
10. Purnama, S., & Asto B, I. (2014b). Pengembangan Media Pembelajaran Interaktif Menggunakan Software Articulate Storyline Pada Mata Pelajaran Teknik Elektronika Dasar Kelas X Tei 1 Di Smk Negeri 2 Probolinggo. Jurnal Pendidikan Teknik Elektro, 3(2), 275–279.
11. Rosyid, A., & Umbara, U. (2018). Implementasi Model Pembelajaran Missouri Mathematics Project Berbantuan GeoGebra Untuk Meningkatkan Kemampuan Komunikasi Matematis Siswa SMP. SJME (Supremum Journal of Mathematics Education), 2(2), 84–89.
12. Rusman. (2012). Belajar dan Pembelajaran Berbasis Komputer : Mengembangkan Profesionalisme Guru Abad 21. Bandung: Alfabeta.
13. Sudrajat, Akhmad. 2008. Media Pembelajaran.(online). (http://akhmadsudrajat.

384
wordpress.com/2008/01/12/kons ep-media-pembelajaran/). Diakses 1 Mei 2016. 14. Sugiyono. (2017). Metode Penelitian Pendidikan (Pendekatan Kuantitatif, Kualitatif dan
R&D). Bandung: Alfabeta. 15. Surjono, Herman Dwi. (2017). Multimedia Pembelajaran Interaktif: Konsep dan
Pengembangan. Yogyakarta: UNY Press. 16. Tegeh, I. M., dkk. (2014). Model Penelitian Pengembangan. Yogyakarta: Graha Ilmu. 17. Yahya, R., Ummah, S.K. and Effendi, M.M., 2020. Media Pembelajaran Interaktif Articulate
Storyline: Pengembangan Perangkat Pembelajaran Flipped classroom Bercirikan Mini-project. SJME (Supremum Journal of Mathematics Education), 4(1), pp.78-91.
18. Yumini, S., & Rakhmawati, L. (2015). Pengembangan Media Pembelajaran Interaktif Berbasis Articulate Storyline Pada Mata Diklat Teknik Elektronika Dasar Di Smk Negeri 1 JETIS Mojokerto Siti Yumini Lusia Rakhmawati. Jurnal Pendidikan Teknik
Elektro, 4(3), 845–849.
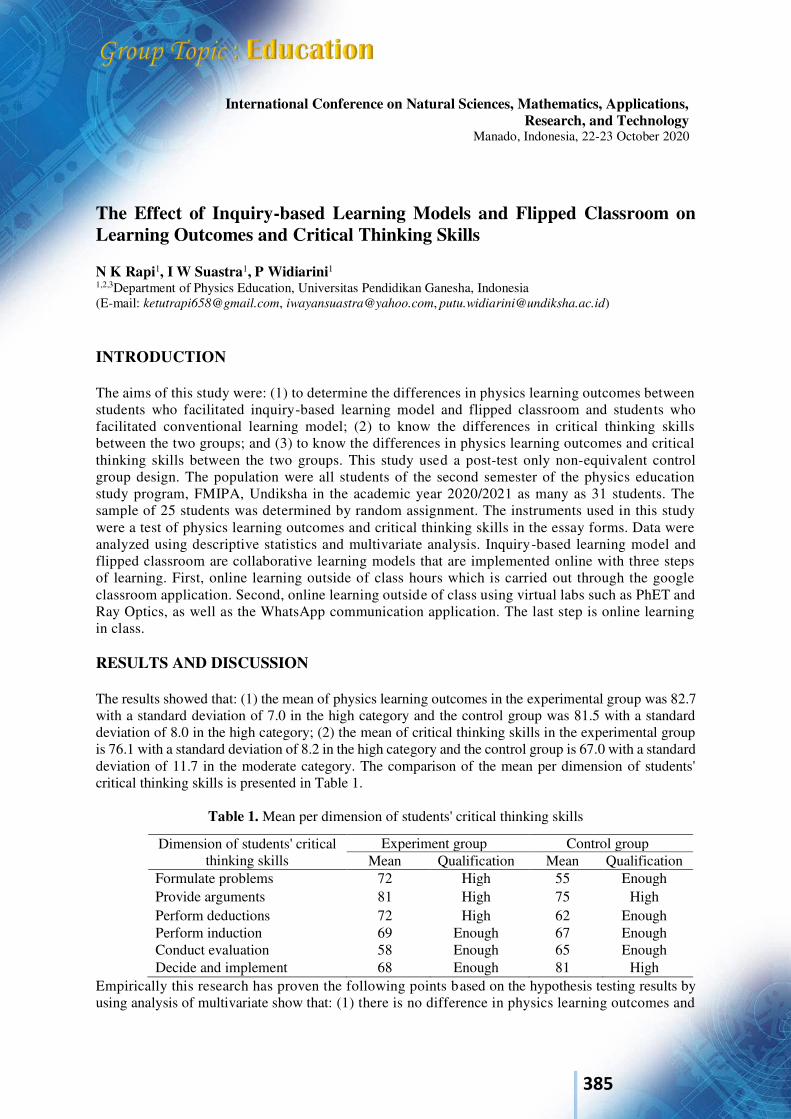
385
International Conference on Natural Sciences, Mathematics, Applications, Research, and Technology
Manado, Indonesia, 22-23 October 2020
The Effect of Inquiry-based Learning Models and Flipped Classroom on Learning Outcomes and Critical Thinking Skills N K Rapi1, I W Suastra1, P Widiarini1 1,2,3Department of Physics Education, Universitas Pendidikan Ganesha, Indonesia (E-mail: [email protected], [email protected], [email protected]) INTRODUCTION The aims of this study were: (1) to determine the differences in physics learning outcomes between students who facilitated inquiry-based learning model and flipped classroom and students who facilitated conventional learning model; (2) to know the differences in critical thinking skills between the two groups; and (3) to know the differences in physics learning outcomes and critical thinking skills between the two groups. This study used a post-test only non-equivalent control group design. The population were all students of the second semester of the physics education study program, FMIPA, Undiksha in the academic year 2020/2021 as many as 31 students. The sample of 25 students was determined by random assignment. The instruments used in this study were a test of physics learning outcomes and critical thinking skills in the essay forms. Data were analyzed using descriptive statistics and multivariate analysis. Inquiry-based learning model and flipped classroom are collaborative learning models that are implemented online with three steps of learning. First, online learning outside of class hours which is carried out through the google classroom application. Second, online learning outside of class using virtual labs such as PhET and Ray Optics, as well as the WhatsApp communication application. The last step is online learning in class. RESULTS AND DISCUSSION The results showed that: (1) the mean of physics learning outcomes in the experimental group was 82.7 with a standard deviation of 7.0 in the high category and the control group was 81.5 with a standard deviation of 8.0 in the high category; (2) the mean of critical thinking skills in the experimental group is 76.1 with a standard deviation of 8.2 in the high category and the control group is 67.0 with a standard deviation of 11.7 in the moderate category. The comparison of the mean per dimension of students' critical thinking skills is presented in Table 1.
Table 1. Mean per dimension of students' critical thinking skills
Empirically this research has proven the following points based on the hypothesis testing results by using analysis of multivariate show that: (1) there is no difference in physics learning outcomes and
Dimension of students' critical thinking skills
Experiment group Control group Mean Qualification Mean Qualification
Formulate problems 72 High 55 Enough Provide arguments 81 High 75 High Perform deductions 72 High 62 Enough Perform induction 69 Enough 67 Enough Conduct evaluation 58 Enough 65 Enough Decide and implement 68 Enough 81 High

386
critical thinking skills together between students who facilitated by inquiry-based learning model and flipped classroom with those facilitated by conventional learning model; (2) there is no difference in physics learning outcomes between students who facilitated by inquiry-based learning model and flipped classroom and those facilitated by conventional learning model. This means that the two learning models have the same effect on the achievement of student physics learning outcomes; and (3) there are differences in critical thinking skills between students who are facilitated by inquiry-based learning model and flipped classroom and those facilitated by conventional learning model. This is due to the advantages of the inquiry -based learning model and the flipped classroom which uses several online learning media and virtual labs in the learning process. Learning activities in inquiry facilitate students to learn as thinkers, not only as passive recipients of knowledge. This model involves the active role of students to construct their knowledge through scientific discovery activities. The guided inquiry learning model involves students actively involved in the discovery of learning concepts and principles to allow for drawing conclusions (Waleulu et. al., 2019). The results of this study are related to previous studies of guided inquiry learning model and flipped classroom approach. Nurdin et. al. (2018) stated that the provision of student worksheets and animation media developed with the guided inquiry syntax can improve student learning outcomes and critical thinking skills. There is a significant improvement in students' critical thinking skills between before and after using the flipped classroom learning model (Maolidah et. al., 2017). Flipped classroom model is effective to improve students learning outcomes (Jdaitawi, 2019). Junaidi et. al. (2016) stated that inquiry-based virtual laboratory learning provides opportunities for students to learn together through discussion activities, express ideas, foster self-confidence, and develop creative thinking and critical thinking skills. The guided inquiry and flipped classroom learning model is one of the innovative learning models based on constructivism that can be an alternative learning model applied outside the classroom or in the classroom according to the learning situation. The model can facilitate an effort to achieve student learning outcomes in physics and critical thinking skills of students in optimal physics learning. Keywords: inquiry, flipped classroom, learning outcomes, critical thinking skills Acknowledgment Thank you to University of Ganesha Education for their funding and facilities on this research. References 1. M. Jdaitawi, The Effect of Flipped Classroom Strategy on Students Learning Outcomes. International Journal
of Instruction, 12(3), 665-680 (2019). 2. G. A. Junaidi and Mursal, Model virtual laboratory berbasis inkuiri untuk meningkatkan keterampilan generik
sains siswa MA. Jurnal Pendidikan Sains Indonesia, 4(2), 130-136 (2016). 3. I. S. Maolidah, T. Ruhimat, and L. Dewi, Efektivitas penerapan model pembelajaran flipped classroom pada
peningkatan kemampuan berpikir kritis siswa, EDUTCEHNOLOGIA, 3(2), 160-170 (2017). 4. H. Nurdin, T. Jalmo, and C. Ertikanto, Effectiveness of guided inquiry model student worksheet to improve
critical thinking skill on heat material, International Journal of Advanced Engineering, Management and Science 4(7), 564-573 (2018).
5. A. Waleulu, M. Muharram, and S. Sugiarti, Pengaruh model pembelajaran inkuiri terbimbing terhadap kemampuan berpikir krtitis dan hasil belajar peserta didik. Chemistry Education Review, 3(1), 8-16 (2019).
387
International Conference on Natural Sciences, Mathematics, Applications, Research, and Technology
Manado, Indonesia, 22-23 October 2020
Students’ digital literacy: A case study in the Bali Province, Indonesia I Wayan Redhana*1, Ida Bagus Nyoman Sudria2 and I Nyoman Suardana3
1,2 Chemistry Education Study Program, Universitas Pendidikan Ganesha, Bali INDONESIA. (E-mail: [email protected], [email protected]) 2 Natural Science Study Program, Universitas Pendidikan Ganesha, Bali, INDONESIA. (E-mail: [email protected]) INTRODUCTION The development of information technology in the 21st century has brought enormous changes to the lines of life. Students must be able to deal with this change by mastering digital literacy. However, so far, measurements of digital literacy, especially students in Bali Indonesia, have not been carried out. This study aims to describe the digital literacy profile of high school students in Bali Province, Indonesia. The study population was high school students in the province of Bali, Indonesia. The samples were drawn with a sampling quota in which 50 students were taken in each district/city. The selection of students in a school was done randomly. From 9 districts/city, 450 students were obtained. The instrument used in this study was a digital literacy instrument developed by Kaeophanuek et al. [1]. This instrument consisted of three dimensions, namely information skills (14 items), digital tool utilization skills (13 items), and digital transformation skills (10 items). The instrument was made using google form and distributed online to high school students. The data obtained in this study were students' digital literacy scores which were analyzed using descriptive and inferential statistics. To compare students' literacy based on dimensions, gender, and grade level, data analysis was carried out using the independent sample t-test and one-factor analysis of variance (ANOVA). All statistical tests were carried out with the help of SPSS 20 software at the 5% significance level. RESULTS AND DISCUSSION The results showed that from 450 data on students' digital literacy scores, there were 10 outlier data. These outlier data were not used so that the analyzed data were as much as 440 students. The number of male and female students involved in this study were 148 and 292 people, respectively. The number of students in grades of X, XI, and XII was 153, 187, and 100 people, respecti vely. The mean scores of digital literacy score based on dimensions were as follows. The mean scores of information skills, digital tool utilization skills, and digital transformation skills were 3,874 ± 0.759, 3.905 ± 0.844, and 3,634 ± 0.853, respectively. The one-way ANOVA test results showed that there was a significant difference in the mean score of students' digital literacy based on dimensions (p <0.050). The LSD test results showed that there were differences in the mean scores of students' digital literacy between the information skills and the digital transformation skills (p <0.050) and between the digital tool utilization skills and the digital transformation skills (p <0.050). Meanwhile, there was no difference in the students' digital literacy between the information skills and the digital tool utilization skills (p> 0.050). The dimension of digital transformation skills was the lowest among the three dimensions of digital literacy. This was

388
because digital transformation skills were the most difficult skills among the three dimensions of digital literacy. The mean scores of the digital literacy of male and female students were 3,826 ± 0.863 and 3,817 ± 0.803, respectively. The results of the mean difference test of students' digital literacy based on gender using the independent sample t-test showed that there was no difference in digital literacy between male and female students (p> 0.05). This was possible because male and female students were accustomed to using digital tools and playing with social media. The mean score of students' digital literacy in grades of X, XI, and XII were 3.745 ± 0.813, 3.796 ± 0.816, and 3,980 ± 0.833, respectively. The one-way ANOVA test results showed that there were differences in students' digital literacy based on grade level (p <0.050). A further test of LSD post hoc comparisons showed that there were differences in the digital literacy between students in grade X and XII (p <0.050) and between students in grade XI and XII (p <0.050). However, there was no difference in the digital literacy between students in grade X and XI (p> 0.050). The highest digital literacy was found in students in grade XII. This was because students in grade XII experienced a longer educational process or experience so that they had the highest digital literacy level. Meanwhile, students in grade X and XI were in a transitional phase so that the differences in digital literacy were not significant. By knowing the students' digital literacy, teachers can design learning that is more targeted in achieving learning goals. It should be framed in critical thinking skills which are 21st-century skills [2]. In addition, it is essential for social, academic, and professional success and plays a very central role [3]. Also, it is indispensable in blended learning [4] [5] [6] [7] [8]. Keywords: digital literacy, information skills, digital tools, digital transformation. Acknowledgment Gratitude is conveyed to the Institute for Research and Community Service of the Ganesha University of Education for providing funds through DIPA BLU research with Number: SP DIPA-023.17.2.677530/2020. References
1. S. Kaeophanuek, J. Na-Songkhla, and P. Nilsook, Int. J. Inf. Educ. Technol. 8(4), 292–297 (2018).
2. Y. Eshet, Issues Informing Sci. Inf. Technol. 9, 267–276 (2012). 3. M. C. Murray and J. Pérez, Issues Informing Sci. Inf. Technol. 11, 85–100 (2014). 4. L. Jeffrey, B. Hegarty, O. Kelly, M. Penman, D. Coburn, and J. McDonald, J. Inf. Technol.
Educ. 10, 383–413 (2011). 5. O. Knutsson, M. Blåsjö, S. Hållsten, and P. Karlström, Internet High. Educ. 15(4), 237–246
(2012). 6. E. M. Meyers, I. Erickson, and R. V. Small, Learn. Media Technol. 38(4), 355–367 (2013). 7. C. Kivunja, Int. J. High. Educ. 4(1), 166–181 (2015). 8. D. D. Prior, J. Mazanov, D. Meacheam, G. Heaslip, and J. Hanson, Internet High. Educ. 29,
91–97 (2016).

389
International Conference on Natural Sciences, Mathematics, Applications, Research, and Technology
Manado, Indonesia, 22-23 October 2020
Effect of Parents' Work on Environmental Literacy of High School Students Nyoman Ayu Amardini1, Wayan Redhana*2 and I Wayan Suja*3 1 Natural Science Study Program, Universitas Pendidikan Ganesha, Bali, INDONESIA (E-mail: [email protected]) 2 Chemistry Education Study Program, Universitas Pendidikan Ganesha, Bali INDONESIA (E-mail: [email protected]) 2 Chemistry Education Study Program, Universitas Pendidikan Ganesha, Bali INDONESIA (E-mail: [email protected]) INTRODUCTION Environmental problems still often occur in Indonesia. At this time there is a lot of environmental damage and excessive use of natural resources. Problems can be reduced if people have the environmental literacy. The environmental literacy is an individual's ability to understand and interpret environmental conditions. This study aimed at describing the effect of parents 'work on the environmental literacy of high school students. This study was an ex post facto research. The population in this study were the eleventh-grade students of Public Senior High School 1 Kediri Tabanan Bali Indonesia which consisted of six classes of Mathematics and Natural Sciences. Samples were selected using a cluster random sampling technique. The number of students in this study was 140 students from 4 classes. The instrument used in this study was an environmental literacy inventory consisting of five dimensions, including knowledge, attention, sensitivity, attitudes, and behavior towards the environment. RESULTS AND DISCUSSION In this research the student environmental literacy data obtained by distributing environmental literacy inventory online to students. Environmental literacy inventory contains 5 dimensions of environmental literacy includes sciences (15 items), attention (15 items), sensitivity (16 items), attitude (9 items) and behavior (8 items) to environment. Afterwards parents work data includes laborer/farmers, seller/entrepreneur, state civil and house wife. Data is analyzed by descriptive statistics and inferential. Data is analyzed by descriptive statistics and inferential. Summary of descriptive data is presented in the Table 1. Table 1. Descriptive data summary
Father’s occupation
Mother’s occupation Mean Std. Deviation
N
Total Laborer/farmers 139.50 25.310 14 Aeller/entrepreneur 126.93 25.256 41 House wife 127.73 24.080 37 State civil 129.02 24.452 48 Total 129.11 24.670 140
The Data analysis techniques used to hypothesis test is Two Way Anova. Before testing hypothesis, the assumption test is carried out which is contains normality test, homogeneity test of variance between groups. The analysis result of student environmental literacy data using Two Way Anova technique is presented in the Table 2.
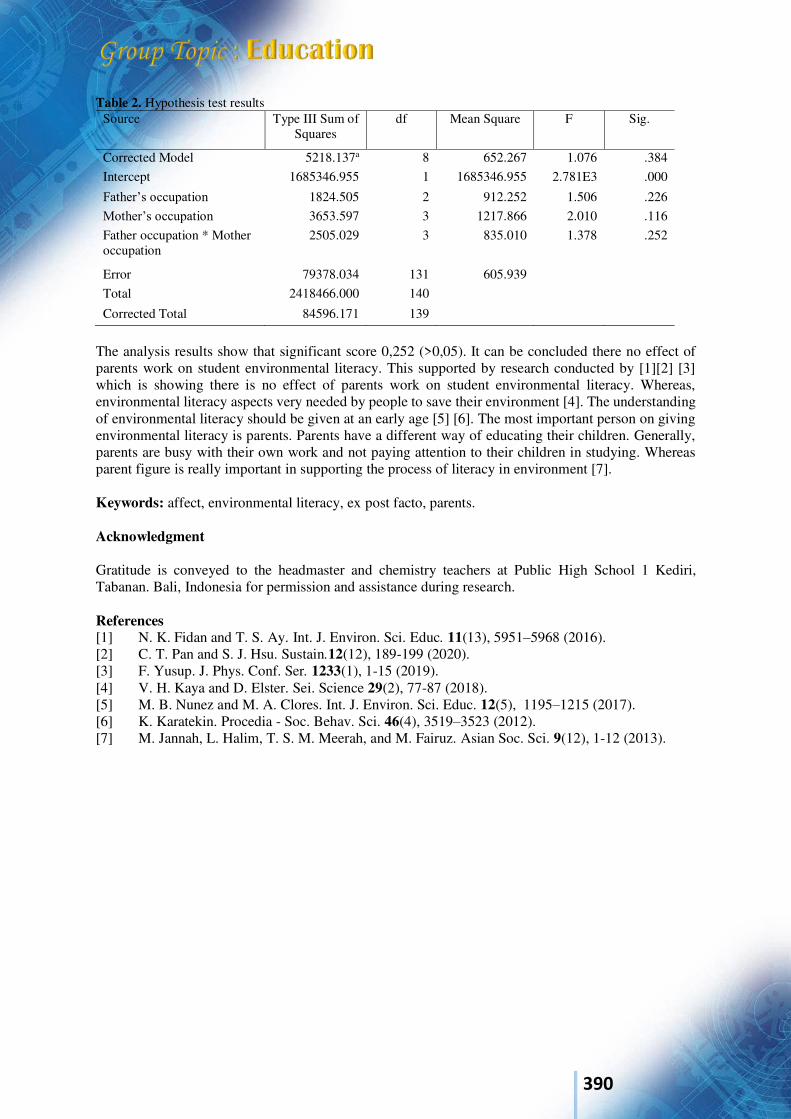
390
Table 2. Hypothesis test results Source Type III Sum of
Squares df Mean Square F Sig.
Corrected Model 5218.137a 8 652.267 1.076 .384 Intercept 1685346.955 1 1685346.955 2.781E3 .000
Father’s occupation 1824.505 2 912.252 1.506 .226 Mother’s occupation 3653.597 3 1217.866 2.010 .116 Father occupation * Mother occupation
2505.029 3 835.010 1.378 .252
Error 79378.034 131 605.939 Total 2418466.000 140
Corrected Total 84596.171 139
The analysis results show that significant score 0,252 (>0,05). It can be concluded there no effect of parents work on student environmental literacy. This supported by research conducted by [1][2] [3] which is showing there is no effect of parents work on student environmental literacy. Whereas, environmental literacy aspects very needed by people to save their environment [4]. The understanding of environmental literacy should be given at an early age [5] [6]. The most important person on giving environmental literacy is parents. Parents have a different way of educating their children. Generally, parents are busy with their own work and not paying attention to their children in studying. Whereas parent figure is really important in supporting the process of literacy in environment [7]. Keywords: affect, environmental literacy, ex post facto, parents. Acknowledgment Gratitude is conveyed to the headmaster and chemistry teachers at Public High School 1 Kediri, Tabanan. Bali, Indonesia for permission and assistance during research. References [1] N. K. Fidan and T. S. Ay. Int. J. Environ. Sci. Educ. 11(13), 5951–5968 (2016). [2] C. T. Pan and S. J. Hsu. Sustain.12(12), 189-199 (2020). [3] F. Yusup. J. Phys. Conf. Ser. 1233(1), 1-15 (2019). [4] V. H. Kaya and D. Elster. Sei. Science 29(2), 77-87 (2018). [5] M. B. Nunez and M. A. Clores. Int. J. Environ. Sci. Educ. 12(5), 1195–1215 (2017). [6] K. Karatekin. Procedia - Soc. Behav. Sci. 46(4), 3519–3523 (2012). [7] M. Jannah, L. Halim, T. S. M. Meerah, and M. Fairuz. Asian Soc. Sci. 9(12), 1-12 (2013).
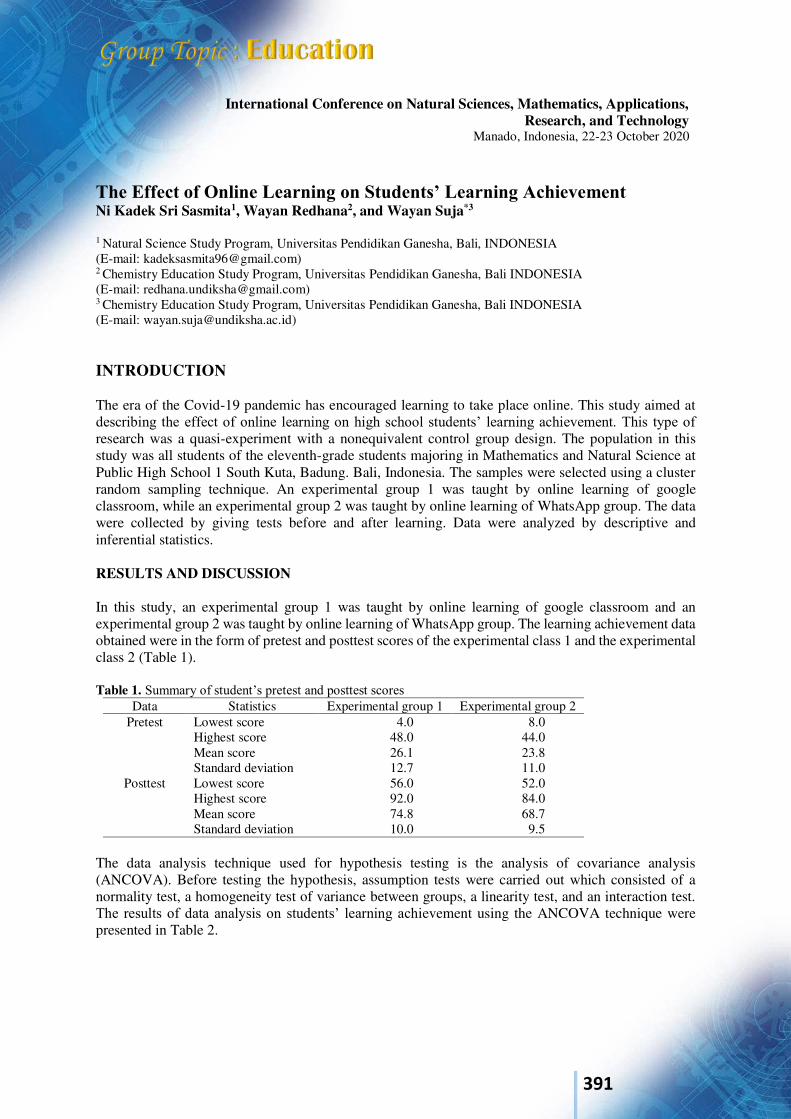
391
International Conference on Natural Sciences, Mathematics, Applications, Research, and Technology
Manado, Indonesia, 22-23 October 2020
The Effect of Online Learning on Students’ Learning Achievement Ni Kadek Sri Sasmita1, Wayan Redhana2, and Wayan Suja*3
1 Natural Science Study Program, Universitas Pendidikan Ganesha, Bali, INDONESIA (E-mail: [email protected]) 2 Chemistry Education Study Program, Universitas Pendidikan Ganesha, Bali INDONESIA (E-mail: [email protected]) 3 Chemistry Education Study Program, Universitas Pendidikan Ganesha, Bali INDONESIA (E-mail: [email protected]) INTRODUCTION The era of the Covid-19 pandemic has encouraged learning to take place online. This study aimed at describing the effect of online learning on high school students’ learning achievement. This type of research was a quasi-experiment with a nonequivalent control group design. The population in this study was all students of the eleventh-grade students majoring in Mathematics and Natural Science at Public High School 1 South Kuta, Badung. Bali, Indonesia. The samples were selected using a cluster random sampling technique. An experimental group 1 was taught by online learning of google classroom, while an experimental group 2 was taught by online learning of WhatsApp group. The data were collected by giving tests before and after learning. Data were analyzed by descriptive and inferential statistics. RESULTS AND DISCUSSION In this study, an experimental group 1 was taught by online learning of google classroom and an experimental group 2 was taught by online learning of WhatsApp group. The learning achievement data obtained were in the form of pretest and posttest scores of the experimental class 1 and the experimental class 2 (Table 1). Table 1. Summary of student’s pretest and posttest scores
Data Statistics Experimental group 1 Experimental group 2 Pretest Lowest score 4.0 8.0
Highest score 48.0 44.0 Mean score 26.1 23.8 Standard deviation 12.7 11.0
Posttest Lowest score 56.0 52.0 Highest score 92.0 84.0 Mean score 74.8 68.7 Standard deviation 10.0 9.5
The data analysis technique used for hypothesis testing is the analysis of covariance analysis (ANCOVA). Before testing the hypothesis, assumption tests were carried out which consisted of a normality test, a homogeneity test of variance between groups, a linearity test, and an interaction test. The results of data analysis on students’ learning achievement using the ANCOVA technique were presented in Table 2.
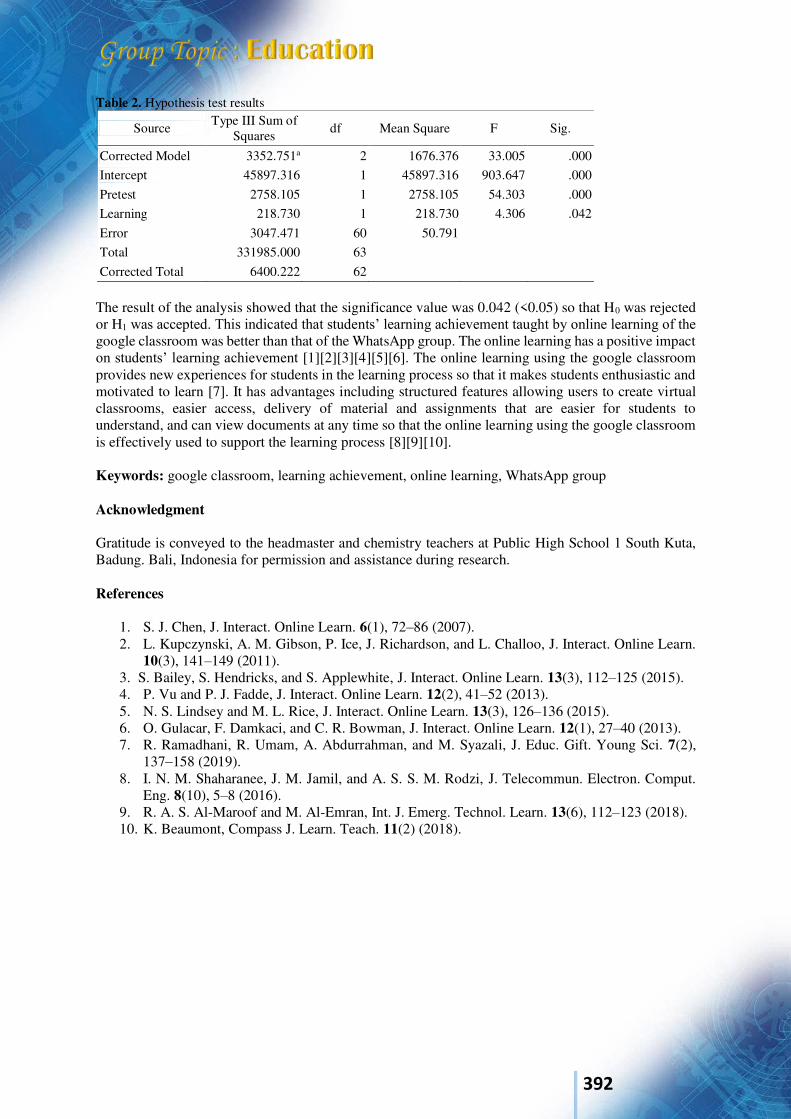
392
Table 2. Hypothesis test results
Source Type III Sum of Squares df Mean Square F Sig.
Corrected Model 3352.751a 2 1676.376 33.005 .000 Intercept 45897.316 1 45897.316 903.647 .000
Pretest 2758.105 1 2758.105 54.303 .000 Learning 218.730 1 218.730 4.306 .042
Error 3047.471 60 50.791 Total 331985.000 63
Corrected Total 6400.222 62 The result of the analysis showed that the significance value was 0.042 (<0.05) so that H0 was rejected or H1 was accepted. This indicated that students’ learning achievement taught by online learning of the google classroom was better than that of the WhatsApp group. The online learning has a positive impact on students’ learning achievement [1][2][3][4][5][6]. The online learning using the google classroom provides new experiences for students in the learning process so that it makes students enthusiastic and motivated to learn [7]. It has advantages including structured features allowing users to create virtual classrooms, easier access, delivery of material and assignments that are easier for students to understand, and can view documents at any time so that the online learning using the google classroom is effectively used to support the learning process [8][9][10]. Keywords: google classroom, learning achievement, online learning, WhatsApp group
Acknowledgment Gratitude is conveyed to the headmaster and chemistry teachers at Public High School 1 South Kuta, Badung. Bali, Indonesia for permission and assistance during research. References
1. S. J. Chen, J. Interact. Online Learn. 6(1), 72–86 (2007). 2. L. Kupczynski, A. M. Gibson, P. Ice, J. Richardson, and L. Challoo, J. Interact. Online Learn.
10(3), 141–149 (2011). 3. S. Bailey, S. Hendricks, and S. Applewhite, J. Interact. Online Learn. 13(3), 112–125 (2015). 4. P. Vu and P. J. Fadde, J. Interact. Online Learn. 12(2), 41–52 (2013). 5. N. S. Lindsey and M. L. Rice, J. Interact. Online Learn. 13(3), 126–136 (2015). 6. O. Gulacar, F. Damkaci, and C. R. Bowman, J. Interact. Online Learn. 12(1), 27–40 (2013). 7. R. Ramadhani, R. Umam, A. Abdurrahman, and M. Syazali, J. Educ. Gift. Young Sci. 7(2),
137–158 (2019). 8. I. N. M. Shaharanee, J. M. Jamil, and A. S. S. M. Rodzi, J. Telecommun. Electron. Comput.
Eng. 8(10), 5–8 (2016). 9. R. A. S. Al-Maroof and M. Al-Emran, Int. J. Emerg. Technol. Learn. 13(6), 112–123 (2018). 10. K. Beaumont, Compass J. Learn. Teach. 11(2) (2018).
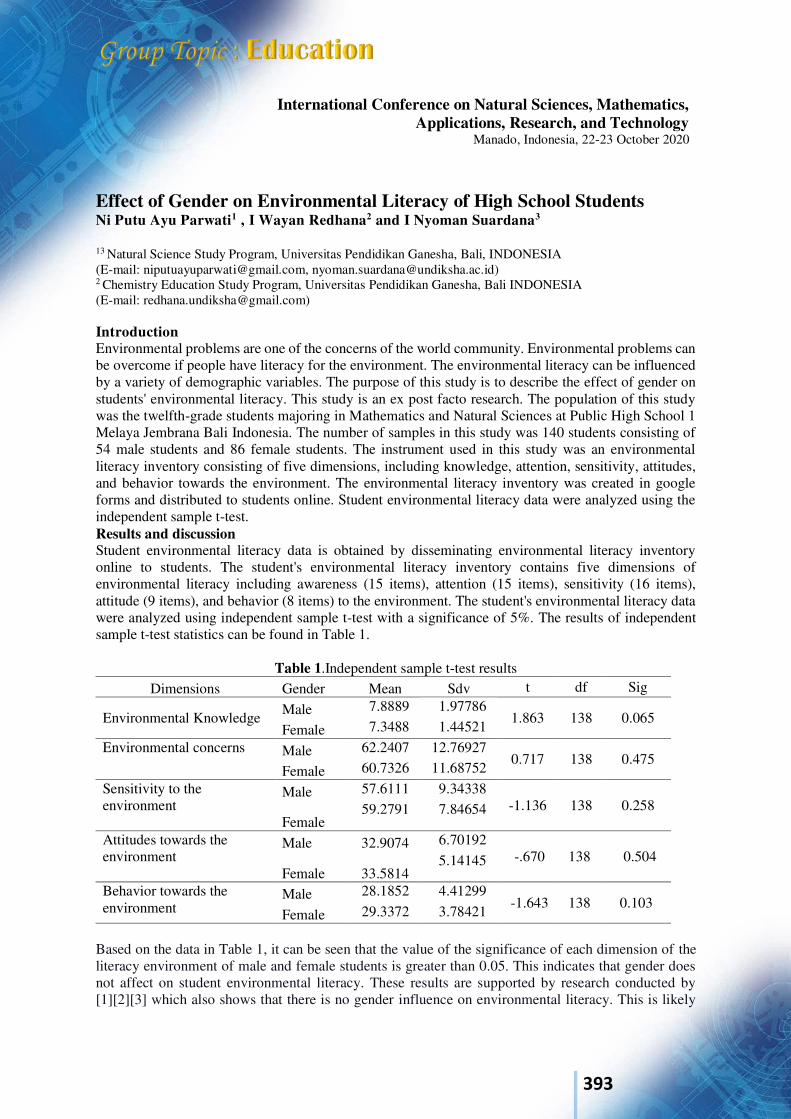
393
International Conference on Natural Sciences, Mathematics, Applications, Research, and Technology
Manado, Indonesia, 22-23 October 2020
Effect of Gender on Environmental Literacy of High School Students Ni Putu Ayu Parwati1 , I Wayan Redhana2 and I Nyoman Suardana3 13 Natural Science Study Program, Universitas Pendidikan Ganesha, Bali, INDONESIA (E-mail: [email protected], [email protected]) 2 Chemistry Education Study Program, Universitas Pendidikan Ganesha, Bali INDONESIA (E-mail: [email protected]) Introduction Environmental problems are one of the concerns of the world community. Environmental problems can be overcome if people have literacy for the environment. The environmental literacy can be influenced by a variety of demographic variables. The purpose of this study is to describe the effect of gender on students' environmental literacy. This study is an ex post facto research. The population of this study was the twelfth-grade students majoring in Mathematics and Natural Sciences at Public High School 1 Melaya Jembrana Bali Indonesia. The number of samples in this study was 140 students consisting of 54 male students and 86 female students. The instrument used in this study was an environmental literacy inventory consisting of five dimensions, including knowledge, attention, sensitivity, attitudes, and behavior towards the environment. The environmental literacy inventory was created in google forms and distributed to students online. Student environmental literacy data were analyzed using the independent sample t-test. Results and discussion Student environmental literacy data is obtained by disseminating environmental literacy inventory online to students. The student's environmental literacy inventory contains five dimensions of environmental literacy including awareness (15 items), attention (15 items), sensitivity (16 items), attitude (9 items), and behavior (8 items) to the environment. The student's environmental literacy data were analyzed using independent sample t-test with a significance of 5%. The results of independent sample t-test statistics can be found in Table 1.
Table 1.Independent sample t-test results Dimensions Gender Mean Sdv t df Sig
Environmental Knowledge Male 7.8889 1.97786 1.863 138 0.065
Female 7.3488 1.44521 Environmental concerns
Male 62.2407 12.76927 0.717 138 0.475
Female 60.7326 11.68752 Sensitivity to the environment
Male 57.6111 9.34338 -1.136 138 0.258
Female 59.2791 7.84654
Attitudes towards the environment
Male 32.9074 6.70192 -.670 138 0.504
Female 33.5814 5.14145
Behavior towards the environment
Male 28.1852 4.41299 -1.643 138 0.103
Female 29.3372 3.78421 Based on the data in Table 1, it can be seen that the value of the significance of each dimension of the literacy environment of male and female students is greater than 0.05. This indicates that gender does not affect on student environmental literacy. These results are supported by research conducted by [1][2][3] which also shows that there is no gender influence on environmental literacy. This is likely

394
due to the reduced analytical power of students due to learning from home during the covid-19 pandemic. Based on the data in Table 1, it can also be seen that the average grade of male student environmental literacy is greater than that of female students in the dimensions of knowledge, attention, and behavior to the environment. Research conducted by [4][5] also shows male students' knowledge of the environment is higher than that of female students. Meanwhile, in the dimensions of sensitivity and attitude to the environment the average grade of female students' environmental literacy is greater than that of male students. This is because women are more environmentally sensitive than men][6]. Keywords: ex post facto, gender, environmental literacy Acknowledgment Gratitude is conveyed to the headmaster and chemistry teachers at Public High School 1 Melaya, Jembrana. Bali, Indonesia for permission and assistance during research. References [1] S. J. A. M. Salahudin and M. Mahmood. International Journal of Innovation in Teaching and
Learning. 3(1), 1–13 (2017). [2] T. V. Gbadamosi. International Journal of Social Sciences. 4(2), 330–347 (2018). [3] N. A. Rahman and N. M. Nasri. Creative Education. 9(14), 2148–2160 (2018). [4] M. Jannah, L. Halim, T. S. M. Meerah, and M. Fairuz. Asian Social Science. 9(12), 1–12 (2013). [5] G. Ozturk, O. Y. Tuzun, and G. Teksoz. Elementary Education Online. 12(4), 926-937 (2013). [6] S. Kose, A. S. Gencer, K. Gezer, G. H. Erol, and K. Bilen. International Electronic Journal of
Environmental Education. 1(2), 85-96 (2010).
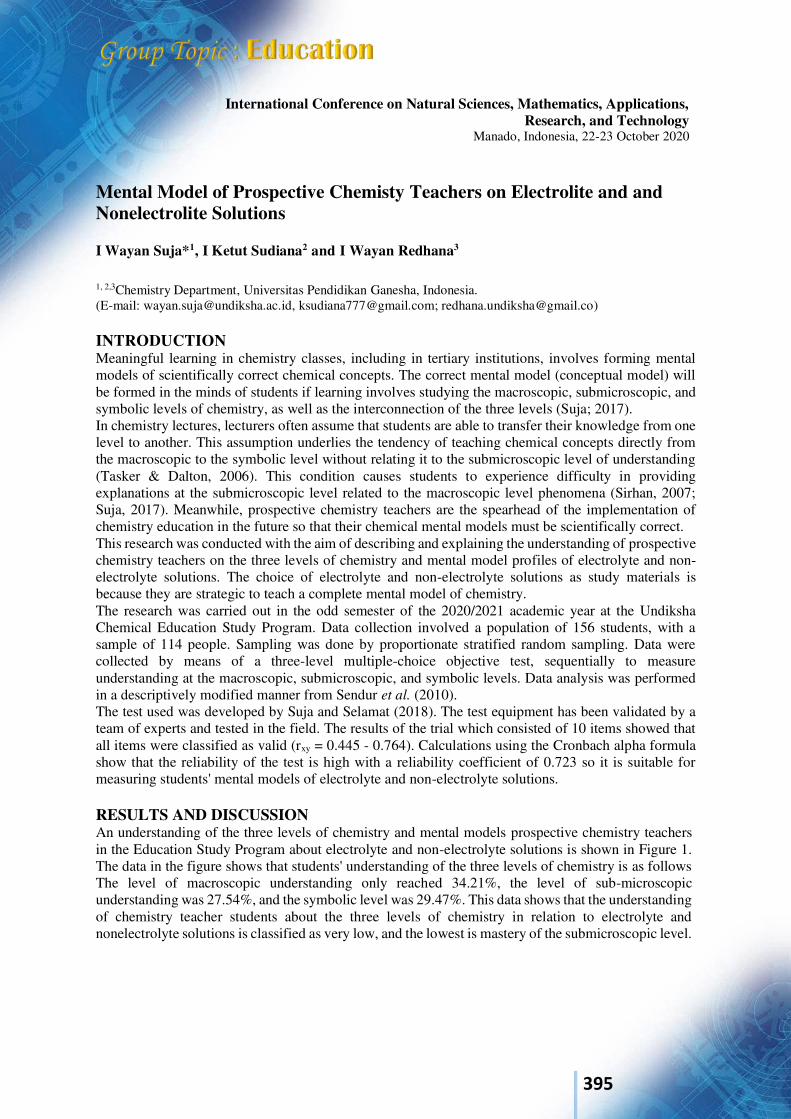
395
International Conference on Natural Sciences, Mathematics, Applications, Research, and Technology
Manado, Indonesia, 22-23 October 2020
Mental Model of Prospective Chemisty Teachers on Electrolite and and Nonelectrolite Solutions I Wayan Suja*1, I Ketut Sudiana2 and I Wayan Redhana3
1, 2,3Chemistry Department, Universitas Pendidikan Ganesha, Indonesia. (E-mail: [email protected], [email protected]; [email protected]) INTRODUCTION Meaningful learning in chemistry classes, including in tertiary institutions, involves forming mental models of scientifically correct chemical concepts. The correct mental model (conceptual model) will be formed in the minds of students if learning involves studying the macroscopic, submicroscopic, and symbolic levels of chemistry, as well as the interconnection of the three levels (Suja; 2017). In chemistry lectures, lecturers often assume that students are able to transfer their knowledge from one level to another. This assumption underlies the tendency of teaching chemical concepts directly from the macroscopic to the symbolic level without relating it to the submicroscopic level of understanding (Tasker & Dalton, 2006). This condition causes students to experience difficulty in providing explanations at the submicroscopic level related to the macroscopic level phenomena (Sirhan, 2007; Suja, 2017). Meanwhile, prospective chemistry teachers are the spearhead of the implementation of chemistry education in the future so that their chemical mental models must be scientifically correct. This research was conducted with the aim of describing and explaining the understanding of prospective chemistry teachers on the three levels of chemistry and mental model profiles of electrolyte and non-electrolyte solutions. The choice of electrolyte and non-electrolyte solutions as study materials is because they are strategic to teach a complete mental model of chemistry. The research was carried out in the odd semester of the 2020/2021 academic year at the Undiksha Chemical Education Study Program. Data collection involved a population of 156 students, with a sample of 114 people. Sampling was done by proportionate stratified random sampling. Data were collected by means of a three-level multiple-choice objective test, sequentially to measure understanding at the macroscopic, submicroscopic, and symbolic levels. Data analysis was performed in a descriptively modified manner from Sendur et al. (2010). The test used was developed by Suja and Selamat (2018). The test equipment has been validated by a team of experts and tested in the field. The results of the trial which consisted of 10 items showed that all items were classified as valid (rxy = 0.445 - 0.764). Calculations using the Cronbach alpha formula show that the reliability of the test is high with a reliability coefficient of 0.723 so it is suitable for measuring students' mental models of electrolyte and non-electrolyte solutions. RESULTS AND DISCUSSION An understanding of the three levels of chemistry and mental models prospective chemistry teachers in the Education Study Program about electrolyte and non-electrolyte solutions is shown in Figure 1. The data in the figure shows that students' understanding of the three levels of chemistry is as follows The level of macroscopic understanding only reached 34.21%, the level of sub-microscopic understanding was 27.54%, and the symbolic level was 29.47%. This data shows that the understanding of chemistry teacher students about the three levels of chemistry in relation to electrolyte and nonelectrolyte solutions is classified as very low, and the lowest is mastery of the submicroscopic level.
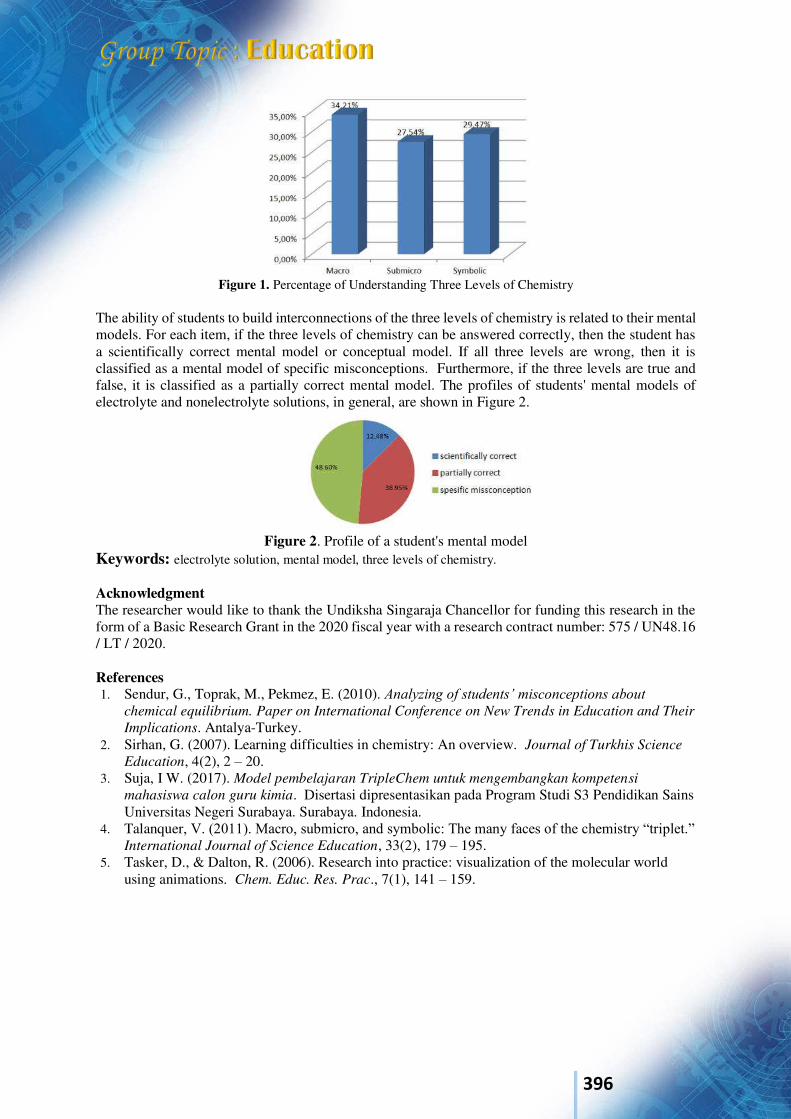
396
Figure 1. Percentage of Understanding Three Levels of Chemistry
The ability of students to build interconnections of the three levels of chemistry is related to their mental models. For each item, if the three levels of chemistry can be answered correctly, then the student has a scientifically correct mental model or conceptual model. If all three levels are wrong, then it is classified as a mental model of specific misconceptions. Furthermore, if the three levels are true and false, it is classified as a partially correct mental model. The profiles of students' mental models of electrolyte and nonelectrolyte solutions, in general, are shown in Figure 2.
Figure 2. Profile of a student's mental model
Keywords: electrolyte solution, mental model, three levels of chemistry. Acknowledgment The researcher would like to thank the Undiksha Singaraja Chancellor for funding this research in the form of a Basic Research Grant in the 2020 fiscal year with a research contract number: 575 / UN48.16 / LT / 2020. References 1. Sendur, G., Toprak, M., Pekmez, E. (2010). Analyzing of students’ misconceptions about
chemical equilibrium. Paper on International Conference on New Trends in Education and Their
Implications. Antalya-Turkey. 2. Sirhan, G. (2007). Learning difficulties in chemistry: An overview. Journal of Turkhis Science
Education, 4(2), 2 – 20. 3. Suja, I W. (2017). Model pembelajaran TripleChem untuk mengembangkan kompetensi
mahasiswa calon guru kimia. Disertasi dipresentasikan pada Program Studi S3 Pendidikan Sains Universitas Negeri Surabaya. Surabaya. Indonesia.
4. Talanquer, V. (2011). Macro, submicro, and symbolic: The many faces of the chemistry “triplet.” International Journal of Science Education, 33(2), 179 – 195.
5. Tasker, D., & Dalton, R. (2006). Research into practice: visualization of the molecular world using animations. Chem. Educ. Res. Prac., 7(1), 141 – 159.
397
International Conference on Natural Sciences, Mathematics, Applications, Research, and Technology
Manado, Indonesia, 22-23 October 2020
I Nyoman Suardana*1 and I Gusti Lanang Wiratma2
1Physics and Science Teaching Department, Ganesha University of Education, INDONESIA. (E-mail: [email protected]) 2Chemistry Department, Ganesha University of Education, INDONESIA. (E-mail: [email protected]) INTRODUCTION The Basic Chemistry course is a compulsory subject for first-year students on the Undergraduate Science Education Study Program in the Ganesha University of Education (GUE). This course provides basic chemistry material that can be used as a prerequisite or knowledge base for other courses, such as Physical Chemistry, Biochemistry, Basic Science, and Applied Science. The concepts or material in science, especially chemistry, are related to one another. Mastery of concepts in Basic Chemistry courses is needed to make it easier for students to learn advanced chemical knowledge or science that requires a basic chemistry. The same thing was stated by Novitasari [1], Lasmiyati and Harta [2] that to study a material, an understanding of the previous material or prerequisite material is needed. The prerequisite material in the Basic Chemistry course is very important for students to master, however, Undergraduate Science Education Study Program students' understanding of the material in the Basic Chemistry course is still low. The 2018/2019 academic year, the average scores final semester examination of class A and B students in the Basic Chemistry I course were 59.9 and 55.5 respectively, in the Basic Chemistry II course, the average score of class A students and B 50.1 and 61.3 respectively (Documents of Undergraduate Science Education Study Program, GUE, 2019). In the 2019/2020 academic year, the average scores final semester examination of class A and B students in the Basic Chemistry I course were 54.8 and 56.4 respectively (Documents of Undergraduate Science Education Study Program, GUE, 2020). The low understanding of students towards Basic Chemistry material is caused by several factors, including the learning process that is not optimal. Learning with the scientific approach (observing, questioning, gathering information, associating, and communicating) is one of the learning that can be done to improve students’ achievement. This learning trains science process skills and provides students the opportunity to construct the knowledge that is being learned. The research findings show that learning with a scientific approach can improve students' achievement [3, 4]. Learning with a scientific approach, apart from practicing science process skills, also provides opportunities for students to reflect and share their knowledge with each other so that the knowledge gained is deeper and internalized. Reflection can help students to focus and be active in self-development as effective and critical independent learners [5]. Furthermore, Suprijono stated that reflective learning trains students to think actively and reflectively which is based on a thinking process towards definitive conclusions [6]. Reflective learning helps students understand material based on their experiences so that they have the ability to analyze personal experiences in explaining the material being studied. Research findings by Zainuddin showed that reflective learning can improve students’
Students’ Achievement on Basic Chemistry Concepts Using Blended Learning with A Scientific Approach
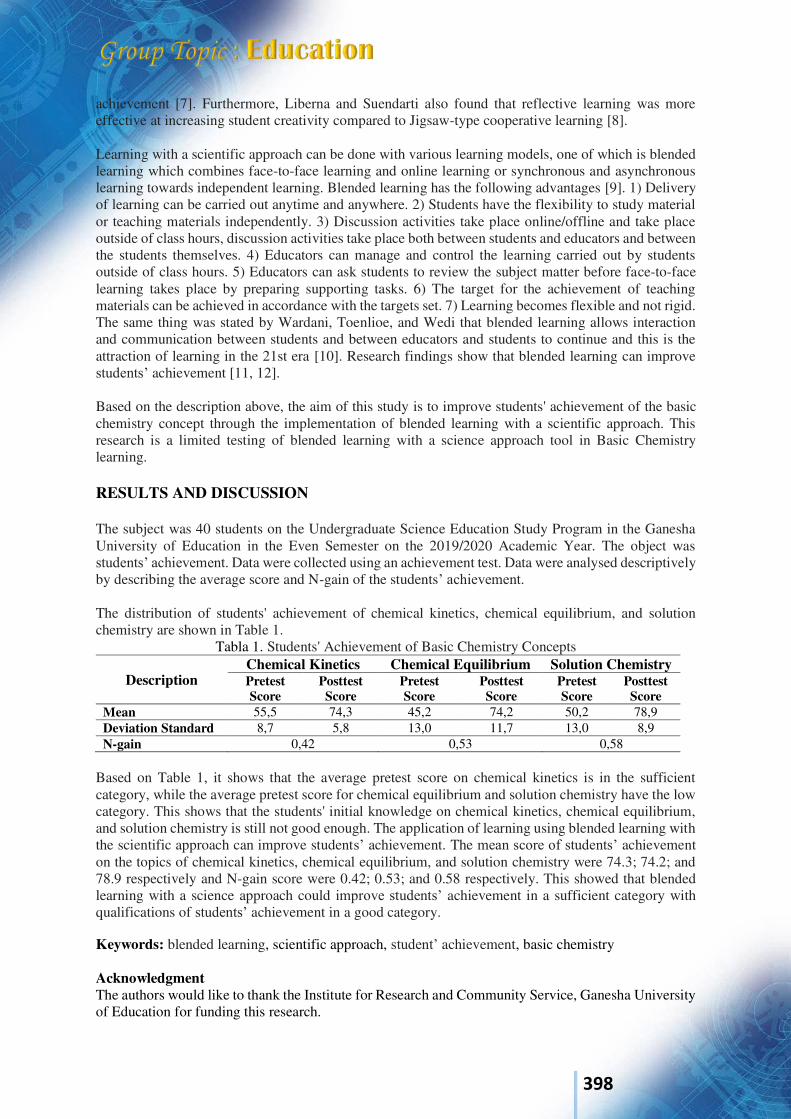
398
achievement [7]. Furthermore, Liberna and Suendarti also found that reflective learning was more effective at increasing student creativity compared to Jigsaw-type cooperative learning [8]. Learning with a scientific approach can be done with various learning models, one of which is blended learning which combines face-to-face learning and online learning or synchronous and asynchronous learning towards independent learning. Blended learning has the following advantages [9]. 1) Delivery of learning can be carried out anytime and anywhere. 2) Students have the flexibility to study material or teaching materials independently. 3) Discussion activities take place online/offline and take place outside of class hours, discussion activities take place both between students and educators and between the students themselves. 4) Educators can manage and control the learning carried out by students outside of class hours. 5) Educators can ask students to review the subject matter before face-to-face learning takes place by preparing supporting tasks. 6) The target for the achievement of teaching materials can be achieved in accordance with the targets set. 7) Learning becomes flexible and not rigid. The same thing was stated by Wardani, Toenlioe, and Wedi that blended learning allows interaction and communication between students and between educators and students to continue and this is the attraction of learning in the 21st era [10]. Research findings show that blended learning can improve students’ achievement [11, 12]. Based on the description above, the aim of this study is to improve students' achievement of the basic chemistry concept through the implementation of blended learning with a scientific approach. This research is a limited testing of blended learning with a science approach tool in Basic Chemistry learning. RESULTS AND DISCUSSION The subject was 40 students on the Undergraduate Science Education Study Program in the Ganesha University of Education in the Even Semester on the 2019/2020 Academic Year. The object was students’ achievement. Data were collected using an achievement test. Data were analysed descriptively by describing the average score and N-gain of the students’ achievement. The distribution of students' achievement of chemical kinetics, chemical equilibrium, and solution chemistry are shown in Table 1.
Tabla 1. Students' Achievement of Basic Chemistry Concepts
Description Chemical Kinetics Chemical Equilibrium Solution Chemistry Pretest Score
Posttest Score
Pretest Score
Posttest Score
Pretest Score
Posttest Score
Mean 55,5 74,3 45,2 74,2 50,2 78,9 Deviation Standard 8,7 5,8 13,0 11,7 13,0 8,9 N-gain 0,42 0,53 0,58
Based on Table 1, it shows that the average pretest score on chemical kinetics is in the sufficient category, while the average pretest score for chemical equilibrium and solution chemistry have the low category. This shows that the students' initial knowledge on chemical kinetics, chemical equilibrium, and solution chemistry is still not good enough. The application of learning using blended learning with the scientific approach can improve students’ achievement. The mean score of students’ achievement on the topics of chemical kinetics, chemical equilibrium, and solution chemistry were 74.3; 74.2; and 78.9 respectively and N-gain score were 0.42; 0.53; and 0.58 respectively. This showed that blended learning with a science approach could improve students’ achievement in a sufficient category with qualifications of students’ achievement in a good category. Keywords: blended learning, scientific approach, student’ achievement, basic chemistry Acknowledgment The authors would like to thank the Institute for Research and Community Service, Ganesha University of Education for funding this research.

399
References
1. Novitasari, D. (2016). The Influence of Using Interactive Multimedia on Students' Mathematical Concept Understanding Ability. Fibonacci. 2(2), 8-18.
2. Lasmiyati & Harta, I. (2014). Development of Learning Modules to Improve Concepts Understanding and Interests of Junior High Schools. Pythagoras. 9 (2), 161-174.
3. Rahmi, F. (2017). Implementing of the Scientific Approach as an Effort to Improve the Science Learning Achevement on the Class IV Students in SDN 19 Koto Tinggi. Jurnal Inovasi
Pendidikan dan Pembelajaran Sekolah Dasar. 1(2), 1-15. 4. Wibowo, A. (2017). The Effect of Realistic and Scientific Mathematics Learning Approaches
on Learning Achievement, Mathematical Reasoning Ability and Learning Interest. Jurnal Riset
Pendidikan Matematika, 4 (1), 1-10. 5. DCU Student Learning Resources. (2007). Learning to Learn, Reflective Learning: Keeping A
Reflective Learning Journal. http://educationalelearningresources.yolasite.com/resources/ Reflectivelearning. pdf. [2 February 2017].
6. Suprijono. 2010. Cooperative Learning and Paikem Aplication. Yogyakarta: Pustaka Belajar 7. Zainuddin. (2018). Efforts to Improve Science Learning Outcomes by Using Reflective
Learning Models. Jurnal Global Edukasi. 1 (5), 611-617. 8. Liberna, H. & Suendarti, M. (2019). The Effectiveness of the Reflective Learning Model in
Improving Student Creativity at Madrasah Tsanawiyah. Jurnal Nasional Pendidikan
Matematika. 3(2), 238-349. 9. Madeamin, I. (2015). Advantages and Disadvantages of Blended Learning.
http://www.ishaqmadeamin.com/2015/02/kelebihan-dan-kekurangan-blended.html. [10 October 2015].
10. Wardani, D.N., Toenlioe, A.J.F., & Wedi, A. (2018). The Attraction of Learning in the 21st Era with Blended Learning. JKTP. 1(1), 13-18.
11. Simarmata, J., Djohar, A., Purba, J.P., & Djuanda, E.A. (2016). Implementation of Blended
Learning Based Learning Model to Improve Students’ Achievement. Proceedings of the National Seminar on Information Technology and Innovation SNITI-3. 11-12 November 2016.
12. Ningsih, Y.L., Misdalina, & Marhamah. (2017). Improved Learning Outcomes and Learning Independence of Statistical Methods through Blended Learning. Al-Jabar. 8(2), 155-164.
400
International Conference on Natural Sciences, Mathematics, Applications, Research, and Technology
Manado, Indonesia, 22-23 October 2020
Improving The Critical Thinking Ability And Responsibility Character Of Learners With Blended Learning Based On Tri Hita Karana Ni Putu Sri Ratna Dewi *1, I Made Oka Riawan, *2
1, 2 Biology Education Study Program, Department of Biology and Marine Fisheries, Ganesha University of Education, INDONESIA. (E-mail: [email protected], [email protected] ) INTRODUCTION Education transformation has always been executing in keeping up with the changing needs of the world today. The nation's generation should be prepared to face competition in the era of digitalization. Nowadays, education implementation has a purpose to support learners with various learning experiences. It will make them understand and take advantage of mainstream information. They can also think critically and analyze every opportunity that can occur based on the values of Pancasila. In this 21st-century, educators and learners at all levels of education must prepare themselves to carry out an effective learning process. This learning style emphasizes on six things, namely: 1) core subject knowledge; 2) development of learning skills; 3) utilize 21st -century learning media to develop learning skills; 4) teaching learners in the context of the 21st century; 5) teaching 21st-century content; and 6) using 21st-century assessments that measure 21st-century skills. The 21st-century learning aims to make learners have mastery of 4C, namely: Communication, Collaboration, Critical thinking, and Creative. The learning system applied in higher education is expected to start leading to digital learning. Implementing these changes requires plenty of time, effort, and costs so that improvements in these three aspects can be achieved. To address this, one thing that can be done is to implement blended learning. Blended learning is one of the most effective methods where learners in this era are the millennial generation who is inseparable with gadgets. Shibley and friends (2011) defined blended learning as a combination of face-to-face and online learning. According to Dzakiria (2006), blended learning is a learning method that combines face-to-face learning with web-based learning. Meanwhile, Garnham said that blended learning is an approach that integrates face-to-face teaching and computer-assisted instructional activities (computer-mediated instruction) in a pedagogic environment. Many Undiksha lecturers have implemented blended learning in several courses, but the implementation of THK-based blended learning is still rare. Even though educational values contained in the THK attract strongly for education providers to raise it as a source of inspiration in the process of improving the quality of education to achieve quality and good character output. Sudira (2013), defined personal characteristics, namely responsibility, morale, character, integrity, self-confidence, and loyalty will grow well as part of the fundamental skills of educated learners in an educational environment based on THK. Based on this issue, research on blended learning based on Tri Hita Karana was conducted to improve critical thinking skills and the character of learners' responsibility, which so far is still in the deficient category. RESULTS AND DISCUSSION The implementation of Tri Hita Karana-based blended learning in learning reproductive system material showed significant differences in critical thinking skills and the character of learners' responsibility between those taught with Tri Hita Karana-based blended learning and those taught conventionally. The results of the data analysis of critical thinking ability showed that
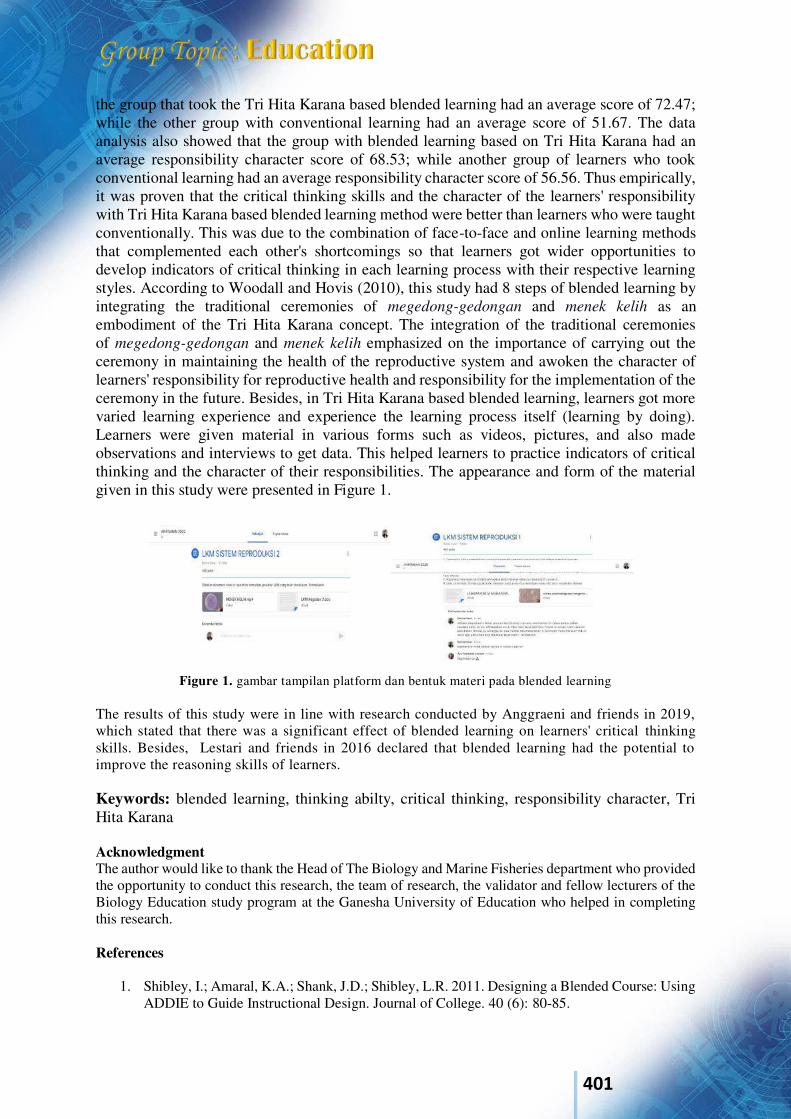
401
the group that took the Tri Hita Karana based blended learning had an average score of 72.47; while the other group with conventional learning had an average score of 51.67. The data analysis also showed that the group with blended learning based on Tri Hita Karana had an average responsibility character score of 68.53; while another group of learners who took conventional learning had an average responsibility character score of 56.56. Thus empirically, it was proven that the critical thinking skills and the character of the learners' responsibility with Tri Hita Karana based blended learning method were better than learners who were taught conventionally. This was due to the combination of face-to-face and online learning methods that complemented each other's shortcomings so that learners got wider opportunities to develop indicators of critical thinking in each learning process with their respective learning styles. According to Woodall and Hovis (2010), this study had 8 steps of blended learning by integrating the traditional ceremonies of megedong-gedongan and menek kelih as an embodiment of the Tri Hita Karana concept. The integration of the traditional ceremonies of megedong-gedongan and menek kelih emphasized on the importance of carrying out the ceremony in maintaining the health of the reproductive system and awoken the character of learners' responsibility for reproductive health and responsibility for the implementation of the ceremony in the future. Besides, in Tri Hita Karana based blended learning, learners got more varied learning experience and experience the learning process itself (learning by doing). Learners were given material in various forms such as videos, pictures, and also made observations and interviews to get data. This helped learners to practice indicators of critical thinking and the character of their responsibilities. The appearance and form of the material given in this study were presented in Figure 1.
Figure 1. gambar tampilan platform dan bentuk materi pada blended learning The results of this study were in line with research conducted by Anggraeni and friends in 2019, which stated that there was a significant effect of blended learning on learners' critical thinking skills. Besides, Lestari and friends in 2016 declared that blended learning had the potential to improve the reasoning skills of learners. Keywords: blended learning, thinking abilty, critical thinking, responsibility character, Tri Hita Karana Acknowledgment The author would like to thank the Head of The Biology and Marine Fisheries department who provided the opportunity to conduct this research, the team of research, the validator and fellow lecturers of the Biology Education study program at the Ganesha University of Education who helped in completing this research. References
1. Shibley, I.; Amaral, K.A.; Shank, J.D.; Shibley, L.R. 2011. Designing a Blended Course: Using ADDIE to Guide Instructional Design. Journal of College. 40 (6): 80-85.

402
2. Dzakiria, H., Mustafa, C. S., Bakar, H. A. (2006). Moving Forward with Blended Learning (BL) as a Pedagogical Alternative to Traditional Classroom Learning. Malaysian Online Journal of Instructional Technoloy MOJIT. 3 (1), 11-18.
3. Woodall, D., Hovis, S. 2010. Eight Phases of Workplace Learning: A Framework for Designing Blended Programs. Tersedia pada http://www.skillsoft.com/news/white_papers.pdf (diakses pada tanggal 1 Pebruari 2019)
4. Lestari, Dian., E.S, Sri Mulyani, Susanti, R. 2016. Pengembangan Perangkat Blended Learning Sistem Saraf Manusia untuk Meningkatkan Keterampilan Berpikir Kritis. Journal of Innovative Science Education. JISE 5(1) hal 83-93.
5. Anggraeni, Anggian., Supriana, Edi, Hidayat, Arif. 2019. Pengaruh Blended Learning terhadap Kemampuan Berpikir Kritis Siswa SMA pada Materi Suhu dan Kalor. Jurnal Pendidikan. Vol. 4(6) Hal 758—763.
403
International Conference on Natural Sciences, Mathematics, Applications, Research, and Technology
Manado, Indonesia, 22-23October 2020
DEVELOPMENT OF BASIC CHEMISTRY PRACTICUM I WITH OCCUPATIONAL HEALTH AND SAFETY (K3) TO PREVENT WORK ACCIDENTS IN LABORATORY I Ketut Sudiana*1 and I Wayan Suja2 1, 2Chemistry Department, Universitas Pendidikan Ganesha, INDONESIA. (E-mail: [email protected]; [email protected]) INTRODUCTION First year students (new students) Chemistry Education Study Program, Faculty of Mathematics and Natural Sciences, Undiksha have some problems in practicum due to the students’ low basic laboratory skills. The current practicum guide is not enough to provide information on basic skills to work in the laboratory. This condition causes students to have problems in practicum activities and has potential to trigger the risk of accidents. The School’s Chemistry Laboratory be the second laboratory that have work accidents. Educational laboratories have a higher risk of work accidents than laboratories for industrial activities (Education Bureau. 2013). The purpose of this research and development is to develop handbook for Basic Chemistry I that contains Occupational Safety and Health (K3). It is hoped that the development result of the practicum guide can be used as a guide in Basic Chemistry practicum I which can help in practicum, prevent work accidents, and can achieve the expected goals. The development of a practicum guide is important to activate students and develop students’ processing skills through the activities in the practicum guide that has been developed (Prayitno, 2017). This research was a Research and Development (R&D) with 4-D development model (Thiagarajan, et al. (1974). This research carried out only in three stages, Define, Design, and Develop because of of the WFH policy as a result of the Covid-19 pandemic. The develop stage was ended up to the legibility test.
RESULTS AND DISCUSSION Define Stage. Needs Analysis through a preliminary study found that the problem in Basic Chemistry I practicum was the low skills of students in practicum and the potential to causes work accidents in the laboratory. There are 6 topics of Basic Chemistry I developed with K3 content. From the 6 practicum topics, students identified the risk of accidents and the K3 concept that students must mastered. The risks of accidents include (1) The damage of glass, metal, and porcelain tools, (2) Inhaling the gases reaction, (3) direct contact with chemicals through the skin, eyes, mouth and respiratory tract, (4) gas leaking. , and (5) fire hazard (Abbas, M. 2016; Lisa Moran and Tina Masciangoli. 2010; Committee on Chemical Management Toolkit Expansion, 2016; Harrison, et al., 2011; WHO, 2011). While the concept of K3 which is important for students to master to prevent work accidents is (1) training on the use of practicum tools, (2) using Personal Protective Equipment (PPE), (3) gas-producing reactions carried out in a fume hood, and (4) the use of Light Fire Extinguisher training. The K3 concept includes 26 work procedures which formulated into 26 SOP (Standard Oporational Procedures) and integrated into the practicum guide using the insertion method (Sugirin, et al., 2013). SOP preparation follows the criteria as stated in the POS compilation references (PermenPANRB No 35 Tahun 2012; Tathagati, 2014). Design Stage. At this stage, media selection and format selection are carried out. The media used is an image media that is useful for clarifying practical instructions or procedures for working in the laboratory, so that students can carry out practicum correctly and safely. At this design stage, the practicum guidebook format was chosen. The format meets the criteria of being attractive, easy and helpful in learning (Tim Penyusun Panduan Penulisan Buku Penuntun Praktikum dan Laporan Praktikum, 2016). The format of Basic Chemistry Practicum Handbook I with K3 as follows.
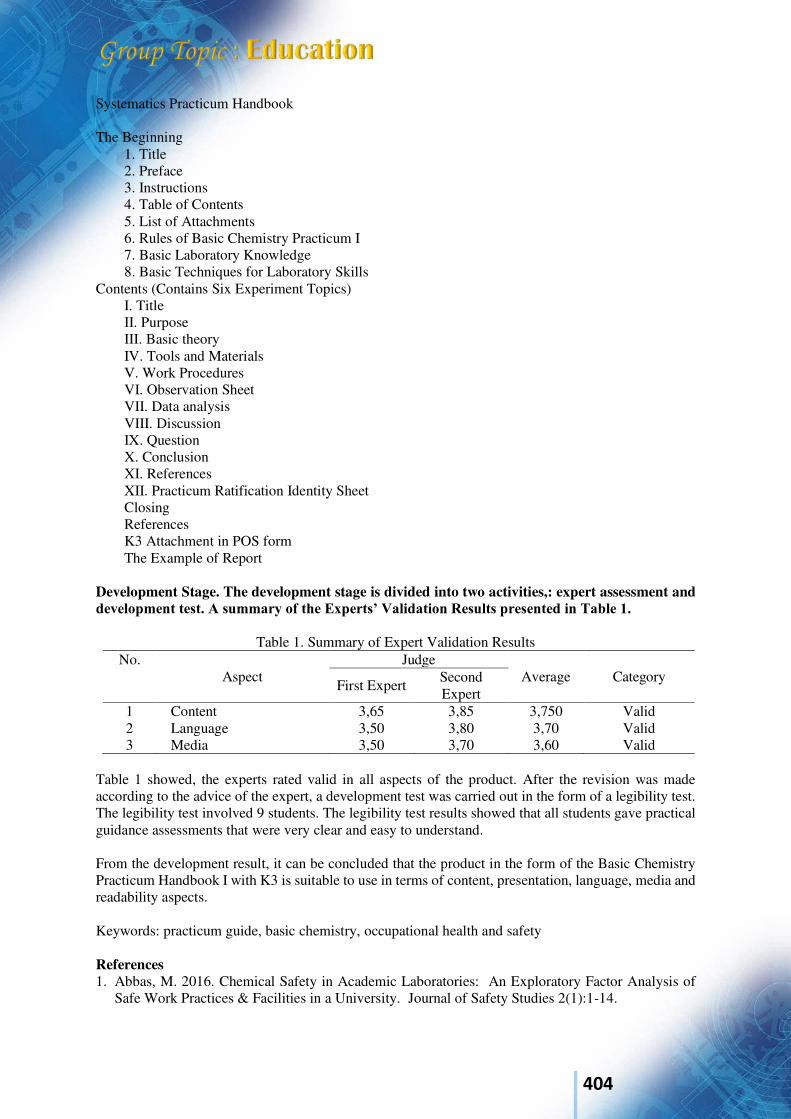
404
Systematics Practicum Handbook
The Beginning 1. Title 2. Preface 3. Instructions 4. Table of Contents 5. List of Attachments 6. Rules of Basic Chemistry Practicum I 7. Basic Laboratory Knowledge 8. Basic Techniques for Laboratory Skills
Contents (Contains Six Experiment Topics) I. Title II. Purpose III. Basic theory IV. Tools and Materials V. Work Procedures VI. Observation Sheet VII. Data analysis VIII. Discussion IX. Question X. Conclusion XI. References XII. Practicum Ratification Identity Sheet Closing References K3 Attachment in POS form The Example of Report
Development Stage. The development stage is divided into two activities,: expert assessment and development test. A summary of the Experts’ Validation Results presented in Table 1.
Table 1. Summary of Expert Validation Results
No. Aspect
Judge Average Category
First Expert Second Expert
1 Content 3,65 3,85 3,750 Valid 2 Language 3,50 3,80 3,70 Valid 3 Media 3,50 3,70 3,60 Valid
Table 1 showed, the experts rated valid in all aspects of the product. After the revision was made according to the advice of the expert, a development test was carried out in the form of a legibility test. The legibility test involved 9 students. The legibility test results showed that all students gave practical guidance assessments that were very clear and easy to understand.
From the development result, it can be concluded that the product in the form of the Basic Chemistry Practicum Handbook I with K3 is suitable to use in terms of content, presentation, language, media and readability aspects. Keywords: practicum guide, basic chemistry, occupational health and safety References 1. Abbas, M. 2016. Chemical Safety in Academic Laboratories: An Exploratory Factor Analysis of
Safe Work Practices & Facilities in a University. Journal of Safety Studies 2(1):1-14.

405
2. Committee on Chemical Management Toolkit Expansion: Standard Operating Procedures. 2016. Chemical Laboratory Safety and Security: A Guide to Developing Standard Operating Procedures. Board on Chemical Sciences and Technology, Division on Earth and Life Studies, The National Academies of Sciences, Engineering, and Medicine, Washington DC.
3. Education Bureau. 2013. Results of the Survey on Laboratory Accidents in Secondary Schools in 2011/2012 School Year. Circular Memorandum No. 55/2013. Date: 16 May 2013. Tersedia pada https://cd1.edb.hkedcity.net/cd/science/laboratory/safety/EDBCM13055E.pdf. Diakses 20 Februari 2020.
4. Harrison, T.G., W.J. Heslop, J.R. Eastman, A. Baldwin and D.E. Shallcross. 2011. Chemistry Lab Skills: Software to Support Laboratory Skills from Schools’ Pre-University to University Foundation Courses. Australian Journal Education Chemistry 71.
5. Lisa Moran and Tina Masciangoli. 2010. Chemical Laboratory Safety and Security A Guide to Prudent Chemical Management. Washington DC: The National Academies Press.
6. PermenPANRB Nomor 35 Tahun 2012 Tentang Pedoman Penyusunan Standar Operasional Prosedur (SOP) Admnistrasi Pemerintahan.
7. Prayitno, T. A. (2017). Pengembangan Petunjuk Praktikum Mikrobiologi Program Studi Pendidikan Biologi. Jurnal Biota Fakultas Pendidikan Ilmu Eksakta, 3(1): 31-37.
8. Sugirin, A. Widyantoro, S., Sudartini, (2013). Pengembangan Model Pengintegrasian Pendidikan Karakter dalam Pembelajaran Bahasa Inggris Di SMA. Laporan Penelitian. UNY. 2013.
9. Thiagarajan, S., Dorothy S. Semmel dan Melvyn I. Semmel. 1974. Instructional Development for Training Teachers of Exceptional Children. Bloomington: IndianaUniversity.
10. Tim Penyusun. 2016. Panduan Penulisan Buku Penuntun Praktikum dan Laporan Praktikum. Edisi 1. Revisi 1. Yogyakarta: Program Studi D III Analis Kimia Fakultas Matematika Dan Ilmu Pengetahuan Alam Universitas Islam Indonesia .
11. WHO. 2011. Laboratory Quality Management System: Handbook. Perancis: WHO Lyon Office
406
International Conference on Natural Sciences, Mathematics, Applications, Research, and Technology
Manado, Indonesia, 22-23 October 2020
THE FEASIBILITY OF INTERACTIVE DIGITAL MATHEMATICS BOOK WITH MULTI REPRESENTATIONS FOR HEARING IMPAIRED STUDENTS I Made Suarsana*1, I Made Sugiarta2, I K A A Juana Putra3, Gede Pande Suarcita4, Kadek Yasa Sumalasia5, Made Dwiyana Putra6
1, 2, 3, 4, 5, 6 Universitas Pendidikan Ganesha ([email protected]) INTRODUCTION Mathematics learning content for special needs (hearing impaired) school is not much different from normal school, but teaching mathematics for hearing impaired student is not the same as teaching it to normal children. Learning materials for hearing impaired students should be kept simple and equipped with multiple representations. With the development of ICT, presenting variuos representations has become easy and inexpensive. Therefore, the aim of this research is to produce interactive digital books with a multi representation approach that is appropriate for hearing impaired student of junior high school. The research was conducted for 3 initial stages of the 4-D development research design (define, design, develop, and disseminate). The feasibility of the resulting media is determined based on the results of expert validation, user practicality responses and student learning completeness scores. The average score of the results of book validation by experts, namely content experts is 2.92 (97.3%), learning design experts are 2.97 (99%), media experts are 2.99 (99.7%) and the experts language is 2.78 (92.7%) so it can be said that the book meets the valid criteria. The average score of practicality responses by student users is 4.24 (84.8%) and teacher users are 4.35 (87%) so it can be said that the book meets practical criteria. The average score of learning completeness is 83.34% so that it can be said that the book has met the effective criteria. By fulfilling the valid, practical, and effective criteria, it can be concluded that the digital books produced have met the criteria feasible for learning mathematics at grade VII junior high school. Further research is needed in the form of a wider field test to obtain empirical evidence of the effectiveness of the book. RESULTS AND DISCUSSION 1) This research has succeeded in developing an interactive digital book for grade VII hearing
impaired students, which contains 4 learning topics, namely fractions, geometry, integers, and common multiple and common divisor. The parts of this book are in the form of the front page, materials, learning videos, learning media, and bibliography. The material is presented using various representations ranging from pictures of concrete objects (real), verbal or stories in the form of conversations between students related to the material, and mathematical symbols. This teaching material is also equipped with computer simulation representations in the form of dynamic worksheets based on geogebra applications. Students can manipulate media on the work screen by moving the cursor and interactively provide input / answers to questions that arise. Immediate feedback on student input is provided by this interactive teaching material. This digital book also features a representation in the form of a learning video equipped with a sign language translator. As visual learners, the potential that deaf students have in capturing information visually is stimulated through the provision of videos. This video is equipped with a sign language translator to help students understand the information contained in the video.
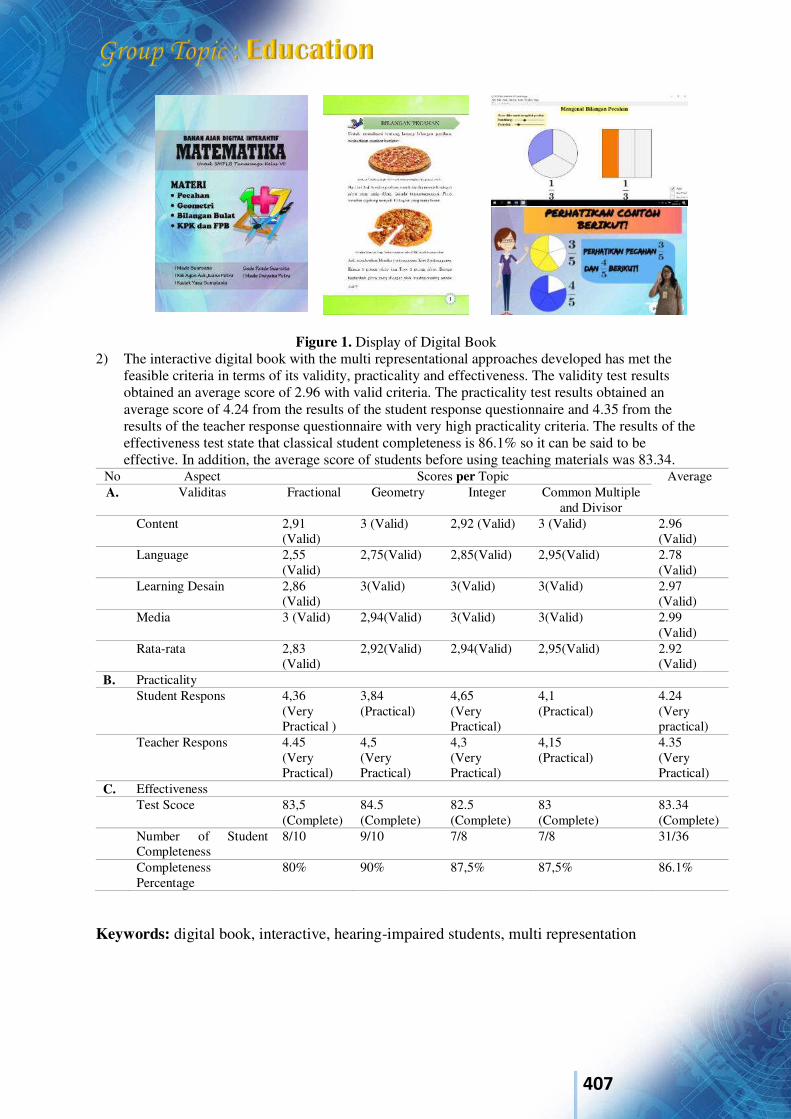
407
Figure 1. Display of Digital Book 2) The interactive digital book with the multi representational approaches developed has met the
feasible criteria in terms of its validity, practicality and effectiveness. The validity test results obtained an average score of 2.96 with valid criteria. The practicality test results obtained an average score of 4.24 from the results of the student response questionnaire and 4.35 from the results of the teacher response questionnaire with very high practicality criteria. The results of the effectiveness test state that classical student completeness is 86.1% so it can be said to be effective. In addition, the average score of students before using teaching materials was 83.34.
No Aspect Scores per Topic Average A. Validitas Fractional Geometry
Integer
Common Multiple
and Divisor Content 2,91
(Valid) 3 (Valid) 2,92 (Valid) 3 (Valid) 2.96
(Valid) Language 2,55
(Valid) 2,75(Valid) 2,85(Valid) 2,95(Valid) 2.78
(Valid) Learning Desain 2,86
(Valid) 3(Valid) 3(Valid) 3(Valid) 2.97
(Valid) Media 3 (Valid) 2,94(Valid) 3(Valid) 3(Valid) 2.99
(Valid) Rata-rata 2,83
(Valid) 2,92(Valid) 2,94(Valid) 2,95(Valid) 2.92
(Valid) B. Practicality Student Respons 4,36
(Very Practical )
3,84 (Practical)
4,65 (Very Practical)
4,1 (Practical)
4.24 (Very practical)
Teacher Respons 4.45 (Very Practical)
4,5 (Very Practical)
4,3 (Very Practical)
4,15 (Practical)
4.35 (Very Practical)
C. Effectiveness Test Scoce 83,5
(Complete) 84.5 (Complete)
82.5 (Complete)
83 (Complete)
83.34 (Complete)
Number of Student Completeness
8/10 9/10 7/8 7/8 31/36
Completeness Percentage
80% 90% 87,5% 87,5% 86.1%
Keywords: digital book, interactive, hearing-impaired students, multi representation

408
References [1] Astuti D, 2013 Pengembangan Bahan Ajar Matematika Untuk SMPLB/B Kelas IX
Berdasarkan Standar Isi in PROSIDING, Seminar Nasional Matematika dan Pendidikan
Matematika p. 211–218. [2] Tanridiler A Uzuner Y Anthropologist U G-T and 2015 undefined, Teaching and learning
mathematics with hearing impaired students Taylor Fr. [3] Nunes T Deaf C M-J of D S and and 2002 undefined, An intervention program for promoting
deaf pupils’ achievement in mathematics academic.oup.com. [4] otorhinolaryngology I R-I journal of pediatric and 1986 undefined, Helping deaf children
acquire language: Lessons from the past Elsevier. [5] Saud S … Z N U S and E (i and 2016 undefined, Design of e-learning courseware for hearing
impaired (HI) students ieeexplore.ieee.org. [6] Chen Y T, 2014 A study to explore the effects of self-regulated learning environment for
hearing-impaired students J. Comput. Assist. Learn. 30 p. 97–109. [7] Chan W H and Chou T J, 2006 Model of school adjustment of students with learning
disabilities and general students in senior high and/or vocational school students J. Spec. Educ. 24 p. 113–134.
[8] Reuterskiold C D Ibertsson T D and Sahlen B D, 2010 Venturing beyond the sentence level: Narrative skills in children with hearing loss. Volta Rev. 110, 3 p. 389–406.
[9] Pariatin Y and Z.A. Y, 2011 Perancangan Media Pembelajaran Interaktif Mata Pelajaran PKN untuk Penyandang Tuna Rungu Berbasis Multimedia J. Algoritm. 11 p. 10–19.
[10] Malatista B R and Sediyono E, 2012 Model Pembelajaran Matematika untuk Siswa Kelas IV SDLB Penyandang Tunarungu dan Wicara dengan Metode Komtal Berbantuan Komputer J.
Inform. 7, 1 p. 7. [11] Hopkins K and Moore B C, 2010 Development of a fast method for measuring sensitivity to
temporal fine structure information at low frequencies Int. J. Audiol. 49, 12 p. 940–946. [12] Kartini, 2009 Peranan Representasi Dalam Pembelajaran Matematika in Seminar Nasional
Matematika dan Pendidikan Matematika. [13] Sabirin M, 2014 Representasi dalam pembelajaran matematika J. Pendidik. Mat. UIN Antasari
1, 2 p. 33–44. [14] Ainsworth S, 1999 The functions of multiple representations Comput. Educ. 33, 2 p. 131–152. [15] Darmastini D P, 2014 Multi representasi siswa smp dalam menyelesaikan soal terbuka
matematika ditinjau dari perbedaan gender MATHEdunesa 1, 3. [16] Pearson, 2018 Beyond Millennials : The Next Generation of Learners Beyond Glob. Res.
Insights August p. 1–21. [17] Henke H, 2001 Electronic books and ePublishing: a practical guide for authors Springer
Science & Business Media. [18] Nelson M R, 2008 E-books in higher education: nearing the end of the era of hype? Educ. Rev.
43, 2 p. 40–42. [19] Hasyim N and Muqoddas A, 2015 Inventarisasi Cerita Rakyat dari Kabupaten Demak melalui
Aplikasi Buku Digital (E-Book) Interaktif ANDHARUPA J. Desain Komun. Vis. Multimed. 1, 02 p. 142–151.
[20] Aziz N N Shaffiei Z A Roseli N H M Aziz N U A Mutalib A A and Jaafar M S, 2011 Assistive Courseware for Hearing Impaired Learners in Malaysia Int. J. Adv. Sci. Eng. Inf. Technol. 1, 2 p. 133–138.
[21] Saud S F and Nasruddin Z A, 2016 Design of e-learning courseware for hearing impaired (HI) students in In User Science and Engineering (i-USEr), 2016 4th International Conference p. 271–276.
[22] Rusli A and Waldrip B, 2011 Implementasi pembelajaran berbasis multi representasi untuk peningkatan penguasaan konsep fisika kuantum J. Cakrawala Pendidik. 1, 1.
[23] Corradi D Elen J and Clarebout G, 2012 Understanding and enhancing the use of multiple external representations in chemistry education J. Sci. Educ. Technol. 21, 6 p. 780–795.
409
[24] Putra M I S, 2016 Efektivitas Pembelajaran Statistik dengan Pendekatan Keterampilan Multi Representasi untuk Meningkatkan Hasil Belajar Mahasiswa PGMI UNIPDU Jombang JMPM
J. Mat. dan Pendidik. Mat. 1, 1 p. 65–75. [25] NURROHMAN T, 2016, PENGEMBANGAN MODEL PEMBELAJARAN KONSEPTUAL
SAINTIFIK BERBASIS REPRESENTASI JAMAK UNTUK PENINGKATAN PENGUASAAN KONSEP FISIKA DAN KETERAMPILAN PROSES SAINS SISWA KELAS X SMAN 1 KALIREJO. UNIVERSITAS LAMPUNG.
[26] Permadi D and Setyaningsih K, 2017 PENGEMBANGAN MODUL MULTI REPRESENTASI BERBASIS KONTEKSTUAL PADA MATERI FLUIDA STATIS UNTUK MENINGKATKAN KEMAMPUAN BERPIKIR KRITIS JIFP (Jurnal Ilmu Fis. dan
Pembelajarannya) 1, 2 p. 5–10. [27] Perdana D M B, 2013, Pengembangan Buku Digital Interaktif (BUDIN) Berbasis Adobe
Creative Suite pada Materi Genetika di SMK. Universitas Negeri Semarang. [28] Miller C H, 2014, Digital storytelling: a creator’s guide to interactive entertainment (Vol. 3rd).
Burlington, Mass: Focal Press. [29] Wijayanti S Fadiawati N and Tania L, 2015 Pengembangan E-book Interaktif Kesetimbangan
Kimia Berbasis Representasi Kimia J. Pendidik. dan Pembelajaran Kim. 4, 2 p. 481–492. [30] Jannah N Fadiawati N and Tania L, 2017 Pengembangan E-book Interaktif Berbasis
Fenomena Kehidupan Sehari-hari tentang Pemisahan Campuran J. Pendidik. dan
pembelajaran Kim. 6, 1 p. 186–198. [31] Indhaka W A Supraptono E and Sugiarti N, 2016 Penerapan buku sekolah elektronik berbasis
android dalam materi ajar besaran dan satuan J. Penelit. Tindakan Kelas 17, 2. [32] Sunismi S and Fathani A H, 2017 Prototipe model collaborative learning matematika melalui
media blog dengan interactive digital book mata kuliah kalkulus II J. Fourier 6, 2 p. 69–83. [33] Ruyati Y, 204AD, Pembelajaran bagi Anak Tuna Rungu. Makalah disampaikan pada Kegiatan
Pendidikan Kompetensi Guru bagi Guru SLB Provinsi Bali di PPPPTK TK dan PLB Bandung, Bandung.
[34] Fajrianto R and Andjrah, 2012 Perancangan Media Pembelajaran Interaktif Mata pelajaran IPA untuk Siswa Kelas VIII SMPLB tuna Rungu dengan Materi “Memahami Sistem dalam Tubuh Manusia” J. Tek. POMITS 1, - p. 1–4.
[35] Hernawati T, 2014, Pendidikan Anak Tunarungu III, Bandung. [36] Tegeh I, Made & Kirna, I Made. 2010 Metod. Penelit. Pengemb. Pendidikan. Singaraja Univ.
Pendidik. Ganesha. [37] Delphie B, 2006 Pembelajaran Anak Berkebutuhan Khusus Bandung: PT Refika Aditama. [38] Dawis A M, 2013, Perancangan Aplikasi Multimedia untuk Pengenalan Bahasa Isyarat bagi
Anak Tuna Rungu Umur 6-9 Tahun, Universitas Muhammadiyah Surakarta. [39] Gunawan A A and Salim A, 2013 Pembelajaran Bahasa Isyarat Dengan Kinect Dan Metode
Dynamic Time Warping J. Mat Stat 13, 2 p. 77–84. [40] Effendi D, 2014, Seminar Nasional dan ExpoTeknik Elektro 2014 PROGRAM APLIKASI
PEMBELAJARAN IPA MATERI SISTEM PEREDARAN DARAH MANUSIA UNTUK SISWA KELAS V SDLB BAGIAN B (TUNA RUNGU) BERBASIS MULTIME.
[41] Marzal J, 2014 Desain Media Pembelajaran Bahasa Inggris Untuk Siswa Tunarungu Berbantuan Teknologi Informasi Dan Komunikasi J. Tekno-pedagogi 4, 2.
[42] Pujawan A A G S Ardana I M and Suarsana I M, PENGEMBANGAN MEDIA PEMBELAJARAN INTERAKTIF MATERI PELUANG UNTUK MENINGKATKAN PEMAHAMAN KONSEP SISWA SMPLB TUNARUNGU ejournal.undiksha.ac.id.
[43] Suarsana I M Mahayukti G A Sudarma K and Yoga N B A, 2018 Development of Interactive Mathematics Learning Media on Statistics Topic for Hearing-impaired Student I Made Suarsana a Int. Res. J. Eng. IT Sci. Res. 4, 6 p. p. 55–66.
[44] Beni K Gita I N and Suarsana I M, 2017, Media Pembelajaran Matematika Interaktif untuk Siswa Tunarungu: Perancangan dan Validasi.
[45] Pariyatin Y and Ashari Y Z, 2014 Perancangan Media Pembelajaran Interaktif Mata Pelajaran PKN untuk Penyandang Tunarungu Berbasis Multimedia (Studi Kasus di Kelas VII SMPLB Negeri Garut Kota) J. Algoritm. 11, 1.

410
International Conference on Natural Sciences, Mathematics, Applications, Research, and Technology
Manado, Indonesia, 22-23 October 2020
Designing a Problem-based Mathematics Learning with the Integration of Guided Discovery Method Nurhayati Abbas*1, Perry Zakaria*2
1, 2 Department of Mathematics, Universitas Negeri Gorontalo, Indonesia ([email protected]) INTRODUCTION The two-variable linear equation system is one of the mathematics topics taught in eighth grade of junior high school/Islamic junior high school. Since the topic has a lot to do with daily life problems, it requires the appropriate ways of teaching. One of the ways is by implementing a problem-based learning model with guided discovery. The essence of this model is by presenting the authentic and meaningful problem situations, which can serve as a stepping stone for investigation and inquiry, to students [1]. Simply put, this learning model characterizes the teaching process that presents authentic problems to students to be solved through investigation. The problem-based teaching model is closely related to group investigative activities. Hence, this learning model can be incorporated with the guided discovery method. The guided discovery method is a learning method that requires students to find ideas in the discovery process. In this method, the students receive guidance from the teacher in verbal instructions or written instructions as outlined in the form of student worksheets [2]. Thereupon, the guided discovery method is a learning method that requires students to find the inner ideas needed to observe, investigate, make assumptions, explain, measure, and make conclusions in finding the investigated knowledge, concepts, or principles with minimum teacher involvement. The collaboration of the guided discovery method with a problem-based teaching model becomes a learning strategy that is predicted to be able to maximize the students' knowledge. Accordingly, it is necessary to design a lesson plan and student worksheet in advance. A lesson plan refers to a face-to-face learning activity plan for one or more meetings. This instrument is developed from the syllabus to direct the students’ learning activities to achieve basic competence. The lesson plan is prepared based on the basic competence or sub-themes which are implemented in one or more meetings [3]. Student worksheets are student guides used to carry out the investigation and problem-solving activities [4]. Hence, student worksheet is an instrument in the form of sheets of paper that guides students in learning, both in finding concepts and solving problems. Further, the drafts of lesson plan and student worksheet need to be developed; the development design refers to the Thiagarajan, Semmel, and Semmel development models, namely the stages of define, design, develop, and disseminate [5]. RESULT AND DISCUSSION The results of the lesson plan design referred to the format of the Regulation of the Minister of Education and Culture of the Republic of Indonesia Number 22 of 2016 on the Basic and Secondary Education Process Standards, while the worksheet refers to developing theories. Both of these learning instruments were then validated by experts. All experts reported that from the point math content, the lesson plan
411
and student worksheet were of good quality. However, it was suggested to add one sub-material, namely the combined method of elimination and substitution. The results of the validation on the use of language and display had also been good. Limited Trial Results. The observing results of students’ activities from two observers showed that on average, they were active during learning meaning that almost all students were actively involved during the learning process. The students collaborated with teachers and other students in dialogue to discover or in learning to do the investigation. Students’ collaboration in problem-based teaching encouraged joint inquiry and dialogue as well as the development of thinking skills and social skills [1]. By guided discovery method, the students were encouraged to learn to a large extent through their active engagement with concepts and principles. Therefore, the collaboration of problem-based learning models with guided discovery could make students more active in the learning process [2]. The results of student responses to the learning activities, on average, were very positive, indicating that the problem-based learning model with guided discovery was able to make students happy and interested in learning mathematics. There was considerable enthusiasm for problem-based learning among teachers and students [1]. In addition, the teacher's response in managing learning activity was positive. Based on the above findings, the lesson plan and worksheet which referred to the problem-based learning models with guided discovery were appropriate to be used as an alternative learning example for the two-variable linear equations topic and the other mathematics lessons with similar characteristics. Keywords: Problem-based Learning, Guided Discovery, Instructional Design Acknowledgment We would like to thank the rector of Universitas Negeri Gorontalo for providing PNBP research funds. Also, we thank the Transbahasa team for their contribution in translating the present article. Special thanks to the Head of the Education and Culture Office of Gorontalo City, the Principal of SMPN 6 State Junior High School in Gorontalo, lecturer colleagues, and mathematics teachers for their contribution to all processes in this research. We hope to work with you again on future projects. References [1] Arends, Richard I. (2000). Learning to Teach. Belajar untuk Mengajar. Terjemahan Helly Prajitno
Soetjipto dan Sri Mulyatini Soetjipto. Yogyakarta: Pustaka Pelajar. [2] Erawati, N. K. Ayu, A.A.I.N Marhaeni, Sariyasa. International Journal of Elementary Education.
Volume 2, Number 2, Tahun 2018, pp. 131-137. P- ISSN: 2579-7158 E-ISSN: 2549-6050 Open Access: https://ejournal.undiksha.ac.id/index. php/IJEE. Akses 1 Okt 2020.h.133
[3] Kementerian Pendidikan dan Kebudayaan. 2013. Materi Pelatihan Implementasi Kurikulum 2013
SMA/SMK – Matematika. Jakarta: Kemendibud. [4] Trianto.2010. Mendesain Model Pembelajaran Inovatif-Progresif.Jakarta: Prenada Media Group. [5] Thiagarajan, S. Dorothy, S. Semmel, and Melvyn I. Semmel. (1974) Instructional Development for
Training Teachers of Exceptional Children. A Source Book. Blomington: Central for Innovation on Teaching the Handicapped.
412
International Conference on Natural Sciences, Mathematics, Applications, Research, and Technology
Manado, Indonesia, 22-23 October 2020
Undagi Bali Ethnomathematic Study in Penglipuran Village and Efforts to Acquire its Knowledge I Putu Pasek Suryawan*1, Made Juniantari2
1, 2 Universitas Pendidikan Ganesha ([email protected]) INTRODUCTION The purpose of this research was to find out: (1) ethnomatematics at Undagi Bali in Penglipuran Village; and (2) how Undagi Bali knows and gets knowledge about Undagi Bali ethnomatematics in Penglipuran Village. This research is a qualitative research using exploratory method, with data collection methods using literature study, observation, and interviews. The subjects of this research are people who work as Undagi traditional Balinese buildings in Penglipuran. The results of the exploration show that there are several ethnomatics in Undagi Bali, namely body measurements such as “lengkat, depa, tampak, ahasta, amusti”, as well as making house roof trusses, building house foundations, and making "luluh" . The ethnomatematics obtained are related to concepts in formal mathematics, such as counting, measuring, and counting activities. The process of the Undagi gaining knowledge is by learning to imitate the more experienced Undagi, learning basic concepts through literature, and learning from their own experiences. RESULTS AND DISCUSSION Based on the results and discussion presented, the conclusions of this study are as follows. 1. Mathematical elements contained in Undagi Bali mathematics in Penglipuran Village are in the
form of counting, measuring, and counting activities. Ethnomatematics that contain elements of calculation is the use of jargon “ping” which deals with repeated addition (“nem ping telu” is 6+6+6), the use of jargon” nikel” which deals with multiplying (“nem nikel ping telu” is six folded three times) as well as determining the location of the gate related to how to divide. Then ethnomatematics which contains elements of measurement is the traditional way of making elbows with rope and wood. In this way, Undagi used a size of 60 cm, 80 cm, 100 cm without knowing that it was a triple phytagoras. Then there are also those who make rectangular shapes using paper, by folding the paper so that it gets a right triangle shape. In addition, information was obtained that there are several basic scales of Balinese measurement used in the process of making traditional Balinese buildings, namely depa, alengkat, acengkang, acelek, atampak, atampakngandang, alek, akacing, ahasta, amusti, agemel, asirang, aguli tujuh, arahi, anyari, duang nyari, atampak lima,
petang nyari, atebah tampak lima. All of these basic scales of measurement use the measurements of the human body, from head to toe of the house owner to be built.
2. The knowledge that Undagi gets is through hereditary habits. They learn through seniors who already understand the process of making traditional Balinese buildings. Undagi also took formal education at least up to high school, so the knowledge they have is a collaboration from reading lontar, experience in the field, and knowledge gained from school. The Undagi process of gaining knowledge is to learn to imitate or learn through examples in the more experienced Undagi, hen learn the basic concepts through various literatures, and also learn from their experiences when they are independent. Until now, when Undagi is used to working independently, they still make small mistakes and are still learning.
413
Keywords: ethnomatematics, Balinese undagi, traditional building. References Abiam, P., Abonyi, O., Ugama, J., Okafor, G., 2016. Effects Of Ethnomathematics-Based Instructional
Approach On Primary School Pupils’ Achievement In Geometry, 2nd ED. Ebonyi State University, Nigeria..
Arisetyawan, A., 2015. Etnomatematika Masyarakat Baduy. Universitas Pendidikan Indonesia. Arisetyawan, A., Suryadi, D., Herman, T., Rahmat, C., 2014. Study Of Ethnomathematics : A Lesson
From The Baduy Culture. International Journal Of Education And Research, Bandung. Balamurugan, M., 2015. Ethnomathematics; An Approach For Learning Mathematics From
Multicultural Perspectives. Int J Modn Res Revs 3, 716–720. Bidja, I Made. 2012. Asta Kosala-Kosali Asta Bumi. Pustaka Bali Post, Denpasar Bishop, J., A., 1993. Significant Influences On Children’s Learning Of Mathematics. United Nations
Educational, Scientific, And Cultural, Paris, France. Bishop, A.J. (1994). Cultural Conflicts in Mathematics Education: Developing a Research Agenda
Vancouver, British Columbia, Canada: FLM Publishing Association Dasim, S.M., 2012. Implementasi Pendidikan Karakter Dalam Pembelajaran Sains Di Sekolah Dasar.
Universitas Pendidikan Indonesia, Bandung. Dwijayasastra, Nikko. 2013. Kajian Arsitektur Hijau Desa Adat Penglipuran Bali. Departemen
Arsitektur Lanskap IPB, Bogor. Ernest,P., 1993, The Philosophy of Mathematics Education, The Falmer Press, London Favilli, F., 2007. EThnomathematics And Mathematics Education, In: Proceedings Of The 10th
International Congress Of Mathematics Education, Discussion Group 15: Ethnomathematics. Freudenthal,H., 2002, Rivisiting Mathematics Education (China Lectures), Kluwer Academic
Publisher, New York/Dordrehct/Boston/London. Julian, Davison. 2014. Balinese Architecture. Tuttle Publishing. Karnilah, N., Juandi, D., Turmudi, 2012. Study Ethnomathematics : Pengungkapan Sistem Bilangan
Masyarakat Adat Baduy. Universitas Pendidikan Indonesia, Bandung. Nuh, Z.M., Dardiri, D., 2017. Etnomatematika Dalam Sistem Pembilangan Pada Masyarakat Melayu
Riau. Kutubkhanah 19, 220–238. Prijotomo, Josef. 2017. Prijotomo Benahi Arsitektur Nusantara. Departemen Arsitektur ITS, Surabaya. Rosa, M., Clark Orey, D., 2011. Ethnomathematics: The Cultural Aspects Of Mathematics, 2nd Ed.
Revista Latinoamericana De Etnomatemática. Rosa, M., Orey, D.C., 2013. Ethnomodeling As A Research Theoretical Framework On
Ethnomathematics And Mathematical Modeling. J. Urban Math. Educ. 6, 62–80. Sirate, S.F.S., 2011. Studi Kualitatif Tentang Aktivitas Etnomatematika Dalam Kehidupan Masyarakat
Tolaki. Stkip Yayasan Pendidik. Ujung Pandang 14, 123–136. Sopandi, Setiadi. 2013. Sejarah Arsitektur Sebuah Pengantar. PT Gramedia Pustaka Utama, Jakarta. Sugiyono, 2016. Metode Penelitian Pendidikan. ALFABETA. Bandung Unodiaku, S.S., 2013. Effect Of Ethno-Mathematics Teaching Materials On Students’ Achievement In
Mathematics In Enugu State. J. Educ. Pract. 4, 70–77.
414
International Conference on Natural Sciences, Mathematics, Applications, Research, and Technology
Manado, Indonesia, 22-23 October 2020
Preview-Review Bilingual Instructional Tools Development with Discovery Learning Model Setting for Enhancing Students’ Conceptual Understanding and Speaking Ability Luh Mitha Priyanka*1 and I Nyoman Selamat2
1Science Education, Universitas Pendidikan Ganesha, INDONESIA, 2Chemistry Education, Universitas Pendidikan Ganesha, INDONESIA. (E-mail: [email protected], [email protected]) INTRODUCTION
Universitas Pendidikan Ganesha has a vision to become a leading university based on Tri Hita Karana philosophy in Asian by 2045. There are several indicator to become a leading university such as competitive, collaborative, and have a character. Competitive means human resources and science technology which developed by Universitas Pendidikan ganesha (Undiksha) are able to compete in creating job opportunities. Having a characters means Undiksha developed human resources and science technology which uphold morality, humanity, and harmony. Collaborative means able to work in team synergistically. Competitive and collaborative as leading indicator can be built through mastery in English. One way to improve English competence through bilingual learning.
One of the faculty’s policies in enhancing learning quality is by using bilingual learning in class. Each study program in Mathematics and Natural Science Faculty is required to have at least two courses which carried out by using Bilingual Learning. In Natural Science Study Program, several course which carried out by using Bilingual Learning are Basec Science 1 and 2, History of Science, Mathematics for Science, and Biotechnology. However some of these bilingual course didn’t work optimally.
Bilingual learning is a method of learning by using two languages (English and Indonesia) in the entire of learning process until assessment implementation. This method aims to improve English competence and also understanding science concept (Constantin & Kassab, 2009). There are two important factors in bilingual learning. First, teacher and student are trained to be persistent in carrying out bilingual learning. Second, bilingual learning which implemented can help student to be more understand in English literature (Nuha, 2014).
Discussion with Basic Science lecture Ms Pujani, get an important information about the implementation of bilingual learning in this course isn’t optimal. This is because the planning and implementation of bilingual learning is still dominated by using Bahasa. Instructional tools which using in this course seventy five percent still using Bahasa. Syllabi, Semester Lesson Plan, Student Worksheet and handout still in Bahasa, meanwhile only assessment as instructional evaluation using English. Instructional tools which isn’t suitable can be one of the factor which make bilingual learning not implemented optimally (Wiratini, 2013).
Bilingual instructional tools which is accordance with the characteristics of students in Science Education is bilingual instructional tools with preview review model. This instructional tools combines Bahasa and English in every learning activity. In this model the introduction stage will carried out in one language for example Bahasa, and continue using English in the next stage of bilingual learning. For the third step will be carried out using combine two languages (Ovando and Collier, 1985). Preview-review bilingual teaching tools with discovery leaning model setting is expected to enhancing student’s conceptual understanding and speaking ability.
415
RESULTS AND DISCUSSION
The developed of preview-review bilingual instructional tools with discovery learning model setting aimed for enhancing students’ conceptual understanding and speaking ability. The developmental procedure was based on ADDIE which consisting of analyze need assessment, design product based on need assessment, develop product which test by expert’s judgment, and limiting product implementation in basic science course. Based on need assessment which conduct by interview with lecture and students, the product which develop are syllabi and learning equipment (semester lesson plan, worksheet, handout, and assessment). Data collection techniques used in this study is in the form of product validation sheets for reveal the feasibility preview-review bilingual instructional toos and assessment for measuring student’s conceptual understanding and speaking ability. Data analysis performed include feasibility preview-review bilingual instructional tools which scored by two expert lecturers. The result of feasibility bilingual instructional tools which developed is considered reasonable. Meanwhile limited product implementation in basic science course showed that the average of science concept’ student is 8.0 with supported by the average of speaking ability in active category. This means preview review bilingual teaching tools with discovery learning model is very effective for improving science concept and student’ speaking ability.
Keywords: discovery learning model, mastery conceptual understanding, preview-review bilingual learning, speaking ability Acknowledgment References
1. Constantin, A. & Kassab M. 2009. Increasing the Motivation for Physics using English as A
Medium of Teaching. Web: https://www.ffri.hr/GE2/Library (received 22.12.2009). 2. Nuha, U. 2014. Meningkatkan Kualitas Pelayanan Perpustakaan dengan Pendekatan Bilingual.
Jurnal Perpustakaan Libraria. Vol. 2 No. 1, 61-79. 3. Ovando, C.J. & Collier, V.P. 1985. Bilingual and ESL Classrooms. New York: McGraw-Hill
Book Company. 4. Wiratini, A, Suparta, N., & Sadra, W. 2013. Pengembangan Perangkat Pembelajaran Billingual
Tipe Partial Immersion dengan Setting Pembelajaran Kooperatif Tipe STAD. E-Journal
Program Pascasarjana Universitas Pendidikan Ganesha, Vol. 2.
416
International Conference on Natural Sciences, Mathematics, Applications, Research, and Technology
Manado, Indonesia, 22-23 October 2020
IMPLEMENTATION OF STEM LEARNING BASED ON LOCAL WISDOM OF BALI “TRI PRAMANA” TO IMPROVE THE SCIENCE LITERATION AND CHARACTER BUILDING Sanjayanti, NPAH*1, Darmayanti, NWS 2
1UNDIKSHA, INDONESIA. (E-mail: [email protected]) 2STKIP Suar Bangli, INDONESIA (E-mail: [email protected]) INTRODUCTION The development of science and technology (IPTEK) is currently happening very rapidly and affect all aspects of community life. With the development of science and technology, it must be balanced also with human resources (HR) quality. One effort that can be done to improve human resources is to improve the quality of science education. Various efforts have been made by the government to improve the quality of science education in Indonesia, such as the development of science learning models, the development of science learning media, the upgrading of teachers, the provision of facilities that support science learning, and the trainings (Depdiknas, 2004). However, the results obtained are still far from expectations. Trends International Mathematics and Sciences Study (TIMSS) in 2011 reported that the students' IPA skills of SD Indonesia were ranked 34th out of 38 countries surveyed. This fact shows that the quality of science learning in Indonesia still needs to be improved. There are several problems that are often the factors causing the low learning outcomes of science students. First, learning is still centered on teachers (teacher centered). Students seem to learn as good listeners. This is very contrary to the view of constructivism, which views knowledge must be built alone by learners. Second, the school less attention to the arrangement of the learning environment. Third, students are less interested in learning science. This is due to students' ignorance of the benefits they gain from learning science. All these problems will ultimately lead to the redundancy of students' science learning outcomes. In addition to the problems that have been described above, the low learning outcomes of science students also caused by mistakes in teacher learned students. One approach to learning that embraces constructivism is learning STEM. STEM (Science, technology, engineering and mathematics) education is now an alternative to science learning that can build a generation capable of facing a challenging 21st century. STEM is very appropriately applied in high school, because this learning model requires students who find their own knowledge. However, students are not really released in the learning process. Teachers play a role in guiding students to construct their knowledge. This STEM learning model, based on local wisdom concept of Bali Tri Pramana. This concept teaches about three ways to gain knowledge by listening (Sabda Pramana), observing (Pratyaksa Pramana), and reasoning (Anumana Pramana). This concept emphasizes on how the acquisition of knowledge of students can not only in one way, but in the three ways already described above. Thus, student knowledge will also be attached better and more durable. This research will be supported by several theoretical foundations, namely learning outcomes, science in primary
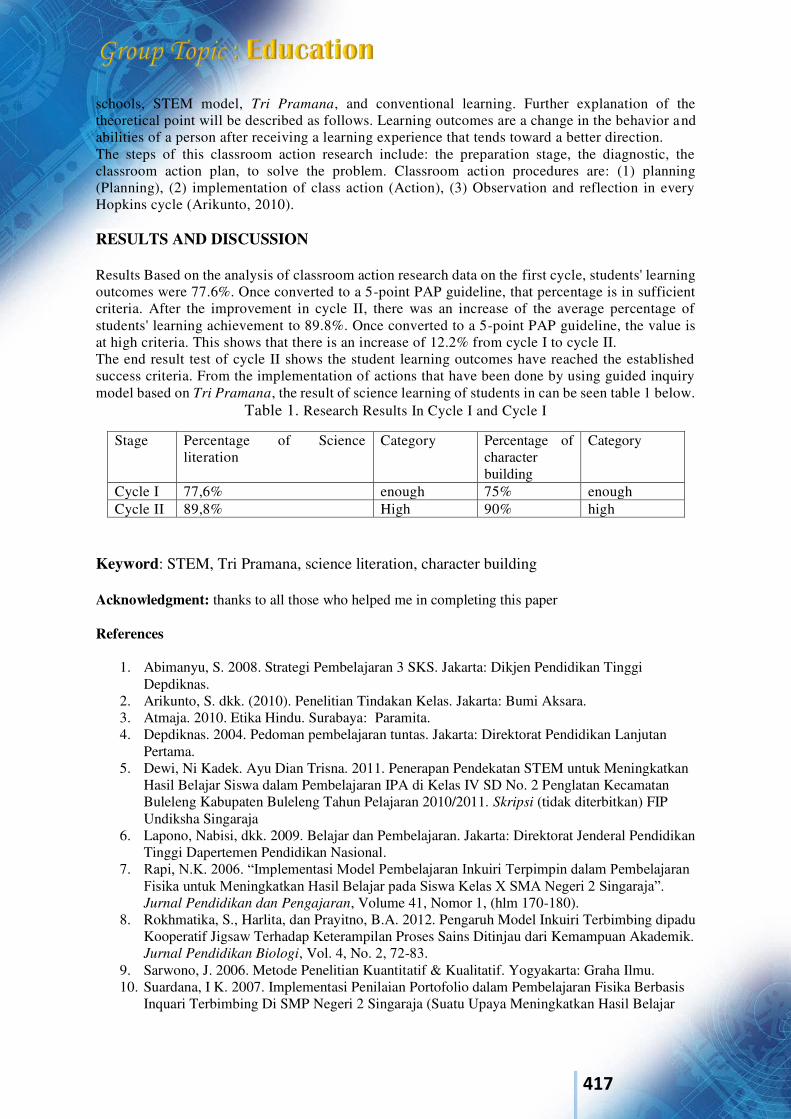
417
schools, STEM model, Tri Pramana, and conventional learning. Further explanation of the theoretical point will be described as follows. Learning outcomes are a change in the behavior and abilities of a person after receiving a learning experience that tends toward a better direction. The steps of this classroom action research include: the preparation stage, the diagnostic, the classroom action plan, to solve the problem. Classroom action procedures are: (1) planning (Planning), (2) implementation of class action (Action), (3) Observation and reflection in every Hopkins cycle (Arikunto, 2010). RESULTS AND DISCUSSION Results Based on the analysis of classroom action research data on the first cycle, students' learning outcomes were 77.6%. Once converted to a 5-point PAP guideline, that percentage is in sufficient criteria. After the improvement in cycle II, there was an increase of the average percentage of students' learning achievement to 89.8%. Once converted to a 5-point PAP guideline, the value is at high criteria. This shows that there is an increase of 12.2% from cycle I to cycle II. The end result test of cycle II shows the student learning outcomes have reached the established success criteria. From the implementation of actions that have been done by using guided inquiry model based on Tri Pramana, the result of science learning of students in can be seen table 1 below.
Table 1. Research Results In Cycle I and Cycle I
Keyword: STEM, Tri Pramana, science literation, character building Acknowledgment: thanks to all those who helped me in completing this paper References
1. Abimanyu, S. 2008. Strategi Pembelajaran 3 SKS. Jakarta: Dikjen Pendidikan Tinggi Depdiknas.
2. Arikunto, S. dkk. (2010). Penelitian Tindakan Kelas. Jakarta: Bumi Aksara. 3. Atmaja. 2010. Etika Hindu. Surabaya: Paramita. 4. Depdiknas. 2004. Pedoman pembelajaran tuntas. Jakarta: Direktorat Pendidikan Lanjutan
Pertama. 5. Dewi, Ni Kadek. Ayu Dian Trisna. 2011. Penerapan Pendekatan STEM untuk Meningkatkan
Hasil Belajar Siswa dalam Pembelajaran IPA di Kelas IV SD No. 2 Penglatan Kecamatan Buleleng Kabupaten Buleleng Tahun Pelajaran 2010/2011. Skripsi (tidak diterbitkan) FIP Undiksha Singaraja
6. Lapono, Nabisi, dkk. 2009. Belajar dan Pembelajaran. Jakarta: Direktorat Jenderal Pendidikan Tinggi Dapertemen Pendidikan Nasional.
7. Rapi, N.K. 2006. “Implementasi Model Pembelajaran Inkuiri Terpimpin dalam Pembelajaran Fisika untuk Meningkatkan Hasil Belajar pada Siswa Kelas X SMA Negeri 2 Singaraja”. Jurnal Pendidikan dan Pengajaran, Volume 41, Nomor 1, (hlm 170-180).
8. Rokhmatika, S., Harlita, dan Prayitno, B.A. 2012. Pengaruh Model Inkuiri Terbimbing dipadu Kooperatif Jigsaw Terhadap Keterampilan Proses Sains Ditinjau dari Kemampuan Akademik. Jurnal Pendidikan Biologi, Vol. 4, No. 2, 72-83.
9. Sarwono, J. 2006. Metode Penelitian Kuantitatif & Kualitatif. Yogyakarta: Graha Ilmu. 10. Suardana, I K. 2007. Implementasi Penilaian Portofolio dalam Pembelajaran Fisika Berbasis
Inquari Terbimbing Di SMP Negeri 2 Singaraja (Suatu Upaya Meningkatkan Hasil Belajar
Stage
Percentage of Science literation
Category Percentage of character building
Category
Cycle I 77,6% enough 75% enough Cycle II 89,8% High 90% high

418
Fisika Siswa pada Pokok Bahasan Gerak dan Gaya). Laporan Penelitian Dosen Muda, Universitas Pendidikan Ganesha.
11. Subagia, I W., dan Wiratma, I.G.L. 2008. Penerapan Model Siklus Belajar Berbasis Tri
Pramana pada Pembelajaran Sains di Sekolah. Jurnal Penelitian dan Pendidikan, volume 41, No 2 (hlm. 272-288).
12. Subagia, I W. 2003b. Model Siklus Belajar Berdasarkan Konsep “Tripramana.” Orasi Ilmiah. Disampaikan dalam rangka Dies Natalis ke-3 IKIP Negeri Singaraja.
13. Subagia, I W., dan Wiratma, I.G.L. 2006. Potensi-Potensi Kearifan Lokal Masyarakat Bali dalam Bidang Pendidikan. Jurnal Pendidikan dan Pengajaran, Vol. 39 No 3 Juli 2006. IKIP Negeri Singaraja.
14. Sudjana, Nana. 2006. Penilaian Hasil Proses Belajar Mengajar. Bandung: Remaja Rosdakarya.
15. Sumantri, Mulyani dan Johar Permana. 1999. Strategi Belajar Mengajar. Jakarta: Departemen Pendidikan dan Kebudayaan.
16. TIMSS. 2011. International Student Achievement In The TIMSS Science Content and Cognitive Domains. Tersedia pada http://www. timss.bc.edu/timss2011/downloads/T1 1_IR_S_Chapter3.pdf. Diakses pada 25 Januari 2013
17. Trianto. 2011. Model Pembelajaran Terpadu: Konsep, Strategi, dan Implementasinya dalam Kurikulum Tingkat Satuan Pendidikan (KTSP). Jakarta: Bumi Aksara.
18. Torlakson. T, 2014. Innovate: A Blueprint For Science, Technology, Engineering, and
Mathematics in California Public Education. California: State Superintendent of Public Instruction.
19. Wulanningsih, Sri., Prayitno, B.A., dan Probosari, R.M. (2012). Pengaruh Model Pembelajaran Inkuiri Terbimbing Terhadap Keterampilan Proses Sains Ditinjau dari Kemampuan Akademik Siswa SMA Negeri 5 Surakarta. Jurnal Pendidikan Biologi, Volume 4, Nomer 2, 33-43.
20. Zehra dan Nermin, 2009. The Effect of Guided Inquiry method on Preservice Teachers’ Science Teaching Self-Efficacy Beliefs. Journal of Turkish Science Education. Volume 6, Issue 2.
21. Ceylan, S., & Ozdilek, Z. (2015). Improving a Sample Lesson Plan for Secondary Science Courses withinthe TEMEducation. Procedia - Social and Behavioral Sciences, 17 , 223 – 228.http://doi.org/10.1016 /j.sbspro.2015.02.395
22. Lickona, Thomas. 2013. Education For Character: How Our Schools Can Teach Respect and Responsibility. Trj. Juma Abdu Wamaungo. Jakarta: Bumi Aksara
419
International Conference on Natural Sciences, Mathematics, Applications, Research, and Technology
Manado, Indonesia, 22-23 October 2020
THE EFFECT OF CREATIVE RESPONSIBILITY BASED LEARNING (CTL) MODEL ON CREATIVE THINKING SKILLS ASSESSED FROM THE SELF EFFICACY OF GRADE IV ELEMENTERY SCHOOL STUDENTS IN SAINS LEARNING
I G.A.T. Agustiana1 , I Nyoman Tika2, dan Made Citra Wibawa 3
1,2Department of Elementery School education, Faculty of Education, Universitas Pendidikan Ganesha-
Indonesia 1Department of Chemistry, Faculty of Mathematics and Natural Sciences, Universitas Pendidikan Ganesha-
Indonesia
Jl. Udayana no. 11 Singaraja 81116
*Corresponding author: [email protected] Research has been carried out that aims to (1). Overall to find out there are differences in creative thinking skills between students who take the Creative Responsibility Based Learning (CRBL) learning model and students who take conventional learning models. (2). To find out the differences in creative thinking skills, in groups of students who have high and low self-efficacy who follow the Creative Responsibility Based Learning (CRBL) learning model and students who follow conventional learning models. (3). To determine whether there is an effect of interaction between learning models and self-efficacy on students' creative thinking skills in science subjects. The results showed the following. (1) Overall, the science learning outcomes of students who take the CRBL learning model are higher than students who take the conventional learning model (Fh = 11.288> Ft (α = 0.05.1: 88) = 3.96) with a significant value of 0.044 <0.005, (2) there is a difference in creative thinking skills between grade IV elmentery school students who have high self-efficacy and low self-efficacy in science learning (Fh = 29,836> Ft (α = 0.05,1: 88) = 3.96 with significance value 0.00 <0.05), and (3) there is a significant interaction effect between learning models and self-efficacy on students' creative thinking skills (Fh = 16,783> Ft (α= 0.05,1: 88) = 3 , 96 with a significance value of 0.00 <0.05). Introduction Various intervention efforts by education experts in facilitating science learning have been carried out to build creative thinking skills in elementary school students, namely, interventions include: using inquiry teaching models (Akkuzu & Uyulgan 2016), Storytelling (Peleg et al. 2009) , crossword puzzles (Yuriev et al. 2016), case-based learning instruction (Çam & Geban 2017), green chemistry approach (Haack & Hutchison 2016). The use of various models and approaches still shows that students have obstacles in understanding science content. This is based on the fact that science is a complex subject that has many abstract concepts and is often counter-intuitive (Gabel, 1998). Furthermore, Hawkes (1996) and others (Fensha & Kass, 1988; Taber, 1995). This obstacle causes the emergence of psychological barriers for students to uncover natural phenomena, in an abstract domain, so that creative thinking skills are needed (Fang et al. 2016). In accordance with Piaget's theory of cognitive development (Barrouillet, 2015), creative thinking skills can be better adapted to the early grades, namely in the development phase of children's knowledge. Interventions to trigger good creative thinking skills can be started from learning science in elementary schools (Agustiana, 2009). Elementary school students' science learning outcomes are relatively low, caused by several factors, namely first, the use of teacher teaching methods that are not appropriate, so that students only memorize not understand the material (Agustiana, 2015). Second, the teacher's ability to motivate children is still low (Hagger & Chatzisarantis 2016), so a new approach needs to be initiated
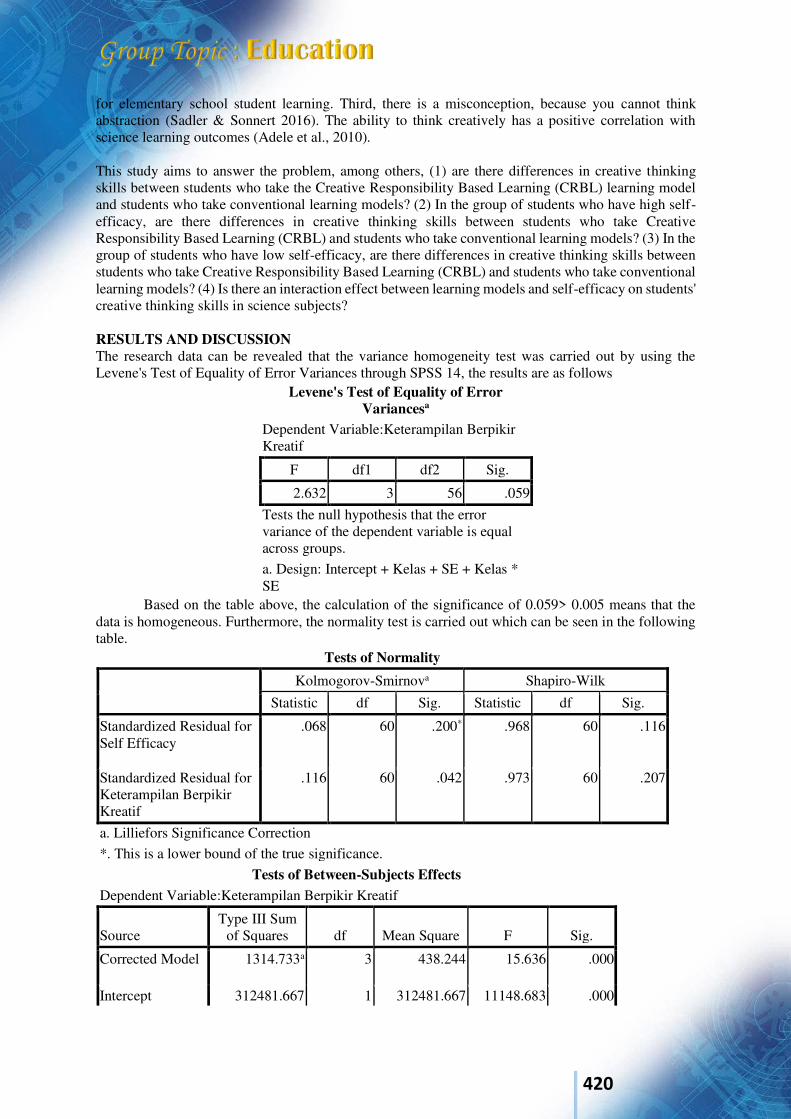
420
for elementary school student learning. Third, there is a misconception, because you cannot think abstraction (Sadler & Sonnert 2016). The ability to think creatively has a positive correlation with science learning outcomes (Adele et al., 2010). This study aims to answer the problem, among others, (1) are there differences in creative thinking skills between students who take the Creative Responsibility Based Learning (CRBL) learning model and students who take conventional learning models? (2) In the group of students who have high self-efficacy, are there differences in creative thinking skills between students who take Creative Responsibility Based Learning (CRBL) and students who take conventional learning models? (3) In the group of students who have low self-efficacy, are there differences in creative thinking skills between students who take Creative Responsibility Based Learning (CRBL) and students who take conventional learning models? (4) Is there an interaction effect between learning models and self-efficacy on students' creative thinking skills in science subjects? RESULTS AND DISCUSSION The research data can be revealed that the variance homogeneity test was carried out by using the Levene's Test of Equality of Error Variances through SPSS 14, the results are as follows
Levene's Test of Equality of Error Variancesa
Dependent Variable:Keterampilan Berpikir Kreatif
F df1 df2 Sig.
2.632 3 56 .059
Tests the null hypothesis that the error variance of the dependent variable is equal across groups. a. Design: Intercept + Kelas + SE + Kelas * SE
Based on the table above, the calculation of the significance of 0.059> 0.005 means that the data is homogeneous. Furthermore, the normality test is carried out which can be seen in the following table.
Tests of Normality
Kolmogorov-Smirnova Shapiro-Wilk
Statistic df Sig. Statistic df Sig.
Standardized Residual for Self Efficacy
.068 60 .200* .968 60 .116
Standardized Residual for Keterampilan Berpikir Kreatif
.116 60 .042 .973 60 .207
a. Lilliefors Significance Correction *. This is a lower bound of the true significance.
Tests of Between-Subjects Effects Dependent Variable:Keterampilan Berpikir Kreatif
Source Type III Sum
of Squares df Mean Square F Sig.
Corrected Model 1314.733a 3 438.244 15.636 .000
Intercept 312481.667 1 312481.667 11148.683 .000
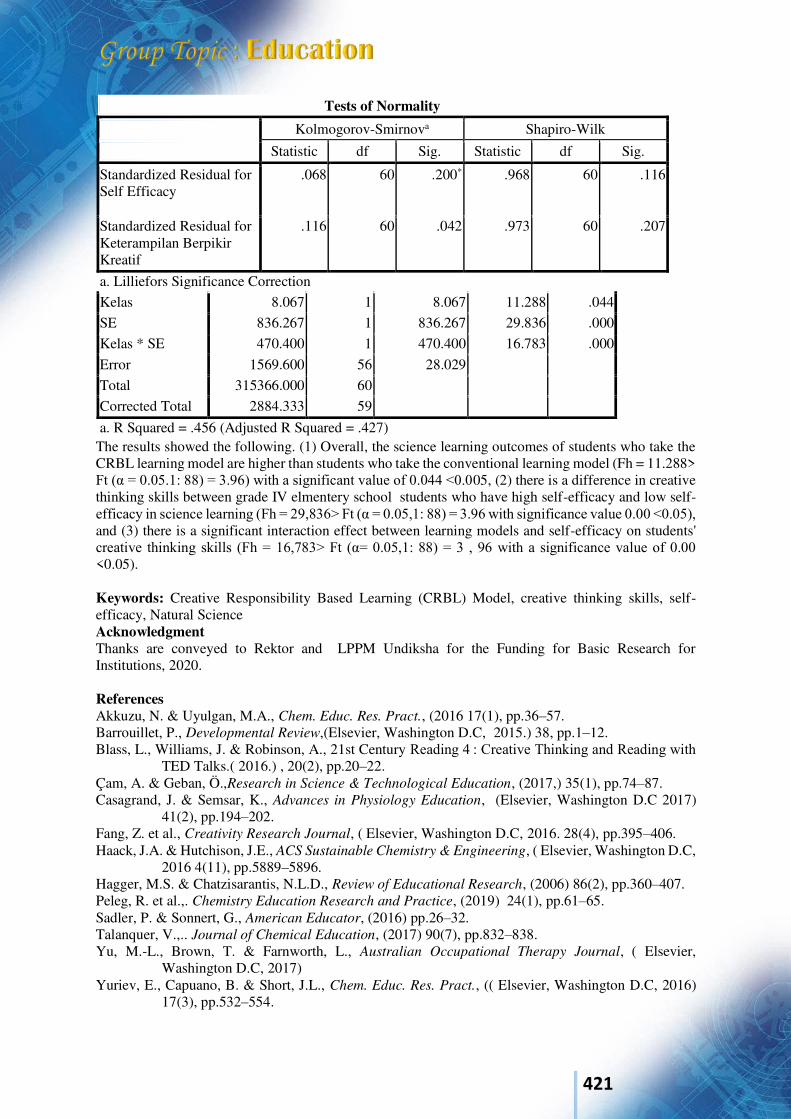
421
Tests of Normality
Kolmogorov-Smirnova Shapiro-Wilk
Statistic df Sig. Statistic df Sig.
Standardized Residual for Self Efficacy
.068 60 .200* .968 60 .116
Standardized Residual for Keterampilan Berpikir Kreatif
.116 60 .042 .973 60 .207
a. Lilliefors Significance Correction Kelas 8.067 1 8.067 11.288 .044 SE 836.267 1 836.267 29.836 .000 Kelas * SE 470.400 1 470.400 16.783 .000 Error 1569.600 56 28.029 Total 315366.000 60 Corrected Total 2884.333 59
a. R Squared = .456 (Adjusted R Squared = .427) The results showed the following. (1) Overall, the science learning outcomes of students who take the CRBL learning model are higher than students who take the conventional learning model (Fh = 11.288> Ft (α = 0.05.1: 88) = 3.96) with a significant value of 0.044 <0.005, (2) there is a difference in creative thinking skills between grade IV elmentery school students who have high self-efficacy and low self-efficacy in science learning (Fh = 29,836> Ft (α = 0.05,1: 88) = 3.96 with significance value 0.00 <0.05), and (3) there is a significant interaction effect between learning models and self-efficacy on students' creative thinking skills (Fh = 16,783> Ft (α= 0.05,1: 88) = 3 , 96 with a significance value of 0.00 <0.05). Keywords: Creative Responsibility Based Learning (CRBL) Model, creative thinking skills, self-efficacy, Natural Science Acknowledgment Thanks are conveyed to Rektor and LPPM Undiksha for the Funding for Basic Research for Institutions, 2020. References Akkuzu, N. & Uyulgan, M.A., Chem. Educ. Res. Pract., (2016 17(1), pp.36–57. Barrouillet, P., Developmental Review,(Elsevier, Washington D.C, 2015.) 38, pp.1–12. Blass, L., Williams, J. & Robinson, A., 21st Century Reading 4 : Creative Thinking and Reading with
TED Talks.( 2016.) , 20(2), pp.20–22. Çam, A. & Geban, Ö.,Research in Science & Technological Education, (2017,) 35(1), pp.74–87. Casagrand, J. & Semsar, K., Advances in Physiology Education, (Elsevier, Washington D.C 2017)
41(2), pp.194–202. Fang, Z. et al., Creativity Research Journal, ( Elsevier, Washington D.C, 2016. 28(4), pp.395–406. Haack, J.A. & Hutchison, J.E., ACS Sustainable Chemistry & Engineering, ( Elsevier, Washington D.C,
2016 4(11), pp.5889–5896. Hagger, M.S. & Chatzisarantis, N.L.D., Review of Educational Research, (2006) 86(2), pp.360–407. Peleg, R. et al.,. Chemistry Education Research and Practice, (2019) 24(1), pp.61–65. Sadler, P. & Sonnert, G., American Educator, (2016) pp.26–32. Talanquer, V.,.. Journal of Chemical Education, (2017) 90(7), pp.832–838. Yu, M.-L., Brown, T. & Farnworth, L., Australian Occupational Therapy Journal, ( Elsevier,
Washington D.C, 2017) Yuriev, E., Capuano, B. & Short, J.L., Chem. Educ. Res. Pract., (( Elsevier, Washington D.C, 2016)
17(3), pp.532–554.
422
International Conference on Natural Sciences, Mathematics, Applications,
Research, and Technology Manado, Indonesia, 22-23 October 2020
STEM Education through modeling in Analytic Geometry (the case of hyperbola) Gede Suweken Mathematics Department, Ganesha University of Education, INDONESIA Email: [email protected] INTRODUCTION Conics (conic sections) as school mathematics curriculum materials have been offered as early as junior high school (SMP) in Indonesia. In junior high school, students have started to study the line equation, one type of the simplest conic sections. This study is continued in senior high school (SMA) with the more complex conics, namely circles, parabolas, ellipses, and hyperbolas. However, although the reform in mathematics and science education is replete with movement into a more integrated learning, the learning of mathematics is still in silo approach. One of the simplest way to start to make mathematics learning to become more integrated, especially to sciences, is to show and discuss its applications to sciences. But the learning of mathematics, in particular the learning of conic sections in SMA, is lack of their use whether in daily applications, sciences, engineering, or technology, despite the fact that the origin of this subject is science (physics). The learning of conic sections are reduced to merely memorizing abstract formula that circles are x2 + y2 = r2, that parabolas are y2 = 4px, that ellipse are x2/a2 + y2/b2= 1, and hyperbolas are of x2/a2 - y2/b2 = 1, that the formula of its eccentricity is x = c/a. It has very rarely been seen whether in students’ text-books or in class session, what are the applications of parabola; whether the real parabolic antenna is really parabola. Where we are going to use the ellipses, or the rather mysterious topic hyperbola? Those are the realities of the teaching of conic sections in our schools. The intent of this article is to show, introduce, explain, and study the application and visualization of one of the types of conic sections, namely ellipse. It will be shown that this application is appropriate for high school students and the use of GeoGebra is inevitable to make the learning richer.
RESULTS AND DISCUSSION More than 100 years ago E.H. More (1902) stated that in the presidential address of American Mathematical Society regarding the learning of mathematics. His statement: Engineers tell us that in the schools algebra is taught in one water-tight component,
geometry in another and physics in another, and the students learns to appreciate (if ever) only very late the absolutely close connection between these different subjects, and then, if he credits the fraternity of teachers with knowing the closeness of this relation, he blames them most heartily for their unaccountably stupid way of teaching him.
423
Now, a century later, one might pause to consider the progress teachers and teacher educator have made in helping teachers and students not only see the important connections between those disciplines, but also understand how one discipline can support the learning of the other. Especially in Indonesia, teachers are still struggling in integrating those truly connected subjects. Although the curriculum of 2013 has been implemented for about 8 years and the curriculum asked teachers, especially mathematics teachers to use the Scientific Method to deliver his/her learning, we rarely find teachers starts their teaching by introducing problems related to natural phenomenon or sciences and using that phenomenon as a starting point to deliver their teaching. There are many opportunities to involve science or natural phenomenon as a trigger to engage students in learning mathematics. However due to the limitation of teachers knowledge about other subjects, other than their own specialties, this integration are rarely found. If it is found, it is very artificial, not genuine. This article will show how hyperbola can be applied to determine the location of an object, for instance a ship in the sea. By using this application we expect students will be interested in furthering their learning of mathematics and to see that STEM subjects are inter related, and realizing that the learning of those subjects are important in solving genuine problems. So, through this modeling, we expect students’ interest in STEM study will be improved. Basically the method for determining the location of an object using the concept of hyperbola consisted of: (i) locating three radio stations, let’s call them station A, B, and C, with B as the common station, (ii) Determining the hyperbolas with foci A and B, and B and C, and (iii) Finding the intersection point of these two hyperbolas. In the second step, we will use the concept of physics. This is due to the fact that hyperbola involves distances in its definition. Finally, having found these two hyperbolas, their intersection point which is the position of the ship can be determined. From the explanation given above, we have shown how physics is also involved in this modeling. All process involve in this modeling is going to use technology, namely GeoGebra. Students will develop a GeoGebra applet for doing the modeling, and to glue all the modeling process, the Design Engineering process is used. In conclusion, by using the problem of determining the location of a ship in sea, we expect students will (i) see how mathematics, sciences, technology, and engineering (that is STEM) have been applied to solve an important real-life problems by merely using concepts that have been studied, (ii) see that they need to integrate those subjects to make them useful in solving a complex problem, and (iii) improve their interest in studying STEM subjects. Keywords: STEM, Geometry Analytic, Hyperbola, GeoGebra, Modeling. References
1. Demana, Franklin D., et.al. 2011. Precalculus: Graphical, Numerical, Algebraic. 8th
Edition. Singapore: Addison-Wesley.
2. Depdikbud. 2013. PMP MTK Peminatan dan Ilmu Alam. Jakarta: Depdikbud.
3. Kilpatrick, J., Jane Swafford, Bradford Findel. 2001. Adding It Up: Helping Children
Learn Mathematics. Washington DC: The National Academies.
4. NCTM. 2009. Focus in High School Mathematics. Reasoning and Sense Making. Reston, VA: NCTM 5. Jolly, Anne. 2017. STEM by Design. New York: Routledge. 6. Gede Suweken. 2011. Pengembangan Mathlet Matematika Eksploratif untuk Meningkatkan Kompetensi Matematika Siswa SMP Kelas VIII di Singaraja. Singaraja: Undiksha (laporan penelitian hibah bersaing).

424
International Conference on Natural Sciences, Mathematics, Applications, Research, and Technology
Manado, Indonesia, 22-23 October 2020
Initial Design Development of Performance Assessment Methods in Planimetry Lectures I Putu Wisna Ariawan*1, I Made Ardana2
1, 2Department of Mathematics Education, Ganesha University of Education, INDONESIA. (E-mail: [email protected], [email protected])
INTRODUCTION In normal conditions, before the Covid-19 pandemic, student learning outcomes, especially in the planimetry course, were not satisfactory. In the 2019/2020 odd semester the average student learning outcomes for the Final Semester Examination only reached 38.75. Of course, this result is still far from being expected. What's more, with the outbreak of Covid-19 which causes the lecture process to be done online, of course the learning outcomes in this course are questionable. The outbreak of Covid-19 caused the world of education to be "forced" to change direction to change the face-to-face learning to online learning. ([1], [2]). In addition, online learning using e-learning is not always effective to be used to obtain quality learning outcomes because it can only be used to measure cognitive domains [3]. For this reason, in the lecture process there must be instructional intervention and innovation from course instructors to improve student learning outcomes in planimetry courses. One of the instructional and innovative interventions that can be done is the use of assessment methods, especially the formative assessment methods used by teachers so far. The formative assessment method that is intended is the method used by teachers to implement assessments that have been compiled for formative purposes. The formative assessment method used so far is more conventional, using only paper-pencil tests. The reason why performance assessment is chosen as a form of instructional intervention and an innovation are: assessment is an important component of instructions [4], student assessment is one of the most important responsibilities of teachers, because the quality of teaching in the classroom is closely related to the quality of the assessment applied [5], and performance assessment is a form of assessment that allows students to demonstrate a series of skills or behaviors, products in a particular context [6]. This study aims to find a performance assessment method format that is valid, practical, efficient and suitable for application in field geometry courses that can improve student learning outcomes. In this study, the research and development method was used. The development design used is the Borg and Gall model [7] which only adopts 5 steps from the 10 steps of the Borg and Gall model. The subjects involved in this study consisted of 3 experts who gave assessments related to the validity and practicality of the product developed based on the questionnaire given with a score range of 1 to 4 on each item, 10 students (who received treatment) who gave an assessment related to the practicality of the product developed based on a questionnaire given with a score range of 1 to 4 on each items. RESULTS AND DISCUSSION Performance assessment in mathematics learning is not exactly the same as performance assessment in other fields. This is because the field of mathematics has a different character from other fields. Performance assessment in mathematics is more in the form of solving problems with paper-pencils and calculators, expressing relationships in various forms such as graphs, and others [8]. There are two important components in assessment, namely the performance task and the performance rubric [9]. Task is the tasks that will be carried out to make a performance assessment, while the rubric consists of a list of criteria manifested by the dimensions of work, process aspects or concepts to be assessed and quality gradations starting from the most perfect level to the worst level. Based on the description above, the product specifications in the form of a performance
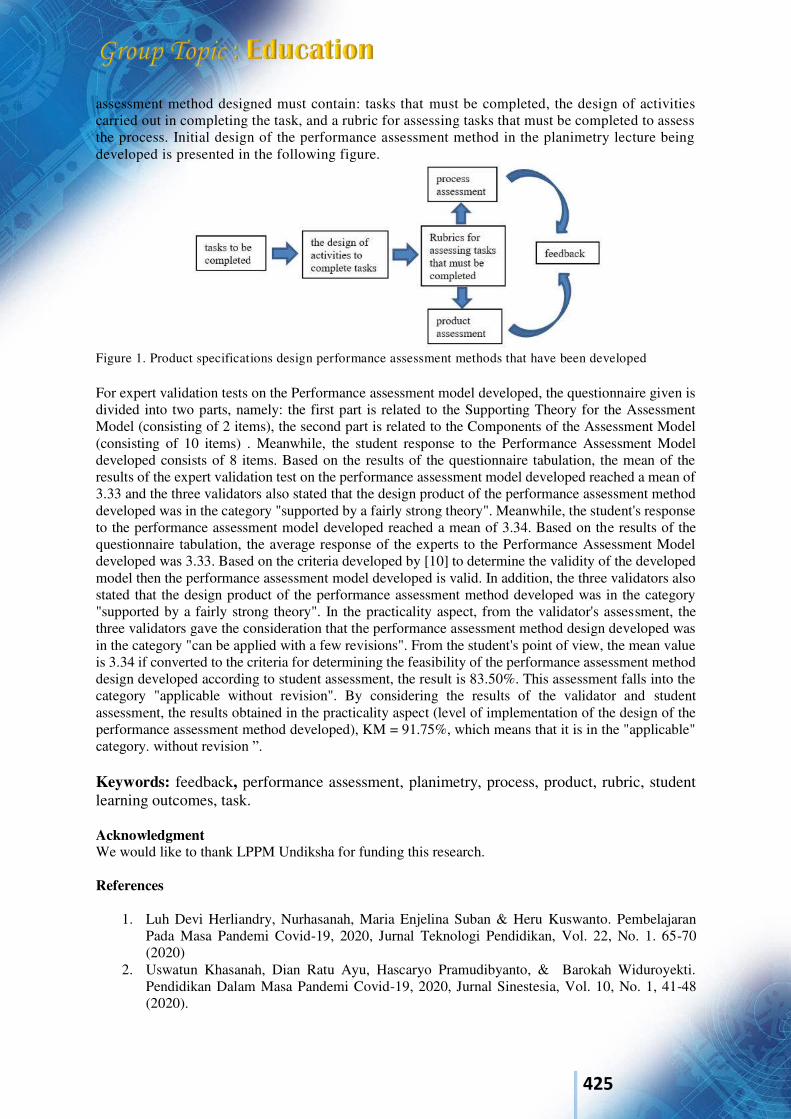
425
assessment method designed must contain: tasks that must be completed, the design of activities carried out in completing the task, and a rubric for assessing tasks that must be completed to assess the process. Initial design of the performance assessment method in the planimetry lecture being developed is presented in the following figure.
Figure 1. Product specifications design performance assessment methods that have been developed For expert validation tests on the Performance assessment model developed, the questionnaire given is divided into two parts, namely: the first part is related to the Supporting Theory for the Assessment Model (consisting of 2 items), the second part is related to the Components of the Assessment Model (consisting of 10 items) . Meanwhile, the student response to the Performance Assessment Model developed consists of 8 items. Based on the results of the questionnaire tabulation, the mean of the results of the expert validation test on the performance assessment model developed reached a mean of 3.33 and the three validators also stated that the design product of the performance assessment method developed was in the category "supported by a fairly strong theory". Meanwhile, the student's response to the performance assessment model developed reached a mean of 3.34. Based on the results of the questionnaire tabulation, the average response of the experts to the Performance Assessment Model developed was 3.33. Based on the criteria developed by [10] to determine the validity of the developed model then the performance assessment model developed is valid. In addition, the three validators also stated that the design product of the performance assessment method developed was in the category "supported by a fairly strong theory". In the practicality aspect, from the validator's assessment, the three validators gave the consideration that the performance assessment method design developed was in the category "can be applied with a few revisions". From the student's point of view, the mean value is 3.34 if converted to the criteria for determining the feasibility of the performance assessment method design developed according to student assessment, the result is 83.50%. This assessment falls into the category "applicable without revision". By considering the results of the validator and student assessment, the results obtained in the practicality aspect (level of implementation of the design of the performance assessment method developed), KM = 91.75%, which means that it is in the "applicable" category. without revision ”. Keywords: feedback, performance assessment, planimetry, process, product, rubric, student learning outcomes, task. Acknowledgment We would like to thank LPPM Undiksha for funding this research. References
1. Luh Devi Herliandry, Nurhasanah, Maria Enjelina Suban & Heru Kuswanto. Pembelajaran Pada Masa Pandemi Covid-19, 2020, Jurnal Teknologi Pendidikan, Vol. 22, No. 1. 65-70 (2020)
2. Uswatun Khasanah, Dian Ratu Ayu, Hascaryo Pramudibyanto, & Barokah Widuroyekti. Pendidikan Dalam Masa Pandemi Covid-19, 2020, Jurnal Sinestesia, Vol. 10, No. 1, 41-48 (2020).

426
3. I Putu Wisna Ariawan, D G H Divayana & P W A Suyasa. Initial design of blended learning for mathematics subject using the Kelase platform by adopting content of Tri Kaya Parisudha. IOP Conf. Series: Journal of Physics: Conf. Series 1470, 1 – 6, (2020).
4. Semire Dikli. Assessment at a distance: Traditional vs. Alternative Assessments. The Turkish Online Journal of Educational Technology – TOJET July 2003, volume 2 Issue 3 Article 2, 13 – 19 (2013).
5. Khadijeh Bayat & Amir Rezaei. Importance of Teachers’ Assessment Literacy. International Journal of English Language Education, Vol. 3, No. 1, 139 – 146 (2015).
6. A.A.I.N. Marhaeni. Asesmen Otentik dalam Rangka KTSP: Suatu Upaya Pemberdayaan Guru dan Siswa. Makalah Disampaikan pada Pelatihan KTSP bagi Guru SMP/MTs di Kabupaten Tabanan Tanggal 10-14 September 2007, 1-13 (2007).
7. W.R. Borg & Gall, M.D. Gall. Educational Research: An Introduction, Fifth Edition. New York: Longman, 2008). 212 – 213.
8. Brian Stecher. Performance Assessment in an Era of Standards-Based Educational Accountability. (Stanford, CA: Stanford University, 2010). pp. 6.
9. Asmawi Zainul. Alternative Assessment (Jakarta: Universitas Terbuka, 2001), pp. 13. 10. Y. Yamasari, Y. Pengembangan Media Pembelajaran Matematika Berbasis ICT yang
Berkualitas. Prosiding Seminar Nasional Pascasarjana X ITS 2010, 4 Agustus 2010, 2010 pp. 3.
427
International Conference on Natural Sciences, Mathematics, Applications, Research, and Technology
Manado, Indonesia, 22-23 October 2020
Need Assesments as a Foundation to Develop Learning Materials of the Introduction of Astronomy to Improve the Students’ Problem Solving and Generic Science Ability N M Pujani*1, I Suswandi2, P P Juniartina3, P H Sudewa4 1,2,3,4Physics and Science Education Departement, Faculty of Mathematics and Science, Universitas Pendidikan Ganesha, Indonesia
(e-mail: [email protected];@; [email protected].; [email protected] ; [email protected].) INTRODUCTION The low results of science learning in Indonesia indicate that students 'problem solving abilities and students' thinking abilities are still in the low category (Gonzales, 2009). Students are expected to have complete knowledge of science (astronomy) to face the problems of everyday life and be able to solve problems faced contextually through integrated science learning (Kemdikbud, 2013). Apart from problem-solving skills, learning science also develops generic science abilities. Generic science ability is a skill to think and act based on the knowledge they have acquired after students learn science (Liliasari, 2005). Generic science skills are abilities that can be used to learn various concepts and solve problems in science (Brotosiswoyo, 2000). Many generic abilities can be developed through practice, for example making decisions, problem solving, communication, group work, and high-level reasoning (Gibb, 2002).
The low ability of problem solving and the genetics science ability is influenced by the choice of learning models and learning material (Pujani, 2017). Sadia et.al, (2007) found that the dominant learning methods used by the teacher were lecture method (70%), experimental method (10%), discussion (10%), and demonstration (10%). The results of observations on Astronomy learning in the Science Education Study Program FMIPA Undiksha found that there were no adequate astronomy learning tools. The available learning tools are still limited to hand outs, there are no astronomy teaching materials. The hand outs used by the teacher are still partial, where the hand outs, activity sheets, and evaluation tools used are all independent without any connection between one another. Even practicum is only given in a very insufficient portion, so that learning is still teacher centered. Therefore, it is necessary to develop introductory astronomy teaching materials and integrated practicum instructions based on inquiry learning models. The main purpose of inquiry learning is to help students develop higher order thinking skills by asking motivating questions, getting answers based on curiosity, and being able to conclude and give meaning to their findings (Sadia, 2014).
The purpose of this study is to analyze the current condition of science learning and determine the topics that are essential to be studied in Astronomy course. This study is the preliminary of the main research to develop learning materials of the Introduction of Astronomy to improve the students’ problem solving and generic science ability. The results of the analysis will be used as a guidance in developing the learning materials of the Introduction of Astronomy for prospective science teachers in Science Education Program at Universitas Pendidikan Ganesha. The method employed in this study is descriptive. The research activity began with the assessment of basic science curriculum for teacher training program and science curriculum in junior and senior high school, followed by analysis of the implementation of learning, and the evaluation of the facility of science laboratory and interview with lecturers and teachers about the implementation of science learning.

428
RESULTS AND DISCUSSION The results of this study provide a real picture of the need to develop learning materials of the Introduction of Astronomy. Teaching materials are prepared based on the curriculum used in the Undergraduate Science Education Program, namely the 2019 curriculum which is competency-based and KKNI oriented. Astronomy courses are offered in semester IV with a weight of 3 (1) credits. The introductory astronomy teaching material that was developed consists of 9 chapters with a supplement in the form of practicum instructions consisting of 6 topics. The material coverage is presented in Table 1 below.
Table 1 The scope of the introductory astronomy material No. Subject matter Description
Introductory Astronomy Teaching Materials 1 Earth in a Celestial Globe Describes the rotation and revolution of the earth, painting
the position of the stars according to the arrangement of the horizon, the equator.
2 Solar system Describe the composition and origin of the Solar System, Planetary Motion, Asteroids, Comet and Meteors.
3 Sun Determine the distance and mass of the sun, spectrum, solar energy and wind
4 Earth Moon System Describes the phases of the Moon, Sidereal and Synodic Periods, Eclipses and the Physical State of the Moon
5 Movement of Planets and Satellites
Describe the Geocentric and Heliocentric, the application of Kepler and Newton's Laws to planetary motion
6 Star Physics Describe the constellations, distance, brightness, temperature and colour of the stars, the H-R diagram
7 Star Evolution Describes the process of the birth of a star, Main Sequence Evolution, and Advanced Evolution
8 Galaxy Describes the Discovery of Galaxies, the Structure of the Milky Way Galaxy, Types of Galaxies and Quasars
9 Universe Describes the Distribution of the Galaxy, the Expanding Universe, the Age and the Origin of the Universe
Practicum Instructions (Supplements) 1 LKM 1 Sundial Determine geographic north and south direction and use
the sun's shadow as a timepiece 2 LKM 2 Earth's Rotation
and Revolution Studying the process of day and night, the time difference and the length of time of day and night on earth
3 LKM 3 Moon’s Rotation and Revolution
Study the phases of the moon and the process of an eclipse
4 LKM 4 Observation Coordinates
Understand the coordinate system of celestial bodies, determine coordinates based on the coordinate system of the horizon and equator
5 LKM 5 Observation of the constellations
Identifying the constellations paints the star configuration of the constellations of the sky
6 LKM 6 Night Sky Observation
Observe night sky objects using the help of a sky map and stellarium
With introductory astronomy teaching materials supplemented with practical instructions, astronomy learning is taught with 2 hours face to face in the classroom and 1 practical credit. Practical activities are very strategic to provide basic skills in studying astronomy which are essential to support conceptual mastery, skills development, student attitudes and other abilities such as problem solving skills and generic science abilities.This finding is in line with the research results of Pujani (2014). Keywords: analysis, need assesment, learning materials, Introduction of Astronomy
429
Acknowledgments The authors would like to thank the Dean of Mathematics and Natural Sciences, Universitas
Pendidikan Ganesha (Undiksha) for financial support. We also appreciate the assistance of teaching staff at Physics and Science Education Department, Undiksha. References
1. P. Gonzales. 2009. Highlights From TIMSS 2007: Mathematics and Science Achievement of
U.S. Fourthand Eighth-Grade Student in an International Context. Washington: Institute of Education Sciences.
2. B. S. Brotosiswoyo. 2000. “Hakekat Pembelajaran Fisika di Perguruan Tinggi”, dalam Hakekat
Pembelajaran MIPA & Kiat Pembelajaran Fisika di Perguruan Tinggi. Jakarta: Proyek Pengembangan Universitas Terbuka. Departemen Pendidikan Nasional.
3. J. Gibb. 2002. The Collection of Research Reading on Generics Skill in VET [Online]. Tersedia: http://www.ncvr.edu.au.hotm [ 2 Februari 2020]
4. Kemendikbud. 2013. Peraturan Menteri Pendidikan dan Kebudayaan Nomor 69 Tahun 2013
tentang Kerangka Dasar dan Struktur Kurikulum Sekolah Menengah Atas/Madrasah Aliyah.
Jakarta. 5. Liliasari. 2005. Membangun Keterampilan Berpikir Manusia Indonesia Melalui Pendidikan
Sains. Naskah Pidato Ilmiah pada Pengukuhan Guru Besar Pendidikan IPA UPI, Bandung. 23 November 2005.
6. I W. Sadia. 2007. Pengembangan Kemampuan Berfikir Formal Siswa SMA Melalui Penerapan Model Pembelajaran Problem Based Learning dan Cyrcle Learning dalam Pembelajaran Fisika. Journal Pendidikan dan Pengajaran Undiksha, 40(1), 1-20, Januari 2007.
7. I W. Sadia. 2014. Model-Model Pembelajaran Sains Konstruktivistik. Yogyakarta: Graha Ilmu. 8. N. M. Pujani. 2014. Pengembangan Perangkat Praktikum Ilmu Pengetahuan Bumi dan
Antariksa Berbasis Kemampuan Generik Sains Untuk Meningkatkan Keterampilan Laboratorium Calon Guru Fisika. Jurnal Pendidikan Indonesia, Undiksha, 3(2), 471-484.
9. N. M. Pujani. 2017. The Implementation of Inquiry Learning Model to Improve Self-Concept and Learning Achievement of the Students of SMA Lab Undiksha, Unnes Science
Education Journal . 6(2), 1577 – 1585
430
International Conference on Natural Sciences, Mathematics, Applications, Research, and Technology
Manado, Indonesia, 22-23 October 2020
Lesson Study in Astrophysics to Improve the Quality of Learning N M Pujani*1, K Suma2 and P H Sudewa3 1,2,3Physics and Science Education Departement, Faculty of Mathematics and Science, Universitas Pendidikan Ganesha, Indonesia
(e-mail: [email protected]; [email protected]; [email protected].) INTRODUCTION
So far, various innovative learning models have been applied by lecturers in the Astronomy course in the field of Astrophysics in the Science Education Study Program, including through teaching grant programs. However, from the author's observations, the average student learning outcomes are still unsatisfactory. One of the contributing factors is the learning method used by lecturers in Astrophysics lectures. Learning tends to be one-way, where the interactions that occur are only from lecturers to students, whereas what should be developed is multi-directional interaction. In addition, learning Astrophysics material is often separated from problems in everyday life. Astrophysical material is felt as a burden that must be remembered, memorized and understood, but it does not have any meaning or feels for their daily lives. In a classroom setting, students learn more from one another than their lecturers. This shows that the Astrophysics lecture material needs to be improved so that student activity and learning outcomes can be improved.
Efforts to improve the process of Astrophysics lecture material, to increase student activity and learning achievement can be done through lesson study. Lesson study is a model of teaching professional development through collaborative and sustainable learning based on the principles of collaboration and mutual learning to build learning communities (Lewis, 2002 and Susilo et al., 2009). Indrawan, et al., (2014) shows that lesson study can develop teacher professionalism and improve student achievement. The advantages of lesson study are: 1) lecturers can formulate long-term learning and development goals; 2) Collaboratively design a research lesson; 3) Carry out learning by assigning a lecturer to teach and other team members to make observations to collect data about learning events in class; 4) Discuss learning events that have been observed during the learning process, using this information to improve the quality of learning; and 5) Implementing revised learning programs in other classes, and if necessary reviewing and revising the learning program (Lewis, 2002).
This study aimed at describing the quality of astrophysics teaching and learning during the implementation of lesson study, including the students’ activity and the impact of the lesson for improvement in students’ learning outcome. The type of research was case study with descriptive qualitative analysis. The study was done in 3 cycles of Plan, Do and See. The subject was 3 lecturers in science education study program and the 4th semester students of Science Education Study Program Universitas Pendidikan Ganesha. The data about learning activities and learning outcome was gathered during the learning process which is assessed from the observation sheet, interview and written questionnaire. Also, the students’ learning outcome was gathered from the written test.
RESULTS AND DISCUSSION The quality of the lesson study observed by the observers can be seen from the percentage of
observers who gave positive responses at each stage of the lesson study. Table 1 describes in general the quality of the implementation of the lesson study cycle.
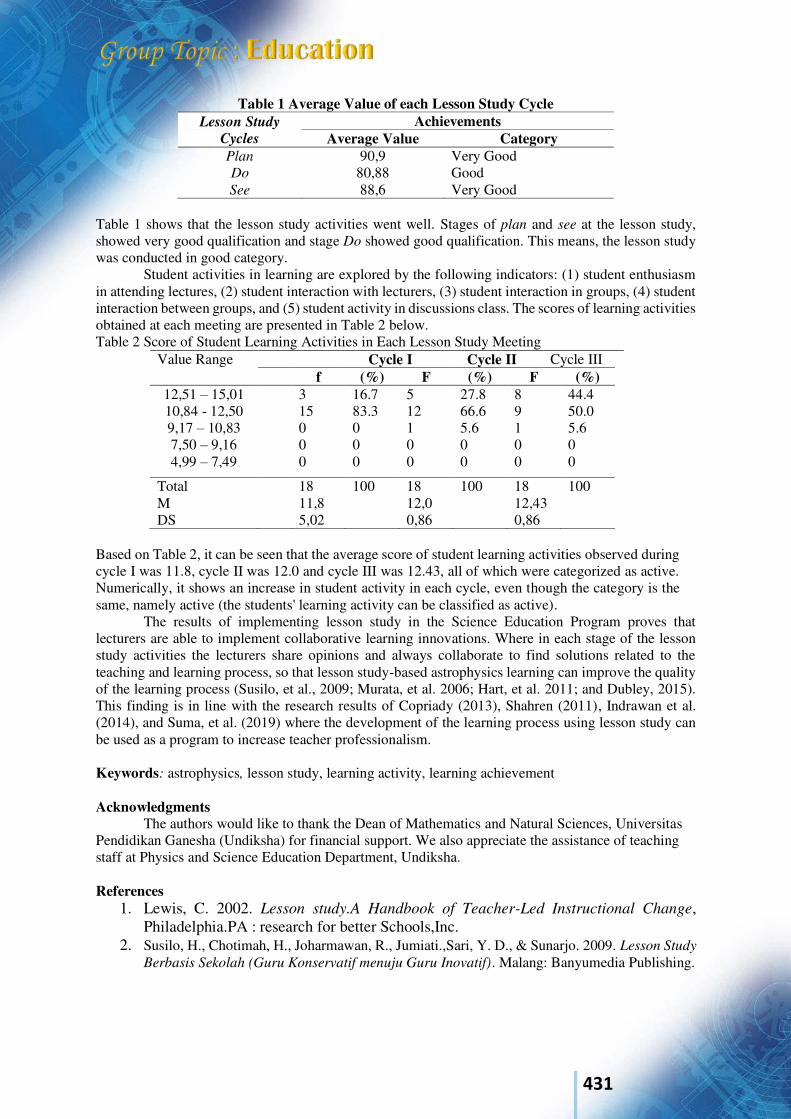
431
Table 1 Average Value of each Lesson Study Cycle Lesson Study
Cycles Achievements
Average Value Category Plan 90,9 Very Good Do 80,88 Good See 88,6 Very Good
Table 1 shows that the lesson study activities went well. Stages of plan and see at the lesson study, showed very good qualification and stage Do showed good qualification. This means, the lesson study was conducted in good category. Student activities in learning are explored by the following indicators: (1) student enthusiasm in attending lectures, (2) student interaction with lecturers, (3) student interaction in groups, (4) student interaction between groups, and (5) student activity in discussions class. The scores of learning activities obtained at each meeting are presented in Table 2 below. Table 2 Score of Student Learning Activities in Each Lesson Study Meeting
Value Range Cycle I Cycle II Cycle III f (%) F (%) F (%)
12,51 – 15,01 10,84 - 12,50 9,17 – 10,83 7,50 – 9,16 4,99 – 7,49
3 15 0 0 0
16.7 83.3 0 0 0
5 12 1 0 0
27.8 66.6 5.6 0 0
8 9 1 0 0
44.4 50.0 5.6 0 0
Total M DS
18 11,8 5,02
100 18 12,0 0,86
100 18 12,43 0,86
100
Based on Table 2, it can be seen that the average score of student learning activities observed during cycle I was 11.8, cycle II was 12.0 and cycle III was 12.43, all of which were categorized as active. Numerically, it shows an increase in student activity in each cycle, even though the category is the same, namely active (the students' learning activity can be classified as active).
The results of implementing lesson study in the Science Education Program proves that lecturers are able to implement collaborative learning innovations. Where in each stage of the lesson study activities the lecturers share opinions and always collaborate to find solutions related to the teaching and learning process, so that lesson study-based astrophysics learning can improve the quality of the learning process (Susilo, et al., 2009; Murata, et al. 2006; Hart, et al. 2011; and Dubley, 2015). This finding is in line with the research results of Copriady (2013), Shahren (2011), Indrawan et al. (2014), and Suma, et al. (2019) where the development of the learning process using lesson study can be used as a program to increase teacher professionalism. Keywords: astrophysics, lesson study, learning activity, learning achievement Acknowledgments
The authors would like to thank the Dean of Mathematics and Natural Sciences, Universitas Pendidikan Ganesha (Undiksha) for financial support. We also appreciate the assistance of teaching staff at Physics and Science Education Department, Undiksha. References
1. Lewis, C. 2002. Lesson study.A Handbook of Teacher-Led Instructional Change, Philadelphia.PA : research for better Schools,Inc.
2. Susilo, H., Chotimah, H., Joharmawan, R., Jumiati.,Sari, Y. D., & Sunarjo. 2009. Lesson Study
Berbasis Sekolah (Guru Konservatif menuju Guru Inovatif). Malang: Banyumedia Publishing.

432
3. I P. O. Indrawan, I. B. P. Arnyana dan N. M. Pujani, 2014. Pengaruh Lesson Study terhadap Kompetensi Profesional Guru IPA dan Prestasi Belajar Siswa SMKN 2 Seririt. e-journal Universitas Pendidikan Ganesha.
4. A. Murata, R. Perry C. Lewis. 2006. How Should Research Contribute to Instructional
Improvement? The Case of Lesson Study. Educational Research. 5. L. C. Hart, A. S. Alston & A. Murata. 2011. Lesson Study Research and Practice in
Mathematics Education (Learning Together). New York: Springer 6. P. Dubley. 2015. Lesson Study Professional Learning for Our Time. New York: Routledge. 7. J. Copriady. 2013. The Implementation of Lesson study Programme for Developing
Profesionalism in Teaching Profession. Jurnal Asian Social Science;9 (12). 8. A. Shahren. 2011. Mathematics Teachers’ Perception of Lesson Study as a Continuous
Professional Development Programme. Journal of science and mathematics education in east
Asia. 34(1), 67 – 89. 9. K. Suma, I W. Sadia & N. M. Pujani. 2019. The effect of lesson study on science teachers’
pedagogical knowledge and self efficacy. International Journal on New Trends in Education
and Their Implications.10 (4)
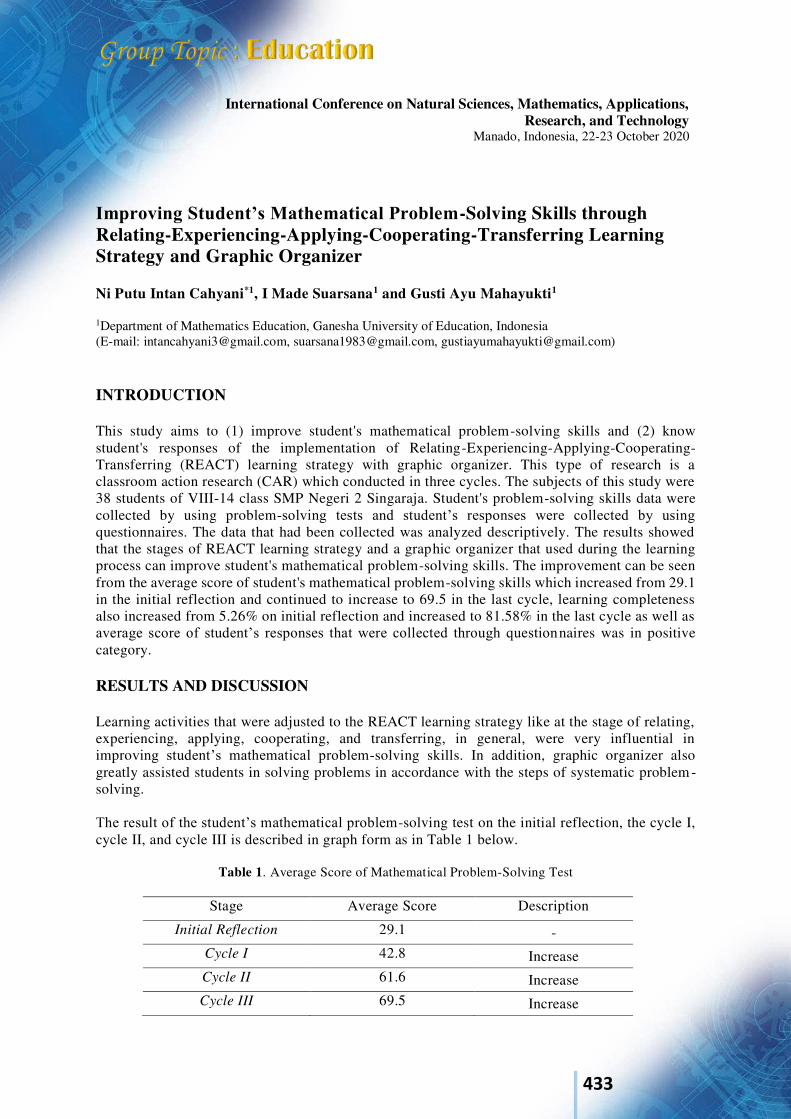
433
International Conference on Natural Sciences, Mathematics, Applications, Research, and Technology
Manado, Indonesia, 22-23 October 2020
Improving Student’s Mathematical Problem-Solving Skills through Relating-Experiencing-Applying-Cooperating-Transferring Learning Strategy and Graphic Organizer Ni Putu Intan Cahyani*1, I Made Suarsana1 and Gusti Ayu Mahayukti1
1Department of Mathematics Education, Ganesha University of Education, Indonesia (E-mail: [email protected], [email protected], [email protected])
INTRODUCTION This study aims to (1) improve student's mathematical problem-solving skills and (2) know student's responses of the implementation of Relating-Experiencing-Applying-Cooperating-Transferring (REACT) learning strategy with graphic organizer. This type of research is a classroom action research (CAR) which conducted in three cycles. The subjects of this study were 38 students of VIII-14 class SMP Negeri 2 Singaraja. Student's problem-solving skills data were collected by using problem-solving tests and student’s responses were collected by using questionnaires. The data that had been collected was analyzed descriptively. The results showed that the stages of REACT learning strategy and a graphic organizer that used during the learning process can improve student's mathematical problem-solving skills. The improvement can be seen from the average score of student's mathematical problem-solving skills which increased from 29.1 in the initial reflection and continued to increase to 69.5 in the last cycle, learning completeness also increased from 5.26% on initial reflection and increased to 81.58% in the last cycle as well as average score of student’s responses that were collected through questionnaires was in positive category. RESULTS AND DISCUSSION Learning activities that were adjusted to the REACT learning strategy like at the stage of relating, experiencing, applying, cooperating, and transferring, in general, were very influential in improving student’s mathematical problem-solving skills. In addition, graphic organizer also greatly assisted students in solving problems in accordance with the steps of systematic problem -solving. The result of the student’s mathematical problem-solving test on the initial reflection, the cycle I, cycle II, and cycle III is described in graph form as in Table 1 below.
Table 1. Average Score of Mathematical Problem-Solving Test
Stage Average Score Description
Initial Reflection 29.1 - Cycle I 42.8 Increase Cycle II 61.6 Increase Cycle III 69.5 Increase
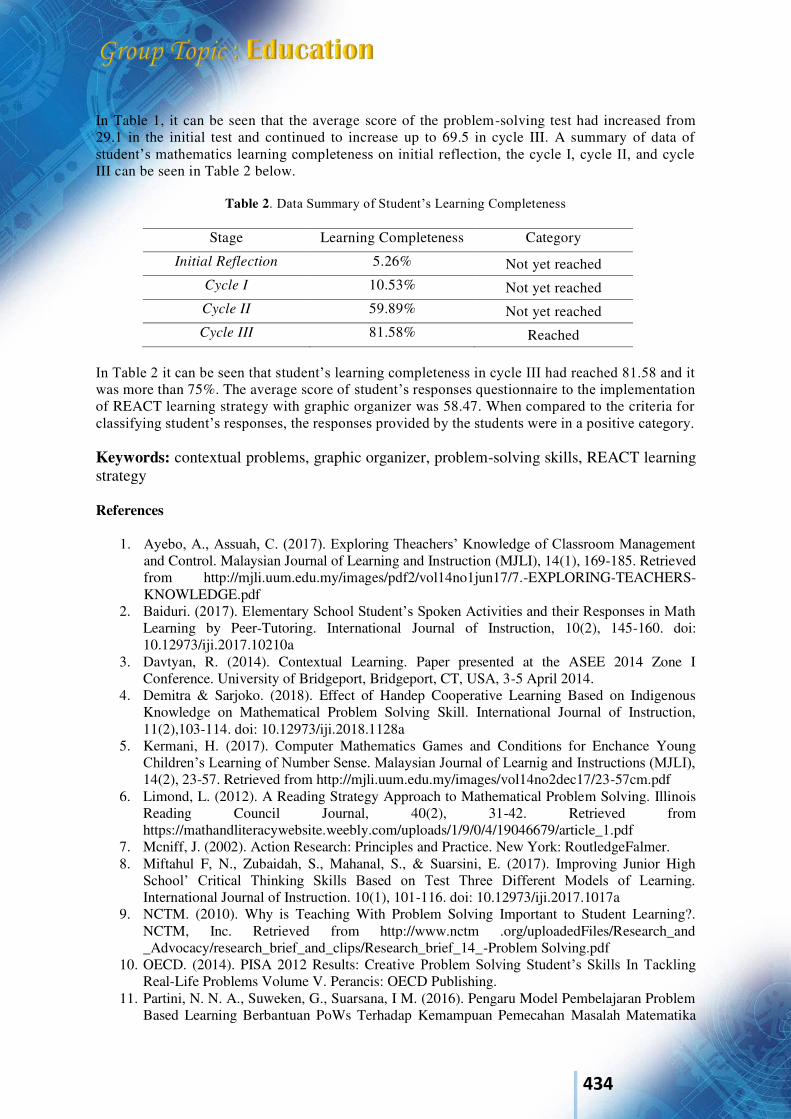
434
In Table 1, it can be seen that the average score of the problem-solving test had increased from 29.1 in the initial test and continued to increase up to 69.5 in cycle III. A summary of data of student’s mathematics learning completeness on initial reflection, the cycle I, cycle II, and cycle III can be seen in Table 2 below.
Table 2. Data Summary of Student’s Learning Completeness
Stage Learning Completeness Category
Initial Reflection 5.26% Not yet reached Cycle I 10.53% Not yet reached Cycle II 59.89% Not yet reached Cycle III 81.58% Reached
In Table 2 it can be seen that student’s learning completeness in cycle III had reached 81.58 and it was more than 75%. The average score of student’s responses questionnaire to the implementation of REACT learning strategy with graphic organizer was 58.47. When compared to the criteria for classifying student’s responses, the responses provided by the students were in a positive category. Keywords: contextual problems, graphic organizer, problem-solving skills, REACT learning strategy References
1. Ayebo, A., Assuah, C. (2017). Exploring Theachers’ Knowledge of Classroom Management and Control. Malaysian Journal of Learning and Instruction (MJLI), 14(1), 169-185. Retrieved from http://mjli.uum.edu.my/images/pdf2/vol14no1jun17/7.-EXPLORING-TEACHERS-KNOWLEDGE.pdf
2. Baiduri. (2017). Elementary School Student’s Spoken Activities and their Responses in Math Learning by Peer-Tutoring. International Journal of Instruction, 10(2), 145-160. doi: 10.12973/iji.2017.10210a
3. Davtyan, R. (2014). Contextual Learning. Paper presented at the ASEE 2014 Zone I Conference. University of Bridgeport, Bridgeport, CT, USA, 3-5 April 2014.
4. Demitra & Sarjoko. (2018). Effect of Handep Cooperative Learning Based on Indigenous Knowledge on Mathematical Problem Solving Skill. International Journal of Instruction, 11(2),103-114. doi: 10.12973/iji.2018.1128a
5. Kermani, H. (2017). Computer Mathematics Games and Conditions for Enchance Young Children’s Learning of Number Sense. Malaysian Journal of Learnig and Instructions (MJLI), 14(2), 23-57. Retrieved from http://mjli.uum.edu.my/images/vol14no2dec17/23-57cm.pdf
6. Limond, L. (2012). A Reading Strategy Approach to Mathematical Problem Solving. Illinois Reading Council Journal, 40(2), 31-42. Retrieved from https://mathandliteracywebsite.weebly.com/uploads/1/9/0/4/19046679/article_1.pdf
7. Mcniff, J. (2002). Action Research: Principles and Practice. New York: RoutledgeFalmer. 8. Miftahul F, N., Zubaidah, S., Mahanal, S., & Suarsini, E. (2017). Improving Junior High
School’ Critical Thinking Skills Based on Test Three Different Models of Learning. International Journal of Instruction. 10(1), 101-116. doi: 10.12973/iji.2017.1017a
9. NCTM. (2010). Why is Teaching With Problem Solving Important to Student Learning?. NCTM, Inc. Retrieved from http://www.nctm .org/uploadedFiles/Research_and _Advocacy/research_brief_and_clips/Research_brief_14_-Problem Solving.pdf
10. OECD. (2014). PISA 2012 Results: Creative Problem Solving Student’s Skills In Tackling Real-Life Problems Volume V. Perancis: OECD Publishing.
11. Partini, N. N. A., Suweken, G., Suarsana, I M. (2016). Pengaru Model Pembelajaran Problem Based Learning Berbantuan PoWs Terhadap Kemampuan Pemecahan Masalah Matematika

435
Siswa Kelas VII SMP Negeri 4 Singaraja. Jurnal Wahana Matematika dan Sains, 9(2), 1-9. Retrieved from https://ejournal.undiksha.ac.id/index.php/JPM/article/view/12647/7943
12. Polya, G. (1973). How to Solve It: A New Aspect of Mathematical Method. New Jersey: Princeton University Press.
13. Rahardjo, S. & Gudnanto. (2012). Pemahaman Individu: Teknik Nontes. Jakarta: Prenada Media Group.
14. Suharta, I G. P., & Suarjana, I M. (2018). A Case Study on Mathematical Literacy of Prospective Elementary School Teachers. International Journal of Instruction, 11(2), 413-424. doi: 10.12973/iji.2018.11228a
15. Upton, P. (2016). Psikologi Perkembangan. Jakarta: Erlangga. 16. Zollman, A. (2009). Students Use Graphic Organizers to Improve Mathematical Problem
Solving Communications. Middle School Journal, 41(2), 4-12. Retrieved from http://www.jstor.org/stable/23044804
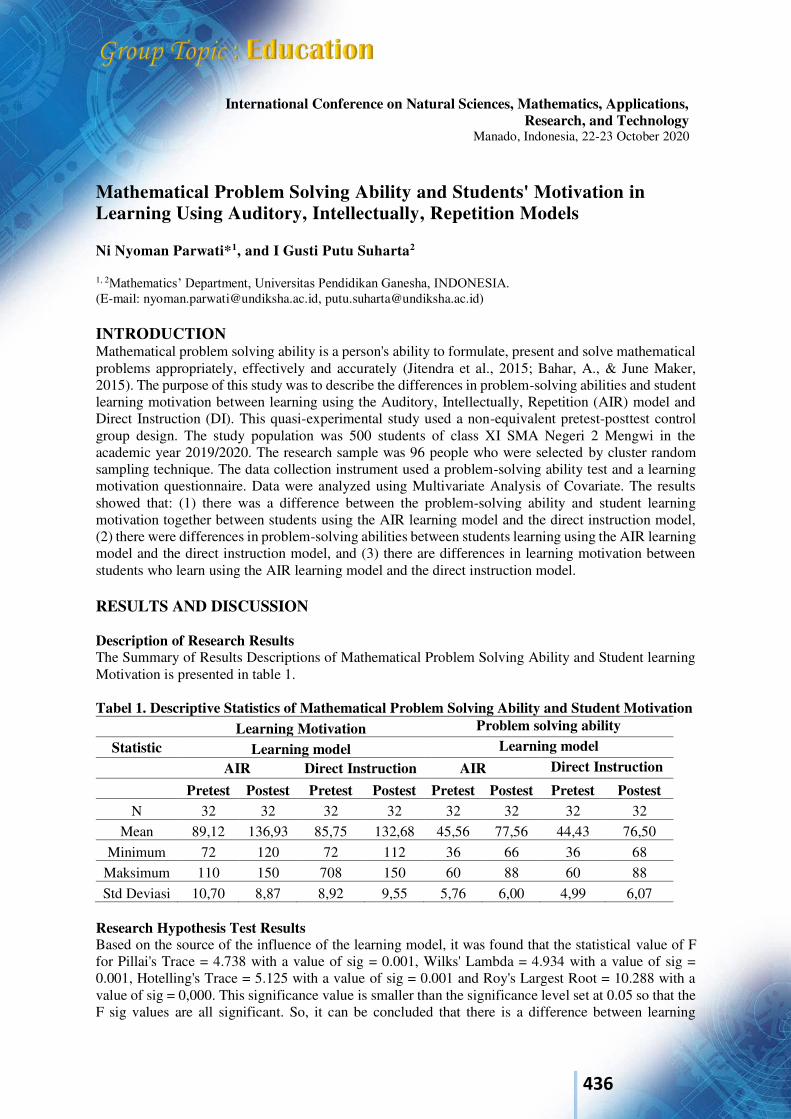
436
International Conference on Natural Sciences, Mathematics, Applications, Research, and Technology
Manado, Indonesia, 22-23 October 2020
Mathematical Problem Solving Ability and Students' Motivation in Learning Using Auditory, Intellectually, Repetition Models Ni Nyoman Parwati*1, and I Gusti Putu Suharta2
1, 2Mathematics’ Department, Universitas Pendidikan Ganesha, INDONESIA. (E-mail: [email protected], [email protected]) INTRODUCTION Mathematical problem solving ability is a person's ability to formulate, present and solve mathematical problems appropriately, effectively and accurately (Jitendra et al., 2015; Bahar, A., & June Maker, 2015). The purpose of this study was to describe the differences in problem-solving abilities and student learning motivation between learning using the Auditory, Intellectually, Repetition (AIR) model and Direct Instruction (DI). This quasi-experimental study used a non-equivalent pretest-posttest control group design. The study population was 500 students of class XI SMA Negeri 2 Mengwi in the academic year 2019/2020. The research sample was 96 people who were selected by cluster random sampling technique. The data collection instrument used a problem-solving ability test and a learning motivation questionnaire. Data were analyzed using Multivariate Analysis of Covariate. The results showed that: (1) there was a difference between the problem-solving ability and student learning motivation together between students using the AIR learning model and the direct instruction model, (2) there were differences in problem-solving abilities between students learning using the AIR learning model and the direct instruction model, and (3) there are differences in learning motivation between students who learn using the AIR learning model and the direct instruction model. RESULTS AND DISCUSSION Description of Research Results The Summary of Results Descriptions of Mathematical Problem Solving Ability and Student learning Motivation is presented in table 1. Tabel 1. Descriptive Statistics of Mathematical Problem Solving Ability and Student Motivation
Learning Motivation Problem solving ability
Statistic Learning model Learning model
AIR Direct Instruction AIR Direct Instruction
Pretest Postest Pretest Postest Pretest Postest Pretest Postest N 32 32 32 32 32 32 32 32
Mean 89,12 136,93 85,75 132,68 45,56 77,56 44,43 76,50 Minimum 72 120 72 112 36 66 36 68
Maksimum 110 150 708 150 60 88 60 88 Std Deviasi 10,70 8,87 8,92 9,55 5,76 6,00 4,99 6,07
Research Hypothesis Test Results Based on the source of the influence of the learning model, it was found that the statistical value of F for Pillai's Trace = 4.738 with a value of sig = 0.001, Wilks' Lambda = 4.934 with a value of sig = 0.001, Hotelling's Trace = 5.125 with a value of sig = 0.001 and Roy's Largest Root = 10.288 with a value of sig = 0,000. This significance value is smaller than the significance level set at 0.05 so that the F sig values are all significant. So, it can be concluded that there is a difference between learning
437
motivation and problem-solving ability of students jointly between students who use the AIR learning model and the Direct Instruction learning model. The results of students' math problem solving abilities, obtained a statistical value of F = 4.793 with a significance number of 0.010. The significance value of this calculation is smaller than 0.05, so it can be concluded that there are differences in problem-solving abilities between students who learn to use the AIR learning model and the Direct Instruction learning model. Based on the source of the influence of the learning model on learning motivation, the statistical value of F = 5.593 with a significance value of 0.005 is smaller than the significance level set at 0.05. So, it can be concluded that there are differences in learning motivation between students who learn using the AIR learning model and the Direct Instruction learning model. The results of this study are in line with research conducted by (Munir et al., 2018) in their research which states that learning using the AIR model makes students learn to be independent and students feel responsible for carrying out tasks in groups with good discussion so that students can exchange ideas and issue ideas for each student. Through the AIR model, students can show good activities as a whole, namely discussion activities and expressing opinions in the learning process so that it affects the improvement of student learning outcomes. According to (Mustika & Kinanti, 2018) the AIR learning model has several advantages, including increasing student participation in learning and expressing their ideas. Provide more opportunities for students to make use of their knowledge and understanding and skills.
Keywords: AIR learning model, direct instruction, learning motivation, mathematical problem-solving
ability. Acknowledgment Gratitude goes to I Made Adi Palguna, teachers and students of class XI SMA Negeri 2 Mengwi for the 2019/2020 school year, who have assisted in completing this research. References 1. Jitendra, A. K., Petersen-Brown, S., Lein, A. E., Zaslofsky, A. F., Kunkel, A. K., Jung, P.-G., &
Egan, A. M. (2015). Teaching mathematical word problem solving: the quality of evidence for strategy instruction priming the problem structure. Journal of Learning Disabilities, 48(1), 51–72. https://doi.org/10.1177/0022219413487408
2. Bahar, A., & June Maker, C. (2015). Cognitive Backgrounds of Problem Solving : A Comparison of Open-ended vs . Closed Mathematics Problems. Eurasia Journal of Mathematics, Science
and Technology Education, 11(6), 1531–1546. https://doi.org/10.12973/eurasia.2015.1410a 3. Munir, Sutarno, H., & Aisyah, N. S. (2018). The development of interactive multimedia based on
auditory, intellectually, repetition in repetition algorithm learning to increase learning outcome. Journal of Physics: Conference Series. https://doi.org/10.1088/1742-6596/1013/1/012102
4. Mustika, H., & Kinanti, N. (2018). Pengaruh Penerapan Model Pembelajaran Auditory Intellectually Repetition (Air) Terhadap Kemampuan Komunikasi Matematika Siswa Di Kelas Viii Smp Negeri 1 Pasir Penyu. MES: Journal of Mathematics Education and Science. https://doi.org/10.30743/mes.v3i2.495
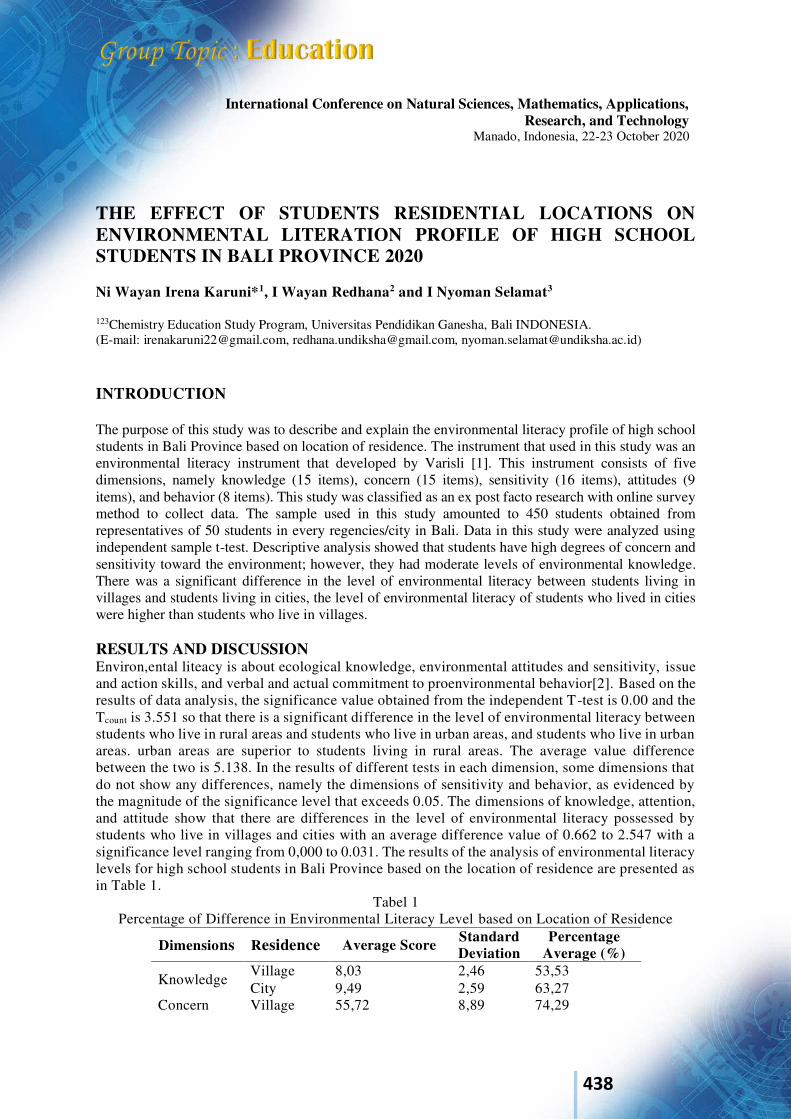
438
International Conference on Natural Sciences, Mathematics, Applications, Research, and Technology
Manado, Indonesia, 22-23 October 2020
THE EFFECT OF STUDENTS RESIDENTIAL LOCATIONS ON ENVIRONMENTAL LITERATION PROFILE OF HIGH SCHOOL STUDENTS IN BALI PROVINCE 2020 Ni Wayan Irena Karuni*1, I Wayan Redhana2 and I Nyoman Selamat3
123Chemistry Education Study Program, Universitas Pendidikan Ganesha, Bali INDONESIA. (E-mail: [email protected], [email protected], [email protected]) INTRODUCTION The purpose of this study was to describe and explain the environmental literacy profile of high school students in Bali Province based on location of residence. The instrument that used in this study was an environmental literacy instrument that developed by Varisli [1]. This instrument consists of five dimensions, namely knowledge (15 items), concern (15 items), sensitivity (16 items), attitudes (9 items), and behavior (8 items). This study was classified as an ex post facto research with online survey method to collect data. The sample used in this study amounted to 450 students obtained from representatives of 50 students in every regencies/city in Bali. Data in this study were analyzed using independent sample t-test. Descriptive analysis showed that students have high degrees of concern and sensitivity toward the environment; however, they had moderate levels of environmental knowledge. There was a significant difference in the level of environmental literacy between students living in villages and students living in cities, the level of environmental literacy of students who lived in cities were higher than students who live in villages. RESULTS AND DISCUSSION Environ,ental liteacy is about ecological knowledge, environmental attitudes and sensitivity, issue and action skills, and verbal and actual commitment to proenvironmental behavior[2]. Based on the results of data analysis, the significance value obtained from the independent T-test is 0.00 and the Tcount is 3.551 so that there is a significant difference in the level of environmental literacy between students who live in rural areas and students who live in urban areas, and students who live in urban areas. urban areas are superior to students living in rural areas. The average value difference between the two is 5.138. In the results of different tests in each dimension, some dimensions that do not show any differences, namely the dimensions of sensitivity and behavior, as evidenced by the magnitude of the significance level that exceeds 0.05. The dimensions of knowledge, attention, and attitude show that there are differences in the level of environmental literacy possessed by students who live in villages and cities with an average difference value of 0.662 to 2.547 with a significance level ranging from 0,000 to 0.031. The results of the analysis of environmental literacy levels for high school students in Bali Province based on the location of residence are presented as in Table 1.
Tabel 1 Percentage of Difference in Environmental Literacy Level based on Location of Residence
Dimensions Residence Average Score Standard Deviation
Percentage Average (%)
Knowledge Village 8,03 2,46 53,53 City 9,49 2,59 63,27
Concern Village 55,72 8,89 74,29
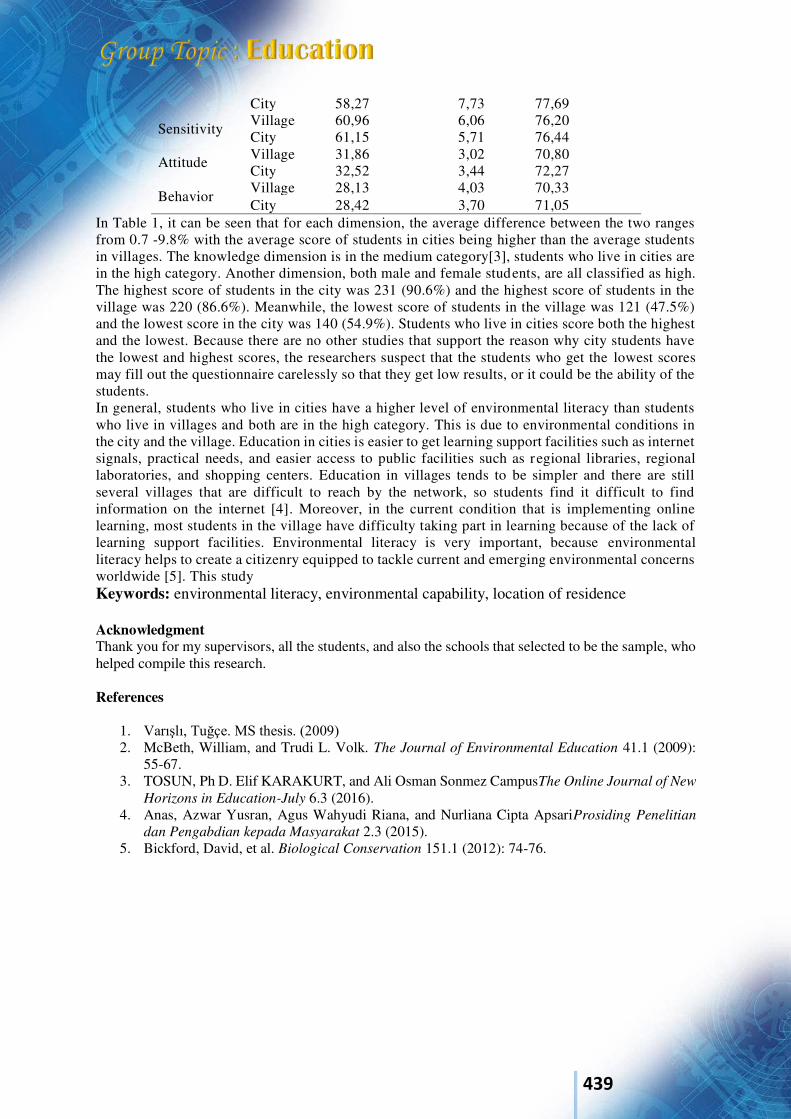
439
City 58,27 7,73 77,69
Sensitivity Village 60,96 6,06 76,20 City 61,15 5,71 76,44
Attitude Village 31,86 3,02 70,80 City 32,52 3,44 72,27
Behavior Village 28,13 4,03 70,33 City 28,42 3,70 71,05
In Table 1, it can be seen that for each dimension, the average difference between the two ranges from 0.7 -9.8% with the average score of students in cities being higher than the average students in villages. The knowledge dimension is in the medium category[3], students who live in cities are in the high category. Another dimension, both male and female students, are all classified as high. The highest score of students in the city was 231 (90.6%) and the highest score of students in the village was 220 (86.6%). Meanwhile, the lowest score of students in the village was 121 (47.5%) and the lowest score in the city was 140 (54.9%). Students who live in cities score both the highest and the lowest. Because there are no other studies that support the reason why city students have the lowest and highest scores, the researchers suspect that the students who get the lowest scores may fill out the questionnaire carelessly so that they get low results, or it could be the ability of the students. In general, students who live in cities have a higher level of environmental literacy than students who live in villages and both are in the high category. This is due to environmental conditions in the city and the village. Education in cities is easier to get learning support facilities such as internet signals, practical needs, and easier access to public facilities such as regional libraries, regional laboratories, and shopping centers. Education in villages tends to be simpler and there are still several villages that are difficult to reach by the network, so students find it difficult to find information on the internet [4]. Moreover, in the current condition that is implementing online learning, most students in the village have difficulty taking part in learning because of the lack of learning support facilities. Environmental literacy is very important, because environmental literacy helps to create a citizenry equipped to tackle current and emerging environmental concerns worldwide [5]. This study Keywords: environmental literacy, environmental capability, location of residence Acknowledgment Thank you for my supervisors, all the students, and also the schools that selected to be the sample, who helped compile this research. References
1. Varışlı, Tuğçe. MS thesis. (2009) 2. McBeth, William, and Trudi L. Volk. The Journal of Environmental Education 41.1 (2009):
55-67. 3. TOSUN, Ph D. Elif KARAKURT, and Ali Osman Sonmez CampusThe Online Journal of New
Horizons in Education-July 6.3 (2016). 4. Anas, Azwar Yusran, Agus Wahyudi Riana, and Nurliana Cipta ApsariProsiding Penelitian
dan Pengabdian kepada Masyarakat 2.3 (2015). 5. Bickford, David, et al. Biological Conservation 151.1 (2012): 74-76.
440
International Conference on Natural Sciences, Mathematics, Applications, Research, and Technology
Manado, Indonesia, 22-23 October 2020 Development of Ethnomatematic Based Geometry Transformation Module to Improve Students' Understanding of Concepts and Productive Dispositions N L H Purnamayanti1, G Suweken2 and I W P Astawa3 1,2,3 Department of Mathematics, Universitas Pendidikan Ganesha, Indonesia (E-mail: [email protected]) INTRODUCTION Mathematics that students need to learn today is not the same as what their parents, grandmothers, and grandfathers needed to previous generations. When students become adults, they will face new problems in various fields of mathematics. One of the mathematical materials that is very useful for students is transforming geometry. This material is very useful for students to build spatial abilities, geometric reasoning abilities, and improve mathematical proof (Edward, 1997: 187). Schools need to provide learning modules to be able to study independently by students during the current COVID-19 pandemic. Learning modules should be arranged with problems that exist in everyday life so that it is easier for students to implement. Thus, learning mathematics in schools can also use the existing culture in the cultural community where students live, which is called ethnomatematics (D'Ambrioso, 1990). The aim of this study is to determine the characteristics of Ethnomatematic Based Geometry Transformation Module to Improve Students' Understanding of Concepts and Productive Dispositions. The development of this research uses the Plomp development model which consists of 3 stages, namely: 1) Preliminary Research, 2) Prototyping, and 3) Assessment. The product produced in this study is an ethnomatematic based transformation geometry module to improve students' understanding of mathematical concepts and productive dispositions. The quality of this learning module is obtained from three aspects, namely validity, practicality, and effectiveness. RESULTS AND DISCUSSION The results of this study are the new Ethnomatematic Based Geometry Transformation Module to Improve Students' Understanding of Concepts and Productive Dispositions which is the result of theoretical analysis. Keywords : Ethnomatematics, Geometry Transformation Module, Understanding of Concepts. References
1. D’ Ambrosio, Ubiratan . 2013. Ethnomathematics & its Place in the History & Pedagogy of Mathematics. For the Learning of Mathematics .Vol.5,No.2,hal. 44-48.
2. Edwards, LD. 1991. "Children's learning in a computer microworld for transformation geometry". Journal for Reasearch in Mathematics Education Vol.22 No.2, hlm.122-137.
3. Edwards, LD.1997. "Explore Ring the Terrority before Proof: Students' Generalization in a computer Microworld for Transformation Geometry". International Journal of Computers for Mathematical Learning, 1:187-215.
4. Freudenthal, H. 1991. Revisiting Mathematics Education: China Lectures, Kluwer Academic Publishers, ISBN 7923-1299-6
5. Kemdikbud. 2013. Materi Pelatihan Guru Implementasi Kurikulum 2013: Matematika SMP MTs. Jakarta: Kemdikbud.
6. Kemdikbud. 2013. Kompetensi Inti Matematika SMP MTs. Jakarta: Litbang kemdikbud.

441
7. Morris, T. & Paulsen, R 2011. "Using Tracing Paper to Teach Transformation Geometry". Amesa Vol. 2. Johannensberg: Amesa.
8. NCTM. 2000. "Principles and Standards for School Mathematics": Electronic Examples. 9. Olson, M., Zenigami, F. & Okazaki, C. 2008. "Students' Geometric Thinking about Rotations
and Benchmark Angles". Mathematics Teaching in the Middle School,14, hlm.24-26.
442
International Conference on Natural Sciences, Mathematics, Applications, Research, and Technology
Manado, Indonesia, 22-23 October 2020
Empirical Study on Development and Utility of Media for Biology Instruction of Senior High School in the Singaraja City I Wayan Sukra Warpala1 and Ni Putu Sri Ratna Dewi2
1,2 Biology Education Department, University of Pendidikan Ganesha, Indonesia (E-mail: [email protected], [email protected]) INTRODUCTION The government has tried to support the aspects of the professional development of teachers at all levels of education, especially those related to pedagogical competence. Teachers really need an in-depth study of the development of ICT-based learning media because the schools’ curriculum is always evolving and changing. The second issue that improving the quality of biology instruction in Senior High School is the need for teaching materials in other forms, not just printed teaching materials in the form of textbooks. The delivery of learning content can be done through communication symbols in the form of verbal and non-verbal symbols, which are then interpreted by the students1. The importance of developing ICT-based instructional media is a priority in research because these learning tools have a strategic role compared to learning tools in the form of printed materials. An effective process of biology instruction is largely determined by the selection and use of instructional media. The use of instructional media has an increasingly important role in the online learning process2, which is carried out during the Pandemic of Covid-19. Regarding the selection and use of biology instructional media, a qualitative descriptive study was conducted by a survey method. The unit of analysis in this research is learning media, especially computer-based media developed by biology teachers. By using purposive sampling technique, it has been obtained that there are 9 teachers who are teaching at State Senior High Schools in Singaraja City. Data collection in this study was carried out through the following steps: (1) to make an inventory of the types of media developed and used by biology teachers; (2) conducting interviews and distributing questionnaires related to understanding the basic concepts of media, media selection, and trends in the types of learning media used and developed; and (3) assessing the instructional media developed by the sample teachers through online presentations. Data were analyzed using descriptive analysis techniques. RESULTS AND DISCUSSION Some of the findings obtained during this study are as follows. Firstly, some biology teachers have correctly defined learning media in accordance with the current learning paradigm and most teachers have understood the position and function of media in learning. Second, most biology teachers (more than 50%) have understood the aspects of selecting instructional media related to the priority and suitability of the choice of instructional media with the characteristic of knowledge. Third, all biology teachers have demonstrated an understanding of the basis for media use and the frequency of media use in learning biology in the frequent category. Fourth, the existence of biology instructional media at State Senior High School in Singaraja City is adequate to support the learning process, but the variety of media types is still lacking. Fifth, the knowledge of biology teachers about many types of instructional media are good, therefore the types of media used in biology instruction also vary widely. Sixth, although the types of media used varied, the biology teachers state that they used video, chart or picture,
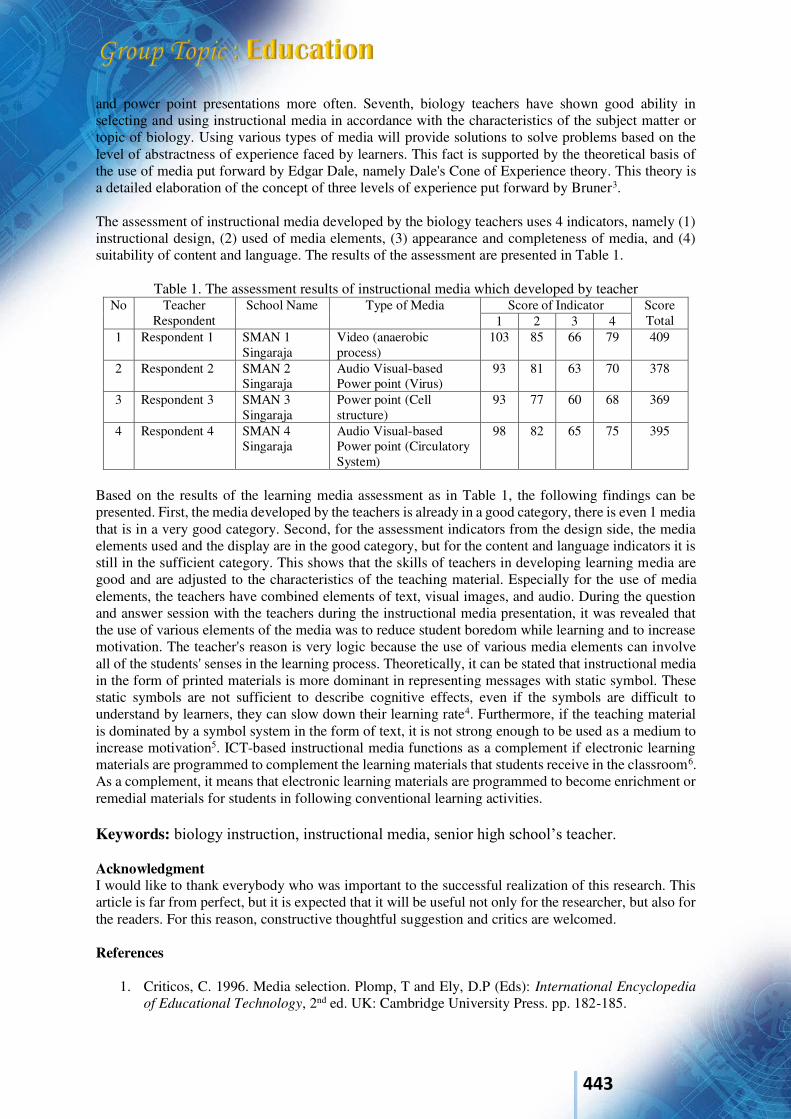
443
and power point presentations more often. Seventh, biology teachers have shown good ability in selecting and using instructional media in accordance with the characteristics of the subject matter or topic of biology. Using various types of media will provide solutions to solve problems based on the level of abstractness of experience faced by learners. This fact is supported by the theoretical basis of the use of media put forward by Edgar Dale, namely Dale's Cone of Experience theory. This theory is a detailed elaboration of the concept of three levels of experience put forward by Bruner3. The assessment of instructional media developed by the biology teachers uses 4 indicators, namely (1) instructional design, (2) used of media elements, (3) appearance and completeness of media, and (4) suitability of content and language. The results of the assessment are presented in Table 1.
Table 1. The assessment results of instructional media which developed by teacher
No Teacher Respondent
School Name Type of Media Score of Indicator Score Total 1 2 3 4
1 Respondent 1 SMAN 1 Singaraja
Video (anaerobic process)
103 85 66 79 409
2 Respondent 2 SMAN 2 Singaraja
Audio Visual-based Power point (Virus)
93 81 63 70 378
3 Respondent 3 SMAN 3 Singaraja
Power point (Cell structure)
93 77 60 68 369
4 Respondent 4 SMAN 4 Singaraja
Audio Visual-based Power point (Circulatory System)
98 82 65 75 395
Based on the results of the learning media assessment as in Table 1, the following findings can be presented. First, the media developed by the teachers is already in a good category, there is even 1 media that is in a very good category. Second, for the assessment indicators from the design side, the media elements used and the display are in the good category, but for the content and language indicators it is still in the sufficient category. This shows that the skills of teachers in developing learning media are good and are adjusted to the characteristics of the teaching material. Especially for the use of media elements, the teachers have combined elements of text, visual images, and audio. During the question and answer session with the teachers during the instructional media presentation, it was revealed that the use of various elements of the media was to reduce student boredom while learning and to increase motivation. The teacher's reason is very logic because the use of various media elements can involve all of the students' senses in the learning process. Theoretically, it can be stated that instructional media in the form of printed materials is more dominant in representing messages with static symbol. These static symbols are not sufficient to describe cognitive effects, even if the symbols are difficult to understand by learners, they can slow down their learning rate4. Furthermore, if the teaching material is dominated by a symbol system in the form of text, it is not strong enough to be used as a medium to increase motivation5. ICT-based instructional media functions as a complement if electronic learning materials are programmed to complement the learning materials that students receive in the classroom6. As a complement, it means that electronic learning materials are programmed to become enrichment or remedial materials for students in following conventional learning activities. Keywords: biology instruction, instructional media, senior high school’s teacher. Acknowledgment I would like to thank everybody who was important to the successful realization of this research. This article is far from perfect, but it is expected that it will be useful not only for the researcher, but also for the readers. For this reason, constructive thoughtful suggestion and critics are welcomed. References
1. Criticos, C. 1996. Media selection. Plomp, T and Ely, D.P (Eds): International Encyclopedia
of Educational Technology, 2nd ed. UK: Cambridge University Press. pp. 182-185.

444
2. Hoon, T. S., Chong, T. S., & Binti Ngah, N. A. 2010. Effect of Interactive Course wave in the Learning of matrices. Educational Technology and Society, 13 (1): 121-132.
3. Heinich, R., Molenda, M., Russell, J.D., and Smaldino, S.E. 2002. Instructional Media and
Technology for Learning, 7th edition. New Jersey: Prentice Hall, Inc. 4. Kozma, R. B. 1991. Learning with Media. Review of Educational Research, 61 (12): 179-212. 5. Pramono, G. 2006. Interaktivitas dan Learner Kontrol pada Multimedia Interaktif. Jurnal
Teknodik, Nomer 19/X/Desember, ISSN: 0854-915X. 6. Lewis, D. 2002. “A departure from training by the book, more companies seeing benefits of e-
learning, the boston globe, globe staff”. Available on: http://bostonworks.boston.com/globe/articles/052602/elearn.html.

445
International Conference on Natural Sciences, Mathematics, Applications, Research, and Technology
Manado, Indonesia, 22-23 October 2020
Practicality of teaching materials developed by using Problem Based
Learning based on PAKEM (Pembelajaran Aktif Kreatif Efektif
Menyenangkan) Model on fraction material in Elementary School Refnywidialistuti1, D N Perdana2
1,2Mathematics Department, Teacher Training and Education Faculty, Universitas Ekasakti, Padang (E-mail: [email protected], [email protected])
INTRODUCTION The fraction material studied in Elementary School is closely related to the daily life of students. The problem that exists in learning fractions is that students still memorize concepts and it is still difficult to apply concepts to problems that students encounter in their daily environment. In developing this student book, it is necessary to apply a model. In this case, a model that suits student needs is used, namely Problem Based Learning. This model is characterized by the use of real-life problems as something students must learn to train and improve critical thinking and problem solving skills. The aim of this study is to determine the practicality of teaching materials, namely student books using PAKEM-oriented Problem Based Learning. RESULTS AND DISCUSSION Practicality questionnaires were given to 20 students in the experimental class. The aspects that are assessed to determine the practicality of teaching materials include ease of use, efficiency of learning time, benefits and attractiveness of teaching materials to student interests. The summary of the results of the practicality questionnaire analysis based on student responses during the field test can be seen in Table 1. Table 1.The Level of Practicality of Teaching Materials based on Student Responses (Field Test)
Items Aspects Kappa Moment Practicality Value
1-5 Ease of use 0,80 High 6-7 Efficiency of learning time 0,75 High 8-10 Benefits and attractiveness 0,74 High
Overall Practicality 0.77 High Based on Table 1, it can be seen that the average practical value of teaching materials, namely student books, based on the responses of class students from the aspects of ease of use, efficiency of learning time, benefits and attractiveness of teaching materials on student interest shows the kappa moment value of 0.77 with a high level of practicality. Thus, the teaching material is practically used as teaching material for learning mathematics in Elementary School grade fifth on fractions material.
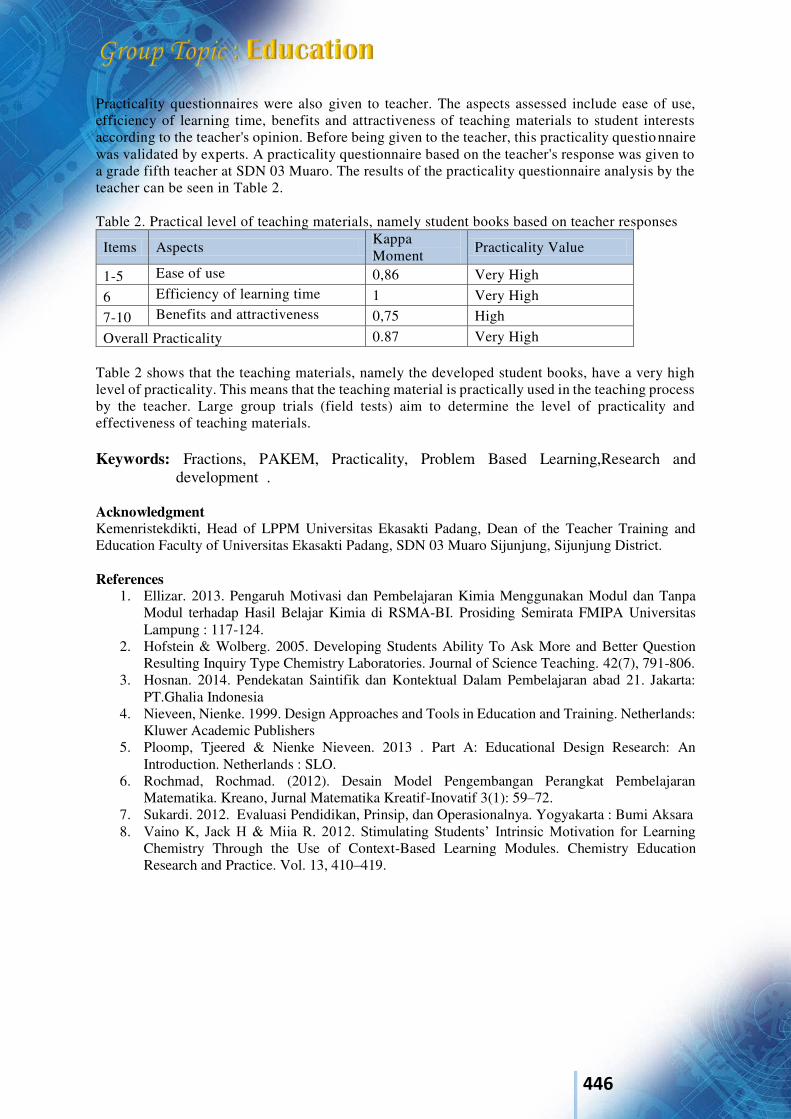
446
Practicality questionnaires were also given to teacher. The aspects assessed include ease of use, efficiency of learning time, benefits and attractiveness of teaching materials to student interests according to the teacher's opinion. Before being given to the teacher, this practicality questionnaire was validated by experts. A practicality questionnaire based on the teacher's response was given to a grade fifth teacher at SDN 03 Muaro. The results of the practicality questionnaire analysis by the teacher can be seen in Table 2. Table 2. Practical level of teaching materials, namely student books based on teacher responses
Items Aspects Kappa Moment Practicality Value
1-5 Ease of use 0,86 Very High
6 Efficiency of learning time 1 Very High
7-10 Benefits and attractiveness 0,75 High
Overall Practicality 0.87 Very High Table 2 shows that the teaching materials, namely the developed student books, have a very high level of practicality. This means that the teaching material is practically used in the teaching process by the teacher. Large group trials (field tests) aim to determine the level of practicality and effectiveness of teaching materials. Keywords: Fractions, PAKEM, Practicality, Problem Based Learning,Research and
development . Acknowledgment Kemenristekdikti, Head of LPPM Universitas Ekasakti Padang, Dean of the Teacher Training and Education Faculty of Universitas Ekasakti Padang, SDN 03 Muaro Sijunjung, Sijunjung District. References
1. Ellizar. 2013. Pengaruh Motivasi dan Pembelajaran Kimia Menggunakan Modul dan Tanpa Modul terhadap Hasil Belajar Kimia di RSMA-BI. Prosiding Semirata FMIPA Universitas Lampung : 117-124.
2. Hofstein & Wolberg. 2005. Developing Students Ability To Ask More and Better Question Resulting Inquiry Type Chemistry Laboratories. Journal of Science Teaching. 42(7), 791-806.
3. Hosnan. 2014. Pendekatan Saintifik dan Kontektual Dalam Pembelajaran abad 21. Jakarta: PT.Ghalia Indonesia
4. Nieveen, Nienke. 1999. Design Approaches and Tools in Education and Training. Netherlands: Kluwer Academic Publishers
5. Ploomp, Tjeered & Nienke Nieveen. 2013 . Part A: Educational Design Research: An Introduction. Netherlands : SLO.
6. Rochmad, Rochmad. (2012). Desain Model Pengembangan Perangkat Pembelajaran Matematika. Kreano, Jurnal Matematika Kreatif-Inovatif 3(1): 59–72.
7. Sukardi. 2012. Evaluasi Pendidikan, Prinsip, dan Operasionalnya. Yogyakarta : Bumi Aksara 8. Vaino K, Jack H & Miia R. 2012. Stimulating Students’ Intrinsic Motivation for Learning
Chemistry Through the Use of Context-Based Learning Modules. Chemistry Education Research and Practice. Vol. 13, 410–419.

447
International Conference on Natural Sciences, Mathematics, Applications, Research, and Technology
Manado, Indonesia, 22-23 October 2020
Analysis Of Classification Ability As The Basis Of Numeric Taxonomic Learning In Animal Biosistematic Lectures Hernawati*1, Yayan Sanjaya2, Fransisca Sudargo 3, Any Aryani4, Zamzam Nursani5, Try K. Mutaqien6, Dita Puspitasari7 and Rahadian D. Juansa8
1, 2, 3, 4, 5, 6, 7, 8 Department of Biology Education, Universitas Pendidikan Indonesia, INDONESIA. (E-mail: [email protected])
INTRODUCTION
Biosystematics or systematics is the study of the diversification of organisms, both past and present, and the relationships between these organisms through time. It includes the sub-disciplines of taxonomy and systematics (Probert, 2010). Taxonomy includes the tasks of species discovery and recognition, identification, diagnosis, comparison, classification, and naming (Vane-Wright, 2013), whereas systematics seeks to explore relationships between species and higher taxonomic units (such as genera and family) in an evolution context and provides the framework in which species are classified (Vane-Wright, 2013).
Learning the classification or animal biodiversity is very important to provide a correct understanding of the many biological content. Therefore, students need to know how living things are classified in order to better understand their biodiversity (Randler, 2008). The problem that currently occurs is that there are still many students who do not understand the basis of classification, especially the classification of vertebrate animals. The results of research that has been done Prokop, Prokop and Tunnicliffe (2007) found that many children possessed scientifically correct knowledge about the anatomy of animals but misclassified invertebrates as vertebrates by drawing bones inside their bodies. In a study similar to the present one, Kattmann (2001) found that children experienced difficulties in biological classification. Therefore based on the problems above, this study aims to analyze the classification ability in animal biosystematics learning as a basis for understanding numerical taxonomy.
We used mixed methods in this study which consisted of qualitative analysis. Data analysis was carried out qualitatively based on the data obtained, then synthesized and found a pattern, then a conclusion was drawn. The number of students was 57 people divided into 11 groups. Classification ability is determined based on indicators that refer to science process skills. The classification ability indicator is made into six indicators, where each indicator is broken down into four indicators. The classification abilities of the six indicators are: (1) recording each observation separately, (2) finding similarities and differences among objects (3) contrasting the objects, (4) comparing the object characteristics, (5) determining the base of grouping, (6) connecting the results of observations.
RESULTS AND DISCUSSION The results of data analysis can be explained that the student's ability to classify indicator 1, recording observations separately has been responded by 89.04%, which is in the very good category. Indicator 3, contrasting the features has been responded by 57.89%, it is included in the quite good category. Furthermore, indicators 2, 4, 5 and 6 can be responded with in good categories.
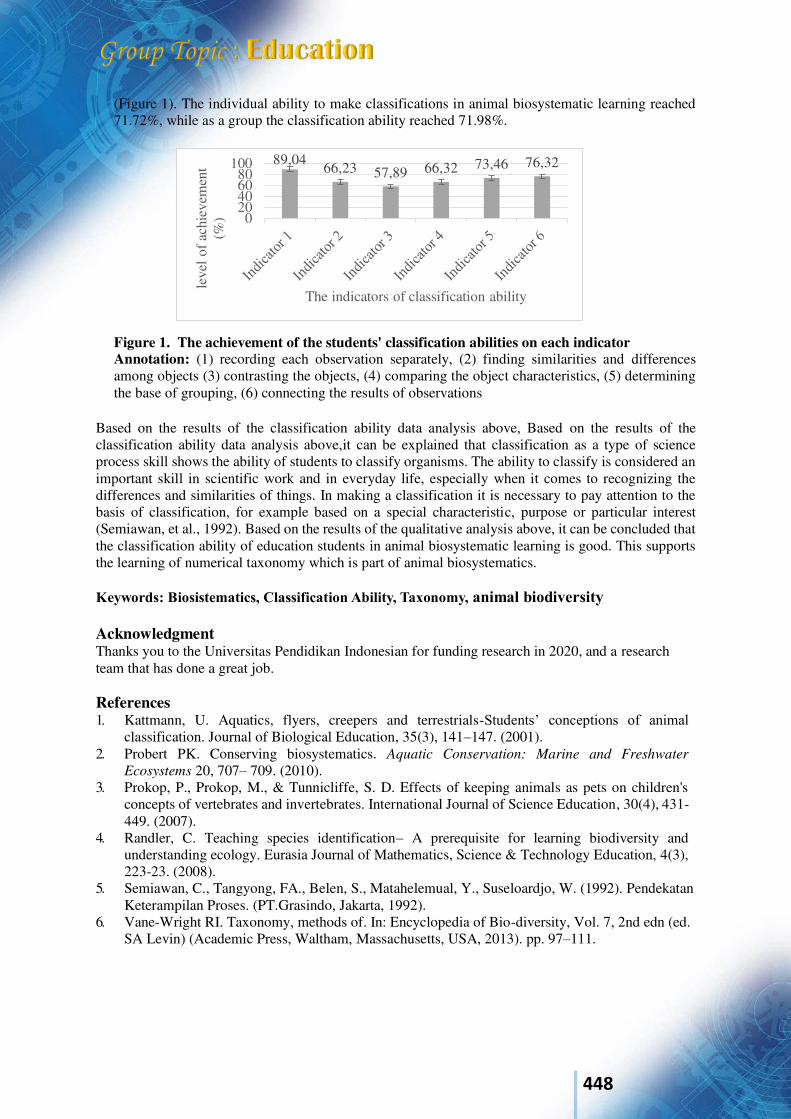
448
(Figure 1). The individual ability to make classifications in animal biosystematic learning reached 71.72%, while as a group the classification ability reached 71.98%.
Figure 1. The achievement of the students' classification abilities on each indicator Annotation: (1) recording each observation separately, (2) finding similarities and differences among objects (3) contrasting the objects, (4) comparing the object characteristics, (5) determining the base of grouping, (6) connecting the results of observations
Based on the results of the classification ability data analysis above, Based on the results of the classification ability data analysis above,it can be explained that classification as a type of science process skill shows the ability of students to classify organisms. The ability to classify is considered an important skill in scientific work and in everyday life, especially when it comes to recognizing the differences and similarities of things. In making a classification it is necessary to pay attention to the basis of classification, for example based on a special characteristic, purpose or particular interest (Semiawan, et al., 1992). Based on the results of the qualitative analysis above, it can be concluded that the classification ability of education students in animal biosystematic learning is good. This supports the learning of numerical taxonomy which is part of animal biosystematics. Keywords: Biosistematics, Classification Ability, Taxonomy, animal biodiversity Acknowledgment Thanks you to the Universitas Pendidikan Indonesian for funding research in 2020, and a research team that has done a great job.
References 1. Kattmann, U. Aquatics, flyers, creepers and terrestrials-Students’ conceptions of animal
classification. Journal of Biological Education, 35(3), 141–147. (2001). 2. Probert PK. Conserving biosystematics. Aquatic Conservation: Marine and Freshwater
Ecosystems 20, 707– 709. (2010). 3. Prokop, P., Prokop, M., & Tunnicliffe, S. D. Effects of keeping animals as pets on children's
concepts of vertebrates and invertebrates. International Journal of Science Education, 30(4), 431-449. (2007).
4. Randler, C. Teaching species identification– A prerequisite for learning biodiversity and understanding ecology. Eurasia Journal of Mathematics, Science & Technology Education, 4(3), 223-23. (2008).
5. Semiawan, C., Tangyong, FA., Belen, S., Matahelemual, Y., Suseloardjo, W. (1992). Pendekatan Keterampilan Proses. (PT.Grasindo, Jakarta, 1992).
6. Vane-Wright RI. Taxonomy, methods of. In: Encyclopedia of Bio-diversity, Vol. 7, 2nd edn (ed. SA Levin) (Academic Press, Waltham, Massachusetts, USA, 2013). pp. 97–111.
89,04 66,23 57,89 66,32 73,46 76,32
020406080
100
leve
l of a
chie
vem
ent
(%)
The indicators of classification ability
449
International Conference on Natural Sciences, Mathematics, Applications, Research, and Technology
Manado, Indonesia, 22-23 October 2020
THE DEVELOPMENT OF INTERACTIVE VIDEO LECTURE – AUTHENTIC PROBLEM ORIENTED TO ENHANCE SEVENTH GRADE STUDENTS SOCIAL ARITHMETIC CONCEPT COMPREHENSION Putu Anita Wulandari Ganesha University of Education ([email protected]) INTRODUCTION Learning resources for students in schools are generally very limited. The purpose of this research was to develop interactive video lectures to enhance seventh grade students’ social arithmetic comprehension acknowledged as valid and highly effective. The research was conducted on students in seventh grade students of SMP Negeri 1 Banjar. The development used ADDIE model (Analysis, Design, Development, Implementation, and Evaluation), which only reached the development stage. Data collection used questionnaires in the form of expert evaluation questionnaires, student response questionnaires, teacher response questionnaires, initial tests, and final tests. Interactive Video Lecture features interesting visualizations and offers authentic problems in the materials delivery. The developed Interactive Video Lecture-Authentic Problems Oriented for social arithmetic learning has passed validity and usability tests, including expert material & media validity as well as effectiveness & practicality. The average score of validity test from 2 material experts and 1 media expert shows 4,7 with very-valid criteria. The practicality test shows 4,58 score in average from the student response questionnaires and 4,55 from teacher response questionnaire with highly practical criteria. The effectiveness test obtains 80 score in average where it was 60 score and the passing level increases from 50% to 83,3%. Based on the all results gained, in conclusion, the developed Interactive Video Lecture-Authentic Problem Oriented to enhance seventh grade students’ social arithmetic concept comprehension has fulfilled validity and usability criteria so that it can be acceptable and worthy to be used broadly. FINDING & DISCUSSION In developing Interactive Video Lecture, the ADDIE development stages had been applied that was only until the development stage due to the limitation of time, fund, and researcher’s ability. In every final stage of ADDIE development, formative assessment had been done to identify its qualification. Based on the research finding and the explanation, the conclusion of this research is drawn, as follow:
1. Interactive Video Lecture-Authentic Problem Oriented to enhance social arithmetic learning has been validated by material expert and media expert. The process of validation assessment has done several revisions by the experts. Here are some views of the developed Interactive Video Lecture. Picture 1. Interactive Video Lecture View
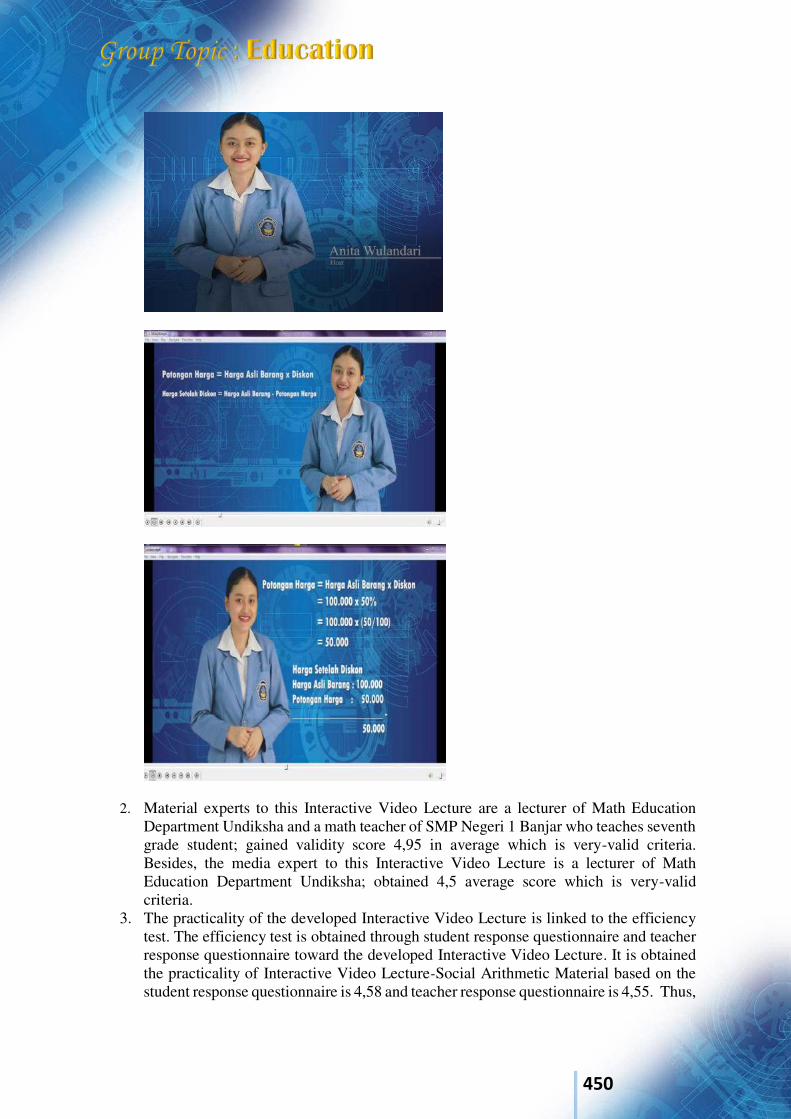
450
2. Material experts to this Interactive Video Lecture are a lecturer of Math Education Department Undiksha and a math teacher of SMP Negeri 1 Banjar who teaches seventh grade student; gained validity score 4,95 in average which is very-valid criteria. Besides, the media expert to this Interactive Video Lecture is a lecturer of Math Education Department Undiksha; obtained 4,5 average score which is very-valid criteria.
3. The practicality of the developed Interactive Video Lecture is linked to the efficiency test. The efficiency test is obtained through student response questionnaire and teacher response questionnaire toward the developed Interactive Video Lecture. It is obtained the practicality of Interactive Video Lecture-Social Arithmetic Material based on the student response questionnaire is 4,58 and teacher response questionnaire is 4,55. Thus,
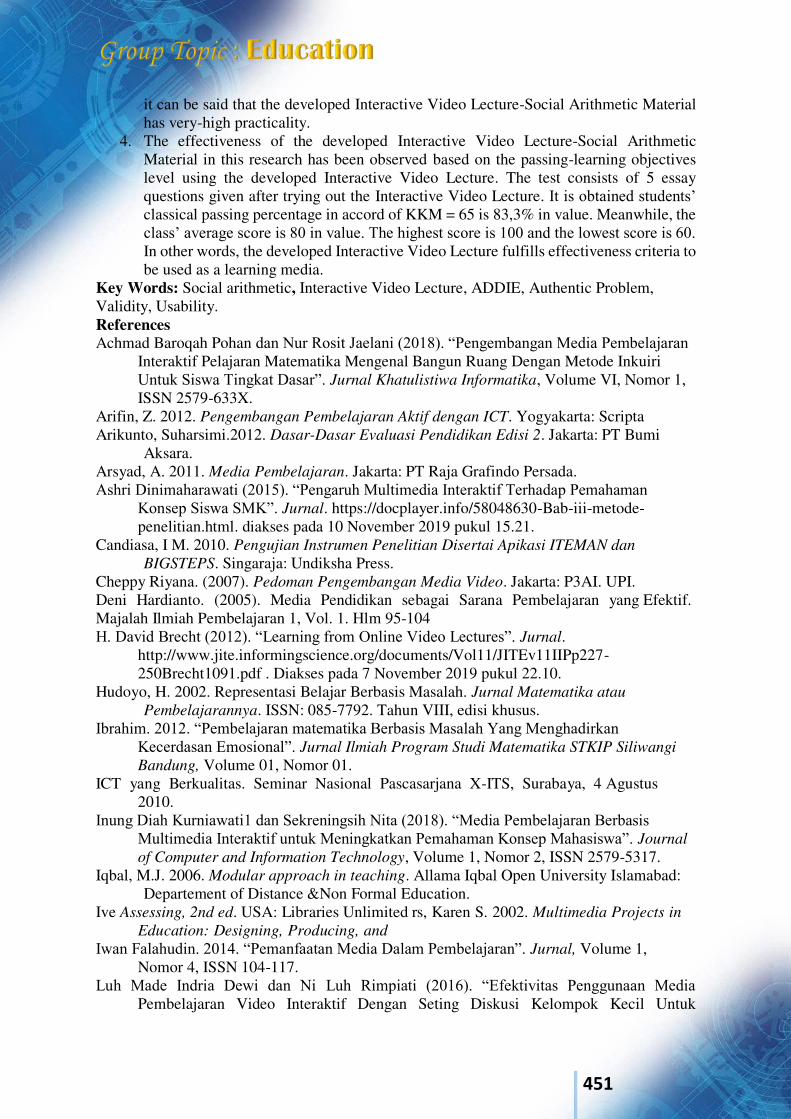
451
it can be said that the developed Interactive Video Lecture-Social Arithmetic Material has very-high practicality.
4. The effectiveness of the developed Interactive Video Lecture-Social Arithmetic Material in this research has been observed based on the passing-learning objectives level using the developed Interactive Video Lecture. The test consists of 5 essay questions given after trying out the Interactive Video Lecture. It is obtained students’ classical passing percentage in accord of KKM = 65 is 83,3% in value. Meanwhile, the class’ average score is 80 in value. The highest score is 100 and the lowest score is 60. In other words, the developed Interactive Video Lecture fulfills effectiveness criteria to be used as a learning media.
Key Words: Social arithmetic, Interactive Video Lecture, ADDIE, Authentic Problem, Validity, Usability. References Achmad Baroqah Pohan dan Nur Rosit Jaelani (2018). “Pengembangan Media Pembelajaran
Interaktif Pelajaran Matematika Mengenal Bangun Ruang Dengan Metode Inkuiri Untuk Siswa Tingkat Dasar”. Jurnal Khatulistiwa Informatika, Volume VI, Nomor 1, ISSN 2579-633X.
Arifin, Z. 2012. Pengembangan Pembelajaran Aktif dengan ICT. Yogyakarta: Scripta Arikunto, Suharsimi.2012. Dasar-Dasar Evaluasi Pendidikan Edisi 2. Jakarta: PT Bumi
Aksara. Arsyad, A. 2011. Media Pembelajaran. Jakarta: PT Raja Grafindo Persada. Ashri Dinimaharawati (2015). “Pengaruh Multimedia Interaktif Terhadap Pemahaman
Konsep Siswa SMK”. Jurnal. https://docplayer.info/58048630-Bab-iii-metode-penelitian.html. diakses pada 10 November 2019 pukul 15.21.
Candiasa, I M. 2010. Pengujian Instrumen Penelitian Disertai Apikasi ITEMAN dan
BIGSTEPS. Singaraja: Undiksha Press. Cheppy Riyana. (2007). Pedoman Pengembangan Media Video. Jakarta: P3AI. UPI. Deni Hardianto. (2005). Media Pendidikan sebagai Sarana Pembelajaran yang Efektif. Majalah Ilmiah Pembelajaran 1, Vol. 1. Hlm 95-104 H. David Brecht (2012). “Learning from Online Video Lectures”. Jurnal.
http://www.jite.informingscience.org/documents/Vol11/JITEv11IIPp227-250Brecht1091.pdf . Diakses pada 7 November 2019 pukul 22.10.
Hudoyo, H. 2002. Representasi Belajar Berbasis Masalah. Jurnal Matematika atau
Pembelajarannya. ISSN: 085-7792. Tahun VIII, edisi khusus. Ibrahim. 2012. “Pembelajaran matematika Berbasis Masalah Yang Menghadirkan
Kecerdasan Emosional”. Jurnal Ilmiah Program Studi Matematika STKIP Siliwangi
Bandung, Volume 01, Nomor 01. ICT yang Berkualitas. Seminar Nasional Pascasarjana X-ITS, Surabaya, 4 Agustus
2010. Inung Diah Kurniawati1 dan Sekreningsih Nita (2018). “Media Pembelajaran Berbasis
Multimedia Interaktif untuk Meningkatkan Pemahaman Konsep Mahasiswa”. Journal
of Computer and Information Technology, Volume 1, Nomor 2, ISSN 2579-5317. Iqbal, M.J. 2006. Modular approach in teaching. Allama Iqbal Open University Islamabad:
Departement of Distance &Non Formal Education. Ive Assessing, 2nd ed. USA: Libraries Unlimited rs, Karen S. 2002. Multimedia Projects in
Education: Designing, Producing, and Iwan Falahudin. 2014. “Pemanfaatan Media Dalam Pembelajaran”. Jurnal, Volume 1,
Nomor 4, ISSN 104-117. Luh Made Indria Dewi dan Ni Luh Rimpiati (2016). “Efektivitas Penggunaan Media
Pembelajaran Video Interaktif Dengan Seting Diskusi Kelompok Kecil Untuk
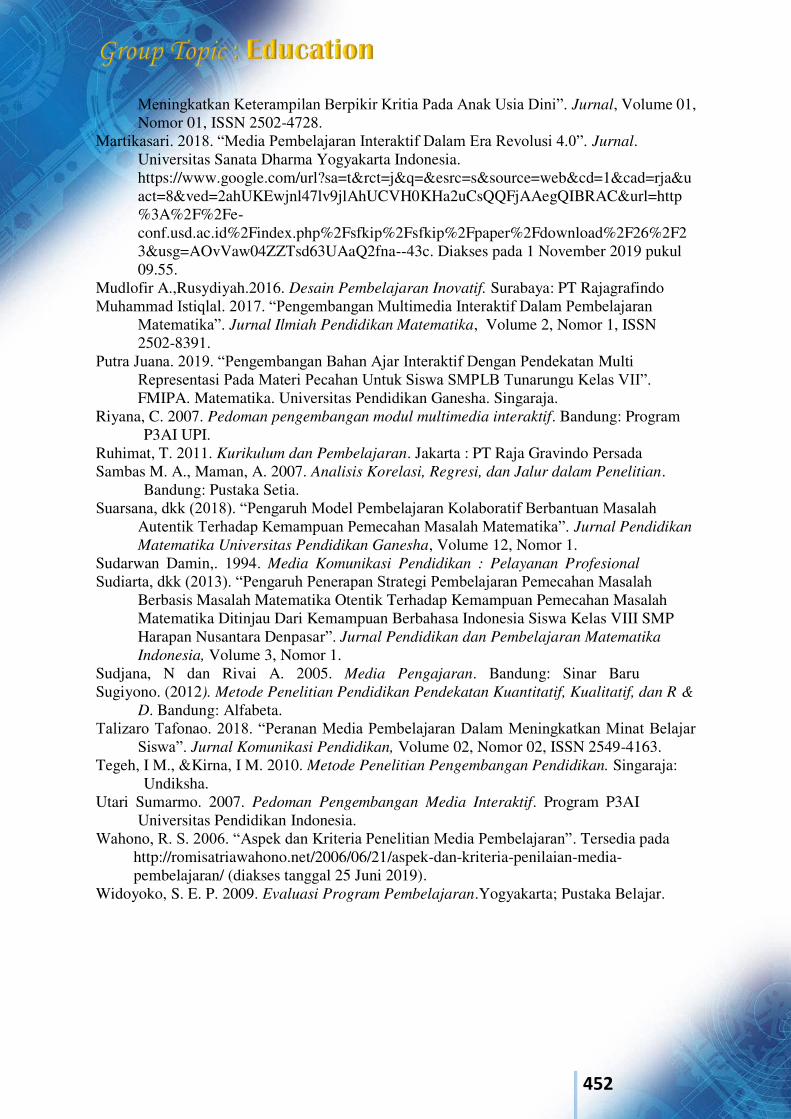
452
Meningkatkan Keterampilan Berpikir Kritia Pada Anak Usia Dini”. Jurnal, Volume 01, Nomor 01, ISSN 2502-4728.
Martikasari. 2018. “Media Pembelajaran Interaktif Dalam Era Revolusi 4.0”. Jurnal. Universitas Sanata Dharma Yogyakarta Indonesia. https://www.google.com/url?sa=t&rct=j&q=&esrc=s&source=web&cd=1&cad=rja&uact=8&ved=2ahUKEwjnl47lv9jlAhUCVH0KHa2uCsQQFjAAegQIBRAC&url=http%3A%2F%2Fe-conf.usd.ac.id%2Findex.php%2Fsfkip%2Fsfkip%2Fpaper%2Fdownload%2F26%2F23&usg=AOvVaw04ZZTsd63UAaQ2fna--43c. Diakses pada 1 November 2019 pukul 09.55.
Mudlofir A.,Rusydiyah.2016. Desain Pembelajaran Inovatif. Surabaya: PT Rajagrafindo Muhammad Istiqlal. 2017. “Pengembangan Multimedia Interaktif Dalam Pembelajaran
Matematika”. Jurnal Ilmiah Pendidikan Matematika, Volume 2, Nomor 1, ISSN 2502-8391.
Putra Juana. 2019. “Pengembangan Bahan Ajar Interaktif Dengan Pendekatan Multi Representasi Pada Materi Pecahan Untuk Siswa SMPLB Tunarungu Kelas VII”. FMIPA. Matematika. Universitas Pendidikan Ganesha. Singaraja.
Riyana, C. 2007. Pedoman pengembangan modul multimedia interaktif. Bandung: Program P3AI UPI.
Ruhimat, T. 2011. Kurikulum dan Pembelajaran. Jakarta : PT Raja Gravindo Persada Sambas M. A., Maman, A. 2007. Analisis Korelasi, Regresi, dan Jalur dalam Penelitian.
Bandung: Pustaka Setia. Suarsana, dkk (2018). “Pengaruh Model Pembelajaran Kolaboratif Berbantuan Masalah
Autentik Terhadap Kemampuan Pemecahan Masalah Matematika”. Jurnal Pendidikan
Matematika Universitas Pendidikan Ganesha, Volume 12, Nomor 1. Sudarwan Damin,. 1994. Media Komunikasi Pendidikan : Pelayanan Profesional Sudiarta, dkk (2013). “Pengaruh Penerapan Strategi Pembelajaran Pemecahan Masalah
Berbasis Masalah Matematika Otentik Terhadap Kemampuan Pemecahan Masalah Matematika Ditinjau Dari Kemampuan Berbahasa Indonesia Siswa Kelas VIII SMP Harapan Nusantara Denpasar”. Jurnal Pendidikan dan Pembelajaran Matematika
Indonesia, Volume 3, Nomor 1. Sudjana, N dan Rivai A. 2005. Media Pengajaran. Bandung: Sinar Baru Sugiyono. (2012). Metode Penelitian Pendidikan Pendekatan Kuantitatif, Kualitatif, dan R &
D. Bandung: Alfabeta. Talizaro Tafonao. 2018. “Peranan Media Pembelajaran Dalam Meningkatkan Minat Belajar
Siswa”. Jurnal Komunikasi Pendidikan, Volume 02, Nomor 02, ISSN 2549-4163. Tegeh, I M., &Kirna, I M. 2010. Metode Penelitian Pengembangan Pendidikan. Singaraja:
Undiksha. Utari Sumarmo. 2007. Pedoman Pengembangan Media Interaktif. Program P3AI
Universitas Pendidikan Indonesia. Wahono, R. S. 2006. “Aspek dan Kriteria Penelitian Media Pembelajaran”. Tersedia pada
http://romisatriawahono.net/2006/06/21/aspek-dan-kriteria-penilaian-media-pembelajaran/ (diakses tanggal 25 Juni 2019).
Widoyoko, S. E. P. 2009. Evaluasi Program Pembelajaran.Yogyakarta; Pustaka Belajar.
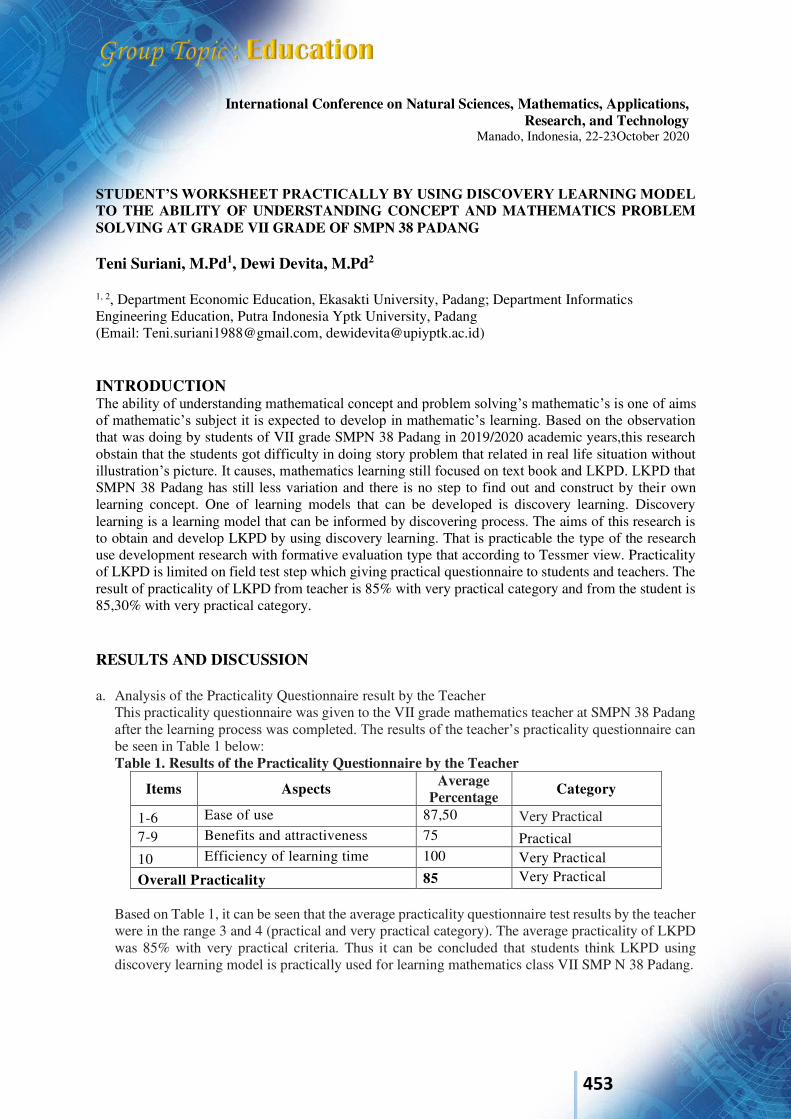
453
International Conference on Natural Sciences, Mathematics, Applications, Research, and Technology
Manado, Indonesia, 22-23October 2020
STUDENT’S WORKSHEET PRACTICALLY BY USING DISCOVERY LEARNING MODEL TO THE ABILITY OF UNDERSTANDING CONCEPT AND MATHEMATICS PROBLEM SOLVING AT GRADE VII GRADE OF SMPN 38 PADANG Teni Suriani, M.Pd1, Dewi Devita, M.Pd2
1, 2, Department Economic Education, Ekasakti University, Padang; Department Informatics Engineering Education, Putra Indonesia Yptk University, Padang (Email: [email protected], [email protected]) INTRODUCTION The ability of understanding mathematical concept and problem solving’s mathematic’s is one of aims of mathematic’s subject it is expected to develop in mathematic’s learning. Based on the observation that was doing by students of VII grade SMPN 38 Padang in 2019/2020 academic years,this research obstain that the students got difficulty in doing story problem that related in real life situation without illustration’s picture. It causes, mathematics learning still focused on text book and LKPD. LKPD that SMPN 38 Padang has still less variation and there is no step to find out and construct by their own learning concept. One of learning models that can be developed is discovery learning. Discovery learning is a learning model that can be informed by discovering process. The aims of this research is to obtain and develop LKPD by using discovery learning. That is practicable the type of the research use development research with formative evaluation type that according to Tessmer view. Practicality of LKPD is limited on field test step which giving practical questionnaire to students and teachers. The result of practicality of LKPD from teacher is 85% with very practical category and from the student is 85,30% with very practical category. RESULTS AND DISCUSSION a. Analysis of the Practicality Questionnaire result by the Teacher
This practicality questionnaire was given to the VII grade mathematics teacher at SMPN 38 Padang after the learning process was completed. The results of the teacher’s practicality questionnaire can be seen in Table 1 below: Table 1. Results of the Practicality Questionnaire by the Teacher
Items Aspects Average Percentage
Category
1-6 Ease of use 87,50 Very Practical 7-9 Benefits and attractiveness 75 Practical 10 Efficiency of learning time 100 Very Practical
Overall Practicality 85 Very Practical
Based on Table 1, it can be seen that the average practicality questionnaire test results by the teacher were in the range 3 and 4 (practical and very practical category). The average practicality of LKPD was 85% with very practical criteria. Thus it can be concluded that students think LKPD using discovery learning model is practically used for learning mathematics class VII SMP N 38 Padang.
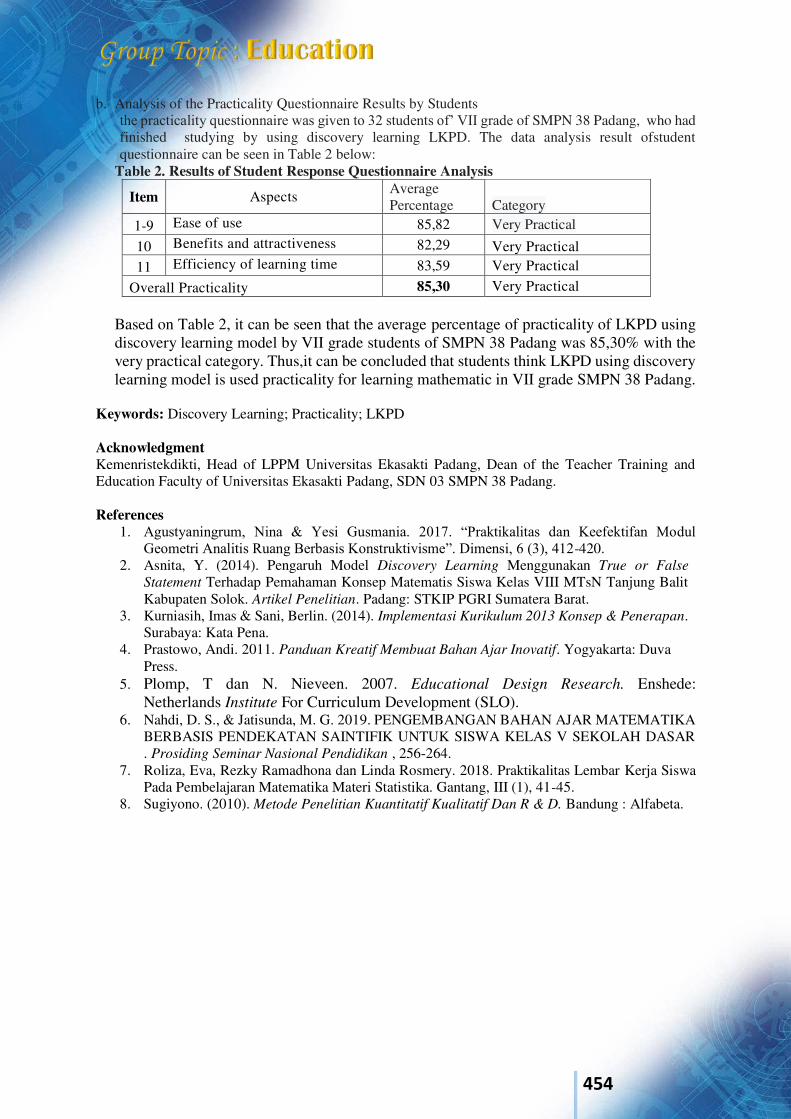
454
b. Analysis of the Practicality Questionnaire Results by Students the practicality questionnaire was given to 32 students of’ VII grade of SMPN 38 Padang, who had finished studying by using discovery learning LKPD. The data analysis result ofstudent questionnaire can be seen in Table 2 below:
Table 2. Results of Student Response Questionnaire Analysis
Item Aspects Average Percentage Category
1-9 Ease of use 85,82 Very Practical
10 Benefits and attractiveness 82,29 Very Practical 11 Efficiency of learning time 83,59 Very Practical
Overall Practicality 85,30 Very Practical
Based on Table 2, it can be seen that the average percentage of practicality of LKPD using discovery learning model by VII grade students of SMPN 38 Padang was 85,30% with the very practical category. Thus,it can be concluded that students think LKPD using discovery learning model is used practicality for learning mathematic in VII grade SMPN 38 Padang.
Keywords: Discovery Learning; Practicality; LKPD Acknowledgment Kemenristekdikti, Head of LPPM Universitas Ekasakti Padang, Dean of the Teacher Training and Education Faculty of Universitas Ekasakti Padang, SDN 03 SMPN 38 Padang. References
1. Agustyaningrum, Nina & Yesi Gusmania. 2017. “Praktikalitas dan Keefektifan Modul Geometri Analitis Ruang Berbasis Konstruktivisme”. Dimensi, 6 (3), 412-420.
2. Asnita, Y. (2014). Pengaruh Model Discovery Learning Menggunakan True or False
Statement Terhadap Pemahaman Konsep Matematis Siswa Kelas VIII MTsN Tanjung Balit Kabupaten Solok. Artikel Penelitian. Padang: STKIP PGRI Sumatera Barat.
3. Kurniasih, Imas & Sani, Berlin. (2014). Implementasi Kurikulum 2013 Konsep & Penerapan. Surabaya: Kata Pena.
4. Prastowo, Andi. 2011. Panduan Kreatif Membuat Bahan Ajar Inovatif. Yogyakarta: Duva Press.
5. Plomp, T dan N. Nieveen. 2007. Educational Design Research. Enshede: Netherlands Institute For Curriculum Development (SLO).
6. Nahdi, D. S., & Jatisunda, M. G. 2019. PENGEMBANGAN BAHAN AJAR MATEMATIKA BERBASIS PENDEKATAN SAINTIFIK UNTUK SISWA KELAS V SEKOLAH DASAR . Prosiding Seminar Nasional Pendidikan , 256-264.
7. Roliza, Eva, Rezky Ramadhona dan Linda Rosmery. 2018. Praktikalitas Lembar Kerja Siswa Pada Pembelajaran Matematika Materi Statistika. Gantang, III (1), 41-45.
8. Sugiyono. (2010). Metode Penelitian Kuantitatif Kualitatif Dan R & D. Bandung : Alfabeta.
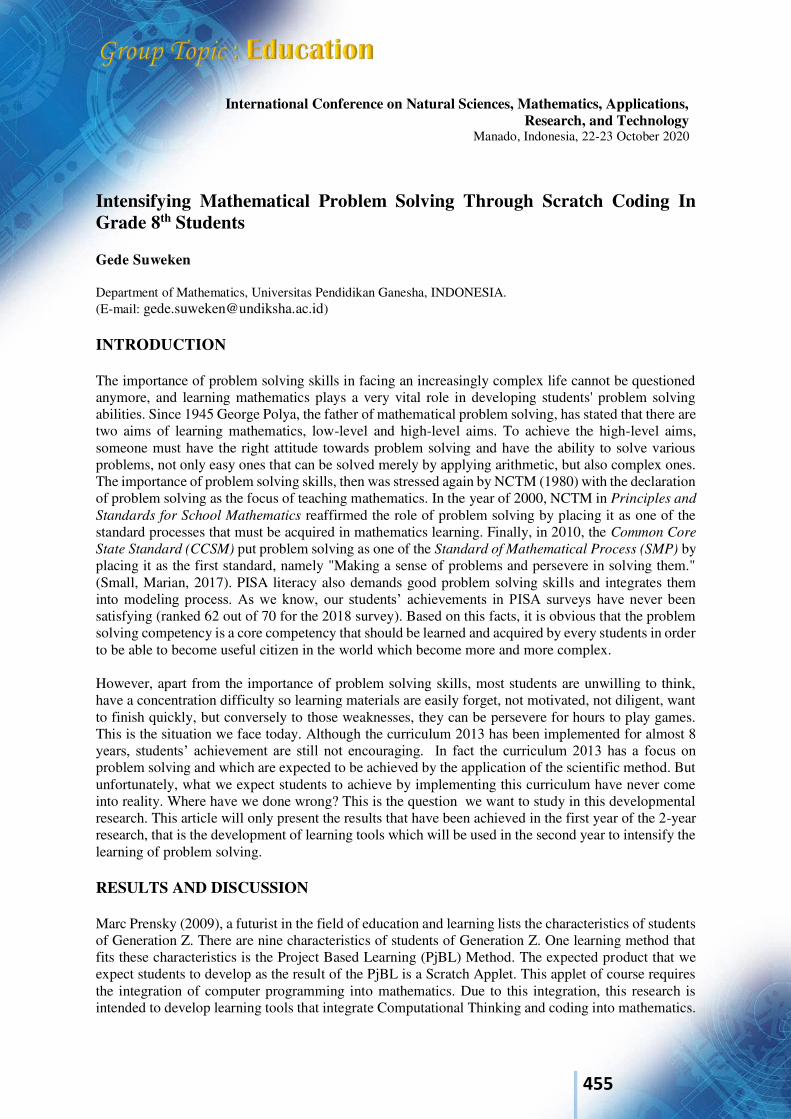
455
International Conference on Natural Sciences, Mathematics, Applications, Research, and Technology
Manado, Indonesia, 22-23 October 2020
Intensifying Mathematical Problem Solving Through Scratch Coding In Grade 8th Students Gede Suweken
Department of Mathematics, Universitas Pendidikan Ganesha, INDONESIA. (E-mail: [email protected]) INTRODUCTION The importance of problem solving skills in facing an increasingly complex life cannot be questioned anymore, and learning mathematics plays a very vital role in developing students' problem solving abilities. Since 1945 George Polya, the father of mathematical problem solving, has stated that there are two aims of learning mathematics, low-level and high-level aims. To achieve the high-level aims, someone must have the right attitude towards problem solving and have the ability to solve various problems, not only easy ones that can be solved merely by applying arithmetic, but also complex ones. The importance of problem solving skills, then was stressed again by NCTM (1980) with the declaration of problem solving as the focus of teaching mathematics. In the year of 2000, NCTM in Principles and
Standards for School Mathematics reaffirmed the role of problem solving by placing it as one of the standard processes that must be acquired in mathematics learning. Finally, in 2010, the Common Core
State Standard (CCSM) put problem solving as one of the Standard of Mathematical Process (SMP) by placing it as the first standard, namely "Making a sense of problems and persevere in solving them." (Small, Marian, 2017). PISA literacy also demands good problem solving skills and integrates them into modeling process. As we know, our students’ achievements in PISA surveys have never been satisfying (ranked 62 out of 70 for the 2018 survey). Based on this facts, it is obvious that the problem solving competency is a core competency that should be learned and acquired by every students in order to be able to become useful citizen in the world which become more and more complex. However, apart from the importance of problem solving skills, most students are unwilling to think, have a concentration difficulty so learning materials are easily forget, not motivated, not diligent, want to finish quickly, but conversely to those weaknesses, they can be persevere for hours to play games. This is the situation we face today. Although the curriculum 2013 has been implemented for almost 8 years, students’ achievement are still not encouraging. In fact the curriculum 2013 has a focus on problem solving and which are expected to be achieved by the application of the scientific method. But unfortunately, what we expect students to achieve by implementing this curriculum have never come into reality. Where have we done wrong? This is the question we want to study in this developmental research. This article will only present the results that have been achieved in the first year of the 2-year research, that is the development of learning tools which will be used in the second year to intensify the learning of problem solving. RESULTS AND DISCUSSION Marc Prensky (2009), a futurist in the field of education and learning lists the characteristics of students of Generation Z. There are nine characteristics of students of Generation Z. One learning method that fits these characteristics is the Project Based Learning (PjBL) Method. The expected product that we expect students to develop as the result of the PjBL is a Scratch Applet. This applet of course requires the integration of computer programming into mathematics. Due to this integration, this research is intended to develop learning tools that integrate Computational Thinking and coding into mathematics.
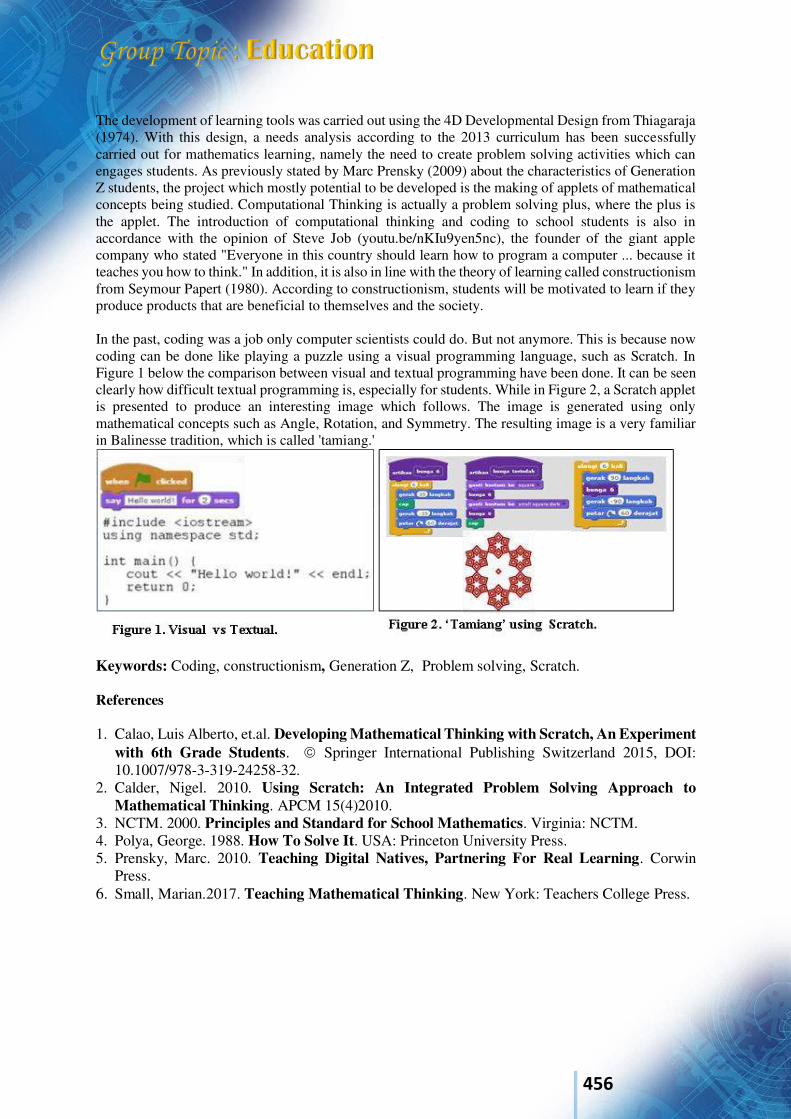
456
The development of learning tools was carried out using the 4D Developmental Design from Thiagaraja (1974). With this design, a needs analysis according to the 2013 curriculum has been successfully carried out for mathematics learning, namely the need to create problem solving activities which can engages students. As previously stated by Marc Prensky (2009) about the characteristics of Generation Z students, the project which mostly potential to be developed is the making of applets of mathematical concepts being studied. Computational Thinking is actually a problem solving plus, where the plus is the applet. The introduction of computational thinking and coding to school students is also in accordance with the opinion of Steve Job (youtu.be/nKIu9yen5nc), the founder of the giant apple company who stated "Everyone in this country should learn how to program a computer ... because it teaches you how to think." In addition, it is also in line with the theory of learning called constructionism from Seymour Papert (1980). According to constructionism, students will be motivated to learn if they produce products that are beneficial to themselves and the society. In the past, coding was a job only computer scientists could do. But not anymore. This is because now coding can be done like playing a puzzle using a visual programming language, such as Scratch. In Figure 1 below the comparison between visual and textual programming have been done. It can be seen clearly how difficult textual programming is, especially for students. While in Figure 2, a Scratch applet is presented to produce an interesting image which follows. The image is generated using only mathematical concepts such as Angle, Rotation, and Symmetry. The resulting image is a very familiar in Balinesse tradition, which is called 'tamiang.'
Keywords: Coding, constructionism, Generation Z, Problem solving, Scratch. References 1. Calao, Luis Alberto, et.al. Developing Mathematical Thinking with Scratch, An Experiment
with 6th Grade Students. Springer International Publishing Switzerland 2015, DOI: 10.1007/978-3-319-24258-32.
2. Calder, Nigel. 2010. Using Scratch: An Integrated Problem Solving Approach to Mathematical Thinking. APCM 15(4)2010.
3. NCTM. 2000. Principles and Standard for School Mathematics. Virginia: NCTM. 4. Polya, George. 1988. How To Solve It. USA: Princeton University Press. 5. Prensky, Marc. 2010. Teaching Digital Natives, Partnering For Real Learning. Corwin
Press. 6. Small, Marian.2017. Teaching Mathematical Thinking. New York: Teachers College Press.
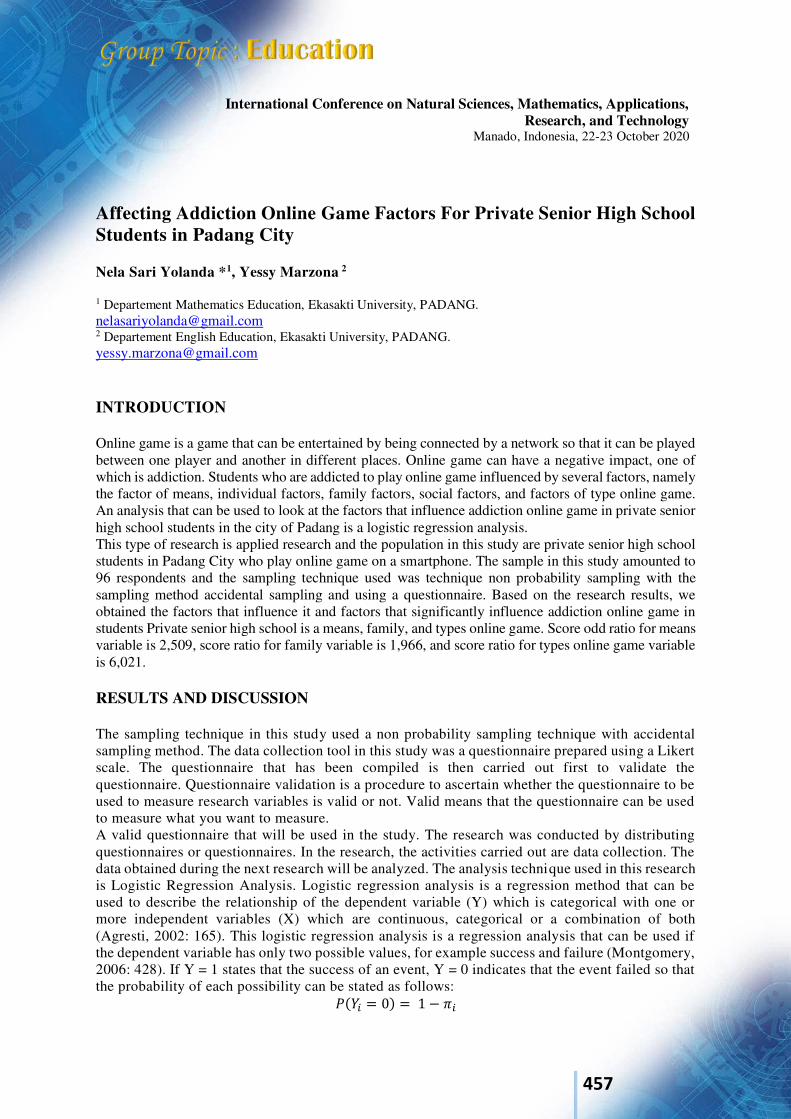
457
International Conference on Natural Sciences, Mathematics, Applications, Research, and Technology
Manado, Indonesia, 22-23 October 2020
Affecting Addiction Online Game Factors For Private Senior High School Students in Padang City Nela Sari Yolanda *1, Yessy Marzona 2
1 Departement Mathematics Education, Ekasakti University, PADANG. [email protected] 2 Departement English Education, Ekasakti University, PADANG. [email protected] INTRODUCTION Online game is a game that can be entertained by being connected by a network so that it can be played between one player and another in different places. Online game can have a negative impact, one of which is addiction. Students who are addicted to play online game influenced by several factors, namely the factor of means, individual factors, family factors, social factors, and factors of type online game. An analysis that can be used to look at the factors that influence addiction online game in private senior high school students in the city of Padang is a logistic regression analysis. This type of research is applied research and the population in this study are private senior high school students in Padang City who play online game on a smartphone. The sample in this study amounted to 96 respondents and the sampling technique used was technique non probability sampling with the sampling method accidental sampling and using a questionnaire. Based on the research results, we obtained the factors that influence it and factors that significantly influence addiction online game in students Private senior high school is a means, family, and types online game. Score odd ratio for means variable is 2,509, score ratio for family variable is 1,966, and score ratio for types online game variable is 6,021. RESULTS AND DISCUSSION The sampling technique in this study used a non probability sampling technique with accidental sampling method. The data collection tool in this study was a questionnaire prepared using a Likert scale. The questionnaire that has been compiled is then carried out first to validate the questionnaire. Questionnaire validation is a procedure to ascertain whether the questionnaire to be used to measure research variables is valid or not. Valid means that the questionnaire can be used to measure what you want to measure. A valid questionnaire that will be used in the study. The research was conducted by distributing questionnaires or questionnaires. In the research, the activities carried out are data collection. The data obtained during the next research will be analyzed. The analysis technique used in this research is Logistic Regression Analysis. Logistic regression analysis is a regression method that can be used to describe the relationship of the dependent variable (Y) which is categorical with one or more independent variables (X) which are continuous, categorical or a combination of both (Agresti, 2002: 165). This logistic regression analysis is a regression analysis that can be used if the dependent variable has only two possible values, for example success and failure (Montgomery, 2006: 428). If Y = 1 states that the success of an event, Y = 0 indicates that the event failed so that the probability of each possibility can be stated as follows: 𝑃(𝑌𝑖 = 0) = 1 − 𝜋𝑖
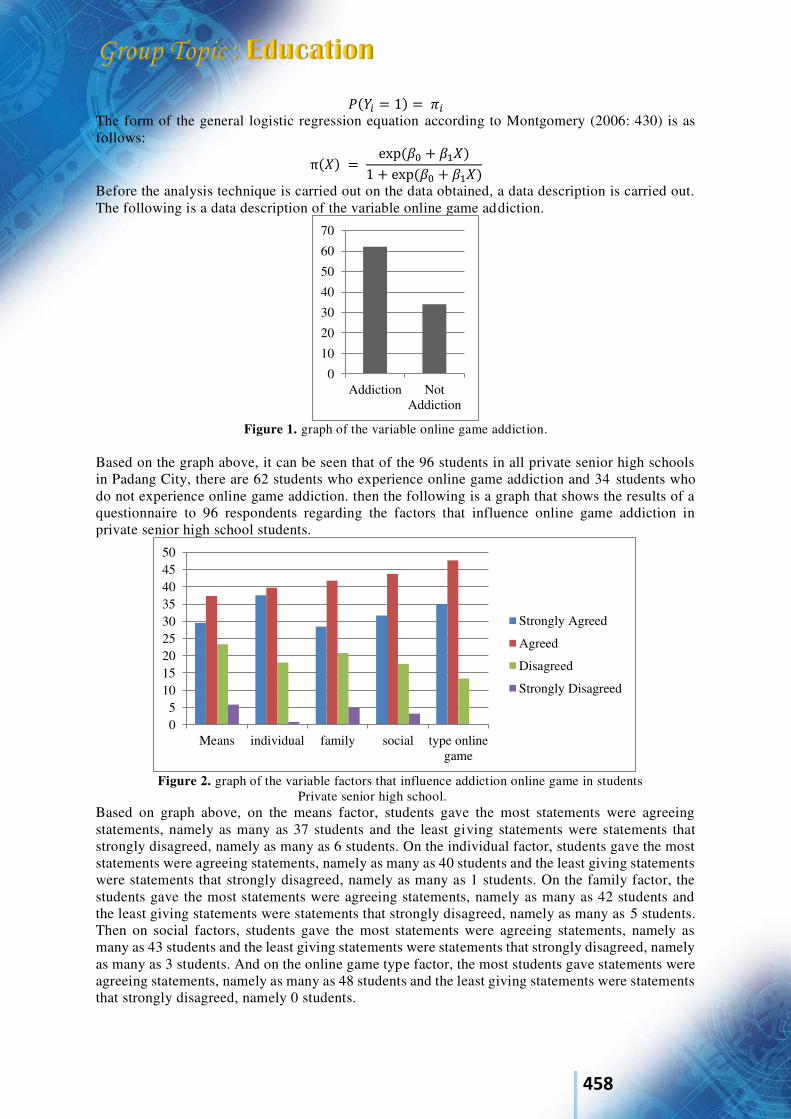
458
𝑃(𝑌𝑖 = 1) = 𝜋𝑖 The form of the general logistic regression equation according to Montgomery (2006: 430) is as follows: π(𝑋) = exp(𝛽0 + 𝛽1𝑋)1 + exp(𝛽0 + 𝛽1𝑋)
Before the analysis technique is carried out on the data obtained, a data description is carried out. The following is a data description of the variable online game addiction.
Figure 1. graph of the variable online game addiction.
Based on the graph above, it can be seen that of the 96 students in all private senior high schools in Padang City, there are 62 students who experience online game addiction and 34 students who do not experience online game addiction. then the following is a graph that shows the results of a questionnaire to 96 respondents regarding the factors that influence online game addiction in private senior high school students.
Figure 2. graph of the variable factors that influence addiction online game in students
Private senior high school. Based on graph above, on the means factor, students gave the most statements were agreeing statements, namely as many as 37 students and the least giving statements were statements that strongly disagreed, namely as many as 6 students. On the individual factor, students gave the most statements were agreeing statements, namely as many as 40 students and the least giving statements were statements that strongly disagreed, namely as many as 1 students. On the family factor, the students gave the most statements were agreeing statements, namely as many as 42 students and the least giving statements were statements that strongly disagreed, namely as many as 5 students. Then on social factors, students gave the most statements were agreeing statements, namely as many as 43 students and the least giving statements were statements that strongly disagreed, namely as many as 3 students. And on the online game type factor, the most students gave statements were agreeing statements, namely as many as 48 students and the least giving statements were statements that strongly disagreed, namely 0 students.
0
10
20
30
40
50
60
70
Addiction NotAddiction
05
101520253035404550
Means individual family social type onlinegame
Strongly Agreed
Agreed
Disagreed
Strongly Disagreed
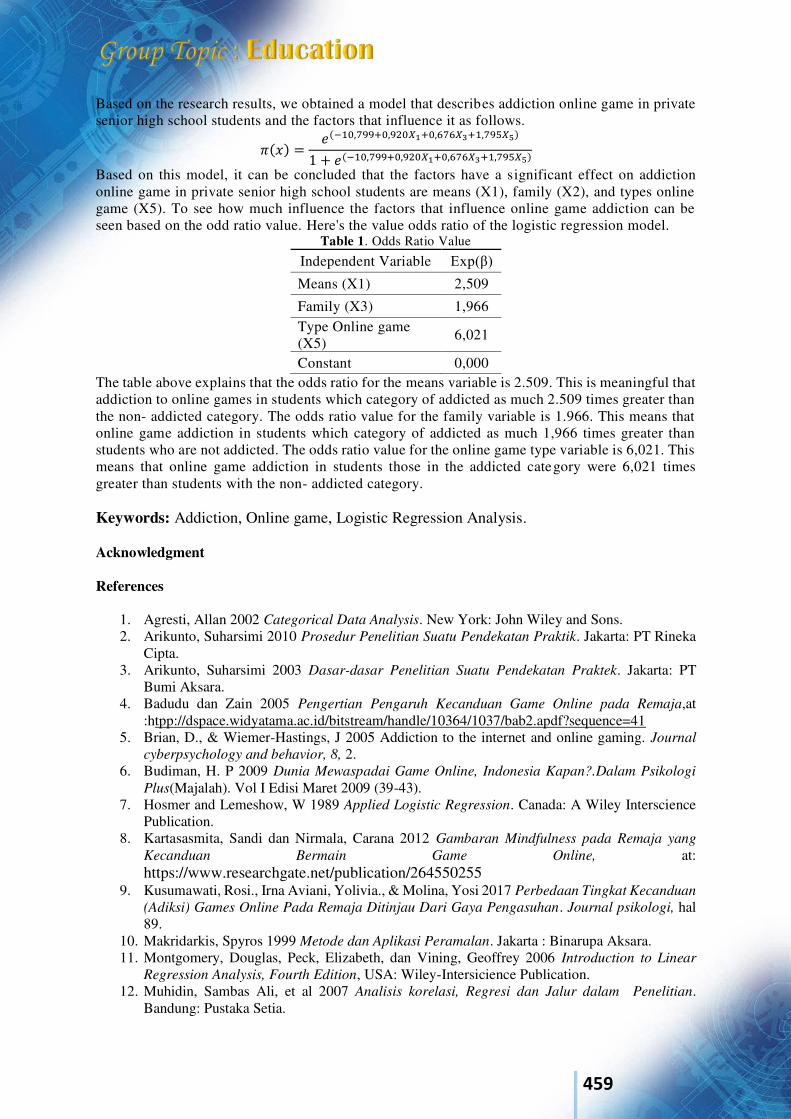
459
Based on the research results, we obtained a model that describes addiction online game in private senior high school students and the factors that influence it as follows. 𝜋(𝑥) = 𝑒(−10,799+0,920𝑋1+0,676𝑋3+1,795𝑋5)1 + 𝑒(−10,799+0,920𝑋1+0,676𝑋3+1,795𝑋5) Based on this model, it can be concluded that the factors have a significant effect on addiction online game in private senior high school students are means (X1), family (X2), and types online game (X5). To see how much influence the factors that influence online game addiction can be seen based on the odd ratio value. Here's the value odds ratio of the logistic regression model.
Table 1. Odds Ratio Value Independent Variable Exp(β) Means (X1) 2,509
Family (X3) 1,966 Type Online game (X5) 6,021
Constant 0,000 The table above explains that the odds ratio for the means variable is 2.509. This is meaningful that addiction to online games in students which category of addicted as much 2.509 times greater than the non- addicted category. The odds ratio value for the family variable is 1.966. This means that online game addiction in students which category of addicted as much 1,966 times greater than students who are not addicted. The odds ratio value for the online game type variable is 6,021. This means that online game addiction in students those in the addicted category were 6,021 times greater than students with the non- addicted category. Keywords: Addiction, Online game, Logistic Regression Analysis. Acknowledgment References
1. Agresti, Allan 2002 Categorical Data Analysis. New York: John Wiley and Sons. 2. Arikunto, Suharsimi 2010 Prosedur Penelitian Suatu Pendekatan Praktik. Jakarta: PT Rineka
Cipta. 3. Arikunto, Suharsimi 2003 Dasar-dasar Penelitian Suatu Pendekatan Praktek. Jakarta: PT
Bumi Aksara. 4. Badudu dan Zain 2005 Pengertian Pengaruh Kecanduan Game Online pada Remaja,at
:htpp://dspace.widyatama.ac.id/bitstream/handle/10364/1037/bab2.apdf?sequence=41 5. Brian, D., & Wiemer-Hastings, J 2005 Addiction to the internet and online gaming. Journal
cyberpsychology and behavior, 8, 2. 6. Budiman, H. P 2009 Dunia Mewaspadai Game Online, Indonesia Kapan?.Dalam Psikologi
Plus(Majalah). Vol I Edisi Maret 2009 (39-43). 7. Hosmer and Lemeshow, W 1989 Applied Logistic Regression. Canada: A Wiley Interscience
Publication. 8. Kartasasmita, Sandi dan Nirmala, Carana 2012 Gambaran Mindfulness pada Remaja yang
Kecanduan Bermain Game Online, at: https://www.researchgate.net/publication/264550255
9. Kusumawati, Rosi., Irna Aviani, Yolivia., & Molina, Yosi 2017 Perbedaan Tingkat Kecanduan
(Adiksi) Games Online Pada Remaja Ditinjau Dari Gaya Pengasuhan. Journal psikologi, hal 89.
10. Makridarkis, Spyros 1999 Metode dan Aplikasi Peramalan. Jakarta : Binarupa Aksara. 11. Montgomery, Douglas, Peck, Elizabeth, dan Vining, Geoffrey 2006 Introduction to Linear
Regression Analysis, Fourth Edition, USA: Wiley-Intersicience Publication. 12. Muhidin, Sambas Ali, et al 2007 Analisis korelasi, Regresi dan Jalur dalam Penelitian.
Bandung: Pustaka Setia.

460
13. Suryabrata, Sumadi 2012 Metodologi Penelitian. Jakarta: PT Raja Grafindo Persada. 14. Susanti, Y. 2008 Ketergantungan pada internet: game online, Video games dan sejenisnya.
Anima: Indonesian psychological journal, 23, 180-183. 15. Yanto, Riki, 2001 “Pengaruh Game Online Terhadap Perilaku Remaja”. Skripsi. Padang :
Social and Political Faculty of Andalas University. 16. Ziqri, Aulia 2010 “Faktor-faktor yang Mempengaruhi Partisipasi Politik Masyarakat
Kecamatan Koto Tangah dalam Pelaksanaan Pemilihan Walikota dan Wakil Walikota Padang Tahun 2013 Menggunakan Analisis Regresi Logistik”. Tugas Akhir. Statistics Departement of Padang State University.
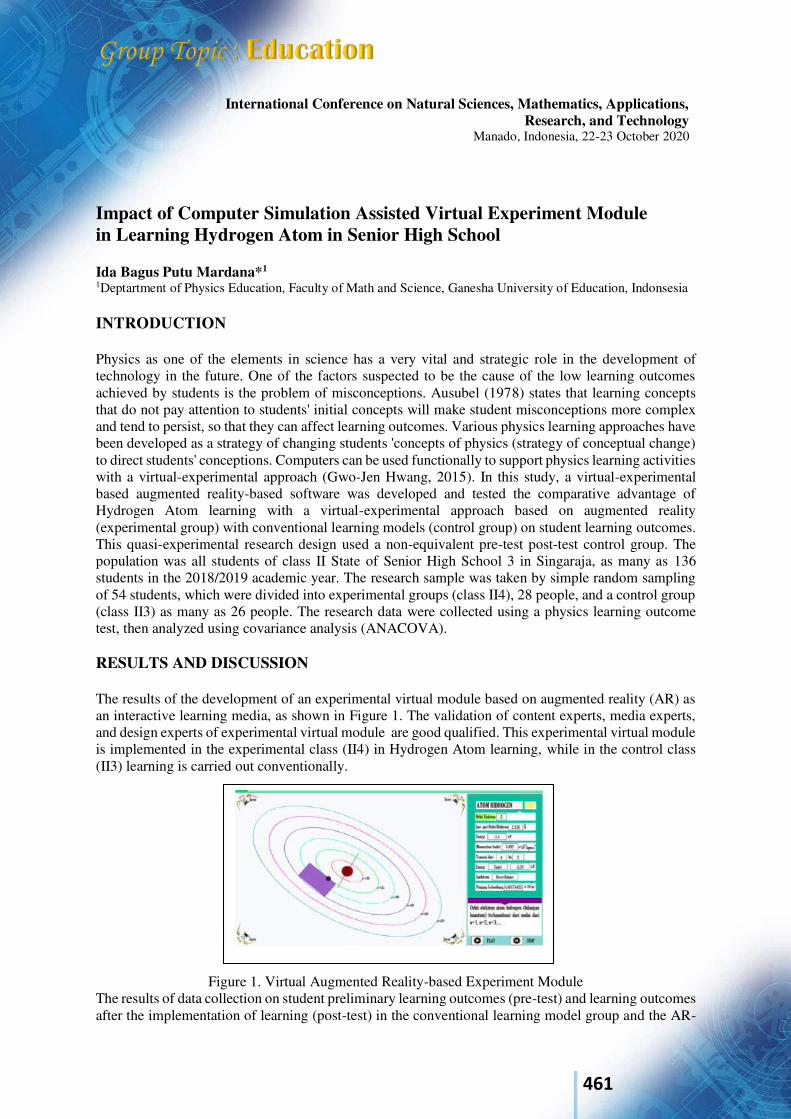
461
International Conference on Natural Sciences, Mathematics, Applications, Research, and Technology
Manado, Indonesia, 22-23 October 2020
Impact of Computer Simulation Assisted Virtual Experiment Module in Learning Hydrogen Atom in Senior High School Ida Bagus Putu Mardana*1
1Deptartment of Physics Education, Faculty of Math and Science, Ganesha University of Education, Indonsesia INTRODUCTION Physics as one of the elements in science has a very vital and strategic role in the development of technology in the future. One of the factors suspected to be the cause of the low learning outcomes achieved by students is the problem of misconceptions. Ausubel (1978) states that learning concepts that do not pay attention to students' initial concepts will make student misconceptions more complex and tend to persist, so that they can affect learning outcomes. Various physics learning approaches have been developed as a strategy of changing students 'concepts of physics (strategy of conceptual change) to direct students' conceptions. Computers can be used functionally to support physics learning activities with a virtual-experimental approach (Gwo-Jen Hwang, 2015). In this study, a virtual-experimental based augmented reality-based software was developed and tested the comparative advantage of Hydrogen Atom learning with a virtual-experimental approach based on augmented reality (experimental group) with conventional learning models (control group) on student learning outcomes. This quasi-experimental research design used a non-equivalent pre-test post-test control group. The population was all students of class II State of Senior High School 3 in Singaraja, as many as 136 students in the 2018/2019 academic year. The research sample was taken by simple random sampling of 54 students, which were divided into experimental groups (class II4), 28 people, and a control group (class II3) as many as 26 people. The research data were collected using a physics learning outcome test, then analyzed using covariance analysis (ANACOVA). RESULTS AND DISCUSSION The results of the development of an experimental virtual module based on augmented reality (AR) as an interactive learning media, as shown in Figure 1. The validation of content experts, media experts, and design experts of experimental virtual module are good qualified. This experimental virtual module is implemented in the experimental class (II4) in Hydrogen Atom learning, while in the control class (II3) learning is carried out conventionally.
Figure 1. Virtual Augmented Reality-based Experiment Module
The results of data collection on student preliminary learning outcomes (pre-test) and learning outcomes after the implementation of learning (post-test) in the conventional learning model group and the AR-
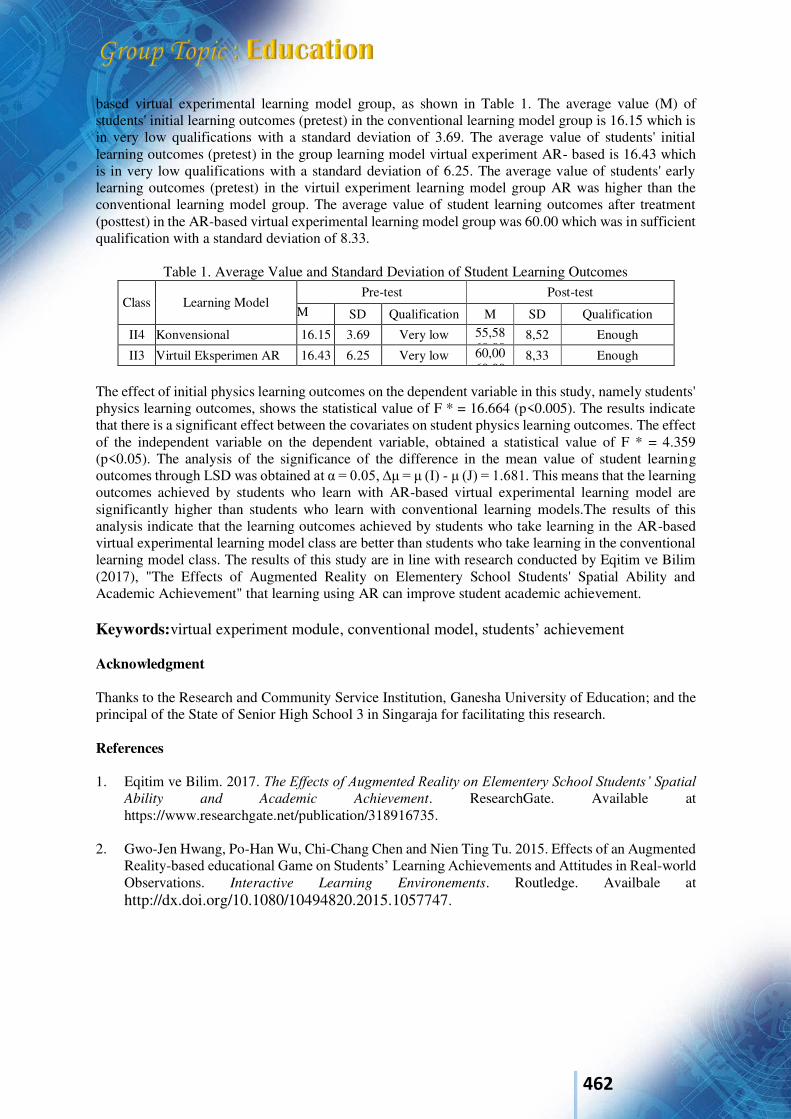
462
based virtual experimental learning model group, as shown in Table 1. The average value (M) of students' initial learning outcomes (pretest) in the conventional learning model group is 16.15 which is in very low qualifications with a standard deviation of 3.69. The average value of students' initial learning outcomes (pretest) in the group learning model virtual experiment AR- based is 16.43 which is in very low qualifications with a standard deviation of 6.25. The average value of students' early learning outcomes (pretest) in the virtuil experiment learning model group AR was higher than the conventional learning model group. The average value of student learning outcomes after treatment (posttest) in the AR-based virtual experimental learning model group was 60.00 which was in sufficient qualification with a standard deviation of 8.33.
Table 1. Average Value and Standard Deviation of Student Learning Outcomes
Class Learning Model Pre-test Post-test
M
SD Qualification M SD Qualification
II4 Konvensional 16.15 3.69 Very low 55,58 60,00
8,52 Enough
II3 Virtuil Eksperimen AR 16.43 6.25 Very low 60,00 60,00
8,33 Enough
The effect of initial physics learning outcomes on the dependent variable in this study, namely students' physics learning outcomes, shows the statistical value of F * = 16.664 (p<0.005). The results indicate that there is a significant effect between the covariates on student physics learning outcomes. The effect of the independent variable on the dependent variable, obtained a statistical value of F * = 4.359 (p<0.05). The analysis of the significance of the difference in the mean value of student learning outcomes through LSD was obtained at α = 0.05, ∆μ = μ (I) - μ (J) = 1.681. This means that the learning outcomes achieved by students who learn with AR-based virtual experimental learning model are significantly higher than students who learn with conventional learning models.The results of this analysis indicate that the learning outcomes achieved by students who take learning in the AR-based virtual experimental learning model class are better than students who take learning in the conventional learning model class. The results of this study are in line with research conducted by Eqitim ve Bilim (2017), "The Effects of Augmented Reality on Elementery School Students' Spatial Ability and Academic Achievement" that learning using AR can improve student academic achievement. Keywords:virtual experiment module, conventional model, students’ achievement Acknowledgment Thanks to the Research and Community Service Institution, Ganesha University of Education; and the principal of the State of Senior High School 3 in Singaraja for facilitating this research. References 1. Eqitim ve Bilim. 2017. The Effects of Augmented Reality on Elementery School Students’ Spatial
Ability and Academic Achievement. ResearchGate. Available at https://www.researchgate.net/publication/318916735.
2. Gwo-Jen Hwang, Po-Han Wu, Chi-Chang Chen and Nien Ting Tu. 2015. Effects of an Augmented
Reality-based educational Game on Students’ Learning Achievements and Attitudes in Real-world Observations. Interactive Learning Environements. Routledge. Availbale at http://dx.doi.org/10.1080/10494820.2015.1057747.
463
International Conference on Natural Sciences, Mathematics, Applications, Research, and Technology
Manado, Indonesia, 22-23 October 2020
Self Regulated E-Learning and Social Attitudes for Achieving Creative Thinking of Students in Learning Physics in High School
I Wayan Santyasa1, Gede Saindra Santyadiputra2, Made Juniantari3
1Physics Education Department, Universitas Pendidikan Ganesha, Indonsia, [email protected] 2Informatics Education Department, Universitas Pendidikan Ganesha, Indonsia, [email protected] 31Mathematics Education Department, Universitas Pendidikan Ganesha, Indonsia, [email protected]
INTRODUCTION The 21st century is a challenge for everyone in the world related to having competence. The National Education Association (NEA, 2014) identifies four important competencies in the 21st century, namely (1) critical thinking and problem solving, (2) communication, (3) collaboration, and (4) creativity and innovation. This challenge has implications for learning in schools, including learning physics in high school. The students' creative thinking in physics learning is a challenge in itself. The ability to think creatively includes the skills to generate new ideas, evaluate, describe, and select ideas (Triyono, Senam, Jumadi, & Wilujeng, 2017). In fact, the 2013 Curriculum provides opportunities for teachers to develop students' creative thinking skills. However, the reality is that students' creative thinking in learning physics in high school is very less (Rizal, Amrita, & Darsono, 2018; Sirait et al., 2018). Reynawati and Purnomo (2018) show that on a scale of 100 the average score of students' creative thinking skills is 28.53 in the very poor category. The low of students’ creative thinking ability is because teachers are less oriented towards developing creative thinking during learning and teachers still tolerate the direct learning model (Ihaloho, Sahyar, & Ginting, 2017; Reynawati & Purnomo, 2018; Rizal et al., 2018; Septiana & Ikhsan , 2017; Sirait et al., 2018). One learning model that accommodates the development of students’ creative thinking in physics learning is the self-regulated learning model. The model affects students' creative thinking abilities (Asep Mauludin et al., 2020). In line with the rapid development of information technology, the direct learning model and the self regulated learning model can be used as pedagogical content in the e-learning system. The terms for the two learning models are direct e-learning (DeL) and self regulated learning (SReL). The integration of the two learning models into e-learning is intended so that both can provide learning performance in accordance with the paradigm of "independent learning independent campus" in the current era. The results of the study show that e-learning can improve students' creative thinking skills (Amidi & Zahid, 2016; Nursarita Prasistayanti, Santyasa, & Sukra Warpala, 2019; Safitri & Suparwoto, 2018). This is because content-based e-learning only tolerates the direct learning model, so that it has less than optimal effect on creative thinking. The social network-based e-learning model synergizes the potential of e-learning with the social attitudes of students, thus supporting the development of students' creative thinking in learning. Based on this background, this study aims to analyze the differences effect of SReL and DeL in achieving creative thinking in terms of students' social attitudes. Students' social attitudes are divided into high social attitudes (HSA) and low social attitudes (LSA). The population was 5 classes (168 people) of class X MIPA SMAN 1 Kubutambahan Buleleng Bali at the 2019/2020 academic year. The sample was 4 classes (128 students, or 76.2% of the population) which were selected using a random assignment technique. Furthermore, 2 classes were assigned as the SReL group and 2 classes as the DeL group. Creative thinking data were collected using an essay test with a scale of 0-4 and social attitudes were collected using a questionnaire with a Lekert model with a scale of 1-5. Data analysis using two-way Anacova. Hypothesis testing uses a significance level of 5%.
464
RESULTS AND DISCUSSION The results of the analysis show 1) There is a difference in the effect between SReL and DeL on creative thinking (F = 35,204; p <0.05). The creative thinking of students learning with the SReL model (Mt1 = 71.95; SD = 6.71) was significantly higher than those studying with the DeL model (Mt2 = 67.09; SD = 6.12). This is in accordance with previous research (Amidi & Zahid, 2016; Safitri & Suparwoto, 2018). Students who study with SReL have relatively high self-efficacy, thus supporting the development of creative thinking. 2) There is a difference in the effect between HSA and LSA on creative thinking (F = 18,439; p <0.05). Students who have SST achieve higher creative thinking (M1t = 71.2; SD = 8.06) than those who have SSR (M2t = 67.9; SD = 8.09). This is in accordance with the results of previous research (Nursarita Prasistayanti, Santyasa, and Sukra Warpala, 2019). E-learning with the social network model serves as a vehicle for developing social attitudes. Good social attitudes is a source of conducive social interaction in learning that leads to the development of students' creative thinking (Nursarita Prasistayanti, Santyasa, and Sukra Warpala, 2019). 3) There is no interactive influence between learning models and students' social attitudes towards creative thinking. Learning physics with the SReL model is accommodating to both levels of students' social attitudes in achieving creative thinking in physics learning for class X MIPA in high school. Keywords: Self regulated e-learning, direct e-learning, social attitude, creative thinking Acknowledgment Thank you to the head of SMAN 1 Kubutambahan. Thank you also to the Physics Teacher of class X of SMAN 1 Kubutambahan and Students of Physics Education Department of Universitas Pendidikan Ganesha who were involved in this research. References Asep Mauludin, Adi Nurjaman, Analisis pengaruh self regulated learning terhadap kemampuan berpikir
kreatif matematis siswa SMA, Jurnal Pembelajaran Matematika Inovatif, 1(2), 219-228, (2018)
Yunita Lesmanawati, Wardani Rahayu, Kadir, dan Vina Iasha, Pengaruh self regulated learning
terhadap kemampuan berpikir kreatif matematis siswa sekolah dasar, Jurnal Basicedu
Volume, 4(3), 593- 603, (2020) A. Reynawati dan T. Purnomo, Penerapan model problem-based learning pada materi pencemaran
lingkungan untuk melatihkan keterampilan berpikir kreatif siswa. Jurnal Pendidikan Sains (PenSa), 6(2), 325-329 (2018).
M. Rizal, A. Amrita and Darsono, Development of student worksheet problem-based learning model to increase higher order thinking skills. IOSR International Journal of Research & Method in
Education (IOSR-JRME), 8(2), 59-65. (2018). K. G. Septiana dan J. Ikhsan, Pengaruh penerapan multiple intelligences dengan model PBL terhadap
pemahaman konsep dankemampuan berpikir kreatif. Jurnal Edukasi Matematika dan Sains (JEMS), 5(1), 43-52 (2017).
A.R. R. Sihaloho, Sahyar, and E. M. Ginting, The eff ect of problem-based learning (PBL) model toward student’s creative thinking and problem solving ability in senior high school. IOSRJournal of Research & Method in Education (IOSR-JRME), 7(4), 11-18, (2017).
A.R. Sirait, B. Sinaga, and Mulyono, Analysis difficulty of mathematical creative thinking ability reviewed from learning styles through problem-based learning. Advances in Social Sciences Research Journal, 5(10), 395-404, (2018).
Triyono, Senam, Jumadi, dan I. Wilujeng, Pengaruh pembelajaran IPA berbasis creative problem solving terhadap kreativitas SMP. Jurnal Kependidikan, 1(2), 214-226, (2017).
A.Amidi dan M. Z. Zahid, Membangun kemampuan berpikir kreatif matematis dengan model pembelajaran berbasis masalah berbantuan e-learning. PRISMA, Prosiding Seminar Nasional
Matematika. 586-594, (2016).

465
A.D.Safitri and Suparwoto, Enhancing senior high school students’ creative thinking skills using project based e-learning. Journal of Physics: Conference Series. 1(1097), 1-6, (2018).
N. W. Nursarita Prasistayanti, I W. Santyasa, I W. dan Sukra Warpala, Pengaruh desain e-learning terhadap hasil belajar dan keterampilan berpikir kreatif siswa dalam mata pelajaran pemrograman pada siswa SMk. Kwangsan: Jurnal Teknologi Pendidikan, 7(2), 138-155 (2019).
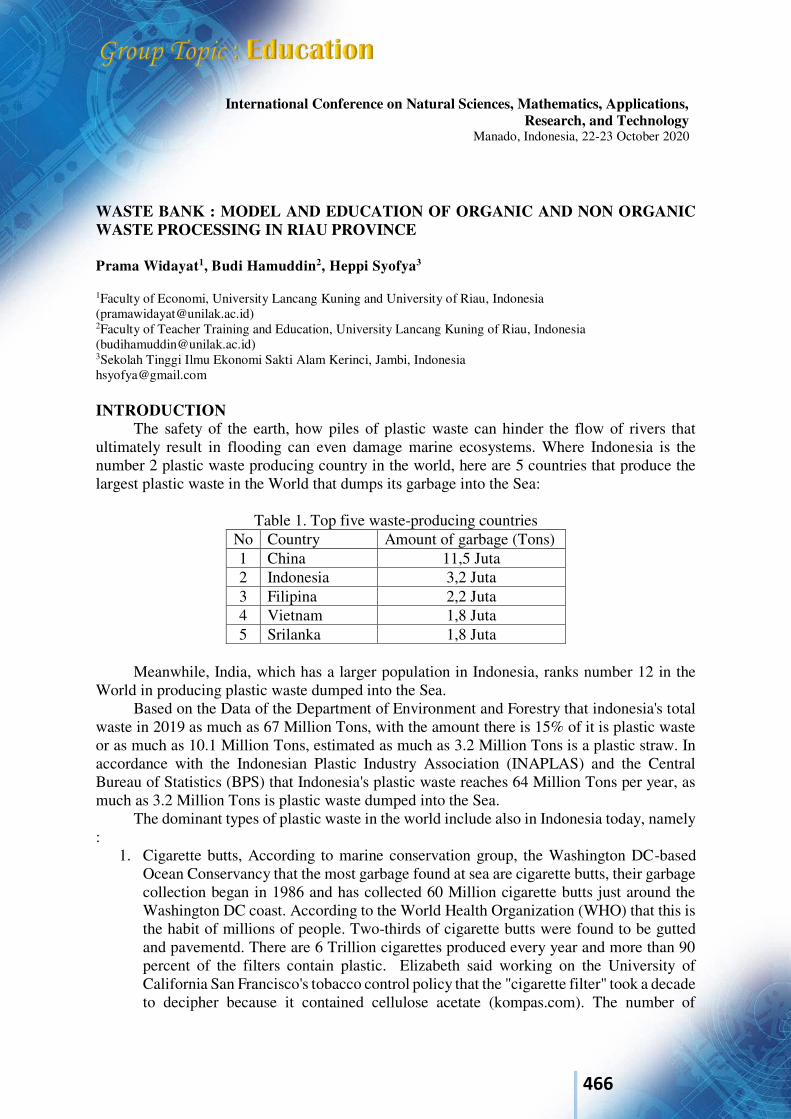
466
International Conference on Natural Sciences, Mathematics, Applications, Research, and Technology
Manado, Indonesia, 22-23 October 2020
WASTE BANK : MODEL AND EDUCATION OF ORGANIC AND NON ORGANIC WASTE PROCESSING IN RIAU PROVINCE Prama Widayat1, Budi Hamuddin2, Heppi Syofya3
1Faculty of Economi, University Lancang Kuning and University of Riau, Indonesia ([email protected]) 2Faculty of Teacher Training and Education, University Lancang Kuning of Riau, Indonesia ([email protected]) 3Sekolah Tinggi Ilmu Ekonomi Sakti Alam Kerinci, Jambi, Indonesia [email protected] INTRODUCTION
The safety of the earth, how piles of plastic waste can hinder the flow of rivers that ultimately result in flooding can even damage marine ecosystems. Where Indonesia is the number 2 plastic waste producing country in the world, here are 5 countries that produce the largest plastic waste in the World that dumps its garbage into the Sea:
Table 1. Top five waste-producing countries
No Country Amount of garbage (Tons) 1 China 11,5 Juta 2 Indonesia 3,2 Juta 3 Filipina 2,2 Juta 4 Vietnam 1,8 Juta 5 Srilanka 1,8 Juta
Meanwhile, India, which has a larger population in Indonesia, ranks number 12 in the
World in producing plastic waste dumped into the Sea. Based on the Data of the Department of Environment and Forestry that indonesia's total
waste in 2019 as much as 67 Million Tons, with the amount there is 15% of it is plastic waste or as much as 10.1 Million Tons, estimated as much as 3.2 Million Tons is a plastic straw. In accordance with the Indonesian Plastic Industry Association (INAPLAS) and the Central Bureau of Statistics (BPS) that Indonesia's plastic waste reaches 64 Million Tons per year, as much as 3.2 Million Tons is plastic waste dumped into the Sea.
The dominant types of plastic waste in the world include also in Indonesia today, namely :
1. Cigarette butts, According to marine conservation group, the Washington DC-based Ocean Conservancy that the most garbage found at sea are cigarette butts, their garbage collection began in 1986 and has collected 60 Million cigarette butts just around the Washington DC coast. According to the World Health Organization (WHO) that this is the habit of millions of people. Two-thirds of cigarette butts were found to be gutted and pavementd. There are 6 Trillion cigarettes produced every year and more than 90 percent of the filters contain plastic. Elizabeth said working on the University of California San Francisco's tobacco control policy that the "cigarette filter" took a decade to decipher because it contained cellulose acetate (kompas.com). The number of
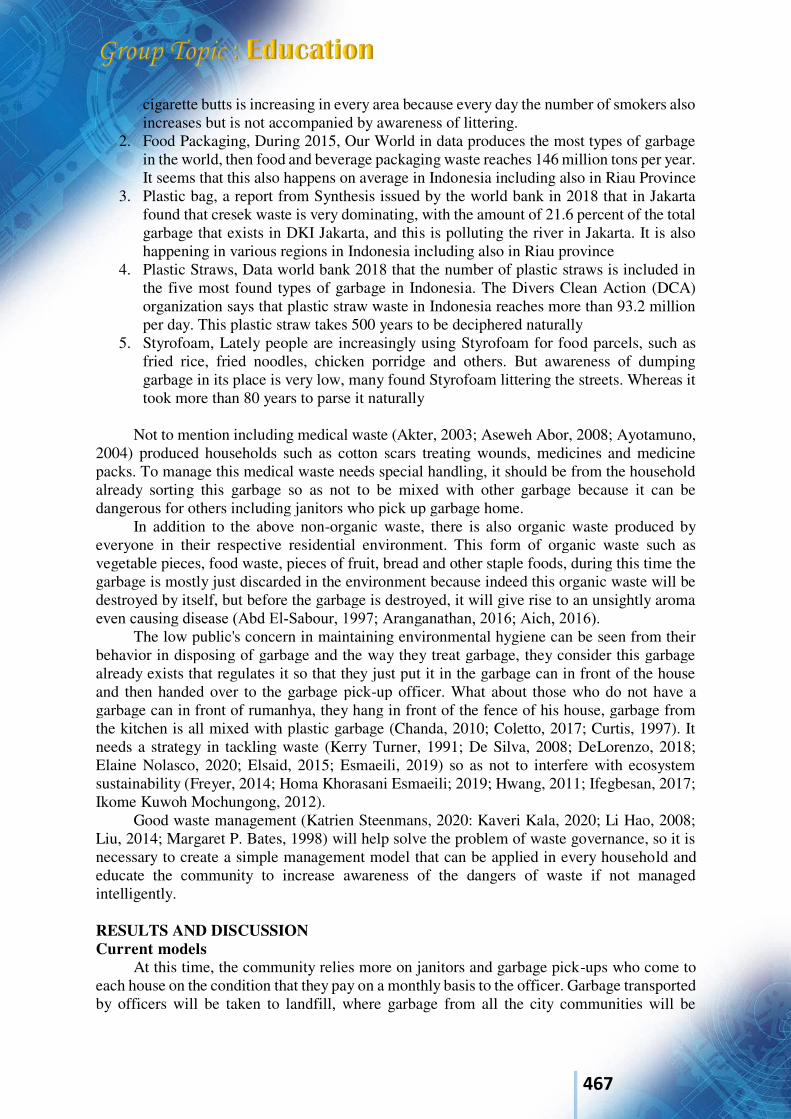
467
cigarette butts is increasing in every area because every day the number of smokers also increases but is not accompanied by awareness of littering.
2. Food Packaging, During 2015, Our World in data produces the most types of garbage in the world, then food and beverage packaging waste reaches 146 million tons per year. It seems that this also happens on average in Indonesia including also in Riau Province
3. Plastic bag, a report from Synthesis issued by the world bank in 2018 that in Jakarta found that cresek waste is very dominating, with the amount of 21.6 percent of the total garbage that exists in DKI Jakarta, and this is polluting the river in Jakarta. It is also happening in various regions in Indonesia including also in Riau province
4. Plastic Straws, Data world bank 2018 that the number of plastic straws is included in the five most found types of garbage in Indonesia. The Divers Clean Action (DCA) organization says that plastic straw waste in Indonesia reaches more than 93.2 million per day. This plastic straw takes 500 years to be deciphered naturally
5. Styrofoam, Lately people are increasingly using Styrofoam for food parcels, such as fried rice, fried noodles, chicken porridge and others. But awareness of dumping garbage in its place is very low, many found Styrofoam littering the streets. Whereas it took more than 80 years to parse it naturally
Not to mention including medical waste (Akter, 2003; Aseweh Abor, 2008; Ayotamuno,
2004) produced households such as cotton scars treating wounds, medicines and medicine packs. To manage this medical waste needs special handling, it should be from the household already sorting this garbage so as not to be mixed with other garbage because it can be dangerous for others including janitors who pick up garbage home.
In addition to the above non-organic waste, there is also organic waste produced by everyone in their respective residential environment. This form of organic waste such as vegetable pieces, food waste, pieces of fruit, bread and other staple foods, during this time the garbage is mostly just discarded in the environment because indeed this organic waste will be destroyed by itself, but before the garbage is destroyed, it will give rise to an unsightly aroma even causing disease (Abd El‐Sabour, 1997; Aranganathan, 2016; Aich, 2016).
The low public's concern in maintaining environmental hygiene can be seen from their behavior in disposing of garbage and the way they treat garbage, they consider this garbage already exists that regulates it so that they just put it in the garbage can in front of the house and then handed over to the garbage pick-up officer. What about those who do not have a garbage can in front of rumanhya, they hang in front of the fence of his house, garbage from the kitchen is all mixed with plastic garbage (Chanda, 2010; Coletto, 2017; Curtis, 1997). It needs a strategy in tackling waste (Kerry Turner, 1991; De Silva, 2008; DeLorenzo, 2018; Elaine Nolasco, 2020; Elsaid, 2015; Esmaeili, 2019) so as not to interfere with ecosystem sustainability (Freyer, 2014; Homa Khorasani Esmaeili; 2019; Hwang, 2011; Ifegbesan, 2017; Ikome Kuwoh Mochungong, 2012).
Good waste management (Katrien Steenmans, 2020: Kaveri Kala, 2020; Li Hao, 2008; Liu, 2014; Margaret P. Bates, 1998) will help solve the problem of waste governance, so it is necessary to create a simple management model that can be applied in every household and educate the community to increase awareness of the dangers of waste if not managed intelligently. RESULTS AND DISCUSSION Current models
At this time, the community relies more on janitors and garbage pick-ups who come to each house on the condition that they pay on a monthly basis to the officer. Garbage transported by officers will be taken to landfill, where garbage from all the city communities will be
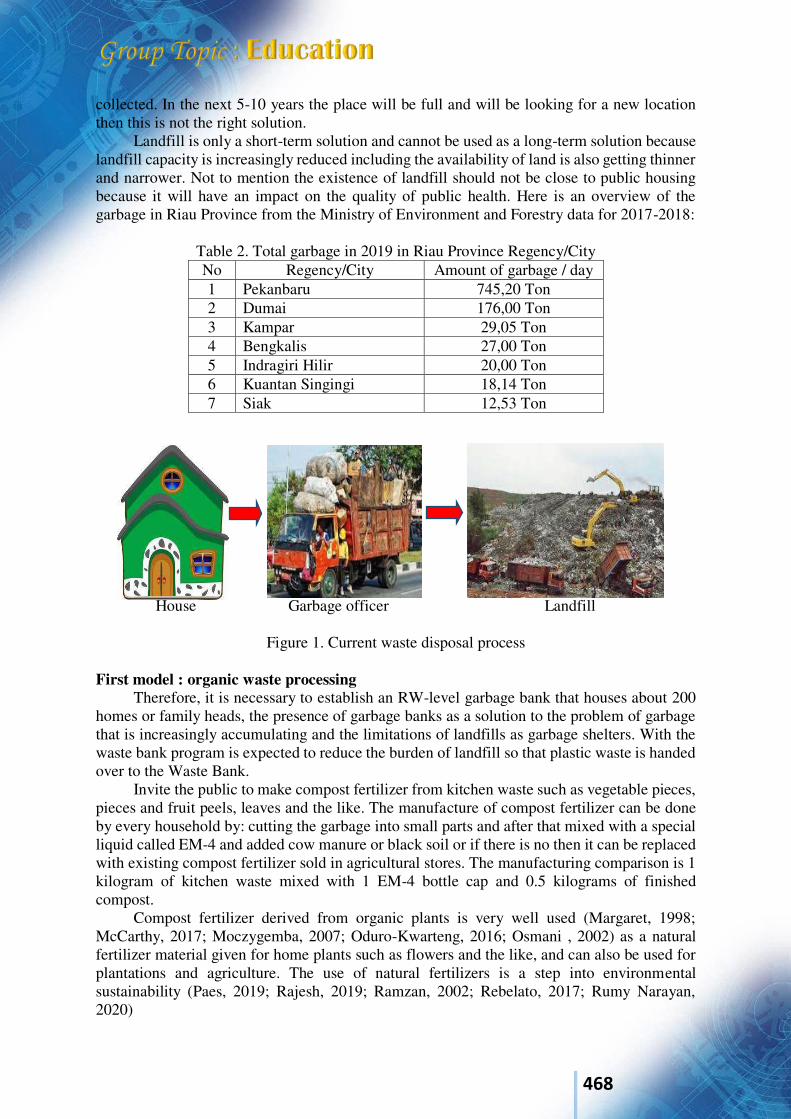
468
collected. In the next 5-10 years the place will be full and will be looking for a new location then this is not the right solution.
Landfill is only a short-term solution and cannot be used as a long-term solution because landfill capacity is increasingly reduced including the availability of land is also getting thinner and narrower. Not to mention the existence of landfill should not be close to public housing because it will have an impact on the quality of public health. Here is an overview of the garbage in Riau Province from the Ministry of Environment and Forestry data for 2017-2018:
Table 2. Total garbage in 2019 in Riau Province Regency/City No Regency/City Amount of garbage / day 1 Pekanbaru 745,20 Ton 2 Dumai 176,00 Ton 3 Kampar 29,05 Ton 4 Bengkalis 27,00 Ton 5 Indragiri Hilir 20,00 Ton 6 Kuantan Singingi 18,14 Ton 7 Siak 12,53 Ton
House Garbage officer Landfill
Figure 1. Current waste disposal process
First model : organic waste processing
Therefore, it is necessary to establish an RW-level garbage bank that houses about 200 homes or family heads, the presence of garbage banks as a solution to the problem of garbage that is increasingly accumulating and the limitations of landfills as garbage shelters. With the waste bank program is expected to reduce the burden of landfill so that plastic waste is handed over to the Waste Bank.
Invite the public to make compost fertilizer from kitchen waste such as vegetable pieces, pieces and fruit peels, leaves and the like. The manufacture of compost fertilizer can be done by every household by: cutting the garbage into small parts and after that mixed with a special liquid called EM-4 and added cow manure or black soil or if there is no then it can be replaced with existing compost fertilizer sold in agricultural stores. The manufacturing comparison is 1 kilogram of kitchen waste mixed with 1 EM-4 bottle cap and 0.5 kilograms of finished compost.
Compost fertilizer derived from organic plants is very well used (Margaret, 1998; McCarthy, 2017; Moczygemba, 2007; Oduro-Kwarteng, 2016; Osmani , 2002) as a natural fertilizer material given for home plants such as flowers and the like, and can also be used for plantations and agriculture. The use of natural fertilizers is a step into environmental sustainability (Paes, 2019; Rajesh, 2019; Ramzan, 2002; Rebelato, 2017; Rumy Narayan, 2020)
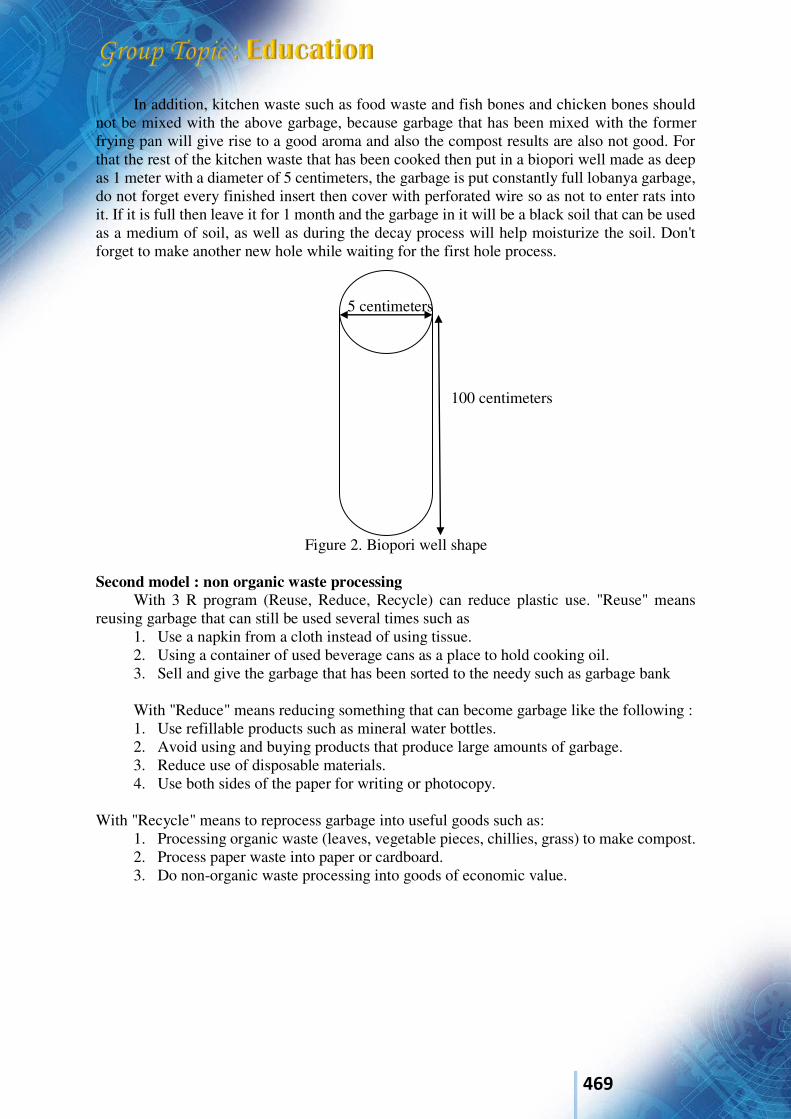
469
In addition, kitchen waste such as food waste and fish bones and chicken bones should not be mixed with the above garbage, because garbage that has been mixed with the former frying pan will give rise to a good aroma and also the compost results are also not good. For that the rest of the kitchen waste that has been cooked then put in a biopori well made as deep as 1 meter with a diameter of 5 centimeters, the garbage is put constantly full lobanya garbage, do not forget every finished insert then cover with perforated wire so as not to enter rats into it. If it is full then leave it for 1 month and the garbage in it will be a black soil that can be used as a medium of soil, as well as during the decay process will help moisturize the soil. Don't forget to make another new hole while waiting for the first hole process.
5 centimeters 100 centimeters
Figure 2. Biopori well shape Second model : non organic waste processing
With 3 R program (Reuse, Reduce, Recycle) can reduce plastic use. "Reuse" means reusing garbage that can still be used several times such as
1. Use a napkin from a cloth instead of using tissue. 2. Using a container of used beverage cans as a place to hold cooking oil. 3. Sell and give the garbage that has been sorted to the needy such as garbage bank With "Reduce" means reducing something that can become garbage like the following : 1. Use refillable products such as mineral water bottles. 2. Avoid using and buying products that produce large amounts of garbage. 3. Reduce use of disposable materials. 4. Use both sides of the paper for writing or photocopy.
With "Recycle" means to reprocess garbage into useful goods such as: 1. Processing organic waste (leaves, vegetable pieces, chillies, grass) to make compost. 2. Process paper waste into paper or cardboard. 3. Do non-organic waste processing into goods of economic value.
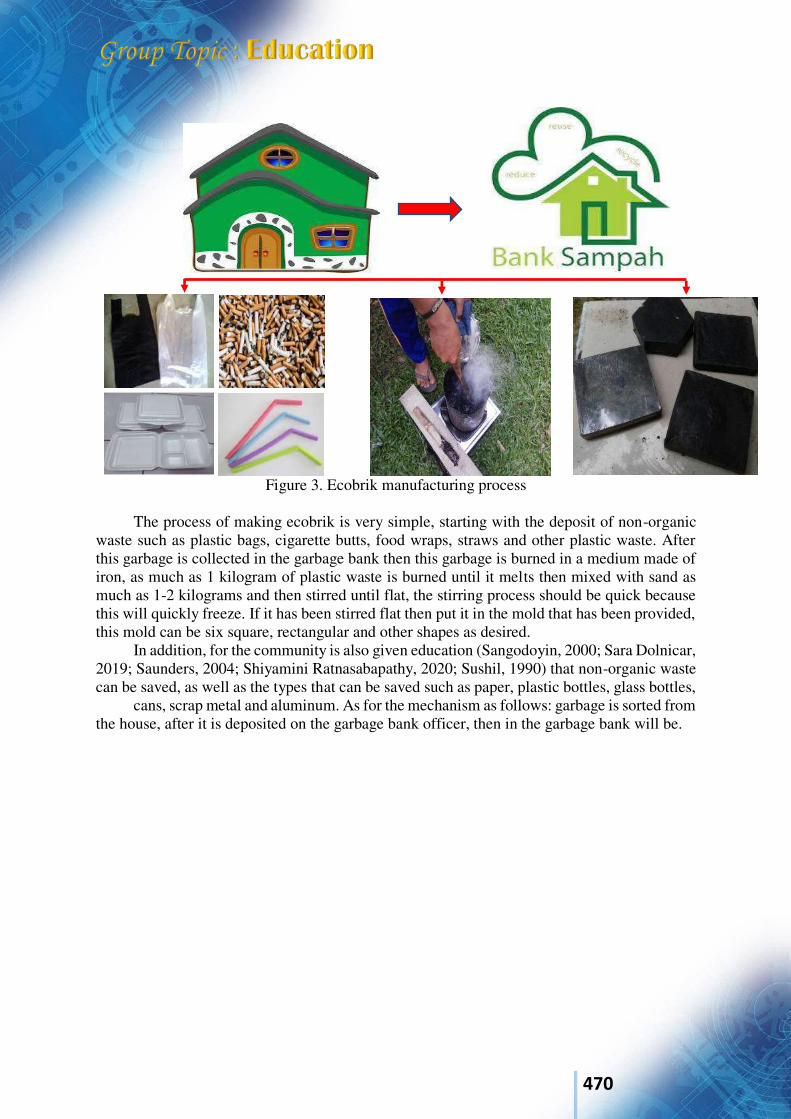
470
Figure 3. Ecobrik manufacturing process
The process of making ecobrik is very simple, starting with the deposit of non-organic waste such as plastic bags, cigarette butts, food wraps, straws and other plastic waste. After this garbage is collected in the garbage bank then this garbage is burned in a medium made of iron, as much as 1 kilogram of plastic waste is burned until it melts then mixed with sand as much as 1-2 kilograms and then stirred until flat, the stirring process should be quick because this will quickly freeze. If it has been stirred flat then put it in the mold that has been provided, this mold can be six square, rectangular and other shapes as desired.
In addition, for the community is also given education (Sangodoyin, 2000; Sara Dolnicar, 2019; Saunders, 2004; Shiyamini Ratnasabapathy, 2020; Sushil, 1990) that non-organic waste can be saved, as well as the types that can be saved such as paper, plastic bottles, glass bottles,
cans, scrap metal and aluminum. As for the mechanism as follows: garbage is sorted from the house, after it is deposited on the garbage bank officer, then in the garbage bank will be.

471
Figure 3. Junk bank mechanism
Saving money on garbage banks has at least reduced the burden of landfills that have
been accommodating garbage from various places that have polluted the environment (Tassell, 1988; Ulrike Gretzel, 2019; Vaishali Sahu, 2019; Varga, 2004; Wang, 2008; Wills, 1995).
The first two models of waste management are the first model of organic waste made into compost fertilizer and made biopori wells, the second model of non-organic waste is made into ecobrik in the form of paving blocks. It is expected to be a solution in reducing the load of garbage that has been dumped into landfill Keywords : waste, education, organic trash, non organic waste, compost, biopori well,
ecobrik Acknowledgment
There are still many shortcomings in this study, where the results of the compost production need to be done laboratory tests about the nutrient content in order to be more useful for the community. As for ecobrik made in the form of paving blocks need to be done pressure test, which is to know how much ability to withstand the load because it will be installed for residential roads or office yard References
1. Abd El‐Sabour, M. F., Abo El‐Seoud, M. A., & Rizk, M. (1997). Physiological and chemical
responses of sunflower to the application of previous organic waste composts to sandy soil.
Environmental Management and Health, 8(4), 128–132 2. Aranganathan, L., & Rajasree S.R., R. (2016). Bioconversion of marine trash fish (MTF) to
organic liquid fertilizer for effective solid waste management and its efficacy on Tomato
growth. Management of Environmental Quality: An International Journal, 27(1), 93–103 3. Aich, A., & Kumar Ghosh, S. (2016). Organic fraction of municipal solid waste – a valuable
source of green energy in India. International Journal of Energy Sector Management, 10(4),
526–545 4. Akter, N., & Tränkler, J. (2003). An analysis of possible scenarios of medical waste
management in Bangladesh. Management of Environmental Quality: An International Journal,
14(2), 242–255.

472
5. Aseweh Abor, P., & Bouwer, A. (2008). Medical waste management practices in a Southern
African hospital. International Journal of Health Care Quality Assurance, 21(4), 356–364. 6. Ayotamuno, J. M., & Gobo, A. E. (2004). Municipal solid waste management in Port Harcourt,
Nigeria. Management of Environmental Quality: An International Journal, 15(4), 389–398
7. Chanda, G. K., Bhunia, G., & Chakraborty, S. K. (2010). Evaluation of nutrient status of
different organic wastes along with environmental quality in the different phases of
vermicomposting by Perionyx excavatus Perrier. Management of Environmental Quality: An
International Journal, 21(3), 368–378 8. Coletto, D., & Bisschop, L. (2017). Waste pickers in the informal economy of the Global South:
included or excluded? International Journal of Sociology and Social Policy, 37(5/6), 280–294
9. Curtis, F. A., & Mak, K. (1991). A Medical Waste Management Strategy. Environmental Management and Health, 2(1), 13–18
10. De Silva, N., & Vithana, S. B. K. H. (2008). Use of PC elements for waste minimization in the
Sri Lankan construction industry. Structural Survey, 26(3), 188–198. 11. DeLorenzo, A., Parizeau, K., & von Massow, M. (2018). Regulating Ontario’s circular
economy through food waste legislation. Society and Business Review
12. Elaine Nolasco, Pedro Henrique Vieira Duraes, Júlia Pereira Gonçalves, Maria Cristina de Oliveira, Lucijane Monteiro de Abreu, Alexandre Nascimento de Almeida, 2020, Characterization of solid wastes as a tool to implement waste management strategies in a
university campus, International Journal of Sustainability in Higher Education
13. Elsaid, S., & Aghezzaf, E.-H. (2015). A framework for sustainable waste management:
challenges and opportunities. Management Research Review, 38(10), 1086–1097 14. Esmaeili, H. K. (2019). Waste Management for the Better Environment: A Case of Municipality
in Iran. Green Behavior and Corporate Social Responsibility in Asia, 103–111
15. Freyer, B., & Bingen, J. (2014). Organic and Non-Organic Farming: Is Convergence Possible?
Research in Rural Sociology and Development, 281–310 16. Homa Khorasani Esmaeili, 2019, Waste Management for the Better Environment: A Case of
Municipality in Iran, Green Behavior and Corporate Social Responsibility in Asia 17. Hwang, B., & Bao Yeo, Z. (2011). Perception on benefits of construction waste management
in the Singapore construction industry. Engineering, Construction and Architectural Management, 18(4), 394–406
18. Ifegbesan, A. P., Ogunyemi, B., & Rampedi, I. T. (2017). Students’ attitudes to solid waste management in a Nigerian university. International Journal of Sustainability in Higher
Education, 18(7), 1244–1262 19. Ikome Kuwoh Mochungong, P., Gulis, G., & Sodemann, M. (2012). Clinical waste incinerators
in Cameroon – a case study. International Journal of Health Care Quality Assurance, 25(1),
6–18 20. Katrien Steenmans, Rosalind Malcolm, 2020, Transitioning towards circular systems: property
rights in waste, Journal of Property, Planning and Environmental Law 21. Kaveri Kala, Nomesh B. Bolia, Sushil, 2020, Effects of socio-economic factors on quantity
and type of municipal solid waste, Management of Environmental Quality 22. Kerry Turner, R., & Powell, J. (1991). Towards an Integrated Waste Management Strategy.
Environmental Management and Health, 2(1), 6–12.
23. Li Hao, J., Hill, M. J., & Yin Shen, L. (2008). Managing construction waste on‐site through system dynamics modelling: the case of Hong Kong. Engineering, Construction and Architectural Management, 15(2), 103–113
24. Liu, Y., & Huang, J. (2014). Rural domestic waste disposal: an empirical analysis in five
provinces of China. China Agricultural Economic Review, 6(4), 558–573 25. Margaret P. Bates, Paul S. Phillips, 1998, Waste minimisation in the food and drink industry
Nutrition & Food Science 26. Margaret P. Bates, Paul S. Phillips, 1999, Sustainable waste management in the food and drink
industry. British Food Journal 27. McCarthy, B., & Liu, H.-B. (2017). “Waste not, want not.” British Food Journal, 119(12),
2519–2531
473
28. Moczygemba, E., & Smaka‐Kincl, V. (2007). 69 per cent recycling rate for waste management
in Graz, Austria. Management of Environmental Quality: An International Journal, 18(2), 126–136
29. Oduro-Kwarteng, S., Anarfi, K. P., & Essandoh, H. M. K. (2016). Source separation and
recycling potential of municipal solid waste in Ghana. Management of Environmental Quality:
An International Journal, 27(2), 210–226
30. Osmani, M. (2012). Innovation in cleaner production through waste recycling in composites. Management of Environmental Quality: An International Journal, 24(1), 6–15.
31. Paes, M. X., de Medeiros, G. A., Mancini, S. D., Ribeiro, F. de M., & Puppim de Oliveira, J. A. (2019). Transition to circular economy in Brazil. Management Decision
32. Rajesh, P. (2019). Solid waste management- sustainability towards a better future, role of CSR
– a review. Social Responsibility Journal 33. Ramzan, S., Liu, C., Xu, Y., Munir, H., & Gupta, B. (2020). The adoption of online e-waste
collection platform to improve environmental sustainability: an empirical study of Chinese
millennials. Management of Environmental Quality: An International Journal 34. Rebelato, M. G., Saran, L. M., Paulino, T. P., & Rodrigues, A. M. (2017). Environmental
performance assessment (EPA): a case study in a graphic company. Management of
Environmental Quality: An International Journal, 28(4), 593–608 35. Rumy Narayan, Annika Tidström, 2020, Leveraging resource ecologies for sustainability
transitions – a waste management case, Journal of Business & Industrial Marketing 36. Sangodoyin, A. Y., & Ipadeola, S. F. (2000). Hazardous wastes Assessing the efficacy of
structures and approaches to management in Nigeria. Environmental Management and Health,
11(1), 39–46 37. Sara Dolnicar,, 2019, Eat up! Prevention of plate waste in tourism and hospitality: a perspective
paper, Tourism Review 38. Saunders, J., & Wynn, P. (2004). Attitudes towards waste minimisation amongst labour only
sub‐contractors. Structural Survey, 22(3), 148–155. 39. Shiyamini Ratnasabapathy, Ali Alashwal, Srinath Perera, 2020, Investigation of waste
diversion rates in the construction and demolition sector in Australia, Built Environment Project and Asset Management
40. Sushil. (1990). Waste Management: A Systems Perspective. Industrial Management & Data
Systems, 90(5), 1–67 41. Tassell, M. G. (1988). LANDFILL SITES BEFORE, DURING AND AFTER FILLING. Property
Management, 6(4), 274–279 42. Ulrike Gretzel, Jamie Murphy, Juho Pesonen, Casey Blanton, 2019, Food waste in tourist
households: a perspective article, Tourism Review 43. Vaishali Sahu, Rounak Attri, Prashast Gupta, Rakesh Yadav, 2019, Development of eco friendly
brick using water treatment plant sludge and processed tea waste, Journal of Engineering, Design and Technology
44. Varga, M., Alpár, T. L., & Németh, G. (2004). General waste handling and recycling in
particleboard production. Management of Environmental Quality: An International Journal,
15(5), 509–520
45. Wang, J., Kang, X., & Wing‐Yan Tam, V. (2008). An investigation of construction wastes: an
empirical study in Shenzhen. Journal of Engineering, Design and Technology, 6(3), 227–236 46. Wills, J. (1995). Managing our wastes. Environmental Management and Health, 6(1), 25–28.