2020 smart grid system report - department of energy
TRANSCRIPT
Message from the Secretary Use this space for the introductory language that would generally go in a transmittal letter, followed by a list of those Members of Congress to whom the report will be sent.
Pursuant to statutory requirements, this report is being provided to the following Members of Congress:
• The Honorable Member of Congress
Title, House or Senate Committee
• The Honorable Member of Congress
Title, House or Senate Committee
• The Honorable Member of Congress
Title, House or Senate Committee
• The Honorable Member of Congress
Title, House or Senate Committee
If you have any questions or need additional information, please contact me or Mr. Brad Crowell, Assistant Secretary for Congressional and Intergovernmental Affairs, at (202) 586-5450.
Sincerely,
2020 Smart Grid System Report January 2022
United States Department of Energy Washington, DC 20585
Department of Energy |January 2022
Smart Grid System Report 2020 | Page ii
Executive Summary This report conveys the status of smart grid deployments across the Nation, the capabilities they provide, and the challenges remaining as we move forward with the modernization of the electric grid. Under section 1302 of the Energy Independence and Security Act of 2007 (EISA) (Public Law 110-140, 42 U.S.C. 17382), the U.S. Department of Energy’s (DOE) Office of Electricity is required to report on the status of smart grid deployments and related challenges every two years.
The electric grid has evolved considerably over the past 10 years. The American Recovery and Reinvestment Act of 2009, representing billions of federal dollars matched with private money to support over 130 projects across the country, provided a powerful stimulus to the deployment of smart grid technologies. The systems deployed enabled utilities to improve the effectiveness and efficiency of their operations, particularly related to reducing the frequency and duration of power outages, providing finer control of operating parameters (e.g., voltage), and enabling greater customer participation in the management of their electricity through the application of advanced metering infrastructure. In 2019, electric utilities spent $80 billion on capital improvements within the transmission and distribution systems, while investments in smart grid technology in 2018 amounted to $6.4 billion (compared to $3.4 billion in 2014) and are forecasted to grow to $16.4 billion annually by 2026.
Over the past five years, we have witnessed accelerated deployment in renewable energy resources and the emergence of a set of technologies, such as electric vehicles, grid-interactive buildings, and microgrids, which are becoming increasingly deployed at the grid edge. These technologies, which consumers and technology service providers often own and control, are introducing significant complexity and uncertainty to grid planners and operators. Due to the changing resource mix and industry composition, the electric grid must now evolve to a new operating structure with advanced functional capabilities; it will now need to manage variable power output, fluctuating and unpredictable load patterns, and bidirectional power flow,a as well as enable novel grid designs. It will also require effective, time-dependent coordination among all participants (utilities, market operators, and emerging players) to ensure the reliable operation of essential and evolving grid functions. The existing electric grid was not designed to handle these new demands and will require significant re-engineering involving advancements in both technology and institutional planning processes. Smart grid technology and strategies for deploying it are essential to address this new, evolving complexity.
What makes the grid “smart” is essentially the application of digital, cyber infrastructure working with the physical system to perform the functions of sensing, communications, control, computing, and data and information management to inform planning and operations.
a The electric grid was originally designed to deliver electricity from centrally located power plants to customers through the electric grid infrastructure. The production of power from customer-owned assets, e.g., from rooftop solar systems, introduces the need to manage bidirectional flow of electricity, which the grid was not originally designed to accommodate.
Department of Energy |January 2022
Smart Grid System Report 2020 | Page iii
It includes the convergence of computing and operations (IT/OT convergenceb) to provide intelligence to human operators and enable autonomous functions where needed. Utilities have deployed digital devices for several decades, but the transition to a more distributed and interactive system will necessitate greater levels of sophistication in the application of smart grid technology.
As the grid evolves, we will need to build out a core cyber-physical, electric platform that will ensure an ability to serve multiple purposes (e.g., resilience, security, efficiency, affordability) while addressing uncertainty with regard to future technological options and changing customer preferences and policies. In addition, we will need to plan for the convergence of the electricity infrastructure with other systems, such as the transportation, building, natural gas, telecommunications, and even social-networking infrastructures.
Even though the Recovery Actc accelerated the use of smart grid technology, we now face a dramatic structural transformation as the trend toward decentralization with greater customer participation combined with increased use of renewable energy will shape future grid designs. These trends are not happening uniformly across the country but in areas where favorable policies exist. The ability to manage the transformation will require technological and institutional solutions and an industry that can organize sufficiently to make them possible. This report provides a look at both technological and institutional trends and related challenges associated with deploying the smart grid. Key findings and recommendations include:
1. The proliferation of a variety of distributed energy resources (DERs),d often not owned by the utility, shifts the operational paradigm from one of control to one of control and coordination.
Coordination is the process that causes or enables a set of decentralized elements to cooperate in solving a common problem, for example, working together to undertake a specific grid operation. As DERs begin to influence how we generate and use electricity, we will need to institute processes that can effectively coordinate grid planning, operations, and market design/implementation not only among utility and nonutility participants but also across federal and state jurisdictions.
b The convergence of information technology (IT) and operations technology (OT). c The American Recovery and Reinvestment Act of 2009. d DERs are resources sited close to customers that can provide all or some of their electric power needs or can be used by the system to either reduce demand (such as improve energy efficiency) or provide supply to satisfy the energy, capacity, or ancillary service needs of the grid. The resources are small in scale, connected to the distribution system, and physically close to the load. Examples of DER types are solar photovoltaic (PV), wind, combined heat and power (CHP), energy storage, demand response (DR), electric vehicles (EVs), microgrids, and energy efficiency (EE).
Department of Energy |January 2022
Smart Grid System Report 2020 | Page iv
A focus on improving coordination is occurring, but is in an early stage, especially among regional system operators and states. Coordination frameworks, however, are needed to delineate the respective roles and responsibilities of all participants within the bulk power, distribution, and customer system domains.
A September 2020 order of the Federal Energy Regulatory Commission (FERC Order 2222), allowing DER aggregators to participate in wholesale markets will require intricate coordination schemes that transverse the transmission-distribution systems boundary. Such coordination will guide observability, communication, and control requirements needed for both normal and contingent circumstances. Effective coordination will involve structural designs that can also permit local and system-wide optimization in real time.
2. Grid modernization is an essential component of an integrated planning process.
38 states and the District of Columbia have completed or are undertaking some form of grid modernization activity that includes the deployment of smart grid technology, DERs, or both. Planning processes at the state level are evolving with regard to incorporating the application of smart grid technology and DERs into more holistic integrated plans; five states now mandate integrated distribution plans (IDPs) and others are following suit. To enhance the robustness of IDPs, DOE has worked with state regulators and utilities over the past several years to institute consistent practices for determining grid modernization strategies that include examining functional and structural requirements needed over time to better inform technology implementation roadmaps. Continued engagement in this area is needed, as are efforts to enable the full integration of planning processes across the bulk power and distribution systems boundary.
3. A whole-systems approach to resilience planning is needed to inform smart grid investments.
Electric utilities typically improve the reliability and resilience of their systems through prudent asset management practices (e.g., assessing and replacing aged or damaged equipment) and protection schemes that can automatically isolate or reroute power flow to reduce equipment damage and minimize outages to customers. Strategic efforts are now required to address, a) vulnerabilities associated with interdependencies between the electric grid and other infrastructures; b) the protection of critical civilian and defense functions; and c) needed improvements in resilience that novel grid configurations, such as microgrids and minigrids, might provide. For example, the analysis of infrastructure interdependencies made possible through the application of DOE’s North American Energy Resilience Model could inform regional strategies to improve resilience.
Department of Energy |January 2022
Smart Grid System Report 2020 | Page v
Developing such resilience strategies will require involving stakeholders, from many levels of government and the private sector, in planning and analytical processes to determine and prioritize options. Strategic resilience planning as a component of an integrated planning process is a new consideration and will require the development of threat-based risk assessment methodology for the electric power industry. The formulation of grid modernization strategies is an outcome of such planning processes and would involve the deployment of smart grid systems to ensure operational requirements related to observability, communications, flexibility, and control.
4. Research and development combined with technology demonstrations focused on system integration are required to enable the transition from legacy to more advanced grid infrastructures.
Utilities are understandably cautious as they test and install new systems that must integrate effectively with legacy infrastructure and perform to meet stringent requirements. Testing, demonstrating, and deploying new systems can take more than 10 years. To effectively advance the application of new technologies needed to ensure grid modernization, more efforts are needed to test and demonstrate the integration of new concepts in realistic environments. Executing the provisions of the Infrastructure Investment and Jobs Act, signed into law on November 15, 2021, will support such efforts. Research, development, and demonstration (RD&D) is needed in the following areas:
• The advancement of solid-state materials and components to improve the performance of power electronics devices needed to control the flow and characteristics of electricity as we become more reliant on renewable and distributed resources.
• The development of novel electrochemical approaches to improve the performance and reduce the cost of energy storage devices while minimizing reliance on scarce or critical materials.
• The development and demonstration of low-cost, multiparametric sensors and supporting platforms that can provide observability of grid assets and the state of the system to support highly dynamic grid operations.
• The implementation of methods to enable the exchange of data using standardized data formats across disparate systems combined with providing technical support to utilities to advance data analytics practices across the industry.
• The advancement of communications networks that are scalable and support multiple functions (e.g., real-time control of DERs and automated feeder switching).
• The demonstration of grid architectures that address operational control, coordination, and scalability issues as the electric grid begins to accommodate
Department of Energy |January 2022
Smart Grid System Report 2020 | Page vi
many more distributed assets and participants with potentially conflicting objectives.
• The development of more powerful grid modeling and simulation tools that use stochastic methods to aid in planning and examining technological options under variable and uncertain circumstances.
• The advancement of technology to prevent, detect, and mitigate the risk of cyber intrusion into electricity system operations.
5. Managing cyber risks is key to enabling the smart grid.
As grid operators increasingly rely on the data from digital devices and third-party systems to make real-time operating decisions, cyber risks are possible through the following pathways:
• Digital devices connected to the enterprise network might have remote access capabilities and often are connected to corporate business networks. With interconnected systems, cyberattacks can migrate from these digital devices to corporate business networks and in the other direction, permitting remote access to intruders.
• Grid-edge devices, such as customer-owned DER, are being integrated with utility and third-party systems. Although this integration is necessary to manage grid complexity, it marks an enormous expansion of the number of entry points for malicious actors.
• Wide-area monitoring and control equipment rely on global positioning system (GPS) clocks for extremely precise timing data. Malicious actors might manipulate GPS signals that could disrupt grid operations.
• Supply chain risks can translate to cybersecurity risks for IT/OT technology due to the global nature of manufacturing. This broad-based sourcing increases the opportunity for malicious code to be introduced into equipment during the manufacturing process that can impair safe and reliable grid operation.
Preventing cyber intrusion will require reducing or eliminating these various forms of entry. Critical infrastructure protection standards used by the bulk-power system (approximately 100 kV and above), including generation and transmission systems, are well established and enforced by the North American Electric Reliability Corporation (NERC) and FERC. Cybersecurity standards and practices, however, are not well established at the distribution system level, where oversight is primarily the responsibility of state-level public utility commissions. Methods for undertaking risk assessments of cyber threats should continue to be advanced, and they should be incorporated more routinely into electric industry planning processes.
Department of Energy |January 2022
Smart Grid System Report 2020 | Page vii
6. Achieving plug-and-play interoperability will remain a challenging and long-term task.
Interoperability is the ability to safely, securely, and effectively exchange and use information among two or more devices and systems. This means the myriad devices and systems deployed on the grid need to function in coordination under, potentially, a wide variety of operational situations.
Achieving true plug-and-play interoperability, that is, having devices work perfectly when first used or connected without significant reconfiguration or adjustment of grid systems, will continue to be a challenging and long-term task. This is due in part to decades of incremental modifications to grid systems, which has resulted in a mixture of protocols the industry uses to communicate and share data. In addition, utilities have typically relied on customized, proprietary solutions provided by technology vendors to build their systems. Significant efforts to develop and institute industry standards continue, so that disparate systems can communicate, and new devices can cooperate within the operational environment of the grid.
Standards development efforts typically have been limited in scope, however, and generally have not addressed whole-system integration. The National Institute of Standards and Technology is now developing a set of interoperability profiles to provide a more holistic view of how devices and systems need to cooperate for given situations. These profiles draw from industry standards to establish a common set of well-defined interoperability requirements that can be verified through testing and certification programs, easing system integration challenges.
Industry is expending significant effort to apply software solutions (e.g., middleware) to enable interoperability between disparate devices and systems. Even so, interoperable systems are nascent. The long-term solution for seamless interoperability could involve building out a standards-based sensor/communication platform that can take advantage of modern networking technology and provide multiple connection points for devices and applications. Such a platform combined with standards and security protocols would permit authorized devices and software to access the platform for data and to communicate with each other in a structured, but flexible environment. Evolving current legacy systems so they can apply a sensor/communication platform is a long-term undertaking that will require significant RD&D and coordination with industry stakeholders. Such a platform would enable future grid capabilities, including knowledge transfer and machine learning among smart devices.
7. The composition of workforce skills needs to evolve to support new grid technologies.
The industry’s approximately 603,000 employees are spread across the three types of utilities—investor-owned utilities (IOUs), public power including municipal utilities, and rural electric cooperatives. Developing a pipeline of qualified and diverse employees to support a more complex electric grid will be essential to the electric sector’s technological transition. After large waves of retirements over the past decade, the rate
Department of Energy |January 2022
Smart Grid System Report 2020 | Page viii
of retirement attrition is stabilizing. The skills required to plan, build, and operate the future grid effectively are changing rapidly, however, due to smart grid technology deployments and the changing grid resource mix. In particular, the pervasive application of digital technology is requiring more highly skilled workers and engineers, particularly:
• System architects • Data scientists (for data management and analytics) • Modeling and simulation experts • IT/OT cybersecurity specialists • Communications engineers • Digital control engineers
As retirements have slowed, nonretirement attrition is emerging as a serious challenge for maintaining a pipeline of a qualified workers. Younger workers in the 23- to 37-year age group have the highest attrition rate (57 percent) due in part to competition with the broader technology industry. Additional efforts in training and education are needed to attract and adapt a smart grid workforce. Recommendations include:
• Augmenting K-12 STEM (science, technology, engineering, and mathematics) education programs that build interest in electrical engineering subjects and emerging energy sector topics, such as electric vehicles, microgrids, and data science.
• Designing university programs in power systems engineering that engage students in real-world applications and provide an additional focus on cutting-edge grid technologies.
• Expanding the availability of continuous education courses that enable active engineering professionals to adapt to rapid industry changes brought about by grid transformation.
• Hiring and retaining workers with knowledge of digital technologies.
The electric grid is considered as an ultra-large-scale system, much like natural ecosystems and cities, in that it is faced with a) inherently conflicting and diverse requirements; b) decentralized data, development, and control; c) continuous evolution and deployment; d) heterogeneous, inconsistent, and changing elements; and e) normal failures. This complexity is becoming more pronounced as consumers shift from being users of the grid to becoming elements of it, along with technology providers offering grid services that utilities traditionally supply.
In addition, we must consider the role of the electric grid, within a larger societal context, in achieving environmental sustainability, economic efficiency, and the delivery of equitable benefits across diverse populations (e.g., disadvantaged communities). The President’s Executive Order 14008 highlights the need to address global climate change and equity in tandem through a coordinated, yet just, effort to decarbonize our energy system. As we undergo a clean energy transition, it will be important to ensure equitable access to
Department of Energy |January 2022
Smart Grid System Report 2020 | Page ix
infrastructure, services, and associated benefits and opportunities as the electric grid evolves to address the climate change challenge.
The challenges we face are both technological and institutional in nature. We need to advance technological capabilities and help decision makers with methods and tools so they can craft grid modernization strategies that deploy them in practical ways to meet future demands. This effort will require instituting the appropriate technology, processes, and design considerations to maintain a stable, coherent, and manageable grid system as it evolves, and to do so in a way that addresses the increased level of complexity and uncertainty presented by continual technological advancement, policy shifts, and changing customer preferences. In the end, such strategies need to consider reliability, efficiency, security, resilience, affordability, and energy justice as outcomes.
Department of Energy |January 2022
Smart Grid System Report 2020 | Page x
SMART GRID SYSTEM REPORT 2020
Table of Contents Executive Summary ..................................................................................................... ii
I. Legislative Mandate ........................................................................................... 1
II. What Is the Smart Grid? .................................................................................... 3
A. Evolution to Digital Sensing and Control ................................................................................... 5
III. Factors Shaping Smart Grid Deployments ............................................... 13
A. Technology Availability ................................................................................................................. 13
B. Federal and State Policies ............................................................................................................. 18
C. New Participants and Evolving Business Models ................................................................ 24
D. Convergence ....................................................................................................................................... 28
E. Resilience ............................................................................................................................................ 29
F. Implications for Grid Modernization ........................................................................................ 31
IV. Investments and Technology Applications .............................................. 36
A. The Transmission System ............................................................................................................. 38
B. The Distribution System ................................................................................................................ 48
C. Customer Systems............................................................................................................................ 59
V. Challenges ........................................................................................................... 76
A. Coordination ...................................................................................................................................... 77
B. Integrated Planning ......................................................................................................................... 81
C. Energy Justice .................................................................................................................................... 86
D. Research, Development, and Demonstration Needs .......................................................... 87
E. Interoperability ............................................................................................................................... 106
F. Cybersecurity ................................................................................................................................... 118
G. Workforce ......................................................................................................................................... 122
VI. Conclusion ........................................................................................................ 135
VII. Appendices ...................................................................................................... 137

Department of Energy |January 2022
Smart Grid System Report 2020 | Page xi
A. Factors Shaping Smart Grid Deployments (Section III) .................................................. 137
B. Investments and Technology Applications (Section IV) ................................................. 137
C. Challenges (Section V) .................................................................................................................. 140
Department of Energy |January 2022
Smart Grid System Report 2020 | Page 1
I. Legislative Mandate The U.S. Department of Energy (DOE) Office of Electricity prepared this Smart Grid System Report as required by Title XIII, Section 1302, of the Energy Infrastructure and Security Act of 2007 (EISA) (Public Law 110-140, 42 U.S.C. 17382).e The EISA directs DOE to submit a biennial report to the U.S. Congress:
“…concerning the status of smart grid deployments nationwide and any regulatory or government barriers to continued deployment. [In addition] the report shall provide the current status and prospects of smart grid development, including information on technology penetration, communications network capabilities, costs, and obstacles. It may include recommendations for State and Federal policies or actions helpful to facilitate the transition to a smart grid.”
Title XIII, entitled “Smart Grid,” states that the policy of the United States is to support the modernization of the Nation’s electricity transmission and distribution system to maintain a reliable and secure electricity infrastructure that can meet future demand growth and to achieve the following:
• Increased use of digital information and controls technology to improve reliability, security, and efficiency of the electric grid.
• Dynamic optimization of grid operations and resources, with full cybersecurity. • Deployment and integration of distributed resources and generation, including
renewable resources. • Development and incorporation of demand response, demand-side resources, and
energy-efficiency resources. • Deployment of “smart” technologies (real-time, automated, interactive technologies
that optimize the physical operation of appliances and consumer devices) for metering, communications concerning grid operations and status, and distribution automation.
• Integration of “smart” appliances and consumer devices. • Deployment and integration of advanced electricity storage and peak-shaving
technologies, including plug-in electric and hybrid electric vehicles, and thermal-storage air conditioning.
• Provision to consumers of timely information and control options. • Development of standards for communication and interoperability of appliances and
equipment connected to the electric grid, including the infrastructure serving the grid. • Identification and lowering of unreasonable or unnecessary barriers to adoption of
smart grid technologies, practices, and services.
e Title XIII resides within Sections 1301–1309 of EISA. Energy Independence and Security Act of 2007, Pub. L. No. 110-140, 121 Stat. 1492 (2007), https://www.energy.gov/oe/downloads/title-xiii-smart-grid-sec-1301-1308-statement-policy-modernization-electricity-grid.
Department of Energy |January 2022
Smart Grid System Report 2020 | Page 2
DOE has continued to work closely with the electric grid industry, including policymakers, regulators, and utilities, to better understand and address both technological and institutional issues related to the advancement of smart grid technology in the context of grid modernization. In addition, we have sought input in shaping the report from the DOE Electricity Advisory Committee and staff from other federal agencies in the Federal Smart Grid Task Force, including the U.S. Department of Homeland Security, the Federal Energy Regulatory Commission (FERC), and the National Institute of Standards and Technology (NIST).
Worth noting is that multiple factors affect the adoption of smart grid technology including, a) the availability of technology, that is, the combination of favorable prices and commercial service; b) policy drivers, often specific to states or regions, that create incentives or mandates; and c) the need of utilities or regional operators to deploy more advanced grid capabilities. As a result, smart grid technology is not being deployed uniformly across the country, but rather in areas where such investments seem warranted. Nevertheless, a complex set of emerging factors will require more intelligent and responsive electrical systems.
This report discusses these factors and presents challenges affecting the implementation of the smart grid. The report is subdivided, as follows:
• II. What Is the Smart Grid – the evolution toward a cyber and physical technology platform to perform the functions of sensing, communication, control, computing, and data/information management to inform grid planning and operations.
• III. Factors Shaping Smart Grid Deployment – tightly interconnected forces across technology, market, and policy areas collectively driving grid transformation, imposing requirements for advanced functional capabilities, and ultimately shaping how utilities and regulators determine the ways to apply smart grid technology.
• IV. Investments and Technology Applications – smart grid investment levels and uses of technology in the context of transmission, distribution, and customer electric and cyber systems.
• V. Challenges – advancements needed in grid coordination, planning, and technology, along with research, development, and demonstration (RD&D), standards, cybersecurity, and workforce efforts necessary to support a more complex and dynamic grid.
• VI. Conclusion.
• VII. Appendices – supporting information.
Department of Energy |January 2022
Smart Grid System Report 2020 | Page 3
II. What Is the Smart Grid? The North American power grid is a vast and complex machine with 1.2 million megawatts (MW) of electricity generating capacity1 that delivers electricity to 330 million people2 across nearly 600,000 circuit miles of transmission lines and 5.5 million miles of distribution lines.3 Power flow, the frequency of alternating current, and voltage levels are continuously maintained and adjusted in precise ways across the grid. Managing the generation and delivery of electricity involves thousands of organizations, including 77 balancing authorities,4 seven independent system operators / regional transmission organizations (ISOs/RTOs),5,f four federal power marketing organizations,6 and over 2,786 distribution utilities7 regulated by various entities [the Federal Energy Regulatory Committee (FERC), state public utility commissions, and local boards]. The power grid continues to evolve in response to new demands and requirements.
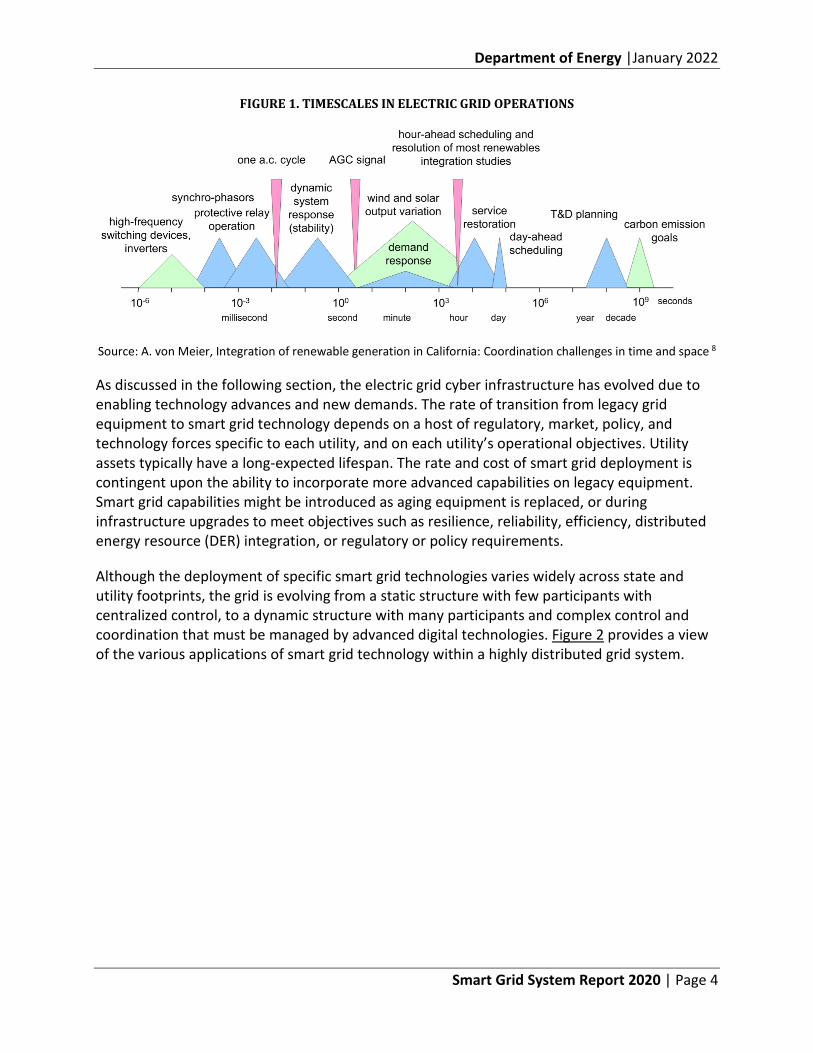
One aspect of the grid that makes it “smart” is the cyber infrastructure that works with the physical system to perform the functions of sensing, communication, control, computing, and data/information management. Another key aspect is the intelligence it can provide to human planners and operators for undertaking immediate and long-term management decisions. Sometimes, the operations must occur in such short timescales they are performed automatically (machine-to-machine). Figure 1 provides a reference for the temporal granularity needed for grid operations and planning.
f Utilities formed ISOs/RTOs to coordinate, control, and monitor the operation of the interstate grid for regions of the United States.
What is being sensed or controlled on the grid?
While smart grid technology can be complex, the physical phenomena it measures or controls are largely limited to voltage, current, and frequency. Digital devices sense and process the relationships and properties of each electrical parameter to increase situational awareness for grid operators or to initiate automated control actions that regulate system voltage, reconfigure circuits, or interrupt power when a problem occurs.
Department of Energy |January 2022
Smart Grid System Report 2020 | Page 4
FIGURE 1. TIMESCALES IN ELECTRIC GRID OPERATIONS
Source: A. von Meier, Integration of renewable generation in California: Coordination challenges in time and space 8
As discussed in the following section, the electric grid cyber infrastructure has evolved due to enabling technology advances and new demands. The rate of transition from legacy grid equipment to smart grid technology depends on a host of regulatory, market, policy, and technology forces specific to each utility, and on each utility’s operational objectives. Utility assets typically have a long-expected lifespan. The rate and cost of smart grid deployment is contingent upon the ability to incorporate more advanced capabilities on legacy equipment. Smart grid capabilities might be introduced as aging equipment is replaced, or during infrastructure upgrades to meet objectives such as resilience, reliability, efficiency, distributed energy resource (DER) integration, or regulatory or policy requirements.
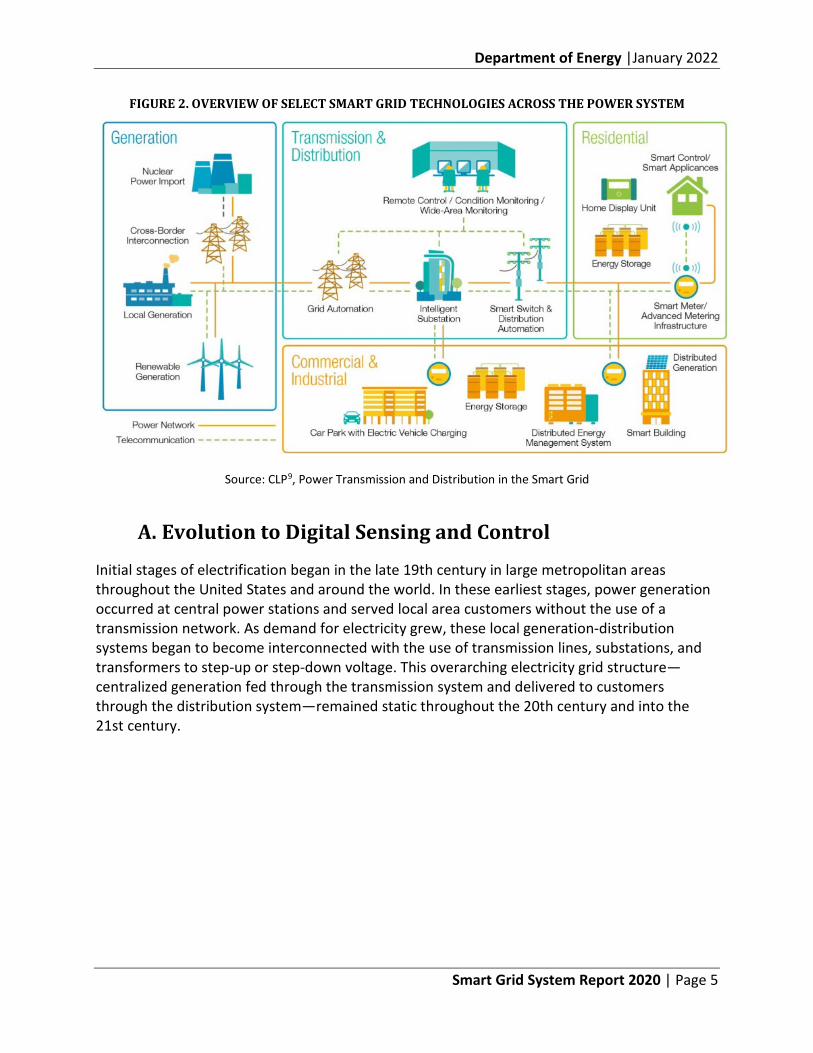
Although the deployment of specific smart grid technologies varies widely across state and utility footprints, the grid is evolving from a static structure with few participants with centralized control, to a dynamic structure with many participants and complex control and coordination that must be managed by advanced digital technologies. Figure 2 provides a view of the various applications of smart grid technology within a highly distributed grid system.
Department of Energy |January 2022
Smart Grid System Report 2020 | Page 5
FIGURE 2. OVERVIEW OF SELECT SMART GRID TECHNOLOGIES ACROSS THE POWER SYSTEM
Source: CLP9, Power Transmission and Distribution in the Smart Grid
A. Evolution to Digital Sensing and Control
Initial stages of electrification began in the late 19th century in large metropolitan areas throughout the United States and around the world. In these earliest stages, power generation occurred at central power stations and served local area customers without the use of a transmission network. As demand for electricity grew, these local generation-distribution systems began to become interconnected with the use of transmission lines, substations, and transformers to step-up or step-down voltage. This overarching electricity grid structure—centralized generation fed through the transmission system and delivered to customers through the distribution system—remained static throughout the 20th century and into the 21st century.
Department of Energy |January 2022
Smart Grid System Report 2020 | Page 6
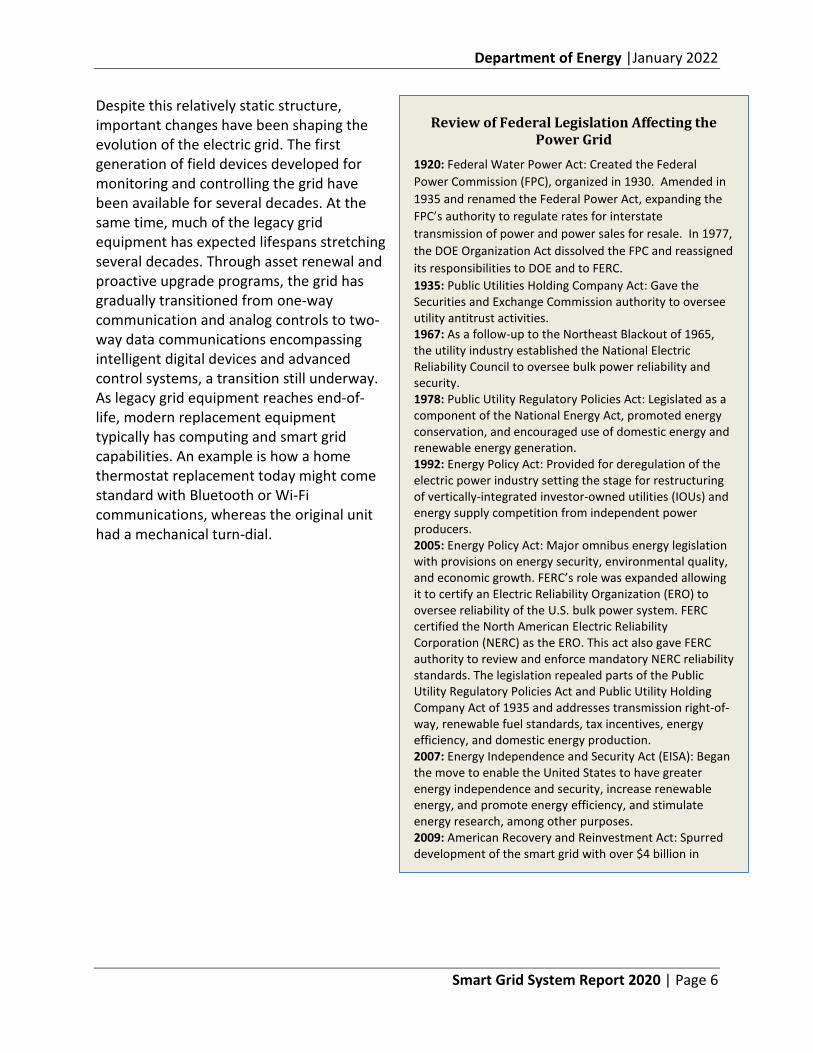
Despite this relatively static structure, important changes have been shaping the evolution of the electric grid. The first generation of field devices developed for monitoring and controlling the grid have been available for several decades. At the same time, much of the legacy grid equipment has expected lifespans stretching several decades. Through asset renewal and proactive upgrade programs, the grid has gradually transitioned from one-way communication and analog controls to two-way data communications encompassing intelligent digital devices and advanced control systems, a transition still underway. As legacy grid equipment reaches end-of-life, modern replacement equipment typically has computing and smart grid capabilities. An example is how a home thermostat replacement today might come standard with Bluetooth or Wi-Fi communications, whereas the original unit had a mechanical turn-dial.
Review of Federal Legislation Affecting the Power Grid
1920: Federal Water Power Act: Created the Federal Power Commission (FPC), organized in 1930. Amended in 1935 and renamed the Federal Power Act, expanding the FPC’s authority to regulate rates for interstate transmission of power and power sales for resale. In 1977, the DOE Organization Act dissolved the FPC and reassigned its responsibilities to DOE and to FERC. 1935: Public Utilities Holding Company Act: Gave the Securities and Exchange Commission authority to oversee utility antitrust activities. 1967: As a follow-up to the Northeast Blackout of 1965, the utility industry established the National Electric Reliability Council to oversee bulk power reliability and security. 1978: Public Utility Regulatory Policies Act: Legislated as a component of the National Energy Act, promoted energy conservation, and encouraged use of domestic energy and renewable energy generation. 1992: Energy Policy Act: Provided for deregulation of the electric power industry setting the stage for restructuring of vertically-integrated investor-owned utilities (IOUs) and energy supply competition from independent power producers. 2005: Energy Policy Act: Major omnibus energy legislation with provisions on energy security, environmental quality, and economic growth. FERC’s role was expanded allowing it to certify an Electric Reliability Organization (ERO) to oversee reliability of the U.S. bulk power system. FERC certified the North American Electric Reliability Corporation (NERC) as the ERO. This act also gave FERC authority to review and enforce mandatory NERC reliability standards. The legislation repealed parts of the Public Utility Regulatory Policies Act and Public Utility Holding Company Act of 1935 and addresses transmission right-of-way, renewable fuel standards, tax incentives, energy efficiency, and domestic energy production. 2007: Energy Independence and Security Act (EISA): Began the move to enable the United States to have greater energy independence and security, increase renewable energy, and promote energy efficiency, and stimulate energy research, among other purposes. 2009: American Recovery and Reinvestment Act: Spurred development of the smart grid with over $4 billion in
Department of Energy |January 2022
Smart Grid System Report 2020 | Page 7
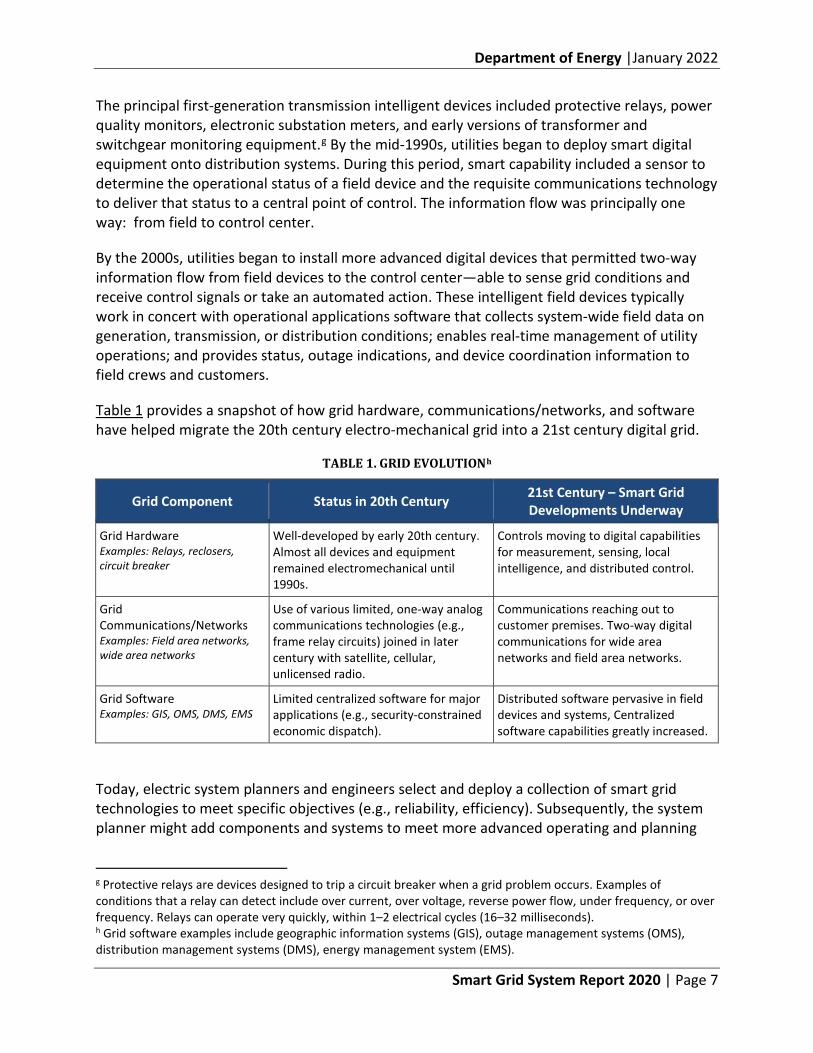
The principal first-generation transmission intelligent devices included protective relays, power quality monitors, electronic substation meters, and early versions of transformer and switchgear monitoring equipment.g By the mid-1990s, utilities began to deploy smart digital equipment onto distribution systems. During this period, smart capability included a sensor to determine the operational status of a field device and the requisite communications technology to deliver that status to a central point of control. The information flow was principally one way: from field to control center.
By the 2000s, utilities began to install more advanced digital devices that permitted two-way information flow from field devices to the control center—able to sense grid conditions and receive control signals or take an automated action. These intelligent field devices typically work in concert with operational applications software that collects system-wide field data on generation, transmission, or distribution conditions; enables real-time management of utility operations; and provides status, outage indications, and device coordination information to field crews and customers.
Table 1 provides a snapshot of how grid hardware, communications/networks, and software have helped migrate the 20th century electro-mechanical grid into a 21st century digital grid.
TABLE 1. GRID EVOLUTIONh
Grid Component Status in 20th Century 21st Century – Smart Grid Developments Underway
Grid Hardware Examples: Relays, reclosers, circuit breaker
Well-developed by early 20th century. Almost all devices and equipment remained electromechanical until 1990s.
Controls moving to digital capabilities for measurement, sensing, local intelligence, and distributed control.
Grid Communications/Networks Examples: Field area networks, wide area networks
Use of various limited, one-way analog communications technologies (e.g., frame relay circuits) joined in later century with satellite, cellular, unlicensed radio.
Communications reaching out to customer premises. Two-way digital communications for wide area networks and field area networks.
Grid Software Examples: GIS, OMS, DMS, EMS
Limited centralized software for major applications (e.g., security-constrained economic dispatch).
Distributed software pervasive in field devices and systems, Centralized software capabilities greatly increased.
Today, electric system planners and engineers select and deploy a collection of smart grid technologies to meet specific objectives (e.g., reliability, efficiency). Subsequently, the system planner might add components and systems to meet more advanced operating and planning
g Protective relays are devices designed to trip a circuit breaker when a grid problem occurs. Examples of conditions that a relay can detect include over current, over voltage, reverse power flow, under frequency, or over frequency. Relays can operate very quickly, within 1–2 electrical cycles (16–32 milliseconds). h Grid software examples include geographic information systems (GIS), outage management systems (OMS), distribution management systems (DMS), energy management system (EMS).
Department of Energy |January 2022
Smart Grid System Report 2020 | Page 8
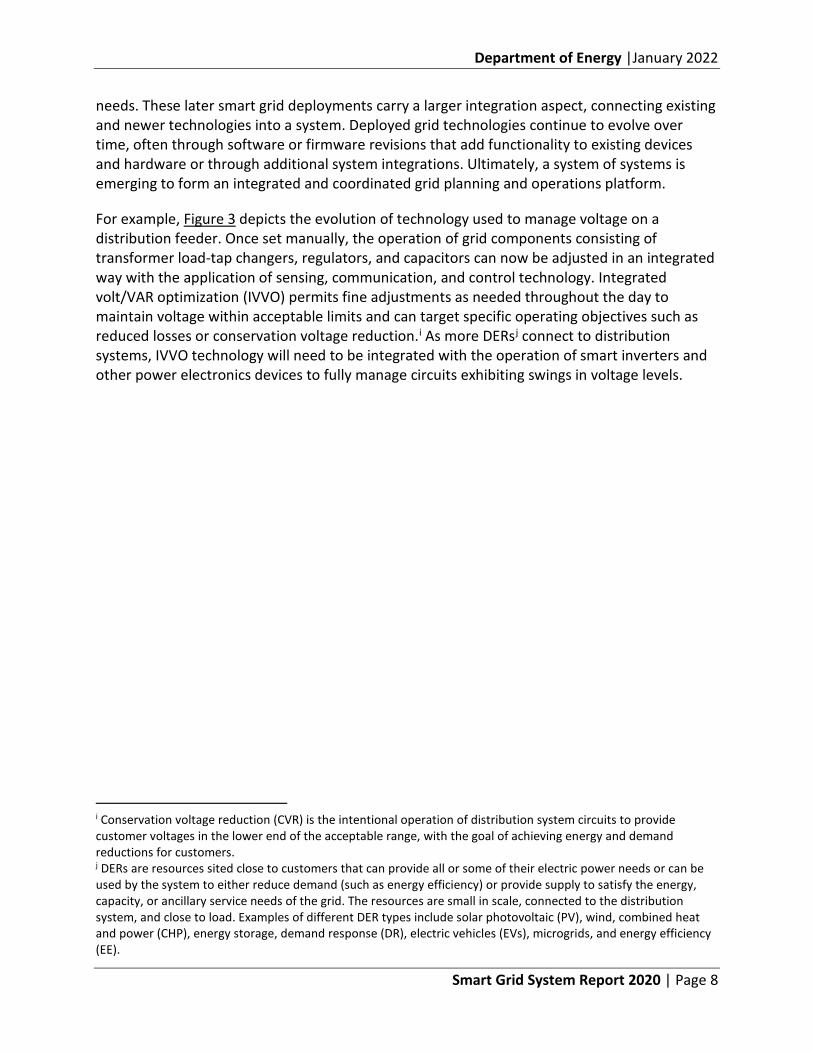
needs. These later smart grid deployments carry a larger integration aspect, connecting existing and newer technologies into a system. Deployed grid technologies continue to evolve over time, often through software or firmware revisions that add functionality to existing devices and hardware or through additional system integrations. Ultimately, a system of systems is emerging to form an integrated and coordinated grid planning and operations platform.
For example, Figure 3 depicts the evolution of technology used to manage voltage on a distribution feeder. Once set manually, the operation of grid components consisting of transformer load-tap changers, regulators, and capacitors can now be adjusted in an integrated way with the application of sensing, communication, and control technology. Integrated volt/VAR optimization (IVVO) permits fine adjustments as needed throughout the day to maintain voltage within acceptable limits and can target specific operating objectives such as reduced losses or conservation voltage reduction.i As more DERsj connect to distribution systems, IVVO technology will need to be integrated with the operation of smart inverters and other power electronics devices to fully manage circuits exhibiting swings in voltage levels.
i Conservation voltage reduction (CVR) is the intentional operation of distribution system circuits to provide customer voltages in the lower end of the acceptable range, with the goal of achieving energy and demand reductions for customers. j DERs are resources sited close to customers that can provide all or some of their electric power needs or can be used by the system to either reduce demand (such as energy efficiency) or provide supply to satisfy the energy, capacity, or ancillary service needs of the grid. The resources are small in scale, connected to the distribution system, and close to load. Examples of different DER types include solar photovoltaic (PV), wind, combined heat and power (CHP), energy storage, demand response (DR), electric vehicles (EVs), microgrids, and energy efficiency (EE).
Department of Energy |January 2022
Smart Grid System Report 2020 | Page 9
FIGURE 3. AN EXAMPLE OF EVOLUTION OF INTEGRATED VOLT/VAR OPTIMIZATION
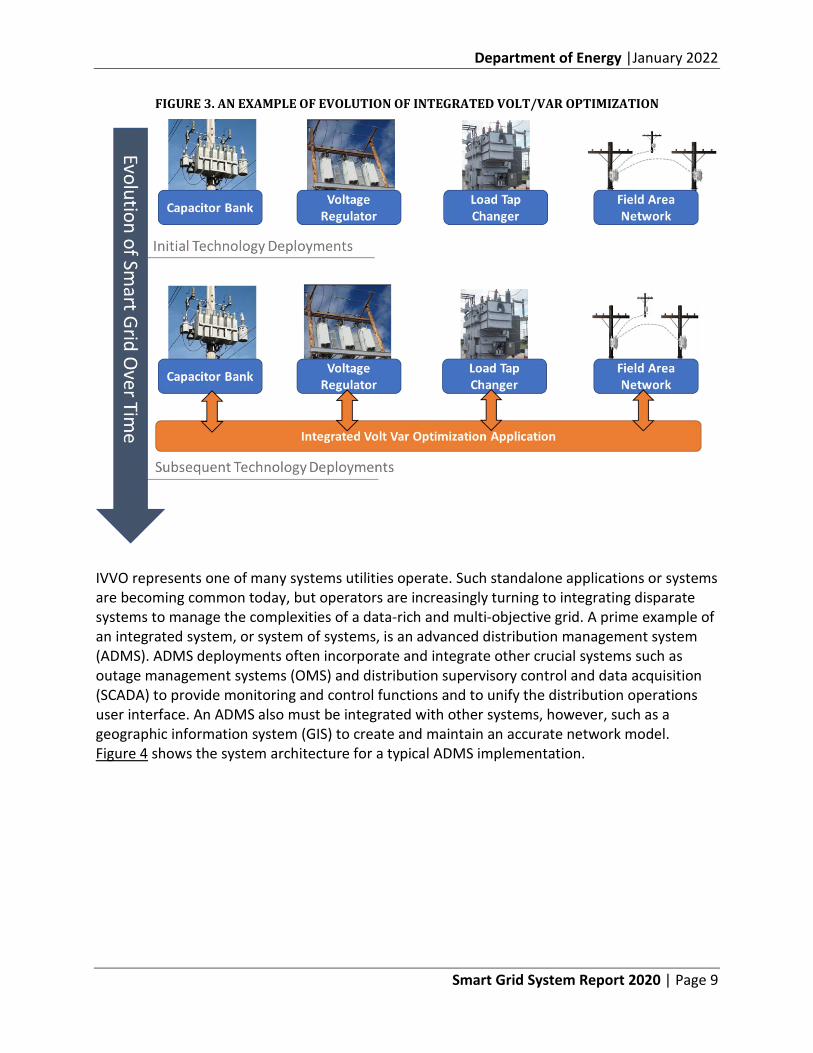
IVVO represents one of many systems utilities operate. Such standalone applications or systems are becoming common today, but operators are increasingly turning to integrating disparate systems to manage the complexities of a data-rich and multi-objective grid. A prime example of an integrated system, or system of systems, is an advanced distribution management system (ADMS). ADMS deployments often incorporate and integrate other crucial systems such as outage management systems (OMS) and distribution supervisory control and data acquisition (SCADA) to provide monitoring and control functions and to unify the distribution operations user interface. An ADMS also must be integrated with other systems, however, such as a geographic information system (GIS) to create and maintain an accurate network model. Figure 4 shows the system architecture for a typical ADMS implementation.
Department of Energy |January 2022
Smart Grid System Report 2020 | Page 10
FIGURE 4. INTEGRATION OF SYSTEMS INVOLVED IN AN ADMS IMPLEMENTATION10
Source: Schneider Electric, How the Convergence of IT and OT Enables Smart Grid Deployment
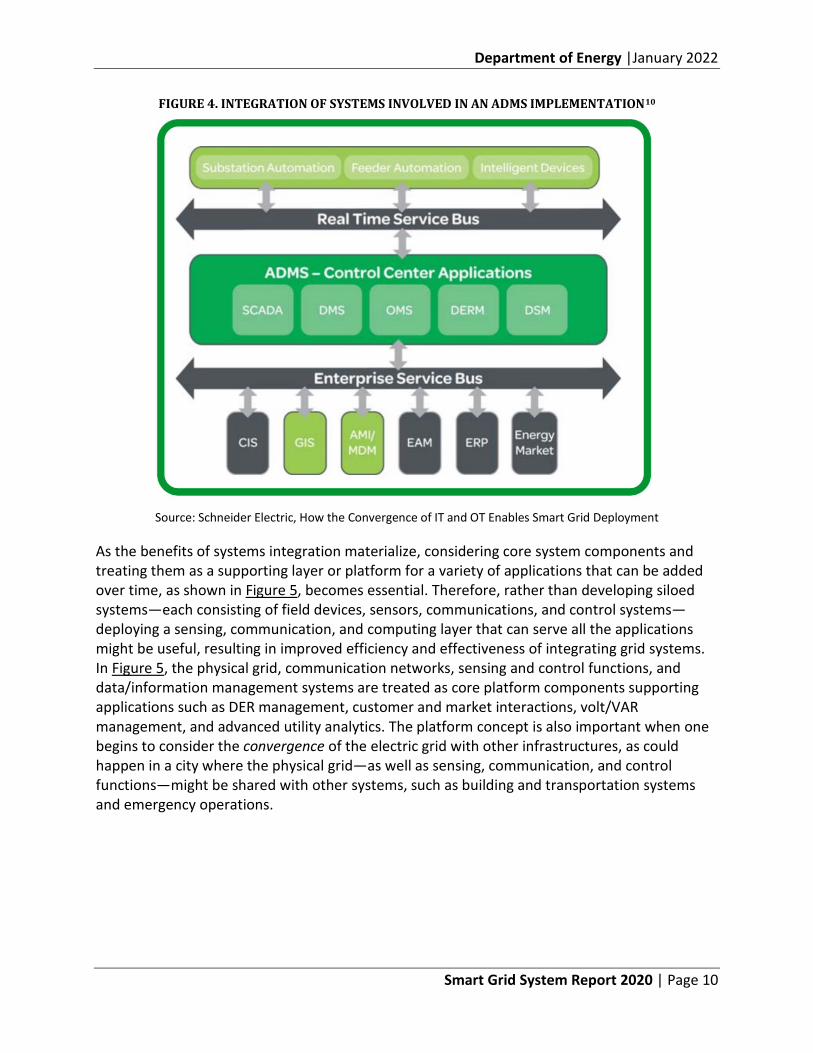
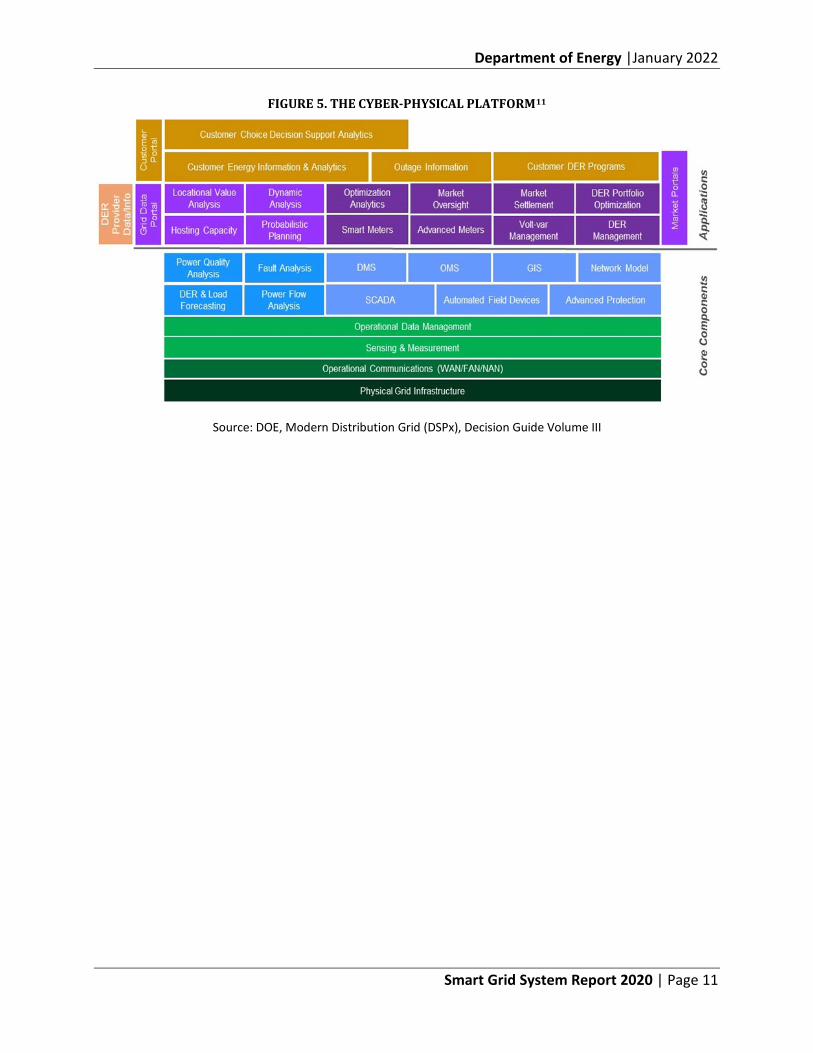
As the benefits of systems integration materialize, considering core system components and treating them as a supporting layer or platform for a variety of applications that can be added over time, as shown in Figure 5, becomes essential. Therefore, rather than developing siloed systems—each consisting of field devices, sensors, communications, and control systems— deploying a sensing, communication, and computing layer that can serve all the applications might be useful, resulting in improved efficiency and effectiveness of integrating grid systems. In Figure 5, the physical grid, communication networks, sensing and control functions, and data/information management systems are treated as core platform components supporting applications such as DER management, customer and market interactions, volt/VAR management, and advanced utility analytics. The platform concept is also important when one begins to consider the convergence of the electric grid with other infrastructures, as could happen in a city where the physical grid—as well as sensing, communication, and control functions—might be shared with other systems, such as building and transportation systems and emergency operations.
Department of Energy |January 2022
Smart Grid System Report 2020 | Page 11
FIGURE 5. THE CYBER-PHYSICAL PLATFORM11
Source: DOE, Modern Distribution Grid (DSPx), Decision Guide Volume III
Department of Energy |January 2022
Smart Grid System Report 2020 | Page 12
Section Endnotes
1 American Public Power Association, America’s Electricity Generation Capacity 2020 Update, March 2020, https://www.publicpower.org/system/files/documents/Americas-Electricity-Generation-Capacity-2020.pdf. 2 United States Census Bureau, U.S. and World Population Clock, September 10, 2020. https://www.census.gov/popclock/. 3 Marston, Theodore U., The US Power System Infrastructure and Its Vulnerabilities, National Academy of Engineering, June 15, 2018, https://www.nae.edu/183133/The-US-Electric-Power-System-Infrastructure-and-Its-Vulnerabilities#:~:text=The%20US%20electricity%20supply%20system%20has%20more%20than%20600%2C000%20circuit,%3E230%20kilovolts%2C%20kV). 4 U.S. Energy Information Administration, 2019 Annual Electric Power Industry Report, Form EIA-861, Balancing Authority, July 30, 2020, https://www.eia.gov/electricity/data/eia861/. 5 FERC, RTOs, and ISOs, https://www.ferc.gov/industries-data/electric/power-sales-and-markets/rtos-and-isos. 6 U.S. DOE, Office of Enterprise Assessments, Power Marketing Administrations, https://www.energy.gov/ea/power-marketing-administrations. 7U.S. Energy Information Administration, 2019 Annual Electric Power Industry Report, Form EIA-861, Sales to Ultimate Customers, July 30, 2020. https://www.eia.gov/electricity/data/eia861/. 8 Alexandra von Meier, University of California, Berkeley, Integration of renewable generation in California: Coordination challenges in time and space, October 2011, https://www.researchgate.net/publication/228854029_Integration_of_renewable_generation_in_California_Coordination_challenges_in_time_and_space. 9 CLP, Power Transmission and Distribution in the Smart Grid, https://www.clp.com.hk/ en/about-clp/power-transmission-and-distribution/smart-grid. 10 Schneider Electric, How the Convergence of IT and OT Enables Smart Grid Deployment, http://cdn.iotwf.com/resources/10/How-the-Convergence-of-IT-and-OT-Enables-Smart-Grid-Development_2013.pdf. 11 Modern Distribution Grid, Decision Guide, Volume III, developed for the Office of Electricity, US Department of Energy, PNNL, June 28, 2017, https://gridarchitecture.pnnl.gov/media/Modern-Distribution-Grid-Volume-III.pdf.
Department of Energy |January 2022
Smart Grid System Report 2020 | Page 13
III. Factors Shaping Smart Grid Deployments The electric grid has experienced technological and institutional evolution throughout its history. Currently, however, we are facing a dramatic structural transformation. Five tightly interconnected forces are collectively driving grid transformation, imposing requirements for advanced functional capabilities, and ultimately shaping how utilities and regulators determine the ways to apply smart grid technology. The five forces are:
• The advancement of technology in three important areas: a) smart grid applications related to improving utility operational capabilities; b) progress made in the advancement of renewable and distributed energy resource technologies and their use by utilities, customers, and third-party merchantsk; and c) the electrification of consumer products, such as electric vehicles and heat pumps.
• Federal, state, and local policies, including the design of markets, that encourage the use of renewable and distributed energy resources and foster energy management options for customers.
• The emergence of new participants, such as utility customers, energy services companies, and technology merchants, in the management and generation of electricity and as providers of grid services.
• The convergence of the electric grid with other systems, such as the natural gas, transportation, and building infrastructures.
• Increasing concerns regarding the security and resilience of the electric grid that require implementing preventive and mitigative strategies, including considerations of alternative grid configurations (e.g., microgrids), to address cyber and physical threats.
A. Technology Availability
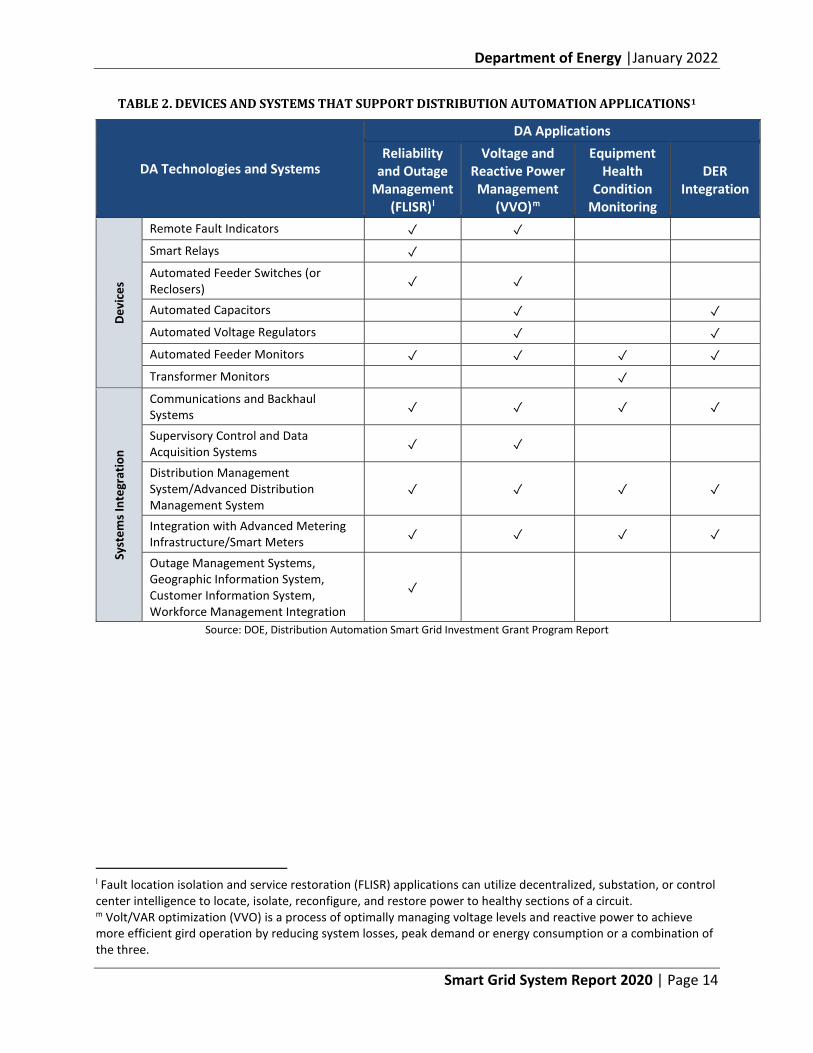
Technology is at the heart of enabling the smart grid. The availability of new smart grid technologies has increased in recent years in the United States, spanning from distribution automation devices and components to advanced computing and control systems. These technologies provide numerous benefits to utilities enabling them to enhance current practices and establish new capabilities, as needed, to improve grid reliability and to support the integration and utilization of distributed energy resources (DERs). Table 2 provides a look at the devices and systems applied to the automation of distribution utility operations.
k This group consists of commercial firms that provide technology and services to utility customers, DER aggregators, and firms that own resources that provide electricity to utilities or customers.
Department of Energy |January 2022
Smart Grid System Report 2020 | Page 14
TABLE 2. DEVICES AND SYSTEMS THAT SUPPORT DISTRIBUTION AUTOMATION APPLICATIONS1
DA Technologies and Systems
DA Applications Reliability
and Outage Management
(FLISR)l
Voltage and Reactive Power Management
(VVO)m
Equipment Health
Condition Monitoring
DER Integration
Devi
ces
Remote Fault Indicators ✓ ✓
Smart Relays ✓
Automated Feeder Switches (or Reclosers) ✓ ✓
Automated Capacitors ✓ ✓ Automated Voltage Regulators ✓ ✓ Automated Feeder Monitors ✓ ✓ ✓ ✓ Transformer Monitors ✓
Syst
ems I
nteg
ratio
n
Communications and Backhaul Systems ✓ ✓ ✓ ✓
Supervisory Control and Data Acquisition Systems ✓ ✓
Distribution Management System/Advanced Distribution Management System
✓ ✓ ✓ ✓
Integration with Advanced Metering Infrastructure/Smart Meters ✓ ✓ ✓ ✓
Outage Management Systems, Geographic Information System, Customer Information System, Workforce Management Integration
✓
Source: DOE, Distribution Automation Smart Grid Investment Grant Program Report
l Fault location isolation and service restoration (FLISR) applications can utilize decentralized, substation, or control center intelligence to locate, isolate, reconfigure, and restore power to healthy sections of a circuit. m Volt/VAR optimization (VVO) is a process of optimally managing voltage levels and reactive power to achieve more efficient gird operation by reducing system losses, peak demand or energy consumption or a combination of the three.
Department of Energy |January 2022
Smart Grid System Report 2020 | Page 15
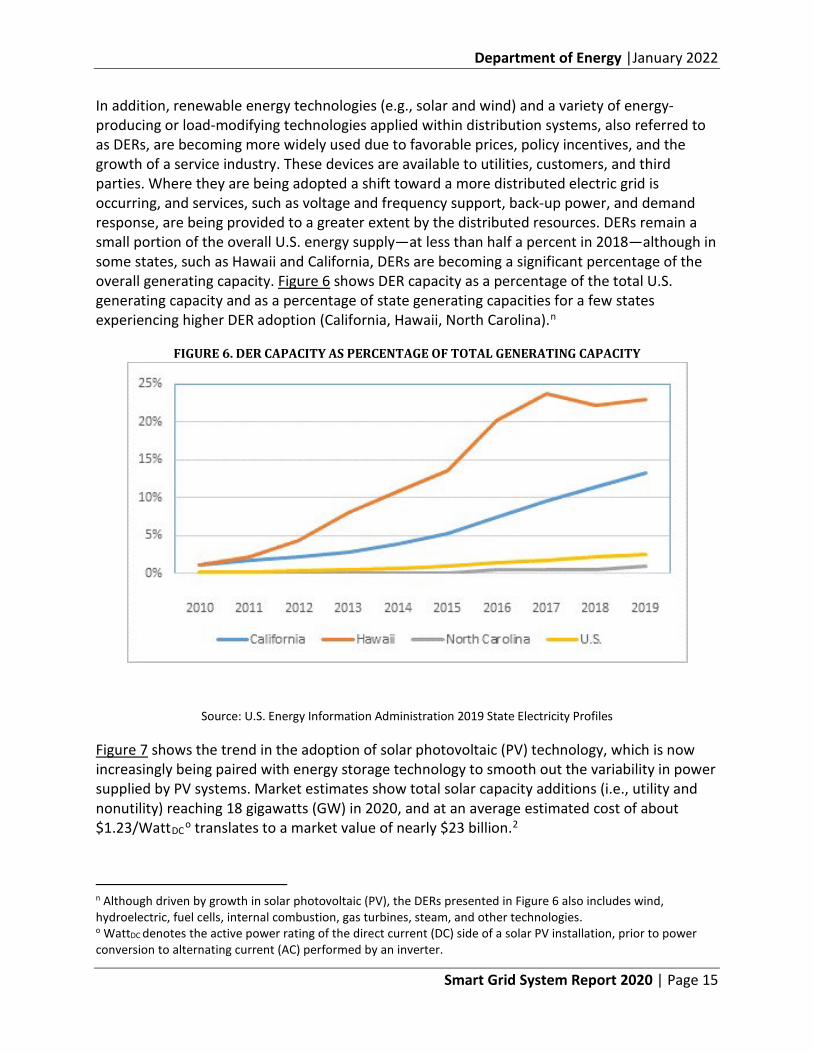
In addition, renewable energy technologies (e.g., solar and wind) and a variety of energy-producing or load-modifying technologies applied within distribution systems, also referred to as DERs, are becoming more widely used due to favorable prices, policy incentives, and the growth of a service industry. These devices are available to utilities, customers, and third parties. Where they are being adopted a shift toward a more distributed electric grid is occurring, and services, such as voltage and frequency support, back-up power, and demand response, are being provided to a greater extent by the distributed resources. DERs remain a small portion of the overall U.S. energy supply—at less than half a percent in 2018—although in some states, such as Hawaii and California, DERs are becoming a significant percentage of the overall generating capacity. Figure 6 shows DER capacity as a percentage of the total U.S. generating capacity and as a percentage of state generating capacities for a few states experiencing higher DER adoption (California, Hawaii, North Carolina).n
FIGURE 6. DER CAPACITY AS PERCENTAGE OF TOTAL GENERATING CAPACITY
Source: U.S. Energy Information Administration 2019 State Electricity Profiles
Figure 7 shows the trend in the adoption of solar photovoltaic (PV) technology, which is now increasingly being paired with energy storage technology to smooth out the variability in power supplied by PV systems. Market estimates show total solar capacity additions (i.e., utility and nonutility) reaching 18 gigawatts (GW) in 2020, and at an average estimated cost of about $1.23/WattDC o translates to a market value of nearly $23 billion.2
n Although driven by growth in solar photovoltaic (PV), the DERs presented in Figure 6 also includes wind, hydroelectric, fuel cells, internal combustion, gas turbines, steam, and other technologies. o WattDC denotes the active power rating of the direct current (DC) side of a solar PV installation, prior to power conversion to alternating current (AC) performed by an inverter.
Department of Energy |January 2022
Smart Grid System Report 2020 | Page 16
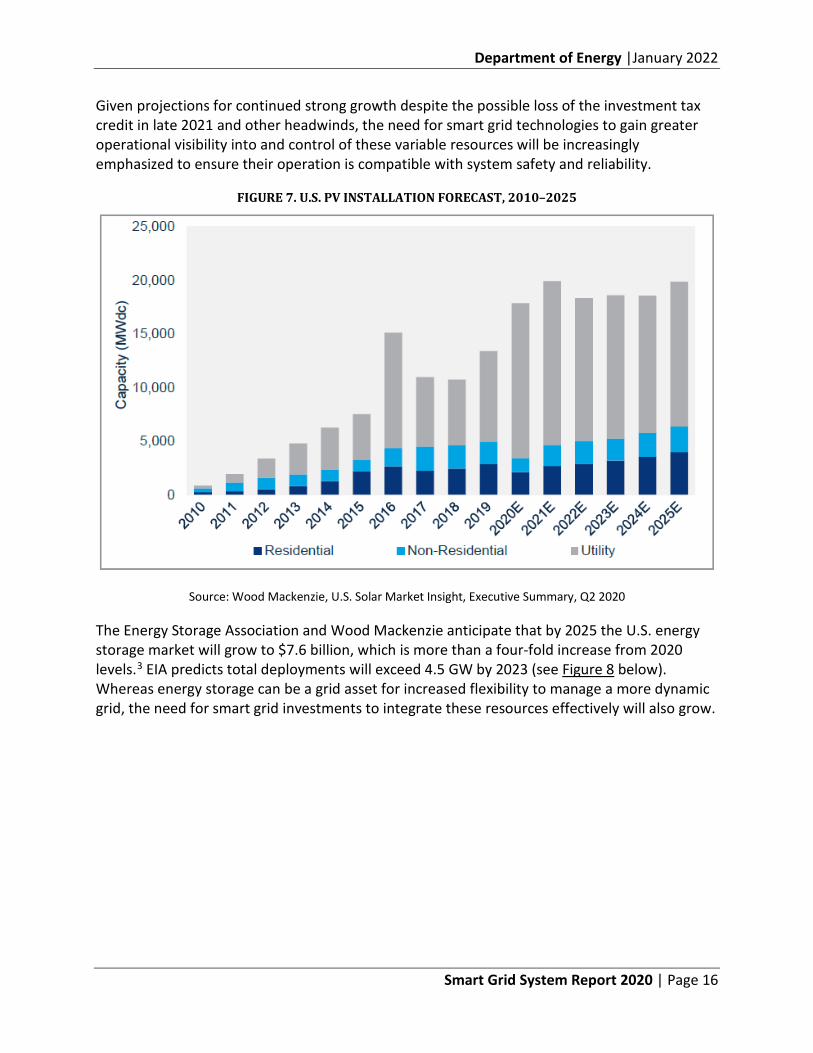
Given projections for continued strong growth despite the possible loss of the investment tax credit in late 2021 and other headwinds, the need for smart grid technologies to gain greater operational visibility into and control of these variable resources will be increasingly emphasized to ensure their operation is compatible with system safety and reliability.
FIGURE 7. U.S. PV INSTALLATION FORECAST, 2010–2025
Source: Wood Mackenzie, U.S. Solar Market Insight, Executive Summary, Q2 2020
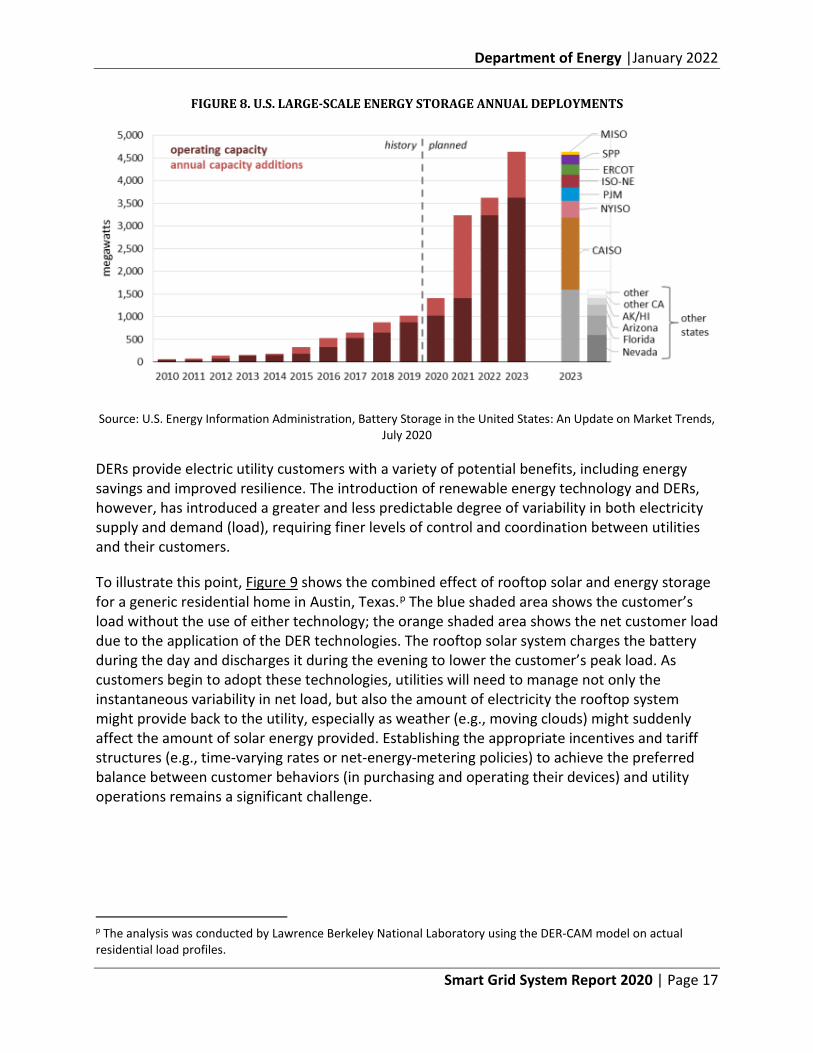
The Energy Storage Association and Wood Mackenzie anticipate that by 2025 the U.S. energy storage market will grow to $7.6 billion, which is more than a four-fold increase from 2020 levels.3 EIA predicts total deployments will exceed 4.5 GW by 2023 (see Figure 8 below). Whereas energy storage can be a grid asset for increased flexibility to manage a more dynamic grid, the need for smart grid investments to integrate these resources effectively will also grow.
Department of Energy |January 2022
Smart Grid System Report 2020 | Page 17
FIGURE 8. U.S. LARGE-SCALE ENERGY STORAGE ANNUAL DEPLOYMENTS
Source: U.S. Energy Information Administration, Battery Storage in the United States: An Update on Market Trends, July 2020
DERs provide electric utility customers with a variety of potential benefits, including energy savings and improved resilience. The introduction of renewable energy technology and DERs, however, has introduced a greater and less predictable degree of variability in both electricity supply and demand (load), requiring finer levels of control and coordination between utilities and their customers.
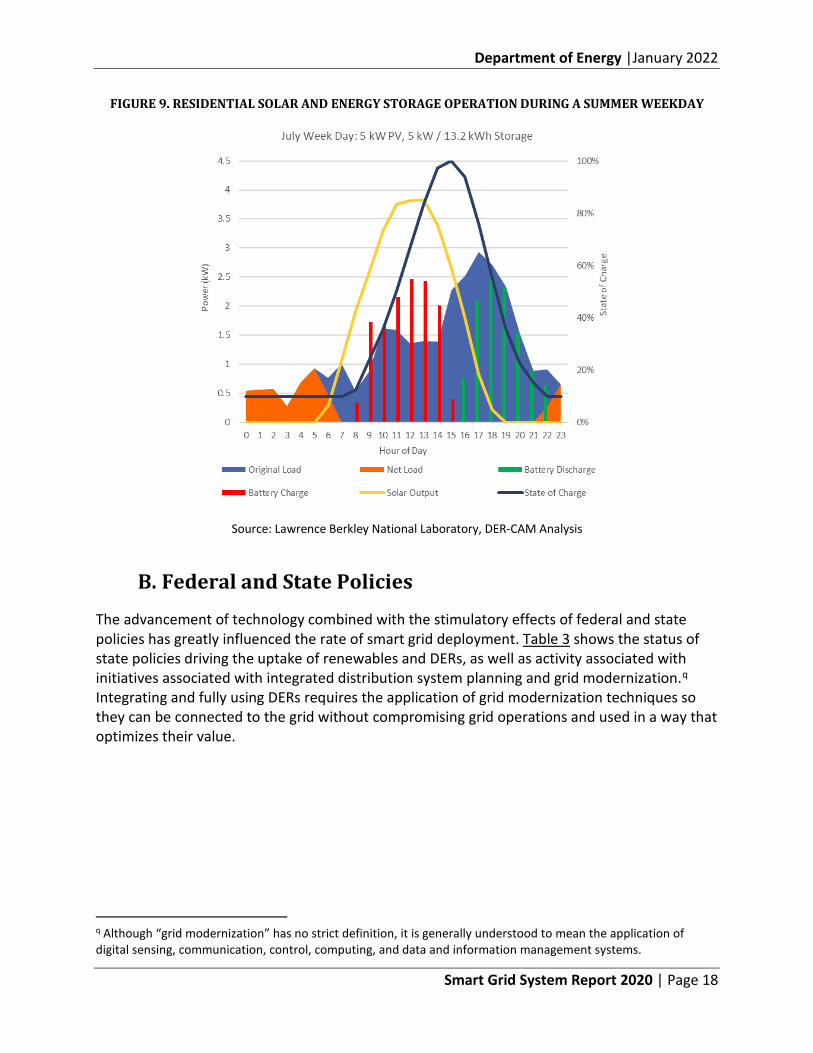
To illustrate this point, Figure 9 shows the combined effect of rooftop solar and energy storage for a generic residential home in Austin, Texas.p The blue shaded area shows the customer’s load without the use of either technology; the orange shaded area shows the net customer load due to the application of the DER technologies. The rooftop solar system charges the battery during the day and discharges it during the evening to lower the customer’s peak load. As customers begin to adopt these technologies, utilities will need to manage not only the instantaneous variability in net load, but also the amount of electricity the rooftop system might provide back to the utility, especially as weather (e.g., moving clouds) might suddenly affect the amount of solar energy provided. Establishing the appropriate incentives and tariff structures (e.g., time-varying rates or net-energy-metering policies) to achieve the preferred balance between customer behaviors (in purchasing and operating their devices) and utility operations remains a significant challenge.
p The analysis was conducted by Lawrence Berkeley National Laboratory using the DER-CAM model on actual residential load profiles.
Department of Energy |January 2022
Smart Grid System Report 2020 | Page 18
FIGURE 9. RESIDENTIAL SOLAR AND ENERGY STORAGE OPERATION DURING A SUMMER WEEKDAY
Source: Lawrence Berkley National Laboratory, DER-CAM Analysis
B. Federal and State Policies
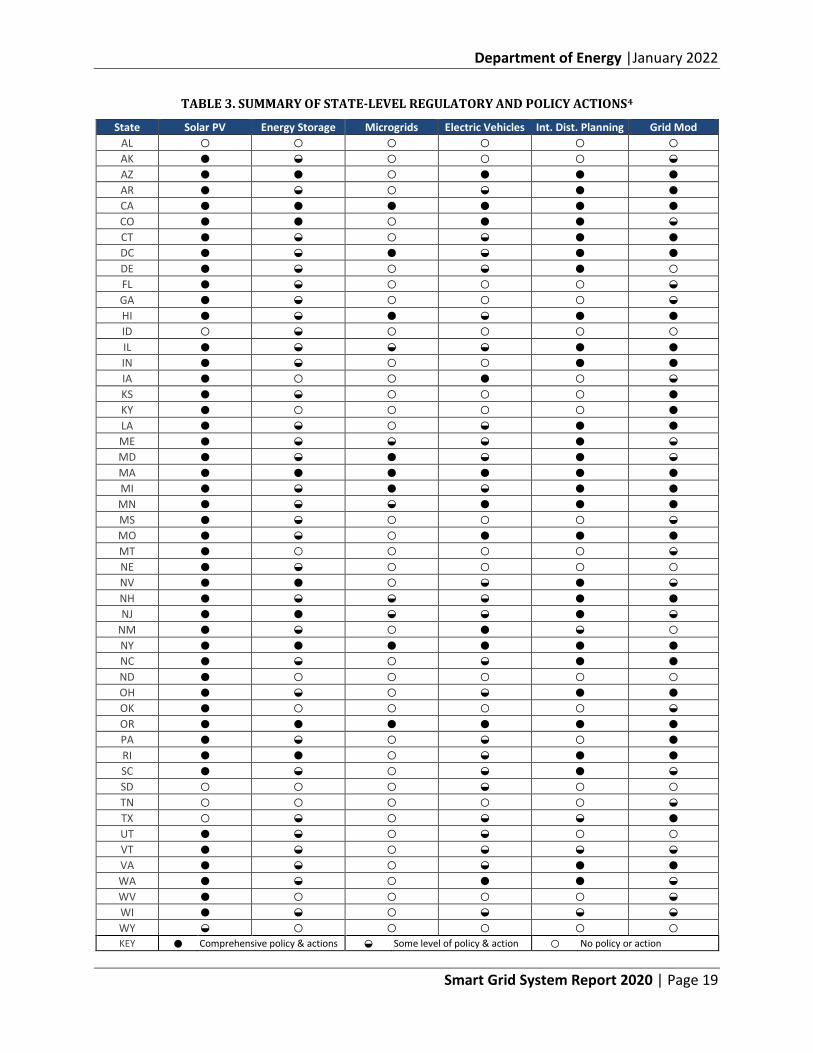
The advancement of technology combined with the stimulatory effects of federal and state policies has greatly influenced the rate of smart grid deployment. Table 3 shows the status of state policies driving the uptake of renewables and DERs, as well as activity associated with initiatives associated with integrated distribution system planning and grid modernization.q Integrating and fully using DERs requires the application of grid modernization techniques so they can be connected to the grid without compromising grid operations and used in a way that optimizes their value.
q Although “grid modernization” has no strict definition, it is generally understood to mean the application of digital sensing, communication, control, computing, and data and information management systems.
Department of Energy |January 2022
Smart Grid System Report 2020 | Page 19
TABLE 3. SUMMARY OF STATE-LEVEL REGULATORY AND POLICY ACTIONS4
State Solar PV Energy Storage Microgrids Electric Vehicles Int. Dist. Planning Grid Mod AL ○ ○ ○ ○ ○ ○ AK ● ◒ ○ ○ ○ ◒ AZ ● ● ○ ● ● ● AR ● ◒ ○ ◒ ● ● CA ● ● ● ● ● ● CO ● ● ○ ● ● ◒ CT ● ◒ ○ ◒ ● ● DC ● ◒ ● ◒ ● ● DE ● ◒ ○ ◒ ● ○ FL ● ◒ ○ ○ ○ ◒ GA ● ◒ ○ ○ ○ ◒ HI ● ◒ ● ◒ ● ● ID ○ ◒ ○ ○ ○ ○ IL ● ◒ ◒ ◒ ● ● IN ● ◒ ○ ○ ● ● IA ● ○ ○ ● ○ ◒ KS ● ◒ ○ ○ ○ ● KY ● ○ ○ ○ ○ ● LA ● ◒ ○ ◒ ● ● ME ● ◒ ◒ ◒ ● ◒ MD ● ◒ ● ◒ ● ◒ MA ● ● ● ● ● ● MI ● ◒ ● ◒ ● ● MN ● ◒ ◒ ● ● ● MS ● ◒ ○ ○ ○ ◒ MO ● ◒ ○ ● ● ● MT ● ○ ○ ○ ○ ◒ NE ● ◒ ○ ○ ○ ○ NV ● ● ○ ◒ ● ◒ NH ● ◒ ◒ ◒ ● ● NJ ● ● ◒ ◒ ● ◒
NM ● ◒ ○ ● ◒ ○ NY ● ● ● ● ● ● NC ● ◒ ○ ◒ ● ● ND ● ○ ○ ○ ○ ○ OH ● ◒ ○ ◒ ● ● OK ● ○ ○ ○ ○ ◒ OR ● ● ● ● ● ● PA ● ◒ ○ ◒ ○ ● RI ● ● ○ ◒ ● ● SC ● ◒ ○ ◒ ● ◒ SD ○ ○ ○ ◒ ○ ○ TN ○ ○ ○ ○ ○ ◒ TX ○ ◒ ○ ◒ ◒ ● UT ● ◒ ○ ◒ ○ ○ VT ● ◒ ○ ◒ ◒ ◒ VA ● ◒ ○ ◒ ● ● WA ● ◒ ○ ● ● ◒ WV ● ○ ○ ○ ○ ◒ WI ● ◒ ○ ◒ ◒ ◒ WY ◒ ○ ○ ○ ○ ○ KEY ● Comprehensive policy & actions ◒ Some level of policy & action ○ No policy or action
Department of Energy |January 2022
Smart Grid System Report 2020 | Page 20
Numerous state and federal policies incentivize the use of DERs. In addition to the policy actions shown in Table 3, for example, 38 states and the District of Columbia have active renewable portfolio standards (RPS) to mandate greater adoption and integration of renewable power generation.5 Massachusetts, for example, has adopted an RPS variant—called the clean peak energy standard—which codifies requirements to have growing levels of less carbon-intensive generation resources operating at the time of peak demand to achieve carbon reductions.6
Although many states historically have relied on net energy metering (NEM) to compensate DERs for excess generation, many are actively exploring or have already adopted alternatives to NEM7 that provide price signals that more effectively align compensation with the value DERs provide. In just the fourth quarter of 2019, 37 states and the District of Columbia took actions focused on distributed generation compensation.8 For example, some states are exploring time-varying rates that incentivize DERs to operate in ways and at times that best provide system value,9 compensation mechanisms for hybrid storage and PV resources, and tariffs for microgrids under a range of ownership models.10
Beyond rate designs, some utilities are also evaluating the ability for DER solutions to provide system value by participating in utility programs (e.g., energy efficiency and demand response) and procurements (e.g., “non-wires alternatives”r). These efforts are creating new markets for DERs within distribution systems. As of mid-2019, 19 states and the District of Columbia had either adopted or were actively exploring adoption of performance-based ratemaking (PBR) structures to incentivize utilities to use resources beyond traditional generation to meet capacity needs and achieve high rates of reliability.11 The North Carolina Clean Energy Technology Center, which reviews grid modernization progress in each of the 50 states, reported that as many as 38 states have taken some action related to grid modernization in Q1 of 2020.12
In addition to state policies, recent actions by the Federal Energy Regulatory Commission (FERC) have focused on the increasing potential of energy storage and aggregated DERs to participate in wholesale markets for energy and ancillary services, thus competing with resources at the bulk power system level. In 2018, FERC issued Order 841 and mandated that all independent system operators and regional transmission organizations (ISOs/RTOs) develop a participation model allowing energy storage resources to participate in wholesale markets and provide all services they are technically capable of delivering.13 On September 17, 2020, FERC issued Order 2222, which requires each ISO/RTO to develop rules allowing for the participation of DER aggregations in wholesale markets.14
Although these orders offer opportunities to capture additional value from energy storage and DER aggregations, they also present operational challenges that will require deploying additional sensing and control technologies.
r Non-wires alternatives (NWAs) use distributed energy resources and microgrids to defer or replace the installation of more traditional “wires and poles” infrastructure.
Department of Energy |January 2022
Smart Grid System Report 2020 | Page 21
ISOs/RTOs have no real-time visibility into distribution system conditions (nor typically do distribution utilities have sufficient observability into behind-the-meter resources). Therefore, ongoing operational coordination is needed among ISOs/RTOs, distribution utilities, DER aggregators, and the owners of participating DERs (e.g., energy storage) to ensure the operation of participating DERs to meet a wholesale market obligation is compatible with distribution system conditions (e.g., voltage and thermal limits).15 Although the California Independent System Operator (CAISO)16 has already implemented a DER aggregation model and the New York Independent System Operator (NYISO)17 is in the process of doing so, their experience to date with facilitating such operational coordination has been limited to pilots.s, 18 As the number of DERs—directly or through an aggregator—participating in wholesale markets increases, ISOs/RTOs, distribution utilities, and the owners or aggregators of DERs will need to develop processes and technological solutions that can effectively coordinate the interactions of these entities across all timescales.
1. STATE PLANNING ACTIVITIES
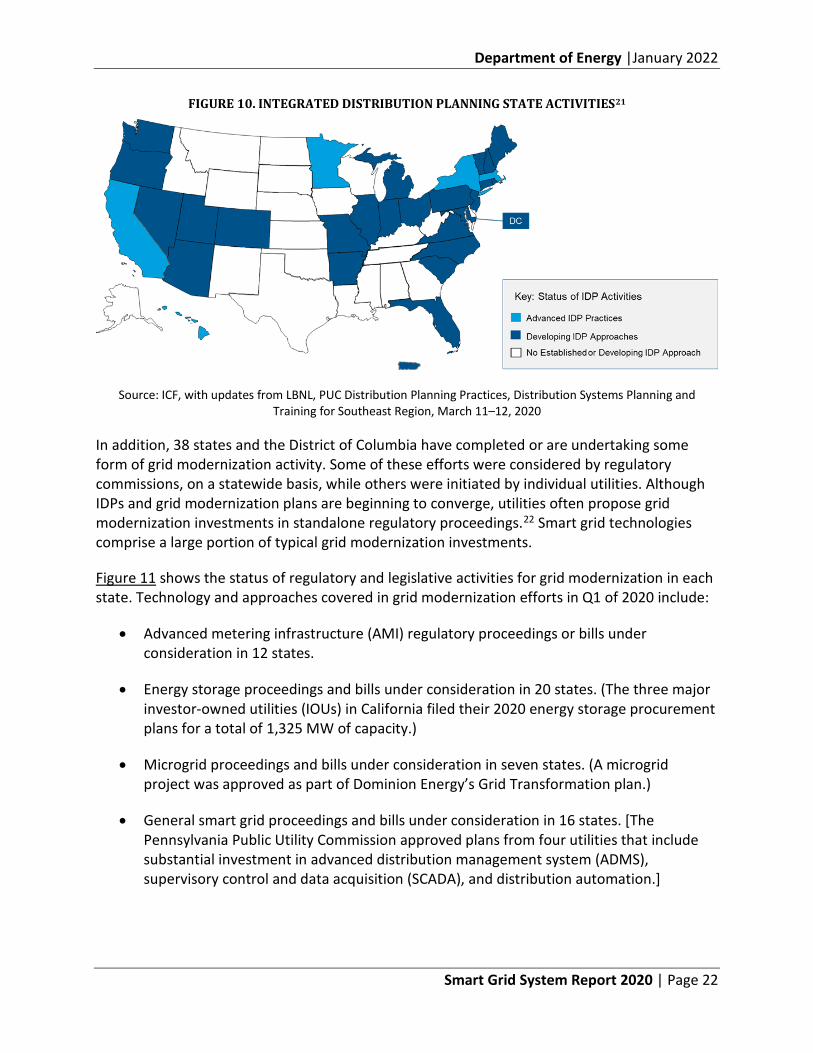
Integrated planning processes that consider grid modernization implementation and include the integration and utilization of DERs, as well as the novel grid configurations (e.g., microgrids) that apply them, are evolving. Five states have mandated that utilities submit an integrated distribution plan (IDP), and 21 states have active regulatory proceedings underway to eventually require them, as depicted in Figure 10.19 IDPs addressing high levels of DER adoption require strategies for effectively accommodating DERs to maintain adequate system conditions, and they need approaches for monitoring and control. IDPs also have highlighted the use of non-wires alternatives (NWA)—typically a combination of smart grid technologies and DERs—as a new type of solution to meet specific grid objectives while deferring or avoiding an investment in traditional utility infrastructure. New York and California are leading NWA deployments with many projects deployed in each state, while 10 other states have each implemented a handful of NWA projects.20
s Even though the CAISO’s Distributed Energy Resource Participation (DERP) model is already implemented, no participation to date has occurred, largely due to the requirements that DERP aggregations must participate in wholesale markets at all times, the time and cost associated with the interconnection process, and that these aggregations do not currently qualify to provide resource adequacy.
Department of Energy |January 2022
Smart Grid System Report 2020 | Page 22
FIGURE 10. INTEGRATED DISTRIBUTION PLANNING STATE ACTIVITIES21
Source: ICF, with updates from LBNL, PUC Distribution Planning Practices, Distribution Systems Planning and Training for Southeast Region, March 11–12, 2020
In addition, 38 states and the District of Columbia have completed or are undertaking some form of grid modernization activity. Some of these efforts were considered by regulatory commissions, on a statewide basis, while others were initiated by individual utilities. Although IDPs and grid modernization plans are beginning to converge, utilities often propose grid modernization investments in standalone regulatory proceedings.22 Smart grid technologies comprise a large portion of typical grid modernization investments.
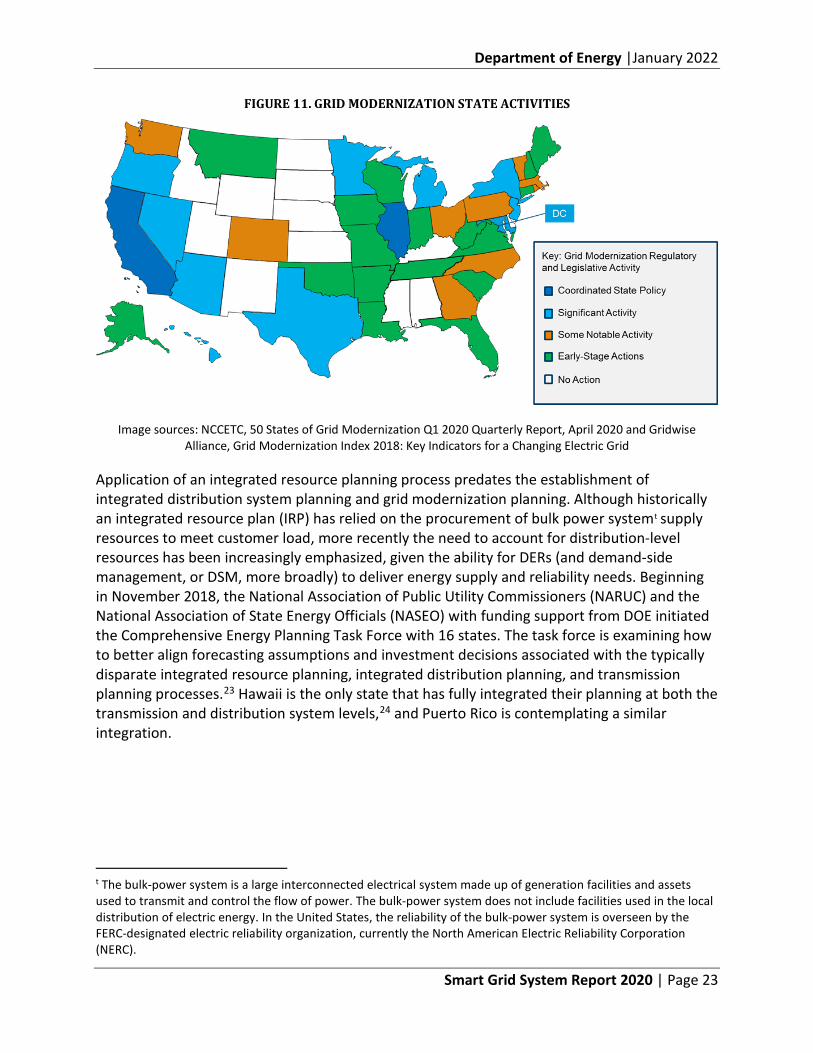
Figure 11 shows the status of regulatory and legislative activities for grid modernization in each state. Technology and approaches covered in grid modernization efforts in Q1 of 2020 include:
• Advanced metering infrastructure (AMI) regulatory proceedings or bills under consideration in 12 states.
• Energy storage proceedings and bills under consideration in 20 states. (The three major investor-owned utilities (IOUs) in California filed their 2020 energy storage procurement plans for a total of 1,325 MW of capacity.)
• Microgrid proceedings and bills under consideration in seven states. (A microgrid project was approved as part of Dominion Energy’s Grid Transformation plan.)
• General smart grid proceedings and bills under consideration in 16 states. [The Pennsylvania Public Utility Commission approved plans from four utilities that include substantial investment in advanced distribution management system (ADMS), supervisory control and data acquisition (SCADA), and distribution automation.]
Department of Energy |January 2022
Smart Grid System Report 2020 | Page 23
FIGURE 11. GRID MODERNIZATION STATE ACTIVITIES
Image sources: NCCETC, 50 States of Grid Modernization Q1 2020 Quarterly Report, April 2020 and Gridwise Alliance, Grid Modernization Index 2018: Key Indicators for a Changing Electric Grid
Application of an integrated resource planning process predates the establishment of integrated distribution system planning and grid modernization planning. Although historically an integrated resource plan (IRP) has relied on the procurement of bulk power systemt supply resources to meet customer load, more recently the need to account for distribution-level resources has been increasingly emphasized, given the ability for DERs (and demand-side management, or DSM, more broadly) to deliver energy supply and reliability needs. Beginning in November 2018, the National Association of Public Utility Commissioners (NARUC) and the National Association of State Energy Officials (NASEO) with funding support from DOE initiated the Comprehensive Energy Planning Task Force with 16 states. The task force is examining how to better align forecasting assumptions and investment decisions associated with the typically disparate integrated resource planning, integrated distribution planning, and transmission planning processes.23 Hawaii is the only state that has fully integrated their planning at both the transmission and distribution system levels,24 and Puerto Rico is contemplating a similar integration.
t The bulk-power system is a large interconnected electrical system made up of generation facilities and assets used to transmit and control the flow of power. The bulk-power system does not include facilities used in the local distribution of electric energy. In the United States, the reliability of the bulk-power system is overseen by the FERC-designated electric reliability organization, currently the North American Electric Reliability Corporation (NERC).
Department of Energy |January 2022
Smart Grid System Report 2020 | Page 24
C. New Participants and Evolving Business Models
As a result of the technological advancements and favorable policies mentioned above, opportunities to provide grid servicesu by electric utility customers (residential, commercial, and industrial customers) and third-party merchants continue to evolve and expand. These grid services include providing electricity back to the grid and ancillary services, such as providing voltage, frequency, and back-up support. In addition, regulators continue to be interested in reducing the need to build greater electricity delivery capacity (e.g., power lines and substations) by applying services provided by local DER owners and customer energy efficiency and demand-side management where economically feasible. The term non-wires alternative is applied to the application of DERs to meet local energy and demand needs.
For example, Bonneville Power Administration avoided a proposed 80-mile, 500-kilovolt (kV) transmission line that would cost over $1 billion by acquiring 45 MW of demand response and 355 MW of generation redispatch.25 In general, where favorable economics and programs exist, there is greater participation by nonutility entities (e.g., utility customers and third parties) in managing and even generating electricity. This has led many to consider the grid as a utility platform to enable the plug-and-play of devices and transactional activity (e.g., the sharing of electricity and other services) envisioned with high levels of DER participation from customers and third-party merchants. Incorporating high levels of DERs onto the grid, however, is not straightforward and requires the deployment of smart grid technology and close coordination among DER operators and grid operators. Legislators and regulators typically are not aware of the level of sophistication and the potential for redundancy needed to effectively integrate and use DERs.
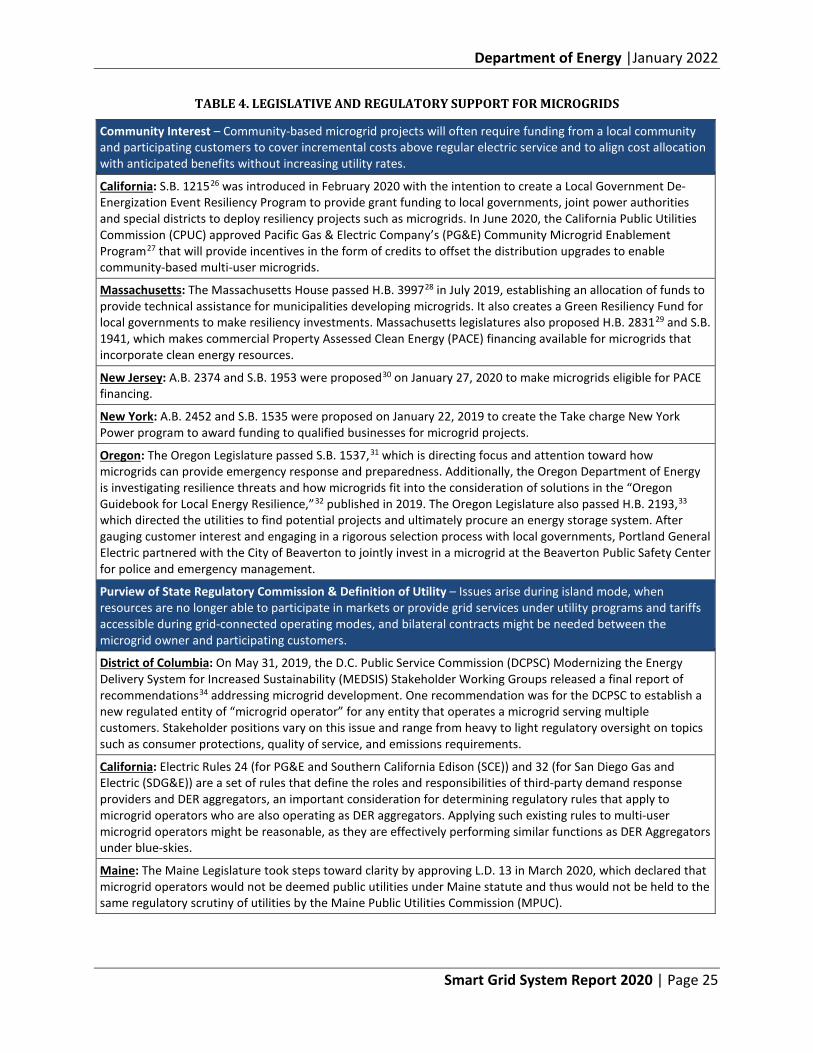
An evolving phenomenon is the growing deployment of microgridsv that will require sophisticated control schemes. As shown in Table 4, several states, communities, and utilities are actively pursuing the use of microgrids as a tool to address resilience needs, and are beginning to recognize the value of microgrids for integrating additional clean energy resources onto the grid to achieve carbon and emission reduction targets.w As shown in Table 5, several types of unique microgrid configurations exist in relation to electrical boundaries, stakeholders, ownership, operational models, and compensation methods.
u Table 12 in Appendix VII.A shows common types of grid services. v A microgrid is a group of interconnected loads and distributed energy resources within clearly defined electrical boundaries that acts as a single controllable entity with respect to the grid. A microgrid can connect and disconnect from the grid to enable it to operate in grid-connected or island. w Community choice aggregators, detailed in Appendix VII.B, allow local governments to procure energy supply services and DERs for eligible energy customers in the community, often to meet carbon and emission targets.
Department of Energy |January 2022
Smart Grid System Report 2020 | Page 25
TABLE 4. LEGISLATIVE AND REGULATORY SUPPORT FOR MICROGRIDS
Community Interest – Community-based microgrid projects will often require funding from a local community and participating customers to cover incremental costs above regular electric service and to align cost allocation with anticipated benefits without increasing utility rates.
California: S.B. 121526 was introduced in February 2020 with the intention to create a Local Government De-Energization Event Resiliency Program to provide grant funding to local governments, joint power authorities and special districts to deploy resiliency projects such as microgrids. In June 2020, the California Public Utilities Commission (CPUC) approved Pacific Gas & Electric Company’s (PG&E) Community Microgrid Enablement Program27 that will provide incentives in the form of credits to offset the distribution upgrades to enable community-based multi-user microgrids.
Massachusetts: The Massachusetts House passed H.B. 399728 in July 2019, establishing an allocation of funds to provide technical assistance for municipalities developing microgrids. It also creates a Green Resiliency Fund for local governments to make resiliency investments. Massachusetts legislatures also proposed H.B. 283129 and S.B. 1941, which makes commercial Property Assessed Clean Energy (PACE) financing available for microgrids that incorporate clean energy resources.
New Jersey: A.B. 2374 and S.B. 1953 were proposed30 on January 27, 2020 to make microgrids eligible for PACE financing.
New York: A.B. 2452 and S.B. 1535 were proposed on January 22, 2019 to create the Take charge New York Power program to award funding to qualified businesses for microgrid projects.
Oregon: The Oregon Legislature passed S.B. 1537,31 which is directing focus and attention toward how microgrids can provide emergency response and preparedness. Additionally, the Oregon Department of Energy is investigating resilience threats and how microgrids fit into the consideration of solutions in the “Oregon Guidebook for Local Energy Resilience,”32 published in 2019. The Oregon Legislature also passed H.B. 2193,33 which directed the utilities to find potential projects and ultimately procure an energy storage system. After gauging customer interest and engaging in a rigorous selection process with local governments, Portland General Electric partnered with the City of Beaverton to jointly invest in a microgrid at the Beaverton Public Safety Center for police and emergency management.
Purview of State Regulatory Commission & Definition of Utility – Issues arise during island mode, when resources are no longer able to participate in markets or provide grid services under utility programs and tariffs accessible during grid-connected operating modes, and bilateral contracts might be needed between the microgrid owner and participating customers.
District of Columbia: On May 31, 2019, the D.C. Public Service Commission (DCPSC) Modernizing the Energy Delivery System for Increased Sustainability (MEDSIS) Stakeholder Working Groups released a final report of recommendations34 addressing microgrid development. One recommendation was for the DCPSC to establish a new regulated entity of “microgrid operator” for any entity that operates a microgrid serving multiple customers. Stakeholder positions vary on this issue and range from heavy to light regulatory oversight on topics such as consumer protections, quality of service, and emissions requirements.
California: Electric Rules 24 (for PG&E and Southern California Edison (SCE)) and 32 (for San Diego Gas and Electric (SDG&E)) are a set of rules that define the roles and responsibilities of third-party demand response providers and DER aggregators, an important consideration for determining regulatory rules that apply to microgrid operators who are also operating as DER aggregators. Applying such existing rules to multi-user microgrid operators might be reasonable, as they are effectively performing similar functions as DER Aggregators under blue-skies.
Maine: The Maine Legislature took steps toward clarity by approving L.D. 13 in March 2020, which declared that microgrid operators would not be deemed public utilities under Maine statute and thus would not be held to the same regulatory scrutiny of utilities by the Maine Public Utilities Commission (MPUC).
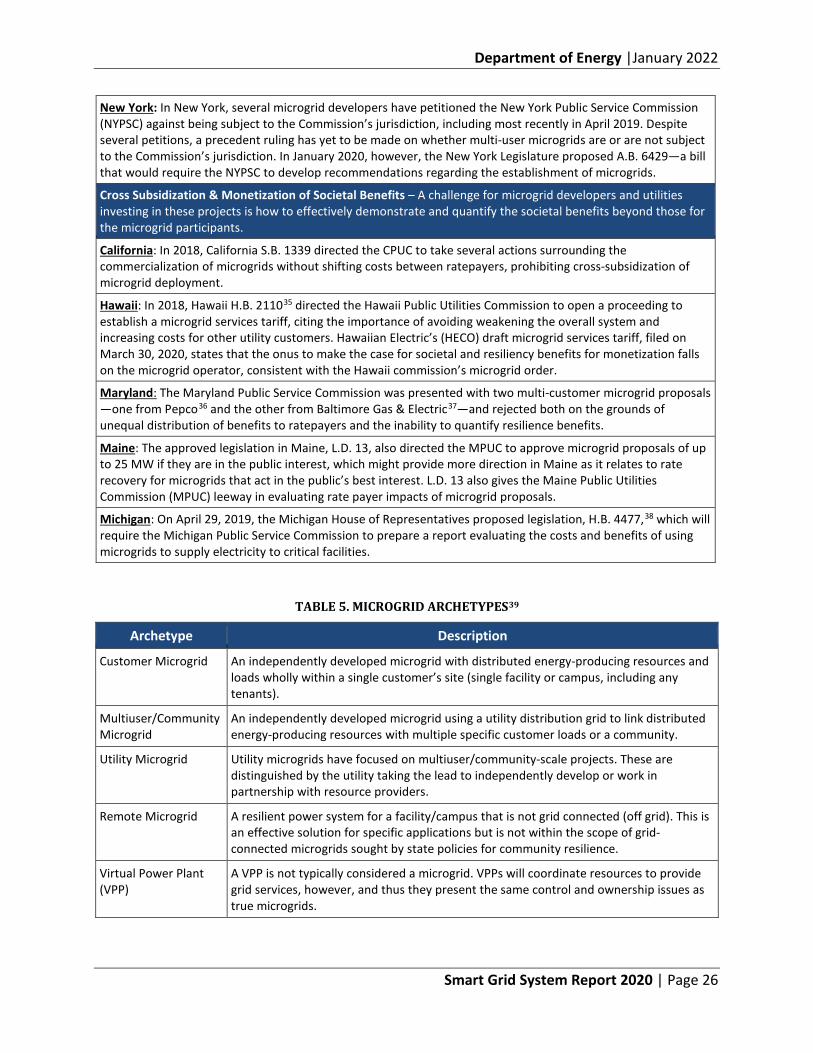
Department of Energy |January 2022
Smart Grid System Report 2020 | Page 26
New York: In New York, several microgrid developers have petitioned the New York Public Service Commission (NYPSC) against being subject to the Commission’s jurisdiction, including most recently in April 2019. Despite several petitions, a precedent ruling has yet to be made on whether multi-user microgrids are or are not subject to the Commission’s jurisdiction. In January 2020, however, the New York Legislature proposed A.B. 6429—a bill that would require the NYPSC to develop recommendations regarding the establishment of microgrids.
Cross Subsidization & Monetization of Societal Benefits – A challenge for microgrid developers and utilities investing in these projects is how to effectively demonstrate and quantify the societal benefits beyond those for the microgrid participants.
California: In 2018, California S.B. 1339 directed the CPUC to take several actions surrounding the commercialization of microgrids without shifting costs between ratepayers, prohibiting cross-subsidization of microgrid deployment.
Hawaii: In 2018, Hawaii H.B. 211035 directed the Hawaii Public Utilities Commission to open a proceeding to establish a microgrid services tariff, citing the importance of avoiding weakening the overall system and increasing costs for other utility customers. Hawaiian Electric’s (HECO) draft microgrid services tariff, filed on March 30, 2020, states that the onus to make the case for societal and resiliency benefits for monetization falls on the microgrid operator, consistent with the Hawaii commission’s microgrid order.
Maryland: The Maryland Public Service Commission was presented with two multi-customer microgrid proposals —one from Pepco36 and the other from Baltimore Gas & Electric37—and rejected both on the grounds of unequal distribution of benefits to ratepayers and the inability to quantify resilience benefits.
Maine: The approved legislation in Maine, L.D. 13, also directed the MPUC to approve microgrid proposals of up to 25 MW if they are in the public interest, which might provide more direction in Maine as it relates to rate recovery for microgrids that act in the public’s best interest. L.D. 13 also gives the Maine Public Utilities Commission (MPUC) leeway in evaluating rate payer impacts of microgrid proposals.
Michigan: On April 29, 2019, the Michigan House of Representatives proposed legislation, H.B. 4477,38 which will require the Michigan Public Service Commission to prepare a report evaluating the costs and benefits of using microgrids to supply electricity to critical facilities.
TABLE 5. MICROGRID ARCHETYPES39
Archetype Description
Customer Microgrid An independently developed microgrid with distributed energy-producing resources and loads wholly within a single customer’s site (single facility or campus, including any tenants).
Multiuser/Community Microgrid
An independently developed microgrid using a utility distribution grid to link distributed energy-producing resources with multiple specific customer loads or a community.
Utility Microgrid Utility microgrids have focused on multiuser/community-scale projects. These are distinguished by the utility taking the lead to independently develop or work in partnership with resource providers.
Remote Microgrid A resilient power system for a facility/campus that is not grid connected (off grid). This is an effective solution for specific applications but is not within the scope of grid-connected microgrids sought by state policies for community resilience.
Virtual Power Plant (VPP)
A VPP is not typically considered a microgrid. VPPs will coordinate resources to provide grid services, however, and thus they present the same control and ownership issues as true microgrids.
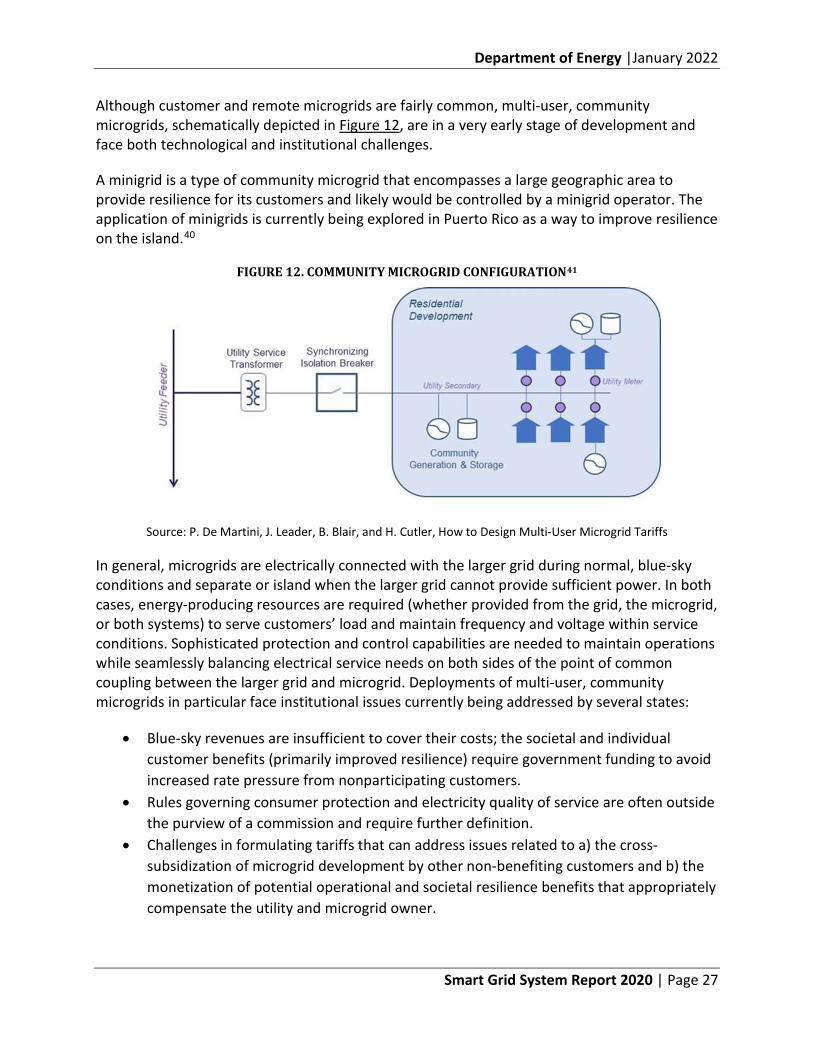
Department of Energy |January 2022
Smart Grid System Report 2020 | Page 27
Although customer and remote microgrids are fairly common, multi-user, community microgrids, schematically depicted in Figure 12, are in a very early stage of development and face both technological and institutional challenges.
A minigrid is a type of community microgrid that encompasses a large geographic area to provide resilience for its customers and likely would be controlled by a minigrid operator. The application of minigrids is currently being explored in Puerto Rico as a way to improve resilience on the island.40
FIGURE 12. COMMUNITY MICROGRID CONFIGURATION41
Source: P. De Martini, J. Leader, B. Blair, and H. Cutler, How to Design Multi-User Microgrid Tariffs
In general, microgrids are electrically connected with the larger grid during normal, blue-sky conditions and separate or island when the larger grid cannot provide sufficient power. In both cases, energy-producing resources are required (whether provided from the grid, the microgrid, or both systems) to serve customers’ load and maintain frequency and voltage within service conditions. Sophisticated protection and control capabilities are needed to maintain operations while seamlessly balancing electrical service needs on both sides of the point of common coupling between the larger grid and microgrid. Deployments of multi-user, community microgrids in particular face institutional issues currently being addressed by several states:
• Blue-sky revenues are insufficient to cover their costs; the societal and individual customer benefits (primarily improved resilience) require government funding to avoid increased rate pressure from nonparticipating customers.
• Rules governing consumer protection and electricity quality of service are often outside the purview of a commission and require further definition.
• Challenges in formulating tariffs that can address issues related to a) the cross-subsidization of microgrid development by other non-benefiting customers and b) the monetization of potential operational and societal resilience benefits that appropriately compensate the utility and microgrid owner.
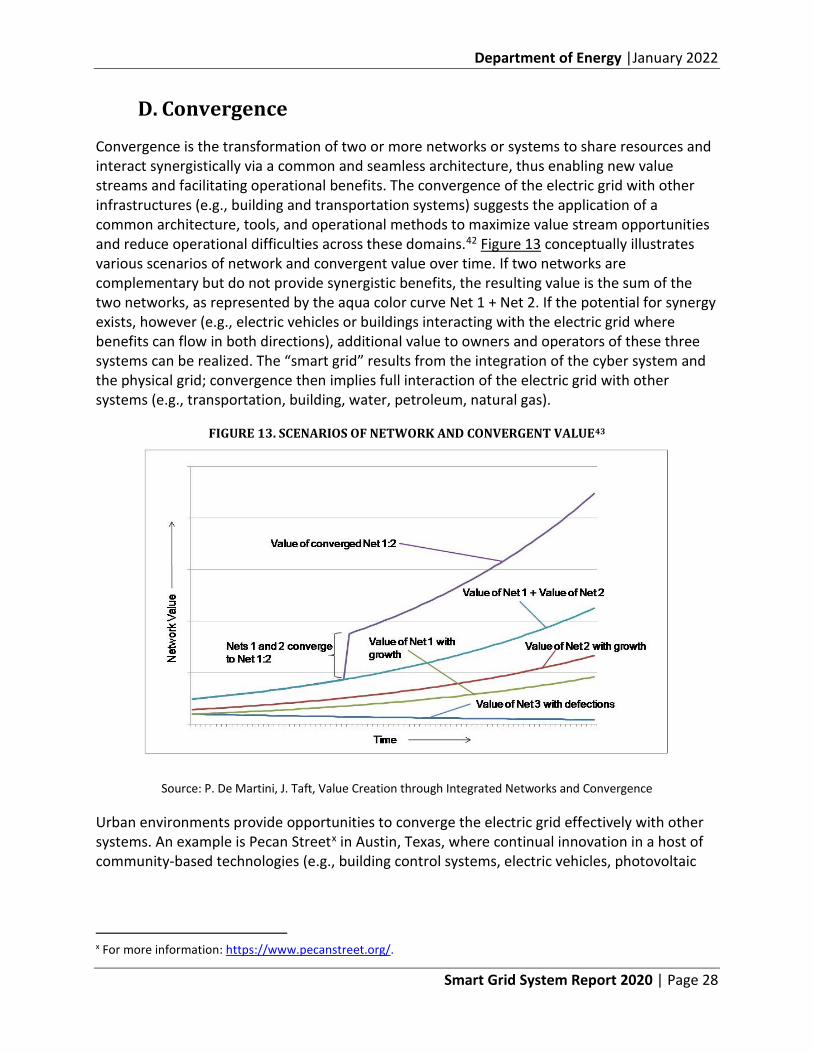
Department of Energy |January 2022
Smart Grid System Report 2020 | Page 28
D. Convergence
Convergence is the transformation of two or more networks or systems to share resources and interact synergistically via a common and seamless architecture, thus enabling new value streams and facilitating operational benefits. The convergence of the electric grid with other infrastructures (e.g., building and transportation systems) suggests the application of a common architecture, tools, and operational methods to maximize value stream opportunities and reduce operational difficulties across these domains.42 Figure 13 conceptually illustrates various scenarios of network and convergent value over time. If two networks are complementary but do not provide synergistic benefits, the resulting value is the sum of the two networks, as represented by the aqua color curve Net 1 + Net 2. If the potential for synergy exists, however (e.g., electric vehicles or buildings interacting with the electric grid where benefits can flow in both directions), additional value to owners and operators of these three systems can be realized. The “smart grid” results from the integration of the cyber system and the physical grid; convergence then implies full interaction of the electric grid with other systems (e.g., transportation, building, water, petroleum, natural gas).
FIGURE 13. SCENARIOS OF NETWORK AND CONVERGENT VALUE43
Source: P. De Martini, J. Taft, Value Creation through Integrated Networks and Convergence
Urban environments provide opportunities to converge the electric grid effectively with other systems. An example is Pecan Streetx in Austin, Texas, where continual innovation in a host of community-based technologies (e.g., building control systems, electric vehicles, photovoltaic
x For more information: https://www.pecanstreet.org/.
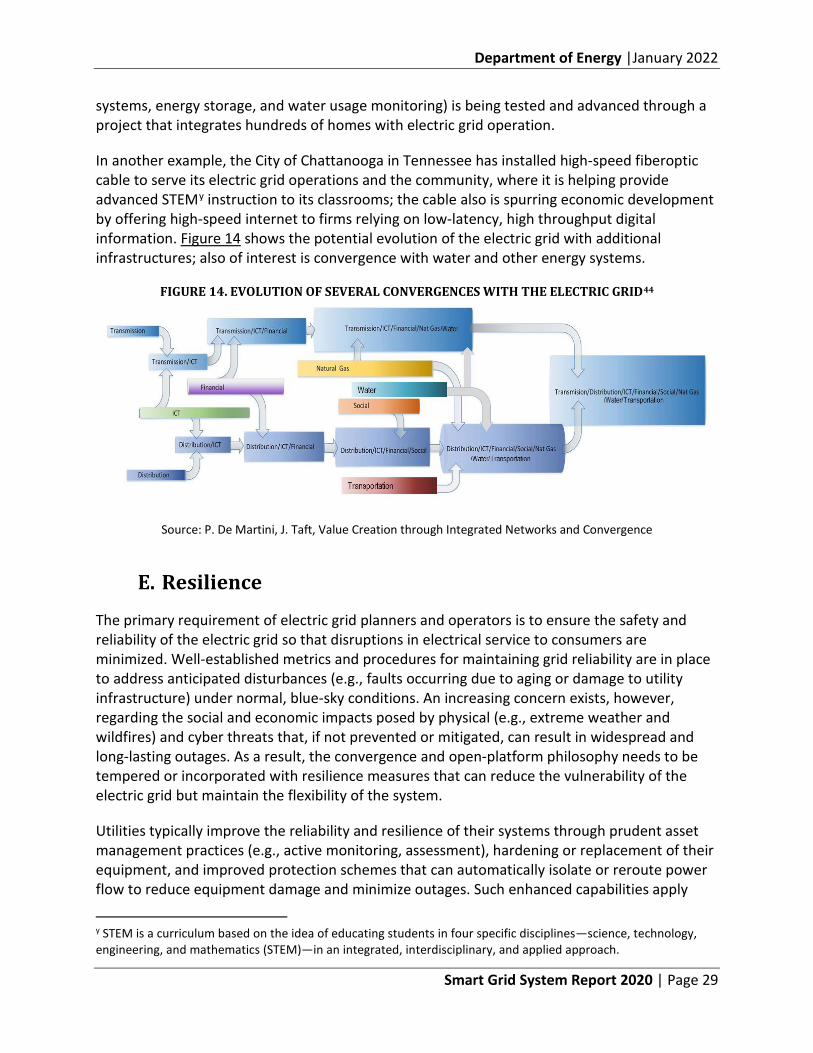
Department of Energy |January 2022
Smart Grid System Report 2020 | Page 29
systems, energy storage, and water usage monitoring) is being tested and advanced through a project that integrates hundreds of homes with electric grid operation.
In another example, the City of Chattanooga in Tennessee has installed high-speed fiberoptic cable to serve its electric grid operations and the community, where it is helping provide advanced STEMy instruction to its classrooms; the cable also is spurring economic development by offering high-speed internet to firms relying on low-latency, high throughput digital information. Figure 14 shows the potential evolution of the electric grid with additional infrastructures; also of interest is convergence with water and other energy systems.
FIGURE 14. EVOLUTION OF SEVERAL CONVERGENCES WITH THE ELECTRIC GRID44
Source: P. De Martini, J. Taft, Value Creation through Integrated Networks and Convergence
E. Resilience
The primary requirement of electric grid planners and operators is to ensure the safety and reliability of the electric grid so that disruptions in electrical service to consumers are minimized. Well-established metrics and procedures for maintaining grid reliability are in place to address anticipated disturbances (e.g., faults occurring due to aging or damage to utility infrastructure) under normal, blue-sky conditions. An increasing concern exists, however, regarding the social and economic impacts posed by physical (e.g., extreme weather and wildfires) and cyber threats that, if not prevented or mitigated, can result in widespread and long-lasting outages. As a result, the convergence and open-platform philosophy needs to be tempered or incorporated with resilience measures that can reduce the vulnerability of the electric grid but maintain the flexibility of the system.
Utilities typically improve the reliability and resilience of their systems through prudent asset management practices (e.g., active monitoring, assessment), hardening or replacement of their equipment, and improved protection schemes that can automatically isolate or reroute power flow to reduce equipment damage and minimize outages. Such enhanced capabilities apply
y STEM is a curriculum based on the idea of educating students in four specific disciplines—science, technology, engineering, and mathematics (STEM)—in an integrated, interdisciplinary, and applied approach.
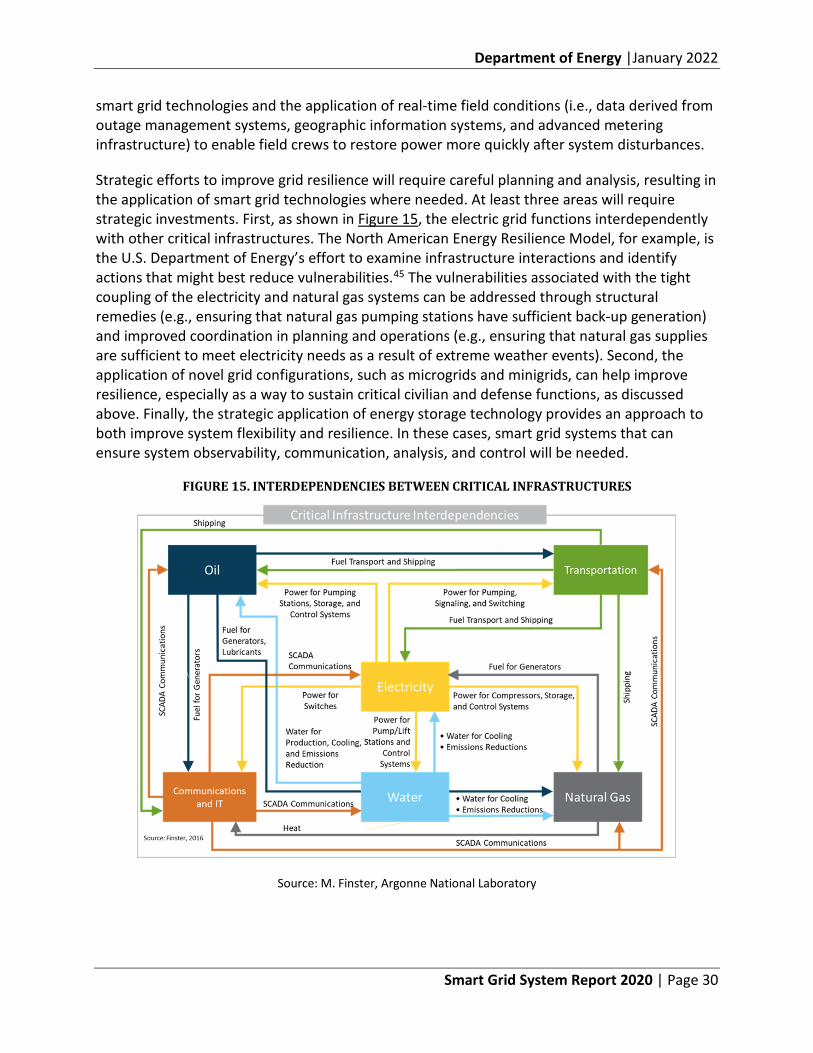
Department of Energy |January 2022
Smart Grid System Report 2020 | Page 30
smart grid technologies and the application of real-time field conditions (i.e., data derived from outage management systems, geographic information systems, and advanced metering infrastructure) to enable field crews to restore power more quickly after system disturbances.
Strategic efforts to improve grid resilience will require careful planning and analysis, resulting in the application of smart grid technologies where needed. At least three areas will require strategic investments. First, as shown in Figure 15, the electric grid functions interdependently with other critical infrastructures. The North American Energy Resilience Model, for example, is the U.S. Department of Energy’s effort to examine infrastructure interactions and identify actions that might best reduce vulnerabilities.45 The vulnerabilities associated with the tight coupling of the electricity and natural gas systems can be addressed through structural remedies (e.g., ensuring that natural gas pumping stations have sufficient back-up generation) and improved coordination in planning and operations (e.g., ensuring that natural gas supplies are sufficient to meet electricity needs as a result of extreme weather events). Second, the application of novel grid configurations, such as microgrids and minigrids, can help improve resilience, especially as a way to sustain critical civilian and defense functions, as discussed above. Finally, the strategic application of energy storage technology provides an approach to both improve system flexibility and resilience. In these cases, smart grid systems that can ensure system observability, communication, analysis, and control will be needed.
FIGURE 15. INTERDEPENDENCIES BETWEEN CRITICAL INFRASTRUCTURES
Source: M. Finster, Argonne National Laboratory
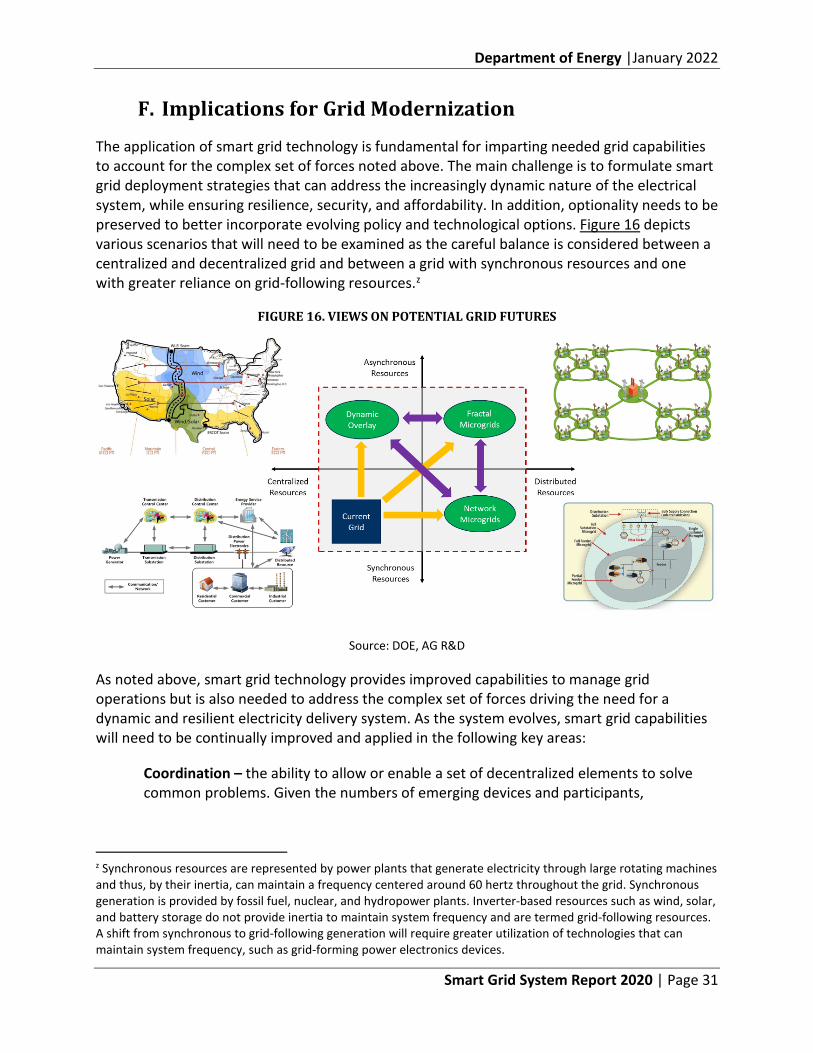
Department of Energy |January 2022
Smart Grid System Report 2020 | Page 31
F. Implications for Grid Modernization
The application of smart grid technology is fundamental for imparting needed grid capabilities to account for the complex set of forces noted above. The main challenge is to formulate smart grid deployment strategies that can address the increasingly dynamic nature of the electrical system, while ensuring resilience, security, and affordability. In addition, optionality needs to be preserved to better incorporate evolving policy and technological options. Figure 16 depicts various scenarios that will need to be examined as the careful balance is considered between a centralized and decentralized grid and between a grid with synchronous resources and one with greater reliance on grid-following resources.z
FIGURE 16. VIEWS ON POTENTIAL GRID FUTURES
Source: DOE, AG R&D
As noted above, smart grid technology provides improved capabilities to manage grid operations but is also needed to address the complex set of forces driving the need for a dynamic and resilient electricity delivery system. As the system evolves, smart grid capabilities will need to be continually improved and applied in the following key areas:
Coordination – the ability to allow or enable a set of decentralized elements to solve common problems. Given the numbers of emerging devices and participants,
z Synchronous resources are represented by power plants that generate electricity through large rotating machines and thus, by their inertia, can maintain a frequency centered around 60 hertz throughout the grid. Synchronous generation is provided by fossil fuel, nuclear, and hydropower plants. Inverter-based resources such as wind, solar, and battery storage do not provide inertia to maintain system frequency and are termed grid-following resources. A shift from synchronous to grid-following generation will require greater utilization of technologies that can maintain system frequency, such as grid-forming power electronics devices.
Department of Energy |January 2022
Smart Grid System Report 2020 | Page 32
coordination is needed for grid planning, operations, and market design and implementation.
Scalability – the ability to accommodate an increasing number of endpoints or participants without undertaking major system rework. An increasing number of distributed energy assets that can change behavior dynamically will require structural approaches and control strategies that can maintain the balanced optimization of those resources with the overall system.
Observability – the ability to maintain temporal, geospatial, and topological awareness of all grid variables and assets. Grid operators will need to observe and react to the state of the system, including having knowledge of the instantaneous condition of all grid components, the state of electrical capacity in energy storage and other devices, the connectivity of grid networks, and ambient conditions (e.g., weather).
Security/resilience – the ability to prevent or mitigate impacts by physical or cyber threats that might adversely affect grid performance. Designing the grid to protect critical functions and to minimize exposure to malicious cyber intrusion is essential.
Flexibility – the ability to deal with variations in operating conditions with a given set of grid assets and capabilities. Energy storage technology can help provide a buffering capability that can smooth out variations in electricity supply and load.
Extensibility – the ability to modify the set of assets and capabilities to meet new operating requirements outside the bounds of the existing grid. The convergence of operations between the electric grid and other infrastructures, such as transportation, buildings, and other energy systems, will require extending the core cyber-physical grid platform.
Agility (to address faster system dynamics) – the ability to adjust quickly to maintain grid performance. Sensing and responding to grid conditions in shorter timescales is becoming increasingly important. For example, utilities are now developing sensing, computing, and control technology that can deenergize power lines before they hit the ground.aa
Interoperability – the ability of two or more systems or components to exchange information and to use the information that has been exchanged. The myriad devices and systems being deployed on the grid will need to function in coordination.
aa For example, continuous point on wave (CPOW) is a high-resolution method of quickly monitoring voltage and current conditions for advanced use cases such as incipient fault detection. More information on CPOW is available from NASPI’s March 2020 report, High-resolution, Time-synchronized Grid Monitoring Devices, available at: https://www.naspi.org/sites/default/files/reference_documents/pnnl_29770_naspi_hires_synch_grid_devices_20200320.pdf.
Department of Energy |January 2022
Smart Grid System Report 2020 | Page 33
Section Endnotes
1 U.S. DOE, Distribution Automation (DA) Smart Grid Investment Grant (SGIG) Program Report September 2016. Available at: https://www.energy.gov/sites/prod/files/2016/11/f34/Distribution%20Automation%20Summary%20Report_09-29-16.pdf. 2 Solar Energies Industry Association and Wood-Mackenzie, Solar Market Insight 2020 Q3 Executive Summary. Available at http://www2.seia.org/l/139231/2019-12-10/2jzzs8. 3 Wood Mackenzie, U.S. Energy Storage Monitor: 2020 year-in-review. Available at: https://www.woodmac.com/research/products/power-and-renewables/us-energy-storage-monitor/ 4 Table Sources: NC Clean Energy Technology Center, 50 States of Grid Modernization, Q1 2020 Quarterly Report, April 2020. https://nccleantech.ncsu.edu/2020/04/30/the-50-states-of-grid-modernization-u-s-sees-busiest-quarter-yet-for-state-and-utility-grid-modernization-activity/. NC Clean Energy Technology Center, 50 States of Solar, Q1 2020 Quarterly Report, April 2020. https://nccleantech.ncsu.edu/2020/04/22/the-50-states-of-solar-report-state-lawmakers-focus-on-expanding-solar-options-during-q1-2020/. NARUC, NASEO, Task Force Member States: Introductory Information. April 2019. https://pubs.naruc.org/pub/67D4F994-B9A4-8A67-DF79-86F5FC4688D5. Lawrence Berkeley National Laboratory, Southeast Regional Training of Distribution System Planning, PUC Distribution Planning Practices. March 11–12, 2020. https://eta-publications.lbl.gov/sites/default/files/12_-_schwartz_puc_distribution_planning_practices.pdf. U.S. Department of Energy, Energy Efficiency & Renewable Energy, Alternative Fuels Data Center, Fuels & Vehicles, Electricity Laws and Incentives. https://afdc.energy.gov/fuels/laws/ELEC. Arkansas Public Service Commission, Docket 16-028-U, In the Matter of An Investigation of Policies Related to Distributed Energy Resources. http://www.apscservices.info/efilings/docket_search_results.asp?casenumber=16-028-U. Connecticut Public Utilities Regulatory Authority, Docket 17-12-03RE09, PURA Investigation into Distribution System Planning of the Electric Distribution Companies. http://www.dpuc.state.ct.us/DOCKCURR.NSF/(Web+Main+View/All+Dockets)?OpenView&StartKey=17-12-03. Connecticut Public Utilities Regulatory Authority, Docket 17-12-03RE04, PURA Investigation into Distribution System Planning of The Electric Distribution Companies – Zero Emission Vehicles. http://www.dpuc.state.ct.us/dockcurr.nsf/8e6fc37a54110e3e852576190052b64d/89c8001d834015f485258489005c1305?OpenDocument. Virginia State Corporation Commission, Case: PUR-2020-00051, Electrification of Motor Vehicles. https://scc.virginia.gov/DocketSearch#caseDetails/140702. Smart Electric Power Alliance, 2019 Utility Energy Storage Market Snapshot, August 2019. https://sepapower.org/resource/2019-utility-energy-storage-market-snapshot/. U.S. Energy Storage Monitor: Q3 2018 Full Report, September 2018. 5 North Carolina Clean Energy Technology Center, Summary Maps. https://programs.dsireusa.org/system/program/maps. 6 Commonwealth of Massachusetts, Clean Peak Energy Standard, 2020. https://www.mass.gov/service-details/clean-peak-energy-standard. 7 National Association of Regulatory Utility Commissioners, Manual on Distributed Energy Resources Rate Design and Compensation, NARUC Staff Subcommittee on Rate Design, November 2016. https://pubs.naruc.org/pub/19FDF48B-AA57-5160-DBA1-BE2E9C2F7EA0. 8 North Carolina Clean Energy Technology Center, 50 States of Solar: Q4 2019 Quarterly Report& 2019 Annual Review, January 2020. https://nccleantech.ncsu.edu/2020/01/29/4618/. 9 Stanton, Tom, Review of State Net Energy Metering and Successor Rate Designs, National Regulatory Research Institute, 2019. https://pubs.naruc.org/pub/A107102C-92E5-776D-4114-9148841DE66B.
Department of Energy |January 2022
Smart Grid System Report 2020 | Page 34
10 California Public Utilities Commission, Decision Adopting Short-Term Actions to Accelerate Microgrid Deployment and Related Resiliency Solutions, Rulemaking 19-09-009, June 11, 2020. https://docs.cpuc.ca.gov/PublishedDocs/Published/G000/M339/K938/339938260.pdf. 11 Wood Mackenzie, Regulatory evolution for a decentralized electric grid: State of performance-based ratemaking in the U.S., June 13, 2019. https://www.woodmac.com/our-expertise/focus/Power--Renewables/regulatory-evolution-performancebasedratemaking/. 12 NCSU. 50 States of Grid Modernization. https://nccleantech.ncsu.edu/wp-content/uploads/2020/02/Q42019-GridMod-Exec-Final2.pdf. 13 FERC, Electric Storage Participation in Markets Operated by Regional Transmission Organizations and Independent System Operators, Docket Nos. RM16-23-000 and AD16-20-000, Order No. 841, issued February 15, 2018. https://elibrary.ferc.gov/idmws/common/OpenNat.asp?fileID=14823759. 14 FERC, Participation of Distributed Energy Resource Aggregations in Markets Operated by Regional Transmission Organizations and Independent System Operators, Docket No. RM18-9-000, Order No. 2222, Issued September 17, 2020. https://www.ferc.gov/sites/default/files/2020-09/E-1_0.pdf. 15 More Than Smart. Coordination of Transmission and Distribution Operations in a High Distributed Energy Resource Electric Grid, June 2017, p.9. https://www.caiso.com/Documents/MoreThanSmartReport-CoordinatingTransmission_DistributionGridOperations.pdf. 16 FERC, Order Accepting Proposed Tariff Revisions Subject to Condition, Docket No. ER16-1085-000, June 2, 2016. https://www.ferc.gov/CalendarFiles/20160602164336-ER16-1085-000.pdf. 17 NYISO, New York Independent System Operator, Inc., Proposed Tariff Revisions Regarding Establishment of Participation Model for Aggregation of Resources, Including Distributed Energy Resources, and Proposed Effective Dates, Docket ER19-2276-000, June 27, 2019. https://nyisoviewer.etariff.biz/ViewerDocLibrary//Filing/Filing1485/Attachments/20190627%20Trnsmttl%20Ltr%20DER%20205%20Flng.pdf. 18 NYISO, NYISO Program Update, July 26, 2018. https://www.nyiso.com/documents/20142/2548045/NYISO%20Pilot%20Program%20MIWG%20072618.pdf/418a9f47-d5a8-a11b-c68e-7542d0b3b25c. 19 DOE Grid Modernization Laboratory Consortium, State Engagement in Electric Distribution System Planning, December 2017. Available at: https://eta-publications.lbl.gov/sites/default/files/state_engagement_in_dsp_final_rev2.pdf. 20 Navigant, Non-Wires Alternatives Tracker 3Q19. 21 “Advanced IDP practices” include states with a regulatory or state policy and activities surrounding non-wires alternatives, hosting capacity, or locational value. “Developing IDP approaches” represent states with some components of integrated distribution planning in place. 22 GridWise Alliance, Grid Modernization Index 2018, December 2018. Available online at: https://gridwise.org/grid-modernization-index/. 23 NARUC, Task Force on Comprehensive Electricity Planning, https://www.naruc.org/taskforce/. 24 Hawaiian Electric Companies’ Integrated Grid Planning Report, July 2018, https://www.hawaiianelectric.com/documents/clean_energy_hawaii/integrated_grid_planning/20180713_dkt_2018_0165.pdf. 25 SEPA, PLMA, E4, Non-Wires Alternatives Case Studies from Leading U.S. Projects, November 2018, https://www.peakload.org/assets/news/2018%20Non-Wires%20Alternatives%20Report_FINAL%20compress.pdf. 26 California SB-1215 Electricity: microgrids http://leginfo.legislature.ca.gov/faces/billHistoryClient.xhtml?bill_id=201920200SB1215. 27 CPUC, Decision Adopting Short-term Actions to Accelerate Microgrid Deployment and Related Resiliency Solutions. Rulemaking 19-09-009. June 11, 2020. Available at: https://docs.cpuc.ca.gov/PublishedDocs/Published/G000/M340/K748/340748922.PDF. 28 Massachusetts Bill H.3997, An act relative to GreenWorks, https://malegislature.gov/Bills/191/H3997.
Department of Energy |January 2022
Smart Grid System Report 2020 | Page 35
29 Massachusetts Bill H.3997, An act authorizing resiliency measures under commercial property assessed clean energy https://malegislature.gov/Bills/191/H2831. 30 New Jersey bill A2374, Directs EDA to establish program for public or private financing of certain renewable energy, water, and storm resiliency projects through use by municipalities of voluntary special assessments for certain property owners, https://www.njleg.state.nj.us/bills/BillView.asp?BillNumber=A2374. 31 Oregon Senate bill 1537, https://olis.oregonlegislature.gov/liz/2020R1/Downloads/MeasureDocument/SB1537. 32 Oregon Guidebook for Local Energy Resilience, https://www.oregon.gov/energy/safety-resiliency/Documents/Oregon-Resilience-Guidebook-COUs.pdf. 33 Oregon House Bill 2193, https://olis.leg.state.or.us/liz/2015R1/Downloads/MeasureDocument/HB2193. 34 SEPA, Modernizing the Energy Delivery System for Increased Sustainability, May 2019, https://dcpsc.org/PSCDC/media/PDFFiles/HotTopics/GridModernizationFinalReport.pdf. 35 Hawaii House Bill 2110, Relating to Resiliency, https://www.capitol.hawaii.gov/session2018/bills/HB2110_.HTM. 36 Public Service Commission of Maryland, Case No. 9361, https://www.psc.state.md.us/wp-content/uploads/Order-No.-88836-Case-No.-9361-Pepco-Microgrid-Order.pdf. 37 UtilityDive, Maryland PSC rejects Baltimore microgrid proposal, https://www.utilitydive.com/news/maryland-psc-rejects-baltimore-microgrid-proposal/423063/. 38 Michigan House Bill No. 4477, http://www.legislature.mi.gov/documents/2019-2020/billintroduced/House/pdf/2019-HIB-4477.pdf. 39 From How to Design Multi-User Microgrid Tariffs, by P. De Martini, J. Leader, B. Blair, and H. Cutler, Smart Electric Power Alliance in partnership with the Pacific Energy Institute, August 2020. 40 Final Resolution and Order on the Puerto Rico Electric Power Authority’s Integrated Resource Plan, Case No.: CEPR-AP-2018-0001, Government of Puerto Rico Public Service Regulatory Board, Puerto Rico Energy Bureau, August 21, 2020. https://energia.pr.gov/wp-content/uploads/sites/8/2020/08/AP20180001-IRP-Final-Resolution-and-Order.pdf. 41 How to Design Multi-User Microgrid Tariffs, by P. De Martini, J. Leader, B. Blair, and H. Cutler, the Smart Electric Power Alliance in partnership with the Pacific Energy Institute, August 2020. https://sepapower.org/resource/how-to-design-multi-user-microgrid-tariffs/. 42 Grid Architecture 2, JD Taft, PNNL-24044 2, January 2016. https://gridarchitecture.pnnl.gov/media/white-papers/GridArchitecture2final.pdf. 43 Value Creation through Integrated Networks and Convergence, by Paul De Martini and Jeffrey Taft, Pacific Northwest National Laboratory, PNNL-24152, February 2015. https://gridarchitecture.pnnl.gov/media/advanced/Electric%20Networks%20%20Convergence%20final%20version%20%20Mar%2015%202015.pdf. 44 Ibid. 45 U.S. DOE, North American Energy Resilience Model, Office of Electricity, July 2019. https://www.energy.gov/sites/prod/files/2019/07/f65/NAERM_Report_public_version_072219_508.pdf.
Department of Energy |January 2022
Smart Grid System Report 2020 | Page 36
IV. Investments and Technology Applications American electric utilities invested more than $70 billion in transmission and distribution equipment, systems, and services in 2016.1,2 Although much of this capital investment has been for equipment refurbishment, replacement of obsolete equipment, or expansion of grid infrastructure, a growing portion has been and continues to be allocated to grid modernization or “smart grid” development.
Utility investments in smart grid include information technology (IT) and operational technology (OT). IT includes management of information for business systems, such as payroll, billing, and other administrative systems. OT includes management of physical grid devices and operation of control and monitoring systems for generation, transmission, and distribution of electricity. Smart grid technologies are integrated within both IT and OT systems.
In 2020, total capital spending on digital technologies (IT and OT) by U.S. electric utilities was approximately $15 billion per year. It is projected to reach over $24.5 billion by 2026. The largest portion of that spending is specifically for smart grid technologies and systems: $8.3 billion in smart grid investments in 2020, projected to reach $16.4 billion by 2026.
Figure 17 shows past and projected growth in capital spending on digital technologies over 12 years and designates what portion went toward smart grid devices and related IT and OT systems. Whereas non-smart-grid investments in IT/OT remain steady, investments in “pure” smart grid technologies and related IT and OT systems are growing significantly.
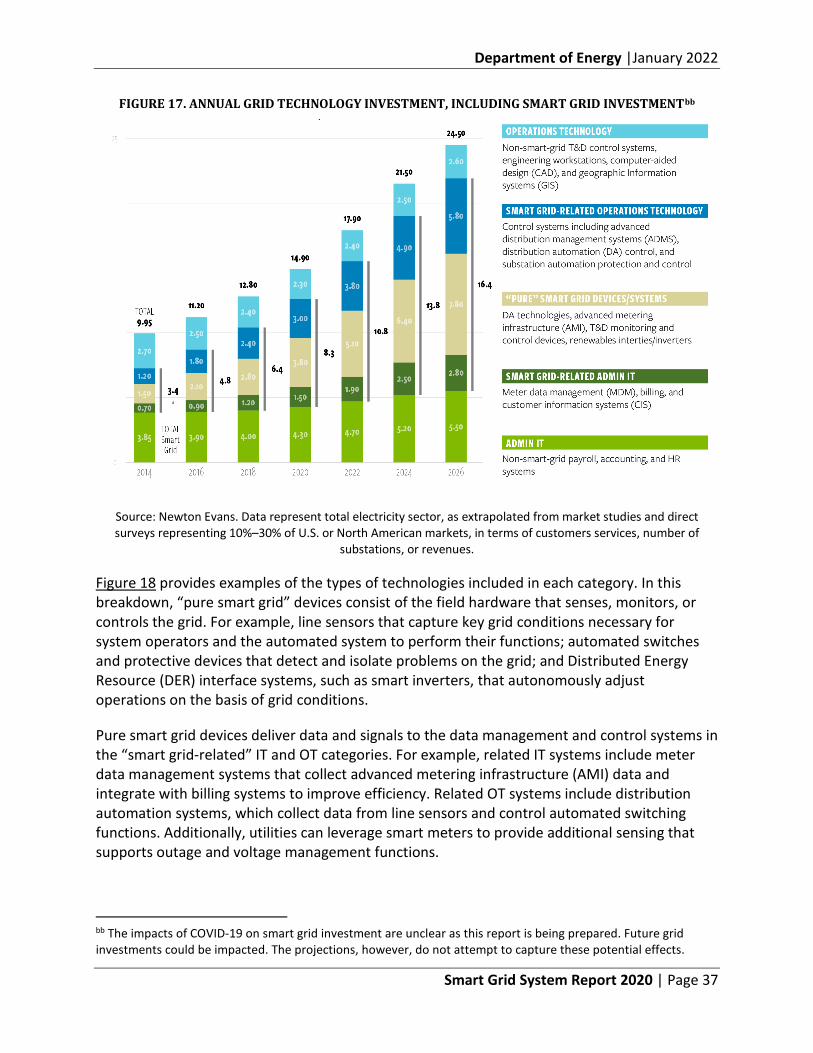
Department of Energy |January 2022
Smart Grid System Report 2020 | Page 37
FIGURE 17. ANNUAL GRID TECHNOLOGY INVESTMENT, INCLUDING SMART GRID INVESTMENTbb
Source: Newton Evans. Data represent total electricity sector, as extrapolated from market studies and direct surveys representing 10%–30% of U.S. or North American markets, in terms of customers services, number of
substations, or revenues.
Figure 18 provides examples of the types of technologies included in each category. In this breakdown, “pure smart grid” devices consist of the field hardware that senses, monitors, or controls the grid. For example, line sensors that capture key grid conditions necessary for system operators and the automated system to perform their functions; automated switches and protective devices that detect and isolate problems on the grid; and Distributed Energy Resource (DER) interface systems, such as smart inverters, that autonomously adjust operations on the basis of grid conditions.
Pure smart grid devices deliver data and signals to the data management and control systems in the “smart grid-related” IT and OT categories. For example, related IT systems include meter data management systems that collect advanced metering infrastructure (AMI) data and integrate with billing systems to improve efficiency. Related OT systems include distribution automation systems, which collect data from line sensors and control automated switching functions. Additionally, utilities can leverage smart meters to provide additional sensing that supports outage and voltage management functions.
bb The impacts of COVID-19 on smart grid investment are unclear as this report is being prepared. Future grid investments could be impacted. The projections, however, do not attempt to capture these potential effects.
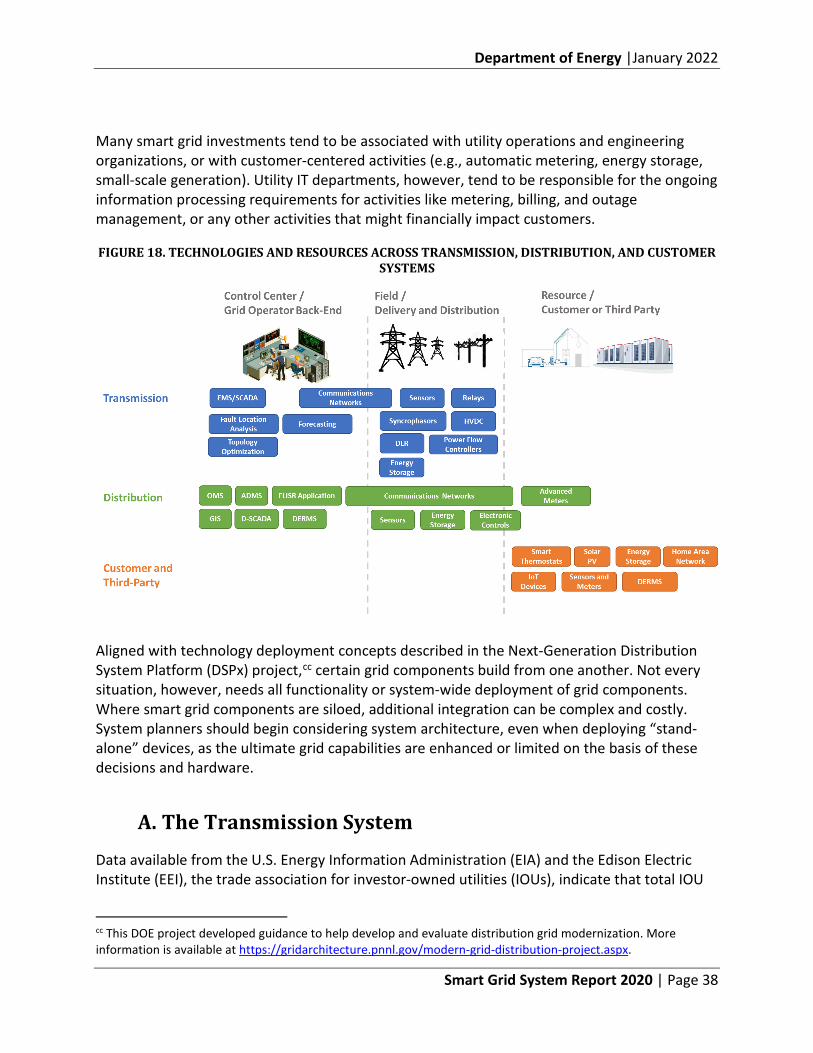
Department of Energy |January 2022
Smart Grid System Report 2020 | Page 38
Many smart grid investments tend to be associated with utility operations and engineering organizations, or with customer-centered activities (e.g., automatic metering, energy storage, small-scale generation). Utility IT departments, however, tend to be responsible for the ongoing information processing requirements for activities like metering, billing, and outage management, or any other activities that might financially impact customers.
FIGURE 18. TECHNOLOGIES AND RESOURCES ACROSS TRANSMISSION, DISTRIBUTION, AND CUSTOMER SYSTEMS
Aligned with technology deployment concepts described in the Next-Generation Distribution System Platform (DSPx) project,cc certain grid components build from one another. Not every situation, however, needs all functionality or system-wide deployment of grid components. Where smart grid components are siloed, additional integration can be complex and costly. System planners should begin considering system architecture, even when deploying “stand-alone” devices, as the ultimate grid capabilities are enhanced or limited on the basis of these decisions and hardware.
A. The Transmission System
Data available from the U.S. Energy Information Administration (EIA) and the Edison Electric Institute (EEI), the trade association for investor-owned utilities (IOUs), indicate that total IOU
cc This DOE project developed guidance to help develop and evaluate distribution grid modernization. More information is available at https://gridarchitecture.pnnl.gov/modern-grid-distribution-project.aspx.
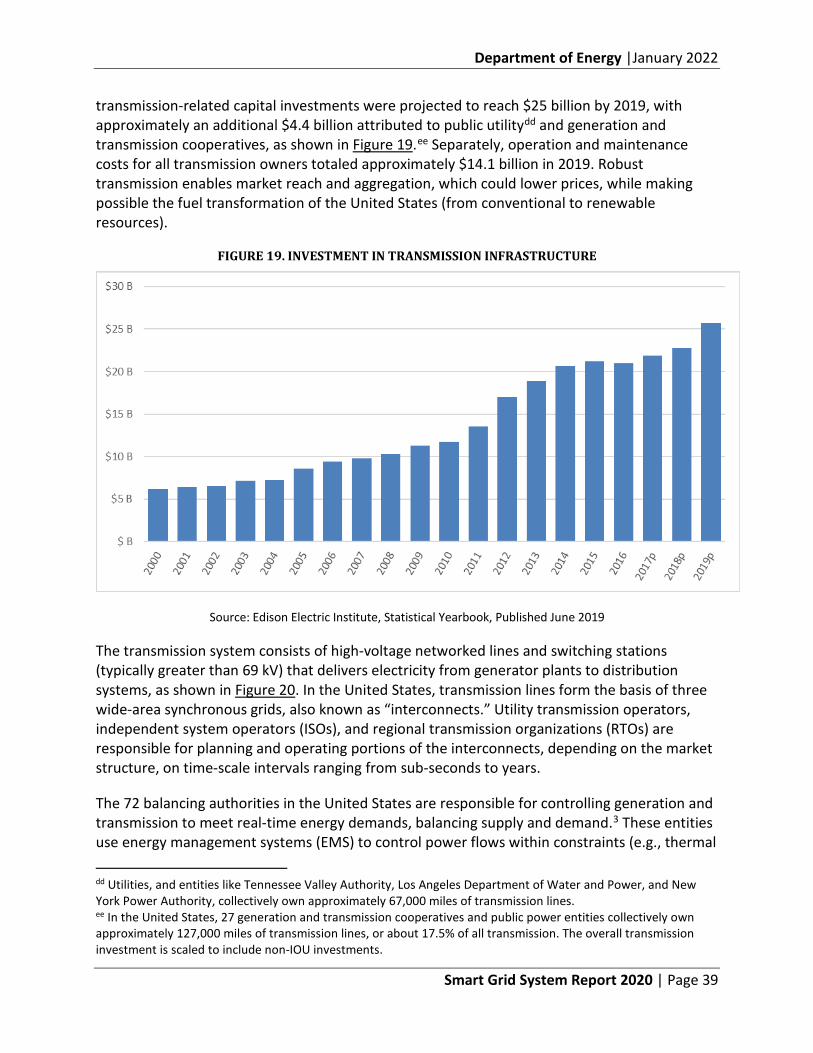
Department of Energy |January 2022
Smart Grid System Report 2020 | Page 39
transmission-related capital investments were projected to reach $25 billion by 2019, with approximately an additional $4.4 billion attributed to public utilitydd and generation and transmission cooperatives, as shown in Figure 19.ee Separately, operation and maintenance costs for all transmission owners totaled approximately $14.1 billion in 2019. Robust transmission enables market reach and aggregation, which could lower prices, while making possible the fuel transformation of the United States (from conventional to renewable resources).
FIGURE 19. INVESTMENT IN TRANSMISSION INFRASTRUCTURE
Source: Edison Electric Institute, Statistical Yearbook, Published June 2019
The transmission system consists of high-voltage networked lines and switching stations (typically greater than 69 kV) that delivers electricity from generator plants to distribution systems, as shown in Figure 20. In the United States, transmission lines form the basis of three wide-area synchronous grids, also known as “interconnects.” Utility transmission operators, independent system operators (ISOs), and regional transmission organizations (RTOs) are responsible for planning and operating portions of the interconnects, depending on the market structure, on time-scale intervals ranging from sub-seconds to years.
The 72 balancing authorities in the United States are responsible for controlling generation and transmission to meet real-time energy demands, balancing supply and demand.3 These entities use energy management systems (EMS) to control power flows within constraints (e.g., thermal
dd Utilities, and entities like Tennessee Valley Authority, Los Angeles Department of Water and Power, and New York Power Authority, collectively own approximately 67,000 miles of transmission lines. ee In the United States, 27 generation and transmission cooperatives and public power entities collectively own approximately 127,000 miles of transmission lines, or about 17.5% of all transmission. The overall transmission investment is scaled to include non-IOU investments.
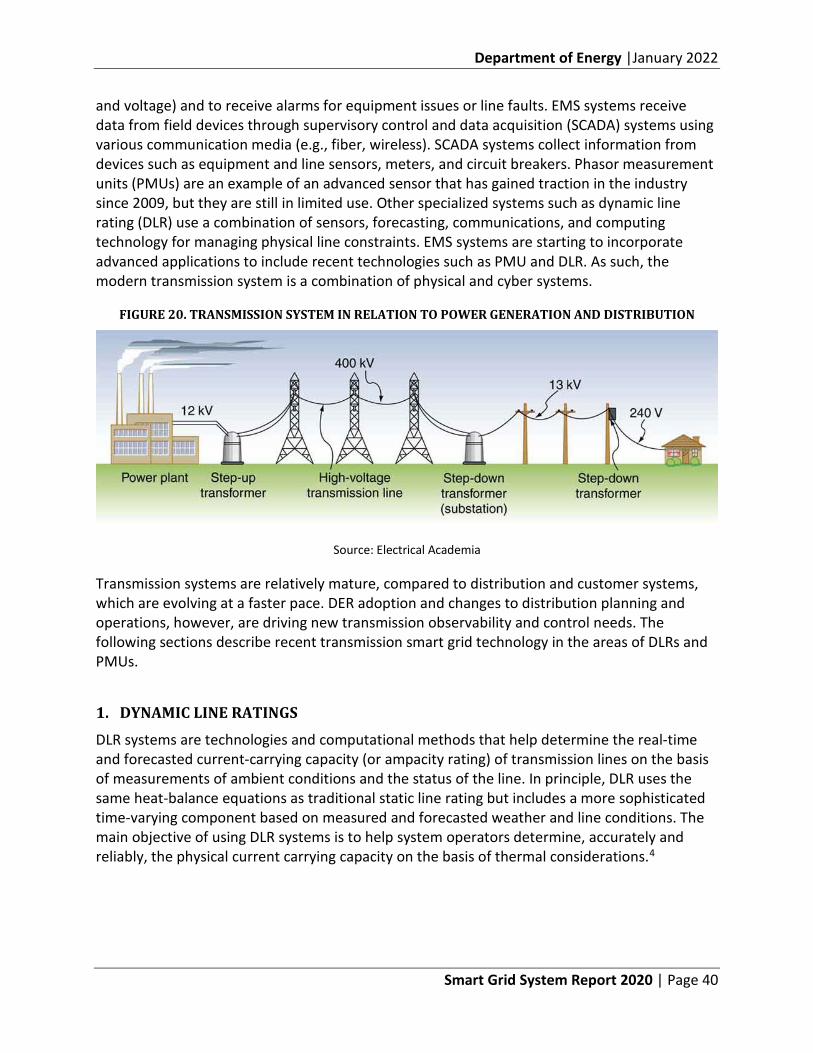
Department of Energy |January 2022
Smart Grid System Report 2020 | Page 40
and voltage) and to receive alarms for equipment issues or line faults. EMS systems receive data from field devices through supervisory control and data acquisition (SCADA) systems using various communication media (e.g., fiber, wireless). SCADA systems collect information from devices such as equipment and line sensors, meters, and circuit breakers. Phasor measurement units (PMUs) are an example of an advanced sensor that has gained traction in the industry since 2009, but they are still in limited use. Other specialized systems such as dynamic line rating (DLR) use a combination of sensors, forecasting, communications, and computing technology for managing physical line constraints. EMS systems are starting to incorporate advanced applications to include recent technologies such as PMU and DLR. As such, the modern transmission system is a combination of physical and cyber systems.
FIGURE 20. TRANSMISSION SYSTEM IN RELATION TO POWER GENERATION AND DISTRIBUTION
Source: Electrical Academia
Transmission systems are relatively mature, compared to distribution and customer systems, which are evolving at a faster pace. DER adoption and changes to distribution planning and operations, however, are driving new transmission observability and control needs. The following sections describe recent transmission smart grid technology in the areas of DLRs and PMUs.
1. DYNAMIC LINE RATINGS
DLR systems are technologies and computational methods that help determine the real-time and forecasted current-carrying capacity (or ampacity rating) of transmission lines on the basis of measurements of ambient conditions and the status of the line. In principle, DLR uses the same heat-balance equations as traditional static line rating but includes a more sophisticated time-varying component based on measured and forecasted weather and line conditions. The main objective of using DLR systems is to help system operators determine, accurately and reliably, the physical current carrying capacity on the basis of thermal considerations.4
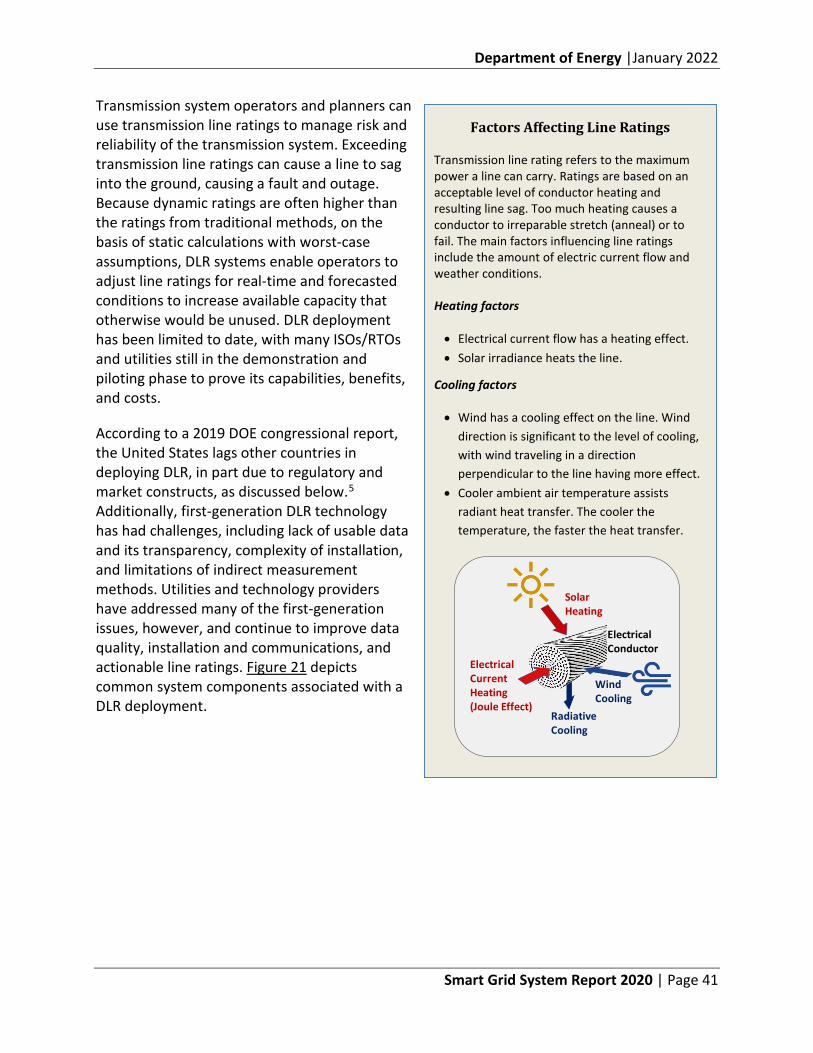
Department of Energy |January 2022
Smart Grid System Report 2020 | Page 41
Transmission system operators and planners can use transmission line ratings to manage risk and reliability of the transmission system. Exceeding transmission line ratings can cause a line to sag into the ground, causing a fault and outage. Because dynamic ratings are often higher than the ratings from traditional methods, on the basis of static calculations with worst-case assumptions, DLR systems enable operators to adjust line ratings for real-time and forecasted conditions to increase available capacity that otherwise would be unused. DLR deployment has been limited to date, with many ISOs/RTOs and utilities still in the demonstration and piloting phase to prove its capabilities, benefits, and costs.
According to a 2019 DOE congressional report, the United States lags other countries in deploying DLR, in part due to regulatory and market constructs, as discussed below.5 Additionally, first-generation DLR technology has had challenges, including lack of usable data and its transparency, complexity of installation, and limitations of indirect measurement methods. Utilities and technology providers have addressed many of the first-generation issues, however, and continue to improve data quality, installation and communications, and actionable line ratings. Figure 21 depicts common system components associated with a DLR deployment.
Factors Affecting Line Ratings
Transmission line rating refers to the maximum power a line can carry. Ratings are based on an acceptable level of conductor heating and resulting line sag. Too much heating causes a conductor to irreparable stretch (anneal) or to fail. The main factors influencing line ratings include the amount of electric current flow and weather conditions.
Heating factors
• Electrical current flow has a heating effect. • Solar irradiance heats the line.
Cooling factors
• Wind has a cooling effect on the line. Wind direction is significant to the level of cooling, with wind traveling in a direction perpendicular to the line having more effect.
• Cooler ambient air temperature assists radiant heat transfer. The cooler the temperature, the faster the heat transfer.
Electrical CurrentHeating (Joule Effect)
Solar Heating
Wind Cooling
Electrical Conductor
Radiative Cooling
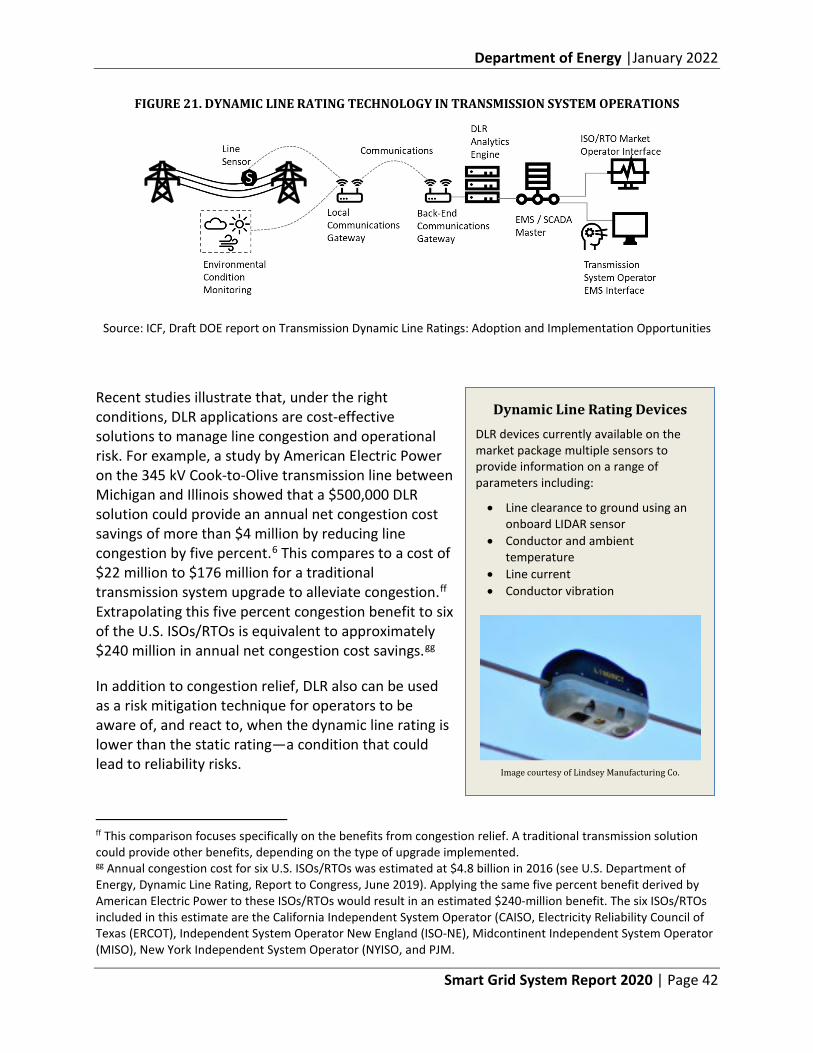
Department of Energy |January 2022
Smart Grid System Report 2020 | Page 42
FIGURE 21. DYNAMIC LINE RATING TECHNOLOGY IN TRANSMISSION SYSTEM OPERATIONS
Source: ICF, Draft DOE report on Transmission Dynamic Line Ratings: Adoption and Implementation Opportunities
Recent studies illustrate that, under the right conditions, DLR applications are cost-effective solutions to manage line congestion and operational risk. For example, a study by American Electric Power on the 345 kV Cook-to-Olive transmission line between Michigan and Illinois showed that a $500,000 DLR solution could provide an annual net congestion cost savings of more than $4 million by reducing line congestion by five percent.6 This compares to a cost of $22 million to $176 million for a traditional transmission system upgrade to alleviate congestion.ff Extrapolating this five percent congestion benefit to six of the U.S. ISOs/RTOs is equivalent to approximately $240 million in annual net congestion cost savings.gg
In addition to congestion relief, DLR also can be used as a risk mitigation technique for operators to be aware of, and react to, when the dynamic line rating is lower than the static rating—a condition that could lead to reliability risks.
ff This comparison focuses specifically on the benefits from congestion relief. A traditional transmission solution could provide other benefits, depending on the type of upgrade implemented. gg Annual congestion cost for six U.S. ISOs/RTOs was estimated at $4.8 billion in 2016 (see U.S. Department of Energy, Dynamic Line Rating, Report to Congress, June 2019). Applying the same five percent benefit derived by American Electric Power to these ISOs/RTOs would result in an estimated $240-million benefit. The six ISOs/RTOs included in this estimate are the California Independent System Operator (CAISO, Electricity Reliability Council of Texas (ERCOT), Independent System Operator New England (ISO-NE), Midcontinent Independent System Operator (MISO), New York Independent System Operator (NYISO, and PJM.
Dynamic Line Rating Devices DLR devices currently available on the market package multiple sensors to provide information on a range of parameters including:
• Line clearance to ground using an onboard LIDAR sensor
• Conductor and ambient temperature
• Line current • Conductor vibration
Image courtesy of Lindsey Manufacturing Co.
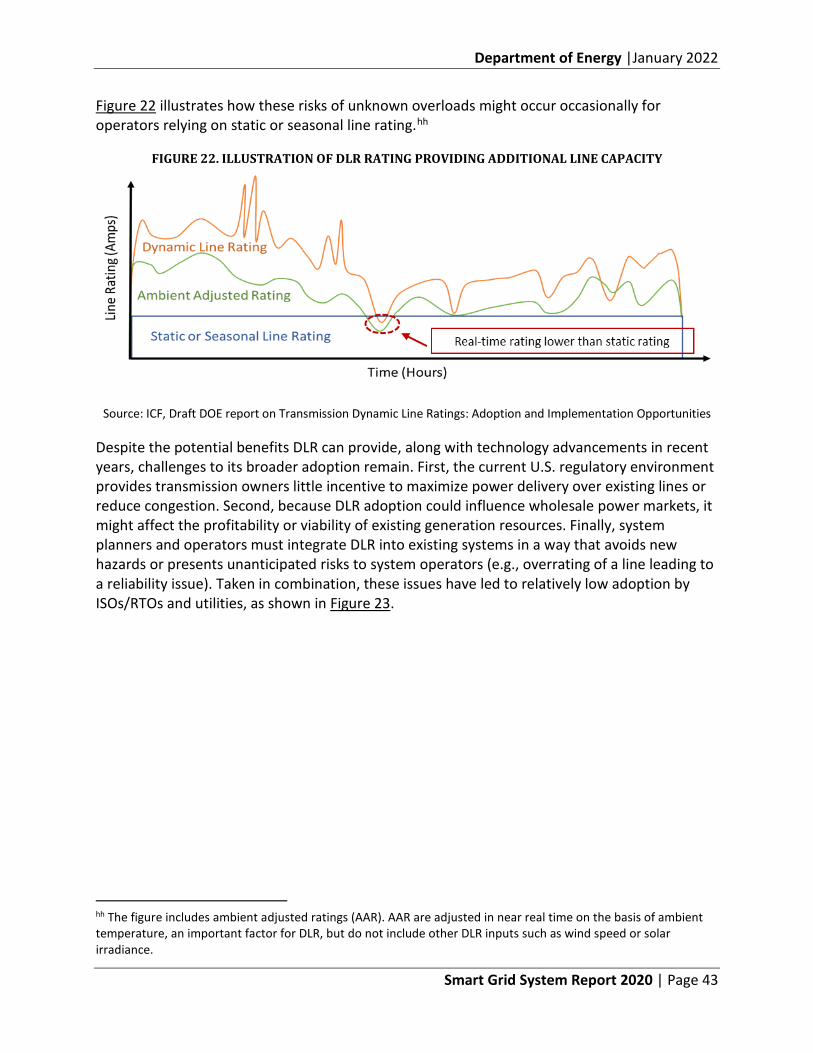
Department of Energy |January 2022
Smart Grid System Report 2020 | Page 43
Figure 22 illustrates how these risks of unknown overloads might occur occasionally for operators relying on static or seasonal line rating.hh
FIGURE 22. ILLUSTRATION OF DLR RATING PROVIDING ADDITIONAL LINE CAPACITY
Source: ICF, Draft DOE report on Transmission Dynamic Line Ratings: Adoption and Implementation Opportunities
Despite the potential benefits DLR can provide, along with technology advancements in recent years, challenges to its broader adoption remain. First, the current U.S. regulatory environment provides transmission owners little incentive to maximize power delivery over existing lines or reduce congestion. Second, because DLR adoption could influence wholesale power markets, it might affect the profitability or viability of existing generation resources. Finally, system planners and operators must integrate DLR into existing systems in a way that avoids new hazards or presents unanticipated risks to system operators (e.g., overrating of a line leading to a reliability issue). Taken in combination, these issues have led to relatively low adoption by ISOs/RTOs and utilities, as shown in Figure 23.
hh The figure includes ambient adjusted ratings (AAR). AAR are adjusted in near real time on the basis of ambient temperature, an important factor for DLR, but do not include other DLR inputs such as wind speed or solar irradiance.
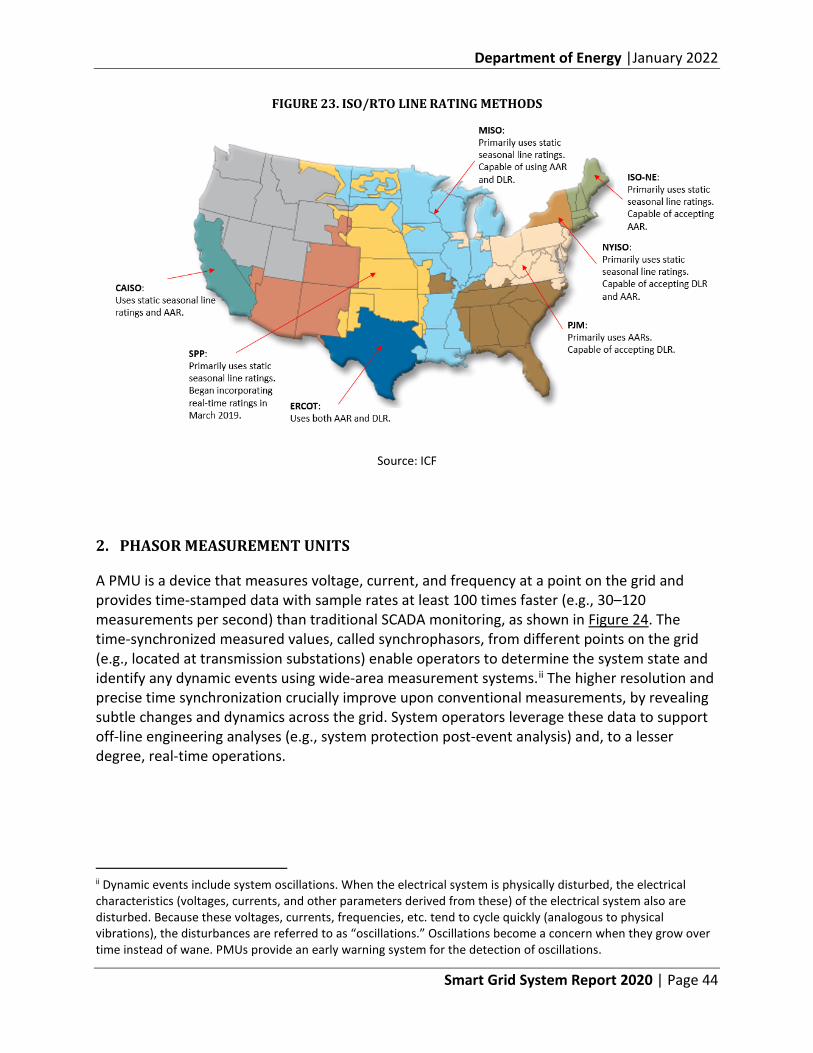
Department of Energy |January 2022
Smart Grid System Report 2020 | Page 44
FIGURE 23. ISO/RTO LINE RATING METHODS
Source: ICF
2. PHASOR MEASUREMENT UNITS
A PMU is a device that measures voltage, current, and frequency at a point on the grid and provides time-stamped data with sample rates at least 100 times faster (e.g., 30–120 measurements per second) than traditional SCADA monitoring, as shown in Figure 24. The time-synchronized measured values, called synchrophasors, from different points on the grid (e.g., located at transmission substations) enable operators to determine the system state and identify any dynamic events using wide-area measurement systems.ii The higher resolution and precise time synchronization crucially improve upon conventional measurements, by revealing subtle changes and dynamics across the grid. System operators leverage these data to support off-line engineering analyses (e.g., system protection post-event analysis) and, to a lesser degree, real-time operations.
ii Dynamic events include system oscillations. When the electrical system is physically disturbed, the electrical characteristics (voltages, currents, and other parameters derived from these) of the electrical system also are disturbed. Because these voltages, currents, frequencies, etc. tend to cycle quickly (analogous to physical vibrations), the disturbances are referred to as “oscillations.” Oscillations become a concern when they grow over time instead of wane. PMUs provide an early warning system for the detection of oscillations.
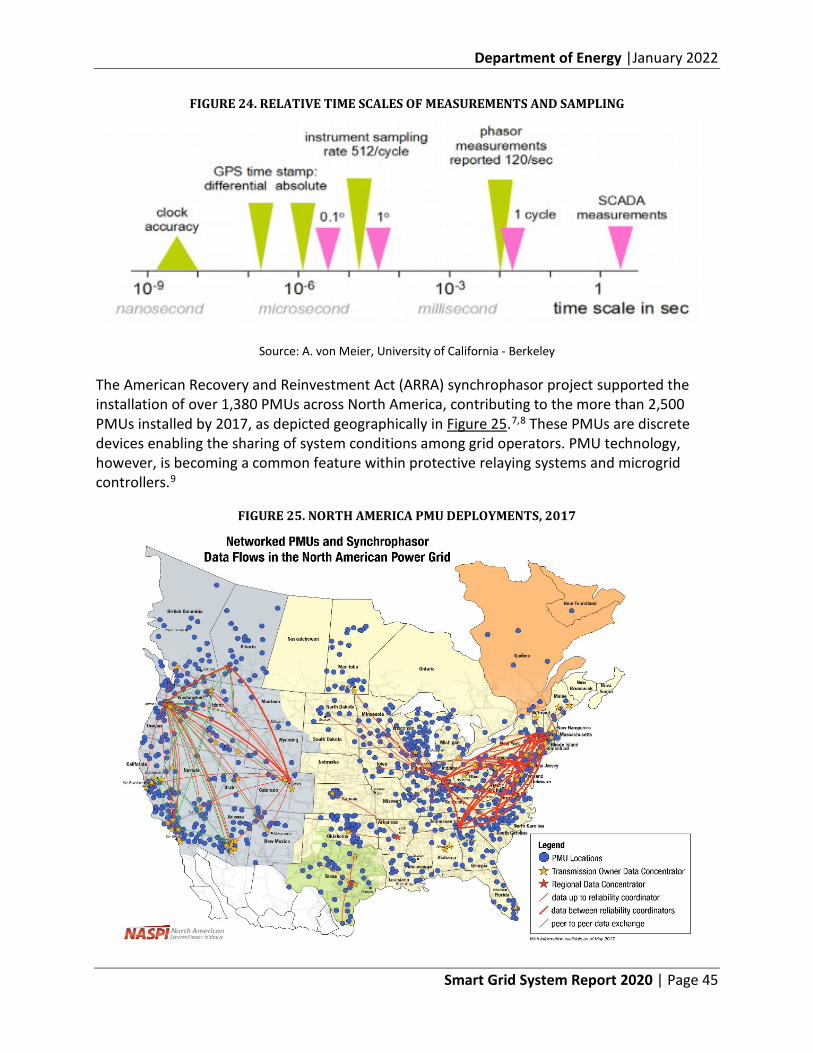
Department of Energy |January 2022
Smart Grid System Report 2020 | Page 45
FIGURE 24. RELATIVE TIME SCALES OF MEASUREMENTS AND SAMPLING
Source: A. von Meier, University of California - Berkeley
The American Recovery and Reinvestment Act (ARRA) synchrophasor project supported the installation of over 1,380 PMUs across North America, contributing to the more than 2,500 PMUs installed by 2017, as depicted geographically in Figure 25.7,8 These PMUs are discrete devices enabling the sharing of system conditions among grid operators. PMU technology, however, is becoming a common feature within protective relaying systems and microgrid controllers.9
FIGURE 25. NORTH AMERICA PMU DEPLOYMENTS, 2017
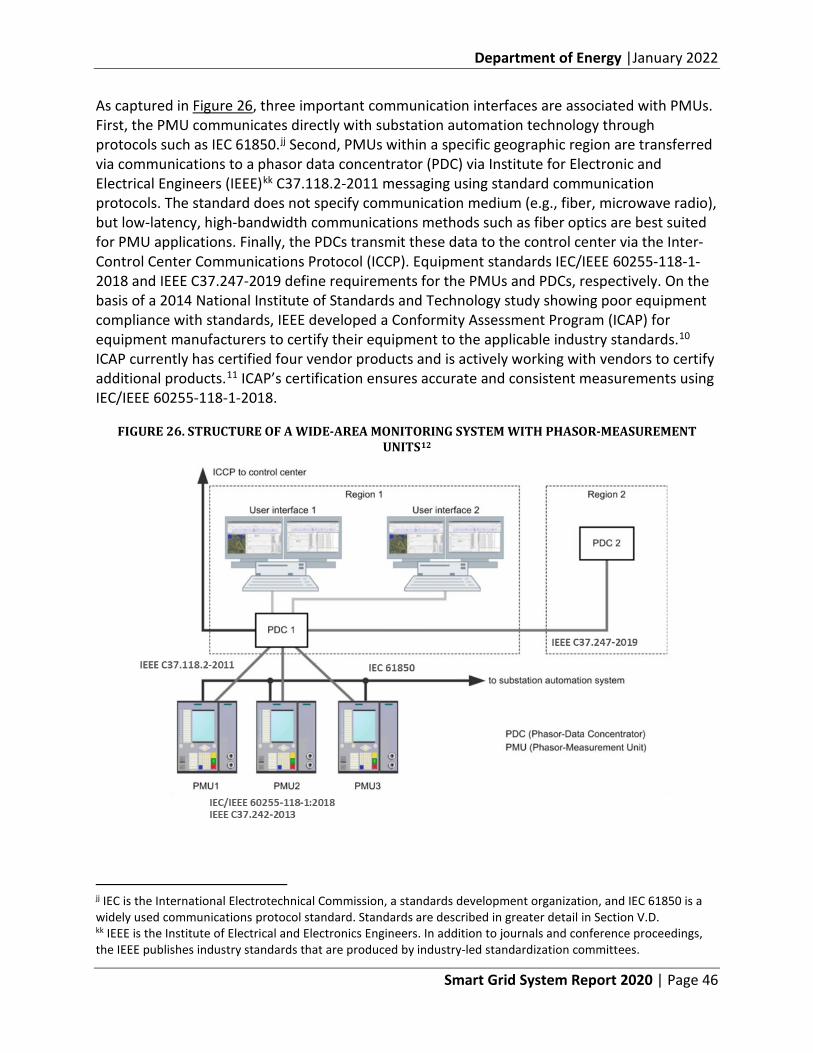
Department of Energy |January 2022
Smart Grid System Report 2020 | Page 46
As captured in Figure 26, three important communication interfaces are associated with PMUs. First, the PMU communicates directly with substation automation technology through protocols such as IEC 61850.jj Second, PMUs within a specific geographic region are transferred via communications to a phasor data concentrator (PDC) via Institute for Electronic and Electrical Engineers (IEEE)kk C37.118.2-2011 messaging using standard communication protocols. The standard does not specify communication medium (e.g., fiber, microwave radio), but low-latency, high-bandwidth communications methods such as fiber optics are best suited for PMU applications. Finally, the PDCs transmit these data to the control center via the Inter-Control Center Communications Protocol (ICCP). Equipment standards IEC/IEEE 60255-118-1-2018 and IEEE C37.247-2019 define requirements for the PMUs and PDCs, respectively. On the basis of a 2014 National Institute of Standards and Technology study showing poor equipment compliance with standards, IEEE developed a Conformity Assessment Program (ICAP) for equipment manufacturers to certify their equipment to the applicable industry standards.10 ICAP currently has certified four vendor products and is actively working with vendors to certify additional products.11 ICAP’s certification ensures accurate and consistent measurements using IEC/IEEE 60255-118-1-2018.
FIGURE 26. STRUCTURE OF A WIDE-AREA MONITORING SYSTEM WITH PHASOR-MEASUREMENT UNITS12
jj IEC is the International Electrotechnical Commission, a standards development organization, and IEC 61850 is a widely used communications protocol standard. Standards are described in greater detail in Section V.D. kk IEEE is the Institute of Electrical and Electronics Engineers. In addition to journals and conference proceedings, the IEEE publishes industry standards that are produced by industry-led standardization committees.
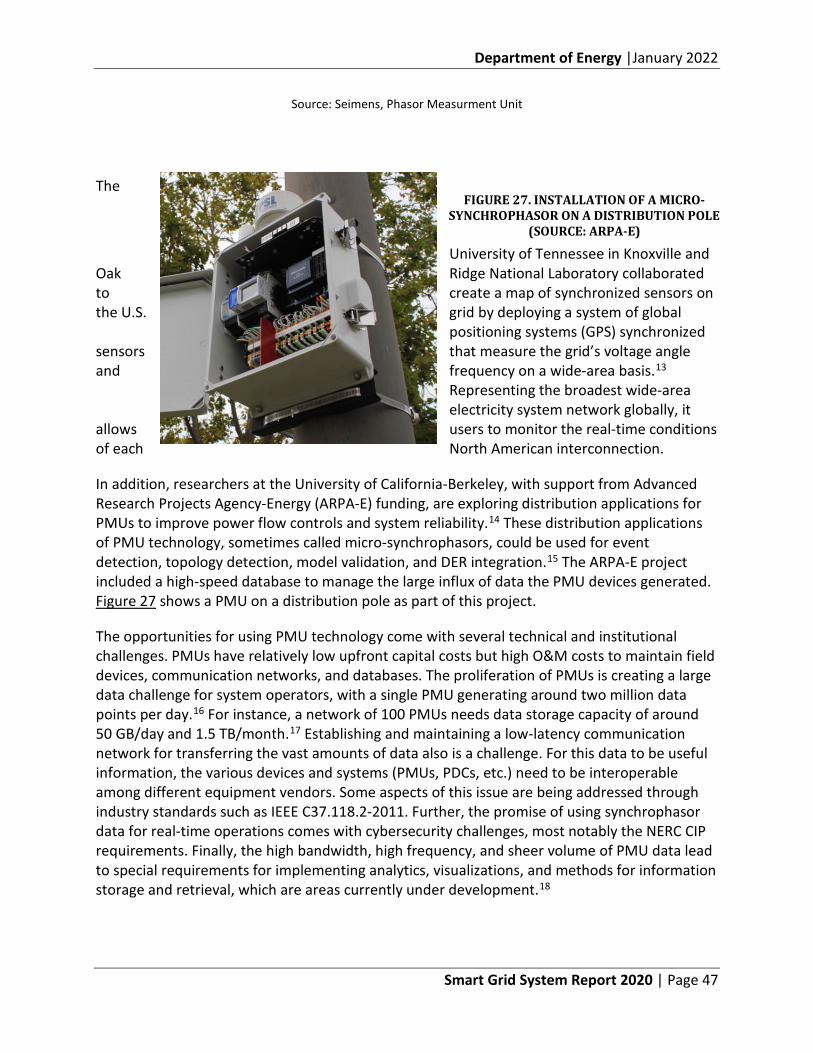
Department of Energy |January 2022
Smart Grid System Report 2020 | Page 47
Source: Seimens, Phasor Measurment Unit
The
University of Tennessee in Knoxville and Oak Ridge National Laboratory collaborated to create a map of synchronized sensors on the U.S. grid by deploying a system of global
positioning systems (GPS) synchronized sensors that measure the grid’s voltage angle and frequency on a wide-area basis.13
Representing the broadest wide-area electricity system network globally, it
allows users to monitor the real-time conditions of each North American interconnection.
In addition, researchers at the University of California-Berkeley, with support from Advanced Research Projects Agency-Energy (ARPA-E) funding, are exploring distribution applications for PMUs to improve power flow controls and system reliability.14 These distribution applications of PMU technology, sometimes called micro-synchrophasors, could be used for event detection, topology detection, model validation, and DER integration.15 The ARPA-E project included a high-speed database to manage the large influx of data the PMU devices generated. Figure 27 shows a PMU on a distribution pole as part of this project.
The opportunities for using PMU technology come with several technical and institutional challenges. PMUs have relatively low upfront capital costs but high O&M costs to maintain field devices, communication networks, and databases. The proliferation of PMUs is creating a large data challenge for system operators, with a single PMU generating around two million data points per day.16 For instance, a network of 100 PMUs needs data storage capacity of around 50 GB/day and 1.5 TB/month.17 Establishing and maintaining a low-latency communication network for transferring the vast amounts of data also is a challenge. For this data to be useful information, the various devices and systems (PMUs, PDCs, etc.) need to be interoperable among different equipment vendors. Some aspects of this issue are being addressed through industry standards such as IEEE C37.118.2-2011. Further, the promise of using synchrophasor data for real-time operations comes with cybersecurity challenges, most notably the NERC CIP requirements. Finally, the high bandwidth, high frequency, and sheer volume of PMU data lead to special requirements for implementing analytics, visualizations, and methods for information storage and retrieval, which are areas currently under development.18
FIGURE 27. INSTALLATION OF A MICRO-SYNCHROPHASOR ON A DISTRIBUTION POLE
(SOURCE: ARPA-E)
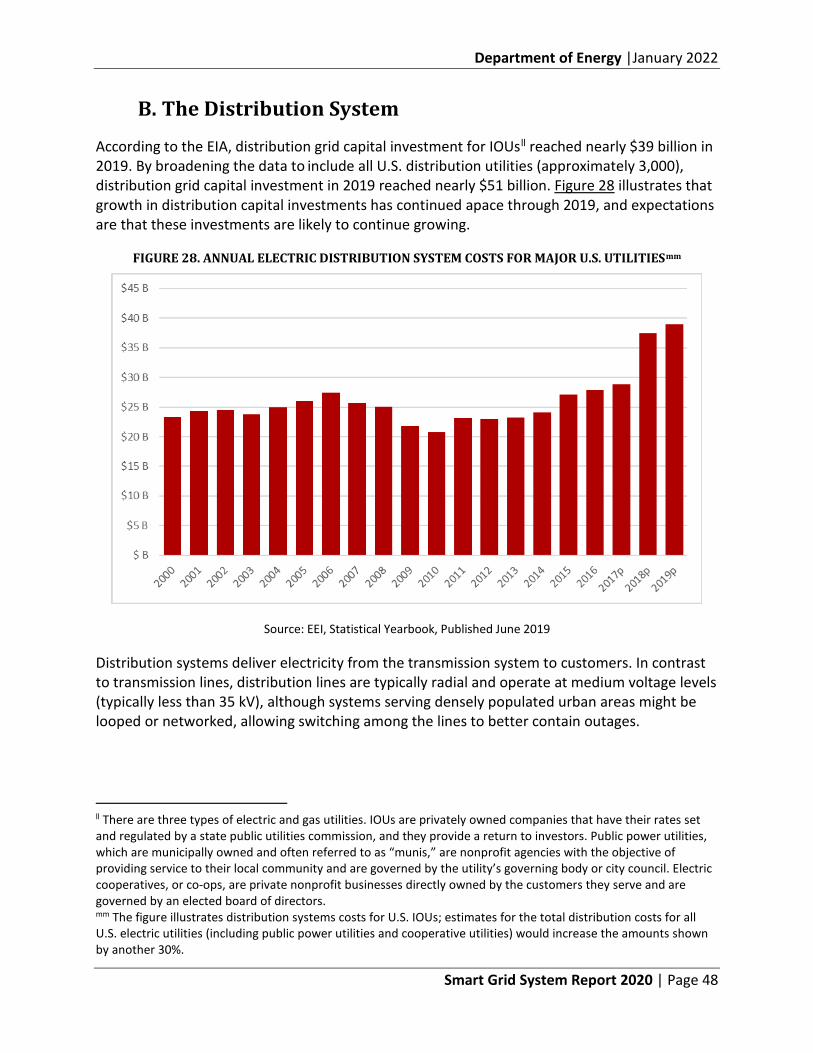
Department of Energy |January 2022
Smart Grid System Report 2020 | Page 48
B. The Distribution System
According to the EIA, distribution grid capital investment for IOUsll reached nearly $39 billion in 2019. By broadening the data to include all U.S. distribution utilities (approximately 3,000), distribution grid capital investment in 2019 reached nearly $51 billion. Figure 28 illustrates that growth in distribution capital investments has continued apace through 2019, and expectations are that these investments are likely to continue growing.
FIGURE 28. ANNUAL ELECTRIC DISTRIBUTION SYSTEM COSTS FOR MAJOR U.S. UTILITIESmm
Source: EEI, Statistical Yearbook, Published June 2019
Distribution systems deliver electricity from the transmission system to customers. In contrast to transmission lines, distribution lines are typically radial and operate at medium voltage levels (typically less than 35 kV), although systems serving densely populated urban areas might be looped or networked, allowing switching among the lines to better contain outages.
ll There are three types of electric and gas utilities. IOUs are privately owned companies that have their rates set and regulated by a state public utilities commission, and they provide a return to investors. Public power utilities, which are municipally owned and often referred to as “munis,” are nonprofit agencies with the objective of providing service to their local community and are governed by the utility’s governing body or city council. Electric cooperatives, or co-ops, are private nonprofit businesses directly owned by the customers they serve and are governed by an elected board of directors. mm The figure illustrates distribution systems costs for U.S. IOUs; estimates for the total distribution costs for all U.S. electric utilities (including public power utilities and cooperative utilities) would increase the amounts shown by another 30%.
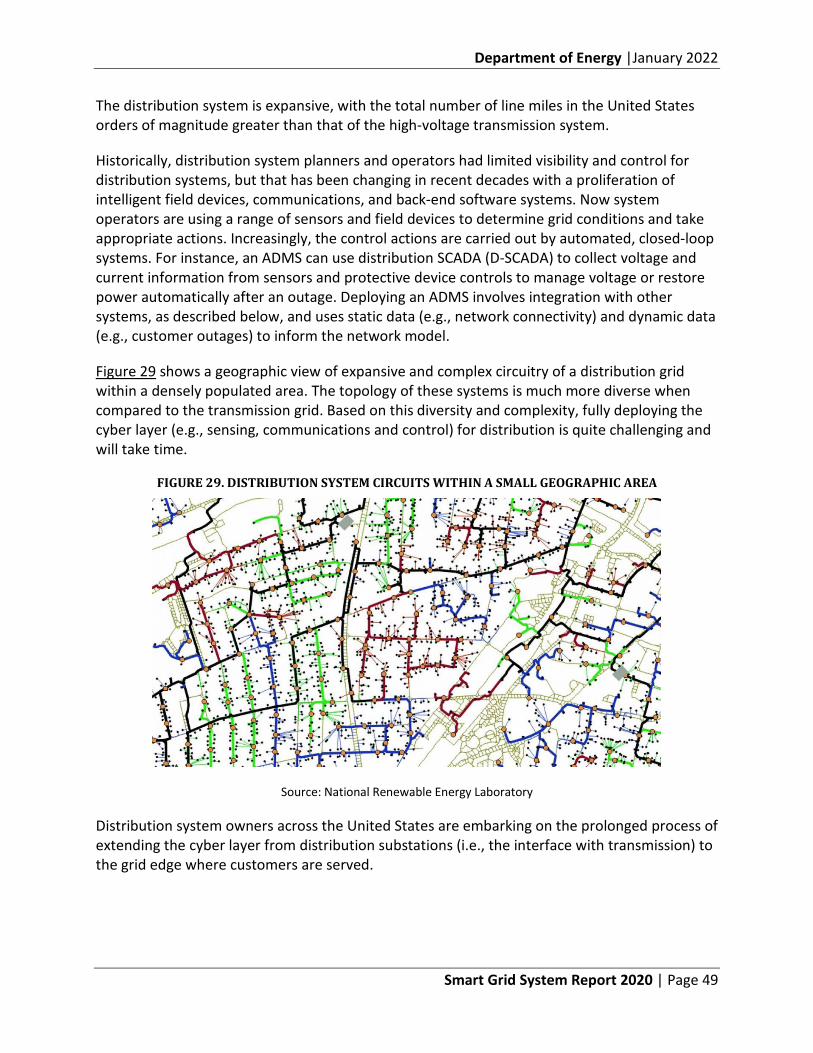
Department of Energy |January 2022
Smart Grid System Report 2020 | Page 49
The distribution system is expansive, with the total number of line miles in the United States orders of magnitude greater than that of the high-voltage transmission system.
Historically, distribution system planners and operators had limited visibility and control for distribution systems, but that has been changing in recent decades with a proliferation of intelligent field devices, communications, and back-end software systems. Now system operators are using a range of sensors and field devices to determine grid conditions and take appropriate actions. Increasingly, the control actions are carried out by automated, closed-loop systems. For instance, an ADMS can use distribution SCADA (D-SCADA) to collect voltage and current information from sensors and protective device controls to manage voltage or restore power automatically after an outage. Deploying an ADMS involves integration with other systems, as described below, and uses static data (e.g., network connectivity) and dynamic data (e.g., customer outages) to inform the network model.
Figure 29 shows a geographic view of expansive and complex circuitry of a distribution grid within a densely populated area. The topology of these systems is much more diverse when compared to the transmission grid. Based on this diversity and complexity, fully deploying the cyber layer (e.g., sensing, communications and control) for distribution is quite challenging and will take time.
FIGURE 29. DISTRIBUTION SYSTEM CIRCUITS WITHIN A SMALL GEOGRAPHIC AREA
Source: National Renewable Energy Laboratory
Distribution system owners across the United States are embarking on the prolonged process of extending the cyber layer from distribution substations (i.e., the interface with transmission) to the grid edge where customers are served.

Department of Energy |January 2022
Smart Grid System Report 2020 | Page 50
In practice, this extension involves deploying sensors, intelligent controls, communications networks, and computing and software applications across a broad swath of the system to meet specific objectives, typically through a planning process as discussed in Section V.B. The following sections describe technologies and applications that are part of the distribution system transformation currently underway.
1. ADVANCED DISTRIBUTION MANAGEMENT SYSTEMS
ADMS support grid operations and can collect, organize, display, and analyze real-time distribution system information across several systems. These systems allow operators to manage distribution system operations to increase system efficiency, improve reliability, and prevent overloads. By interacting with other operational systems such as a GIS, OMS, and customer information system (CIS), an ADMS can create an integrated view of distribution operations.19,20 Figure 30 shows an ADMS display that integrates static and dynamic data from the substation, field devices, and a variety of systems to provide additional insight into grid operations. ADMS systems have features useful to distribution planners, such as an accurate, well-maintained network model and more granular historical power flow data.
FIGURE 30. EXAMPLE ADMS DISPLAY
Source: Quasar
An ADMS provides utilities a centralized system that can enable applications for managing the grid. The most common functions utilities use as part of existing ADMS deployments are fault
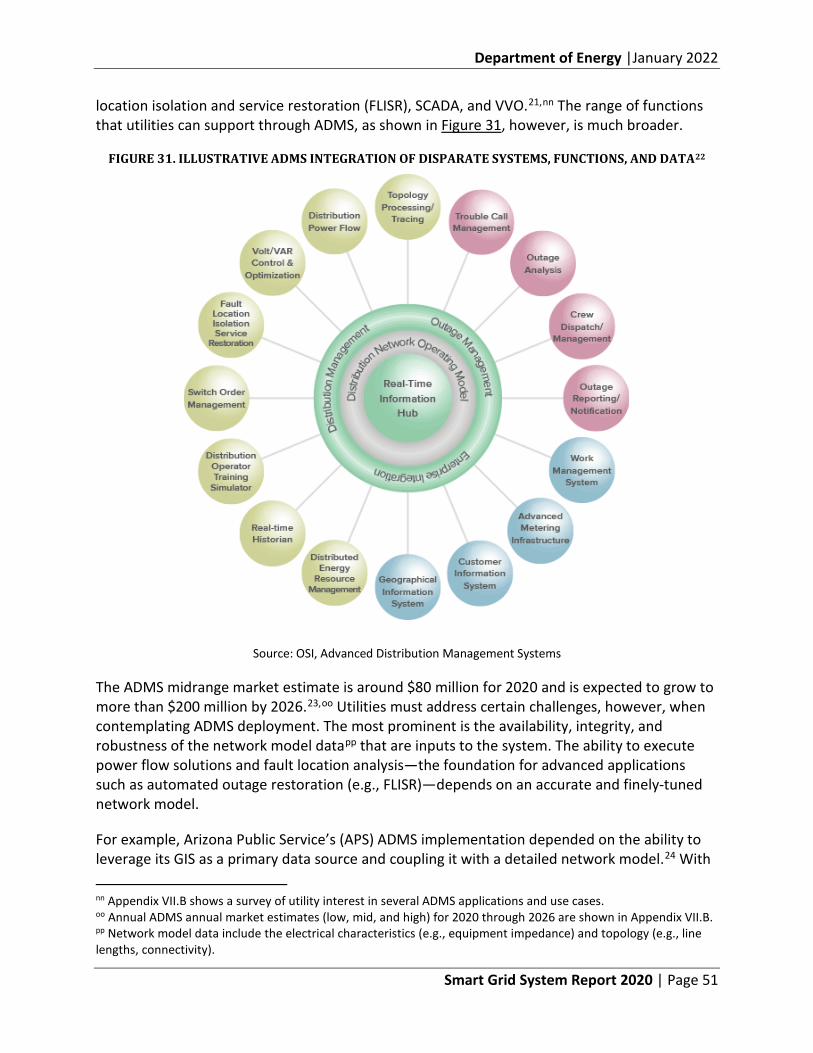
Department of Energy |January 2022
Smart Grid System Report 2020 | Page 51
location isolation and service restoration (FLISR), SCADA, and VVO.21,nn The range of functions that utilities can support through ADMS, as shown in Figure 31, however, is much broader.
FIGURE 31. ILLUSTRATIVE ADMS INTEGRATION OF DISPARATE SYSTEMS, FUNCTIONS, AND DATA22
Source: OSI, Advanced Distribution Management Systems
The ADMS midrange market estimate is around $80 million for 2020 and is expected to grow to more than $200 million by 2026.23,oo Utilities must address certain challenges, however, when contemplating ADMS deployment. The most prominent is the availability, integrity, and robustness of the network model datapp that are inputs to the system. The ability to execute power flow solutions and fault location analysis—the foundation for advanced applications such as automated outage restoration (e.g., FLISR)—depends on an accurate and finely-tuned network model.
For example, Arizona Public Service’s (APS) ADMS implementation depended on the ability to leverage its GIS as a primary data source and coupling it with a detailed network model.24 With
nn Appendix VII.B shows a survey of utility interest in several ADMS applications and use cases. oo Annual ADMS annual market estimates (low, mid, and high) for 2020 through 2026 are shown in Appendix VII.B. pp Network model data include the electrical characteristics (e.g., equipment impedance) and topology (e.g., line lengths, connectivity).
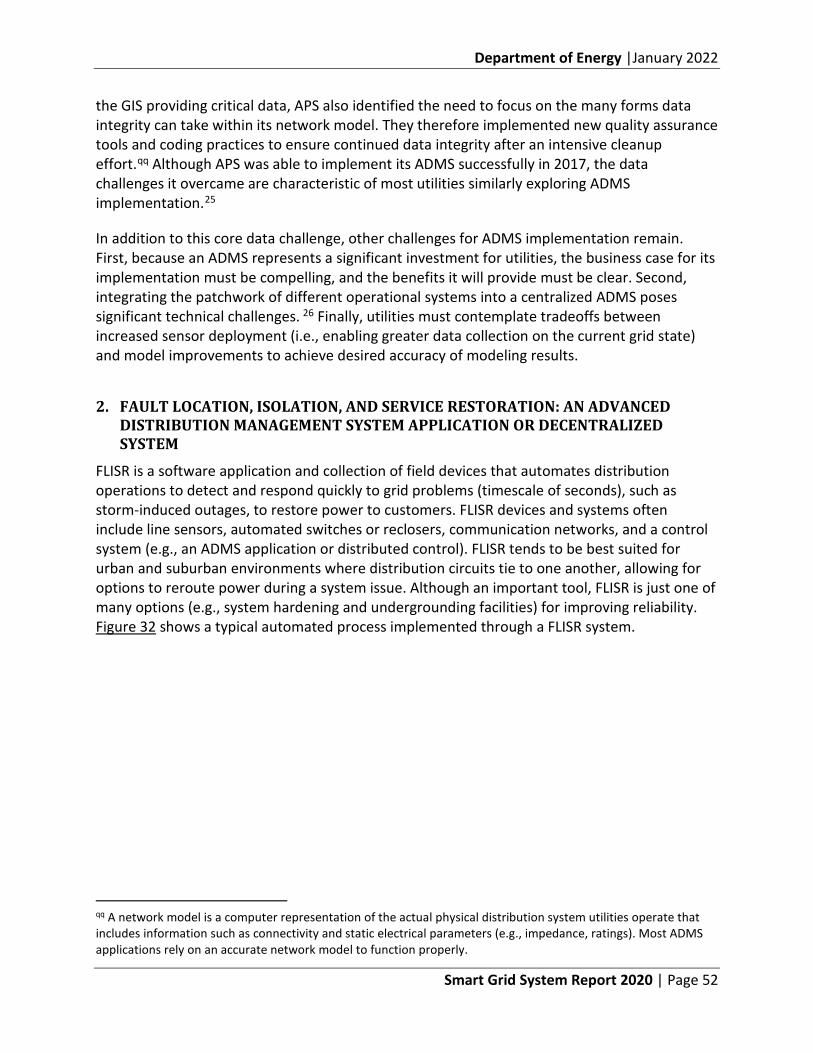
Department of Energy |January 2022
Smart Grid System Report 2020 | Page 52
the GIS providing critical data, APS also identified the need to focus on the many forms data integrity can take within its network model. They therefore implemented new quality assurance tools and coding practices to ensure continued data integrity after an intensive cleanup effort.qq Although APS was able to implement its ADMS successfully in 2017, the data challenges it overcame are characteristic of most utilities similarly exploring ADMS implementation.25
In addition to this core data challenge, other challenges for ADMS implementation remain. First, because an ADMS represents a significant investment for utilities, the business case for its implementation must be compelling, and the benefits it will provide must be clear. Second, integrating the patchwork of different operational systems into a centralized ADMS poses significant technical challenges. 26 Finally, utilities must contemplate tradeoffs between increased sensor deployment (i.e., enabling greater data collection on the current grid state) and model improvements to achieve desired accuracy of modeling results.
2. FAULT LOCATION, ISOLATION, AND SERVICE RESTORATION: AN ADVANCED DISTRIBUTION MANAGEMENT SYSTEM APPLICATION OR DECENTRALIZED SYSTEM
FLISR is a software application and collection of field devices that automates distribution operations to detect and respond quickly to grid problems (timescale of seconds), such as storm-induced outages, to restore power to customers. FLISR devices and systems often include line sensors, automated switches or reclosers, communication networks, and a control system (e.g., an ADMS application or distributed control). FLISR tends to be best suited for urban and suburban environments where distribution circuits tie to one another, allowing for options to reroute power during a system issue. Although an important tool, FLISR is just one of many options (e.g., system hardening and undergrounding facilities) for improving reliability. Figure 32 shows a typical automated process implemented through a FLISR system.
qq A network model is a computer representation of the actual physical distribution system utilities operate that includes information such as connectivity and static electrical parameters (e.g., impedance, ratings). Most ADMS applications rely on an accurate network model to function properly.
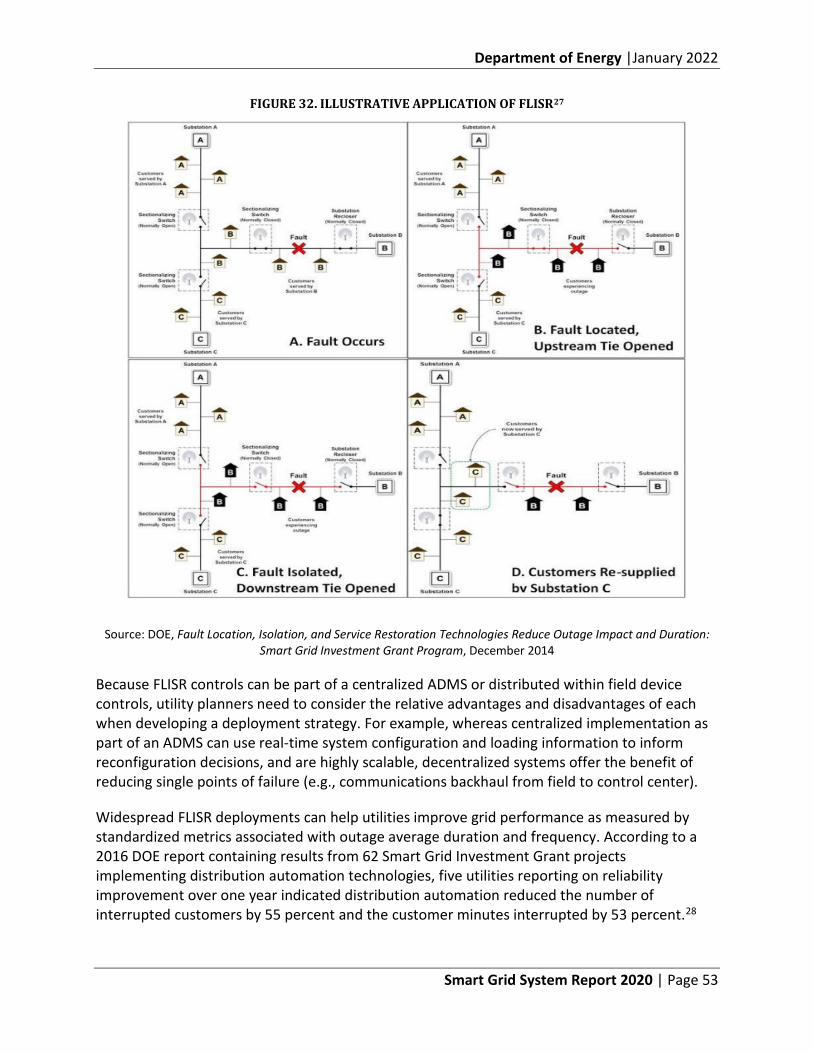
Department of Energy |January 2022
Smart Grid System Report 2020 | Page 53
FIGURE 32. ILLUSTRATIVE APPLICATION OF FLISR27
Source: DOE, Fault Location, Isolation, and Service Restoration Technologies Reduce Outage Impact and Duration: Smart Grid Investment Grant Program, December 2014
Because FLISR controls can be part of a centralized ADMS or distributed within field device controls, utility planners need to consider the relative advantages and disadvantages of each when developing a deployment strategy. For example, whereas centralized implementation as part of an ADMS can use real-time system configuration and loading information to inform reconfiguration decisions, and are highly scalable, decentralized systems offer the benefit of reducing single points of failure (e.g., communications backhaul from field to control center).
Widespread FLISR deployments can help utilities improve grid performance as measured by standardized metrics associated with outage average duration and frequency. According to a 2016 DOE report containing results from 62 Smart Grid Investment Grant projects implementing distribution automation technologies, five utilities reporting on reliability improvement over one year indicated distribution automation reduced the number of interrupted customers by 55 percent and the customer minutes interrupted by 53 percent.28
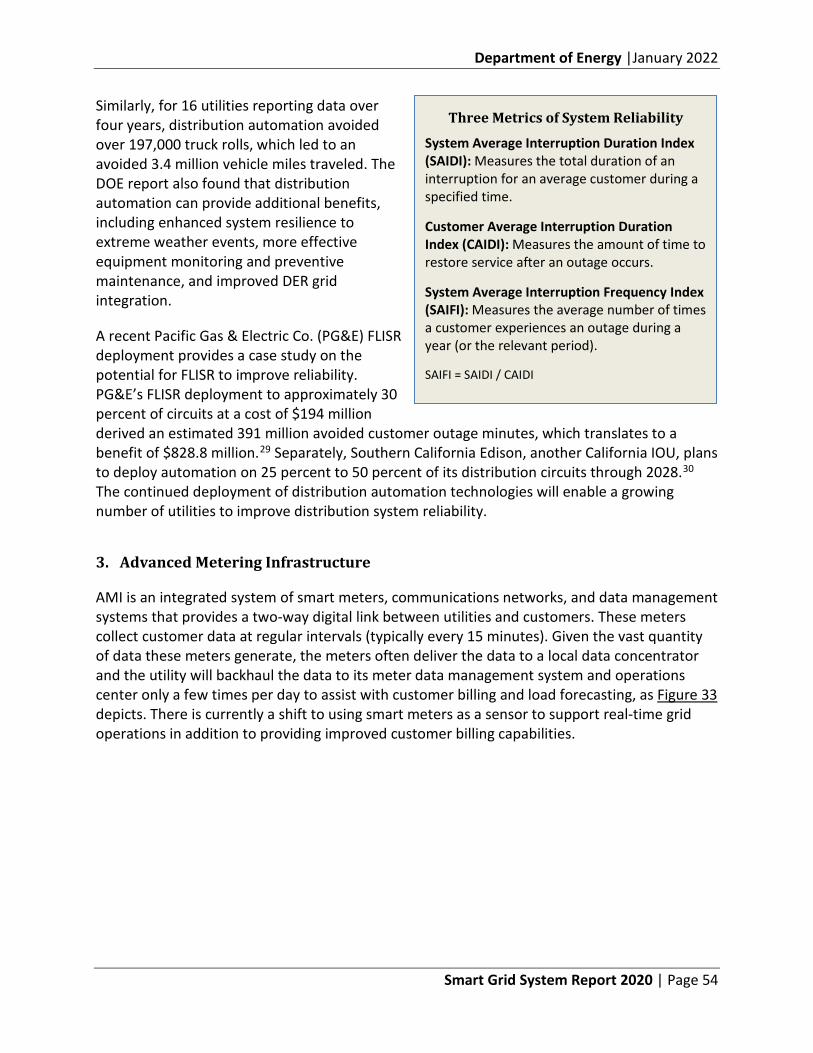
Department of Energy |January 2022
Smart Grid System Report 2020 | Page 54
Similarly, for 16 utilities reporting data over four years, distribution automation avoided over 197,000 truck rolls, which led to an avoided 3.4 million vehicle miles traveled. The DOE report also found that distribution automation can provide additional benefits, including enhanced system resilience to extreme weather events, more effective equipment monitoring and preventive maintenance, and improved DER grid integration.
A recent Pacific Gas & Electric Co. (PG&E) FLISR deployment provides a case study on the potential for FLISR to improve reliability. PG&E’s FLISR deployment to approximately 30 percent of circuits at a cost of $194 million derived an estimated 391 million avoided customer outage minutes, which translates to a benefit of $828.8 million.29 Separately, Southern California Edison, another California IOU, plans to deploy automation on 25 percent to 50 percent of its distribution circuits through 2028.30 The continued deployment of distribution automation technologies will enable a growing number of utilities to improve distribution system reliability.
3. Advanced Metering Infrastructure
AMI is an integrated system of smart meters, communications networks, and data management systems that provides a two-way digital link between utilities and customers. These meters collect customer data at regular intervals (typically every 15 minutes). Given the vast quantity of data these meters generate, the meters often deliver the data to a local data concentrator and the utility will backhaul the data to its meter data management system and operations center only a few times per day to assist with customer billing and load forecasting, as Figure 33 depicts. There is currently a shift to using smart meters as a sensor to support real-time grid operations in addition to providing improved customer billing capabilities.
Three Metrics of System Reliability
System Average Interruption Duration Index (SAIDI): Measures the total duration of an interruption for an average customer during a specified time.
Customer Average Interruption Duration Index (CAIDI): Measures the amount of time to restore service after an outage occurs.
System Average Interruption Frequency Index (SAIFI): Measures the average number of times a customer experiences an outage during a year (or the relevant period).
SAIFI = SAIDI / CAIDI
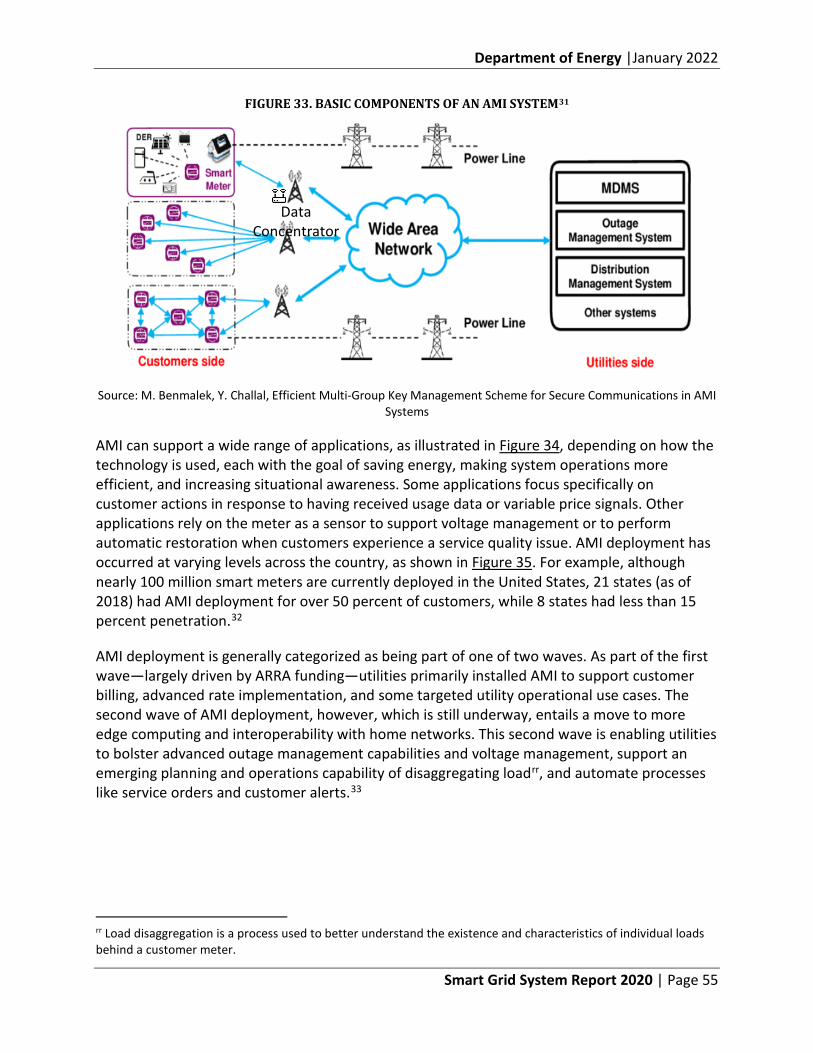
Department of Energy |January 2022
Smart Grid System Report 2020 | Page 55
FIGURE 33. BASIC COMPONENTS OF AN AMI SYSTEM31
Source: M. Benmalek, Y. Challal, Efficient Multi-Group Key Management Scheme for Secure Communications in AMI Systems
AMI can support a wide range of applications, as illustrated in Figure 34, depending on how the technology is used, each with the goal of saving energy, making system operations more efficient, and increasing situational awareness. Some applications focus specifically on customer actions in response to having received usage data or variable price signals. Other applications rely on the meter as a sensor to support voltage management or to perform automatic restoration when customers experience a service quality issue. AMI deployment has occurred at varying levels across the country, as shown in Figure 35. For example, although nearly 100 million smart meters are currently deployed in the United States, 21 states (as of 2018) had AMI deployment for over 50 percent of customers, while 8 states had less than 15 percent penetration.32
AMI deployment is generally categorized as being part of one of two waves. As part of the first wave—largely driven by ARRA funding—utilities primarily installed AMI to support customer billing, advanced rate implementation, and some targeted utility operational use cases. The second wave of AMI deployment, however, which is still underway, entails a move to more edge computing and interoperability with home networks. This second wave is enabling utilities to bolster advanced outage management capabilities and voltage management, support an emerging planning and operations capability of disaggregating loadrr, and automate processes like service orders and customer alerts.33
rr Load disaggregation is a process used to better understand the existence and characteristics of individual loads behind a customer meter.
Data Concentrator
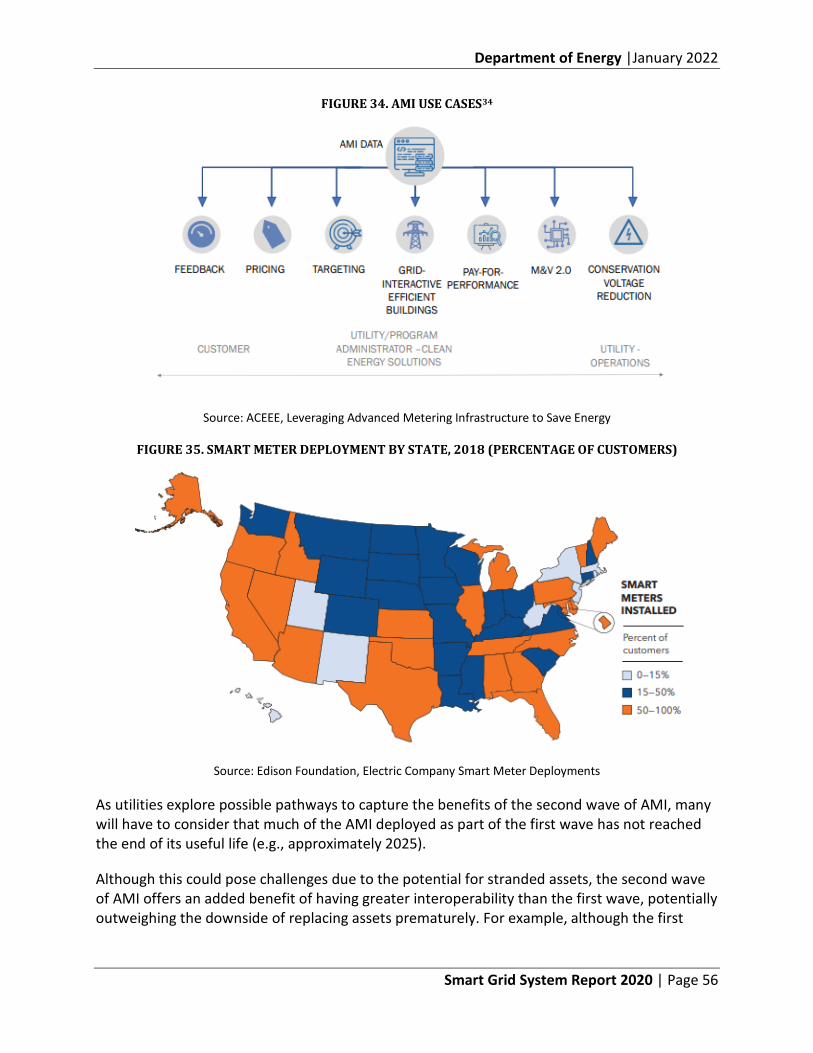
Department of Energy |January 2022
Smart Grid System Report 2020 | Page 56
FIGURE 34. AMI USE CASES34
Source: ACEEE, Leveraging Advanced Metering Infrastructure to Save Energy
FIGURE 35. SMART METER DEPLOYMENT BY STATE, 2018 (PERCENTAGE OF CUSTOMERS)
Source: Edison Foundation, Electric Company Smart Meter Deployments
As utilities explore possible pathways to capture the benefits of the second wave of AMI, many will have to consider that much of the AMI deployed as part of the first wave has not reached the end of its useful life (e.g., approximately 2025).
Although this could pose challenges due to the potential for stranded assets, the second wave of AMI offers an added benefit of having greater interoperability than the first wave, potentially outweighing the downside of replacing assets prematurely. For example, although the first
Department of Energy |January 2022
Smart Grid System Report 2020 | Page 57
wave used Zigbee,ss the second wave could support open communication protocols [e.g., Wi-Fi, Wi-SUN mesh, or Narrowband Internet of Things (NB-IoT)] to fully enable interoperability of these technologies.
Utilities face other challenges with AMI implementation, irrespective of whether the deployments are first or second wave. For example, regulatory commissions in multiple states have rejected utility AMI proposals in recent years due to concerns over the investment’s cost-effectiveness and a lack of metrics to measure the investment’s success clearly. Separately, because AMI introduces potentially hundreds of thousands or millions of access points to intercept consumer data,35 how to bolster cybersecurity to prevent attackers from targeting the data, network, or physical devices is an ongoing priority.
4. DISTRIBUTED ENERGY RESOURCE MANAGEMENT SYSTEM
A distributed energy resource management system (DERMS) is a software application that increases an operator’s real-time visibility into DER status and allows for the controls necessary to integrate and optimize DERs in support of grid operating objectives. DERMS technology is still maturing and being piloted by several utilities. A core DERMS function is to manage aggregations of DER, forecast their capability, and communicate with other DER aggregators.36,37 Figure 36 shows the interactions of a DERMS with utilities, aggregators, and DER.
ss Zigbee is a suite of high-level communications protocols, based on standard IEEE 802.15.4, used to create personal area networks with small, low-power digital radios.
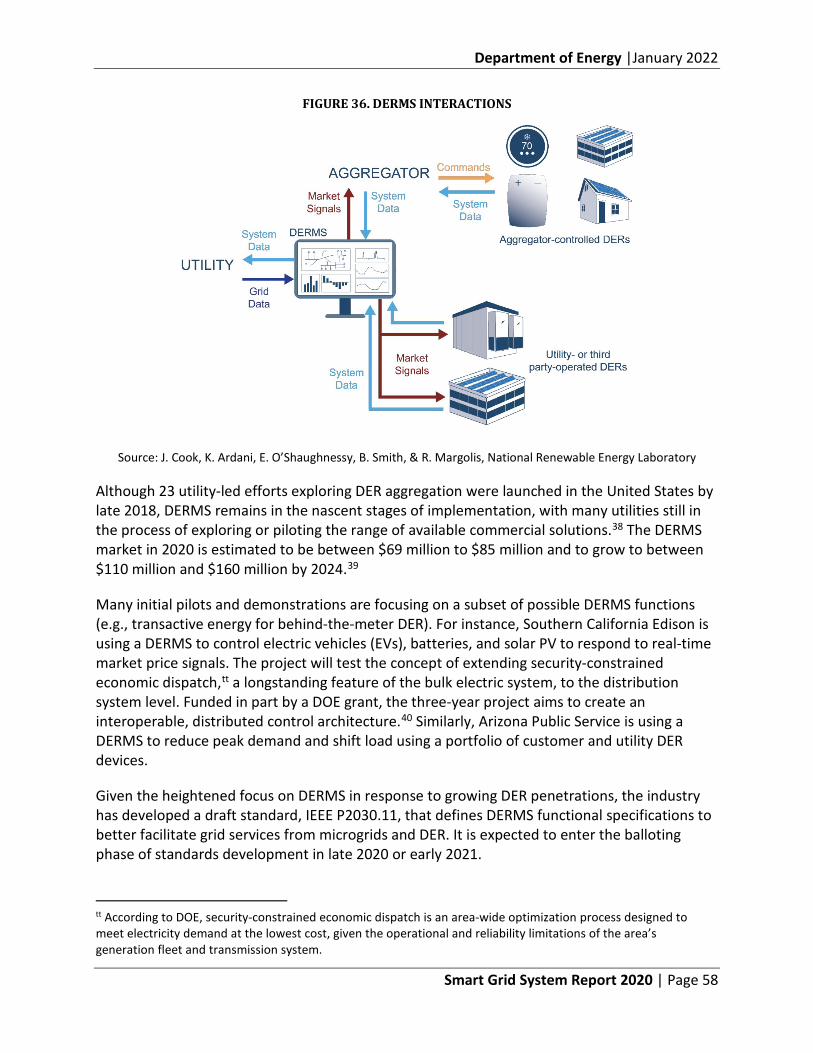
Department of Energy |January 2022
Smart Grid System Report 2020 | Page 58
FIGURE 36. DERMS INTERACTIONS
Source: J. Cook, K. Ardani, E. O’Shaughnessy, B. Smith, & R. Margolis, National Renewable Energy Laboratory
Although 23 utility-led efforts exploring DER aggregation were launched in the United States by late 2018, DERMS remains in the nascent stages of implementation, with many utilities still in the process of exploring or piloting the range of available commercial solutions.38 The DERMS market in 2020 is estimated to be between $69 million to $85 million and to grow to between $110 million and $160 million by 2024.39
Many initial pilots and demonstrations are focusing on a subset of possible DERMS functions (e.g., transactive energy for behind-the-meter DER). For instance, Southern California Edison is using a DERMS to control electric vehicles (EVs), batteries, and solar PV to respond to real-time market price signals. The project will test the concept of extending security-constrained economic dispatch,tt a longstanding feature of the bulk electric system, to the distribution system level. Funded in part by a DOE grant, the three-year project aims to create an interoperable, distributed control architecture.40 Similarly, Arizona Public Service is using a DERMS to reduce peak demand and shift load using a portfolio of customer and utility DER devices.
Given the heightened focus on DERMS in response to growing DER penetrations, the industry has developed a draft standard, IEEE P2030.11, that defines DERMS functional specifications to better facilitate grid services from microgrids and DER. It is expected to enter the balloting phase of standards development in late 2020 or early 2021.
tt According to DOE, security-constrained economic dispatch is an area-wide optimization process designed to meet electricity demand at the lowest cost, given the operational and reliability limitations of the area’s generation fleet and transmission system.
Department of Energy |January 2022
Smart Grid System Report 2020 | Page 59
Additionally, IEEE 2030.5 standardizes DER communications with DERMS, while IEEE 2030.7 (the Standard for the Specification of Microgrid Controllers) helps standardize microgrid operational communications. Together, these standards begin to form end-to-end interoperability for microgrids and groups of DER.
C. Customer Systems
Electricity consumers and aggregators form the third major component of grid modernization investment, deploying EMS for homes, office buildings, and manufacturing facilities. Over time, these resources will become integrated into the broader electric system in a coordinated manner. By 2018, the investment level in these systems had increased significantly; sales of EVs also continued to grow. The combined total of spending for industrial, building, and home EMS had reached $12.5 billion, while related energy control device spending was $2.5 billion. Commercial aggregators of demand and supply services among nearly 151 million electricity consumers accounted for $7 billion in revenue in 2018.uu Estimates for renewable energy spending in 2018 reached $23.5 billion. Together, these investments amounted to more than $53.5 billion. Additionally, consumers purchased nearly $19.9 billion of electric carsvv, and businesses spent as much as $8 billion in commercial and industrial light- and heavy-duty electric trucks in 2018. Including the values of EV shipments, the larger portrait of nationwide smart grid investments approached $86.2 billion, of which only about $12.8 billion was spent by utilities.41
Customers—spanning commercial, industrial, and residential classes—are increasingly interacting with the electric grid. Although historically utilities treated customers only as consumers of energy, the growing adoption of DERs and smart grid technologies has enabled customers actively to manage both energy consumption and production. Traditional devices in the home, such as water heaters or thermostats, are now incorporating computational and networking capabilities for integration with control systems. Newer technology such as EV chargers and energy storage provide flexible resource options with relatively large energy and capacity.
Like utilities, customers might adopt EMS (albeit much more limited in scope and capabilities compared to transmission or distribution EMS) to monitor and control these devices, optimizing the performance of their building or home to minimize bills and deliver grid services. Given the range of technologies that could be present at a customer site (e.g., solar photovoltaic, energy storage, EVs, smart appliances) and a greater ability to respond to utility instructions or price signals, many utilities are in the process of, or have already completed, deploying AMI to customer sites.
AMI not only enables utilities to collect customer usage and production data on a fixed-interval basis (e.g., every 15 minutes), but also allows the utility to communicate directly with
uu Aggregation systems include demand resource management systems (DRMS) and DERMS. vv Electric cars include battery electric vehicles (BEVs) and plug-in hybrid electric vehicles (PHEVs).
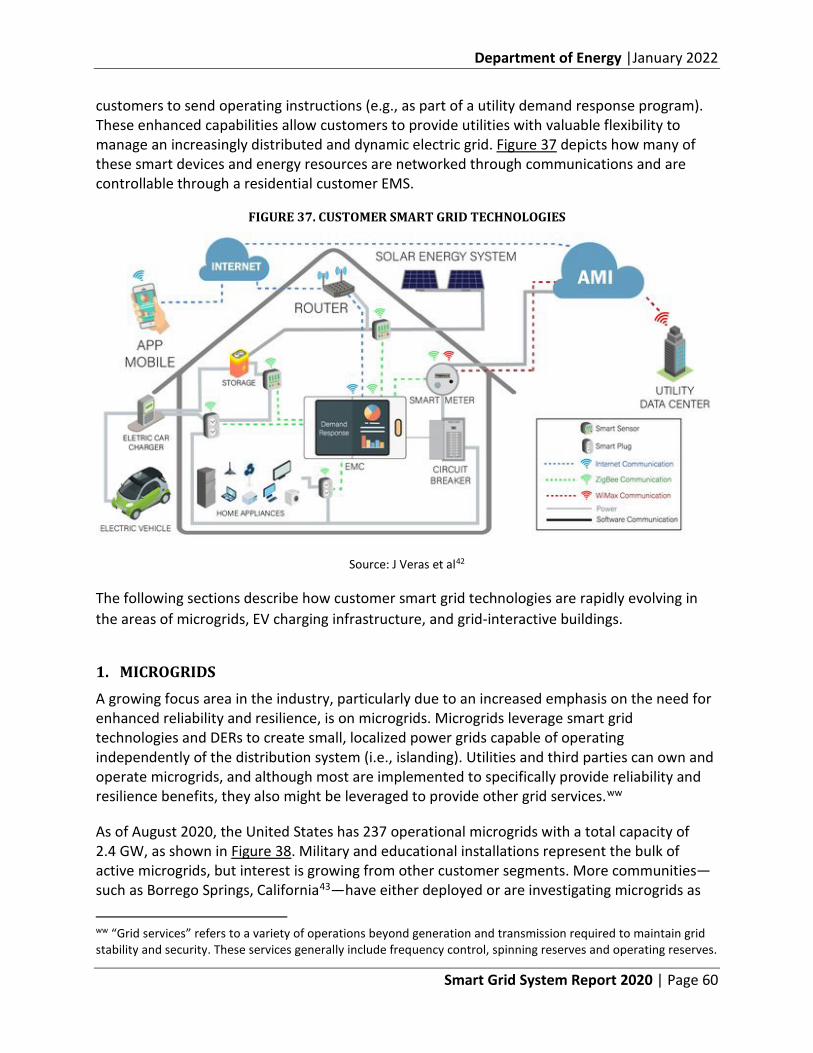
Department of Energy |January 2022
Smart Grid System Report 2020 | Page 60
customers to send operating instructions (e.g., as part of a utility demand response program). These enhanced capabilities allow customers to provide utilities with valuable flexibility to manage an increasingly distributed and dynamic electric grid. Figure 37 depicts how many of these smart devices and energy resources are networked through communications and are controllable through a residential customer EMS.
FIGURE 37. CUSTOMER SMART GRID TECHNOLOGIES
Source: J Veras et al42
The following sections describe how customer smart grid technologies are rapidly evolving in the areas of microgrids, EV charging infrastructure, and grid-interactive buildings.
1. MICROGRIDS A growing focus area in the industry, particularly due to an increased emphasis on the need for enhanced reliability and resilience, is on microgrids. Microgrids leverage smart grid technologies and DERs to create small, localized power grids capable of operating independently of the distribution system (i.e., islanding). Utilities and third parties can own and operate microgrids, and although most are implemented to specifically provide reliability and resilience benefits, they also might be leveraged to provide other grid services.ww
As of August 2020, the United States has 237 operational microgrids with a total capacity of 2.4 GW, as shown in Figure 38. Military and educational installations represent the bulk of active microgrids, but interest is growing from other customer segments. More communities—such as Borrego Springs, California43—have either deployed or are investigating microgrids as
ww “Grid services” refers to a variety of operations beyond generation and transmission required to maintain grid stability and security. These services generally include frequency control, spinning reserves and operating reserves.
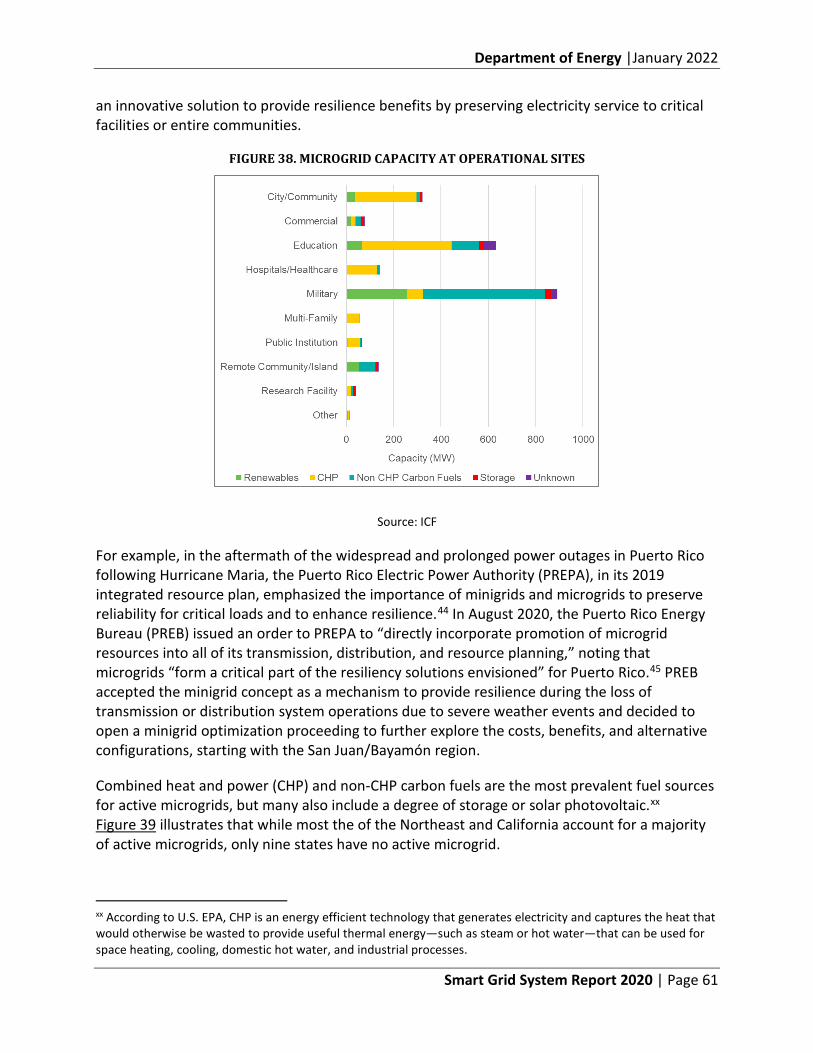
Department of Energy |January 2022
Smart Grid System Report 2020 | Page 61
an innovative solution to provide resilience benefits by preserving electricity service to critical facilities or entire communities.
FIGURE 38. MICROGRID CAPACITY AT OPERATIONAL SITES
Source: ICF
For example, in the aftermath of the widespread and prolonged power outages in Puerto Rico following Hurricane Maria, the Puerto Rico Electric Power Authority (PREPA), in its 2019 integrated resource plan, emphasized the importance of minigrids and microgrids to preserve reliability for critical loads and to enhance resilience.44 In August 2020, the Puerto Rico Energy Bureau (PREB) issued an order to PREPA to “directly incorporate promotion of microgrid resources into all of its transmission, distribution, and resource planning,” noting that microgrids “form a critical part of the resiliency solutions envisioned” for Puerto Rico.45 PREB accepted the minigrid concept as a mechanism to provide resilience during the loss of transmission or distribution system operations due to severe weather events and decided to open a minigrid optimization proceeding to further explore the costs, benefits, and alternative configurations, starting with the San Juan/Bayamón region.
Combined heat and power (CHP) and non-CHP carbon fuels are the most prevalent fuel sources for active microgrids, but many also include a degree of storage or solar photovoltaic.xx Figure 39 illustrates that while most the of the Northeast and California account for a majority of active microgrids, only nine states have no active microgrid.
xx According to U.S. EPA, CHP is an energy efficient technology that generates electricity and captures the heat that would otherwise be wasted to provide useful thermal energy—such as steam or hot water—that can be used for space heating, cooling, domestic hot water, and industrial processes.
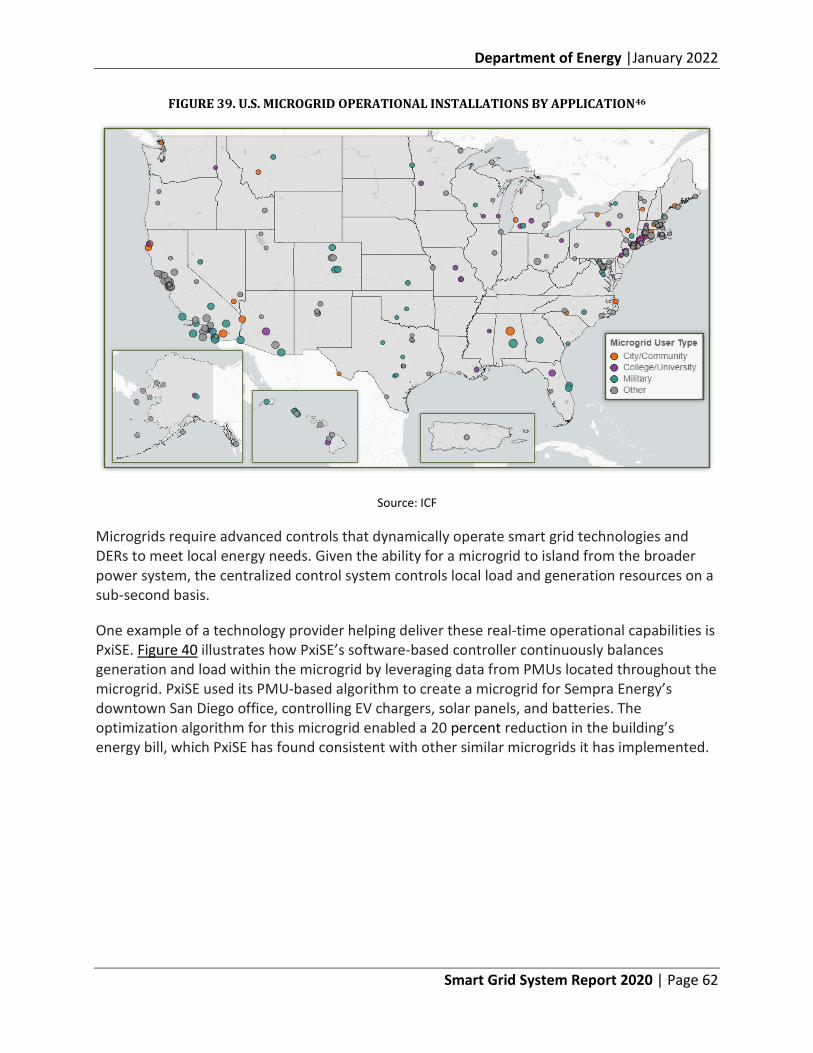
Department of Energy |January 2022
Smart Grid System Report 2020 | Page 62
FIGURE 39. U.S. MICROGRID OPERATIONAL INSTALLATIONS BY APPLICATION46
Source: ICF
Microgrids require advanced controls that dynamically operate smart grid technologies and DERs to meet local energy needs. Given the ability for a microgrid to island from the broader power system, the centralized control system controls local load and generation resources on a sub-second basis.
One example of a technology provider helping deliver these real-time operational capabilities is PxiSE. Figure 40 illustrates how PxiSE’s software-based controller continuously balances generation and load within the microgrid by leveraging data from PMUs located throughout the microgrid. PxiSE used its PMU-based algorithm to create a microgrid for Sempra Energy’s downtown San Diego office, controlling EV chargers, solar panels, and batteries. The optimization algorithm for this microgrid enabled a 20 percent reduction in the building’s energy bill, which PxiSE has found consistent with other similar microgrids it has implemented.
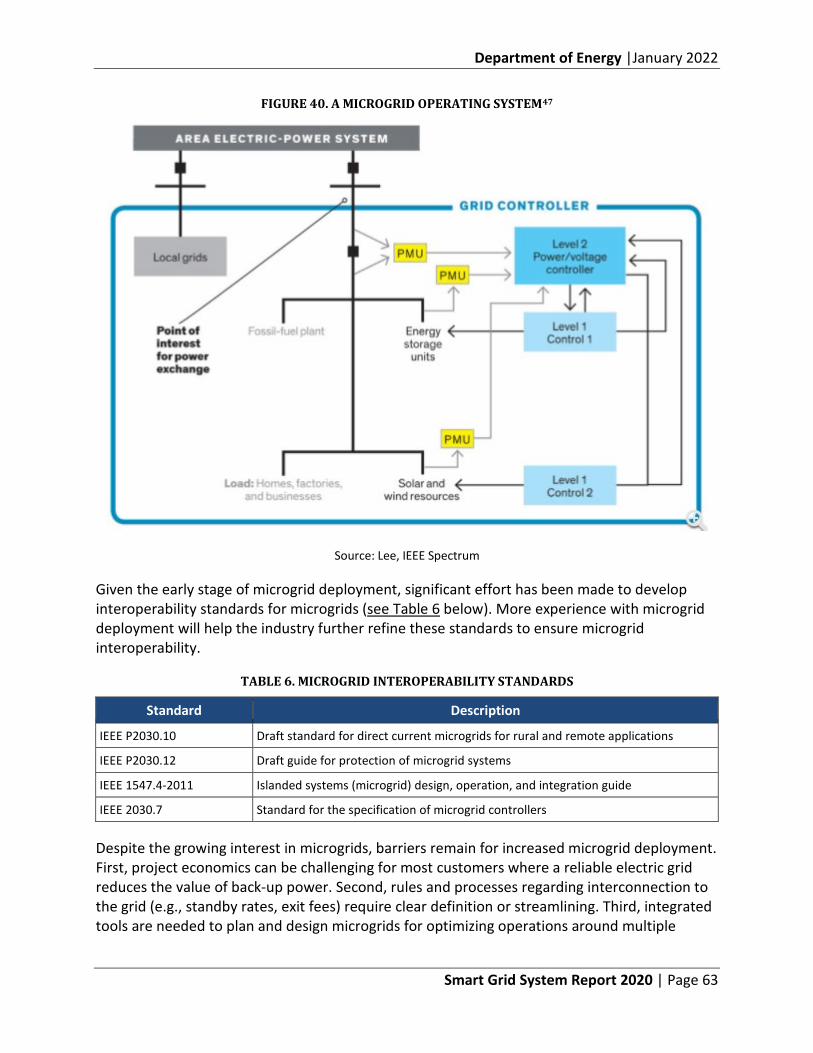
Department of Energy |January 2022
Smart Grid System Report 2020 | Page 63
FIGURE 40. A MICROGRID OPERATING SYSTEM47
Source: Lee, IEEE Spectrum
Given the early stage of microgrid deployment, significant effort has been made to develop interoperability standards for microgrids (see Table 6 below). More experience with microgrid deployment will help the industry further refine these standards to ensure microgrid interoperability.
TABLE 6. MICROGRID INTEROPERABILITY STANDARDS
Standard Description
IEEE P2030.10 Draft standard for direct current microgrids for rural and remote applications
IEEE P2030.12 Draft guide for protection of microgrid systems
IEEE 1547.4-2011 Islanded systems (microgrid) design, operation, and integration guide
IEEE 2030.7 Standard for the specification of microgrid controllers
Despite the growing interest in microgrids, barriers remain for increased microgrid deployment. First, project economics can be challenging for most customers where a reliable electric grid reduces the value of back-up power. Second, rules and processes regarding interconnection to the grid (e.g., standby rates, exit fees) require clear definition or streamlining. Third, integrated tools are needed to plan and design microgrids for optimizing operations around multiple
Department of Energy |January 2022
Smart Grid System Report 2020 | Page 64
objectives and, potentially, multiple owners. Finally, methodologies are still emerging to compensate microgrids for the resilience and other grid benefits they provide.48
In addition to these challenges, regulatory considerations affect microgrid design and adoption. For nonutility microgrids, consideration must be given to deriving a legal definition for microgrids, establishing interconnection requirements and standards, clarifying franchise requirements to interconnect and lay wires across facilities connected to the microgrid, and developing owner licensing and registration requirements that enable microgrids to provide grid services. Separately, whether utilities can own microgrids and how tariff structures and energy market design will affect microgrid cost-effectiveness are critical considerations.
2. ELECTRIC VEHICLES AND CHARGING INFRASTRUCTURE
EVs represent another emerging technology, with projections for total U.S. EV adoption by 2030 ranging from approximately 1.5 million to 6 million, as shown in Figure 41.49 This prospective EV growth, including the electrification of bus fleets and commercial and industrial vehicles, will introduce both challenges and opportunities for the grid. Challenges include that higher numbers of EVs charging at the same time could cause spikes in electricity demand, potentially creating operational concerns for specific sections of the grid if total demand exceeds the system’s capacity. Adding to this challenge is the difficulty of forecasting both when and where EVs will charge given their mobile nature and a growing number of options for charging.
A key enabler of greater EV deployment is accessibility to charging stations. EV charging stations can be public (e.g., workplace, shopping centers, highway service areas) or private (e.g., at a residence), with the former experiencing significant investment from private companies offering the charging infrastructure. As of June 2020, the United States has nearly 26,000 public charging stations with over 82,000 charging outlets and over 3,000 private charging stations with over 13,000 charging outlets.50
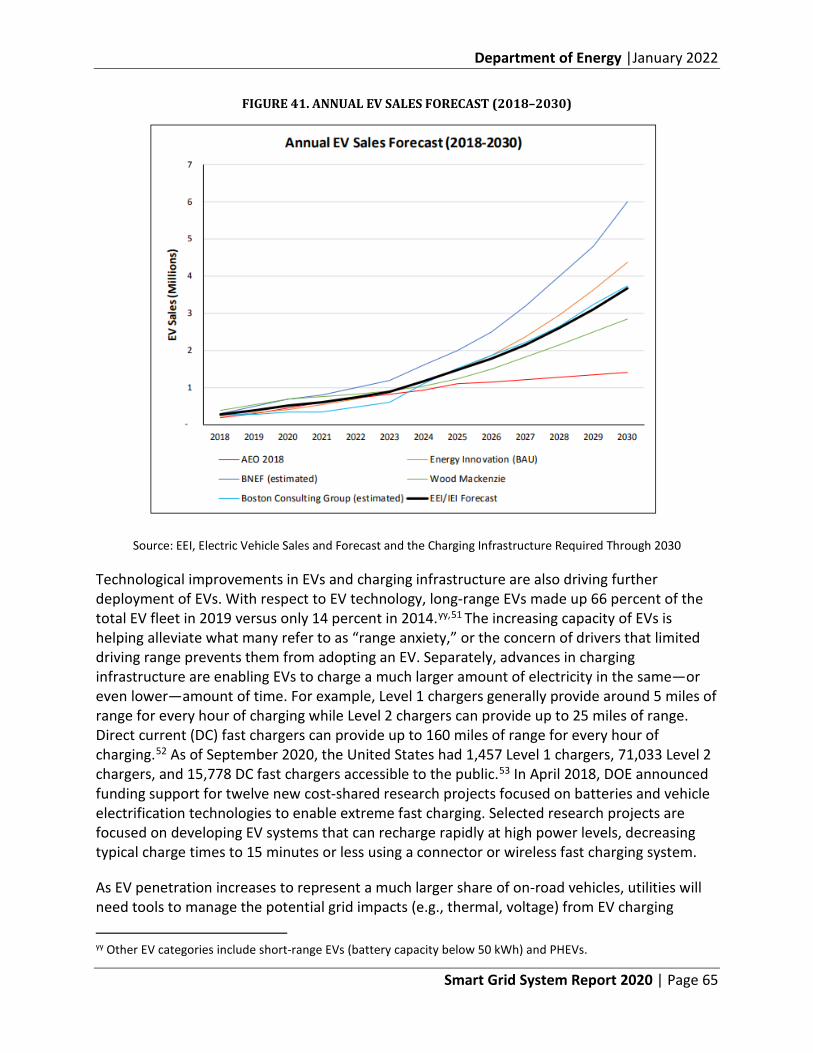
Department of Energy |January 2022
Smart Grid System Report 2020 | Page 65
FIGURE 41. ANNUAL EV SALES FORECAST (2018–2030)
Source: EEI, Electric Vehicle Sales and Forecast and the Charging Infrastructure Required Through 2030
Technological improvements in EVs and charging infrastructure are also driving further deployment of EVs. With respect to EV technology, long-range EVs made up 66 percent of the total EV fleet in 2019 versus only 14 percent in 2014.yy,51 The increasing capacity of EVs is helping alleviate what many refer to as “range anxiety,” or the concern of drivers that limited driving range prevents them from adopting an EV. Separately, advances in charging infrastructure are enabling EVs to charge a much larger amount of electricity in the same—or even lower—amount of time. For example, Level 1 chargers generally provide around 5 miles of range for every hour of charging while Level 2 chargers can provide up to 25 miles of range. Direct current (DC) fast chargers can provide up to 160 miles of range for every hour of charging.52 As of September 2020, the United States had 1,457 Level 1 chargers, 71,033 Level 2 chargers, and 15,778 DC fast chargers accessible to the public.53 In April 2018, DOE announced funding support for twelve new cost-shared research projects focused on batteries and vehicle electrification technologies to enable extreme fast charging. Selected research projects are focused on developing EV systems that can recharge rapidly at high power levels, decreasing typical charge times to 15 minutes or less using a connector or wireless fast charging system.
As EV penetration increases to represent a much larger share of on-road vehicles, utilities will need tools to manage the potential grid impacts (e.g., thermal, voltage) from EV charging
yy Other EV categories include short-range EVs (battery capacity below 50 kWh) and PHEVs.
Department of Energy |January 2022
Smart Grid System Report 2020 | Page 66
effectively. One strategy—managed charging—refers to a utility’s ability to either indirectly or directly influence EV charging behavior, and at its root represents a technology, customer, and business model challenge. For indirect managed charging, some utilities are exploring, or have implemented, EV-specific time-of-use rates to encourage charging during off-peak hours. Alternatively, direct management of EV charging would require utilities or third parties to have the ability to start, stop, or throttle EV charging. While many utility efforts to date in this area have focused on indirect-managed charging due to challenges with direct control for EVs (e.g., residential owners not wanting to cede control of their vehicle charging; requirements for networked charging stations), interest among utilities to pilot and demonstrate direct load control methods is increasing.54
EV-managed charging offers utilities a range of benefits, including integration of lower-cost energy supply, provision of various grid services (e.g., demand response), and economic returns to both EV owners and the broader utility customer base. In addition, the batteries present in EVs can provide energy back to the grid when needed, for example, to meet peak electricity demand or supply power during emergencies. To unlock this full value potential, utilities must address multiple challenges. For example, utilities must continue educating customers on managed charging to make more acceptable. Separately, utilities need to enhance network communications and equipment interoperability to enable the real-time exchange of data and information needed to manage EV charging effectively.
Although no industry-wide standard currently governs all communications within the EV ecosystem, it continues to be a major focus area for utilities, electric vehicle supply equipment (EVSE) vendors, and other relevant parties. Figure 42 shows control and communication interfaces among utility control centers, network service providers (NSP), EVSE vendors, and other home smart devices. The figure notes standard communication protocols and physical components (e.g., SAE J1772 plug) associated with the various interfaces. The IEEE Standards Association is considering standard development for a “Guide for Electric Transportation Fast Charging Station Management System Functional Specification” (IEEE P2030.13).zz Additionally, the Smart Electric Power Alliance, with support from the National Institute of Standards and Technology (NIST), is developing an EV-managed charging interoperability profile that draws from existing standards to allow EV fleet managers to provide grid services.55
One case study that highlights progress in utility-managed charging is the PG&E smart charging pilot. In partnership with BMW, PG&E tested four vehicle grid integration (VGI) use cases.56 Performance requirements for demand response were met for 90 percent of events called (209 in total). EV availability was a challenge, however, as the EVs contributed an average of only 20 percent of the need and stationary batteries contributed the remaining 80 percent. Because 60 percent of participants were enrolled under PG&E’s Time of Use rate that incentivized charging after 11 p.m., few EVs were available when most demand response events were called.
zz A Project Authorization Request (PAR), the document triggering standards development, was submitted to the IEEE Standards Association NesCom, the committee that approves new standards.
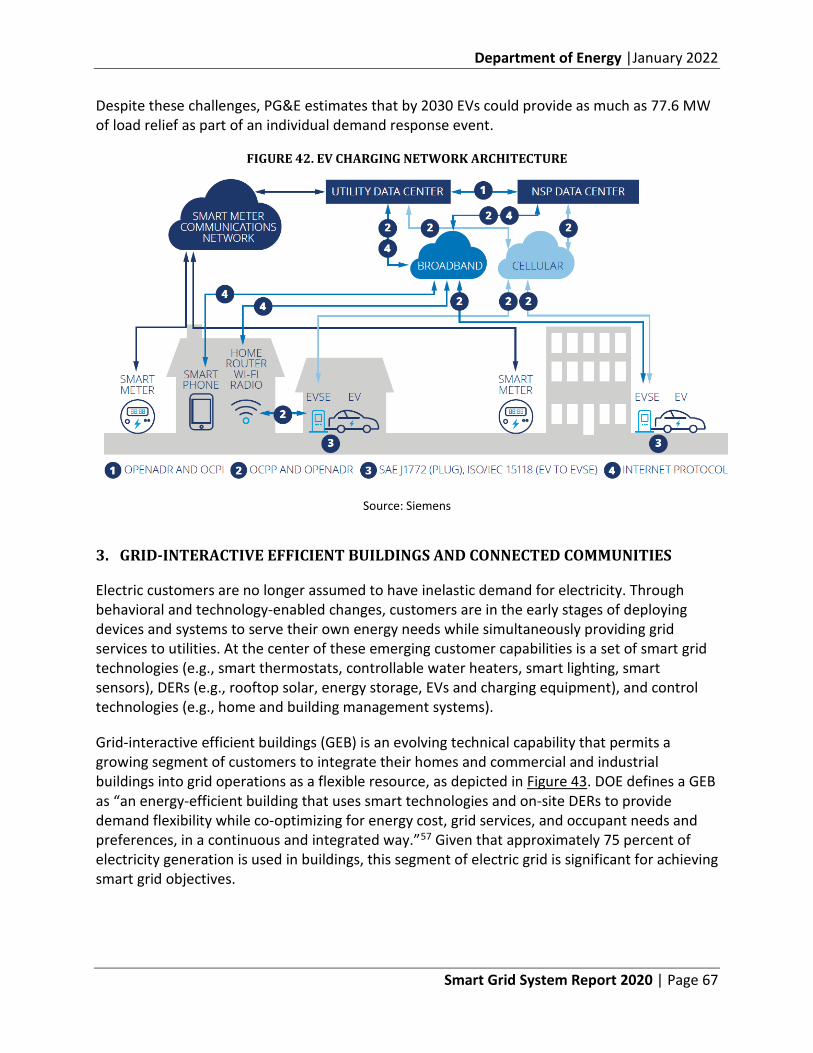
Department of Energy |January 2022
Smart Grid System Report 2020 | Page 67
Despite these challenges, PG&E estimates that by 2030 EVs could provide as much as 77.6 MW of load relief as part of an individual demand response event.
FIGURE 42. EV CHARGING NETWORK ARCHITECTURE
Source: Siemens
3. GRID-INTERACTIVE EFFICIENT BUILDINGS AND CONNECTED COMMUNITIES
Electric customers are no longer assumed to have inelastic demand for electricity. Through behavioral and technology-enabled changes, customers are in the early stages of deploying devices and systems to serve their own energy needs while simultaneously providing grid services to utilities. At the center of these emerging customer capabilities is a set of smart grid technologies (e.g., smart thermostats, controllable water heaters, smart lighting, smart sensors), DERs (e.g., rooftop solar, energy storage, EVs and charging equipment), and control technologies (e.g., home and building management systems).
Grid-interactive efficient buildings (GEB) is an evolving technical capability that permits a growing segment of customers to integrate their homes and commercial and industrial buildings into grid operations as a flexible resource, as depicted in Figure 43. DOE defines a GEB as “an energy-efficient building that uses smart technologies and on-site DERs to provide demand flexibility while co-optimizing for energy cost, grid services, and occupant needs and preferences, in a continuous and integrated way.”57 Given that approximately 75 percent of electricity generation is used in buildings, this segment of electric grid is significant for achieving smart grid objectives.
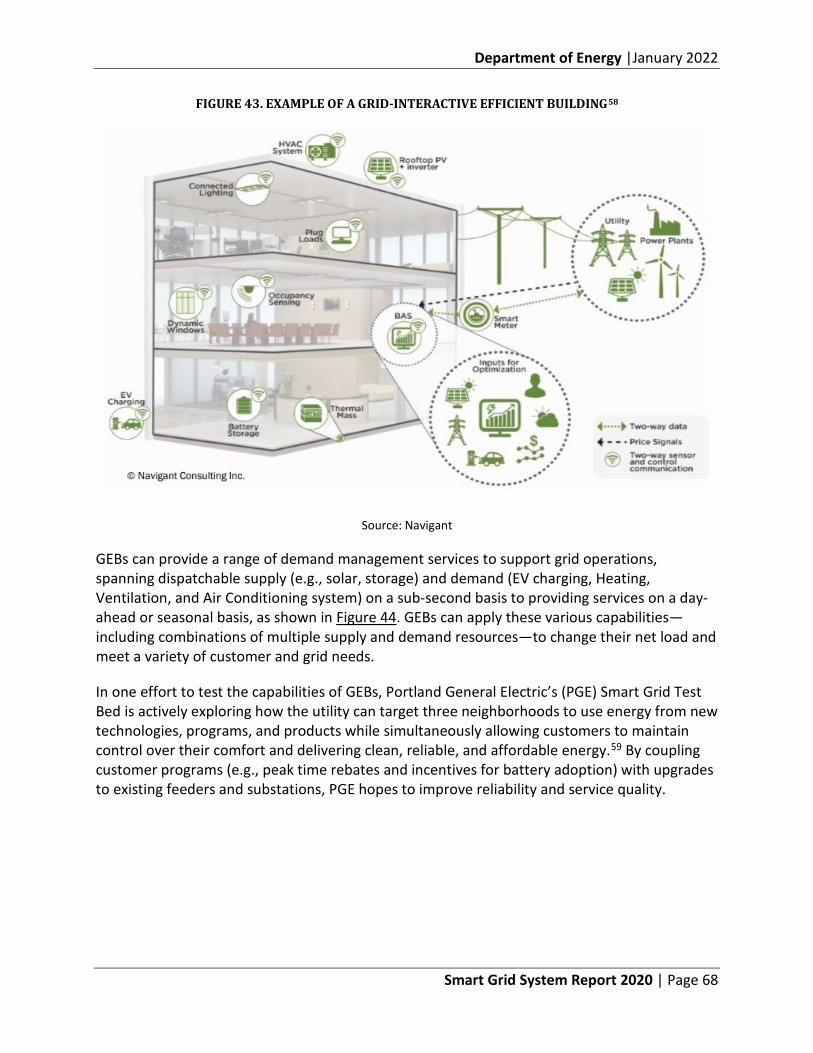
Department of Energy |January 2022
Smart Grid System Report 2020 | Page 68
FIGURE 43. EXAMPLE OF A GRID-INTERACTIVE EFFICIENT BUILDING58
Source: Navigant
GEBs can provide a range of demand management services to support grid operations, spanning dispatchable supply (e.g., solar, storage) and demand (EV charging, Heating, Ventilation, and Air Conditioning system) on a sub-second basis to providing services on a day-ahead or seasonal basis, as shown in Figure 44. GEBs can apply these various capabilities—including combinations of multiple supply and demand resources—to change their net load and meet a variety of customer and grid needs.
In one effort to test the capabilities of GEBs, Portland General Electric’s (PGE) Smart Grid Test Bed is actively exploring how the utility can target three neighborhoods to use energy from new technologies, programs, and products while simultaneously allowing customers to maintain control over their comfort and delivering clean, reliable, and affordable energy.59 By coupling customer programs (e.g., peak time rebates and incentives for battery adoption) with upgrades to existing feeders and substations, PGE hopes to improve reliability and service quality.
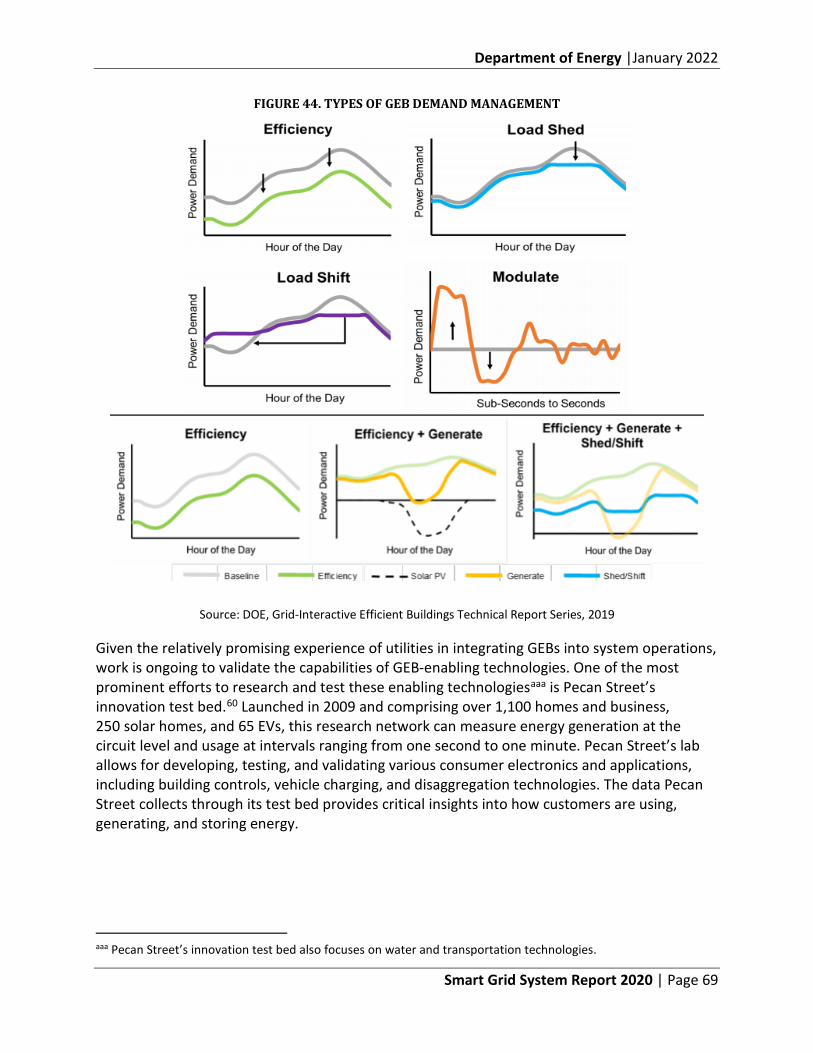
Department of Energy |January 2022
Smart Grid System Report 2020 | Page 69
FIGURE 44. TYPES OF GEB DEMAND MANAGEMENT
Source: DOE, Grid-Interactive Efficient Buildings Technical Report Series, 2019
Given the relatively promising experience of utilities in integrating GEBs into system operations, work is ongoing to validate the capabilities of GEB-enabling technologies. One of the most prominent efforts to research and test these enabling technologiesaaa is Pecan Street’s innovation test bed.60 Launched in 2009 and comprising over 1,100 homes and business, 250 solar homes, and 65 EVs, this research network can measure energy generation at the circuit level and usage at intervals ranging from one second to one minute. Pecan Street’s lab allows for developing, testing, and validating various consumer electronics and applications, including building controls, vehicle charging, and disaggregation technologies. The data Pecan Street collects through its test bed provides critical insights into how customers are using, generating, and storing energy.
aaa Pecan Street’s innovation test bed also focuses on water and transportation technologies.
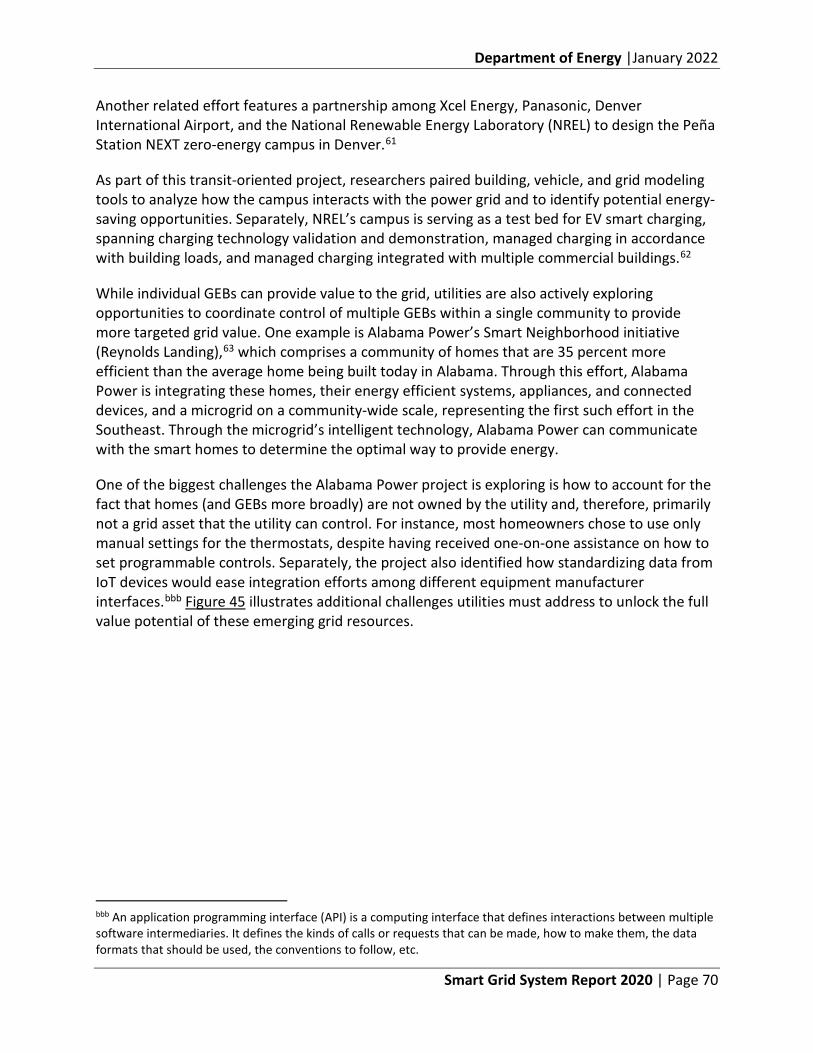
Department of Energy |January 2022
Smart Grid System Report 2020 | Page 70
Another related effort features a partnership among Xcel Energy, Panasonic, Denver International Airport, and the National Renewable Energy Laboratory (NREL) to design the Peña Station NEXT zero-energy campus in Denver.61
As part of this transit-oriented project, researchers paired building, vehicle, and grid modeling tools to analyze how the campus interacts with the power grid and to identify potential energy-saving opportunities. Separately, NREL’s campus is serving as a test bed for EV smart charging, spanning charging technology validation and demonstration, managed charging in accordance with building loads, and managed charging integrated with multiple commercial buildings.62
While individual GEBs can provide value to the grid, utilities are also actively exploring opportunities to coordinate control of multiple GEBs within a single community to provide more targeted grid value. One example is Alabama Power’s Smart Neighborhood initiative (Reynolds Landing),63 which comprises a community of homes that are 35 percent more efficient than the average home being built today in Alabama. Through this effort, Alabama Power is integrating these homes, their energy efficient systems, appliances, and connected devices, and a microgrid on a community-wide scale, representing the first such effort in the Southeast. Through the microgrid’s intelligent technology, Alabama Power can communicate with the smart homes to determine the optimal way to provide energy.
One of the biggest challenges the Alabama Power project is exploring is how to account for the fact that homes (and GEBs more broadly) are not owned by the utility and, therefore, primarily not a grid asset that the utility can control. For instance, most homeowners chose to use only manual settings for the thermostats, despite having received one-on-one assistance on how to set programmable controls. Separately, the project also identified how standardizing data from IoT devices would ease integration efforts among different equipment manufacturer interfaces.bbb Figure 45 illustrates additional challenges utilities must address to unlock the full value potential of these emerging grid resources.
bbb An application programming interface (API) is a computing interface that defines interactions between multiple software intermediaries. It defines the kinds of calls or requests that can be made, how to make them, the data formats that should be used, the conventions to follow, etc.
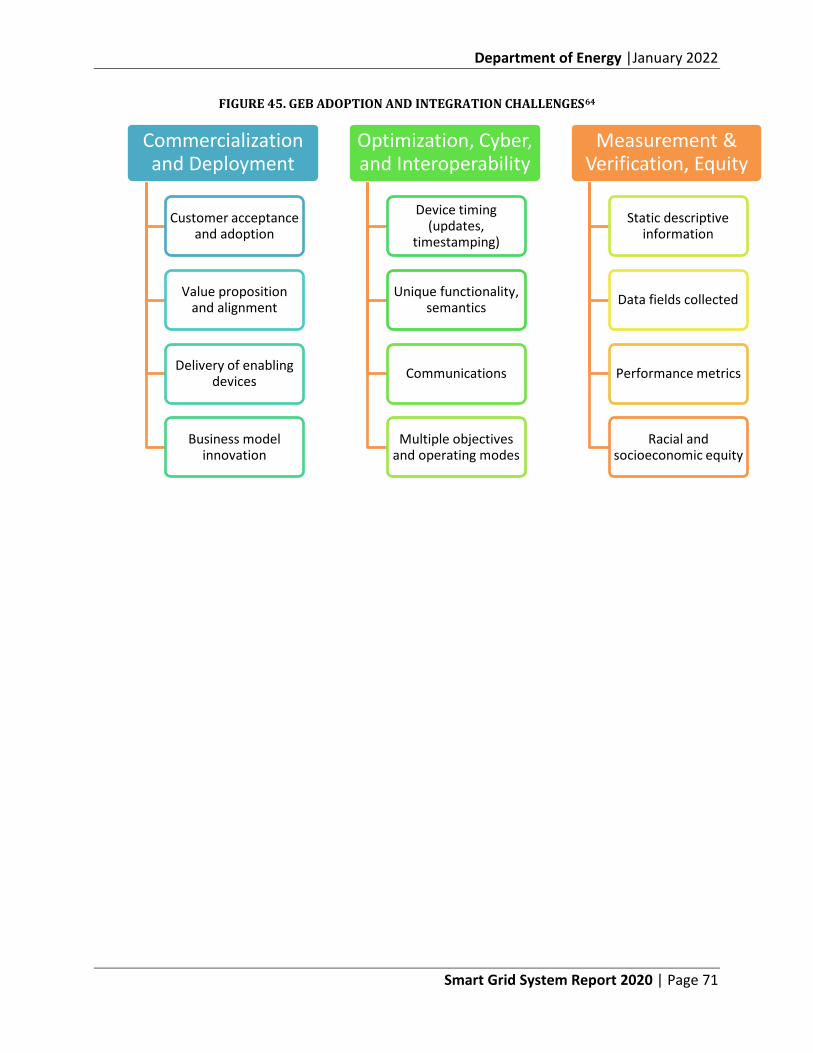
Department of Energy |January 2022
Smart Grid System Report 2020 | Page 71
FIGURE 45. GEB ADOPTION AND INTEGRATION CHALLENGES64
Commercialization and Deployment
Customer acceptance and adoption
Value proposition and alignment
Delivery of enabling devices
Business model innovation
Optimization, Cyber, and Interoperability
Device timing (updates,
timestamping)
Unique functionality, semantics
Communications
Multiple objectives and operating modes
Measurement & Verification, Equity
Static descriptive information
Data fields collected
Performance metrics
Racial and socioeconomic equity
Department of Energy |January 2022
Smart Grid System Report 2020 | Page 72
Section Endnotes
1 EIA, Major utilities continue to increase spending on US electric distribution systems, 2018, https://www.eia.gov/todayinenergy/detail.php?id=36675. 2 EIA, Investment in electricity transmission infrastructure shows steady increase, 2018, https://www.eia.gov/todayinenergy/detail.php?id=34892. 3 EIA, Form EIA-861, 2019ER, https://www.eia.gov/electricity/data/eia861/. 4 U.S. DOE, Dynamic Line Rating: Report to Congress, June 2019, https://www.energy.gov/sites/prod/files/2019/08/f66/Congressional_DLR_Report_June2019_final_508_0.pdf. 5 Ibid. 6 Ibid. 7 U.S. DOE, Advancement of Synchrophasor Technology, March 2016, https://www.energy.gov/sites/prod/files/2016/11/f34/2016-03-20%20Sychrophasor%20Report%20-%20Final%20Version%20%28Report%20Body%20and%20Appendices%29.pdf. 8 North American Syncrophasor Initiative, Synchrophasors and the grid, 2017, https://www.naspi.org/sites/default/files/reference_documents/naspi_naruc_silverstein_20170714.pdf. 9 SEL, SEL-421 Performance as Both a Protective Relay and Phasor Measurement Unit whitepaper, https://cms-cdn.selinc.com/assets/Literature/Publications/White%20Papers/421_Performance_20050419.pdf?v=20170218-000951. 10 NIST, NISTIR 8106, 2014 NIST Assessment of Phasor Measurement Unit Performance, https://nvlpubs.nist.gov/nistpubs/ir/2016/NIST.IR.8106.pdf. 11 IEEE Conformity Assessment Program (ICAP), https://standards.ieee.org/products-services/icap/certification-registry/index.html. 12 Image adapted from Siemens, Phasor measurement unit (PMU), https://new.siemens.com/global/en/products/energy/energy-automation-and-smart-grid/protection-relays-and-control/general-protection/phasor-measurement-unit-pmu.html. 13 The University of Tennessee Knoxville and Oak Ridge National Laboratory, FNET/GridEye Web DisplayEye Web Display, http://fnetpublic.utk.edu/frequencymap.html. 14 California Institute for Energy and Environment, Micro-synchrophasors for Distribution Systems, January 2017, https://arpa-e.energy.gov/sites/default/files/9_OPEN%202012_MPMU_UC-Berkeley.pdf. 15 NASPI, Synchrophasor Monitoring for Distribution Systems: Technical Foundations and Applications, January 2018, https://www.naspi.org/sites/default/files/reference_documents/naspi_distt_synchrophasor_monitoring_distribution_20180109.pdf. 16 Huang, C., Li, F., Zhou, D., et al. Data Quality Issues for Synchrophasor Applications Part I: A Review. J. Mod. Power Syst. Clean Energy 4, 342–352 (2016), https://doi.org/10.1007/s40565-016-0217-4. 17 Ibid. 18 ISO New England, Cloud-based PMU Data Sharing and Analytics Platform, https://intra.ece.ucr.edu/~hamed/(2)%20Luo_Presentation_Cloud-based%20PMU%20Data%20Sharing%20and%20Analytics%20Platform_ISONE.pdf. 19 U.S. Department of Energy, Distribution System Platform (DSPx) Project, Modern Distribution Grid – Volume III: Decision Guide, 2017, p.8, https://gridarchitecture.pnnl.gov/media/Modern-Distribution-Grid-Volume-III.pdf. 20 OpenEI. Definition: Distribution Management System, http://en.openei.org/wiki/Definition:Distribution_Management_System. 21 Newton-Evans; North American Distribution Automation Market Assessment and Outlook: 2018–2020; CAPEX 2020 Mid-Year: Outlook for Smart Grid Investment.
Department of Energy |January 2022
Smart Grid System Report 2020 | Page 73
22 Open Systems International, Advanced Distribution Management Systems, https://www.osii.com/solutions/products/distribution-management.asp. 23 Analysis provided to DOE by Newton-Evans, 2020. 24 Wilke, Larry and David Hopson, Arizona Public Service Leverages Data for Advanced Distribution Management, T&D World, August 21, 2018, https://www.tdworld.com/grid-innovations/distribution/article/20971578/arizona-public-service-leverages-data-for-advanced-distribution-management. 25 Helmer, Tom, The Hidden Data Governance Issues an ADMS Project Brings to Energy Delivery Business Systems, Energy Central, January 9, 2020, https://energycentral.com/o/udc/hidden-data-governance-issues-adms-project-brings-energy-delivery-business. 26 Agalgaonkar, Y., et al., ADMS State of the Industry and Gap Analysis, Pacific Northwest National Laboratory, March 2016, https://www.pnnl.gov/main/publications/external/technical_reports/PNNL-26361.pdf. 27 U.S. DOE, Fault Location, Isolation, and Service Restoration Technologies Reduce Outage Impact and Duration: Smart Grid Investment Grant Program, December 2014, https://www.energy.gov/sites/prod/files/2017/08/f35/B5_draft_report-12-18-2014.pdf. 28 U.S. DOE, Distribution Automation (DA) Smart Grid Investment Grant (SGIG) Program Report September 2016. 29 Pacific Gas and Electric Company, Smart Grid Annual Report – 2019, https://www.pge.com/pge_global/common/pdfs/safety/how-the-system-works/electric-systems/smart-grid/AnnualReport2019.pdf. 30 Southern California Edison, 2021 General Rate Case – Grid Modernization, Grid Technology, and Energy Storage, http://www3.sce.com/sscc/law/dis/dbattach5e.nsf/0/BC9BF1FB73919F0A882584660077EDC0/$FILE/SCE02V4P1.pdf. 31 M. Benmalek, Y. Challal, Efficient Multi-Group Key Management Scheme for Secure Communications in AMI Systems, 2016. https://www.semanticscholar.org/paper/MK-AMI%3A-Efficient-multi-group-key-management-scheme-Benmalek-Challal/91e9eb3f890714cf885790679d3fd0dc51da9763. 32 Cooper, Adam, and Mike Shuster, Electric Company Smart Meter Deployments: Foundation for a Smart Grid (2019 Update), The Edison Foundation: Institute for Electric Innovation, December 2019. https://www.edisonfoundation.net/-/media/Files/IEI/publications/IEI_Smart-Meter-Report_2019_FINAL.ashx. 33 U.S. DOE, VOICES of Experience: Leveraging AMI Networks and Data, Office of Electricity, March 2019. https://www.smartgrid.gov/files/documents/VOEAMI_2019.pdf. 34 Gold, Rachel, Corri Waters, and Dan York, Leveraging Advanced Metering Infrastructure to Save Energy, American Council for an Energy-Efficient Economy, Report U2001, January 3, 2020. https://www.aceee.org/sites/default/files/publications/researchreports/u2001.pdf. 35 Halim, Fatemeh, et al., Cyber Security Issues in Smart Meter and Their Solutions, International Journal of Computer Science and Network Security, Vol 18 No. 3, March 2018, http://paper.ijcsns.org/07_book/201803/20180314.pdf. 36 U.S. Department of Energy, Distribution System Platform (DSPx) Project, Modern Distribution Grid – Volume III: Decision Guide, 2017, p.7, https://gridarchitecture.pnnl.gov/media/Modern-Distribution-Grid-Volume-III.pdf. 37 Electric Power Research Institute, Common Functions for DER Group Management, Third Edition, Product ID 3002008215, ehttps://www.epri.com/#/pages/product/3002008215/. 38 NREL, Expanding PV Value: Lessons learned from Utility-led Distributed Energy Resource Aggregation in the United States, https://www.nrel.gov/docs/fy19osti/71984.pdf. 39 Newton Evans adjustment (7%–9.6% growth) of forecasts from research firms including Navigant, F&S, BCC, and M&M (15%–18% growth). 40 Southern California Edison, Electric Access System Enhancement (EASE), August 2017, http://gridworks.org/wp-content/uploads/2017/03/Electric-Access-System-Enhancement-Overview-for-MTS-v4.pdf. 41 Utility data derived from Newton-Evans Studies. Renewables data from AWEA 2018 Report ($12 billion); Solar Energies Industry Association PV Installation Forecast ($11 billion); Energy Storage Association per Wood
Department of Energy |January 2022
Smart Grid System Report 2020 | Page 74
Mackenzie report U.S. Energy Storage market Q4 208 ($500 million); Electricity Consumer data developed from U.S. estimates of electric vehicles sold ($19.9 billion)—calculated by average cost ($55,600), source: (Cox Automotive Reports) × number of units sold (359,000-per EV VOLUMES); Industrial, Building, and Home EMS ($13 billion), source: Grandview Research report, https://www.grandviewresearch.com/industry-analysis/us-energy-management-systems-ems-market/request/rs6; Estimates for Smart Controls ($7 billion) Heavy truck sales (250,000 units), source: https://www.statista.com/statistics/245369/class-8-truck-sales-by-manfuacturer/ and https://fred.stlouisfed.org/series/HTRUCKSSAAR, calculating average value at $170,000 (per unit) × 1% of total heavy truck sales in 2018 = $850 million. Microgrid investments not included. 42 Jaclason M. Veras, et al., A Multi-Objective Demand Response Optimization Model for Scheduling Loading in a Home Energy Management System, https://www.researchgate.net/publication/327851208_A_Multi-Objective_Demand_Response_Optimization_Model_for_Scheduling_Loads_in_a_Home_Energy_Management_System. 43 California Energy Commission, Borrego Springs: California’s First Renewable Energy-Based Community Microgrid, CEC-500-2019-013, February 2019, https://ww2.energy.ca.gov/2019publications/CEC-500-2019-013/CEC-500-2019-013.pdf. 44 Siemens Industry, Puerto Rico Integrated Resource Plan 2018–2019, Siemens PTI Report Number: RPT-015-19, June 7, 2019, https://aeepr.com/es-pr/QuienesSomos/Ley57/Plan%20Integrado%20de%20Recursos/IRP2019%20-%20Ex%201.00%20-%20Main%20Report%20%20REV2%2006072019.pdf. 45 Government of Puerto Rico Public Service Regulatory Board Puerto Rico Energy Bureau, Case No. CEPR-AP-2018-0001, https://energia.pr.gov/wp-content/uploads/2020/08/AP20180001-IRP-Final-Resolution-and-Order.pdf. 46 ICF Microgrid Database. Data current through August 31, 2020. 47 Lee, Patrick T., The Software-Defined Power Grid is Here, IEEE Spectrum, June 23, 2020, https://spectrum.ieee.org/energy/the-smarter-grid/the-softwaredefined-power-grid-is-here. 48 California Public Utilities Commission, Decision Adopting Short-Term Actions to Accelerate Microgrid Deployment and Related Resiliency Solutions, Rulemaking 19-09-009, June 11, 2020, https://docs.cpuc.ca.gov/PublishedDocs/Published/G000/M339/K938/339938260.pdf. 49 EEI, IEI, Electric Vehicle Sales Forecast and the Charging Infrastructure Required Through 2030, November, 2018, https://www.edisonfoundation.net/iei/publications/Documents/IEI_EEI%20EV%20Forecast%20Report_Nov2018.pdf. 50 DOE, Alternatives Fuels Data Center, https://afdc.energy.gov/stations/states. 51 Fleetcarma, EV Growing Pains. 52 Chargepoint, Driver’s Checklist: A Quick Guide to Fast Charging, https://www.chargepoint.com/files/Quick_Guide_to_Fast_Charging.pdf. 53 DOE , Alternative Fuels Data Center, https://afdc.energy.gov/stations/states. 54 Smart Electric Power Alliance, A Comprehensive Guide to Electric Vehicle Managed Charging, May 2019, https://sepapower.org/resource/a-comprehensive-guide-to-electric-vehicle-managed-charging/. 55 Smart Electric Power Alliance, Interoperability Profile Task Force, IPTF – EV Fleet Managed Charging Interoperability Profile Reference Information, https://sepapower.org/iptf-ev-fleet-managed-charging-interoperability-profile-reference-information/. 56 Pacific Gas & Electric, BMW i ChargeForward: PG&E’s Electric Vehicle Smart Charging Pilot, October 12, 2017, https://efiling.energy.ca.gov/GetDocument.aspx?tn=221489. 57 DOE, GEB Webinar Series, DER Integration https://www.energy.gov/sites/prod/files/2020/07/f76/bto-geb-webinar-der-integration-070120.pdf. 58 Ibid. 59 Portland General Electric, Smart Grid Test Bed, https://www.portlandgeneral.com/our-company/energy-strategy/smart-grid/smart-grid-test-bed. 60 Pecan Street. https://www.pecanstreet.org/.
Department of Energy |January 2022
Smart Grid System Report 2020 | Page 75
61 NREL, Electric Vehicle Smart Charging at Scale. Available online at: https://www.nrel.gov/transportation/managed-electric-vehicle-charging.html. 62 NREL, Site-Integrated Electric Vehicle Charging. Available online at: https://www.nrel.gov/transportation/workplace-electric-vehicle-charging.html. 63 Alabama Power, Reynolds Landing. https://www.smartneighbor.com/pages/reynolds-landing. 64 U.S. DOE, GEB Webinar Series: DER Integration, Building Technologies Office, June 30, 2020, https://www.energy.gov/sites/prod/files/2020/07/f76/bto-geb-webinar-der-integration-070120.pdf.
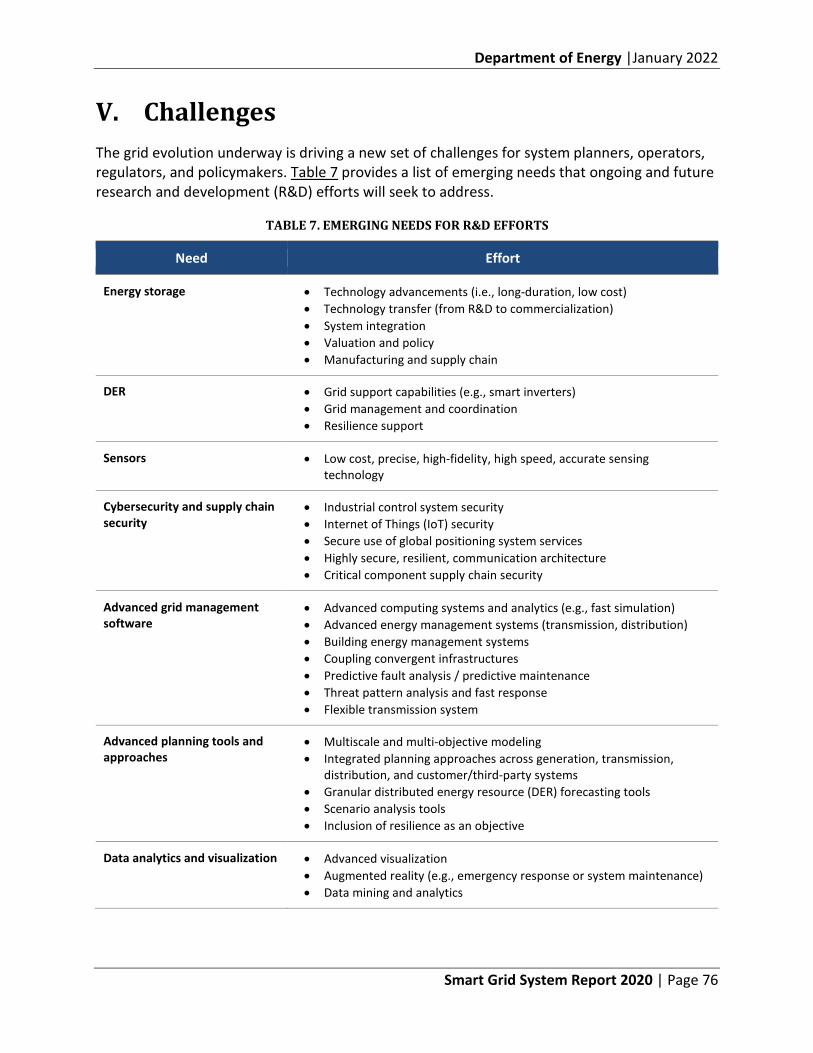
Department of Energy |January 2022
Smart Grid System Report 2020 | Page 76
V. Challenges The grid evolution underway is driving a new set of challenges for system planners, operators, regulators, and policymakers. Table 7 provides a list of emerging needs that ongoing and future research and development (R&D) efforts will seek to address.
TABLE 7. EMERGING NEEDS FOR R&D EFFORTS
Need Effort
Energy storage • Technology advancements (i.e., long-duration, low cost) • Technology transfer (from R&D to commercialization) • System integration • Valuation and policy • Manufacturing and supply chain
DER • Grid support capabilities (e.g., smart inverters) • Grid management and coordination • Resilience support
Sensors • Low cost, precise, high-fidelity, high speed, accurate sensing technology
Cybersecurity and supply chain security
• Industrial control system security • Internet of Things (IoT) security • Secure use of global positioning system services • Highly secure, resilient, communication architecture • Critical component supply chain security
Advanced grid management software
• Advanced computing systems and analytics (e.g., fast simulation) • Advanced energy management systems (transmission, distribution) • Building energy management systems • Coupling convergent infrastructures • Predictive fault analysis / predictive maintenance • Threat pattern analysis and fast response • Flexible transmission system
Advanced planning tools and approaches
• Multiscale and multi-objective modeling • Integrated planning approaches across generation, transmission,
distribution, and customer/third-party systems • Granular distributed energy resource (DER) forecasting tools • Scenario analysis tools • Inclusion of resilience as an objective
Data analytics and visualization • Advanced visualization • Augmented reality (e.g., emergency response or system maintenance) • Data mining and analytics
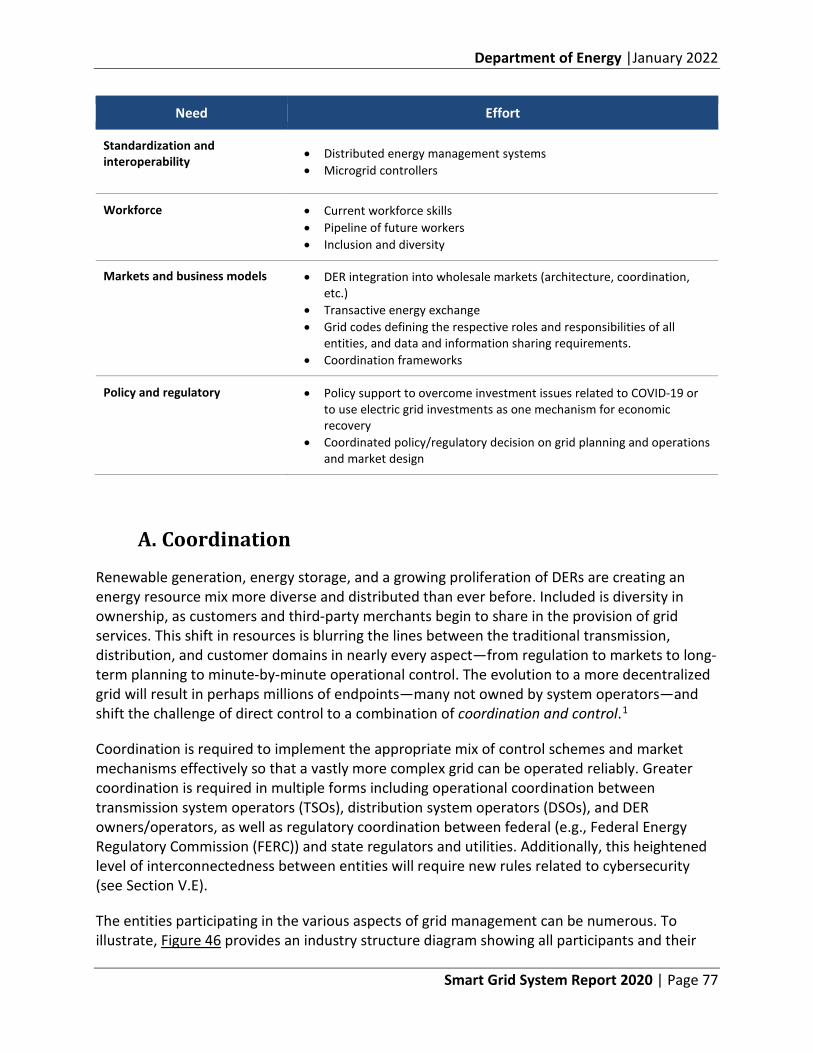
Department of Energy |January 2022
Smart Grid System Report 2020 | Page 77
Need Effort
Standardization and interoperability • Distributed energy management systems
• Microgrid controllers
Workforce
• Current workforce skills • Pipeline of future workers • Inclusion and diversity
Markets and business models
• DER integration into wholesale markets (architecture, coordination, etc.)
• Transactive energy exchange • Grid codes defining the respective roles and responsibilities of all
entities, and data and information sharing requirements. • Coordination frameworks
Policy and regulatory • Policy support to overcome investment issues related to COVID-19 or to use electric grid investments as one mechanism for economic recovery
• Coordinated policy/regulatory decision on grid planning and operations and market design
A. Coordination
Renewable generation, energy storage, and a growing proliferation of DERs are creating an energy resource mix more diverse and distributed than ever before. Included is diversity in ownership, as customers and third-party merchants begin to share in the provision of grid services. This shift in resources is blurring the lines between the traditional transmission, distribution, and customer domains in nearly every aspect—from regulation to markets to long-term planning to minute-by-minute operational control. The evolution to a more decentralized grid will result in perhaps millions of endpoints—many not owned by system operators—and shift the challenge of direct control to a combination of coordination and control.1
Coordination is required to implement the appropriate mix of control schemes and market mechanisms effectively so that a vastly more complex grid can be operated reliably. Greater coordination is required in multiple forms including operational coordination between transmission system operators (TSOs), distribution system operators (DSOs), and DER owners/operators, as well as regulatory coordination between federal (e.g., Federal Energy Regulatory Commission (FERC)) and state regulators and utilities. Additionally, this heightened level of interconnectedness between entities will require new rules related to cybersecurity (see Section V.E).
The entities participating in the various aspects of grid management can be numerous. To illustrate, Figure 46 provides an industry structure diagram showing all participants and their
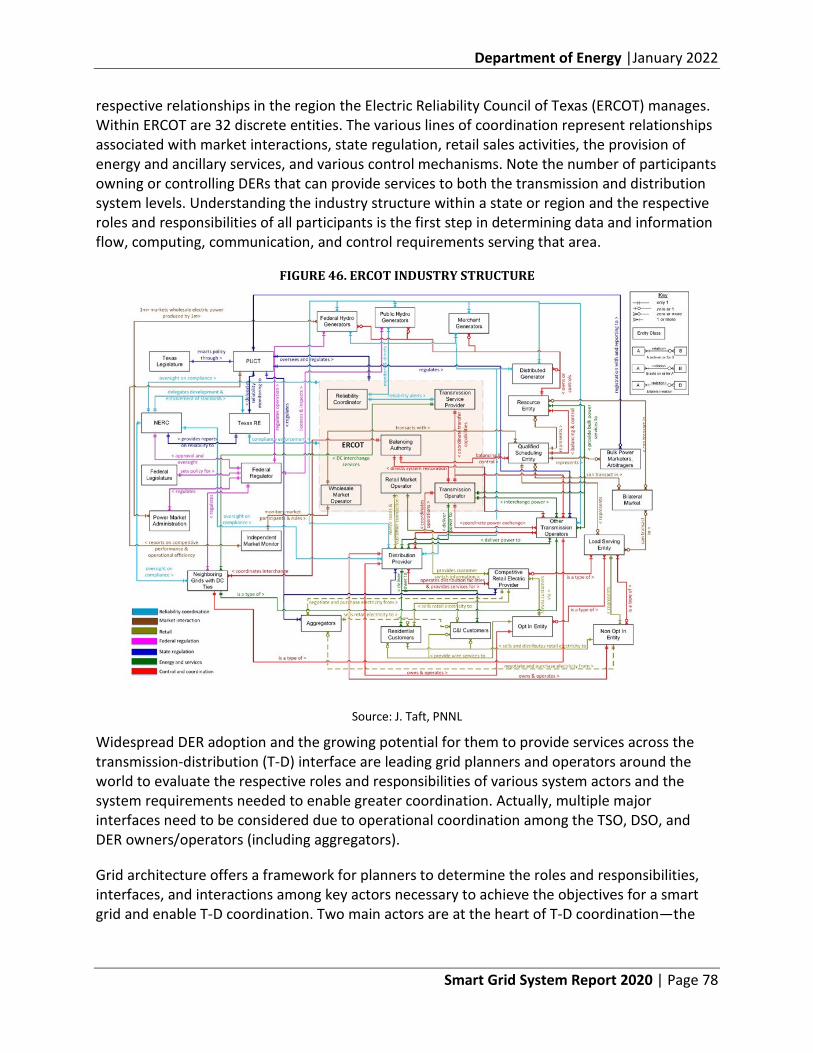
Department of Energy |January 2022
Smart Grid System Report 2020 | Page 78
respective relationships in the region the Electric Reliability Council of Texas (ERCOT) manages. Within ERCOT are 32 discrete entities. The various lines of coordination represent relationships associated with market interactions, state regulation, retail sales activities, the provision of energy and ancillary services, and various control mechanisms. Note the number of participants owning or controlling DERs that can provide services to both the transmission and distribution system levels. Understanding the industry structure within a state or region and the respective roles and responsibilities of all participants is the first step in determining data and information flow, computing, communication, and control requirements serving that area.
FIGURE 46. ERCOT INDUSTRY STRUCTURE
Source: J. Taft, PNNL
Widespread DER adoption and the growing potential for them to provide services across the transmission-distribution (T-D) interface are leading grid planners and operators around the world to evaluate the respective roles and responsibilities of various system actors and the system requirements needed to enable greater coordination. Actually, multiple major interfaces need to be considered due to operational coordination among the TSO, DSO, and DER owners/operators (including aggregators).
Grid architecture offers a framework for planners to determine the roles and responsibilities, interfaces, and interactions among key actors necessary to achieve the objectives for a smart grid and enable T-D coordination. Two main actors are at the heart of T-D coordination—the
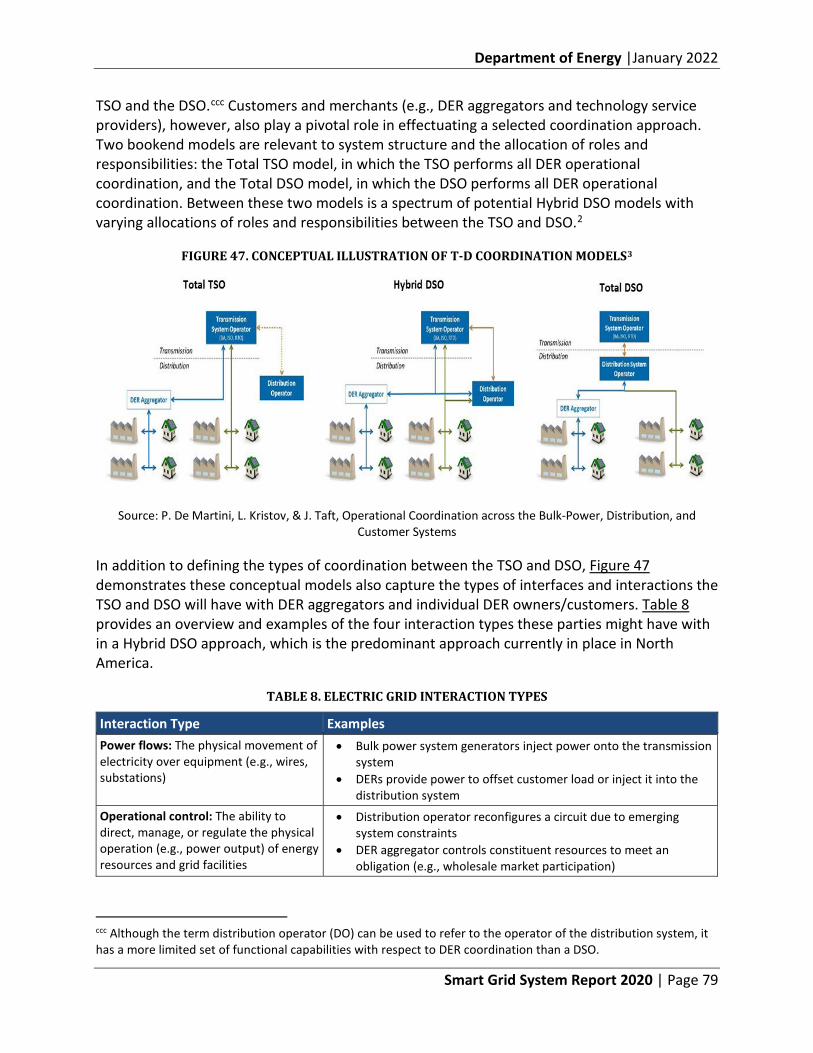
Department of Energy |January 2022
Smart Grid System Report 2020 | Page 79
TSO and the DSO.ccc Customers and merchants (e.g., DER aggregators and technology service providers), however, also play a pivotal role in effectuating a selected coordination approach. Two bookend models are relevant to system structure and the allocation of roles and responsibilities: the Total TSO model, in which the TSO performs all DER operational coordination, and the Total DSO model, in which the DSO performs all DER operational coordination. Between these two models is a spectrum of potential Hybrid DSO models with varying allocations of roles and responsibilities between the TSO and DSO.2
FIGURE 47. CONCEPTUAL ILLUSTRATION OF T-D COORDINATION MODELS3
Source: P. De Martini, L. Kristov, & J. Taft, Operational Coordination across the Bulk-Power, Distribution, and Customer Systems
In addition to defining the types of coordination between the TSO and DSO, Figure 47 demonstrates these conceptual models also capture the types of interfaces and interactions the TSO and DSO will have with DER aggregators and individual DER owners/customers. Table 8 provides an overview and examples of the four interaction types these parties might have with in a Hybrid DSO approach, which is the predominant approach currently in place in North America.
TABLE 8. ELECTRIC GRID INTERACTION TYPES
Interaction Type Examples Power flows: The physical movement of electricity over equipment (e.g., wires, substations)
• Bulk power system generators inject power onto the transmission system
• DERs provide power to offset customer load or inject it into the distribution system
Operational control: The ability to direct, manage, or regulate the physical operation (e.g., power output) of energy resources and grid facilities
• Distribution operator reconfigures a circuit due to emerging system constraints
• DER aggregator controls constituent resources to meet an obligation (e.g., wholesale market participation)
ccc Although the term distribution operator (DO) can be used to refer to the operator of the distribution system, it has a more limited set of functional capabilities with respect to DER coordination than a DSO.
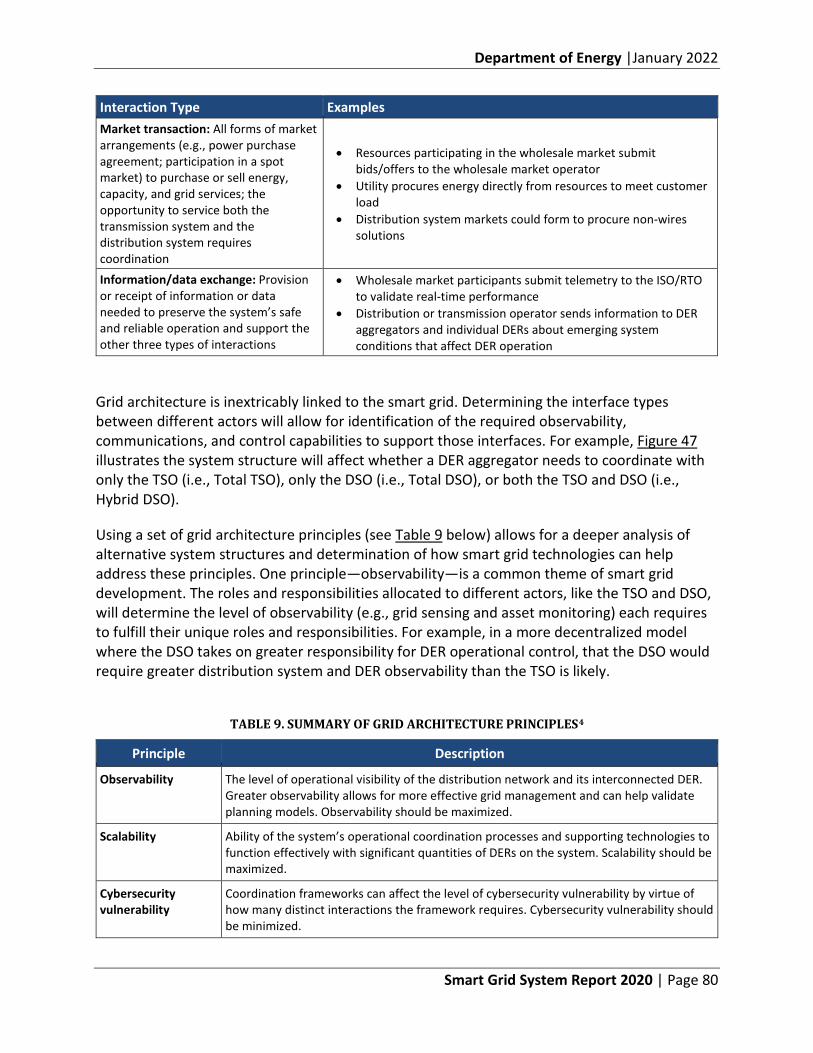
Department of Energy |January 2022
Smart Grid System Report 2020 | Page 80
Interaction Type Examples Market transaction: All forms of market arrangements (e.g., power purchase agreement; participation in a spot market) to purchase or sell energy, capacity, and grid services; the opportunity to service both the transmission system and the distribution system requires coordination
• Resources participating in the wholesale market submit bids/offers to the wholesale market operator
• Utility procures energy directly from resources to meet customer load
• Distribution system markets could form to procure non-wires solutions
Information/data exchange: Provision or receipt of information or data needed to preserve the system’s safe and reliable operation and support the other three types of interactions
• Wholesale market participants submit telemetry to the ISO/RTO to validate real-time performance
• Distribution or transmission operator sends information to DER aggregators and individual DERs about emerging system conditions that affect DER operation
Grid architecture is inextricably linked to the smart grid. Determining the interface types between different actors will allow for identification of the required observability, communications, and control capabilities to support those interfaces. For example, Figure 47 illustrates the system structure will affect whether a DER aggregator needs to coordinate with only the TSO (i.e., Total TSO), only the DSO (i.e., Total DSO), or both the TSO and DSO (i.e., Hybrid DSO).
Using a set of grid architecture principles (see Table 9 below) allows for a deeper analysis of alternative system structures and determination of how smart grid technologies can help address these principles. One principle—observability—is a common theme of smart grid development. The roles and responsibilities allocated to different actors, like the TSO and DSO, will determine the level of observability (e.g., grid sensing and asset monitoring) each requires to fulfill their unique roles and responsibilities. For example, in a more decentralized model where the DSO takes on greater responsibility for DER operational control, that the DSO would require greater distribution system and DER observability than the TSO is likely.
TABLE 9. SUMMARY OF GRID ARCHITECTURE PRINCIPLES4
Principle Description
Observability The level of operational visibility of the distribution network and its interconnected DER. Greater observability allows for more effective grid management and can help validate planning models. Observability should be maximized.
Scalability Ability of the system’s operational coordination processes and supporting technologies to function effectively with significant quantities of DERs on the system. Scalability should be maximized.
Cybersecurity vulnerability
Coordination frameworks can affect the level of cybersecurity vulnerability by virtue of how many distinct interactions the framework requires. Cybersecurity vulnerability should be minimized.
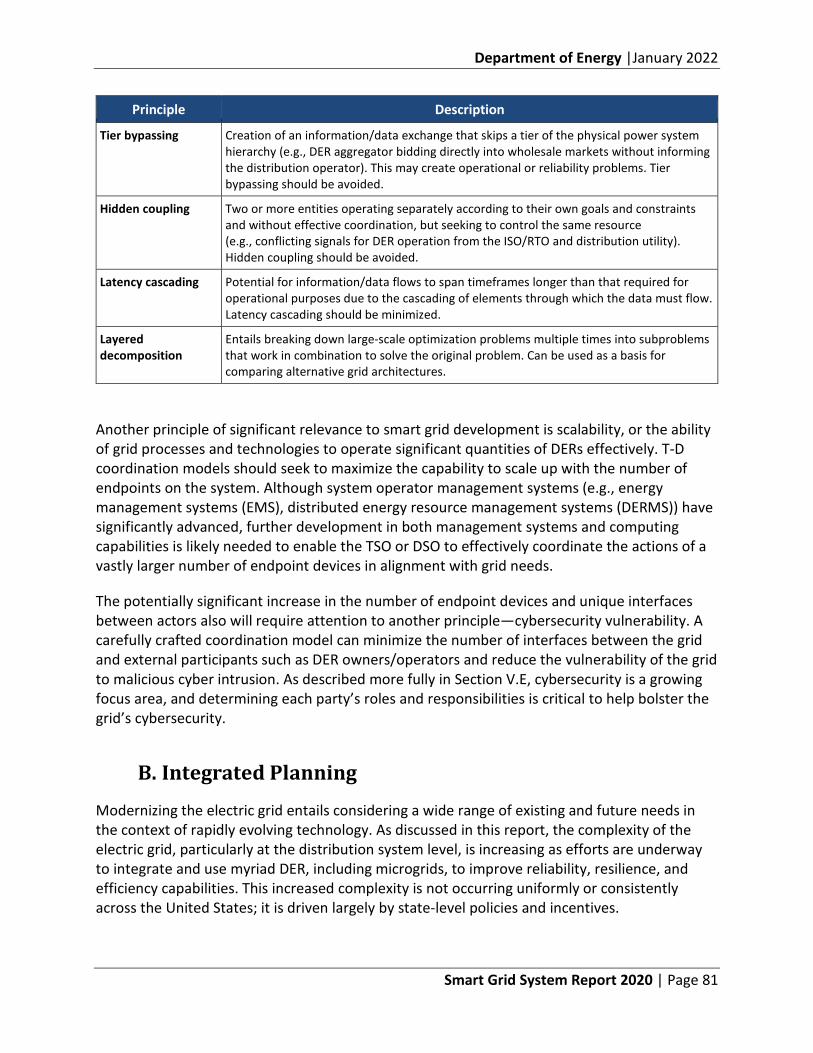
Department of Energy |January 2022
Smart Grid System Report 2020 | Page 81
Principle Description
Tier bypassing Creation of an information/data exchange that skips a tier of the physical power system hierarchy (e.g., DER aggregator bidding directly into wholesale markets without informing the distribution operator). This may create operational or reliability problems. Tier bypassing should be avoided.
Hidden coupling Two or more entities operating separately according to their own goals and constraints and without effective coordination, but seeking to control the same resource (e.g., conflicting signals for DER operation from the ISO/RTO and distribution utility). Hidden coupling should be avoided.
Latency cascading Potential for information/data flows to span timeframes longer than that required for operational purposes due to the cascading of elements through which the data must flow. Latency cascading should be minimized.
Layered decomposition
Entails breaking down large-scale optimization problems multiple times into subproblems that work in combination to solve the original problem. Can be used as a basis for comparing alternative grid architectures.
Another principle of significant relevance to smart grid development is scalability, or the ability of grid processes and technologies to operate significant quantities of DERs effectively. T-D coordination models should seek to maximize the capability to scale up with the number of endpoints on the system. Although system operator management systems (e.g., energy management systems (EMS), distributed energy resource management systems (DERMS)) have significantly advanced, further development in both management systems and computing capabilities is likely needed to enable the TSO or DSO to effectively coordinate the actions of a vastly larger number of endpoint devices in alignment with grid needs.
The potentially significant increase in the number of endpoint devices and unique interfaces between actors also will require attention to another principle—cybersecurity vulnerability. A carefully crafted coordination model can minimize the number of interfaces between the grid and external participants such as DER owners/operators and reduce the vulnerability of the grid to malicious cyber intrusion. As described more fully in Section V.E, cybersecurity is a growing focus area, and determining each party’s roles and responsibilities is critical to help bolster the grid’s cybersecurity.
B. Integrated Planning
Modernizing the electric grid entails considering a wide range of existing and future needs in the context of rapidly evolving technology. As discussed in this report, the complexity of the electric grid, particularly at the distribution system level, is increasing as efforts are underway to integrate and use myriad DER, including microgrids, to improve reliability, resilience, and efficiency capabilities. This increased complexity is not occurring uniformly or consistently across the United States; it is driven largely by state-level policies and incentives.
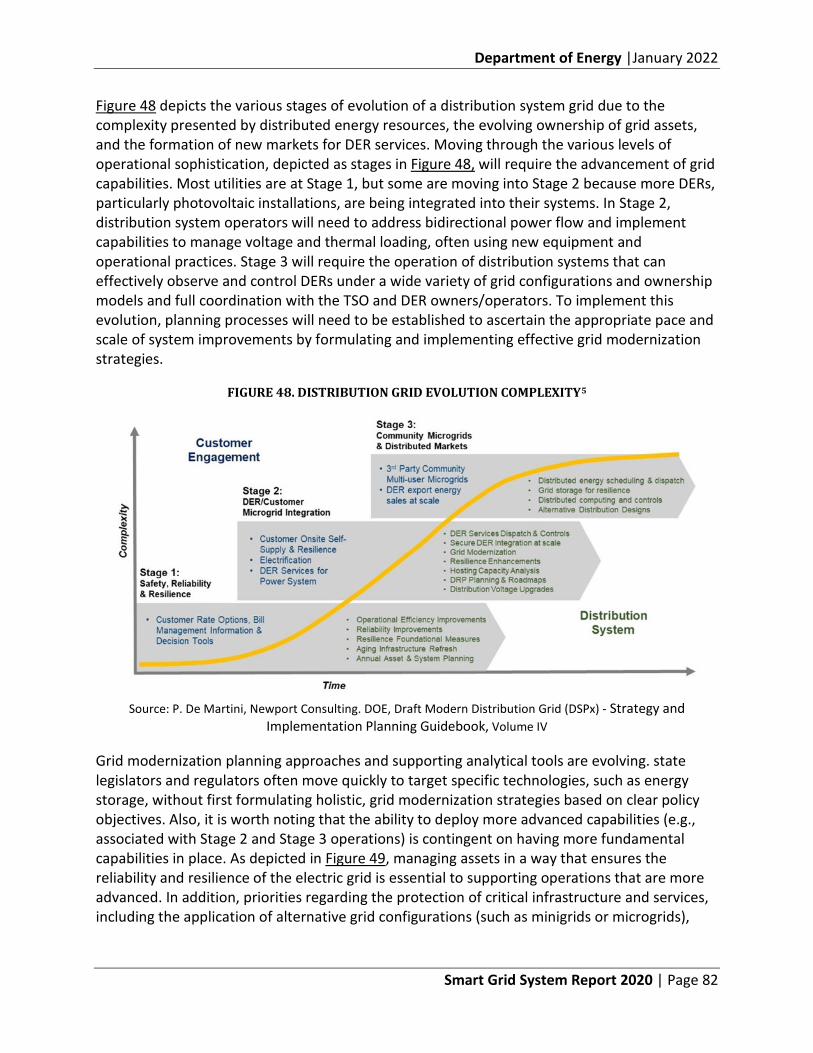
Department of Energy |January 2022
Smart Grid System Report 2020 | Page 82
Figure 48 depicts the various stages of evolution of a distribution system grid due to the complexity presented by distributed energy resources, the evolving ownership of grid assets, and the formation of new markets for DER services. Moving through the various levels of operational sophistication, depicted as stages in Figure 48, will require the advancement of grid capabilities. Most utilities are at Stage 1, but some are moving into Stage 2 because more DERs, particularly photovoltaic installations, are being integrated into their systems. In Stage 2, distribution system operators will need to address bidirectional power flow and implement capabilities to manage voltage and thermal loading, often using new equipment and operational practices. Stage 3 will require the operation of distribution systems that can effectively observe and control DERs under a wide variety of grid configurations and ownership models and full coordination with the TSO and DER owners/operators. To implement this evolution, planning processes will need to be established to ascertain the appropriate pace and scale of system improvements by formulating and implementing effective grid modernization strategies.
FIGURE 48. DISTRIBUTION GRID EVOLUTION COMPLEXITY5
Source: P. De Martini, Newport Consulting. DOE, Draft Modern Distribution Grid (DSPx) - Strategy and
Implementation Planning Guidebook, Volume IV
Grid modernization planning approaches and supporting analytical tools are evolving. state legislators and regulators often move quickly to target specific technologies, such as energy storage, without first formulating holistic, grid modernization strategies based on clear policy objectives. Also, it is worth noting that the ability to deploy more advanced capabilities (e.g., associated with Stage 2 and Stage 3 operations) is contingent on having more fundamental capabilities in place. As depicted in Figure 49, managing assets in a way that ensures the reliability and resilience of the electric grid is essential to supporting operations that are more advanced. In addition, priorities regarding the protection of critical infrastructure and services, including the application of alternative grid configurations (such as minigrids or microgrids),
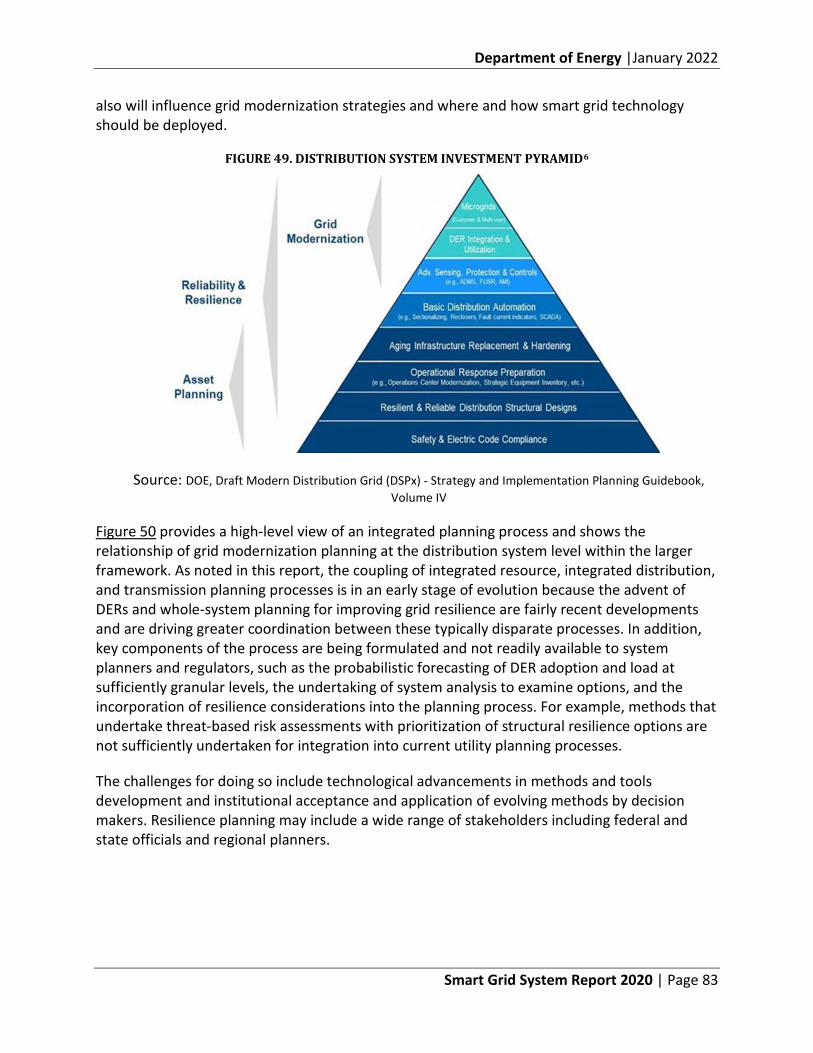
Department of Energy |January 2022
Smart Grid System Report 2020 | Page 83
also will influence grid modernization strategies and where and how smart grid technology should be deployed.
FIGURE 49. DISTRIBUTION SYSTEM INVESTMENT PYRAMID6
Source: DOE, Draft Modern Distribution Grid (DSPx) - Strategy and Implementation Planning Guidebook, Volume IV
Figure 50 provides a high-level view of an integrated planning process and shows the relationship of grid modernization planning at the distribution system level within the larger framework. As noted in this report, the coupling of integrated resource, integrated distribution, and transmission planning processes is in an early stage of evolution because the advent of DERs and whole-system planning for improving grid resilience are fairly recent developments and are driving greater coordination between these typically disparate processes. In addition, key components of the process are being formulated and not readily available to system planners and regulators, such as the probabilistic forecasting of DER adoption and load at sufficiently granular levels, the undertaking of system analysis to examine options, and the incorporation of resilience considerations into the planning process. For example, methods that undertake threat-based risk assessments with prioritization of structural resilience options are not sufficiently undertaken for integration into current utility planning processes.
The challenges for doing so include technological advancements in methods and tools development and institutional acceptance and application of evolving methods by decision makers. Resilience planning may include a wide range of stakeholders including federal and state officials and regional planners.
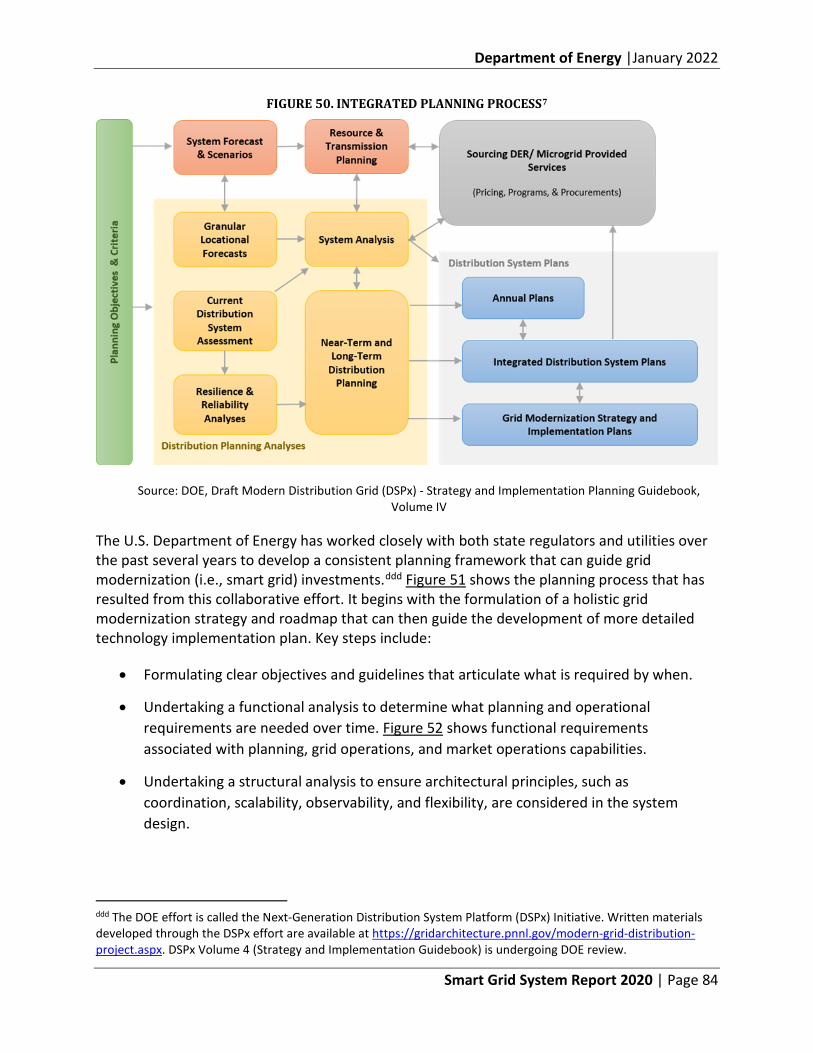
Department of Energy |January 2022
Smart Grid System Report 2020 | Page 84
FIGURE 50. INTEGRATED PLANNING PROCESS7
Source: DOE, Draft Modern Distribution Grid (DSPx) - Strategy and Implementation Planning Guidebook, Volume IV
The U.S. Department of Energy has worked closely with both state regulators and utilities over the past several years to develop a consistent planning framework that can guide grid modernization (i.e., smart grid) investments.ddd Figure 51 shows the planning process that has resulted from this collaborative effort. It begins with the formulation of a holistic grid modernization strategy and roadmap that can then guide the development of more detailed technology implementation plan. Key steps include:
• Formulating clear objectives and guidelines that articulate what is required by when.
• Undertaking a functional analysis to determine what planning and operational requirements are needed over time. Figure 52 shows functional requirements associated with planning, grid operations, and market operations capabilities.
• Undertaking a structural analysis to ensure architectural principles, such as coordination, scalability, observability, and flexibility, are considered in the system design.
ddd The DOE effort is called the Next-Generation Distribution System Platform (DSPx) Initiative. Written materials developed through the DSPx effort are available at https://gridarchitecture.pnnl.gov/modern-grid-distribution-project.aspx. DSPx Volume 4 (Strategy and Implementation Guidebook) is undergoing DOE review.
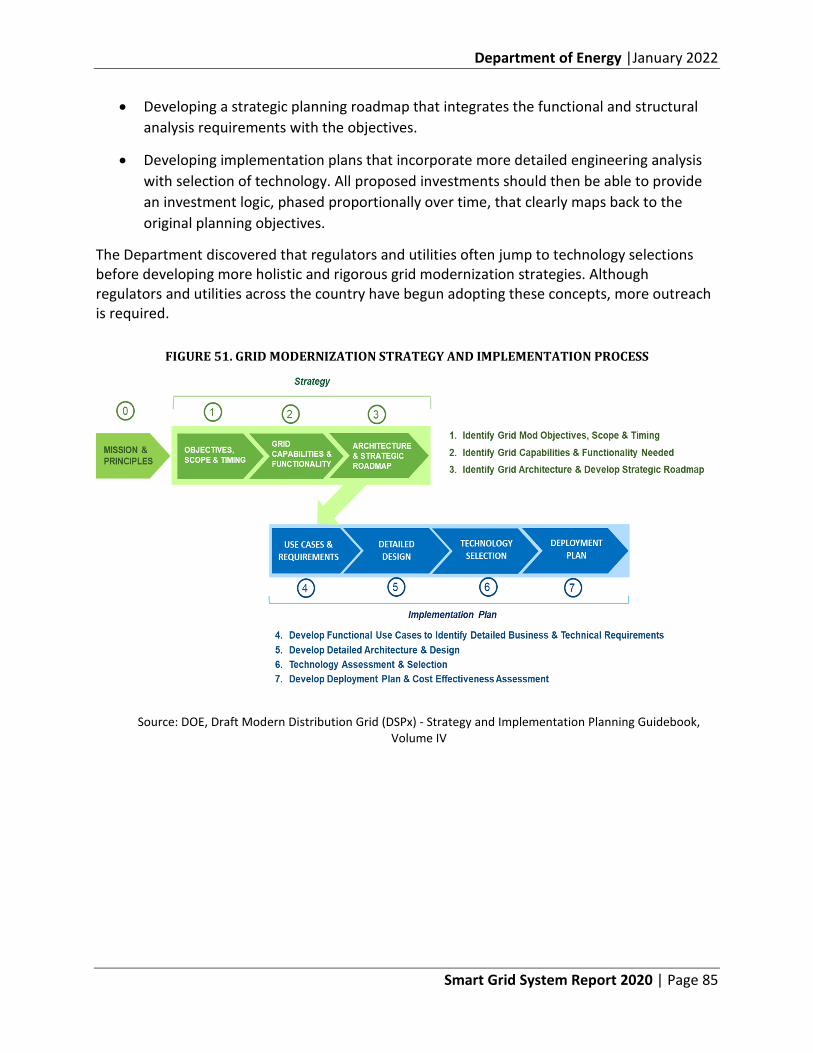
Department of Energy |January 2022
Smart Grid System Report 2020 | Page 85
• Developing a strategic planning roadmap that integrates the functional and structural analysis requirements with the objectives.
• Developing implementation plans that incorporate more detailed engineering analysis with selection of technology. All proposed investments should then be able to provide an investment logic, phased proportionally over time, that clearly maps back to the original planning objectives.
The Department discovered that regulators and utilities often jump to technology selections before developing more holistic and rigorous grid modernization strategies. Although regulators and utilities across the country have begun adopting these concepts, more outreach is required.
FIGURE 51. GRID MODERNIZATION STRATEGY AND IMPLEMENTATION PROCESS
Source: DOE, Draft Modern Distribution Grid (DSPx) - Strategy and Implementation Planning Guidebook, Volume IV
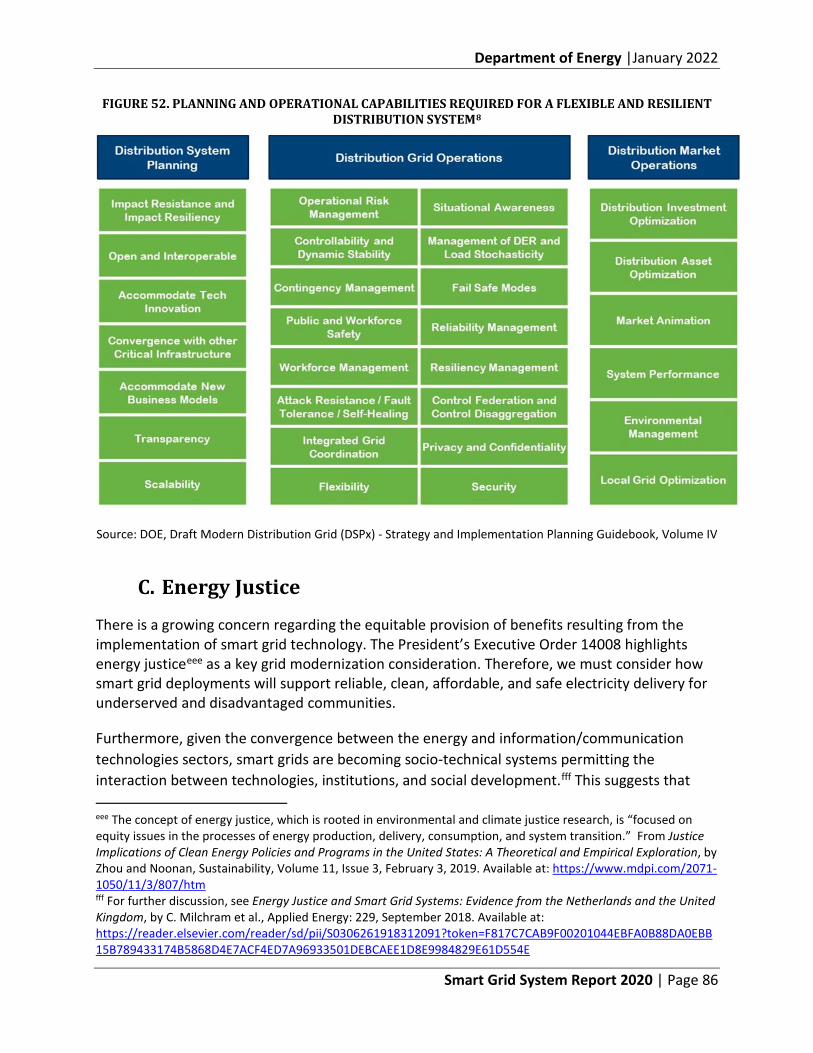
Department of Energy |January 2022
Smart Grid System Report 2020 | Page 86
FIGURE 52. PLANNING AND OPERATIONAL CAPABILITIES REQUIRED FOR A FLEXIBLE AND RESILIENT DISTRIBUTION SYSTEM8
Source: DOE, Draft Modern Distribution Grid (DSPx) - Strategy and Implementation Planning Guidebook, Volume IV
C. Energy Justice
There is a growing concern regarding the equitable provision of benefits resulting from the implementation of smart grid technology. The President’s Executive Order 14008 highlights energy justiceeee as a key grid modernization consideration. Therefore, we must consider how smart grid deployments will support reliable, clean, affordable, and safe electricity delivery for underserved and disadvantaged communities.
Furthermore, given the convergence between the energy and information/communication technologies sectors, smart grids are becoming socio-technical systems permitting the interaction between technologies, institutions, and social development.fff This suggests that
eee The concept of energy justice, which is rooted in environmental and climate justice research, is “focused on equity issues in the processes of energy production, delivery, consumption, and system transition.” From Justice Implications of Clean Energy Policies and Programs in the United States: A Theoretical and Empirical Exploration, by Zhou and Noonan, Sustainability, Volume 11, Issue 3, February 3, 2019. Available at: https://www.mdpi.com/2071-1050/11/3/807/htm fff For further discussion, see Energy Justice and Smart Grid Systems: Evidence from the Netherlands and the United Kingdom, by C. Milchram et al., Applied Energy: 229, September 2018. Available at: https://reader.elsevier.com/reader/sd/pii/S0306261918312091?token=F817C7CAB9F00201044EBFA0B88DA0EBB15B789433174B5868D4E7ACF4ED7A96933501DEBCAEE1D8E9984829E61D554E
Department of Energy |January 2022
Smart Grid System Report 2020 | Page 87
“social value” becomes a design driver for smart grid implementation in addition to technical-economic aspects. Addressing energy justice will require:
• Equitable distribution of benefits, burdens, or costs, and responsibilities among stakeholders of a given energy system.
• Equitable access to and participation in decision-making processes shaping the design objectives and outcomes of energy systems.
• Education to gain an equitable appreciation of stakeholder groups within energy systems.
D. Research, Development, and Demonstration Needs
Having dedicated research, development, and demonstration (RD&D) activities to continue enhancing the smart grid technological capabilities is critical to meet evolving electric system needs. Smart grid RD&D has been a key focus area of DOE which has led and coordinated grid modernization efforts across the country. These efforts were given a significant boost with the passage of Title XIII of the Energy Independence and Security Act of 2007 (EISA). Subsequently, through the American Recovery and Reinvestment Act (ARRA) of 2009, DOE received $3.4 billion to invest in 99 Smart Grid Investment Grant (SGIG) projects with the objectives of modernizing the grid, enhancing cybersecurity, improving interoperability, and reporting on the performance of smart grid technology.9 This was augmented with an additional $700 million to fund the Smart Grid Regional and Energy Storage Demonstration program which supported 32 projects.ggg The combined effort applied over $9 billion in government and private-sector funds over a five-year period.
In addition to program funding, DOE has continued to advance smart grid RD&D activities through its Grid Modernization Initiative (GMI), Grid Modernization Laboratory Consortium (GMLC), and Advanced Research Projects Agency-Energy (ARPA-E) to create next-generation smart systems, including devices, software, tools, and techniques.10 The success of these DOE-led RD&D efforts depends on the ability to coordinate with others, including federal agencies, electric utilities, equipment manufacturers, regional, state, and local governments, National Laboratories, universities, and research organizations. Figure 53 shows active research areas within DOE and how these areas tie to grid technologies. Underlying the successful application of grid technologies are the overarching technical requirements of observability, controllability, and interoperability.
ggg For more information, including project details, on the Department’s Smart Grid ARRA efforts: https://www.energy.gov/oe/information-center/recovery-act
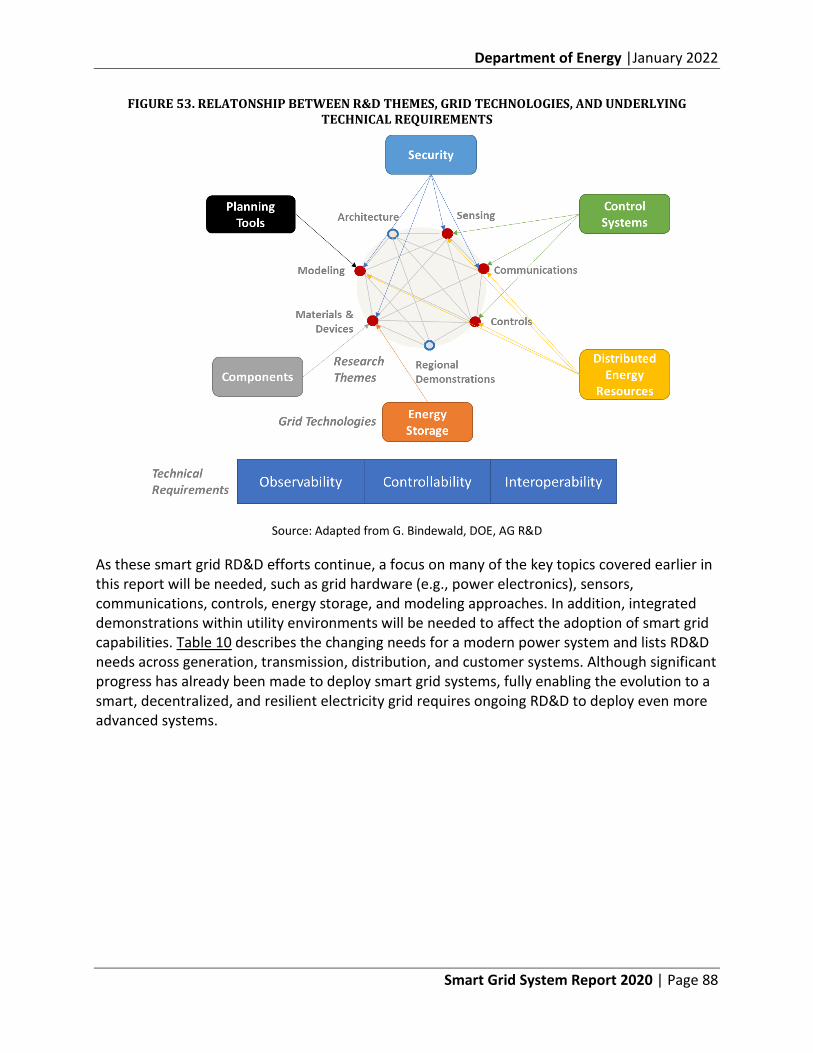
Department of Energy |January 2022
Smart Grid System Report 2020 | Page 88
FIGURE 53. RELATONSHIP BETWEEN R&D THEMES, GRID TECHNOLOGIES, AND UNDERLYING TECHNICAL REQUIREMENTS
Source: Adapted from G. Bindewald, DOE, AG R&D
As these smart grid RD&D efforts continue, a focus on many of the key topics covered earlier in this report will be needed, such as grid hardware (e.g., power electronics), sensors, communications, controls, energy storage, and modeling approaches. In addition, integrated demonstrations within utility environments will be needed to affect the adoption of smart grid capabilities. Table 10 describes the changing needs for a modern power system and lists RD&D needs across generation, transmission, distribution, and customer systems. Although significant progress has already been made to deploy smart grid systems, fully enabling the evolution to a smart, decentralized, and resilient electricity grid requires ongoing RD&D to deploy even more advanced systems.
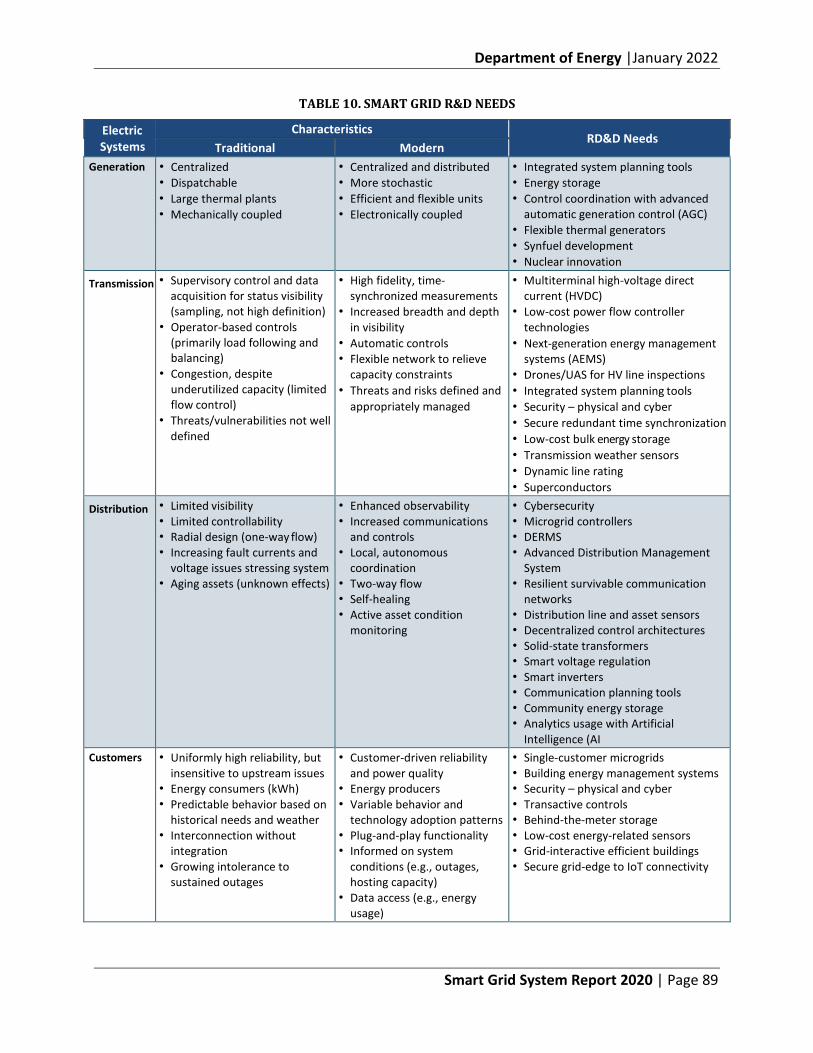
Department of Energy |January 2022
Smart Grid System Report 2020 | Page 89
TABLE 10. SMART GRID R&D NEEDS
Electric Systems
Characteristics RD&D Needs
Traditional Modern Generation • Centralized
• Dispatchable • Large thermal plants • Mechanically coupled
• Centralized and distributed • More stochastic • Efficient and flexible units • Electronically coupled
• Integrated system planning tools • Energy storage • Control coordination with advanced
automatic generation control (AGC) • Flexible thermal generators • Synfuel development • Nuclear innovation
Transmission • Supervisory control and data acquisition for status visibility (sampling, not high definition)
• Operator-based controls (primarily load following and balancing)
• Congestion, despite underutilized capacity (limited flow control)
• Threats/vulnerabilities not well defined
• High fidelity, time- synchronized measurements
• Increased breadth and depth in visibility
• Automatic controls • Flexible network to relieve
capacity constraints • Threats and risks defined and
appropriately managed
• Multiterminal high-voltage direct current (HVDC)
• Low-cost power flow controller technologies
• Next-generation energy management systems (AEMS)
• Drones/UAS for HV line inspections • Integrated system planning tools • Security – physical and cyber • Secure redundant time synchronization • Low-cost bulk energy storage • Transmission weather sensors • Dynamic line rating • Superconductors
Distribution • Limited visibility • Limited controllability • Radial design (one-way flow) • Increasing fault currents and
voltage issues stressing system • Aging assets (unknown effects)
• Enhanced observability • Increased communications
and controls • Local, autonomous
coordination • Two-way flow • Self-healing • Active asset condition
monitoring
• Cybersecurity • Microgrid controllers • DERMS • Advanced Distribution Management
System • Resilient survivable communication
networks • Distribution line and asset sensors • Decentralized control architectures • Solid-state transformers • Smart voltage regulation • Smart inverters • Communication planning tools • Community energy storage • Analytics usage with Artificial
Intelligence (AI Customers • Uniformly high reliability, but
insensitive to upstream issues • Energy consumers (kWh) • Predictable behavior based on
historical needs and weather • Interconnection without
integration • Growing intolerance to
sustained outages
• Customer-driven reliability and power quality
• Energy producers • Variable behavior and
technology adoption patterns • Plug-and-play functionality • Informed on system
conditions (e.g., outages, hosting capacity)
• Data access (e.g., energy usage)
• Single-customer microgrids • Building energy management systems • Security – physical and cyber • Transactive controls • Behind-the-meter storage • Low-cost energy-related sensors • Grid-interactive efficient buildings • Secure grid-edge to IoT connectivity
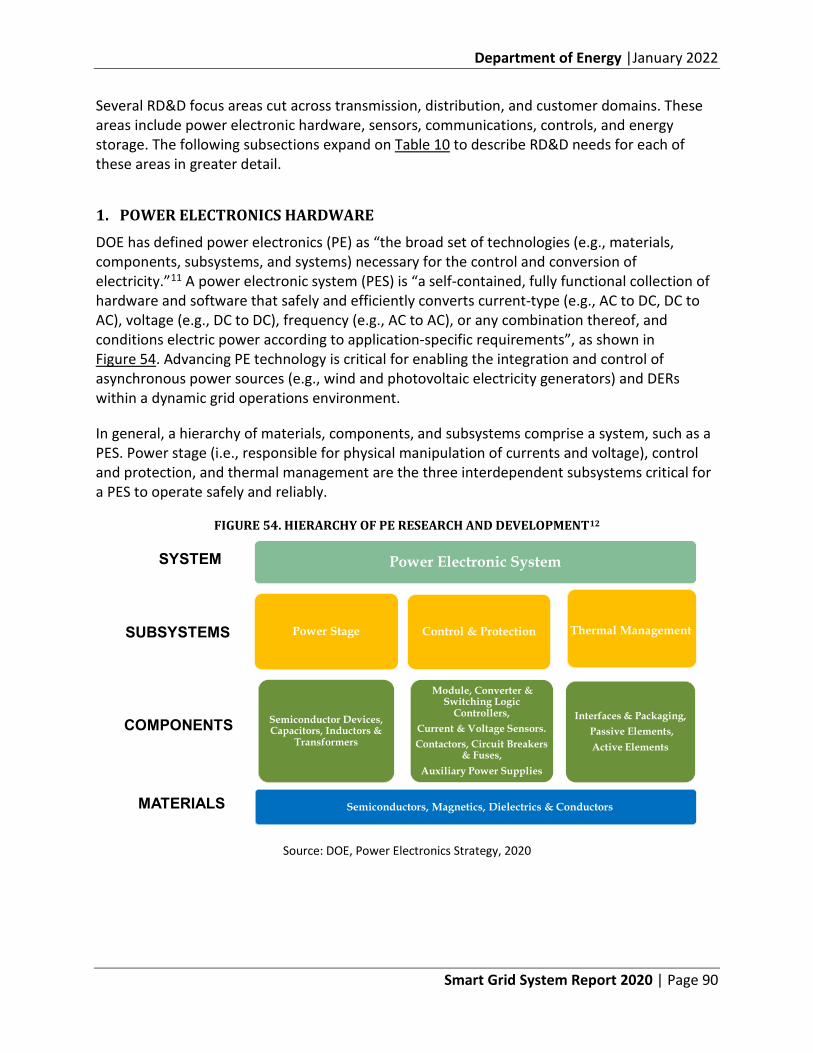
Department of Energy |January 2022
Smart Grid System Report 2020 | Page 90
Several RD&D focus areas cut across transmission, distribution, and customer domains. These areas include power electronic hardware, sensors, communications, controls, and energy storage. The following subsections expand on Table 10 to describe RD&D needs for each of these areas in greater detail.
1. POWER ELECTRONICS HARDWARE
DOE has defined power electronics (PE) as “the broad set of technologies (e.g., materials, components, subsystems, and systems) necessary for the control and conversion of electricity.”11 A power electronic system (PES) is “a self-contained, fully functional collection of hardware and software that safely and efficiently converts current-type (e.g., AC to DC, DC to AC), voltage (e.g., DC to DC), frequency (e.g., AC to AC), or any combination thereof, and conditions electric power according to application-specific requirements”, as shown in Figure 54. Advancing PE technology is critical for enabling the integration and control of asynchronous power sources (e.g., wind and photovoltaic electricity generators) and DERs within a dynamic grid operations environment.
In general, a hierarchy of materials, components, and subsystems comprise a system, such as a PES. Power stage (i.e., responsible for physical manipulation of currents and voltage), control and protection, and thermal management are the three interdependent subsystems critical for a PES to operate safely and reliably.
FIGURE 54. HIERARCHY OF PE RESEARCH AND DEVELOPMENT12
Source: DOE, Power Electronics Strategy, 2020
Power Electronic System
Power Stage
Semiconductor Devices, Capacitors, Inductors &
Transformers
Control & Protection
Module, Converter & Switching Logic
Controllers,Current & Voltage Sensors.Contactors, Circuit Breakers
& Fuses,Auxiliary Power Supplies
Interfaces & Packaging,Passive Elements,Active Elements
Semiconductors, Magnetics, Dielectrics & Conductors
COMPONENTS
MATERIALS
SUBSYSTEMS
SYSTEM
Thermal Management
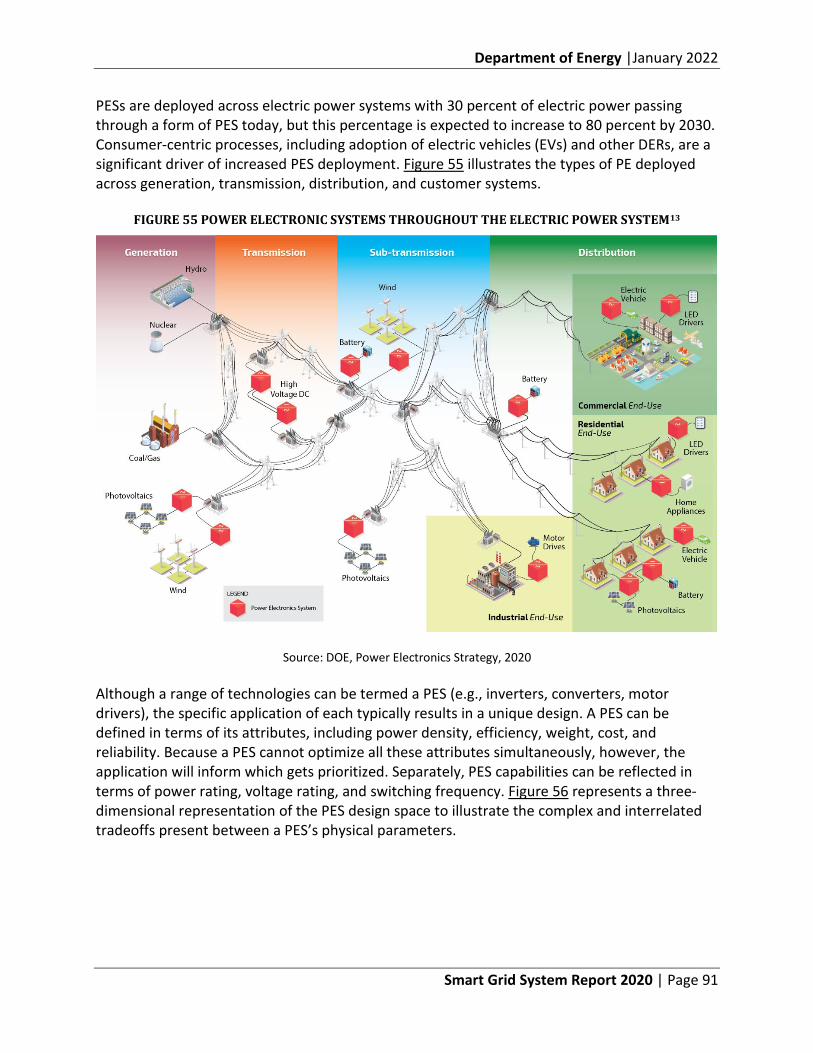
Department of Energy |January 2022
Smart Grid System Report 2020 | Page 91
PESs are deployed across electric power systems with 30 percent of electric power passing through a form of PES today, but this percentage is expected to increase to 80 percent by 2030. Consumer-centric processes, including adoption of electric vehicles (EVs) and other DERs, are a significant driver of increased PES deployment. Figure 55 illustrates the types of PE deployed across generation, transmission, distribution, and customer systems.
FIGURE 55 POWER ELECTRONIC SYSTEMS THROUGHOUT THE ELECTRIC POWER SYSTEM13
Source: DOE, Power Electronics Strategy, 2020
Although a range of technologies can be termed a PES (e.g., inverters, converters, motor drivers), the specific application of each typically results in a unique design. A PES can be defined in terms of its attributes, including power density, efficiency, weight, cost, and reliability. Because a PES cannot optimize all these attributes simultaneously, however, the application will inform which gets prioritized. Separately, PES capabilities can be reflected in terms of power rating, voltage rating, and switching frequency. Figure 56 represents a three-dimensional representation of the PES design space to illustrate the complex and interrelated tradeoffs present between a PES’s physical parameters.
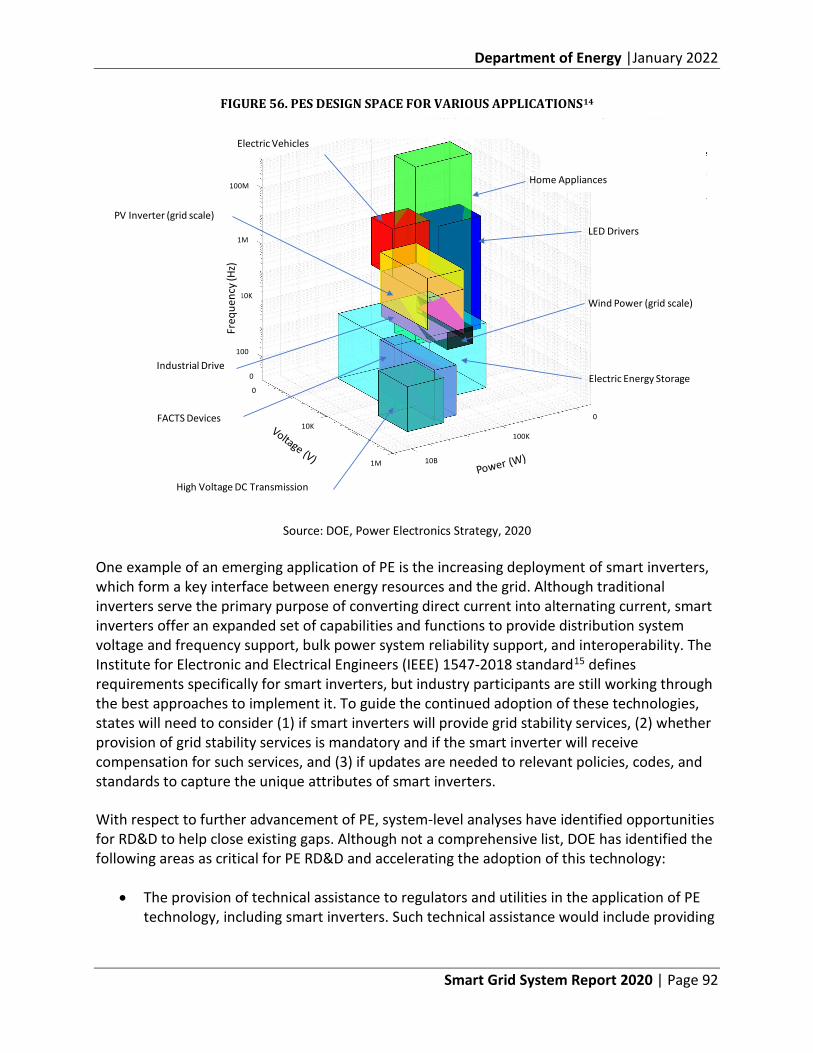
Department of Energy |January 2022
Smart Grid System Report 2020 | Page 92
FIGURE 56. PES DESIGN SPACE FOR VARIOUS APPLICATIONS14
Source: DOE, Power Electronics Strategy, 2020
One example of an emerging application of PE is the increasing deployment of smart inverters, which form a key interface between energy resources and the grid. Although traditional inverters serve the primary purpose of converting direct current into alternating current, smart inverters offer an expanded set of capabilities and functions to provide distribution system voltage and frequency support, bulk power system reliability support, and interoperability. The Institute for Electronic and Electrical Engineers (IEEE) 1547-2018 standard15 defines requirements specifically for smart inverters, but industry participants are still working through the best approaches to implement it. To guide the continued adoption of these technologies, states will need to consider (1) if smart inverters will provide grid stability services, (2) whether provision of grid stability services is mandatory and if the smart inverter will receive compensation for such services, and (3) if updates are needed to relevant policies, codes, and standards to capture the unique attributes of smart inverters.
With respect to further advancement of PE, system-level analyses have identified opportunities for RD&D to help close existing gaps. Although not a comprehensive list, DOE has identified the following areas as critical for PE RD&D and accelerating the adoption of this technology:
• The provision of technical assistance to regulators and utilities in the application of PE technology, including smart inverters. Such technical assistance would include providing
10K
1M
0
0
100
10K
1M
100M
10B
100K
0
Freq
uenc
y (Hz
)
High Voltage DC Transmission
Industrial Drive
LED Drivers
Electric Vehicles
PV Inverter (grid scale)
Wind Power (grid scale)
Electric Energy Storage
FACTS Devices
Home Appliances
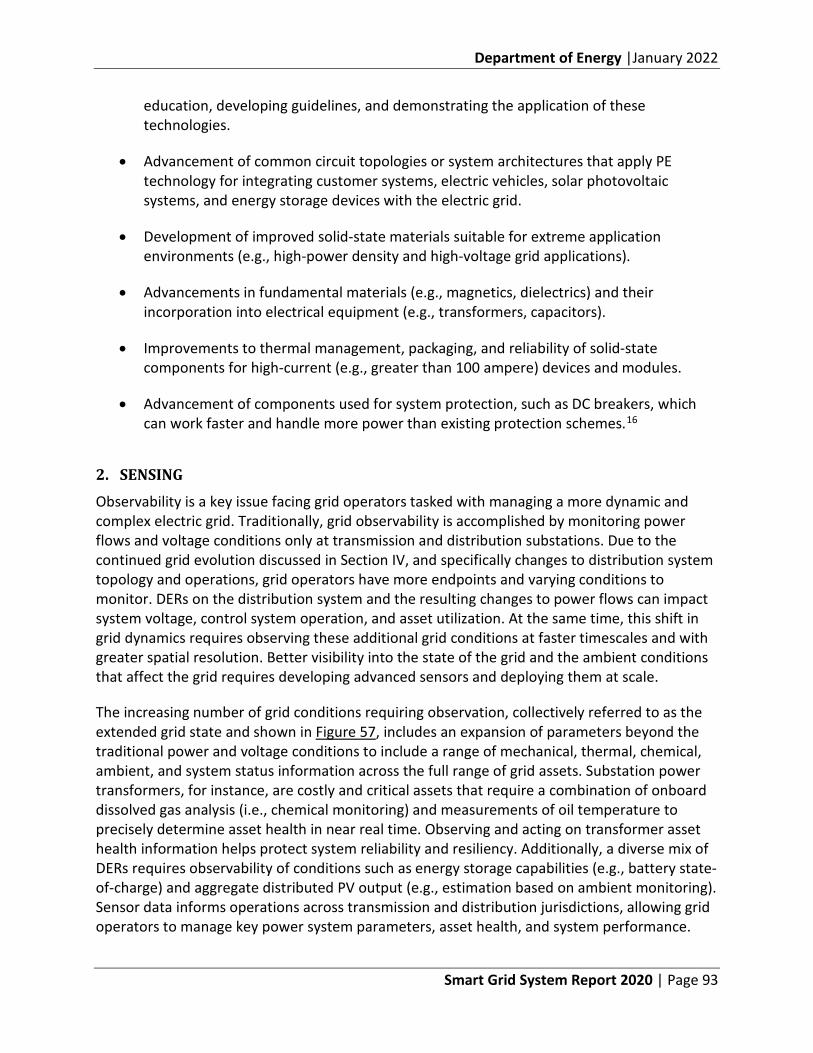
Department of Energy |January 2022
Smart Grid System Report 2020 | Page 93
education, developing guidelines, and demonstrating the application of these technologies.
• Advancement of common circuit topologies or system architectures that apply PE technology for integrating customer systems, electric vehicles, solar photovoltaic systems, and energy storage devices with the electric grid.
• Development of improved solid-state materials suitable for extreme application environments (e.g., high-power density and high-voltage grid applications).
• Advancements in fundamental materials (e.g., magnetics, dielectrics) and their incorporation into electrical equipment (e.g., transformers, capacitors).
• Improvements to thermal management, packaging, and reliability of solid-state components for high-current (e.g., greater than 100 ampere) devices and modules.
• Advancement of components used for system protection, such as DC breakers, which can work faster and handle more power than existing protection schemes.16
2. SENSING
Observability is a key issue facing grid operators tasked with managing a more dynamic and complex electric grid. Traditionally, grid observability is accomplished by monitoring power flows and voltage conditions only at transmission and distribution substations. Due to the continued grid evolution discussed in Section IV, and specifically changes to distribution system topology and operations, grid operators have more endpoints and varying conditions to monitor. DERs on the distribution system and the resulting changes to power flows can impact system voltage, control system operation, and asset utilization. At the same time, this shift in grid dynamics requires observing these additional grid conditions at faster timescales and with greater spatial resolution. Better visibility into the state of the grid and the ambient conditions that affect the grid requires developing advanced sensors and deploying them at scale.
The increasing number of grid conditions requiring observation, collectively referred to as the extended grid state and shown in Figure 57, includes an expansion of parameters beyond the traditional power and voltage conditions to include a range of mechanical, thermal, chemical, ambient, and system status information across the full range of grid assets. Substation power transformers, for instance, are costly and critical assets that require a combination of onboard dissolved gas analysis (i.e., chemical monitoring) and measurements of oil temperature to precisely determine asset health in near real time. Observing and acting on transformer asset health information helps protect system reliability and resiliency. Additionally, a diverse mix of DERs requires observability of conditions such as energy storage capabilities (e.g., battery state-of-charge) and aggregate distributed PV output (e.g., estimation based on ambient monitoring). Sensor data informs operations across transmission and distribution jurisdictions, allowing grid operators to manage key power system parameters, asset health, and system performance.
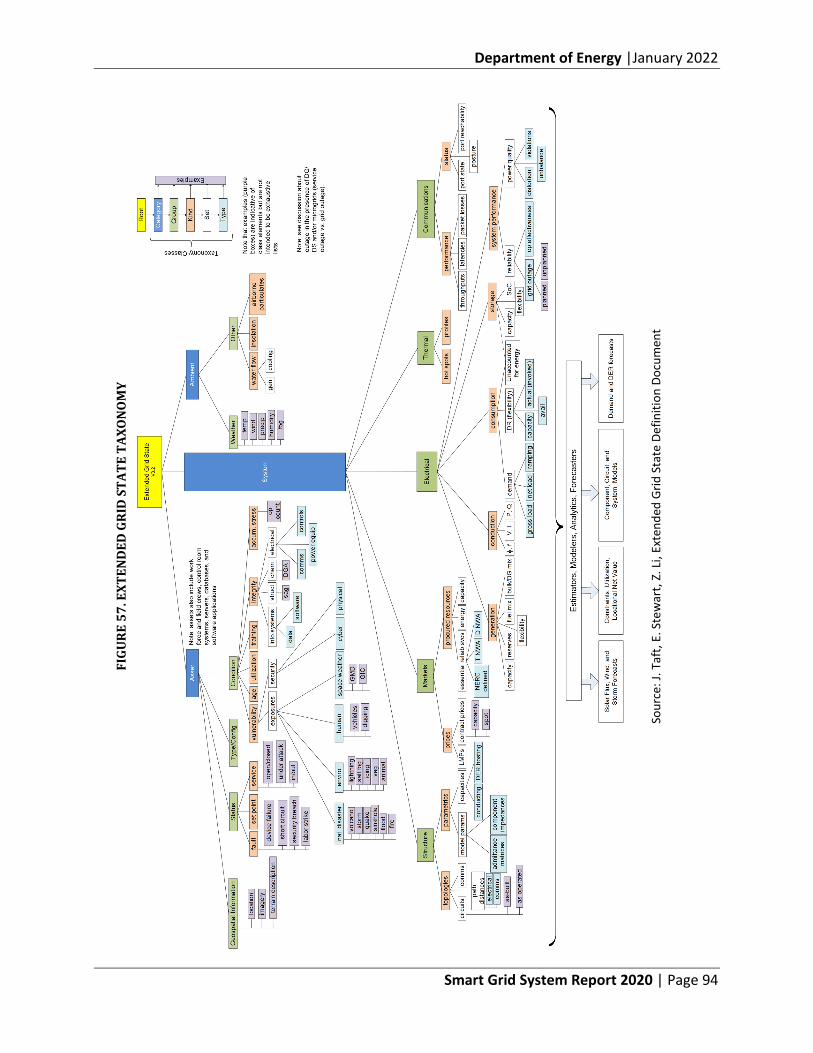
Department of Energy |January 2022
Smart Grid System Report 2020 | Page 94
FIGU
RE 5
7. E
XTEN
DED
GRI
D S
TATE
TAX
ON
OM
Y
Sour
ce: J
. Taf
t, E.
Ste
war
t, Z.
Li,
Exte
nded
Grid
Sta
te D
efin
ition
Doc
umen
t
Department of Energy |January 2022
Smart Grid System Report 2020 | Page 95
Sensors, which comprise the four core elements shown in Figure 58, currently are used primarily for localized applications and often are not fully integrated. Of these elements, powering sensors and establishing robust communications pose persistent challenges due to the remote geographic and harsh environmental conditions often associated with sensor deployments. These challenges, including the maintenance implications and significant upfront costs of sensors, have limited their use to niche applications rather than more widespread adoption that would provide a holistic view of grid state. The four core sensor elements shown in Figure 58, however, are increasingly converging to achieve fully integrated sensing or measurement systems.
FIGURE 58: FOUR CORE ELEMENTS OF AN INTEGRATED SENSOR
Sensing technology has several gaps, but R&D can help utilities enhance the level of sensing to support the future grid. To address these gaps and enable timely diagnosis, prediction, and prescription of system variables during normal and extreme event conditions, R&D efforts should focus on improving the cost and performance capabilities of sensors and the systems they support. DOE has identified a variety of areas where targeted RD&D could help close existing gaps in sensing technology capabilities, including:
• Develop robust, low-cost, multiparameter sensors that can be ubiquitously applied to monitor the health, performance, and state of grid assets and the ambient environment. Such sensors should measure a variety of physical, electrical, and chemical parameters and be applied to improve grid reliability, the observability of distributed assets, and system protection.
• Pursue research and development to advance materials needed to improve the robustness and functional range of sensors.
• Develop platforms to enable the integration of multiple sensor types for a range of applications.
Physical transducer: Converts measured phyiscal
parameter (measurand) to an electrical signal for processing.
Computational device: Converts the electrical signal from the transducer to digital
information (typically a microprocessor or microcontroller).
Communication device: Transmits the information
over a wired or wireless network to a location for
enabling data analytics and, ultimately, decision-making.
Power supply or system: Provides power to various
elements of the sensor device.
Sensor Elements
Department of Energy |January 2022
Smart Grid System Report 2020 | Page 96
• Explore opportunities for improving the reliability, speed, accuracy, and cost of phasor measurement units for distribution-level applications.
• Pursue new sensing technologies required for emerging grid components, such as power electronics-based, solid-state transformers.
• Develop sensor technology with onboard data assimilation, analytics, and distributed intelligence to reduce the requirement for information flow and enable automatic functions.
3. DATA MANAGEMENT AND ANALYTICS
Sensor deployment throughout the electric grid has provided utilities with large amounts of data. This increasingly requires improved data management and analytics techniques to turn these data into actionable information for grid operators. Data analytics, on the other hand, is the science of analyzing raw data to draw conclusions useful for meeting organizational objectives. Data management practices treat data as valuable assets to unlock their potential for an organization.hhh
Considering the case of customer Advanced Metering Infrastructure (AMI) data, a utility could collect 15-minute or hourly data for millions of customers and amass years’ worth of these records. Each record could contain multiple data points such as voltage level, real power, and reactive power. Although this vast amount of data poses integrity, storage, and analytics challenges, utilities are finding ways to use this information for operational applications such locating a distribution system problem (e.g., tree on power line) or for advanced planning analytics associated with targeting energy efficiency and demand side management programs or improving asset management.iii In an application using more advanced sensor data, utilities have used high-resolution voltage and current data at the distribution substation level, coupled with pattern-matching software analysis, to effectively detect incipient faults before they lead to equipment failure and cause customer outages.jjj
The required timescale for sensing, transferring, and analyzing grid data depends on the application. Real-time analytics for protection and control, for instance, require very low latency (i.e., millisecond to subsecond) data sensing and processing, while transaction analytics for market operations requires historical data at a higher latency (i.e., minutes to days). Figure 59 depicts a range of acceptable data latencies for different grid applications.
hhh Managing data effectively requires having a data strategy and reliable methods to access, integrate, cleanse, govern, store, and prepare data for analytics. iii DOE, Advanced Metering Infrastructure and Customer Systems, Results from the Smart Grid Investment Grant Program, September 2016, available at: https://www.energy.gov/sites/prod/files/2016/12/f34/AMI%20Summary%20Report_09-26-16.pdf jjj Mid-South Synergy Electric Cooperative, Texas A&M, Mid-South Synergy Uses DFA Technology to Avoid Outage and to Reduce Wildfire Risk, February 2017, available at: http://powersolutionsllc.us/wp-content/uploads/2017/02/201701.MidSouth.BrokenInsulatorAndCharredCrossarm.pdf
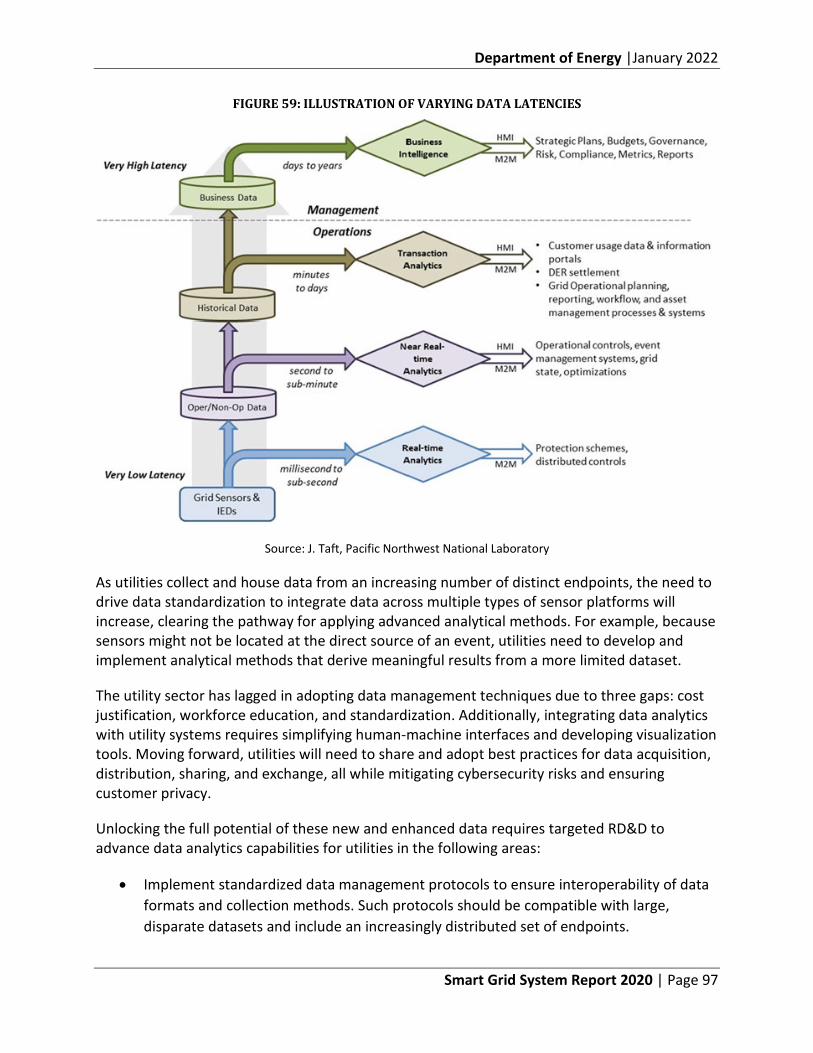
Department of Energy |January 2022
Smart Grid System Report 2020 | Page 97
FIGURE 59: ILLUSTRATION OF VARYING DATA LATENCIES
Source: J. Taft, Pacific Northwest National Laboratory
As utilities collect and house data from an increasing number of distinct endpoints, the need to drive data standardization to integrate data across multiple types of sensor platforms will increase, clearing the pathway for applying advanced analytical methods. For example, because sensors might not be located at the direct source of an event, utilities need to develop and implement analytical methods that derive meaningful results from a more limited dataset.
The utility sector has lagged in adopting data management techniques due to three gaps: cost justification, workforce education, and standardization. Additionally, integrating data analytics with utility systems requires simplifying human-machine interfaces and developing visualization tools. Moving forward, utilities will need to share and adopt best practices for data acquisition, distribution, sharing, and exchange, all while mitigating cybersecurity risks and ensuring customer privacy.
Unlocking the full potential of these new and enhanced data requires targeted RD&D to advance data analytics capabilities for utilities in the following areas:
• Implement standardized data management protocols to ensure interoperability of data formats and collection methods. Such protocols should be compatible with large, disparate datasets and include an increasingly distributed set of endpoints.
Department of Energy |January 2022
Smart Grid System Report 2020 | Page 98
• Develop and apply methods for data monitoring, cleansing, and utilization that support the incorporation of data into utility models and systems within required timeframes. These methods should support a range of applications that enable the integration of data from both new and existing sensors.
• Pursue, through demonstrations, the application of multimodal and multivariate machine learning techniques to support real-time and predictive analysis of a wide range of grid conditions.
• Develop simplified human-machine interfaces with advanced data management and analytical tools.
• Target development and application of analytical methods that enable the coupling of sensors of varying types (e.g., mechanical, radio frequency, optical, electrical) and time synchronization to accomplish the desired objectives of operating a modern electric power system (e.g., resilience, wildfire mitigation).
• Develop a program and an information sharing platform to identify utility analytics challenges; connect utilities with researchers at national labs and academia; and share outcomes with the broader utility industry.
4. GRID CONTROL
The increasing number of renewable and distributed energy resources is fundamentally changing traditional approaches for managing key power system parameters (i.e., voltage, frequency, current, and power flow) and for balancing the supply and demand of electricity. Approaches for maintaining strict control over these parameters and ensuring a balanced system require the development and application of more sophisticated, digital control schemes with the ability to undertake actions involving more endpoints within faster and more dynamic timeframes.
Traditionally, supplying sufficient electric power to meet load is accomplished by dispatching power plants or taking them offline, depending on whether power demand is increasing or decreasing, respectively. Finer control is accomplished by regulating the speed at which generators at power plants rotate, as measured by changes in system frequency (which is kept tightly at 60 hertz, or cycles per second).kkk The rotating mass of these generators is largely responsible for maintaining the inertia needed to maintain a constant frequency across the grid system.
kkk In large, interconnected power systems, grid operators use centralized AGC systems to continuously (every 4–6 seconds) update the setpoints of generators to regulate power output and frequency.
Department of Energy |January 2022
Smart Grid System Report 2020 | Page 99
Separately, voltage and reactive power levels are controlled through a variety of devices (e.g., transformers and capacitors) that can be set manually or automatically adjusted through centralized or distributed control systems.lll
As discussed throughout this report, electric grids are experiencing rapid changes in the generation resource mix with increasing amounts of renewable generation such as wind and solar photovoltaic (PV) power plants and a plethora of distributed energy resources that can either contribute energy or modify load within very fast timescales. These variable and distributed resources are asynchronously connected to the grid, that is, they are not currently involved in maintaining system inertia through the use of a rotating generator; they are either completely or partially interfaced with the grid through power electronics devices (inverters). The power electronics aspects of these generating resources present new opportunities in terms of grid control and response to abnormal grid conditions. For instance, inverters and other power electronics devices are expected to provide system stability (e.g., frequency regulation) as synchronous resources are replaced by asynchronous resources. Significant effort, however, is required to ensure these resources can provide grid services under both static and dynamic conditions and can operate in a manner that supports grid reliability, that is, inverters function to ensure the correct operation of power system parameters under all conditions.17
Efforts to ensure the appropriate operation of inverter-based resources are ongoing. For example, as a result of large outages that occurred due to disturbances (fires) that momentarily disconnected power from large PV resources in the West, NERC formed the Inverter-Based Resource Performance Task Force (IRPTF) to develop recommended performance specifications for bulk power system-connected, inverter-based resources during steady-state and dynamic system conditions.18 Although numerous utilities participate in the IRPTF, considerable work is needed to develop control schemes at the distribution system level for DERs. These control schemes should ensure that DERs are dispatchable, that is, perform when needed, within the coordination guidelines set up by all participants, and support grid reliability.
In addition to establishing control schemes that can effectively integrate inverter-based resources into grid operations, grid designers will need to consider the structure of control systems and the coordination required among the various elements (as discussed above). As the number of grid-edge devices and new participants that might own them continues to grow, the ability to scale proportionally, while maintaining effective grid operations, is becoming increasingly important. Scalability considerations include providing a capability to accommodate an increasing number of DERs in a way that recognizes both local (or selfish) interests and system-wide operational requirements—even over short timespans—and effectively balances the optimization objectives of both.
lll Note that certain devices also are used to protect power system equipment from rapid events such as equipment faults and lightning strikes. For example, protective relays can sense faults and initiate a trip, or disconnect, to undertake 32–128 samples per cycle and digital fault recorders that provide an historical account of an event can undertake 32–384 samples per cycle.
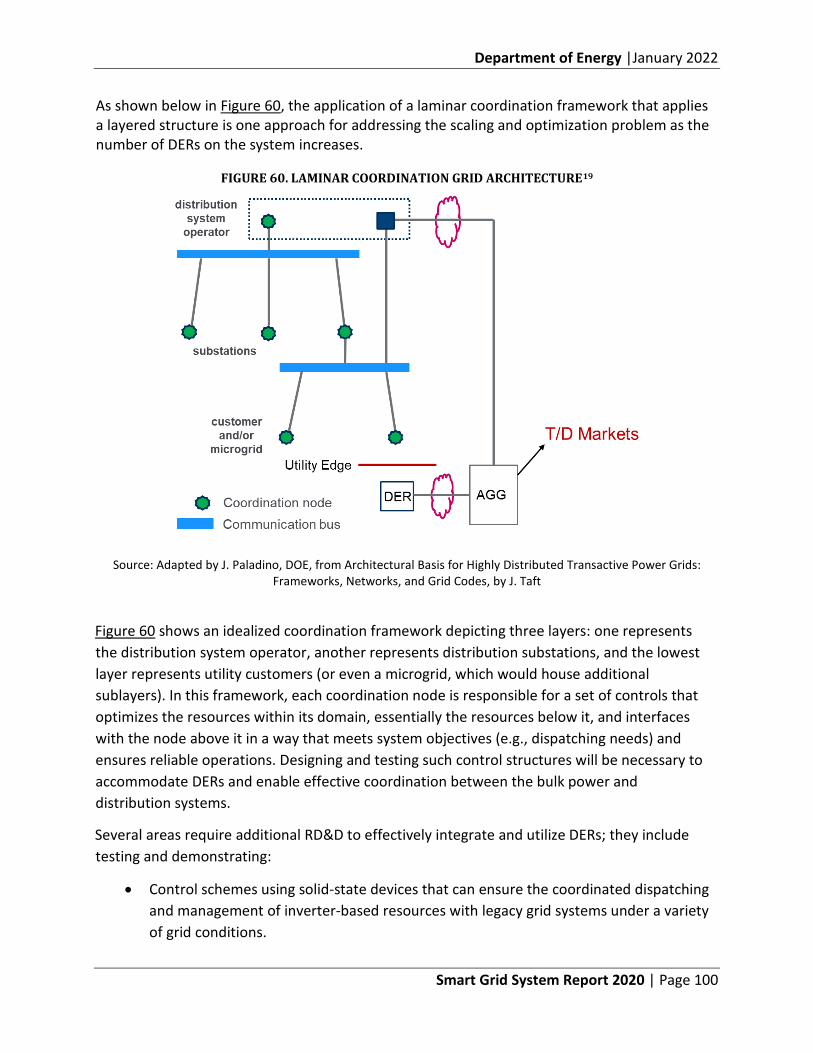
Department of Energy |January 2022
Smart Grid System Report 2020 | Page 100
As shown below in Figure 60, the application of a laminar coordination framework that applies a layered structure is one approach for addressing the scaling and optimization problem as the number of DERs on the system increases.
FIGURE 60. LAMINAR COORDINATION GRID ARCHITECTURE19
Source: Adapted by J. Paladino, DOE, from Architectural Basis for Highly Distributed Transactive Power Grids: Frameworks, Networks, and Grid Codes, by J. Taft
Figure 60 shows an idealized coordination framework depicting three layers: one represents the distribution system operator, another represents distribution substations, and the lowest layer represents utility customers (or even a microgrid, which would house additional sublayers). In this framework, each coordination node is responsible for a set of controls that optimizes the resources within its domain, essentially the resources below it, and interfaces with the node above it in a way that meets system objectives (e.g., dispatching needs) and ensures reliable operations. Designing and testing such control structures will be necessary to accommodate DERs and enable effective coordination between the bulk power and distribution systems.
Several areas require additional RD&D to effectively integrate and utilize DERs; they include testing and demonstrating:
• Control schemes using solid-state devices that can ensure the coordinated dispatching and management of inverter-based resources with legacy grid systems under a variety of grid conditions.
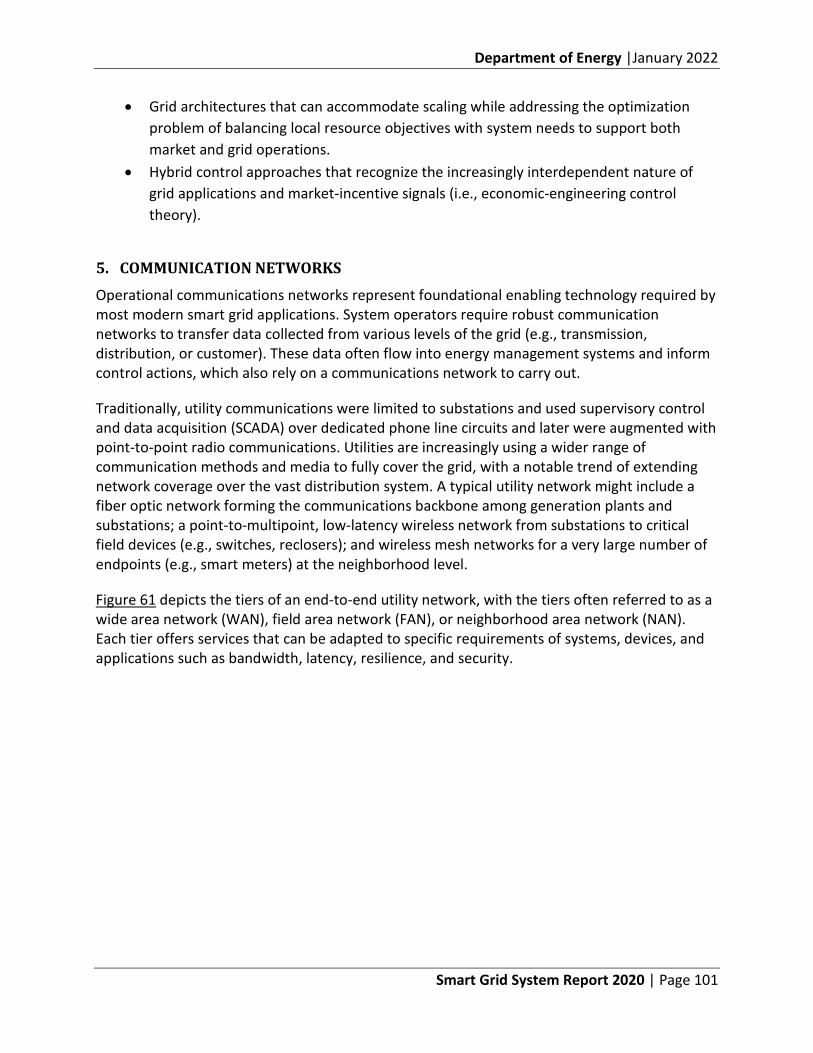
Department of Energy |January 2022
Smart Grid System Report 2020 | Page 101
• Grid architectures that can accommodate scaling while addressing the optimization problem of balancing local resource objectives with system needs to support both market and grid operations.
• Hybrid control approaches that recognize the increasingly interdependent nature of grid applications and market-incentive signals (i.e., economic-engineering control theory).
5. COMMUNICATION NETWORKS
Operational communications networks represent foundational enabling technology required by most modern smart grid applications. System operators require robust communication networks to transfer data collected from various levels of the grid (e.g., transmission, distribution, or customer). These data often flow into energy management systems and inform control actions, which also rely on a communications network to carry out.
Traditionally, utility communications were limited to substations and used supervisory control and data acquisition (SCADA) over dedicated phone line circuits and later were augmented with point-to-point radio communications. Utilities are increasingly using a wider range of communication methods and media to fully cover the grid, with a notable trend of extending network coverage over the vast distribution system. A typical utility network might include a fiber optic network forming the communications backbone among generation plants and substations; a point-to-multipoint, low-latency wireless network from substations to critical field devices (e.g., switches, reclosers); and wireless mesh networks for a very large number of endpoints (e.g., smart meters) at the neighborhood level.
Figure 61 depicts the tiers of an end-to-end utility network, with the tiers often referred to as a wide area network (WAN), field area network (FAN), or neighborhood area network (NAN). Each tier offers services that can be adapted to specific requirements of systems, devices, and applications such as bandwidth, latency, resilience, and security.
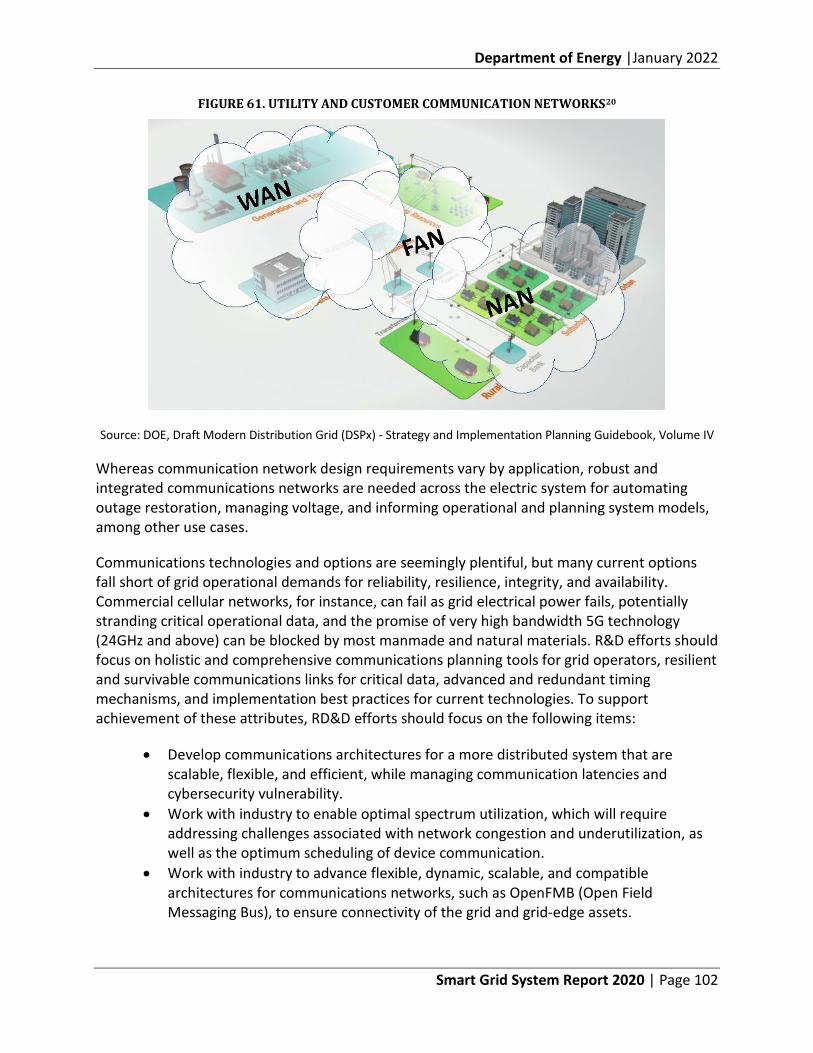
Department of Energy |January 2022
Smart Grid System Report 2020 | Page 102
FIGURE 61. UTILITY AND CUSTOMER COMMUNICATION NETWORKS20
Source: DOE, Draft Modern Distribution Grid (DSPx) - Strategy and Implementation Planning Guidebook, Volume IV
Whereas communication network design requirements vary by application, robust and integrated communications networks are needed across the electric system for automating outage restoration, managing voltage, and informing operational and planning system models, among other use cases.
Communications technologies and options are seemingly plentiful, but many current options fall short of grid operational demands for reliability, resilience, integrity, and availability. Commercial cellular networks, for instance, can fail as grid electrical power fails, potentially stranding critical operational data, and the promise of very high bandwidth 5G technology (24GHz and above) can be blocked by most manmade and natural materials. R&D efforts should focus on holistic and comprehensive communications planning tools for grid operators, resilient and survivable communications links for critical data, advanced and redundant timing mechanisms, and implementation best practices for current technologies. To support achievement of these attributes, RD&D efforts should focus on the following items:
• Develop communications architectures for a more distributed system that are scalable, flexible, and efficient, while managing communication latencies and cybersecurity vulnerability.
• Work with industry to enable optimal spectrum utilization, which will require addressing challenges associated with network congestion and underutilization, as well as the optimum scheduling of device communication.
• Work with industry to advance flexible, dynamic, scalable, and compatible architectures for communications networks, such as OpenFMB (Open Field Messaging Bus), to ensure connectivity of the grid and grid-edge assets.
Department of Energy |January 2022
Smart Grid System Report 2020 | Page 103
• Seek to enhance a distributed communications architecture to address emerging challenges from the Industrial IoT and 5G wireless.
• Develop a strict, clear framework for cybersecurity and privacy implications and rules for the broad variety of data and data uses to help structure communication architecture development.
• Quantify network uncertainties and security risks in the context of the modern electric power system and develop self-healing and more robust network capabilities to oppose malicious operations.
6. ENERGY STORAGE
Electricity is unique among commodities in that its delivery was developed without a storage component. Every other resource commodity has the ability to store excess quantities built into its delivery system, for example, in the form of granaries, warehouses, and reservoirs. This embedded storage capacity creates a buffer for mismatches between supply and demand, stabilizing prices and protecting customers.
The lack of embedded storage capacity on the electric grid has ramifications for its design, operations, and costs. Without a buffer, electric grid operators must maintain a constant balance in generation (supply) and customer load (demand). To account for unpredictability in loads, generation, weather, and mechanical outages, operators must maintain significant amounts of reserve generation that can quickly respond to changing grid conditions and preserve the balance. It also means that grid components must be sized and built on the basis of peak demand, resulting in a grid that is larger (and more expensive) than what average load would require. When contrasted with the natural gas system, which has ubiquitous storage built into its delivery system, the benefits of embedded storage capacity on the electric grid become evident.
Demonstrated improvements in the performance and cost of energy storage technology have fostered greater adoption. In January 2020, DOE announced the Energy Storage Grand Challenge (ESGC), a comprehensive program to accelerate the development, commercialization, and utilization of next-generation energy storage technologies and to sustain U.S. global leadership in energy storage. DOE released a draft ESGC roadmap in July 2020 and requested stakeholder input.21 The ESGC has focused efforts in five key areas:
• Technology Development – to undertake energy storage R&D
• Manufacturing and Supply Chain – to develop strategies to strengthen U.S. leadership in innovation and manufacturing
• Technology Transition – to ensure that energy storage R&D transitions to markets through field validation, demonstration projects, public-private partnerships, business model development, and dissemination of high-quality market data
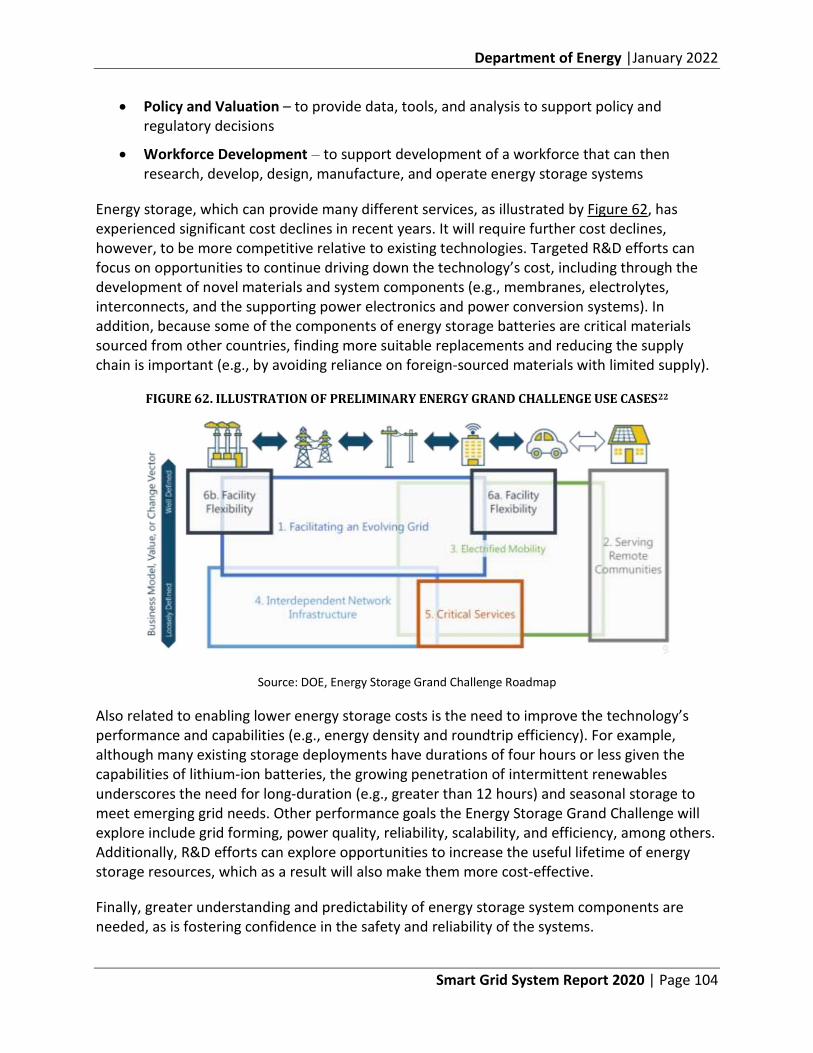
Department of Energy |January 2022
Smart Grid System Report 2020 | Page 104
• Policy and Valuation – to provide data, tools, and analysis to support policy and regulatory decisions
• Workforce Development – to support development of a workforce that can then research, develop, design, manufacture, and operate energy storage systems
Energy storage, which can provide many different services, as illustrated by Figure 62, has experienced significant cost declines in recent years. It will require further cost declines, however, to be more competitive relative to existing technologies. Targeted R&D efforts can focus on opportunities to continue driving down the technology’s cost, including through the development of novel materials and system components (e.g., membranes, electrolytes, interconnects, and the supporting power electronics and power conversion systems). In addition, because some of the components of energy storage batteries are critical materials sourced from other countries, finding more suitable replacements and reducing the supply chain is important (e.g., by avoiding reliance on foreign-sourced materials with limited supply).
FIGURE 62. ILLUSTRATION OF PRELIMINARY ENERGY GRAND CHALLENGE USE CASES22
Source: DOE, Energy Storage Grand Challenge Roadmap
Also related to enabling lower energy storage costs is the need to improve the technology’s performance and capabilities (e.g., energy density and roundtrip efficiency). For example, although many existing storage deployments have durations of four hours or less given the capabilities of lithium-ion batteries, the growing penetration of intermittent renewables underscores the need for long-duration (e.g., greater than 12 hours) and seasonal storage to meet emerging grid needs. Other performance goals the Energy Storage Grand Challenge will explore include grid forming, power quality, reliability, scalability, and efficiency, among others. Additionally, R&D efforts can explore opportunities to increase the useful lifetime of energy storage resources, which as a result will also make them more cost-effective.
Finally, greater understanding and predictability of energy storage system components are needed, as is fostering confidence in the safety and reliability of the systems.

Department of Energy |January 2022
Smart Grid System Report 2020 | Page 105
Given minimal levels of operational experience with energy storage to date, fire department officials, building managers, and other approval authorities need to better understand how to deploy this technology safely and reliably. Through additional R&D efforts—including the development of standards (e.g., IEEE, National Fire Protection Association, International Electrotechnical Commission (IEC), Underwriters Lab (UL))—stakeholders can be more confident that energy storage is deployed according to safety best practices and performance test standards while also being able to meet reliability metrics.
The ability to ubiquitously apply energy storage within the grid will profoundly change the way we deliver and manage electricity. Thoughtfully positioned energy storage systems can address system challenges such as providing grid flexibility needed to manage increasing levels of variability in generation and load, back-up power to maintain reliability and resilience, and storage capacity needed to fuel electric vehicle fleets. Understanding how to apply energy storage technology will require careful planning supported by more sophisticated modeling tools. Deploying energy storage technology will involve the use of advanced smart grid capabilities needed to observe and control the state of the grid and its assets within a highly dynamic environment.
Department of Energy |January 2022
Smart Grid System Report 2020 | Page 106
E. Interoperability
Interoperability is the ability to safely, securely, and effectively exchange and use information among two or more devices and systems. This means the myriad devices and systems deployed on the grid need to function in coordination under, potentially, a wide variety of operational situations. In theory, true interoperability would enable the plug-and-play of any device or system on the grid, that is, the devices and systems would work perfectly when first used or connected without significant reconfiguration or adjustment by the user (e.g., customer, utility, or other grid participant). Achieving plug-and-play interoperability for the electric grid, however, will be a challenging and long-term task. Although significant effort has been underway for many years to develop and institute standards so emerging devices and systems can function within the grid operational environment, much additional work is required to address structural constraints (e.g., managing bidirectional flow of electricity) to allow devices and systems to readily interoperate in a plug-and-play manner.
As with much of the grid, we have inherited legacy infrastructure from prior decades. Utilities have built their systems incrementally and have depended largely on customized solutions from vendors to enhance their capabilities to meet changing requirements. This incremental approach has resulted in collections of systems within a given utility that were not originally designed to interoperate; thus, these systems primarily reside within silos that contain dedicated equipment. Also, these systems often depend on vendor-specific protocols for communicating and exchanging data. Examples include voltage management systems, outage management systems, geographic information systems, and customer data management systems. More recently, the realization of operational and asset management efficiencies resulting from the sharing of information across these systems, for both planning and operational purposes, has led to considerable and costly efforts by utilities to integrate them. Furthermore, the proliferation of DERs has necessitated greater degrees of operational coordination requiring integrated devices and systems.
Figure 63 provides a conceptual view of the various levels of interoperability. The horizontal bars represent levels of interoperability maturity ranging from noninteroperable systems requiring effort- and cost-intensive point-to-point solutions to true plug-and-play operations that allow direct communication between systems and can be integrated with minimal effort. Customized point-to-point solutions permit a small set of devices to cooperate but become untenable as the sole approach to enable interoperability as the number of devices requiring integration across a wide range of functions increases.
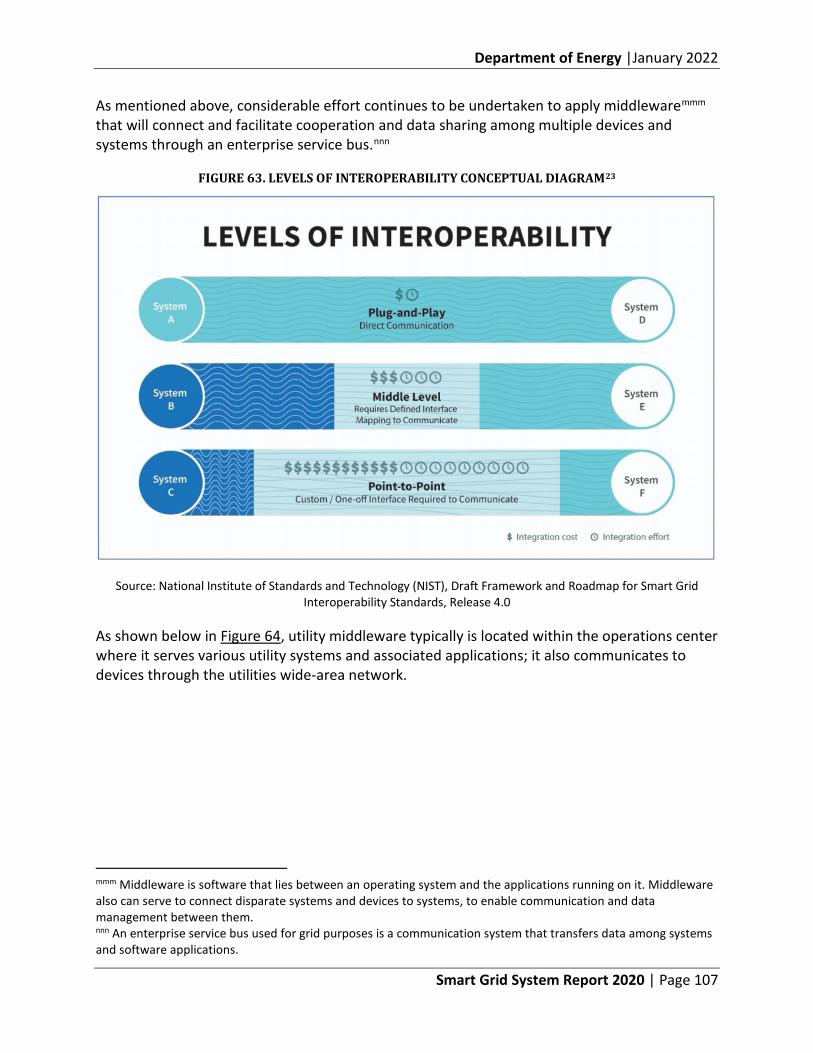
Department of Energy |January 2022
Smart Grid System Report 2020 | Page 107
As mentioned above, considerable effort continues to be undertaken to apply middlewaremmm that will connect and facilitate cooperation and data sharing among multiple devices and systems through an enterprise service bus.nnn
FIGURE 63. LEVELS OF INTEROPERABILITY CONCEPTUAL DIAGRAM23
Source: National Institute of Standards and Technology (NIST), Draft Framework and Roadmap for Smart Grid Interoperability Standards, Release 4.0
As shown below in Figure 64, utility middleware typically is located within the operations center where it serves various utility systems and associated applications; it also communicates to devices through the utilities wide-area network.
mmm Middleware is software that lies between an operating system and the applications running on it. Middleware also can serve to connect disparate systems and devices to systems, to enable communication and data management between them. nnn An enterprise service bus used for grid purposes is a communication system that transfers data among systems and software applications.
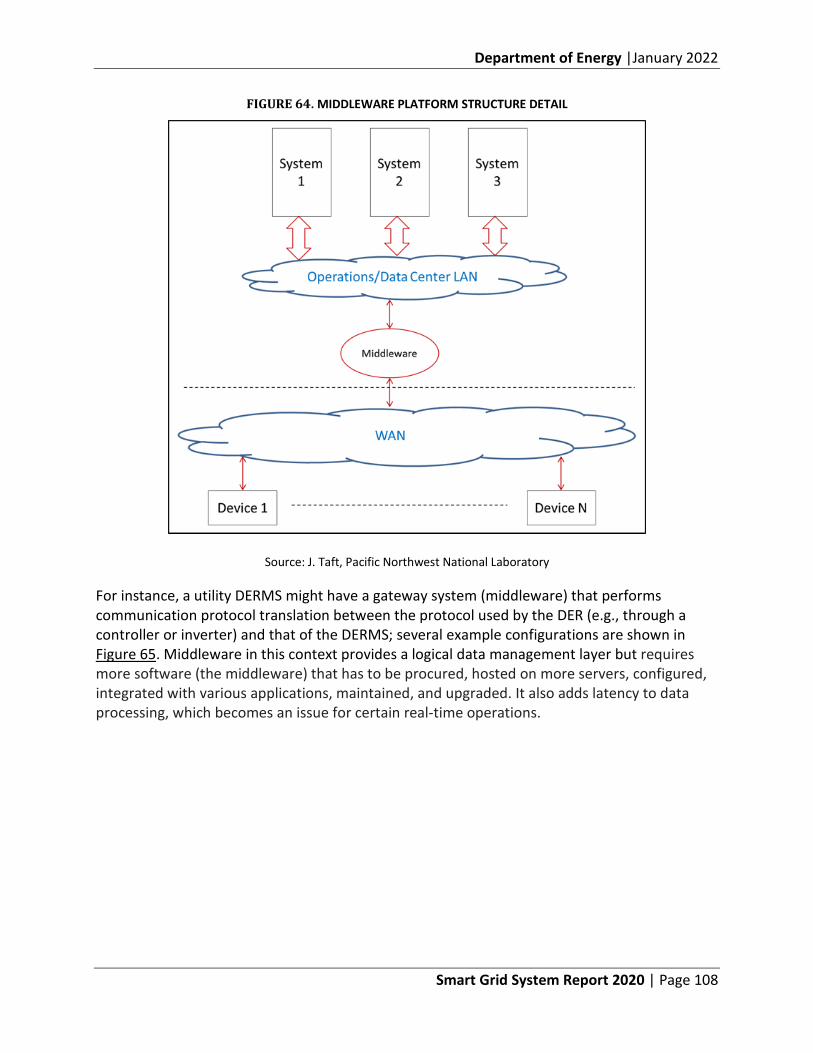
Department of Energy |January 2022
Smart Grid System Report 2020 | Page 108
FIGURE 64. MIDDLEWARE PLATFORM STRUCTURE DETAIL
Source: J. Taft, Pacific Northwest National Laboratory
For instance, a utility DERMS might have a gateway system (middleware) that performs communication protocol translation between the protocol used by the DER (e.g., through a controller or inverter) and that of the DERMS; several example configurations are shown in Figure 65. Middleware in this context provides a logical data management layer but requires more software (the middleware) that has to be procured, hosted on more servers, configured, integrated with various applications, maintained, and upgraded. It also adds latency to data processing, which becomes an issue for certain real-time operations.
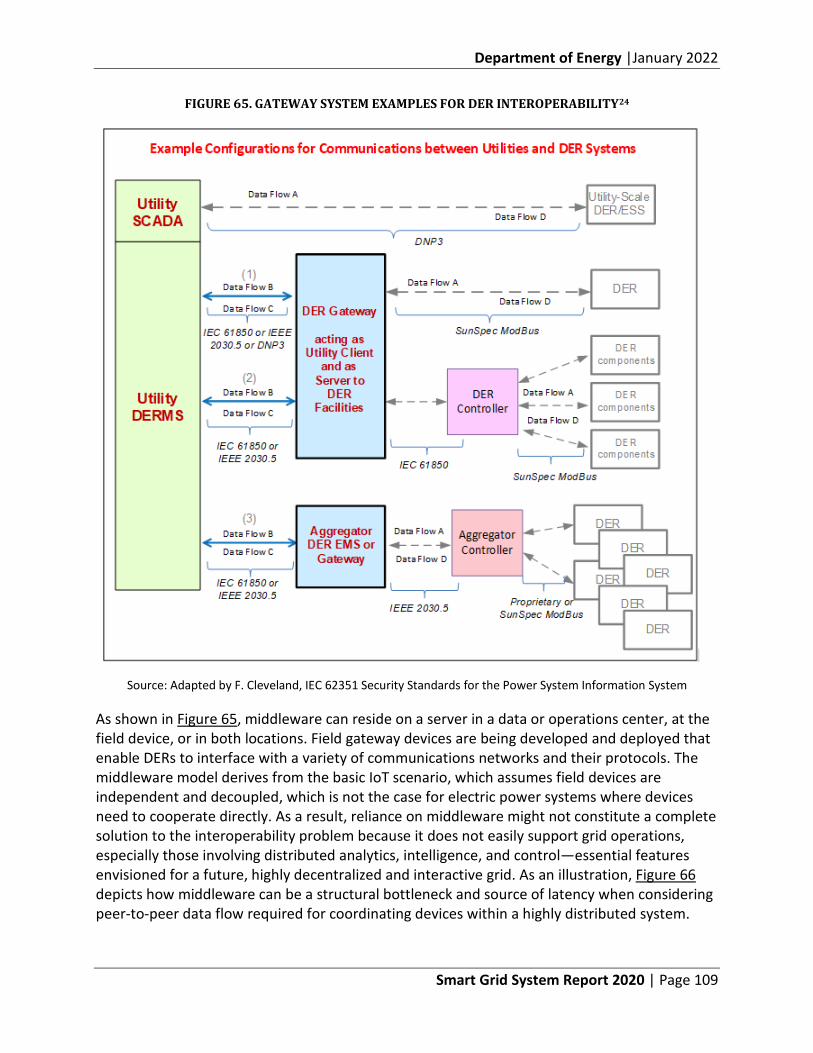
Department of Energy |January 2022
Smart Grid System Report 2020 | Page 109
FIGURE 65. GATEWAY SYSTEM EXAMPLES FOR DER INTEROPERABILITY24
Source: Adapted by F. Cleveland, IEC 62351 Security Standards for the Power System Information System
As shown in Figure 65, middleware can reside on a server in a data or operations center, at the field device, or in both locations. Field gateway devices are being developed and deployed that enable DERs to interface with a variety of communications networks and their protocols. The middleware model derives from the basic IoT scenario, which assumes field devices are independent and decoupled, which is not the case for electric power systems where devices need to cooperate directly. As a result, reliance on middleware might not constitute a complete solution to the interoperability problem because it does not easily support grid operations, especially those involving distributed analytics, intelligence, and control—essential features envisioned for a future, highly decentralized and interactive grid. As an illustration, Figure 66 depicts how middleware can be a structural bottleneck and source of latency when considering peer-to-peer data flow required for coordinating devices within a highly distributed system.
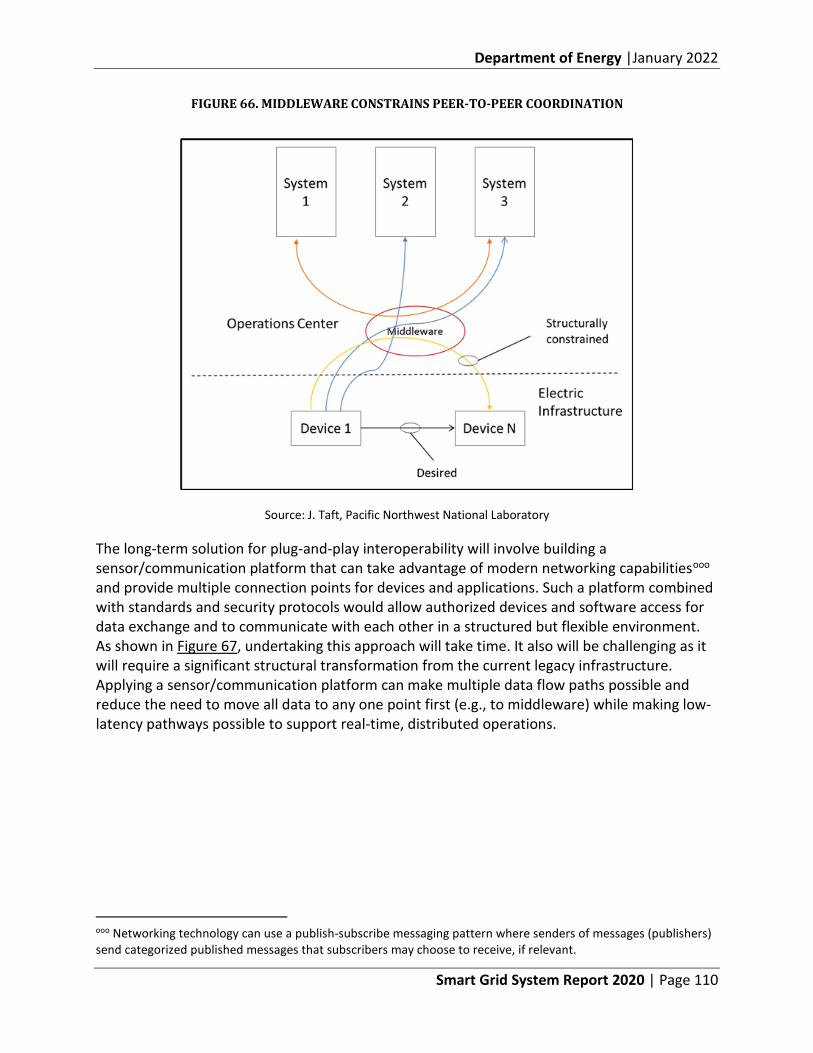
Department of Energy |January 2022
Smart Grid System Report 2020 | Page 110
FIGURE 66. MIDDLEWARE CONSTRAINS PEER-TO-PEER COORDINATION
Source: J. Taft, Pacific Northwest National Laboratory
The long-term solution for plug-and-play interoperability will involve building a sensor/communication platform that can take advantage of modern networking capabilitiesooo and provide multiple connection points for devices and applications. Such a platform combined with standards and security protocols would allow authorized devices and software access for data exchange and to communicate with each other in a structured but flexible environment. As shown in Figure 67, undertaking this approach will take time. It also will be challenging as it will require a significant structural transformation from the current legacy infrastructure. Applying a sensor/communication platform can make multiple data flow paths possible and reduce the need to move all data to any one point first (e.g., to middleware) while making low-latency pathways possible to support real-time, distributed operations.
ooo Networking technology can use a publish-subscribe messaging pattern where senders of messages (publishers) send categorized published messages that subscribers may choose to receive, if relevant.
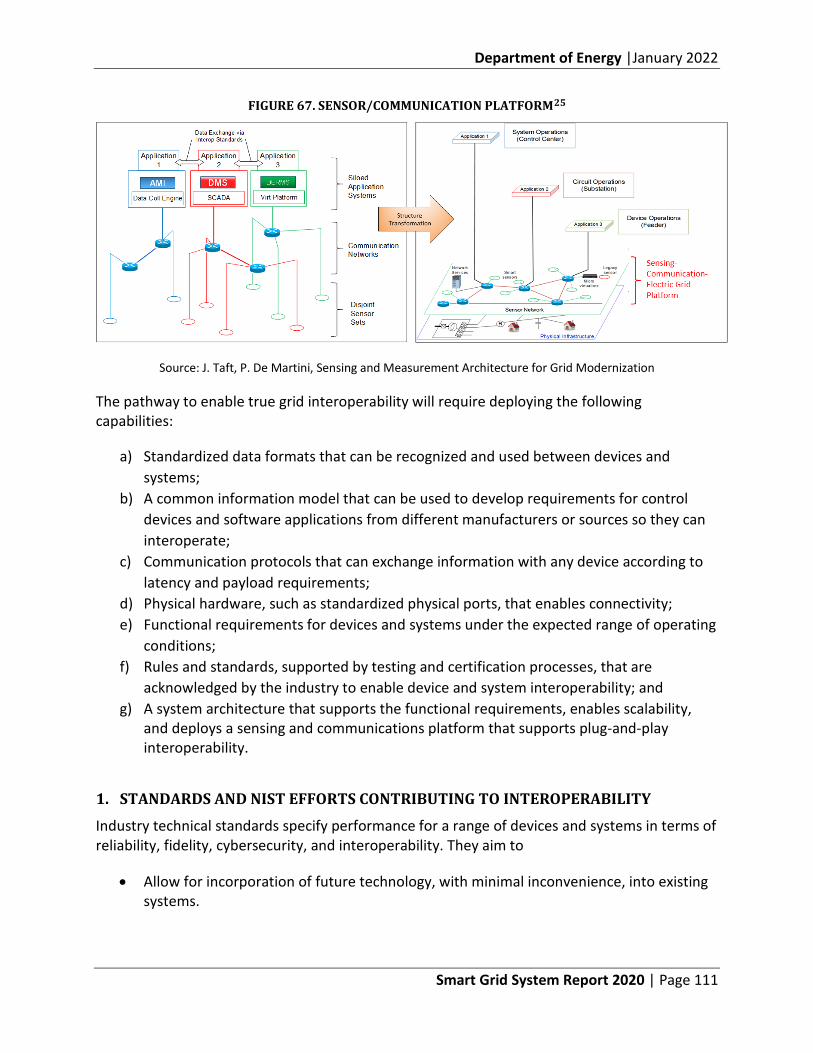
Department of Energy |January 2022
Smart Grid System Report 2020 | Page 111
FIGURE 67. SENSOR/COMMUNICATION PLATFORM25
Source: J. Taft, P. De Martini, Sensing and Measurement Architecture for Grid Modernization
The pathway to enable true grid interoperability will require deploying the following capabilities:
a) Standardized data formats that can be recognized and used between devices and systems;
b) A common information model that can be used to develop requirements for control devices and software applications from different manufacturers or sources so they can interoperate;
c) Communication protocols that can exchange information with any device according to latency and payload requirements;
d) Physical hardware, such as standardized physical ports, that enables connectivity; e) Functional requirements for devices and systems under the expected range of operating
conditions; f) Rules and standards, supported by testing and certification processes, that are
acknowledged by the industry to enable device and system interoperability; and g) A system architecture that supports the functional requirements, enables scalability,
and deploys a sensing and communications platform that supports plug-and-play interoperability.
1. STANDARDS AND NIST EFFORTS CONTRIBUTING TO INTEROPERABILITY
Industry technical standards specify performance for a range of devices and systems in terms of reliability, fidelity, cybersecurity, and interoperability. They aim to
• Allow for incorporation of future technology, with minimal inconvenience, into existing systems.
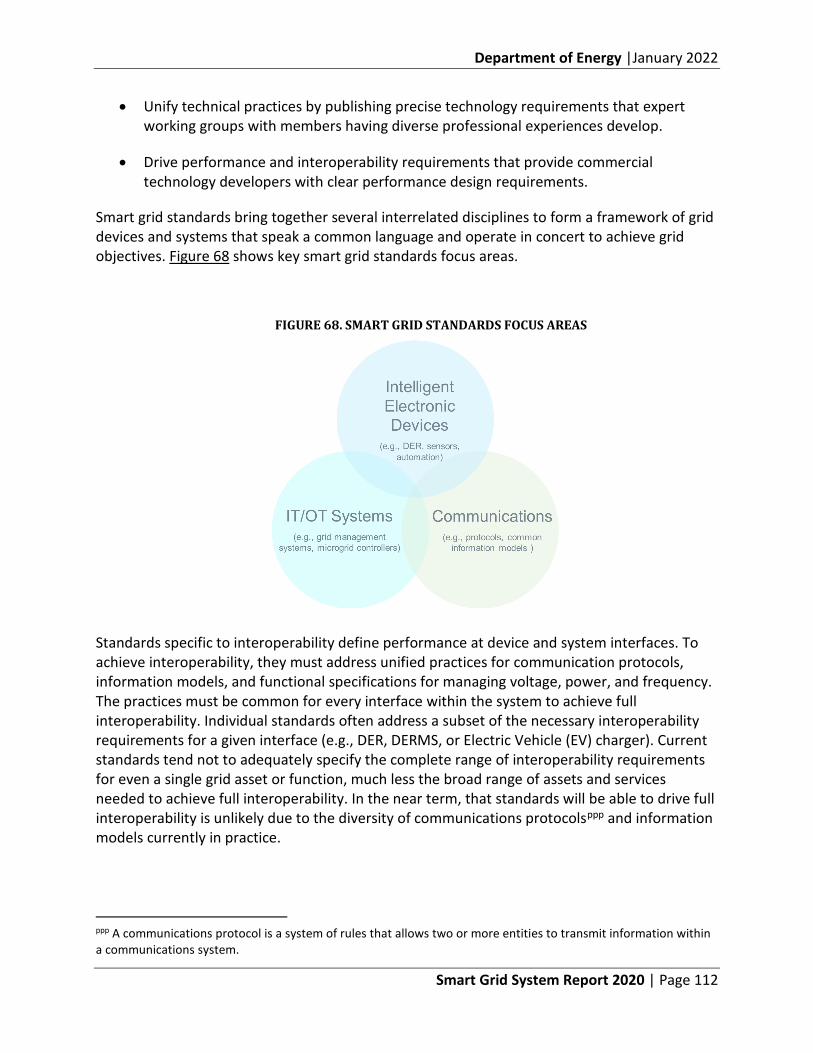
Department of Energy |January 2022
Smart Grid System Report 2020 | Page 112
• Unify technical practices by publishing precise technology requirements that expert working groups with members having diverse professional experiences develop.
• Drive performance and interoperability requirements that provide commercial technology developers with clear performance design requirements.
Smart grid standards bring together several interrelated disciplines to form a framework of grid devices and systems that speak a common language and operate in concert to achieve grid objectives. Figure 68 shows key smart grid standards focus areas.
FIGURE 68. SMART GRID STANDARDS FOCUS AREAS
Standards specific to interoperability define performance at device and system interfaces. To achieve interoperability, they must address unified practices for communication protocols, information models, and functional specifications for managing voltage, power, and frequency. The practices must be common for every interface within the system to achieve full interoperability. Individual standards often address a subset of the necessary interoperability requirements for a given interface (e.g., DER, DERMS, or Electric Vehicle (EV) charger). Current standards tend not to adequately specify the complete range of interoperability requirements for even a single grid asset or function, much less the broad range of assets and services needed to achieve full interoperability. In the near term, that standards will be able to drive full interoperability is unlikely due to the diversity of communications protocolsppp and information models currently in practice.
ppp A communications protocol is a system of rules that allows two or more entities to transmit information within a communications system.
Department of Energy |January 2022
Smart Grid System Report 2020 | Page 113
Even for a particular grid device or system, industry standards often offer multiple routes for compliance (e.g., several communication protocols) to satisfy a diverse group of stakeholders contributing to standards development processes.qqq Standards are beneficially narrowing the interface options (physical and data) and moving in the direction of interoperability, but they fall short of facilitating seamless integration (e.g., plug-and-play). For example, IEEE 1547-2018 requires application of a unified information model;rrr it allows for the use of three different DER communication protocols, but gateway devices might be needed to perform protocol translation.
A secondary issue with standards providing interoperability is that compliance by vendors and utilities is optional unless required by legislation or regulation, which is only found in a few cases.sss Optionality for implementing and following standards means that market forces will continue to play an influential role in consolidating interoperability approaches. A wide range of stakeholdersttt can persist in advancing interoperability by collaborating on best-practices and by striving to standardize on a single approach for a given application.
Section 1305 of EISA directs the NIST “to coordinate the development of a framework that includes protocols and model standards for information management to achieve interoperability of smart grid devices and systems.”26 NIST has produced several iterations of its Framework and Roadmap for Smart Grid Interoperability Standards and has recently issued a draft fourth version.27 The current draft describes communications scenarios for various grid architectures used to guide specific communication and interoperability requirements. The goal is to explore relationships and associated interoperability needs that expanded communications to many diverse endpoints will have on four key grid themes: cybersecurity, operations, economics, and testing and certification requirements. The draft framework (Version 4.0) reflects a range of ongoing grid changes, including rapid technological advancements, falling prices of smart grid technologies, increased proliferation of sensors and network-enabled devices, and the resulting massive amounts of granular data.
To supplement standards development and their revised draft framework and roadmap, NIST is also developing interoperability profiles to provide a more holistic view of how devices and systems need to interoperate. The basic set of elements for an interoperability profile include the asset description and associated physical performance specifications, communication protocol, and information model. Different devices have unique capabilities that need to be accurately captured by a profile to enable integration into the grid operations environment. For example, EVs differ from stationary DER storage devices in several important dimensions, and an EV interoperability profile would need to account for aspects such as locational
qqq Standards development organizations operate open working group and balloting processes that require a high degree of consensus (e.g., 75% approval in balloting) to approve and publish standards. rrr IEEE 1547-2018 requires a unified information model. In practice, this is implemented in protocols using the IEC 61850-7-420 common information model. sss For instance, the California Public Utilities Commission determined that IEEE 2030.5 communications protocol is the standard for DER in California with an implementation date of June 22, 2020. ttt Parties interested in interoperability include national labs, academia, NGOs, utilities, vendors, third-party DER operators, and customers.
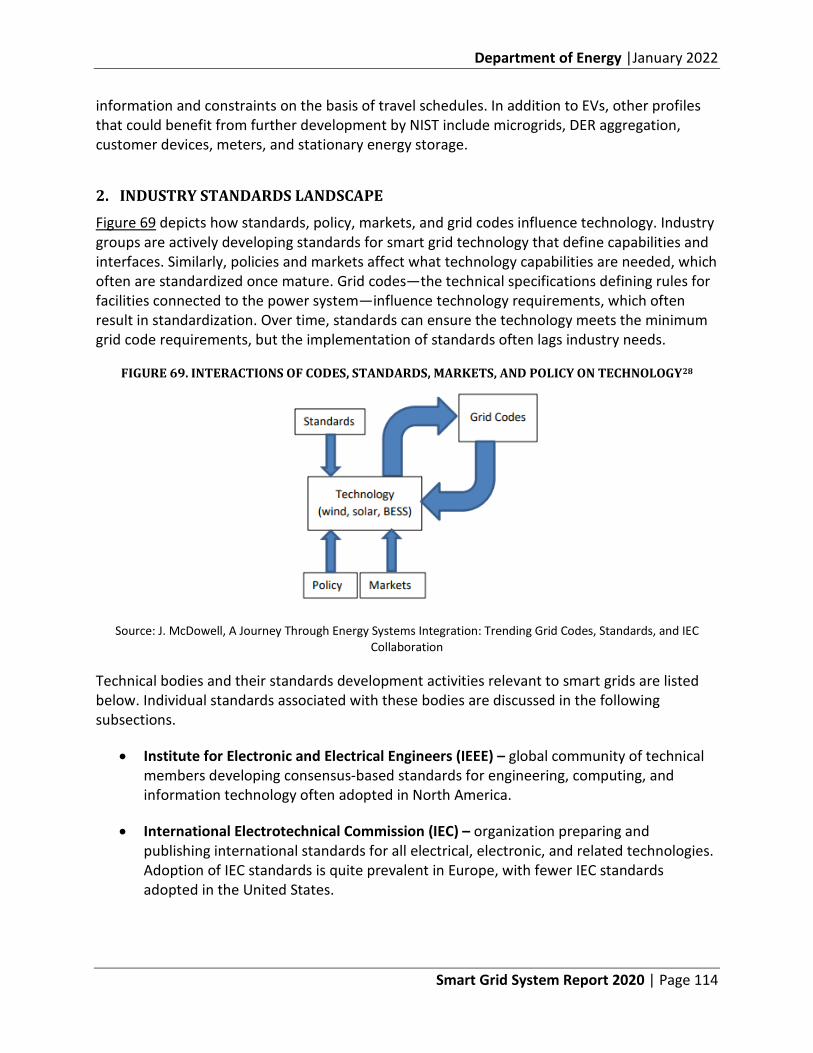
Department of Energy |January 2022
Smart Grid System Report 2020 | Page 114
information and constraints on the basis of travel schedules. In addition to EVs, other profiles that could benefit from further development by NIST include microgrids, DER aggregation, customer devices, meters, and stationary energy storage.
2. INDUSTRY STANDARDS LANDSCAPE
Figure 69 depicts how standards, policy, markets, and grid codes influence technology. Industry groups are actively developing standards for smart grid technology that define capabilities and interfaces. Similarly, policies and markets affect what technology capabilities are needed, which often are standardized once mature. Grid codes—the technical specifications defining rules for facilities connected to the power system—influence technology requirements, which often result in standardization. Over time, standards can ensure the technology meets the minimum grid code requirements, but the implementation of standards often lags industry needs.
FIGURE 69. INTERACTIONS OF CODES, STANDARDS, MARKETS, AND POLICY ON TECHNOLOGY28
Source: J. McDowell, A Journey Through Energy Systems Integration: Trending Grid Codes, Standards, and IEC Collaboration
Technical bodies and their standards development activities relevant to smart grids are listed below. Individual standards associated with these bodies are discussed in the following subsections.
• Institute for Electronic and Electrical Engineers (IEEE) – global community of technical members developing consensus-based standards for engineering, computing, and information technology often adopted in North America.
• International Electrotechnical Commission (IEC) – organization preparing and publishing international standards for all electrical, electronic, and related technologies. Adoption of IEC standards is quite prevalent in Europe, with fewer IEC standards adopted in the United States.
Department of Energy |January 2022
Smart Grid System Report 2020 | Page 115
• National Institute of Standards and Technology (NIST) – one of the nation’s oldest science laboratories, now part of the U.S. Department of Commerce. Smart grid technology is one of NIST’s focus areas for supporting standards development.
• International Council on Large Electric Systems (CIGRE) – global technical body focusing on sharing power systems expertise. CIGRE publishes reference papers and technical bulletins rather than standards documents that can serve as guideposts for areas of further R&D and standardization. A selection of working groups formed in 2019 and 2020 is included in Appendix VII.C.2.
• North American Electric Reliability Corporation (NERC) – a nonprofit organization that develops reliability standards and requirements for operating the bulk power system in the United States and Canada. NERC is developing a cybersecurity standard for the secure design and operation of modern third-party data storage and analysis systems (e.g., cloud services), which are growing in popularity as a means to organize and store significant amounts of new data from smart grid devices.29 Cybersecurity standards are described in greater detail in Appendix VII.C.3.
3. IEEE SMART GRID INTEROPERABILITY STANDARDS
IEEE 2030, published in 2011, is a standard that provides alternative smart grid interoperability approaches and best practices through the smart grid interoperability reference model (SGIRM) it established.30 IEEE began a process for revising the standard in May 2020 to cover DER technology and system architecture more fully. Aimed at addressing the growing impact of DERs on central power generation dispatch and transmission operations, IEEE P2030.11 will standardize functional specifications for DERMS, an important step for aggregating and managing DER.uuu The DERMS standard, expected to enter the balloting phase in late 2020 or early 2021, will facilitate grid services from DERs and microgrids. Although these standards help facilitate interoperability, their completion will not lead to full interoperability because they do not define all the features required (e.g., communication protocols, information models). Table 11 summarizes active and draft standards in the IEEE 2030 series.vvv
uuu IEEE P2030.11 DERMS functions include discovery and visualization and monitoring of real and reactive power flows and voltage at specific nodes; DER production estimation and scheduling, and dispatch of real and reactive power; and DER ancillary services provision, including voltage and frequency control/support. vvv IEEE draft standards are denoted by “P” in front of the standard number (e.g., IEEE P2030.11).
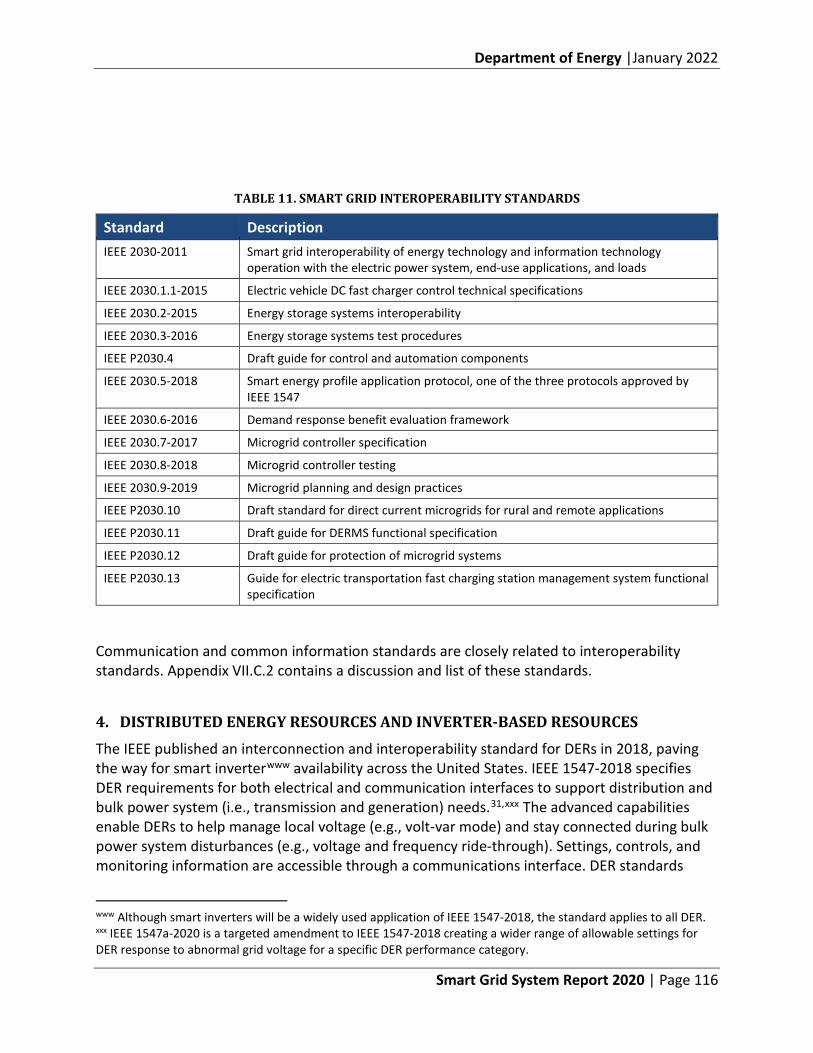
Department of Energy |January 2022
Smart Grid System Report 2020 | Page 116
TABLE 11. SMART GRID INTEROPERABILITY STANDARDS
Standard Description IEEE 2030-2011 Smart grid interoperability of energy technology and information technology
operation with the electric power system, end-use applications, and loads
IEEE 2030.1.1-2015 Electric vehicle DC fast charger control technical specifications
IEEE 2030.2-2015 Energy storage systems interoperability
IEEE 2030.3-2016 Energy storage systems test procedures
IEEE P2030.4 Draft guide for control and automation components
IEEE 2030.5-2018 Smart energy profile application protocol, one of the three protocols approved by IEEE 1547
IEEE 2030.6-2016 Demand response benefit evaluation framework
IEEE 2030.7-2017 Microgrid controller specification
IEEE 2030.8-2018 Microgrid controller testing
IEEE 2030.9-2019 Microgrid planning and design practices
IEEE P2030.10 Draft standard for direct current microgrids for rural and remote applications
IEEE P2030.11 Draft guide for DERMS functional specification
IEEE P2030.12 Draft guide for protection of microgrid systems
IEEE P2030.13 Guide for electric transportation fast charging station management system functional specification
Communication and common information standards are closely related to interoperability standards. Appendix VII.C.2 contains a discussion and list of these standards.
4. DISTRIBUTED ENERGY RESOURCES AND INVERTER-BASED RESOURCES
The IEEE published an interconnection and interoperability standard for DERs in 2018, paving the way for smart inverterwww availability across the United States. IEEE 1547-2018 specifies DER requirements for both electrical and communication interfaces to support distribution and bulk power system (i.e., transmission and generation) needs.31,xxx The advanced capabilities enable DERs to help manage local voltage (e.g., volt-var mode) and stay connected during bulk power system disturbances (e.g., voltage and frequency ride-through). Settings, controls, and monitoring information are accessible through a communications interface. DER standards
www Although smart inverters will be a widely used application of IEEE 1547-2018, the standard applies to all DER. xxx IEEE 1547a-2020 is a targeted amendment to IEEE 1547-2018 creating a wider range of allowable settings for DER response to abnormal grid voltage for a specific DER performance category.
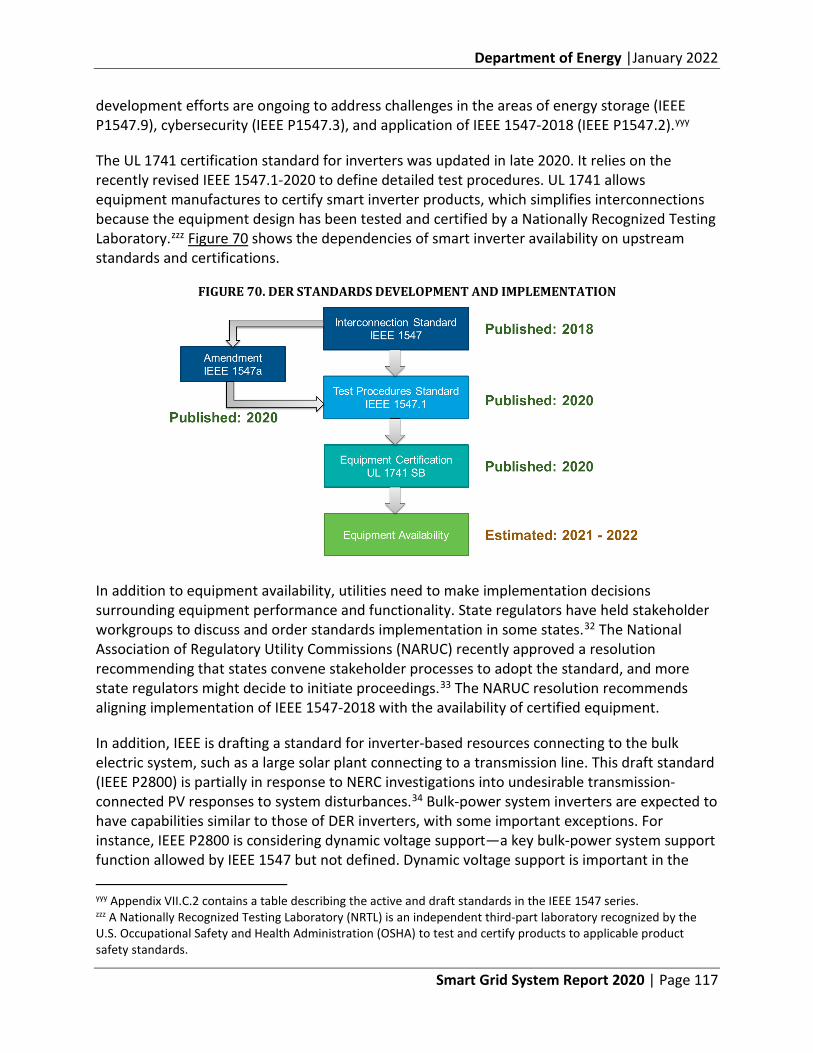
Department of Energy |January 2022
Smart Grid System Report 2020 | Page 117
development efforts are ongoing to address challenges in the areas of energy storage (IEEE P1547.9), cybersecurity (IEEE P1547.3), and application of IEEE 1547-2018 (IEEE P1547.2).yyy
The UL 1741 certification standard for inverters was updated in late 2020. It relies on the recently revised IEEE 1547.1-2020 to define detailed test procedures. UL 1741 allows equipment manufactures to certify smart inverter products, which simplifies interconnections because the equipment design has been tested and certified by a Nationally Recognized Testing Laboratory.zzz Figure 70 shows the dependencies of smart inverter availability on upstream standards and certifications.
FIGURE 70. DER STANDARDS DEVELOPMENT AND IMPLEMENTATION
In addition to equipment availability, utilities need to make implementation decisions surrounding equipment performance and functionality. State regulators have held stakeholder workgroups to discuss and order standards implementation in some states.32 The National Association of Regulatory Utility Commissions (NARUC) recently approved a resolution recommending that states convene stakeholder processes to adopt the standard, and more state regulators might decide to initiate proceedings.33 The NARUC resolution recommends aligning implementation of IEEE 1547-2018 with the availability of certified equipment.
In addition, IEEE is drafting a standard for inverter-based resources connecting to the bulk electric system, such as a large solar plant connecting to a transmission line. This draft standard (IEEE P2800) is partially in response to NERC investigations into undesirable transmission-connected PV responses to system disturbances.34 Bulk-power system inverters are expected to have capabilities similar to those of DER inverters, with some important exceptions. For instance, IEEE P2800 is considering dynamic voltage support—a key bulk-power system support function allowed by IEEE 1547 but not defined. Dynamic voltage support is important in the
yyy Appendix VII.C.2 contains a table describing the active and draft standards in the IEEE 1547 series. zzz A Nationally Recognized Testing Laboratory (NRTL) is an independent third-part laboratory recognized by the U.S. Occupational Safety and Health Administration (OSHA) to test and certify products to applicable product safety standards.
Department of Energy |January 2022
Smart Grid System Report 2020 | Page 118
future grid with a lower number of conventional generation sources (e.g., lower inertia, lower system strength).
5. GRID INTERACTIVE ELECTRIC VEHICLES AND SMART CITY STANDARDS
With the acceleration of transportation electrification, closer coordination is needed between SAE International (formerly the Society of Automotive Engineers) and IEEE to facilitate integration of electric vehicle and charger technology with the electric power system. Well-planned EV integration manages grid impacts and associated costs by coordinating EV charging and standardizing grid support capabilities within EV charging equipment. Similar to DER integration, grid support capabilities are needed for higher levels of EV penetration. Smart city standards mark another gap in the current standards landscape. Smart city standards might bring together networking, transportation, home and building, Internet of Things, microgrid, and other relevant standards into a cohesive framework that allows cities to meet certain operating objectives. IEEE 2013-2019 provides a start to smart city standards by laying out an architectural framework for the IoT.
F. Cybersecurity
The current landscape of the U.S. economy is tightly coupled with the electric grid. The grid’s growing reliance on networked systems and smart devices means that cybersecurity must be a central consideration when designing the evolving smart grid. The needs to secure a smart grid range from performing R&D to advancing industry standards and supporting implementation of best practices. As cyber threats to the grid continue to advance, so must the framework of R&D, standards, and practices to reduce the risks of cyber-enabled grid disruptions that impact U.S. economic health and safety.
1. GROWING THREATS TO GRID CYBER-PHYSICAL SECURITY
In August 2019, the Office of the Director of National Intelligence stated, “We face a perfect storm comprised of information technology (IT) vulnerabilities associated with the proliferation of software and network technologies; increasing reliance on foreign-owned, manufactured, or controlled hardware, software, and services; and adversaries’ increasingly persistent and sophisticated asymmetric cyberattacks.”35 Increasingly sophisticated and frequent cyberattacks represent a significant challenge for a modern grid that is increasing its digital connections and controls.
Intelligent devices across the system are increasingly network connected to manage the growing complexity of a modern grid. This connectivity brings new capabilities, efficiencies, and situational awareness, but also increases the attack surface for intruders. Coupling digital control capabilities with electromechanical devices (e.g., electrical switches) results in the ability to create physical grid disruptions through cyber means, not just physical attacks, which creates an integrated “cyber-physical” grid layer that must be secured in concert.
Department of Energy |January 2022
Smart Grid System Report 2020 | Page 119
In 2019, the Director of the National Counterintelligence and Security Center stated, “the energy sector remains a key target of nation-state cyber intrusions, supply chain attacks, economic espionage efforts and other threats.”36
The scale of the challenge is growing while reliable and resilient electric service is ever more essential to citizens and the U.S. economy. Although the U.S. electric energy sector has not yet experienced a known serious cyber-related disruption, a 2015 widespread blackout in Ukraine resulting from spear phishingaaaa cyberattacks demonstrates the potential physical consequences of a sophisticated, targeted attack by knowledgeable actors.37 This cyber intrusion affected three electric distribution companies and left over 225,000 customers without power.
U.S. electric utilities are constantly targeted. From April 5 to August 29, 2019, at least 17 U.S.-based electric utilities received spear phishing emails appearing to be from an industry licensing body with the intent to deliver malware.38 Reports of these incidents indicate that more than a dozen relatively small U.S. utilities, located near dams, locks, and other critical infrastructure, were targeted in this wave of cyberattacks.39 Smaller electric utilities often have less robust cyber infrastructure and could have vulnerabilities that pose an immense threat to the electric grid and the critical infrastructure served.
2. MANAGING CYBER RISKS TO SMART GRID INFRASTRUCTURE
As grid operators increasingly rely on the data from digital devices and third-party systems to make real-time operating decisions or deploy automated systems, cyber risks must be managed in the following areas:
• Industrial control systems (ICS) • Grid-edge devices and consumer IoTbbbb • Global positioning systems (GPS)cccc • Digital technology supply chain
Industrial Control System Risks
Smart grid devices and ICS are considered operational technology (OT)—digital devices and networks that control critical physical grid processes, including the generation, transmission, and delivery of electricity. While traditional information technology (IT) is typically used in utility business management systems (such as payroll, HR, and billing), OT systems are typically
aaaa Spear phishing is an email or electronic communications scam targeted toward a specific individual, organization, or business. Although often intended to steal data for malicious purposes, cybercriminals may also intend to install malware on a targeted user’s computer. bbbb IoT (Internet of Things) is defined by GAO as the concept of connecting and interacting through a broad network array of “smart” devices, such as building energy management systems, smart thermostats, or electric vehicle charging stations. Consumer DERs are included as IoT for the purposes of this report. cccc GAO defines GPS as “a global positioning, navigation, and timing system consisting of space, ground control, and user equipment segments that support the broadcasts of military and civil GPS signals.”
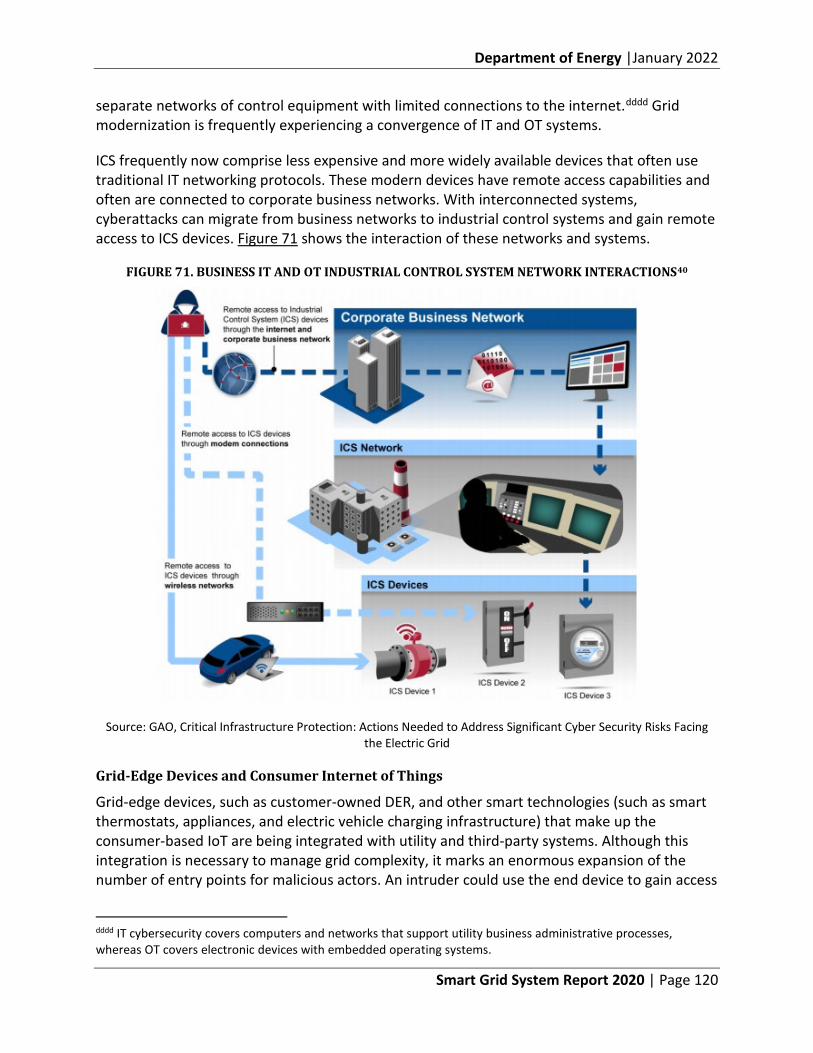
Department of Energy |January 2022
Smart Grid System Report 2020 | Page 120
separate networks of control equipment with limited connections to the internet.dddd Grid modernization is frequently experiencing a convergence of IT and OT systems.
ICS frequently now comprise less expensive and more widely available devices that often use traditional IT networking protocols. These modern devices have remote access capabilities and often are connected to corporate business networks. With interconnected systems, cyberattacks can migrate from business networks to industrial control systems and gain remote access to ICS devices. Figure 71 shows the interaction of these networks and systems.
FIGURE 71. BUSINESS IT AND OT INDUSTRIAL CONTROL SYSTEM NETWORK INTERACTIONS40
Source: GAO, Critical Infrastructure Protection: Actions Needed to Address Significant Cyber Security Risks Facing the Electric Grid
Grid-Edge Devices and Consumer Internet of Things
Grid-edge devices, such as customer-owned DER, and other smart technologies (such as smart thermostats, appliances, and electric vehicle charging infrastructure) that make up the consumer-based IoT are being integrated with utility and third-party systems. Although this integration is necessary to manage grid complexity, it marks an enormous expansion of the number of entry points for malicious actors. An intruder could use the end device to gain access
dddd IT cybersecurity covers computers and networks that support utility business administrative processes, whereas OT covers electronic devices with embedded operating systems.
Department of Energy |January 2022
Smart Grid System Report 2020 | Page 121
into utility IT/OT systems, to enter a third-party (e.g., DER aggregator) system, or to falsify or spoof system data that causes an operator to take action that harms the system. Either case could have major impacts on safe and reliable operation of the electric grid.
In addition, consumer data privacy is tightly intertwined with cybersecurity issues. As described in Section V, many regions rely on AMI to collect and transmit consumer electric usage data. AMI introduces potentially hundreds of thousands or even millions of access points to intercept consumer data.41 Attackers could target the data, network, or physical devices, compromising consumer data or utility networks.
Global Positioning Systems
The grid depends on GPS for position, navigation, and timing (PNT) information to monitor and control generation, transmission, distribution assets. Malicious actors might inject counterfeit GPS signals that could disrupt grid operations.42 For example, wide-area monitoring and control equipment uses GPS clocks for extremely precise timing data. Some of these systems serve roles in protecting the system, and misoperations could cause widespread outages or damage system equipment. Ensuring critical equipment is resilient against this threat, factoring in the responsible use of PNT throughout the system, and adherence to best practices can help mitigate this threat.43
Supply Chain
Supply chain risks can translate to cybersecurity risks for IT/OT technology due to the global nature of manufacturing.44,45 International standards and practices have been developed to ensure device integrity and functionality because manufacturers of smart grid technology source components from a wide range of vendors. This broad-based sourcing increases the opportunity for malicious code to be introduced into equipment during the manufacturing process that can impair safe and reliable grid operation. NERC has created reliability standard CIP-013-1 to address supply chain risks and mitigate potential issues for the power system. NERC is also implementing modifications to standard 2019-03 Cybersecurity Supply Chain Risks to modify supply chain standards for those systems that provide electronic and physical access control to high- and medium-impact cyber systems.
North American Electric Reliability Corporation Critical Infrastructure Protection and Other Cybersecurity Standards
NERC Critical Infrastructure Protection (CIP) Reliability Standards are part of protecting the bulk power system, but currently do not cover the distribution system. NERC standards are used to bolster cybersecurity controls and clarify compliance activities in relation to the physical security of cyber systems, system security management, incident reporting, and recovery plans for cyber systems. They are being consistently revised to deal with emerging issues. NERC is developing a new standard (2019-02) to clarify requirements related to access to bulk power system cyber information. In July 2020, NERC and NIST published a mapping between NERC CIP cybersecurity requirements and NIST Cybersecurity Framework Version 1.1 to provide guidance
Department of Energy |January 2022
Smart Grid System Report 2020 | Page 122
on the identification and implementation of best practices for cyber asset security and protection.46
On June 24, 2020, FERC issued a notice47 seeking comment on potential enhancements to NERC CIP Reliability Standards. The notice specifically seeks input on whether currently effective CIP Reliability Standards adequately address: (1) cybersecurity risks pertaining to data security, (2) detection of anomalies and events, and (3) mitigation of cybersecurity events. In addition to these CIP Reliability Standards focus areas, FERC is also seeking feedback on the potential risks of a coordinated cyber-attack on geographically distributed assets and whether this warrants FERC action.
Appendix VII.C.3 contains an overview of cybersecurity R&D, risk management frameworks, tools, and standards that utilities can leverage to secure their digital infrastructure and reduce the risks of a cyber-attack on modern grid systems. Despite cybersecurity advances, continued investment is needed in cybersecurity technologies and resources to help utilities keep pace with a rapidly evolving and increasingly sophisticated threat landscape. New smart grid technologies and systems must be cyber secure by design. A few areas where continued R&D is needed are in areas of:
• Development and validation of hardware and software sensing technologies for the rapid detection of anomalies
• Cyber intrusion signature library incorporating real-time data feeds from sensors in the field to enable artificial intelligence and machine learning
• Isolation of automated systems, self-healing networks, and security frameworks for power grid applications
G. Workforce
Developing a pipeline of qualified and diverse employees to support a more complex electric grid will be essential to the electric sector’s technological transition. After large waves of retirements over the past decade at utilities, the rate of retirement attrition is stabilizing. The skills required to plan, build, and operate the future grid effectively are changing rapidly, however, due to technology deployments and the changing grid resource mix. In particular, the pervasive application of digital technology is requiring more highly skilled workers and engineers. Increasing digitization, innovation, and opportunities in other industries have meanwhile created a shortage in the necessary technical skills to operate a smart grid, resulting in increasing competition for qualified staff and an emerging challenge of nonretirement attrition for the electric sector. In addition to evolving utility and system operator skill sets, technology vendors and third-party resource providers are seeing an expanding role in the electric sector, requiring a skilled workforce to support the industry. These combined factors create continued challenges for the electric industry to attract, recruit, hire, and retain qualified applicants.
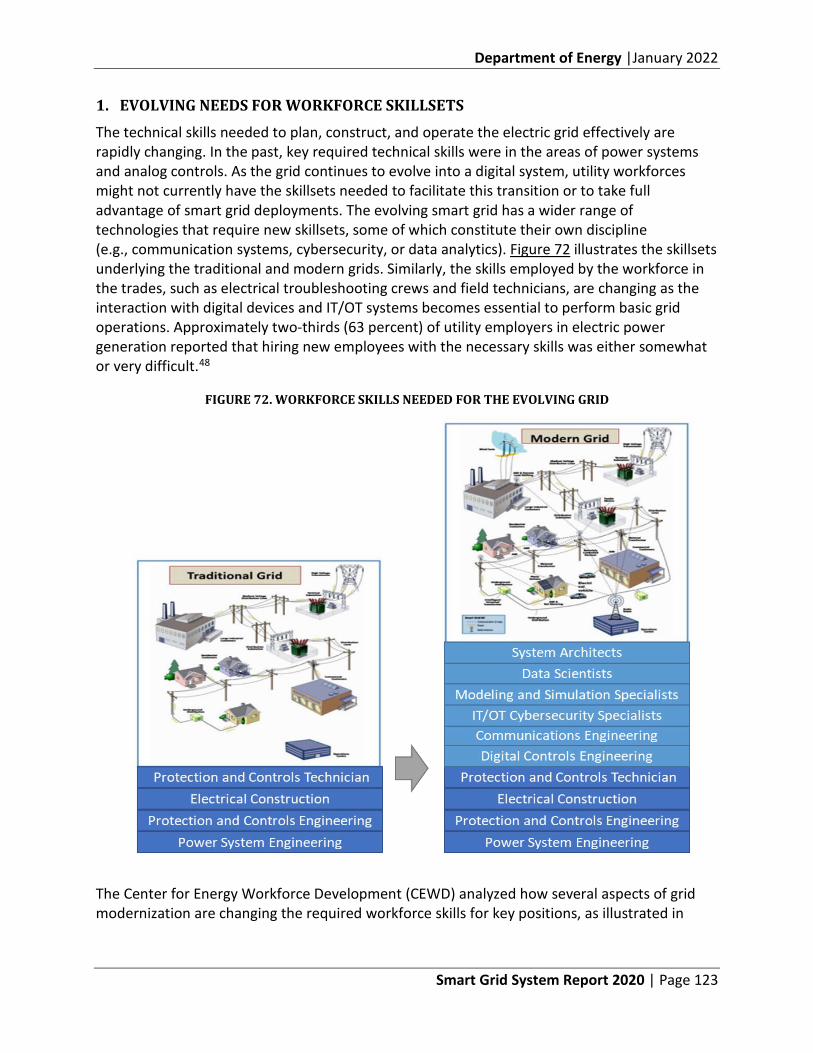
Department of Energy |January 2022
Smart Grid System Report 2020 | Page 123
1. EVOLVING NEEDS FOR WORKFORCE SKILLSETS
The technical skills needed to plan, construct, and operate the electric grid effectively are rapidly changing. In the past, key required technical skills were in the areas of power systems and analog controls. As the grid continues to evolve into a digital system, utility workforces might not currently have the skillsets needed to facilitate this transition or to take full advantage of smart grid deployments. The evolving smart grid has a wider range of technologies that require new skillsets, some of which constitute their own discipline (e.g., communication systems, cybersecurity, or data analytics). Figure 72 illustrates the skillsets underlying the traditional and modern grids. Similarly, the skills employed by the workforce in the trades, such as electrical troubleshooting crews and field technicians, are changing as the interaction with digital devices and IT/OT systems becomes essential to perform basic grid operations. Approximately two-thirds (63 percent) of utility employers in electric power generation reported that hiring new employees with the necessary skills was either somewhat or very difficult.48
FIGURE 72. WORKFORCE SKILLS NEEDED FOR THE EVOLVING GRID
The Center for Energy Workforce Development (CEWD) analyzed how several aspects of grid modernization are changing the required workforce skills for key positions, as illustrated in
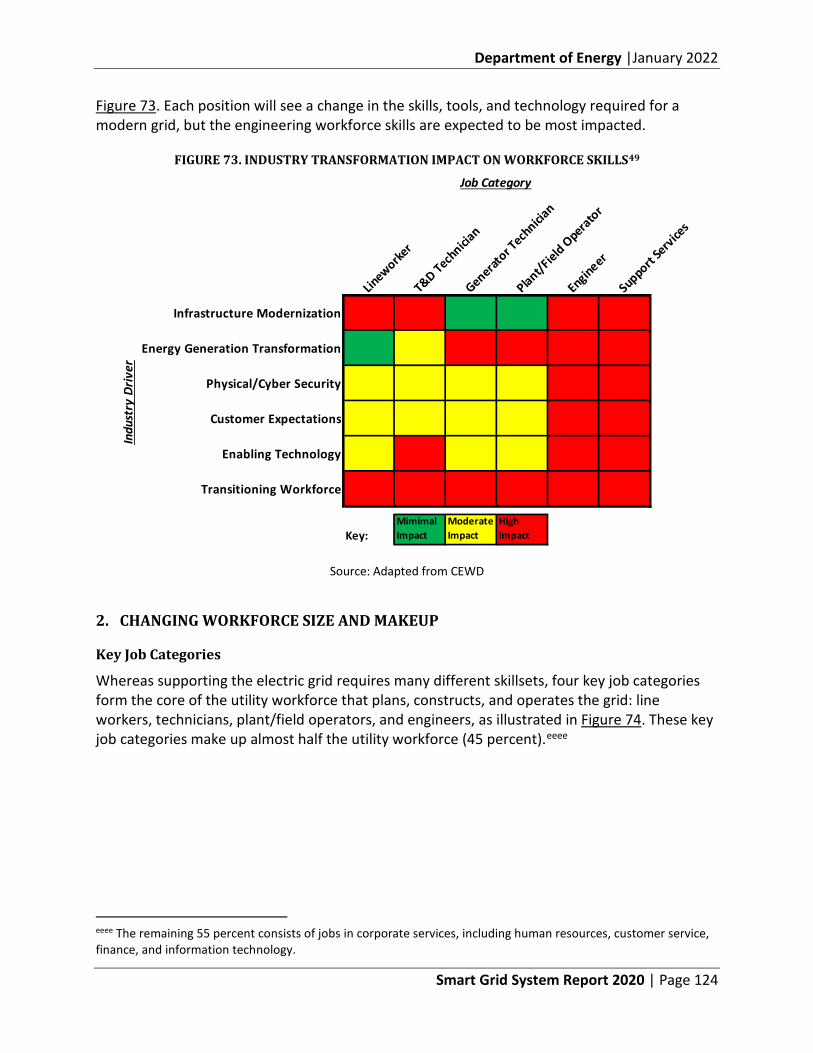
Department of Energy |January 2022
Smart Grid System Report 2020 | Page 124
Figure 73. Each position will see a change in the skills, tools, and technology required for a modern grid, but the engineering workforce skills are expected to be most impacted.
FIGURE 73. INDUSTRY TRANSFORMATION IMPACT ON WORKFORCE SKILLS49
Source: Adapted from CEWD
2. CHANGING WORKFORCE SIZE AND MAKEUP
Key Job Categories
Whereas supporting the electric grid requires many different skillsets, four key job categories form the core of the utility workforce that plans, constructs, and operates the grid: line workers, technicians, plant/field operators, and engineers, as illustrated in Figure 74. These key job categories make up almost half the utility workforce (45 percent).eeee
eeee The remaining 55 percent consists of jobs in corporate services, including human resources, customer service, finance, and information technology.
Job Category
Lineworke
r
T&D Technicia
n
Generator T
echnicia
n
Plant/Field O
perator
Engineer
Support Se
rvices
Infrastructure Modernization
Energy Generation Transformation
Physical/Cyber Security
Customer Expectations
Enabling Technology
Transitioning Workforce
Key: Mimimal Impact
Moderate Impact
High Impact
Indu
stry
Driv
er
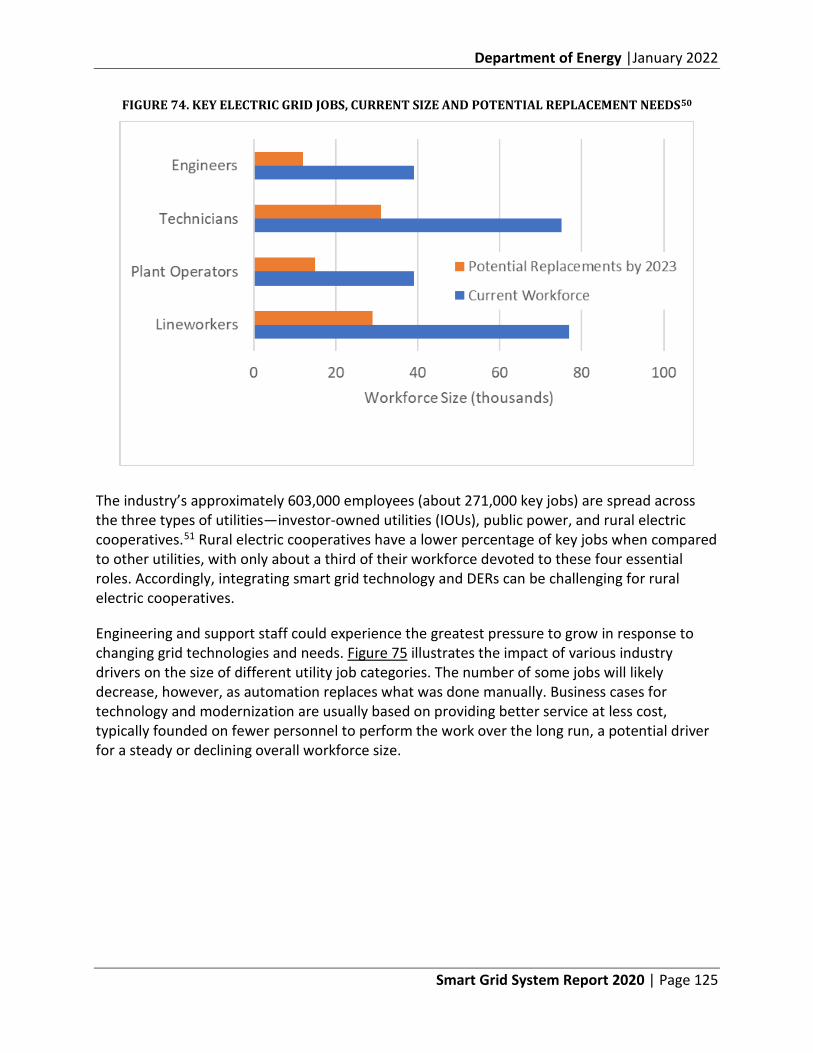
Department of Energy |January 2022
Smart Grid System Report 2020 | Page 125
FIGURE 74. KEY ELECTRIC GRID JOBS, CURRENT SIZE AND POTENTIAL REPLACEMENT NEEDS50
The industry’s approximately 603,000 employees (about 271,000 key jobs) are spread across the three types of utilities—investor-owned utilities (IOUs), public power, and rural electric cooperatives.51 Rural electric cooperatives have a lower percentage of key jobs when compared to other utilities, with only about a third of their workforce devoted to these four essential roles. Accordingly, integrating smart grid technology and DERs can be challenging for rural electric cooperatives.
Engineering and support staff could experience the greatest pressure to grow in response to changing grid technologies and needs. Figure 75 illustrates the impact of various industry drivers on the size of different utility job categories. The number of some jobs will likely decrease, however, as automation replaces what was done manually. Business cases for technology and modernization are usually based on providing better service at less cost, typically founded on fewer personnel to perform the work over the long run, a potential driver for a steady or declining overall workforce size.
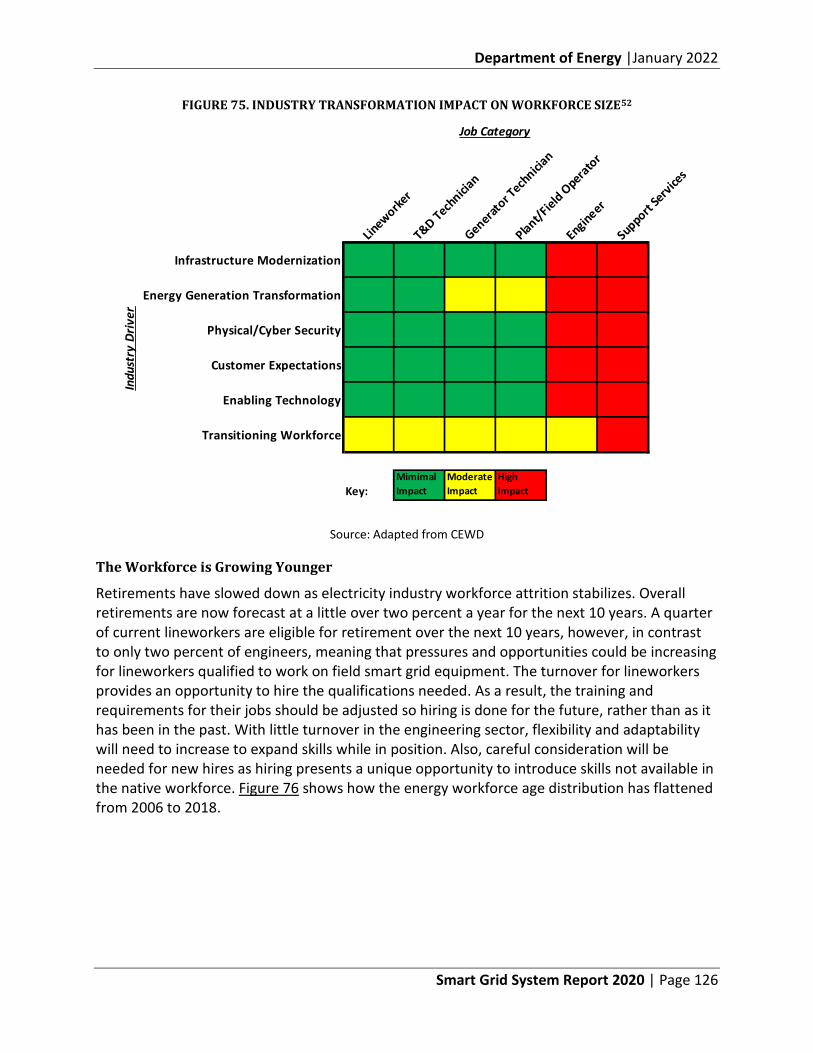
Department of Energy |January 2022
Smart Grid System Report 2020 | Page 126
FIGURE 75. INDUSTRY TRANSFORMATION IMPACT ON WORKFORCE SIZE52
Source: Adapted from CEWD
The Workforce is Growing Younger
Retirements have slowed down as electricity industry workforce attrition stabilizes. Overall retirements are now forecast at a little over two percent a year for the next 10 years. A quarter of current lineworkers are eligible for retirement over the next 10 years, however, in contrast to only two percent of engineers, meaning that pressures and opportunities could be increasing for lineworkers qualified to work on field smart grid equipment. The turnover for lineworkers provides an opportunity to hire the qualifications needed. As a result, the training and requirements for their jobs should be adjusted so hiring is done for the future, rather than as it has been in the past. With little turnover in the engineering sector, flexibility and adaptability will need to increase to expand skills while in position. Also, careful consideration will be needed for new hires as hiring presents a unique opportunity to introduce skills not available in the native workforce. Figure 76 shows how the energy workforce age distribution has flattened from 2006 to 2018.
Job Category
Lineworke
r
T&D Technicia
n
Generator T
echnicia
n
Plant/Field O
perator
Engineer
Support Se
rvices
Infrastructure Modernization
Energy Generation Transformation
Physical/Cyber Security
Customer Expectations
Enabling Technology
Transitioning Workforce
Key: Mimimal Impact
Moderate Impact
High Impact
Indu
stry
Driv
er
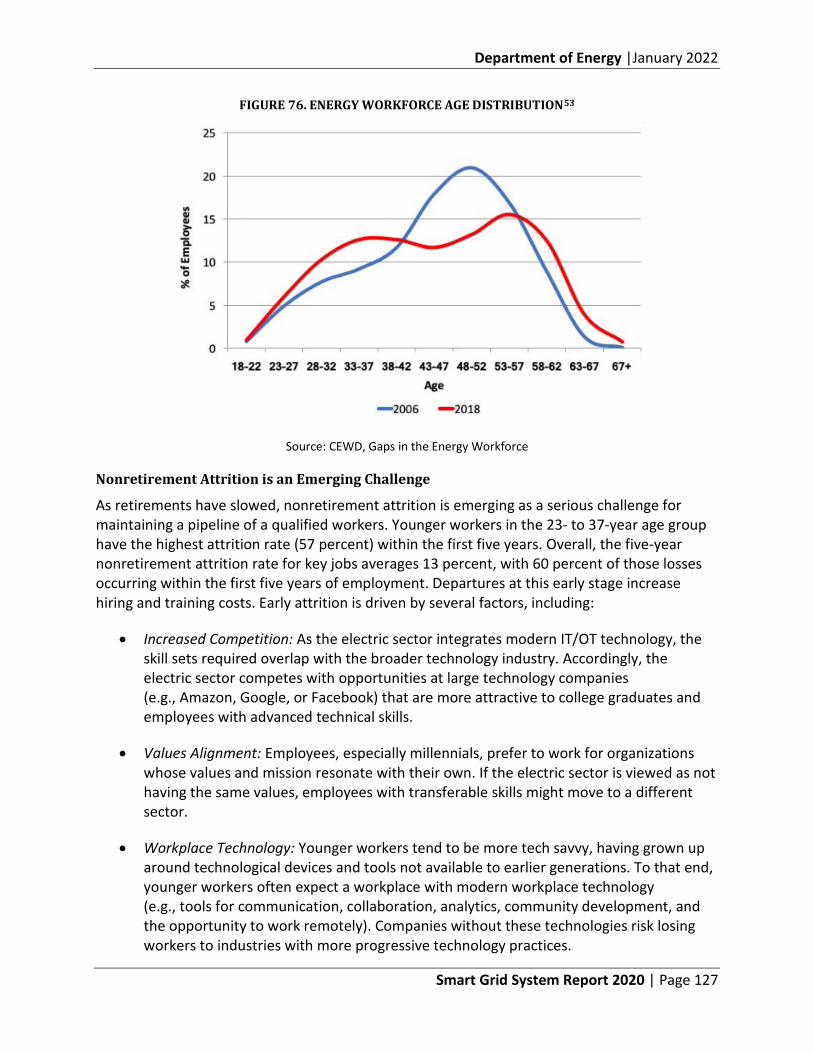
Department of Energy |January 2022
Smart Grid System Report 2020 | Page 127
FIGURE 76. ENERGY WORKFORCE AGE DISTRIBUTION53
Source: CEWD, Gaps in the Energy Workforce
Nonretirement Attrition is an Emerging Challenge
As retirements have slowed, nonretirement attrition is emerging as a serious challenge for maintaining a pipeline of a qualified workers. Younger workers in the 23- to 37-year age group have the highest attrition rate (57 percent) within the first five years. Overall, the five-year nonretirement attrition rate for key jobs averages 13 percent, with 60 percent of those losses occurring within the first five years of employment. Departures at this early stage increase hiring and training costs. Early attrition is driven by several factors, including:
• Increased Competition: As the electric sector integrates modern IT/OT technology, the skill sets required overlap with the broader technology industry. Accordingly, the electric sector competes with opportunities at large technology companies (e.g., Amazon, Google, or Facebook) that are more attractive to college graduates and employees with advanced technical skills.
• Values Alignment: Employees, especially millennials, prefer to work for organizations whose values and mission resonate with their own. If the electric sector is viewed as not having the same values, employees with transferable skills might move to a different sector.
• Workplace Technology: Younger workers tend to be more tech savvy, having grown up around technological devices and tools not available to earlier generations. To that end, younger workers often expect a workplace with modern workplace technology (e.g., tools for communication, collaboration, analytics, community development, and the opportunity to work remotely). Companies without these technologies risk losing workers to industries with more progressive technology practices.
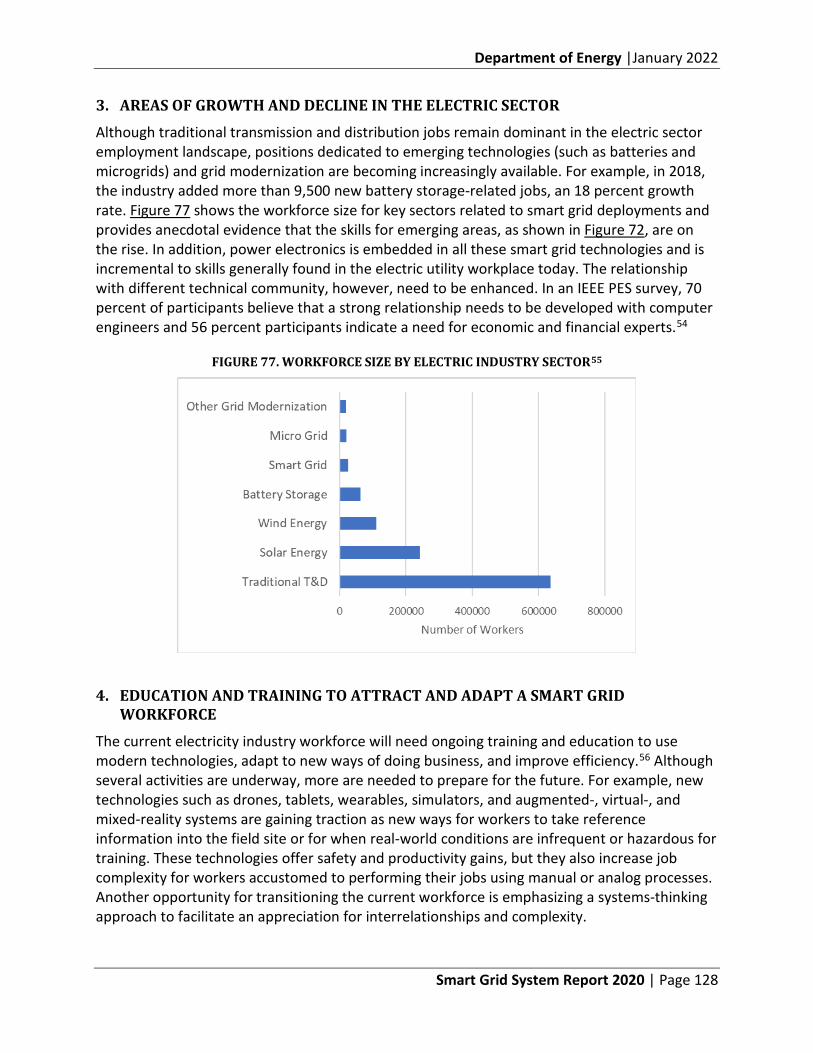
Department of Energy |January 2022
Smart Grid System Report 2020 | Page 128
3. AREAS OF GROWTH AND DECLINE IN THE ELECTRIC SECTOR
Although traditional transmission and distribution jobs remain dominant in the electric sector employment landscape, positions dedicated to emerging technologies (such as batteries and microgrids) and grid modernization are becoming increasingly available. For example, in 2018, the industry added more than 9,500 new battery storage-related jobs, an 18 percent growth rate. Figure 77 shows the workforce size for key sectors related to smart grid deployments and provides anecdotal evidence that the skills for emerging areas, as shown in Figure 72, are on the rise. In addition, power electronics is embedded in all these smart grid technologies and is incremental to skills generally found in the electric utility workplace today. The relationship with different technical community, however, need to be enhanced. In an IEEE PES survey, 70 percent of participants believe that a strong relationship needs to be developed with computer engineers and 56 percent participants indicate a need for economic and financial experts.54
FIGURE 77. WORKFORCE SIZE BY ELECTRIC INDUSTRY SECTOR55
4. EDUCATION AND TRAINING TO ATTRACT AND ADAPT A SMART GRID WORKFORCE
The current electricity industry workforce will need ongoing training and education to use modern technologies, adapt to new ways of doing business, and improve efficiency.56 Although several activities are underway, more are needed to prepare for the future. For example, new technologies such as drones, tablets, wearables, simulators, and augmented-, virtual-, and mixed-reality systems are gaining traction as new ways for workers to take reference information into the field site or for when real-world conditions are infrequent or hazardous for training. These technologies offer safety and productivity gains, but they also increase job complexity for workers accustomed to performing their jobs using manual or analog processes. Another opportunity for transitioning the current workforce is emphasizing a systems-thinking approach to facilitate an appreciation for interrelationships and complexity.
Department of Energy |January 2022
Smart Grid System Report 2020 | Page 129
Finally, because cybersecurity challenges are constantly evolving, the workforce must receive ongoing training on cybersecurity best practices. To develop a workforce pipeline of the right size, skills, and diversity for a modern grid, the electricity industry needs a combination of efforts:
• K-12 science, technology, engineering, and mathematics (STEM) education programs that build interest in energy sector and electrical engineering subjects. STEM education needs to introduce young people to more topics central to the electric sector, such as the role of distributed generation and microgrids in alleviating grid outages, reducing air pollution from cars by transitioning to electric vehicles, emphasizing the role of energy efficiency measures to reduce energy poverty, and demonstrating the value of data science in analyzing grid data.
• More widespread university power systems engineering programs that include a focus on cutting-edge grid technologies. Universities are experiencing increased electrical engineering enrollment, but power systems programs are not widespread. The number of degrees awarded in the electrical engineering discipline grew by 22.1 percent from 2014 to 2018.57 The number of electrical engineering programs that include a power focus have also been on the rise.58 However, utilities have found many university graduates in the electrical engineering discipline had limited or no training in the real-world standards, principles, and practices followed at an electric utility, however, requiring heavy investment in additional training for new graduates.59
• Continuous education courses that enable active engineering professionals to adapt to rapid industry changes. Grid transformation is significantly affecting the skills requirements for electricity industry workers of all types, as discussed above. For active engineering professionals adapting to rapid industry changes, the Electric Power Research Institute’s (EPRI’s) GridEd workforce development initiative has developed short educational courses on new topics in power engineering and data science. ffff Through 2018, the most popular courses by enrollment were:60
• DG interconnection on radial distribution systems • Energy storage technologies, applications, and integration • Applications of smart inverter technology • Electric power distribution systems • Business case analysis in the electric utility industry
Cybersecurity training is a significant area of need. According to state energy officials, the demand for skilled cybersecurity professionals is outpacing available workers.61
ffff The GridEd effort involves collaboration among EPRI, four partner universities (Stony Brook University, University of California – Riverside, Virginia Tech, and Washington State University), and utility and industry sponsors.
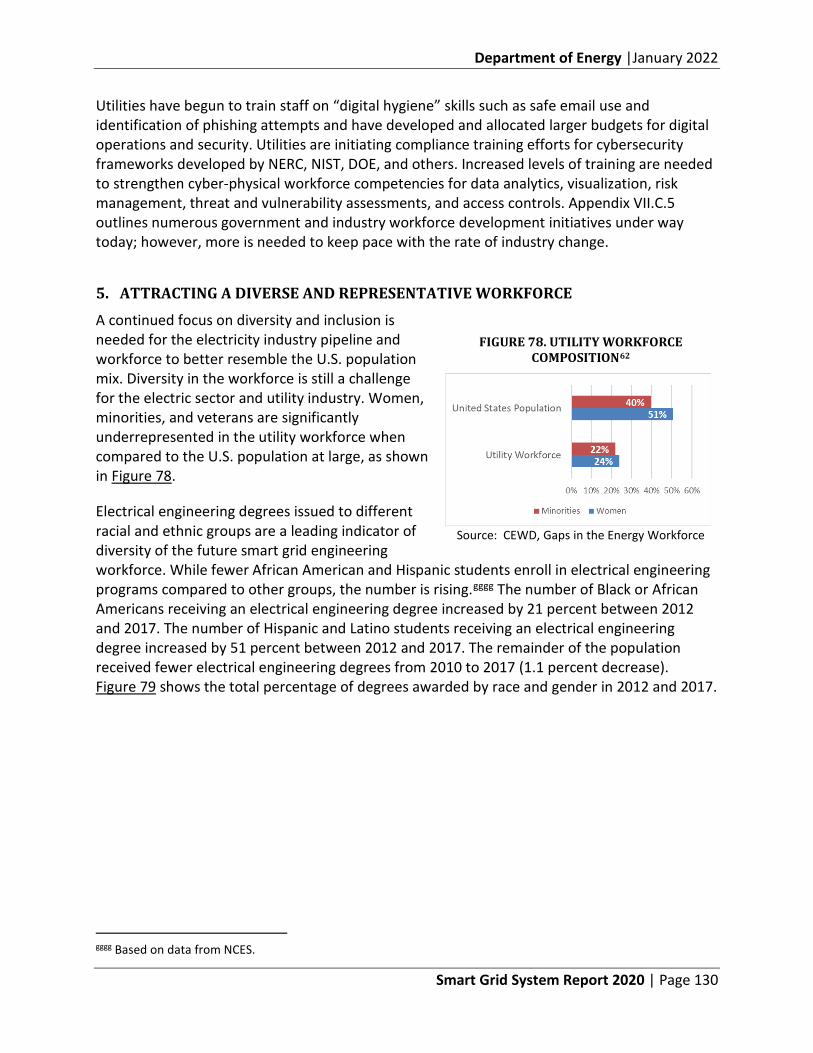
Department of Energy |January 2022
Smart Grid System Report 2020 | Page 130
Utilities have begun to train staff on “digital hygiene” skills such as safe email use and identification of phishing attempts and have developed and allocated larger budgets for digital operations and security. Utilities are initiating compliance training efforts for cybersecurity frameworks developed by NERC, NIST, DOE, and others. Increased levels of training are needed to strengthen cyber-physical workforce competencies for data analytics, visualization, risk management, threat and vulnerability assessments, and access controls. Appendix VII.C.5 outlines numerous government and industry workforce development initiatives under way today; however, more is needed to keep pace with the rate of industry change.
5. ATTRACTING A DIVERSE AND REPRESENTATIVE WORKFORCE
A continued focus on diversity and inclusion is needed for the electricity industry pipeline and workforce to better resemble the U.S. population mix. Diversity in the workforce is still a challenge for the electric sector and utility industry. Women, minorities, and veterans are significantly underrepresented in the utility workforce when compared to the U.S. population at large, as shown in Figure 78.
Electrical engineering degrees issued to different racial and ethnic groups are a leading indicator of diversity of the future smart grid engineering workforce. While fewer African American and Hispanic students enroll in electrical engineering programs compared to other groups, the number is rising.gggg The number of Black or African Americans receiving an electrical engineering degree increased by 21 percent between 2012 and 2017. The number of Hispanic and Latino students receiving an electrical engineering degree increased by 51 percent between 2012 and 2017. The remainder of the population received fewer electrical engineering degrees from 2010 to 2017 (1.1 percent decrease). Figure 79 shows the total percentage of degrees awarded by race and gender in 2012 and 2017.
gggg Based on data from NCES.
FIGURE 78. UTILITY WORKFORCE COMPOSITION62
Source: CEWD, Gaps in the Energy Workforce
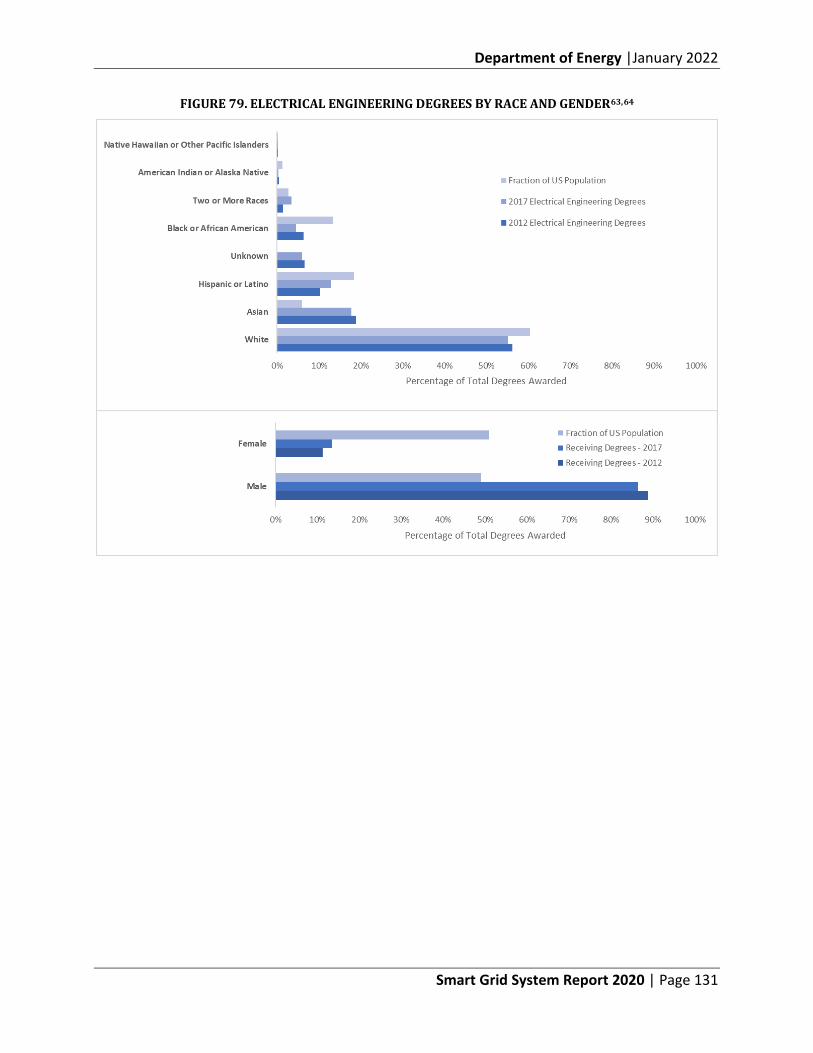
Department of Energy |January 2022
Smart Grid System Report 2020 | Page 131
FIGURE 79. ELECTRICAL ENGINEERING DEGREES BY RACE AND GENDER63,64
Department of Energy |January 2022
Smart Grid System Report 2020 | Page 132
Section Endnotes
1 Taft, JD. Grid Architecture 2. Pacific Northwest National Laboratory. January 2016. https://gridmod.labworks.org/sites/default/files/resources/Grid%20Architecture%202%20final_GMLC.pdf. 2 De Martini, P., & Kristov, L., Distribution Systems in a High Distributed Energy Resource Future: Planning, Market Design, Operation and Oversight, 2015. https://emp.lbl.gov/sites/default/files/lbnl-1003797.pdf. 3 Operational Coordination across the Bulk-Power, Distribution, and Customer Systems, by P. De Martini, L. Kristov, and J. Taft, prepared for the Electricity Advisory Committee, US Department of Energy, February 2019. 4 Ibid. 5 DOE, DOE Modern Distribution Grid – Strategy and Implementation Planning Guidebook, Volume 4 of the Next-Generation Distribution System Platform (DSPx) Initiative, U.S. Department of Energy, draft. https://gridarchitecture.pnnl.gov/media/Modern-Distribution-Grid_Volume_IV_v1_0_draft.pdf. 6 Ibid. 7 Ibid. 8 Ibid. 9 U.S. DOE, Distribution Automation: Results from the Smart Grid Investment Grant Program, September 2016. https://www.energy.gov/sites/prod/files/2016/11/f34/Distribution%20Automation%20Summary%20Report_09-29-16.pdf. 10 DOE, Advanced grid research and development, https://www.energy.gov/oe/mission/oe-divisions/advanced-grid-research-and-development. 11 U.S. DOE, U.S. Department of Energy Power Electronics Strategy, Office of Electricity, TRAC Program, July 2020. 12 Ibid. 13 Ibid. 14 Ibid. 15 IEEE, 1547-2018 - IEEE Standard for Interconnection and Interoperability of Distributed Energy Resources with Associated Electric Power Systems Interfaces. https://standards.ieee.org/standard/1547-2018.html. 16 U.S. DOE, U.S. Department of Energy Power Electronics Strategy, Office of Electricity, TRAC Program, July 2020. 17 “Reliability Guidance – BPS-Connected Inverter-Based Resource Performance,” North American Electric Reliability Corporation, September 2018. 18 Ibid. 19 Adapted by J. Paladino, DOE, from Architectural Basis for Highly Distributed Transactive Power Grids: Frameworks, Networks, and Grid Codes, by JD Taft, June 2016, PNNL-25480. https://gridarchitecture.pnnl.gov/media/advanced/Architectural%20Basis%20for%20Highly%20Distributed%20Transactive%20Power%20Grids_final.pdf. 20 DOE, DOE Modern Distribution Grid – Strategy and Implementation Planning Guidebook, Volume 4 of the Next-Generation Distribution System Platform (DSPx) Initiative, U.S. Department of Energy, draft. https://gridarchitecture.pnnl.gov/media/Modern-Distribution-Grid_Volume_IV_v1_0_draft.pdf. 21 U.S. DOE, DOE releases Draft Energy Storage Grand Challenge Roadmap and Requests Stakeholder Input. Available online at: https://www.energy.gov/articles/doe-releases-draft-energy-storage-grand-challenge-roadmap-and-requests-stakeholder-input. 22 U.S. DOE, Energy Storage Grand Challenge Draft Roadmap, July 2020, https://www.energy.gov/sites/prod/files/2020/07/f76/ESGC%20Draft%20Roadmap_2.pdf. 23 NIST, Smart Grid Framework, NIST Framework and Roadmap of Smart Grid Interoperability Standards, Release 4.0, September 2020. https://www.nist.gov/el/smart-grid/smart-grid-framework.
Department of Energy |January 2022
Smart Grid System Report 2020 | Page 133
24 Adapted by F. Cleveland, IEC 62351 Security Standards for the Power System Information System, 2012. http://iectc57.ucaiug.org/wg15public/Public%20Documents/White%20Paper%20on%20Security%20Standards%20in%20IEC%20TC57.pdf. 25 Sensing and Measurement Architecture for Grid Modernization, by Jeffrey Taft and Paul De Martini, PNNL-25249, February 2016. Available online at: https://gridarchitecture.pnnl.gov/media/advanced/Sensor%20Networks%20for%20Electric%20Power%20Systems.pdf. 26 U.S. Energy Independence and Security Act of 2007, Public Law 110-140-DEC. 19, 2007, Available online at: https://www.govinfo.gov/content/pkg/PLAW-110publ140/pdf/PLAW-110publ140.pdf. 27 NIST, Smart Grid Framework, NIST Framework and Roadmap of Smart Grid Interoperability Standards, Release 4.0, Available online at: https://www.nist.gov/el/smart-grid/smart-grid-framework. 28 J. MacDowell et al., A Journey Through Energy Systems Integration: Trending Grid Codes, Standards, and IEC Collaboration, in IEEE Power and Energy Magazine, vol. 17, no. 6, pp. 79-88, Nov.-Dec. 2019. 29 NERC, Project 2019-02 BES Cyber System Information Access Management, Available online at: https://www.nerc.com/pa/Stand/Pages/Project2019-02BCSIAccessManagement.aspx. 30 IEEE, 2030–2011 – IEEE Guide for Smart Grid Interoperability of Energy Technology and Information Technology Operation with the Electric Power System (EPS), End-Use Applications, and Loads. 31 IEEE, IEEE, 1547-2018 – IEEE Standard for Interconnection and Interoperability of Distributed Energy Resources with Associated Electric Power Systems Interfaces. Available for purchase at: https://standards.ieee.org/standard/1547-2018.html. 32 Minnesota Public Utilities Commission, Docket No E-999/CI-16-521, In the Matter of Updating Generic Standards for the Interconnection and Operation of Distributed Generation Facilities. Available online at: https://mn.gov/puc/assets/January%2022%202020%20Order_tcm14-431303.pdf. 33 NARUC, Resolutions Proposed for Consideration at the 2020 Winter Policy Summit, 1/28/2020, available online at: https://pubs.naruc.org/pub/49A6A319-155D-0A36-3140-EFAD21E48B50. 34 NERC, PRC-024-2 Gaps Whitepaper, NERC Inverter-Based Resource Performance Task Force, Available online at: https://www.nerc.com/comm/PC/InverterBased%20Resource%20Performance%20Task%20Force%20IRPT/NERC_IRPTF_PRC-024-2_Gaps_Whitepaper_FINAL_CLEAN.pdf. 35 Source: Office of the Director of National Intelligence, Improving Cybersecurity for the Intelligence Community Information Environment Implementation Plan, August 2019. 36 Security, FBI, Federal Agencies Brief Energy Sector on Data Breaches, Cyberattacks, Available online at: https://www.securitymagazine.com/articles/91244-fbi-federal-agencies-brief-energy-sector-on-data-breaches-cyberattacks. 37 CISA, U.S. Department of Homeland Security, ICS Alert (IR-ALERT-H-16-056-01), Cyber-Attack Against Ukrainian Critical Infrastructure, Available online at: https://www.us-cert.gov/ics/alerts/IR-ALERT-H-16-056-01. 38 Proofpoint, LookBack Forges Ahead: Continued Targeting of the United States’ Utilities Sector Reveals Additional Adversary TTPs, September 23, 2019. 39 The Wall Street Journal, Utilities Targeted in Cyberattacks Identified, November 24, 2019. Available online at: https://www.wsj.com/articles/utilities-targeted-in-cyberattacks-identified-11574611200. 40 GAO, Critical Infrastructure Protection: Actions Needed to Address Significant Cyber Security Risks Facing the Electric Grid, GAO-19-332, August 2019. https://www.gao.gov/assets/710/701079.pdf. 41 Halim, Fatemeh, et al., Cyber Security Issues in Smart Meter and Their Solutions, International Journal of Computer Science and Network Security, Vol 18, No. 3, March 2018. Available online at: http://paper.ijcsns.org/07_book/201803/20180314.pdf. 42 U.S. Government Accountability Office, Critical Infrastructure Protection – Actions Needed to Address Significant Cybersecurity Risks Facing the Electric Grid, August 2019.
Department of Energy |January 2022
Smart Grid System Report 2020 | Page 134
43 U.S. Department of Homeland Security, Improving the Operation and Development of Global Positioning System (GPS) Equipment Used by Critical Infrastructure, Available online at: https://us-cert.cisa.gov/sites/default/files/documents/Improving_the_Operation_and_Development_of_Global_Positioning_System_%28GPS%29_Equipment_Used_by_Critical_Infrastructure_S508C.pdf. 44 Congressional Research Service, Electric Grid Cybersecurity, September 4, 2018. Available online at: https://fas.org/sgp/crs/homesec/R45312.pdf. 45 Protect Our Power, A Review of Power Industry’s Supply Chain Security Risks, February 20, 2020. 46 NERC, Mapping of CIP Standards to NIST Cybersecurity Framework (CSF) v1.1Subcategories performed by Electric Industry Responsible Entity volunteers, NIST and NERC, Available online at: https://www.nerc.com/pa/comp/CAOneStopShop/NIST%20CSF%20v1.1%20to%20NERC%20CIP%20FINAL.XLSX. 47 U.S. Federal Register, Potential Enhancements to the Critical Infrastructure Protection Reliability Standards, FERC, June 24, 2020, Available online at: https://www.federalregister.gov/documents/2020/06/24/2020-13618/potential-enhancements-to-the-critical-infrastructure-protection-reliability-standards. 48 NASEO, EFI, The 2019 U.S. Energy & Employment Report, Available online at: https://static1.squarespace.com/static/5a98cf80ec4eb7c5cd928c61/t/5c7f3708fa0d6036d7120d8f/1551849054549/USEER+2019+US+Energy+Employment+Report.pdf. 49 Figure is adapted from Center for Energy Workforce Development, State of the Energy Workforce 2018, Available online at: http://www.cewd.org/documents/SOTI2018-Final.pdf. 50 Center for Energy Workforce Development, Gaps in the Energy Workforce 2019 Pipeline Survey Results. Available online at: http://cewd.org/documents/surveyreport/2019-GapsintheEnergyWorkforce-SurveyResults.pdf. 51 Ibid. 52 Figure is adapted from Center for Energy Workforce Development, State of the Energy Workforce 2018, Available online at: http://www.cewd.org/documents/SOTI2018-Final.pdf. 53 Center for Energy Workforce Development, Gaps in the Energy Workforce 2019 Pipeline Survey Results. Available online at: http://cewd.org/documents/surveyreport/2019-GapsintheEnergyWorkforce-SurveyResults.pdf. 54 IEEE PES, Survey Report: IEEE PES Future Directions. 55 NASEO, EFI, The 2019 U.S. Energy & Employment Report, Available online at: https://static1.squarespace.com/static/5a98cf80ec4eb7c5cd928c61/t/5c7f3708fa0d6036d7120d8f/1551849054549/USEER+2019+US+Energy+Employment+Report.pdf. 56 EPRI, Program on Technology Innovation: The Future of Utility Training and Education, January 2019. 57 American Society for Engineering Education, Growth in Engineering Degrees by Discipline 2014 – 2018, October 18, 2019. Available online at: https://ira.asee.org/growth-in-engineering-degrees-by-discipline-2014-2018/. 58 IEEE PES, Electrical Power Engineering Education Resources: 2015–2016 US and Canadian University Survey Results, November 2017, Available online at: https://www.ieee-pes.org/images/files/pdf/peec-survey/2015-16_PES_PEEC_Survey_Report_Final_11-2017.pdf. 59 EPRI, Leveraging Industry Research to Educate a Future Electric Grid Workforce, August 2019. 60 EPRI, Leveraging Industry Research to Educate a Future Electric Grid Workforce, August 2019. 61 NASEO, EFI, I, Available online at: https://static1.squarespace.com/static/5a98cf80ec4eb7c5cd928c61/t/5c7f3708fa0d6036d7120d8f/1551849054549/USEER+2019+US+Energy+Employment+Report.pdf. 62 Center for Energy Workforce Development, Gaps in the Energy Workforce 2019 Pipeline Survey Results. Available online at: http://cewd.org/documents/surveyreport/2019-GapsintheEnergyWorkforce-SurveyResults.pdf. 63 Data source for figure: Integrated Postsecondary Education Data System conducted by the US Department of Education’s National Center for Education Statistics (NCES). Available online at: https://nces.ed.gov/ipeds/use-the-data. 64 Data source for figure: United States Census Bureau Quick Facts. Available online at: https://www.census.gov/quickfacts/fact/table/US/PST045218.
Department of Energy |January 2022
Smart Grid System Report 2020 | Page 135
VI. Conclusion The electric grid is considered an ultra-large-scale (ULS) system,1 much like natural ecosystems and cities, in that it is faced with a) inherently conflicting and diverse requirements; b) decentralized data, development, and control; c) continuous evolution and deployment; d) heterogeneous, inconsistent, and changing elements; and e) normal failures. This complexity is becoming more pronounced as consumers shift from being users of the grid to becoming elements of it, along with technology providers offering grid services utilities traditionally supply. ULS systems are not typically designed through top-down engineering, yet they function in a highly complex and organized manner, given competing needs and objectives by the elements that function within it.
The challenges we face are both technological and institutional in nature; we need to advance and effectively integrate our technological solutions, as well as help decision makers with methods and tools so they can craft grid modernization strategies that deploy these solutions over time in practical ways to meet future demands. This will require instituting the appropriate technology, processes, and design considerations to maintain a stable, coherent, and manageable grid system as it evolves, and to do so in a way that addresses the increased levels of complexity and uncertainty presented by continual technological advancement, policy shifts, and changing customer expectations. In the end, such strategies need to consider reliability, efficiency, security, resilience, and affordability as outcomes.

Department of Energy |January 2022
Smart Grid System Report 2020 | Page 136
Section Endnotes
1 Northrop, L., Feiler, P., Gabriel, R. P., Goodenough, J., Linger, R., Longstaff, T., Kazman, R., Klein, M., Schmidt, D., Sullivan, K. & Wallnau, K. (2006). Ultra-Large-Scale Systems—The Software Challenge of the Future. Software Engineering Institute, Carnegie Mellon.
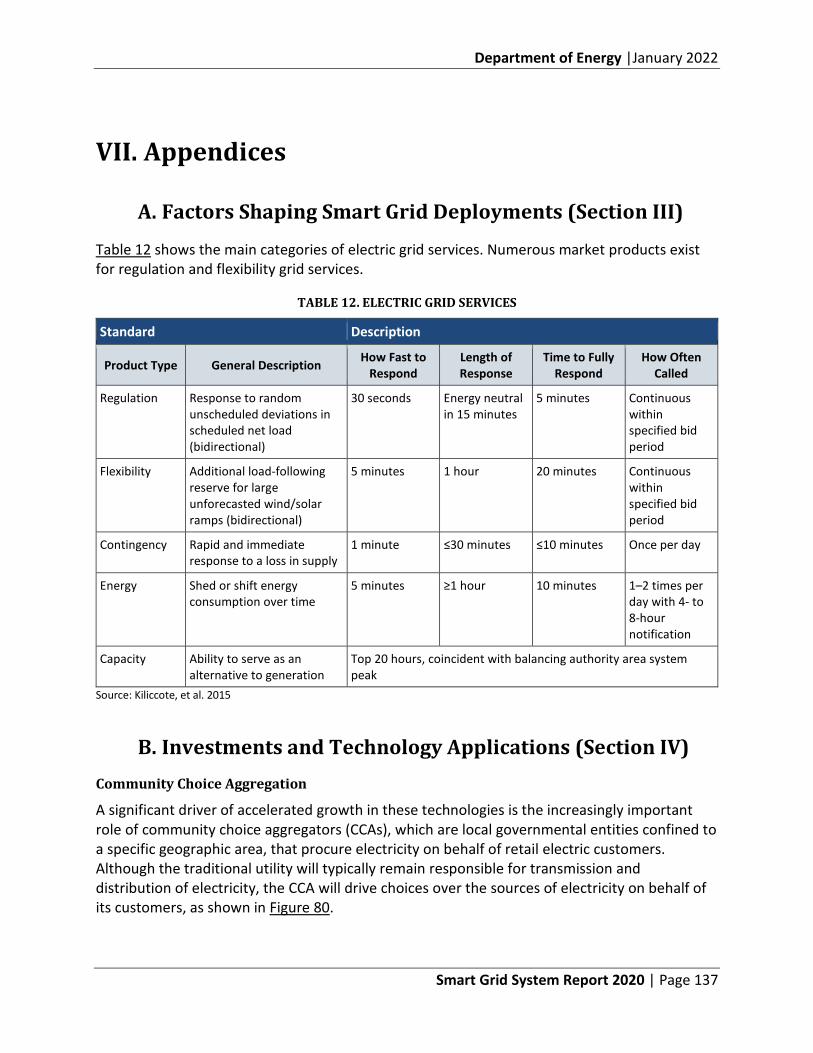
Department of Energy |January 2022
Smart Grid System Report 2020 | Page 137
VII. Appendices
A. Factors Shaping Smart Grid Deployments (Section III)
Table 12 shows the main categories of electric grid services. Numerous market products exist for regulation and flexibility grid services.
TABLE 12. ELECTRIC GRID SERVICES
Standard Description
Product Type General Description How Fast to Respond
Length of Response
Time to Fully Respond
How Often Called
Regulation Response to random unscheduled deviations in scheduled net load (bidirectional)
30 seconds Energy neutral in 15 minutes
5 minutes Continuous within specified bid period
Flexibility Additional load-following reserve for large unforecasted wind/solar ramps (bidirectional)
5 minutes 1 hour 20 minutes Continuous within specified bid period
Contingency Rapid and immediate response to a loss in supply
1 minute ≤30 minutes ≤10 minutes Once per day
Energy Shed or shift energy consumption over time
5 minutes ≥1 hour 10 minutes 1–2 times per day with 4- to 8-hour notification
Capacity Ability to serve as an alternative to generation
Top 20 hours, coincident with balancing authority area system peak
Source: Kiliccote, et al. 2015
B. Investments and Technology Applications (Section IV) Community Choice Aggregation
A significant driver of accelerated growth in these technologies is the increasingly important role of community choice aggregators (CCAs), which are local governmental entities confined to a specific geographic area, that procure electricity on behalf of retail electric customers. Although the traditional utility will typically remain responsible for transmission and distribution of electricity, the CCA will drive choices over the sources of electricity on behalf of its customers, as shown in Figure 80.
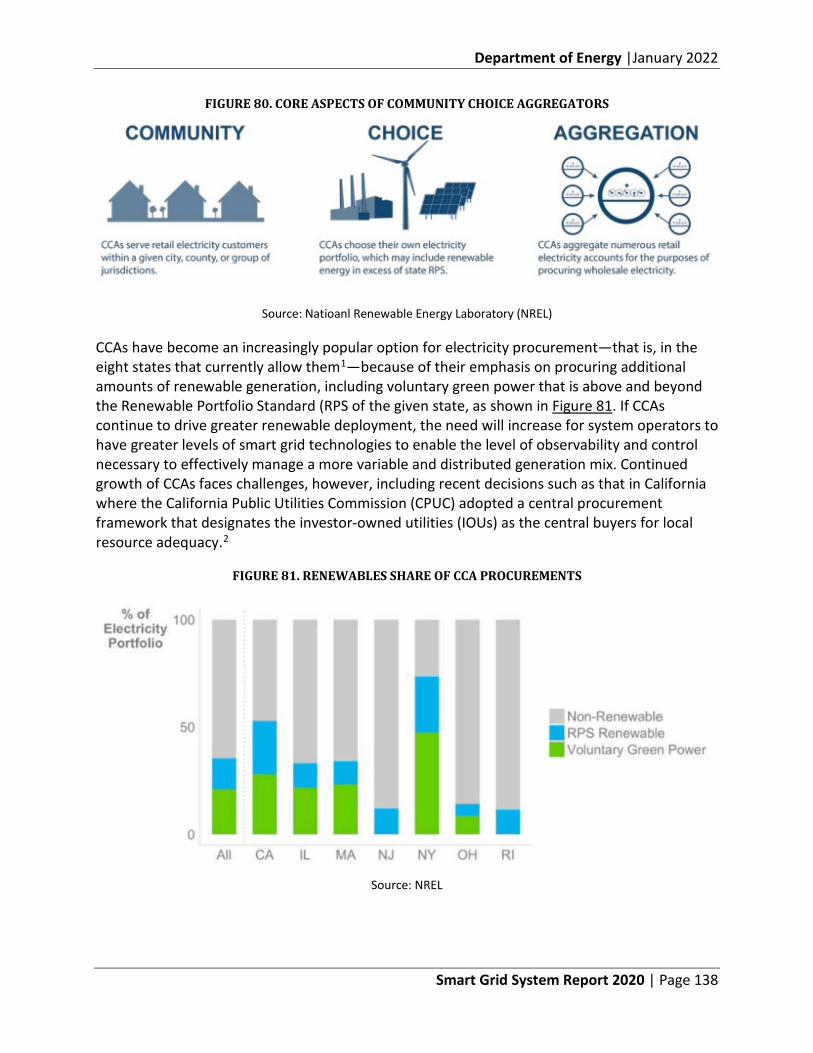
Department of Energy |January 2022
Smart Grid System Report 2020 | Page 138
FIGURE 80. CORE ASPECTS OF COMMUNITY CHOICE AGGREGATORS
Source: Natioanl Renewable Energy Laboratory (NREL)
CCAs have become an increasingly popular option for electricity procurement—that is, in the eight states that currently allow them1—because of their emphasis on procuring additional amounts of renewable generation, including voluntary green power that is above and beyond the Renewable Portfolio Standard (RPS of the given state, as shown in Figure 81. If CCAs continue to drive greater renewable deployment, the need will increase for system operators to have greater levels of smart grid technologies to enable the level of observability and control necessary to effectively manage a more variable and distributed generation mix. Continued growth of CCAs faces challenges, however, including recent decisions such as that in California where the California Public Utilities Commission (CPUC) adopted a central procurement framework that designates the investor-owned utilities (IOUs) as the central buyers for local resource adequacy.2
FIGURE 81. RENEWABLES SHARE OF CCA PROCUREMENTS
Source: NREL
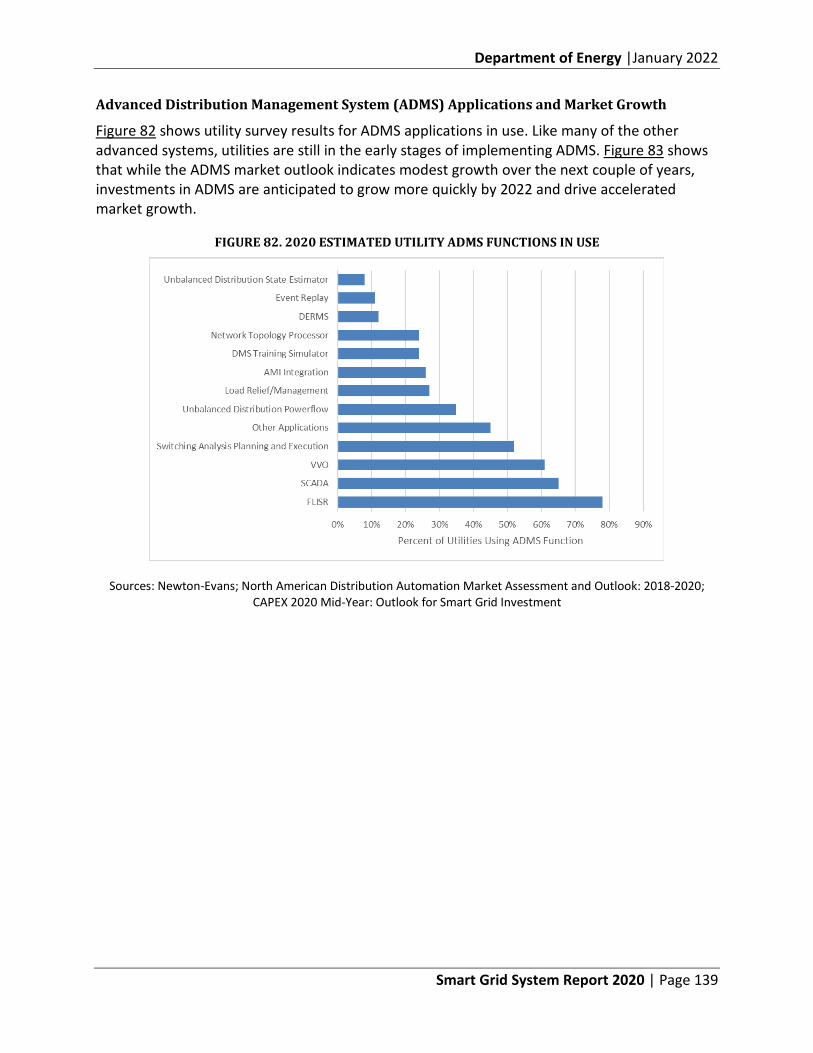
Department of Energy |January 2022
Smart Grid System Report 2020 | Page 139
Advanced Distribution Management System (ADMS) Applications and Market Growth
Figure 82 shows utility survey results for ADMS applications in use. Like many of the other advanced systems, utilities are still in the early stages of implementing ADMS. Figure 83 shows that while the ADMS market outlook indicates modest growth over the next couple of years, investments in ADMS are anticipated to grow more quickly by 2022 and drive accelerated market growth.
FIGURE 82. 2020 ESTIMATED UTILITY ADMS FUNCTIONS IN USE
Sources: Newton-Evans; North American Distribution Automation Market Assessment and Outlook: 2018-2020; CAPEX 2020 Mid-Year: Outlook for Smart Grid Investment
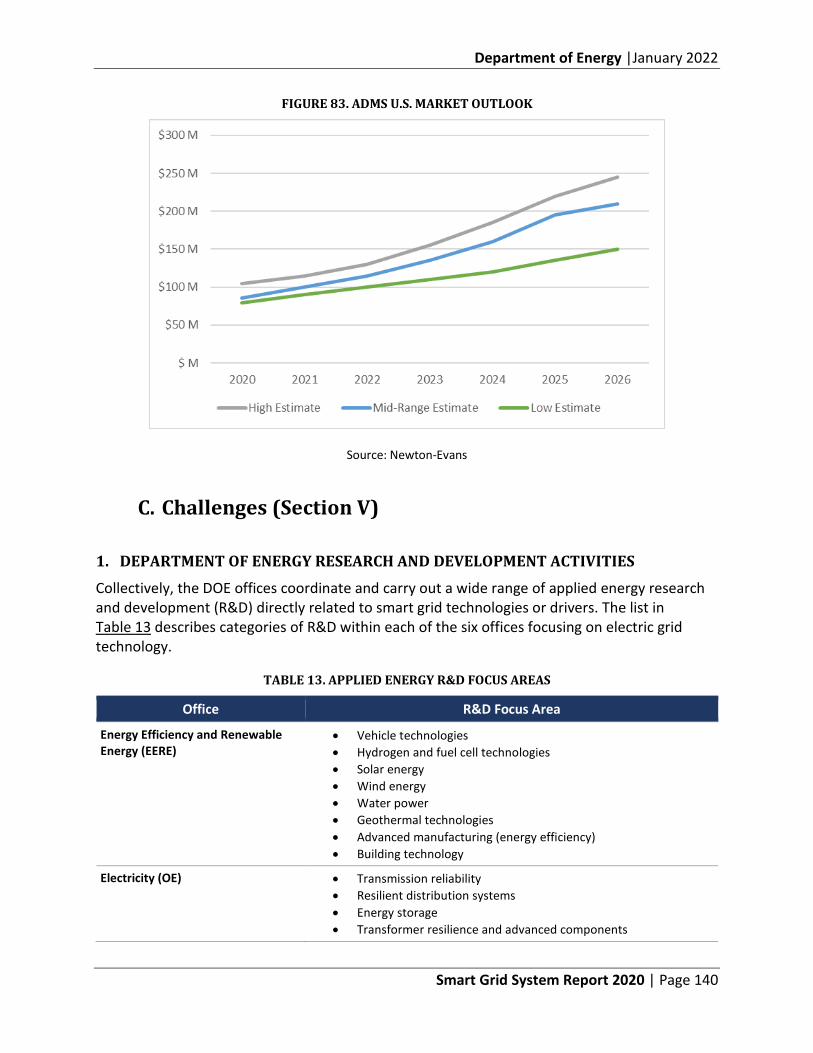
Department of Energy |January 2022
Smart Grid System Report 2020 | Page 140
FIGURE 83. ADMS U.S. MARKET OUTLOOK
Source: Newton-Evans
C. Challenges (Section V)
1. DEPARTMENT OF ENERGY RESEARCH AND DEVELOPMENT ACTIVITIES
Collectively, the DOE offices coordinate and carry out a wide range of applied energy research and development (R&D) directly related to smart grid technologies or drivers. The list in Table 13 describes categories of R&D within each of the six offices focusing on electric grid technology.
TABLE 13. APPLIED ENERGY R&D FOCUS AREAS
Office R&D Focus Area
Energy Efficiency and Renewable Energy (EERE)
• Vehicle technologies • Hydrogen and fuel cell technologies • Solar energy • Wind energy • Water power • Geothermal technologies • Advanced manufacturing (energy efficiency) • Building technology
Electricity (OE) • Transmission reliability • Resilient distribution systems • Energy storage • Transformer resilience and advanced components
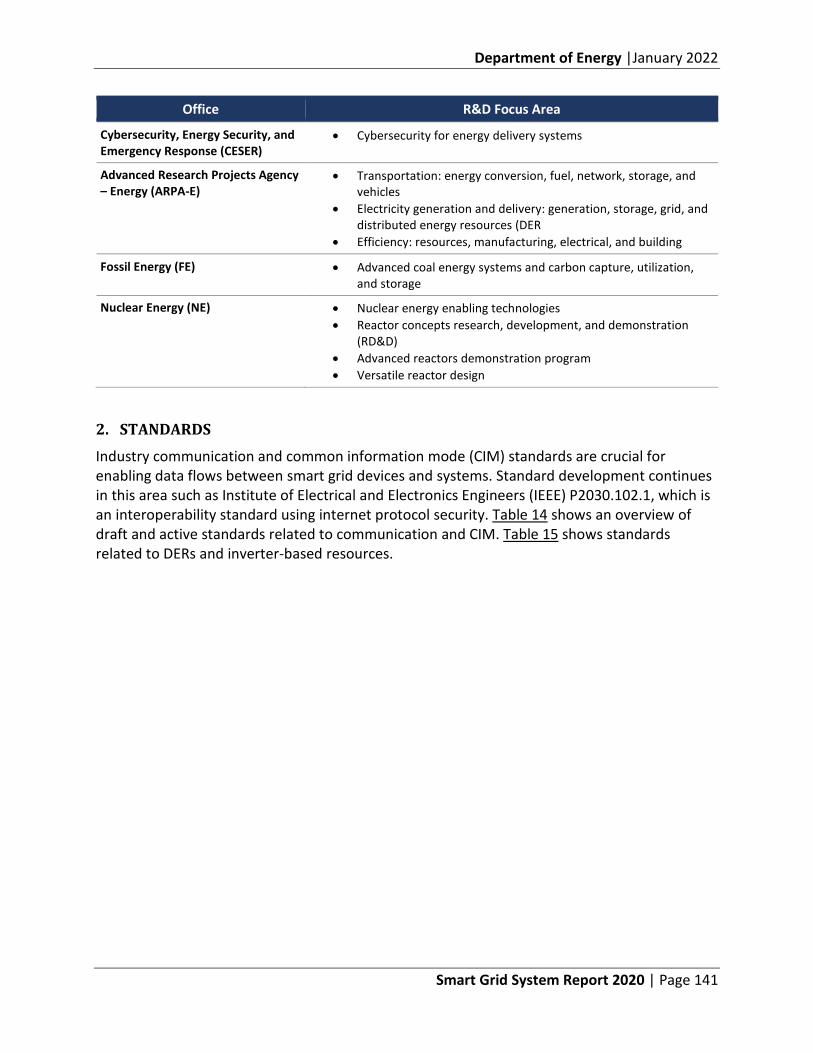
Department of Energy |January 2022
Smart Grid System Report 2020 | Page 141
Office R&D Focus Area
Cybersecurity, Energy Security, and Emergency Response (CESER)
• Cybersecurity for energy delivery systems
Advanced Research Projects Agency – Energy (ARPA-E)
• Transportation: energy conversion, fuel, network, storage, and vehicles
• Electricity generation and delivery: generation, storage, grid, and distributed energy resources (DER
• Efficiency: resources, manufacturing, electrical, and building
Fossil Energy (FE) • Advanced coal energy systems and carbon capture, utilization, and storage
Nuclear Energy (NE) • Nuclear energy enabling technologies • Reactor concepts research, development, and demonstration
(RD&D) • Advanced reactors demonstration program • Versatile reactor design
2. STANDARDS
Industry communication and common information mode (CIM) standards are crucial for enabling data flows between smart grid devices and systems. Standard development continues in this area such as Institute of Electrical and Electronics Engineers (IEEE) P2030.102.1, which is an interoperability standard using internet protocol security. Table 14 shows an overview of draft and active standards related to communication and CIM. Table 15 shows standards related to DERs and inverter-based resources.
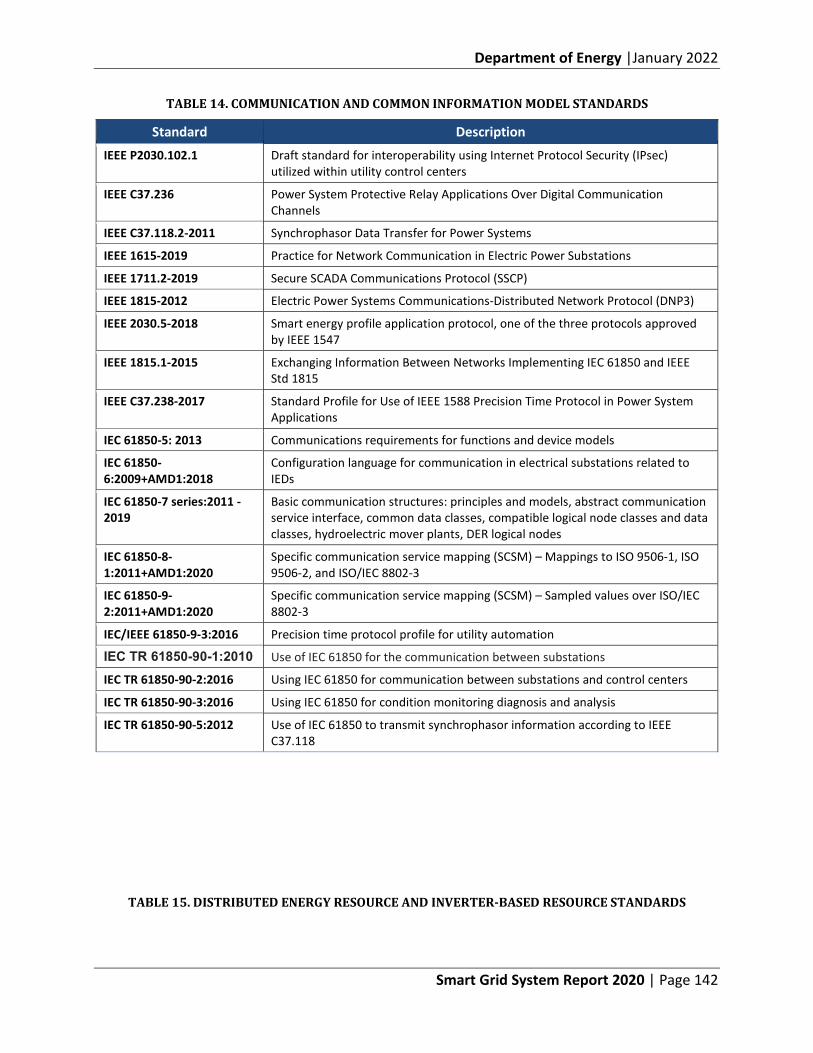
Department of Energy |January 2022
Smart Grid System Report 2020 | Page 142
TABLE 14. COMMUNICATION AND COMMON INFORMATION MODEL STANDARDS
Standard Description IEEE P2030.102.1 Draft standard for interoperability using Internet Protocol Security (IPsec)
utilized within utility control centers
IEEE C37.236 Power System Protective Relay Applications Over Digital Communication Channels
IEEE C37.118.2-2011 Synchrophasor Data Transfer for Power Systems
IEEE 1615-2019 Practice for Network Communication in Electric Power Substations
IEEE 1711.2-2019 Secure SCADA Communications Protocol (SSCP)
IEEE 1815-2012 Electric Power Systems Communications-Distributed Network Protocol (DNP3)
IEEE 2030.5-2018 Smart energy profile application protocol, one of the three protocols approved by IEEE 1547
IEEE 1815.1-2015 Exchanging Information Between Networks Implementing IEC 61850 and IEEE Std 1815
IEEE C37.238-2017 Standard Profile for Use of IEEE 1588 Precision Time Protocol in Power System Applications
IEC 61850-5: 2013 Communications requirements for functions and device models
IEC 61850-6:2009+AMD1:2018
Configuration language for communication in electrical substations related to IEDs
IEC 61850-7 series:2011 - 2019
Basic communication structures: principles and models, abstract communication service interface, common data classes, compatible logical node classes and data classes, hydroelectric mover plants, DER logical nodes
IEC 61850-8-1:2011+AMD1:2020
Specific communication service mapping (SCSM) – Mappings to ISO 9506-1, ISO 9506-2, and ISO/IEC 8802-3
IEC 61850-9-2:2011+AMD1:2020
Specific communication service mapping (SCSM) – Sampled values over ISO/IEC 8802-3
IEC/IEEE 61850-9-3:2016 Precision time protocol profile for utility automation
IEC TR 61850-90-1:2010 Use of IEC 61850 for the communication between substations
IEC TR 61850-90-2:2016 Using IEC 61850 for communication between substations and control centers
IEC TR 61850-90-3:2016 Using IEC 61850 for condition monitoring diagnosis and analysis
IEC TR 61850-90-5:2012 Use of IEC 61850 to transmit synchrophasor information according to IEEE C37.118
TABLE 15. DISTRIBUTED ENERGY RESOURCE AND INVERTER-BASED RESOURCE STANDARDS
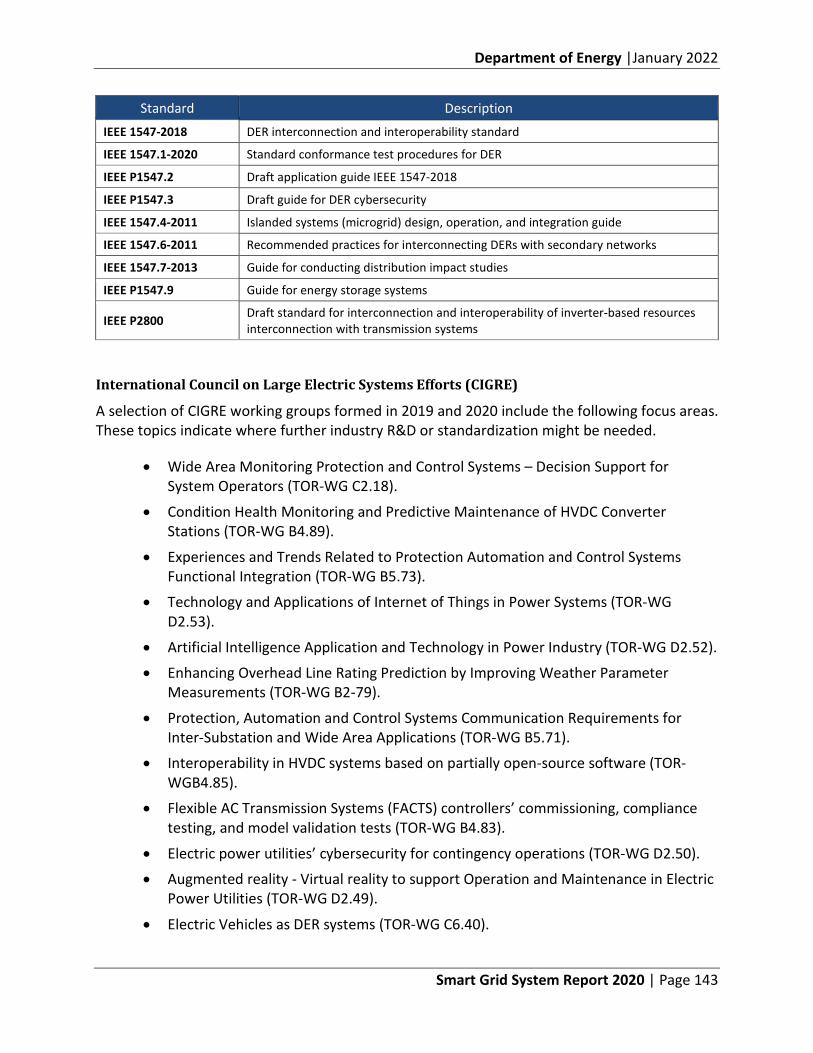
Department of Energy |January 2022
Smart Grid System Report 2020 | Page 143
Standard Description IEEE 1547-2018 DER interconnection and interoperability standard
IEEE 1547.1-2020 Standard conformance test procedures for DER
IEEE P1547.2 Draft application guide IEEE 1547-2018
IEEE P1547.3 Draft guide for DER cybersecurity
IEEE 1547.4-2011 Islanded systems (microgrid) design, operation, and integration guide
IEEE 1547.6-2011 Recommended practices for interconnecting DERs with secondary networks
IEEE 1547.7-2013 Guide for conducting distribution impact studies
IEEE P1547.9 Guide for energy storage systems
IEEE P2800 Draft standard for interconnection and interoperability of inverter-based resources interconnection with transmission systems
International Council on Large Electric Systems Efforts (CIGRE)
A selection of CIGRE working groups formed in 2019 and 2020 include the following focus areas. These topics indicate where further industry R&D or standardization might be needed.
• Wide Area Monitoring Protection and Control Systems – Decision Support for System Operators (TOR-WG C2.18).
• Condition Health Monitoring and Predictive Maintenance of HVDC Converter Stations (TOR-WG B4.89).
• Experiences and Trends Related to Protection Automation and Control Systems Functional Integration (TOR-WG B5.73).
• Technology and Applications of Internet of Things in Power Systems (TOR-WG D2.53).
• Artificial Intelligence Application and Technology in Power Industry (TOR-WG D2.52).
• Enhancing Overhead Line Rating Prediction by Improving Weather Parameter Measurements (TOR-WG B2-79).
• Protection, Automation and Control Systems Communication Requirements for Inter-Substation and Wide Area Applications (TOR-WG B5.71).
• Interoperability in HVDC systems based on partially open-source software (TOR-WGB4.85).
• Flexible AC Transmission Systems (FACTS) controllers’ commissioning, compliance testing, and model validation tests (TOR-WG B4.83).
• Electric power utilities’ cybersecurity for contingency operations (TOR-WG D2.50).
• Augmented reality - Virtual reality to support Operation and Maintenance in Electric Power Utilities (TOR-WG D2.49).
• Electric Vehicles as DER systems (TOR-WG C6.40).
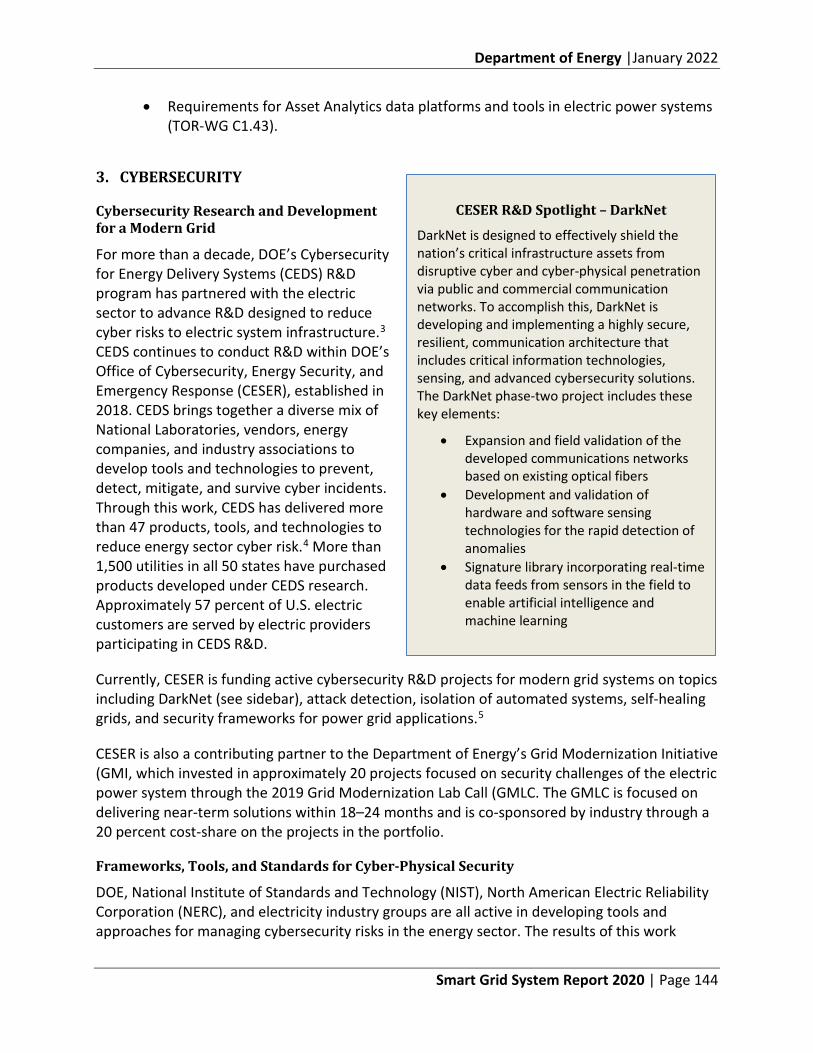
Department of Energy |January 2022
Smart Grid System Report 2020 | Page 144
• Requirements for Asset Analytics data platforms and tools in electric power systems (TOR-WG C1.43).
3. CYBERSECURITY
Cybersecurity Research and Development for a Modern Grid
For more than a decade, DOE’s Cybersecurity for Energy Delivery Systems (CEDS) R&D program has partnered with the electric sector to advance R&D designed to reduce cyber risks to electric system infrastructure.3 CEDS continues to conduct R&D within DOE’s Office of Cybersecurity, Energy Security, and Emergency Response (CESER), established in 2018. CEDS brings together a diverse mix of National Laboratories, vendors, energy companies, and industry associations to develop tools and technologies to prevent, detect, mitigate, and survive cyber incidents. Through this work, CEDS has delivered more than 47 products, tools, and technologies to reduce energy sector cyber risk.4 More than 1,500 utilities in all 50 states have purchased products developed under CEDS research. Approximately 57 percent of U.S. electric customers are served by electric providers participating in CEDS R&D.
Currently, CESER is funding active cybersecurity R&D projects for modern grid systems on topics including DarkNet (see sidebar), attack detection, isolation of automated systems, self-healing grids, and security frameworks for power grid applications.5
CESER is also a contributing partner to the Department of Energy’s Grid Modernization Initiative (GMI, which invested in approximately 20 projects focused on security challenges of the electric power system through the 2019 Grid Modernization Lab Call (GMLC. The GMLC is focused on delivering near-term solutions within 18–24 months and is co-sponsored by industry through a 20 percent cost-share on the projects in the portfolio.
Frameworks, Tools, and Standards for Cyber-Physical Security
DOE, National Institute of Standards and Technology (NIST), North American Electric Reliability Corporation (NERC), and electricity industry groups are all active in developing tools and approaches for managing cybersecurity risks in the energy sector. The results of this work
CESER R&D Spotlight – DarkNet
DarkNet is designed to effectively shield the nation’s critical infrastructure assets from disruptive cyber and cyber-physical penetration via public and commercial communication networks. To accomplish this, DarkNet is developing and implementing a highly secure, resilient, communication architecture that includes critical information technologies, sensing, and advanced cybersecurity solutions. The DarkNet phase-two project includes these key elements:
• Expansion and field validation of the developed communications networks based on existing optical fibers
• Development and validation of hardware and software sensing technologies for the rapid detection of anomalies
• Signature library incorporating real-time data feeds from sensors in the field to enable artificial intelligence and machine learning
Department of Energy |January 2022
Smart Grid System Report 2020 | Page 145
include models, frameworks, and standards available to organizations in the electric sector. This section covers some notable efforts to guide organizations toward more robust cyber practices. Standards development processes are typically lengthy, while cybersecurity risks can evolve rapidly.
Additional focus on advancing and harmonizing cybersecurity standards is needed to keep pace with the evolving threats, especially in fast-moving areas such as IoT.6 Further, utility and vendor adaption of available standards needs an increased focus moving forward. Organizations’ budgets for hiring and training cyber employees is a barrier to standards implementation. Nonutility ownership and control of assets increasingly crucial to grid reliability (e.g., DER, energy storage) poses yet another challenge for end-to-end cybersecurity. Third-party system integrations with utility systems offer an entry point for cyber intrusions, and third-parties are not mandated to comply with standards at the same level as utilities.
National Institute of Standards and Technology Cybersecurity Framework
NIST developed a Framework for Improving Critical Infrastructure Cybersecurity (Cybersecurity Framework).7 The framework provides a systematic process for organizations to identify, assess, and manage cybersecurity risk. NIST’s original mandate to develop the framework came from Executive Order (EO) 13636, “Improving Critical Infrastructure Cybersecurity” (February 2013) and was later formalized under the Cybersecurity Enhancement Act of 2014 (CEA). The framework has continued to evolve according to CEA, and Version 1.1 was released in April 2018. NIST’s earlier framework efforts to develop NISTIR 7628 a decade ago are still viewed as useful industry guides. Figure 84 describes the core functions of NIST’s cybersecurity framework.
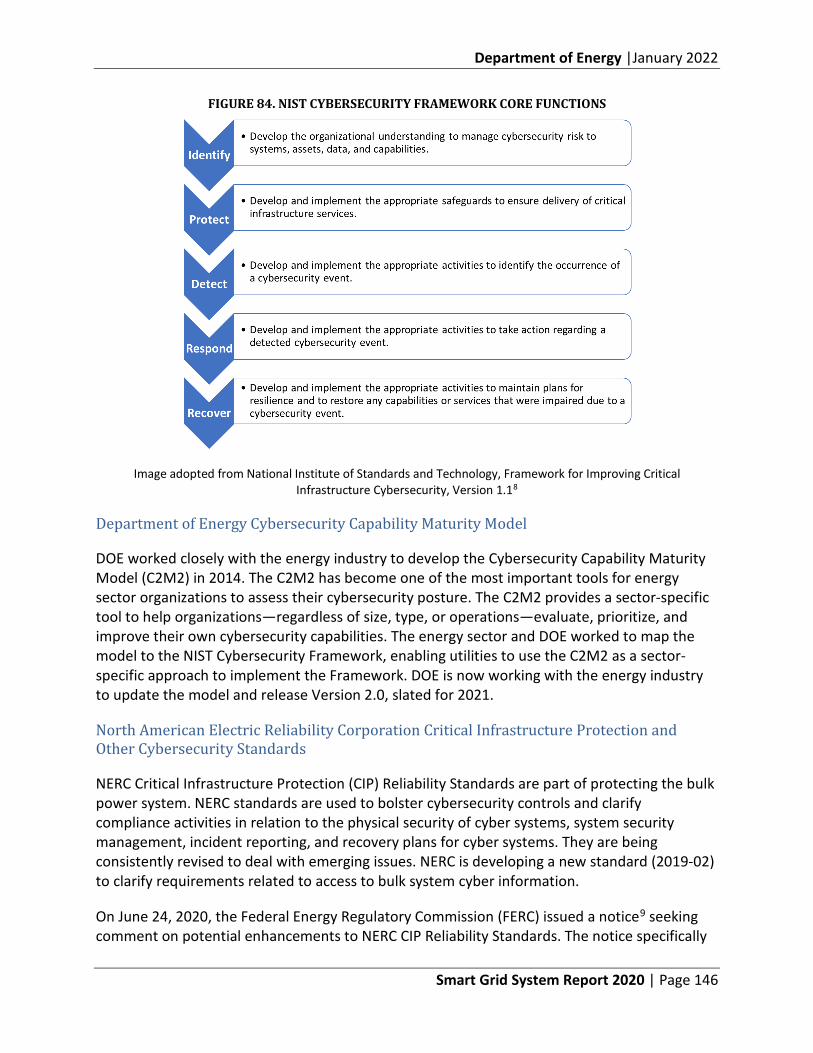
Department of Energy |January 2022
Smart Grid System Report 2020 | Page 146
FIGURE 84. NIST CYBERSECURITY FRAMEWORK CORE FUNCTIONS
Image adopted from National Institute of Standards and Technology, Framework for Improving Critical Infrastructure Cybersecurity, Version 1.18
Department of Energy Cybersecurity Capability Maturity Model
DOE worked closely with the energy industry to develop the Cybersecurity Capability Maturity Model (C2M2) in 2014. The C2M2 has become one of the most important tools for energy sector organizations to assess their cybersecurity posture. The C2M2 provides a sector-specific tool to help organizations—regardless of size, type, or operations—evaluate, prioritize, and improve their own cybersecurity capabilities. The energy sector and DOE worked to map the model to the NIST Cybersecurity Framework, enabling utilities to use the C2M2 as a sector-specific approach to implement the Framework. DOE is now working with the energy industry to update the model and release Version 2.0, slated for 2021.
North American Electric Reliability Corporation Critical Infrastructure Protection and Other Cybersecurity Standards
NERC Critical Infrastructure Protection (CIP) Reliability Standards are part of protecting the bulk power system. NERC standards are used to bolster cybersecurity controls and clarify compliance activities in relation to the physical security of cyber systems, system security management, incident reporting, and recovery plans for cyber systems. They are being consistently revised to deal with emerging issues. NERC is developing a new standard (2019-02) to clarify requirements related to access to bulk system cyber information.
On June 24, 2020, the Federal Energy Regulatory Commission (FERC) issued a notice9 seeking comment on potential enhancements to NERC CIP Reliability Standards. The notice specifically
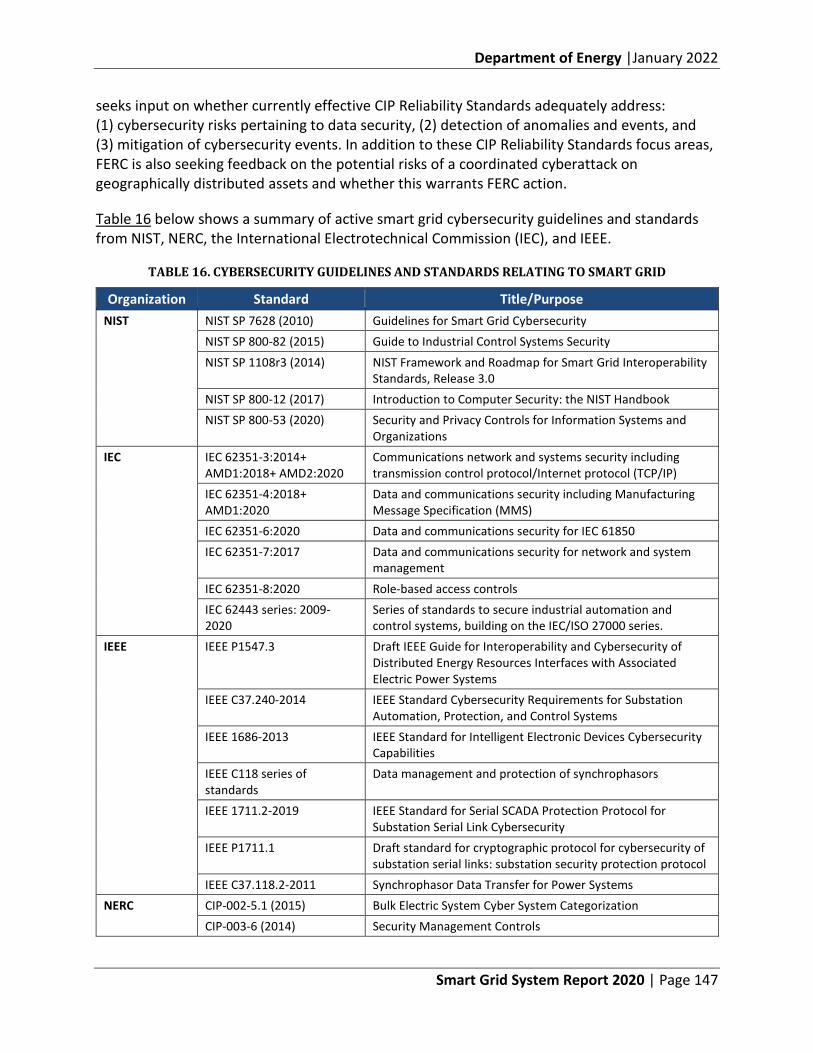
Department of Energy |January 2022
Smart Grid System Report 2020 | Page 147
seeks input on whether currently effective CIP Reliability Standards adequately address: (1) cybersecurity risks pertaining to data security, (2) detection of anomalies and events, and (3) mitigation of cybersecurity events. In addition to these CIP Reliability Standards focus areas, FERC is also seeking feedback on the potential risks of a coordinated cyberattack on geographically distributed assets and whether this warrants FERC action.
Table 16 below shows a summary of active smart grid cybersecurity guidelines and standards from NIST, NERC, the International Electrotechnical Commission (IEC), and IEEE.
TABLE 16. CYBERSECURITY GUIDELINES AND STANDARDS RELATING TO SMART GRID
Organization Standard Title/Purpose NIST NIST SP 7628 (2010) Guidelines for Smart Grid Cybersecurity
NIST SP 800-82 (2015) Guide to Industrial Control Systems Security NIST SP 1108r3 (2014) NIST Framework and Roadmap for Smart Grid Interoperability
Standards, Release 3.0 NIST SP 800-12 (2017) Introduction to Computer Security: the NIST Handbook NIST SP 800-53 (2020) Security and Privacy Controls for Information Systems and
Organizations IEC IEC 62351-3:2014+
AMD1:2018+ AMD2:2020 Communications network and systems security including transmission control protocol/Internet protocol (TCP/IP)
IEC 62351-4:2018+ AMD1:2020
Data and communications security including Manufacturing Message Specification (MMS)
IEC 62351-6:2020 Data and communications security for IEC 61850 IEC 62351-7:2017 Data and communications security for network and system
management IEC 62351-8:2020 Role-based access controls IEC 62443 series: 2009-2020
Series of standards to secure industrial automation and control systems, building on the IEC/ISO 27000 series.
IEEE IEEE P1547.3 Draft IEEE Guide for Interoperability and Cybersecurity of Distributed Energy Resources Interfaces with Associated Electric Power Systems
IEEE C37.240-2014 IEEE Standard Cybersecurity Requirements for Substation Automation, Protection, and Control Systems
IEEE 1686-2013 IEEE Standard for Intelligent Electronic Devices Cybersecurity Capabilities
IEEE C118 series of standards
Data management and protection of synchrophasors
IEEE 1711.2-2019 IEEE Standard for Serial SCADA Protection Protocol for Substation Serial Link Cybersecurity
IEEE P1711.1 Draft standard for cryptographic protocol for cybersecurity of substation serial links: substation security protection protocol
IEEE C37.118.2-2011 Synchrophasor Data Transfer for Power Systems NERC CIP-002-5.1 (2015) Bulk Electric System Cyber System Categorization
CIP-003-6 (2014) Security Management Controls
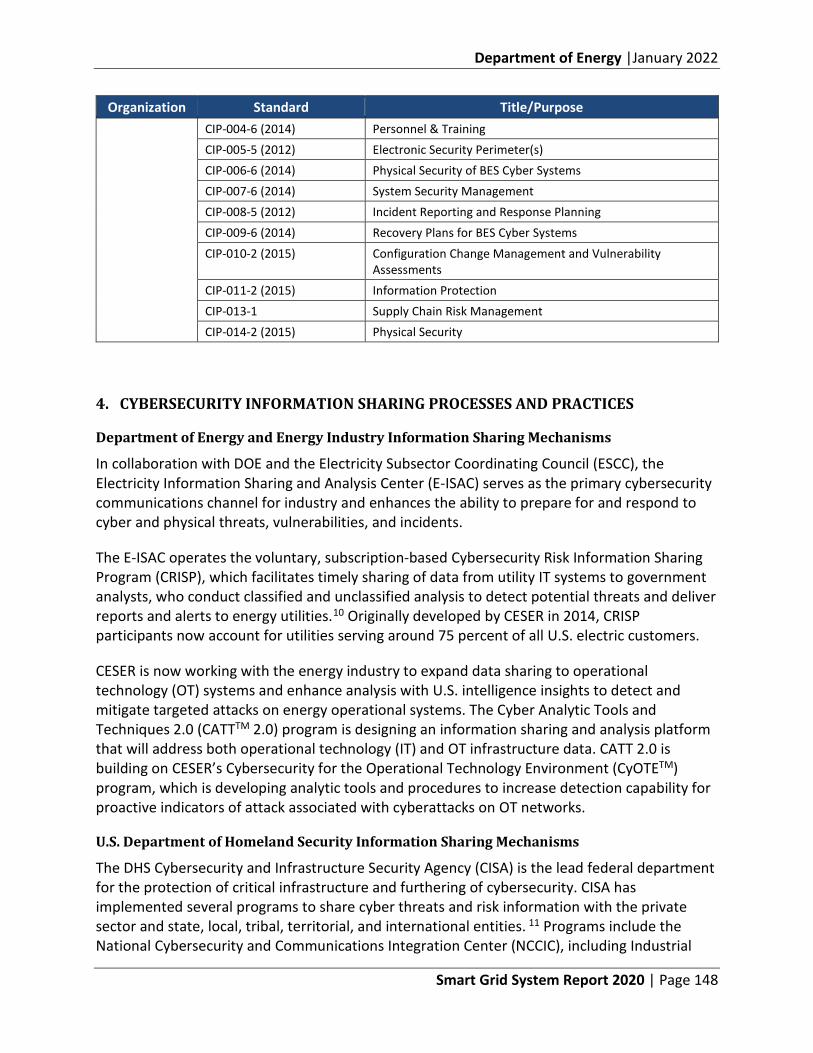
Department of Energy |January 2022
Smart Grid System Report 2020 | Page 148
Organization Standard Title/Purpose CIP-004-6 (2014) Personnel & Training CIP-005-5 (2012) Electronic Security Perimeter(s) CIP-006-6 (2014) Physical Security of BES Cyber Systems CIP-007-6 (2014) System Security Management CIP-008-5 (2012) Incident Reporting and Response Planning CIP-009-6 (2014) Recovery Plans for BES Cyber Systems CIP-010-2 (2015) Configuration Change Management and Vulnerability
Assessments CIP-011-2 (2015) Information Protection CIP-013-1 Supply Chain Risk Management CIP-014-2 (2015) Physical Security
4. CYBERSECURITY INFORMATION SHARING PROCESSES AND PRACTICES
Department of Energy and Energy Industry Information Sharing Mechanisms
In collaboration with DOE and the Electricity Subsector Coordinating Council (ESCC), the Electricity Information Sharing and Analysis Center (E-ISAC) serves as the primary cybersecurity communications channel for industry and enhances the ability to prepare for and respond to cyber and physical threats, vulnerabilities, and incidents.
The E-ISAC operates the voluntary, subscription-based Cybersecurity Risk Information Sharing Program (CRISP), which facilitates timely sharing of data from utility IT systems to government analysts, who conduct classified and unclassified analysis to detect potential threats and deliver reports and alerts to energy utilities.10 Originally developed by CESER in 2014, CRISP participants now account for utilities serving around 75 percent of all U.S. electric customers.
CESER is now working with the energy industry to expand data sharing to operational technology (OT) systems and enhance analysis with U.S. intelligence insights to detect and mitigate targeted attacks on energy operational systems. The Cyber Analytic Tools and Techniques 2.0 (CATTTM 2.0) program is designing an information sharing and analysis platform that will address both operational technology (IT) and OT infrastructure data. CATT 2.0 is building on CESER’s Cybersecurity for the Operational Technology Environment (CyOTETM) program, which is developing analytic tools and procedures to increase detection capability for proactive indicators of attack associated with cyberattacks on OT networks.
U.S. Department of Homeland Security Information Sharing Mechanisms
The DHS Cybersecurity and Infrastructure Security Agency (CISA) is the lead federal department for the protection of critical infrastructure and furthering of cybersecurity. CISA has implemented several programs to share cyber threats and risk information with the private sector and state, local, tribal, territorial, and international entities. 11 Programs include the National Cybersecurity and Communications Integration Center (NCCIC), including Industrial
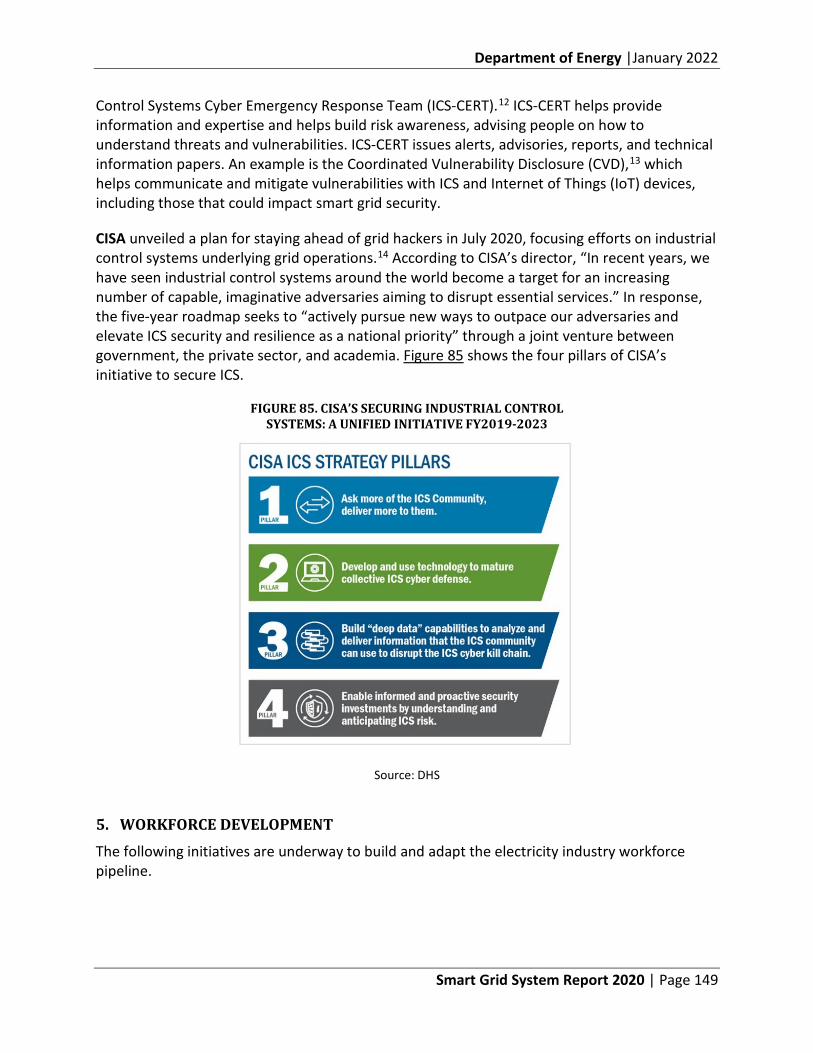
Department of Energy |January 2022
Smart Grid System Report 2020 | Page 149
Control Systems Cyber Emergency Response Team (ICS-CERT).12 ICS-CERT helps provide information and expertise and helps build risk awareness, advising people on how to understand threats and vulnerabilities. ICS-CERT issues alerts, advisories, reports, and technical information papers. An example is the Coordinated Vulnerability Disclosure (CVD),13 which helps communicate and mitigate vulnerabilities with ICS and Internet of Things (IoT) devices, including those that could impact smart grid security.
CISA unveiled a plan for staying ahead of grid hackers in July 2020, focusing efforts on industrial control systems underlying grid operations.14 According to CISA’s director, “In recent years, we have seen industrial control systems around the world become a target for an increasing number of capable, imaginative adversaries aiming to disrupt essential services.” In response, the five-year roadmap seeks to “actively pursue new ways to outpace our adversaries and elevate ICS security and resilience as a national priority” through a joint venture between government, the private sector, and academia. Figure 85 shows the four pillars of CISA’s initiative to secure ICS.
FIGURE 85. CISA’S SECURING INDUSTRIAL CONTROL SYSTEMS: A UNIFIED INITIATIVE FY2019-2023
Source: DHS
5. WORKFORCE DEVELOPMENT
The following initiatives are underway to build and adapt the electricity industry workforce pipeline.
Department of Energy |January 2022
Smart Grid System Report 2020 | Page 150
K-12 and University-Level Education
The Consortium of Universities for Sustainable Power (CUSP) was formed in 2006, with 235 U.S. universities as members, and has an electric energy systems (undergraduate and graduate) course content on its website.15 The curriculum is developed by experts in their respective fields and is open source. CUSP was created with funding from the National Science Foundation, Office of Naval Research, National Aeronautics and Space Administration, and the Electric Power Research Institute (EPRI).
The National Energy Education Development (NEED) project was launched by a congressional resolution in 1980 and continues to further the mission of promoting an energy-conscious and educated society. The NEED project provides a curriculum on a range of energy topics including energy transformations, energy sources, electricity, transportation fuels, and energy efficiency and conservation. More than 65,000 classrooms nationwide currently use NEED program resources.16
Through its GridEd initiative, EPRI has partnered with seven universities to form the GridEd collaborative educational initiative. The partner universities developed 10 new courses and modified 19 at both graduate and undergraduate levels based on identified gaps in power engineering curricula since 2013.
Courses studied by students include power systems analysis, power electronics, IoT for grid modernization, and market operation of power systems. GridEd’s student innovation board (SIB) consists of 13 universities and 41 student leaders from partner and affiliate universities. Partner universities have conducted outreach efforts, including the development of energy pathway curricula, seminars for high school students, and educational materials for middle school students.
Growing the Utility Workforce
In October 2018, DOE’s Solar Energy Technologies Office (SETO) announced that it would provide $7.9 million to seven projects focused on developing the solar workforce for the industry’s future needs. The projects were kicked off in June 2019.17
DOE’s Wind Energy Technologies Office has several initiatives in place to train and encourage participation in the wind industry, including:18
• The Wind Energy Workforce and Education Summit • Wind for Schools Project • Collegiate Wind Competition • North American Wind Energy Academy
Over the past decade, the Center for Energy Workforce Development (CEWD) has undertaken several initiatives to grow the utility workforce and to close a skills gap in occupations such as line workers, technicians, and operators. CEWD has developed the National Energy Education Network (NEEN). NEEN is a consortium of over 200 high schools, community colleges, and
Department of Energy |January 2022
Smart Grid System Report 2020 | Page 151
universities that have partnered with CEWD members to build education pathways that lead to the skills and competencies for the future grid. Other CEWD initiatives include:19
• Identifying critical jobs threatened by the impending retirements of older employees. • Determining the key skills required in jobs with the changing nature of technology • Specifying credentials. • Developing educational tools, curricula, and training toolkits in mathematics and
problem solving. • Documenting best practices for energy employers to engage with educators and
teachers.
Preparing the Workforce for Cyber Threats
Cybersecurity workforce development is a national priority outlined in the President’s National Cyber Strategy and Executive Order on America’s Cybersecurity Workforce (Executive Order 13870).
Through its CyberForce Competition, DOE seeks to identify and develop the next generation of cybersecurity professionals to secure the nation’s critical energy infrastructure.
In November 2019, DOE held its fifth CyberForce Competition hosted by 10 National Laboratories, which featured a professional-level pilot that included scoring to be considered in identifying highly qualified individuals for potential placement at DOE. In 2019, 105 collegiate teams from 32 states and Puerto Rico participated in the CyberForce Competition, a nearly 67 percent increase in participation over the previous year’s 63 teams from 24 states and Puerto Rico.
A final draft of NIST’s National Initiative for Cybersecurity Education (NICE) Cybersecurity Workforce Framework is planned for release in November 2020.20 First published in August 2017, the framework applies across the public, private, and academic sectors.21 NIST developed a range of cybersecurity guides that complement the framework.
Department of Energy |January 2022
Smart Grid System Report 2020 | Page 152
Section End
1 U.S. Environmental Protection Agency, Community Choice Aggregation, 2020. Available online at: https://www.epa.gov/greenpower/community-choice-aggregation#:~:text=Community%20choice%20aggregation%20(CCA)%2C,service%20from%20their%20existing%20utility. 2 CPUC, Decision on Central Procurement of the Resource Adequacy Program, Rulemaking 17-09-020, June 11, 2020. Available online at: https://docs.cpuc.ca.gov/PublishedDocs/Published/G000/M339/K814/339814622.PDF. 3 U.S. DOE, Cybersecurity for Energy Delivery Systems (CEDS) R&D Program, From Innovation to Practice: Re-designing Energy Delivery Systems to Survive Cyber Attacks, July 2018, available online at: https://www.energy.gov/sites/prod/files/2018/09/f55/CEDS%20From%20Innovation%20to%20Practice%20FINAL_0.pdf. 4 US DOE, Cybersecurity Research, Development and Demonstration (RD&D) for Energy Delivery Systems. Available online: https://www.energy.gov/ceser/activities/cybersecurity-critical-energy-infrastructure/cybersecurity-research-development-and. 5 Cybersecurity for Energy Delivery Systems (CEDS) Fact Sheets. Available online at: https://www.energy.gov/ceser/cybersecurity-energy-delivery-systems-ceds-fact-sheets. 6 Cyberwatching.eu, Cybersecurity Standards Gap Analysis, October 2018. Available online at: 7 National Institute of Standards and Technology, Cybersecurity Framework, Version 1.1, April 16, 2018, Available online at: https://cyberwatching.eu/sites/default/files/White-Paper-Cybersecurity-Standard-Gaps-Analysis_Cyberwatching.eu-October2018.pdf https://nvlpubs.nist.gov/nistpubs/CSWP/NIST.CSWP.04162018.pdf. 8 National Institute of Standards and Technology, Cybersecurity Framework, Version 1.1, April 16, 2018, Available online at: https://nvlpubs.nist.gov/nistpubs/CSWP/NIST.CSWP.04162018.pdf. 9 U.S. Federal Register, Potential Enhancements to the Critical Infrastructure Protection Reliability Standards, FERC, June 24, 2020. https://www.federalregister.gov/documents/2020/06/24/2020-13618/potential-enhancements-to-the-critical-infrastructure-protection-reliability-standards. 10 NERC, Electricity Information Sharing and Analysis Center. Available online at: https://www.nerc.com/pa/CI/ESISAC/Pages/default.aspx. 11 CISA, Information Sharing and Awareness. Available online at: https://www.cisa.gov/information-sharing-and-awareness. 12 CISA, Industrial Control Systems. Available online: https://www.us-cert.gov/ics. 13 CISA Coordinated Vulnerability Disclosure (CVD) Process. Available online at: https://www.cisa.gov/coordinated-vulnerability-disclosure-process. 14 CISA, Securing Industrial Control Systems: A Unified Initiative. July 2020. Available online at: https://www.cisa.gov/sites/default/files/publications/Securing_Industrial_Control_Systems_S508C.pdf. 15 Consortium of Universities for Sustainable Power. https://cusp.umn.edu/. 16 National Energy Education Development, P.E.E.P.2.0, Available online at: https://www.need.org/programs/peco/. 17 SETO FY2018 – Workforce Initiatives. 18 Keyser, David, and Suzanne Tegen. 2019. The Wind Energy Workforce in the United States: Training, Hiring, and Future Needs. Golden, CO: National Renewable Energy Laboratory. NREL/TP-6A20-73908. Available online at: https://www.nrel.gov/docs/fy19osti/73908.pdf. 19 Kerr, William, Michael Norris, and Manjari Raman. CEWD: Closing the Skills Gap. Harvard Business School Case 818-081, February 2018. (Revised May 2019). 20 NICE Cybersecurity Workforce Framework Resource Center, Latest Updates. Available online at: https://www.nist.gov/itl/applied-cybersecurity/nice/nice-cybersecurity-workforce-framework-resource-center/latest-updates.

Department of Energy |January 2022
Smart Grid System Report 2020 | Page 153
21 NIST, National Initiative for Cybersecurity Education (NICE) Cybersecurity Workforce Framework, August 2017. Available online at: https://nvlpubs.nist.gov/nistpubs/SpecialPublications/NIST.SP.800-181.pdf.

Department of Energy |January 2022
Smart Grid System Report 2020 | Page 154