surface charge microscopy: novel technique for mapping charge-mosaic surfaces in electrolyte...
TRANSCRIPT
Seediscussions,stats,andauthorprofilesforthispublicationat:https://www.researchgate.net/publication/5231003
SurfaceChargeMicroscopy:NovelTechniqueforMappingCharge-MosaicSurfacesinElectrolyteSolutions
ARTICLEinLANGMUIR·AUGUST2008
ImpactFactor:4.46·DOI:10.1021/la801269z·Source:PubMed
CITATIONS
31
READS
53
2AUTHORS:
XihuiYin
10PUBLICATIONS79CITATIONS
SEEPROFILE
JaroslawDrelich
MichiganTechnologicalUniversity
189PUBLICATIONS2,980CITATIONS
SEEPROFILE
Availablefrom:JaroslawDrelich
Retrievedon:03February2016

Published in Langmuir 24(15)(2008)8013-8020. Surface Charge Microscopy: Novel Technique for Mapping Charge-Mosaic Surfaces in
Electrolyte Solutions
Xihui Yin and Jaroslaw Drelich* Department of Materials Science and Engineering
Michigan Technological University Houghton, MI 49931, USA
Abstract
The effective surface potential, called zeta potential, is commonly determined from
electrophoretic mobility measurements for particles moving in a solution in response to an
electric field applied between two electrodes. The situation can be reversed and the solution can
be forced to flow through a plug of packed particles and the streaming potential of the particles is
calculated. A significant limitation of these electrokinetic measurements is that only an average
value of the zeta potential/streaming potential is measured — regardless of whether the surface
charge distribution is homogeneous or otherwise. However, in real-world situations, nearly all
solids (and liquids) of technological significance exhibit surface heterogeneities. To detect
heterogeneities in surface charge, analytical tools which provide accurate and spatially resolved
information about material surface potential — particularly at microscopic and sub-microscopic
resolutions — are needed.
In this study, atomic force microscopy (AFM) was used to measure the surface
interaction forces between a silicon nitride AFM cantilever and a multi-phase volcanic rock. The
experiments were conducted in electrolyte solutions with different ionic strengths and pH values.
The colloidal force measurements were carried out stepwise across the boundary between
adjacent phases. At each location, the force-distance curves were recorded. Surface charge
densities were then calculated by fitting the experimental data with a DLVO theoretical model.
Significant differences between the surface charge densities of the two phases and gradual
transitions in the surface charge density at the interface were observed. It is demonstrated that
this novel technique can be applied to examine one- and two-dimensional distributions of surface
* Corresponding author: [email protected]
1

potential.
Introduction
A novel AFM-based technique for mapping variations in the surface charge density and/or
surface potential on micro- and nano-scaled heterogeneous surfaces is introduced here. This
technique, which we call Surface Charge Microscopy, relies on recording colloidal force curves
over multiple locations on the substrate surface using small probes. The surface charge
characteristics of the heterogeneous substrate are determined from the recorded colloidal force
curves, allowing for the surface charge variation to be probed and mapped.
A number of techniques have been employed to measure the surface charge density and
surface potential (zeta potential, streaming potential, etc.). They are mainly based on
electrokinetic phenomena such as electrophoresis, electroosmosis, sedimentation, electroviscous
flow, etc., or titration.1,2 All of these techniques rely on examination of either a large population
of particles or large area of a substrate, with an end result that reflects an average value of the
substrate/particle surface charge. The primary disadvantage of all of the above-mentioned
techniques, therefore, is their inability to examine anisotropy in the substrate’s surface charge.
Anisotropy is common to many practical substrates; the new technique described in this paper
enables us to begin to quantify it.
Surface potential is one of the essential parameters used in describing dispersed systems and
has always been the focus of extensive research due to its importance in describing the stability
of suspensions and emulsions as well as in the control of flocculation, coalescence, aggregation,
flotation and other phase separation processes. Classical models of colloidal forces assume
2

homogeneity of the interacting surfaces and uniform distribution of surface charge/potential. In
real world situations, contrary to the assumptions in the classical models, almost all surfaces are
heterogeneous at macroscopic and/or microscopic levels.3 Heterogeneity can produce various
effects on the interaction forces between surfaces/particles and these effects depend on the spatial
arrangement of differently charged regions.4 Understanding and modeling of such effects are in
their infancy and significant progress is needed to correlate the extent and pattern of surface
heterogeneities with surface-surface interactions. It is very likely that the classical models on
colloidal forces will need to be re-written for systems involving heterogeneous surfaces, an
advancement that could elevate understanding and lead to better control over particle separation
processes. The technique discussed in this paper is a stepping stone in this direction.
Surface charge heterogeneity is common and can arise from several sources. In crystalline
materials, the occurrence of variation in surface charge is attributed to the imperfections in the
arrangement of ions in the crystal lattice. The surface charge heterogeneity often arises from
different functional groups on adjacent crystals and phases of anisotropic material. Specifically
in mineral materials, different oxygen-containing functional groups emerge on the surface when
the metal hydroxides or oxides are immersed in the electrolyte solution, and the affinities of the
functional groups to the ions are different.5 Further, almost all rocks and sediments are
multi-elemental materials (naturally-occurring inorganic composites) with phases of different
surface charge characteristics.4, 6-8 Besides mineral materials, there are other types of
heterogeneous systems.9 For instance, polyelectrolytes can form solid surfaces that are composed
of differently charged micro-areas. Polyelectrolyte multilayers can arrange into a sandwich-like
3

structure which allows various ionic groups to be non-uniformly distributed within the interface
region. Moreover, the interfaces composed of a charged substrate covered by charged particles
may also be considered another heterogeneous system.
To detect heterogeneities in surface charge, analytical tools which provide accurate and
spatially resolved information about material surface potential, particularly at microscopic and
sub-microscopic resolutions, are needed. Atomic force microscopy (AFM) is capable of
characterizing solid surfaces at such length scales by providing images of surfaces and probing
materials properties such as adhesion, elasticity, friction, and magnetic properties.10 The AFM is
also commonly used in the measurement of long-range and short-range surface forces for
microscopic particles through the colloidal probe technique.10-12 Nano-sized probes having
desirable chemical functionality are also frequently used in surface force measurements; such a
technique is known as chemical force microscopy.13 Analysis of AFM-measured forces, based
on the DLVO theory,14,15 can be used to either compare model predictions with experimental
results, or to calculate parameters such as the Hamaker constant, surface potential, or surface
charge density.
The determination of the surface charge through measurements of surface forces by the
AFM colloidal probe technique has been demonstrated for a number of different minerals.16-18
Although the technique discussed in this paper is based on these previous approaches, it expands
significantly beyond them. Firstly, instead of making a few force measurements at random
locations on the substrate surface, we show that the spatial variation of the probe-substrate
interaction can be recorded and appropriate line scans and two-dimensional maps of surface
4

potential can be constructed. Specifically, we have mapped the variation of surface charge
density and surface potential for a polished multi-phase rock specimen. The differences in
elemental compositions and structures among mineralogical phases are primarily responsible for
the non-uniform surface charge pattern of the specimen. Secondly, we have replaced 2-20 µm
probes with sharp tips. By doing that, resolution in the surface charge measurements has been
improved to 20-100 nm (~20 to 100 times improvement over the colloidal probe technique). A
drawback of the technique at this point is the increased error in calculated surface charge/surface
potential values, a result of a crude theoretical model describing the sharp tip-substrate forces.
Experimental
A multi-phase volcanic rock from a deposit near Duluth (Minnesota USA), known as Duluth
Gabbro, was used in this study. The specimen was wet-polished with a series of abrasive papers
and fine alumina powder. The polished sample was ultra-sonically cleaned in water and methanol
to remove alumina powder and organic contaminants, respectively, and dried prior to colloidal
force measurements or specimen’s characterization. Figure 1 shows the backscattered electron
image (BEI) of the rock taken with a JEOL 6400 scanning electron microscope at 20 kV
accelerating voltage. The image reveals several phases of different elemental composition. Major
phases of the rock include olivine (MgFe)2SiO4, feldspars: albite (NaAlSi3O8), orthoclase
(KAlSi3O8), and anorthite (CaAl2Si2O8), orthopyroxene (Mg,Fe)2Si2O6, clinopyroxene Ca(Mg,
Fe)Si2O6, amphibole ((Mg, Fe)7Si8O22(OH)2), ilmenite (FeTiO3), magnetite (Fe3O4), ulvospinel
(Fe2TiO4), mica (K, Mg, Fe, Al, Si) and quartz (SiO2).19 Plagioclase feldspar (albite and anorthite)
5

and clinopyroxene were the most commonly occurring phases in the polished specimen. Both
had similar topographic characteristics after polishing, and exhibited minimum damage at the
phase boundaries. For these reasons, only the regions near the boundary between these two
phases were selected for colloidal force measurements in this study. The elemental composition
of both clinopyroxene and plagioclase feldspar was confirmed with x-ray energy dispersive
spectroscopy (EDS) for each region used in colloidal force measurements (see Ref. (20) for
details).
Contact-mode silicon nitride (Si3N4) AFM cantilevers of a V-frame shape (Digital
Instruments, Santa Barbara, CA), having pyramidal-shaped tips and a spring constant of either
0.12 N/m or 0.58 N/m were used in this study. The apex curvature radius for each tip was
measured from images of the tip captured under the field emission scanning electron microscope
(S-4700 FE-SEM, Hitachi High Technologies America, Schaumburg, IL). The procedure for the
tip apex curvature measurement relied on fitting two circles to the size of the tip. The radii of
these two circles were determined and the average value, representing the size of the tip apex,
was calculated. As an example, a FE-SEM image of one of the tips used, together with two
circles fitting to the size of the tip apex, is shown in Figure 2.
The internal (uncoated) side of the AFM cantilever was used as a Si3N4 substrate (Digital
Instruments, Santa Barbara, CA) in measurements of Si3N4-Si3N4 colloidal forces and
determination of the surface charge density for Si3N4. It is expected, as per Albrecht et al.
[1990],21 that the surface characteristic of the uncoated cantilever matches that of Si3N4 tip. The
colloidal force measurements were carried out in 1 mM KCl solutions of varying pH using a
6

Nanoscope II AFM (Digital Instruments Inc) equipped with a fluid cell. Several random
locations on the silicon nitride substrate were selected during the force measurements. Surface
charge density and surface potential values reported in this paper are average values calculated
from several force curves after fitting the theoretical equations presented in the next section.
On the surface of the Duluth Gabbro specimen, the force measurements were conducted
across the boundaries of two phases, along 12 μm-long lines using a step size ranging from 0.2 to
1 μm. The step size was controlled by an offset adjustment in the software.
All the measurements were performed at a scan rate of 1 Hz, and captured at a resolution of
512 points/measurement. The force curves were then analyzed with SPIP software (Image
Metrology, Lyngby, Denmark), which converts the deflection-distance data to force-separation
curves. The additional processing of the force-distance curve included baseline correction and
hysteresis correction.
Theoretical Equations
Theoretical DLVO Model for a Conical Tip-Flat Substrate Geometry. The cantilevers used in
experiments had pyramidal shaped tips. The shape of the tip can be approximated as conical with
a spherical cap at its apex.22 The equations on DLVO forces (van der Waals plus electrostatic
forces) for such geometry were derived previously23 and only final equations are shown here:
- van der Waals forces:
12 2 2 21 1 1
( ) 2 1.0 sin tan (1 cos )6 3tan
vdW R D LA R D A R D RFL D L L
α α αα
+ − − − − −= − − +
(1)
7

- electrostatic force (constant surface charge density case):
( ) ( )( )
( )
1 1
1 1
22 2 20 1 2 32 2
0 0
2 22
1 20
4 2
4tan 2
L Ledl D DT S T S
T SL LT S
F a e a e a e a e
b e b e
κ κκ κ
κ κ
π πσ σ σ σε εκ ε εκ
σ σπ σ σε εκ α
− −− −
− −
= − + + − +
+ + +
(2)
where: L1=D+R(1-cosα), a0=κR-1, a1=κRcosα-1, a2=a0+0.5, and a3=a1+0.5
1 1(1 cos ) 1 1sintan tan
D Rb R Lααα α κ
+ − = − + +
2 1(1 cos ) 1 1sintan tan 2
D Rb R Lααα α κ
+ − = − + +
α and β are the geometrical angles for the spherical cap at the tip end and conical tip with
α+β=90°, D is the distance from the end of tip to the substrate, L is the distance between a
differential surface section of the tip and the substrate, r is the radius of the circle of the tip at a
given vertical position, R is the radius of the spherical cap at the tip end, ε is the dielectric
constant of the solution in this system, ε0 is the permittivity of vacuum, 1/κ is the Debye length, σ
is the surface charge density, and subscripts S and T refer to substrate and tip, respectively.
Surface Potential. Surface potential (Ψ) was calculated from the experimentally-determined
surface charge density (σ) values using the following set of equations:
0 exp( )iz ec ckT∞
Ψ= − (3)
2
002
c ckT
σεε∞− = (4)
02 2
kTce z
κεε∞ = (5)
8

where k is the Boltzmann constant, T is the temperature, e is the electronic charge, z is the
valency of the ions, c0 is the ionic concentration on the surface, and c∞ is the ionic concentration
in the bulk (at x=∞) where Ψ∞=0.
Results and Discussion
Determining charge regulation of Si3N4
Since the surface charge density of the cantilever’s tip (σT) is one of the important
parameters for the force curve fitting, it was necessary to determine this value prior to analysis of
the data for the Duluth Gabbro specimen. The colloidal forces were measured between the Si3N4
tip and Si3N4 cantilever in 1mM KCl of varying pH. Three examples of recorded force curves are
shown in Figure 3. In general, the repulsive forces dominated the interactions at all pH values
larger than pH=4 and they increased with increasing pH. At pH=4, the long-range electrostatic
forces were absent suggesting the appearance of an isoelectric point for silicon nitride near pH~4.
The experimental force curves were fitted with the DLVO theoretical model assuming that the
surface charge density of the tip equals the surface charge density of the substrate (σT=σS). As
shown in Figure 3, theoretical force curves fitted quite well with the experimental force curves,
particularly at separations larger than a few nanometers. The fitting parameter determined in this
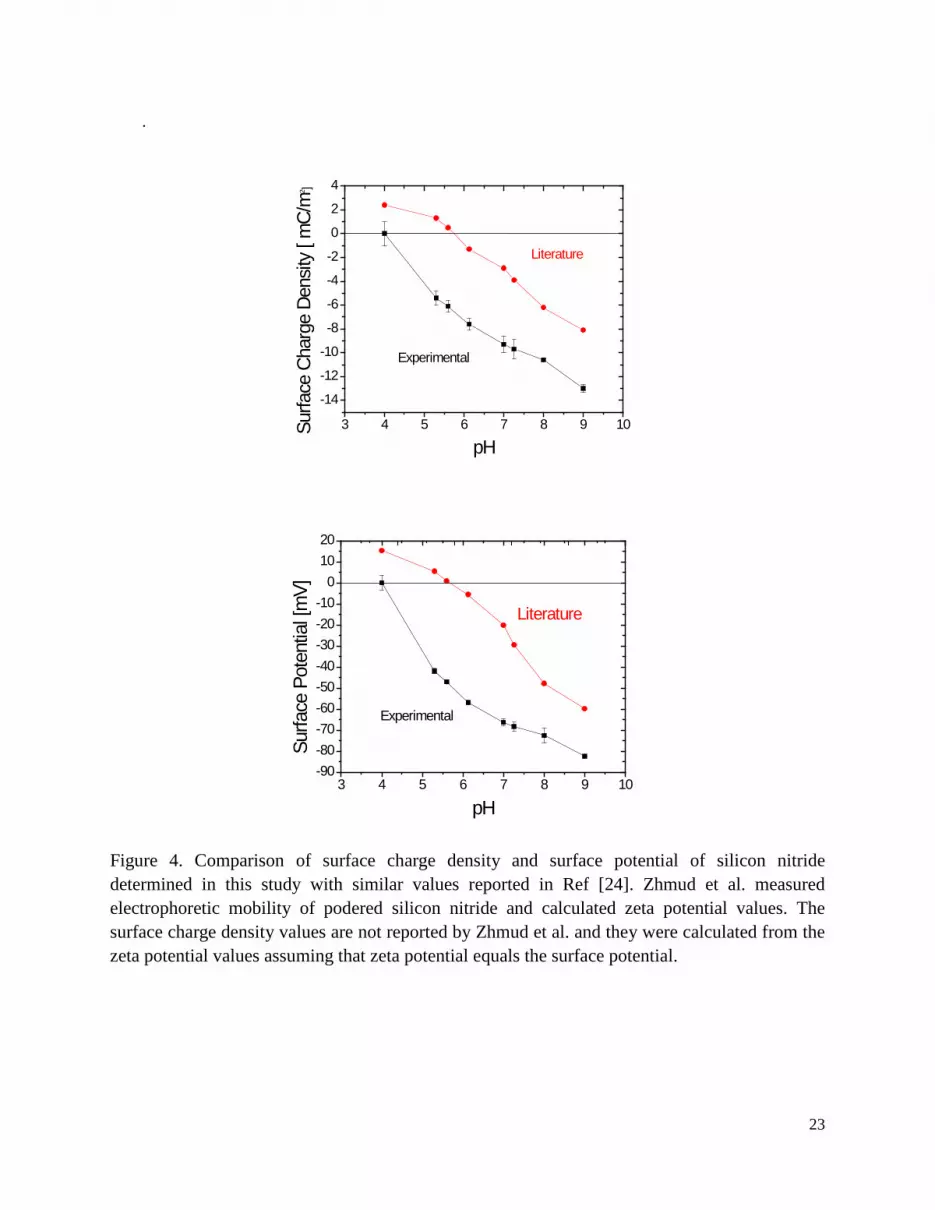
study, surface charge density of Si3N4, is plotted versus the pH value of the solution in Figure 4.
Figure 4 also shows the correlation between surface potential for Si3N4 and pH of solution. The
surface potential was calculated from surface charge density using equations (3) to (5).
Our surface charge density/surface potential results for silicon nitride are also compared to
9

the results obtained by Zhmud et al.24 during their electrokinetic studies of suspensions made of
Si3N4 powder (it should be noted here that Zhmud et al. measured zeta potential and the surface
charge density values presented in Figure 4 are those calculated by us from the reported zeta
potential values). As shown in Figure 4, the isoelectric point for silicon nitride obtained from
electrophoretic mobility measurements is about pH ~6, two pH units higher than the value
determined in our AFM-based studies. Usually, for a silicon nitride sample without any
pretreatment, the hydrolytic instability of the surface and its proneness to oxidation would lead to
a silica layer development on some parts of its surface. The existence of this silica layer may
lower the isoelectric point of the silicon nitride surface. The samples in Ref. (24) were etched in
solutions of HF, HCl, and KOH to remove the silica layer, while AFM tips and the substrates
used in this study were only cleaned from organic contaminants using organic solvents and UV
light. In addition, the surface of freshly exposed silicon nitride, after crushing and grinding, is
different than the surfaces of an AFM tip and cantilever, both aged in air-based atmosphere for
several weeks or longer. Finally, the crystallographic structure of the silicon nitride sample was
not identified in Ref. (24) nor was it determined for our AFM tips. It may be that they are not the
same type of crystalline material, with the same surface charge properties. Therefore, the
difference in surface charge characteristics of silicon nitride is expected. The surface charge
characteristics results produced by the colloidal probe technique in this study should be more
representative of silicon nitride tips used in AFM studies than powder used in Ref. (24).
Profile of surface charge density across two phases
10

Several regions with two phases, clinopyroxene (Ca(Mg, Fe)Si2O6) and plagioclase feldspar
(NaAlSi3O8 + CaAl2Si2O8), on the surface of Duluth Gabbro were selected for colloidal force
measurements. The elemental compositions of the phases were confirmed through x-ray EDS
analysis. The colloidal force measurements between the AFM Si3N4 tip and an individual phase
as well as across the phase-phase boundary were carried out in aqueous solutions of KCl at pH>5.
The isoelectric point for both clinopyroxene and plagioclase feldspars is located at pH<4.25
Therefore, the tip and both minerals were negatively charged in KCl solutions having pH>5 and
only repulsive forces were recorded. Two examples of force-separation curves are shown in
Figure 5. The results indicate stronger repulsive forces between the Si3N4 tip and clinopyroxene
than for plagioclase feldspar.
Theoretical fits such as in Figure 5 were common, suggesting good agreement between
experimental and theoretical forces, particularly at larger separations. At short separations, the
theoretical fitting curves deviated from the experimental curves. Stronger attractive interactions
were sometimes observed at 4-6 nm separations than could be anticipated from calculated van
der Waals forces. This discrepancy might be the result of an inaccurate Hamaker constant used in
this study. The average Hamaker constant for Duluth Gabbro of A123=3.46×10⁻²¹ J (A11
=16.2×10⁻²⁰J (Si3N4), A22=4.36×10⁻²⁰J (Duluth Gabbro), A33=3.7×10⁻²⁰J (Water)) was used. This
value was determined from advancing contact angles using the Fowkes’ approach.20,26 Further, a
deviation of the tip shape from the conical shape assumed in the theoretical model could
contribute to the discrepancies in experimental and theoretical forces as well; this includes the
roughness of the tip surface. Also, strong repulsive interactions were recorded at separations
11

below 1-2 nm. These short-range repulsions are attributed to a non-DLVO force called hydration
force which was not taken into account in the theoretical model used in this study.27
The colloidal forces were also measured across the phase boundaries on the surface of
Duluth Gabbro sample at 0.2 to 1 µm intervals per step using an operator-controlled offset
adjustment. The schematic of the stepwise measurements is shown in Figure 6 (A). The
force-separation curves at each location were recorded and they were fitted with DLVO
theoretical model under constant surface charge density condition. The radius for the tip apex
curvature was determined separately from the FE-SEM images of the tips and varied from 55 to
83 nm, depending on the tip.
Figure 6 (B,C) shows the distribution of surface charge density and corresponding surface
potential across one of the 12 μm-long phase boundaries. The surface charge density was
obtained from fitting the experimental data with the theoretical force curve and the surface
potential was calculated by the Graham equation. As shown in Figure 6, the surfaces of two
minerals had different surface charge densities and surface potentials. The surface charge density
for clinopyroxene is approximately -7.5 mC/m2 and it is -5.6mC/m2 for plagioclase feldspar. The
surface potentials calculated from the surface charge density values are -57 mV and -44 mV for
plagioclase feldspar and clinopyroxene, respectively. The solid lines on graphs are the trend lines
for the experimental data generated by the Origin software using a sigmoidal analysis. The
thickness of the interphase region was estimated as ~2μm which was marked using vertical
straight dotted lines in Figure 6. The error bars for the experimental data represent errors in curve
fitting.
12

In the AFM studies, a 10%-20% variation in the magnitude of colloidal forces is commonly
observed when doing the measurements on the same location.23 The variation of the results for
two minerals as shown in Figure 6 is within this range. The scattered points in the plagioclase
feldspar phase may be attributed to the small number of experimental points on the recorded
force curves. Additionally, since the spring constant of cantilever used in this study was from the
product specification provided by the manufacturer and not confirmed by independent
measurements, the error of measured colloidal forces can be 5%-10%.16 Further, the tip apex
curvature is another parameter which would affect the accuracy of the results. As per our
estimate, the error from determining the radius of tip curvature can be as high as 10%.
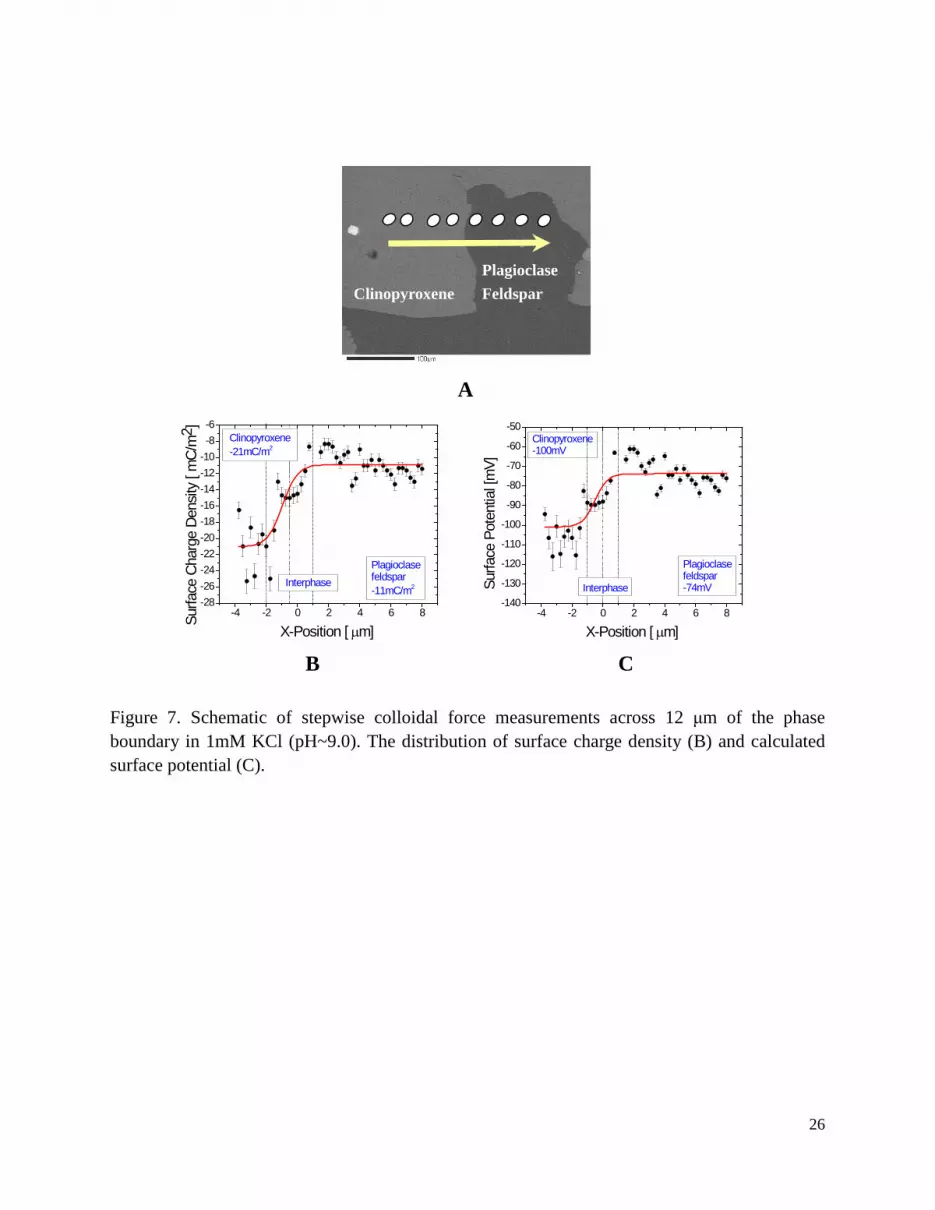
Figure 7 shows the results of surface charge density and calculated surface potential across
a different phase boundary (1 mM KCl, pH=9). The distance between consecutive measurements
was reduced to 250 nm. In this case, at each location, three force-separation curves were
recorded and then fitted with the calculated DLVO theoretical model. The results were averaged
to produce the graphs. As shown in Figure 7, a significant difference in surface charge density
and surface potential was observed for the two minerals. Specifically, the surface charge density
varied from -10 mC/m2 to -26 mC/m2 and the calculated surface potential ranged from -60 mV to
-120 mV.
Thickness of the interphase
As demonstrated in the previous section, colloidal force measurements with nano-sized
probes make it possible to record changes in surface charge and surface potential across phases
13

of heterogeneous surfaces and their boundaries. These changes can be tracked at sub-microscopic
resolution. The measurements of colloidal forces across phase boundaries revealed gradual
transitions in magnitude of these forces over the distances of up to a few micrometers. The width
of the transition region between one phase and another was measured using the surface charge
density versus x-position curve (i.e., Figures 6 and 7). This transition region is called
“interphase” in this paper.
The thickness of the interphase was measured from the results of surface charge distribution
and was determined as the distance between the first point representing surface charge density
for clinopyroxene and the point representing surface charge of plagioclase feldspar. This distance
is marked by the dashed lines in Figures 6 and 7. Several surface charge density versus
x-position curves were recorded for solutions having various KCl concentration,20 from which
the thickness of the interphase was measured. The average values were then plotted versus the
Debye length (κ-1) of electrolyte solution (Figure 8). The Debye length, which is a function of
ionic strength, represents the thickness of the electric double layer. In an electrolyte solution, the
double layer is compressed with increasing ionic strength.
As shown in Figure 8, the thickness of the interphase increases with the increasing Debye
length suggesting a deteriorating effect of increasing electric double layer thickness on the
resolution of colloidal force microscopy. However, the thickness of the interphase measured for
different KCl solutions appears to be much larger than the resolution of the technique. We expect
that the limiting resolution of the colloidal force microscopy is on the order of a diameter of the
tip apex curvature plus up to about two values of the Debye length (resolution ~ 2R/κ). Since the
14
cantilever tips used were relatively sharp with the radius (R) of apex curvature on the order of
55-83 nm, the thickness of the interphase from 1.5 to 4 µm cannot explain the correlation in
Figure 8. The results clearly point out to the (lateral) interphase between two minerals that is
much thicker than the possible range of interactions between the tip and phases. This suggests
that there is a much broader disturbance of the electrolyte composition above the interphase than
the electric double layer model predicts for the liquid above a homogeneous surface.
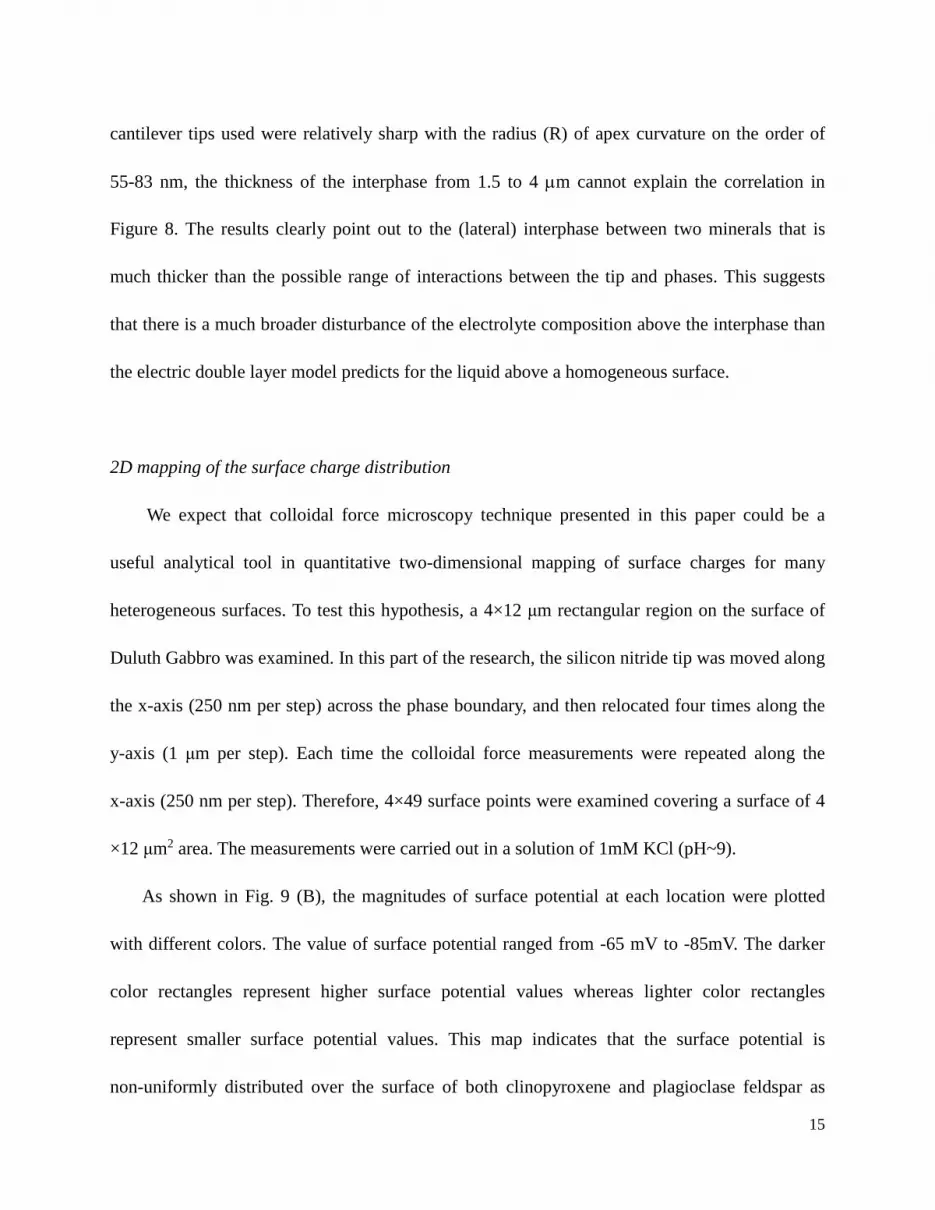
2D mapping of the surface charge distribution
We expect that colloidal force microscopy technique presented in this paper could be a
useful analytical tool in quantitative two-dimensional mapping of surface charges for many
heterogeneous surfaces. To test this hypothesis, a 4×12 μm rectangular region on the surface of
Duluth Gabbro was examined. In this part of the research, the silicon nitride tip was moved along
the x-axis (250 nm per step) across the phase boundary, and then relocated four times along the
y-axis (1 μm per step). Each time the colloidal force measurements were repeated along the
x-axis (250 nm per step). Therefore, 4×49 surface points were examined covering a surface of 4
×12 μm2 area. The measurements were carried out in a solution of 1mM KCl (pH~9).
As shown in Fig. 9 (B), the magnitudes of surface potential at each location were plotted
with different colors. The value of surface potential ranged from -65 mV to -85mV. The darker
color rectangles represent higher surface potential values whereas lighter color rectangles
represent smaller surface potential values. This map indicates that the surface potential is
non-uniformly distributed over the surface of both clinopyroxene and plagioclase feldspar as
15

well as along the interphase. It also shows that the surface potential for clinopyroxene is
generally higher than for plagioclase feldspar, consistent with the results presented in the
previous section. The interphase region is located at the center of the x-axis. Although there is a
scatter of the surface potential values, the interphase still can be clearly recognized. Figure 9 (C)
shows the same map of surface potential values but plotted using the values from the surface
potential versus position trend lines. Such electronic smoothing of the map improves the quality
of the map. Other forms of data processing such those utilized in processing AFM topographic or
compositional images is possible, and will be explored in a future.
Conclusions
We have proposed a novel AFM-based technique for detecting the variation of surface
charge density and surface potential with a high spatial resolution on heterogeneous surfaces. In
this study, colloidal forces between the silicon nitride AFM cantilevers with pyramidal-shape tips
and a multi-phase mineral substrate (Duluth Gabbro) were measured in aqueous solutions of
varying KCl concentration and pH. Stepwise measurements were carried out across boundaries
of adjacent phases, and the stepwise movement was controlled by an offset adjustment in the
AFM software. The force-distance curves recorded at each substrate location were fitted with the
DLVO theoretical model which combines the electrical double layer and van der Waals forces for
conical tip-flat substrate geometry. The charge regulation of silicon nitride with varying pH value
and the average Hamaker constant for the multi-phase mineral sample were determined prior to
analysis of the data. The surface charge density of the substrate was determined from the force
16
curve fitting, and the substrate’s surface potential was then calculated using the Graham
equation.
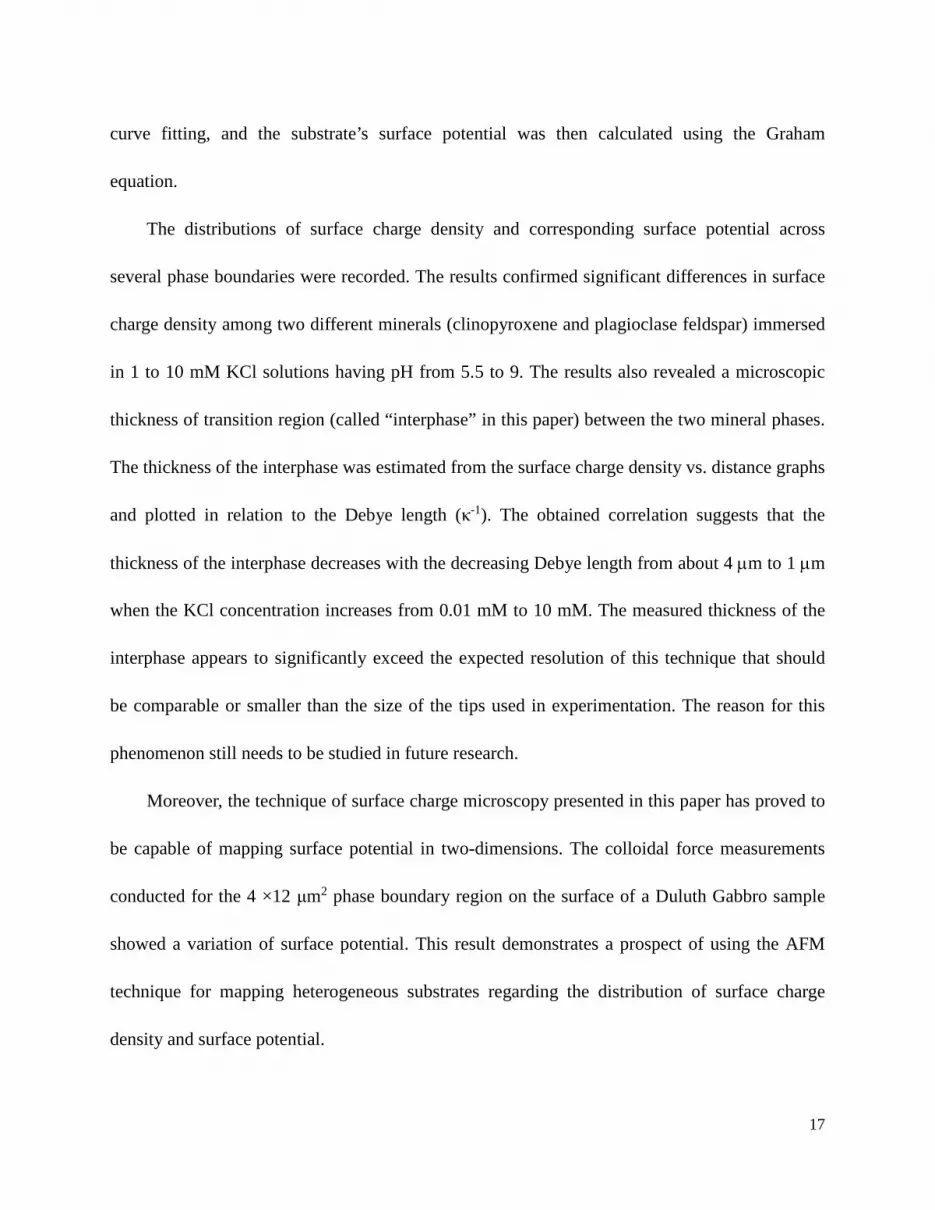
The distributions of surface charge density and corresponding surface potential across
several phase boundaries were recorded. The results confirmed significant differences in surface
charge density among two different minerals (clinopyroxene and plagioclase feldspar) immersed
in 1 to 10 mM KCl solutions having pH from 5.5 to 9. The results also revealed a microscopic
thickness of transition region (called “interphase” in this paper) between the two mineral phases.
The thickness of the interphase was estimated from the surface charge density vs. distance graphs
and plotted in relation to the Debye length (κ-1). The obtained correlation suggests that the
thickness of the interphase decreases with the decreasing Debye length from about 4 µm to 1 µm
when the KCl concentration increases from 0.01 mM to 10 mM. The measured thickness of the
interphase appears to significantly exceed the expected resolution of this technique that should
be comparable or smaller than the size of the tips used in experimentation. The reason for this
phenomenon still needs to be studied in future research.
Moreover, the technique of surface charge microscopy presented in this paper has proved to
be capable of mapping surface potential in two-dimensions. The colloidal force measurements
conducted for the 4 ×12 μm2 phase boundary region on the surface of a Duluth Gabbro sample
showed a variation of surface potential. This result demonstrates a prospect of using the AFM
technique for mapping heterogeneous substrates regarding the distribution of surface charge
density and surface potential.
17

Acknowledgments
Financial support from the Michigan Technological University Department of Materials Science and Engineering is greatly appreciated. The authors appreciate comments from Prof. Calvin L. White and editorial corrections from Ms. Allison Hein. REFERENCES (1) Adamson, A. W.; Gast, A. P. Physical Chemistry of Surface, 6th ed.; John Wiley & Sons, Inc.; New York, 1997. (2) Masliyah, J. H.; Bhattacharjee, S. Electrokinetic and Colloid Transport Phenomena, John Wiley & Sons, Inc.; Hoboken, NJ, 2006. (3) Drelich, J. Polish Journal of Chemistry. 1997, 71, 525-549. (4) Walz, J. Y. Advances in Colloid and Interface Scienc. 1998, 74, 119-168. (5) Hiemstra, T.; Van Riemsdijk, W. H.; BoltMultisite, G. H. Journal of colloid and interface science. 1989, 133, 91-105. (6) Schuhmann, D. Journal of Colloid and Interface Science. 1984, 97, 541-551. (7) Song, L.; Johnson, P. R.; Elimelech, M. Environmental Science and Technology. 1994, 28, 1164-1171. (8) Johnson, P. R.; Sun, N.; Elimelech, M. Environmental Science and Technology. 1996, 30, 3284-3293. (9) Zembala, M. Advances in Colloid and Interface Science. 2004, 112, 59-92. (10) Drelich, J.; Mittal, K. L. (Eds), Atomic Force Microscopy in Adhesion Studies; VSP; Leiden-Boston, 2005. (11) Ducker, W.A.; Senden, T. J.; Pashley, R. M. Nature.1991, 353, 239-241. (12) Butt, H.-J.; Cappella, B.; Kappl, M. Surf. Sci. Reports. 2005, 59, 1-152. (13) Vezenov, D.V.; Noy, A.; Ashby, P. in “Atomic Force Microscopy in Adhesion Studies,” J. Drelich and K.L. Mittal (Eds), VSP, Leiden-Boston (2005), pp. 189-240. (14) Derjaguin, B. V.; Landao, L. Acta Physicochem. URSS. 1941, 14, 633-662. (15) Verwey, E. J. W.; Overbeek, J. Th. G.. Theory of stability of lyophobic colloids; Elsevier; Amsterdam, 1948. (16) Veeramasuneni, S.; Yalamanchili, M. R.; Miller, J. D. Journal of colloid and Interface Science. 1996, 184, 594–600. (17) Larson, I.; Drummond, C. J.; Chan, D. Y. C.; Grieser, F. Langmuir. 1997, 13, 2109-2112. (18) Assemi, S.; Nalaskowski, J.; Miller, J. D.; Johnson, W. P. Langmuir. 2006, 22, 1403-1405. (19) Bonnichsen, B. Econ.Geo. 1975, 70, 319-340. (20) Yin, X. Mapping surface domains having different surface potential using atomic force microscopy, M.S. Thesis, Department of Materials Science and Engineering, Michigan Technological University, Houghton, MI 2008. (21) Albrecht, T. R.; Akamine, S.; Carver, T. E.; Quate, C. F. J. Vac. Sci. Technol. A. 1990, 8, 3386-3396. (22) Drelich, J.; Long, J.; Xu, Z.; Masliyah, J.; White, C.L. Journal of Colloid and Interface
18

Science. 2006, 303(2), 627-638. (23) Drelich, J.; Long, J.; Yeung, A. The Canadian Journal of Chemical Engineering. 2007, 85, 625-634. (24) Zhmud, B. V.; Sonnefeld, J.; Bergström, L. Colloids and Surfaces, 1999, 158, 327-341. (25) King, R. P. Principles of floatation; Johannesburg, 1982. (26) Fowkes, F. M. Industrial and Engineering Chemistry. 1964, 56, 40-52. (27) Israelachvili, J. N.; Adams, G. E. J. Chem Soc. Faraday Trans., 1978, 74, 975-1001.
19

Figure 1. The backscattered electron image of the polished multi-phase rock (Duluth Gabbro) used in this study.
20

Figure 2. The FE-SEM image of one of the AFM cantilever tips used in this study with two circles added that represent minimum and maximum curvature of the tip apex.
21

0 10 20 30 40 50-0.20.00.20.40.60.81.01.21.41.61.82.0
Forc
e [n
N]
Separation [nm]
pH 4.0
0 10 20 30 40 50-0.20.00.20.40.60.81.01.21.41.61.82.0
Forc
e [n
N]
Separation [nm]
pH 6.0
0 10 20 30 40 50-0.20.00.20.40.60.81.01.21.41.61.82.0
Forc
e [n
N]
Separation [nm]
pH 9.0
Figure 3. Examples of force-separation curves for the Si3N4 tip - Si3N4 substrate system in 1mM
KCl of varying pH: 4, 6, and 9. The solid lines represent theoretical fits.
22
.
3 4 5 6 7 8 9 10
-14
-12
-10
-8
-6
-4
-2
0
2
4
Literature
Surfa
ce C
harg
e De
nsity
[m
C/m
2 ]
pH
Experimental
3 4 5 6 7 8 9 10-90-80-70-60-50-40-30-20-10
01020
Experimental
Surfa
ce P
oten
tial [
mV]
pH
Literature
Figure 4. Comparison of surface charge density and surface potential of silicon nitride determined in this study with similar values reported in Ref [24]. Zhmud et al. measured electrophoretic mobility of podered silicon nitride and calculated zeta potential values. The surface charge density values are not reported by Zhmud et al. and they were calculated from the zeta potential values assuming that zeta potential equals the surface potential.
23

Figure 5. Examples of force-separation curves recorded for clinopyroxene (A) and plagioclase feldspars (C) in 1 mM KCl (pH 5.8). (B) Backscattered electron image of one of the surface regions selected for colloidal force measurements.
0 10 20 30 40 50-0.2
0.0
0.2
0.4
0.6
0.8
1.0
Forc
e [n
N]
Separation [nm]
A
0 10 20 30 40 50-0.2
0.0
0.2
0.4
0.6
0.8
1.0
C
B
24

-6 -4 -2 0 2 4 6-9.0-8.5-8.0-7.5-7.0-6.5-6.0-5.5-5.0-4.5-4.0
Clinopyroxene-7.5 mC/m2
Plagioclasefeldspar-5.6 mC/m2
Surfa
ce C
harg
e De
nsity
[m
C/m
2 ]
X-Position [ µm]
interphase
-6 -4 -2 0 2 4 6-65
-60
-55
-50
-45
-40
-35Clinopyroxene-57 mV
Plagioclasefeldspar-44 mVInterphase
Surfa
ce P
oten
tial [
mV]
X-Position [ µm]
Figure 6. Schematic of stepwise colloidal force measurements across 12 μm of the phase boundary in 1mM KCl (pH~5.8). The distribution of surface charge density (B) and calculated surface potential (C).
AFM Tip
A
B C
Phase 1 Phase 2
25
-4 -2 0 2 4 6 8-28-26-24-22-20-18-16-14-12-10-8-6
Plagioclasefeldspar-11mC/m2
Surfa
ce C
harg
e De
nsity
[m
C/m
2 ]
X-Position [ µm]
Interphase
Clinopyroxene-21mC/m2
-4 -2 0 2 4 6 8-140
-130
-120
-110
-100
-90
-80
-70
-60
-50Clinopyroxene-100mV
Plagioclasefeldspar-74mV
Surfa
ce P
oten
tial [
mV]
X-Position [ µm]
Interphase
Figure 7. Schematic of stepwise colloidal force measurements across 12 μm of the phase boundary in 1mM KCl (pH~9.0). The distribution of surface charge density (B) and calculated surface potential (C).
Clinopyroxene Plagioclase Feldspar
A
B C
26

0 5 10 15 20 25 30 351.0
1.5
2.0
2.5
3.0
3.5
4.0
4.5
10 mM5 mM
1 mM
Thick
ness
of I
nter
phas
e [µ
m]
Debye Length [nm]
KCl solutions
0.01 mM
Figure 8. Measured interphase thickness at various electrolyte concentrations versus Debye length (κ-1).
27

Figure 9. Topographic image of examined phase boundary under the magnification of 300X (left) and 1500X (right) (A), map of surface potential in a 4×12 μm rectangular region (B), map of surface potential using the calculated trend lines (C).
+6 X[µm] -6
1 Y
[µ m] 4
Clinopyroxene Plagioclase feldspar
+6 X[μm] -6
1 Y
[µ m] 4
Clinopyroxene Plagioclase feldspar
B
C
Plagioclase feldspar
Clinopyroxene
A
28