summer heat and low soil organic matter influence severity of hazelnut cytospora canker
TRANSCRIPT

Vol. 104, No. 4, 2014 387
Ecology and Epidemiology
Summer Heat and Low Soil Organic Matter Influence Severity of Hazelnut Cytospora Canker
Jay Ram Lamichhane, Alfredo Fabi, and Leonardo Varvaro
Department of Science and Technology for Agriculture, Forestry, Nature and Energy (DAFNE), Tuscia University, Viterbo, Italy; Hazelnut Research Center, Viterbo, Italy.
Accepted for publication 3 October 2013.
ABSTRACT
Lamichhane, J. R., Fabi, A., and Varvaro, L. 2014. Summer heat and low soil organic matter influence severity of hazelnut Cytospora canker. Phytopathology 104:387-395.
Cytospora canker, caused by the fungus Cytospora corylicola, is present in hazelnut production areas worldwide. The disease is wide-spread throughout the main production areas of Italy. The causal agent is considered to be a secondary invader of damaged tissue that attacks mainly stressed plants. However, little is known of disease severity and stress factors that predispose plants to infection. In particular, the role of pedoclimatic factors was investigated. Direct survey indicated that disease severity varied across several study sites. Geostatistics showed a strong
positive correlation between disease severity index and summer heat (r = 0.80 and 0.91 for July and August, respectively) and strong negative correlation between disease severity index and soil organic matter (r = –0.78). A moderate positive correlation between disease severity index and magnesium/potassium ratio (r = 0.58) and moderate negative corre-lations between disease severity index and total soil nitrogen (r = –0.53), thermal shock (r = –0.46), and rainfall (r = –0.53) were determined. No significant correlation between disease severity index and soil aluminum (r = –0.35), soil pH (r = –0.01), and plant age (r = –0.38) was found.
Additional keywords: Corylus avellana.
Hazelnut (Corylus avellana L.) is one of the most economically
important nut crops of Italy (38). Throughout the range of cultivation, this crop is prone to numerous diseases. Cytospora canker, caused by the ascomycete Cytospora corylicola Sacc., (43) is reported across hazelnut-growing areas worldwide (27). In Italy, the pathogen is endemic throughout the hazelnut cultivated areas (21,52). Until several years ago, Cytospora canker was considered to be a minor problem in Italian hazelnut orchards. Only recently, Tavella and Giannetti (52) reported that Cytospora canker significantly increased over the years in Piedmont (northern Italy), even in young orchards. Widespread presence of the disease has been reported also from the province of Viterbo, central Italy, which harbors almost one-third of the cultivated hazelnut area of the country (38).
The increase in disease severity was of concern for the Italian hazelnut industry, given its economic importance. In the past, it was thought that only old plants, when grown at high density and improperly managed, were attacked by Cytospora spp. (41,43). However, recent surveys throughout the areas of central Italy showed that relatively young plants also are attacked by the pathogen (A. Fabi and L. Varvaro, personal communication). In addition, the severity of the disease was apparently different among hazelnut-growing areas that have the same cultivars, plant age, and cultural practices.
Cytospora canker is caused by species in the genus Cytospora. These pathogens and their related teleomorphs cause important canker and dieback of >85 species worldwide, including many hardwood, coniferous, and monocot plants (3,20,24,49). The
genus Cytospora represents the asexual stage of the causal fungi. Cytospora spp. are highly virulent and destructive on cultivated Prunus spp. (5,33), Picea spp. and Acer spp. (25) in the land-scape, and Populus spp. (29) in forestry. However, on many tree species, including hazelnut, Cytospora spp. are considered a secondary invader of damaged tissue rather than a primary inv-ader of healthy, intact trees (47,49). Stressed plants, due to ad-verse pedoclimatic conditions, are particularly predisposed to Cytospora spp. attack. Factors such as summer heat (56), late-season water deficit (6,24,35), and soil physical and fertility properties (5) have been documented to predispose other tree species to Cytospora canker. However, information on the possi-ble role of pedoclimatic factors on Cytospora canker of hazelnut is lacking.
Spatial pattern analysis is useful to describe the spatial position of phytopathogens and diseased plants (36,40). In particular, application of geostatistics has markedly increased in studies of plant disease epidemiology and management (39,42,57). Spatial analysis allows quantitative examination of factors that affect plant health (12,37). Successful applications of such techniques are reported in plant pathology at plot or field scales (23,31,50). Spatial autocorrelation modeling, a key point of geostatistics, can be achieved through the variogram estimation. Kriging is a vario-gram model, integrated into a process for surface interpolation. Kriging has two outcomes, a surface map of the variable and that of the kriging standard deviation (KSD). KSD provides a relative measure of confidence in the estimates (16,17). Pedoclimatic factors that affect plant heath can be regarded as regionalized variables and analyzed through geostatistics and kriging (30). Finally, regression analysis may be carried out on disease fre-quency distribution in relation to numerous spatialized pedo-climatic parameters. The aims of this study were to determine (i) whether Cytospora canker severity varies across the study sites and (ii) whether disease severity is correlated with plant age and pedoclimatic factors.
Corresponding author: J. R. Lamichhane; E-mail address: [email protected]
* The e-Xtra logo stands for “electronic extra” and indicates that Figures 1, 2, and 3appear in color online.
http://dx.doi.org/10.1094 / PHYTO-05-13-0136-R © 2014 The American Phytopathological Society
e-Xtra*
388 PHYTOPATHOLOGY
MATERIALS AND METHODS
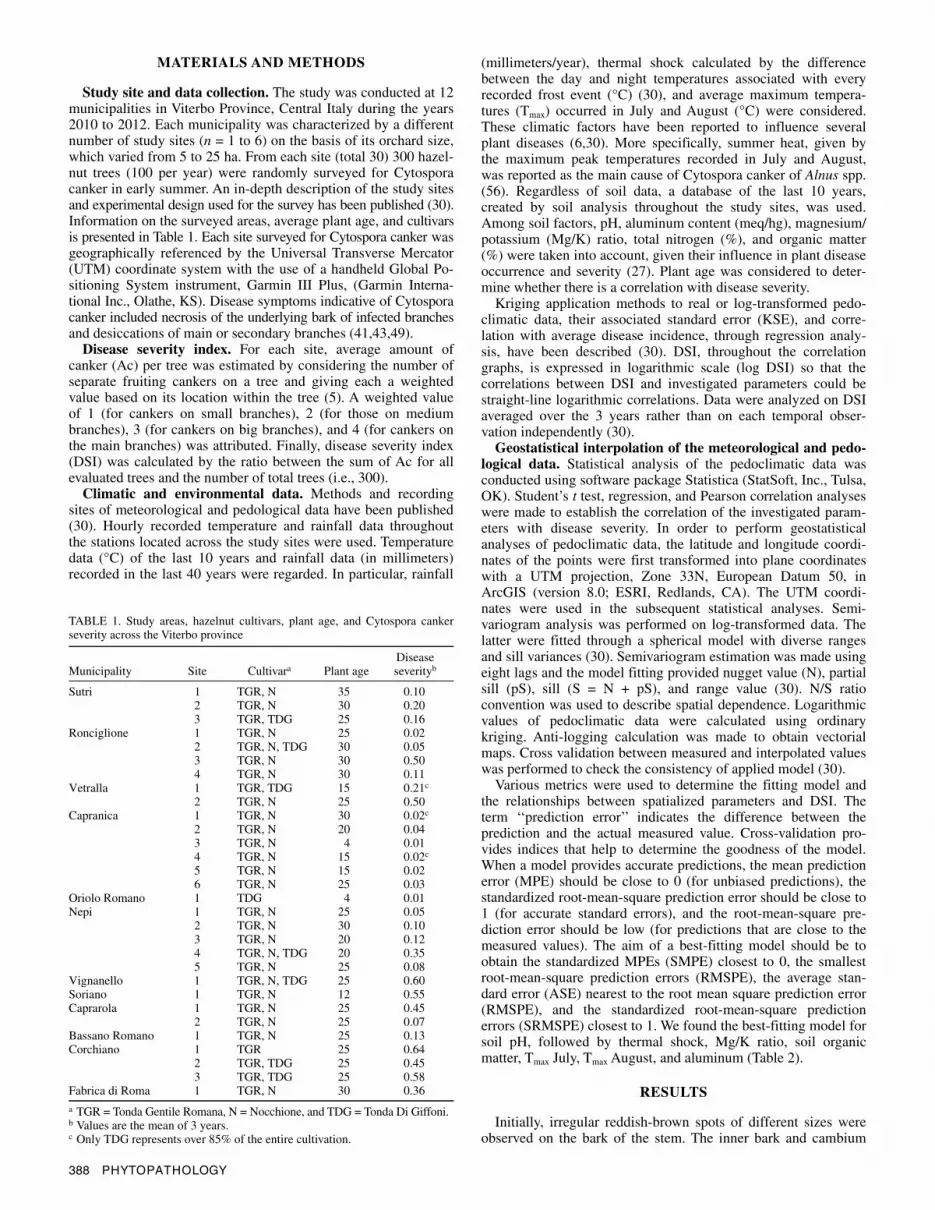
Study site and data collection. The study was conducted at 12 municipalities in Viterbo Province, Central Italy during the years 2010 to 2012. Each municipality was characterized by a different number of study sites (n = 1 to 6) on the basis of its orchard size, which varied from 5 to 25 ha. From each site (total 30) 300 hazel-nut trees (100 per year) were randomly surveyed for Cytospora canker in early summer. An in-depth description of the study sites and experimental design used for the survey has been published (30). Information on the surveyed areas, average plant age, and cultivars is presented in Table 1. Each site surveyed for Cytospora canker was geographically referenced by the Universal Transverse Mercator (UTM) coordinate system with the use of a handheld Global Po-sitioning System instrument, Garmin III Plus, (Garmin Interna-tional Inc., Olathe, KS). Disease symptoms indicative of Cytospora canker included necrosis of the underlying bark of infected branches and desiccations of main or secondary branches (41,43,49).
Disease severity index. For each site, average amount of canker (Ac) per tree was estimated by considering the number of separate fruiting cankers on a tree and giving each a weighted value based on its location within the tree (5). A weighted value of 1 (for cankers on small branches), 2 (for those on medium branches), 3 (for cankers on big branches), and 4 (for cankers on the main branches) was attributed. Finally, disease severity index (DSI) was calculated by the ratio between the sum of Ac for all evaluated trees and the number of total trees (i.e., 300).
Climatic and environmental data. Methods and recording sites of meteorological and pedological data have been published (30). Hourly recorded temperature and rainfall data throughout the stations located across the study sites were used. Temperature data (°C) of the last 10 years and rainfall data (in millimeters) recorded in the last 40 years were regarded. In particular, rainfall
(millimeters/year), thermal shock calculated by the difference between the day and night temperatures associated with every recorded frost event (°C) (30), and average maximum tempera-tures (Tmax) occurred in July and August (°C) were considered. These climatic factors have been reported to influence several plant diseases (6,30). More specifically, summer heat, given by the maximum peak temperatures recorded in July and August, was reported as the main cause of Cytospora canker of Alnus spp. (56). Regardless of soil data, a database of the last 10 years, created by soil analysis throughout the study sites, was used. Among soil factors, pH, aluminum content (meq/hg), magnesium/ potassium (Mg/K) ratio, total nitrogen (%), and organic matter (%) were taken into account, given their influence in plant disease occurrence and severity (27). Plant age was considered to deter-mine whether there is a correlation with disease severity.
Kriging application methods to real or log-transformed pedo-climatic data, their associated standard error (KSE), and corre-lation with average disease incidence, through regression analy-sis, have been described (30). DSI, throughout the correlation graphs, is expressed in logarithmic scale (log DSI) so that the correlations between DSI and investigated parameters could be straight-line logarithmic correlations. Data were analyzed on DSI averaged over the 3 years rather than on each temporal obser-vation independently (30).
Geostatistical interpolation of the meteorological and pedo-logical data. Statistical analysis of the pedoclimatic data was conducted using software package Statistica (StatSoft, Inc., Tulsa, OK). Student’s t test, regression, and Pearson correlation analyses were made to establish the correlation of the investigated param-eters with disease severity. In order to perform geostatistical analyses of pedoclimatic data, the latitude and longitude coordi-nates of the points were first transformed into plane coordinates with a UTM projection, Zone 33N, European Datum 50, in ArcGIS (version 8.0; ESRI, Redlands, CA). The UTM coordi-nates were used in the subsequent statistical analyses. Semi-variogram analysis was performed on log-transformed data. The latter were fitted through a spherical model with diverse ranges and sill variances (30). Semivariogram estimation was made using eight lags and the model fitting provided nugget value (N), partial sill (pS), sill (S = N + pS), and range value (30). N/S ratio convention was used to describe spatial dependence. Logarithmic values of pedoclimatic data were calculated using ordinary kriging. Anti-logging calculation was made to obtain vectorial maps. Cross validation between measured and interpolated values was performed to check the consistency of applied model (30).
Various metrics were used to determine the fitting model and the relationships between spatialized parameters and DSI. The term ‘‘prediction error’’ indicates the difference between the prediction and the actual measured value. Cross-validation pro-vides indices that help to determine the goodness of the model. When a model provides accurate predictions, the mean prediction error (MPE) should be close to 0 (for unbiased predictions), the standardized root-mean-square prediction error should be close to 1 (for accurate standard errors), and the root-mean-square pre-diction error should be low (for predictions that are close to the measured values). The aim of a best-fitting model should be to obtain the standardized MPEs (SMPE) closest to 0, the smallest root-mean-square prediction errors (RMSPE), the average stan-dard error (ASE) nearest to the root mean square prediction error (RMSPE), and the standardized root-mean-square prediction errors (SRMSPE) closest to 1. We found the best-fitting model for soil pH, followed by thermal shock, Mg/K ratio, soil organic matter, Tmax July, Tmax August, and aluminum (Table 2).
RESULTS
Initially, irregular reddish-brown spots of different sizes were observed on the bark of the stem. The inner bark and cambium
TABLE 1. Study areas, hazelnut cultivars, plant age, and Cytospora cankerseverity across the Viterbo province
Municipality
Site
Cultivara
Plant age
Disease severityb
Sutri 1 TGR, N 35 0.10 2 TGR, N 30 0.20 3 TGR, TDG 25 0.16 Ronciglione 1 TGR, N 25 0.02 2 TGR, N, TDG 30 0.05 3 TGR, N 30 0.50 4 TGR, N 30 0.11 Vetralla 1 TGR, TDG 15 0.21c 2 TGR, N 25 0.50 Capranica 1 TGR, N 30 0.02c 2 TGR, N 20 0.04 3 TGR, N 4 0.01 4 TGR, N 15 0.02c 5 TGR, N 15 0.02 6 TGR, N 25 0.03 Oriolo Romano 1 TDG 4 0.01 Nepi 1 TGR, N 25 0.05 2 TGR, N 30 0.10 3 TGR, N 20 0.12 4 TGR, N, TDG 20 0.35 5 TGR, N 25 0.08 Vignanello 1 TGR, N, TDG 25 0.60 Soriano 1 TGR, N 12 0.55 Caprarola 1 TGR, N 25 0.45 2 TGR, N 25 0.07 Bassano Romano 1 TGR, N 25 0.13 Corchiano 1 TGR 25 0.64 2 TGR, TDG 25 0.45 3 TGR, TDG 25 0.58 Fabrica di Roma 1 TGR, N 30 0.36
a TGR = Tonda Gentile Romana, N = Nocchione, and TDG = Tonda Di Giffoni. b Values are the mean of 3 years. c Only TDG represents over 85% of the entire cultivation.
Vol. 104, No. 4, 2014 389
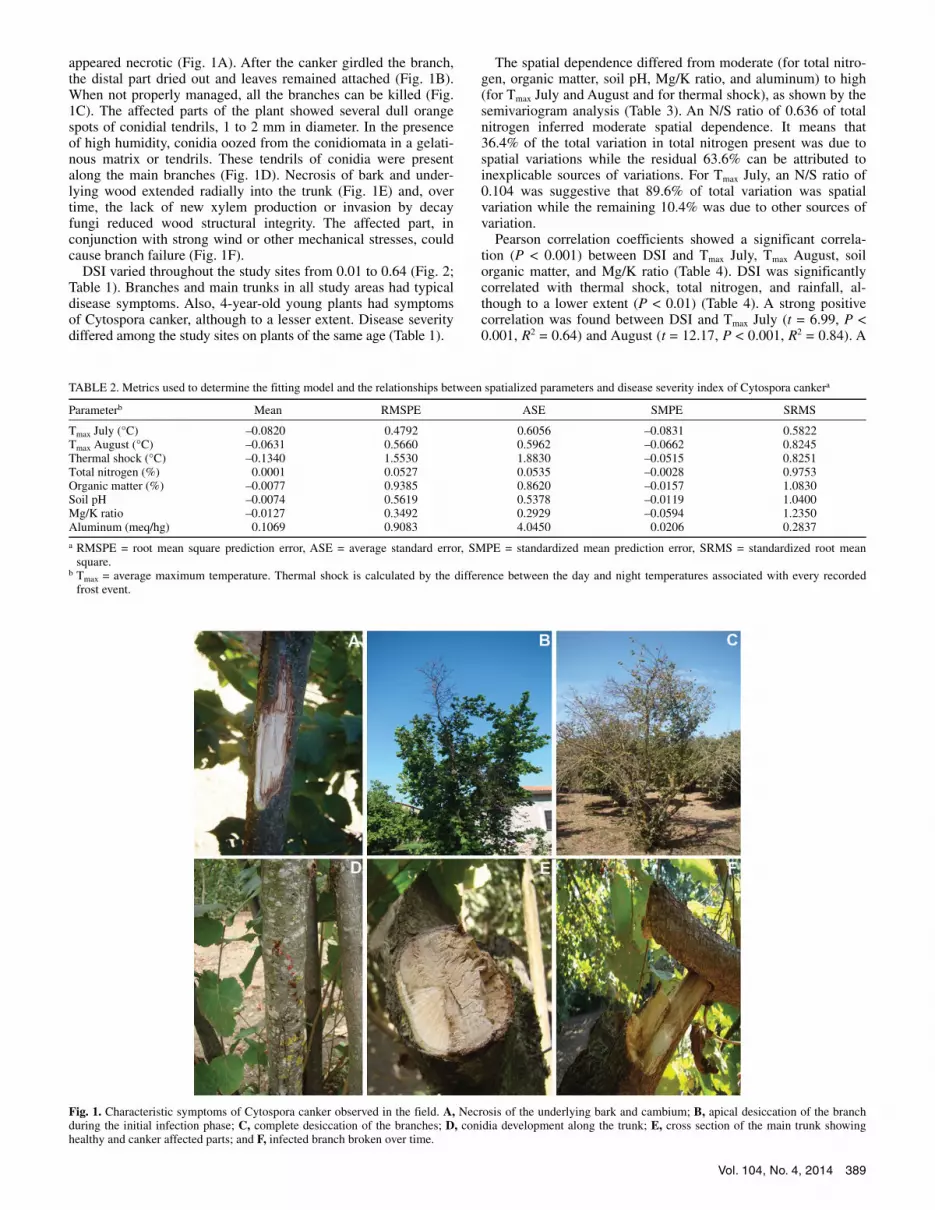
appeared necrotic (Fig. 1A). After the canker girdled the branch, the distal part dried out and leaves remained attached (Fig. 1B). When not properly managed, all the branches can be killed (Fig. 1C). The affected parts of the plant showed several dull orange spots of conidial tendrils, 1 to 2 mm in diameter. In the presence of high humidity, conidia oozed from the conidiomata in a gelati-nous matrix or tendrils. These tendrils of conidia were present along the main branches (Fig. 1D). Necrosis of bark and under-lying wood extended radially into the trunk (Fig. 1E) and, over time, the lack of new xylem production or invasion by decay fungi reduced wood structural integrity. The affected part, in conjunction with strong wind or other mechanical stresses, could cause branch failure (Fig. 1F).
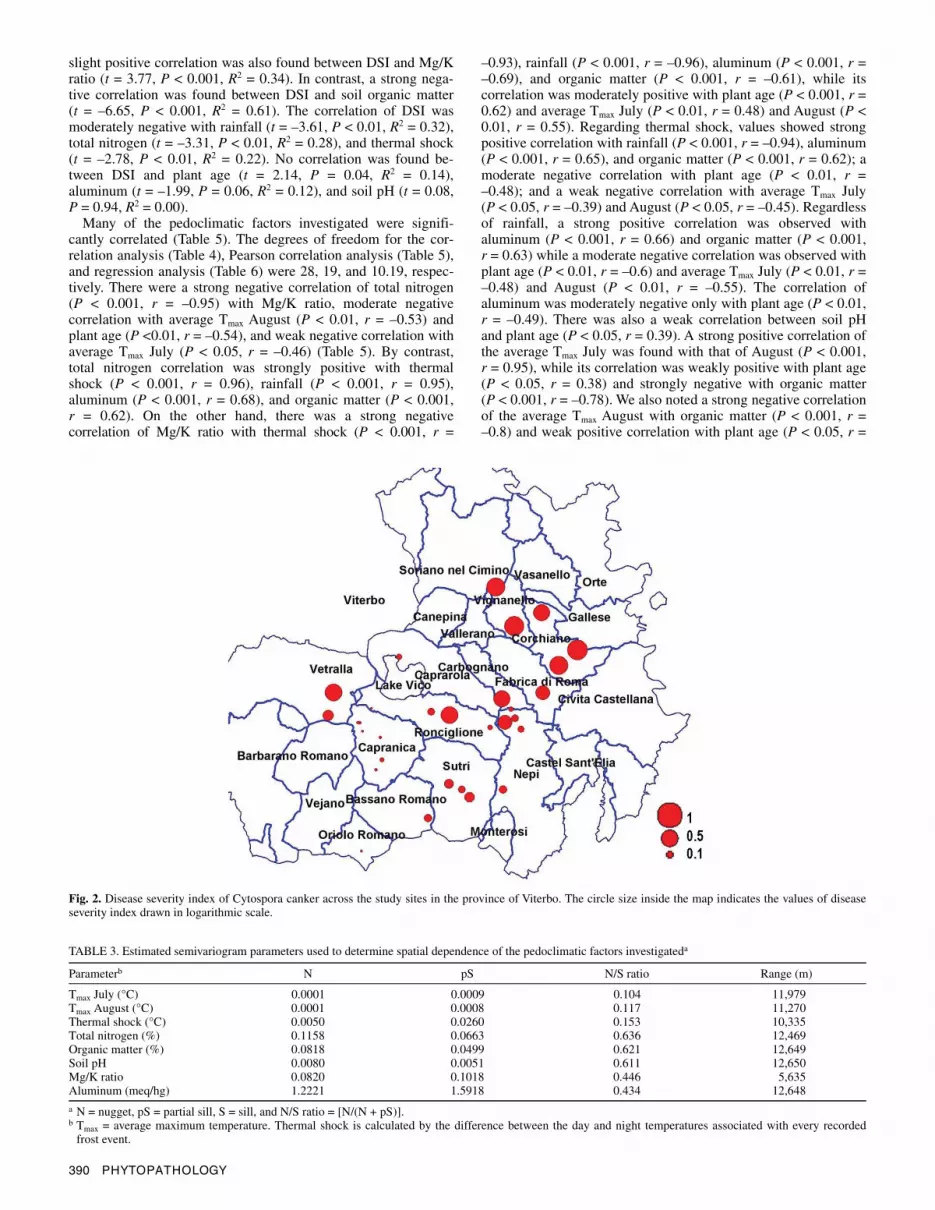
DSI varied throughout the study sites from 0.01 to 0.64 (Fig. 2; Table 1). Branches and main trunks in all study areas had typical disease symptoms. Also, 4-year-old young plants had symptoms of Cytospora canker, although to a lesser extent. Disease severity differed among the study sites on plants of the same age (Table 1).
The spatial dependence differed from moderate (for total nitro-gen, organic matter, soil pH, Mg/K ratio, and aluminum) to high (for Tmax July and August and for thermal shock), as shown by the semivariogram analysis (Table 3). An N/S ratio of 0.636 of total nitrogen inferred moderate spatial dependence. It means that 36.4% of the total variation in total nitrogen present was due to spatial variations while the residual 63.6% can be attributed to inexplicable sources of variations. For Tmax July, an N/S ratio of 0.104 was suggestive that 89.6% of total variation was spatial variation while the remaining 10.4% was due to other sources of variation.
Pearson correlation coefficients showed a significant correla-tion (P < 0.001) between DSI and Tmax July, Tmax August, soil organic matter, and Mg/K ratio (Table 4). DSI was significantly correlated with thermal shock, total nitrogen, and rainfall, al-though to a lower extent (P < 0.01) (Table 4). A strong positive correlation was found between DSI and Tmax July (t = 6.99, P < 0.001, R2 = 0.64) and August (t = 12.17, P < 0.001, R2 = 0.84). A
Fig. 1. Characteristic symptoms of Cytospora canker observed in the field. A, Necrosis of the underlying bark and cambium; B, apical desiccation of the branch during the initial infection phase; C, complete desiccation of the branches; D, conidia development along the trunk; E, cross section of the main trunk showing healthy and canker affected parts; and F, infected branch broken over time.
TABLE 2. Metrics used to determine the fitting model and the relationships between spatialized parameters and disease severity index of Cytospora cankera
Parameterb Mean RMSPE ASE SMPE SRMS
Tmax July (°C) –0.0820 0.4792 0.6056 –0.0831 0.5822 Tmax August (°C) –0.0631 0.5660 0.5962 –0.0662 0.8245 Thermal shock (°C) –0.1340 1.5530 1.8830 –0.0515 0.8251 Total nitrogen (%) 0.0001 0.0527 0.0535 –0.0028 0.9753 Organic matter (%) –0.0077 0.9385 0.8620 –0.0157 1.0830 Soil pH –0.0074 0.5619 0.5378 –0.0119 1.0400 Mg/K ratio –0.0127 0.3492 0.2929 –0.0594 1.2350 Aluminum (meq/hg) 0.1069 0.9083 4.0450 0.0206 0.2837
a RMSPE = root mean square prediction error, ASE = average standard error, SMPE = standardized mean prediction error, SRMS = standardized root mean square.
b Tmax = average maximum temperature. Thermal shock is calculated by the difference between the day and night temperatures associated with every recorded frost event.
390 PHYTOPATHOLOGY
slight positive correlation was also found between DSI and Mg/K ratio (t = 3.77, P < 0.001, R2 = 0.34). In contrast, a strong nega-tive correlation was found between DSI and soil organic matter (t = –6.65, P < 0.001, R2 = 0.61). The correlation of DSI was moderately negative with rainfall (t = –3.61, P < 0.01, R2 = 0.32), total nitrogen (t = –3.31, P < 0.01, R2 = 0.28), and thermal shock (t = –2.78, P < 0.01, R2 = 0.22). No correlation was found be-tween DSI and plant age (t = 2.14, P = 0.04, R2 = 0.14), aluminum (t = –1.99, P = 0.06, R2 = 0.12), and soil pH (t = 0.08, P = 0.94, R2 = 0.00).
Many of the pedoclimatic factors investigated were signifi-cantly correlated (Table 5). The degrees of freedom for the cor-relation analysis (Table 4), Pearson correlation analysis (Table 5), and regression analysis (Table 6) were 28, 19, and 10.19, respec-tively. There were a strong negative correlation of total nitrogen (P < 0.001, r = –0.95) with Mg/K ratio, moderate negative correlation with average Tmax August (P < 0.01, r = –0.53) and plant age (P <0.01, r = –0.54), and weak negative correlation with average Tmax July (P < 0.05, r = –0.46) (Table 5). By contrast, total nitrogen correlation was strongly positive with thermal shock (P < 0.001, r = 0.96), rainfall (P < 0.001, r = 0.95), aluminum (P < 0.001, r = 0.68), and organic matter (P < 0.001, r = 0.62). On the other hand, there was a strong negative correlation of Mg/K ratio with thermal shock (P < 0.001, r =
–0.93), rainfall (P < 0.001, r = –0.96), aluminum (P < 0.001, r = –0.69), and organic matter (P < 0.001, r = –0.61), while its correlation was moderately positive with plant age (P < 0.001, r = 0.62) and average Tmax July (P < 0.01, r = 0.48) and August (P < 0.01, r = 0.55). Regarding thermal shock, values showed strong positive correlation with rainfall (P < 0.001, r = –0.94), aluminum (P < 0.001, r = 0.65), and organic matter (P < 0.001, r = 0.62); a moderate negative correlation with plant age (P < 0.01, r = –0.48); and a weak negative correlation with average Tmax July (P < 0.05, r = –0.39) and August (P < 0.05, r = –0.45). Regardless of rainfall, a strong positive correlation was observed with aluminum (P < 0.001, r = 0.66) and organic matter (P < 0.001, r = 0.63) while a moderate negative correlation was observed with plant age (P < 0.01, r = –0.6) and average Tmax July (P < 0.01, r = –0.48) and August (P < 0.01, r = –0.55). The correlation of aluminum was moderately negative only with plant age (P < 0.01, r = –0.49). There was also a weak correlation between soil pH and plant age (P < 0.05, r = 0.39). A strong positive correlation of the average Tmax July was found with that of August (P < 0.001, r = 0.95), while its correlation was weakly positive with plant age (P < 0.05, r = 0.38) and strongly negative with organic matter (P < 0.001, r = –0.78). We also noted a strong negative correlation of the average Tmax August with organic matter (P < 0.001, r = –0.8) and weak positive correlation with plant age (P < 0.05, r =
Fig. 2. Disease severity index of Cytospora canker across the study sites in the province of Viterbo. The circle size inside the map indicates the values of disease severity index drawn in logarithmic scale.
TABLE 3. Estimated semivariogram parameters used to determine spatial dependence of the pedoclimatic factors investigateda
Parameterb N pS N/S ratio Range (m)
Tmax July (°C) 0.0001 0.0009 0.104 11,979 Tmax August (°C) 0.0001 0.0008 0.117 11,270 Thermal shock (°C) 0.0050 0.0260 0.153 10,335 Total nitrogen (%) 0.1158 0.0663 0.636 12,469 Organic matter (%) 0.0818 0.0499 0.621 12,649 Soil pH 0.0080 0.0051 0.611 12,650 Mg/K ratio 0.0820 0.1018 0.446 5,635 Aluminum (meq/hg) 1.2221 1.5918 0.434 12,648
a N = nugget, pS = partial sill, S = sill, and N/S ratio = [N/(N + pS)]. b Tmax = average maximum temperature. Thermal shock is calculated by the difference between the day and night temperatures associated with every recorded
frost event.
Vol. 104, No. 4, 2014 391
0.41). Finally, no correlation of soil pH was found with the pedoclimatic factors.
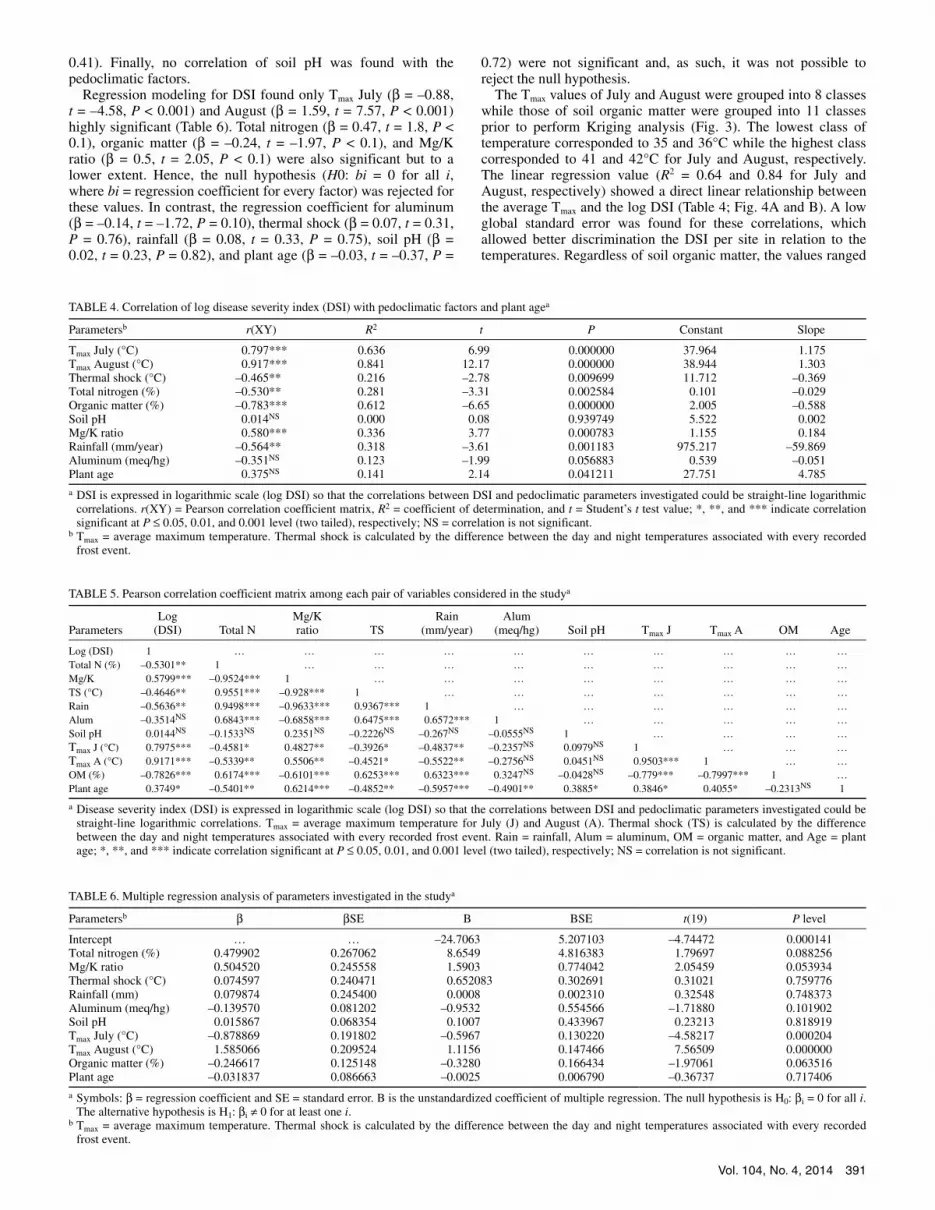
Regression modeling for DSI found only Tmax July (β = –0.88, t = –4.58, P < 0.001) and August (β = 1.59, t = 7.57, P < 0.001) highly significant (Table 6). Total nitrogen (β = 0.47, t = 1.8, P < 0.1), organic matter (β = –0.24, t = –1.97, P < 0.1), and Mg/K ratio (β = 0.5, t = 2.05, P < 0.1) were also significant but to a lower extent. Hence, the null hypothesis (H0: bi = 0 for all i, where bi = regression coefficient for every factor) was rejected for these values. In contrast, the regression coefficient for aluminum (β = –0.14, t = –1.72, P = 0.10), thermal shock (β = 0.07, t = 0.31, P = 0.76), rainfall (β = 0.08, t = 0.33, P = 0.75), soil pH (β = 0.02, t = 0.23, P = 0.82), and plant age (β = –0.03, t = –0.37, P =
0.72) were not significant and, as such, it was not possible to reject the null hypothesis.
The Tmax values of July and August were grouped into 8 classes while those of soil organic matter were grouped into 11 classes prior to perform Kriging analysis (Fig. 3). The lowest class of temperature corresponded to 35 and 36°C while the highest class corresponded to 41 and 42°C for July and August, respectively. The linear regression value (R2 = 0.64 and 0.84 for July and August, respectively) showed a direct linear relationship between the average Tmax and the log DSI (Table 4; Fig. 4A and B). A low global standard error was found for these correlations, which allowed better discrimination the DSI per site in relation to the temperatures. Regardless of soil organic matter, the values ranged
TABLE 4. Correlation of log disease severity index (DSI) with pedoclimatic factors and plant agea
Parametersb r(XY) R2 t P Constant Slope
Tmax July (°C) 0.797*** 0.636 6.99 0.000000 37.964 1.175 Tmax August (°C) 0.917*** 0.841 12.17 0.000000 38.944 1.303 Thermal shock (°C) –0.465** 0.216 –2.78 0.009699 11.712 –0.369 Total nitrogen (%) –0.530** 0.281 –3.31 0.002584 0.101 –0.029 Organic matter (%) –0.783*** 0.612 –6.65 0.000000 2.005 –0.588 Soil pH 0.014NS 0.000 0.08 0.939749 5.522 0.002 Mg/K ratio 0.580*** 0.336 3.77 0.000783 1.155 0.184 Rainfall (mm/year) –0.564** 0.318 –3.61 0.001183 975.217 –59.869 Aluminum (meq/hg) –0.351NS 0.123 –1.99 0.056883 0.539 –0.051 Plant age 0.375NS 0.141 2.14 0.041211 27.751 4.785
a DSI is expressed in logarithmic scale (log DSI) so that the correlations between DSI and pedoclimatic parameters investigated could be straight-line logarithmic correlations. r(XY) = Pearson correlation coefficient matrix, R2 = coefficient of determination, and t = Student’s t test value; *, **, and *** indicate correlation significant at P ≤ 0.05, 0.01, and 0.001 level (two tailed), respectively; NS = correlation is not significant.
b Tmax = average maximum temperature. Thermal shock is calculated by the difference between the day and night temperatures associated with every recorded frost event.
TABLE 5. Pearson correlation coefficient matrix among each pair of variables considered in the studya
Parameters
Log (DSI)
Total N
Mg/K ratio
TS
Rain (mm/year)
Alum (meq/hg)
Soil pH
Tmax J
Tmax A
OM
Age
Log (DSI) 1 … … … … … … … … … … Total N (%) –0.5301** 1 … … … … … … … … … Mg/K 0.5799*** –0.9524*** 1 … … … … … … … … TS (°C) –0.4646** 0.9551*** –0.928*** 1 … … … … … … … Rain –0.5636** 0.9498*** –0.9633*** 0.9367*** 1 … … … … … … Alum –0.3514NS 0.6843*** –0.6858*** 0.6475*** 0.6572*** 1 … … … … … Soil pH 0.0144NS –0.1533NS 0.2351NS –0.2226NS –0.267NS –0.0555NS 1 … … … … Tmax J (°C) 0.7975*** –0.4581* 0.4827** –0.3926* –0.4837** –0.2357NS 0.0979NS 1 … … … Tmax A (°C) 0.9171*** –0.5339** 0.5506** –0.4521* –0.5522** –0.2756NS 0.0451NS 0.9503*** 1 … … OM (%) –0.7826*** 0.6174*** –0.6101*** 0.6253*** 0.6323*** 0.3247NS –0.0428NS –0.779*** –0.7997*** 1 … Plant age 0.3749* –0.5401** 0.6214*** –0.4852** –0.5957*** –0.4901** 0.3885* 0.3846* 0.4055* –0.2313NS 1
a Disease severity index (DSI) is expressed in logarithmic scale (log DSI) so that the correlations between DSI and pedoclimatic parameters investigated could be straight-line logarithmic correlations. Tmax = average maximum temperature for July (J) and August (A). Thermal shock (TS) is calculated by the differencebetween the day and night temperatures associated with every recorded frost event. Rain = rainfall, Alum = aluminum, OM = organic matter, and Age = plant age; *, **, and *** indicate correlation significant at P ≤ 0.05, 0.01, and 0.001 level (two tailed), respectively; NS = correlation is not significant.
TABLE 6. Multiple regression analysis of parameters investigated in the studya
Parametersb β βSE B BSE t(19) P level
Intercept … … –24.7063 5.207103 –4.74472 0.000141 Total nitrogen (%) 0.479902 0.267062 8.6549 4.816383 1.79697 0.088256 Mg/K ratio 0.504520 0.245558 1.5903 0.774042 2.05459 0.053934 Thermal shock (°C) 0.074597 0.240471 0.652083 0.302691 0.31021 0.759776 Rainfall (mm) 0.079874 0.245400 0.0008 0.002310 0.32548 0.748373 Aluminum (meq/hg) –0.139570 0.081202 –0.9532 0.554566 –1.71880 0.101902 Soil pH 0.015867 0.068354 0.1007 0.433967 0.23213 0.818919 Tmax July (°C) –0.878869 0.191802 –0.5967 0.130220 –4.58217 0.000204 Tmax August (°C) 1.585066 0.209524 1.1156 0.147466 7.56509 0.000000 Organic matter (%) –0.246617 0.125148 –0.3280 0.166434 –1.97061 0.063516 Plant age –0.031837 0.086663 –0.0025 0.006790 –0.36737 0.717406
a Symbols: β = regression coefficient and SE = standard error. B is the unstandardized coefficient of multiple regression. The null hypothesis is H0: βi = 0 for all i. The alternative hypothesis is H1: βi ≠ 0 for at least one i.
b Tmax = average maximum temperature. Thermal shock is calculated by the difference between the day and night temperatures associated with every recorded frost event.

392 PHYTOPATHOLOGY
from a lowest class (1.7 to 2.05%) to a highest class (0.21 to 0.375%). A KSE of 0.85 to 1.15 was associated with the predic-tion of the amount of soil organic matter (Fig. 3C). Also, the linear regression value (R2 = 0.61) confirmed a direct linear re-lationship between the soil organic matter and log DSI (Table 4; Fig. 4C).
Thermal shock values covered a range of 8.5 to 14.5°C, and a KSE that varied from 1.784 to 2.128 was associated (Fig. 3D). DSI was lower at sites where these values were 11.5 to 13.5°C. Concerning soil nitrogen, the lowest class corresponded to an estimated value of 0.015 to 0.075% while the highest class was 0.21 to 0.375% (Fig. 3E). A KSE (0.047 to 0.06) was associated with the prediction of the total soil nitrogen. Despite a low global standard error observed for this correlation, an inverse linear relationship, with low significance (R2 = 0.28), was found be-tween the nitrogen contents and log DSI (Fig. 4E). Similarly, the Mg/K ratio ranged from a minimum of 0.1 up to a maximum of 2.7 (Fig. 3F). DSI was higher at high Mg/K ratios, demonstrating a direct correlation, confirmed also by linear regression analysis (R2 = 0.33). Standard error for these values differed from 0.297 to 0.412. Annual rainfall, divided into 11 classes of values (Fig. 3G), had an inverse correlation with DSI (Fig. 4G). No correlation of DSI was found with plant age, (R2 = 0.14), soil aluminum content (R2 = 0.12), and soil pH (R2 = 0.00) (data not shown). The associ-ated standard error of soil aluminum and pH was generally higher for all the sites when compared with the other cases described above (data not shown).
DISCUSSION The present study demonstrated the association of pedoclimatic
factors with severity of hazelnut Cytospora canker. In particular,
strong positive correlation of summer heat and strong negative correlation of soil organic matter with disease severity are con-sistent with previous reports. These factors, either directly predis-posing plants by stress or by favoring the pathogen inoculum spread, favor the occurrence and spread of Cytospora canker.
Previous studies demonstrated that summer heat or moisture stress commonly predispose trees to Cytospora cankers and other cankers caused by facultative pathogens (44,48,56). Many woody hosts became susceptible to cankers caused by facultative patho-gens when moisture content of bark fell below a threshold of 80% of saturation (8,9). More specifically, water potentials below –1.2 MPa predisposed a variety of woody plants to such diseases (24,44). Bertrand et al. (6) found a strong correlation between leaf water potential and length of Cytospora cankers in Prunus domestica following inoculation. The authors observed that solute potential as high as –1.0 MPa were sufficient to induce suscepti-bility to disease. In addition, growth of Cytospora cankers in-creased significantly on field-inoculated Populus tremuloides once water potential decreased (24). In poplar, both high tempera-ture and low tissue moisture content were related to development of the disease (10). Worrall et al. (56) demonstrated that, in alder, canker expansion and killing of branches and stems occurred almost exclusively in the warmest part of summer. The authors presented evidence suggesting that warm summer temperatures are conducive to the disease. Maximum peaks of summer tem-perature are particularly severe across our study sites. Hence, moisture stress in hazelnut might result from warm and dry at-mospheric conditions. In addition, the presence of very compact clay soil, common throughout hazelnut cultivated areas of central Italy (30), does not allow the root systems to sufficiently expand, causing water stress. The negative correlation of rainfall to Cyto-spora disease severity further corroborates these observations. It is
Fig. 3. Map illustrating the correlation of average disease severity index with different pedoclimatic factors. Krigings of A, maximum temperature of July and B, August; C, soil organic matter; D, thermal shock; E, total nitrogen; F, Mg/K ratio and G, rainfall. The red circle size inside the maps indicates the different disease severity index (0.01 to 0.64) expressed in logarithmic scale.

Vol. 104, No. 4, 2014 393
striking that, in alder, canker growth halted with the arrival of monsoon conditions despite the persistence of high Tmax for several weeks (56). The increase in atmospheric moisture likely reduced transpiration demand and the associated moisture stress.
Interactions between drought and disease have been recognized also in other fungal pathosystems (15,25). Paradoxically, although moisture is indispensable for the germination and initiation of infection by fungal spores as well as for dispersal in many species (4), the effect of drought on reducing plant defenses and en-hancing fungal diseases is frequently reported (45). The impact of drought as a predisposing stress has moved to the forefront with the severe heat and drought of summer 2003 in Europe (35) and the concern is all the more important that such episodes might become more frequent in the future due to global climate change (13). In this study, geostatistics did not show any positive correlation among the rainfall and Cytospora disease severity. However, it should be clarified that the lack of correlation might be due to the irrigation practices across the area characterized by low annual rainfall. Usually, rainfall ensures leaf wetness and higher humidity, essential for the growth and dispersal of conidia and ascospores (28,34). In addition, a higher rainfall was reported
as highly favorable for other hazelnut–bacterial disease patho-systems (19,30).
Cytospora canker causes defoliation, reducing photosynthetic area and consequent carbohydrate content of plants (24). In-stances of severe defoliation are favorable also for the entry of other plant pathogens through leaf scars. Especially, the condition could be ideal for the bacterial pathogen Xanthomonas arboricola pv. corylina. The latter has an epiphytic phase on hazelnut plants (30) and can switch from epiphytic lifestyle to parasitic one via leaf scars. Our study sites are characterized by a prolonged spring drought, especially in recent years. In addition, annual rainfall is not uniform (18,30). In Viterbo, there is often a long delay be-tween nut harvest in late summer to early autumn and additional moisture. In a number of cases, growers wait for early fall rain-falls and do not supply a post-harvest irrigation. This delay could be stressful.
Strong negative correlation between DSI and soil organic matter is consistent with the role of moisture relations in the dis-ease. In general, organic amendments applied to field soils im-prove soil functions such as infiltration, water-holding capacity, nutrient retention and release, and resistance to wind and water
Fig. 4. Correlation of the average disease severity index of each site with different pedoclimatic factors. Average maximum temperature of A, July (t = 6.99, P < 0.001, R2 = 0.63) and B, August (t = 12.17, P < 0.001, R2 = 0.84); C, average content of soil organic matter (t = –6.65, P < 0.001, R2 = 0.61); D, average thermal shock (t = –2.78, P < 0.01, R2 = 0.21); E, average nitrogen (t = –3.31, P < 0.01, R2 = 0.28); F, average Mg/K ratio (t = 3.77, P < 0.001, R2 = 0.33); and G, average rainfall (t = –3.61, P < 0.01, R2 = 0.31). Horizontal and vertical bars represent the standard error of disease severity index and pedoclimatic variables, respectively. The average number of replicates in each site = 6.

394 PHYTOPATHOLOGY
erosion (11). Organic-matter-mediated suppression of soilborne diseases in field soils caused by fungal pathogens has been reported for different plant species (26,32,51,58). Moreover, there are several studies on the role of organic amendments on bacterial foliar disease suppression. Examples are the suppression of bac-terial spot of tomato (1) and bacterial spot of radish (58), caused by X. campestris pvs. vesicatoria and armoraciae, respectively. Plants in soils with low organic content may be predisposed to Cytospora canker. A recent study (30) highlighted the massive use of mineral fertilizers across hazelnut orchards of central Italy, which alters soil organic matter and consequent mineral equilibrium.
The negative correlation of total soil nitrogen with disease severity is consistent with the studies reported in the literature. The greatest benefit to the plant is provided when sufficient nutrients are available (4). More specifically, nitrogen is essential to the formation of various structures, proteins, and enzymes needed in both growth and disease resistance (4). It has been reported that fungal disease incidence and severity decrease with increasing levels of nitrogen fertilizer application (2,54,55). On the other hand, excessive levels of nitrogen predispose plants to some diseases. Cytospora canker of peach is more severe in trees with excessive or deficient nitrogen levels than with adequate nitrogen levels (14). Soil nitrogen content was positively corre-lated with bacterial blight disease of hazelnut (30) across our study sites. Bacterial and fungal pathogens react differently to the same level of nitrogen. In particular, a positive correlation found for Xanthomonas spp.-induced blight can be explained by the fact that this is a foliar pathogen which better survives and multiplies on vigorous plant parts (4).
The positive correlation, although to a lesser extent, of Mg/K ratio with disease severity is inconsistent with the previous report on bacterial blight disease (30). Although no data are available in the literature to explain why higher content of magnesium in soil predisposes plants to pathogen attacks, the inverse situation can be easily explained. Indeed, plants grown in soil with poor levels of potassium are prone to pathogen attacks. Bertrand et al. (5) found that Cytospora canker of prune was associated with high clay content or inadequate potassium. Although most of our study sites have soils of volcanic origin, the high presence of clay soil might not allow the potassium to be readily available for plants.
In general, thermal shock associated with frost events creates micro-lesions on plant tissues and predisposes plants to pathogen attacks. Studies on bacterial canker and bacterial blight have re-ported a strong positive correlation between thermal shock and hazelnut bacterial disease incidence (18,30). The negative correla-tion of thermal shock with Cytospora canker, although to a lesser extent, is probably due to the fact that, in areas subjected to frequent thermal shock events, the presence of Cytospora canker can be masked by that of bacterial canker. The latter is an acute disease which often kills plants quickly (46). Indeed, Cytospora canker severity is very low across the sites where bacterial canker is a severe problem.
Another interesting result of this study is that no correlation of plant age was detected with the severity of Cytospora canker. This finding is in agreement with the observations made during the recent years.
The dieback of one or more branches within the tree from Cytospora canker causes widespread deterioration of the entire orchard. An open canopy increases exposure of the floor to sun, wind, and moisture loss (22), while frequent removal of plant parts results in the loss of production. In addition, continued removal of cankered twig and branches contributes to the constant presence of the wounds which are an ideal entry port of other plant pathogens (7,30,43). Especially for hazelnut, a complete closure of the canopy is considered to be the optimal condition both for the plant health and production (53). Moreover, sucker removal from the plant base, frequently practiced during the late
spring or winter, poses another dilemma for hazelnut crop health. In this case, soil pathogens also can enter through the wounds and alter the plant health. A previous study revealed the association of Cytospora canker with winter injury or pruning wounds (33).
The overall findings of this study support the hypothesis that hazelnut trees are much more susceptible to Cytospora canker when they are stressed. Almost all the hazelnut orchards are intensively managed and highly mechanized. Soil compaction is common throughout the orchards but tilling is not widely prac-ticed. The use of heavy machines worsens the condition. All these circumstances lead to lower soil aeration and drainage and reduced root elongation (30). Reduction of severe fluctuations in soil moisture by mulching, precise irrigation scheduling, and tilling is important to prevent plant stress. Future studies on the epidemiology of the disease in other Italian hazelnut-growing areas might provide some new insights to better understand the Cytospora–hazelnut pathosystems. In particular, information is needed on the major sources of primary inoculum, the importance of ascospores and conidia in the natural spread of the disease, time of infection, and optimal condition for conidial germination.
LITERATURE CITED
1. Abbasi, P., Al-Dahmani, J., Sahin, F., Hoitink, H., and Miller, S. 2002. Effect of compost amendments on disease severity and yield of tomato in conventional and organic production systems. Plant Dis. 86:13-16.
2. Abro, M. A., Lecompte, F., Bryone, F., and Nicot, P. C. 2013. Nitrogen fertilization of the host plant influences production and pathogenicity of Botrytis cinerea secondary inoculum. Phytopathology 103:261-267.
3. Adams, G. C., Roux, J., and Wingfield, M. J. 2006. Cytospora species (Ascomycota, Diaporthales, Valsaceae): introduced and native pathogens of trees in South Africa. Australas. Plant Pathol. 35:521-548.
4. Agrios, G. 2005. Plant pathology. Academic Press, New York. 5. Bertrand, P., English, H., and Carlson, R. 1976. Relation of soil physical
and fertility properties to the occurrence of Cytospora canker in French prune orchards. Phytopathology 66:1321-1324.
6. Bertrand, P., English, H., Uriu, K., and Schick, F. 1976. Late season water deficits and development of Cytospora canker in French prune. Phytopathology 66:1318-1320.
7. Bianco, M., and Danise, B. 2002. La difesa fitosanitaria del nocciolo. Pages 52-61 in: II° Convegno Nazionale sul Nocciolo, Giffoni Valle Piana (SA).
8. Bier, J. 1964. The relation of some bark factors to canker susceptibility. Phytopathology 54:250-253.
9. Bier, J. E. 1959. The relation of bark moisture to the development of canker diseases caused by native, facultative parasites. Can. J. Bot. 37:229-238.
10. Bloomberg, W. 1962. Cytospora canker of poplars: factors influencing the development of the disease. Can. J. Bot. 40:1271-1280.
11. Brady, N., and Weil, R. 2002. The Nature and Properties of Soils. Kluwer Academic Publishers, Dordrecht, the Netherlands.
12. Broders, K. D., Wallhead, M. W., Austin, G. D., Lipps, P. E., Paul, P. A., Mullen, R. W., and Dorrance, A. E. 2009. Association of soil chemical and physical properties with Pythium species diversity, community composition, and disease incidence. Phytopathology 99:957-967.
13. Change, I. P. O. C. 2001. Climate Change 2001: The Scientific Basis. J. T. Houghton, Y. Ding, D. J. Griggs, M. Noguer, P. J. Van Der Linden, X. Dai, eds. Cambridge University Press. http://www.grida.no/climate/ ipcc_tar/wg1/index.htm
14. Cline, R. 1980. Orchard management and peach canker. Pages 82-86 in: Peach Canker Workshop Proc. Agriculture Canada, ON, Canada.
15. Colhoun, J. 1973. Effects of environmental factors on plant disease. Annu. Rev. Phytopathol. 11:343-364.
16. Eastman, J. 2001. Guide to GIS and Image Processing, Vol. I. Clark University, Worcester, MA.
17. Eastman, J. 2001. Guide to GIS and Image Processing, Vol. II, Id. Clark University, Worcester, MA.
18. Fabi, A., and Varvaro, L. 2009. Application of geostatistics in studying epidemiology of hazelnut diseases: a case study. Acta Hortic. 845:507-514.
19. Fabi, A., and Varvaro, L. 2010. La Moria del nocciolo nel Viterbese: procedure di indagine epidemiologica mediante tecniche GIS. Corylus Co. 2:23-30.
20. Farr, D. F., Bills, G. F., Chamuris, G. P., and Rossman, A. Y. 1989. Fungi on Plants and Plant Products in the United States. American Phytopatho-logical Society, St. Paul, MN.
Vol. 104, No. 4, 2014 395
21. Fiori, M. 2006. Le principali avversità del nocciolo in Sardegna. Petria 16:71-88.
22. Fralish, J. 1975. Ecological and historical aspects of aspen succession in northern Wisconsin. Trans. Wisc. Acad. Sci. Arts Lett. 63:54-65.
23. Gottwald, T. R., Avinent, L., Llácer, G., Hermoso De Mendoza, A., and Cambra, M. 1995. Analysis of the spatial spread of sharka (Plum pox virus) in apricot and peach orchards in eastern spain. Plant Dis. 79:266-278.
24. Guyon, J., Jacobi, W., and McIntyre, G. 1996. Effects of environmental stress on the development of Cytospora canker of aspen. Plant Dis. 80:1320-1326.
25. Hepting, G. 1963. Climate and forest diseases. Annu. Rev. Phytopathol. 1:31-50.
26. Hoitink, H. A. J., and Boehm, M. J. 1999. Biocontrol within the context of soil microbial communities: a substrate-dependent phenomenon. Annu. Rev. Phytopathol. 37:427-446.
27. Janick, J., and Paull, R. 2008. The Encyclopedia of Fruit and Nuts. CABI Publishing, Wallingford, UK.
28. Kamiri, L., and Laemmlen, F. 1981. Epidemiology of Cytospora canker in Colorado blue spruce by Valsa Kunzei. Phytopathology 71:941-947.
29. Kepley, J. B., and Jacobi, W. R. 2000. Pathogenicity of Cytospora fungi on six hardwood species. J. Arboric. 26:326-334.
30. Lamichhane, J. R., Fabi, A., Ridolfi, R., and Varvaro, L. 2013. Epidemiological study of hazelnut bacterial blight in central Italy by using laboratory analysis and geostatistics. PLoS One 8:e56298.
31. Larkin, R. P., Gumpertz, M. L., and Ristaino, J. B. 1995. Geostatistical Analysis of Phytophthora epidemic development in commercial bell pepper fields. Phytopathology 85:191-203.
32. Lewis, J. A., Lumsden, R. D., Millner, P. D., and Keinath, A. P. 1992. Suppression of damping-off of peas and cotton in the field with composted sewage sludge. Crop Prot. 11:260-266.
33. Luepschen, N., Hetherington, J., Stahl, F., and Mowrer, K. 1979. Cytospora canker of peach trees in Colorado: survey of incidence, canker location and apparent infection courts. Plant Dis. Rep. 63:685-687.
34. Luepschen, N., and Rohrbach, K. 1969. Cytospora canker of peach trees: spore availability and wound susceptibility. Plant Dis. Rep. 53:869-872.
35. Marie-laure, D., and Benoit, M. 2006. Interactive effects of drought and pathogens in forest trees. Ann. For. Sci. 63:597-612.
36. Martins, L., Castro, J., Macedo, W., Marques, C., and Abreu, C. 2007. Assessment of the spread of chestnut ink disease using remote sensing and geostatistical methods C. G. Abreu, E. Rosa, and A. A. Monteiro, eds. Eur. J. Plant Pathol. 119:159-164.
37. Martins, L. M., Macedo, F. W., Marques, C. P., and Abreu, C. G. 2005. Assessment of chestnut ink disease spread by geostatistical methods. Acta Hortic. 693:621-625.
38. Me, G., and Valentini, N. 2006. La corilicoltura in Italia e nel mondo. Petria 16:7-18.
39. Nelson, M. R., Orum, T. V, Jaime-Garcia, R., and Nadeem, A. 1999. Applications of geographic information systems and geostatistics in plant disease epidemiology and management. Plant Dis. 83:308-319.
40. Noe, J. P., and Campbell, C. L. 1985. Spatial pattern analysis of plant-parasitic nematodes. J. Nematol. 17:86-93.
41. Noviello, C. 1968. Osservazioni sulle malattie parassitarie del nocciolo con particolare riferimento alla Campania. Ann. Fac. Sci. Agrar. Univ. Napoli 4:3-31.
42. Orum, T. V, Bigelow, D. M., Nelson, M. R., Howell, D. R., and Cotty, P. J. 1997. Spatial and temporal patterns of Aspergillus flavus strain composition and propagule density in Yuma country, Arizona, soils. Plant Dis. 81:911-916.
43. Salerno M. 1961. Cytospora corylicola Sacc. e patogenesi del mal dello stacco de nocciolo (Corylus avellana L.) in Sicilia. Riv. Patol. Veg. 1:38-64.
44. Schoeneweiss, D. 1981. The role of environmental stress in diseases of woody plants. Plant Dis. 65:308-314.
45. Schoeneweiss D. F. 1975. Predisposition, stress and plant disease. Annu. Rev. Phytopathol. 193-211.
46. Scortichini, M. 2002. Bacterial canker and decline of European hazelnut. Plant Dis. 86:704-709.
47. Scortichini, M. 2006. Le principali avversità del nocciolo nel Lazio. Petria 16:31-44.
48. Sinclair, W. A., and Yon, H. H. 2005. Diseases of Trees and Shrubs. Cornell University Press, Ithaca, NY.
49. Spielman, L. 1985. A monograph of Valsa on hardwoods in North America. Can. J. Bot. 63:1355-1387.
50. Stein, A., Kocks, C. G., Zadoks, J. C., Frinking, H. D., Ruissen, M. A., and Myers, D. E. 1994. A geostatistical analysis of the spatio-temporal development of downy mildew in cabbage. Phytopathology 84:1227-1239.
51. Stone, A. G., Vallad, G. E., Cooperband, L. R., Rotenberg, D., Darby, H. M., James, R. V., Stevenson, W. R., and Goodman, R. M. 2003. Effect of organic amendments on soilborne and foliar diseases in field-grown snap bean and cucumber. Plant Dis. 87:1037-1042.
52. Tavella, L., and Gianetti, G. 2006. Le principali avversità del nocciolo in Piemonte. Petria 16:45-58.
53. Tombesi, A. 1991. Il Nocciolo. Pages 614-630 in: Frutticol Speciale. Reda, Rome.
54. Warncke, D. 1996. Soil and plant tissue testing for nitrogen management in carrots. Commun. Soil Sci. Plant Anal. 27:597-605.
55. Westerveld, S., McDonald, M. R., and McKeown, A. W. 2006. Carrot yield, quality, and storability in relation to preplant and residual nitrogen on mineral and organic soils. Hortic. Technol. 16:286-293.
56. Worrall, J., Adams, G., and Tharpi, S. 2010. Summer heat and an epidemic of Cytospora canker of Alnus. Can. J. Plant Pathol. 32:376-386.
57. Wu, B. M., Van Bruggen, A. H., Subbarao, K. V, and Pennings, G. G. 2001. Spatial analysis of lettuce downy mildew using geostatistics and geographic information systems. Phytopathology 91:134-142.
58. Zhang, W. 1997. Disease suppression and systemic acquired resistance induced in plants by compost-amended potting mixes, compost water extracts, and no-tillage soil. Ph.D. thesis, Ohio State University.