long-term drought severity variations in morocco
TRANSCRIPT
Long-term drought severity variations in Morocco
Jan Esper,1 David Frank,1 Ulf Buntgen,1 Anne Verstege,1 Jurg Luterbacher,2
and Elena Xoplaki2
Received 30 May 2007; revised 17 July 2007; accepted 26 July 2007; published 5 September 2007.
[1] Cedrus atlantica ring width data are used toreconstruct long-term changes in the Palmer DroughtSeverity Index (PDSI) over the past 953 years inMorocco, NW Africa. The reconstruction captures the dryconditions since the 1980s well and places this extremeperiod within a millennium-long context. PDSI values wereabove average for most of the 1450–1980 period, which letrecent drought appear exceptional. However, our resultsalso indicate that this pluvial episode of the past millenniumwas preceded by generally drier conditions back to 1049.Comparison of PDSI estimates with large-scale pressurefield reconstructions revealed steady synoptic patterns fordrought conditions over the past 350 years. The long-termchanges from initially dry to pluvial to recent dry conditionsare similar to PDSI trends reported from N America, and wesuggest that they are related to long-term temperaturechanges, potentially teleconnected with ENSO variabilityand forced by solar irradiance changes. Citation: Esper, J.,
D. Frank, U. Buntgen, A. Verstege, J. Luterbacher, and E. Xoplaki
(2007), Long-term drought severity variations in Morocco,
Geophys. Res. Lett., 34, L17702, doi:10.1029/2007GL030844.
1. Introduction
[2] Analysis of the PDSI, a standardized measure ofsurface moisture conditions [Palmer, 1965], revealed dis-tinct 20th century aridity changes in vulnerable NWAfrica,including a sharp downward trend towards drier conditionsin the 1980s [Luterbacher et al., 2006, and referencestherein]. While this trend is largely related to changes inprecipitation, the persistence of drought until present seemsto be forced additionally by regional surface warming [Daiet al., 2004].[3] Drought of this duration and magnitude has severe
socio-ecological consequences. Yet a high-resolution long-term reconstruction that could place current conditions inthe context of the past millennium [Treydte et al., 2006;Cook et al., 2004] is missing for N Africa. Such anevaluation of modern drought requires the analysis of proxydata that (i) include updated measurements into the 21stcentury, (ii) are capable of retaining both high and lowfrequency variability related to PDSI variation, and (iii) spanmuch of the past millennium.[4] Analyses of Cedrus atlantica ring width data from
Morocco indicate sensitivity of these trees to precipitationvariation [Esper et al., 2006], the PDSI [Guiot et al., 2005]
and NAO variations [Glueck and Stockton, 2001;Cook et al.,2002], and allowed spatial patterns of moisture anomaliesover the past 150 years to be derived [Chbouki et al., 1995].Till and Guiot [1990] used cedar trees sampled in the mid1970s, and reconstructed annual to multi-decadal scaleprecipitation variation back to the 12th century.[5] Here we re-use Cedrus atlantica tree-ring data gen-
erated in the 1980s [Glueck and Stockton, 2001] andcombine these measurements with a major update collectedin 2002. This update allows analysis of tree growth andinstrumental data during the current drought episode incomparison to PDSI estimates back to AD 1049. Our studyis designed to retain the full spectrum of PDSI variability,from inter-annual to centennial scales. Emphasis is placedon mid-troposphere synoptic modes that trigger extreme dryand wet conditions in Morocco.
2. Material and Methods
2.1. PDSI and Tree-Ring Data
[6] We used monthly 2.5� gridded PDSI data from Dai etal. [2004] as the target drought metric, and specified themean of four highly correlated grid points for proxycalibration (Figure 1). Data were considered back to 1931,as several meteorological stations, including Midelt in thecenter of the old growth tree sites, started recording precip-itation then [Knippertz et al., 2003]. With a lag-1 autocor-relation of about 0.7 over the 1931–2001 period, PDSIpersistence is similar to that of cedar tree-rings, suggesting amatch between the spectral properties of the predictor andpredictand [Frank and Esper, 2005].[7] Tree-ring data used in this study include�64,000 annual
ring width measurements from Cedrus atlantica trees sam-pled in 1985 [Glueck and Stockton, 2001], and a newercollection of �100,000 measurements sampled in 2002.While the original dataset also contains sites with younger(<400 years) trees in the Rif, Middle and High Atlas, theupdate focused on old growth cedar forests (except for Iso;see auxiliary Table S11). In the 2002 field campaign wesampled all tree age classes to allow for comparisons ofsignals between differently aged cedars.[8] Four sites from elevations >2,100 m in the Middle
(Tiz and Col) and High Atlas (Tou and Jaf) had cedar trees>500 years. As these sites are within a radius of about 50 kmand mean site chronologies share common high to lowfrequency variance, we merged the old growth sites to acombined dataset TCTJ. TCTJ integrates 326 tree-ringseries with a mean length of 412 years. For the purposeof exploring PDSI-related long-term trends and to evaluatepotential biases in juvenile tree-rings, we also used subsets
1Auxiliary material data sets are available at ftp://ftp.agu.org/apend/gl/2007gl030844. Other auxiliary material files are in the HTML.
GEOPHYSICAL RESEARCH LETTERS, VOL. 34, L17702, doi:10.1029/2007GL030844, 2007ClickHere
for
FullArticle
1Swiss Federal Research Institute for Forest, Snow and LandscapeResearch, Birmensdorf, Switzerland.
2National Centre of Competence in Research on Climate (NCCR) andInstitute of Geography, University of Bern, Bern, Switzerland.
Copyright 2007 by the American Geophysical Union.0094-8276/07/2007GL030844$05.00
L17702 1 of 5
of TCTJ where we excluded trees younger than AD 1600and even 1400 (see auxiliary material).
2.2. Reconstruction Trials
[9] We applied various detrending techniques to theTCTJ datasets to evaluate long-term trends in resultingchronologies (see auxiliary material). These includedRegional Curve Standardization (RCS) [Esper et al.,2003a], Age Banding [Briffa et al., 2001], individualnegative exponential detrending [Fritts, 1976], and regularnormalization [Esper et al., 2003b]. Resulting chronologiesare termed RCS, RCS Old, AgeBand, NegExp, and Norm.
[10] For drought reconstruction we spliced the (shorter)Norm and (longer) RCS Old chronology to Norm-RCS (seeFigure S6), and regressed this record over the 1931–2001period against February–June PDSI data [Dai et al., 2004].For calibration/verification tests we utilized the 1931–1965and 1966–2001 sub-periods with the R2, RE, and CEstatistics [Cook et al., 1994], and analyzed trend in regres-sion residuals. Three types of error were assigned toestimate reconstruction uncertainty over the past millenni-um. These include error from (i) the difficulty of selectingthe most appropriate detrending method (detrending error),(ii) the temporally changing number and variance of ringwidth series combined in a chronology (chronology error),and (iii) the unexplained variance in the calibration regres-sion model (calibration error).[11] For circulation pattern analysis, we used European
scale gridded 500 hPa geopotential height data over the1948–2002 period [Kistler et al., 2001] and reconstructedfields at monthly resolution back to 1659 [Luterbacher etal., 2002]. A scaled composite analysis [Brown and Hall,1999] was applied to extract the relevant mid-tropospherepressure patterns triggering extreme PDSI anomalies, i.e.,years that exceed 1.5 standard deviations from the long-termmean. Circulation pattern detection was applied over the full1659–2001 period, and the 1948–2001 and pre-1900 sub-periods.
3. Results
3.1. PDSI History
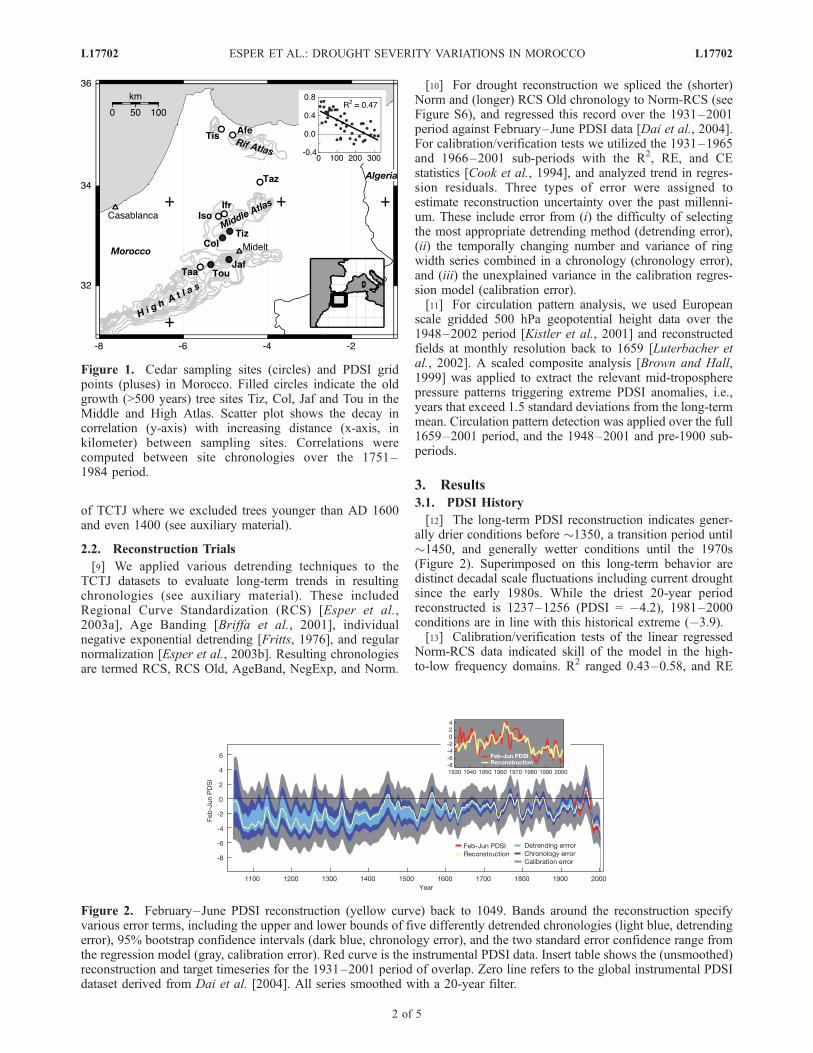
[12] The long-term PDSI reconstruction indicates gener-ally drier conditions before �1350, a transition period until�1450, and generally wetter conditions until the 1970s(Figure 2). Superimposed on this long-term behavior aredistinct decadal scale fluctuations including current droughtsince the early 1980s. While the driest 20-year periodreconstructed is 1237–1256 (PDSI = �4.2), 1981–2000conditions are in line with this historical extreme (�3.9).[13] Calibration/verification tests of the linear regressed
Norm-RCS data indicated skill of the model in the high-to-low frequency domains. R2 ranged 0.43–0.58, and RE
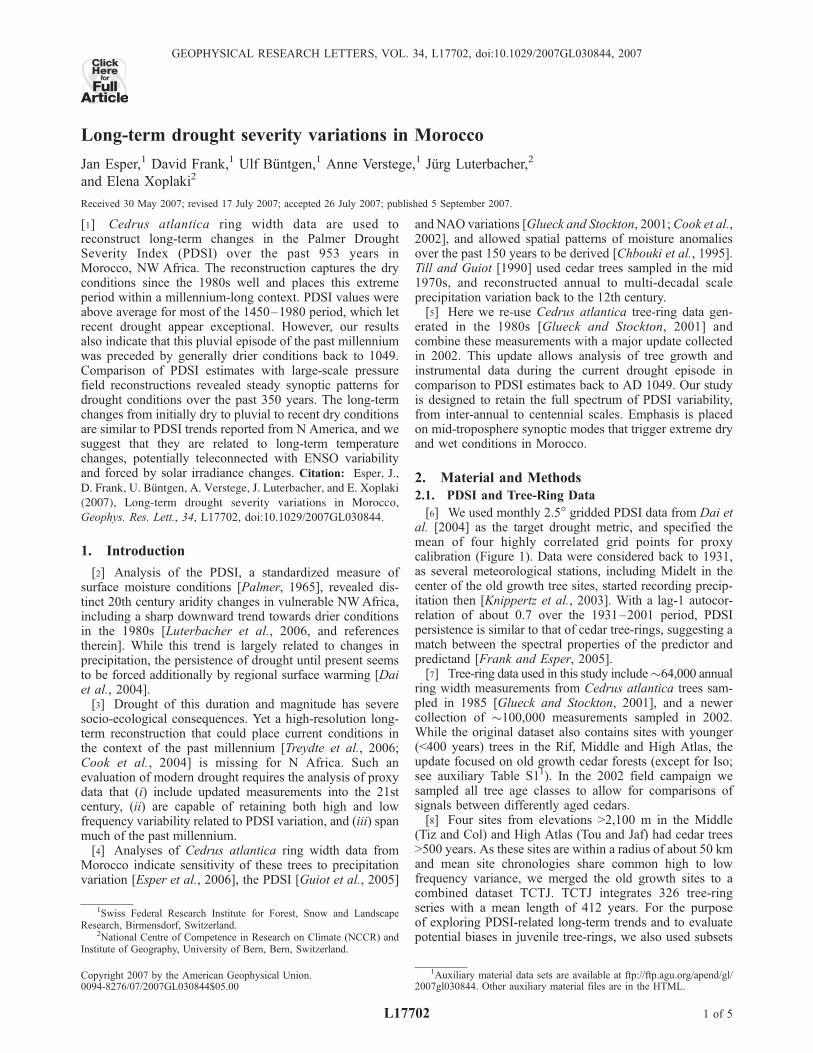
Figure 1. Cedar sampling sites (circles) and PDSI gridpoints (pluses) in Morocco. Filled circles indicate the oldgrowth (>500 years) tree sites Tiz, Col, Jaf and Tou in theMiddle and High Atlas. Scatter plot shows the decay incorrelation (y-axis) with increasing distance (x-axis, inkilometer) between sampling sites. Correlations werecomputed between site chronologies over the 1751–1984 period.
Figure 2. February–June PDSI reconstruction (yellow curve) back to 1049. Bands around the reconstruction specifyvarious error terms, including the upper and lower bounds of five differently detrended chronologies (light blue, detrendingerror), 95% bootstrap confidence intervals (dark blue, chronology error), and the two standard error confidence range fromthe regression model (gray, calibration error). Red curve is the instrumental PDSI data. Insert table shows the (unsmoothed)reconstruction and target timeseries for the 1931–2001 period of overlap. Zero line refers to the global instrumental PDSIdataset derived from Dai et al. [2004]. All series smoothed with a 20-year filter.
L17702 ESPER ET AL.: DROUGHT SEVERITY VARIATIONS IN MOROCCO L17702
2 of 5
and CE 0.63–0.67 and 0.35–0.50, respectively (seeTable S2). When calibrated over the full 1931–2001 period,the model explains 56% of February–June PDSI variability,and analysis of the regression revealed little trend in modelresiduals. The February–June seasonality is, however, notvery distinct, as monthly PDSI series are highly correlated.Similarly good results were thus obtained when includingcold season months (e.g., October–June). Importantly, thechange from wet conditions until the 1970s to subsequentlydry conditions is fully retained in the proxy data. Most ofthe reconstructed, pre-instrumental variance is captured inthe 1931–2001 calibration period, both suggesting a robustcalibration as little extrapolation outside the calibrationinterval occurs and emphasizing the extreme nature of therecent moisture fluctuations.[14] While the (conservatively) stacked errors (Figure 2)
indicate some decadal scale droughts (e.g., ca. 1800s,1880s, 1980/90s, and earlier in the last millennium ca.1350s and 1520s) deviate significantly from the instrumen-tal mean, confidence of the long-term trends remains lower.This assessment reflects both the greater uncertainty inlow-frequency variation from detrending, and how theindividual errors are combined. For comparison, seeFigure S7 for the narrower uncertainty bands derived fromroot-summed-squared errors.
3.2. Regional to Large-Scale Comparison
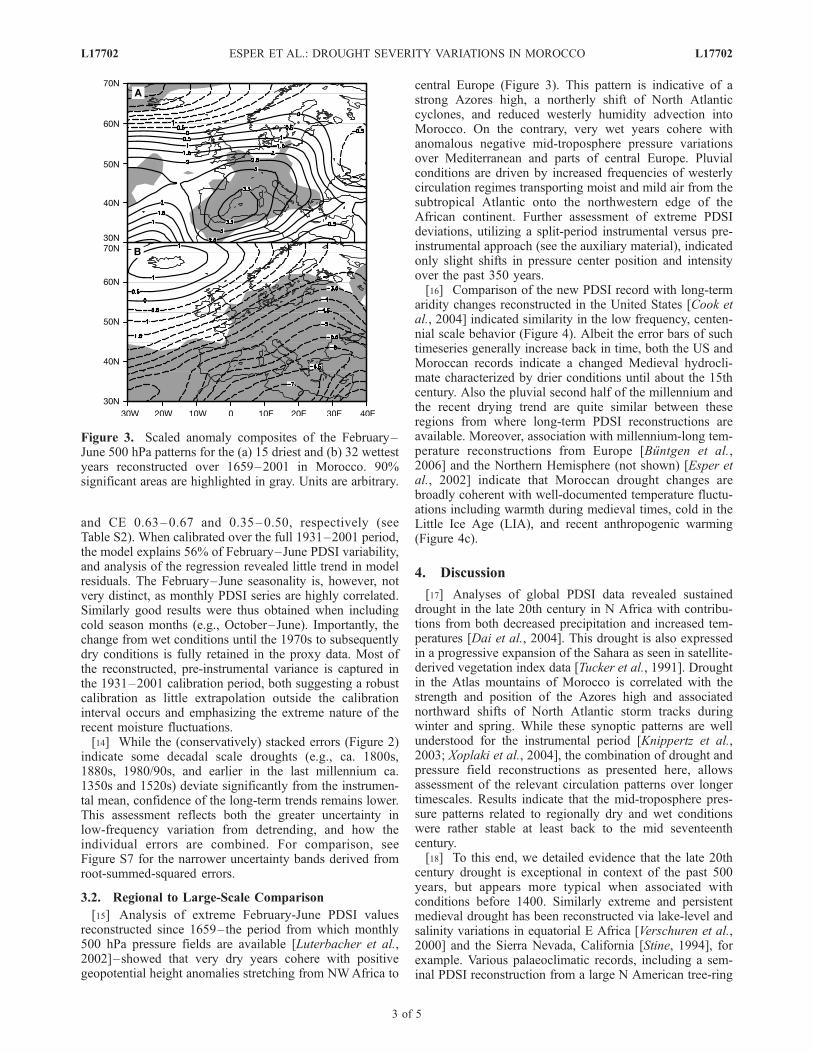
[15] Analysis of extreme February-June PDSI valuesreconstructed since 1659–the period from which monthly500 hPa pressure fields are available [Luterbacher et al.,2002]–showed that very dry years cohere with positivegeopotential height anomalies stretching from NWAfrica to
central Europe (Figure 3). This pattern is indicative of astrong Azores high, a northerly shift of North Atlanticcyclones, and reduced westerly humidity advection intoMorocco. On the contrary, very wet years cohere withanomalous negative mid-troposphere pressure variationsover Mediterranean and parts of central Europe. Pluvialconditions are driven by increased frequencies of westerlycirculation regimes transporting moist and mild air from thesubtropical Atlantic onto the northwestern edge of theAfrican continent. Further assessment of extreme PDSIdeviations, utilizing a split-period instrumental versus pre-instrumental approach (see the auxiliary material), indicatedonly slight shifts in pressure center position and intensityover the past 350 years.[16] Comparison of the new PDSI record with long-term
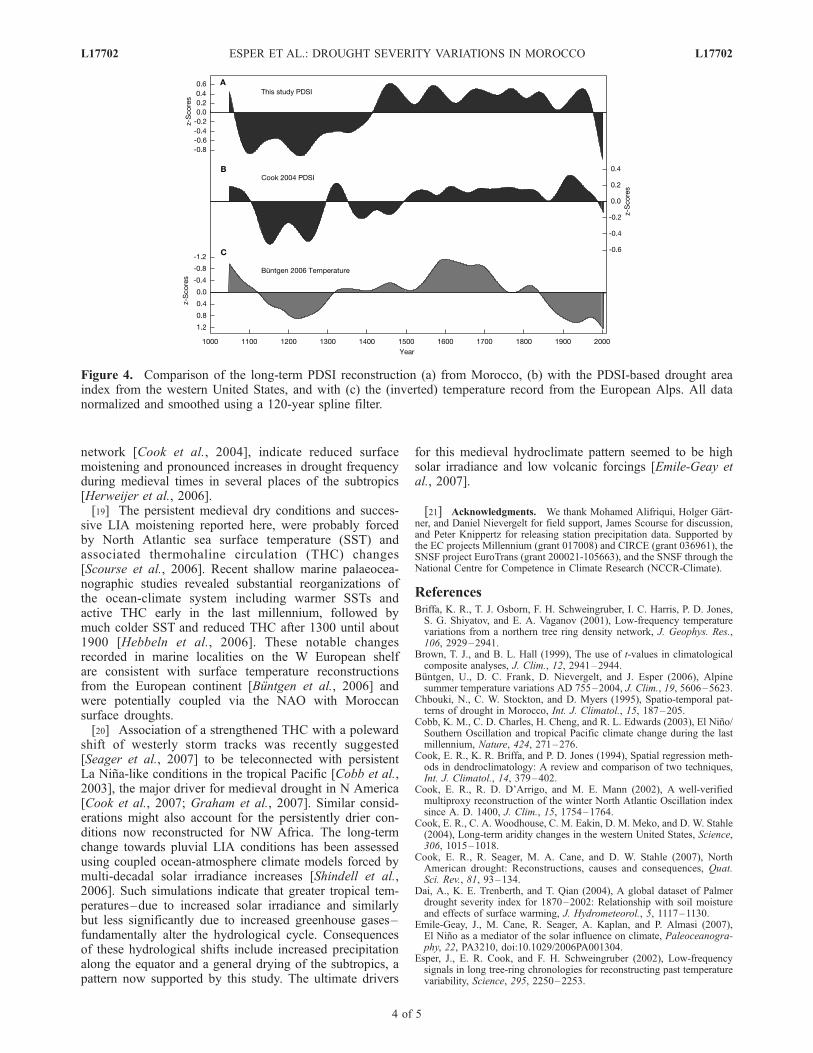
aridity changes reconstructed in the United States [Cook etal., 2004] indicated similarity in the low frequency, centen-nial scale behavior (Figure 4). Albeit the error bars of suchtimeseries generally increase back in time, both the US andMoroccan records indicate a changed Medieval hydrocli-mate characterized by drier conditions until about the 15thcentury. Also the pluvial second half of the millennium andthe recent drying trend are quite similar between theseregions from where long-term PDSI reconstructions areavailable. Moreover, association with millennium-long tem-perature reconstructions from Europe [Buntgen et al.,2006] and the Northern Hemisphere (not shown) [Esper etal., 2002] indicate that Moroccan drought changes arebroadly coherent with well-documented temperature fluctu-ations including warmth during medieval times, cold in theLittle Ice Age (LIA), and recent anthropogenic warming(Figure 4c).
4. Discussion
[17] Analyses of global PDSI data revealed sustaineddrought in the late 20th century in N Africa with contribu-tions from both decreased precipitation and increased tem-peratures [Dai et al., 2004]. This drought is also expressedin a progressive expansion of the Sahara as seen in satellite-derived vegetation index data [Tucker et al., 1991]. Droughtin the Atlas mountains of Morocco is correlated with thestrength and position of the Azores high and associatednorthward shifts of North Atlantic storm tracks duringwinter and spring. While these synoptic patterns are wellunderstood for the instrumental period [Knippertz et al.,2003; Xoplaki et al., 2004], the combination of drought andpressure field reconstructions as presented here, allowsassessment of the relevant circulation patterns over longertimescales. Results indicate that the mid-troposphere pres-sure patterns related to regionally dry and wet conditionswere rather stable at least back to the mid seventeenthcentury.[18] To this end, we detailed evidence that the late 20th
century drought is exceptional in context of the past 500years, but appears more typical when associated withconditions before 1400. Similarly extreme and persistentmedieval drought has been reconstructed via lake-level andsalinity variations in equatorial E Africa [Verschuren et al.,2000] and the Sierra Nevada, California [Stine, 1994], forexample. Various palaeoclimatic records, including a sem-inal PDSI reconstruction from a large N American tree-ring
Figure 3. Scaled anomaly composites of the February–June 500 hPa patterns for the (a) 15 driest and (b) 32 wettestyears reconstructed over 1659–2001 in Morocco. 90%significant areas are highlighted in gray. Units are arbitrary.
L17702 ESPER ET AL.: DROUGHT SEVERITY VARIATIONS IN MOROCCO L17702
3 of 5
network [Cook et al., 2004], indicate reduced surfacemoistening and pronounced increases in drought frequencyduring medieval times in several places of the subtropics[Herweijer et al., 2006].[19] The persistent medieval dry conditions and succes-
sive LIA moistening reported here, were probably forcedby North Atlantic sea surface temperature (SST) andassociated thermohaline circulation (THC) changes[Scourse et al., 2006]. Recent shallow marine palaeocea-nographic studies revealed substantial reorganizations ofthe ocean-climate system including warmer SSTs andactive THC early in the last millennium, followed bymuch colder SST and reduced THC after 1300 until about1900 [Hebbeln et al., 2006]. These notable changesrecorded in marine localities on the W European shelfare consistent with surface temperature reconstructionsfrom the European continent [Buntgen et al., 2006] andwere potentially coupled via the NAO with Moroccansurface droughts.[20] Association of a strengthened THC with a poleward
shift of westerly storm tracks was recently suggested[Seager et al., 2007] to be teleconnected with persistentLa Nina-like conditions in the tropical Pacific [Cobb et al.,2003], the major driver for medieval drought in N America[Cook et al., 2007; Graham et al., 2007]. Similar consid-erations might also account for the persistently drier con-ditions now reconstructed for NW Africa. The long-termchange towards pluvial LIA conditions has been assessedusing coupled ocean-atmosphere climate models forced bymulti-decadal solar irradiance increases [Shindell et al.,2006]. Such simulations indicate that greater tropical tem-peratures–due to increased solar irradiance and similarlybut less significantly due to increased greenhouse gases–fundamentally alter the hydrological cycle. Consequencesof these hydrological shifts include increased precipitationalong the equator and a general drying of the subtropics, apattern now supported by this study. The ultimate drivers
for this medieval hydroclimate pattern seemed to be highsolar irradiance and low volcanic forcings [Emile-Geay etal., 2007].
[21] Acknowledgments. We thank Mohamed Alifriqui, Holger Gart-ner, and Daniel Nievergelt for field support, James Scourse for discussion,and Peter Knippertz for releasing station precipitation data. Supported bythe EC projects Millennium (grant 017008) and CIRCE (grant 036961), theSNSF project EuroTrans (grant 200021-105663), and the SNSF through theNational Centre for Competence in Climate Research (NCCR-Climate).
ReferencesBriffa, K. R., T. J. Osborn, F. H. Schweingruber, I. C. Harris, P. D. Jones,S. G. Shiyatov, and E. A. Vaganov (2001), Low-frequency temperaturevariations from a northern tree ring density network, J. Geophys. Res.,106, 2929–2941.
Brown, T. J., and B. L. Hall (1999), The use of t-values in climatologicalcomposite analyses, J. Clim., 12, 2941–2944.
Buntgen, U., D. C. Frank, D. Nievergelt, and J. Esper (2006), Alpinesummer temperature variations AD 755–2004, J. Clim., 19, 5606–5623.
Chbouki, N., C. W. Stockton, and D. Myers (1995), Spatio-temporal pat-terns of drought in Morocco, Int. J. Climatol., 15, 187–205.
Cobb, K. M., C. D. Charles, H. Cheng, and R. L. Edwards (2003), El Nino/Southern Oscillation and tropical Pacific climate change during the lastmillennium, Nature, 424, 271–276.
Cook, E. R., K. R. Briffa, and P. D. Jones (1994), Spatial regression meth-ods in dendroclimatology: A review and comparison of two techniques,Int. J. Climatol., 14, 379–402.
Cook, E. R., R. D. D’Arrigo, and M. E. Mann (2002), A well-verifiedmultiproxy reconstruction of the winter North Atlantic Oscillation indexsince A. D. 1400, J. Clim., 15, 1754–1764.
Cook, E. R., C. A. Woodhouse, C. M. Eakin, D. M. Meko, and D. W. Stahle(2004), Long-term aridity changes in the western United States, Science,306, 1015–1018.
Cook, E. R., R. Seager, M. A. Cane, and D. W. Stahle (2007), NorthAmerican drought: Reconstructions, causes and consequences, Quat.Sci. Rev., 81, 93–134.
Dai, A., K. E. Trenberth, and T. Qian (2004), A global dataset of Palmerdrought severity index for 1870–2002: Relationship with soil moistureand effects of surface warming, J. Hydrometeorol., 5, 1117–1130.
Emile-Geay, J., M. Cane, R. Seager, A. Kaplan, and P. Almasi (2007),El Nino as a mediator of the solar influence on climate, Paleoceanogra-phy, 22, PA3210, doi:10.1029/2006PA001304.
Esper, J., E. R. Cook, and F. H. Schweingruber (2002), Low-frequencysignals in long tree-ring chronologies for reconstructing past temperaturevariability, Science, 295, 2250–2253.
Figure 4. Comparison of the long-term PDSI reconstruction (a) from Morocco, (b) with the PDSI-based drought areaindex from the western United States, and with (c) the (inverted) temperature record from the European Alps. All datanormalized and smoothed using a 120-year spline filter.
L17702 ESPER ET AL.: DROUGHT SEVERITY VARIATIONS IN MOROCCO L17702
4 of 5
Esper, J., E. R. Cook, P. J. Krusic, K. Peters, and F. H. Schweingruber(2003a), Tests of the RCS method for preserving low-frequency varia-bility in long tree-ring chronologies, Tree Ring Res., 59, 81–98.
Esper, J., S. G. Shiyatov, V. S. Mazepa, R. J. S. Wilson, D. A. Graybill, andG. Funkhouser (2003b), Temperature-sensitive Tien Shan tree ring chron-ologies show multi-centennial growth trends, Clim. Dyn., 8, 699–706.
Esper, J., U. Buntgen, D. C. Frank, D. Nievergelt, K. Treydte, andA.Verstege(2006),Multiple tree-ring parameters fromAtlas cedar (Morocco) and theirclimatic signal, in Tree Rings in Archaeology, Climatology and Ecology,Reihe Umwelt Environ., vol. 61, edited by I. Heinrich et al., pp. 46–55,Forschungszentrum Julich, Julich, Germany.
Frank, D., and J. Esper (2005), Temperature reconstructions and compar-isons with instrumental data from a tree-ring network for the EuropeanAlps, Int. J. Climatol., 25, 1437–1454.
Fritts, H. C. (1976), Tree Rings and Climate, 567 pp., Academic, London.Glueck, M. F., and C. W. Stockton (2001), Reconstruction of the NorthAtlantic Oscillation, 1429–1983, Int. J. Climatol., 21, 1453–1465.
Graham, N. E., et al. (2007), Tropical Pacific mid-latitude teleconnectionsin medieval times, Clim. Change, 83, 241–285.
Guiot, J., S. Alleaume, A. Nicault, and S. Brewer (2005), The Mediterra-nean droughts during the last 650 years: Reconstruction from tree-ringsand climate model simulation, Geophys. Res. Abstracts, 7, 02471.
Hebbeln, D., et al. (2006), Late Holocene coastal hydrographic and climatechanges in the eastern North Sea, Holocene, 16, 987–1001.
Herweijer, C., R. Seager, and E. R. Cook (2006), North American droughtsof the mid to late nineteenth century: A history, simulation and implica-tion for mediaeval drought, Holocene, 16, 159–171.
Kistler, R., et al. (2001), The NCEP-NCAR 50-year reanalysis: Monthlymeans CD-ROM and documentation, Bull. Am. Meteorol. Soc., 82, 247–267.
Knippertz, P., M. Christoph, and P. Speth (2003), Long-term precipitationvariability in Morocco and the link to the large-scale circulation in recentand future climates, Meteorol. Atmos. Phys., 83, 67–88.
Luterbacher, J., E. Xoplaki, D. Dietrich, R. Rickli, J. Jacobeit, C. Beck,D. Gyalistras, C. Schmutz, and H. Wanner (2002), Reconstruction ofsea-level pressure fields over the eastern North Atlantic and Europeback to 1500, Clim. Dyn., 18, 545–561.
Luterbacher, J., et al. (2006), Mediterranean climate variability over the lastcenturies: A review, in The Mediterranean Climate, edited by P. Lionelloet al., pp. 27–148, Elsevier, Amsterdam.
Palmer, W. C. (1965), Meteorological drought, Res. Pap. 45, 58 pp., U. S.Dep. of Commer., Washington, D. C.
Scourse, J., H. P. Sejrup, and P. D. Jones (2006), Late Holocene oceano-graphic and climate change from the western European margin: Theresults of the Holsmeer project, Holocene, 16, 931–935.
Seager, R., N. Graham, C. Herweijer, A. L. Gordon, Y. Kushnir, and E. Cook(2007), Blueprints for medieval hydroclimate, Quat. Sci. Rev., in press.
Shindell, D. T., G. Faluvegi, R. L. Miller, G. A. Schmidt, J. E. Hansen, andS. Sun (2006), Solar and anthropogenic forcing of tropical hydrology,Geophys. Res. Lett., 33, L24706, doi:10.1029/2006GL027468.
Stine, S. (1994), Extreme and persistent drought in California and Patago-nia during mediaeval time, Nature, 369, 546–549.
Till, C., and J. Guiot (1990), Reconstruction of precipitation in Moroccosince 1100 A. D. based on Cedrus atlantica tree-ring widths, Quat. Res.,33, 337–351.
Treydte, K., G. H. Schleser, G. Helle, D. C. Frank, M. Winiger, G. H. Haug,and J. Esper (2006), Millennium-long precipitation record from tree-ringoxygen isotopes in northern Pakistan, Nature, 440, 1179–1182.
Tucker, C. J., H. E. Dregne, and W. W. Newcomb (1991), Expansion andcontraction of the Sahara Desert from 1980 to 1990, Science, 253, 299–301.
Verschuren, D., K. R. Laird, and B. F. Cumming (2000), Rainfall anddrought in equatorial East Africa during the past 1100 years, Nature,403, 410–414.
Xoplaki, E., J. F. Gonzalez-Rouco, J. Luterbacher, and H. Wanner (2004),Wet season Mediterranean precipitation variability: Influence of large-scale dynamics and trends, Clim. Dyn., 23, 63–78.
�����������������������U. Buntgen, J. Esper, D. Frank, and A. Verstege, Swiss Federal Research
Institute for Forest, Snow and Landscape Research, CH-8903 Birmensdorf,Switzerland. ([email protected])J. Luterbacher and E. Xoplaki, National Centre of Competence in
Research on Climate (NCCR) and Institute of Geography, University ofBern, CH-3012 Bern, Switzerland.
L17702 ESPER ET AL.: DROUGHT SEVERITY VARIATIONS IN MOROCCO L17702
5 of 5
1
Auxiliary Material
Long-term drought severity variations in Morocco
Jan Esper1, David Frank1, Ulf Büntgen1, Anne Verstege1, Jürg Luterbacher2, Elena Xoplaki2
1 Swiss Federal Research Institute WSL, Birmensdorf, Switzerland 2 National Centre of Competence in Research on Climate (NCCR) and Institute of Geography, University of
Bern, Bern, Switzerland.
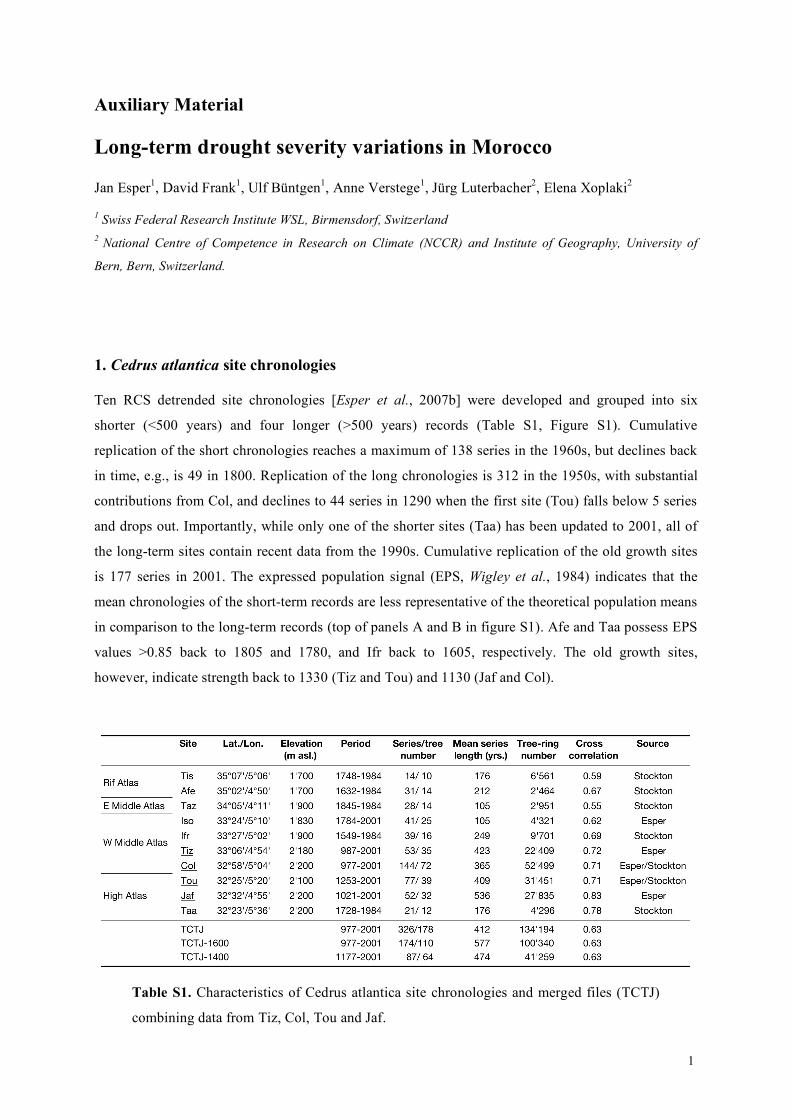
1. Cedrus atlantica site chronologies
Ten RCS detrended site chronologies [Esper et al., 2007b] were developed and grouped into six
shorter (<500 years) and four longer (>500 years) records (Table S1, Figure S1). Cumulative
replication of the short chronologies reaches a maximum of 138 series in the 1960s, but declines back
in time, e.g., is 49 in 1800. Replication of the long chronologies is 312 in the 1950s, with substantial
contributions from Col, and declines to 44 series in 1290 when the first site (Tou) falls below 5 series
and drops out. Importantly, while only one of the shorter sites (Taa) has been updated to 2001, all of
the long-term sites contain recent data from the 1990s. Cumulative replication of the old growth sites
is 177 series in 2001. The expressed population signal (EPS, Wigley et al., 1984) indicates that the
mean chronologies of the short-term records are less representative of the theoretical population means
in comparison to the long-term records (top of panels A and B in figure S1). Afe and Taa possess EPS
values >0.85 back to 1805 and 1780, and Ifr back to 1605, respectively. The old growth sites,
however, indicate strength back to 1330 (Tiz and Tou) and 1130 (Jaf and Col).
Table S1. Characteristics of Cedrus atlantica site chronologies and merged files (TCTJ)
combining data from Tiz, Col, Tou and Jaf.
2
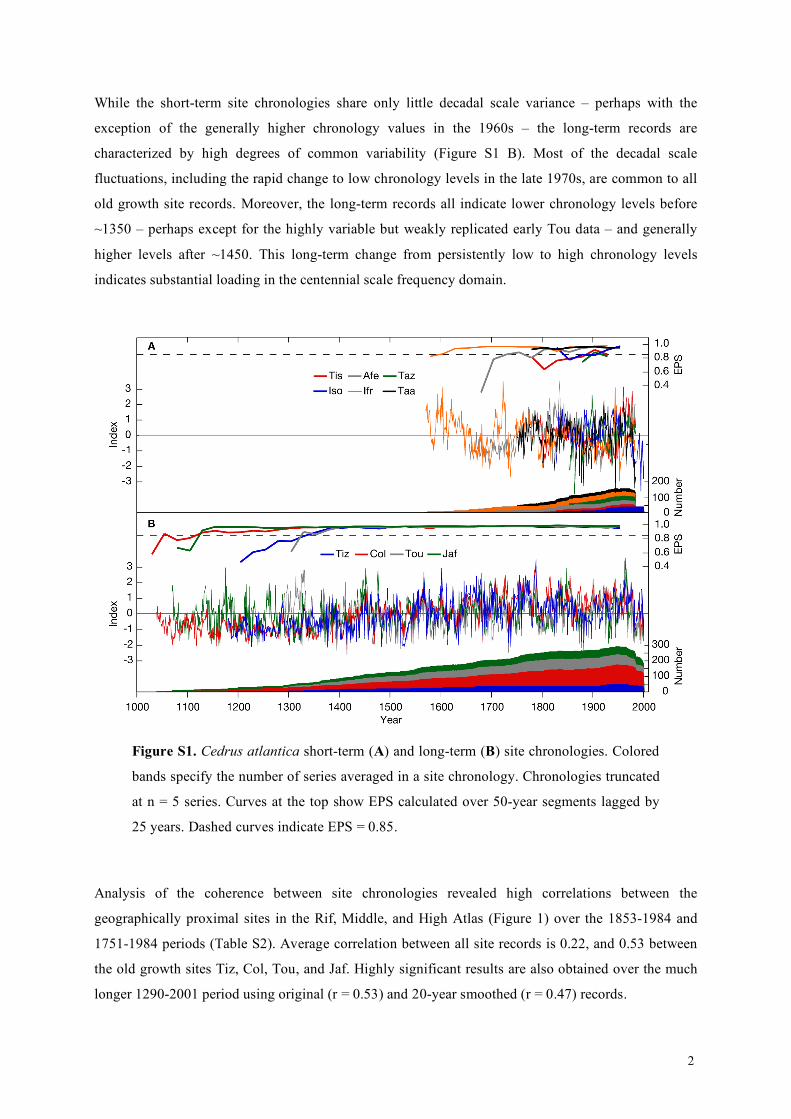
While the short-term site chronologies share only little decadal scale variance – perhaps with the
exception of the generally higher chronology values in the 1960s – the long-term records are
characterized by high degrees of common variability (Figure S1 B). Most of the decadal scale
fluctuations, including the rapid change to low chronology levels in the late 1970s, are common to all
old growth site records. Moreover, the long-term records all indicate lower chronology levels before
~1350 – perhaps except for the highly variable but weakly replicated early Tou data – and generally
higher levels after ~1450. This long-term change from persistently low to high chronology levels
indicates substantial loading in the centennial scale frequency domain.
Figure S1. Cedrus atlantica short-term (A) and long-term (B) site chronologies. Colored
bands specify the number of series averaged in a site chronology. Chronologies truncated
at n = 5 series. Curves at the top show EPS calculated over 50-year segments lagged by
25 years. Dashed curves indicate EPS = 0.85.
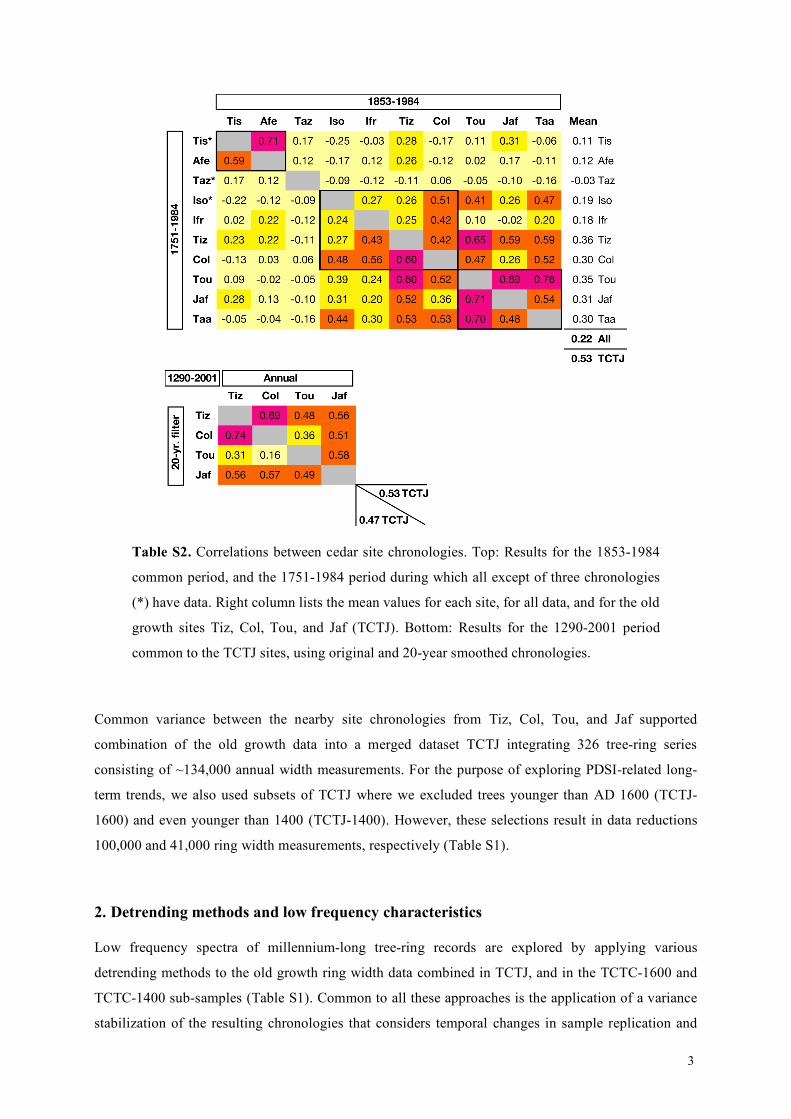
Analysis of the coherence between site chronologies revealed high correlations between the
geographically proximal sites in the Rif, Middle, and High Atlas (Figure 1) over the 1853-1984 and
1751-1984 periods (Table S2). Average correlation between all site records is 0.22, and 0.53 between
the old growth sites Tiz, Col, Tou, and Jaf. Highly significant results are also obtained over the much
longer 1290-2001 period using original (r = 0.53) and 20-year smoothed (r = 0.47) records.
3
Table S2. Correlations between cedar site chronologies. Top: Results for the 1853-1984
common period, and the 1751-1984 period during which all except of three chronologies
(*) have data. Right column lists the mean values for each site, for all data, and for the old
growth sites Tiz, Col, Tou, and Jaf (TCTJ). Bottom: Results for the 1290-2001 period
common to the TCTJ sites, using original and 20-year smoothed chronologies.
Common variance between the nearby site chronologies from Tiz, Col, Tou, and Jaf supported
combination of the old growth data into a merged dataset TCTJ integrating 326 tree-ring series
consisting of ~134,000 annual width measurements. For the purpose of exploring PDSI-related long-
term trends, we also used subsets of TCTJ where we excluded trees younger than AD 1600 (TCTJ-
1600) and even younger than 1400 (TCTJ-1400). However, these selections result in data reductions
100,000 and 41,000 ring width measurements, respectively (Table S1).
2. Detrending methods and low frequency characteristics
Low frequency spectra of millennium-long tree-ring records are explored by applying various
detrending methods to the old growth ring width data combined in TCTJ, and in the TCTC-1600 and
TCTC-1400 sub-samples (Table S1). Common to all these approaches is the application of a variance
stabilization of the resulting chronologies that considers temporal changes in sample replication and
4
interseries correlation [Frank et al., 2007], and the utilization of the arithmetic mean for chronology
calculation. MTM power spectra [Mann and Lees, 1996] are used to analyze low frequency
differences between chronologies.
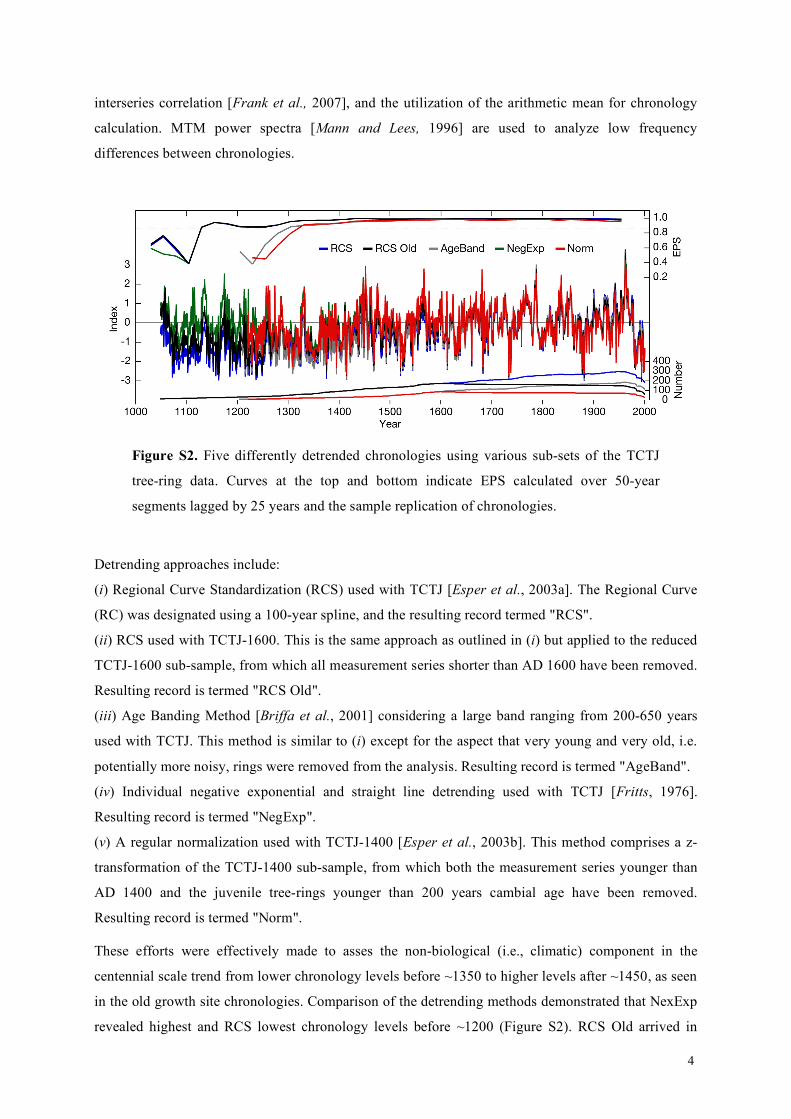
Figure S2. Five differently detrended chronologies using various sub-sets of the TCTJ
tree-ring data. Curves at the top and bottom indicate EPS calculated over 50-year
segments lagged by 25 years and the sample replication of chronologies.
Detrending approaches include:
(i) Regional Curve Standardization (RCS) used with TCTJ [Esper et al., 2003a]. The Regional Curve
(RC) was designated using a 100-year spline, and the resulting record termed "RCS".
(ii) RCS used with TCTJ-1600. This is the same approach as outlined in (i) but applied to the reduced
TCTJ-1600 sub-sample, from which all measurement series shorter than AD 1600 have been removed.
Resulting record is termed "RCS Old".
(iii) Age Banding Method [Briffa et al., 2001] considering a large band ranging from 200-650 years
used with TCTJ. This method is similar to (i) except for the aspect that very young and very old, i.e.
potentially more noisy, rings were removed from the analysis. Resulting record is termed "AgeBand".
(iv) Individual negative exponential and straight line detrending used with TCTJ [Fritts, 1976].
Resulting record is termed "NegExp".
(v) A regular normalization used with TCTJ-1400 [Esper et al., 2003b]. This method comprises a z-
transformation of the TCTJ-1400 sub-sample, from which both the measurement series younger than
AD 1400 and the juvenile tree-rings younger than 200 years cambial age have been removed.
Resulting record is termed "Norm".
These efforts were effectively made to asses the non-biological (i.e., climatic) component in the
centennial scale trend from lower chronology levels before ~1350 to higher levels after ~1450, as seen
in the old growth site chronologies. Comparison of the detrending methods demonstrated that NexExp
revealed highest and RCS lowest chronology levels before ~1200 (Figure S2). RCS Old arrived in
5
between these two extremes in this early period of the past millennium. Due to the removal of young
tree-rings in the Age Banding approach and the use of the truncated TCTJ-1400 data in the Norm
approach, these records do not reach back to 1049, and allow comparisons only until 1204 and 1221,
respectively. The EPS indicates reasonable signal strength back to about 1120 for RCS, RCS Old and
NexExp, and back to 1300 and 1320 for AgeBand and Norm, respectively.
While generally larger chronology differences are evident during the earliest portion of the past
millennium, the period between 1250 and 1360 is characterized by low variance between the long-
term records. All chronologies portray low values before ~1360 and a long-term increase until ~1450,
i.e. the differing detrendings and utilization of various sub-samples of TCTJ all support the low
frequency change during the 14th and 15th centuries, as seen in the old growth site chronologies.
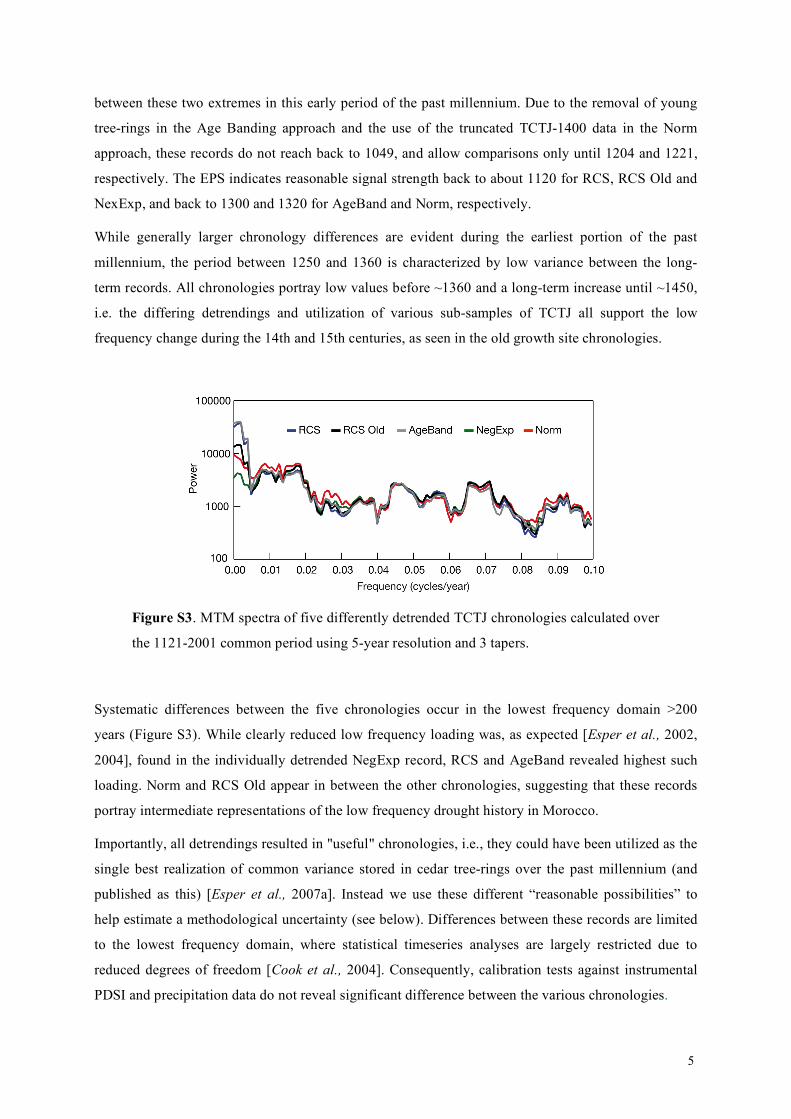
Figure S3. MTM spectra of five differently detrended TCTJ chronologies calculated over
the 1121-2001 common period using 5-year resolution and 3 tapers.
Systematic differences between the five chronologies occur in the lowest frequency domain >200
years (Figure S3). While clearly reduced low frequency loading was, as expected [Esper et al., 2002,
2004], found in the individually detrended NegExp record, RCS and AgeBand revealed highest such
loading. Norm and RCS Old appear in between the other chronologies, suggesting that these records
portray intermediate representations of the low frequency drought history in Morocco.
Importantly, all detrendings resulted in "useful" chronologies, i.e., they could have been utilized as the
single best realization of common variance stored in cedar tree-rings over the past millennium (and
published as this) [Esper et al., 2007a]. Instead we use these different “reasonable possibilities” to
help estimate a methodological uncertainty (see below). Differences between these records are limited
to the lowest frequency domain, where statistical timeseries analyses are largely restricted due to
reduced degrees of freedom [Cook et al., 2004]. Consequently, calibration tests against instrumental
PDSI and precipitation data do not reveal significant difference between the various chronologies.
6
3. Trend preservation via RCS
Analysis of the RCS method applied to all TCTJ data indicated that resulting chronologies contain
increasing long-term trends that are possibly exaggerated by the inclusion of measurement series from
younger trees. This potential bias has been assessed by splitting the TCTJ data into Young and Old
sub-samples, integrating 152 tree-ring series <AD 1600 and 174 series >AD 1600, respectively.
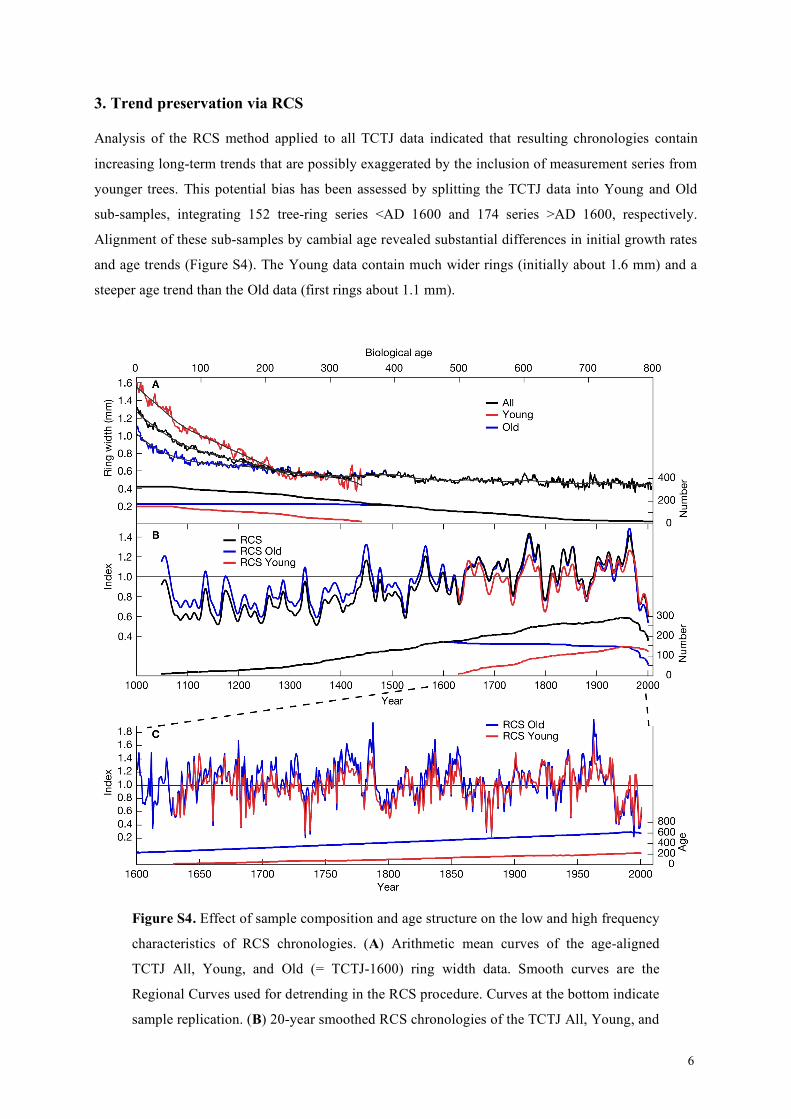
Alignment of these sub-samples by cambial age revealed substantial differences in initial growth rates
and age trends (Figure S4). The Young data contain much wider rings (initially about 1.6 mm) and a
steeper age trend than the Old data (first rings about 1.1 mm).
Figure S4. Effect of sample composition and age structure on the low and high frequency
characteristics of RCS chronologies. (A) Arithmetic mean curves of the age-aligned
TCTJ All, Young, and Old (= TCTJ-1600) ring width data. Smooth curves are the
Regional Curves used for detrending in the RCS procedure. Curves at the bottom indicate
sample replication. (B) 20-year smoothed RCS chronologies of the TCTJ All, Young, and
7
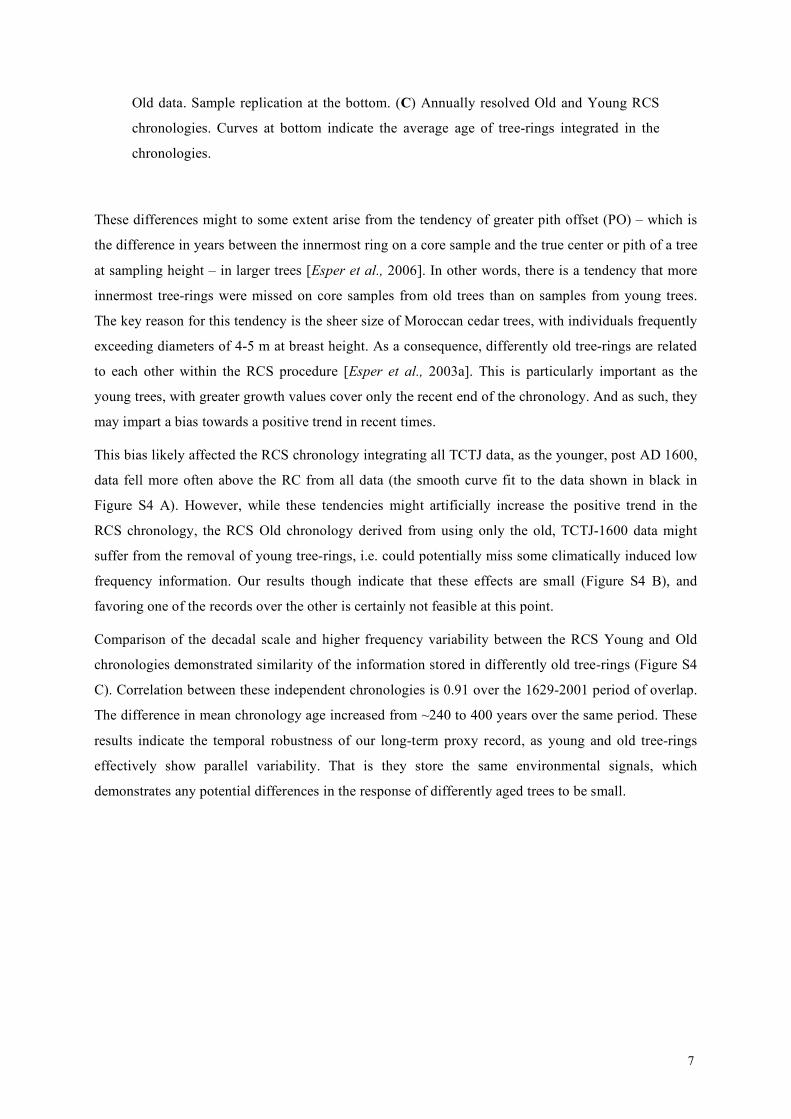
Old data. Sample replication at the bottom. (C) Annually resolved Old and Young RCS
chronologies. Curves at bottom indicate the average age of tree-rings integrated in the
chronologies.
These differences might to some extent arise from the tendency of greater pith offset (PO) – which is
the difference in years between the innermost ring on a core sample and the true center or pith of a tree
at sampling height – in larger trees [Esper et al., 2006]. In other words, there is a tendency that more
innermost tree-rings were missed on core samples from old trees than on samples from young trees.
The key reason for this tendency is the sheer size of Moroccan cedar trees, with individuals frequently
exceeding diameters of 4-5 m at breast height. As a consequence, differently old tree-rings are related
to each other within the RCS procedure [Esper et al., 2003a]. This is particularly important as the
young trees, with greater growth values cover only the recent end of the chronology. And as such, they
may impart a bias towards a positive trend in recent times.
This bias likely affected the RCS chronology integrating all TCTJ data, as the younger, post AD 1600,
data fell more often above the RC from all data (the smooth curve fit to the data shown in black in
Figure S4 A). However, while these tendencies might artificially increase the positive trend in the
RCS chronology, the RCS Old chronology derived from using only the old, TCTJ-1600 data might
suffer from the removal of young tree-rings, i.e. could potentially miss some climatically induced low
frequency information. Our results though indicate that these effects are small (Figure S4 B), and
favoring one of the records over the other is certainly not feasible at this point.
Comparison of the decadal scale and higher frequency variability between the RCS Young and Old
chronologies demonstrated similarity of the information stored in differently old tree-rings (Figure S4
C). Correlation between these independent chronologies is 0.91 over the 1629-2001 period of overlap.
The difference in mean chronology age increased from ~240 to 400 years over the same period. These
results indicate the temporal robustness of our long-term proxy record, as young and old tree-rings
effectively show parallel variability. That is they store the same environmental signals, which
demonstrates any potential differences in the response of differently aged trees to be small.
8
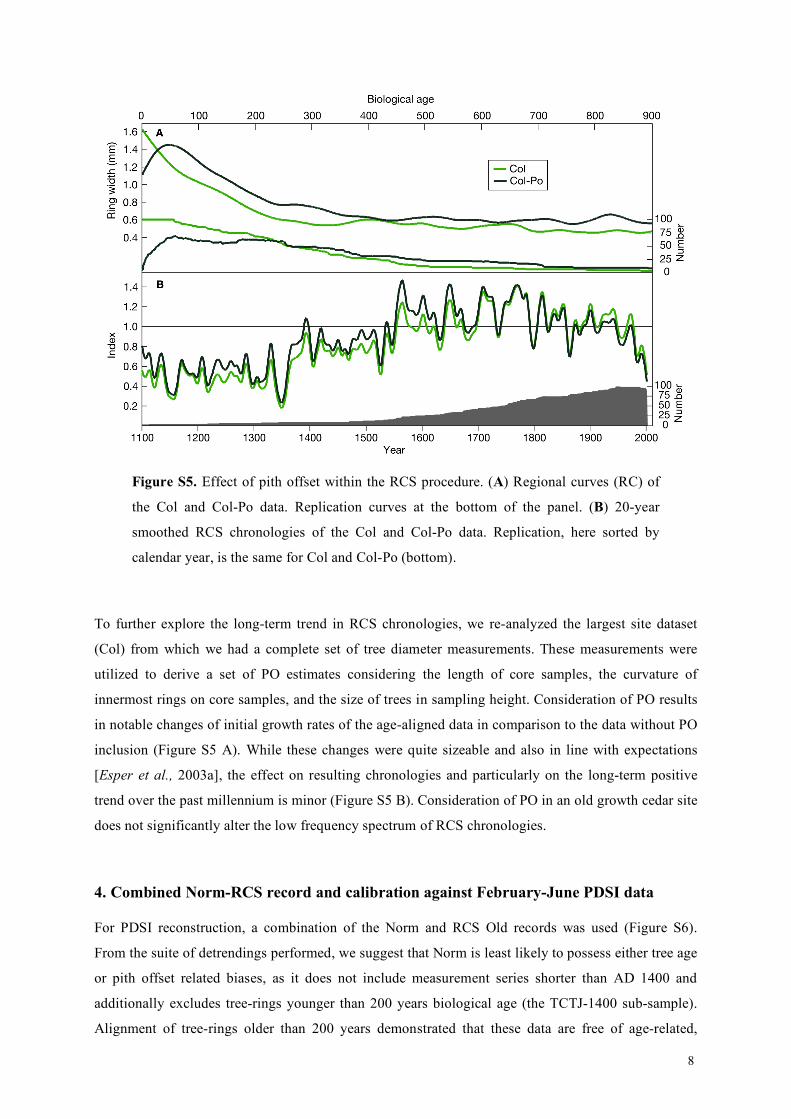
Figure S5. Effect of pith offset within the RCS procedure. (A) Regional curves (RC) of
the Col and Col-Po data. Replication curves at the bottom of the panel. (B) 20-year
smoothed RCS chronologies of the Col and Col-Po data. Replication, here sorted by
calendar year, is the same for Col and Col-Po (bottom).
To further explore the long-term trend in RCS chronologies, we re-analyzed the largest site dataset
(Col) from which we had a complete set of tree diameter measurements. These measurements were
utilized to derive a set of PO estimates considering the length of core samples, the curvature of
innermost rings on core samples, and the size of trees in sampling height. Consideration of PO results
in notable changes of initial growth rates of the age-aligned data in comparison to the data without PO
inclusion (Figure S5 A). While these changes were quite sizeable and also in line with expectations
[Esper et al., 2003a], the effect on resulting chronologies and particularly on the long-term positive
trend over the past millennium is minor (Figure S5 B). Consideration of PO in an old growth cedar site
does not significantly alter the low frequency spectrum of RCS chronologies.
4. Combined Norm-RCS record and calibration against February-June PDSI data
For PDSI reconstruction, a combination of the Norm and RCS Old records was used (Figure S6).
From the suite of detrendings performed, we suggest that Norm is least likely to possess either tree age
or pith offset related biases, as it does not include measurement series shorter than AD 1400 and
additionally excludes tree-rings younger than 200 years biological age (the TCTJ-1400 sub-sample).
Alignment of tree-rings older than 200 years demonstrated that these data are free of age-related,
9
biological noise (Figure S6 A). Additionally, these records have been identified as intermediate
members representing the center of the low frequency spectra of tree-ring chronologies (see above,
Figure S3).
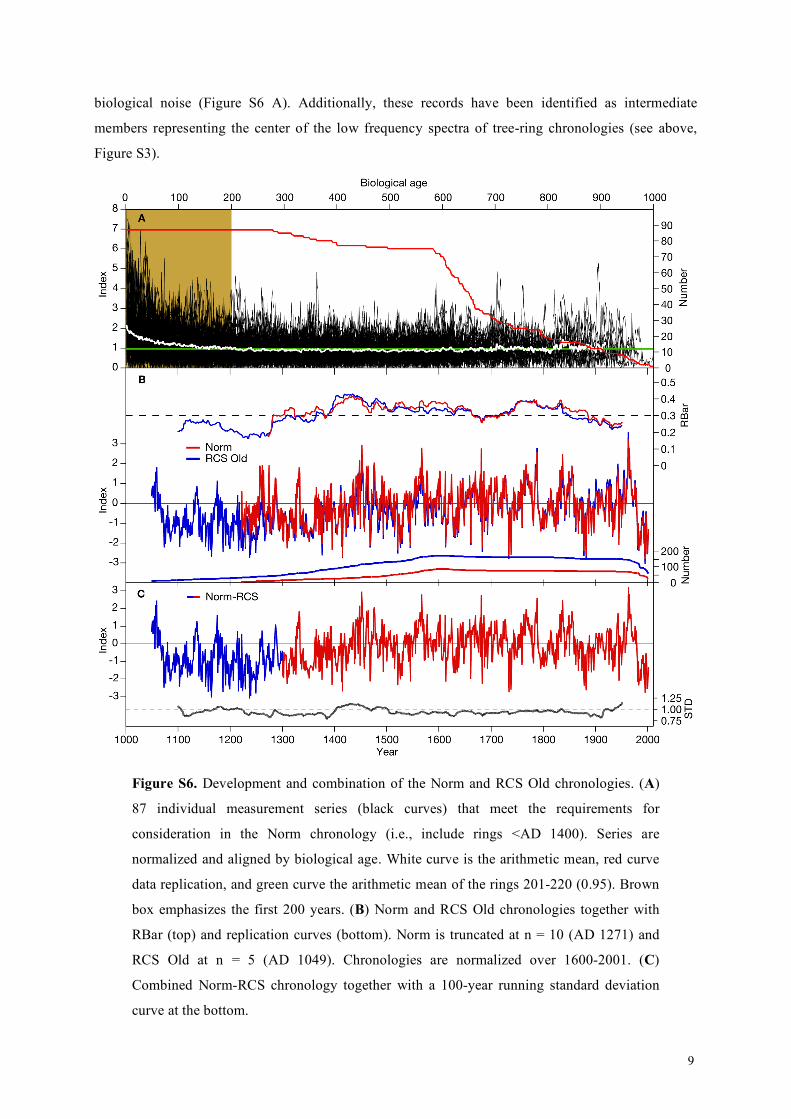
Figure S6. Development and combination of the Norm and RCS Old chronologies. (A)
87 individual measurement series (black curves) that meet the requirements for
consideration in the Norm chronology (i.e., include rings <AD 1400). Series are
normalized and aligned by biological age. White curve is the arithmetic mean, red curve
data replication, and green curve the arithmetic mean of the rings 201-220 (0.95). Brown
box emphasizes the first 200 years. (B) Norm and RCS Old chronologies together with
RBar (top) and replication curves (bottom). Norm is truncated at n = 10 (AD 1271) and
RCS Old at n = 5 (AD 1049). Chronologies are normalized over 1600-2001. (C)
Combined Norm-RCS chronology together with a 100-year running standard deviation
curve at the bottom.
10
A downside of the Norm record, however, is the substantial data reduction in TCTJ-1400, which
results in a length restriction to AD 1271 when Norm drops below 10 measurements series (see
replication curves in Figure S6 B). The early portion of the past millennium is represented by RCS
Old, as this record integrates 40 series in 1271, and 10 series in 1049. The mean and variance of RCS
Old were adjusted over the 1300-1350 period to Norm; the combined Norm-RCS record is represented
by Norm back to 1300 and by RCS Old prior to this year.
Correlations between Norm and RCS Old over the 1300-1350 and 1300-2001 periods are 0.87 and
0.96, respectively. Comparison of RBar timeseries – which is the average correlation coefficient
among all pairs of series combined in a chronology – demonstrated similarity of common variance
between Norm and RCS Old (Figure S6 B). The RBar reaches a peak value of about 0.4 during the
15th century and a minimum of about 0.15 in the 13th century. Such variations in RBar may produce
variance artifacts [Frank et al., 2007]. Notably, a running standard deviation timeseries of the
combined record remains stable over time, and does not possess any obvious systematic shift at the
transition between the Norm and RCS records (Figure S6 C).
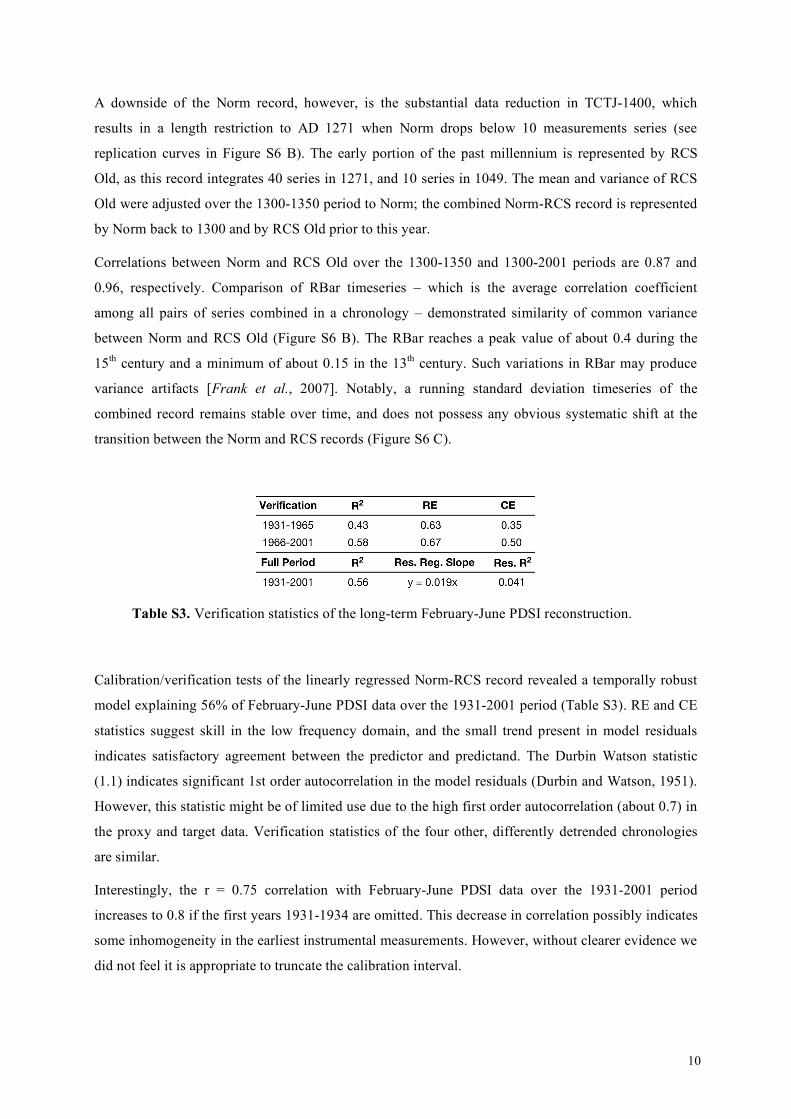
Table S3. Verification statistics of the long-term February-June PDSI reconstruction.
Calibration/verification tests of the linearly regressed Norm-RCS record revealed a temporally robust
model explaining 56% of February-June PDSI data over the 1931-2001 period (Table S3). RE and CE
statistics suggest skill in the low frequency domain, and the small trend present in model residuals
indicates satisfactory agreement between the predictor and predictand. The Durbin Watson statistic
(1.1) indicates significant 1st order autocorrelation in the model residuals (Durbin and Watson, 1951).
However, this statistic might be of limited use due to the high first order autocorrelation (about 0.7) in
the proxy and target data. Verification statistics of the four other, differently detrended chronologies
are similar.
Interestingly, the r = 0.75 correlation with February-June PDSI data over the 1931-2001 period
increases to 0.8 if the first years 1931-1934 are omitted. This decrease in correlation possibly indicates
some inhomogeneity in the earliest instrumental measurements. However, without clearer evidence we
did not feel it is appropriate to truncate the calibration interval.
11
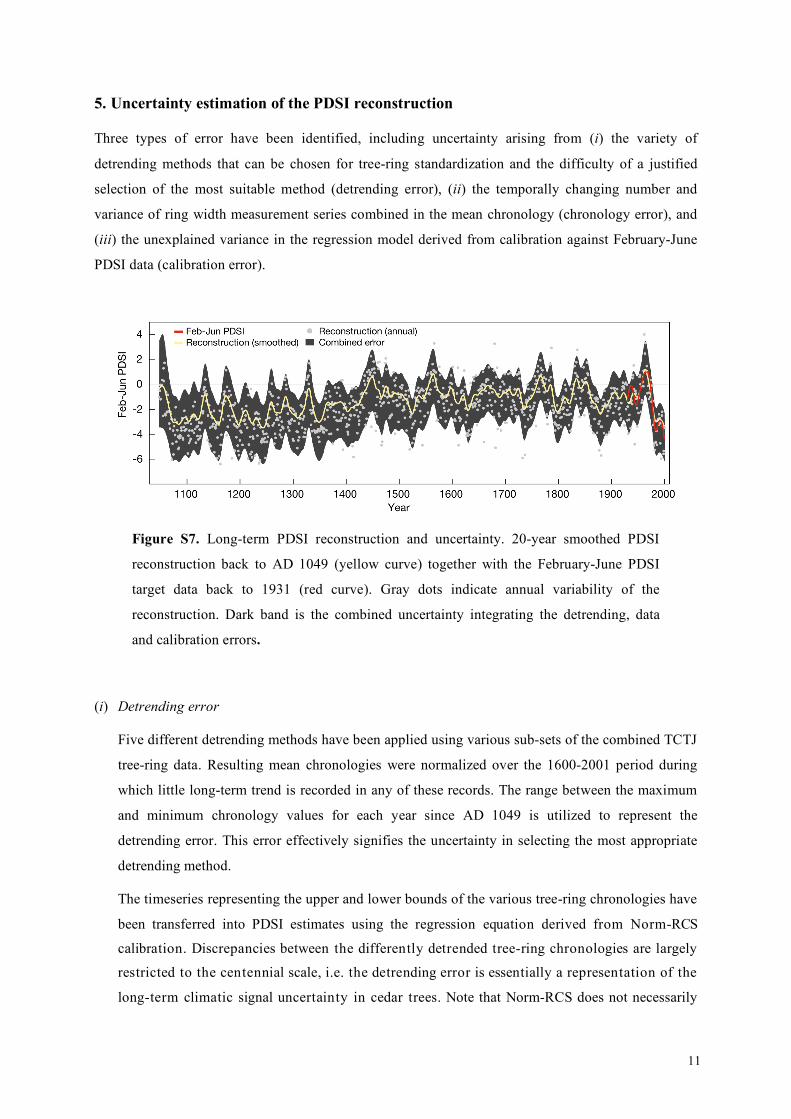
5. Uncertainty estimation of the PDSI reconstruction
Three types of error have been identified, including uncertainty arising from (i) the variety of
detrending methods that can be chosen for tree-ring standardization and the difficulty of a justified
selection of the most suitable method (detrending error), (ii) the temporally changing number and
variance of ring width measurement series combined in the mean chronology (chronology error), and
(iii) the unexplained variance in the regression model derived from calibration against February-June
PDSI data (calibration error).
Figure S7. Long-term PDSI reconstruction and uncertainty. 20-year smoothed PDSI
reconstruction back to AD 1049 (yellow curve) together with the February-June PDSI
target data back to 1931 (red curve). Gray dots indicate annual variability of the
reconstruction. Dark band is the combined uncertainty integrating the detrending, data
and calibration errors.
(i) Detrending error
Five different detrending methods have been applied using various sub-sets of the combined TCTJ
tree-ring data. Resulting mean chronologies were normalized over the 1600-2001 period during
which little long-term trend is recorded in any of these records. The range between the maximum
and minimum chronology values for each year since AD 1049 is utilized to represent the
detrending error. This error effectively signifies the uncertainty in selecting the most appropriate
detrending method.
The timeseries representing the upper and lower bounds of the various tree-ring chronologies have
been transferred into PDSI estimates using the regression equation derived from Norm-RCS
calibration. Discrepancies between the differently detrended tree-ring chronologies are largely
restricted to the centennial scale, i.e. the detrending error is essentially a representation of the
long-term climatic signal uncertainty in cedar trees. Note that Norm-RCS does not necessarily
12
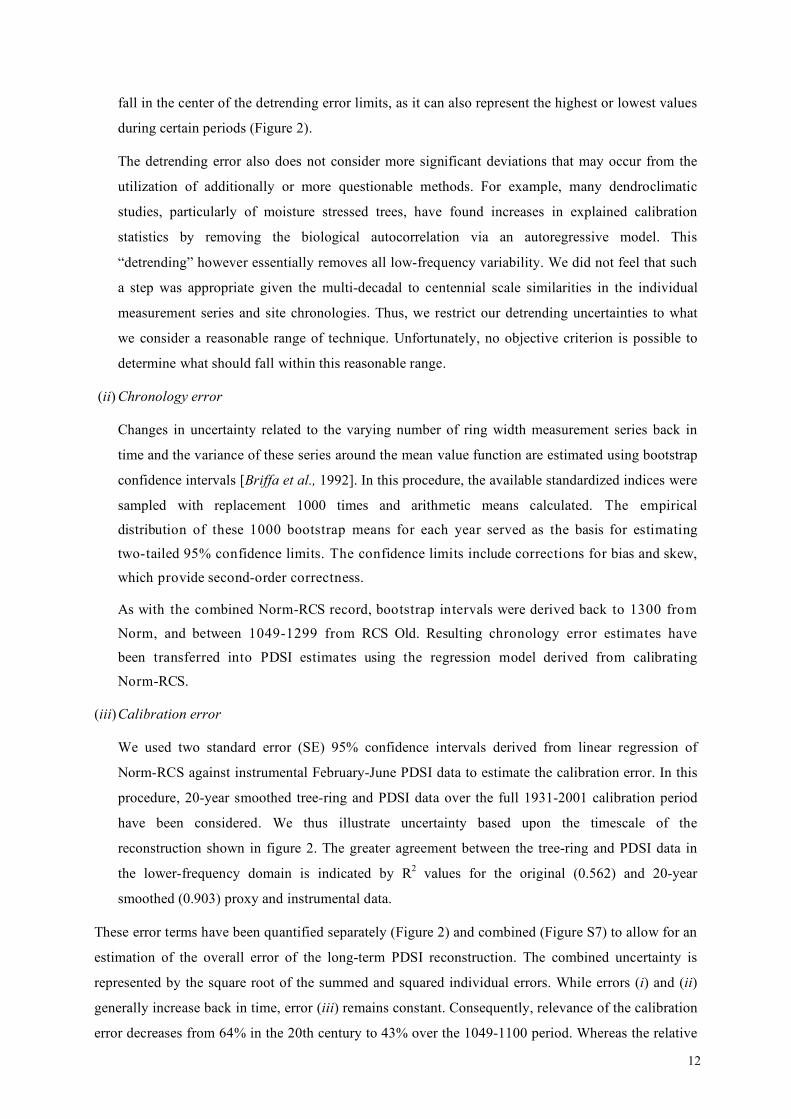
fall in the center of the detrending error limits, as it can also represent the highest or lowest values
during certain periods (Figure 2).
The detrending error also does not consider more significant deviations that may occur from the
utilization of additionally or more questionable methods. For example, many dendroclimatic
studies, particularly of moisture stressed trees, have found increases in explained calibration
statistics by removing the biological autocorrelation via an autoregressive model. This
“detrending” however essentially removes all low-frequency variability. We did not feel that such
a step was appropriate given the multi-decadal to centennial scale similarities in the individual
measurement series and site chronologies. Thus, we restrict our detrending uncertainties to what
we consider a reasonable range of technique. Unfortunately, no objective criterion is possible to
determine what should fall within this reasonable range.
(ii) Chronology error
Changes in uncertainty related to the varying number of ring width measurement series back in
time and the variance of these series around the mean value function are estimated using bootstrap
confidence intervals [Briffa et al., 1992]. In this procedure, the available standardized indices were
sampled with replacement 1000 times and arithmetic means calculated. The empirical
distribution of these 1000 bootstrap means for each year served as the basis for estimating
two-tailed 95% confidence limits. The confidence limits include corrections for bias and skew,
which provide second-order correctness.
As with the combined Norm-RCS record, bootstrap intervals were derived back to 1300 from
Norm, and between 1049-1299 from RCS Old. Resulting chronology error estimates have
been transferred into PDSI estimates using the regression model derived from calibrating
Norm-RCS.
(iii) Calibration error
We used two standard error (SE) 95% confidence intervals derived from linear regression of
Norm-RCS against instrumental February-June PDSI data to estimate the calibration error. In this
procedure, 20-year smoothed tree-ring and PDSI data over the full 1931-2001 calibration period
have been considered. We thus illustrate uncertainty based upon the timescale of the
reconstruction shown in figure 2. The greater agreement between the tree-ring and PDSI data in
the lower-frequency domain is indicated by R2 values for the original (0.562) and 20-year
smoothed (0.903) proxy and instrumental data.
These error terms have been quantified separately (Figure 2) and combined (Figure S7) to allow for an
estimation of the overall error of the long-term PDSI reconstruction. The combined uncertainty is
represented by the square root of the summed and squared individual errors. While errors (i) and (ii)
generally increase back in time, error (iii) remains constant. Consequently, relevance of the calibration
error decreases from 64% in the 20th century to 43% over the 1049-1100 period. Whereas the relative
13
influence of the chronology and detrending errors increases over these periods from 24% to 28% and
from 12% to 29%, respectively.
Overall, error estimation of the new reconstruction might appear conservative. However, consideration
of three error types likely provides a more comprehensive understanding of the total error associated
with tree-ring based reconstructions and their sources. Most typical, only consideration of the error
arising from changes in sample replication (type ii) or calibration (type iii) is provided.
6. Driving synoptic patterns
Temporal variation of the mean geopotential height anomalies as shown in figure 3 was analyzed by
comparing the pressure field data [Kistler et al., 2001; Luterbacher et al., 2002] during the second half
of the 20th century with the pre-anthropogenic 1659-1900 period (Figure S8). The scaled composites
for these time slices indicated that the general circulation patterns – significantly positive geopotential
height anomalies in S Europe during dry years, and negative anomalies centered in the eastern
Mediterranean area during wet years – remained fairly stable over time.
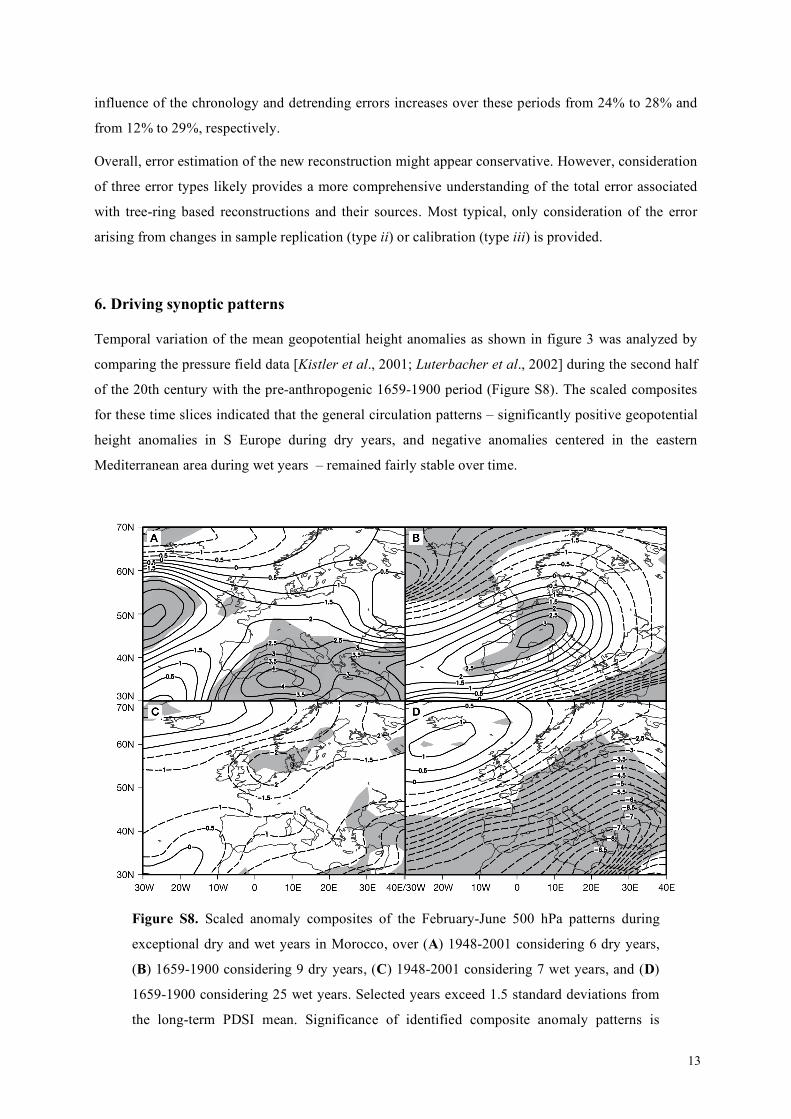
Figure S8. Scaled anomaly composites of the February-June 500 hPa patterns during
exceptional dry and wet years in Morocco, over (A) 1948-2001 considering 6 dry years,
(B) 1659-1900 considering 9 dry years, (C) 1948-2001 considering 7 wet years, and (D)
1659-1900 considering 25 wet years. Selected years exceed 1.5 standard deviations from
the long-term PDSI mean. Significance of identified composite anomaly patterns is
14
assigned using a modified two-sided t test [Brown and Hall, 1999], with areas where
p<0.1 highlighted in gray. Units are arbitrary.
During regionally dry years, the reconstructed PDSI and pressure data also indicate a slight weakening
of the Azores high as well as a minor NE shift of the maximum mid troposphere pressure center
towards S France in comparison to the modern period. In combination with this shift, we found a
steeper pressure gradient towards the E Mediterranean area during historical times in comparison to
the 20th century data (Figures S8 A-B). Circulation pattern detection also revealed lower pressure
anomalies and steeper gradients during the 1659-1900 period for Moroccan wet years. While this
historically intensified pattern also affected the spatial domain over which pressure deviations are
statistically significant (gray area in Figures S8 C-D), the overall synoptic situation, as indicated by
negative deviations in the SE sector and positive deviations in NW sector, remained effectively the
same and consistent with pressure and circulation patterns expected during wet and dry years.
7. Comparison with gridded PDSI proxy
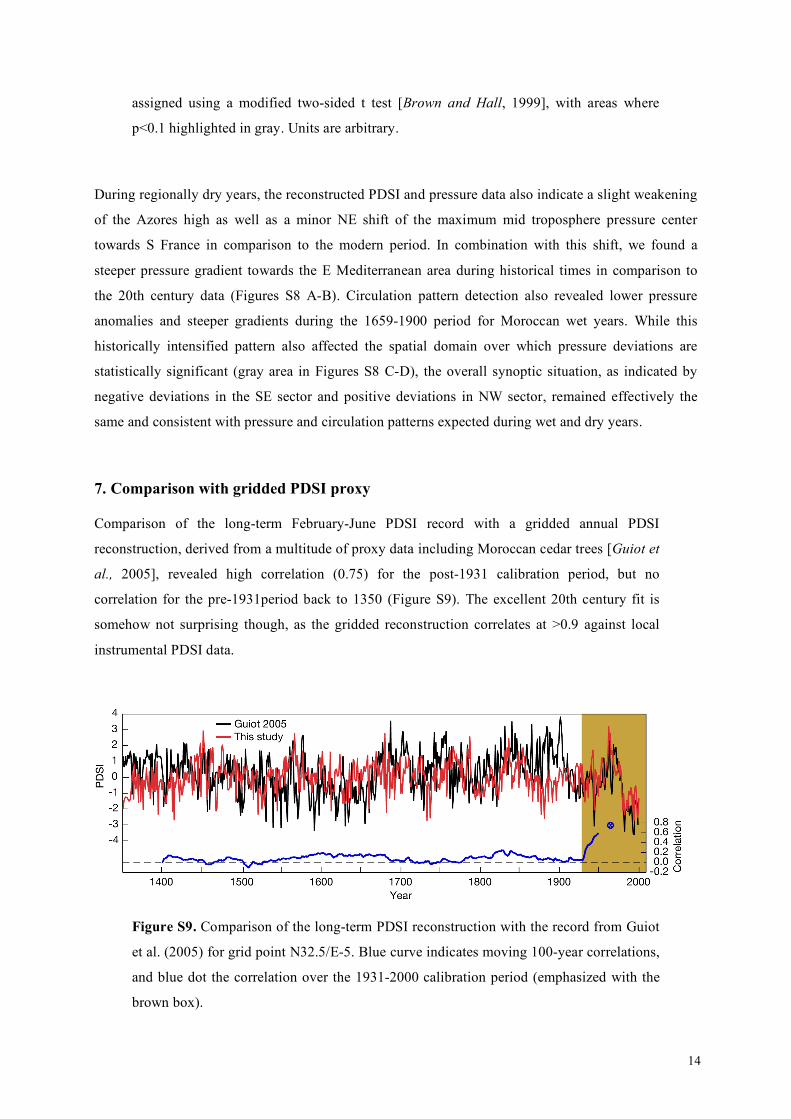
Comparison of the long-term February-June PDSI record with a gridded annual PDSI
reconstruction, derived from a multitude of proxy data including Moroccan cedar trees [Guiot et
al., 2005], revealed high correlation (0.75) for the post-1931 calibration period, but no
correlation for the pre-1931period back to 1350 (Figure S9). The excellent 20th century fit is
somehow not surprising though, as the gridded reconstruction correlates at >0.9 against local
instrumental PDSI data.
Figure S9. Comparison of the long-term PDSI reconstruction with the record from Guiot
et al. (2005) for grid point N32.5/E-5. Blue curve indicates moving 100-year correlations,
and blue dot the correlation over the 1931-2000 calibration period (emphasized with the
brown box).
15
The lack of coherence before 1931, however, suggests overfitting of the neural network based
calibration model used by Guiot et al. [2005]. This conclusion is drawn as the loss of skill
appeared exactly at the transition between the training and reconstruction periods. Interestingly,
the Guiot et al. [2005] reconstruction includes longer term Moroccan tree-ring data. Our
analysis of these data revealed temporally robust coherence between cedar site chronologies
(Figure S1, Table S2), as well as between young and old tree-rings over the past 400 years
(Figure S4), indicating spatial and temporal consistency in the long-term PDSI reconstruction.
Moreover, comparison with mid troposphere pressure field reconstructions (Figures 3 and S8)
showed that the larger-scale circulation patterns indicative of regionally dry and wet years,
remained unchanged over the past 350 years. All these results indicate the PDSI signal in the
present study to be stable over longer timescales.
References
Briffa, K. R., P. D. Jones, T. S. Bartholin, D. Eckstein, F. H. Schweingruber, W. Karlén, P.
Zetterberg, and M. Eronen (1992), Fennoscandian summers from AD 500 – temperature-changes
on short and long timescales, Clim. Dyn., 7, 111-119.
Cook, E. R., J. Esper, R. D’Arrigo (2004), Extra-tropical Northern Hemisphere temperature
variability over the past 1000 years, Quat. Sc. Rev., 23, 2063-2074.
Durbin, J, and G. S. Watson (1951), Testing for serial correlation in least squares regression.
Biometrika, 38, 159-78.
Esper, J., E. R. Cook, P. J. Krusic, K. Peters, and F. H. Schweingruber (2003a), Tests of the RCS
method for preserving low-frequency variability in long tree-ring chronologies, Tree-Ring Res., 59,
81-98.
Esper J., S. G. Shiyatov, V. S. Mazepa, R. J. S. Wilson, D. A. Graybill, and G. Funkhouser (2003b),
Temperature-sensitive Tien Shan tree ring chronologies show multi-centennial growth trends, Clim.
Dyn., 8, 699-706.
Esper, J. D. C., and R. J. S. Wilson (2004), Climate reconstructions - low frequency ambition and
high frequency ratification, EOS, 85, 113, 120.
Esper, J., U. Büntgen, D. C. Frank, D. Nievergelt, K. Treydte, and A. Verstege (2006), Multiple tree-
ring parameters from Atlas cedar (Morocco) and their climatic signal, in Tree rings in archaeology,
climatology and ecology, edited by I. Heinrich et al., pp. 46-55, Reihe Umwelt/Environment, 61,
Jülich.
Esper J., D. C. Frank, and J. Luterbacher (2007a), On selected issues and challenges in
dendroclimatology, in A changing world: challenges for landscape research, edited by F. Kienast
et al., pp. 113-132, Springer, Berlin.
16
Esper, J., D. C. Frank, R. J. S. Wilson, U. Büntgen, and K. Treydte (2007b), Uniform growth
trends among central Asian low and high elevation juniper tree sites. Trees, 21, 141–150.
Frank, D. C., J, Esper, and E. R. Cook (2007), Correction for proxy number and coherence in a
large-scale temperature reconstruction, Geophys. Res. Let., in press.
Guiot, J., S. Alleaume, A. Nicault, and S. Brewer (2005), The Mediterranean droughts during the last
650 years: reconstruction from tree-rings and climate model simulation. Geophys. Res. Abstracts, 7,
02471, European Geoscience Union, Vienna, 24-29 April 2005.
Kistler, R., et al. (2001), The NCEP-NCAR 50-year Reanalysis: monthly means CD-ROM and
documentation. Bull. Am. Meteorol. Soc., 82, 247-267.
Luterbacher, J., E. Xoplaki, D. Dietrich, R. Rickli, J. Jacobeit, C. Beck, D. Gyalistras, C. Schmutz, and
H. Wanner, (2002), Reconstruction of Sea-Level Pressure Fields over the Eastern North Atlantic and
Europe Back to 1500, Clim. Dyn., 18, 545-561.
Mann, M. E., and J. M. Lees (1996), Robust estimation of background noise and signal detection in
climatic time series, Clim. Change, 33, 409–445.
Wigley, T. M. L., K. R. Briffa, and P. D. Jones (1984), On the average of correlated time series,
with applications in dendroclimatology and hydrometeorology, J. Clim. Appl. Meteorol., 23, 201-
213.