suicidal intent in deliberate self-harm and the risk of suicide: the predictive power of the suicide...
TRANSCRIPT
www.elsevier.com/locate/jad
Journal of Affective Disord
Research report
Suicidal intent in deliberate self-harm and the risk of suicide:
The predictive power of the Suicide Intent Scale
Louise Harriss, Keith HawtonT
Centre for Suicide Research, Department of Psychiatry, University of Oxford, Warneford Hospital, Oxford OX3 7JX, UK
Received 9 August 2004; received in revised form 2 February 2005; accepted 4 February 2005
Abstract
Background: Suicidal intent at the time of deliberate self-harm (DSH) is known to be associated with risk of future suicide in
DSH patients. The predictive power of suicidal intent to identify particular individuals who are at high risk of suicide is unclear.
Method: Clinical and demographic data on 4156 DSH patients presenting to hospital 1993 and 1997 were analysed. Follow-up
information on eventual suicide was available for 2489 patients (mean follow-up 5.2 years). The predictive value of the Beck
Suicidal Intent Scale (SIS) was examined using Receiver Operating Characteristic (ROC) plots.
Results: Thirty males (2.9%) and 24 females (1.7%) died by suicide. Despite a robust association between suicidal intent and
eventual suicide, the positive predictive value (PPV) of the SIS was low (4%). Predicted probabilities of suicide assigned to
individual patients were also low, even for those who eventually died by suicide.
Limitations: Assessment and follow-up information was not available for all patients.
Conclusions: The SIS cannot predict which individual patients will ultimately die by suicide. Nonetheless, information
regarding suicidal intent is valuable in the clinical risk assessment and management of DSH patients.
D 2005 Elsevier B.V. All rights reserved.
Keywords: Attempted suicide; Deliberate self-harm; Suicidal intent; Suicide; Follow-up
1. Introduction
The risk of suicide amongst patients who engage in
deliberate self-harm (DSH) is considerably higher
than the risk within the general population (Owens et
al., 2002). Whilst this risk remains elevated for many
years after a DSH episode (Hawton and Fagg, 1988;
0165-0327/$ - see front matter D 2005 Elsevier B.V. All rights reserved.
doi:10.1016/j.jad.2005.02.009
T Corresponding author. Fax: +44 1865 223933.
E-mail address: [email protected] (K. Hawton).
Sakinofsky, 2000; Owens et al., 2002), it is at its
greatest during the first 12 months. A recent inves-
tigation in the UK found the suicide risk amongst
DSH patients during the first year following DSH to
be 66 times the population risk (Hawton et al.,
2003b).
It has therefore been a major concern of researchers
and clinicians to establish risk factors for eventual
suicide in DSH patients (Sakinofsky, 2000). An
extensive range of clinical and demographic charac-
ers 86 (2005) 225–233
L. Harriss, K. Hawton / Journal of Affective Disorders 86 (2005) 225–233226
teristics of these patients has been shown to have a
strong association with suicide risk: e.g., age, gender,
employment status, living situation, DSH method,
previous DSH (Hawton and Fagg, 1988; Sakinofsky,
2000). In a recent follow-up study of a large sample of
DSH patients in Oxford, UK (Harriss et al., 2005), we
demonstrated that the level of suicidal intent at the
time of DSH–that is, the degree to which the
individual wished to die–is also associated with risk
of subsequent suicide. Patients with high scores on the
Beck Suicide Intent Scale (SIS) (Beck et al., 1974)
were significantly more likely to die by suicide than
patients with low SIS scores. This association was
found to be especially strong within the first year after
an episode, and amongst female patients. We con-
cluded that the measurement of suicidal intent is
valuable in the evaluation of future suicide risk,
particularly when considered in conjunction with
other known risk factors.
Intrinsic to the investigation of such risk factors
for suicide is the question of prediction: is it
possible, in the light of these findings, to identify
particular individuals who are at risk of eventually
dying by suicide? Studies that have endeavoured to
do so have been largely unsuccessful (e.g., Pokorny,
1983, 1993; Goldney and Spence, 1987; Goldstein et
al., 1991; Powell et al., 2000), primarily due to the
low prevalence of suicide even within high-risk
patient groups.
Receiver Operating Characteristic (ROC) curves,
which are most often used to evaluate the efficacy
of diagnostic tests (Zweig and Campbell, 1993), can
be employed to assess the performance of psycho-
logical scales (e.g., Beck et al., 1999). Nimeus et al.
(2002) used this method in their evaluation of the
predictive value of the SIS. Despite having found
significantly higher SIS scores amongst the eventual
suicides (22 of the original sample of 555 DSH
patients), the optimal cut-off score for distinguishing
between suicides and non-suicides yielded a positive
predictive value (PPV) of only 9.7%; that is, less
than 10% of patients predicted to die by suicide
according to their SIS scores were correctly
classified as such. Nevertheless, Nimeus et al. deduced
that the SIS might be ba valuable tool in predicting
suicideQ.Given the widespread use of the SIS within clinical
practice, it is important that its role in evaluating
future suicide risk is clearly established. Using a long-
term monitoring system for DSH that provides a large
patient sample and a substantial follow-up period, we
have investigated the ability of the Beck Suicide
Intent Scale to predict the occurrence of future suicide
in DSH patients.
2. Method
2.1. Study population
Patients were identified through the Oxford Mon-
itoring System for Attempted Suicide (Hawton et al.,
2003a). All individuals who present to the general
hospital in Oxford following an episode of DSH are
identified either through assessment by members of
the hospital psychiatric service, or by scrutiny of
records of presentations to the Accident and Emer-
gency Department. It has been established that this
system produces comprehensive data (Sellar et al.,
1990), and that the findings are comparable with those
from other areas in the UK (e.g., Platt et al., 1988).
The definition of DSH encompasses intentional
self-poisoning or self-injury, irrespective of motiva-
tion (Hawton et al., 2003a). Self-poisoning is defined
as the intentional self-administration of more than the
prescribed dose of any drug, and includes poisoning
with non-ingestible substances, overdoses of
drecreational drugsT, and severe alcohol intoxication
where clinical staff consider such cases to be acts of
deliberate self-harm. Approximately 85% of cases
involve overdoses (Hawton et al., 2003a). Self-injury
is defined as any injury that has been deliberately self-
inflicted.
For all patients assessed by the general hospital
psychiatric service, a clinician completes a stand-
ardised form that records demographic and clinical
information. Since 1st January 1993, the Suicide
Intent Scale (SIS) devised by Beck et al. (1974) has
also been completed at the time of assessment
whenever possible. All assessed DSH patients aged
15 or over, who presented to the general hospital
between 1st January 1993 and 31st December 1997,
and for whom the SIS had been completed on at
least one presentation, were included in the study.
The follow-up period extended until 31st December
2000.
L. Harriss, K. Hawton / Journal of Affective Disorders 86 (2005) 225–233 227
2.2. Suicide Intent Scale
The Beck Suicide Intent Scale (SIS) is a 15-item
interviewer-rated questionnaire designed to assess the
severity of suicidal intention associated with an
episode of DSH (Beck et al., 1974). Each item
scores 0–2, giving a total score range of 0–30. The
questionnaire is divided into two sections: the first
eight items comprise the dcircumstancesT section
(Part 1), and are concerned with the objective
circumstances of the act of DSH. The remaining
seven items form the dself-reportT section (Part 2),
and are based on the patient’s own reconstruction of
his/her feelings and thoughts at the time of the act.
Scores for each of these sections were considered
separately in the analysis, as well as the total SIS
score of both sections combined.
We have investigated the predictive value of
suicidal intent alongside a range of demographic and
clinical variables recorded during assessment: age,
marital status, employment status, drug misuse,
alcohol misuse (defined as chronic alcoholism with
physical symptoms, alcohol dependence, or excessive
drinking), current and previous psychiatric treatment,
lonely living conditions (living alone, in an institution,
in lodgings or in a hostel), previous DSH (irrespective
of whether or not this resulted in a general hospital
referral), and method of DSH.
2.3. Suicide
Deaths from suicide that occurred up to 31st
December 2000 were identified for patients who
presented between 1st January 1993 and 31st Decem-
ber 1997, through the submission of demographic
information (name, gender, and date of birth) to the
Office of National Statistics for England and Wales,
the Central Services Agency in Northern Ireland, and
the General Register Office for Scotland. Tracing
revealed whether a patient was alive or deceased as of
31st December 2000. Patients who could not be traced
were excluded from the analyses. All deaths that
received a coroner’s verdict of dsuicideT (ICD-9 code
E950–E959), dundetermined causeT (E980–E989), ordaccidental poisoningT (E850–E869) were combined
to form the suicide category for the purposes of this
study. It has been shown that the overall mortality
from suicide will be underestimated if the dsuicideT
verdict alone is used (Charlton et al., 1992). Fur-
thermore, amongst DSH patients, the risk of death by
accidental poisoning is similar to the risk of death by
suicide or undetermined cause (Hawton et al.,
submitted for publication). Examination of individual
cases of accidental poisoning that occurred within the
study sample revealed that such verdicts were highly
likely to be suicide.
2.4. Statistical analyses
Receiver Operating Characteristic (ROC) curves
were employed to examine the data. The ability of the
SIS to distinguish between the suicide and non-suicide
groups was measured by calculating the sensitivity
(proportion of true positives correctly identified) and
specificity (proportion of true negatives correctly
identified) when using each possible score on the
SIS as the cut-off value for group membership. The
ROC plots provide a graphical display of all
sensitivity/specificity pairs for every possible cut-off
value on the scale.
Choosing an doptimumT cut-off value of a test is
necessarily subjective, and dependent on a range of
factors such as the relative cost (e.g., severity of
outcome, financial cost) of errors (false positives and
false negatives), and the prevalence of the disease that
the test is designed to predict. For example, a cut-off
value that produces a particular true- or false-positive
rate may be optimal under certain circumstances; one
that is based on the change in the post-test odds of the
outcome may be more appropriate in others (Rutter
and Miglioretti, 2003). Following Beck et al. (1999)
and Nimeus et al. (2002), the optimal cut-off value for
the purposes of this study was considered to be the
one that maximised the correct classification of both
suicides and non-suicides—i.e., maximised the sum of
sensitivity and specificity.
Whereas sensitivity and specificity measure the
ability of the SIS to distinguish between groups, it is
the predictive value at a particular cut-off point that
gives the probability of a correct prediction of suicide
or non-suicide (Altman and Bland, 1994a). The
positive predictive value (PPV: the fraction of positive
results that are correct) at each point on the SIS was
also calculated.
Backward stepwise Cox regression analysis was
used to investigate risk factors for eventual suicide.
0.50
0.75
1.00
10
0
sitiv
ity
(a) Male SIS total scores
L. Harriss, K. Hawton / Journal of Affective Disorders 86 (2005) 225–233228
Binary logistic regression analysis was used to
identify probability of and prediction of suicide group
membership.
The analyses were conducted using the Statistical
Package for the Social Sciences (SPSS Inc., 2003),
and Stata 7 (StataCorp, 2001).
0.00
0.25
0.50
0.75
1.00
0.00 0.25 0.50 0.75 1.00
1 - Specificity
14
0
10
20
0.00
0.25
0.00 0.25 0.50 0.75 1.00
1 - Specificity
20
Sen
Sens
itivi
ty
(b) Female SIS total scores
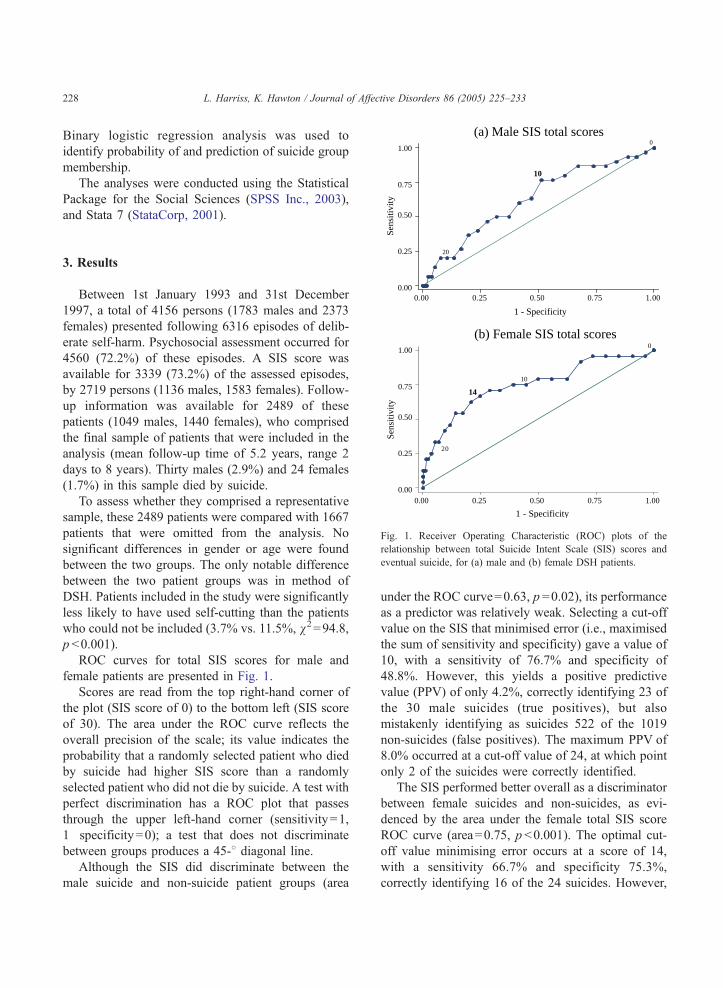
Fig. 1. Receiver Operating Characteristic (ROC) plots of the
relationship between total Suicide Intent Scale (SIS) scores and
eventual suicide, for (a) male and (b) female DSH patients.
3. Results
Between 1st January 1993 and 31st December
1997, a total of 4156 persons (1783 males and 2373
females) presented following 6316 episodes of delib-
erate self-harm. Psychosocial assessment occurred for
4560 (72.2%) of these episodes. A SIS score was
available for 3339 (73.2%) of the assessed episodes,
by 2719 persons (1136 males, 1583 females). Follow-
up information was available for 2489 of these
patients (1049 males, 1440 females), who comprised
the final sample of patients that were included in the
analysis (mean follow-up time of 5.2 years, range 2
days to 8 years). Thirty males (2.9%) and 24 females
(1.7%) in this sample died by suicide.
To assess whether they comprised a representative
sample, these 2489 patients were compared with 1667
patients that were omitted from the analysis. No
significant differences in gender or age were found
between the two groups. The only notable difference
between the two patient groups was in method of
DSH. Patients included in the study were significantly
less likely to have used self-cutting than the patients
who could not be included (3.7% vs. 11.5%, v2=94.8,
p b0.001).
ROC curves for total SIS scores for male and
female patients are presented in Fig. 1.
Scores are read from the top right-hand corner of
the plot (SIS score of 0) to the bottom left (SIS score
of 30). The area under the ROC curve reflects the
overall precision of the scale; its value indicates the
probability that a randomly selected patient who died
by suicide had higher SIS score than a randomly
selected patient who did not die by suicide. A test with
perfect discrimination has a ROC plot that passes
through the upper left-hand corner (sensitivity=1,
1�specificity=0); a test that does not discriminate
between groups produces a 45-8 diagonal line.Although the SIS did discriminate between the
male suicide and non-suicide patient groups (area
under the ROC curve=0.63, p =0.02), its performance
as a predictor was relatively weak. Selecting a cut-off
value on the SIS that minimised error (i.e., maximised
the sum of sensitivity and specificity) gave a value of
10, with a sensitivity of 76.7% and specificity of
48.8%. However, this yields a positive predictive
value (PPV) of only 4.2%, correctly identifying 23 of
the 30 male suicides (true positives), but also
mistakenly identifying as suicides 522 of the 1019
non-suicides (false positives). The maximum PPV of
8.0% occurred at a cut-off value of 24, at which point
only 2 of the suicides were correctly identified.
The SIS performed better overall as a discriminator
between female suicides and non-suicides, as evi-
denced by the area under the female total SIS score
ROC curve (area=0.75, p b0.001). The optimal cut-
off value minimising error occurs at a score of 14,
with a sensitivity 66.7% and specificity 75.3%,
correctly identifying 16 of the 24 suicides. However,
(b) Male Part 2 SIS scores
(a) Male Part 1 SIS scores
0.00
0.25
0.50
0.75
1.00
0.00 0.25 0.50 0.75 1.00
1 - Specificity
5
0
10
Sens
itivi
ty
0.00
0.25
0.50
0.75
1.00
0.00 0.25 0.50 0.75 1.00
1 - Specificity
10
0
5
Sens
itivi
ty
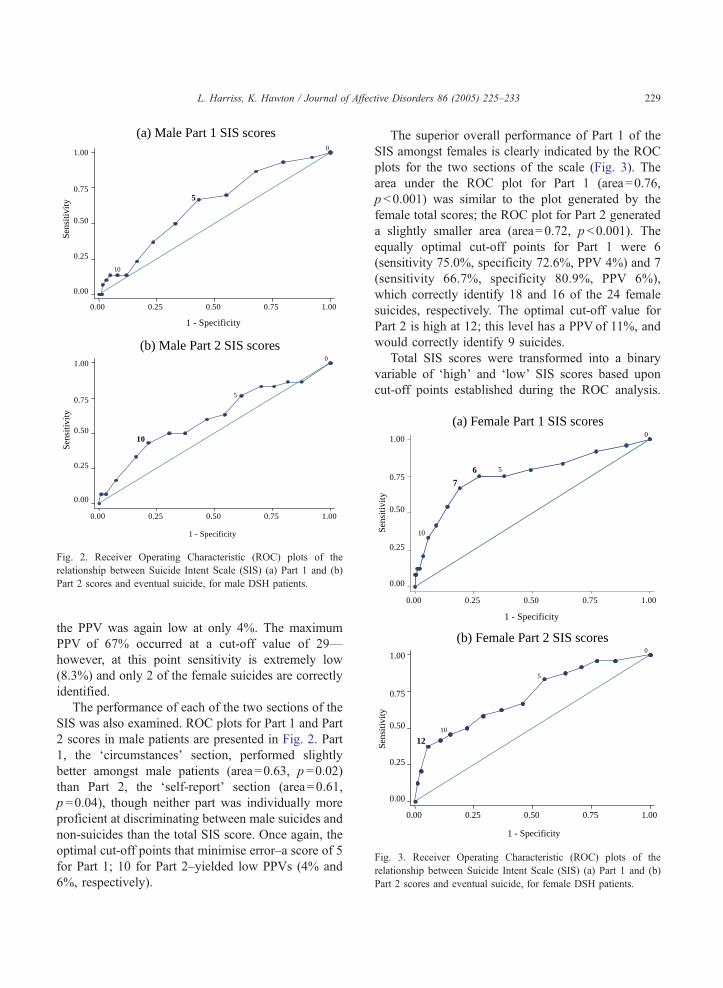
Fig. 2. Receiver Operating Characteristic (ROC) plots of the
relationship between Suicide Intent Scale (SIS) (a) Part 1 and (b)
Part 2 scores and eventual suicide, for male DSH patients. 0.00
0.25
0.50
0.75
1.00
0.00 0.25 0.50 0.75 1.00
1 - Specificity
6
7
0
10
5
Sens
itivi
ty
0.00
0.25
0.50
0.75
1.00
0.00 0.25 0.50 0.75 1.00
1 - Specificity
12
0
5
10
Sens
itivi
ty
(a) Female Part 1 SIS scores
(b) Female Part 2 SIS scores
Fig. 3. Receiver Operating Characteristic (ROC) plots of the
relationship between Suicide Intent Scale (SIS) (a) Part 1 and (b
Part 2 scores and eventual suicide, for female DSH patients.
L. Harriss, K. Hawton / Journal of Affective Disorders 86 (2005) 225–233 229
the PPV was again low at only 4%. The maximum
PPV of 67% occurred at a cut-off value of 29—
however, at this point sensitivity is extremely low
(8.3%) and only 2 of the female suicides are correctly
identified.
The performance of each of the two sections of the
SIS was also examined. ROC plots for Part 1 and Part
2 scores in male patients are presented in Fig. 2. Part
1, the dcircumstancesT section, performed slightly
better amongst male patients (area=0.63, p =0.02)
than Part 2, the dself-reportT section (area=0.61,
p =0.04), though neither part was individually more
proficient at discriminating between male suicides and
non-suicides than the total SIS score. Once again, the
optimal cut-off points that minimise error–a score of 5
for Part 1; 10 for Part 2–yielded low PPVs (4% and
6%, respectively).
The superior overall performance of Part 1 of the
SIS amongst females is clearly indicated by the ROC
plots for the two sections of the scale (Fig. 3). The
area under the ROC plot for Part 1 (area=0.76,
pb0.001) was similar to the plot generated by the
female total scores; the ROC plot for Part 2 generated
a slightly smaller area (area=0.72, pb0.001). The
equally optimal cut-off points for Part 1 were 6
(sensitivity 75.0%, specificity 72.6%, PPV 4%) and 7
(sensitivity 66.7%, specificity 80.9%, PPV 6%),
which correctly identify 18 and 16 of the 24 female
suicides, respectively. The optimal cut-off value for
Part 2 is high at 12; this level has a PPV of 11%, and
would correctly identify 9 suicides.
Total SIS scores were transformed into a binary
variable of dhighT and dlowT SIS scores based upon
cut-off points established during the ROC analysis.
)
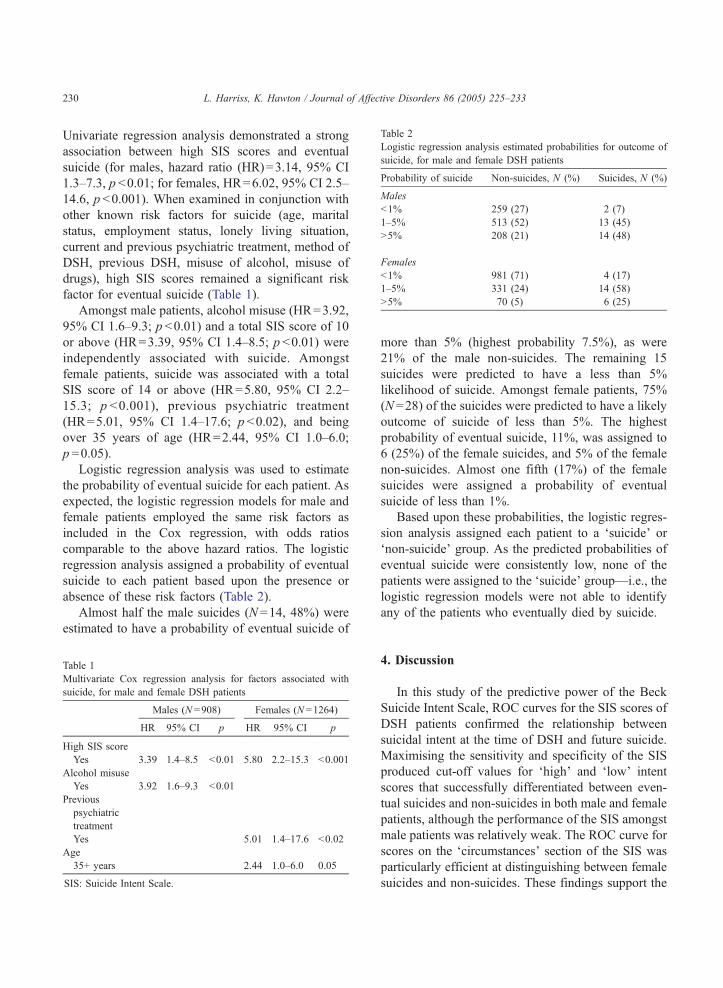
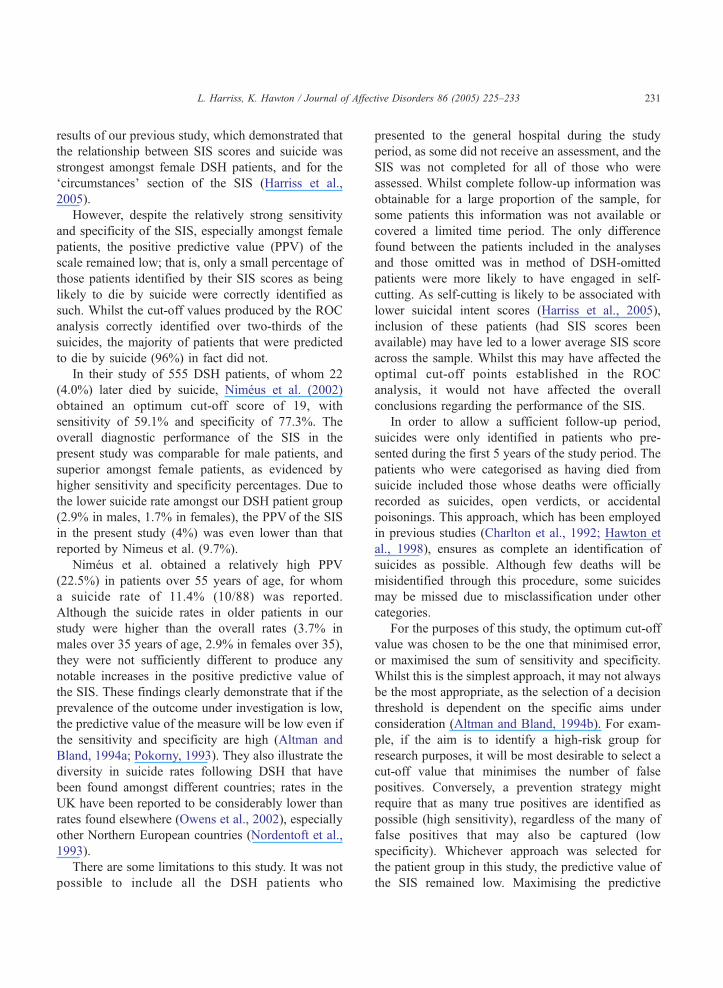
Table 2
Logistic regression analysis estimated probabilities for outcome of
suicide, for male and female DSH patients
Probability of suicide Non-suicides, N (%) Suicides, N (%)
Males
b1% 259 (27) 2 (7)
1–5% 513 (52) 13 (45)
N5% 208 (21) 14 (48)
Females
b1% 981 (71) 4 (17)
1–5% 331 (24) 14 (58)
N5% 70 (5) 6 (25)
L. Harriss, K. Hawton / Journal of Affective Disorders 86 (2005) 225–233230
Univariate regression analysis demonstrated a strong
association between high SIS scores and eventual
suicide (for males, hazard ratio (HR)=3.14, 95% CI
1.3–7.3, p b0.01; for females, HR=6.02, 95% CI 2.5–
14.6, p b0.001). When examined in conjunction with
other known risk factors for suicide (age, marital
status, employment status, lonely living situation,
current and previous psychiatric treatment, method of
DSH, previous DSH, misuse of alcohol, misuse of
drugs), high SIS scores remained a significant risk
factor for eventual suicide (Table 1).
Amongst male patients, alcohol misuse (HR=3.92,
95% CI 1.6–9.3; p b0.01) and a total SIS score of 10
or above (HR=3.39, 95% CI 1.4–8.5; p b0.01) were
independently associated with suicide. Amongst
female patients, suicide was associated with a total
SIS score of 14 or above (HR=5.80, 95% CI 2.2–
15.3; p b0.001), previous psychiatric treatment
(HR=5.01, 95% CI 1.4–17.6; p b0.02), and being
over 35 years of age (HR=2.44, 95% CI 1.0–6.0;
p =0.05).
Logistic regression analysis was used to estimate
the probability of eventual suicide for each patient. As
expected, the logistic regression models for male and
female patients employed the same risk factors as
included in the Cox regression, with odds ratios
comparable to the above hazard ratios. The logistic
regression analysis assigned a probability of eventual
suicide to each patient based upon the presence or
absence of these risk factors (Table 2).
Almost half the male suicides (N =14, 48%) were
estimated to have a probability of eventual suicide of
Table 1
Multivariate Cox regression analysis for factors associated with
suicide, for male and female DSH patients
Males (N =908) Females (N =1264)
HR 95% CI p HR 95% CI p
High SIS score
Yes 3.39 1.4–8.5 b0.01 5.80 2.2–15.3 b0.001
Alcohol misuse
Yes 3.92 1.6–9.3 b0.01
Previous
psychiatric
treatment
Yes 5.01 1.4–17.6 b0.02
Age
35+ years 2.44 1.0–6.0 0.05
SIS: Suicide Intent Scale.
more than 5% (highest probability 7.5%), as were
21% of the male non-suicides. The remaining 15
suicides were predicted to have a less than 5%
likelihood of suicide. Amongst female patients, 75%
(N =28) of the suicides were predicted to have a likely
outcome of suicide of less than 5%. The highest
probability of eventual suicide, 11%, was assigned to
6 (25%) of the female suicides, and 5% of the female
non-suicides. Almost one fifth (17%) of the female
suicides were assigned a probability of eventual
suicide of less than 1%.
Based upon these probabilities, the logistic regres-
sion analysis assigned each patient to a dsuicideT ordnon-suicideT group. As the predicted probabilities of
eventual suicide were consistently low, none of the
patients were assigned to the dsuicideT group—i.e., the
logistic regression models were not able to identify
any of the patients who eventually died by suicide.
4. Discussion
In this study of the predictive power of the Beck
Suicide Intent Scale, ROC curves for the SIS scores of
DSH patients confirmed the relationship between
suicidal intent at the time of DSH and future suicide.
Maximising the sensitivity and specificity of the SIS
produced cut-off values for dhighT and dlowT intent
scores that successfully differentiated between even-
tual suicides and non-suicides in both male and female
patients, although the performance of the SIS amongst
male patients was relatively weak. The ROC curve for
scores on the dcircumstancesT section of the SIS was
particularly efficient at distinguishing between female
suicides and non-suicides. These findings support the
L. Harriss, K. Hawton / Journal of Affective Disorders 86 (2005) 225–233 231
results of our previous study, which demonstrated that
the relationship between SIS scores and suicide was
strongest amongst female DSH patients, and for the
dcircumstancesT section of the SIS (Harriss et al.,
2005).
However, despite the relatively strong sensitivity
and specificity of the SIS, especially amongst female
patients, the positive predictive value (PPV) of the
scale remained low; that is, only a small percentage of
those patients identified by their SIS scores as being
likely to die by suicide were correctly identified as
such. Whilst the cut-off values produced by the ROC
analysis correctly identified over two-thirds of the
suicides, the majority of patients that were predicted
to die by suicide (96%) in fact did not.
In their study of 555 DSH patients, of whom 22
(4.0%) later died by suicide, Nimeus et al. (2002)
obtained an optimum cut-off score of 19, with
sensitivity of 59.1% and specificity of 77.3%. The
overall diagnostic performance of the SIS in the
present study was comparable for male patients, and
superior amongst female patients, as evidenced by
higher sensitivity and specificity percentages. Due to
the lower suicide rate amongst our DSH patient group
(2.9% in males, 1.7% in females), the PPV of the SIS
in the present study (4%) was even lower than that
reported by Nimeus et al. (9.7%).
Nimeus et al. obtained a relatively high PPV
(22.5%) in patients over 55 years of age, for whom
a suicide rate of 11.4% (10/88) was reported.
Although the suicide rates in older patients in our
study were higher than the overall rates (3.7% in
males over 35 years of age, 2.9% in females over 35),
they were not sufficiently different to produce any
notable increases in the positive predictive value of
the SIS. These findings clearly demonstrate that if the
prevalence of the outcome under investigation is low,
the predictive value of the measure will be low even if
the sensitivity and specificity are high (Altman and
Bland, 1994a; Pokorny, 1993). They also illustrate the
diversity in suicide rates following DSH that have
been found amongst different countries; rates in the
UK have been reported to be considerably lower than
rates found elsewhere (Owens et al., 2002), especially
other Northern European countries (Nordentoft et al.,
1993).
There are some limitations to this study. It was not
possible to include all the DSH patients who
presented to the general hospital during the study
period, as some did not receive an assessment, and the
SIS was not completed for all of those who were
assessed. Whilst complete follow-up information was
obtainable for a large proportion of the sample, for
some patients this information was not available or
covered a limited time period. The only difference
found between the patients included in the analyses
and those omitted was in method of DSH-omitted
patients were more likely to have engaged in self-
cutting. As self-cutting is likely to be associated with
lower suicidal intent scores (Harriss et al., 2005),
inclusion of these patients (had SIS scores been
available) may have led to a lower average SIS score
across the sample. Whilst this may have affected the
optimal cut-off points established in the ROC
analysis, it would not have affected the overall
conclusions regarding the performance of the SIS.
In order to allow a sufficient follow-up period,
suicides were only identified in patients who pre-
sented during the first 5 years of the study period. The
patients who were categorised as having died from
suicide included those whose deaths were officially
recorded as suicides, open verdicts, or accidental
poisonings. This approach, which has been employed
in previous studies (Charlton et al., 1992; Hawton et
al., 1998), ensures as complete an identification of
suicides as possible. Although few deaths will be
misidentified through this procedure, some suicides
may be missed due to misclassification under other
categories.
For the purposes of this study, the optimum cut-off
value was chosen to be the one that minimised error,
or maximised the sum of sensitivity and specificity.
Whilst this is the simplest approach, it may not always
be the most appropriate, as the selection of a decision
threshold is dependent on the specific aims under
consideration (Altman and Bland, 1994b). For exam-
ple, if the aim is to identify a high-risk group for
research purposes, it will be most desirable to select a
cut-off value that minimises the number of false
positives. Conversely, a prevention strategy might
require that as many true positives are identified as
possible (high sensitivity), regardless of the many of
false positives that may also be captured (low
specificity). Whichever approach was selected for
the patient group in this study, the predictive value of
the SIS remained low. Maximising the predictive
L. Harriss, K. Hawton / Journal of Affective Disorders 86 (2005) 225–233232
value of the SIS yielded an extremely low true
positive rate.
The results of the regression analysis corroborate
the findings of a number of other studies (e.g.,
Pokorny, 1983, 1993; Goldney and Spence, 1987;
Powell et al., 2000), that it is not possible use patient
information–even information about factors that have
been shown to be strongly related to suicide, such as
suicidal intent–to predict accurately which individual
patients will die by suicide. The predicted probabil-
ities of eventual suicide are low, even amongst the
suicide patient group. These findings highlight the
dangers of attempting to use a bchecklistQ approach
for identifying at-risk patients—measures such as the
SIS cannot be used as straightforward predictive tools
for determining treatment decisions.
However, the utility of clinical scales in the
treatment and management of patients is not depend-
ent on their predictive value alone (Zweig and
Campbell, 1993). The process of clinical risk assess-
ment is not the same as the process of prediction—this
distinction is vital for appropriate interpretation of the
findings of studies such as this. Clinical risk assess-
ment is a complex decision-making process that takes
into account a multitude of factors, and is consid-
erably more sophisticated than the statistical techni-
ques that have been employed by researchers to
predict suicide. The clinician can be informed in his or
her assessment by considering a range of character-
istics of the individual patient, particularly those that
are known to be strongly associated with eventual
suicide. The robustness of high SIS scores as a
significant factor in the regression models confirms
that patients with high SIS scores at the time of DSH
are at increased risk of dying by suicide, and thus
supports the use of information about suicidal intent
as part of a clinical suicide risk assessment.
Acknowledgements
The authors thank the staff of the Office of
National Statistics for England and Wales, the
General Register Office for Scotland, and the Central
Services Agency in Northern Ireland for their
assistance with this project. Staff at the Department
of Psychological Medicine at the John Radcliffe
Hospital in Oxford, and Elizabeth Bale and Alison
Bond assisted with the collection of patient informa-
tion that was used in this study. We also thank
Daniel Zahl, who compiled the mortality follow-up
information. The Oxford Monitoring System is
funded by the Department of Health. The mortality
follow-up study was funded by a grant from the
National Health Science Executive for England.
Keith Hawton is also supported by Oxfordshire
Mental Healthcare trust. There is no conflict of
interest.
References
Altman, D.G., Bland, M., 1994. Diagnostic tests 2: predictive
values. British Medical Journal 309, 102.
Altman, D.G., Bland, M., 1994. Diagnostic tests 3: receiver
operating characteristic plots. British Medical Journal 309, 188.
Beck, A.T., Schuyler, D., Herman, I., 1974. Development of
suicidal intent scales. In: Beck, A.T., Resnik, H.L.P., Lettieri,
D.J. (Eds.), The Prediction of Suicide. Charles Press, Phila-
delphia, PA, pp. 45–56.
Beck, A.T., Brown, G.K., Steer, R.A., Dahlsgaard, K.K., Grisham,
J.R., 1999. Suicide ideation at its worst point: a predictor of
eventual suicide in psychiatric outpatients. Suicide and Life
Threatening Behavior 29 (1), 1–9.
Charlton, J., Kelly, S., Dunnell, K., Evans, B., Jenkins, R., Wallis,
R., 1992. Trends in suicide deaths in England and Wales.
Population Trends 69, 10–16.
Goldney, R.D., Spence, N.D., 1987. Is suicide predictable?
Australian and New Zealand Journal of Psychiatry 21, 3–4.
Goldstein, R.B., Black, D.W., Nasrallah, A., Winokur, G., 1991.
The prediction of suicide. Sensitivity, specificity, and predictive
value of a multi-variate model applied to suicide among 1,906
patients with affective disorders. Archives of General Psychiatry
48, 418–422.
Harriss, L., Hawton, K., Zahl, D., 2005. Value of measuring suicidal
intent in the assessment of people attending hospital following
self-poisoning or self-injury. British Journal of Psychiatry 186,
60–66.
Hawton, K., Fagg, J., 1988. Suicide, and other causes of death,
following attempted suicide. British Journal of Psychiatry 152,
359–366.
Hawton, K., Fagg, J., Simkin, S., Harriss, L., Malmberg, A., 1998.
Methods used for suicide by farmers in England and Wales: the
contribution of availability and its relevance to prevention.
British Journal of Psychiatry 173, 320–324.
Hawton, K., Harriss, L., Hall, S., Simkin, S., Bale, E., Bond, A.,
2003a. Deliberate self-harm in Oxford, 1990–2000: a time of
change in patient characteristics. Psychological Medicine 33,
987–996.
Hawton, K., Zahl, D., Weatherall, R., 2003b. Suicide following
deliberate self-harm: long-term follow-up of patients who
presented to a general hospital. British Journal of Psychiatry
182, 537–542.
L. Harriss, K. Hawton / Journal of Affective Disorders 86 (2005) 225–233 233
Hawton, K., Harriss, L., Zahl., D., submitted for publication. Deaths
from all causes in a long-term follow-up study of 11,583
deliberate self-harm patients.
Nimeus, A., Alsen, M., Traskman-Bendz, L., 2002. High suicidal
intent scores indicate future suicide. Archives of Suicide
Research 6, 211–219.
Nordentoft, M., Breum, L., Munck, L.K., Nordestgaard, A.G.,
Hunding, A., Laursen Bjaeldager, P.A., 1993. High mortality by
natural and unnatural causes: a 10 year follow up study of
patients admitted to a poisoning treatment centre after suicide
attempt. British Medical Journal 306, 1637–1641.
Owens, D., Horrocks, J., House, A., 2002. Fatal and non-fatal
repetition of self-harm. British Journal of Psychiatry 181,
193–199.
Platt, S., Hawton, K., Kreitman, N., Fagg, J., Foster, J., 1988.
Recent clinical and epidemiological trends in parasuicide in
Edinburgh and Oxford: a tale of two cities. Psychological
Medicine 18, 405–418.
Pokorny, A.D., 1983. Prediction of suicide in psychiatric patients.
Archives of General Psychiatry 40, 249–257.
Pokorny, A.D., 1993. Suicide prediction revisited. Suicide and Life-
Threatening Behavior 23 (1), 1–10.
Powell, J., Geddes, J., Deeks, J.J., Goldacre, M., Hawton, K., 2000.
Suicide in psychiatric hospital in-patients. British Journal of
Psychiatry 176, 266–272.
Rutter, C.M., Miglioretti, D.L., 2003. Estimating the accuracy of
psychological scales using longitudinal data. Biostatistics 4,
97–107.
Sakinofsky, I., 2000. Repetition of suicidal behaviour. In: Hawton,
K., Van Heeringen, K. (Eds.), The International Handbook of
Suicide and Attempted Suicide. Wiley, Chichester, pp. 385–404.
Sellar, C., Goldacre, M.J., Hawton, K., 1990. Reliability of routine
hospital data on poisoning as measures of deliberate self
poisoning in adolescents. Journal of Epidemiology and Com-
munity Health 44, 313–315.
SPSS Inc., 2003. SPSS for Windows Release 11.5.2. SPSS Inc.,
Chicago.
StataCorp, 2001. Stata Statistical Software: release 7.0. Stata
Corporation, College Station, TX.
Zweig, M.H., Campbell, G., 1993. Receiver-operating characteristic
(ROC) plots: a fundamental evaluation tool in clinical medicine.
Clinical Chemistry 39, 561–577.