substrate-integrated waveguide microwave sensor for water
TRANSCRIPT
applied sciences
Article
Substrate-Integrated Waveguide Microwave Sensor forWater-in-Diesel Fuel Applications
Antonella Maria Loconsole , Vito Vincenzo Francione, Vincenza Portosi , Onofrio Losito, Michele Catalano,Attilio Di Nisio , Filippo Attivissimo and Francesco Prudenzano *
Citation: Loconsole, A.M.; Francione,
V.V.; Portosi, V.; Losito, O.; Catalano,
M.; Di Nisio, A.; Attivissimo, F.;
Prudenzano, F. Substrate-Integrated
Waveguide Microwave Sensor for
Water-in-Diesel Fuel Applications.
Appl. Sci. 2021, 11, 10454. https://
doi.org/10.3390/app112110454
Academic Editors: Adel Razek and
Ernesto Limiti
Received: 10 August 2021
Accepted: 3 November 2021
Published: 7 November 2021
Publisher’s Note: MDPI stays neutral
with regard to jurisdictional claims in
published maps and institutional affil-
iations.
Copyright: © 2021 by the authors.
Licensee MDPI, Basel, Switzerland.
This article is an open access article
distributed under the terms and
conditions of the Creative Commons
Attribution (CC BY) license (https://
creativecommons.org/licenses/by/
4.0/).
Department of Electrical and Information Engineering, Politecnico di Bari, Via Orabona, 4, 70125 Bari, Italy;[email protected] (A.M.L.); [email protected] (V.V.F.);[email protected] (V.P.); [email protected] (O.L.); [email protected] (M.C.);[email protected] (A.D.N.); [email protected] (F.A.)* Correspondence: [email protected]
Abstract: A water-in-diesel microwave sensor based on a substrate integrated waveguide (SIW)microwave applicator is designed and characterized in this study. The interaction between themicrowave electromagnetic field and the diesel fuel contaminated with small concentrations of wateris obtained via suitable radiating slots placed on the top of an SIW waveguiding structure. The SIWapplicator working frequency is chosen by observing the behavior of the complex dielectric permit-tivity of the fuel–water blend based on a preliminary wide band investigation. The performances ofthe SIW microwave sensor are evaluated in terms of scattering parameter modulus |S21| as a functionof the water concentration in ppm. The best sensitivity ∆|S21|
∆ρ = 1.42 mdB/ppm is obtained at a
frequency of f = 9.76 GHz, with a coefficient of determination R2 = 0.94. The sensor is low-cost, lowprofile and ensures a good sensitivity for constant and real-time monitoring.
Keywords: substrate integrated waveguide (SIW); microwave sensor; water-in-fuel monitoring
1. Introduction
The monitoring of hydrocarbon quality is an important goal, not only for modernautomotive, industrial and aerospace applications, but also in view of the next uses ofbiodiesel fuel generation [1,2]. There are many different contaminants that can compromisehydrocarbon quality, such as alcohol, water, ethanol, and oils [3–5]. Monitoring shouldbe fast, accurate and real time, because these contaminants could alter the lubrificationproperties of fuel and reduce motor performance. In particular, they could alter the viscosity,density, and boiling point of the hydrocarbons [6]. In general, traditional laboratorytechniques, such as an evaporation test, distillation, gas chromatography, etc., useful toidentify the quality of petroleum liquid and its derivative products, are more expensive andintroduce a delay time for analysis. Microwave sensor techniques provide an interestingalternative approach [5–11].
Water in fuel also causes the corrosion of metallic parts [1]. Therefore, conformity andquality standards must be respected for suitable fuel employment. For example, with refer-ence to water in fuel concentrations, EN590 is the European rule defining the standard forautomotive and ASTM D1655 for aerospace applications [12–14]. In particular, regardingautomotive applications, the water content in fuel must not be over 500 ppm [15]. Watercontamination can be detected by using different electromagnetic technologies, includingoptical fiber gratings and microwave reflection techniques [14–20]. Microwave (MW) sen-sors can be very efficient devices for real-time water detection, since the dielectric constantof water, εr,H2O = 70, is about 40 times the dielectric constant of diesel fuel, εr, f uel = 1.75, atthe frequency f = 10 GHz. Many different kinds of devices have been proposed, includingcoaxial antennas and microstrip sensors, stacked multi ring resonators (SMRR) or verti-cally stacked ring resonators (VSRR), and microwave resonant cavities [5–11,14,15,20–24].
Appl. Sci. 2021, 11, 10454. https://doi.org/10.3390/app112110454 https://www.mdpi.com/journal/applsci
Appl. Sci. 2021, 11, 10454 2 of 18
Microstrip technology, in addition to having a number of practical advantages, allows todesign compact and integrated devices, but it does not guarantee a complete confinementof the electromagnetic (EM) field and suffers radiating losses. On the other hand, substrateintegrated waveguide (SIW) technology allows to obtain compact and low-cost solutions,good performances, integration of active and passive devices on a single substrate, goodEM field guidance, a reduction in insertion and radiation losses, and the use of higherpower [25–29]. SIW technology is employed in many fields, including aerospace, medicaltherapy, industrial monitoring, and free-space communications, thanks to the easiness ofits construction process [30–39].
In this work, a microwave SIW applicator for water-in-fuel detection is designed andconstructed. To the best of our knowledge, the microwave frequency range f = 9− 11 GHzis investigated to this aim for the first time, allowing the creation of a very compactdevice. The sensor characterization, using a vector network analyzer (VNA), confirms thesimulation results with a quite good agreement. These performances are intriguing whencompared to the literature results [14,15,22].
2. Water-Fuel Blend Characterization
The SIW microwave applicator is designed to work in the frequency range f = 9− 11 GHzwith CST Studio Suite® software. This frequency range was chosen by observing the be-havior of the complex dielectric permittivity of the fuel–water blend, on the basis of awide-band investigation performed with a SPEAG DAK 3.5 probe [40] and a N9927AFieldFox Handheld Microwave Vector Analyzer by Keysight [41]. This preliminary investi-gation has highlighted changes in complex dielectric permittivity at the aforementionedfrequencies, thus promising potential applications for sensing.
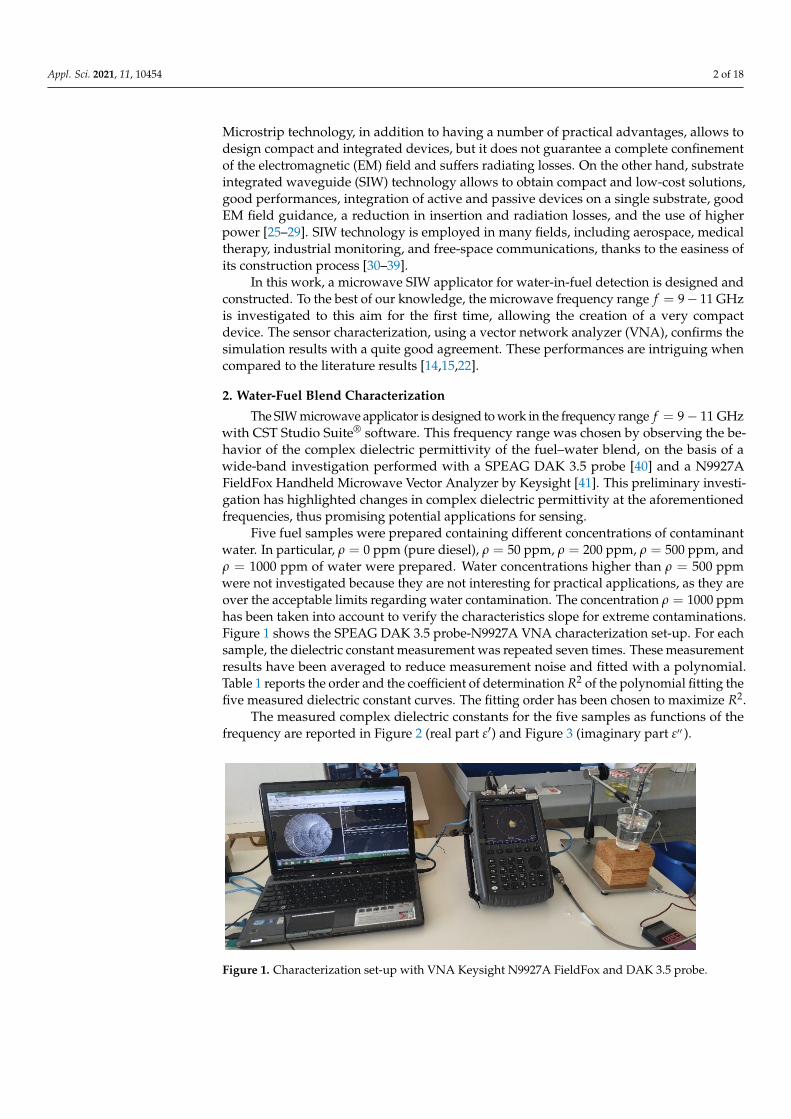
Five fuel samples were prepared containing different concentrations of contaminantwater. In particular, ρ = 0 ppm (pure diesel), ρ = 50 ppm, ρ = 200 ppm, ρ = 500 ppm, andρ = 1000 ppm of water were prepared. Water concentrations higher than ρ = 500 ppmwere not investigated because they are not interesting for practical applications, as they areover the acceptable limits regarding water contamination. The concentration ρ = 1000 ppmhas been taken into account to verify the characteristics slope for extreme contaminations.Figure 1 shows the SPEAG DAK 3.5 probe-N9927A VNA characterization set-up. For eachsample, the dielectric constant measurement was repeated seven times. These measurementresults have been averaged to reduce measurement noise and fitted with a polynomial.Table 1 reports the order and the coefficient of determination R2 of the polynomial fitting thefive measured dielectric constant curves. The fitting order has been chosen to maximize R2.
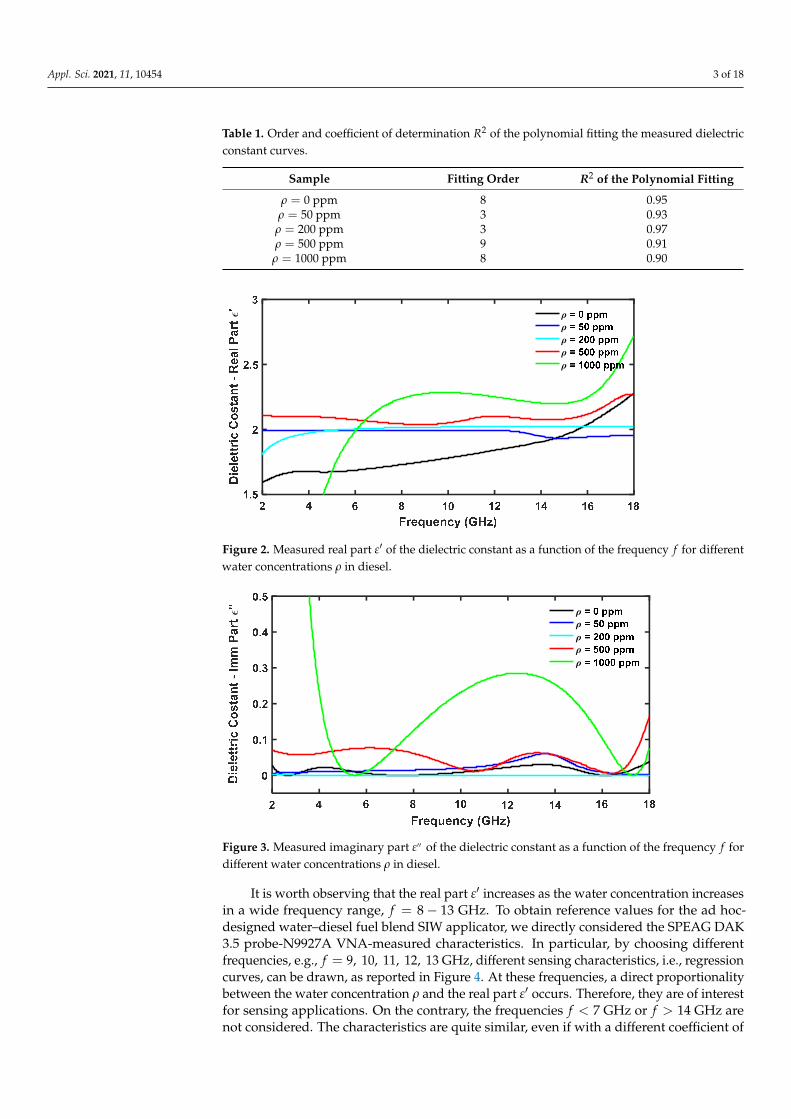
The measured complex dielectric constants for the five samples as functions of thefrequency are reported in Figure 2 (real part ε′) and Figure 3 (imaginary part ε′′ ).
Appl. Sci. 2021, 11, x FOR PEER REVIEW 3 of 19
SPEAG DAK 3.5 probe-N9927A VNA-measured characteristics. In particular, by choosing different frequencies, e.g., = 9, 10, 11, 12, 13GHz, different sensing characteristics, i.e., regression curves, can be drawn, as reported in Figure 4. At these frequencies, a direct proportionality between the water concentration and the real part ′ occurs. Therefore, they are of interest for sensing applications. On the contrary, the frequencies < 7GHz or > 14GHz are not considered. The characteristics are quite similar, even if with a different coefficient of determination , indicating the proportionate amount of variation in the response variable explained by the independent variable in the linear regression model. We underline that this preliminary investigation has been performed to roughly identify a frequency range where the variation in the complex dielectric constant with water concentration promises potential applications to be investigated.
Table 2 reports the measured sensitivities for the five curves of Figure 4, confirming this observation. The direct proportionality between the real part ′ and the water concentration pave the way to design an ad hoc water in diesel microwave sensor.
Figure 1. Characterization set-up with VNA Keysight N9927A FieldFox and DAK 3.5 probe.
Figure 2. Measured real part ’ of the dielectric constant as a function of the frequency for different water concentrations in diesel.
Figure 1. Characterization set-up with VNA Keysight N9927A FieldFox and DAK 3.5 probe.
Appl. Sci. 2021, 11, 10454 3 of 18
Table 1. Order and coefficient of determination R2 of the polynomial fitting the measured dielectricconstant curves.
Sample Fitting Order R2 of the Polynomial Fitting
ρ = 0 ppm 8 0.95ρ = 50 ppm 3 0.93
ρ = 200 ppm 3 0.97ρ = 500 ppm 9 0.91ρ = 1000 ppm 8 0.90
Appl. Sci. 2021, 11, x FOR PEER REVIEW 3 of 19
SPEAG DAK 3.5 probe-N9927A VNA-measured characteristics. In particular, by choosing different frequencies, e.g., = 9, 10, 11, 12, 13GHz, different sensing characteristics, i.e., regression curves, can be drawn, as reported in Figure 4. At these frequencies, a direct proportionality between the water concentration and the real part ′ occurs. Therefore, they are of interest for sensing applications. On the contrary, the frequencies < 7GHz or > 14GHz are not considered. The characteristics are quite similar, even if with a different coefficient of determination , indicating the proportionate amount of variation in the response variable explained by the independent variable in the linear regression model. We underline that this preliminary investigation has been performed to roughly identify a frequency range where the variation in the complex dielectric constant with water concentration promises potential applications to be investigated.
Table 2 reports the measured sensitivities for the five curves of Figure 4, confirming this observation. The direct proportionality between the real part ′ and the water concentration pave the way to design an ad hoc water in diesel microwave sensor.
Figure 1. Characterization set-up with VNA Keysight N9927A FieldFox and DAK 3.5 probe.
Figure 2. Measured real part ’ of the dielectric constant as a function of the frequency for different water concentrations in diesel.
Figure 2. Measured real part ε′ of the dielectric constant as a function of the frequency f for differentwater concentrations ρ in diesel.
Appl. Sci. 2021, 11, x FOR PEER REVIEW 4 of 19
Figure 3. Measured imaginary part ’’ of the dielectric constant as a function of the frequency for different water concentrations in diesel.
Figure 4. Real part ’ of the dielectric constant, measured with SPEAG DAK 3.5 probe-N9927A VNA, as a function of the water concentration in diesel, for different frequencies.
Table 2. Sensitivities of the SPEAG DAK 3.5 probe-N9927A VNA as a water-in-fuel sensor for dif-ferent frequencies.
Frequency (GHz) Sensitivity (× / ) 9 0.399 0.79 10 0.395 0.82 11 0.376 0.86 12 0.344 0.88 13 0.304 0.91
3. Applicator Design The aim of the design is to obtain a low cost, planar/low-profile and compact (of few
square centimeters) microwave applicator, providing good performance in terms of sen-sitivity and resolution, even if operating at a single frequency, to be employed in a simple online set-up, for example including a microwave source and an MW power meter.
Figure 3. Measured imaginary part ε′′ of the dielectric constant as a function of the frequency f fordifferent water concentrations ρ in diesel.
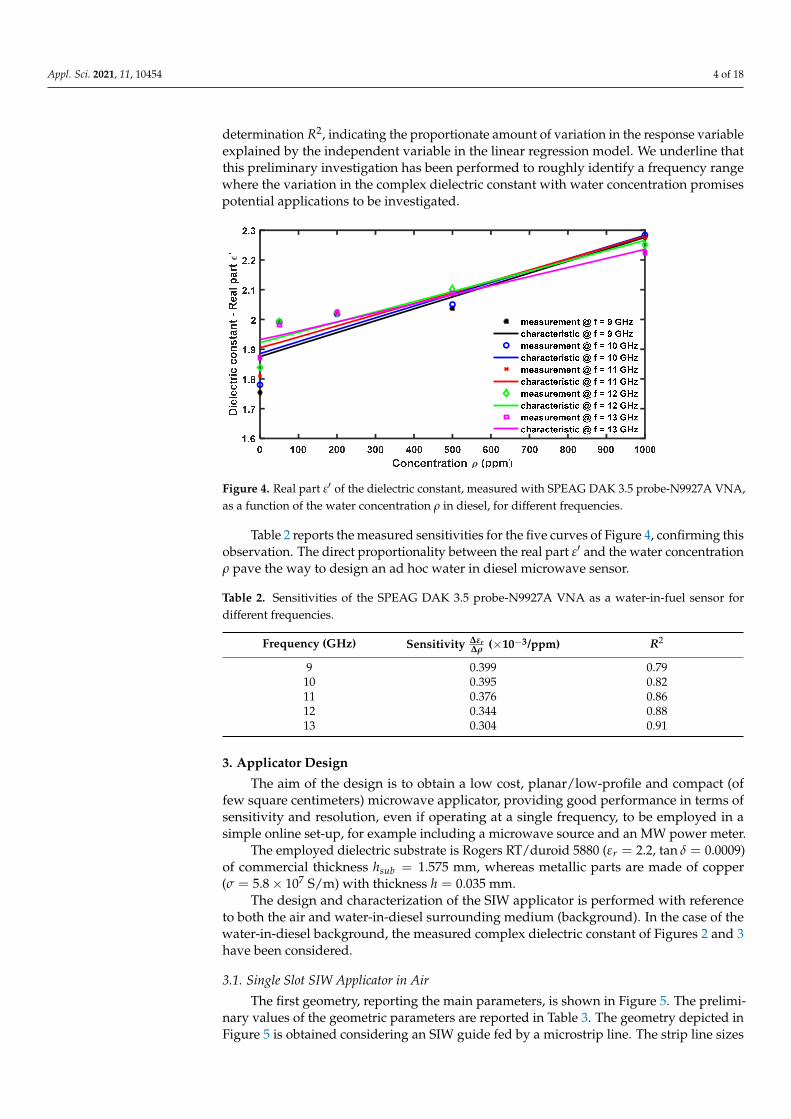
It is worth observing that the real part ε′ increases as the water concentration increasesin a wide frequency range, f = 8− 13 GHz. To obtain reference values for the ad hoc-designed water–diesel fuel blend SIW applicator, we directly considered the SPEAG DAK3.5 probe-N9927A VNA-measured characteristics. In particular, by choosing differentfrequencies, e.g., f = 9, 10, 11, 12, 13 GHz, different sensing characteristics, i.e., regressioncurves, can be drawn, as reported in Figure 4. At these frequencies, a direct proportionalitybetween the water concentration ρ and the real part ε′ occurs. Therefore, they are of interestfor sensing applications. On the contrary, the frequencies f < 7 GHz or f > 14 GHz arenot considered. The characteristics are quite similar, even if with a different coefficient of
Appl. Sci. 2021, 11, 10454 4 of 18
determination R2, indicating the proportionate amount of variation in the response variableexplained by the independent variable in the linear regression model. We underline thatthis preliminary investigation has been performed to roughly identify a frequency rangewhere the variation in the complex dielectric constant with water concentration promisespotential applications to be investigated.
Appl. Sci. 2021, 11, x FOR PEER REVIEW 4 of 19
Figure 3. Measured imaginary part ’’ of the dielectric constant as a function of the frequency for different water concentrations in diesel.
Figure 4. Real part ’ of the dielectric constant, measured with SPEAG DAK 3.5 probe-N9927A VNA, as a function of the water concentration in diesel, for different frequencies.
Table 2. Sensitivities of the SPEAG DAK 3.5 probe-N9927A VNA as a water-in-fuel sensor for dif-ferent frequencies.
Frequency (GHz) Sensitivity (× / ) 9 0.399 0.79 10 0.395 0.82 11 0.376 0.86 12 0.344 0.88 13 0.304 0.91
3. Applicator Design The aim of the design is to obtain a low cost, planar/low-profile and compact (of few
square centimeters) microwave applicator, providing good performance in terms of sen-sitivity and resolution, even if operating at a single frequency, to be employed in a simple online set-up, for example including a microwave source and an MW power meter.
Figure 4. Real part ε′ of the dielectric constant, measured with SPEAG DAK 3.5 probe-N9927A VNA,as a function of the water concentration ρ in diesel, for different frequencies.
Table 2 reports the measured sensitivities for the five curves of Figure 4, confirming thisobservation. The direct proportionality between the real part ε′ and the water concentrationρ pave the way to design an ad hoc water in diesel microwave sensor.
Table 2. Sensitivities of the SPEAG DAK 3.5 probe-N9927A VNA as a water-in-fuel sensor fordifferent frequencies.
Frequency (GHz) Sensitivity ∆εr∆ρ (×10−3/ppm) R2
9 0.399 0.7910 0.395 0.8211 0.376 0.8612 0.344 0.8813 0.304 0.91
3. Applicator Design
The aim of the design is to obtain a low cost, planar/low-profile and compact (offew square centimeters) microwave applicator, providing good performance in terms ofsensitivity and resolution, even if operating at a single frequency, to be employed in asimple online set-up, for example including a microwave source and an MW power meter.
The employed dielectric substrate is Rogers RT/duroid 5880 (εr = 2.2, tan δ = 0.0009)of commercial thickness hsub = 1.575 mm, whereas metallic parts are made of copper(σ = 5.8× 10⁷ S/m) with thickness h = 0.035 mm.
The design and characterization of the SIW applicator is performed with referenceto both the air and water-in-diesel surrounding medium (background). In the case of thewater-in-diesel background, the measured complex dielectric constant of Figures 2 and 3have been considered.
3.1. Single Slot SIW Applicator in Air
The first geometry, reporting the main parameters, is shown in Figure 5. The prelimi-nary values of the geometric parameters are reported in Table 3. The geometry depicted inFigure 5 is obtained considering an SIW guide fed by a microstrip line. The strip line sizes
Appl. Sci. 2021, 11, 10454 5 of 18
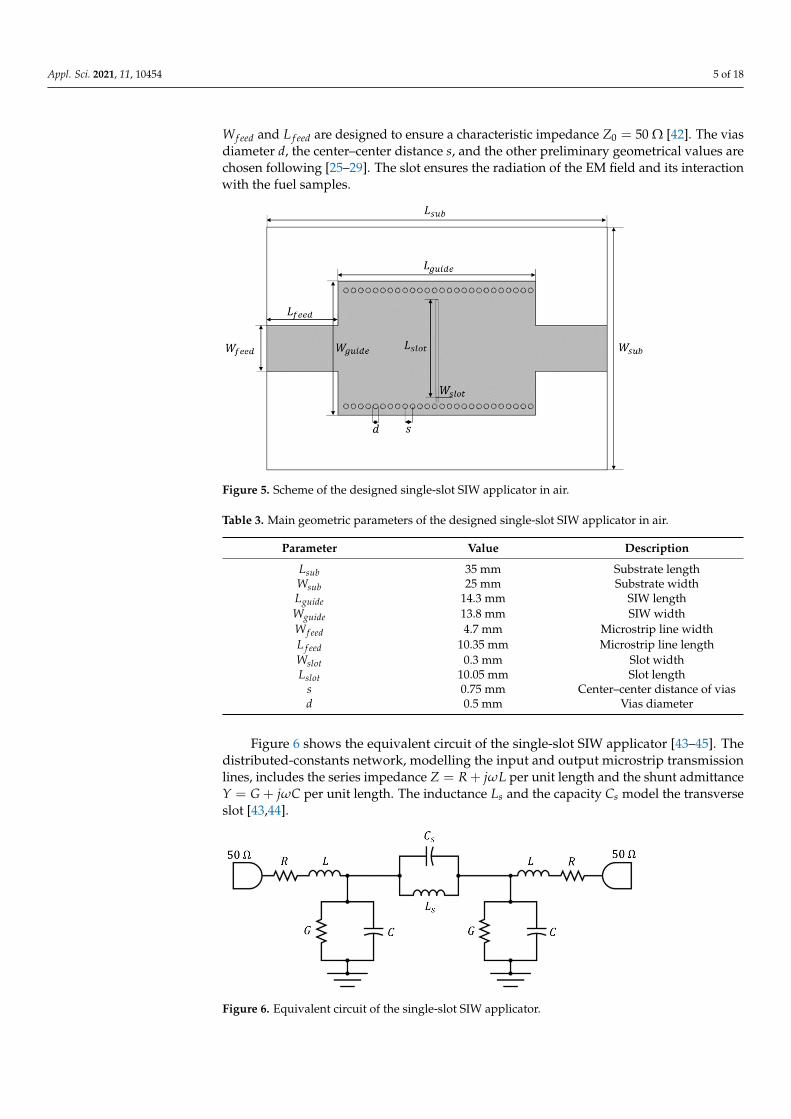
W f eed and L f eed are designed to ensure a characteristic impedance Z0 = 50 Ω [42]. The viasdiameter d, the center–center distance s, and the other preliminary geometrical values arechosen following [25–29]. The slot ensures the radiation of the EM field and its interactionwith the fuel samples.
Appl. Sci. 2021, 11, x FOR PEER REVIEW 5 of 19
The employed dielectric substrate is Rogers RT/duroid 5880 ( = 2.2 , tan =0.0009) of commercial thickness = 1.575mm, whereas metallic parts are made of copper ( = 5.8 × 10 S/m) with thickness = 0.035mm.
The design and characterization of the SIW applicator is performed with reference to both the air and water-in-diesel surrounding medium (background). In the case of the water-in-diesel background, the measured complex dielectric constant of Figures 2 and 3 have been considered.
3.1. Single Slot SIW Applicator in Air
The first geometry, reporting the main parameters, is shown in Figure 5. The prelim-inary values of the geometric parameters are reported in Table 3. The geometry depicted in Figure 5 is obtained considering an SIW guide fed by a microstrip line. The strip line sizes and are designed to ensure a characteristic impedance = 50Ω [42]. The vias diameter , the center–center distance , and the other preliminary geometrical values are chosen following [25–29]. The slot ensures the radiation of the EM field and its interaction with the fuel samples.
Figure 5. Scheme of the designed single-slot SIW applicator in air.
Figure 6 shows the equivalent circuit of the single-slot SIW applicator [43–45]. The distributed-constants network, modelling the input and output microstrip transmission lines, includes the series impedance = per unit length and the shunt admit-tance = per unit length. The inductance and the capacity model the transverse slot [43,44].
Figure 6. Equivalent circuit of the single-slot SIW applicator.
Figure 5. Scheme of the designed single-slot SIW applicator in air.
Table 3. Main geometric parameters of the designed single-slot SIW applicator in air.
Parameter Value Description
Lsub 35 mm Substrate lengthWsub 25 mm Substrate widthLguide 14.3 mm SIW lengthWguide 13.8 mm SIW widthW f eed 4.7 mm Microstrip line widthL f eed 10.35 mm Microstrip line lengthWslot 0.3 mm Slot widthLslot 10.05 mm Slot length
s 0.75 mm Center–center distance of viasd 0.5 mm Vias diameter
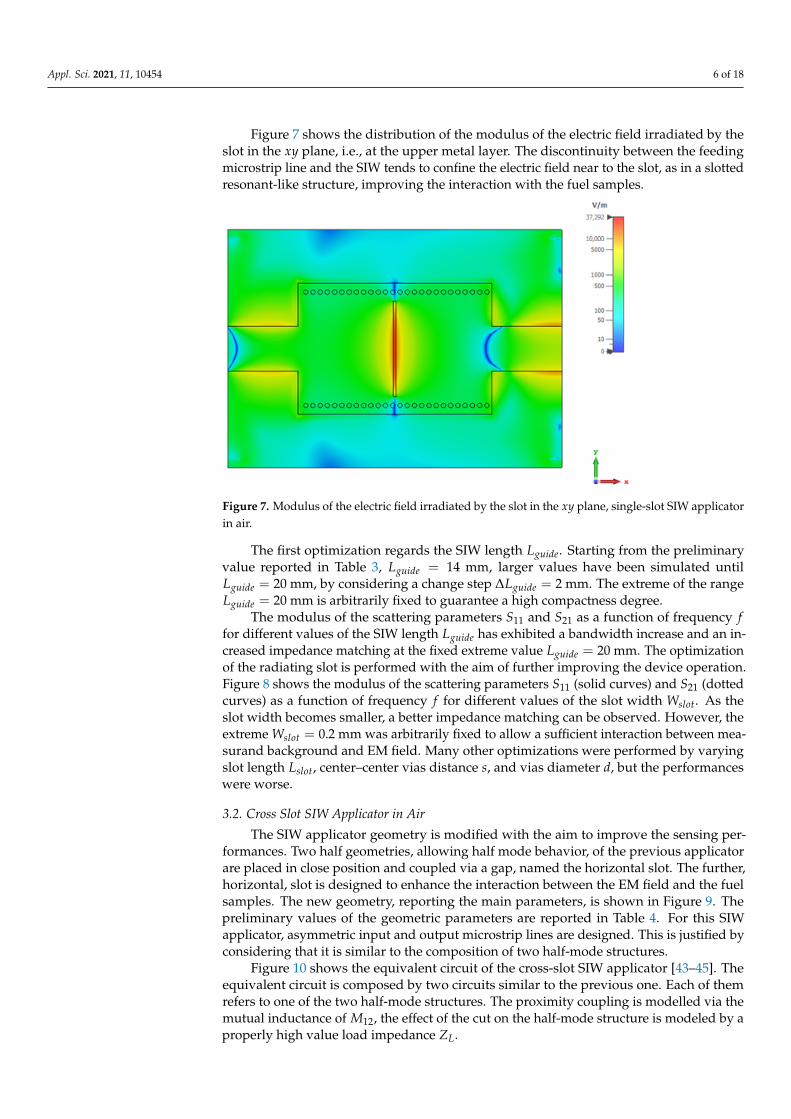
Figure 6 shows the equivalent circuit of the single-slot SIW applicator [43–45]. Thedistributed-constants network, modelling the input and output microstrip transmissionlines, includes the series impedance Z = R + jωL per unit length and the shunt admittanceY = G + jωC per unit length. The inductance Ls and the capacity Cs model the transverseslot [43,44].
Appl. Sci. 2021, 11, x FOR PEER REVIEW 5 of 19
The employed dielectric substrate is Rogers RT/duroid 5880 ( = 2.2 , tan =0.0009) of commercial thickness = 1.575mm, whereas metallic parts are made of copper ( = 5.8 × 10 S/m) with thickness = 0.035mm.
The design and characterization of the SIW applicator is performed with reference to both the air and water-in-diesel surrounding medium (background). In the case of the water-in-diesel background, the measured complex dielectric constant of Figures 2 and 3 have been considered.
3.1. Single Slot SIW Applicator in Air
The first geometry, reporting the main parameters, is shown in Figure 5. The prelim-inary values of the geometric parameters are reported in Table 3. The geometry depicted in Figure 5 is obtained considering an SIW guide fed by a microstrip line. The strip line sizes and are designed to ensure a characteristic impedance = 50Ω [42]. The vias diameter , the center–center distance , and the other preliminary geometrical values are chosen following [25–29]. The slot ensures the radiation of the EM field and its interaction with the fuel samples.
Figure 5. Scheme of the designed single-slot SIW applicator in air.
Figure 6 shows the equivalent circuit of the single-slot SIW applicator [43–45]. The distributed-constants network, modelling the input and output microstrip transmission lines, includes the series impedance = per unit length and the shunt admit-tance = per unit length. The inductance and the capacity model the transverse slot [43,44].
Figure 6. Equivalent circuit of the single-slot SIW applicator.
Figure 6. Equivalent circuit of the single-slot SIW applicator.
Appl. Sci. 2021, 11, 10454 6 of 18
Figure 7 shows the distribution of the modulus of the electric field irradiated by theslot in the xy plane, i.e., at the upper metal layer. The discontinuity between the feedingmicrostrip line and the SIW tends to confine the electric field near to the slot, as in a slottedresonant-like structure, improving the interaction with the fuel samples.
Appl. Sci. 2021, 11, x FOR PEER REVIEW 6 of 19
Figure 7 shows the distribution of the modulus of the electric field irradiated by the slot in the plane, i.e., at the upper metal layer. The discontinuity between the feeding microstrip line and the SIW tends to confine the electric field near to the slot, as in a slotted resonant-like structure, improving the interaction with the fuel samples.
Table 3. Main geometric parameters of the designed single-slot SIW applicator in air.
Parameter Value Description 35 mm Substrate length 25 mm Substrate width 14.3 mm SIW length 13.8 mm SIW width 4.7 mm Microstrip line width 10.35 mm Microstrip line length 0.3 mm Slot width 10.05 mm Slot length
0.75 mm Center–center distance of vias 0.5 mm Vias diameter
Figure 7. Modulus of the electric field irradiated by the slot in the plane, single-slot SIW appli-cator in air.
The first optimization regards the SIW length . Starting from the preliminary value reported in Table 3, = 14mm , larger values have been simulated until = 20mm, by considering a change step = 2mm. The extreme of the range = 20mm is arbitrarily fixed to guarantee a high compactness degree.
The modulus of the scattering parameters and as a function of frequency for different values of the SIW length has exhibited a bandwidth increase and an increased impedance matching at the fixed extreme value = 20mm. The optimiza-tion of the radiating slot is performed with the aim of further improving the device oper-ation. Figure 8 shows the modulus of the scattering parameters (solid curves) and (dotted curves) as a function of frequency for different values of the slot width . As the slot width becomes smaller, a better impedance matching can be observed. How-ever, the extreme = 0.2mm was arbitrarily fixed to allow a sufficient interaction be-tween measurand background and EM field. Many other optimizations were performed
Figure 7. Modulus of the electric field irradiated by the slot in the xy plane, single-slot SIW applicatorin air.
The first optimization regards the SIW length Lguide. Starting from the preliminaryvalue reported in Table 3, Lguide = 14 mm, larger values have been simulated untilLguide = 20 mm, by considering a change step ∆Lguide = 2 mm. The extreme of the rangeLguide = 20 mm is arbitrarily fixed to guarantee a high compactness degree.
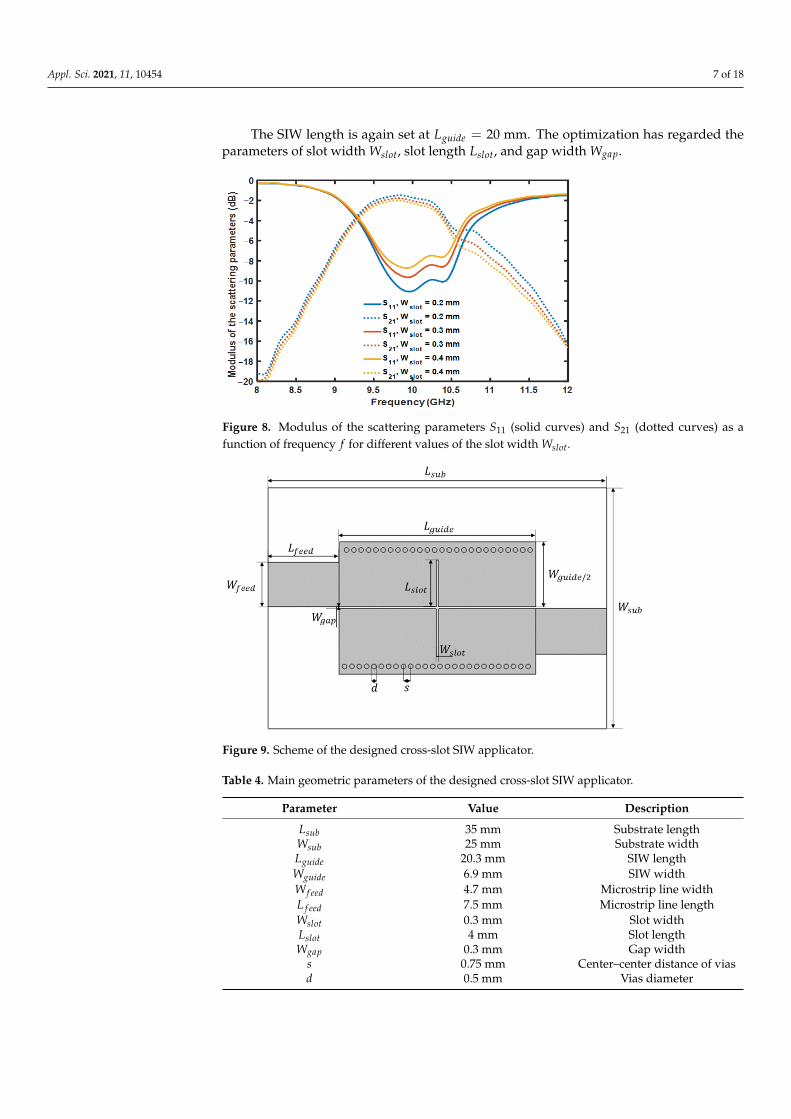
The modulus of the scattering parameters S11 and S21 as a function of frequency ffor different values of the SIW length Lguide has exhibited a bandwidth increase and an in-creased impedance matching at the fixed extreme value Lguide = 20 mm. The optimizationof the radiating slot is performed with the aim of further improving the device operation.Figure 8 shows the modulus of the scattering parameters S11 (solid curves) and S21 (dottedcurves) as a function of frequency f for different values of the slot width Wslot. As theslot width becomes smaller, a better impedance matching can be observed. However, theextreme Wslot = 0.2 mm was arbitrarily fixed to allow a sufficient interaction between mea-surand background and EM field. Many other optimizations were performed by varyingslot length Lslot, center–center vias distance s, and vias diameter d, but the performanceswere worse.
3.2. Cross Slot SIW Applicator in Air
The SIW applicator geometry is modified with the aim to improve the sensing per-formances. Two half geometries, allowing half mode behavior, of the previous applicatorare placed in close position and coupled via a gap, named the horizontal slot. The further,horizontal, slot is designed to enhance the interaction between the EM field and the fuelsamples. The new geometry, reporting the main parameters, is shown in Figure 9. Thepreliminary values of the geometric parameters are reported in Table 4. For this SIWapplicator, asymmetric input and output microstrip lines are designed. This is justified byconsidering that it is similar to the composition of two half-mode structures.
Figure 10 shows the equivalent circuit of the cross-slot SIW applicator [43–45]. Theequivalent circuit is composed by two circuits similar to the previous one. Each of themrefers to one of the two half-mode structures. The proximity coupling is modelled via themutual inductance of M12, the effect of the cut on the half-mode structure is modeled by aproperly high value load impedance ZL.
Appl. Sci. 2021, 11, 10454 7 of 18
The SIW length is again set at Lguide = 20 mm. The optimization has regarded theparameters of slot width Wslot, slot length Lslot, and gap width Wgap.
Appl. Sci. 2021, 11, x FOR PEER REVIEW 7 of 19
by varying slot length , center–center vias distance , and vias diameter , but the performances were worse.
Figure 8. Modulus of the scattering parameters (solid curves) and (dotted curves) as a func-tion of frequency for different values of the slot width .
3.2. Cross Slot SIW Applicator in Air
The SIW applicator geometry is modified with the aim to improve the sensing per-formances. Two half geometries, allowing half mode behavior, of the previous applicator are placed in close position and coupled via a gap, named the horizontal slot. The further, horizontal, slot is designed to enhance the interaction between the EM field and the fuel samples. The new geometry, reporting the main parameters, is shown in Figure 9. The preliminary values of the geometric parameters are reported in Table 4. For this SIW ap-plicator, asymmetric input and output microstrip lines are designed. This is justified by considering that it is similar to the composition of two half-mode structures.
Figure 10 shows the equivalent circuit of the cross-slot SIW applicator [43–45]. The equivalent circuit is composed by two circuits similar to the previous one. Each of them refers to one of the two half-mode structures. The proximity coupling is modelled via the mutual inductance of , the effect of the cut on the half-mode structure is modeled by a properly high value load impedance .
Figure 9. Scheme of the designed cross-slot SIW applicator.
Figure 8. Modulus of the scattering parameters S11 (solid curves) and S21 (dotted curves) as afunction of frequency f for different values of the slot width Wslot.
Appl. Sci. 2021, 11, x FOR PEER REVIEW 7 of 19
by varying slot length , center–center vias distance , and vias diameter , but the performances were worse.
Figure 8. Modulus of the scattering parameters (solid curves) and (dotted curves) as a func-tion of frequency for different values of the slot width .
3.2. Cross Slot SIW Applicator in Air
The SIW applicator geometry is modified with the aim to improve the sensing per-formances. Two half geometries, allowing half mode behavior, of the previous applicator are placed in close position and coupled via a gap, named the horizontal slot. The further, horizontal, slot is designed to enhance the interaction between the EM field and the fuel samples. The new geometry, reporting the main parameters, is shown in Figure 9. The preliminary values of the geometric parameters are reported in Table 4. For this SIW ap-plicator, asymmetric input and output microstrip lines are designed. This is justified by considering that it is similar to the composition of two half-mode structures.
Figure 10 shows the equivalent circuit of the cross-slot SIW applicator [43–45]. The equivalent circuit is composed by two circuits similar to the previous one. Each of them refers to one of the two half-mode structures. The proximity coupling is modelled via the mutual inductance of , the effect of the cut on the half-mode structure is modeled by a properly high value load impedance .
Figure 9. Scheme of the designed cross-slot SIW applicator. Figure 9. Scheme of the designed cross-slot SIW applicator.
Table 4. Main geometric parameters of the designed cross-slot SIW applicator.
Parameter Value Description
Lsub 35 mm Substrate lengthWsub 25 mm Substrate widthLguide 20.3 mm SIW lengthWguide 6.9 mm SIW widthW f eed 4.7 mm Microstrip line widthL f eed 7.5 mm Microstrip line lengthWslot 0.3 mm Slot widthLslot 4 mm Slot lengthWgap 0.3 mm Gap width
s 0.75 mm Center–center distance of viasd 0.5 mm Vias diameter
Appl. Sci. 2021, 11, 10454 8 of 18
Appl. Sci. 2021, 11, x FOR PEER REVIEW 8 of 19
Table 4. Main geometric parameters of the designed cross-slot SIW applicator.
Parameter Value Description 35 mm Substrate length 25 mm Substrate width 20.3 mm SIW length 6.9 mm SIW width 4.7 mm Microstrip line width 7.5 mm Microstrip line length 0.3 mm Slot width 4 mm Slot length 0.3 mm Gap width
0.75 mm Center–center distance of vias 0.5 mm Vias diameter
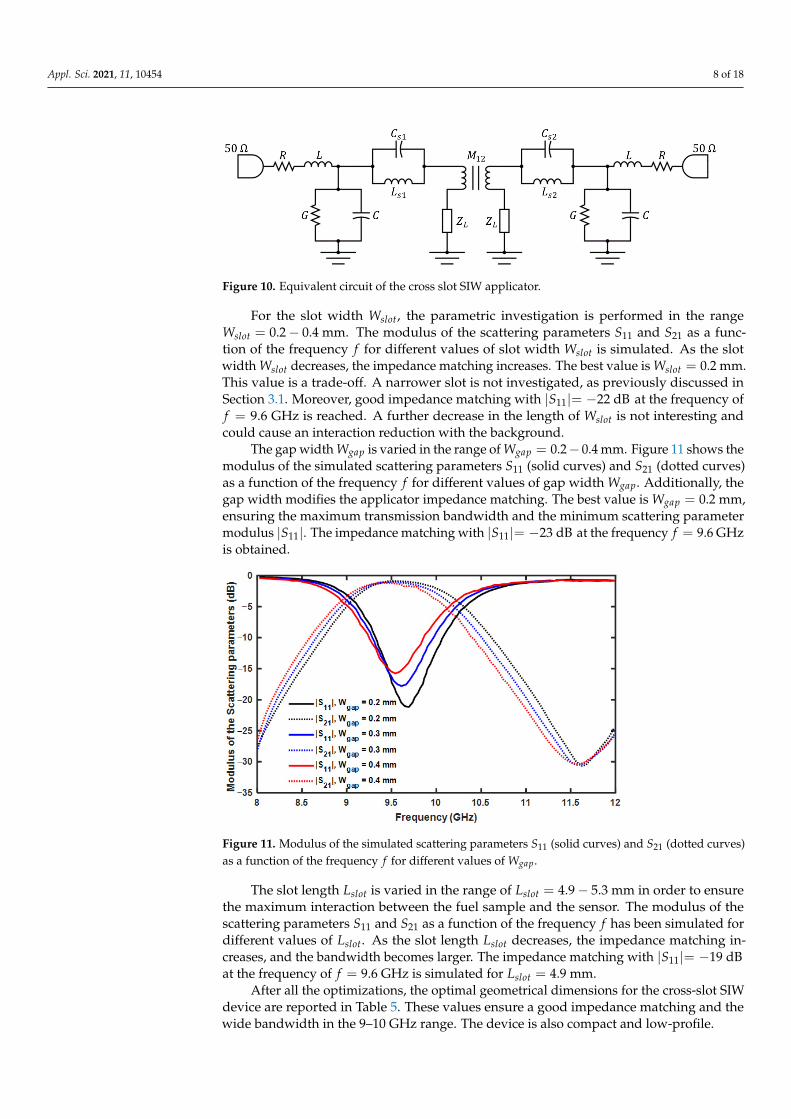
Figure 10. Equivalent circuit of the cross slot SIW applicator.
The SIW length is again set at = 20mm. The optimization has regarded the parameters of slot width , slot length , and gap width .
For the slot width , the parametric investigation is performed in the range = 0.2 − 0.4mm. The modulus of the scattering parameters and as a func-tion of the frequency for different values of slot width is simulated. As the slot width decreases, the impedance matching increases. The best value is =0.2mm. This value is a trade-off. A narrower slot is not investigated, as previously dis-cussed in Section 3.1. Moreover, good impedance matching with | | = −22dB at the frequency of = 9.6GHz is reached. A further decrease in the length of is not in-teresting and could cause an interaction reduction with the background.
The gap width is varied in the range of = 0.2 − 0.4mm. Figure 11 shows the modulus of the simulated scattering parameters (solid curves) and (dotted curves) as a function of the frequency for different values of gap width . Addition-ally, the gap width modifies the applicator impedance matching. The best value is =0.2mm, ensuring the maximum transmission bandwidth and the minimum scattering pa-rameter modulus | |. The impedance matching with | | = −23dB at the frequency = 9.6GHz is obtained.
Figure 10. Equivalent circuit of the cross slot SIW applicator.
For the slot width Wslot, the parametric investigation is performed in the rangeWslot = 0.2− 0.4 mm. The modulus of the scattering parameters S11 and S21 as a func-tion of the frequency f for different values of slot width Wslot is simulated. As the slotwidth Wslot decreases, the impedance matching increases. The best value is Wslot = 0.2 mm.This value is a trade-off. A narrower slot is not investigated, as previously discussed inSection 3.1. Moreover, good impedance matching with |S11|= −22 dB at the frequency off = 9.6 GHz is reached. A further decrease in the length of Wslot is not interesting andcould cause an interaction reduction with the background.
The gap width Wgap is varied in the range of Wgap = 0.2− 0.4 mm. Figure 11 shows themodulus of the simulated scattering parameters S11 (solid curves) and S21 (dotted curves)as a function of the frequency f for different values of gap width Wgap. Additionally, thegap width modifies the applicator impedance matching. The best value is Wgap = 0.2 mm,ensuring the maximum transmission bandwidth and the minimum scattering parametermodulus |S11|. The impedance matching with |S11|= −23 dB at the frequency f = 9.6 GHzis obtained.
Appl. Sci. 2021, 11, x FOR PEER REVIEW 9 of 19
Figure 11. Modulus of the simulated scattering parameters (solid curves) and (dotted curves) as a function of the frequency for different values of .
The slot length is varied in the range of = 4.9 − 5.3mm in order to ensure the maximum interaction between the fuel sample and the sensor. The modulus of the scattering parameters and as a function of the frequency has been simulated for different values of . As the slot length decreases, the impedance matching increases, and the bandwidth becomes larger. The impedance matching with | | =−19dB at the frequency of = 9.6GHz is simulated for = 4.9mm.
After all the optimizations, the optimal geometrical dimensions for the cross-slot SIW device are reported in Table 5. These values ensure a good impedance matching and the wide bandwidth in the 9–10 GHz range. The device is also compact and low-profile.
Table 5. Optimized geometric parameters of the designed cross-slot SIW applicator.
Parameter Value Description 35 mm Substrate length 25 mm Substrate width 20 mm SIW length / 6.9 mm Half SIW width 4.7 mm Microstrip line width 7.5 mm Microstrip line length 0.2 mm Slot width 4.9 mm Slot length 0.2 mm Gap distance
0.75 mm Center–center distance of vias 0.5 mm Vias diameter
4. Simulation of Cross-Slot SIW Applicator as Sensor Water-in-Diesel Background To evaluate the cross-slot SIW applicator performances as a water-in-fuel sensor, the
measured dielectric constants of the five samples were imported into the simulation CST Studio Suite® software. A similar investigation to that reported in Section 3 was per-formed, showing that the same SIW structure could be employed with a water-in-diesel background, allowing a promising performance without further refinement. In other words, the dielectric constant of air and the real part ’ of the diesel dielectric constant at the considered frequencies are sufficiently close.
Figure 11. Modulus of the simulated scattering parameters S11 (solid curves) and S21 (dotted curves)as a function of the frequency f for different values of Wgap.
The slot length Lslot is varied in the range of Lslot = 4.9− 5.3 mm in order to ensurethe maximum interaction between the fuel sample and the sensor. The modulus of thescattering parameters S11 and S21 as a function of the frequency f has been simulated fordifferent values of Lslot. As the slot length Lslot decreases, the impedance matching in-creases, and the bandwidth becomes larger. The impedance matching with |S11|= −19 dBat the frequency of f = 9.6 GHz is simulated for Lslot = 4.9 mm.
After all the optimizations, the optimal geometrical dimensions for the cross-slot SIWdevice are reported in Table 5. These values ensure a good impedance matching and thewide bandwidth in the 9–10 GHz range. The device is also compact and low-profile.
Appl. Sci. 2021, 11, 10454 9 of 18
Table 5. Optimized geometric parameters of the designed cross-slot SIW applicator.
Parameter Value DescriptionLsub 35 mm Substrate lengthWsub 25 mm Substrate widthLguide 20 mm SIW length
Wguide/2 6.9 mm Half SIW widthW f eed 4.7 mm Microstrip line widthL f eed 7.5 mm Microstrip line lengthWslot 0.2 mm Slot widthLslot 4.9 mm Slot lengthgap 0.2 mm Gap distance
s 0.75 mm Center–center distance of viasd 0.5 mm Vias diameter
4. Simulation of Cross-Slot SIW Applicator as Sensor Water-in-Diesel Background
To evaluate the cross-slot SIW applicator performances as a water-in-fuel sensor,the measured dielectric constants of the five samples were imported into the simulationCST Studio Suite® software. A similar investigation to that reported in Section 3 wasperformed, showing that the same SIW structure could be employed with a water-in-dieselbackground, allowing a promising performance without further refinement. In otherwords, the dielectric constant of air and the real part ε′ of the diesel dielectric constant atthe considered frequencies f are sufficiently close.
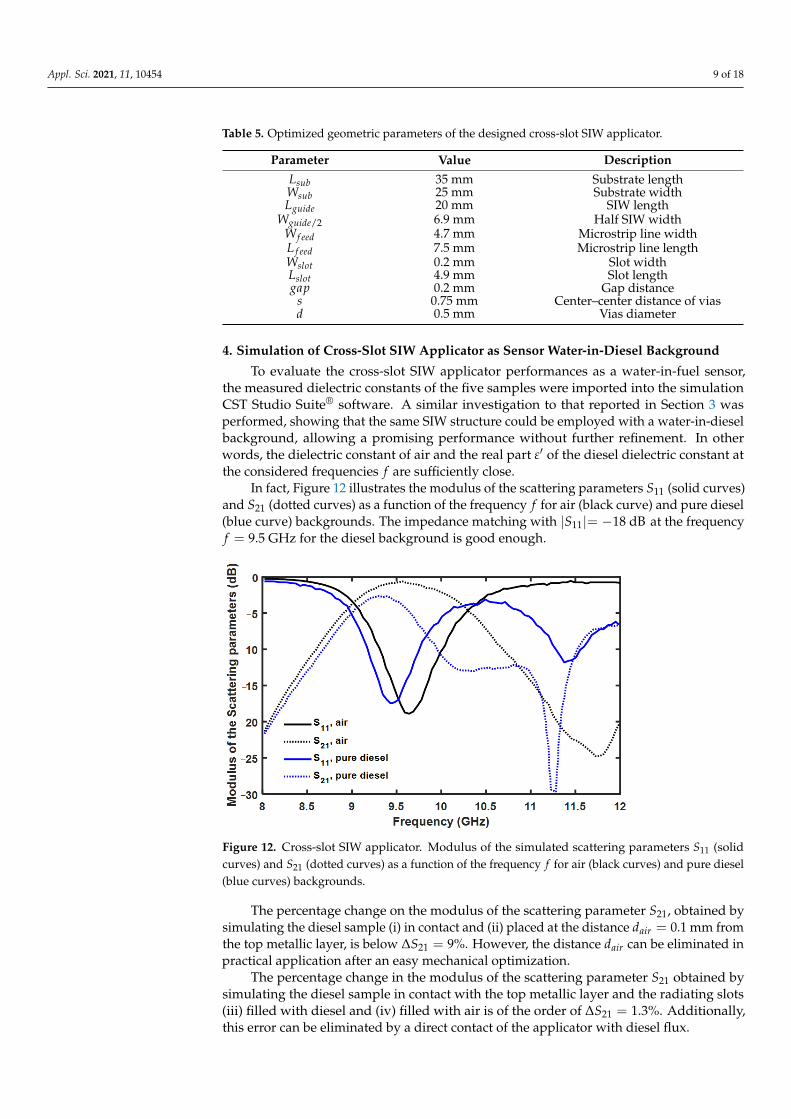
In fact, Figure 12 illustrates the modulus of the scattering parameters S11 (solid curves)and S21 (dotted curves) as a function of the frequency f for air (black curve) and pure diesel(blue curve) backgrounds. The impedance matching with |S11|= −18 dB at the frequencyf = 9.5 GHz for the diesel background is good enough.
Appl. Sci. 2021, 11, x FOR PEER REVIEW 10 of 19
In fact, Figure 12 illustrates the modulus of the scattering parameters (solid curves) and (dotted curves) as a function of the frequency for air (black curve) and pure diesel (blue curve) backgrounds. The impedance matching with | | = −18dB at the frequency = 9.5GHz for the diesel background is good enough.
Figure 12. Cross-slot SIW applicator. Modulus of the simulated scattering parameters (solid curves) and (dotted curves) as a function of the frequency for air (black curves) and pure diesel (blue curves) backgrounds.
The percentage change on the modulus of the scattering parameter , obtained by simulating the diesel sample (i) in contact and (ii) placed at the distance = 0.1mm from the top metallic layer, is below Δ = 9%. However, the distance can be elim-inated in practical application after an easy mechanical optimization.
The percentage change in the modulus of the scattering parameter obtained by simulating the diesel sample in contact with the top metallic layer and the radiating slots (iii) filled with diesel and (iv) filled with air is of the order of Δ = 1.3%. Additionally, this error can be eliminated by a direct contact of the applicator with diesel flux.
Figure 13a shows the modulus of the simulated scattering parameter as a func-tion of the frequency for the five different water concentrations. Figure 13b is a magni-fied view of the matching frequency = 9.5GHz. It shows that, as the water concentration increases, the modulus of the scattering parameter decreases. The variation is quite linear. The values of the modulus of the scattering parameter for the five water con-centrations at frequency = 9.2GHz are listed in Table 6.
Figure 12. Cross-slot SIW applicator. Modulus of the simulated scattering parameters S11 (solidcurves) and S21 (dotted curves) as a function of the frequency f for air (black curves) and pure diesel(blue curves) backgrounds.
The percentage change on the modulus of the scattering parameter S21, obtained bysimulating the diesel sample (i) in contact and (ii) placed at the distance dair = 0.1 mm fromthe top metallic layer, is below ∆S21 = 9%. However, the distance dair can be eliminated inpractical application after an easy mechanical optimization.
The percentage change in the modulus of the scattering parameter S21 obtained bysimulating the diesel sample in contact with the top metallic layer and the radiating slots(iii) filled with diesel and (iv) filled with air is of the order of ∆S21 = 1.3%. Additionally,this error can be eliminated by a direct contact of the applicator with diesel flux.
Appl. Sci. 2021, 11, 10454 10 of 18
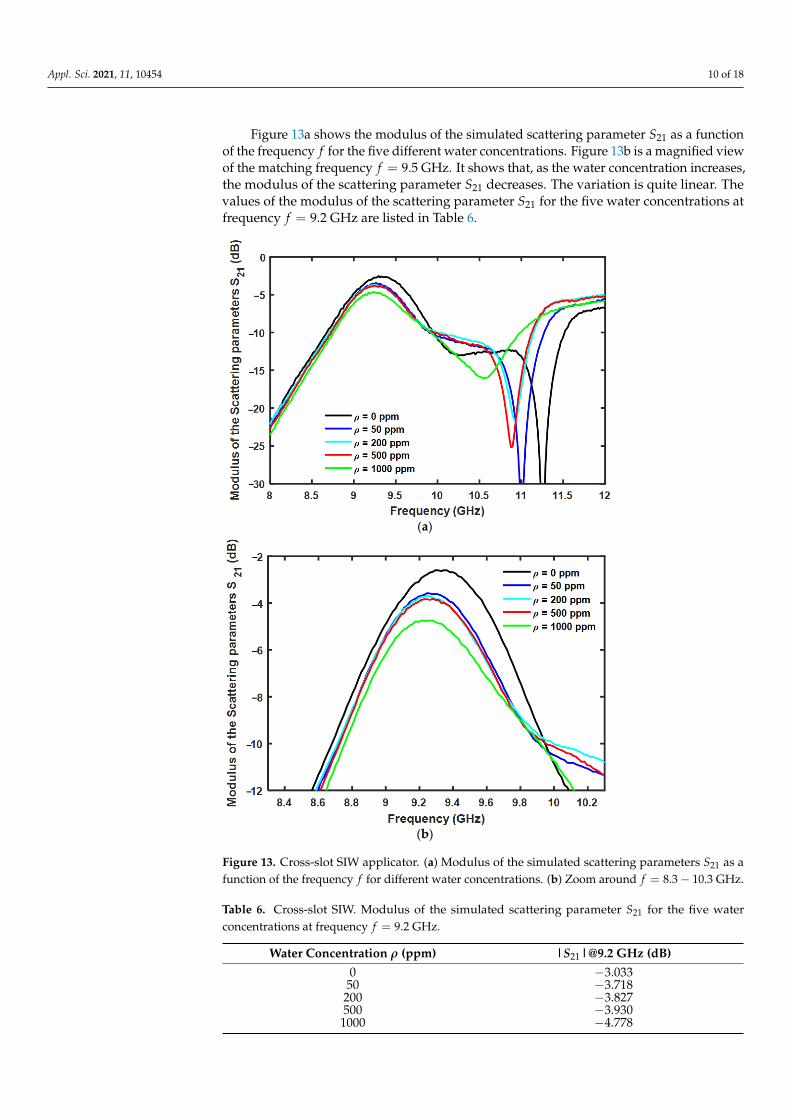
Figure 13a shows the modulus of the simulated scattering parameter S21 as a functionof the frequency f for the five different water concentrations. Figure 13b is a magnified viewof the matching frequency f = 9.5 GHz. It shows that, as the water concentration increases,the modulus of the scattering parameter S21 decreases. The variation is quite linear. Thevalues of the modulus of the scattering parameter S21 for the five water concentrations atfrequency f = 9.2 GHz are listed in Table 6.
Appl. Sci. 2021, 11, x FOR PEER REVIEW 11 of 19
(a)
(b)
Figure 13. Cross-slot SIW applicator. (a) Modulus of the simulated scattering parameters as a function of the frequency for different water concentrations. (b) Zoom around = 8.3 −10.3GHz. Table 6. Cross-slot SIW. Modulus of the simulated scattering parameter for the five water con-centrations at frequency = 9.2GHz.
Water Concentration (ppm) | |@ . (dB) 0 −3.033 50 −3.718 200 −3.827 500 −3.930 1000 −4.778
The simulated sensor sensitivity can be calculated as Δ| |Δ = 1.39mdB/[email protected]
The coefficient of determination is = 0.85, which is quite good.
Figure 13. Cross-slot SIW applicator. (a) Modulus of the simulated scattering parameters S21 as afunction of the frequency f for different water concentrations. (b) Zoom around f = 8.3− 10.3 GHz.
Table 6. Cross-slot SIW. Modulus of the simulated scattering parameter S21 for the five waterconcentrations at frequency f = 9.2 GHz.
Water Concentration ρ (ppm) |S21|@9.2 GHz (dB)0 −3.03350 −3.718200 −3.827500 −3.9301000 −4.778
Appl. Sci. 2021, 11, 10454 11 of 18
The simulated sensor sensitivity can be calculated as
∆|S21|∆ρ
= 1.39 mdB/ppm @ 9.2 GHz
The coefficient of determination is R2 = 0.85, which is quite good.
5. Cross-Slot SIW Applicator Characterization, Air Background
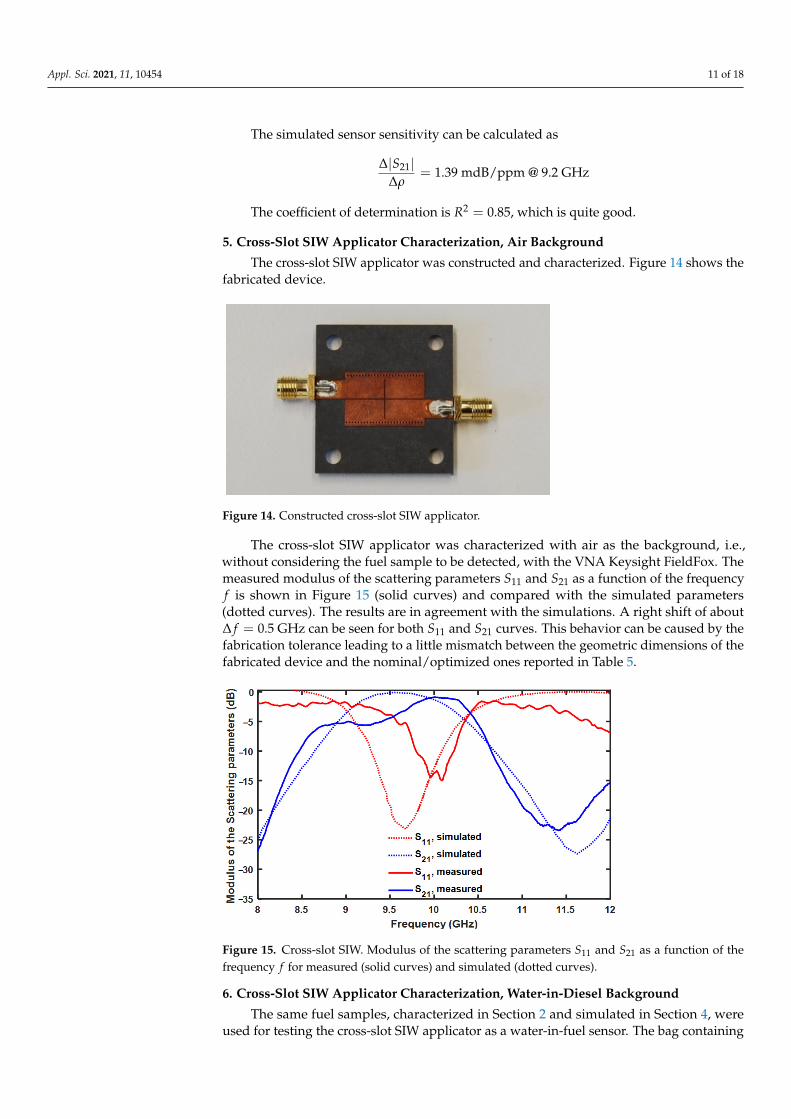
The cross-slot SIW applicator was constructed and characterized. Figure 14 shows thefabricated device.
Appl. Sci. 2021, 11, x FOR PEER REVIEW 12 of 19
5. Cross-Slot SIW Applicator Characterization, Air Background The cross-slot SIW applicator was constructed and characterized. Figure 14 shows
the fabricated device.
Figure 14. Constructed cross-slot SIW applicator.
The cross-slot SIW applicator was characterized with air as the background, i.e., with-out considering the fuel sample to be detected, with the VNA Keysight FieldFox. The measured modulus of the scattering parameters and as a function of the fre-quency is shown in Figure 15 (solid curves) and compared with the simulated param-eters (dotted curves). The results are in agreement with the simulations. A right shift of about Δ = 0.5GHz can be seen for both and curves. This behavior can be caused by the fabrication tolerance leading to a little mismatch between the geometric dimensions of the fabricated device and the nominal/optimized ones reported in Table 5.
Figure 15. Cross-slot SIW. Modulus of the scattering parameters and as a function of the frequency for measured (solid curves) and simulated (dotted curves).
6. Cross-Slot SIW Applicator Characterization, Water-in-Diesel Background The same fuel samples, characterized in Section 2 and simulated in Section 4, were
used for testing the cross-slot SIW applicator as a water-in-fuel sensor. The bag containing the fuel samples is constituted by polyethylene. Figure 16 shows measurements proving that it can be considered transparent, allowing complete radiating field transmission, and does not affect the water-in-diesel characterization.
The complete measurement set-up is shown in Figure 17a. It is composed by the VNA Keysight FieldFox, connected to the constructed cross-slot SIW applicator. Figure 17b
Figure 14. Constructed cross-slot SIW applicator.
The cross-slot SIW applicator was characterized with air as the background, i.e.,without considering the fuel sample to be detected, with the VNA Keysight FieldFox. Themeasured modulus of the scattering parameters S11 and S21 as a function of the frequencyf is shown in Figure 15 (solid curves) and compared with the simulated parameters(dotted curves). The results are in agreement with the simulations. A right shift of about∆ f = 0.5 GHz can be seen for both S11 and S21 curves. This behavior can be caused by thefabrication tolerance leading to a little mismatch between the geometric dimensions of thefabricated device and the nominal/optimized ones reported in Table 5.
Appl. Sci. 2021, 11, x FOR PEER REVIEW 12 of 19
5. Cross-Slot SIW Applicator Characterization, Air Background The cross-slot SIW applicator was constructed and characterized. Figure 14 shows
the fabricated device.
Figure 14. Constructed cross-slot SIW applicator.
The cross-slot SIW applicator was characterized with air as the background, i.e., with-out considering the fuel sample to be detected, with the VNA Keysight FieldFox. The measured modulus of the scattering parameters and as a function of the fre-quency is shown in Figure 15 (solid curves) and compared with the simulated param-eters (dotted curves). The results are in agreement with the simulations. A right shift of about Δ = 0.5GHz can be seen for both and curves. This behavior can be caused by the fabrication tolerance leading to a little mismatch between the geometric dimensions of the fabricated device and the nominal/optimized ones reported in Table 5.
Figure 15. Cross-slot SIW. Modulus of the scattering parameters and as a function of the frequency for measured (solid curves) and simulated (dotted curves).
6. Cross-Slot SIW Applicator Characterization, Water-in-Diesel Background The same fuel samples, characterized in Section 2 and simulated in Section 4, were
used for testing the cross-slot SIW applicator as a water-in-fuel sensor. The bag containing the fuel samples is constituted by polyethylene. Figure 16 shows measurements proving that it can be considered transparent, allowing complete radiating field transmission, and does not affect the water-in-diesel characterization.
The complete measurement set-up is shown in Figure 17a. It is composed by the VNA Keysight FieldFox, connected to the constructed cross-slot SIW applicator. Figure 17b
Figure 15. Cross-slot SIW. Modulus of the scattering parameters S11 and S21 as a function of thefrequency f for measured (solid curves) and simulated (dotted curves).
6. Cross-Slot SIW Applicator Characterization, Water-in-Diesel Background
The same fuel samples, characterized in Section 2 and simulated in Section 4, wereused for testing the cross-slot SIW applicator as a water-in-fuel sensor. The bag containing
Appl. Sci. 2021, 11, 10454 12 of 18
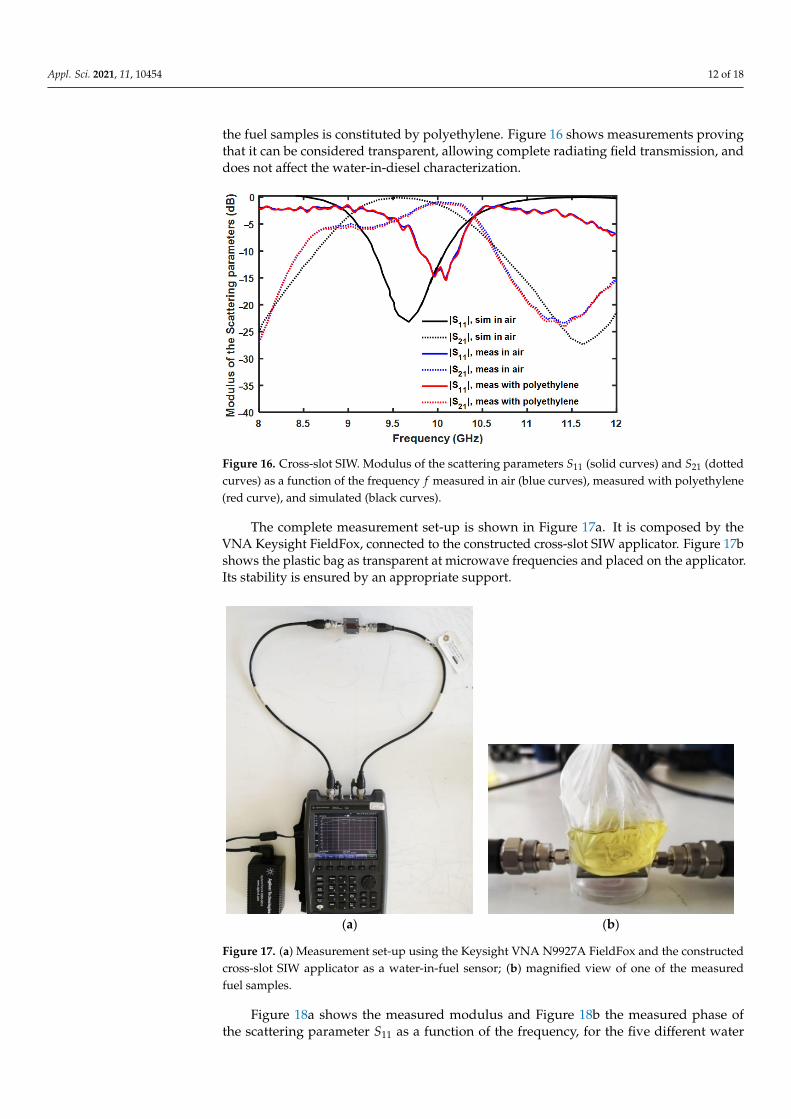
the fuel samples is constituted by polyethylene. Figure 16 shows measurements provingthat it can be considered transparent, allowing complete radiating field transmission, anddoes not affect the water-in-diesel characterization.
Appl. Sci. 2021, 11, x FOR PEER REVIEW 13 of 19
shows the plastic bag as transparent at microwave frequencies and placed on the applica-tor. Its stability is ensured by an appropriate support.
Figure 16. Cross-slot SIW. Modulus of the scattering parameters (solid curves) and (dotted curves) as a function of the frequency measured in air (blue curves), measured with polyethylene (red curve), and simulated (black curves).
(a) (b)
Figure 17. (a) Measurement set-up using the Keysight VNA N9927A FieldFox and the constructed cross-slot SIW applicator as a water-in-fuel sensor; (b) magnified view of one of the measured fuel samples.
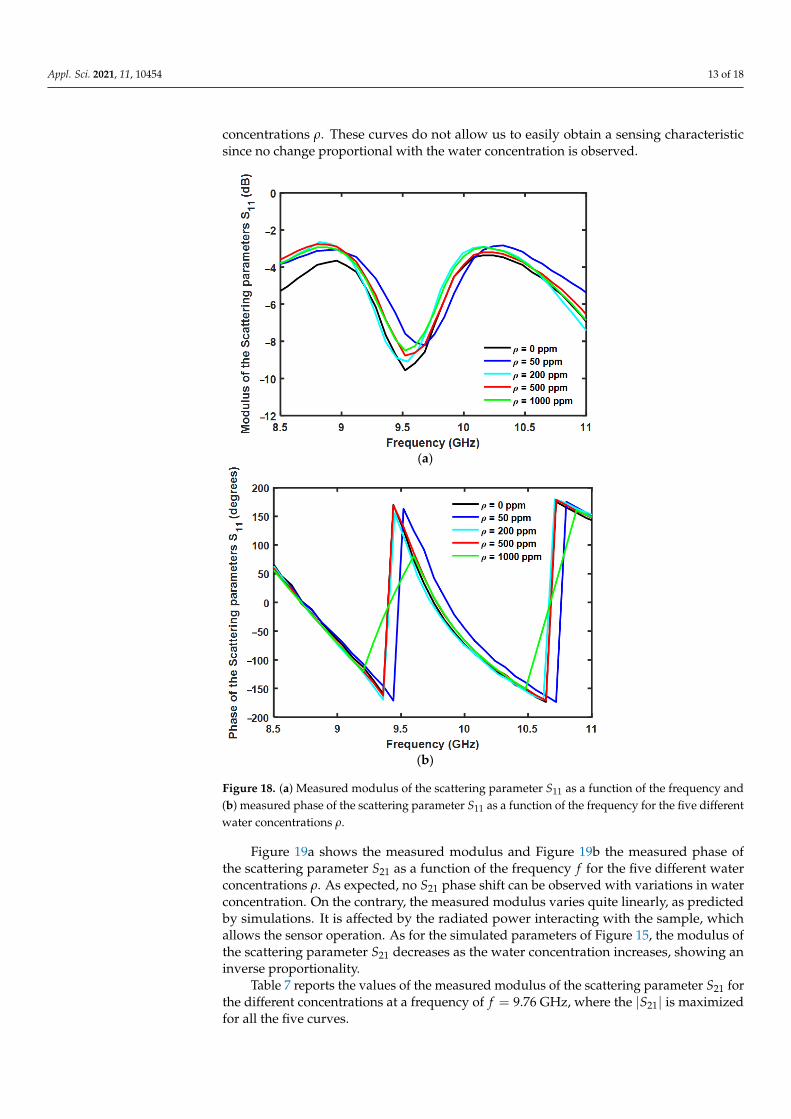
Figure 18a shows the measured modulus and Figure 18b the measured phase of the scattering parameter as a function of the frequency, for the five different water con-centrations . These curves do not allow us to easily obtain a sensing characteristic since no change proportional with the water concentration is observed.
Figure 16. Cross-slot SIW. Modulus of the scattering parameters S11 (solid curves) and S21 (dottedcurves) as a function of the frequency f measured in air (blue curves), measured with polyethylene(red curve), and simulated (black curves).
The complete measurement set-up is shown in Figure 17a. It is composed by theVNA Keysight FieldFox, connected to the constructed cross-slot SIW applicator. Figure 17bshows the plastic bag as transparent at microwave frequencies and placed on the applicator.Its stability is ensured by an appropriate support.
Appl. Sci. 2021, 11, x FOR PEER REVIEW 13 of 19
shows the plastic bag as transparent at microwave frequencies and placed on the applica-tor. Its stability is ensured by an appropriate support.
Figure 16. Cross-slot SIW. Modulus of the scattering parameters (solid curves) and (dotted curves) as a function of the frequency measured in air (blue curves), measured with polyethylene (red curve), and simulated (black curves).
(a) (b)
Figure 17. (a) Measurement set-up using the Keysight VNA N9927A FieldFox and the constructed cross-slot SIW applicator as a water-in-fuel sensor; (b) magnified view of one of the measured fuel samples.
Figure 18a shows the measured modulus and Figure 18b the measured phase of the scattering parameter as a function of the frequency, for the five different water con-centrations . These curves do not allow us to easily obtain a sensing characteristic since no change proportional with the water concentration is observed.
Figure 17. (a) Measurement set-up using the Keysight VNA N9927A FieldFox and the constructedcross-slot SIW applicator as a water-in-fuel sensor; (b) magnified view of one of the measuredfuel samples.
Figure 18a shows the measured modulus and Figure 18b the measured phase ofthe scattering parameter S11 as a function of the frequency, for the five different water
Appl. Sci. 2021, 11, 10454 13 of 18
concentrations ρ. These curves do not allow us to easily obtain a sensing characteristicsince no change proportional with the water concentration is observed.
Appl. Sci. 2021, 11, x FOR PEER REVIEW 14 of 19
(a)
(b)
Figure 18. (a) Measured modulus of the scattering parameter as a function of the frequency and (b) measured phase of the scattering parameter as a function of the frequency for the five dif-ferent water concentrations .
Figure 19a shows the measured modulus and Figure 19b the measured phase of the scattering parameter as a function of the frequency for the five different water con-centrations . As expected, no S phase shift can be observed with variations in water concentration. On the contrary, the measured modulus varies quite linearly, as predicted by simulations. It is affected by the radiated power interacting with the sample, which allows the sensor operation. As for the simulated parameters of Figure 15, the modulus of the scattering parameter S decreases as the water concentration increases, showing an inverse proportionality.
Figure 18. (a) Measured modulus of the scattering parameter S11 as a function of the frequency and(b) measured phase of the scattering parameter S11 as a function of the frequency for the five differentwater concentrations ρ.
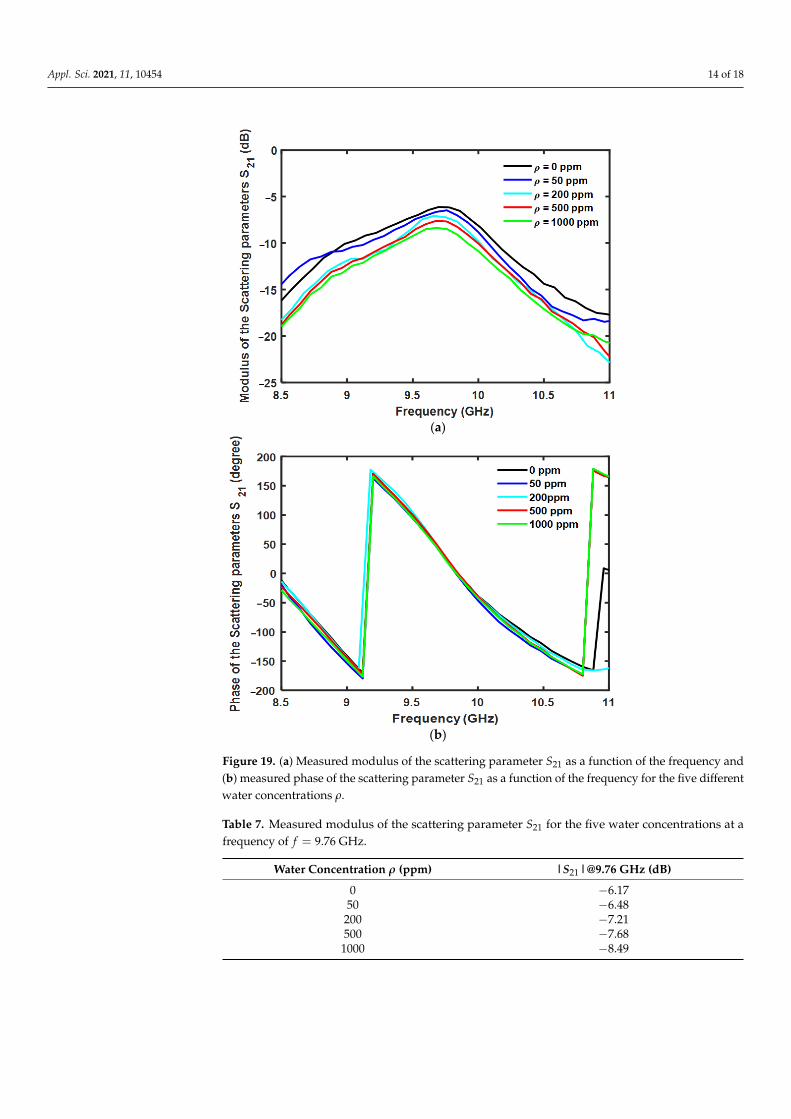
Figure 19a shows the measured modulus and Figure 19b the measured phase ofthe scattering parameter S21 as a function of the frequency f for the five different waterconcentrations ρ. As expected, no S21 phase shift can be observed with variations in waterconcentration. On the contrary, the measured modulus varies quite linearly, as predictedby simulations. It is affected by the radiated power interacting with the sample, whichallows the sensor operation. As for the simulated parameters of Figure 15, the modulus ofthe scattering parameter S21 decreases as the water concentration increases, showing aninverse proportionality.
Table 7 reports the values of the measured modulus of the scattering parameter S21 forthe different concentrations at a frequency of f = 9.76 GHz, where the |S21| is maximizedfor all the five curves.
Appl. Sci. 2021, 11, 10454 14 of 18Appl. Sci. 2021, 11, x FOR PEER REVIEW 15 of 19
(a)
(b)
Figure 19. (a) Measured modulus of the scattering parameter as a function of the frequency and (b) measured phase of the scattering parameter as a function of the frequency for the five dif-ferent water concentrations .
Table 7 reports the values of the measured modulus of the scattering parameter for the different concentrations at a frequency of = 9.76GHz, where the | | is maxim-ized for all the five curves.
Table 7. Measured modulus of the scattering parameter for the five water concentrations at a frequency of = 9.76GHz.
Water Concentration (ppm) | |@ . (dB) 0 −6.17 50 −6.48 200 −7.21 500 −7.68 1000 −8.49
Figure 19. (a) Measured modulus of the scattering parameter S21 as a function of the frequency and(b) measured phase of the scattering parameter S21 as a function of the frequency for the five differentwater concentrations ρ.
Table 7. Measured modulus of the scattering parameter S21 for the five water concentrations at afrequency of f = 9.76 GHz.
Water Concentration ρ (ppm) |S21|@9.76 GHz (dB)
0 −6.1750 −6.48200 −7.21500 −7.68
1000 −8.49
Appl. Sci. 2021, 11, 10454 15 of 18
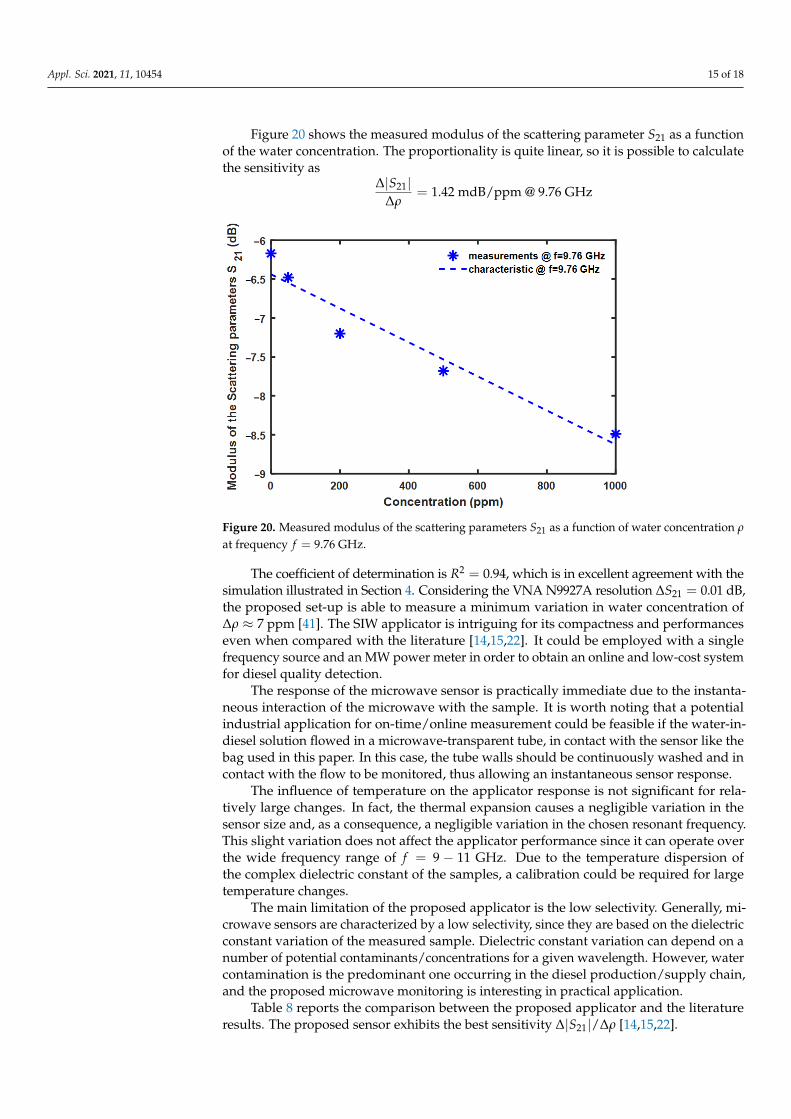
Figure 20 shows the measured modulus of the scattering parameter S21 as a functionof the water concentration. The proportionality is quite linear, so it is possible to calculatethe sensitivity as
∆|S21|∆ρ
= 1.42 mdB/ppm @ 9.76 GHz
Appl. Sci. 2021, 11, x FOR PEER REVIEW 16 of 19
Figure 20 shows the measured modulus of the scattering parameter as a function of the water concentration. The proportionality is quite linear, so it is possible to calculate the sensitivity as Δ| |Δ = 1.42mdB/[email protected]
The coefficient of determination is = 0.94, which is in excellent agreement with the simulation illustrated in Section 4. Considering the VNA N9927A resolution Δ =0.01dB, the proposed set-up is able to measure a minimum variation in water concentra-tion of Δ ≈ 7ppm [41]. The SIW applicator is intriguing for its compactness and perfor-mances even when compared with the literature [14,15,22]. It could be employed with a single frequency source and an MW power meter in order to obtain an online and low-cost system for diesel quality detection.
Figure 20. Measured modulus of the scattering parameters as a function of water concentration
at frequency = 9.76GHz. The response of the microwave sensor is practically immediate due to the instanta-
neous interaction of the microwave with the sample. It is worth noting that a potential industrial application for on-time/online measurement could be feasible if the water-in-diesel solution flowed in a microwave-transparent tube, in contact with the sensor like the bag used in this paper. In this case, the tube walls should be continuously washed and in contact with the flow to be monitored, thus allowing an instantaneous sensor response.
The influence of temperature on the applicator response is not significant for rela-tively large changes. In fact, the thermal expansion causes a negligible variation in the sensor size and, as a consequence, a negligible variation in the chosen resonant frequency. This slight variation does not affect the applicator performance since it can operate over the wide frequency range of = 9 − 11GHz. Due to the temperature dispersion of the complex dielectric constant of the samples, a calibration could be required for large tem-perature changes.
The main limitation of the proposed applicator is the low selectivity. Generally, mi-crowave sensors are characterized by a low selectivity, since they are based on the dielec-tric constant variation of the measured sample. Dielectric constant variation can depend on a number of potential contaminants/concentrations for a given wavelength. However, water contamination is the predominant one occurring in the diesel production/supply chain, and the proposed microwave monitoring is interesting in practical application.
Table 8 reports the comparison between the proposed applicator and the literature results. The proposed sensor exhibits the best sensitivity Δ| |/Δ [14,15,22].
Figure 20. Measured modulus of the scattering parameters S21 as a function of water concentration ρ
at frequency f = 9.76 GHz.
The coefficient of determination is R2 = 0.94, which is in excellent agreement with thesimulation illustrated in Section 4. Considering the VNA N9927A resolution ∆S21 = 0.01 dB,the proposed set-up is able to measure a minimum variation in water concentration of∆ρ ≈ 7 ppm [41]. The SIW applicator is intriguing for its compactness and performanceseven when compared with the literature [14,15,22]. It could be employed with a singlefrequency source and an MW power meter in order to obtain an online and low-cost systemfor diesel quality detection.
The response of the microwave sensor is practically immediate due to the instanta-neous interaction of the microwave with the sample. It is worth noting that a potentialindustrial application for on-time/online measurement could be feasible if the water-in-diesel solution flowed in a microwave-transparent tube, in contact with the sensor like thebag used in this paper. In this case, the tube walls should be continuously washed and incontact with the flow to be monitored, thus allowing an instantaneous sensor response.
The influence of temperature on the applicator response is not significant for rela-tively large changes. In fact, the thermal expansion causes a negligible variation in thesensor size and, as a consequence, a negligible variation in the chosen resonant frequency.This slight variation does not affect the applicator performance since it can operate overthe wide frequency range of f = 9 − 11 GHz. Due to the temperature dispersion ofthe complex dielectric constant of the samples, a calibration could be required for largetemperature changes.
The main limitation of the proposed applicator is the low selectivity. Generally, mi-crowave sensors are characterized by a low selectivity, since they are based on the dielectricconstant variation of the measured sample. Dielectric constant variation can depend on anumber of potential contaminants/concentrations for a given wavelength. However, watercontamination is the predominant one occurring in the diesel production/supply chain,and the proposed microwave monitoring is interesting in practical application.
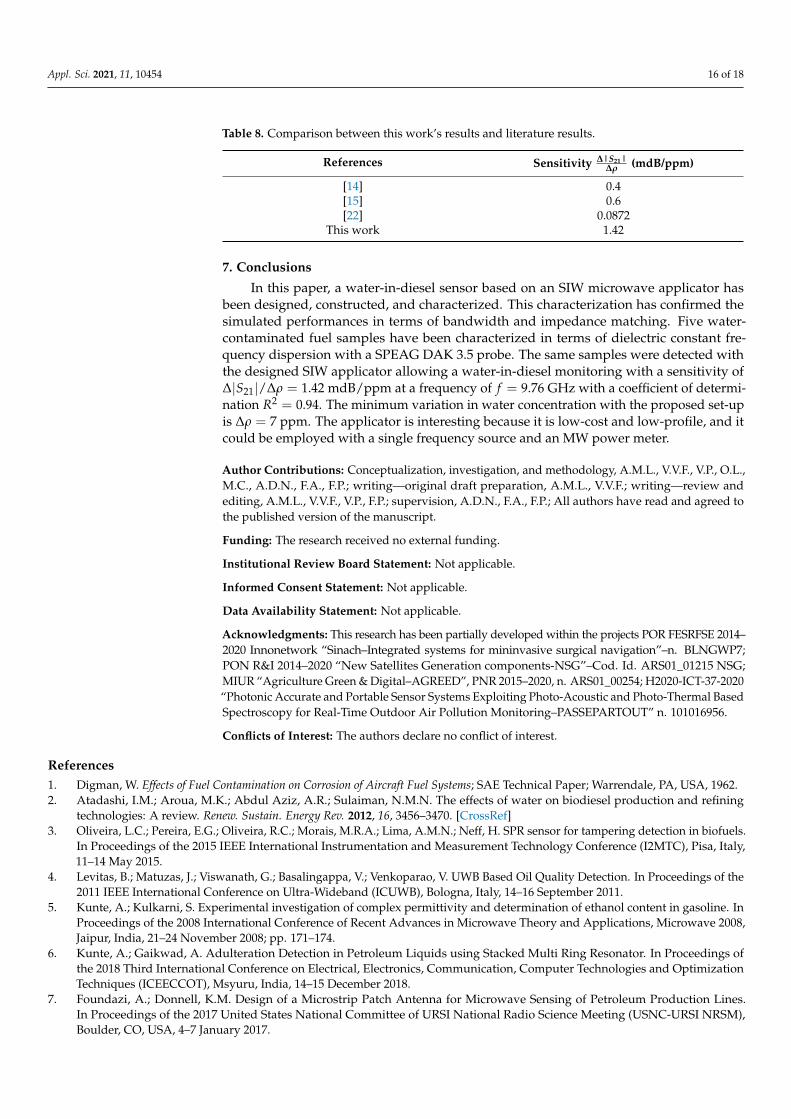
Table 8 reports the comparison between the proposed applicator and the literatureresults. The proposed sensor exhibits the best sensitivity ∆|S21|/∆ρ [14,15,22].
Appl. Sci. 2021, 11, 10454 16 of 18
Table 8. Comparison between this work’s results and literature results.
References Sensitivity ∆|S21|∆ρ (mdB/ppm)
[14] 0.4[15] 0.6[22] 0.0872
This work 1.42
7. Conclusions
In this paper, a water-in-diesel sensor based on an SIW microwave applicator hasbeen designed, constructed, and characterized. This characterization has confirmed thesimulated performances in terms of bandwidth and impedance matching. Five water-contaminated fuel samples have been characterized in terms of dielectric constant fre-quency dispersion with a SPEAG DAK 3.5 probe. The same samples were detected withthe designed SIW applicator allowing a water-in-diesel monitoring with a sensitivity of∆|S21|/∆ρ = 1.42 mdB/ppm at a frequency of f = 9.76 GHz with a coefficient of determi-nation R2 = 0.94. The minimum variation in water concentration with the proposed set-upis ∆ρ = 7 ppm. The applicator is interesting because it is low-cost and low-profile, and itcould be employed with a single frequency source and an MW power meter.
Author Contributions: Conceptualization, investigation, and methodology, A.M.L., V.V.F., V.P., O.L.,M.C., A.D.N., F.A., F.P.; writing—original draft preparation, A.M.L., V.V.F.; writing—review andediting, A.M.L., V.V.F., V.P., F.P.; supervision, A.D.N., F.A., F.P.; All authors have read and agreed tothe published version of the manuscript.
Funding: The research received no external funding.
Institutional Review Board Statement: Not applicable.
Informed Consent Statement: Not applicable.
Data Availability Statement: Not applicable.
Acknowledgments: This research has been partially developed within the projects POR FESRFSE 2014–2020 Innonetwork “Sinach–Integrated systems for mininvasive surgical navigation”–n. BLNGWP7;PON R&I 2014–2020 “New Satellites Generation components-NSG”–Cod. Id. ARS01_01215 NSG;MIUR “Agriculture Green & Digital–AGREED”, PNR 2015–2020, n. ARS01_00254; H2020-ICT-37-2020“Photonic Accurate and Portable Sensor Systems Exploiting Photo-Acoustic and Photo-Thermal BasedSpectroscopy for Real-Time Outdoor Air Pollution Monitoring–PASSEPARTOUT” n. 101016956.
Conflicts of Interest: The authors declare no conflict of interest.
References1. Digman, W. Effects of Fuel Contamination on Corrosion of Aircraft Fuel Systems; SAE Technical Paper; Warrendale, PA, USA, 1962.2. Atadashi, I.M.; Aroua, M.K.; Abdul Aziz, A.R.; Sulaiman, N.M.N. The effects of water on biodiesel production and refining
technologies: A review. Renew. Sustain. Energy Rev. 2012, 16, 3456–3470. [CrossRef]3. Oliveira, L.C.; Pereira, E.G.; Oliveira, R.C.; Morais, M.R.A.; Lima, A.M.N.; Neff, H. SPR sensor for tampering detection in biofuels.
In Proceedings of the 2015 IEEE International Instrumentation and Measurement Technology Conference (I2MTC), Pisa, Italy,11–14 May 2015.
4. Levitas, B.; Matuzas, J.; Viswanath, G.; Basalingappa, V.; Venkoparao, V. UWB Based Oil Quality Detection. In Proceedings of the2011 IEEE International Conference on Ultra-Wideband (ICUWB), Bologna, Italy, 14–16 September 2011.
5. Kunte, A.; Kulkarni, S. Experimental investigation of complex permittivity and determination of ethanol content in gasoline. InProceedings of the 2008 International Conference of Recent Advances in Microwave Theory and Applications, Microwave 2008,Jaipur, India, 21–24 November 2008; pp. 171–174.
6. Kunte, A.; Gaikwad, A. Adulteration Detection in Petroleum Liquids using Stacked Multi Ring Resonator. In Proceedings ofthe 2018 Third International Conference on Electrical, Electronics, Communication, Computer Technologies and OptimizationTechniques (ICEECCOT), Msyuru, India, 14–15 December 2018.
7. Foundazi, A.; Donnell, K.M. Design of a Microstrip Patch Antenna for Microwave Sensing of Petroleum Production Lines.In Proceedings of the 2017 United States National Committee of URSI National Radio Science Meeting (USNC-URSI NRSM),Boulder, CO, USA, 4–7 January 2017.

Appl. Sci. 2021, 11, 10454 17 of 18
8. Lee, C.H.; Jeong, Y.; Ashraf, H. Rectangular Cavity Sensor for Distinguishing between Normal and High-Drivability-IndexGasolines. IEEE Access 2020, 8, 182193–182203. [CrossRef]
9. Kulkarni, S.; Joshi, M.S. Design and Analysis of Shielded Vertically Stacked Ring Resonator as Complex Permittivity Sensor forPetroleum Oils, IEEE Trans. Microw. Theory Tech. 2015, 63, 2411–2417. [CrossRef]
10. Kunte, A.A.; Gaikwad, A.N. Dielectric constant measurement of low loss liquids using stacked multi ring resonator. Sadhana2018, 43, 1–12. [CrossRef]
11. Eyebe, G.A.; Sama, N.; Boubekeur, N.; Domigue, F. Microwave Sensing Schemes of CPW Resonators Fully Printed on HumiditySensitive Substrates. IEEE Microw. Wirel. Compon. Lett. 2020, 29, 303–305. [CrossRef]
12. EN 590:2004. Automotive Fuels. Diesel. Requirements and Test Methods, Standard; European Committee for Standardization:Bruxelles, Belgium, 2004.
13. ASTM D1655. Standard Specification for Aviation. Turbine Fuels, Annual Book of ASTM Standards (Section 05); Technical Report;American Society of Testing and Materials (ASTM): West Conshohocken, PA, USA, 2009.
14. Andria, G.; Attivissimo, F.; Di Nisio, A.; D’Aucelli, G.M.; Camporeale, S.M.; Pappalardi, P. Design of a Microwave Sensor for FuelQuality Monitoring. In Proceedings of the 2018 5th IEEE International Workshop on Metrology for AeroSpace (MetroAeroSpace),Rome, Italy, 20–22 June 2018.
15. Andria, G.; Attivissimo, F.; Di Nisio, A.; Trotta, A.; Camporeale, S.M.; Pappalardi, P. Design of a microwave sensor formeasurement of water in fuel contamination. Measurement 2019, 136, 74–81. [CrossRef]
16. Farries, M.; Hayes, N.; Kelley, J.; Tippet, G.; Webb, G.; Tighe, B.; Zhou, K. Optical methods for detecting contamination in jetfuel. In Proceedings of the 2009 IEEE Avionics, Fiber-Optics and Photonics Technology Conference, San Antonio, TX, USA,22–24 September 2009.
17. Zhang, W.; Webb, D.J.; Carpenter, M.; Williams, C. Measuring water activity of aviation fuel using a polymer optical fiber Bragggrating. In Proceedings of the SPIE 9157, 23rd International Conference on Optical Fibre Sensors, Santander, Spain, 2 June 2014.
18. Zhang, W.; Grice, S.; Sugden, K.; Bennion, I. Free water in fuel sensor using fiber long period grating. In Proceedings of the SPIE7753, 21st International Conference on Optical Fiber Sensors, Ottawa, ON, Canada, 17 May 2011.
19. Zhang, W.; Webb, D.J.; Lao, L.; Hammond, D.; Carpenter, M.; Williams, C. Water content detection in aviation fuel by usingPMMA based optical fiber grating. Sens. Actuators B Chem. 2019, 282, 774–779. [CrossRef]
20. Räikkönen, H.; Oksanen, M. Microwave acoustic sensing of water in hydrocarbon/water solutions. Sens. Actuator A Phys. 1994,45, 99–101. [CrossRef]
21. Skwarek, V.; Eggers, T. A Low-cost Capacitive Fuel-level and Quality Sensor for Automotive Applications. In Proceedings of theAMA Conferences 2013—SENSOR 2013, Nürnberg, Germany, 14–16 May 2013; pp. 680–685.
22. Xue, Q.; Tang, X.; Li, Y.; Liu, H.; Duan, X. Contactless and Simultaneous Measurement of Water and Acid contaminations in OilUsing a Flexible Microstrip Sensor. ACS Sens. 2020, 5, 171–179. [CrossRef]
23. Liu, H.; Tang, X.; Lu, H.; Xie, W.; Hu, Y.; Xue, Q. An interdigitated impedance microsensor for detection of moisture content inengine oil. Nanotechnol. Precis. Eng. 2020, 3, 75–80. [CrossRef]
24. Khalid, K.; Grozescu, I.V.; Tiong, L.K.; Sim, L.T.; Mohd, R. Water detection in fuel tanks using the microwave reflection technique.Meas. Sci. Technol. 2003, 14, 1905–1911. [CrossRef]
25. Cassivi, Y.; Perregrini, L.; Arcioni, P.; Bressan, M.; Wu, K.; Conciauro, G. Dispersion characteristics of substrate integratedrectangular waveguide. IEEE Microw. Wirel. Compon. Lett. 2002, 12, 333–335. [CrossRef]
26. Xu, F.; Wu, K. Guided–wave and leakage characteristics of substrate integrated waveguide. IEEE Trans. Microw. Theory Tech. 2005,53, 66–73.
27. Venanzoni, G.; Mencarelli, D.; Morini, A.; Farina, M.; Prudenzano, F. Review of Substrate Integrated Waveguide Circuits forBeam-Forming Networks Working in X-Band. Appl. Sci. 2019, 9, 1003. [CrossRef]
28. Bozzi, M.; Georgiadis, A.; Wu, K. Review of substrate-integrated waveguide circuits and antennas. IET Microw. Antenna Propag.2011, 5, 909–920. [CrossRef]
29. Wu, K.; Deslandes, D.; Cassivi, Y. The Substrate Integrated Circuits—A New Concept for High-Frequency Electronics andOptoelectronics. In Proceedings of the TELSKIS 2003, Nis, Serbia and Montenegro, 1–3 October 2003.
30. Bigelli, F.; Mencarelli, D.; Farina, M.; Venanzoni, G.; Scalmati, P.; Renghini, C.; Morini, A. Design and Fabrication of a DielectriclessSubstrate-Integrated Waveguide. IEEE Trans. Compon. Packag. Manuf. Technol. 2016, 6, 256–261. [CrossRef]
31. Portosi, V.; Loconsole, A.M.; Prudenzano, F. A Split Ring Resonator-Based Metamaterial for Microwave Impedance Matchingwith Biological Tissue. Appl. Sci. 2020, 10, 6740. [CrossRef]
32. Mencarelli, D.; Morini, A.; Prudenzano, F.; Venanzoni, G.; Bigelli, B.; Losito, O.; Farina, M. Broadband Single-Layer Slotted ArrayAntenna in SIW Technology. IEEE Antennas Wirel. Propag. Lett. 2016, 15, 263–265. [CrossRef]
33. Liu, C.; Tong, F. An SIW Resonator Sensor for Liquid Permittivity Measurements at C Band. IEEE Microw. Wirel. Compon. Lett.2015, 25, 751–753.
34. Losito, O.; Portosi, V.; Venanzoni, G.; Bigelli, F.; Mencarelli, D.; Scalmati, P.; Renghini, C.; Carta, P.; Prudenzano, F. FeasibilityInvestigation of SIW Cavity-Backed Patch Antenna Array for Ku Band Applications. Appl. Sci. 2019, 9, 1271. [CrossRef]
35. Qi, C.; Jackson, D.R.; Yao, Y.; Chen, J. SIW Microstrip Cavity Resonators with a Sensing Aperture. In Proceedings of the 2019 IEEETexas Symposium on Wireless and Microwave Circuits and Systems (WMCS), Waco, TX, USA, 28–29 March 2019.

Appl. Sci. 2021, 11, 10454 18 of 18
36. Venanzoni, G.; Mencarelli, D.; Morini, A.; Farina, M.; Angeloni, G.; Renghini, C.; Carta, P.; Potenza, P.; Losito, O.; Mescia, L.; et al.Single Layer Standalone Wideband Substrate Integrated Waveguide Directional Coupler. Microw. Opt. Technol. Lett. 2014, 56,1141–1144. [CrossRef]
37. Castellano, T.; Losito, O.; Mescia, L.; Chiapperino, M.A.; Venanzoni, G.; Mencarelli, D.; Angeloni, G.; Renghini, C.; Carta,P.; Prudenzano, F. Feasibility Investigation of Low Cost Substrate Integrated Waveguide (SIW) Directional Couplers. Prog.Electromagn. Res. B 2014, 59, 31–44. [CrossRef]
38. Chiapperino, M.A.; Losito, O.; Castellano, T.; Venanzoni, G.; Mescia, L.; Angeloni, G.; Renghini, C.; Carta, P.; Potenza, P.;Prudenzano, F. Dual-Band Substrate Integrated Waveguide Resonator Based on Sierpinski Carpet. Prog. Electromagn. Res. C 2015,57, 1–12. [CrossRef]
39. Venanzoni, G.; Mencarelli, D.; Morini, A.; Farina, M.; Losito, O.; Prudenzano, F. Compact Double-Layer Substrate IntegratedWaveguide Magic Tee for X-Band Applications. Microw. Opt. Technol. Lett. 2016, 58, 932–936. [CrossRef]
40. SPEAG. DAK Professional Handbook V 1.10. August 2013.41. Keysight. FieldFox Handheld Analyzers 4/6.5/9/14/18/26.5/32/44/50 GHz Datasheet. Available online: https://www.
keysight.com/it/en/assets/7018-03314/data-sheets/5990-9783.pdf (accessed on 10 July 2021).42. Pozar, D.M. Microwave Engineering, 3rd ed.; Wiley: Hoboken, NJ, USA, 2004.43. Nella, A.; Gandhi, A. Lumped Equivalent Models of Narrowband Antennas and Isolation Enhancement in a Three Antennas
System. Radioengineering 2018, 27, 646–653.44. Dashti, H.; Neshati, M.H. Input Impedance of Rectangular Substrate Integrated Waveguide (SIW) Cavity Backed Slot Antennas.
In Proceedings of the 27th Iranian Conference on Electrical Engineering (ICEE), Tehran, Iran, 2–4 May 2017.45. Balanis, C.A. Antenna Theory Analysis and Design, 4th ed.; Wiley: Hoboken, NJ, USA, 2016.