subsistence salmon harvests in the kuskokwim area during
TRANSCRIPT
SUBSISTENCE SALMON HARVESTS IN THE KUSKOKWIM AREA DURING 1989
Robert J. Walker Michael W. Coffing
Technical Paper No. 189
Alaska Dcpartmcnt of Fish and Game Division of Subsistence
Juneau. Alaska
Fcbruay 1993
This research was parttally supported by ANILCA Federal Funds administered through the U.S. Fish and Wildlife Service. Anchorage. Alaska, SG-l-9.
ADA PUBLICATIONS STATEMENT The Alaska Department of Fish and Game operates all of its public programs and activitres -free -from discrtmination on the basis of race, sex, color, race, religion. national origrn. age. marital status. pregnancy. parenthood, or disability. For lnformatton on alternative fbrmats avarlableufor this and other department publications, piease contact the department ADA Coordinator at (voice) 9074654120. (TDD) l-800- 478-3648 or (fax) 907-586-6595. An>? person who believes he.+he has been drscrrmrnated agornst should write to.
Alaska Department of Fish and Game P.0. BOX 25526 .Juncazr. Alaska 99802-5526
or
IJ.S Department of the Inter/or Washrngton. D. C 20240

ABSTRACT
Salmon are an important element of the subsistence-cash economy of western and interior
Alaska. A significant portion of the salmon harvested in the Kuskokwirn Fisheries Management
Area are used for subsistence. Subsistence fishermen have not been required to report the amount
of salmon harvested for subsistence, however, the Alaska Department of Fish and Game has
collected subsistence salmon harvest information from Kuskokwim Area fishermen since 1960.
Sampling effort and the methodology used to estimate the total subsistence salmon harvest has
varied over time. In 1989 a new sampling and estimation methodology was developed to improve
the estimates of the total number of Kuskokwim Area salmon harvested for subsistence use. The
new methodology included updating community households lists and then categorizing each
household into one of two strata, “usually fish” or “usually do not fish.”
Data were collected from 36 communities throughout the Kuskokwim Fisheries
Management Area. Of the 2,478 households for which some information was collected, 1,527
were determined to have subsistence fished for salmon during 1989. Estimates of the total number
of subsistence salmon harvested from the Kuskokwim Fisheries Management Area for 1989 were
77,030 chinook, 132,858 chum, 34,255 sockeye, and 49,691 coho salmon. Levels of confidence
for the estimated total subsistence salmon harvest was within 6.5 percent of the estimated total.
Comparisons of the 1989 harvest estimates developed using the newly revised methodology with
the 1989 harvest estimates developed using pre-1989 estimation methods indicate that the older
method significantly overestimated salmon harvests. The ability to develop reliable estimates of
subsistence caught salmon are largely dependent on maintaining up to date community lists of
households that “usual&. fish” and “usually do not fish,” and by having staff conduct house-to-
house harvest sumc!s \~ell after pcoplc have completed subsistence salmon fishing for the season.
TABLE OF CONTENTS
ABSTRACT
LIST OF FIGURES .,,...............................................................,..,..............,,.,.............,.......... iii
LIST OF TABLES . . . . . . . . . . . . . . . . . . . . . . . . . . . . . . . . . . . . . . . . . . . . . . . . . . . . . . . . . . . . . . . . . . . . . . . . . . . . . . . . . . . . . . . . . . . . . . . . . . . . . . . . . . . . . . . . . . v
ACKNOWLEDGMENTS . . . . . . . . . . . . . . . . . . . . . . . . . . . . . . . . . . . . .I.. . . . . . . . . . . . . . . . . . . . . . . . . . . . . . . . . . . . . . vi
INTRODUCTION .................................................................................................................. 1 Objectives ................................................................................................................. 6
METHODS ........................................................................................................................... 6 Recording Subsistence Salmon Harvests, 1989 ............................................................... 6 Estimating Subsistence Salmon Harvests. ....................................................................... 12
RESULTS ........................................................................................................................... 15 Sampling Summary ....................................................................................................... 15 1989 Community and Drainage Harvest Totals .............................................................. 19 Gear Types ................................................................................................................. 20 Household Size and Number of Dogs ............................................................................. 3 1 Harvest of Salmon For Dog Food ................................................................................... 3 1
DISCUSSION.. ....................................................................................................................... 34 Comparison of 1989 and Previous Harvest Estimation Methods ..................................... 34 1989 Frequency of Harvests for Fishing Households ...................................................... 35 Subsistence Harvest Levels, 1980-89 ............................................................................. 49
CONCLUSION . . . . . . . . . ..__..............o._..........._._.____..................................................................... 58
REFERENCES . . . . . . . . . .._....t...................................................................................................... 60
APPENDIX 1 1989 KUSKOKWIM AREA SUBSISTENCE SALMON PRESEASON HARVEST SURVEY. . . . . . . . . . . . . . . . . . . . . . . . . . . . . . . . . .._.___.___._...... 61
APPENDIX 2. 1989 KUSKOKWIM AREA SUBSISTENCE SALMON CATCH CALENDAR. ..__..... _.____.._......_._._,................._.___._.._....., 62
APPENDIX 3. 1989 KUSKOKWIM AREA SUBSISTENCE SALMON HOUSEHOLD SURVEY .___..._._,.._........_.....,,.,,....,...................__.______ 68
APPENDIX J 1989 KUSKOKWIM AREA SUBSISTENCE SALMON POST-SEASON HARVEST SURVEY. .._.,,,,,.,......_.____.__..________...,,.,,,.,. 70
. . . 111
Figure 1.
Figure 2.
Figure 3.
Figure 4.
Figure 5.
Figure 6.
Figure 7.
Figure 8.
Figure 9.
Figure 10.
Figure 1 1.
Figure 12.
Figure 13.
Figure 14.
Figure 15.
Figure 16
LIST OF FIGURES
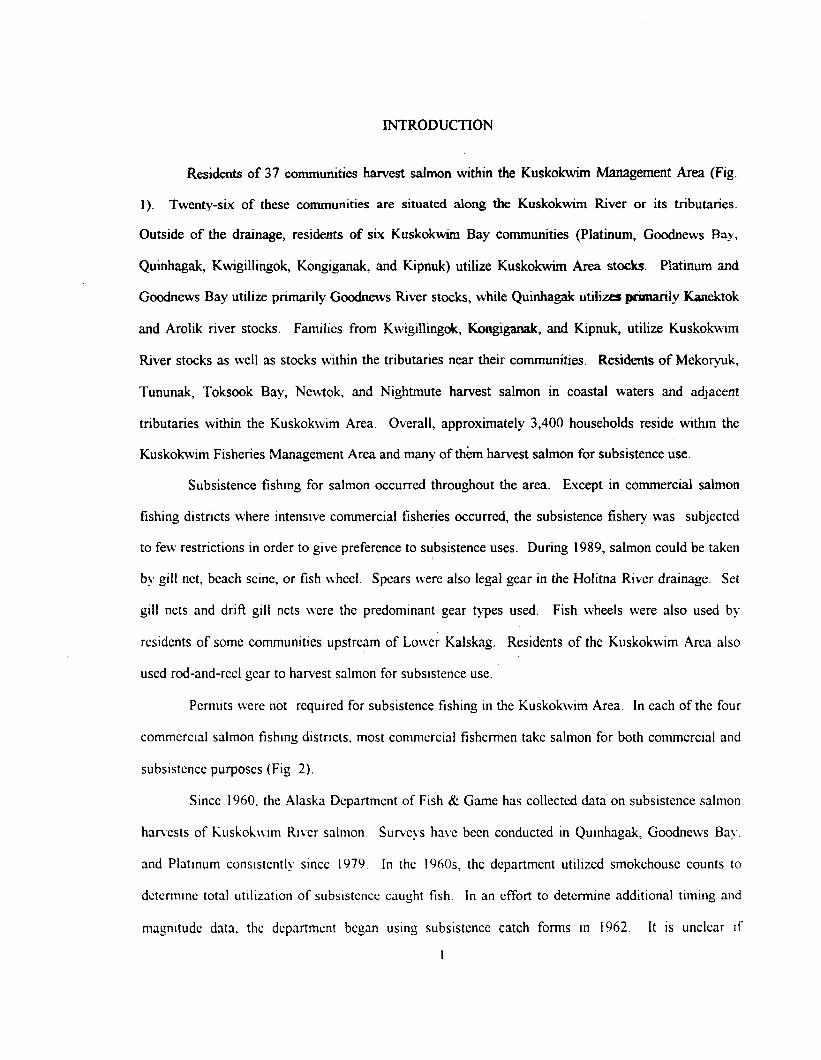
Kuskokwim Area communities ,.. . . . . . . . . . . . . . . . . . . . . . . . . . . . . . . . . . . . . . . . . . . . . . . . . . . . . . . . . . . . . . . . . . 2
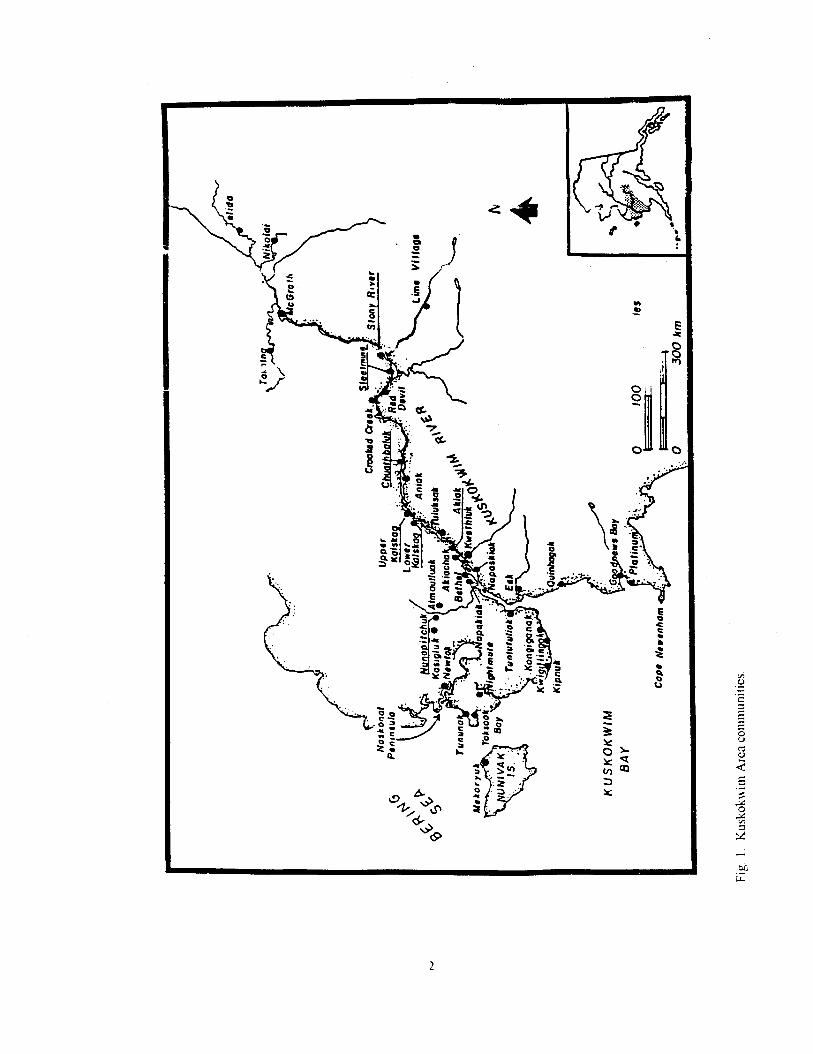
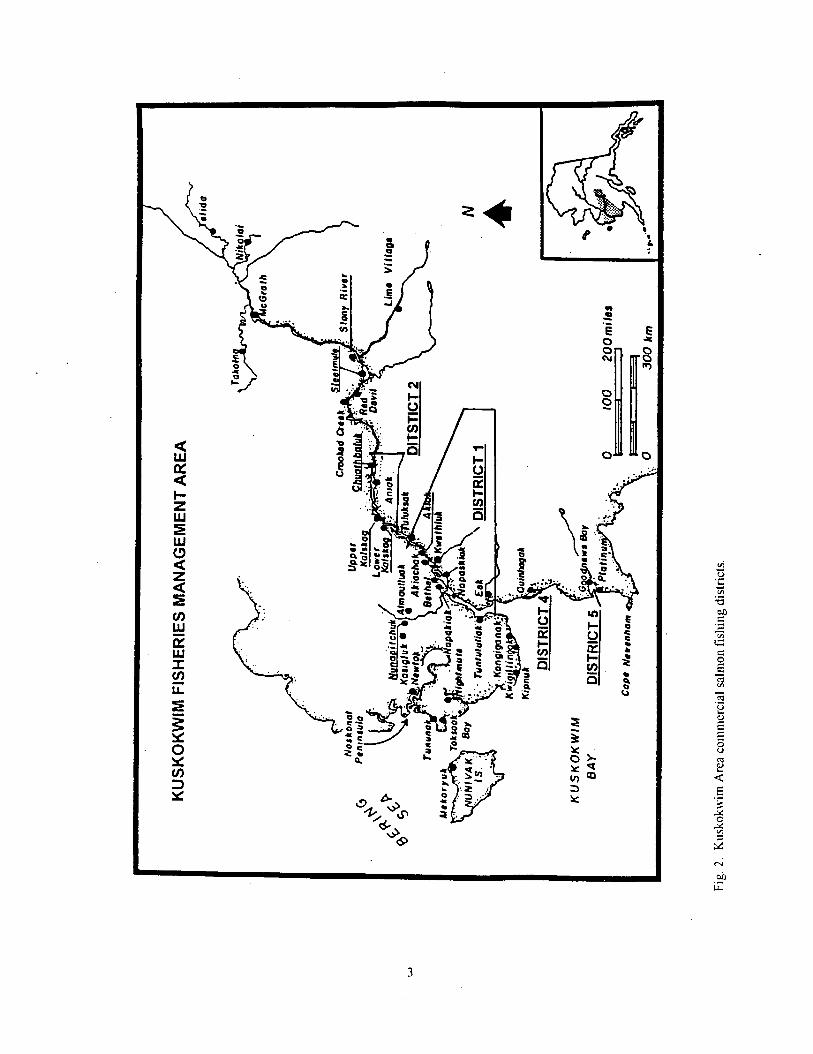
Kuskokwim Area commercial salmon fishing districts . . . . . . . . . . . . . . . . . . . . . . . . . . . . . . . . 3
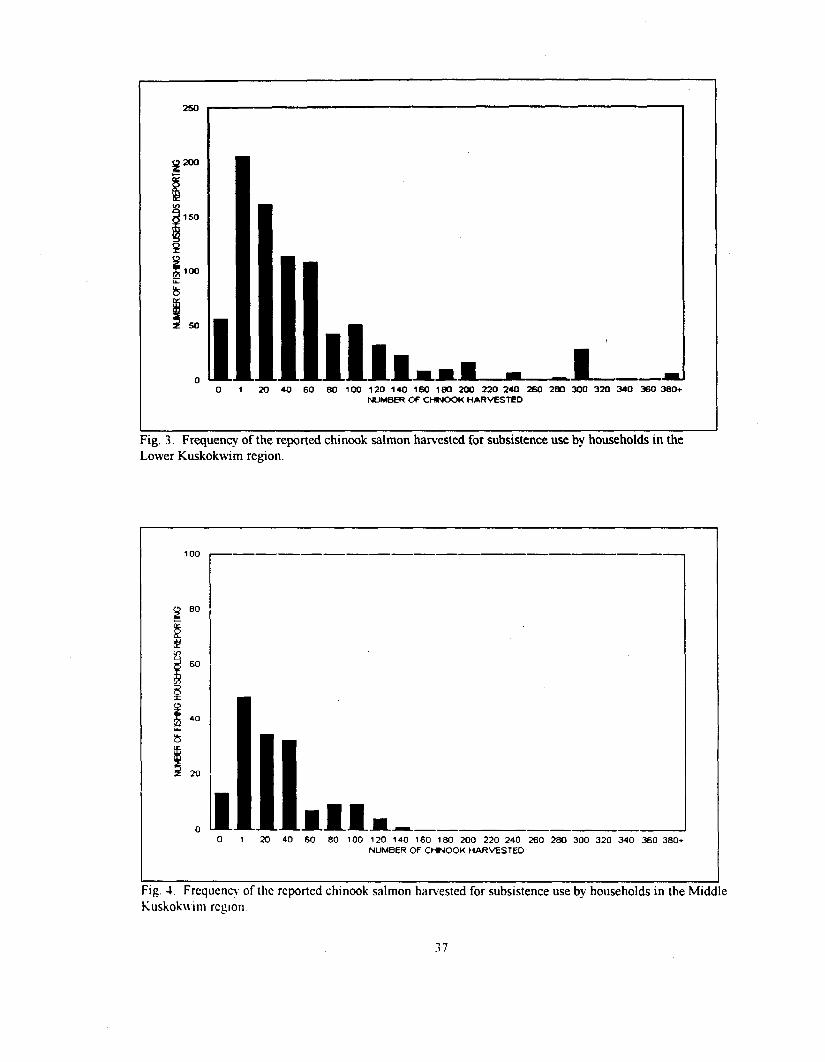
Frequency of the reported Chinook salmon harvested for subsistence use by households in the Lower Kuskokwim region . . . . . . . . . . . . . , . . . . . . . . . . . . . . . . . . . . . . . . 37
Frequency of the reported Chinook salmon harvested for subsistence use by households in the Middle Kuskokwim region.. . . . . . . . . . . . . . . . . . . . . . . . . . . . . . . . . . . . 37
Frequency of the reported Chinook salmon harvested for subsistence use by households in the Upper Kuskokwim region. . . . . . . . . . . . . . . . . . . . . . . . . . . . . . . . . . . . . . . . 38
Frequency of the reported Chinook salmon harvested for subsistence use by households in the Kuskokwim Bay region. . . . . . . . . . . . . . . . . . . . . . . . . . . . . . . . . . . . 38
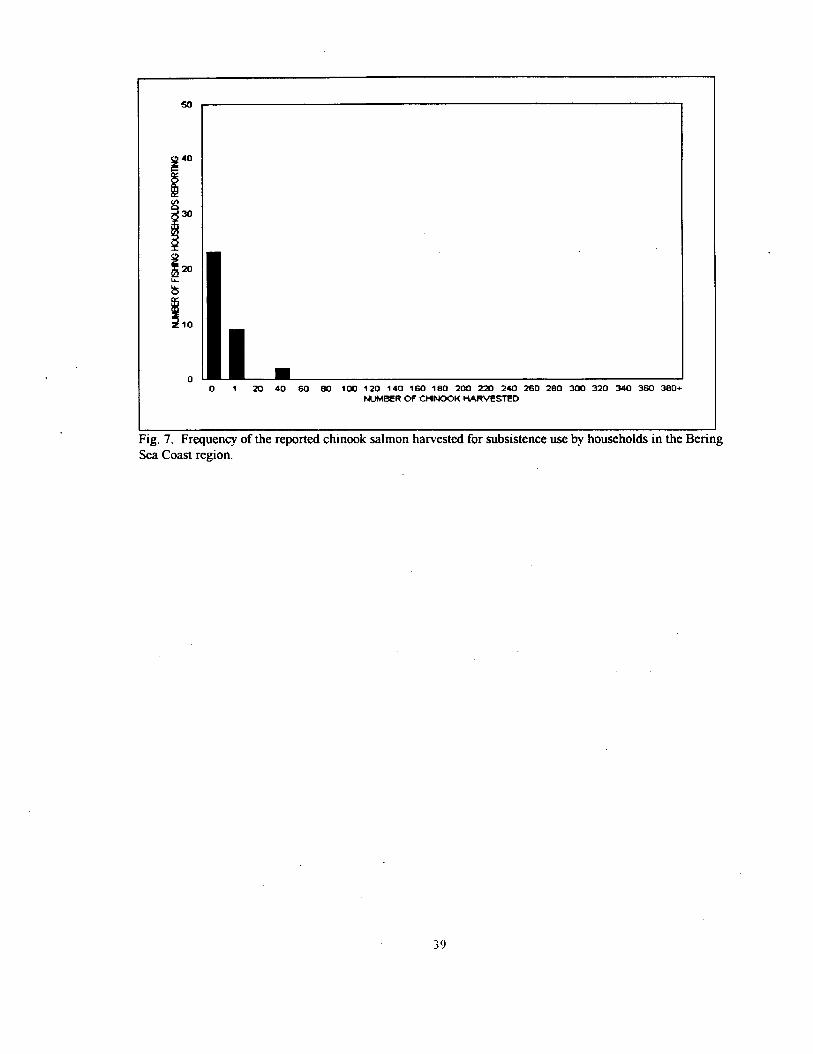
Frequency of the reported Chum salmon harvested for subsistence use by households in the Bering Sea Coast region. ,........................................ 39
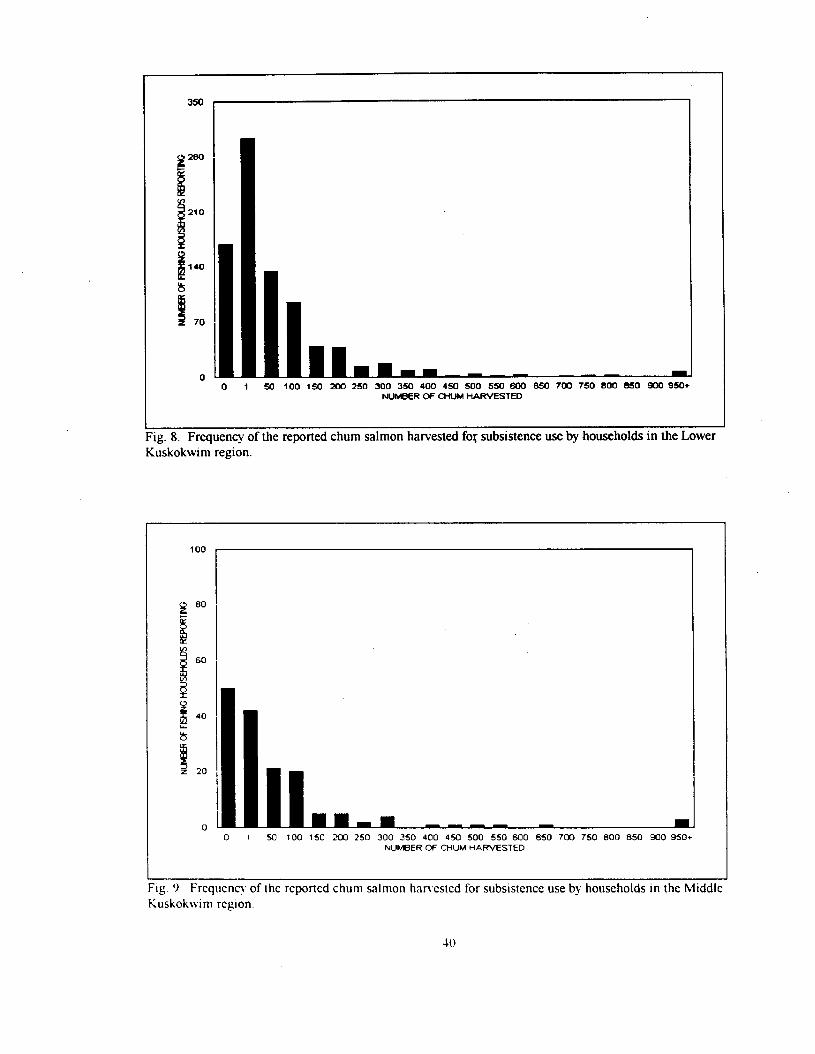
Frequency of the reported Chum salmon harvested for subsistence use by households in the Lower Kuskokwim region . . . . . . . . . . . . . . . . . . . . . . . . . . . . . . . . . . . . . . . . 40
Frequency of the reported Chum salmon harvested for subsistence use by households in the Middle Kuskokwim region. . . . . . . . . . . . . . . . . . . . . . . . . . . . . . . . . . . . . . 40
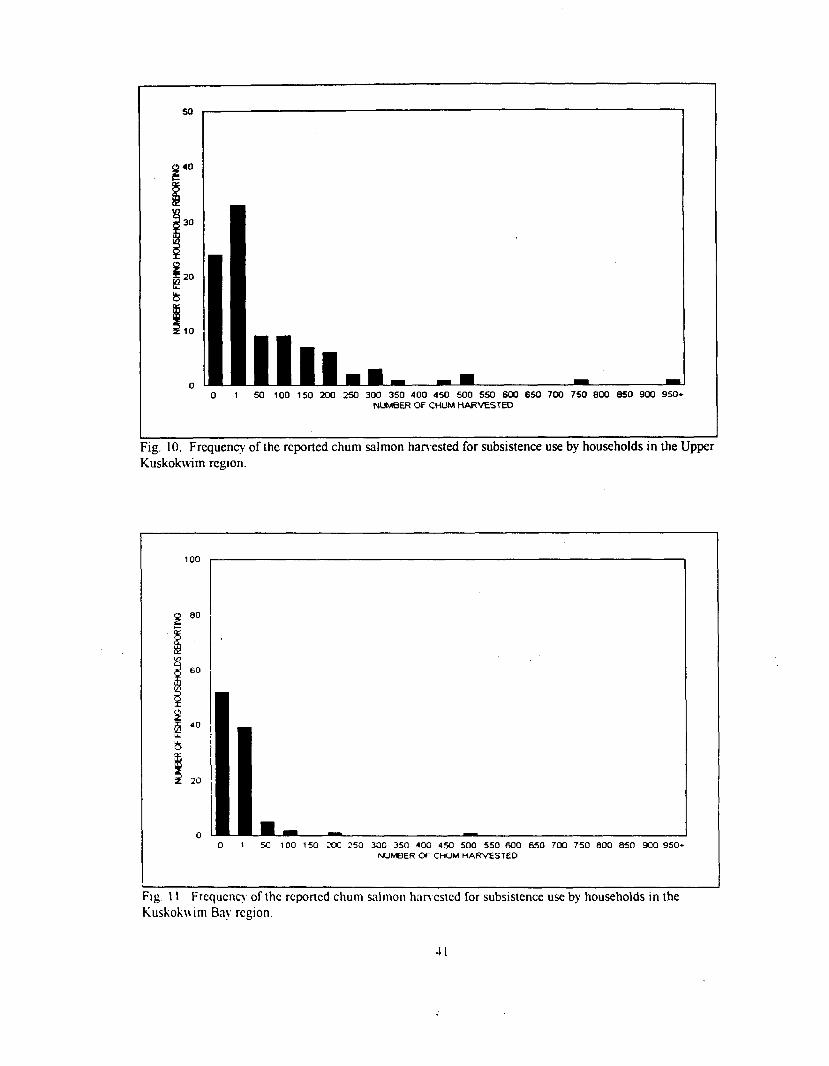
Frequency of the reported Chum salmon.harvested for subsistence use by households in the Upper Kuskokwim region. _...................................... 41
Frequency of the reported Chum salmon harvested for subsistence use by households in the Kuskokwim Bay region., ,,......_.......__._...,__..........___._. 41
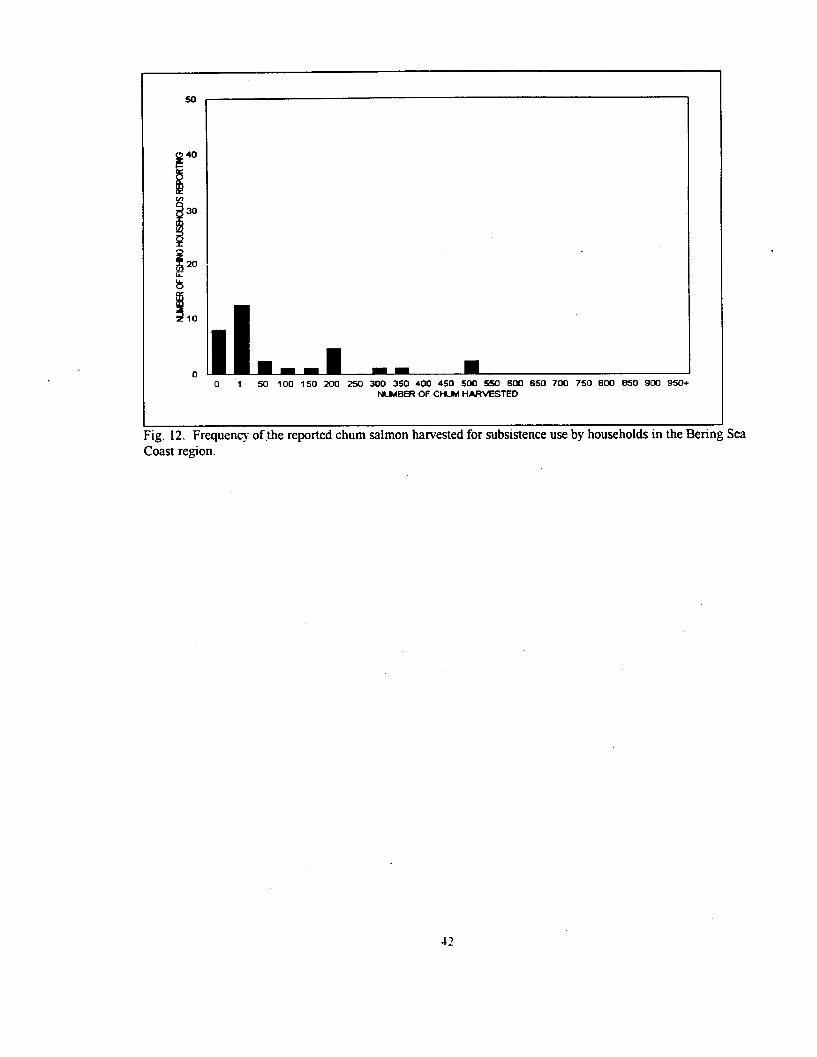
Frequency of the reported Chum salmon harvested for subsistence use by households in the Bering Sea Coast region. _..... ., . . . . . . . . . . . . . . .._.. . . . . 42
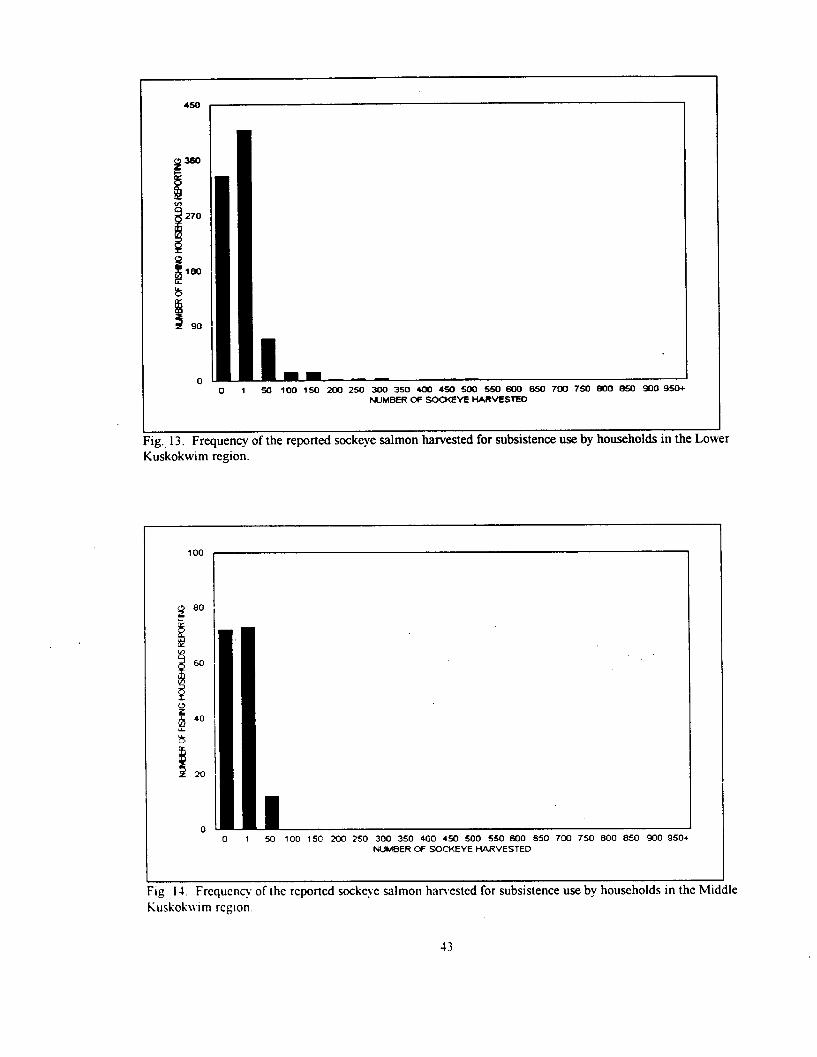
Frequency of the reported Sockeye salmon harvested for subsistence use by households in the Loiver Kuskokwim region ..,.........__. . . . . . . . 43
Frequency of the reported Sockeye salmon harvested for subsistence use by households in the Middle Kuskokwim region. . . . ..___._....._..................._.. 43
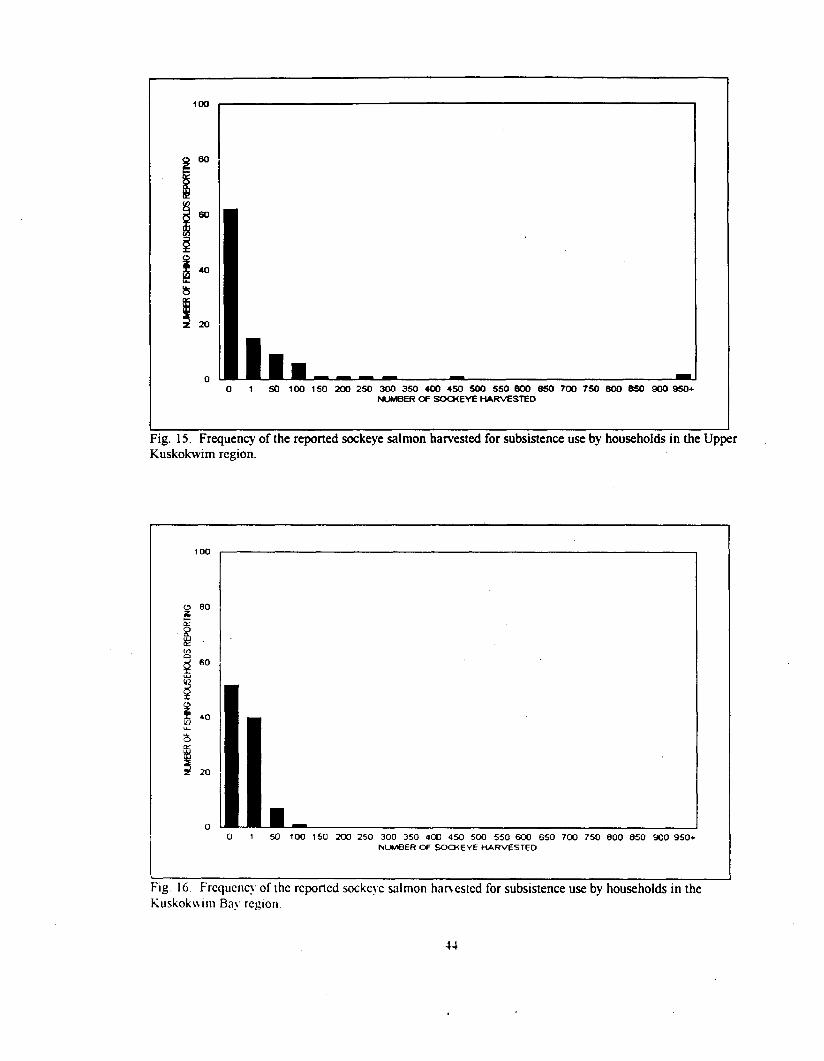
Frequency of the reported Sockeye salmon harvested for subsistence use by households in the Upper Kuskokvvim region. . . . . . . . . . . . . . . . . . . . . . . . . . . . . . . . . . . . . . . . 44
Frcqucncy, of the rcportcd Sockeye salmon harvested for subsistence USC by households in the Kuskok\vlm Bay region. . . . . . . . . . . . . . . . . . . . . . . . . . . . . . . . . . . . . . . . . . . 44
iV
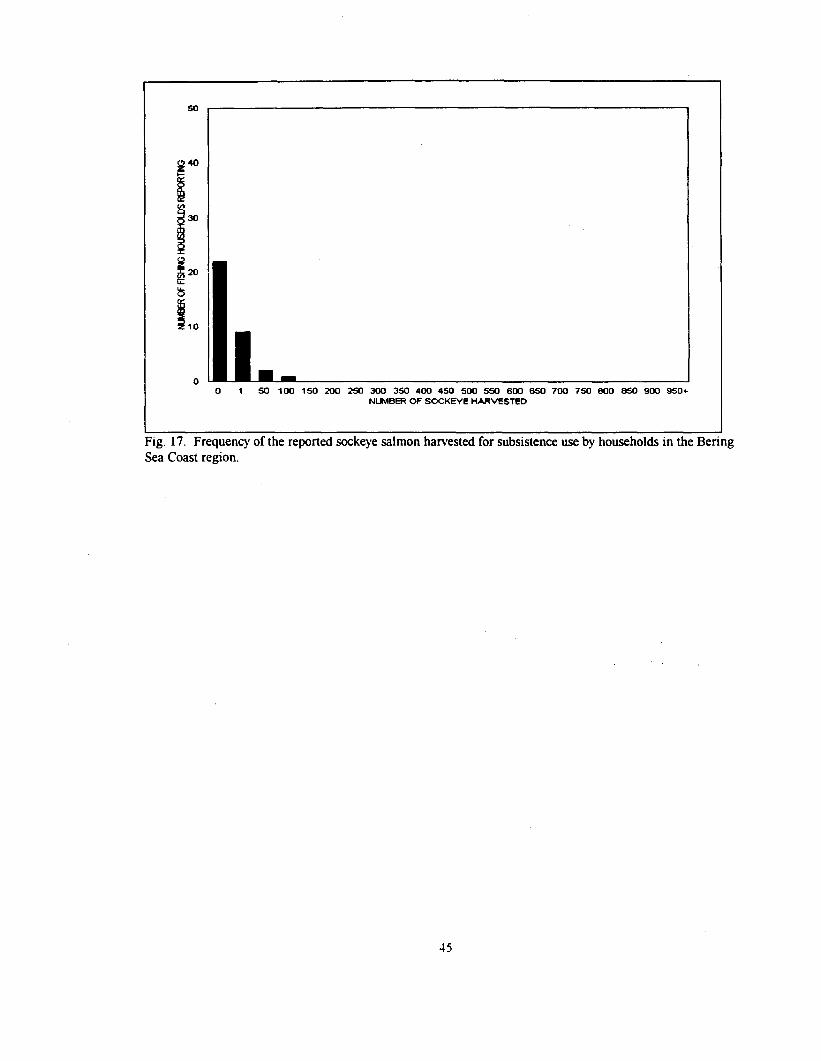
Figure 17. Frequency of the reported Sockeye salmon harvested for subsistence use by households in the Bering Sea Coast region. . . . . . . . . . . . . . . . . . . . . . . . . . . . . . . . . . . . . . . . . . 45
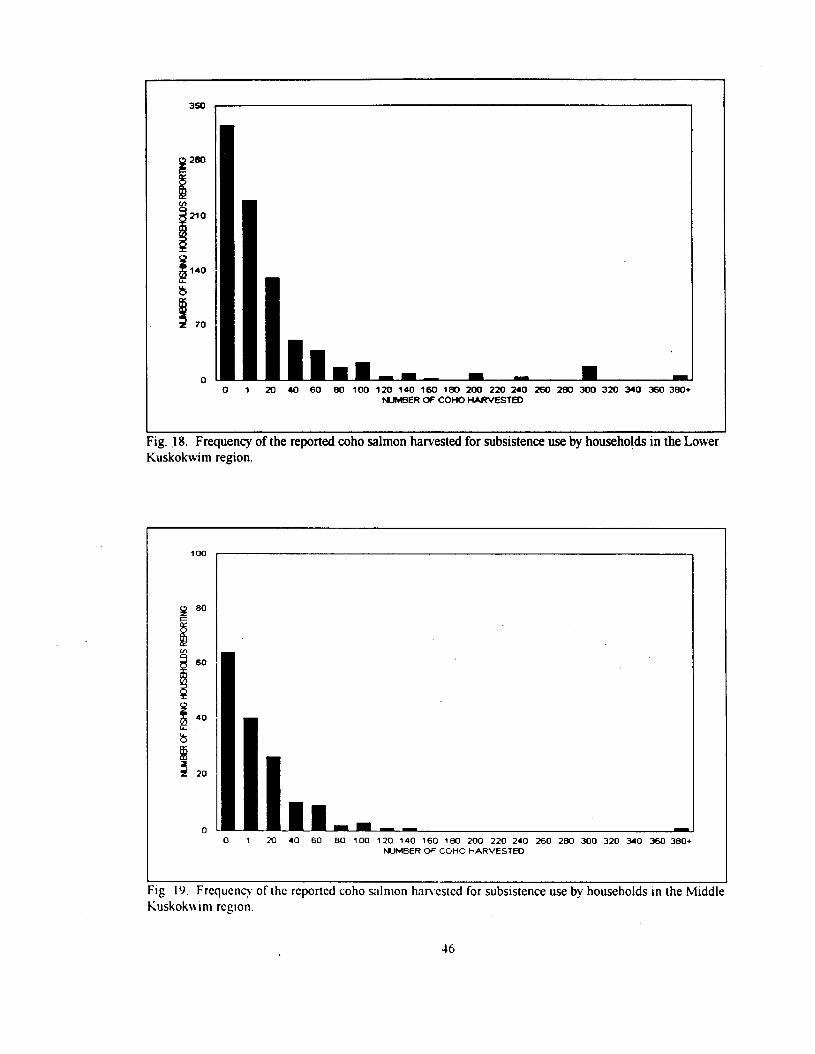
Figure 18. Frequency of the reported Coho salmon harvested for subsistence use by households in the Lower Kuskokwim region . . . . . . . . . . . . . . . . . . . . . . . . . . . . . . . . . . . . . . . . 46
Figure 19. Frequency of the reported Coho salmon harvested for subsistence use by households in the Middle Kuskokwim region.. . . . . . . . . . . . . . . . . . . . . . . . . . . . 46
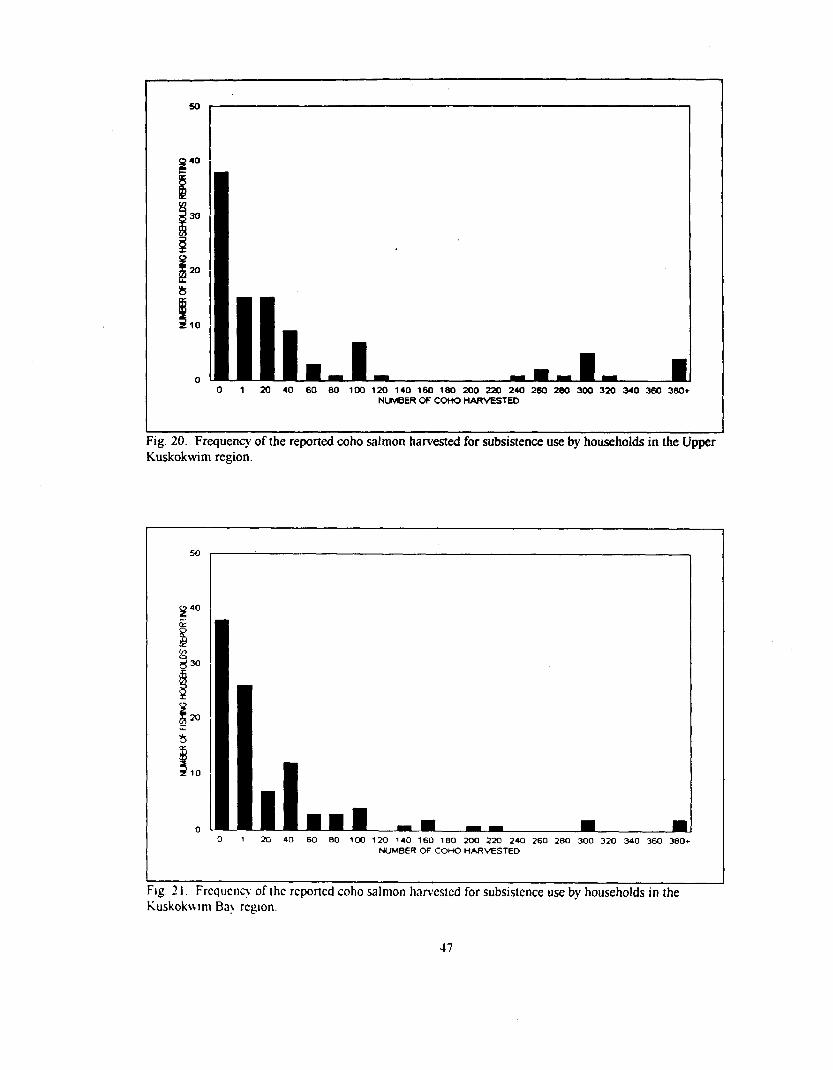
Figure 20. Frequency of the reported Coho salmon harvested for subsistence use by households in the Upper Kuskokwim region. . . . . . . . . . . . . . . . . . . . . . . . . . . . . . 47
Figure 2 1. Frequency of the reported Coho salmon harvested for subsistence use by households in the Kuskokwim Bay region. . . . . . . . . . . . . . . . . . . . . . . . . . . . . . . . . . . . . . 47
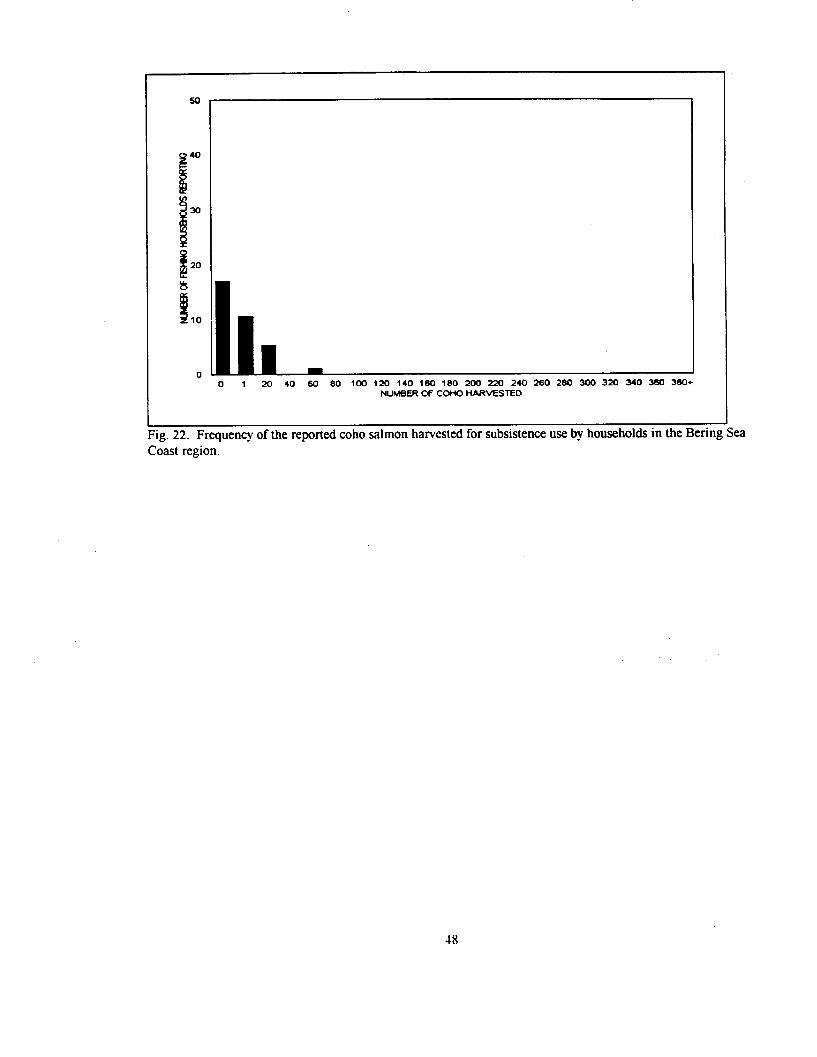
Figure 22. Frequency of the reported Coho salmon harvested for subsistence use by households in the Bering Sea Coast region. .,....................................... 48
V
LIST OF TABLES
Table 1.
Table 2.
Table 3.
Table 4.
Table 5.
Table 6.
Table 7.
Table 8.
Table 9.
Table 10.
Table Il.
Table 12.
Table 13.
Table 14.
Table 15.
Table I6
Kuskokwim Area communities and dates of community visits for 1989 subsistence salmon harvest surveys. . . . . . . . . . . . . . . . . . . . . . . . . . . . . . .._................................ 11
Kuskokwim Area subsistence salmon project sampling summary, 1989 . . . . . . . . . . . 16
Sampling summary for Kuskokwim Area households categorized as “usually fish,” 1989 . . . . . . . . . . . . . . . . . . . . . . . . . . . . . . . . . . . . . . . . . . . . . . . . . . . . . . . . . . . . . . . . . . . . . . . . . . . . . . . . . . 17
Sampling summary for Kuskokwir .I Area households categorized as “usually do not fish,” 1989..... . . . . . . . . . . . . . . . . . . . . . . . . . . . . . . . . . . . . . . . . . . . . . . . . . . . . . . . . . . . . . . . . . . . . . . . . . 18
Kuskokwim Area subsistence salmon harvests, 1989. . . . . . . . . . . . . . . . . . . . . . . . . . . . . . . . 2 1
Kuskokwim Area Chinook salmon subsistence harvests, 1989. . . . . . . . . . . . . . . . . . . . 22
Kuskokwim Area Chum salmon subsistence harvests, 1989 . . . . . . . . . . . . . . . . . . . . . . . . 24
Kuskokwim Area Sockeye salmon subsistence harvests, 1989 . . . . . . . . . . . . . . . . . . . . . . . . . 26
Kuskokwim Area Coho salmon subsistence harvests, 1989 . . . . . . . . . . . . . . . . . . . . . . . . . . . . . . 28
Reported use of fishing gear by subsistence salmon fishing households in the Kuskokwim Area, 1989 ..,.,.,,,,.,................................................................. 30
Number of people and dogs in surveyed communities reporting information, 1989 . . . . ..__......_.,.,,.._,..,......._....t.....,.._..................................................,.........,. 32
Reported harvest of salmon used to feed dogs, 1989. . . . . . . . . . . . . . . . . . . . . . . . . . . . . . . . . . . . . . 33
Alternative estimates for 1989 Kuskokwim Area subsistence salmon harvests .., ._. .., ..__. _. ._.. ., .: . . .._. ,...... . . . . . . . . . . _....... . . . . . . . . . . ., . . . . . . . . . . . 50
Kuskokvvim Area Chinook salmon subsistence harvests by community, 1980-1989 ..,.___...,,,.......,_._.,......,.,.__...._._.,,.,,.,......,.,,.........,......,,........,............ 52
Kuskokvvim Arca combined subsistence catches of Chum, Sockeye, Pink, and small Chinook salmon b>f community, 1980-1989 ._....,.............................. 54
Kuskok\vim Arca fishing families by community, 1980-1989 __.,,.____,.,,____....._.. 56
vi
ACKNOWLEDGMENTS
Information presented in this report would have not been available except for the many people living throughout the Kuskokwim Fisheries Management Area that participated in our harvest surveys and took the time to record their subsistence catches and return their catch calendars to us. Brad Palach and Mike Wade were hired specifically for the project and were responsible for conducting the bulk of the household interviews. Clarence Alexander, David Andersen, Molly Chythlook, Mary Pete, and Jody Seitz, also assisted with the household inter-views. Elizabeth Andrews provided advice and guidance throughout the course of the project and reviewed earlier drafts of this report. Sandra Skaggs fastidiously entered and edited household and harvest information. Cheryl Scott provided data management assistance prior to the 1989 fishing season and Charles Ut&e provided additional data management support. Vicky Leffrngwell and Carolyn Jones provided administrative support. Francis Inoue contributed her graphic artist skills to the design of the subsistence salmon catch calendars sent to households prior to the fishing season.
vii

. . . Vlll
INTRODUCTION
Residents of 37 communities harvest salmon within the Kuskokwim Management Area (Fig.
1). Twenty-six of these communities are situated along the Kuskokwim River or its tributaries.
Outside of the drainage, residents of six Kuskokwim Bay communities (Platinum, Goodnews Bay,
Quinhagak, Kwigillingok, Kongiganak, and Kipnuk) utilize Kuskokwim Area stocks. Platinum and
Goodnews Bay utilize primarily Goodnews River stocks, while Quinhagak utilizes pr&narily Kanektok
and Arolik river stocks. Families from Kwigillingok, Kongiganak, and Kipnuk, utilize Kuskokwim
River stocks as well as stocks within the tributaries near their communities. Residents of Mekoryuk,
Tununak, Toksook Bay, Newtok, and Nightmute harvest salmon in coastal waters and adjacent
tributaries within the Kuskokwim Area. Overall, approximately 3,400 households reside within the
Kuskokwim Fisheries Management Area and many of them harvest salmon for subsistence use.
Subsistence fishing for salmon occurred throughout the area. Except in commercial salmon
fishing districts where intensive commercial fisheries occurred, the subsistence fishery was subjected
to few restrictions in order to give preference to subsistence uses. During 1989, salmon could be taken
by gill net, beach seine. or fish ivheel. Spears were also legal gear in the Holitna River drainage. Set
gill nets and drift gill nets were the predominant gear types used. Fish wheels were also used by
residents of some communities upstream of Looser Kalskag. ‘Residents of the Kuskokwim Area also
used rod-and-rcci gear to harvest salmon for subsistence use.
Permits Lvere not required for subsistence fishing in the Kuskokwim Area. In each of the four
commcrcral salmon fishmg districts, most commctcial fishermen take salmon for both commercial and
subststcnce purposes (Fig. 2).
Smcc 1960. the Alaska Dcpartmcnt of Fish & Game has collected data on subsistence salmon
harvests of Kuskok\\-im Rrvcr salmon Survc~~s have been conducted in Quinhagak, Goodnews Ba!,.
and Platmum consistcntl!. since 1979. In the 1960s, the department utilized smokehouse counts to
dctcrmine total utilizatron of subsistence caught fish. in an effort to determine additional timing and
magmtudc data. the dcpartmcnt began using subsistence catch forms in 1962. It is unclear tf
I
3 x
:
3
sub&en- catch forms were used from 1963 through 1965, however, in 1966 the department started
using subsistence catch calendars to help determine subsistence salmon harvest levels on the
Kuskokwim River. These calendars were picked up during the annual surveys of smokehouses, drying
racks, caches, and personal interviews conducted in July and August. Beginning in 1969, subsistence
catch calendars have been printed with return postage prepaid by the department. Since that time
subsistence fishermen have been asked to mail their completed catch calendar to the department after
they were through fishing for the season. Salmon catch calendars were also picked up by department
staff conducting salmon harvest surveys in most communities during July and August except in 1983,
1984, 1986, and 1987 when many of the communities were not surveyed.
Estimates of the subsistence salmon harvest have been derived through from harvest data
obtained from subsistence salmon catch calendars and from household surveys with “fishing families.”
Subsistence fishing and processing was usually an actiiity involving several people of an extended
family. The participants making up the each “fishing family” were commonly related to one another
and cooperated during the summer in the harvesting, cutting, drying, smoking, and storing of salmon.
The “fishing family” sometimes included one or more individuals having a limited entry commercial
fisheries permit ivho fished for both commercial and subsistence purposes.
Subsequent to the chinook, sockeye, and chum salmon runs, department staff traveled to
Kuskokwim Area communities in order to collect subsistence salmon catch calendars and to conduct
household intcrvielvs aimed at gathering information on subsistence salmon fishing. These intervie\vs
usually began in carI>, August \vhile the coho salmon run was still in progress. As a result, the
subsistcncc harvest of coho salmon \vas not completely documented. Prior to 1989, little effort \vas
made to determine the crtcnt of the subsistence coho salmon harvest. The department also felt that
hancsts of sockc\c. chum, coho, and pink salmon \vcre not accurately reported; that some sockeye and
coho \vcrc rcportcd as chum. for esample. Because of that opinion, the department has classified
sockc~c. chum. coho. and pink salmon into a category called “small salmon” when comparing year to
!xar hancsts. Rcmindcr lcttcrs \\crc also mailed to households who were not contacted during the
communlt!. kisIts and did not return their catch calendar.
1
The subsistence salmon harvest information has been presented in tabular form as expanded
data in order to include estimates for those families known to have fished, but for one reason or another
did not return their salmon catch calendar or were not personally contacted. Harvest data for these
ftilies were assumed to be the same as the average catch for other “fishing families” in the particular
community. Although subsistence salmon harvest information was available for 1960 through 1988,
the statistical methods used to expand the harvest data to arrive at the total harvest of Kuskokwim area
salmon, had not been documented fully.
During 1983, 1984, 1986, and 1987, funds were not available to conduct subsistence harvest
surveys in all Kuskokwim Area communities. Subsets of villages were sampled during these years, and
expansion to other communities in the area were made. Beginning in 1988, the Division of
Subsistence, through an agreement and partial funding through the Division of Commercial Fisheries,
was responsible for carrying out all aspects of collecting subsistence salmon harvest data from
Kuskokwim area communities.
The Alaska fish and game law (Title 16) requires that fishery resources be “conserved in a
manner consistent with the sustained-yield principle” (A.S. 16) State law also requires that the highest
priority be given to subsistence uses as long as sustained yield of the resource is provided (ch. 52,
SLA 1986). In addition to mandating the conservation of fisheries, the state was also charged with
their commercial development. These legal measures provided the framework for the allocation of
fishcry resources, such as Kuskokvvim Area salmon, among subsistence, commercial, and recreational
uses
Management of the Kuskok\vtm Arca salmon fisheries requires a determination of the
allo\~ablc harvest consistent with maintaining sustained-yield of the salmon stocks. After determining
the neccssan’ cscapcment levels, excess salmon can be allocated among different uses. The number of
salmon ncccssary for subststence are considcrcd first among these uses. As subsistence use of
Kuskok\vrm Arca salmon stocks IS srgnificant, conserving, managing, and allocating salmon in the
Kuskok\vim Area rests on having rchable data on subsistence salmon harvests,
In 1989, a new method was developed and subsequently used to achieve the objective of
improving harvest reporting and the estimation of the total harvest. This report describes the
methodologies used for documenting subsistence salmon harvests and estimating the total harvest by
communities which may utilize Kuskokwim Area salmon stocks. It concludes with an evaluation of the
methodologies based on the results of the 1989 study.
Objectives
The primary objective of the 1989 subsistence salmon harvest project was to develop and
implement a revised harvest reporting and estimation procedure for determining harvest levels by
species by each Kuskokwirn Area community potentially harvesting Kuskokwim Area stocks for
subsistence. Secondarily, the 1989 study had additional objectives: (1) update community household
lists and identify salmon fishing households in each community; (2) evaluate the precision and
accuracy of the estimated harvest using the new methodology and compared to the previously used
methodology; (3) compile information on fishing effort (number of households participating), gear
types, and timing of the subsistence harvest.
-ME-l-HODS
Rccordine Subsistence Salmon Harvests. 1989
During 1989, Kuskokwim Area households were situated in three general areas: 1) along the
Kuskokwim River and its tributaries, 2) along Kuskokwim and Goodnews bays, and 3) along the
Bering Sea coast in the vicinity of Nunivak Island and Nelson Island (Fig. 1). Twenty-six communities
xvcrc situated along 1,000 miles of the Kuskokwim River or its tributaries from Eek to Telida. Based
on the 1988 survey.. there \vcrc an estimated 759 “fishing families” living within this area. A “fishing
family” rcprcscntcd at least one household unit, but more in some cases. In addition, 94 “fishing
6
f&lies” lived in the southern Kuskokwim Bay communities of Quinhagak, Goodnews Bay, and
Platinum in 1988. Twelve lived in Kongiganak, situated on northern Kuskokwim Bay. Some families
in Kipnuk and Kwigillingok also harvested Kuskokwim Area salmon for subsistence use, however,
these two communities did not allow household salmon harvest interviews to be conducted in their
communities. As a result, the number of “fishing families” or fishing households is unknown. One-
hundred and two “fishing families” lived in the communities of Mekoryuk, Tununak, Toksook Bay,
Nightmute, and Newtok in 1988. Residents of all Kuskokwim Area communities were predominantly
Alaskan Native.
In 1989, a new method was developed and subsequently used to improve both harvest
reporting and the estimation of the total harvest. The first step toward improving the accuracy of
harvest estimates was to improve existing information on the number of households engaged in salmon
fishing. That is, the total harvest estimate could be improved simply by having a more accurate count
of the number of households participating in the fishery. The total number of households was
previously undocumented. The 1989 study had the objective of censusing subsistence salmon harvests
of all Kuskokwim Area households.
The 1989 goal of recording the harvests of all households, whether or not they were included
on previous lists of “fishing families,” was a departure from the methodology used in the earlier
surveys. Prior to 1989. subsistence salmon harvest studies were aimed at gathering salmon harvest
data from groups of people having fishing camps. Many of these groups had been mailed salmon catch
calendars or \verc surveyed in previous years, hoivever, the total harvest of the group, or “fishing
farnil\,.” \vas usually attributed to the primary household returning the calendar to the household that
was survcycd. Households that jvere part of a “fishing family”, although they received a portion of the
group’s hanest. \vcrc not indicated as having fished for salmon. As a result, the total amount of fishing
effort. at the household level, \vas grossly undercstimatcd..
The 1989 efforts attcmptcd to idcntie all households participating in subsistence salmon
fishing acttvities and attcmptcd to idcntif\, harvest levels for each household. The dynamics of
particrpation in salmon fishing indicate that often there are households in a community that do not fish
for one or several seasons, but subsequently begin to fish; whereas other households no longer fish.
This was often a result of changes in household composition, such as the household becoming smaller
when younger members marry and form new households.
In 1989, several changes were also made in the methods for recording subsistence salmon
harvests. First, it was determined the study should seek data on salmon harvests from each household
involved in subsistence salmon fishing rather than a sample of “fishing families.” The household unit
was selected for the purpose of systematically updating the list of participants in salmon fishing and to
help reduce duplicate counts or omissions of salmon harvests. This approach also aided in maintaining
a more accurate list of currc‘ ishing households given the dynamism of participation in salmon
fishing. Each household identified was assigned a unique number in order to track information related
to individual households.
Although the fishing list compiled during surveys at the end of the 1988 fishing season
included many household names, in spring, 1989, a number of sources were used to supplement those
community household lists. These data sources included (1) household census lists from the Alaska
Department of Community and Regional Affairs for 1985-88 (information was not available for all
communities for all >,ears); (2) the names of 1987 commercial fishing permit holders in Bethel and
McGrath; (3) the names of 1988 sport fishing license hblders in Bethel and iicGrath; and (4) the
names of individuals in the 1988 phone books for Bethel and McGrath.
Escept for residents of Bethel or McGrath, subsistence salmon catch calendars were sent to all
households In Kuskokwim Area cornmun~ties identified at the end of the 1988 fishing season. Bethel
and McGrath households were sent a postcard survey prior to the 1989 fishing season (Appendix 1).
Thus sumey simply asked if the reclpxnt planncd to fish for subsistence salmon during 1989. If the
rcspondcnt returned the card and rcplicd that hc/shc would fish for salmon, a calendar was then mailed.
A second change in data collection \vas made to the catch calendar itself. Three similar
calendars \\crc used for different rcglons of the Kuskokwim Area: 1) the Kuskokwim Bay region, 2)
the Upper Kuskokwlm region. and 3) the Louver Kuskokkvim, Middle Kuskokwim, and Bering Sea
Coast region (Appcndis 2). Each calendar. as in the past, was designed for recording the daily harvest
8
of each salmon species. However, each calendar was modified in three major ways. First, it indicated
only those salmon species which occurred in each particular region. Second, because local names for
each species of salmon varied within the Kuskokwim Area, each species was identified by both its
common name and the term used by local residents. Third, since salmon were available in the different
regions at different times of the season, the time period or months providedon the three calendar types
varied for each region and included only those months which most people fished. For example, June
through September for the Lower-Middle Kuskokwim and Bering Sea Coast regions and July through
October for the Upper Kuskokwim region. These changes were intended to improve accuracy of
reporting and to facilitate the entry of data into computer files. The catch calendar was the only
harvest recording instrument used that was capable of recording timing of harvest by species on a daily
and monthly basis.
Approximately 1,750 of these calendars were distributed. Where addresses were available, the
calendars were mailed to post ofice boses; otherwise, calendars were sent general delivery for the post
office clerk to distribute. Each calendar had a postage paid addressed envelope attached for return to
the Bethel Subsistence Division offke.
A third component in data collection was the post-season harvest interview administered by
staff to community households. Following the fishing season, Division of Subsistence staff, permanent
and seasonal, traveled to each of the communities in October or November to collect catch calendars
and administer a brief questionnaire to each household. The questionnaire (Appendix 3) served to
collect harvest information, if the salmon catch calendar had not been used or was partially used, and
also facilitated the recording information on fishing gear used, household size, other households in a
fishmg group, number of dogs, and number of salmon harvested for dog food’. Comments on salmon
runs. fishmg conditions. and regulations \\crc also rccordcd and name and address infomtation 1va.s
updated as ncccssary’. Sirmlar to the subswcncc salmon catch calendars, slightly different versions of
the household intcrvicw instrument were used m the dlffcrcnt regions of the drainage.
Thirty-one communities were targeted for post-season household interviews during October
and November (Table 1). Telida, Mekoryuk, Newtok, Nightmute, Toksook Bay, and Tununak, were
not selected for household interviews. Two of the communities, Kipnuk and Kwigillingok, declined to
participate in the post-season survey project.
Prior to beginning the community surveys, efforts were made to inform and prepare
communities for the arrival of survey staff. This was done weeks or days in advance of their arrival
through radio and television announcements, posters in public buildings, phone calls to city offices, and
letters to City, IRA, or Traditional Councils in each community visited.
Survey work was conducted systematically. Upon arrival in a community, staff checked in
with the city office to introduce themselves and outline their task. Knowledgeable individuals within
the community assisted in compiling a list of households and identifjring those that fished for
subsistence salmon in 1989. Staff attempted to contact all identified fishing households. Structured
interviews were conducted with these households through the use of the interview instruments and
subsistence salmon catch calendars were also collected. If time permitted, other households on the
community list were contacted about their salmon fishing activities, if any. A typical community visit
lasted 1-2 days.
The fourth important and additional component of the 1989 project was the collection of
harvest data from postcard and telephone surveys conducted after fishing was over. The postcard
survey (Appendix 4) simply asked if the household fished for subsistence salmon and the quantities
hamestcd of each of the salmon species The postcard could be separated in half and returned, postage
prepaid. Generally, the postcard SUI-LC~ \vas mailed to households that had not returned a subsistence
salmon catch calendar or had not been contacted during the post-season community visit. As visits
lvcrc not made to households in Kipnuk. K;\viglllingok. Bethel, Telida, Mekoryuk, Newtok, Nightmute,
Toksook Bay. or Tununak. all households in these communities were mailed the postcard survey in
October Attempts \vcrc also made to contact Bethel households which did not respond to the postcard
sunc>’ \\ith a phone sunc!’ durmg No\cmbcr The telephone interviews asked the same questions as
the postcard sunc!
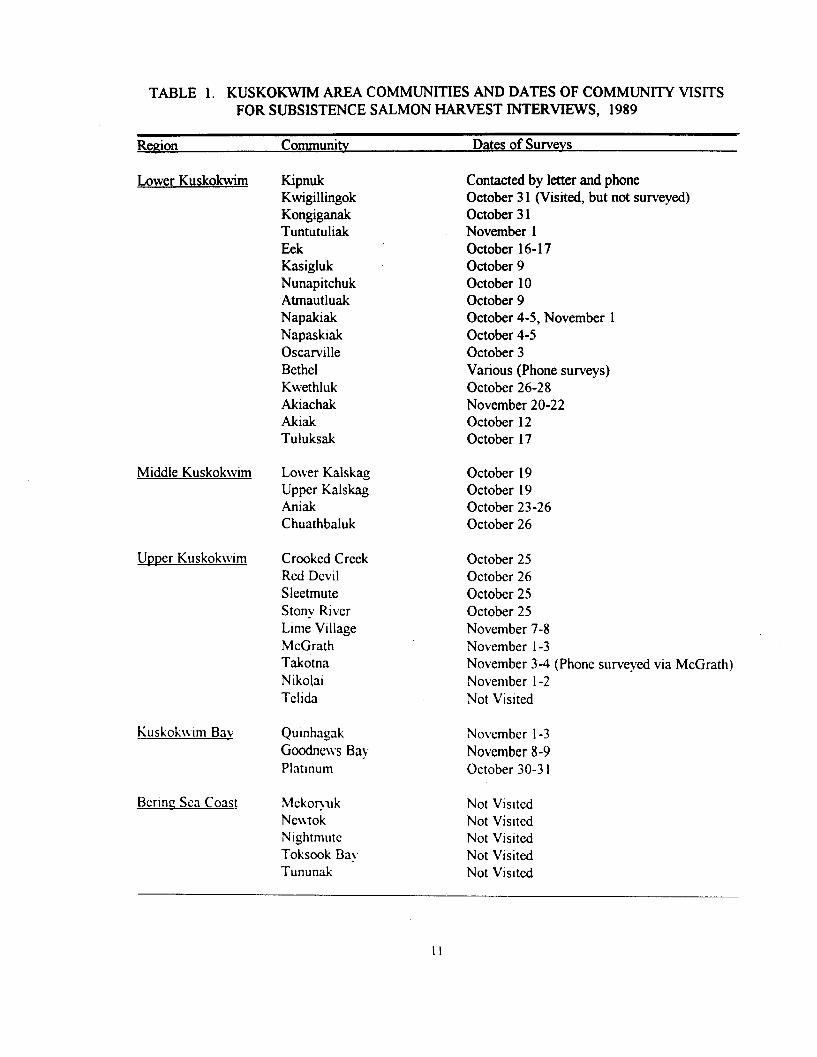
TABLE 1. KUSKOKWIM AREA COMMUNITIES AND DATES OF COMMUNITY VISITS FOR SUBSISTENCE SALMON HARVEST INTERVIEWS, 1989
Region Communitv Dates of Survevs
Lower Kuskokwim
Middle Kuskokwim
Upper Kuskok\vim
Kuskokivim Bav
Bcrmc Sea Coast
Kipnuk Kwigillingok Kongiganak Tuntutuliak Eek Kasigluk Nunapitchuk Atrnautluak Napakiak Napaskiak Oscarville Bethel Kwethluk Akiachak Akiak Tuluksak
Contacted by letter and phone October 3 1 (Visited, but not surveyed) October 3 1 November 1 October 16-17 October 9 October 10 October 9 October 4-5, November 1 October 4-5 October 3 Various (Phone surveys) October 26-28 November 20-22 October 12 October 17
Lower Kalskag Upper Kalskag Aniak Chuathbaluk
October 19 October 19 October 23-26 October 26
Crooked Creek Red Devil Sleetmute Stony River Lime Village McGrath Takotna Nikolai Telida
October 25 October 26 October 25 October 25 November 7-8 November l-3 November 3-4 (Phone surveyed via McGrath) November l-2 Not Visited
Quinhagak Goodne~vs Ba) Platinum
November l-3 November 8-9 October 30-3 I
Mckoquk Nc\vtok Nrghtmutc Toksook Bay Tununak
Not Visited Not Visited Not Visited Not Visited Not Visited
II
Estimatina Subsistence Salmon Harvests
Ideally, salmon harvest information from every household in a community would be collected.
However, due to staffing and fiscal constraints, this was not possible and information from a subset of
households was used. If the information from the subset of households could be considered to be a
representative sample of the population, inferences about the larger defined population could be made
from the information gathered.
However, this use of “random” information is often very inefficient. For a heterogeneous
population statistical estimates for characteristics (means, totals, percentages) of the population
provided by the “random sample” may be very imprecise. Perhaps only a few households were
involved in a certain harvest activity, or a few households harvested the majority of salmon within a
community. Under these conditions it would take a large sample fraction to guarantee that these
households would be included in the sample, and care must be taken that an overemphasis on sampling
these households not be made so that the “random sample” assumption not be violated.
One relatively straightfonvard sampling alternative to the random sample approach is the
stratified sample. Under this design households within the community were pre-categorized into
groups, or strata. For the Kuskokwim Area subsistence salmon project, households were identified as
“usually fish” or “usually do not fish.” Households that “usually fish” either were identified as such
during the community visit (see examples of the surveys in Appendix 3) or were known to have fished
in 1988 and 1989. All other households wxc classified as “usually do not fish.” Whenever possible
during the community visits. local rcsidcnts provided staff information which helped classify.
households as either “usually fish” or “usuall~~ do not fish.” This methodology followed one developed
for estimating subsistence salmon harvests for Yukon Rl\,cr communities in 1988.
In order to calculate communit!. Icxl statistics, strata level statistics \vere calculated and
combined after adjusting for disproportlonatc sampling intensity \vithin each stratum. A f$rthcr
refinement to previousI!, used mcthodologlcs IS the use of a “finite population correction factor” in the
calculation of variances associated \vith sample statistics. Variance is a measure of the imprecision of
12
a statistical estimate (i.e., the reliability of the estimate). The effect of the finite population correction
factor is to reduce the variance of an estimate as the relative sample size increases. As the sample size
approaches the size of the population, the variance approaches zero, which is intuitively correct as
there is no variation associated with a statistic calculated from a censused population. Literature (e.g.,
Cochran 1977) suggests this adjustment factor be used when 10 percent or more of the population is
sampled. For the Kuskokwim Area subsistence salmon project, information was collected from 72
percent of the households defined within the area, and between 11 and 100 percent of the households
within individual communities for which estimates were made.
Data from the three information sources (subsistence salmon catch calendars, household
interviews, postcard surveys and telephone interviews) were entered into a microcomputer database.
Data were verified against source documents, and several logic checks of the data were made. The
master list of names and addresses of resident households was updated to reflect changes in household
composition and number of households residing in each community. The unique household numbering
system was maintained on the master list and on the database tables containing information from each
of the three information sources.
Harvest information vvas collected by each, of the information sources. Information for a single
household may have been available from more than one source. In order to provide a single best
estimate for a household’s harvest of a salmon species during 1989, information was composited from
the various information sources. In most cases, there were few discrepancies between information
available from the different sources. In those cases vvhere a household interview was conducted and the
mtcrvicw indicated that the household fished for subsistence salmon, but no salmon harvest could bc
quantified through any information source. the harvest was identified as “missing.” Harvests for
groups of households that fished together vvcre partitioned between the households.
Guidelines developed during the course of the process to composite harvest information
included the assumptions that.
( I) the salmon catch calendar would bc the most accurate means of recording a household’s hanut.
13
(2) information from the different sources for various species needed to be evaluated concurrently in order to identify the harvest for a particular species;
(3) information from the different sources for a particular species may be different due to the timing of the collection of this information; -
(4) information on the use of salmon to feed dogs be used household’s catch if no other harvest information is available.
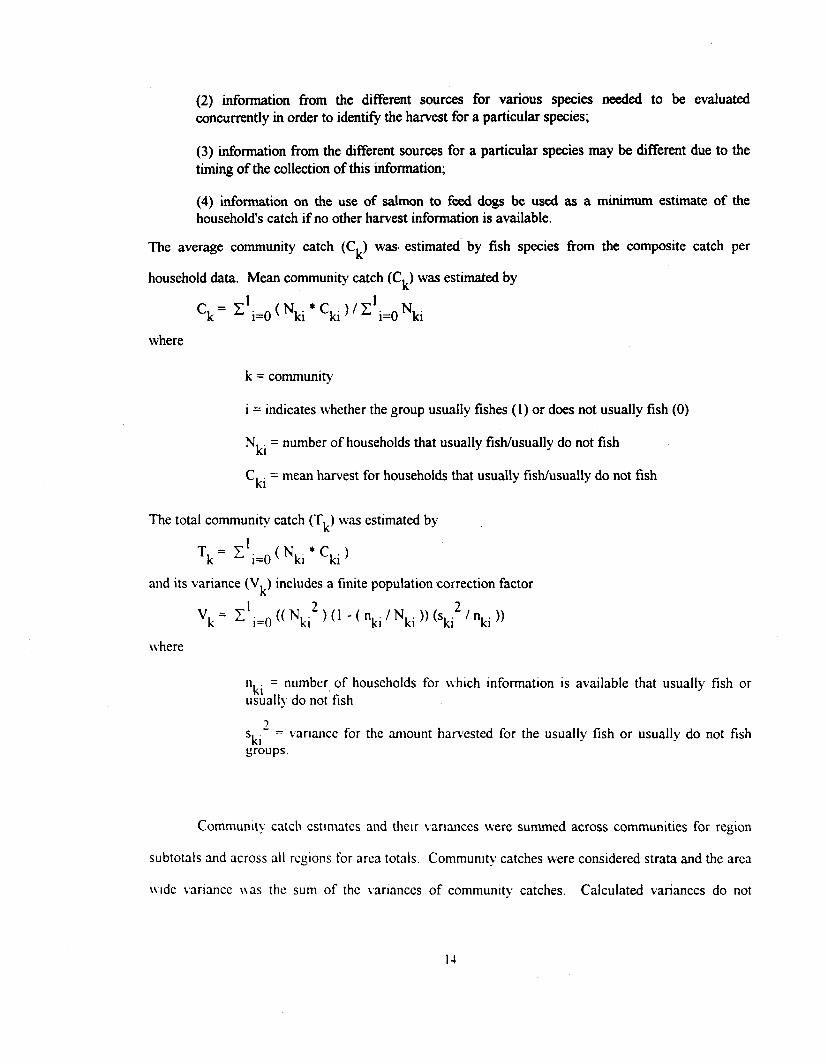
The average community catch (C,) was. estimated by fish species
household data. Mean community catch (Ck) was estimated by
as a minimum estimate of the
from the composite catch per
ck= c’ 1 i=o ( Nki * ‘ki ) ’ ’ i=o Nki
where
k = community
i = indicates whether the group usually fishes (1) or does not usually fish (0)
Nki = number of households that usually fish/usually do not fish
Cki = mean harvest for households that usually fish/usually do not fish
The total community catch (Tk) was estimated by
Tk = ~‘i=o ( Nki * ‘ki )
and its variance (V,) includes a finite population correction factor
Vk = Zli=O (( Nki2 ) (1 - ( “ki ’ Nki )) (Ski2 ’ “ki ))
ivhere
nki = number of households for kvhich information is available that usually fish or usually do not’fish
2 ‘ki = vanancc for the amount harvested for the usually fish or usually do not fish groups
Communq catch cstunatcs and their variances were summed across communities for region
subtotals and across all rcglons for area totals. Community catches were considered strata and the arca
\\~dc \,ariancc \\as the sum of the variances of community catches. Calculated variances do not
account for any form of measurement error. Estimates for community, region, and total area harvests
are reported with approximate 95 percent confidence intervals (two standard errors of the totals).
RESULTS
Samvling Summary
Table 2 presents data on the number of households contacted. Over 3,400 households were
defined in the microcomputer database for households in communities located in the Kuskokwim Area
(Kuskokwim River, Kuskokwim Bay, and Bering Sea Coast). Subsistence salmon fishing information
was collected from over 72 percent of these households. The majority of contacts (969) were through
interviews, however, 630 Bethel households were contacted during telephone interviews. Of all of
households contacted, 1,527 (6 1.6 percent) were determined to have subsistence fished for salmon in
1989. Approximately 15 percent (267) of the 1,745 subsistence salmon catch calendars and 22 percent
(348) of the 1,58 1 postcard surveys which were mailed, were returned.
Nearly 1,300 households were classified as “usually fish” (Table 3). Salmon harvest
information was collected on 98.4 percent of these households, and 89.1 percent of these households
fished for salmon in 1989. Nearly 24 percent of the “usually fish” households mailed subsistence
salmon catch calendars used them. In addition, 29.8 percent of the “usually fish” households that wcrc
mailed post-season postcard surveys returned them.
Over 2,100 households were classified as “usually do not fish” for subsistence salmon (Table
4). Information was collected on 56.8 percent of these households, and 17.8 percent of them fished for
salmon in 1989. Only 4 percent of the “usually do not fish” households that were mailed salmon catch
calendars rctumed them. Tvvcnty percent of the “usually do not fish” households that were mailed
postcard survqs returned them. Over one-half of the “usually do not fish” households resided in
Bcthcl. Nearly 50 percent of those Bethel households vvere interviewed by telephone.
15
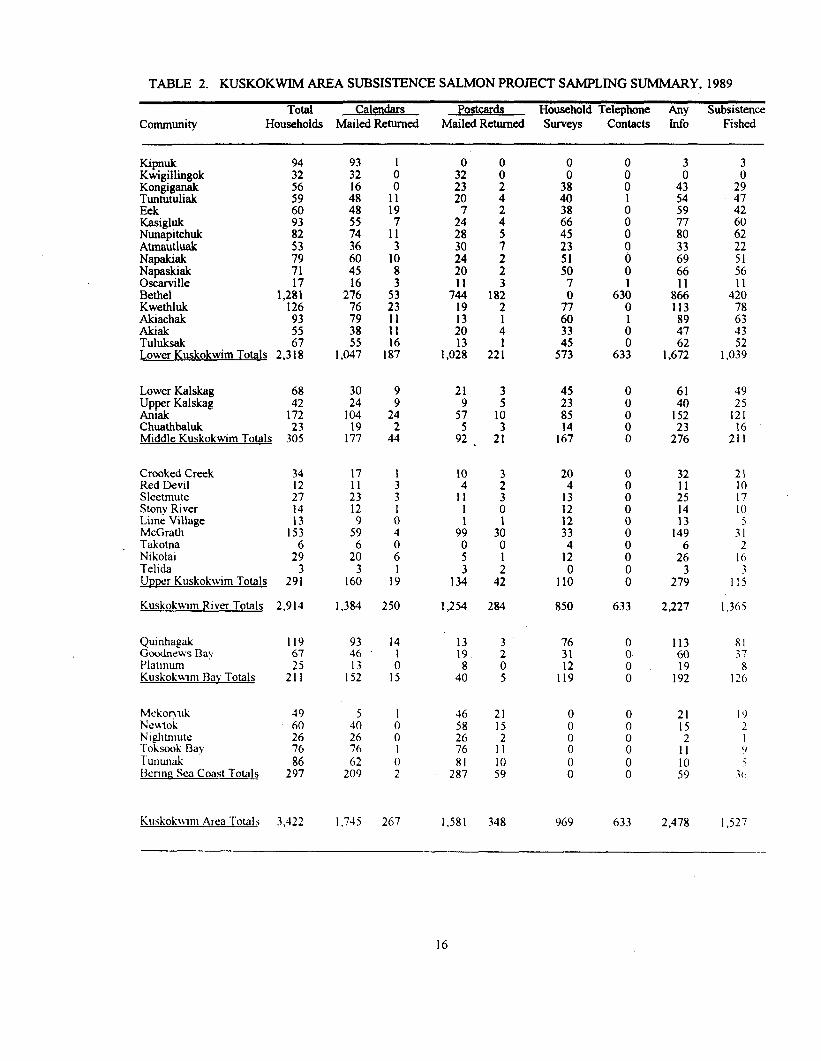
TABLE 2. KUSKOKWIM AREA SUBSISTENCE SALMON PROJECT SAMPLING SUMMARY, 1989
Total Calendars Postcards Household Telephone Any Subsistence Community Households Mailed Returned Mailed Returned Surveys contacts Info Fished
Kipnuk Kwigillingok ;; ;O$$$~ :t Eek 60 Kasigluk Nunapitchuk ii Atmautluak Napakiak ;; p=+&c 71
Bethel 1.2:: Kwethluk 126 Akiachak Akiak z: Tuluksak 67 Lower Kuskokwim Totals 2.3 18
Lower Kalskag 68 Upper Kalskag Aniak 147: Chuathbaluk 23 Middle Kuskokwim Totals 305
23: 104
1:;
9
2: 2
44
21 9
57
9:
: 10
2:
45 23 85 14
167
Crocked Creek 34 Red Devil Sleetmute ::: Stony River Lime Village t’: McGrath 153 Takotna Nikolai 2; Telida 3 Uutxr Kuskokwim Totals 291
Kuskokwim Rover Totals 2,914
17
:: 12
5::
2: 3
160
10
1’: 1
9; 0 5 3
134
:
i
3: 0
: 42
20 4
13
!22 33
1;
11:
1,384 250 1,254 284 850
Qumhagak 119 Goodnews Bay 67 Platinum 25 Kuskokuim I3av Totals 211
93 46
1::
14
:, 15
13 19 8
40
76 31 12
119
Mckonuk NCNTOjr Nightmute Toksook Bav l‘ununak ’ 13cnna Sea Coast Totals
49
26: 76 86
297
4;: 26
2; 209
1 16 0 58 0 26 I 76 0 81 2 287
21 15
1: 10 59
Kuskokvvlm Area Totals 3,422 1,745 267 1.581 348 969
i 43 54 59
ii; 33
iii
8:; 113 89 47
1,6;;
:, 29 47 42
z; 22
::, 11
420
2 43 52
1,039
61 49 40 25
152 121
2;: 2::
32
::
t; 149
2:
27;
21 IO 17 IO
3: 2
16
11:
2,227 1,365
113 60
1:;
81 37
8 126
21 I5
1:
:i
2,478 1,527
16
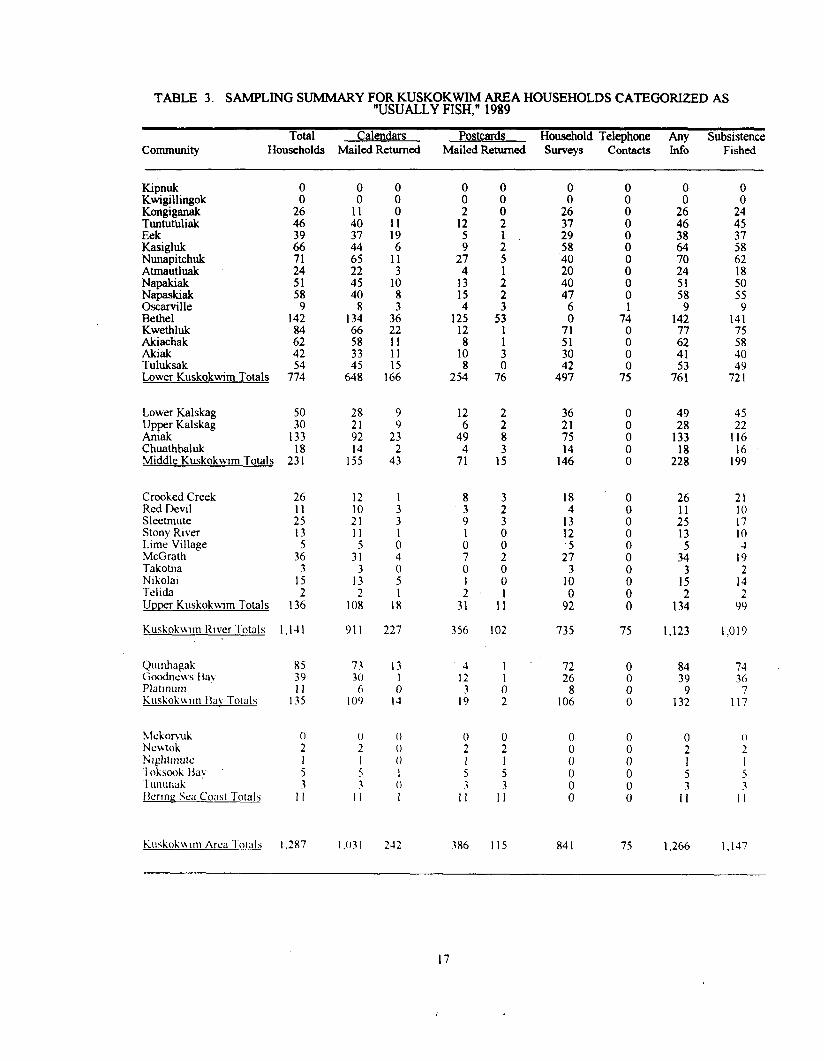
TABLE 3. SAMPLINGS UMMARY FOR KUSKOKWIM AREA HOUSEHOLDS CATEGORIZED AS “USUALLY FISH,” 1989
community Total Calendars Poskards Household Telephone Any Subsistence
Households Mailed Returned Mailed Returned Surveys Contacts Info Fished
Kipnuk Kwigjllingok :
!zizE% 26 46
Eek Kasigluk 2: Nunapitchuk Atmautlti li Napakiak 51 Napaskiak 58 Oscarville 9 Bethel 142 Kwethluk Akiachak ti Akiak 42 Tuluksak Lower Kuskokwim Totals 7::
00 11 40
ii
:; 45 40
13: 66 58 33
6ii
Lower Kalskag 50 28 Upper Kalskag Aniak ,:I:
21 92
Chuathbaluk 18 14 Middle Kuskok\nm Totals 23 1 155
Crooked Creek 26 Red Devil Sleetmute :: Stony River 13 Lime Village 5 McGrath 36 Takotna 3 Ndiola 15 Telida 2 Utxxr Kuskokwim Totals 136
Kuskok\ilm River Totals I, 14 I
12
:7 11 5
31
1: 2
I08
911 227 356
0 2 I > 3
I I
I .O? I
: 0
t:, 6
11 3
10
i 36 22
t; 15
166
9
2: 2
43
I 3 3
:, 4 0 5 I
18
I3 I 0
I-l
0 0 0 I 0 I
242
:
1:
; 27
4 13 15 4
125 12
1:
25:
12 6
49
7:
8
i 1
‘: 0
: 31
4 I2 3
19
0 2 I 5 3
I I
386
00 0 2
: 5
: 2
5:
t 3
7:
2 2 8 3
15
:
:,
i 0 0
I1
102
1 I 0 2
0 2
:
1:
II5
iii 26 37 29 58
'40 20 40 47
: :t 30 42
497
2 75
1::
18 4
t: ,5
27
1:
9;
735
72 26
8 106
841
: 0 0 0 0
i 0 0 1
74
: 0
7;
0 0 0 0 0
0 0
: 0 0
::
i
75
0
z 0
i 0 0 0 0
75
49
13;
2::
45 22
116 16
199
26
:: 13
3:
1:
13:
21 IO I7 10 4
19 2
14 2
99
1,123 1,019
84 74 39 36
9 7 132 II7
0 2 I 5 3
II
1,266 1,147
17
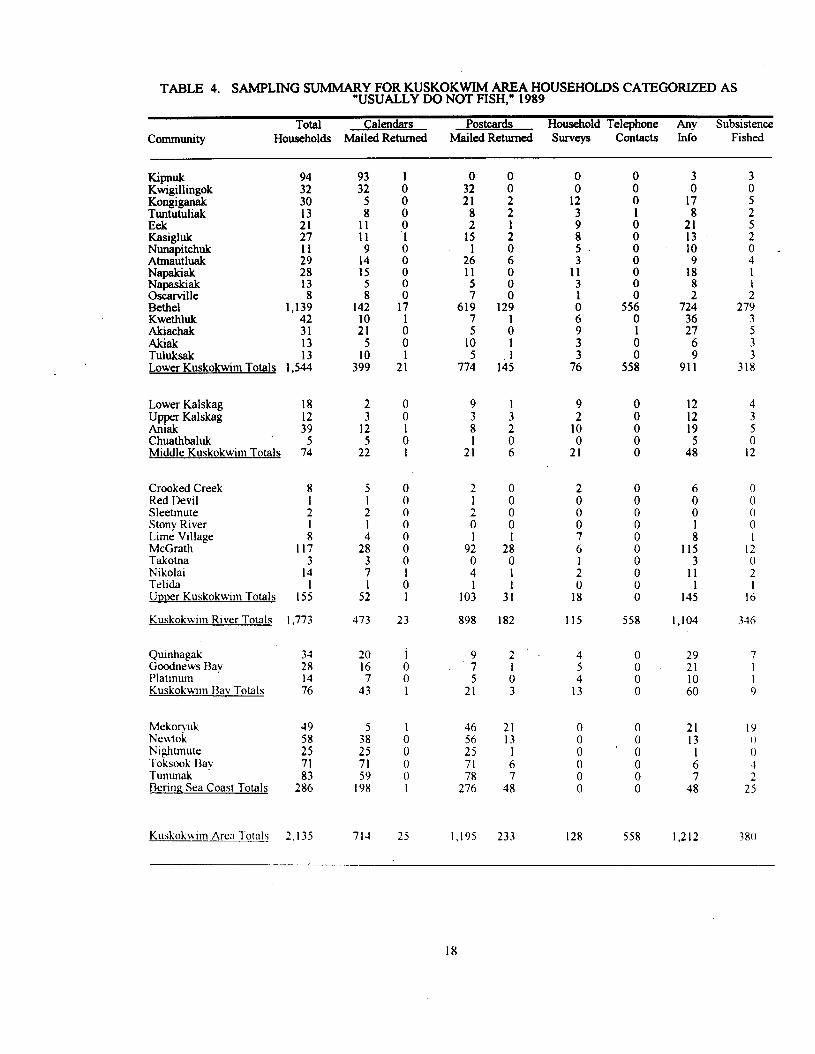
TABLE 4. SAMPLINGSUMMAR Y FOR KUSKOKWIM AREA HOUSEHOLDS CATEGORIZED AS “USUALLY DO NOT FISH,” 1989
community Total Calendars Postcards Household Telephone Any Subsistence
Households Mailed Returned Mailed Retumed surveys Contacts Info Fished
Kipnuk Kwig$ingok
Kit%!-% Eek Kasieluk Nun&pitchuk Atmautluak Napakiak Napaskiak Oscarville Bethel Kwethhtk Akiachak Akiak Tuhtksak Lower Kuskokwim Totals
Lower Kalskag 18 2 Upper Kalskag 12 3 Aniak 39 12 Chuathbaluk 5 5 Middle Kuskokwim Totals 74 22
Crooked Creek Red Devil Sleetmute Stony River Lime Village McGrath Takotna Nikolai Tehda Uoner Kuskokwim Totals
94
:;
11
;i 13 8
1,139 42 31 13
1.5:
8 1 2 1 8
117 3
14
15:
Kuskokwim Rover Totals 1,773 473 23 898 182 115 558 1,104 346
Qumhagak Goodnews Bay Platmum Kuskokwim Bav Totals
Mekonuk Neutojc N~ghtmute Toksook Bay Tununak king Sea Coast Totals
49
1;
ii: 286
Kuskokvvtm Area I~otnls 2,135
93 32
5 8
t: 9
14 15
ii 142
:‘: 5
3;:
5 1 2 1
2;: 3 7
5:
20 16 7
43
5
:t 71 59
198
71-l 25
21
i 15
2: 11
:: 619
7 5
10
77:
9 3 8 1
21
2 1
; 1
92 0 4
10:
s
2:
46 ;;
71
2::
I.195
8 2 2
:
: 0
8 129
:, 1
14:
0
1;
; 8
: 11 3 1
: 9
: 76
0 1
i 0
8
8 556
0 1
: 558
17
2; 13 10
1;:
i 724
:67 6
91;
3 0
:
: 0 . 4 1 I
27: 3
:
31:
4 10 0
21
12 12 19 5
48
4
: 0
12
ii 0 0
z
: 0
18
: 0
A 115
3 11
1 145
a
:: I
12 0 2
I:,
4 5 4
13
0 0 0 0
29 21
67
21 13
I 6 7
48
21 13
1 6 7
48
19
11 1 2
25
233 128 558 1,212 380
18
1989 Community and Drainaae Harvest Totals
Harvest estimates by community and region are presented in Table 5. The 1989 harvest
estimates for the Kuskokwim Area communities’ are 77,030 chinook, 132,858 chum, 34,255 sockeye,
and 49,691 coho salmon. Reported harvests accounted for 78.5 percent of the estimated chinook
salmon harvest, 78..0 percent of the chum, 8 1.2 percent of the sockeye, and 75.6 percent of the coho
salmon harvest.
Households in communities who fished in the Lower Kuskokwim region, which included
communities from Tuluksak to Kongiganak, harvested 81.1 percent of the estimated subsistence
chinook salmon catch, 69.3 percent of the chum, 6 1.5 percent of the sockeye, and 69.0 percent of the
subsistence coho salmon catch. About two-thirds (68.0 percent) of the identified fishing households
reside in this area.
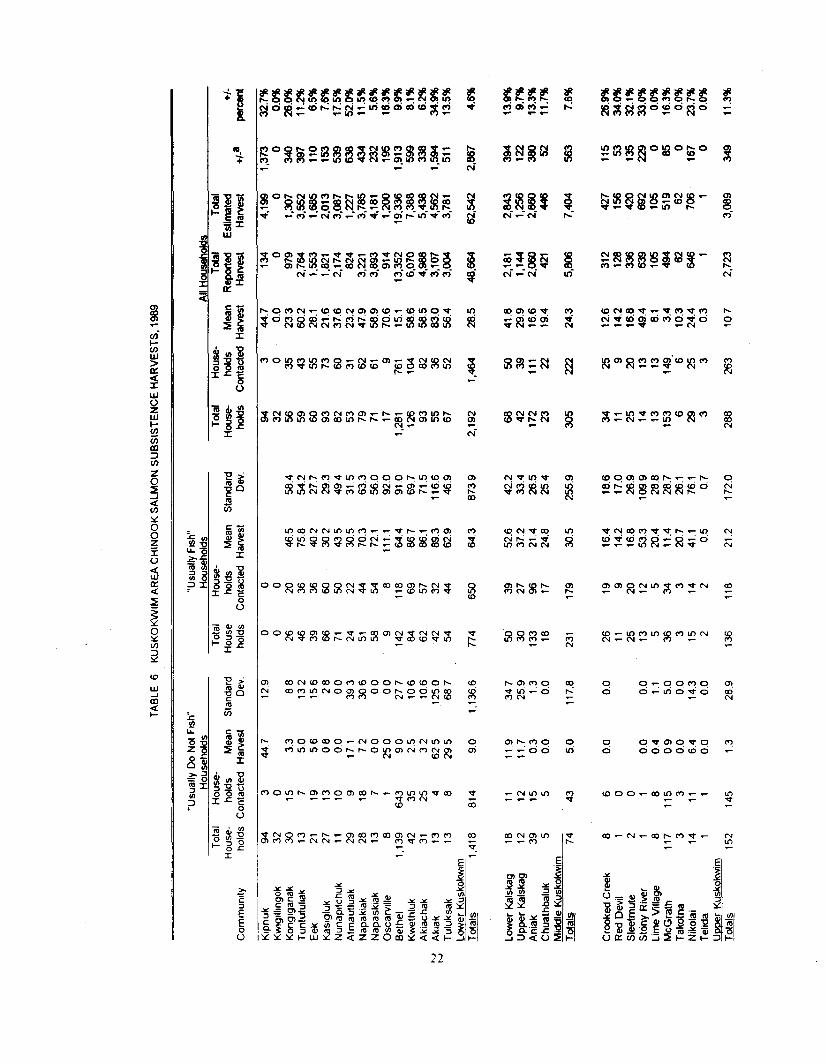
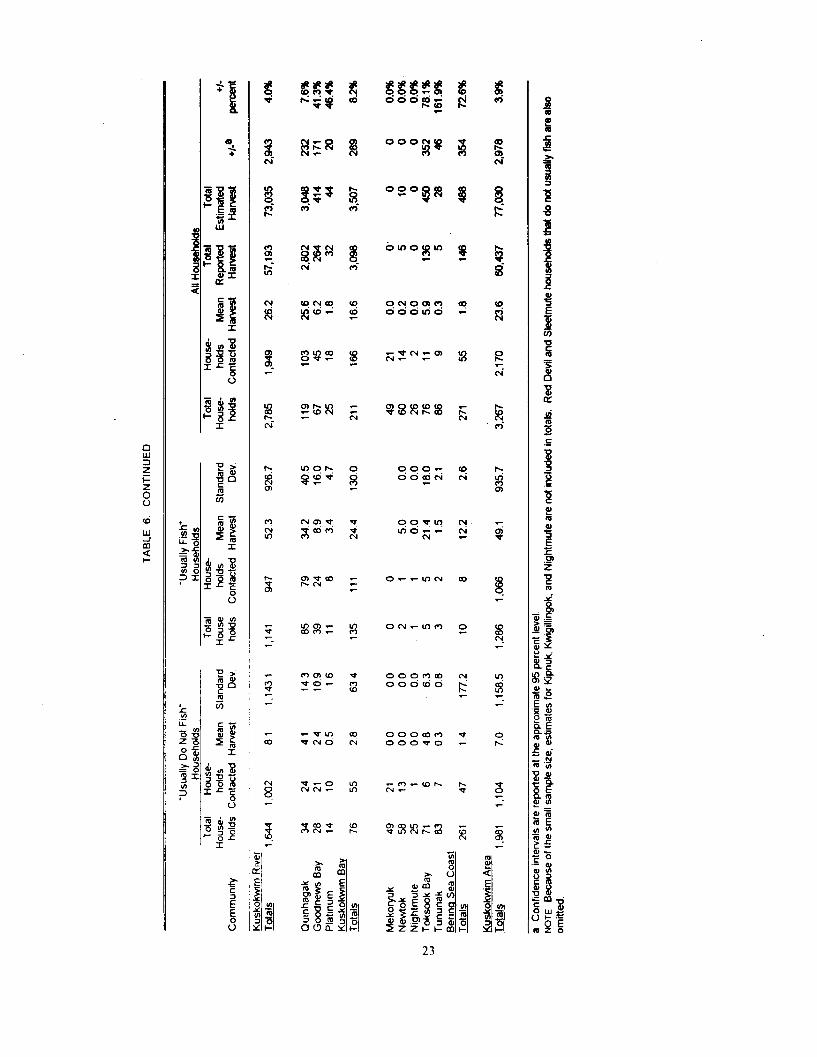
Sample information, harvest estimates, and confidence intervals by community and region for
chinook salmon are presented in Table 6. The 1989 harvest estimate for chinook was 77,030 fish with
an approximate 95 percent confidence interval of +/- 2,978 fish (or +/- 3.9 percent of the estimated
total). Harvest estimates for the Lolver Kuskokwim and Middle Kuskokwim regions as well as the
estimates for the Kuskoklvim Bay region had levels of precision within 10 percent of the estimated
totals. Bethel harvested more chinook salmon than any other ‘community (19,336 fish).
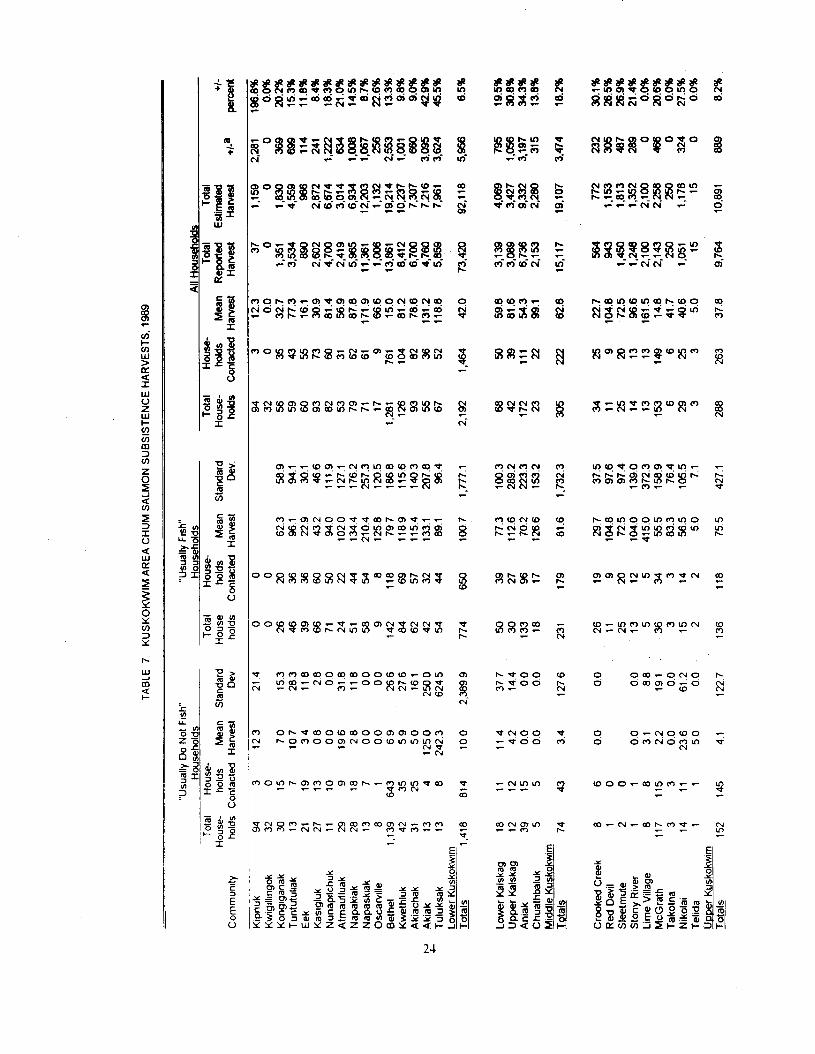
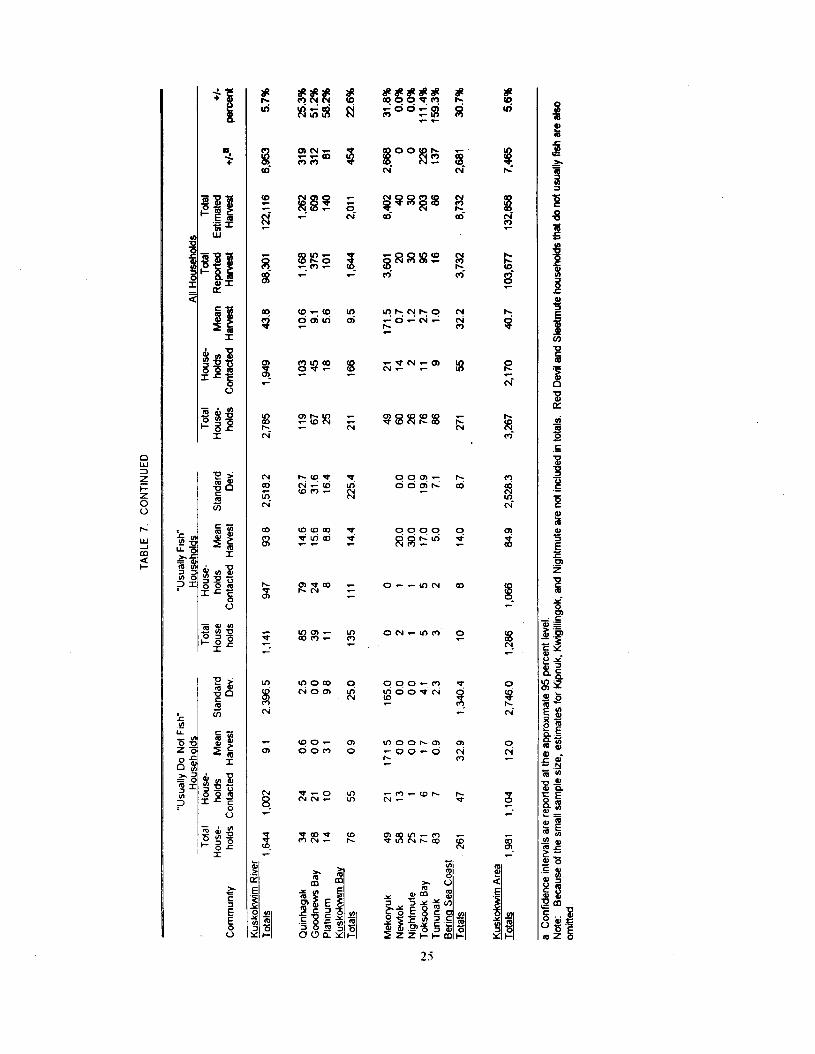
The 1989 chum salmon harvest estimate was 132,858 fish with an approximate 95 percent
confidence interval of +/- 7,465 fish (or +/- 5.6 percent of the estimated total, Table 7). Harvest
cstlmatcs for the Lower Kuskok\vlm and Upper KuskokLvim regions had levels of precision within 10
pcrccnt of the estimated totals. The communq of Bcthcl harvested an estimated 19,214 chum salmon.
and the communities of Napaskiak and Kwcthluk each harvested over 10,000 chum salmon. The 1989
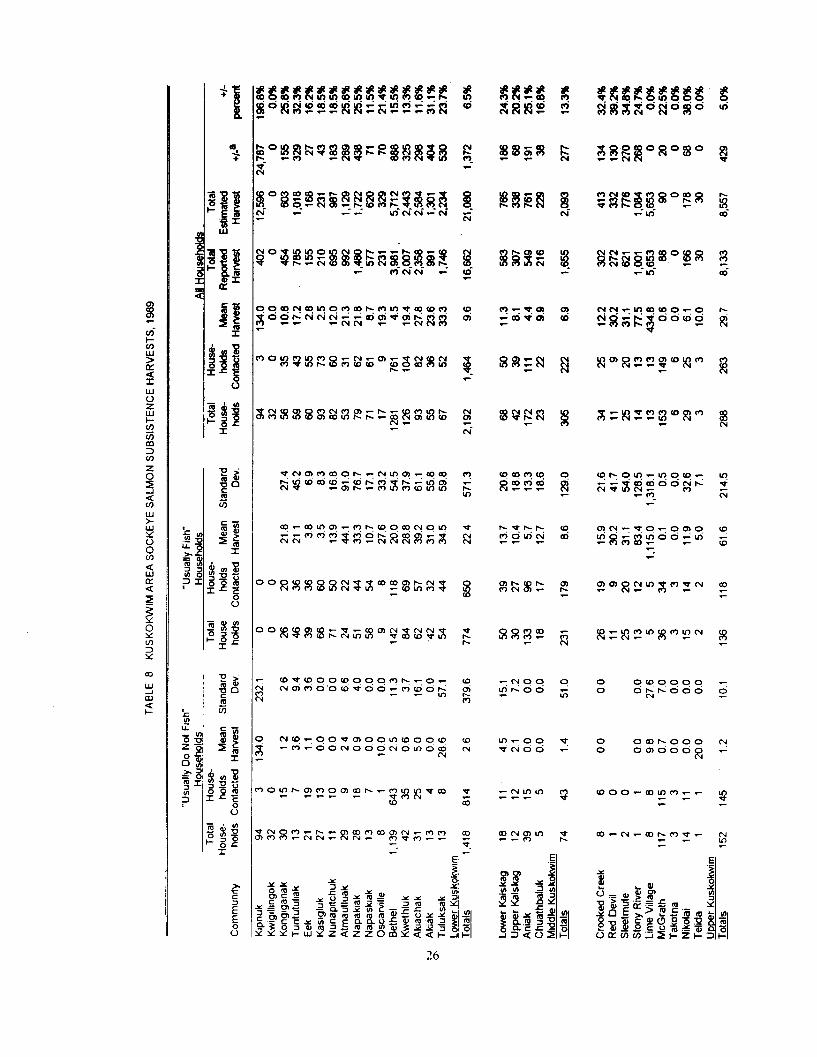
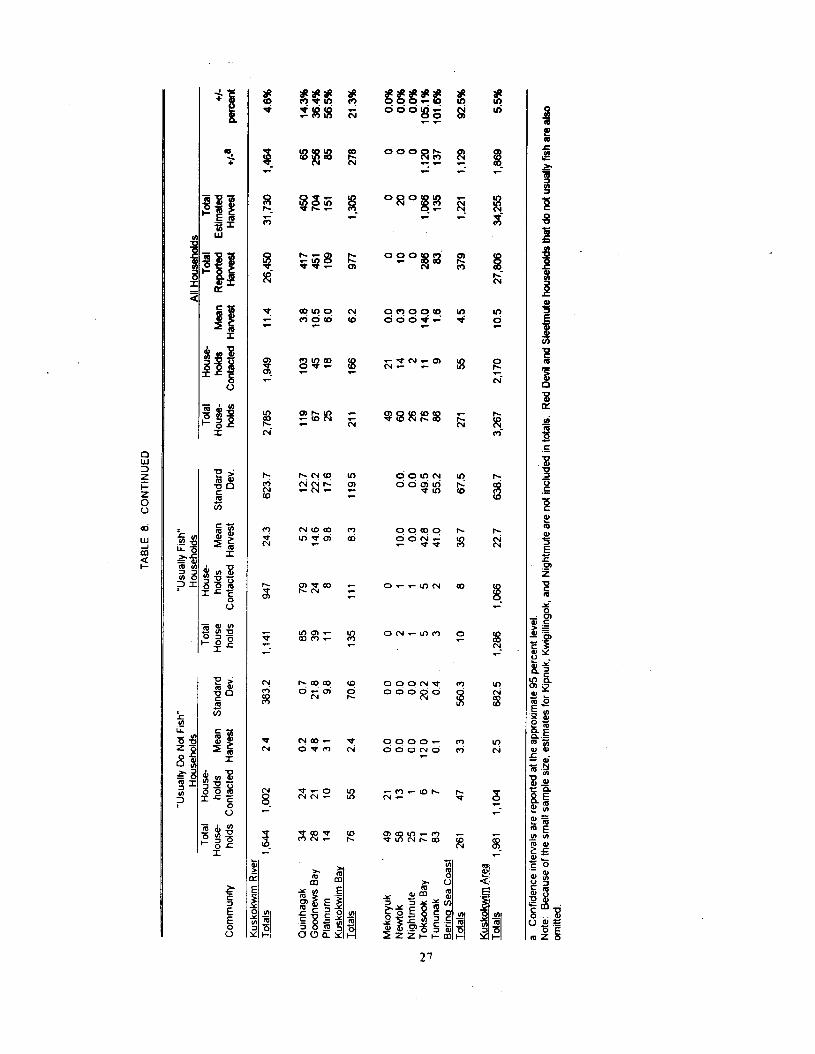
sockc\x hanest estimate (34,255) has the same rclativc precision (+/- 5.5 percent, or 1,869 fish) as the
chum salmon cstlmatc (Table 8).
. * So ~~una~es are uwd Ior h~pnuh. h\~~p~llmgA or S~ghtmu~ e Red I)c\~l and Sleetmute households that do not usually fish are also omitkd
19
Harvest estimates for the Lower Kuskokwim and Upper Kuskokwim regions had levels of
precision within 10 percent of the estimated totals. The communities of Bethel and Lime Village each
harvested over 5,000 sockeye salmon.
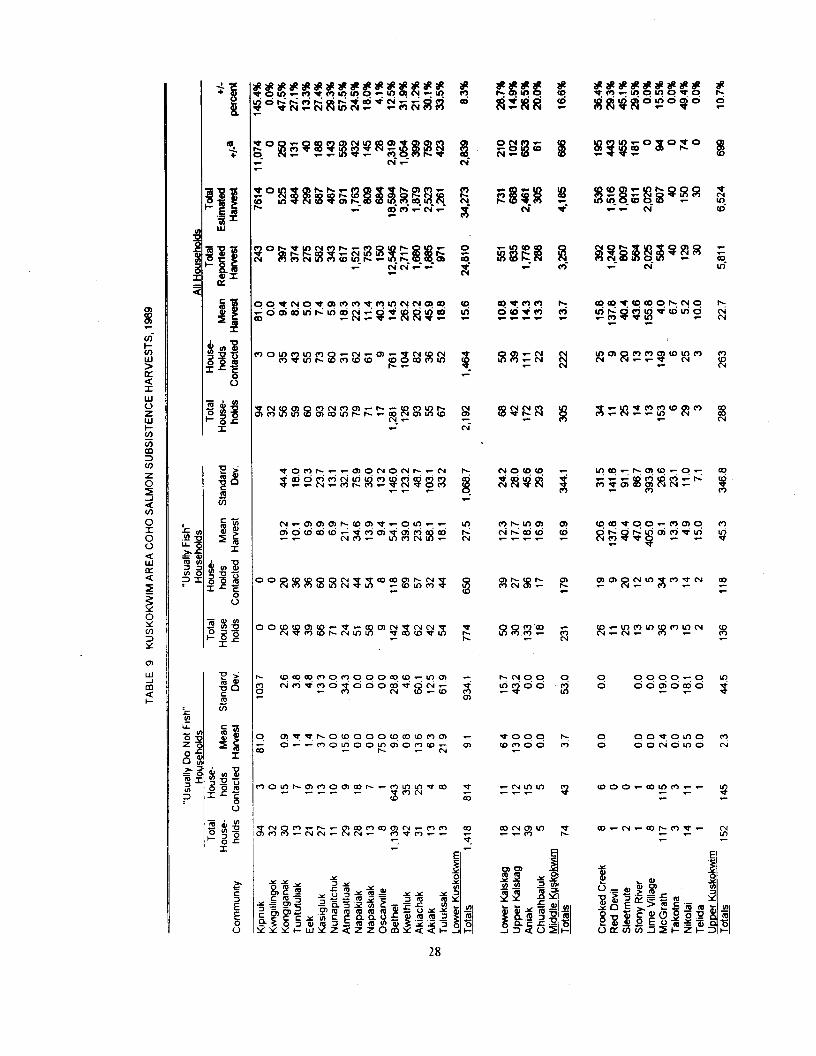
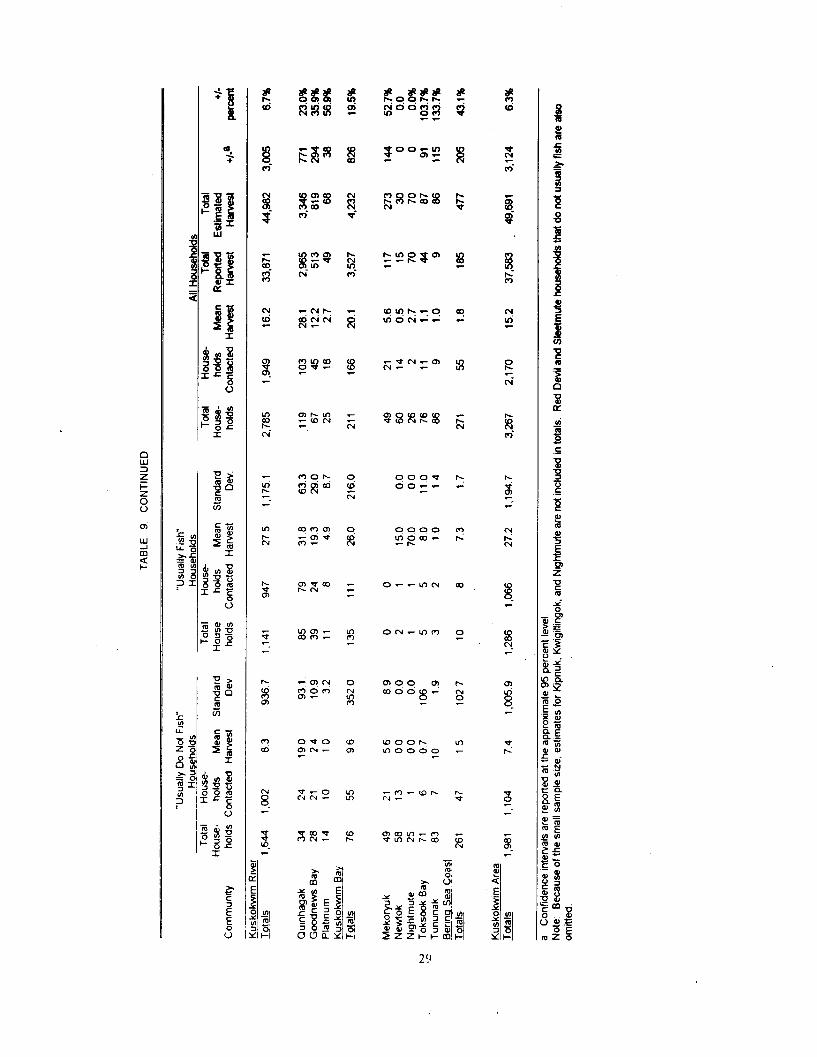
Sample information, harvest estimates, and confidence intervals by community and fishing area
for coho salmon are presented in Table 9. The 1989 harvest estimate was 49,691 coho with an
approximate 95 percent confidence interval of +/- 3,124 fish (or +/- 6.3 percent of the estimated total).
The harvest estimate for the Lower Kuskokwim region had a level of precision within 10 percent of the
estimated total. Bethel ( 18,594 fish) was the main coho salmon harvesting community.
Gear Tvpes
Several types of gear were used to harvest salmon for subsistence (Table IO). This
information was available only for those households during community visits. Based on information
from 91.3 percent (418 of 458) of the Lower Kuskokwim region households and 75.8 percent of the
households that reside along the Middle Kuskokwim region for which there was information, the
majority of the fishing households utilized drift gill nets. Set gill nets were also used by over 25
percent of the households in these areas. Note that households may have used more than one gear type
over the course of the fishing season. One household in Aniak reported using a fish wheel. Fifteen
households in Aniak. t\vo in Chuathbaluk. and four households in Kwethluk also reported the use of
rod-and-reel gear to harvest salmon.
The majority (60.6 percent) of fishing households in communities within the Upper
Kuskokwim region utilized set gill nets 01er 50 pcrccnt of fishing households in Nikolai as well as
households in Sleetmute and McGrath used rod-and-reel gear for harvesting salmon. About 17 percent
of the households ivithin the Upper Kuskok\\n-n rcgton used rod-and-reel gear. In addition, nine Upper
Kuskok\vrm rcgron households used fish \\hccls
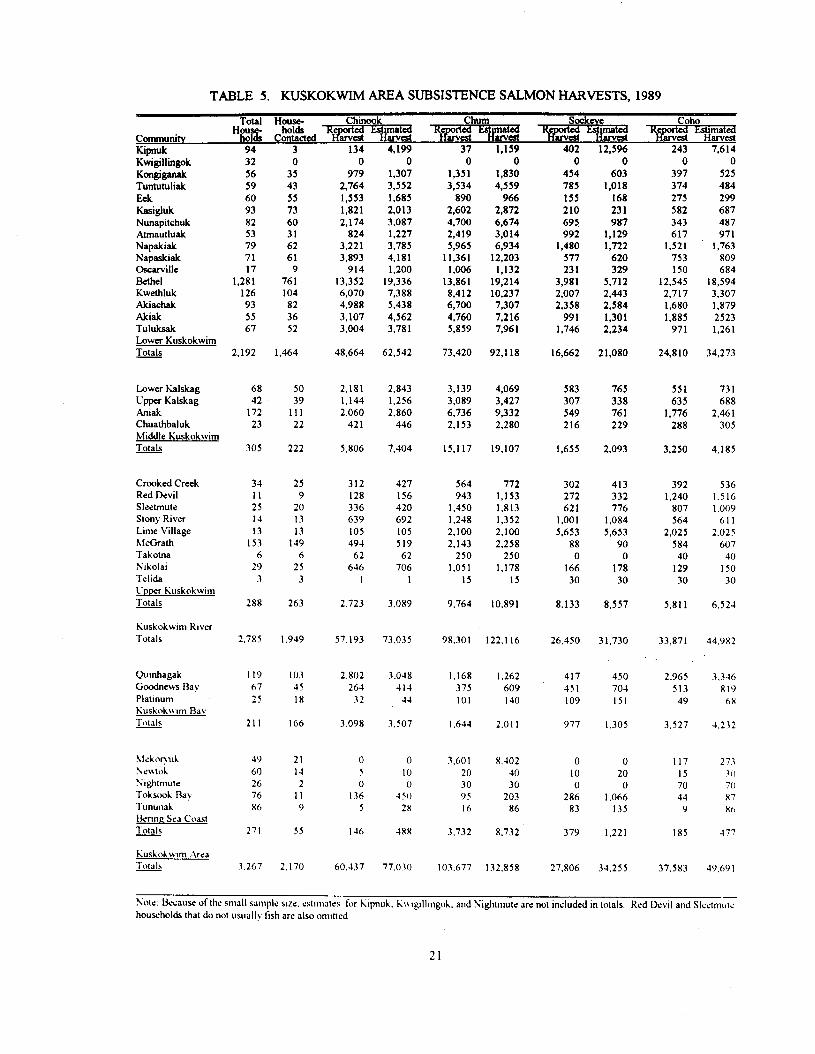
TABLE 5. KUSKOKWIM AREA SUBSISTENCE SALMON HARVESTS, 1989
Communihr Kipnuk Kwigillingok Kdganak Tuntutuliak Eek Kasigluk Nunapitchuk Atmautluak Napakiak Napaskiak Ckcarville Bethel Kwetbluk Akiachak Akiak Tuluksak Lower Kuskokwim Totals
Lower Kalskag Upper Kalskag Aniak Chuathbaluk Middle Kuskokwim *
Crooked Creek Red Devil Sleetmute Stony River Lime Village hfcGrath Takoma Nikolai Tslida l’nver Kuskokwim Totals
Kuskokwim Rover TOldIS
Qumhagah Goodnews Da! Platmum Kushokwlm Ra\ T01als
Total House- Chinook Chum Hall rted listmated R rted
hoi% ckked l%Ywst lLNcst lfEwst 94 3 I34 4,199 37 1,159 402 12.5% 243 7,614 32 0 0 0 0 0 0 0 0 0 56 35 979 1,307 1,351 1,830 454 603 397 525 59 43 2,764 3,552 3,534 4,559 785 1,018 374 484 60 55 1,553 1,685 890 966 I55 168 275 299 93 73 1,821 2,013 2,602 2,872 210 231 582 687 82 60 2.174 3,087 4,700 6,674 695 987 343 487 53 31 824 1,227 2,419 3,014 992 1,129 617 971 79 62 3,221 3.785 5,965 6,934 1,480 1,722 1,521 1,763 71 61 3,893 4,181 11,361 12,203 577 620 753 809 17 9 914 1,200 1,006 1,132 231 329 I50 684
1,281 761 13,352 19,336 13,861 19,214 3,981 5,712 12,545 18,594 126 I04 6,070 7,388 8.412 10,237 2,007 2,443 2,717 3.307 93 82 4,988 5,438 6,700 7,307 2,358 2,584 1,680 1,879 55 36 3,107 4,562 4,760 7,216 991 1,301 1,885 2523 67 52 3.004 3.78 I 5,859 7,961 1,746 2,234 971 1,261
2,192 1,464 48,664 62,542 73,420 92.1 I8 16,662 21,080 24,810 34,273
68 50 42 39
172 Ill 23 22
305 222
34 25 11 9 25 20 14 13 13 I3
153 149 6 6
29 25 3 3
288 263
2.785 I .949
119 IO3 67 45 25 IR
211 166
3,139 4,069 3,089 3,427 6,736 9,332 2,153 2,280
15.1 I7 19,107
564 772 943 1.153
1,450 1.813 I .248 1,352 2.100 2,100 2,143 2.258
250 250 1.051 1.178
I5 I5
9,764 IO.891
583 765 551 731 307 338 635 688 549 761 1,776 2,461 216 229 288 305
1,655 2,093 3,250 4,185
302 413 392 536 272 332 1,240 I.516 621 776 807 I .009
1,001 1,084 564 611 5,653 5,653 2,025 2.025
88 90 584 607 0 0 40 40
166 178 129 I50 30 30 30 30
8.133 8.557 5,811 6.524
26,450 3 1.730 33,871 44.982
417 450 2,965 3.346 451 704 513 819 I09 I51 49 6X
977 I .305 3,527 4.232
49 21 60 I4 26 2 76 II 86 9
271 55
0 0 II7 273 IO 20 I5 30 0 0 70 70
286 1.066 44 87 83 135 9 XC1
379 I.221 IX5 477
3.267 2.170
2.181 2.843 1,144 1.256 2.060 2.860
421 446
5.806 7.404
312 427 128 I56 336 420 639 692 105 IO5 494 519 62 62
646 706 I I
2.723 3.089
57.193 73.035
2.802 3.048 264 41-I 32 44
3.09R 3.507
0 0 5 I 0 0 0
136 4%) 5 28
I46 JR8
60.337 77.010
9R.30 I 122.1 I6
I.168 1.262 375 609 101 I40
I .644 2.01 I
3.60 I x.402 20 40 30 30 95 203 I6 86
3.732 8.732
103.677 132.858 27,806 34,255 37.583 49,69 I
- Nols. &cause oflhc small sample s~zc. cstmrates for I;lpnuh. h\r~g~ll~ngok. and Nightmute are not included in totals. Red Devil and Slcctnlut~ households that do not usualI! lish arc also omItted
21
0 0-0000 d d&ujdP’d
9 o-rmovo 0 ododtio
woo.-aDmm-~ - -
a3.-rJ.-aDbc)PI- c Y
oooc w 6daic-i Pi
ON-Loo 0
000~00 N ooowo k
000Q00 P 000~0 L
23
0 d
o*.-or+0 ocomdzo
') obvaiow~oommoqo 0 " ~omoomc4oowtnm~~ 0 - -
-N
ON00 0 cood m
9 O.-NOW~ 0 OONOEW
-NV)“, c-v a
woo-aDmm-- - 7
CO.-N-cDlcP,V- - 7
O.-.-i‘,N QJ
ON.-u-1(3’ 0
moor-m m ;;oo-0
2
- ~qwqowoqqm~.yo~
5 NmmODwP00-mw0~ - 7
E ~~~oovmoomwoow --o-OONOOONOU)Q~
Or.-“,N W
ON.-WC) 0
ooqoc m OOONO t-7
NY -m-wr- s
%%Wz2 2
0 d
0000-0 ” ddclidtid - P %
9 cq*.qlno m 0 OONOLOO N
woo.-(Dlno-- - c
W.-N.-WPcCOV- - 7 s:
0--Y)N
moo m a300
E-
(Door- moo00
-P-J-WP- c, -
%3ZKB
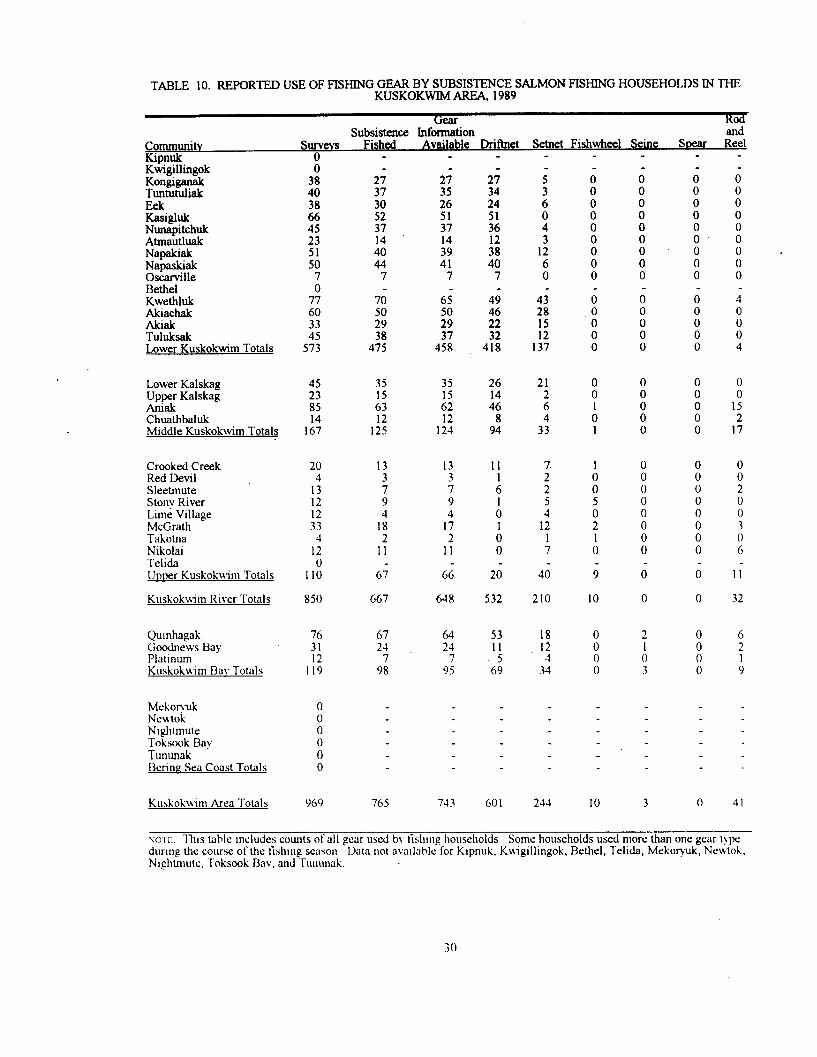
TABLE 10. REPORTED USE OF FISHING GEAR BY SUBSISTENCE SALMON FISHING HOUSEHOLDS IN THE KUSKOKWIM AREA, 1989
communitv
Rod and
Available DrifInet Setttet Fishwheel Seine Suear Reel Kipnuk 0 Ktigilliugok Kongiganak Tuututuliak Eek Kaaigluk Ntmapitchuk Atmautluak Napakiak
LZi%E Bethel Kwethluk Akiachak Akiak Tuluksak Lower Kuskokwim Totals
0
ii
2 45 23
::,
i 77 60 33
547:
- 2; 37
:s 37 14 40 44
7
70 1: 38
475
2;
:i 51 37 I4
:7 7
6;
2: 37
458
-
2;
ii
::,
if 40
7
49 46 22 32
418
- -
: 6 0 4 3
12 6 0
4; 28 15 12
137
Lower Kalskag 45 35 Upper Kalskag 23 15 AIIi* 85 63 Chuathbaluk 14 12 Middle Kuskokwim Totals 167 125
35 26
ii; :: 12 8
124 94
21
it
3':
Crooked Creek Red Devil Sleetmute Stony River Lime Village McGrath Takotna Nikolai Tel& Unner Kuskokwim Totals
20 4
I3 I2
::
I:
II:
Kuskokuim River Totals 8.50
I3
: 9
148 2
II
6;
667
13 3 7 9 4
17 2
II
66
648
11
:,
:, 1
:
20
532
7. 2 2 5
1;
:
40
210
Quinhagak 76 67 64 53 Goodnews Bay 31 24 24 II Platinum I2 7 7 5 Kuskokwim Bav Totals II9 98 95 69
18 12
3:
Mekonuk Neu~oic Ntghtmute Toksook Bay Tununak Betme. Sea Coast Totals
Kuskok\~nn Area Totals 969 765 743 601 244
0 0 0 0 0
i 0 0
0
i
ii
:
: 0
i 0 0
::
:
0
0
0 0 0 0
0
ii 0 0 0 0
i - 0
4
z 0 4
0
1: 2
17
0 0 2 0 0 3 0 6
II-
32
41
SOI t: Ttus table mcludes counts of all gear used b!, lislnng honscbolds Some households used more than one gear t!pc dunng the course of the tishmp SCLLSOII Data not avatlable for Kipnuk, Kuxgillmgok, Bethel, Telida, Mekoryuk, Newtok, N@mutc. Toksook Bay. and Tununak
30
In the Kuskokwim Bay region communities of Quinhagak, Goodnews Bay, and Platinum,
almost threequarters (72.6 percent) of the fishing households used drift gill nets to harvest subsistence
salmon, and over one-third (35.8 percent) used set gill nets. In addition to gill nets, seines and rod-and-
reel gear were used by residents of Quinhagak and Goodnews Bay for harvesting salmon.
Household Size and Number of Dogs
The post-season interviews also yielded information on household size and the number of dogs
per community (Table 11). Household size information was recorded for 943 households, however, the
number of dogs per household was not always recorded. The information on the number of dogs
represents only the reported numbers from the sample of households that fished for subsistence, fed
salmon to their dogs, and were interviewed. Unlike the estimated total salmon harvest data, the data on
dogs have not been expanded to account for households not interviewed. Therefore, the number of
dogs reported in a community should be used as a minimum estimate of the actual number.
Overall, these 943 households included 4,398 people and averaged 4.7 people per household.
Largest household sizes ivere in communities the Lower Kuskokwim region (5.1 per household) and
smallest household sizes in communities along the Upper Kuskokwim region (3.4 per household).
Harvest of Salmon For Doe Food
A total of 117 of the 948 households mtcwlc\ved reported harvesting salmon to feed 1,430
dogs (Table 12). The number of dogs o\\ncd b>’ these I I7 households ranged from 1 to 180 per
household and avcragcd 12.2 dogs More than half (59 percent) of the households harvesting salmon
for dog f&d had IO dogs or less. 30 pcrccnt had from 11 to 20 dogs, and 11 percent had more than 20
dogs. Oni>, one household reported having more than 37 dogs.
31
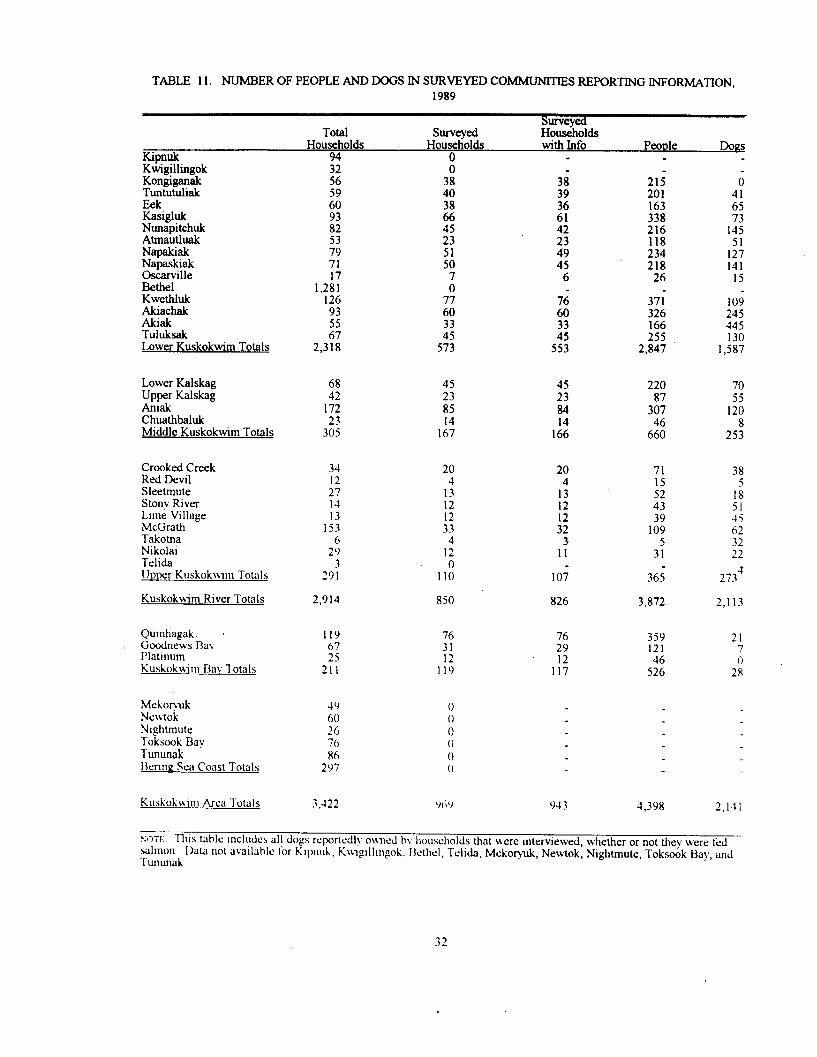
TABLE 11. NUMBER OF PEOPLE AND DOGS IN SURVEYED COMMUNTHE S REPORTING INFORMATION, 1989
Kipnuk Ktigillingok Kongiganak Tuntutuliak Eek Kasigluk Nunapitchuk Atmautluak Napakiak Napaskiak Oscarville Bethel Kwethluk Akiachak Akiak Tuluksak Lower Kuskokwim Totals
Total Households
94
Surveyed Households
0
3: 40
2: 45 23 51
bunvd Households with Info
-
:f
:: 42 23
ti! 6
PeoDle -
21; 201 163 338 216 118 234 218
26
37; 326 166 255
2,847
Dons
;;
1,2:: 126 93 55
2.3:;
50 7
7’: 60
:; 573
E ::
553
- 0
41
:: 145 51
127 141
15
109 245 445 130
1,587
Lower Kalskag Upper Kalskag Aniak Chuathbaluk Middle Kuskokwim Totals
68
147:
45 23
3::
85
1;;
;: 84
1::
Crooked Creek Red Devil Sleetmute Stony River Lime Village McGrath Takotna Nikolai Telida Unpcr Kuskok\\nn Totals
34 12 27 14 13
153 6
29
20
1;
1: 33
1: 0
20 4
::
:: 3
3 ?‘)I 110
Kuskokwtm River Totals 2,914 850
11
10;
826
71
:: 43
1%
3:
36;
3,872
38 5
18 51
2
::
273’
2,113
Qumhapak. s 119 Goodnews Bay 67 Platmum 25 Kuskokuim Rav Totals 211
76 76 31 29 12 12
119 117
359 121
5;:
Mekonuk 40 Nr\\tok
0 60 0
Nightmute 26 0 Toksook Bay 70 0 Tununak X6 0 knna Sea Coast Totals 297 0
Kuskok\~m~ Arca Totals 3.522 969 943 4,398
21
0’ 28
2,131
NOTE: .Th~s table IIK~U~CS all dogs reportail~ o\\nd hv Ilo~~sel~olds that $vere Illterviewed, wl~.&er or not thev were fed SI~IIIOII Tununak
bata not ava~lahlc Ibr K~pnuh. K\~~g~ll~ngok. 13ctl\cl, Tclda, Mekoryuk, Newtok, Nightmute, Toksook Bay, ;Ind
32
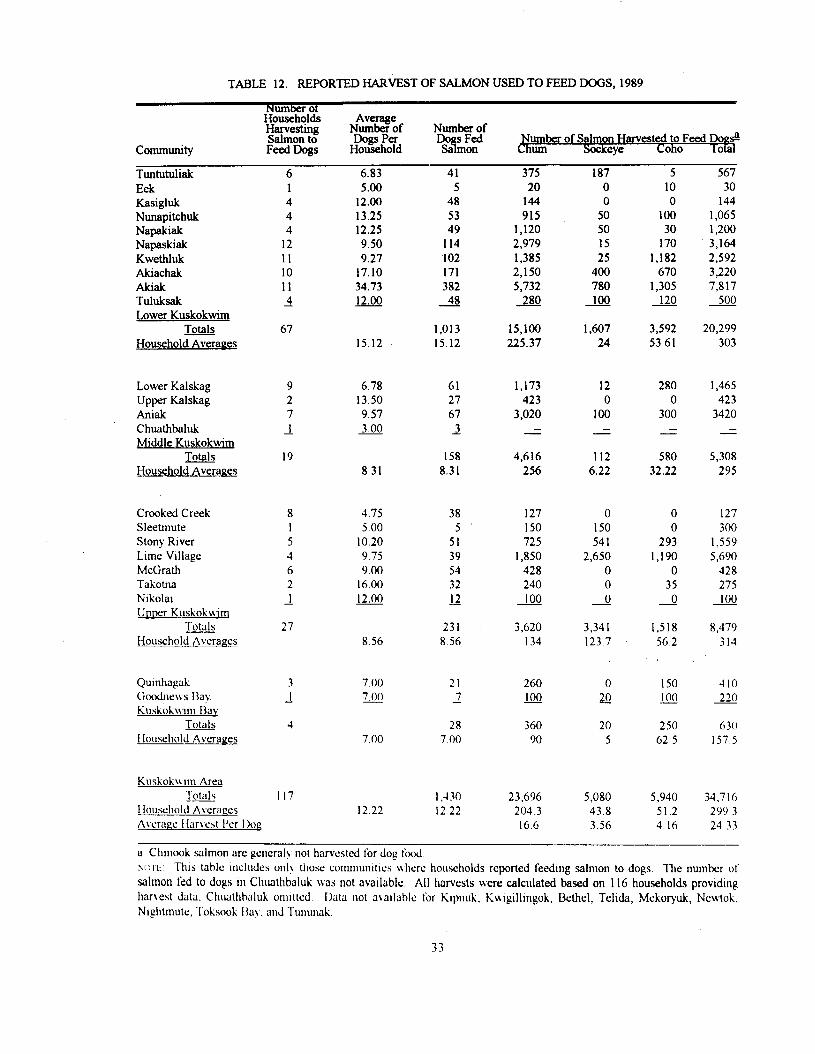
TABLE 12. REPORTED HARVEST OF SALMON USED TO FEED DOGS, 1989
community
Tuntutuliak Eek Kasigluk Nunapitchuk Napakiak Napaskiak Kwethluk Akiachak Akiak Tuluksak Lower Kuskokwim
m Household Averages
N bert Ho%hol%
!?iXfZ% N%?% f Number of
H%l% %a%:: Number of Salmon Harvested to Feed Do&
Feed Dogs um Sockeye Coho Total
375 187 5 567 6 1 4 4 4
12 11 10 11 4
67
6.83 5.00
12.00 13.25 12.25 9.50 9.27
17.10 34.73 12.00
41 5
48 53 49
114 102 171 382
48
20 0 10 30 144 0 0 144 915 50 100 1,065
1,120 50 30 1,200 2,979 15 170 3,164 1,385 25 1,182 2,592 2,150 400 670 3,220 5,732 780 1,305 7,817 JjjQ 100 JJQ 500
15.12 1,013 15,100 1,607 3,592 20,299 15.12 225.37 24 53.61 303
Lower Kalskag Upper Kalskag Aniak Chuathbaluk Middle Kuskokwim
Totals Household Averages
Crooked Creek Sleetmute Stony River Lime Village McGrath Takotna Nikolai Upper Kuskok\vlm
m Household Averages
Qumhagak Goodnews Bal Kuskokulm Bay
Totals f~ousehold Averages
Kuskok\ru~l Area u
1 louschold Averages A/l
9 2 7
1
19
8 I 5 4 6 2
1
27
3 _I
4
117
6.78 61 1,173 13.50 27 423 9.57 67 3,020
3.00 3 -1
12 0
100
280 0
300 z
1,465 423
3420
8.31 158 4,616 112 580 5,308
8.31 256 6.22 32.22 295
4.75 38 127 0 0 127 5.00 5 150 150 0 300
10.20 51 725 541 293 1,559 9.75 39 1,850 2,650 1,190 5,690 9.00 54 428 0 0 428
1600 32 240 0 35 275 12.00 12 J&l 0 0 100
8.56 231 3,620 3,341 1,518 8,479
8.56 134 123.7 56.2 314
7 00 700
7.00
12 22
21 2
28 7 00
1,430 12 22
260 0 150 410 loo 20 100 220
360 20 250 630 90 5 62.5 157.5
23,696 5,080 5,940 34,716 204.3 43.8 51.2 299 3 16.6 3.56 4.16 24 33
a Chmook salmon are generaly not harvested for dog food SWI: 1111s tahlc mcludrs only those commumtlcs \\hrre households reported feeding salmon to dogs. The number of salmon fed to dogs in Chuathbaluk \vas not avaJable. All harvests ivere calculated based on 116 households providing hanest data, Chnlathhaluk onnttrd Data not ava~lahlc I‘or Kipnuk, K\vlgillingok, Bethel, Tel&, Mekoryuk, Newtok, N~ghtmute. l’ohok Ha!, and ~I‘ununak.
33
Among households that reported feeding salmon to dogs, the fewest average number of dogs
per household (7.0) was in the Kuskokwim Bay region and the largest number of dogs ( 15.12 per
household) was in the Lower Kuskokwim region. Households in the Middle and Upper Kuskokwim
regions that fed salmon to dogs averaged approximately 8 dogs per household.
A total of 23,696 chum salmon, 5,080 sockeye, and 5,940 coho salmon were harvested for
dogs by 116 of these households. One household which reported feeding salmon to dogs could not
provide an estimate of the number of salmon used. Household harvests of chum salmon ranged from 0
to 1,500 and averaged 204.3 fish per household. Harvests of sockeye ranged from 0 to 500 fish per
household, averaging 43.8 salmon. Coho harvests ranged from 0 to 333 fish per househ.old with an
average of 5 1.2
On the average, households in the Upper Kuskokwim region harvested more sockeye salmon
for dog food than households in the other regions. This was primarily due to the harvest by households
in Lime Village; only three of the seven communities in that region reported harvesting sockeye salmon.
Average household harvests of chum salmon were largest in the Middle Kuskokwim region, however,
households in the Lower Kuskokwim region also harvested significant numbers of chum salmon.
Average household harvests of coho salmon to feed dogs was greatest in the Kuskokwim Bay region,
followed by the Upper Kuskokwim and the Lower Kuskokwim regions. Overall, among households in
the Kuskokwim Area that harvest salmon for dog food, households averaged 299 salmon harvested for
that purpose.
DISCUSSION
ComDarlson of I989 and Previous Harvest Estimation Methods
The nc\vl\ dc\xlopcd estimation method used in 1989 improved the harvest estimates
compared to the methodolog!, used in previous !‘ears. This was determined by applying the previousl>
used mcthodolog to the 1989 data and comparing the results (Table 13). The old methodology would
31
have first estimated the total number of fishing households in a community based on the proportion of
households whose salmon harvest activity was known and then would have estimated the total harvest
by applying the average harvests of the known fishing households across the estimated total number of
fishing households. This comparison showed, overall, that the previous method would have
overestimated salmon harvests significantly. The reason that the pre-1989 statistical methods
overestimated the 1989 harvests may be due to the overemphasis of fishing households in the reporting
of 1989 harvest information. That is, a higher fraction of households in the sample were found to have
fished, which may be the result of targeting fishing households during community surveys and the
higher return rates for salmon catch calendars and post-season postcards by households that “usually
fish.”
1989 Freuuencv of Harvests for Fishing Households
Harvest levels for households that “usually fish” were grouped into ranges for each species.
Data are presented only for households that actually reported fishing. In 1989, chinook salmon
harvests ranged from 0 to over 380, although this varied among regions of the Kuskokwim River,
Kuskokwim Bay, and Bering Sea coast (Figures 3 through 7 ). Except in the Bering Sea Coast region,
the majority of fishing households reported harvesting. Among households that did harvest chinook,
between I and I9 chinook were the usual number,
The estimated number of chum salmon harvested was almost as large (83 percent) as the
number of all other species of salmon hamcsted combined. Nevertheless, significant numbers of
households in the Middle Kuskoklvim and Kuskokwim Bay regions did not harvest this species
(Flgurcs 8 through I2 ). Households that harvcstcd chum salmon commonly harvested between 1 and
49 chum salmon. A few households m the Louver, Middle, and Upper Kuskokwim regions each
hamestcd over 950 chum salmon.
The majority of fishing households harvesting sockeye salmon caught between 1 and 49 such
salmon. howcvcr. slgniticant numbers of households in each study area did not harvest this species
35
(Figures 13 through 17). Only in the Upper Kuskokwim region (Lime Village) did households report
harvests greater than 400 sockeye salmon. Reportedly, sockeye salmon are not abundant upriver from
the community of Stony River and may not be available to many fishing households in the Upper
Kuskokwim region. Coho salmon harvests ranged from 1 to over 380 salmon per household (Figures
18 through 22 ). Significant numbers of households in each study area did not harvest coho.
36
250
f 200
i v)
1 150
0 0 1 20 40 60 80 100 120 140 160 180 200 220 240 260 280 300 320 340 360 360+
NUMBER OF CHNOOK HARVESTED
ig. 3. Frequency of the reported chinook salmon harvested for subsistence use by households in the Lower Kuskokwim region
ii 2 60
@
f 40
E;
I 20
0 I Ill 111L-- ------ 0 1 20 40 60 80 100 120 140 160 160 200 220 240 260 260 300 320 340 360 360+
NUMBER OF CHNOOK HARVESTED
1
Fig. 4 Frequent of the rcportcd chinook salmon hantested for subsistence use by households in the Middl Kuskok\vlm rcglon
e
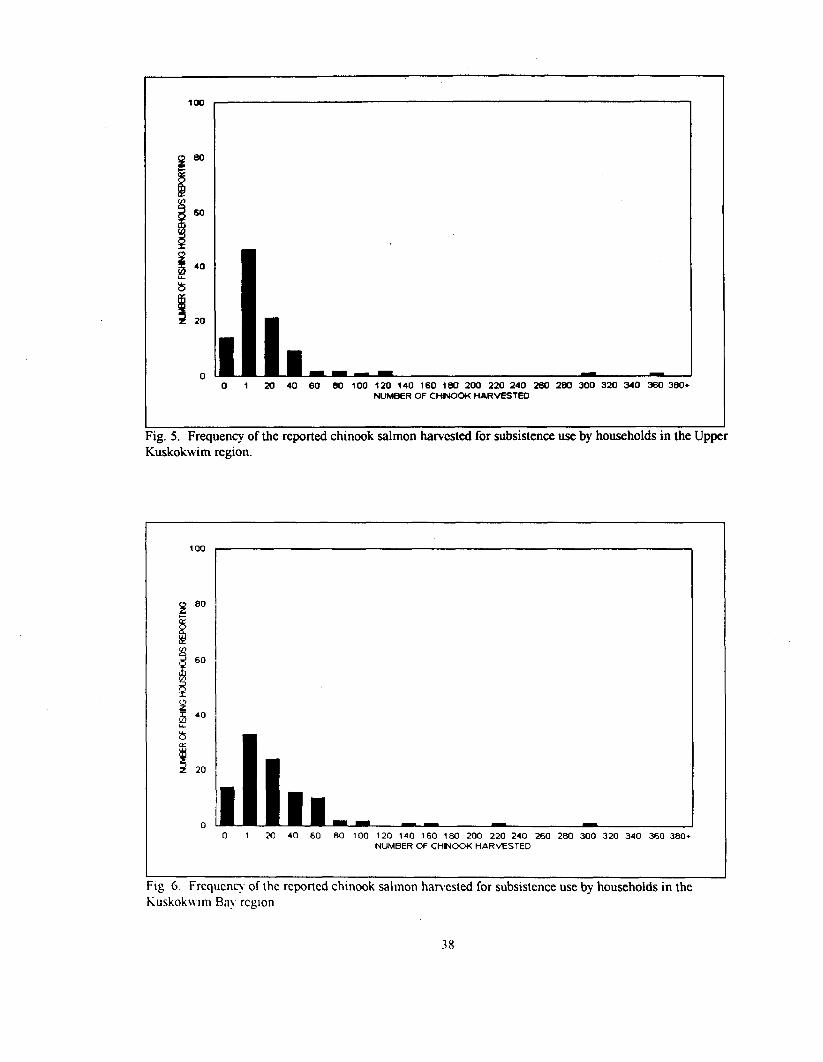
Fig. 5. Frequency of the reported chinook salmon harvested for subsistence use by households in the Upper Kuskokwim region.
0 0 1 20 40 60 00 100 120 140 160 180 200 220 240 260 280 300 320 340 360 300*
NUMBER OF CHNOOK HARMSTED
0 0 1 M 40 60 80 100 120 140 160 180 200 220 240 260 260 300 320 340 360 380+
NUMBER OF CtiNOOK HARVESTED
Fig. 6 Frequency of the reported chinook salmon harvested for subsistence use by households in the Kuskok\\ lm B+ rcglon
38
50
f 40 I2 v) I 30
it 20
b J 10
0
Fig. 7. Frequency of the reported chinook salmon harvested for subsistence use by households in the Bering Sea Coast region.
I 0 1 20 40 60 60 lm 120 7 40 160 160 200 220 240 260 260 300 320 340 360 360~
NUMBER OF CWNOOK HARVESTED
39
350
P 290
ii
I
i 210
$
Ii! 140
b
!I 70
o- I L
0 1 so 100 150 am 250 300 350 400 450 500 550 600 650 7m 750 800 850 900 QSO+ NUMBER OF CHUM HARVESTED
ig. 8. Frequency of the reported chum salmon harvested for subsistence use by households in the Lower Kuskokwim region.
0 1 50 100 1 SO 200 250 300 350 400 49 500 550 600 650 7M 750 800 850 900 950+ NUMBER OF CWJM HARVESTED
FIN. 0. Frcqucnn of the reported chum salmon hancstcd for subsistence use by households in the Middle Kuskokwim region.
0 1 SO 100 150 200 250 300 350 400 450 500 550 6W 650 700 750 800 850 900 95-O+ NUMBER OF CHUM HARVESTED
ig. 10. Frequency of the reported chum salmon hanested for subsistence use by households in the Upper Kuskokwim region.
100
g *O
!l z
f
60
$ 40
ii
!I 20
0 0 1 M 100 150 XC 350 300 350 400 450 500 550 600 ES0 700 750 800 850 900 950+
NUMBER OF CHUM liARVESTED
Fig. I I Frcqucnq of the rcportcd chum salmon hanxstcd for subsistence use by households in the Kuskoku Irn Bay region
50
tl 40
il v)
I 30
,
4 20
E
! 10
ig. 12. Frequency of .the reported chum salmon harvested for subsistence use by households in the Bering Sea
0 1 so 100 is0 200 25x3 300 350 400 450 500 550 600 650 700 750 800 850 9m 9so+ NIJABER OF CHUM HARVESTED
Coast region.
42
450
i!i 100
ii
J 90
0 0 1 so 100 i so 2m 250 300 350 400 450 so0 550 600 650 7m 750 800 850 900 950+
NUMBER OF SOCKEYE HARVESTED
ig., 13. Frequency of the reported sockeye salmon harvested for subsistence use by households in the Lower Kuskokwim region.
100
0 -
0 1 SO 100 150 200 250 300 350 400 450 500 550 EdlO 650 700 750 800 850 900 950+ I NUMBER OF SOCKEYE HARVESTED
Fig 14. Frcqucncy of the reported sockeye salmon hanrestcd for subsistence use by households in the Middle Kuskokwlm rcglon.
13
im
0 0 1 50 im I 50 2m 250 3m 350 4ec1 450 500 550 en0 650 700 750 em asn 900 950+
NUMBER OF SOCMEYE HARVESTED
ig. 15. Frequency of the reported sockeye salmon harvested for subsistence use by households in the Upper Kuskokwim region.
0 1 50 100 I 50 200 250 300 350 400 450 500 550 600 650 700 750 800 es0 900 950~ NUMBER OF SOCKEYE MARVESTED
ig. 16. Frcqucncy of the rcportcd sockeye salmon harvcwd for subsistence use by households in the Kuskok\\ im Bay rcglon.
so
e 40
Is In
t
30
E 20
B
I! 10
0
‘ig. 17. Frequency of the reported sockeye salmon harvested for subsistence use by households in the Bering
0 1 50 im 150 200 250 300 350 400 450 so0 sso 6rn 660 700 750 600 660 Sal 950+ NUMBER OF SOCKEYE HARVESTED
Sea Coast region.
350
f 260
E ln
1 210
ii 140 L
8
f 70
0 0 1 20 40 60 60 100 120 140 160 180 200 226 240 260 280 300 320 340 360 360+
NJhBER OF COHO HARVESTED
‘ig. 18. Frequency of the reported coho salmon harvested for subsistence use by househo&is in the Lower Kuskokwim region.
100
g 8o
iz .
m 60 I
3
o- 0 1 20 40 60 80 100 120 140 160 160 200 220 240 260 260 300 320 340 360 360+
NUMBER OF COHO HARVESTED
Fig 19. Frcqucncy of the reported coho salmon hnrvcstcd for subsistence use by households in the Middle Kuskokwim rcglon.
46
60
0 0 1 20 40 60 60 1M 120 140 160 160 200 220 240 260 260 300
.-_ 320
_.- _-- --- 340 380 360+
NUMBER Of-- COHO HARVESTED
ig. 20. Frequency of the reported coho salmon harvested for subsistence use by households in the Upper Kuskokwim region.
” 1 am 40 60 80 la 120 140 160 160 200 220 240 260 260 300 3,~ ~4” ,DU JO”+ NUMBER Of COHO HARVESTED
lg. 2 I Frcqucncs of the rcportcd coho salmon hanwcd for subsistence use by households in the Kuskokwm Bn!, rigIon.
47
E 20
8
10
0 I
0 1 20 40 60 60 100 120 140 160 160 200 220 240 260 260 300 320 340 360 360+ NUMBER OF COHO HARVESTED
rg. 22. Frequency or the reportea coho salmon nawestea ror swslstence use oy nousenow in the Benng Sea Coast region.
Subsistence Harvest Levels. 1980-89
Subsistence salmon harvests for Kuskokwim River drainage communities have been estimated
since 1960 by the Alaska Department of Fish and Game. Through 1985, harvests were reported for
chinook salmon and “other” or “small” salmon. “Small” salmon have been described as mostly chum,
with lesser numbers of sockeye, pinks and small chinook. Tables 14 and 15 present chinook and small
salmon harvest estimates for the period 1980 through 1989.
Prior to 1989, the total estimated chinook salmon harvest for communities throughout the
Kuskokwim Area have ranged from nearly 45,661 in 1985 to 67,000 in 1987. The 1989 harvest
estimate for chinook salmon (77,030) exceeds the previous high harvest by nearly 8,000 fish. The
1989 harvest estimates were also the highest estimates in Lower Kuskokwim and Upper Kuskokwim
regions. “Small” salmon harvest estimates have ranged from 98,220 in 1987 to 190,011 in 1982. The
1989 harvest estimate (153,846) is the highest estimate since 1982.
During 1989, the increased effort to document households and categorize each into “usually
fish” or “usually do not fish” significantly increased the number of households that were known to have
fished for salmon for subsistence purposes in the Kuskokwim Area (Table 16). In 1989, over 1,500
households were determined to have fished compared to 969 households identified as fishing in 1988.
The greatest increase in the number of households that fished occurred in the Lower Kuskokwim
region, inhere there ivas an increase of over 400 households. That increase was primarily due to the
increase in the number of Bethel households that uere found to have subsistence fished and were added
to the database.
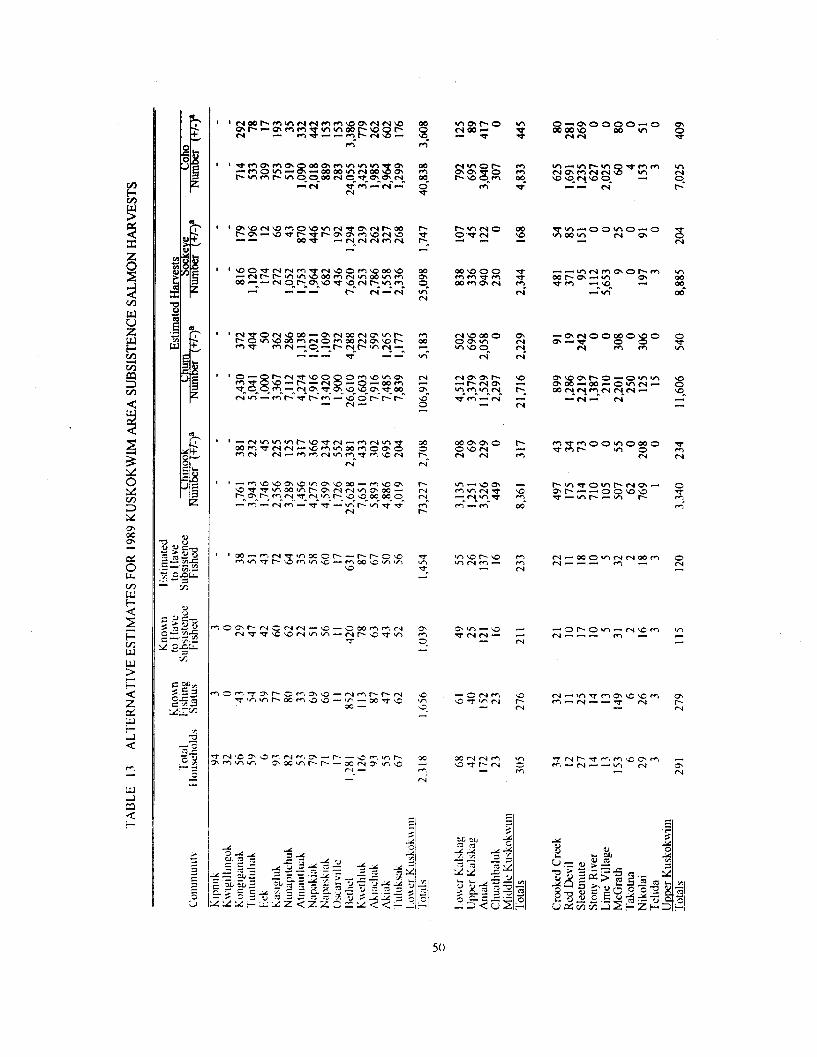
r
:i
50
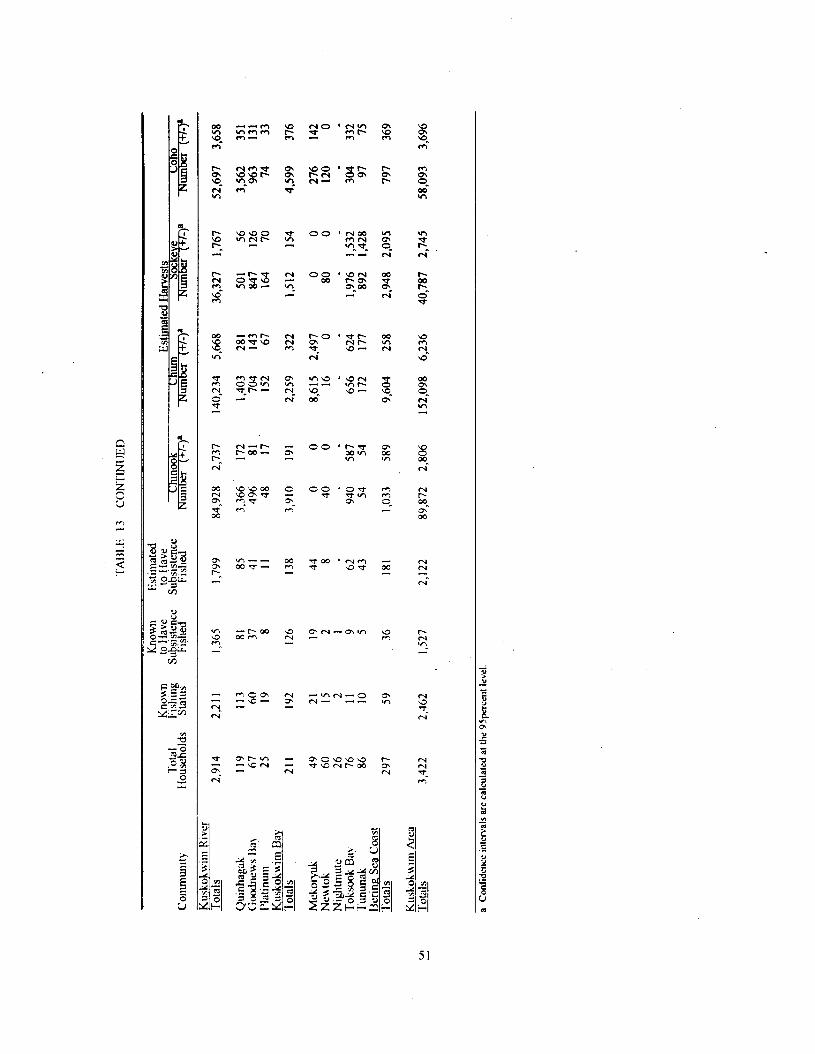
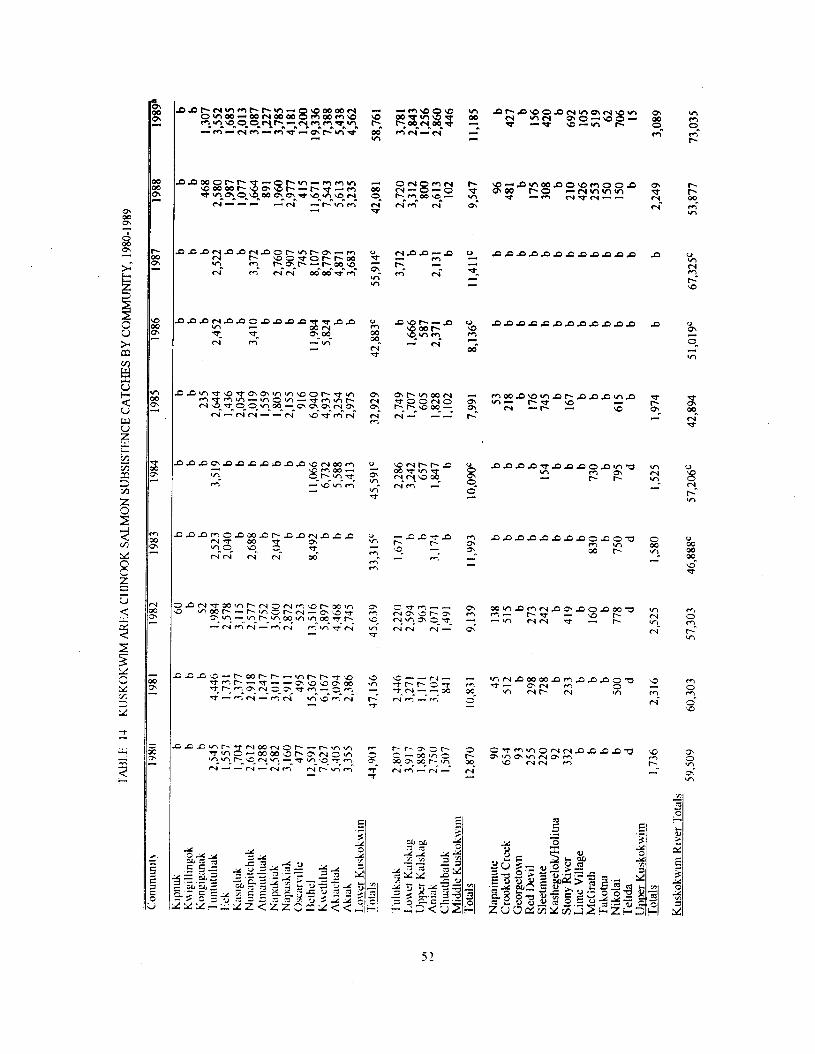
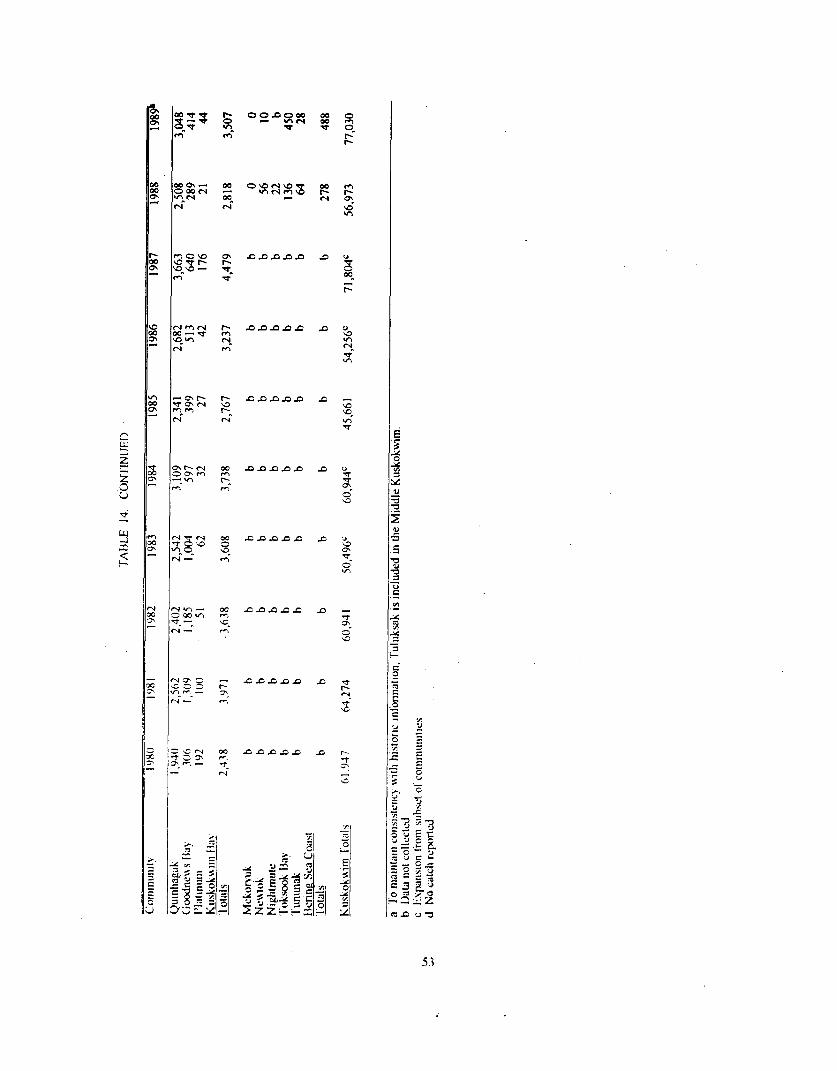
”
F
SDDDD D 0
5.1
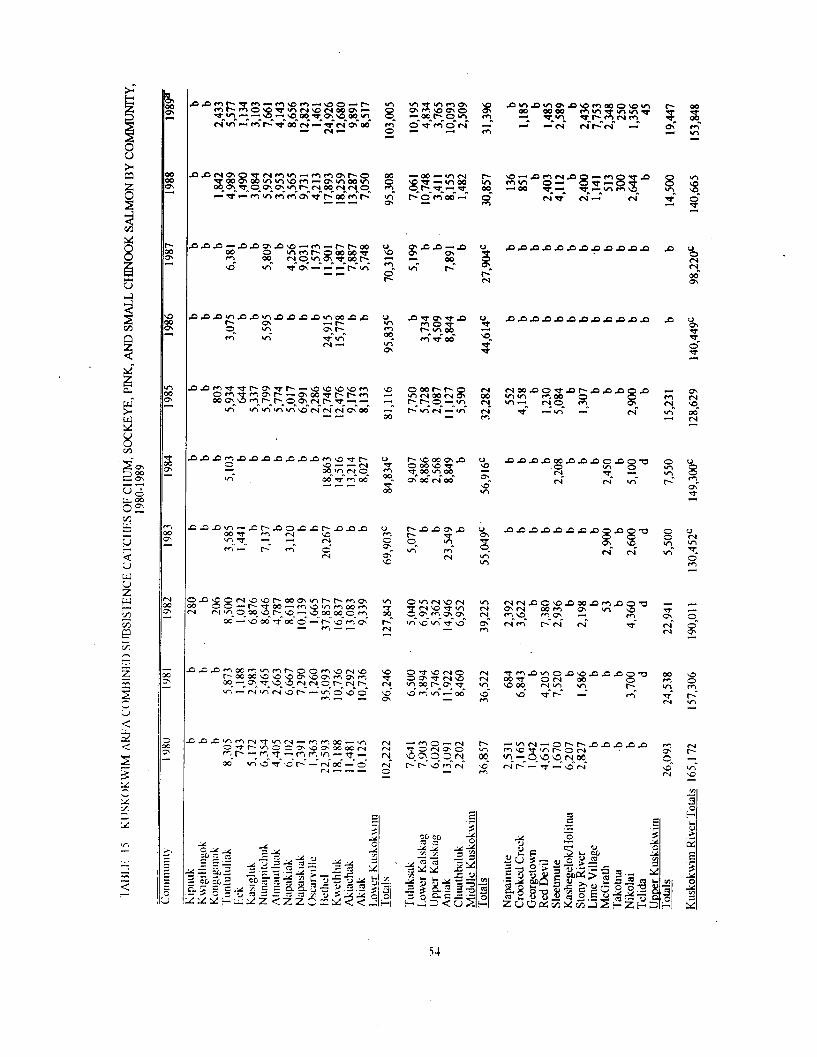
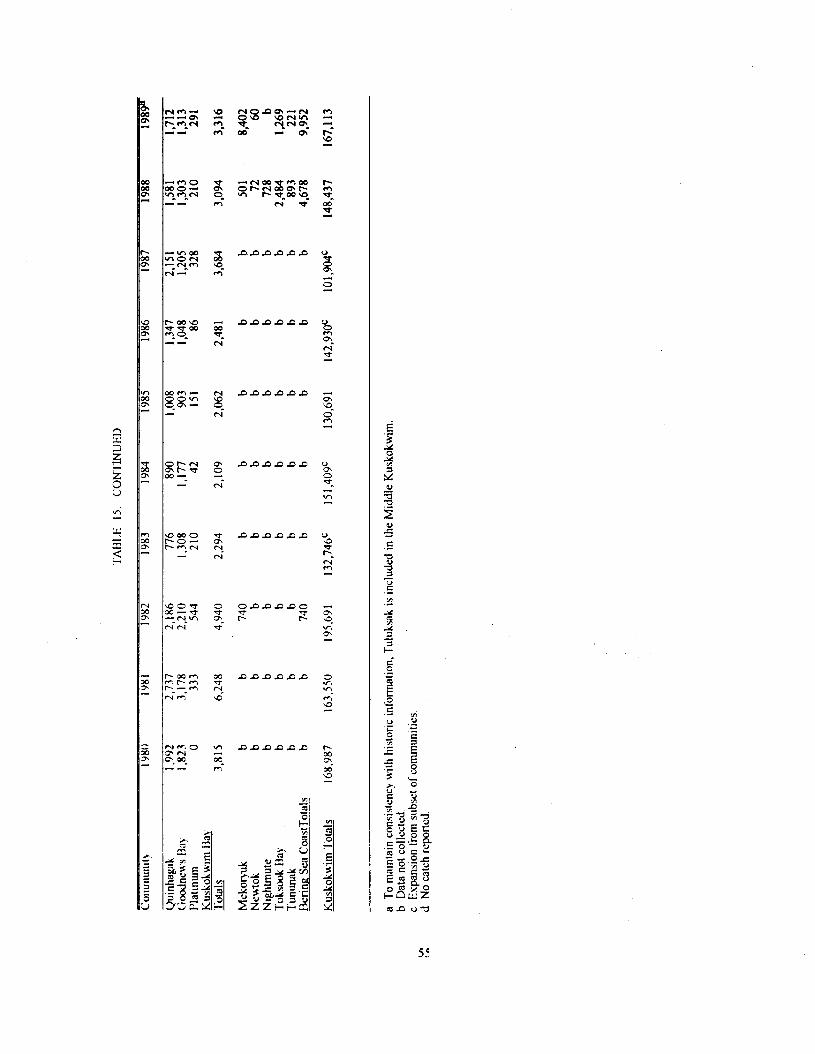
-U”lOe z!gz
D.DDDDD 0
d-^ r-y
E;
DDDDDD U.
a
G
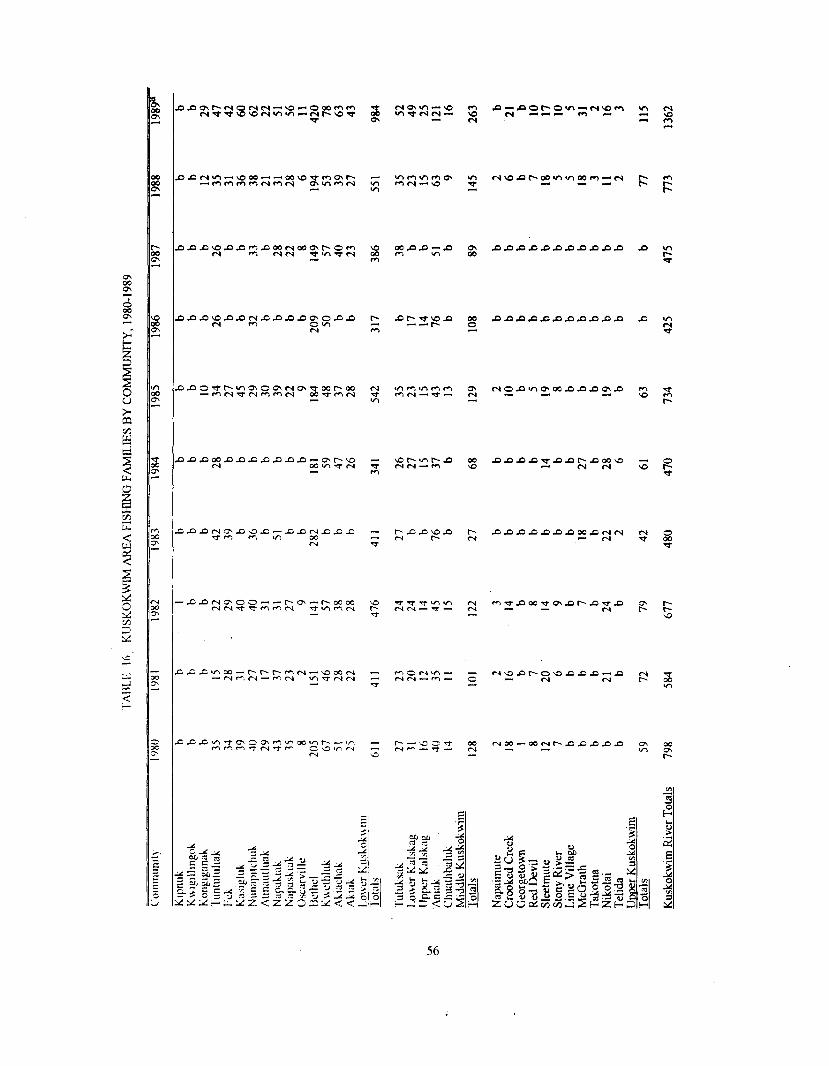
zDDs;D E
DDDDDDDDDDD
r Dz,sgD 8 DDDDDDDDDDD w-l
- zDD$D 2
DDDDDDDWD$m
v
56
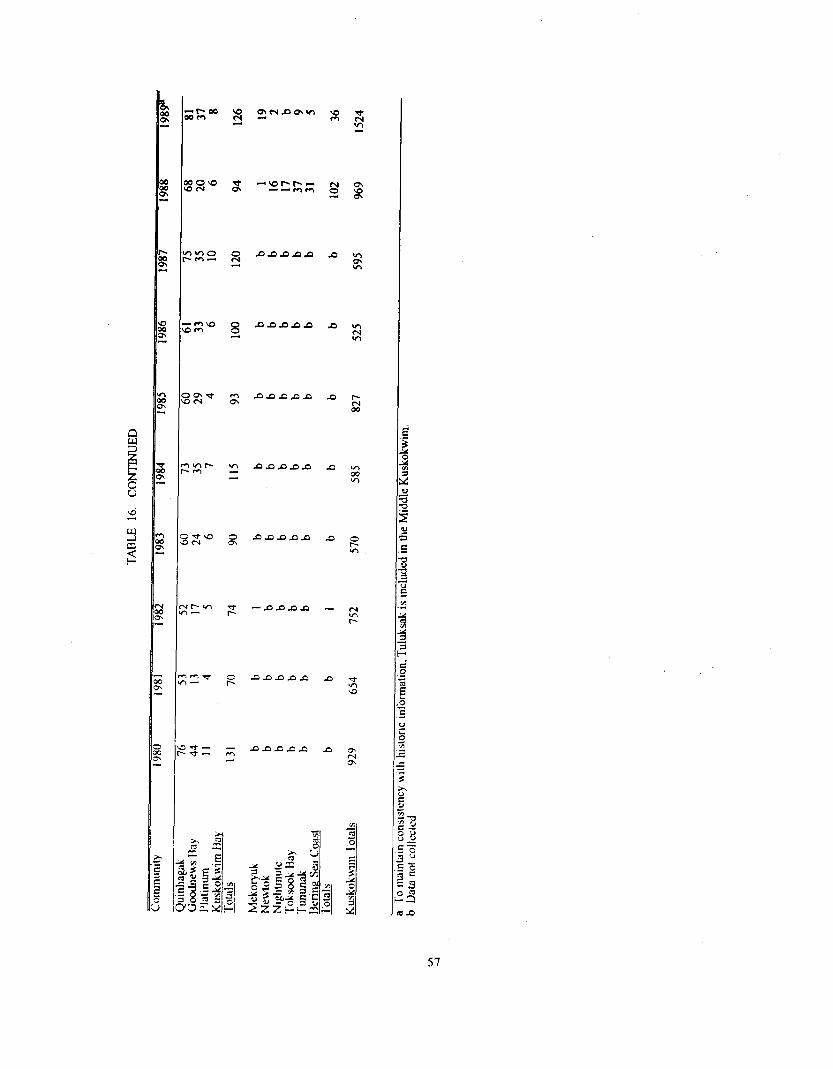
DDDDD 5 2 m
DDDDD 5
:
DDDDD 5 Ki 00
DDDDD -0
2
DDDDD n
E
-DDDD -
2
DDDDD D 5
CONCLUSION
Salmon harvest statistics are essential for fisheries management purposes and are of
ever-increasing importance in the applied social and biological sciences. The harvest of
salmon in the Kuskokwim Area has been and continues to be important both in the subsistence
economy and also in the market economy. Subsistence and commercial fishermen, often the
same individuals, share a real interest in the maintenance of the sustained yield of salmon
stocks in the Kuskokwim Area. This can be accomplished best when there are reliable data on
the biological status of salmon stocks and adequate social science information including
subsistence harvest data.
The Kuskokwim Fisheries Management Area is large. Communities which depend
upon the harvest of salmon for subsistence are situated throughout the Kuskokwim River
drainage, along Kuskokwim Bay, and along the Bering Sea coast. In 1989, there were over
3,400 households in these communities, most of which use salmon for subsistence. Although
not all households actively participated in harvesting salmon, many were directly involved in
cutting and processing the fish and in distributing the finished products to other households. It
was important to identify all households involved in subsistence salmon production and, to the
degree possible, households given salmon in order to arrive at subsistence salmon use
information at the household level.
Overall, the methodology developed and used in 1989 provided very reliable estimates.
The estimated 1989 subsistence hanest \vas 77,030 chinook, 132,858, chum, 34,255 sockeye,
and 49,691 coho salmon. Because of the relatively low harvest of pink salmon, data on this
spccics were not collected. The degree of reliability \vas greater for some salmon species
hancstcd and for certain fishing areas than for others. Levels of confidence for estimated total
salmon hancst was ~lthln 6.5 pcrccnt of the estimated totals.
The applxation of a refined methodology in 1989 demonstrated the importance of
hai,mg a current list of households that “usualI!, fish” and that “usually do not fish” and the
58
need to contact households during community visits a.& the fishing season. Because the
estimate was derived from a sample of households (those that could be contacted or who
returned their catch calendar or postcard, regardless of whether they were in the “usually fish”
or “usually do not fish” category), it was critical to be able to accurately describe both the
population from which the sample was selected and the sample itself. Secondly, the best
means for recording harvests came from staff visits to the communities and household
interviews, rather than from returned catch calendars or harvest postcards. However, the post-
season reminder postcard was an efficient and cost-effective method of contacting households
that were not likely to have fished for subsistence salmon.
The success of the revised methodology resulted from the derivation of a statistically-
valid sample and the emphasis on household interviews for collecting harvest data. The broad-
based approach of personally contacting most households which fished for salmon also
contributed to the reliability of the data. Household members voluntarily answered a series of
questions about their fishing activities and were also interested to learn of the effort to improve
subsistence harvest estimates. Higher overall harvest levels for 1989 are primarily a result of
the concerted and increased effort expended to identify and contact households, conduct
thorough field surveys during October or November after salmon fishing was completed and
households had returned from fall moose and caribou hunting activities, do not necessarily
represent any significant increases in harvest, harvest effort, or use of salmon for subsistence.
In the future, using a sampling method \ihich accommodates the dynamism in fishing
participation by maintaining current household lists \vill help insure that all fishing households
\vill be contacted for harvest information. Fmally, the improved accuracy of the subsistence
harvest estimate can go a long way totyard bringing together salmon harvesters, users, and
fishen, managers through a mutual appreciation of the relevance of accurate subsistence
harvest data in managing and allocatmg the salmon resource.
59
REFERENCES
Alaska Department of Fish and Game 1960- 1965 Annual Report Arctic-Yukon-Kuskokwim Area. Division of Commercial Fisheries.
Anchorage.
1983-1988 Annual Management Report, Kuskokwim Area. Division of Commercial Fisheries. Anchorage.
Cochran, William G. 1977 Sampling Techniques. New York: John Wiley & Sons.
Coffing, Michael W. 1991 Kwethluk Subsistence: Contemporary Land use Patterns, Wild Resource Harvest and
Use, and the Subsistence Economy of a Lower Kuskokwim River Area Community. Appendix 4. Division of Subsistence, Alaska Department of Fish and Game, Juneau, Technical Paper No. 157.
Walker, Robert J. and Louis Brown 1988 Historic Subsistence Salmon Harvest Catalog. Data Management and Biometrics,
Division of Subsistence, Alaska Department of Fish and Game, Anchorage.
60
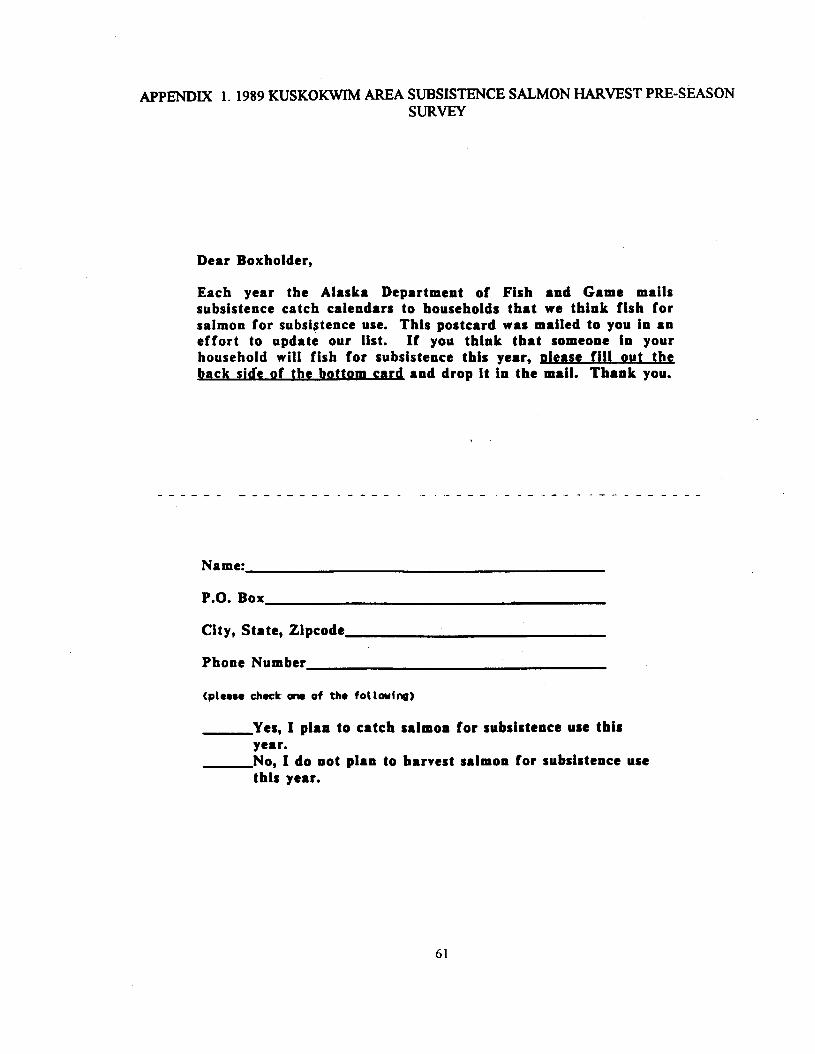
APPENDIX 1.1989 KUSKOKWIM AREA SUBSISTENCE SALMON HARVEST PRE-SEASON SURVEY
Dear Boxholder,
Each year the Alaska Department of Fish and Game mails subsistence catch calendars to households that we think fish for salmon for subsistence use. This postcard was mailed to you in an effort to update our list. If you think that someone in your household will fish for subsistence this year, be fill out the back side of the bottom & and drop It in the mail. Thank you.
Name:
P.0. Box
City, State, Zipcode
Phone Number
Yes, I plan to catch salmon for subsistence use this year. No, I do not plan to harvest salmon for subsistence use this year.
61
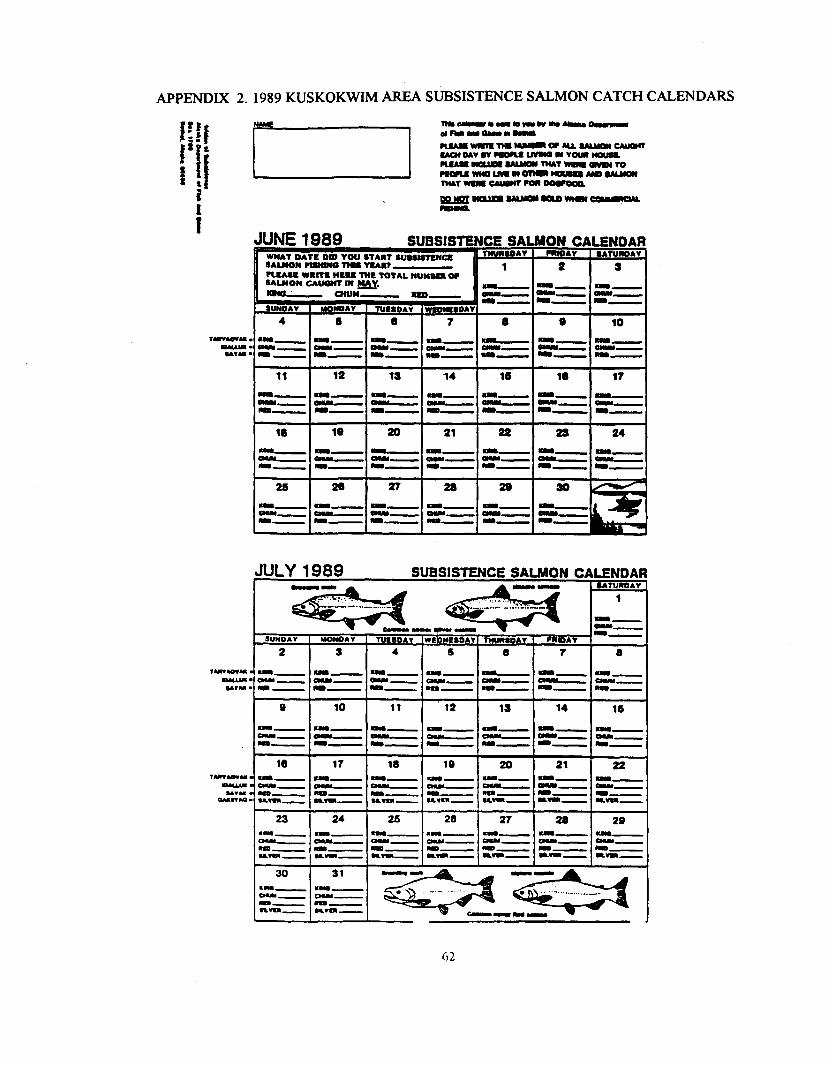
APPENDIX 2.1989 KUSKOKWIM AREA SUFJSISTENCE SALMON CATCH CALENDARS
TlW-NWWVMkkUU-
JUNE 1989 WNAt DATE DW YOU eAuoN-nmc PUAEL wwtc neec 1 lluoll CAuwn IN g lplQv OWN.
11 12 -m OI- 011m wmm- mm m- T 12 10 -m -- -- m- m-
0 I
10
-- u- -- ou- I mm- m-
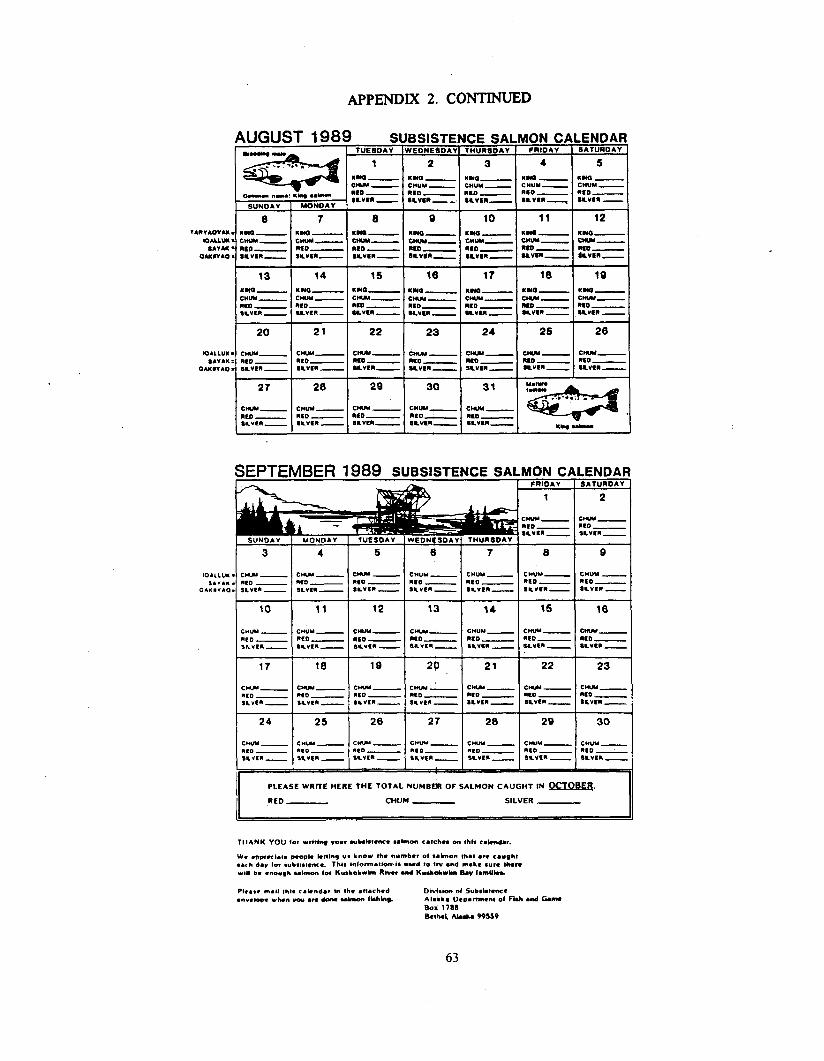
APPENDIX2 CONTINUED
,ENDAA SATUROAV
5 “YQ- C”“Y - “to - Nl.“I” -
BSISTENCE SAl “EONESOAVI THURSDAY
11 ""a- CWUN - E,?:",,r
12 "ma- sum- MD- frvw-
25
,ENDAR SEPTEMBER 1989 SUBSISTENCE SAI MON Cl FRIDAY
1
8
WV”- “IID - *““I”-
10 I
11 I
12 15
CW- "CD - WYC" -
22
EW- "LO - s."t" -
PLEASE WRtlE HERE THE TOTAL NUMBE’R OF SALMON CAUGHT IN WOE&
RED - CHVM- SILVER -
63
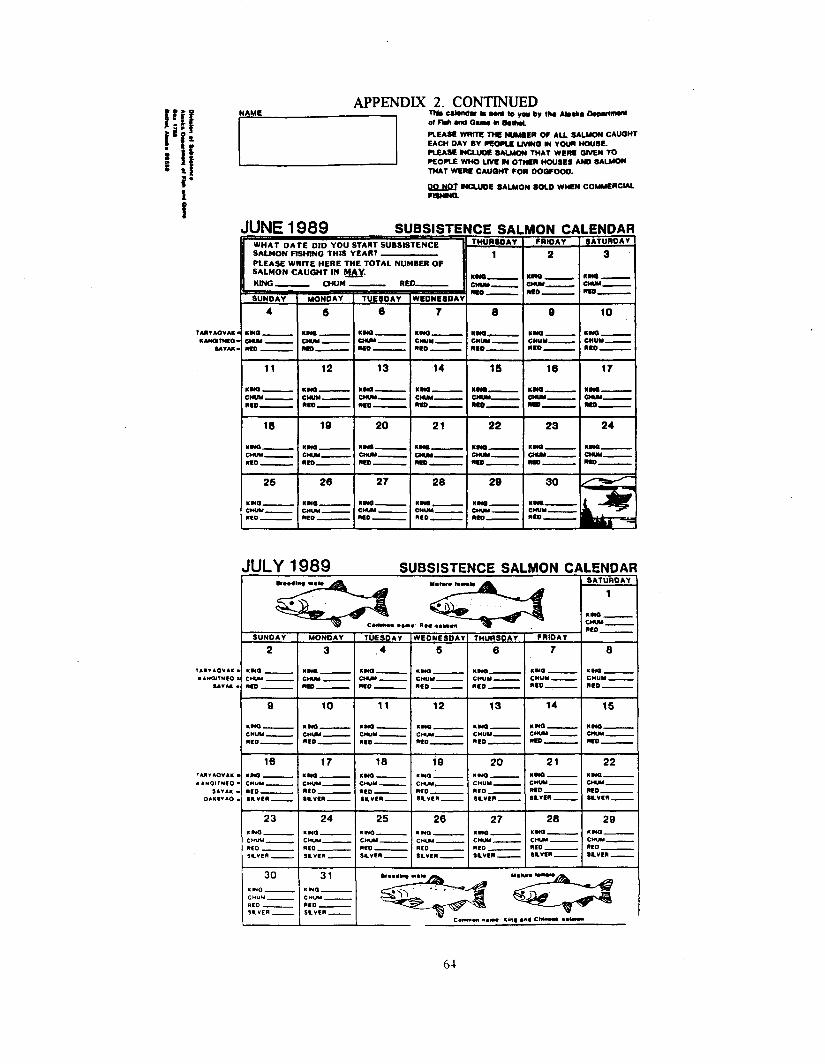
f % ? 1.
1”
i f
l i
APPENDIX2.CONTINUED
PLEASE WRllE THE HWER Df AU, SALUON CAW~T EACH DAY SV PEOPLE UWNO IN VOUN HOUSE. CLSAW WCUJDS SALMON Tl,AT WERE OWEN TO PEOPLE WHO UVI! Iy OTHER MOIJSES AWD SALMON TMAT WERI? CAUQNT FOR 000FOOO.
JUNE 1989 SUBSISTENCE SALMON CALENOAF
SALMON CAUGHT IN w.
JULY 1989 SUBSISTENCE SALMON CALENDAR
24 I I 26 I 27 25
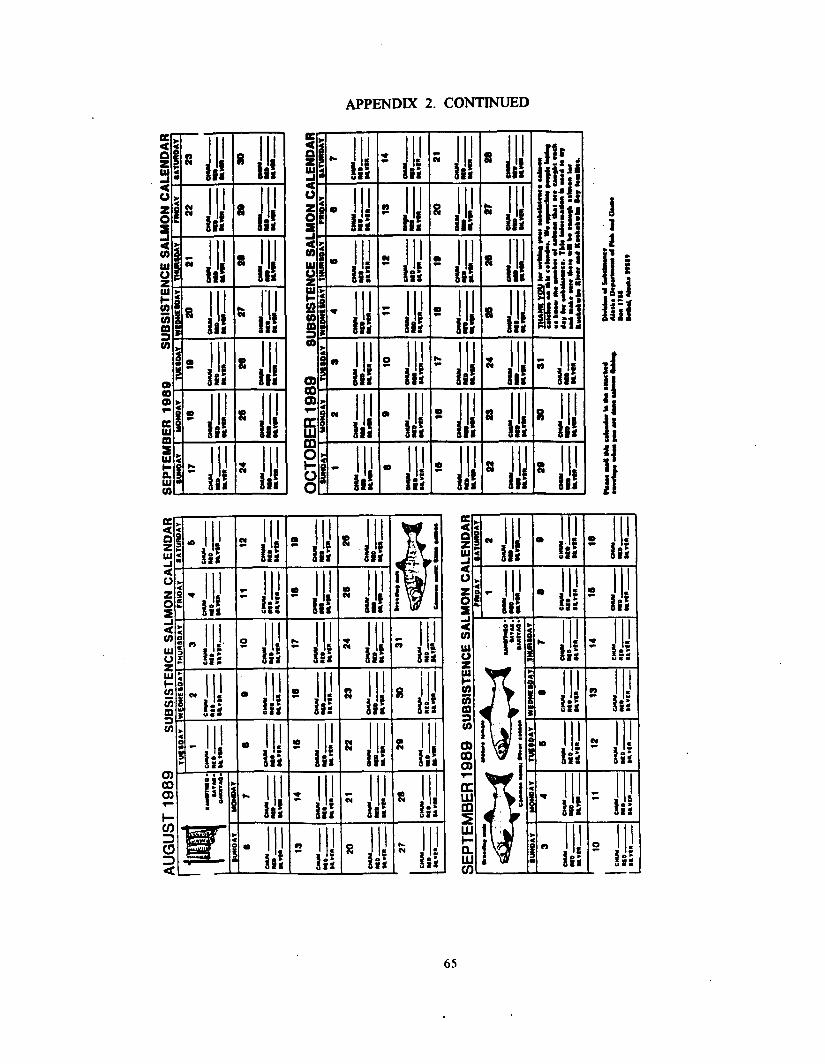
APPENDIX 2. CONTINUED
65
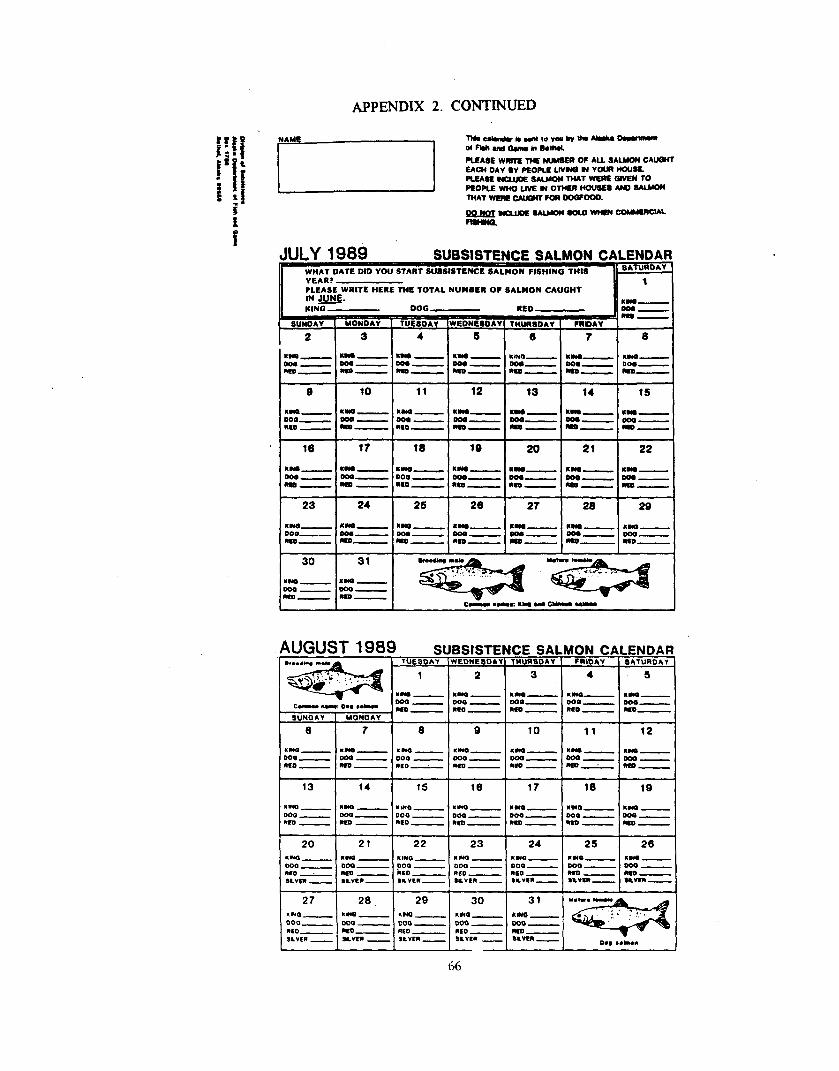
APPENDIX 2.CONTl-NUEiD
JULY 1989 SUBSISTENCE SALMON CALENDAF WHAT DATE DID YDU START SUBSISTENCC: SALMON FISHtWO THIS -tsATURoAv YEAR? FLEAS WRITE HERE THE TOTAL NUMOLR OF SALMON CAUGHT IN Jyp?s;. KIN0 -
Tzz= 2
**o- wo- MO-
9
*yQ- DOO- wo-
16
mm- Doe- nw-
ma- KY- -- ooo- wo- Kw-
t+
21 22
Rmo- em- ma- ooo- mo- wo-
I *ON- ooo-
8-P
i 20
23
30
-m- am- mo-
4UGUST 198! BSISTENCE SALMON CALENDAR
UONOAV
7
18 I
17 I
18 I
19
66
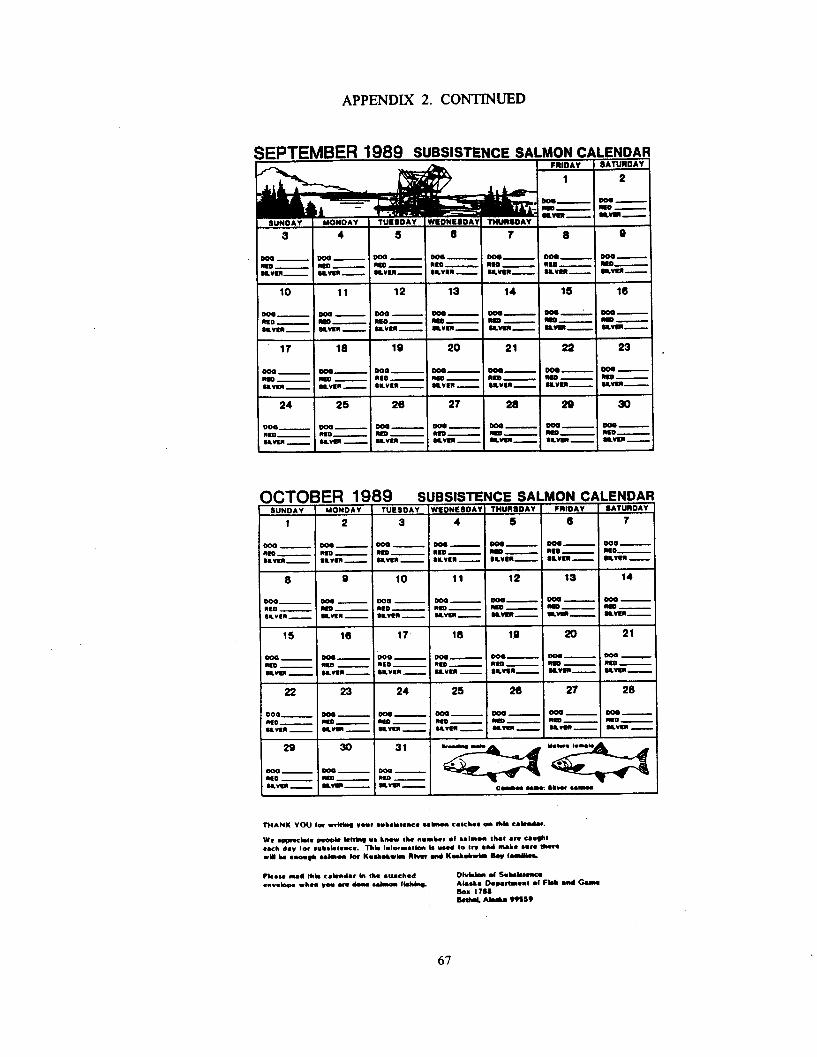
APPENDIX 2. CONTINUED
19 SUBSISTE NCE SALMON CALENDAR ’ nNJRsDAY I FRIDAY SATURDAY
S 6 7
31
-- -- =“u- Na
cm w: .e”ml ..- J
67
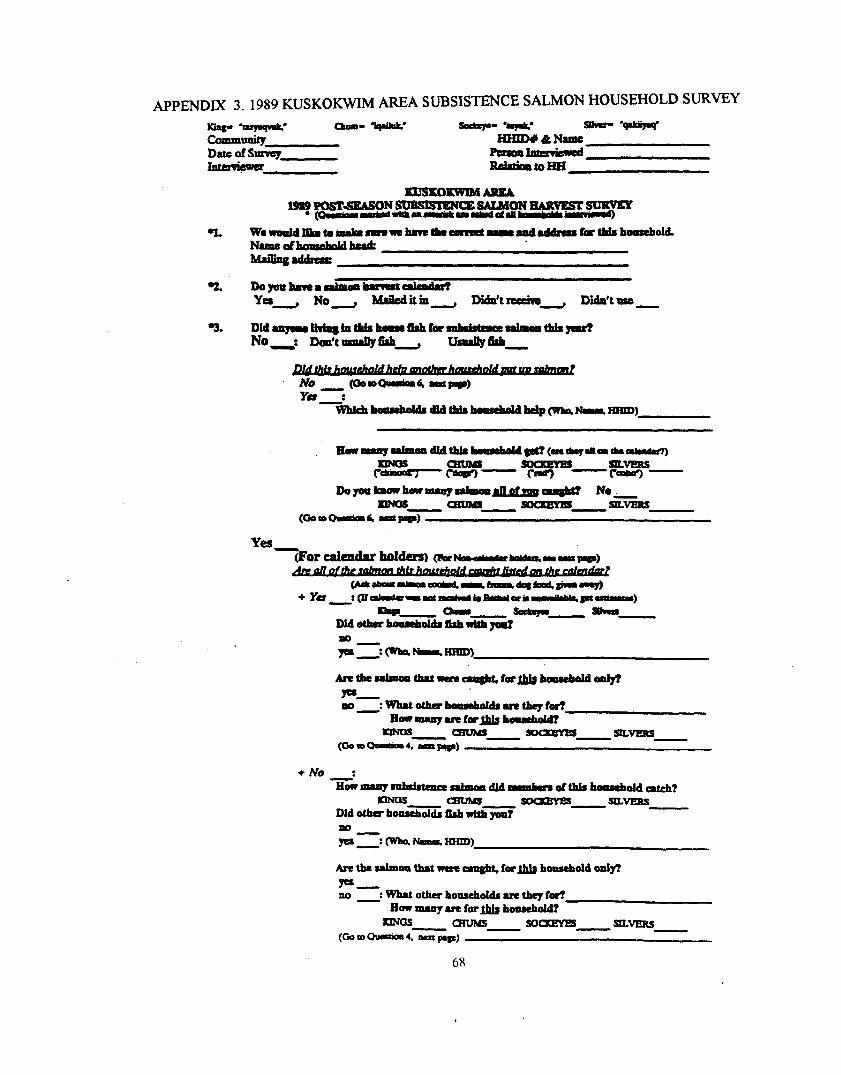
APPEiNDtX 3.1989 KUSKOKWIM AREA SUBSISTENCE SALMON HOUSEHOLD SURVEY
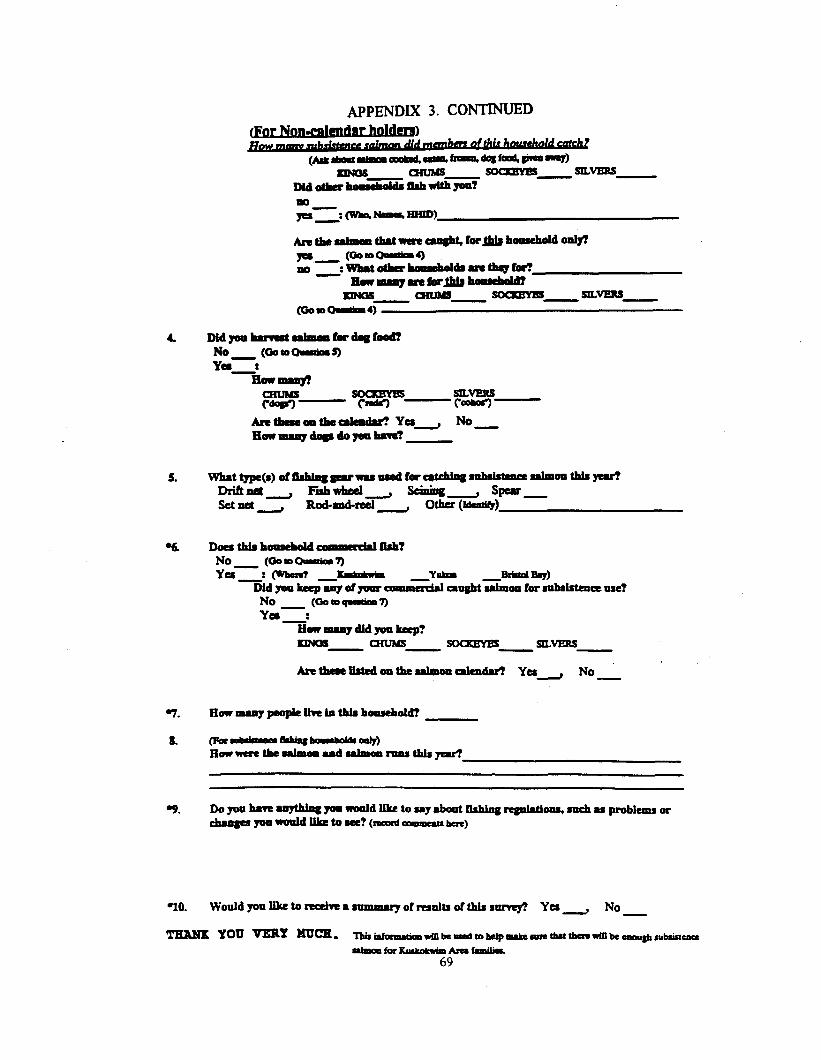
10. Wouldyoollkctonxeivea l mmary of nsdts of this sarvq? Yu - No
TEmx YOU VERY =JQb ndsiufunMtioowinkmN4mhclpmskalutb&tben””mkclmP~Nbrincncc -forKbeDkwbAtu-
69
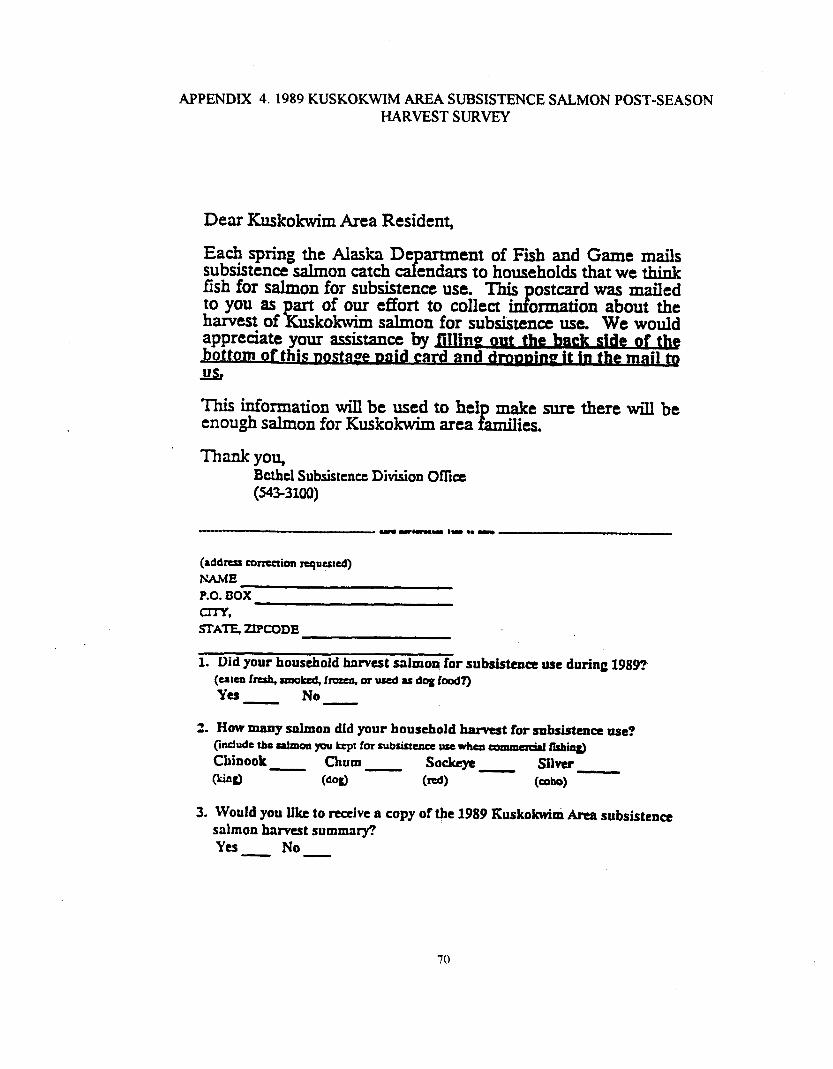
APPENDIX 4.1989 KUSKOKWIM AREZA SUBSISTENCE SALMON POST-SEASON HARVEST SURVJZY
Dear Kuskokwim Area Resident,
Each spring the Alaska De car
artment subsistence salmon catch
of Fish and Game mails endars to households that we think
fish for salmon for subsistence use. This ostcard was mailed to you as art of our effort to collect ’ ormation about the J harvest of R uskokwim salmon for subsistence use. We would appreciate your assistance by filIiny out the baa side of the . . . bottom of this nostwe nnid card and dram It rn the ma il tp Es?
This information wiU be used to hel enough salmon for Kuskokwim area
make sure there will be LlI l ies.
-llmJ.k YOU, Bcthcl Subsistence Division Office (5413100)
(address mrrution requested) NAME P.0. BOX CTPI, SrA= ‘LIPCODE
1. Did your household harvest s;limoq for subsistence use during 1989? (atat fresh, satokai, fmzen, or used as dog food?) Ya No
2. How many salmon did your housc.h@Id harvest for subsistence use? (indude the calamn p kept for nabsistcncc w when commcrdrl Gsbiog) Chinook churn
- (WI - SOckcrc SIIW
- w3 (=a (coho) -
3. Would you like to receive a copy of the 1989 Kuskokwiti Area sub&ten= salmon hnrwst summiuy? YU No