bat response to shelterwood harvests and forest structure in oak-hickory forests
TRANSCRIPT

This article appeared in a journal published by Elsevier. The attachedcopy is furnished to the author for internal non-commercial researchand education use, including for instruction at the authors institution
and sharing with colleagues.
Other uses, including reproduction and distribution, or selling orlicensing copies, or posting to personal, institutional or third party
websites are prohibited.
In most cases authors are permitted to post their version of thearticle (e.g. in Word or Tex form) to their personal website orinstitutional repository. Authors requiring further information
regarding Elsevier’s archiving and manuscript policies areencouraged to visit:
http://www.elsevier.com/copyright
Author's personal copy
Bat response to shelterwood harvests and forest structure in oak-hickory forests
Marne A. Titchenell ⇑, Roger A. Williams, Stanley D. GehrtThe Ohio State University, School of Environment and Natural Resources, 210 Kottman Hall, 2021 Coffey Road, Columbus, OH 43210, USA
a r t i c l e i n f o
Article history:Received 11 March 2011Received in revised form 20 May 2011Accepted 21 May 2011Available online 14 June 2011
Keywords:Bat activityForest structureShelterwood harvestForest management
a b s t r a c t
Forest management practices, such as shelterwood harvesting, can greatly impact bat habitat relation-ships. Such practices can alter the amount of structural volume within a forest, which can influencebat foraging patterns. We determined the effects of shelterwood harvests of different retention levels(50% and 70% of full stocking) on bat activity patterns in oak-hickory forests located in southern Ohio.We used the Anabat system to monitor activity during May–September 2006. Our objectives were toquantify the effects of harvesting on structural volume and use the results to explain variations in batactivity. Because harvesting alters vertical structure as well as the total amount of volume within a forest,we also determined the height within the vertical profile where changes in structural volume begin toinfluence overall and species-specific activity. Overall bat activity did not differ significantly betweenshelterwood harvest levels, but was significantly different between harvested and control sites, withmore passes detected within the harvested sites. Lasiurus borealis (red bat), Eptesicus fuscus (big brownbat), and Lasionycteris noctivagans (silver-haired bat) activity was significantly greater in harvested versuscontrol sites, but did not differ between shelterwood harvest levels. Myotis spp. (Myotis lucifugus (littlebrown bat) and Myotis septentrionalis (northern Myotis)) and Perimyotis subflavus (tri-colored bat) activitydid not vary between shelterwood harvest levels or between harvested and control sites. The greatestreductions in structural volume occurred in the understory to mid-canopy of the shelterwood harvests.Overall activity was most influenced by the amount of volume within 3–6 m above the forest floor, anddeclined as volume within that height strata increased. Mean bat passes declined by 50% when volumewithin 3–6 m exceeded 17 m3/ha. Estimated use by L. borealis decreased by 50% at volumes exceeding1750 m3/ha in the understory to mid-canopy (0–12 m), while E. fuscus and L. noctivagans estimateduse was the highest when volumes within 3–6 m were less than 63 m3/ha. Our results suggest that forestmanagement practices that reduce the amount of structural volume in the understory to mid-canopyprovide suitable habitat for foraging bats. Quantifying the amount of structural volume at various heightswithin the vertical profile of the forest can lend valuable insights into overall and species-specific batactivity patterns.
Published by Elsevier B.V.
1. Introduction
Due to current and potential future declines in bat populationsin North America and around the world (Kunz and Fenton, 2003;O’Shea and Bogan, 2003), it has become increasingly importantfor natural resource managers to understand how forest manage-ment practices influence bat habitat relationships. Forest managersare focusing on the restoration of plant communities that wereonce dominant across the eastern United States, such as oak forests(Barclay and Brigham, 1996). Although oak species (Quercus spp.)still dominate the overstory in many forests, regeneration on theforest floor is dominated by species that will out-compete oakseedlings in the future. The shelterwood method of timber
harvesting is a preferred practice used to regenerate oaks in east-ern deciduous forests (Sander, 1988; Schlesinger et al., 1993; Yah-ner, 1995). Limited information exists on the effects of shelterwoodharvests on bat communities and information is needed for man-agers to be sensitive to bat habitat requirements.
Research has shown that silvicultural practices directly impactbat populations within forest ecosystems (Krusic and Neefus,1996; Fenton, 2001; Menzel et al., 2005) by adjusting the numberof available roost sites and by altering the amount of structural vol-ume, or clutter (Jones et al., 2000; Loeb and Waldrop, 2008; Adamset al., 2009). Morphological variations in body size and wing shape,differences in echolocation call design, and the degree of structuralvolume (any tree, branch, or physical obstacle that impedes a bat’sflight path or reflects an echolocation call (Fenton, 2001; Owenet al., 2004)), can influence a bat’s habitat use (Aldridge andRautenbach, 1987; Norberg and Rayner, 1987). Smaller bodiedbats, those with low wing loadings and aspect ratios, have higher
0378-1127/$ - see front matter Published by Elsevier B.V.doi:10.1016/j.foreco.2011.05.032
⇑ Corresponding author. Tel.: +1 614 292 0402; fax: +1 614 292 7432.E-mail addresses: [email protected] (M.A. Titchenell), [email protected]
(R.A. Williams), [email protected] (S.D. Gehrt).
Forest Ecology and Management 262 (2011) 980–988
Contents lists available at ScienceDirect
Forest Ecology and Management
journal homepage: www.elsevier .com/ locate/ foreco
Author's personal copy
echolocation calls and are able to better maneuver dense habitats(Aldridge and Rautenbach, 1987; Norberg and Rayner, 1987).Larger bodied bats, those species with high wing loadings and as-pect ratios, have lower frequency echolocation calls and fasterflight speeds. These species are better adapted to flying in openhabitats with low structural volume (Aldridge and Rautenbach,1987; Jones et al., 2000; Menzel et al., 2005).
Although previous research suggests that the amount of struc-tural volume within a forest has an important influence on bat for-aging patterns and species presence (Jung et al., 1999; Owen et al.,2004; Menzel et al., 2005; Ober and Hayes, 2007), few studies haveattempted to quantify structural volume in relation to bat activity.Areas of low structural volume are often associated with high lev-els of bat activity (Erickson and West, 2003; Menzel et al., 2005;Loeb and O’Keefe, 2006). Likewise, habitats of high structural vol-ume are often linked to low levels of bat activity (Jung et al.,1999; Brooks and Ford, 2005; Obrist et al., 2011). Quantifying theamount of structural volume where bat activity becomes positivelyor negatively affected would be valuable for developing forestmanagement protocols that benefit bats, as well as provide insightinto species-specific activity patterns in relation to structural vol-ume. Harvesting alters the total amount of volume within a standand the vertical structure, often resulting in reductions in theunderstory to mid-canopy. Few studies have determined theheight within the vertical profile where changes in structural vol-ume begin to influence bat activity (Adams et al., 2009; Smith andGehrt, 2010) and none have attempted to quantify the amount ofvolume at those heights in relation to bat activity. Knowledge ofthe relationship between structural volume and foraging patternswould be highly beneficial in aiding bat management decisions.
We assessed habitat use by bats in shelterwood harvests imple-mented in oak-hickory forests in southern Ohio, USA. Our researchhad three objectives: (1) assess bat activity within the shelterwoodharvested and control sites, (2) quantify the effects of shelterwoodharvesting on forest structure, and 3) use the amount of structuralvolume within the harvested and control sites to explain variationsin bat activity. We predicted that due to the reduction of volume,the shelterwood harvest sites would sustain higher levels of overallbat activity than the control sites. Because species-specific activitylends valuable insight and can sometimes be masked in overall batactivity analyses, it was examined in addition to overall bat activityin objectives one and three. We predicted that species-specificactivity would vary among treatments based on differences inmorphology and echolocation call design. Accordingly, largebodied species would exploit areas of low structural volume whilesmall bodied species would utilize areas of higher structuralvolume.
2. Methods
2.1. Study area and design
We selected two oak-hickory forests located on upland soils insouthern Ohio as study areas. One study area was located withinRichland Furnace State Forest, Jackson County, Ohio (39�100N lati-tude, 82�360W longitude) and the second was within Zaleski StateForest, Vinton County, Ohio (39�150N latitude, 82�230W longitude).Both forests lie within the unglaciated hill country of southernOhio where the regional topography is characterized by deeply dis-sected terrain of the Allegheny Plateau (Kerr, 1985). Both state for-ests are managed under a multiple-use concept which includesmanagement for wildlife habitat improvement, recreation, wa-tershed management, esthetics, and forest products. The forestsare dominated by upland oak and hickory (Carya spp.) species suchas Q. alba (white oak), Q. prinus (chestnut oak), Q. coccinea (Scarlet
oak) C. glabra (pignut hickory), C. laciniosa (shellbark hickory), andC. tomentosa (mockernut hickory), which accounted for an averageof 88.2% of the total basal area (m2/ha). The remainder consists oftypical upland hardwood species, such as Acer rubrum (red maple),Liriodendron tulipfera (yellow poplar), and Nyssa sylvatica (blackgum).
Within each of the forest study areas, a control, and two shelter-wood harvests, one 50% of full stocking (100%) and one 70% of fullstocking, were established, each comprising 10 ha. The shelter-wood harvest levels were chosen to establish the range of stockinglevels recommended to regenerate oak species (Graney andRogerson, 1985; Sander, 1988; Jacobs and Wray, 1992). BothZaleski and Richland Furnace study areas had two replicates ofeach shelterwood harvest level and control, totaling six sites perstudy area, and 12 sites between both study areas. Sites withineach study area were located no less than 60 m apart from one an-other. To achieve the initial shelterwood cut, a combined crownthinning and low thinning was used to reduce the stocking level,favoring dominant and co-dominant oak in the overstory. Harvest-ing in Zaleski and Richland Furnace study areas began in June 2005and ended in March 2006.
2.2. Vegetative sampling
We used a systematic sampling design to locate eight vegeta-tion plots within each of the 12 harvested and control sites, for atotal of 96 plots in Zaleski and Richland Furnace study areas com-bined. Plots were established at a distance of 60 m apart ontransects located 60 m from each other and the edge of other treat-ment sites or uncut areas. This sampling design provided a sam-pling intensity of 6.4%, which is sufficient to describe vegetativecompositions for oak forests in southern Ohio (Hutchinson et al.,1999).
For each vegetation plot we measured the overstory trees(P10 cm diameter at breast height (dbh)), saplings (P1.4 m inheight and 610 cm dbh), and large seedlings (0.3–1.4 m in height).Overstory, sapling, and large seedling plots were circular and mea-sured 0.08, 0.04, and 0.02 ha in size respectively. In order to quan-tify the amount of structural volume at various heights in thevertical profile, we used a previously designed algorithm (Avinaet al., 2007) to estimate volume (m3/ha) in five predeterminedheight strata (0–3, 3–6, 6–9, 9–12, and 12+ m (Smith and Gehrt,2010)). The following measurements were required for the algo-rithm. For all woody stems, we measured total height, height tothe base of the live crown, and crown diameter (determined byaveraging two measurements; the maximum crown diameter andthe crown diameter at a right angle to the axis of the maximumcrown diameter) to the nearest 0.15 m and recorded the species(Avina et al., 2007). Percent canopy cover was also measured oneach plot using a spherical densiometer. All vegetation samplingtook place during the first growing season following the harvest,June–August in 2006.
2.3. Monitoring bat activity
To compare bat foraging activity across the harvested and con-trol sites, we used Anabat II broadband ultrasonic bat detectors(Titley Electronics, Ballina, New South Wales, Australia) coupledwith audiocassette recorders (Model no. S701, Radio Shack, Athens,Ohio, USA), to record echolocation calls. Each night we randomlyselected two of the 12 harvested or control sites for monitoringusing a sampling without replacement scheme. After each treat-ment or control site had been monitored once, they were removedfrom the population and the process was repeated until all siteshad been monitored. In general, all sites were monitored within1 week of each other for each rotation throughout the season
M.A. Titchenell et al. / Forest Ecology and Management 262 (2011) 980–988 981
Author's personal copy
(Gehrt and Chelsvig, 2003). Our monitoring design ensured equalsampling effort among all sites throughout the season and mini-mized variation between nights and monitoring stations.
Within each site, we used all eight vegetation plots as monitor-ing stations. At each vegetation plot, we placed a bat detector andcassette recorder with voice-activation mode in a protective box atthe plot center. We hung the protective boxes from a stable poleapproximately 1.5 m from the ground to reduce sound attenuationby understory vegetation. The vertical detection distance of anAnabat bat detector is estimated to be 15–20 m, indicating thatdetectors placed 1.5 m above ground would sample bats flying be-low and within the canopy of most forest stands (Krusic et al.,1996). To maximize the detection of bat passes and minimizeexternal noise such as wind, we set the bat detectors at a sensitiv-ity of eight, division ratio of 16, and orientated at a 45�. We placedthe bat detectors facing the interior of the site, turned on 30 minprior to sundown, and left to record for 3 h.
Mist-netting was conducted during June–August of 2006 toaugment acoustic data regarding species presence within the foreststudy areas. Species belonging to the genus Myotis can be difficultto separate by their echolocation call designs, but by capturingthese and other species, knowledge of species presence was possi-ble and inferences made from acoustical monitoring data wereused with a higher degree of confidence (O’Farrell and Gannon,1999; Murray et al., 2001; Gannon et al., 2003). Mist-netting wasconducted one to two nights per week in sites other than thosebeing acoustically monitored that same night. Nets were opened30 min prior to sunset and were check at 5–10 min intervals dur-ing the 3 h they remained open.
2.4. Echolocation call analysis
To identify bat echolocation passes, we analyzed tapes fromeach monitoring session using an Anabat V Zero Crossing AnalysisInterface Module (ZCAIM) and the computer program AnaBat6(version 6.3g) (Titley Electronics, Ballina, New South Wales,Australia). We defined a bat pass as two or more calls from a singlespecies separated by greater than one second. Two or more passesby different species recorded simultaneously were considered sep-arate passes. To identify bat passes by species, passes consisting offour or more calls were standardized using the default filter in Ana-Look (version 4.9j), which eliminated passes of extraneous noiseand interference (Gehrt and Chelsvig, 2004). The default filter func-tion quantifies the selection of identifiable calls thereby eliminat-ing subjectivity among researchers (Britzke and Murray, 2000).Species were then identified qualitatively by examining the slopeand curvature of the calls, and quantitatively by evaluating theminimum and mean frequencies and duration of each call se-quence. We used a call reference library (Gehrt and Chelsvig,2004) to identify individual species calls.
Differentiating among species’ echolocation calls can bechallenging due to the quality of detection, which can be affectedby the direction the bat is facing relative to the detector, the direc-tion of the detector’s microphone, attenuation, or Doppler shift(Betts, 1998). Also, there are some species that share similar callstructures which can lead to misclassification. White and Gehrt(2001) reported that multiple species of Myotis and Perimyotis sub-flavus (tri-colored bat) detected in northeastern Illinois were mis-classified due to similar call structures. Univariate analysis of callparameters were ineffective at separating Eptesicus fuscus (bigbrown bats) and Lasionycteris noctivagans (silver-haired bats) andexperienced observers misclassified 30% of all calls by these twospecies (Betts, 1998). One method of minimizing errors in classifi-cation of recorded calls to species is to combine similar species intogroups or clades (Yates and Muzika, 2006). Therefore, we assem-bled species with similar call structures, habitat partitioning, and
morphological similarities into species groups: (1) E. fuscus andL. noctivagans (EPLA) (Betts, 1998; Reynolds, 2006), and (2)P. subflavus and members of the genus Myotis, Myotis lucifugus(little brown bat), Myotis septentrionalis (northern Myotis), andMyotis sodalis (Indiana bat) (MYPE) (Loeb and O’Keefe, 2006). Weassigned Lasiurus borealis (red bat) to their own group, LABO.
2.5. Statistical analysis
To assess bat activity within the harvested and control sites, wecalculated the overall mean number of bat passes for each site(n = 12) by averaging the number of passes per night in each veg-etation plot, and then averaging across the eight vegetation plotsper site. We used a two-way, fixed effects analysis of variance (AN-OVA) with treatment and forest as main effects to determine ifoverall bat activity and species group activity varied among treat-ment and control sites, and if the pattern of variation was consis-tent between the two forest study areas (Statistical AnalysisSystems (SAS), 2002). Tukey’s multiple mean comparison was usedto distinguish which means differed (P 6 0.05). Data were trans-formed to the square-root (overall activity) and the fourth power(species group activity) to meet assumptions of normality andthe Anderson–Darling test was used as confirmation (P = 0.54).
We quantified the effects of the shelterwood harvests on foreststructure by applying a previously developed algorithm (Avinaet al., 2007) to the vegetation data collected. The algorithm deter-mined the total structural volume (m3/ha) that existed within eachheight strata (0–3, 3–6, 6–9, 9–12, and 12+ m) for each vegetationplot. We calculated an overall mean for each volume stratum with-in each harvested and control site (n = 12) by averaging the totalvolume in each height stratum across plots. We determined differ-ences in volume between the harvested and control sites and with-in the five predetermined height strata by using one way analysesof variance (SAS, 2002). Tukey’s multiple mean comparison wasused to determine significant differences (P 6 0.05). Assumptionsof normality were met by log and square root transformations ofthe volume variables.
To determine the relationship between bat activity and struc-tural volume, we used an information theory approach to developand identify the best statistical models of overall bat and speciesgroup activity (Burnham and Anderson, 2002). We developed aset of 22 candidate models based on knowledge of bat habitat rela-tionships. Our predictor variables were mean volumes within thefive height strata across harvested and control sites, basal area(m2/ha), % canopy cover, and an additional set of predictor vari-ables created by combining and averaging the five height strata(Table 1). We created this additional set of variables to determinethe level of detail necessary when measuring vertical structuralvolume. For example, are volume measurements of 0–3 and3–6 m necessary or is a measurement of 0–6 m sufficient? We usedlinear regression assuming Gaussian distributions to assess overallbat activity in response to the variables. For this analysis, we trans-formed bat activity (mean passes per plot) and all predictor vari-ables to the natural log to meet assumptions of normality. Toassess species group activity, we used logistic regression to predictspecies group presence in relation to the variables. Because basalarea and canopy cover can also reflect the amount of volume with-in a forest, we analyzed those variables in models separate frommodels containing the volume strata to determine if they were suf-ficient alone to predict bat presence. We used Akaike’s InformationCriteria corrected for small sample sizes (AICc) to rank models anddetermine variable importance. For each model, we calculated thedifference between the model with the lowest AICc and the AICc forthe ith model (Di), and Akaike’s weights (wi). Models with the low-est AICc, Di 6 2, and the highest weights were considered the bestapproximating models. We used model averaging to determine the
982 M.A. Titchenell et al. / Forest Ecology and Management 262 (2011) 980–988
Author's personal copy
importance of variables in top models, graphed the relationship,and examined the modeled line for further interpretation. Datawere analyzed using R statistical package (version 2.5.0, 2007).
3. Results
We monitored bat activity for 38 nights June–August of 2006within the 12 treatment and control sites (6–8 nights/site) for a to-tal of 1824 monitoring hours. Overall, 11,560 bat passes were re-corded, of which 796 passes (6.8%) were identified to threespecies groups; LABO, EPLA, and MYPE. LABO constituted 45%(358) of the total calls identified to species, EPLA comprised 40%(321), and MYPE constituted 15% (117). Mistnetting was conducted14 nights during the same time period for a total of 42 h. We cap-tured 47 bats of five different species; M. septentrionalis (14), L.borealis (13), P. subflavus (8), E. fuscus (7), and M. lucifugus (5).
3.1. Bat activity within harvested and control sites
Overall bat activity was similar between the two forest studyareas (ANOVA: F = 0.67, P = 0.45) and between months (ANOVA:F = 0.44, P = 0.68) therefore, data were pooled. While there wasno significant difference in overall bat activity between the twoharvest levels, activity differed significantly between the harvestedand control sites (Table 2). Activity was highest within harvestedsites with a total of 5487 passes (47.5%) recorded within the 50%shelterwood harvest sites, and 5327 passes (46.1%) recorded with-in the 70% shelterwood harvest sites. A total of 746 passes were re-corded within the control sites, comprising 6.4% of the total passesrecorded.
Species group activity did not vary significantly (for all ANOVAsP > 0.05) between forest study areas and months, therefore wepooled species data. For LABO, EPLA, and MYPE, no significant dif-ferences were found in activity between the 50% and 70% harvestlevels (Table 2). There was also no significant difference betweenharvested and control sites for MYPE; however activity for bothLABO and EPLA differed significantly (Table 2). Activity was highestwithin the harvested sites for LABO (225 passes in 50% shelter-wood harvest, 133 passes in 70% shelterwood harvest) and EPLA(131 passes in 50% shelterwood harvest, 190 passes in 70% shelter-wood harvest). We identified LABO and EPLA passes in 100% of theharvested sites, but did not detect any passes within the controlsites. MYPE was detected in 92% of all sites, and was the only spe-cies group detected within the control sites. However, activity lev-els for MYPE were higher within the harvested sites (47 passeswithin 50% shelterwood harvest, 57 passes within 70% shelter-wood harvest) than in the control sites (13 passes).
3.2. Stand structural volume
Structural volume in all five height strata for both harvest levelswas significantly different from the control sites, with the excep-tion of the 12+ m stratum (Table 3). Across harvest levels, therewere no significant differences in any of the strata, however meanvolumes were on average higher within the 70% shelterwood har-vest sites than in the 50% shelterwood harvest sites (Table 3). Thegreatest reductions in volume occurred in the understory to mid-canopy height strata (0–12 m) of the shelterwood harvests, specif-ically within the 3–6 and 6–9 m strata (Table 3). Mean volume ofthe 12+ m stratum within the 50% shelterwood harvest sites wasreduced to 50.4% of the total average volume of the same stratumwithin the control sites (41,596.8 m3/ha), and the 70% shelterwoodharvest sites were reduced to 73.6% (Table 3). These volume esti-mates coincide with the desired stocking levels of 50% and 70%,which were marked using basal area estimations. Basal area dif-fered significantly across both harvest levels and control sites,while canopy cover differed significantly only between the har-vested and control sites (Table 3).
3.3. Effects of structural volume on bat activity
The model containing the 3–6 m stratum was the best predictorof overall bat activity within the harvested and control sites (Table4). This model was the only one with substantial empirical support(Di 6 2) and explained 60% of the variation (Table 4). The 3–6 mstratum was also present in succeeding models (Table 4), thereforewe model averaged the variable and graphed the relationship(Fig. 1). Mean bat passes were highest when the volume withinthe 3–6 m stratum was zero, but as the volume increased, batactivity decreased (Fig. 1). The threshold volume at which batactivity declined by 50% was 17 m3/ha (Fig. 1). The mean volumewithin the 3–6 m height stratum collectively between the two
Table 1Variables measured at vegetation plots located in southern Ohio,USA, 2006.
Variable Definition
Ba Basal area (m2/ha)cc Canopy cover (%)0–3 m Mean volume (m3/ha) within 0–3 m3–6 m Mean volume (m3/ha) within 3–6 m6–9 m Mean volume (m3/ha) within 6–9 m9–12 m Mean volume (m3/ha) within 9–12 m12+ m Mean volume (m3/ha) above 12 m
Mean volume (m3/ha) of multiple strata:0–6 m 0–3 and 3–6 m0–9 m 0–3, 3–6, and 6–9 m0–12 m 0 3, 3–6, 6–9, and 9–12 m3–9 m 3–6 and 6–9 m3–12+ m 3–6, 6–9, 9–12, and 12+ m6–12 m 6–9 and 9–12 m6–12+ m 6–9, 9–12, and 12+ m9–12+ m 9–12 and 12+ mTotal v Total mean volume (m3/ha)
Table 2Bat activity (mean passes/site) in harvested and control sites (n = 12) in oak-hickory forests located in southern Ohio, USA, 2006. Means followed by the same capital letter are notsignificantly different across treatment and control sites (Tukey’s, P > 0.05).
Species 50% Shelterwood (n = 4) 70% Shelterwood (n = 4) Control (n = 4) ANOVAa
Mean SE Mean SE Mean SE F P
Overall activity 1371.75A 482.43 1331.75A 644.56 186.50B 115.13 15.44 0.004LABO 1.09A 0.79 0.60A 0.32 0.00B 0.00 12.35 0.004EPLA 0.64A 0.11 0.82A 0.51 0.00B 0.00 7.96 0.013MYPE 0.20A 0.10 0.24A 0.18 0.07A 0.04 0.92 0.527
a 2-Way ANOVA across 2 treatments and control.
M.A. Titchenell et al. / Forest Ecology and Management 262 (2011) 980–988 983
Author's personal copy
harvest sites was also low, but much greater within the controlsites (Table 3).
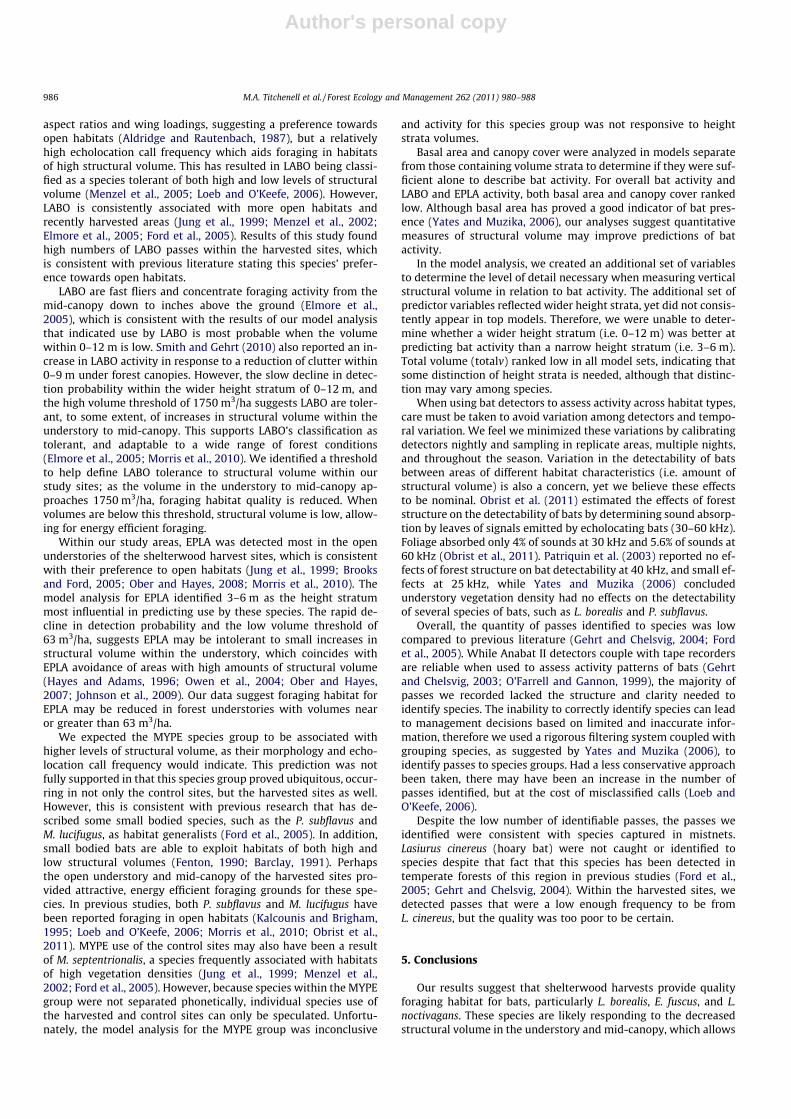
The model that contained the variable representative of the 0–12 m stratum was the best predictor for LABO activity (wi = 0.34)(Table 5). There was moderate support for the model thatcontained the 0–12 m stratum and the 12+ m stratum (wi = 0.13)(Table 5). Because the 0–12 m stratum was present in the toptwo models, we model averaged the variable and graphed the rela-tionship to determine the threshold volume; at 1750 m3/ha, the
probability of use by LABO declines by 50% (Fig. 2). In addition,at a volume of approximately 6000 m3/ha, probability decreasedto zero (Fig. 2). The mean volume within 0–12 m was 267.9 m3/ha in the 50% shelterwood sites and 295 m3/ha within the 70%shelterwood harvest sites, well below the threshold volume. Thecontrol sites had a mean volume of 2203 m3/ha within the 0–12 m stratum.
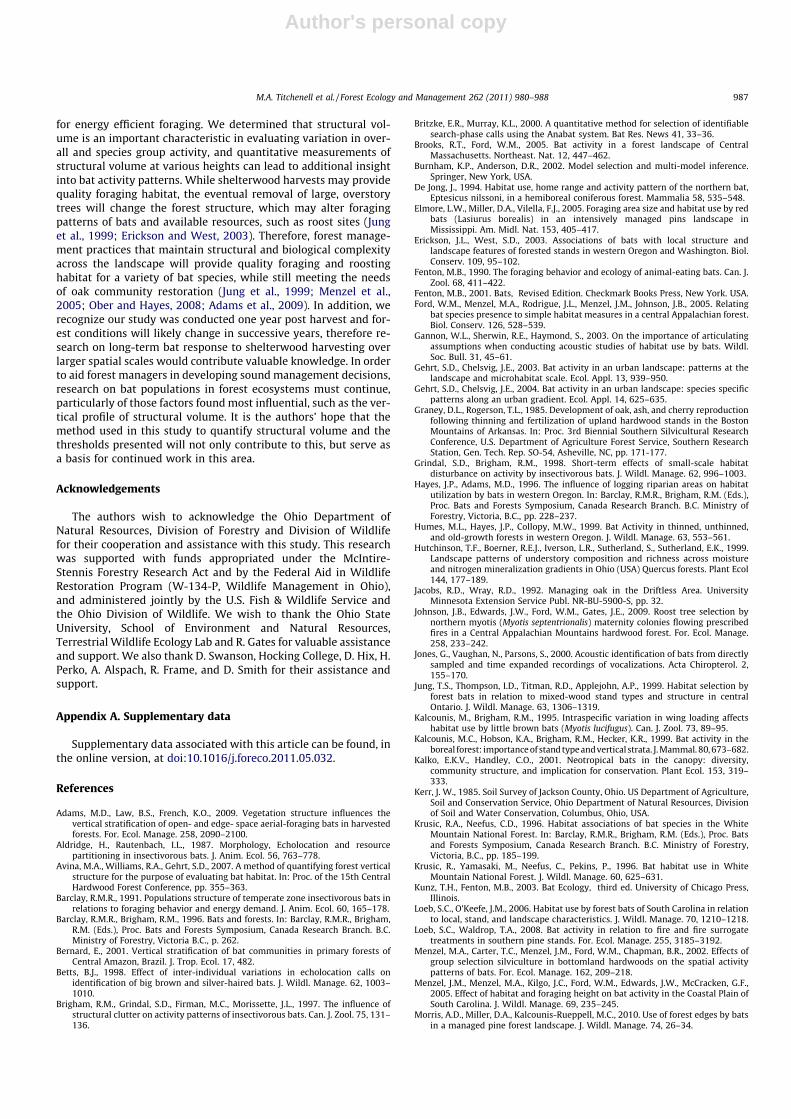
Similar to overall bat activity, the best approximating model ofEPLA activity contained the variable representative of the 3–6 mstratum (Table 5). This model had the highest support (wi = 0.54)and was the only one with Di 6 2 (Table 5). After model averaging,the graphed relationship displayed a rapid decline in the probabil-ity of use by EPLA as the volume within 3–6 m increased (Fig. 3).The probability of use by EPLA declined by 50% at the thresholdvolume of 63 m3/ha, and at 250 m3/ha, probability dropped to zero
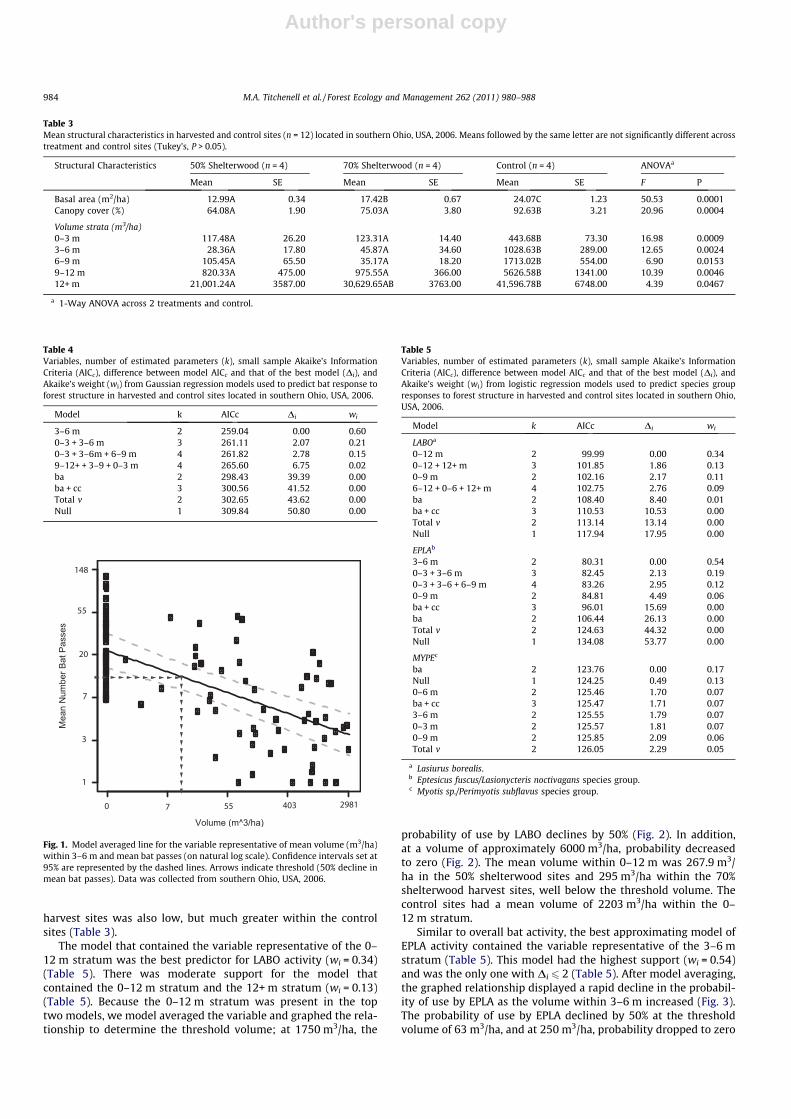
Table 3Mean structural characteristics in harvested and control sites (n = 12) located in southern Ohio, USA, 2006. Means followed by the same letter are not significantly different acrosstreatment and control sites (Tukey’s, P > 0.05).
Structural Characteristics 50% Shelterwood (n = 4) 70% Shelterwood (n = 4) Control (n = 4) ANOVAa
Mean SE Mean SE Mean SE F P
Basal area (m2/ha) 12.99A 0.34 17.42B 0.67 24.07C 1.23 50.53 0.0001Canopy cover (%) 64.08A 1.90 75.03A 3.80 92.63B 3.21 20.96 0.0004
Volume strata (m3/ha)0–3 m 117.48A 26.20 123.31A 14.40 443.68B 73.30 16.98 0.00093–6 m 28.36A 17.80 45.87A 34.60 1028.63B 289.00 12.65 0.00246–9 m 105.45A 65.50 35.17A 18.20 1713.02B 554.00 6.90 0.01539–12 m 820.33A 475.00 975.55A 366.00 5626.58B 1341.00 10.39 0.004612+ m 21,001.24A 3587.00 30,629.65AB 3763.00 41,596.78B 6748.00 4.39 0.0467
a 1-Way ANOVA across 2 treatments and control.
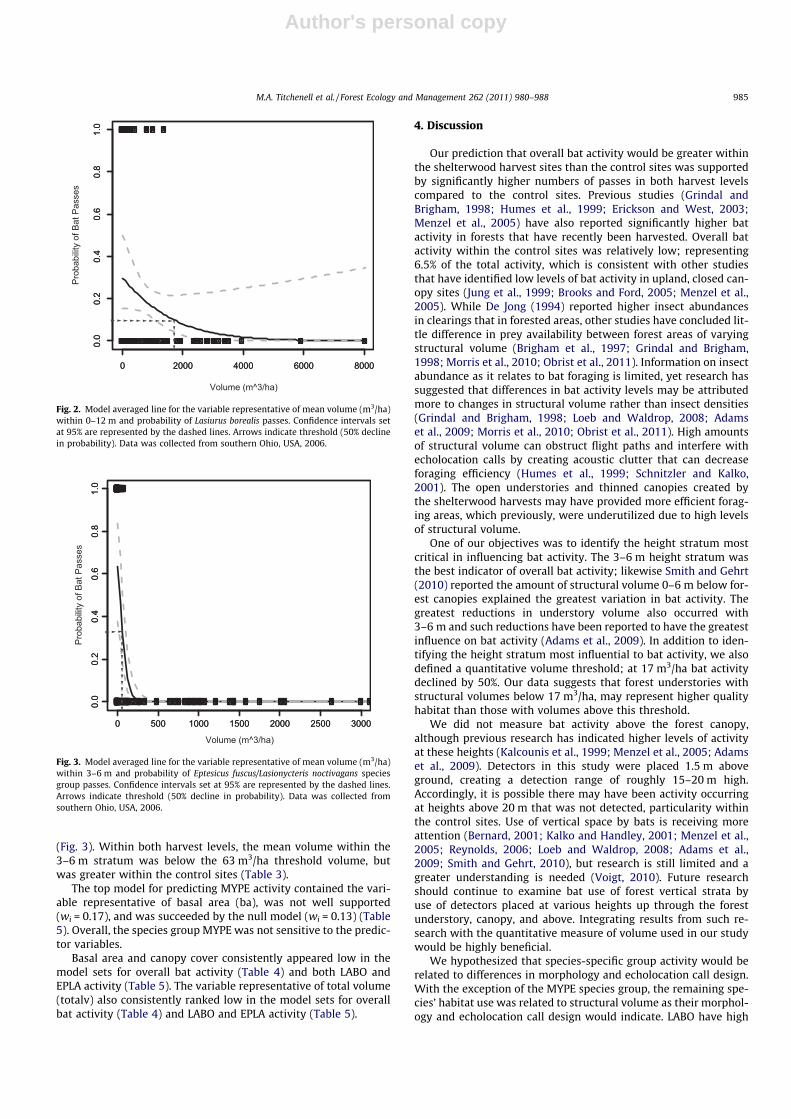
Table 4Variables, number of estimated parameters (k), small sample Akaike’s InformationCriteria (AICc), difference between model AICc and that of the best model (Di), andAkaike’s weight (wi) from Gaussian regression models used to predict bat response toforest structure in harvested and control sites located in southern Ohio, USA, 2006.
Model k AICc Di wi
3–6 m 2 259.04 0.00 0.600–3 + 3–6 m 3 261.11 2.07 0.210–3 + 3–6m + 6–9 m 4 261.82 2.78 0.159–12+ + 3–9 + 0–3 m 4 265.60 6.75 0.02ba 2 298.43 39.39 0.00ba + cc 3 300.56 41.52 0.00Total v 2 302.65 43.62 0.00Null 1 309.84 50.80 0.00
0 7 55 403 2981
1
3
7
20
55
148
Fig. 1. Model averaged line for the variable representative of mean volume (m3/ha)within 3–6 m and mean bat passes (on natural log scale). Confidence intervals set at95% are represented by the dashed lines. Arrows indicate threshold (50% decline inmean bat passes). Data was collected from southern Ohio, USA, 2006.
Table 5Variables, number of estimated parameters (k), small sample Akaike’s InformationCriteria (AICc), difference between model AICc and that of the best model (Di), andAkaike’s weight (wi) from logistic regression models used to predict species groupresponses to forest structure in harvested and control sites located in southern Ohio,USA, 2006.
Model k AICc Di wi
LABOa
0–12 m 2 99.99 0.00 0.340–12 + 12+ m 3 101.85 1.86 0.130–9 m 2 102.16 2.17 0.116–12 + 0–6 + 12+ m 4 102.75 2.76 0.09ba 2 108.40 8.40 0.01ba + cc 3 110.53 10.53 0.00Total v 2 113.14 13.14 0.00Null 1 117.94 17.95 0.00
EPLAb
3–6 m 2 80.31 0.00 0.540–3 + 3–6 m 3 82.45 2.13 0.190–3 + 3–6 + 6–9 m 4 83.26 2.95 0.120–9 m 2 84.81 4.49 0.06ba + cc 3 96.01 15.69 0.00ba 2 106.44 26.13 0.00Total v 2 124.63 44.32 0.00Null 1 134.08 53.77 0.00
MYPEc
ba 2 123.76 0.00 0.17Null 1 124.25 0.49 0.130–6 m 2 125.46 1.70 0.07ba + cc 3 125.47 1.71 0.073–6 m 2 125.55 1.79 0.070–3 m 2 125.57 1.81 0.070–9 m 2 125.85 2.09 0.06Total v 2 126.05 2.29 0.05
a Lasiurus borealis.b Eptesicus fuscus/Lasionycteris noctivagans species group.c Myotis sp./Perimyotis subflavus species group.
984 M.A. Titchenell et al. / Forest Ecology and Management 262 (2011) 980–988
Author's personal copy
(Fig. 3). Within both harvest levels, the mean volume within the3–6 m stratum was below the 63 m3/ha threshold volume, butwas greater within the control sites (Table 3).
The top model for predicting MYPE activity contained the vari-able representative of basal area (ba), was not well supported(wi = 0.17), and was succeeded by the null model (wi = 0.13) (Table5). Overall, the species group MYPE was not sensitive to the predic-tor variables.
Basal area and canopy cover consistently appeared low in themodel sets for overall bat activity (Table 4) and both LABO andEPLA activity (Table 5). The variable representative of total volume(totalv) also consistently ranked low in the model sets for overallbat activity (Table 4) and LABO and EPLA activity (Table 5).
4. Discussion
Our prediction that overall bat activity would be greater withinthe shelterwood harvest sites than the control sites was supportedby significantly higher numbers of passes in both harvest levelscompared to the control sites. Previous studies (Grindal andBrigham, 1998; Humes et al., 1999; Erickson and West, 2003;Menzel et al., 2005) have also reported significantly higher batactivity in forests that have recently been harvested. Overall batactivity within the control sites was relatively low; representing6.5% of the total activity, which is consistent with other studiesthat have identified low levels of bat activity in upland, closed can-opy sites (Jung et al., 1999; Brooks and Ford, 2005; Menzel et al.,2005). While De Jong (1994) reported higher insect abundancesin clearings that in forested areas, other studies have concluded lit-tle difference in prey availability between forest areas of varyingstructural volume (Brigham et al., 1997; Grindal and Brigham,1998; Morris et al., 2010; Obrist et al., 2011). Information on insectabundance as it relates to bat foraging is limited, yet research hassuggested that differences in bat activity levels may be attributedmore to changes in structural volume rather than insect densities(Grindal and Brigham, 1998; Loeb and Waldrop, 2008; Adamset al., 2009; Morris et al., 2010; Obrist et al., 2011). High amountsof structural volume can obstruct flight paths and interfere withecholocation calls by creating acoustic clutter that can decreaseforaging efficiency (Humes et al., 1999; Schnitzler and Kalko,2001). The open understories and thinned canopies created bythe shelterwood harvests may have provided more efficient forag-ing areas, which previously, were underutilized due to high levelsof structural volume.
One of our objectives was to identify the height stratum mostcritical in influencing bat activity. The 3–6 m height stratum wasthe best indicator of overall bat activity; likewise Smith and Gehrt(2010) reported the amount of structural volume 0–6 m below for-est canopies explained the greatest variation in bat activity. Thegreatest reductions in understory volume also occurred with3–6 m and such reductions have been reported to have the greatestinfluence on bat activity (Adams et al., 2009). In addition to iden-tifying the height stratum most influential to bat activity, we alsodefined a quantitative volume threshold; at 17 m3/ha bat activitydeclined by 50%. Our data suggests that forest understories withstructural volumes below 17 m3/ha, may represent higher qualityhabitat than those with volumes above this threshold.
We did not measure bat activity above the forest canopy,although previous research has indicated higher levels of activityat these heights (Kalcounis et al., 1999; Menzel et al., 2005; Adamset al., 2009). Detectors in this study were placed 1.5 m aboveground, creating a detection range of roughly 15–20 m high.Accordingly, it is possible there may have been activity occurringat heights above 20 m that was not detected, particularity withinthe control sites. Use of vertical space by bats is receiving moreattention (Bernard, 2001; Kalko and Handley, 2001; Menzel et al.,2005; Reynolds, 2006; Loeb and Waldrop, 2008; Adams et al.,2009; Smith and Gehrt, 2010), but research is still limited and agreater understanding is needed (Voigt, 2010). Future researchshould continue to examine bat use of forest vertical strata byuse of detectors placed at various heights up through the forestunderstory, canopy, and above. Integrating results from such re-search with the quantitative measure of volume used in our studywould be highly beneficial.
We hypothesized that species-specific group activity would berelated to differences in morphology and echolocation call design.With the exception of the MYPE species group, the remaining spe-cies’ habitat use was related to structural volume as their morphol-ogy and echolocation call design would indicate. LABO have high
Fig. 2. Model averaged line for the variable representative of mean volume (m3/ha)within 0–12 m and probability of Lasiurus borealis passes. Confidence intervals setat 95% are represented by the dashed lines. Arrows indicate threshold (50% declinein probability). Data was collected from southern Ohio, USA, 2006.
Fig. 3. Model averaged line for the variable representative of mean volume (m3/ha)within 3–6 m and probability of Eptesicus fuscus/Lasionycteris noctivagans speciesgroup passes. Confidence intervals set at 95% are represented by the dashed lines.Arrows indicate threshold (50% decline in probability). Data was collected fromsouthern Ohio, USA, 2006.
M.A. Titchenell et al. / Forest Ecology and Management 262 (2011) 980–988 985
Author's personal copy
aspect ratios and wing loadings, suggesting a preference towardsopen habitats (Aldridge and Rautenbach, 1987), but a relativelyhigh echolocation call frequency which aids foraging in habitatsof high structural volume. This has resulted in LABO being classi-fied as a species tolerant of both high and low levels of structuralvolume (Menzel et al., 2005; Loeb and O’Keefe, 2006). However,LABO is consistently associated with more open habitats andrecently harvested areas (Jung et al., 1999; Menzel et al., 2002;Elmore et al., 2005; Ford et al., 2005). Results of this study foundhigh numbers of LABO passes within the harvested sites, whichis consistent with previous literature stating this species’ prefer-ence towards open habitats.
LABO are fast fliers and concentrate foraging activity from themid-canopy down to inches above the ground (Elmore et al.,2005), which is consistent with the results of our model analysisthat indicated use by LABO is most probable when the volumewithin 0–12 m is low. Smith and Gehrt (2010) also reported an in-crease in LABO activity in response to a reduction of clutter within0–9 m under forest canopies. However, the slow decline in detec-tion probability within the wider height stratum of 0–12 m, andthe high volume threshold of 1750 m3/ha suggests LABO are toler-ant, to some extent, of increases in structural volume within theunderstory to mid-canopy. This supports LABO’s classification astolerant, and adaptable to a wide range of forest conditions(Elmore et al., 2005; Morris et al., 2010). We identified a thresholdto help define LABO tolerance to structural volume within ourstudy sites; as the volume in the understory to mid-canopy ap-proaches 1750 m3/ha, foraging habitat quality is reduced. Whenvolumes are below this threshold, structural volume is low, allow-ing for energy efficient foraging.
Within our study areas, EPLA was detected most in the openunderstories of the shelterwood harvest sites, which is consistentwith their preference to open habitats (Jung et al., 1999; Brooksand Ford, 2005; Ober and Hayes, 2008; Morris et al., 2010). Themodel analysis for EPLA identified 3–6 m as the height stratummost influential in predicting use by these species. The rapid de-cline in detection probability and the low volume threshold of63 m3/ha, suggests EPLA may be intolerant to small increases instructural volume within the understory, which coincides withEPLA avoidance of areas with high amounts of structural volume(Hayes and Adams, 1996; Owen et al., 2004; Ober and Hayes,2007; Johnson et al., 2009). Our data suggest foraging habitat forEPLA may be reduced in forest understories with volumes nearor greater than 63 m3/ha.
We expected the MYPE species group to be associated withhigher levels of structural volume, as their morphology and echo-location call frequency would indicate. This prediction was notfully supported in that this species group proved ubiquitous, occur-ring in not only the control sites, but the harvested sites as well.However, this is consistent with previous research that has de-scribed some small bodied species, such as the P. subflavus andM. lucifugus, as habitat generalists (Ford et al., 2005). In addition,small bodied bats are able to exploit habitats of both high andlow structural volumes (Fenton, 1990; Barclay, 1991). Perhapsthe open understory and mid-canopy of the harvested sites pro-vided attractive, energy efficient foraging grounds for these spe-cies. In previous studies, both P. subflavus and M. lucifugus havebeen reported foraging in open habitats (Kalcounis and Brigham,1995; Loeb and O’Keefe, 2006; Morris et al., 2010; Obrist et al.,2011). MYPE use of the control sites may also have been a resultof M. septentrionalis, a species frequently associated with habitatsof high vegetation densities (Jung et al., 1999; Menzel et al.,2002; Ford et al., 2005). However, because species within the MYPEgroup were not separated phonetically, individual species use ofthe harvested and control sites can only be speculated. Unfortu-nately, the model analysis for the MYPE group was inconclusive
and activity for this species group was not responsive to heightstrata volumes.
Basal area and canopy cover were analyzed in models separatefrom those containing volume strata to determine if they were suf-ficient alone to describe bat activity. For overall bat activity andLABO and EPLA activity, both basal area and canopy cover rankedlow. Although basal area has proved a good indicator of bat pres-ence (Yates and Muzika, 2006), our analyses suggest quantitativemeasures of structural volume may improve predictions of batactivity.
In the model analysis, we created an additional set of variablesto determine the level of detail necessary when measuring verticalstructural volume in relation to bat activity. The additional set ofpredictor variables reflected wider height strata, yet did not consis-tently appear in top models. Therefore, we were unable to deter-mine whether a wider height stratum (i.e. 0–12 m) was better atpredicting bat activity than a narrow height stratum (i.e. 3–6 m).Total volume (totalv) ranked low in all model sets, indicating thatsome distinction of height strata is needed, although that distinc-tion may vary among species.
When using bat detectors to assess activity across habitat types,care must be taken to avoid variation among detectors and tempo-ral variation. We feel we minimized these variations by calibratingdetectors nightly and sampling in replicate areas, multiple nights,and throughout the season. Variation in the detectability of batsbetween areas of different habitat characteristics (i.e. amount ofstructural volume) is also a concern, yet we believe these effectsto be nominal. Obrist et al. (2011) estimated the effects of foreststructure on the detectability of bats by determining sound absorp-tion by leaves of signals emitted by echolocating bats (30–60 kHz).Foliage absorbed only 4% of sounds at 30 kHz and 5.6% of sounds at60 kHz (Obrist et al., 2011). Patriquin et al. (2003) reported no ef-fects of forest structure on bat detectability at 40 kHz, and small ef-fects at 25 kHz, while Yates and Muzika (2006) concludedunderstory vegetation density had no effects on the detectabilityof several species of bats, such as L. borealis and P. subflavus.
Overall, the quantity of passes identified to species was lowcompared to previous literature (Gehrt and Chelsvig, 2004; Fordet al., 2005). While Anabat II detectors couple with tape recordersare reliable when used to assess activity patterns of bats (Gehrtand Chelsvig, 2003; O’Farrell and Gannon, 1999), the majority ofpasses we recorded lacked the structure and clarity needed toidentify species. The inability to correctly identify species can leadto management decisions based on limited and inaccurate infor-mation, therefore we used a rigorous filtering system coupled withgrouping species, as suggested by Yates and Muzika (2006), toidentify passes to species groups. Had a less conservative approachbeen taken, there may have been an increase in the number ofpasses identified, but at the cost of misclassified calls (Loeb andO’Keefe, 2006).
Despite the low number of identifiable passes, the passes weidentified were consistent with species captured in mistnets.Lasiurus cinereus (hoary bat) were not caught or identified tospecies despite that fact that this species has been detected intemperate forests of this region in previous studies (Ford et al.,2005; Gehrt and Chelsvig, 2004). Within the harvested sites, wedetected passes that were a low enough frequency to be fromL. cinereus, but the quality was too poor to be certain.
5. Conclusions
Our results suggest that shelterwood harvests provide qualityforaging habitat for bats, particularly L. borealis, E. fuscus, and L.noctivagans. These species are likely responding to the decreasedstructural volume in the understory and mid-canopy, which allows
986 M.A. Titchenell et al. / Forest Ecology and Management 262 (2011) 980–988
Author's personal copy
for energy efficient foraging. We determined that structural vol-ume is an important characteristic in evaluating variation in over-all and species group activity, and quantitative measurements ofstructural volume at various heights can lead to additional insightinto bat activity patterns. While shelterwood harvests may providequality foraging habitat, the eventual removal of large, overstorytrees will change the forest structure, which may alter foragingpatterns of bats and available resources, such as roost sites (Junget al., 1999; Erickson and West, 2003). Therefore, forest manage-ment practices that maintain structural and biological complexityacross the landscape will provide quality foraging and roostinghabitat for a variety of bat species, while still meeting the needsof oak community restoration (Jung et al., 1999; Menzel et al.,2005; Ober and Hayes, 2008; Adams et al., 2009). In addition, werecognize our study was conducted one year post harvest and for-est conditions will likely change in successive years, therefore re-search on long-term bat response to shelterwood harvesting overlarger spatial scales would contribute valuable knowledge. In orderto aid forest managers in developing sound management decisions,research on bat populations in forest ecosystems must continue,particularly of those factors found most influential, such as the ver-tical profile of structural volume. It is the authors’ hope that themethod used in this study to quantify structural volume and thethresholds presented will not only contribute to this, but serve asa basis for continued work in this area.
Acknowledgements
The authors wish to acknowledge the Ohio Department ofNatural Resources, Division of Forestry and Division of Wildlifefor their cooperation and assistance with this study. This researchwas supported with funds appropriated under the McIntire-Stennis Forestry Research Act and by the Federal Aid in WildlifeRestoration Program (W-134-P, Wildlife Management in Ohio),and administered jointly by the U.S. Fish & Wildlife Service andthe Ohio Division of Wildlife. We wish to thank the Ohio StateUniversity, School of Environment and Natural Resources,Terrestrial Wildlife Ecology Lab and R. Gates for valuable assistanceand support. We also thank D. Swanson, Hocking College, D. Hix, H.Perko, A. Alspach, R. Frame, and D. Smith for their assistance andsupport.
Appendix A. Supplementary data
Supplementary data associated with this article can be found, inthe online version, at doi:10.1016/j.foreco.2011.05.032.
References
Adams, M.D., Law, B.S., French, K.O., 2009. Vegetation structure influences thevertical stratification of open- and edge- space aerial-foraging bats in harvestedforests. For. Ecol. Manage. 258, 2090–2100.
Aldridge, H., Rautenbach, I.L., 1987. Morphology, Echolocation and resourcepartitioning in insectivorous bats. J. Anim. Ecol. 56, 763–778.
Avina, M.A., Williams, R.A., Gehrt, S.D., 2007. A method of quantifying forest verticalstructure for the purpose of evaluating bat habitat. In: Proc. of the 15th CentralHardwood Forest Conference, pp. 355–363.
Barclay, R.M.R., 1991. Populations structure of temperate zone insectivorous bats inrelations to foraging behavior and energy demand. J. Anim. Ecol. 60, 165–178.
Barclay, R.M.R., Brigham, R.M., 1996. Bats and forests. In: Barclay, R.M.R., Brigham,R.M. (Eds.), Proc. Bats and Forests Symposium, Canada Research Branch. B.C.Ministry of Forestry, Victoria B.C., p. 262.
Bernard, E., 2001. Vertical stratification of bat communities in primary forests ofCentral Amazon, Brazil. J. Trop. Ecol. 17, 482.
Betts, B.J., 1998. Effect of inter-individual variations in echolocation calls onidentification of big brown and silver-haired bats. J. Wildl. Manage. 62, 1003–1010.
Brigham, R.M., Grindal, S.D., Firman, M.C., Morissette, J.L., 1997. The influence ofstructural clutter on activity patterns of insectivorous bats. Can. J. Zool. 75, 131–136.
Britzke, E.R., Murray, K.L., 2000. A quantitative method for selection of identifiablesearch-phase calls using the Anabat system. Bat Res. News 41, 33–36.
Brooks, R.T., Ford, W.M., 2005. Bat activity in a forest landscape of CentralMassachusetts. Northeast. Nat. 12, 447–462.
Burnham, K.P., Anderson, D.R., 2002. Model selection and multi-model inference.Springer, New York, USA.
De Jong, J., 1994. Habitat use, home range and activity pattern of the northern bat,Eptesicus nilssoni, in a hemiboreal coniferous forest. Mammalia 58, 535–548.
Elmore, L.W., Miller, D.A., Vilella, F.J., 2005. Foraging area size and habitat use by redbats (Lasiurus borealis) in an intensively managed pins landscape inMississippi. Am. Midl. Nat. 153, 405–417.
Erickson, J.L., West, S.D., 2003. Associations of bats with local structure andlandscape features of forested stands in western Oregon and Washington. Biol.Conserv. 109, 95–102.
Fenton, M.B., 1990. The foraging behavior and ecology of animal-eating bats. Can. J.Zool. 68, 411–422.
Fenton, M.B., 2001. Bats, Revised Edition. Checkmark Books Press, New York. USA.Ford, W.M., Menzel, M.A., Rodrigue, J.L., Menzel, J.M., Johnson, J.B., 2005. Relating
bat species presence to simple habitat measures in a central Appalachian forest.Biol. Conserv. 126, 528–539.
Gannon, W.L., Sherwin, R.E., Haymond, S., 2003. On the importance of articulatingassumptions when conducting acoustic studies of habitat use by bats. Wildl.Soc. Bull. 31, 45–61.
Gehrt, S.D., Chelsvig, J.E., 2003. Bat activity in an urban landscape: patterns at thelandscape and microhabitat scale. Ecol. Appl. 13, 939–950.
Gehrt, S.D., Chelsvig, J.E., 2004. Bat activity in an urban landscape: species specificpatterns along an urban gradient. Ecol. Appl. 14, 625–635.
Graney, D.L., Rogerson, T.L., 1985. Development of oak, ash, and cherry reproductionfollowing thinning and fertilization of upland hardwood stands in the BostonMountains of Arkansas. In: Proc. 3rd Biennial Southern Silvicultural ResearchConference, U.S. Department of Agriculture Forest Service, Southern ResearchStation, Gen. Tech. Rep. SO-54, Asheville, NC, pp. 171-177.
Grindal, S.D., Brigham, R.M., 1998. Short-term effects of small-scale habitatdisturbance on activity by insectivorous bats. J. Wildl. Manage. 62, 996–1003.
Hayes, J.P., Adams, M.D., 1996. The influence of logging riparian areas on habitatutilization by bats in western Oregon. In: Barclay, R.M.R., Brigham, R.M. (Eds.),Proc. Bats and Forests Symposium, Canada Research Branch. B.C. Ministry ofForestry, Victoria, B.C., pp. 228–237.
Humes, M.L., Hayes, J.P., Collopy, M.W., 1999. Bat Activity in thinned, unthinned,and old-growth forests in western Oregon. J. Wildl. Manage. 63, 553–561.
Hutchinson, T.F., Boerner, R.E.J., Iverson, L.R., Sutherland, S., Sutherland, E.K., 1999.Landscape patterns of understory composition and richness across moistureand nitrogen mineralization gradients in Ohio (USA) Quercus forests. Plant Ecol144, 177–189.
Jacobs, R.D., Wray, R.D., 1992. Managing oak in the Driftless Area. UniversityMinnesota Extension Service Publ. NR-BU-5900-S, pp. 32.
Johnson, J.B., Edwards, J.W., Ford, W.M., Gates, J.E., 2009. Roost tree selection bynorthern myotis (Myotis septentrionalis) maternity colonies flowing prescribedfires in a Central Appalachian Mountains hardwood forest. For. Ecol. Manage.258, 233–242.
Jones, G., Vaughan, N., Parsons, S., 2000. Acoustic identification of bats from directlysampled and time expanded recordings of vocalizations. Acta Chiropterol. 2,155–170.
Jung, T.S., Thompson, I.D., Titman, R.D., Applejohn, A.P., 1999. Habitat selection byforest bats in relation to mixed-wood stand types and structure in centralOntario. J. Wildl. Manage. 63, 1306–1319.
Kalcounis, M., Brigham, R.M., 1995. Intraspecific variation in wing loading affectshabitat use by little brown bats (Myotis lucifugus). Can. J. Zool. 73, 89–95.
Kalcounis, M.C., Hobson, K.A., Brigham, R.M., Hecker, K.R., 1999. Bat activity in theboreal forest: importance of stand type and vertical strata. J. Mammal. 80, 673–682.
Kalko, E.K.V., Handley, C.O., 2001. Neotropical bats in the canopy: diversity,community structure, and implication for conservation. Plant Ecol. 153, 319–333.
Kerr, J. W., 1985. Soil Survey of Jackson County, Ohio. US Department of Agriculture,Soil and Conservation Service, Ohio Department of Natural Resources, Divisionof Soil and Water Conservation, Columbus, Ohio, USA.
Krusic, R.A., Neefus, C.D., 1996. Habitat associations of bat species in the WhiteMountain National Forest. In: Barclay, R.M.R., Brigham, R.M. (Eds.), Proc. Batsand Forests Symposium, Canada Research Branch. B.C. Ministry of Forestry,Victoria, B.C., pp. 185–199.
Krusic, R., Yamasaki, M., Neefus, C., Pekins, P., 1996. Bat habitat use in WhiteMountain National Forest. J. Wildl. Manage. 60, 625–631.
Kunz, T.H., Fenton, M.B., 2003. Bat Ecology, third ed. University of Chicago Press,Illinois.
Loeb, S.C., O’Keefe, J.M., 2006. Habitat use by forest bats of South Carolina in relationto local, stand, and landscape characteristics. J. Wildl. Manage. 70, 1210–1218.
Loeb, S.C., Waldrop, T.A., 2008. Bat activity in relation to fire and fire surrogatetreatments in southern pine stands. For. Ecol. Manage. 255, 3185–3192.
Menzel, M.A., Carter, T.C., Menzel, J.M., Ford, W.M., Chapman, B.R., 2002. Effects ofgroup selection silviculture in bottomland hardwoods on the spatial activitypatterns of bats. For. Ecol. Manage. 162, 209–218.
Menzel, J.M., Menzel, M.A., Kilgo, J.C., Ford, W.M., Edwards, J.W., McCracken, G.F.,2005. Effect of habitat and foraging height on bat activity in the Coastal Plain ofSouth Carolina. J. Wildl. Manage. 69, 235–245.
Morris, A.D., Miller, D.A., Kalcounis-Rueppell, M.C., 2010. Use of forest edges by batsin a managed pine forest landscape. J. Wildl. Manage. 74, 26–34.
M.A. Titchenell et al. / Forest Ecology and Management 262 (2011) 980–988 987

Author's personal copy
Murray, K.L., Britzke, E.R., Robbins, L.W., 2001. Variation in search-phase calls ofbats. J. Mammal. 82, 728–737.
Norberg, U.M., Rayner, J.M.V., 1987. Ecological morphology and flight in bats(Mammalia; Chiroptera): wing adaptations, flight performance, foragingstrategy, and echolocation. Biol. Sci. 316, 335–427.
Ober, H.K., Hayes, J.P., 2007. Influence of vegetation on bat use of riparian areas atmultiple spatial scales. J. Wildl. Manage. 72, 396–404.
Ober, H.K., Hayes, J.P., 2008. Prey selection by bats in forests of western Oregon. J.Mammal. 89, 1191–1200.
Obrist, M.K., Rathey, E., Bontadina, F., Martinoli, A., Conedera, M., Christe, P., Moretti,M., 2011. Response of bat species to sylvo-pastoral abandonment. For. Ecol.Manage. 261, 789–798.
O’Farrell, M.J., Gannon, W.L., 1999. A comparison of acoustic versus capturetechniques for the inventory of bats. J. Wildl. Manage. 80, 11–23.
O’Shea, T.J., Bogan, M.A., 2003. Monitoring trends in bat populations of the UnitedStates and territories: problems and prospects. U.S. Geological SurveyInformation and Technology Report ITR-2003-0003.
Owen, S.F., Menzel, M.A., Edwards, J.W., Ford, W.M., Menzel, J.M., Chapman, B.R.,Wood, P.B., Miller, K.V., 2004. Bat Activity in Harvested and Intact Forest Standsin the Allegheny Mountains. North. J. Appl. For. 21, 154–159.
Patriquin, K.J., Hogberg, L.K., Chruszcz, B.J., Barclay, R.M.R., 2003. The influenceofhabitat structure on the ability to detect ultrasound using bat detectors.Wildl. Soc. Bull. 31, 475–481.
Reynolds, D.S., 2006. Monitoring the potential impact of a wind development site onbats in the northeast. J. Wildl. Manage. 70, 1219–1227.
Sander, I.L., 1988. Guidelines for regenerating Appalachian oak stands. Society ofAmerican Foresters Publ. 88-03. In: Proc. Guidelines for regeneratingAppalachian hardwood stands, pp. 189-198.
SAS Institute Inc., 2002. SAS/STAT User’s Guide. Version 9. SAS Institute, Cary N.C..Schlesinger, R.C., Sander, I.L., Davidson, K.R., 1993. Oak regeneration potential
increased by shelterwood treatments. North. J. Appl. For. 10, 149–153.Schnitzler, H.U., Kalko, E.K.V., 2001. Echolocation by insect eating bats. BioScience
51, 557–569.Smith, D.A., Gehrt, S.D., 2010. Bat response to woodland restoration with urban
forest fragments. Resto. Ecol. 18, 914–923.Voigt, C.C., 2010. Insights into strata use of forest animals using the ‘canopy effect’.
Biotropica 42, 634–637.White, E.P., Gehrt, S.D., 2001. Effects of recording media on echolocation data from
broadband bat detectors. Wildl. Soc. Bull. 29, 974–978.Yahner, R.H., 1995. Eastern Deciduous Forests Ecology and Wildlife Conservation.
University of Minnesota Press, Minnesota.Yates, M.D., Muzika, R.M., 2006. Effect of forest structure and fragmentation on site
occupancy of bat species in Missouri Ozark forests. J. Wildl. Manage. 70, 1238–1248.
988 M.A. Titchenell et al. / Forest Ecology and Management 262 (2011) 980–988