study of the mechanical and physical behavior of gypsum
TRANSCRIPT

materials
Article
Study of the Mechanical and Physical Behavior of GypsumBoards with Plastic Cable Waste Aggregates and TheirApplication to Construction Panels
Alejandra Vidales-Barriguete 1,* , Jaime Santa-Cruz-Astorqui 1, Carolina Piña-Ramírez 2 ,Marta Kosior-Kazberuk 3 , Katarzyna Kalinowska-Wichrowska 3 and Evangelina Atanes-Sánchez 4
�����������������
Citation: Vidales-Barriguete, A.;
Santa-Cruz-Astorqui, J.;
Piña-Ramírez, C.; Kosior-Kazberuk,
M.; Kalinowska-Wichrowska, K.;
Atanes-Sánchez, E. Study of the
Mechanical and Physical Behavior of
Gypsum Boards with Plastic Cable
Waste Aggregates and Their
Application to Construction Panels.
Materials 2021, 14, 2255. https://
doi.org/10.3390/ma14092255
Academic Editor: Antonio Caggiano
Received: 5 April 2021
Accepted: 24 April 2021
Published: 27 April 2021
Publisher’s Note: MDPI stays neutral
with regard to jurisdictional claims in
published maps and institutional affil-
iations.
Copyright: © 2021 by the authors.
Licensee MDPI, Basel, Switzerland.
This article is an open access article
distributed under the terms and
conditions of the Creative Commons
Attribution (CC BY) license (https://
creativecommons.org/licenses/by/
4.0/).
1 Departamento de Tecnología de la Edificación, Escuela Técnica Superior de Edificación,Universidad Politécnica de Madrid, 28040 Madrid, Spain; [email protected]
2 Departamento de Construcciones Arquitectónicas y su Control, Escuela Técnica Superior de Edificación,Universidad Politécnica de Madrid, 28040 Madrid, Spain; [email protected]
3 Faculty of Civil Engineering and Environmental Sciences, Bialystok University of Technology,15-351 Bialystok, Poland; [email protected] (M.K.-K.); [email protected] (K.K.-W.)
4 Departamento de Ingeniería Mecánica, Química y de Diseño Industrial, Escuela Técnica Superior deIngeniería y Diseño Industrial, Universidad Politécnica de Madrid, 28040 Madrid, Spain;[email protected]
* Correspondence: [email protected]
Abstract: The objective of this study was to analyze the physico-mechanical properties of gypsumboards including plastic waste aggregates from cable recycling. The plastic cable waste is incor-porated into the gypsum matrix without going through any type of selection and/or treatment,as it is obtained after the cable recycling process. In the experimental process, gypsum boardsof different dimensions were manufactured and tested for their Young’s modulus, shock-impactresistance, flexural strength, thermal conductivity, and thermal comfort. The results obtained show asignificant increase in the elasticity of the boards with plastic waste (limited cracking), compliancewith the minimum value of flexural strength, and a slight improvement in the thermal conductivitycoefficient (lower energy demand) and surface comfort (reduced condensation and greater adher-ence). Therefore, the analyzed material could provide a suitable alternative to currently marketedgypsum boards, contributing to sustainable construction not only in new constructions, but also inbuilding renovations.
Keywords: gypsum board; plastic waste; mechanical properties of gypsum board; physical propertiesof gypsum board; plaster applications
1. Introduction
In the construction sector, there has been a radical change in the manufacture ofmaterials over the years. Where materials were once acquired locally and with minimalextraction and transformation processes, they can now be acquired anywhere in the worldthrough laborious and sophisticated extraction and transformation processes [1].
Traditional materials, such as stone, gypsum, wood, and concrete, continue to beused however, in recent decades, alternative systems using lower environmental impactmaterials have been increasingly applied [2,3].
One of the most widespread materials in the world is gypsum board, mainly dueto its ease and speed of assembly, versatility, and cleanliness. It has been widely usedin residential buildings, offices, hotels, hospitals, and so on. Moreover, it is also usedfor the production of false ceilings, interior partitions, and wall linings. The boards areprefabricated (by gypsum manufacturing companies) and manufactured. Then, they areassembled on-site in a light metallic structure. This type of construction also called drywall
Materials 2021, 14, 2255. https://doi.org/10.3390/ma14092255 https://www.mdpi.com/journal/materials

Materials 2021, 14, 2255 2 of 13
puts less weight on the existing structures and offers a better level of comfort and greaterease of repair and/or modification when carrying out renovations [4].
At present, there is a trend for using materials from recycling, not only as alternativesto the natural resources, but also to avoid the accumulation of waste. This is why researchin this field is essential, in order to achieve sustainable development and compliance withthe guidelines and directives of the European Union.
One of the waste products that has generated the most social alarm is plastic. Around350 million tons are manufactured per year around the world, and although it is true thatthe percentage of waste generated being recycled is increasing each year, an amount closeto 40% still ends up in landfill [5]. Plastic is present in all areas of our lives due to its greatdiversity and the heterogeneity of its properties.
In the construction sector, plastics have been used in a wide variety of applicationsincluding pipes, window frames, insulation, coatings, floors, and cable coatings, among oth-ers. In the case of the latter, there are many factors that intervene in the requirement ofone plastic or another in a cable, such as the type of atmosphere in which it is to be placed,the work stress that must be endured; the resistance to fire or flame spread, low smokeemissions, and so on. That is why these properties generate a wide range of possibilities,both in the current and future market for cables, with a multitude of plastic coatings, due tothe heterogeneity mentioned above.
However, the recycling problems associated with plastic make it a recurring themein the context of innovating materials, that is, trying to extend the life-cycle of plastic byreincorporating it into other materials [6]. Such studies have tried to improve acousticinsulation and for further lighten boards with the addition of expanded polystyrene (EPS)and cellulose solid waste [7–10]. Moreover, other types of waste have been incorporated,such as polypropylene and polyolefin waste which improve the resistance capacity againsttensile stresses [11–14], the reducing effect of which has been verified, when greater lengthand quantity of fibers are incorporated; wood waste and ladle furnace slag, which improvethermal properties [15–19]; recycled paper, which improves the mechanical strength [20];gypsum waste, which retains all its properties after several recycling processes [21–25];polyurethane waste for its potential use in construction materials [26]; or polyvinyl alcohol,which increases the porosity and decreases the density of the compounds [27,28]. To thebest or our knowledge, no studies have analyzed the effect of plastic cable waste in plastermatrices. In general, the studies mentioned above concerned finding ways to improvesome of the properties of gypsum boards, but also to apply sustainability and circulareconomy criteria in these new “eco-products”.
This article presents the results of tests carried out on gypsum boards including aggre-gates of plastic cable waste, which were not subjected to any type of selection or previoustreatment, despite their heterogeneity. The objective was to study the physico-mechanicalproperties of these boards and their potencial contribution to sustainable construction.
2. Materials and Methods
A series of samples were prepared with Iberyola E-35 fine gypsum (type A) manufac-tured by Placo, water from the Canal de Isabel II in Madrid (Spain), and plastic cable wasteprovided by the recycling company Lyrsa Álava (Spain), with a maximum granulometricsize of 3 mm and flat, rounded geometry (Figure 1). The water-to-gypsum mass ratio usedwas 0.8. The plastic cable waste, also referred to as PR (plastic residue) in this work wasincorporated in percentages of 50, 60 and 70 into the gypsum mass (dosage in Table 1),with the intent of reusing the maximum amount of waste and also minimizing the use ofraw material (gypsum and water). These series, with 3 samples each, were called E0.8 50PR,E0.8 60PR, and E0.8 70PR, respectively. The minimum values for the properties of gypsumcomposites have been established in the UNE-EN 13279-1 standard [29].
In each test, a series of 3 samples without waste was made (a reference series calledE0.8), against which the test results of the composites with plastic waste were compared.All the mixtures (Figure 1) were made according to the indications of the UNE-EN 13279-

Materials 2021, 14, 2255 3 of 13
2 standard [30]. Prior to pouring water, the gypsum and polymeric waste were mixedmanually for a few seconds, in order to prevent the waste from floating.
Materials 2021, 14, x FOR PEER REVIEW 3 of 13
All the mixtures (Figure 1) were made according to the indications of the UNE-EN 13279-2 standard [30]. Prior to pouring water, the gypsum and polymeric waste were mixed manually for a few seconds, in order to prevent the waste from floating.
Figure 1. Left, plastic cable waste (PR). Center, sample without PR. Right, sample with PR.
Four series were prepared, including samples of different types, and five different properties were tested (Table 1):
Table 1. Name of samples, composition, dimensions, and test performed.
Series Name PR Pellets (wt%) *
Water-to Gypsum Ratio
Dimensions ** (cm)
Test Performed
I
E0.8 0%
0.8 16 × 4 × 4 Young’s modulus E0.8 50PR 50% E0.8 60PR 60% E0.8 70PR 70%
II
E0.8 0%
0.8 15 × 15 × 2 Shock-Impact Resistance E0.8 50PR 50% E0.8 60PR 60% E0.8 70PR 70%
III
E0.8 0%
0.8 40 × 30 × 1 Flexural strength E0.8 50PR 50% E0.8 60PR 60% E0.8 70PR 70%
IV
E0.8 0%
0.8 30 × 30 × 3 Thermal conductivity Surface thermal comfort
E0.8 50PR 50% E0.8 60PR 60% E0.8 70PR 70%
* Calculated on the mass of gypsum. ** Length × Width × Height.
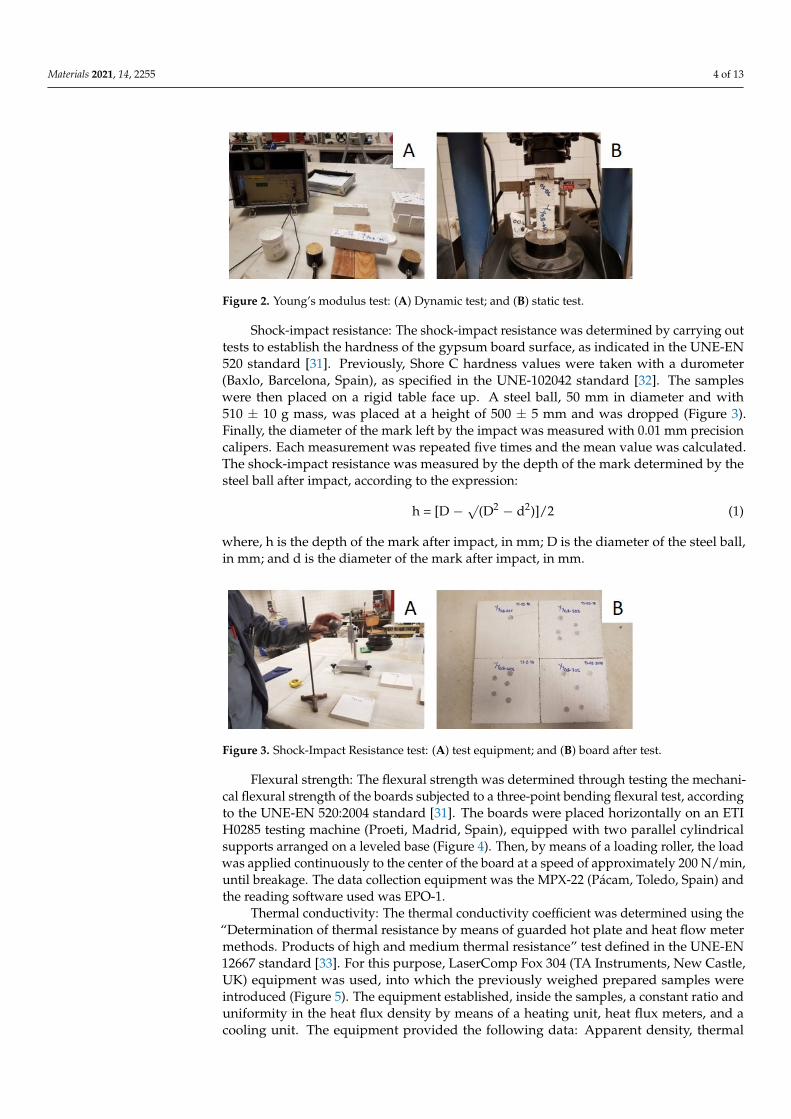
Young’s modulus: Young’s modulus was determined by the dynamic and static methods according to the standard UNE-EN 13279-2 [30]. For the dynamic Young’s mod-ulus, the ultrasonic propagation velocity was determined using the Ultrasonic tester E46 (Ibertest, Madrid, Spain). First, a gel was applied on each of the sides where the emitter and receiver were placed, in order to favor the transmission of the sound waves; passing time readings were taken longitudinally between these sides (Figure 2A). For the static Young’s modulus, the Autotest 200-10SW equipment was used (Ibertest, Madrid, Spain), on which the sample was positioned vertically and the extensometers were placed (Figure 2B). The equipment then compressed the sample and recorded the numerical value of Young’s modulus.
Figure 1. Left, plastic cable waste (PR). Center, sample without PR. Right, sample with PR.
Four series were prepared, including samples of different types, and five differentproperties were tested (Table 1):
Table 1. Name of samples, composition, dimensions, and test performed.
Series Name PR Pellets(wt%) *
Water-toGypsum Ratio
Dimensions **(cm) Test Performed
I
E0.8 0%
0.8 16 × 4 × 4 Young’smodulus
E0.8 50PR 50%E0.8 60PR 60%E0.8 70PR 70%
II
E0.8 0%
0.8 15 × 15 × 2 Shock-ImpactResistance
E0.8 50PR 50%E0.8 60PR 60%E0.8 70PR 70%
III
E0.8 0%
0.8 40 × 30 × 1 Flexural strengthE0.8 50PR 50%E0.8 60PR 60%E0.8 70PR 70%
IV
E0.8 0%
0.8 30 × 30 × 3
Thermalconductivity
Surface thermalcomfort
E0.8 50PR 50%E0.8 60PR 60%E0.8 70PR 70%
* Calculated on the mass of gypsum. ** Length ×Width × Height.
Young’s modulus: Young’s modulus was determined by the dynamic and staticmethods according to the standard UNE-EN 13279-2 [30]. For the dynamic Young’smodulus, the ultrasonic propagation velocity was determined using the Ultrasonic testerE46 (Ibertest, Madrid, Spain). First, a gel was applied on each of the sides where theemitter and receiver were placed, in order to favor the transmission of the sound waves;passing time readings were taken longitudinally between these sides (Figure 2A). For thestatic Young’s modulus, the Autotest 200-10SW equipment was used (Ibertest, Madrid,Spain), on which the sample was positioned vertically and the extensometers were placed(Figure 2B). The equipment then compressed the sample and recorded the numerical valueof Young’s modulus.
Materials 2021, 14, 2255 4 of 13Materials 2021, 14, x FOR PEER REVIEW 4 of 13
Figure 2. Young’s modulus test: (A) Dynamic test; and (B) static test.
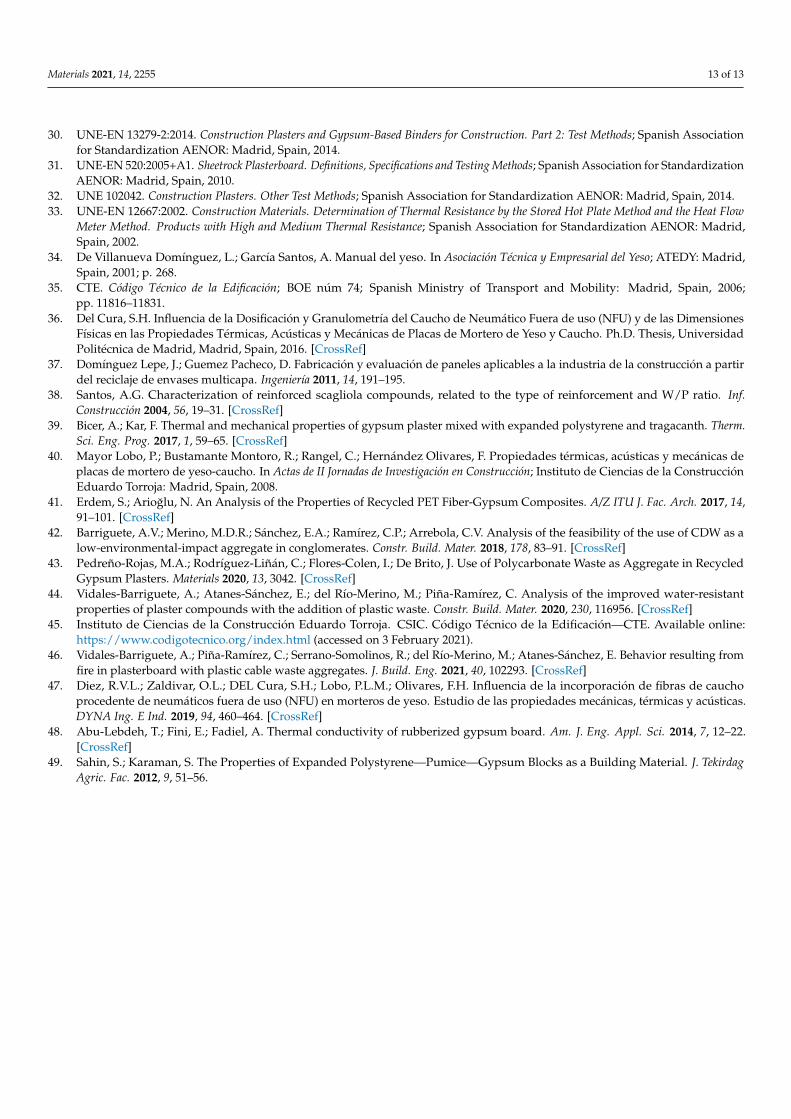
Shock-impact resistance: The shock-impact resistance was determined by carrying out tests to establish the hardness of the gypsum board surface, as indicated in the UNE-EN 520 standard [31]. Previously, Shore C hardness values were taken with a durometer (Baxlo, Barcelona, Spain), as specified in the UNE-102042 standard [32]. The samples were then placed on a rigid table face up. A steel ball, 50 mm in diameter and with 510 ± 10 g mass, was placed at a height of 500 ± 5 mm and was dropped (Figure 3). Finally, the di-ameter of the mark left by the impact was measured with 0.01 mm precision calipers. Each measurement was repeated five times and the mean value was calculated. The shock-im-pact resistance was measured by the depth of the mark determined by the steel ball after impact, according to the expression:
h = [D − √(D2 − d2)]/2 (1)
where, h is the depth of the mark after impact, in mm; D is the diameter of the steel ball, in mm; and d is the diameter of the mark after impact, in mm.
Figure 3. Shock-Impact Resistance test: (A) test equipment; and (B) board after test.
Flexural strength: The flexural strength was determined through testing the mechan-ical flexural strength of the boards subjected to a three-point bending flexural test, accord-ing to the UNE-EN 520:2004 standard [31]. The boards were placed horizontally on an ETI H0285 testing machine (Proeti, Madrid, Spain), equipped with two parallel cylindrical supports arranged on a leveled base (Figure 4). Then, by means of a loading roller, the load was applied continuously to the center of the board at a speed of approximately 200 N/min, until breakage. The data collection equipment was the MPX-22 (Pácam, Toledo, Spain) and the reading software used was EPO-1.
Figure 4. Flexural strength test: (A) test equipment; and (B) board with PR during test.
Figure 2. Young’s modulus test: (A) Dynamic test; and (B) static test.
Shock-impact resistance: The shock-impact resistance was determined by carrying outtests to establish the hardness of the gypsum board surface, as indicated in the UNE-EN520 standard [31]. Previously, Shore C hardness values were taken with a durometer(Baxlo, Barcelona, Spain), as specified in the UNE-102042 standard [32]. The sampleswere then placed on a rigid table face up. A steel ball, 50 mm in diameter and with510 ± 10 g mass, was placed at a height of 500 ± 5 mm and was dropped (Figure 3).Finally, the diameter of the mark left by the impact was measured with 0.01 mm precisioncalipers. Each measurement was repeated five times and the mean value was calculated.The shock-impact resistance was measured by the depth of the mark determined by thesteel ball after impact, according to the expression:
h = [D −√
(D2 − d2)]/2 (1)
where, h is the depth of the mark after impact, in mm; D is the diameter of the steel ball,in mm; and d is the diameter of the mark after impact, in mm.
Materials 2021, 14, x FOR PEER REVIEW 4 of 13
Figure 2. Young’s modulus test: (A) Dynamic test; and (B) static test.
Shock-impact resistance: The shock-impact resistance was determined by carrying out tests to establish the hardness of the gypsum board surface, as indicated in the UNE-EN 520 standard [31]. Previously, Shore C hardness values were taken with a durometer (Baxlo, Barcelona, Spain), as specified in the UNE-102042 standard [32]. The samples were then placed on a rigid table face up. A steel ball, 50 mm in diameter and with 510 ± 10 g mass, was placed at a height of 500 ± 5 mm and was dropped (Figure 3). Finally, the di-ameter of the mark left by the impact was measured with 0.01 mm precision calipers. Each measurement was repeated five times and the mean value was calculated. The shock-im-pact resistance was measured by the depth of the mark determined by the steel ball after impact, according to the expression:
h = [D − √(D2 − d2)]/2 (1)
where, h is the depth of the mark after impact, in mm; D is the diameter of the steel ball, in mm; and d is the diameter of the mark after impact, in mm.
Figure 3. Shock-Impact Resistance test: (A) test equipment; and (B) board after test.
Flexural strength: The flexural strength was determined through testing the mechan-ical flexural strength of the boards subjected to a three-point bending flexural test, accord-ing to the UNE-EN 520:2004 standard [31]. The boards were placed horizontally on an ETI H0285 testing machine (Proeti, Madrid, Spain), equipped with two parallel cylindrical supports arranged on a leveled base (Figure 4). Then, by means of a loading roller, the load was applied continuously to the center of the board at a speed of approximately 200 N/min, until breakage. The data collection equipment was the MPX-22 (Pácam, Toledo, Spain) and the reading software used was EPO-1.
Figure 4. Flexural strength test: (A) test equipment; and (B) board with PR during test.
Figure 3. Shock-Impact Resistance test: (A) test equipment; and (B) board after test.
Flexural strength: The flexural strength was determined through testing the mechani-cal flexural strength of the boards subjected to a three-point bending flexural test, accordingto the UNE-EN 520:2004 standard [31]. The boards were placed horizontally on an ETIH0285 testing machine (Proeti, Madrid, Spain), equipped with two parallel cylindricalsupports arranged on a leveled base (Figure 4). Then, by means of a loading roller, the loadwas applied continuously to the center of the board at a speed of approximately 200 N/min,until breakage. The data collection equipment was the MPX-22 (Pácam, Toledo, Spain) andthe reading software used was EPO-1.
Thermal conductivity: The thermal conductivity coefficient was determined using the“Determination of thermal resistance by means of guarded hot plate and heat flow metermethods. Products of high and medium thermal resistance” test defined in the UNE-EN12667 standard [33]. For this purpose, LaserComp Fox 304 (TA Instruments, New Castle,UK) equipment was used, into which the previously weighed prepared samples wereintroduced (Figure 5). The equipment established, inside the samples, a constant ratio anduniformity in the heat flux density by means of a heating unit, heat flux meters, and acooling unit. The equipment provided the following data: Apparent density, thermal

Materials 2021, 14, 2255 5 of 13
conductivity, heat flux, and thermal resistance. For each composite, three samples weretested. The value presented in this work for each of the properties corresponds to theiraverage value.
Materials 2021, 14, x FOR PEER REVIEW 4 of 13
Figure 2. Young’s modulus test: (A) Dynamic test; and (B) static test.
Shock-impact resistance: The shock-impact resistance was determined by carrying out tests to establish the hardness of the gypsum board surface, as indicated in the UNE-EN 520 standard [31]. Previously, Shore C hardness values were taken with a durometer (Baxlo, Barcelona, Spain), as specified in the UNE-102042 standard [32]. The samples were then placed on a rigid table face up. A steel ball, 50 mm in diameter and with 510 ± 10 g mass, was placed at a height of 500 ± 5 mm and was dropped (Figure 3). Finally, the di-ameter of the mark left by the impact was measured with 0.01 mm precision calipers. Each measurement was repeated five times and the mean value was calculated. The shock-im-pact resistance was measured by the depth of the mark determined by the steel ball after impact, according to the expression:
h = [D − √(D2 − d2)]/2 (1)
where, h is the depth of the mark after impact, in mm; D is the diameter of the steel ball, in mm; and d is the diameter of the mark after impact, in mm.
Figure 3. Shock-Impact Resistance test: (A) test equipment; and (B) board after test.
Flexural strength: The flexural strength was determined through testing the mechan-ical flexural strength of the boards subjected to a three-point bending flexural test, accord-ing to the UNE-EN 520:2004 standard [31]. The boards were placed horizontally on an ETI H0285 testing machine (Proeti, Madrid, Spain), equipped with two parallel cylindrical supports arranged on a leveled base (Figure 4). Then, by means of a loading roller, the load was applied continuously to the center of the board at a speed of approximately 200 N/min, until breakage. The data collection equipment was the MPX-22 (Pácam, Toledo, Spain) and the reading software used was EPO-1.
Figure 4. Flexural strength test: (A) test equipment; and (B) board with PR during test. Figure 4. Flexural strength test: (A) test equipment; and (B) board with PR during test.
Materials 2021, 14, x FOR PEER REVIEW 5 of 13
Thermal conductivity: The thermal conductivity coefficient was determined using the “Determination of thermal resistance by means of guarded hot plate and heat flow meter methods. Products of high and medium thermal resistance” test defined in the UNE-EN 12667 standard [33]. For this purpose, LaserComp Fox 304 (TA Instruments, New Castle, UK) equipment was used, into which the previously weighed prepared sam-ples were introduced (Figure 5). The equipment established, inside the samples, a constant ratio and uniformity in the heat flux density by means of a heating unit, heat flux meters, and a cooling unit. The equipment provided the following data: Apparent density, ther-mal conductivity, heat flux, and thermal resistance. For each composite, three samples were tested. The value presented in this work for each of the properties corresponds to their average value.
Figure 5. Thermal conductivity test: (A) The boards prepared for testing; and (B) board with PR during test.
Surface thermal comfort and visual aspect: The surface thermal comfort was deter-mined using Villanueva’s Plaster Manual [34] (Figure 6). For this purpose, the heat pene-tration coefficient was calculated, which is given by the expression:
b = √(λ × c × ρ) (2)
where, b is the thermal penetration coefficient, in J/(s0.5m2K); λ is the thermal conductivity, in W/mK; c is the specific heat, in J/kgK, according to the Technical Building Code [35], for high hardness gypsum boards it is 1000 J/kgK; and ρ is the density, in kg/m3.
Figure 6. Boards used in the surface thermal comfort test.
To evaluate the visual appearance of the composites, the boards were manually plas-tered and then painted.
3. Results and Discussion The results obtained for the composites after performing the tests described above
are shown below:
3.1. Young’s Modulus Figure 7 shows the Young’s modulus data obtained in the two variants studied: Static
and dynamic. These tests were carried out on Series I composites.
Figure 5. Thermal conductivity test: (A) The boards prepared for testing; and (B) board with PRduring test.
Surface thermal comfort and visual aspect: The surface thermal comfort was de-termined using Villanueva’s Plaster Manual [34] (Figure 6). For this purpose, the heatpenetration coefficient was calculated, which is given by the expression:
b =√
(λ × c × $) (2)
where, b is the thermal penetration coefficient, in J/(s0.5m2K); λ is the thermal conductivity,in W/mK; c is the specific heat, in J/kgK, according to the Technical Building Code [35],for high hardness gypsum boards it is 1000 J/kgK; and $ is the density, in kg/m3.
Materials 2021, 14, x FOR PEER REVIEW 5 of 13
Thermal conductivity: The thermal conductivity coefficient was determined using the “Determination of thermal resistance by means of guarded hot plate and heat flow meter methods. Products of high and medium thermal resistance” test defined in the UNE-EN 12667 standard [33]. For this purpose, LaserComp Fox 304 (TA Instruments, New Castle, UK) equipment was used, into which the previously weighed prepared sam-ples were introduced (Figure 5). The equipment established, inside the samples, a constant ratio and uniformity in the heat flux density by means of a heating unit, heat flux meters, and a cooling unit. The equipment provided the following data: Apparent density, ther-mal conductivity, heat flux, and thermal resistance. For each composite, three samples were tested. The value presented in this work for each of the properties corresponds to their average value.
Figure 5. Thermal conductivity test: (A) The boards prepared for testing; and (B) board with PR during test.
Surface thermal comfort and visual aspect: The surface thermal comfort was deter-mined using Villanueva’s Plaster Manual [34] (Figure 6). For this purpose, the heat pene-tration coefficient was calculated, which is given by the expression:
b = √(λ × c × ρ) (2)
where, b is the thermal penetration coefficient, in J/(s0.5m2K); λ is the thermal conductivity, in W/mK; c is the specific heat, in J/kgK, according to the Technical Building Code [35], for high hardness gypsum boards it is 1000 J/kgK; and ρ is the density, in kg/m3.
Figure 6. Boards used in the surface thermal comfort test.
To evaluate the visual appearance of the composites, the boards were manually plas-tered and then painted.
3. Results and Discussion The results obtained for the composites after performing the tests described above
are shown below:
3.1. Young’s Modulus Figure 7 shows the Young’s modulus data obtained in the two variants studied: Static
and dynamic. These tests were carried out on Series I composites.
Figure 6. Boards used in the surface thermal comfort test.
To evaluate the visual appearance of the composites, the boards were manuallyplastered and then painted.
3. Results and Discussion
The results obtained for the composites after performing the tests described above areshown below:
3.1. Young’s Modulus
Figure 7 shows the Young’s modulus data obtained in the two variants studied: Staticand dynamic. These tests were carried out on Series I composites.

Materials 2021, 14, 2255 6 of 13Materials 2021, 14, x FOR PEER REVIEW 6 of 13
Figure 7. Young’s modulus values (UNE-EN 13279-2).
The static Young’s modulus showed a significant decrease in the stiffness of all the composites, with respect to the reference sample. Specifically, the composites with 50% and 60% PR were 58.62% more elastic, and the composite with 70% PR was 65.52% more elastic, which shows the effect of plastic waste on the elastic behavior of the material. Ac-cordingly, the most elastic composite containing PR was E0.8 70PR (500.00 MPa) and the stiff-est were both E0.8 50PR and E0.8 60PR (600.00 MPa).
The results for the dynamic Young’s modulus also indicated a significant decrease in the stiffness of the mixtures with respect to the reference sample, close to 50%. The com-posite with 50% PR decreased the dynamic Young’s modulus by 42.04%, the composite with 60% PR by 46.23%, and the composite with 70% PR by 48.13%. In this case, the most elastic PR composite was also E0.8 70PR (2664.15 MPa) and the stiffest was E0.8 50PR (2976.26 MPa). These data corroborate the results obtained in other studies using gypsum and rub-ber waste [36–39], in which the elasticity of the compounds significantly increased with the content of polymer waste.
3.2. Shock-Impact Resistance Considering that gypsum boards can be exposed to impact from objects at any time,
the resistance of the composites in this regard was tested. In the analysis of the shock-impact resistance test, carried out in Series II, the diameter and depth of the steel ball mark were determined, as shown in Table 2.
Table 2. Shock-impact resistance (UNE-EN 520).
Series Name Shore C
Hardness Mark Diameter
d (mm) Mark Depth h
(mm)
II
E0.8 78 14.70 ± 0.40 1.17 ± 0.06 E0.8 50PR 81.17 11.68 ± 0.97 0.73 ± 0.11 E0.8 60PR 80.6 13.70 ± 0.97 1.01 ± 0.14 E0.8 70PR 81.6 13.18 ± 0.63 0.93 ± 0.09
In the case of the reference board E0.8, the first impact broke the sample. However, in all the impacts on the samples with PR, the steel ball rebounded, which corroborated the increase in elasticity achieved in the composites under study (verified and analyzed with Young’s modulus in the previous section), showing the composite E0.8 50PR the highest shock-impact resistance (0.73 mm mark depth). These results are also similar to those ob-tained by other researchers [36,37,40,41], in which the improvement of the shock-impact resistance capacity was observed in mixtures of plaster with polymeric residues.
E0.8 E0.8 50PR E0.8 60PR E0.8 70PRStatic 1450.00 600.00 600.00 500.00Dynamic 5136.65 2976.26 2762.18 2664.15
0.00
1000.00
2000.00
3000.00
4000.00
5000.00
6000.00
7000.00
Youn
g's m
odul
us (M
Pa)
Figure 7. Young’s modulus values (UNE-EN 13279-2).
The static Young’s modulus showed a significant decrease in the stiffness of all thecomposites, with respect to the reference sample. Specifically, the composites with 50% and60% PR were 58.62% more elastic, and the composite with 70% PR was 65.52% more elastic,which shows the effect of plastic waste on the elastic behavior of the material. Accordingly,the most elastic composite containing PR was E0.8 70PR (500.00 MPa) and the stiffest wereboth E0.8 50PR and E0.8 60PR (600.00 MPa).
The results for the dynamic Young’s modulus also indicated a significant decrease inthe stiffness of the mixtures with respect to the reference sample, close to 50%. The compos-ite with 50% PR decreased the dynamic Young’s modulus by 42.04%, the composite with60% PR by 46.23%, and the composite with 70% PR by 48.13%. In this case, the most elasticPR composite was also E0.8 70PR (2664.15 MPa) and the stiffest was E0.8 50PR (2976.26 MPa).These data corroborate the results obtained in other studies using gypsum and rubberwaste [36–39], in which the elasticity of the compounds significantly increased with thecontent of polymer waste.
3.2. Shock-Impact Resistance
Considering that gypsum boards can be exposed to impact from objects at any time,the resistance of the composites in this regard was tested. In the analysis of the shock-impact resistance test, carried out in Series II, the diameter and depth of the steel ball markwere determined, as shown in Table 2.
Table 2. Shock-impact resistance (UNE-EN 520).
Series Name Shore CHardness
Mark Diameterd (mm)
Mark Depthh (mm)
II
E0.8 78 14.70 ± 0.40 1.17 ± 0.06E0.8 50PR 81.17 11.68 ± 0.97 0.73 ± 0.11E0.8 60PR 80.6 13.70 ± 0.97 1.01 ± 0.14E0.8 70PR 81.6 13.18 ± 0.63 0.93 ± 0.09
In the case of the reference board E0.8, the first impact broke the sample. However,in all the impacts on the samples with PR, the steel ball rebounded, which corroboratedthe increase in elasticity achieved in the composites under study (verified and analyzedwith Young’s modulus in the previous section), showing the composite E0.8 50PR the highestshock-impact resistance (0.73 mm mark depth). These results are also similar to thoseobtained by other researchers [36,37,40,41], in which the improvement of the shock-impactresistance capacity was observed in mixtures of plaster with polymeric residues.

Materials 2021, 14, 2255 7 of 13
3.3. Flexural Strength
Considering that the boards can work under the mechanical effect of bending, tests forflexural strength were carried out on the composites. Table 3 shows the results of theflexural breaking load and the displacement of the boards made with the Series III mixtures.
Table 3. Flexural breaking load of boards and displacement under load (UNE-EN 520).
Series Name Flexural Breaking Load (kN) Displacement under Load (mm)
III
E0.8 0.284 ± 0.02 2.06 ± 0.49E0.8 50PR 0.173 ± 0.03 14.37 ± 1.22E0.8 60PR 0.160 ± 0.02 16.86 ± 0.69E0.8 70PR 0.177 ± 0.01 16.25 ± 0.79
The mean flexural breaking load in the mixtures decreased by 39.08%, 43.66% and37.68% respectively, with 50% PR, 60% PR and 70% PR content, compared to the referencesample. A similar phenomenon occurred in the flexural tests of prismatic samples describedin [42]. In that article, SEM images showed, that the dihydrate gypsum crystals form aporous network that surrounds the much larger particles of plastic waste. These imagesshowed the presence of a certain amount of discontinuities in the gypsum-pellet junction,which would explain the decrease in the mechanical properties of these compounds. On theother hand, the displacement admitted by the boards of the composites with 50% PR,60% PR and 70% PR exceeded the displacement admitted by the reference board by697.57%, 818.45% and 788.83%, respectively. This verifies, once again, the results obtainedin the Young’s modulus tests, in which the elasticity of the composites with PR increasedconsiderably. All of the boards, except the E0.8 60PR board, exceeded the minimum breakingload value (Figure 8) required by the UNE-EN 520 standard (0.168 kN); however, it is truethat, in this standard, the boards were prepared with a sheet of paper or cardboard on oneof their sides, which was not taken into account in the case of the boards tested. Therefore,it would be advisable to carry out the test with boards prepared with a covering layer ofeither paper or cardboard and recheck their flexural breaking load value, which wouldpossibly sufficiently increase the E0.8 60PR board qualities to meet the requirements of theaforementioned standard. The PR composite with the highest flexural strength among theboards was E0.8 70PR (0.177 kN) and the one with the lowest flexural strength was E0.8 60PR(0.160 kN).
Materials 2021, 14, x FOR PEER REVIEW 7 of 13
3.3. Flexural Strength Considering that the boards can work under the mechanical effect of bending, tests
for flexural strength were carried out on the composites. Table 3 shows the results of the flexural breaking load and the displacement of the boards made with the Series III mix-tures.
Table 3. Flexural breaking load of boards and displacement under load (UNE-EN 520).
Series Name Flexural Breaking Load (kN)
Displacement under Load (mm)
III
E0.8 0.284 ± 0.02 2.06 ± 0.49 E0.8 50PR 0.173 ± 0.03 14.37 ± 1.22 E0.8 60PR 0.160 ± 0.02 16.86 ± 0.69 E0.8 70PR 0.177 ± 0.01 16.25 ± 0.79
The mean flexural breaking load in the mixtures decreased by 39.08%, 43.66% and 37.68% respectively, with 50%PR, 60%PR and 70%PR content, compared to the reference sample. A similar phenomenon occurred in the flexural tests of prismatic samples de-scribed in [42]. In that article, SEM images showed, that the dihydrate gypsum crystals form a porous network that surrounds the much larger particles of plastic waste. These images showed the presence of a certain amount of discontinuities in the gypsum-pellet junction, which would explain the decrease in the mechanical properties of these com-pounds. On the other hand, the displacement admitted by the boards of the composites with 50%PR, 60%PR and 70%PR exceeded the displacement admitted by the reference board by 697.57%, 818.45% and 788.83%, respectively. This verifies, once again, the results obtained in the Young’s modulus tests, in which the elasticity of the composites with PR increased considerably. All of the boards, except the E0.8 60PR board, exceeded the minimum breaking load value (Figure 8) required by the UNE-EN 520 standard (0.168 kN); however, it is true that, in this standard, the boards were prepared with a sheet of paper or card-board on one of their sides, which was not taken into account in the case of the boards tested. Therefore, it would be advisable to carry out the test with boards prepared with a covering layer of either paper or cardboard and recheck their flexural breaking load value, which would possibly sufficiently increase the E0.8 60PR board qualities to meet the require-ments of the aforementioned standard. The PR composite with the highest flexural strength among the boards was E0.8 70PR (0.177 kN) and the one with the lowest flexural strength was E0.8 60PR (0.160 kN).
Figure 8. Average load-displacement values of the composites (UNE-EN 520).
E0.8:0.284; 2.06
E0.8 50PR:0.173;14.37
E0.8 60PR:0.16;16.86
E0.8 70PR:0.177;16.25
0
0.05
0.1
0.15
0.2
0.25
0.3
0 5 10 15 20
Flex
ural
bre
akin
g lo
ad (k
N)
Displacement under load (mm)
Minimum value 0.168 kN UNE-EN 520
Figure 8. Average load-displacement values of the composites (UNE-EN 520).

Materials 2021, 14, 2255 8 of 13
From the load-displacement graphs of each of the mixtures, the higher flexural strengthand stiffness of the reference, as well as the reduction of the flexural strength of thecomposites with PR and their higher deformation capacity (elasticity), can be deduced(Figure 9).
Materials 2021, 14, x FOR PEER REVIEW 8 of 13
From the load-displacement graphs of each of the mixtures, the higher flexural strength and stiffness of the reference, as well as the reduction of the flexural strength of the composites with PR and their higher deformation capacity (elasticity), can be deduced (Figure 9).
Figure 9. Load-displacement of the composites.
Similar results have also been observed in the studies of other researchers [14,40,41,43] where, by introducing polymeric residues, the deforming capacity of the mix-tures was increased.
3.4. Thermal Conductivity The results obtained after the test according to the UNE-EN 12667, carried out in Se-
ries IV, are shown in Table 4. Density, thermal conductivity, heat flux, and thermal re-sistance were determined.
Table 4. Apparent density, thermal conductivity, heat flux, and thermal resistance (UNE-EN 12667).
Series Name Density (kg/m3) Thermal Conductiv-
ity—λ (W/mK) Heat Flux
(W/m2) Thermal Resistance
(m2K/W)
IV
E0.8 969.97 0.2444 ± 0.02 151.8 0.1326 E0.8 50PR 980.3 0.2298 ± 0.01 143.8 0.1395 E0.8 60PR 994.27 0.2264 ± 0.03 137 0.1488 E0.8 70PR 998.67 0.2469 ± 0.02 149 0.1346
Compared to the reference sample, the apparent density of the samples increased with the incorporation of PR and, a higher content of pellets. This increase was in agree-ment with the evolution of porosity of these samples, as determined in previous studies [44], with a pore volume value of 0.5419 cm3/g for the reference sample. This value pro-gressively decreased to values of 0.467, 0.4276, and 0.3447 cm3/g for the composites with 50%, 60%, and 70% PR, respectively, resulting in decreases in porosity of 22.18%, 20.57%, and 32.58%, respectively, compared to the reference sample. In other words, the incorpo-ration of PR produced a lower porosity, which resulted in a higher value for the apparent density of the composites with PR, compared to the reference one; the higher the PR con-tent, the higher the density, as the pore volume decreased.
0.00
0.03
0.06
0.09
0.12
0.15
0.18
0.21
0.24
0.27
0.30
0 1 2 3 4 5 6 7 8 9 10 11 12 13 14
Flex
ural
load
(kN
)
Displacement under load (mm)
E0.8 E0.8 50PR E0.8 60PR E0.8 70PR
Figure 9. Load-displacement of the composites.
Similar results have also been observed in the studies of other researchers [14,40,41,43]where, by introducing polymeric residues, the deforming capacity of the mixtures was increased.
3.4. Thermal Conductivity
The results obtained after the test according to the UNE-EN 12667, carried out inSeries IV, are shown in Table 4. Density, thermal conductivity, heat flux, and thermalresistance were determined.
Table 4. Apparent density, thermal conductivity, heat flux, and thermal resistance (UNE-EN 12667).
Series Name Density(kg/m3)
ThermalConductivity—λ
(W/mK)
Heat Flux(W/m2)
ThermalResistance(m2K/W)
IV
E0.8 969.97 0.2444 ± 0.02 151.8 0.1326E0.8 50PR 980.3 0.2298 ± 0.01 143.8 0.1395E0.8 60PR 994.27 0.2264 ± 0.03 137 0.1488E0.8 70PR 998.67 0.2469 ± 0.02 149 0.1346
Compared to the reference sample, the apparent density of the samples increased withthe incorporation of PR and, a higher content of pellets. This increase was in agreement withthe evolution of porosity of these samples, as determined in previous studies [44], with apore volume value of 0.5419 cm3/g for the reference sample. This value progressivelydecreased to values of 0.467, 0.4276, and 0.3447 cm3/g for the composites with 50%, 60%,and 70% PR, respectively, resulting in decreases in porosity of 22.18%, 20.57%, and 32.58%,respectively, compared to the reference sample. In other words, the incorporation of PRproduced a lower porosity, which resulted in a higher value for the apparent density of thecomposites with PR, compared to the reference one; the higher the PR content, the higherthe density, as the pore volume decreased.
The value obtained with this method for the thermal conductivity of the referencesample was very similar to the generic value of 0.25 W/mK assigned in the TechnicalBuilding Code [45] for gypsum boards.

Materials 2021, 14, 2255 9 of 13
In none of the three thermal properties in Table 4 (thermal conductivity, heat flux,and thermal resistance) was an increasing or decreasing linear relationship observedbetween the mixtures with PR and the reference. In the composites with 50% PR and60% PR, the thermal conductivity values decreased by 5.97% and 7.36%, respectively.Consequently, the heat flux decreased, by 5.27% and 9.75%, and the thermal resistancevalue increased by 5.20% and 12.22%, respectively. However, in case of the compositewith 70% PR, the thermal conductivity increased (by 1.02%) with respect to the reference,the heat flux decreased (by 1.84%), and the thermal resistance also slightly increased (by1.51%). These results concerning the thermal properties depending on the PR content inthe samples can be explained on the basis of two factors with opposite effects on theseproperties. Taking into account the lower porosity and, therefore, the lower presence of airin pores, the thermal conductivity of the composites with PR should be higher than that ofthe reference, where a higher amount of PR should lead to a higher thermal conductivity.However, according to the results presented in Table 4, this was not the case. This behaviormay have been due to the fact that the thermal conductivity was affected not only by thepore volume of the samples but also by the presence of the pellets, which make their owncontribution to the thermal conductivity of the composites.
The most abundant polymers in electric cable waste are PVC and PE [46], which haveexhibited conductivities of 0.17 W/(mK) for PVC and 0.5 and 0. 33 W/(mK) for high andlow-density PE, respectively [45]. The pellets used in this work were a heterogeneousmixture of polymers, and it is possible that the thermal conductivity of PR may have beenlower than that of gypsum; as such, the presence of PR in the composites would have ledto a decrease in the thermal conductivity of the samples. This would have been especiallythe case with samples with higher PR content, as was observed in the samples with 50%and 60% PR having values lower than the reference, and even lower for the sample withhigher pellet content (E0.860PR).
For sample E0.870PR, this decrease in thermal conductivity due to the high PR content(70%) would have been counteracted by a pore volume much lower than the pore volumesof the rest of the samples, which would have globally led to an increase in thermal conduc-tivity to a value slightly higher than that of the reference sample. However, the values ofthe three thermal properties in Table 4 for the E0.870PR compound were very similar to thevalues obtained in the reference, with a difference of less than 2% in all of them. Therefore,with regards to the thermal properties according to the PR content, at concentrations of upto 60% PR, the effect of the lower conductivity of the pellets with respect to the gypsumprevailed, resulting in lower values for the thermal conductivity of the composites, com-pared to the reference. At high concentrations (e.g., 70% PR), the effect of a much lowerpore volume prevailed, which increased the thermal conductivity of the composite to avalue close to that of the reference.
The composite with the highest apparent density, E0.870PR, had the highest thermalconductivity coefficient (0.2469 W/mK), the highest heat flux (149.0 W/m2), and the lowestthermal resistance (0.1346 m2K/W). However, the composite with the lowest apparentdensity, E0.850PR, did not present the lowest conductivity coefficient, lowest heat flux,or highest thermal resistance; rather, it was the intermediate density composite, E0.860PR,with values of 0.2264 W/mK, 137.0 W/m2, and 0.1488 m2K/W, respectively.
In any case, the results of Table 4 indicate that the thermal behavior of the composites withPR did not present great differences, with respect to the gypsum reference. The incorporationof pellets up to 60% of PR did not imply a high increase in the insulation capacity, as thethermal conductivity coefficient of the materials studied was much higher with respect to thethermal conductivity coefficient of an insulating material, such as expanded polystyrene ormineral wool, with thermal conductivities of 0.039 W/(mK) and 0.050 W/(mK) respectively.However, it should be noted that, according to the data obtained, both the E0.850PR andE0.860PR boards showed a slight thermal improvements with respect to the board withoutPR, which makes them more energy-efficient than the traditional material, corroborating thestudies of other researchers using polymeric waste [36,47–49].

Materials 2021, 14, 2255 10 of 13
3.5. Surface Thermal Comfort and Visual Appearance
The thermal conductivity coefficients and densities obtained in the thermal test “Deter-mination of thermal resistance by means of guarded hot plate and heat flow meter methods.Products of high and medium thermal resistance”, defined in the UNE-EN 12667 standard(Table 4), are used to determine the values of thermal comfort or perceived sensation whentouching the surface of a material. With these data, the heat penetration coefficient ofeach of the composites was calculated (Table 5): The lower this coefficient is, the morecomfortable the surface of the material is to the touch, the less cold it is and, therefore,the less condensation that may appear on it [34].
Table 5. Thermal comfort due to heat penetration coefficient.
Series Name Specific Heat(J/kgK) Heat Penetration Coefficient (J/(s0.5m2K))
IV
E0.8 1000 486.89E0.8 50PR 1000 474.63E0.8 60PR 1000 474.45E0.8 70PR 1000 496.56
The surface comfort of all the composites, expressed in terms of the coefficient ofthermal penetration, was very similar to that of the reference sample. The mixtures with50% PR and 60% PR showed a slight improvement (of about 2.50%), while the mixture with70% PR slightly worsened (by 2%), due to the slight increase in its coefficient of thermalconductivity, as analyzed in the previous section. The composite with the lowest heatpenetration coefficient and, therefore, the one that had the best surface comfort was E0.8 60PR(474.45 J/(s0.5m2K)); however, it had a value very similar to that of E0.8 50PR. The compositewith the highest heat penetration coefficient and, therefore, the one that had the worstsurface comfort was E0,8 70PR (496,56 J/s1/2m2K).
Generally, such boards are treated with a surface finish that can be affected by small set-tlement movements or can expand due to temperature changes in the building. Figure 10Ashows images of the reference composite (left image), with gypsum plastering (middleimage), and after paint application (right image). Figure 10B shows the same imagesfor a composite with PR. The visual effect of the surface finishes of the composites withPR (Series IV), once the paint had been applied (Figure 10B), was similar to that for thecomposites without PR (Figure 10A). An improvement in the behavior of the compositeswith PR, with respect to the appearance of cracks, is highlighted; this was due to theirhigh elasticity, as observed in the flexural strength test. The fact that the composites withPR without any coating have a rough appearance, as shown in the image on the left ofFigure 10B, is also an advantage, as this facilitates the adhesion of coating materials suchas paints or tiling.
Materials 2021, 14, x FOR PEER REVIEW 10 of 13
obtained, both the E0.850PR and E0.860PR boards showed a slight thermal improvements with respect to the board without PR, which makes them more energy-efficient than the traditional material, corroborating the studies of other researchers using polymeric waste [36,47–49].
3.5. Surface Thermal Comfort and Visual Appearance The thermal conductivity coefficients and densities obtained in the thermal test “De-
termination of thermal resistance by means of guarded hot plate and heat flow meter methods. Products of high and medium thermal resistance”, defined in the UNE-EN 12667 standard (Table 4), are used to determine the values of thermal comfort or perceived sensation when touching the surface of a material. With these data, the heat penetration coefficient of each of the composites was calculated (Table 5): The lower this coefficient is, the more comfortable the surface of the material is to the touch, the less cold it is and, therefore, the less condensation that may appear on it [34].
Table 5. Thermal comfort due to heat penetration coefficient.
Series Name Specific Heat
(J/kgK) Heat Penetration Coefficient (J/(s0.5m2K))
IV
E0.8 1000 486.89 E0.8 50PR 1000 474.63 E0.8 60PR 1000 474.45 E0.8 70PR 1000 496.56
The surface comfort of all the composites, expressed in terms of the coefficient of thermal penetration, was very similar to that of the reference sample. The mixtures with 50%PR and 60%PR showed a slight improvement (of about 2.50%), while the mixture with 70%PR slightly worsened (by 2%), due to the slight increase in its coefficient of thermal conductivity, as analyzed in the previous section. The composite with the lowest heat pen-etration coefficient and, therefore, the one that had the best surface comfort was E0.8 60PR
(474.45 J/(s0.5m2K)); however, it had a value very similar to that of E0.8 50PR. The composite with the highest heat penetration coefficient and, therefore, the one that had the worst surface comfort was E0,8 70PR (496,56 J/s1/2m2K).
Generally, such boards are treated with a surface finish that can be affected by small settlement movements or can expand due to temperature changes in the building. Figure 10A shows images of the reference composite (left image), with gypsum plastering (mid-dle image), and after paint application (right image). Figure 10B shows the same images for a composite with PR. The visual effect of the surface finishes of the composites with PR (Series IV), once the paint had been applied (Figure 10B), was similar to that for the composites without PR (Figure 10A). An improvement in the behavior of the composites with PR, with respect to the appearance of cracks, is highlighted; this was due to their high elasticity, as observed in the flexural strength test. The fact that the composites with PR without any coating have a rough appearance, as shown in the image on the left of Figure 10B, is also an advantage, as this facilitates the adhesion of coating materials such as paints or tiling.
Figure 10. Board finishes: (A) Reference board; an (B) composite board with PR.

Materials 2021, 14, 2255 11 of 13
4. Conclusions
Boards including plastic cable waste showed a significant improvement, in termsof cracking and impact resistance, compared to traditional boards. This was becausethe incorporation of the plastic cable waste in the gypsum matrix increased elasticity byapproximately 50%, compared to the reference composites without added waste.
In terms of flexural breaking load, all the composites exceeded the minimum valueestablished in the standards, except the one with 60%PR, which had a value of 0.008 kNlower than said minimum value. It should be noted that the composites were not manufac-tured with a paper or cardboard coating on one of the sides (as indicated in the standard),which suggests that, if this were the case, the flexural strength value would increase,thus potentially complying with the standard.
The thermal behavior of the composites with PR did not show major differences,with respect to the gypsum reference composite; however, the thermal properties alsoimproved slightly with pellet contents of up to 60%, which led to a contribution to a lowerenergy demand, with respect to the traditional material.
The same was true for the finish of the composites which, although similar to that of thereference, showed a slight improvement in surface comfort in the composites with plasticcable waste. This means that the boards were less cold, and therefore, less condensationmay appear on them. Their roughness, before any finishing, also indicated an increase inthe adherence to the support or to the final finish.
For all these reasons, it is considered that the use of plastic cable waste as aggregates forthe manufacture of gypsum boards provides advantages over traditional boards. It wouldbe of interest to use them not only in new construction, but also in building renovations,where the appearance of cracks, condensation, breakage, and/or spalling due to impact,or detachment of the finishing material (e.g., paint or tiling) would be reduced.
In addition, the manufacturing of this type of board would serve as a contribution tosustainable construction, not only due to the improvement in the thermal properties of theboard (lower energy demand), but also because of the incorporation of plastic waste as asecondary raw material, which minimizes this type of waste and reduces the amount ofgypsum and water used for the manufacture of the boards.
Author Contributions: Conceptualization, A.V.-B., C.P.-R., M.K.-K., K.K.-W., E.A.-S.; methodology,A.V.-B., K.K.-W., E.A.-S.; formal analysis, A.V.-B., J.S.-C.-A., C.P.-R., M.K.-K., E.A.-S.; investigation,A.V.-B., J.S.-C.-A., K.K.-W., E.A.-S.; resources, A.V.-B.; data curation, A.V.-B.; writing—originaldraft preparation, A.V.-B.; writing—review and editing, J.S.-C.-A., C.P.-R., M.K.-K., K.K.-W., E.A.-S.;supervision, J.S.-C.-A., E.A.-S.; funding acquisition, M.K.-K., K.K.-W. All authors have read andagreed to the published version of the manuscript.
Funding: The study was performed under the research projects numbers WZ/WB-IIL/4/2020 andWZ-WB-IIL/3/2020 funded by the Polish Ministry of Education and Science.
Institutional Review Board Statement: Not applicable.
Informed Consent Statement: Not applicable.
Data Availability Statement: Data sharing is not applicable to this article.
Acknowledgments: To the company Lyrsa Álava for their generous contribution of the cable plasticwaste. To the Laboratorio de Instalaciones of the Instituto de Ciencias de la Construcción EduardoTorroja (Madrid, Spain), for their time and contribution of the thermal test.
Conflicts of Interest: The authors declare no conflict of interest.

Materials 2021, 14, 2255 12 of 13
References1. Vidales Barriguete, A. Caracterización Fisicoquímica y Aplicaciones de Yeso con Adición de Residuo Plástico de Cables Mediante
Criterios de Economía Circular. Ph.D. Thesis, Universidad Politécnica de Madrid, Madrid, Spain, 2019. [CrossRef]2. Ramírez, C.P.; Merino, M.D.R.; Arrebola, C.V.; Barriguete, A.V.; Kosior-Kazberuk, M. Analysis of the mechanical behaviour of the
cement mortars with additives of mineral wool fibres from recycling of CDW. Constr. Build. Mater. 2019, 210, 56–62. [CrossRef]3. Kosior-Kazberuk, M.; Krassowska, J.; Barriguete, A.V.; Rodríguez, C.P. Parámetros de la Fractura del Hormigón Reforzado con
Fibras de Basalto = Fracture Parameters of Basalt Fiber Reinforced Concrete. An. Edif. 2018, 4, 52–59. [CrossRef]4. Quinchía Figueroa, A.M.; Valencia García, M.F.; Giraldo Orozco, J.M. Uso de lodos provenientes de la industria papelera en la
elaboración de paneles prefabricados para la construcción. Rev. EIA 2007, 8, 9–19.5. PlasticsEurope. Plásticos—Situación en 2018. Available online: https://www.plasticseurope.org/es/resources/publications/12
40-plasticos-situacion-en-2018 (accessed on 25 March 2021).6. Arandes, J.M.; Bilbao, J.; López Valerio, D. Reciclado de residuos plásticos. Rev. Iberoam. Polímeros 2004, 5, 28–45.7. De Oliveira, K.A.; Barbosa, J.C.; Christoforo, A.L.; Molina, J.C.; Oliveira, C.A.B.; Bertolini, M.S.; Gava, M.; Ventorim, G.
Sound absorption of recycled gypsum matrix composites with residual cellulosic pulp and expanded polystyrene. Bioresources2019, 14, 4806–4813.
8. San-Antonio-González, A.; Merino, M.D.R.; Arrebola, C.V.; Villoria-Sáez, P. Lightweight Material Made with Gypsum and EPSWaste with Enhanced Mechanical Strength. J. Mater. Civ. Eng. 2016, 28, 04015101. [CrossRef]
9. Muñoz Muñoz, D.R.; Narváez Pupiales, J.I. Construcción Sostenible a Partir de Paneles Prefabricados Utilizando yeso y CelulosaReciclada. Bachelor’s Thesis, Universidad Central de Ecuador, Quito, Ecuador, 2019.
10. Merino, M.D.R.; Sáez, P.V.; Longobardi, I.; Astorqui, J.S.C.; Porras-Amores, C. Redesigning lightweight gypsum with mixes ofpolystyrene waste from construction and demolition waste. J. Clean. Prod. 2019, 220, 144–151. [CrossRef]
11. Suárez, F.; Felipe-Sesé, L.; Díaz, F.A.; Gálvez, J.C.; Alberti, M.G. Comportamiento a fractura de yeso con adición de fibraspoliméricas. An. Mecánica Fract. 2019, 36, 114–119.
12. Silva Collado, D. Propuesta de Paneles Prefabricados Para Particiones Interiores con Compuesto de yeso Reforzado con Fibras dePolipropileno Obtenidas de Residuos de Toallitas Húmedas. Bachelor´s Thesis, Universidad de Sevilla, Sevilla, Spain, 2019.
13. Deng, Y.-H.; Furuno, T. Properties of gypsum particleboard reinforced with polypropylene fibers. J. Wood Sci. 2001, 47, 445–450.[CrossRef]
14. Mohandesi, J.A.; Sangghaleh, A.; Nazari, A.; Pourjavad, N. Analytical modeling of strength in randomly oriented PP and PPTAshort fiber reinforced gypsum composites. Comput. Mater. Sci. 2011, 50, 1619–1624. [CrossRef]
15. Morales-Conde, M.; Rodríguez-Liñán, C.; Pedreño-Rojas, M. Physical and mechanical properties of wood-gypsum compositesfrom demolition material in rehabilitation works. Constr. Build. Mater. 2016, 114, 6–14. [CrossRef]
16. Alonso, Á.; Gadea, J.; Gutiérrez-González, S.; Calderón, V. Impact of Plasterboard with Ladle Furnace Slag on Fire Reaction andtermal Behavior. Fire Technol. 2019, 55, 1733–1751. [CrossRef]
17. Pedreño-Rojas, M.; Morales-Conde, M.; Pérez-Gálvez, F.; Rodríguez-Liñán, C. Eco-efficient acoustic and thermal conditioningusing false ceiling plates made from plaster and wood waste. J. Clean. Prod. 2017, 166, 690–705. [CrossRef]
18. Cherki, A.-B.; Remy, B.; Khabbazi, A.; Jannot, Y.; Baillis, D. Experimental thermal properties characterization of insulatingcork–gypsum composite. Constr. Build. Mater. 2014, 54, 202–209. [CrossRef]
19. Liuzzi, S.; Rubino, C.; Stefanizzi, P. Use of clay and olive pruning waste for building materials with high hygrothermalperformances. Energy Procedia 2017, 126, 234–241. [CrossRef]
20. Sánchez Guerrero, C.M.; Chávez Valencia, L.E. UG Rock. Jóvenes Cienc. 2017, 3, 2087–2090.21. Rossetto, J.R.D.M.; Correia, L.S.; Geraldo, R.H.; Camarini, G. Gypsum Plaster Waste Recycling: Analysis of Calcination Time. Key
Eng. Mater. 2015, 668, 312–321. [CrossRef]22. Erbs, A.; Nagalli, A.; De Carvalho, K.Q.; Mymrin, V.; Passig, F.H.; Mazer, W. Properties of recycled gypsum from gypsum
plasterboards and commercial gypsum throughout recycling cycles. J. Clean. Prod. 2018, 183, 1314–1322. [CrossRef]23. Pinheiro, S.M.M.; Camarini, G. Characteristics of Gypsum Recycling in Different Cycles. Int. J. Eng. Technol. 2015, 7, 215–218.
[CrossRef]24. Pedreño-Rojas, M.; Flores-Colen, I.; De Brito, J.; Rodríguez-Liñán, C. Influence of the heating process on the use of gypsum wastes
in plasters: Mechanical, thermal and environmental analysis. J. Clean. Prod. 2019, 215, 444–457. [CrossRef]25. Rivero, A.J.; Sathre, R.; Navarro, J.G. Life cycle energy and material flow implications of gypsum plasterboard recycling in the
European Union. Resour. Conserv. Recycl. 2016, 108, 171–181. [CrossRef]26. Gómez-Rojo, R.; Alameda, L.; Rodríguez, Á.; Calderón, V.; Gutiérrez-González, S. Characterization of Polyurethane Foam Waste
for Reuse in Eco-Efficient Building Materials. Polymers 2019, 11, 359. [CrossRef]27. Khalil, A.; Tawfik, A.; Hegazy, A.; El-Shahat, M. Effect of some waste additives on the physical and mechanical properties of
gypsum plaster composites. Constr. Build. Mater. 2014, 68, 580–586. [CrossRef]28. Zhu, C.; Zhang, J.; Peng, J.; Cao, W.; Liu, J. Physical and mechanical properties of gypsum-based composites reinforced with PVA
and PP fibers. Constr. Build. Mater. 2018, 163, 695–705. [CrossRef]29. UNE-EN 13279-1:2009. Construction Plasters and Gypsum-Based Binders for Construction. Part 1: Definitions and Specifications; Spanish
Association for Standardization AENOR: Madrid, Spain, 2009.
Materials 2021, 14, 2255 13 of 13
30. UNE-EN 13279-2:2014. Construction Plasters and Gypsum-Based Binders for Construction. Part 2: Test Methods; Spanish Associationfor Standardization AENOR: Madrid, Spain, 2014.
31. UNE-EN 520:2005+A1. Sheetrock Plasterboard. Definitions, Specifications and Testing Methods; Spanish Association for StandardizationAENOR: Madrid, Spain, 2010.
32. UNE 102042. Construction Plasters. Other Test Methods; Spanish Association for Standardization AENOR: Madrid, Spain, 2014.33. UNE-EN 12667:2002. Construction Materials. Determination of Thermal Resistance by the Stored Hot Plate Method and the Heat Flow
Meter Method. Products with High and Medium Thermal Resistance; Spanish Association for Standardization AENOR: Madrid,Spain, 2002.
34. De Villanueva Domínguez, L.; García Santos, A. Manual del yeso. In Asociación Técnica y Empresarial del Yeso; ATEDY: Madrid,Spain, 2001; p. 268.
35. CTE. Código Técnico de la Edificación; BOE núm 74; Spanish Ministry of Transport and Mobility: Madrid, Spain, 2006;pp. 11816–11831.
36. Del Cura, S.H. Influencia de la Dosificación y Granulometría del Caucho de Neumático Fuera de uso (NFU) y de las DimensionesFísicas en las Propiedades Térmicas, Acústicas y Mecánicas de Placas de Mortero de Yeso y Caucho. Ph.D. Thesis, UniversidadPolitécnica de Madrid, Madrid, Spain, 2016. [CrossRef]
37. Domínguez Lepe, J.; Guemez Pacheco, D. Fabricación y evaluación de paneles aplicables a la industria de la construcción a partirdel reciclaje de envases multicapa. Ingeniería 2011, 14, 191–195.
38. Santos, A.G. Characterization of reinforced scagliola compounds, related to the type of reinforcement and W/P ratio. Inf.Construcción 2004, 56, 19–31. [CrossRef]
39. Bicer, A.; Kar, F. Thermal and mechanical properties of gypsum plaster mixed with expanded polystyrene and tragacanth. Therm.Sci. Eng. Prog. 2017, 1, 59–65. [CrossRef]
40. Mayor Lobo, P.; Bustamante Montoro, R.; Rangel, C.; Hernández Olivares, F. Propiedades térmicas, acústicas y mecánicas deplacas de mortero de yeso-caucho. In Actas de II Jornadas de Investigación en Construcción; Instituto de Ciencias de la ConstrucciónEduardo Torroja: Madrid, Spain, 2008.
41. Erdem, S.; Arioglu, N. An Analysis of the Properties of Recycled PET Fiber-Gypsum Composites. A/Z ITU J. Fac. Arch. 2017, 14,91–101. [CrossRef]
42. Barriguete, A.V.; Merino, M.D.R.; Sánchez, E.A.; Ramírez, C.P.; Arrebola, C.V. Analysis of the feasibility of the use of CDW as alow-environmental-impact aggregate in conglomerates. Constr. Build. Mater. 2018, 178, 83–91. [CrossRef]
43. Pedreño-Rojas, M.A.; Rodríguez-Liñán, C.; Flores-Colen, I.; De Brito, J. Use of Polycarbonate Waste as Aggregate in RecycledGypsum Plasters. Materials 2020, 13, 3042. [CrossRef]
44. Vidales-Barriguete, A.; Atanes-Sánchez, E.; del Río-Merino, M.; Piña-Ramírez, C. Analysis of the improved water-resistantproperties of plaster compounds with the addition of plastic waste. Constr. Build. Mater. 2020, 230, 116956. [CrossRef]
45. Instituto de Ciencias de la Construcción Eduardo Torroja. CSIC. Código Técnico de la Edificación—CTE. Available online:https://www.codigotecnico.org/index.html (accessed on 3 February 2021).
46. Vidales-Barriguete, A.; Piña-Ramírez, C.; Serrano-Somolinos, R.; del Río-Merino, M.; Atanes-Sánchez, E. Behavior resulting fromfire in plasterboard with plastic cable waste aggregates. J. Build. Eng. 2021, 40, 102293. [CrossRef]
47. Diez, R.V.L.; Zaldivar, O.L.; DEL Cura, S.H.; Lobo, P.L.M.; Olivares, F.H. Influencia de la incorporación de fibras de cauchoprocedente de neumáticos fuera de uso (NFU) en morteros de yeso. Estudio de las propiedades mecánicas, térmicas y acústicas.DYNA Ing. E Ind. 2019, 94, 460–464. [CrossRef]
48. Abu-Lebdeh, T.; Fini, E.; Fadiel, A. Thermal conductivity of rubberized gypsum board. Am. J. Eng. Appl. Sci. 2014, 7, 12–22.[CrossRef]
49. Sahin, S.; Karaman, S. The Properties of Expanded Polystyrene—Pumice—Gypsum Blocks as a Building Material. J. TekirdagAgric. Fac. 2012, 9, 51–56.