study of performance appraisal systems in service industry in
TRANSCRIPT
55
Study of Performance Appraisal Systems in Service Industry in India
Dr Rajeshwari Malik and Dr Supriya Chikkara
Associate Professor Department of Management and Commerce Maharaja Surajmal Institute (NAAC A Grade) Affiliated to GGSIP University, Janakpuri, New Delhi
E-mail: [email protected] [email protected]
ISSN 2348-2869 Print
© 2018 Symbiosis Centre for Management Studies, NoIDA
Journal of General Management Research, Vol. 5, Issue 2, July 2018, pp. 55–69
Journal of General ManaGeMent research
AbstractGlobally, organizations do everything possible to ensure that all employees are adequately committed to their specialized work in order to attain organizational goals. In the present competitive environment, organizations have to ensure peak performance of their employees continuously in order to compete effectively in the market place. Performance appraisal is a major management practice to assess the immediate and future relevance of any worker in any given organization. Even today in the era of globalization, Performance Appraisal has become very important and a dire necessity for the employees both in the private as well as public sector organization. Performance appraisals are intended to evaluate the performance and potential of employees. Still these may not be valid indicator of what these are intended to assess because of a variety of limitations on their uses. Performance appraisal errors affect the validity and dependability of the performance appraisal systems. The main purpose of this research paper is to study and analyze the appraisal systems, to study the interrelationship between the factors like job satisfaction, organizational culture, etc., with performance appraisal system. How long people wish to stay in the organization, and how they talk about their organization outside is also studied in this research paper.

56 Journal of General Management Research
Keywords: Performance Appraisal, Job Satisfaction, Employee’s Satisfaction, Attitude, Performance Appraisal Biases
INTRODUCTION
Globalization has created a niche to sustain and enhance human resource since they
are the prime contributors to organizational performance. Performance appraisal (PA) is a vital tool to measure the frameworks set by any organization to its employees. It is utilized to track individual contribution and performance against organizational goals and to identify individual strengths and opportunities for future improvements and assessed whether organizational goals are achieved or serves as basis for the company’s future planning and development. The success of any organization depends on the quality and characteristics of its employees. The employees become a significant factor in any organization since they are the heart of the company.
‘Performance appraisal isn’t about the forms. The ultimate purpose of performance appraisal is to allow employees and managers to improve continuously and to remove barriers to job success, in other words, to make everyone better. When HR practices are not evaluated, the investment and its effects cannot be tested and resources can be wasted in inadequate activities’ (Foot and Hook, 1996).
Performance Appraisal is a systematic means of ensuring that superiors and their staff meet regularly to discuss past and present performance issues and to agree what future is appropriate on both sides. Performance appraisal helps the organization in achieving its strategic advantages and increasing of effective operational processes through constant improvement of individual
employee performance along with focusing on weak improvable points. Performance appraisal provides a periodic opportunity for communication between the person who assigns the work and the person who performs it, to discuss what they expect from the other, and how those expectations are being met. Performance appraisal is a process to improve employee’s work performance by helping them realize and use their full potential in carrying out the organization’s missions and to provide information to employees and managers for use in making work related decisions. It is a systematic and logical review, conducted by the organization annually to judge his potential in performing a task. It helps to analyze the skills and abilities of an employee for their future growth that increases the productivity of employees. It helps to identify, the employee who performs their task well and those who are not, along with the reasons for the same.
CONCEPTUAL FRAMEWORKPerformance Appraisal is an organized way of evaluating employee performance, for which a comparison is made between actual performance and the preset standards. The results of the performance appraisal are documented. After that reviews are given to the employee about their performance during the year, to tell them where they require improvements. Employees also wish to know their position in the organization after a particular period of time. The most challenging aspect of a performance appraisal is measuring the actual performance of the employee. Since the performance is measured by tasks performed, there is a continuous process that must be administered in order to monitor the performances throughout the appraisal cycle. Thus, it’s very important to choose the correct

57 Study of Performance Appraisal Systems in Service Industry in India
measuring techniques. It’s also important to focus on a desired performance (standardized performance) and then compare the desired performance to the actual performance of the employee. All of the planning that goes into the performance appraisal is for the purpose of evaluating employees, providing employees with valuable feedback and creating a positive effect on future performance. Although the process may be tedious, the end result is one of great importance. The procedure and the concept of the performance appraisal can be understood with the help of the with the help of the Fig. 1.
Figure 1: Performance Appraisal Procedure in Organization
SIGNIFICANCE AND APPLICABILITY OF PERFORMANCE APPRAISAL Performance appraisal provides important and useful information for the assessment of employee’s skill, knowledge, ability and overall job performance. The following are the points which indicate the importance of performance appraisal in an organization:
1. It encourages employees to perform better in the future
2. It presents an opportunity for employees
to leverage positive performance for an increase in salary or promotion.
3. During the appraisal, employees can discuss strengths and weaknesses with a supervisor, in effect, allowing employees to discuss personal concerns.
4. It provides communication between a supervisor and employee on a regular basis to discuss job duties and issues with work performance.
5. It allows employees to identify what skills may be lacking and need to be acquired or improved upon. There are instances when education provided by the company is a necessity to advance success overall.
6. It holds employees accountable for their job performance, and since the employee knows that an appraisal is coming, the employee has the opportunity to prepare in advance.
7. It provides the opportunity for managers to explain organizational goals and the ways in which employees can participate in the achievement of those goals.
Table 1: Applicability of Performance Appraisal
General Application Specific Purpose
Development Uses
• Identificationofindividualneeds
• Performancefeedback• Determiningtransferand
job assignment• Identifyingofindividuals
strengths and development needs
Administrative Uses/Decisions
• Salary• Promotion• Retentionortermination• Recognitionofindividual
performance• Lay-offs• Identificationofpoor
performers

58 Journal of General Management Research
General Application Specific Purpose
Organizational Maintenance/ Objectives
• HRPlanning• Determiningorganizational
training needs• Evaluationoforganizational
goal achievement• Informationforgoal
identification• EvaluationofHRsystem• Reinforcementoforganiza-
tional development needsDocumen- tation
• Criteriaforvalidationresearch
• DocumentationforHRdecisions
• Helpingtomeetlegalrequirements
Source: Integral Review – A Journal of Management,5(2),Dec.2012,pp.46-52.
Boswell and Boudreau (2000) make a most useful and clear distinction between two types of functions for appraisal systems:
• Evaluative functions include use of performanceappraisalforsalaryadminis- tration, promotion decisions, retention/termination decisions, recognition of individual performance and identification of poor performance. To conduct this evaluative function the appraiser takes the role of the ‘judge’. Evaluative functions focus primarily on differentiating between people.
• Developmental functions include the identification of individual training needs, providing performance feedback, determining transfers and attachments, identification of individual strengths and weaknesses. For this developmental function the appraiser takes the role of a coach or mentor. Developmental functions focus primarily on within person analysis.
PERFORMANCE APPRAISAL BIASESIn evaluating performance, it is important to always compare actual performance to the performance standards as determined during the Performance Planning stage. To be fair and objective, a performance evaluation mustbebasedontheemployee’sjob-relatedbehaviour, not on the employee’s personal traits or other factors not related to the job. It is also important to make sure the evaluation is submitted complete with all required signatures and supporting documentation. Managers commit mistakes while evaluating employees and their performance. Biases and judgment errors of various kinds may spoil the performance appraisal process. Bias refers to inaccurate distortion of a measurement. While appraising performances, all the biases should be avoided.
1. First Impression (primacy effect): Raters form an overall impression about the ratee on the basis of some particular characteristics of the ratee identified by them. The identified qualities and features may not provide adequate base for appraisal.
2. Halo Effect: The individual’s performance is completely appraised on the basis of a perceived positive quality, feature or trait. In other words this is the tendency to rate a man uniformly high or low in other traitsifheisextra-ordinarilyhighorlowin one particular trait. If a worker has few absences, his supervisor might give him a high rating in all other areas of work.
3. Horn Effect: The individual’s performance is completely appraised on the basis of a negative quality or feature perceived. This results in an overall lower rating than may be warranted. ‘He is not formally dressed

59 Study of Performance Appraisal Systems in Service Industry in India
up in the office. He may be casual at work too!’
4. Excessive Stiffness or Lenience: Depending upon the raters own standards, values and physical and mental makeup at the time of appraisal, ratees may be rated very strictly or leniently. Some of the managers are likely to take the line of least resistance and rate people high, whereas others, by nature, believe in the tyranny of exact assessment, considering more particularly the drawbacks of the individual and thus making the assessment excessively severe. The leniency error can render a system ineffective. If everyone is to be rated high, the system has not done anything to differentiate among the employees.
5. Central Tendency: Appraisers rate all employees as average performers. That is, it is an attitude to rate people as neither high nor low and follow the middle path. For example, a professor, with a view to play it safe, might give a class grade near the equal to B, regardless of the differences in individual performances.
6. Personal Biases: The way a supervisor feels about each of the individuals working under him – whether he likes or dislikes them – as a tremendous effect on the rating of their performances. Personal Bias can stem from various sources as a result of information obtained from colleagues, considerations of faith and thinking, social and family background and so on.
7. Spillover Effect: The present performance is evaluated much on the basis of past performance. “The person who was a good performer in distant past is assured to be okay at present also”.
8. Recency Effect: Rating is influenced by the most recent behaviour ignoring the
commonly demonstrated behaviours during the entire appraisal period.
9. Pitchfork Effect: It occurs when rating is done by letting a single weakness of an employee determine the overall rating.
OBJECTIVES OF THE STUDY1. To understand the conceptual framework
of performance appraisal system in organizations.
2. To understand the various rating errors in the existing appraisal system that affects the performance appraisal of the employees.
3. To study the relationship between job satisfaction and performance appraisal systems
4. To study the factors contributing towards perception of performance appraisal systems.
5. To assess the employee’s satisfaction with the Performance appraisal systems in their organization.
LITERATURE REVIEWMuczyk and Gable (1987). The high degree of success or failure of any organization depends on how performance is managed within it. It would be impossible for an organization to achieve its goals, for instance, giving best employees a sizable pay increase, spot individuals ready for promotion, justifiable grounds for termination of poor performer, and undertaking successful human resource planning, if managers do not give prime concern to make better the performance appraisal of the organization. As to date, it is argued that every performance appraisal system created by organizations contains deficiencies hindering it from successfully attaining its goals in the organization.

60 Journal of General Management Research
Mullins (1996) Performance appraisal is extensively used to facilitate salary increments, promotions, staff retention and to reinforce staff behaviour.
Longenecker (1997) contended that a performance appraisal system helps the organization identify three major things: performance standards, core competences, and communicating the standards and competencies to employees.
Fletcher (2001) Performance appraisal is understood as ‘activities through which organizations seek to assess employees and develop their competence, enhance performance and distribute rewards’.
Cleveland, Mohammed, Skattebo and Sin (2003), described four purposes of PA: to make distinctions among people, distinguish a person’s strengths from his or her weaknesses, implement and evaluate human resource systems in organizations, and document personnel decisions.
Jackson and Schuler (2003) describes performance appraisal as evaluating performance based on the judgments and opinions of subordinates, peers, supervisor, other managers and even workers themselves.
V. Balu (2006) Performance appraisal is defined as “a managerial process through which an individual employee’s behaviour and accomplishments for a fixed time period are measured and evaluated”.
DeCarlo& Leigh (2006); Jaworksi & Kohli (2011), PA helps in improving performance and building both job satisfaction and organizational commitment.
Vance (2006) explains that performance appraisal is intended to engage, align, and coalesce individual and group effort to continually improve overall organizational
mission accomplishment. He stated that, it provides a basis for identifying and correcting disparities in performance. Thus, it is according to him, performance appraisal is activities oriented. He added that it also may provide the basis for other personnel actions which typically include: (1) performance pay, (2) training and career development, (3) promotion and placement, (4) recognition and rewards, (5) disciplinary actions, and (6) identifying selection criteria. Its success depends primarily on the (1) system and measures (criteria), (2) culture, and (3) the perceived attitudes and needs of participants, i.e. their degree of engagement with their jobs.
Bohlander and Snell (2007) sees performance appraisal as an annual regular undertaking developed to assist employees in understanding their roles, objectives, expectations and performance success conducted by a supervisor to a subordinate.
Liliane M. and Peter M. (2010) exclaimed that the performance and competitiveness of different companies can be attainted through implementation of perfectly defined performance measurement indicators and framework that are able to measure the performance function by analysing the use of certain performance indicators in management of maintenance. They discovered that the maximum respondents have very less decisions and changes in processes triggered by performance measurement.
Brown et al. (2010). It’s not only the ratees’ attitudes towards the PAS that is critical. Even the attitude of the raters is also critical to the system. The attitudes and approach the raters to the process have been shown to influence the quality of the appraisals. Some raters have indicated that they are reluctant to conduct the appraisals saying that they hated
61 Study of Performance Appraisal Systems in Service Industry in India
conducting appraisals, ‘second only to firing employees’.
Michael Pitt (2013) highlighted on the fact that Performance management is an essential element to check the performance and quality of properties. This paper determined the recent standards and performance of maintenance management system by studying high-riseprivate office buildings.
Neeti and Santosh C. (2015) studied that employees have good knowledge of performance appraisal and have a positive attitude towards it as their promotion is purely based on performance appraisal and the ratings help to fix increments. During the course of study suggestions came from the employees for the need of counseling. Performance appraisal should be made more transparent and rationale.
Kumari & Malhotra (2012). Performance can be defined as “What is expected to be delivered by an individual or a set of individuals within
a timeframe. What is expected to be delivered could be stated in terms of results or efforts, tasks and quality, with specification of conditions under which it is to be delivered”
RESEARCH METHODOLOGY AND DATA ANALYSIS For the current research paper, a sample survey wasconductedinthemonthofJune-August’17, in higher education institutes located in Delhi-NCR.Forobjective1and2,literaturewas reviewed in the conceptual framework. The framework of appraisal procedure and various biases were studied. For objective 3 to 5, the following hypotheses were formed.
• H01: There exists no significantrelationship between job satisfaction and performance appraisal system in the organization.
• H02: There exists no significancedifference in contribution of various factors towards perception of performance appraisal system.
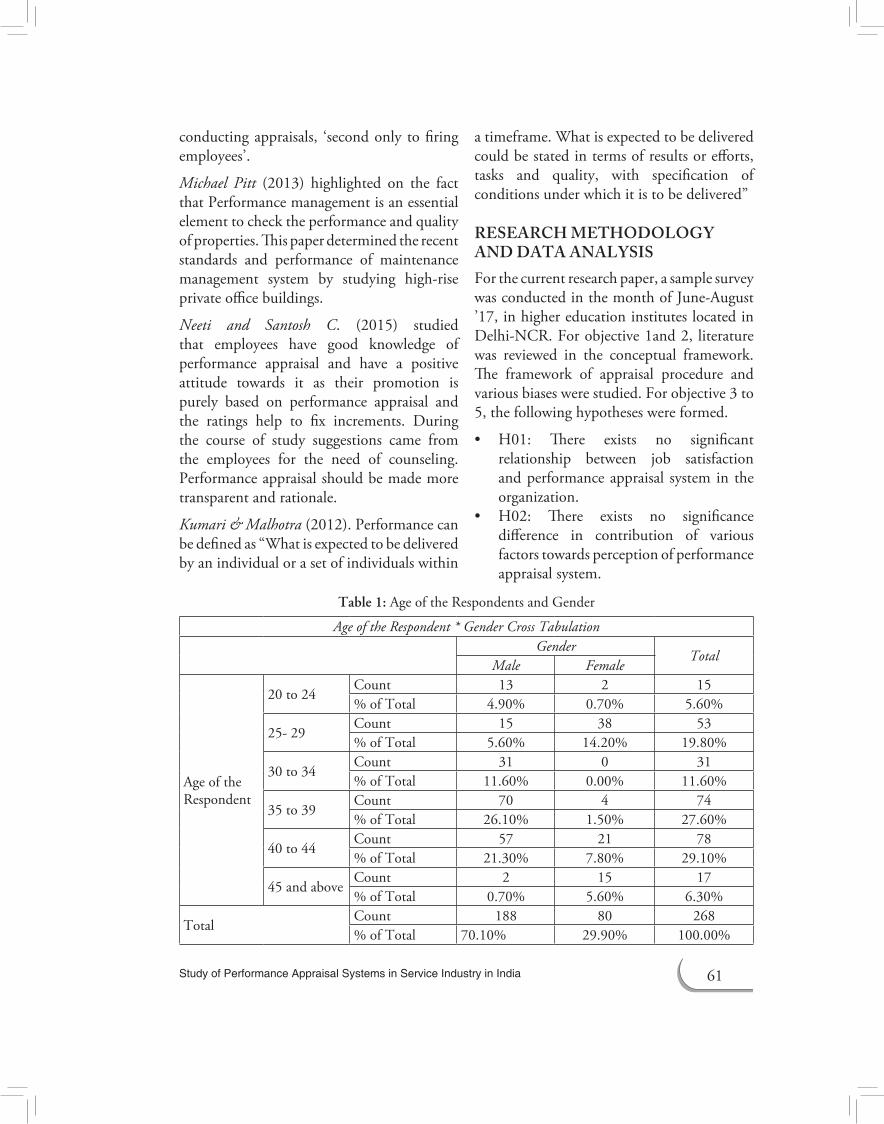
Table 1: Age of the Respondents and Gender
Age of the Respondent * Gender Cross TabulationGender
TotalMale Female
Age of the Respondent
20 to 24Count 13 2 15% of Total 4.90% 0.70% 5.60%
25-29Count 15 38 53% of Total 5.60% 14.20% 19.80%
30 to 34Count 31 0 31% of Total 11.60% 0.00% 11.60%
35 to 39Count 70 4 74% of Total 26.10% 1.50% 27.60%
40 to 44Count 57 21 78% of Total 21.30% 7.80% 29.10%
45 and aboveCount 2 15 17% of Total 0.70% 5.60% 6.30%
Total Count 188 80 268% of Total 70.10% 29.90% 100.00%
62 Journal of General Management Research
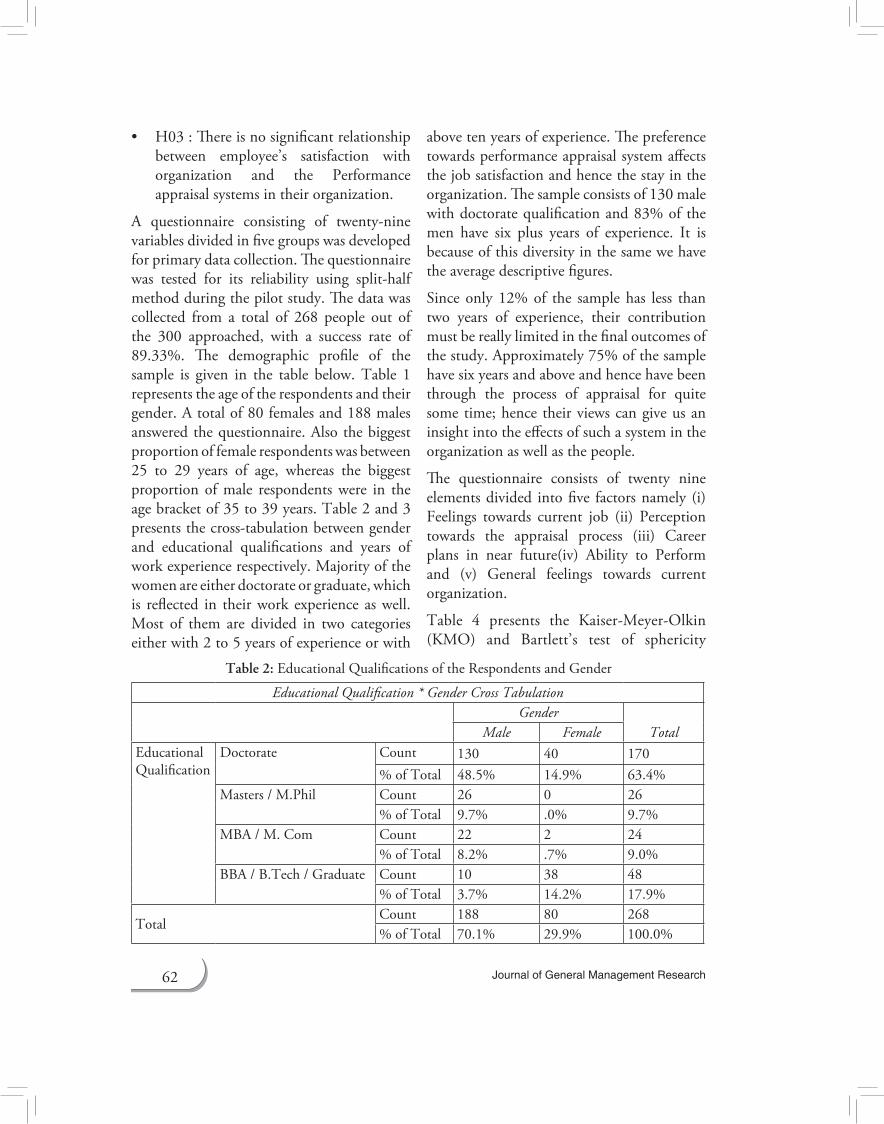
• H03:Thereisnosignificantrelationshipbetween employee’s satisfaction with organization and the Performance appraisal systems in their organization.
A questionnaire consisting of twenty-ninevariables divided in five groups was developed for primary data collection. The questionnaire was tested for its reliability using split-halfmethod during the pilot study. The data was collected from a total of 268 people out of the 300 approached, with a success rate of 89.33%. The demographic profile of the sample is given in the table below. Table 1 represents the age of the respondents and their gender. A total of 80 females and 188 males answered the questionnaire. Also the biggest proportion of female respondents was between 25 to 29 years of age, whereas the biggest proportion of male respondents were in the age bracket of 35 to 39 years. Table 2 and 3 presentsthecross-tabulationbetweengenderand educational qualifications and years of work experience respectively. Majority of the women are either doctorate or graduate, which is reflected in their work experience as well. Most of them are divided in two categories either with 2 to 5 years of experience or with
above ten years of experience. The preference towards performance appraisal system affects the job satisfaction and hence the stay in the organization. The sample consists of 130 male with doctorate qualification and 83% of the men have six plus years of experience. It is because of this diversity in the same we have the average descriptive figures.
Since only 12% of the sample has less than two years of experience, their contribution must be really limited in the final outcomes of the study. Approximately 75% of the sample have six years and above and hence have been through the process of appraisal for quite some time; hence their views can give us an insight into the effects of such a system in the organization as well as the people.
The questionnaire consists of twenty nine elements divided into five factors namely (i)Feelings towards current job (ii) Perception towards the appraisal process (iii) Career plans in near future(iv) Ability to Perform and (v) General feelings towards current organization.
Table 4 presents the Kaiser-Meyer-Olkin(KMO) and Bartlett’s test of sphericity
Table 2: Educational Qualifications of the Respondents and Gender
Educational Qualification * Gender Cross TabulationGender
TotalMale FemaleEducational Qualification
Doctorate Count 130 40 170% of Total 48.5% 14.9% 63.4%
Masters / M.Phil Count 26 0 26% of Total 9.7% .0% 9.7%
MBA / M. Com Count 22 2 24% of Total 8.2% .7% 9.0%
BBA / B.Tech / Graduate Count 10 38 48% of Total 3.7% 14.2% 17.9%
TotalCount 188 80 268% of Total 70.1% 29.9% 100.0%

63 Study of Performance Appraisal Systems in Service Industry in India
gives information about the factorability of the data. Reliability of the constructs for29itemsis0.781 that demonstrates good internal consistency of the constructs. Generally, a KMO value greater than 0.5 is desirable. Bartlett’s test of sphericity is a test statistics used to examine the hypothesis that the variables are uncorrelated in the population. (Malhotra and Dash, 2012). The hypothesis that the population correlation matrix is an identity matrix is rejected by this test. The approximate Chi-square statisticsis 3451.4 with 406 degrees of freedom, which is significant at the 0.05 level. Thus factor analysis is an appropriate technique for analyzing the correlation matrix of the
268 sample data. The reliability coefficient of scale, i.e. Cronbach’s alpha was used for estimating the reliability and the value of Cronbach’s Alpha was found to be 0.724for each construct, depicting that factor analysis is appropriate for the dataset.
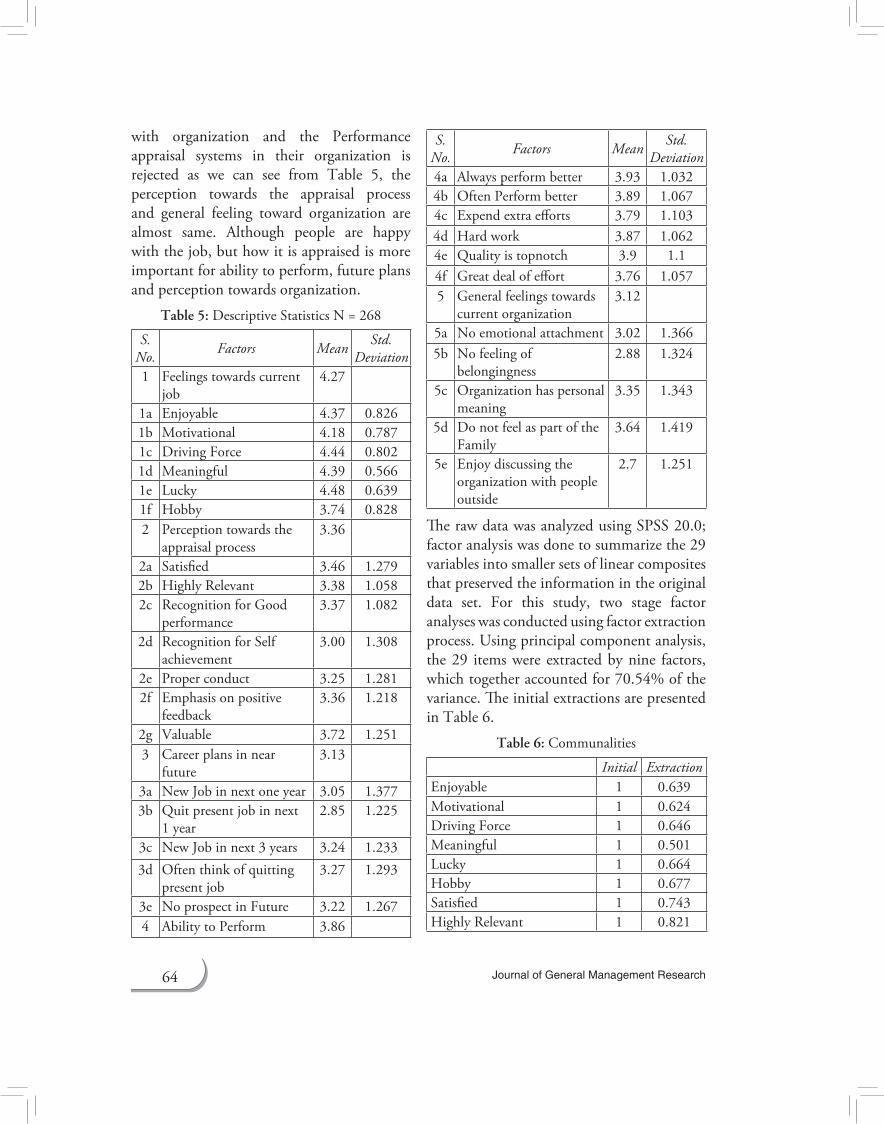
The five variables gave the results as mentioned in Table 5. Majority of the respondents seem to have highly positive feeling towards their current job, but the general feeling towards current organization is not that high. This shows that there are some factors other than ‘job’ which contribute towards this change in perception. The perception towards the appraisal system is in sync with the career plans in near future and ability to perform. The job an ability to perform are the most closely related and is visible in the findings also, where ability to perform has the second highest mean value at 3.86, next only to feelings towards current job which stands highest at 4.27, on a scale of 1 to 5 in increasing order.
Hypothesis H03: There is no significant relationship between employee’s satisfaction
Table 3: Work Experience of the Respondents and Gender
Work Experience * Gender Cross tabulationGender
TotalMale Female
Work Experience
LessthantwoyearsCount 31 3 34% of Total 11.6% 1.1% 12.7%
Two to five yearsCount 0 37 37% of Total .0% 13.8% 13.8%
Six to 10 yearsCount 58 2 60% of Total 21.6% .7% 22.4%
Above 10 yearsCount 99 38 137% of Total 36.9% 14.2% 51.1%
TotalCount 188 80 268% of Total 70.1% 29.9% 100.0%
Table 4: KMO and Bartlett’s Test
Kaiser-Meyer-OlkinMeasureofSampling Adequacy. 0.781
Bartlett’s Test of Sphericity
Approx. Chi-Square 3451.34
df 406Sig. 0
Reliability Statistics No.ofitemsCronbach’s Alpha 0.724 29
64 Journal of General Management Research
with organization and the Performance appraisal systems in their organization is rejected as we can see from Table 5, the perception towards the appraisal process and general feeling toward organization are almost same. Although people are happy with the job, but how it is appraised is more important for ability to perform, future plans and perception towards organization.
Table 5:DescriptiveStatisticsN=268
S. No. Factors Mean Std.
Deviation1 Feelings towards current
job4.27
1a Enjoyable 4.37 0.8261b Motivational 4.18 0.7871c Driving Force 4.44 0.8021d Meaningful 4.39 0.5661e Lucky 4.48 0.6391f Hobby 3.74 0.8282 Perception towards the
appraisal process3.36
2a Satisfied 3.46 1.2792b Highly Relevant 3.38 1.0582c Recognition for Good
performance3.37 1.082
2d Recognition for Self achievement
3.00 1.308
2e Proper conduct 3.25 1.2812f Emphasis on positive
feedback3.36 1.218
2g Valuable 3.72 1.2513 Career plans in near
future 3.13
3a NewJobinnextoneyear 3.05 1.3773b Quit present job in next
1 year2.85 1.225
3c NewJobinnext3years 3.24 1.2333d Often think of quitting
present job3.27 1.293
3e NoprospectinFuture 3.22 1.2674 Ability to Perform 3.86
S. No. Factors Mean Std.
Deviation4a Always perform better 3.93 1.0324b Often Perform better 3.89 1.0674c Expend extra efforts 3.79 1.1034d Hard work 3.87 1.0624e Quality is topnotch 3.9 1.14f Great deal of effort 3.76 1.0575 General feelings towards
current organization3.12
5a Noemotionalattachment 3.02 1.3665b Nofeelingof
belongingness2.88 1.324
5c Organization has personal meaning
3.35 1.343
5d Do not feel as part of the Family
3.64 1.419
5e Enjoy discussing the organization with people outside
2.7 1.251
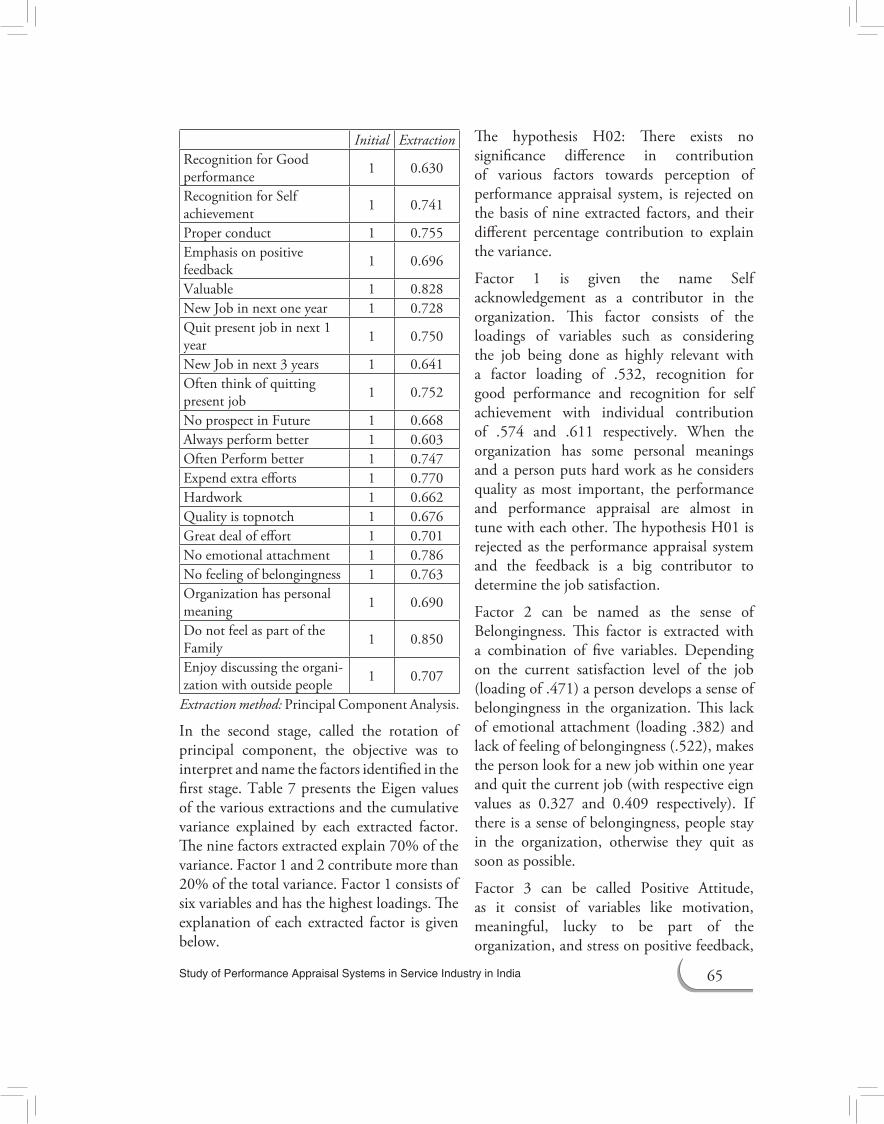
The raw data was analyzed using SPSS 20.0; factor analysis was done to summarize the 29 variables into smaller sets of linear composites that preserved the information in the original data set. For this study, two stage factor analyses was conducted using factor extraction process. Using principal component analysis, the 29 items were extracted by nine factors, which together accounted for 70.54% of the variance. The initial extractions are presented in Table 6.
Table 6: Communalities
Initial ExtractionEnjoyable 1 0.639Motivational 1 0.624Driving Force 1 0.646Meaningful 1 0.501Lucky 1 0.664Hobby 1 0.677Satisfied 1 0.743Highly Relevant 1 0.821
65 Study of Performance Appraisal Systems in Service Industry in India
Initial ExtractionRecognition for Good performance 1 0.630
Recognition for Self achievement 1 0.741
Proper conduct 1 0.755Emphasis on positive feedback 1 0.696
Valuable 1 0.828NewJobinnextoneyear 1 0.728Quit present job in next 1 year 1 0.750
NewJobinnext3years 1 0.641Often think of quitting present job 1 0.752
NoprospectinFuture 1 0.668Always perform better 1 0.603Often Perform better 1 0.747Expend extra efforts 1 0.770Hardwork 1 0.662Quality is topnotch 1 0.676Great deal of effort 1 0.701Noemotionalattachment 1 0.786Nofeelingofbelongingness 1 0.763Organization has personal meaning 1 0.690
Do not feel as part of the Family 1 0.850
Enjoydiscussingtheorgani- zation with outside people 1 0.707
Extraction method: Principal Component Analysis.
In the second stage, called the rotation of principal component, the objective was to interpret and name the factors identified in the first stage. Table 7 presents the Eigen values of the various extractions and the cumulative variance explained by each extracted factor. The nine factors extracted explain 70% of the variance. Factor 1 and 2 contribute more than 20% of the total variance. Factor 1 consists of six variables and has the highest loadings. The explanation of each extracted factor is given below.
The hypothesis H02: There exists no significance difference in contribution of various factors towards perception of performance appraisal system, is rejected on the basis of nine extracted factors, and their different percentage contribution to explain the variance.
Factor 1 is given the name Self acknowledgement as a contributor in the organization. This factor consists of the loadings of variables such as considering the job being done as highly relevant with a factor loading of .532, recognition for good performance and recognition for self achievement with individual contribution of .574 and .611 respectively. When the organization has some personal meanings and a person puts hard work as he considers quality as most important, the performance and performance appraisal are almost in tune with each other. The hypothesis H01 is rejected as the performance appraisal system and the feedback is a big contributor to determine the job satisfaction.
Factor 2 can be named as the sense of Belongingness. This factor is extracted with a combination of five variables. Depending on the current satisfaction level of the job (loading of .471) a person develops a sense of belongingness in the organization. This lack of emotional attachment (loading .382) and lack of feeling of belongingness (.522), makes the person look for a new job within one year and quit the current job (with respective eign values as 0.327 and 0.409 respectively). If there is a sense of belongingness, people stay in the organization, otherwise they quit as soon as possible.
Factor 3 can be called Positive Attitude, as it consist of variables like motivation, meaningful, lucky to be part of the organization, and stress on positive feedback,

66 Journal of General Management Research
Tab
le 7
: Tot
al V
aria
nce
Expl
aine
d (E
xtra
ctio
n M
etho
d: P
rinci
pal C
ompo
nent
Ana
lysis
)
Com
pone
ntIn
itial
Eig
enva
lues
Extra
ction
Sum
s of S
quar
ed L
oadi
ngs
Rota
tion
Sum
s of S
quar
ed L
oadi
ngs
Tot
al%
of V
aria
nce
Cum
ulat
ive %
Tot
al%
of V
aria
nce
Cum
ulat
ive %
Tot
al%
of V
aria
nce
Cum
ulat
ive %
14.
448
15.3
3815
.338
4.44
815
.338
15.3
383.
165
10.9
1310
.913
23.
760
12.9
6428
.302
3.76
012
.964
28.3
022.
952
10.1
8021
.093
32.
810
9.69
137
.994
2.81
09.
691
37.9
942.
739
9.44
530
.539
41.
975
6.81
144
.804
1.97
56.
811
44.8
042.
283
7.87
338
.412
51.
928
6.64
851
.452
1.92
86.
648
51.4
522.
236
7.71
146
.123
61.
698
5.85
557
.307
1.69
85.
855
57.3
072.
226
7.67
653
.799
71.
446
4.98
562
.292
1.44
64.
985
62.2
921.
900
6.55
060
.349
81.
310
4.51
666
.809
1.31
04.
516
66.8
091.
569
5.41
165
.760
91.
083
3.73
670
.545
1.08
33.
736
70.5
451.
388
4.78
570
.545
10.8
863.
056
73.6
0111
.799
2.75
476
.355
12.7
602.
621
78.9
7613
.679
2.34
181
.317
14.6
282.
165
83.4
8215
.569
1.96
185
.443
16.5
081.
751
87.1
9417
.486
1.67
788
.871
18.4
431.
529
90.4
0019
.380
1.30
991
.709
20.3
481.
201
92.9
1121
.342
1.17
894
.089
22.2
911.
005
95.0
9423
.259
.892
95.9
8524
.244
.841
96.8
2625
.222
.766
97.5
9126
.206
.711
98.3
0227
.200
.689
98.9
9228
.158
.546
99.5
3829
.134
.462
100.
000

67 Study of Performance Appraisal Systems in Service Industry in India
Table 8: Component Matrix
Component1 2 3 4 5 6 7 8 9
Enjoyable -0.16 -0.008 0.497 -0.137 -0.033 0.263 0.525 0.021 -0.039Motivational -0.148 -0.079 0.677 -0.021 -0.215 0.039 0.073 -0.26 -0.124Driving Force -0.344 -0.139 0.249 0.04 -0.171 0.484 0.419 0.064 -0.036Meaningful -0.395 -0.061 0.445 -0.2 -0.14 0.014 -0.072 0.069 -0.269Lucky -0.404 -0.219 0.373 0.157 -0.471 0.084 0.089 0.131 -0.186Hobby 0.229 0.049 -0.402 0.262 0.282 0.128 0.498 0.036 -0.216satisfied 0.417 0.471 0.405 0.057 0.292 0.169 -0.114 -0.131 -0.19Highly Relevant 0.532 0.448 -0.179 0.015 0.39 0.204 -0.045 0.16 -0.287Recognition for Good performance
0.574 0.204 -0.068 0.109 0.05 0.151 0.43 -0.11 0.143
Recognition for Self achievement
0.611 0.497 0.11 0.202 -0.014 -0.055 0.092 -0.034 0.234
Proper conduct 0.296 0.379 0.628 0.207 0.22 0.103 -0.104 -0.013 0.126Emphasis on positive feedback
0.222 0.468 0.569 0.289 0.036 0.037 -0.053 -0.075 0.099
Valuable 0.25 0.048 -0.039 0.522 -0.573 -0.173 0.091 0.156 0.314NewJobinnextoneyear -0.489 0.327 -0.221 0.382 -0.014 0.282 -0.107 0.093 0.296Quit present job in next 1 year
-0.517 0.409 0.276 0.099 0.135 0.24 -0.271 -0.108 0.262
NewJobinnext3years -0.546 0.266 -0.205 0.335 -0.064 0.207 -0.261 -0.029 -0.054Often think of quitting present job
-0.626 0.289 -0.207 0.15 0.244 0.326 0.031 0.172 -0.124
NoprospectinFuture -0.642 -0.097 0.074 -0.075 0.398 0.082 -0.098 0.211 0.128Always perform better 0.009 -0.643 0.185 0.16 0.336 -0.064 -0.009 -0.057 0.093Often Perform better 0.173 -0.666 0.306 0.059 0.394 0.066 0.005 0.057 0.118Expend extra efforts 0.277 -0.685 0.128 -0.077 0.320 0.24 -0.042 0.055 0.191Hardwork 0.316 -0.445 0.02 -0.22 -0.094 0.291 -0.313 -0.257 0.241Quality is topnotch 0.496 -0.263 -0.057 -0.099 -0.383 0.418 -0.081 0.086 0.109Great deal of effort 0.366 -0.114 -0.213 -0.055 -0.267 0.530 -0.11 0.377 -0.011Noemotionalattachment -0.079 0.382 -0.104 -0.672 0.049 0.251 0.124 0.077 0.29Nofeelingofbelongingness
-0.137 0.522 -0.062 -0.634 -0.119 0.024 0.09 -0.133 0.158
Organizations has personal meaning
0.415 0.349 0.256 -0.304 -0.191 -0.139 -0.265 0.261 -0.212
Do not feel as part of the Family
0.176 -0.021 0.322 -0.012 0.092 -0.165 -0.079 0.819 0.055
Enjoy discussing the organization with outside people
-0.357 0.138 0.137 -0.162 0.117 -0.472 0.341 0.216 0.341
68 Journal of General Management Research
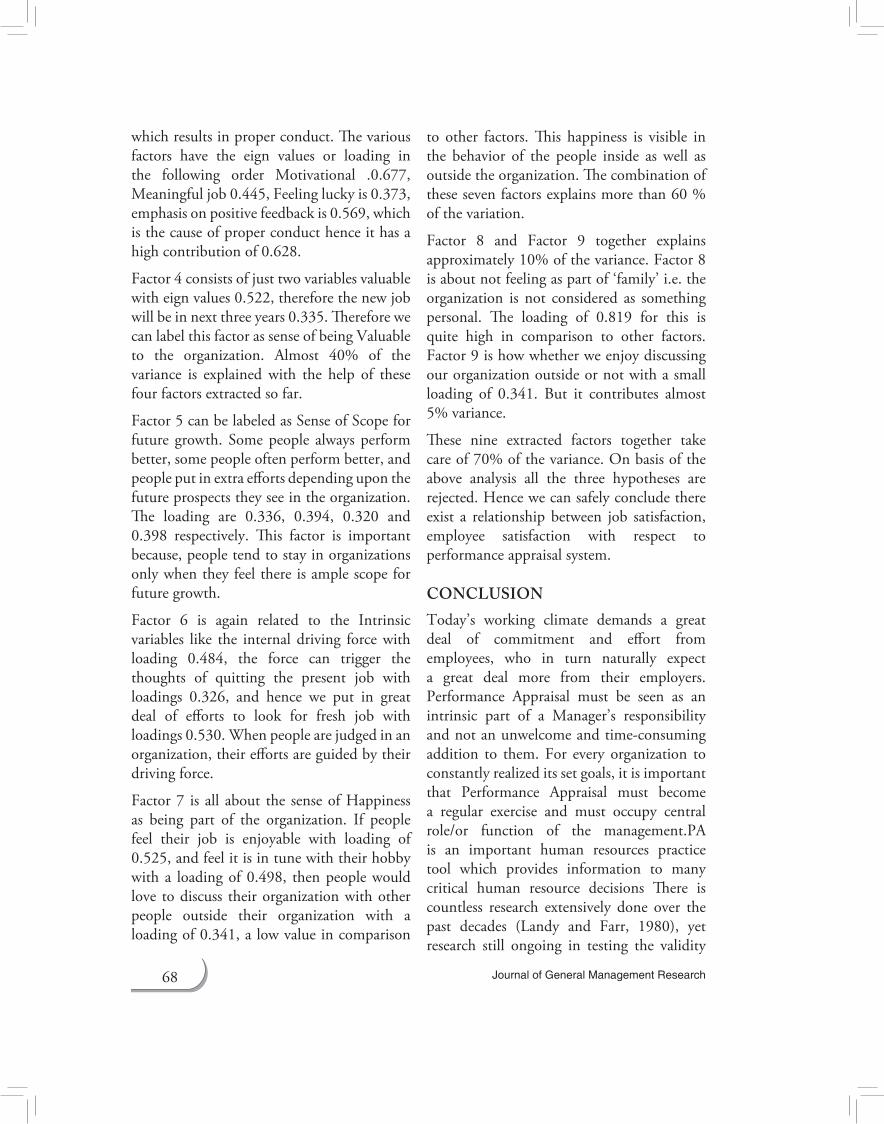
which results in proper conduct. The various factors have the eign values or loading in the following order Motivational .0.677, Meaningful job 0.445, Feeling lucky is 0.373, emphasis on positive feedback is 0.569, which is the cause of proper conduct hence it has a high contribution of 0.628.
Factor 4 consists of just two variables valuable with eign values 0.522, therefore the new job will be in next three years 0.335. Therefore we can label this factor as sense of being Valuable to the organization. Almost 40% of the variance is explained with the help of these four factors extracted so far.
Factor 5 can be labeled as Sense of Scope for future growth. Some people always perform better, some people often perform better, and people put in extra efforts depending upon the future prospects they see in the organization. The loading are 0.336, 0.394, 0.320 and 0.398 respectively. This factor is important because, people tend to stay in organizations only when they feel there is ample scope for future growth.
Factor 6 is again related to the Intrinsic variables like the internal driving force with loading 0.484, the force can trigger the thoughts of quitting the present job with loadings 0.326, and hence we put in great deal of efforts to look for fresh job with loadings 0.530. When people are judged in an organization, their efforts are guided by their driving force.
Factor 7 is all about the sense of Happiness as being part of the organization. If people feel their job is enjoyable with loading of 0.525, and feel it is in tune with their hobby with a loading of 0.498, then people would love to discuss their organization with other people outside their organization with a loading of 0.341, a low value in comparison
to other factors. This happiness is visible in the behavior of the people inside as well as outside the organization. The combination of these seven factors explains more than 60 % of the variation.
Factor 8 and Factor 9 together explains approximately 10% of the variance. Factor 8 is about not feeling as part of ‘family’ i.e. the organization is not considered as something personal. The loading of 0.819 for this is quite high in comparison to other factors. Factor 9 is how whether we enjoy discussing our organization outside or not with a small loading of 0.341. But it contributes almost 5% variance.
These nine extracted factors together take care of 70% of the variance. On basis of the above analysis all the three hypotheses are rejected. Hence we can safely conclude there exist a relationship between job satisfaction, employee satisfaction with respect to performance appraisal system.
CONCLUSIONToday’s working climate demands a great deal of commitment and effort from employees, who in turn naturally expect a great deal more from their employers. Performance Appraisal must be seen as an intrinsic part of a Manager’s responsibility andnotanunwelcomeandtime-consumingaddition to them. For every organization to constantly realized its set goals, it is important that Performance Appraisal must become a regular exercise and must occupy central role/or function of the management.PA is an important human resources practice tool which provides information to many critical human resource decisions There is countless research extensively done over the past decades (Landy and Farr, 1980), yetresearch still ongoing in testing the validity
69 Study of Performance Appraisal Systems in Service Industry in India
of the Performance Appraisal system across global. Furthermore, the effectiveness of the Performance Appraisal system is also based on to the extent how well Human Resource Development in an organization is oriented.
REFERENCES [1] Bohlander, G., & Snell, S. (2007). Managing
Human Resources (14th ed.). Mason, Ohio, USA: Thomson.
[2] Boswell, W.R., & Boudreau, J.W. (2000). Employee satisfaction with performance appraisals and appraisers. Human Resource Development Quarterly,11(3),283-299.
[3] Brown M, et al. (2010). Consequences of the performance appraisal experience: Personnel Review,39(3),375-396
[4]Cardy, R.L. & Dobbins, S.G. (1994).Performance appraisal: Alternative perspectives. Cincinnati,OH:South-WesternPublishing.
[5]Cleveland, J.N., Mohammed, S., Skattebo,A.L. & Sin, H.P. (2003). Multiple purposesof performance appraisal: A replication and extension. Poster presented at the annual conference for the Society for Industrial and OrganizationalPsychology,Orlando,FL.
[6]DeCarlo,T.E.,&Leigh,T.W.(2006).Impactof sales person attraction on sales managers’ attributions and Feedback. Journal of Marketing, 60(2),47-66.
[7] Fletcher, C. (2001). Performance appraisal and management: The developing research agenda. Journal of Occupational and organizational Psychology,74(4),473-487.
[8] Foot M., and Hook, C. (1996), Introducing human resource management, Singapore: Longman.
[9] Jackson, S.E. & Schuler, R.S. (2006). Managing Human Resource: Through Strategic Partnership, Ninth Edition. Ohio, USA: Thomson South-Western.
[10] Jorge M.S. & Carlos F. (2010). A LiteratureReview of Maintenance Performance Measurement: Directions for Future Research, RioDjaneiro,Sept2010,1-15.
[11] Kumari,N.&Malhotra, R. (2012). ‘EffectivePerformance Management System for Enhancing Growth’, Global Management Journal, 4(1/2): 77-85.
[12] Landy, E.F., Barnes, J.L. & Murphy, K.R.(1978). Correlated of perceived fairness and accuracy of performance evaluation. Journal of Applied Psychology, 63,751-754.
[13] Landy, F.J, and Farr. J.L. (1980)-PerformanceRating’, Psychological Bulletin, 87(1):72-107.
[14] Longenecker, C.O. (1997). Why managerialperformance appraisals are ineffective: Causes and lessons: Journal of Career Development International,2(5)212-218.
[15] McDowall, A. & Fletcher, C. (2004). Employee development: An organizational justice perspective. Journal of Personnel Review, 33(1), 8-29.
[16]Murphy, K.R. & Cleveland, J.N. (1995).Understanding Performance Appraisal: Thousand Oaks, CA: Sage Publications.
[17]Mullins, L.J. (1996). Management andOrganizational Behaviour (Fourth Edition), London:PitmanPublishing.
[18] Muczyk, Jan P. and Myron Gable (1987). Managing Sales Performance Through a Comprehensive Performance Appraisal System, Journal of Personal Selling & Sales Management, 7 (May),41-52.
[19]Neeti,SantoshC.(2015).StudyofPerformanceAppraisal System and it’s Effectiveness in FMCG Industry, International Journal of Research & Development in Technology and Management Science –Kailash,22(1),2015,53-63.
[20] Shrivastava, P. & Kiran, U.R. (2012). Performance Appraisal Practices In Indian Banks, Integral Review – A Journal of Management, e-ISSN: 2278-6120, p-ISSN: 0974-8032,Volume5,No.2,Dec.2012,pp.46-52.
[21] Vance, R.J. (2006). Employee engagement and commitment: A guide to understanding, measuring and increasing engagement in your organization. Society for Human Resource Management (SHRM) Foundation Effective Practice Guidelines.