structure and grazing impact of the mesozooplankton community during late summer 1994 near south...
TRANSCRIPT
ORIGINAL PAPER
E.A. Pakhomov á H.M. Verheye á A. AtkinsonR.K. Laubscher á J.Taunton-Clark
Structure and grazing impact of the mesozooplankton communityduring late summer 1994 near South Georgia, Antarctica
Received: 30 October 1996 /Accepted: 23 February 1997
Abstract Mesozooplankton abundance, communitystructure and grazing impact were determined duringlate austral summer (February/March) 1994 at eightoceanic stations near South Georgia using samplescollected with a Bongo and WP-2 nets in the upper200-m and 100-m layer, respectively. The zooplanktonabundance was generally dominated by copepoditestages C3±C5 of six copepod species: Rhincalanus gigas,Calanus simillimus, Calanoides acutus, Metridia spp.,Clausocalanus laticeps and Ctenocalanus vanus. Mostcopepods had large lipid sacs. All copepods accountedfor 41±98% of total zooplankton abundance. Juvenileeuphausiids were the second most important compo-nent contributing between 1 and 20% of total abun-dance. Pteropods, mainly Limacina in¯ata, were im-portant members of the pelagic community at two sites,accounting for 44 and 53% of total abundance. Averagemesozooplankton biomass in the upper 200 m was 8.0 gdry weight m)2, ranging from 4.3 to 11.5 g dry weightm)2. With the exception of Calanus simillimus, gutpigment contents and feeding activity of copepod spe-cies were low, suggesting that some species, after havingstored large lipid reserves, had probably started un-dergoing developmental arrest. Daily mesozooplanktongrazing impact, measured using in situ gut ¯uorescencetechniques and in vitro incubations, varied widely from<1 to 8% (mean 3.5%) of phytoplankton standingstock, and from 5 to 102% (mean 36%) of primaryproduction. The highest grazing impact was found
northeast of the island co-incident with the lowestphytoplankton biomass and primary production levels.
Introduction
The island of South Georgia (54°S, 37.5°W) is locatedin the path of the Antarctic Circumpolar Current(ACC). It is bounded to the north by the AntarcticPolar Front (APF) and to the south by the Weddell-Scotia Con¯uence (WSC). The oceanographic regime inthe vicinity of the island, therefore, re¯ects the inter-action of two major current systems: the AntarcticCircumpolar Current and the Weddell Sea Gyre (Prid-dle et al. 1988). The enhanced biological productivity ofthe shelf waters surrounding the island is well docu-mented (Hardy and Gunther 1935; Hart 1942) and itsupports large seabird and Antarctic fur seal colonies(Croxall et al. 1985).
The zooplankton community around the island ofSouth Georgia has recently been the subject of extensiveinvestigations. The zooplankton composition and dis-tribution were found to be closely related to watertemperature and hence water origin (Atkinson and Peck1988). The major factors that in¯uence zooplanktonabundance over the South Georgia shelf appeared to bethe circulation pattern, and seasonal and diel verticalmigrations (Atkinson and Peck 1988; 1990; Atkinson etal. 1990). The grazing impact of zooplankton, especiallycopepods, changed seasonally and spatially, varyingbetween < 5 and 56% of daily primary production(Atkinson et al. 1992a, 1992b, 1996; Ward et al. 1995).
Seasonal variations in the position of the APF in thevicinity of South Georgia have been previously de-scribed and were thought to result in compositionalchanges in the zooplankton community (Atkinson andPeck 1988; Priddle et al. 1988). It was suggested that,although the general position of the APF roughly fol-lows the bathymetry of the Scotia Arc, seasonal andshort-term changes in its position may be wind-driven.
Polar Biol (1997) 18: 180±192 Ó Springer-Verlag 1997
E.A. Pakhomov (&) á R.K. LaubscherSouthern Ocean Group, Department of Zoologyand Entomology, Rhodes University, P.O. Box 94,Grahamstown 6140, South Africae-mail: [email protected]
H.M. Verheye á J. Taunton-ClarkSea Fisheries Research Institute, Private Bag X 2,8012 Rogge Bay, Cape Town, South Africa
A. AtkinsonBritish Antarctic Survey, Natural Environment Research Council,High Cross, Madingley Road, Cambridge CB3 OET, UK
During summer 1981/1982, when the APF lay to thenorth of the island, the zooplankton community wasdominated by Antarctic species, while in winter 1983the APF migrated southwards and subantarctic speciespredominated (Atkinson and Peck 1988). Most pre-vious studies have been conducted in summer duringthe so-called ``cold years'' when the APF was located tothe north of the island (Hardy and Gunther 1935;Priddle et al. 1986, 1988). ``Cold years'' appear to be the``normal'' situation around South Georgia. However,during the summer cruise of 1994, sea surface temper-ature, salinity and nutrients provided partial evidencefor the intrusion of Subantarctic Surface Waters intothe region (Pakhomov et al. 1997; J. Taunton-Clark,unpublished work). Warm years are signi®ed by thescarcity of the cold-water zooplankton species, includ-ing Euphausia superba, around the island, and presum-ably with replacement by a warmer-water fauna. Theseyears also seem to be associated with catastrophicbreeding failure in vertebrate predators that rely on krill(Boyd et al. 1995; Croxall and Rothery 1995)
The main objectives of this study were to examinethe composition and grazing impact of the zooplanktoncommunity in the vicinity of South Georgia during lateaustral summer of 1994 and to compare these resultswith previous studies, including a data set obtainedduring a spring bloom in January 1994.
Materials and methods
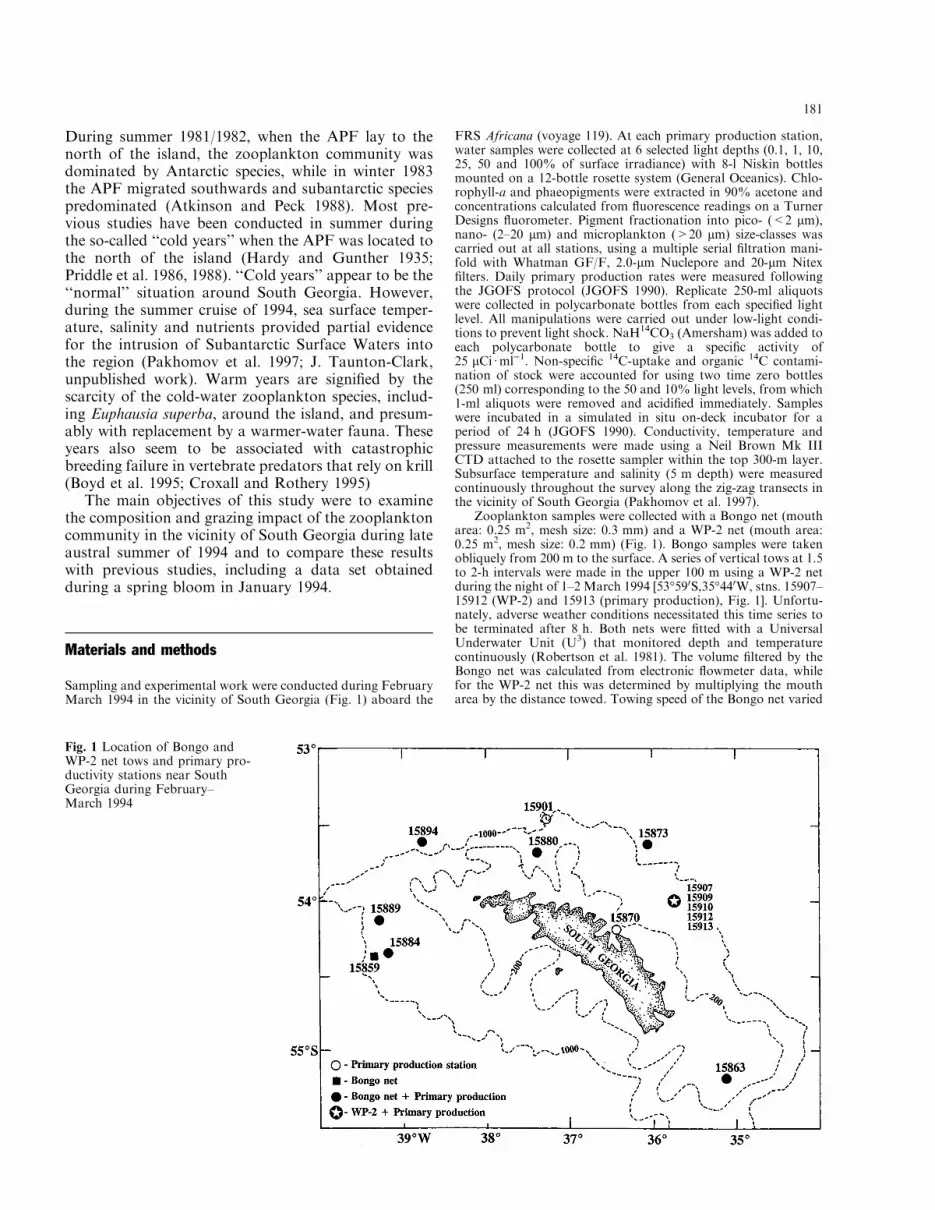
Sampling and experimental work were conducted during FebruaryMarch 1994 in the vicinity of South Georgia (Fig. 1) aboard the
FRS Africana (voyage 119). At each primary production station,water samples were collected at 6 selected light depths (0.1, 1, 10,25, 50 and 100% of surface irradiance) with 8-l Niskin bottlesmounted on a 12-bottle rosette system (General Oceanics). Chlo-rophyll-a and phaeopigments were extracted in 90% acetone andconcentrations calculated from ¯uorescence readings on a TurnerDesigns ¯uorometer. Pigment fractionation into pico- (<2 lm),nano- (2±20 lm) and microplankton (>20 lm) size-classes wascarried out at all stations, using a multiple serial ®ltration mani-fold with Whatman GF/F, 2.0-lm Nuclepore and 20-lm Nitex®lters. Daily primary production rates were measured followingthe JGOFS protocol (JGOFS 1990). Replicate 250-ml aliquotswere collected in polycarbonate bottles from each speci®ed lightlevel. All manipulations were carried out under low-light condi-tions to prevent light shock. NaH14CO3 (Amersham) was added toeach polycarbonate bottle to give a speci®c activity of25 lCi áml)1. Non-speci®c 14C-uptake and organic 14C contami-nation of stock were accounted for using two time zero bottles(250 ml) corresponding to the 50 and 10% light levels, from which1-ml aliquots were removed and acidi®ed immediately. Sampleswere incubated in a simulated in situ on-deck incubator for aperiod of 24 h (JGOFS 1990). Conductivity, temperature andpressure measurements were made using a Neil Brown Mk IIICTD attached to the rosette sampler within the top 300-m layer.Subsurface temperature and salinity (5 m depth) were measuredcontinuously throughout the survey along the zig-zag transects inthe vicinity of South Georgia (Pakhomov et al. 1997).
Zooplankton samples were collected with a Bongo net (moutharea: 0.25 m2, mesh size: 0.3 mm) and a WP-2 net (mouth area:0.25 m2, mesh size: 0.2 mm) (Fig. 1). Bongo samples were takenobliquely from 200 m to the surface. A series of vertical tows at 1.5to 2-h intervals were made in the upper 100 m using a WP-2 netduring the night of 1±2 March 1994 [53°590S,35°440W, stns. 15907±15912 (WP-2) and 15913 (primary production), Fig. 1]. Unfortu-nately, adverse weather conditions necessitated this time series tobe terminated after 8 h. Both nets were ®tted with a UniversalUnderwater Unit (U3) that monitored depth and temperaturecontinuously (Robertson et al. 1981). The volume ®ltered by theBongo net was calculated from electronic ¯owmeter data, whilefor the WP-2 net this was determined by multiplying the moutharea by the distance towed. Towing speed of the Bongo net varied
Fig. 1 Location of Bongo andWP-2 net tows and primary pro-ductivity stations near SouthGeorgia during February±March 1994
181
between 1.5 and 3 knots and an average tow duration was 15 min.Samples were preserved in 4±6% bu�ered formalin and examinedin the laboratory. Catches were sorted, counted and taxonomiccomposition assessed. Zooplankton abundance was expressed asthe number of individuals per square meter. Dry weights of themain zooplanktonic groups were obtained from specimens thatwere oven-dried at 60°C for 36 h. No adjustments were made tocorrect for tissue loss due to formaldehyde preservation. The meancopepod population stage was calculated according to:
Average stage = (nCI + 2*nCII + ...6*nCVI)/N
where nCI, nCII... is number of respective stages and N is totalnumber counted. Copepodites I were very scarce or absent insamples. This could be the result of their substantial underesti-mation due to the use of the net with large mesh size (0.3 mm).
Copepods (Rhincalanus gigas, Calanoides acutus and Calanussimillimus) of dominant development stages and euphausiid juve-niles (Thysanoessa spp. and Euphausia spp.) that were used formeasurements of gut pigment content were sorted immediatelyafter capture, placed in plastic centrifuge tubes (3±5 replicates, 1±5individuals per tube) containing 5 ml 100% methanol and storedat )20°C for ³12 h (Simard et al. 1985). After centrifugation,(5000 rpm) the pigment content of the methanol extract wasmeasured with a Turner 111 ¯uorometer, before and after acidi-®cation (Mackas and Bohrer 1976). Pigment contents were ex-pressed in terms of chl-a equivalents per individual and calculatedaccording to Strickland and Parsons (1968) as modi®ed by Con-over et al. (1986). When the chl-a/phaeopigment ratio of the gutcontent was higher than 0.25, total pigment levels were correctedaccording to Baars and Helling (1985). No estimates of the gutevacuation rate (k) were obtained for copepods, so average kvalues reported in the literature were employed: R. gigas 0.64 �0.26 (SD) h)1, range 0.23±1.0 h)1; Calanodes acutus 1.13 �0.28 h)1, range 0.92±1.59 h)1; Calanus simillimus 1.17 � 0.41 h)1,range 0.6±1.96 h)1 (Atkinson 1996; Atkinson et al. 1992a,b, 1996;Drits and Pasternak 1993; Perissinotto 1992). To estimate the gutevacuation rates of the euphausiids, freshly caught animals wereplaced gently into a 20-l plastic bucket ®lled with 0.2-lm ®lteredseawater to which non-¯uorescent charcoal powder (£ 100 lmparticle diameter) was added to maintain the animals in a con-tinuous feeding mode (Perissinotto and Pakhomov 1996; Willasonand Cox 1987). Containers with experimental animals were kepton deck at an ambient air temperature and light regime. The du-ration of these incubations ranged from 5 to 6 h and the decline ingut content was monitored at intervals of 10±30 min for the ®rst 2h and every 0.5±2 h thereafter. The gut evacuation rate constant(k, h)1) was derived from the slope of the regression of the naturallogarithm of gut pigment versus time (Dam and Peterson 1988;Perissinotto and Pakhomov 1996). No measurements of pigmentdegradation e�ciency were made, so all ingestion rates weremultiplied by 1.5 to adjust for this (Dam and Peterson 1988;Kiorboe and Tiselius 1987; Mayzaud and Razouls 1992; Peris-
sinotto 1992). Daily ingestion rates (I, ng (pigm) individual)1
day)1) were estimated from the relation I = 1.5 k G, where G is a24-h integrated value of gut pigment content, ng (pigm) individ-ual)1 (Perissinotto 1992; Wang and Conover 1986). Since no directmeasurements of ingestion rate of small copepods (Clausocalanusspp. and Ctenocalanus spp.), Metridia spp. and Oithona spp. weremade, the values obtained during January 1994 (Atkinson et al.1996) were used in order to calculate their grazing. Consumptionrates of Limacina spp., calculated for the same species in the vi-cinity of the subantarctic Prince Edward Islands during summer,were taken from Perissinotto (1992).
Four in vitro feeding experiments (in triplicate) with cope-podites C4±C5 of Calanoides acutus and R. gigas were also carriedout. Copepods were separated from a 3-l cod-end ®tted to theBongo net and allowed to acclimatize in 20-l containers ®lled withambient seawater prior to the experiments. After 24 h, 4±8 cope-pods per jar were incubated for 24 h in 1.2-l bottles ®lled withambient seawater collected from the surface. Experimental jars werekept in the dark in a deck incubator with a ¯ow-through circulationsystem to maintain ambient temperature and to facilitate a homo-genous suspension of food particles. Ingestion rates were estimatedfrom the di�erence between the ¯uorescence of water in the un-grazed controls and that of the experimental bottles (with grazers),thereby taking into account pigment increase due to phytoplanktongrowth in the control bottles. Two to three 250-ml aliquots from thecontrol and experimental bottles were ®ltered onto GF/C ®lters,and the pigment extracted in 8 ml of 90% acetone.
In order to estimate the mesozooplankton community grazingimpact, density data of the most abundant zooplankters werecombined with individual mass-speci®c ingestion rates measuredfor dominant development stages of most abundant copepods andeuphausiid juveniles. For stations where no direct measurementsof ingestion rates were made, average or literature values wereused. To convert chl-a concentration into autotrophic carbon (C),the carbon/chlorophyll ratio of 50 was used (Atkinson 1996).
Results
Environment and phytoplankton dynamics
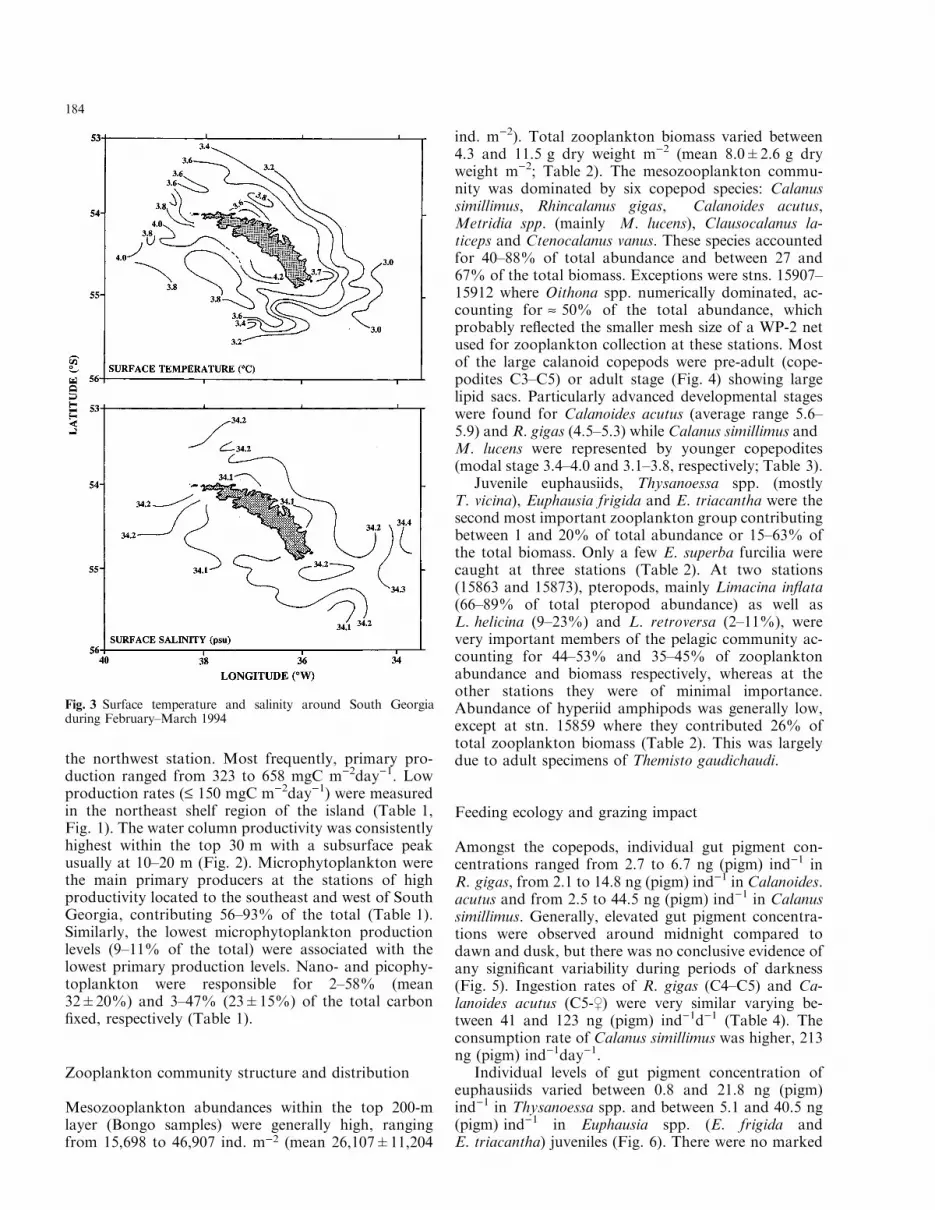
The water column structure in the vicinity of SouthGeorgia during February-March 1994 was character-ized by a 35 to 65-m mixed upper layer and a pro-nounced thermocline (Table 1, Fig. 2). Surface tem-perature was generally greater than 3°C with the highesttemperature generally recorded over the shelf area,northwest and southwest of the island (Fig. 3). Surfacesalinities were usually higher than 33.10 psu with high-
Table 1 Size fractionated chlorophyll-a and primary production integrated over the euphotic zone in the vicinity of South Georgia duringFebruary±March 1994
Stn. no. Date1994
Euphoticdepth (m)
Mixed-layerdepth (m)
Chlorophyll-a (mg m)2) Primary production (mg C m)2day)1)
Micro Nano Pico Total Micro Nano Pico Total
15863 19.02 65 65 24.31 24.64 3.14 52.09 339.5 132.8 133.2 605.515870 21.02 50 35 29.04 10.26 2.93 42.23 17.0 68.4 65.2 150.615873 22.02 65 65 23.28 27.71 20.83 71.82 123.7 197.2 141.3 462.215880 23.02 55 50 35.78 29.32 41.19 106.29 128.7 164.5 77.9 371.115884 24.02 54 60 23.97 19.93 11.86 55.76 707.6 28.2 22.2 758.015889 25.02 54 50 76.03 42.37 28.29 146.69 197.7 91.4 34.6 323.715894 26.02 54 60 211.54 31.40 88.65 331.55 1316.2 24.0 319.7 1659.915901 28.02 59 40 53.31 57.22 14.23 124.76 131.5 258.9 53.1 443.515913 02.03 54 60 2.44 12.75 17.62 32.81 6.0 30.2 32.4 68.6
182
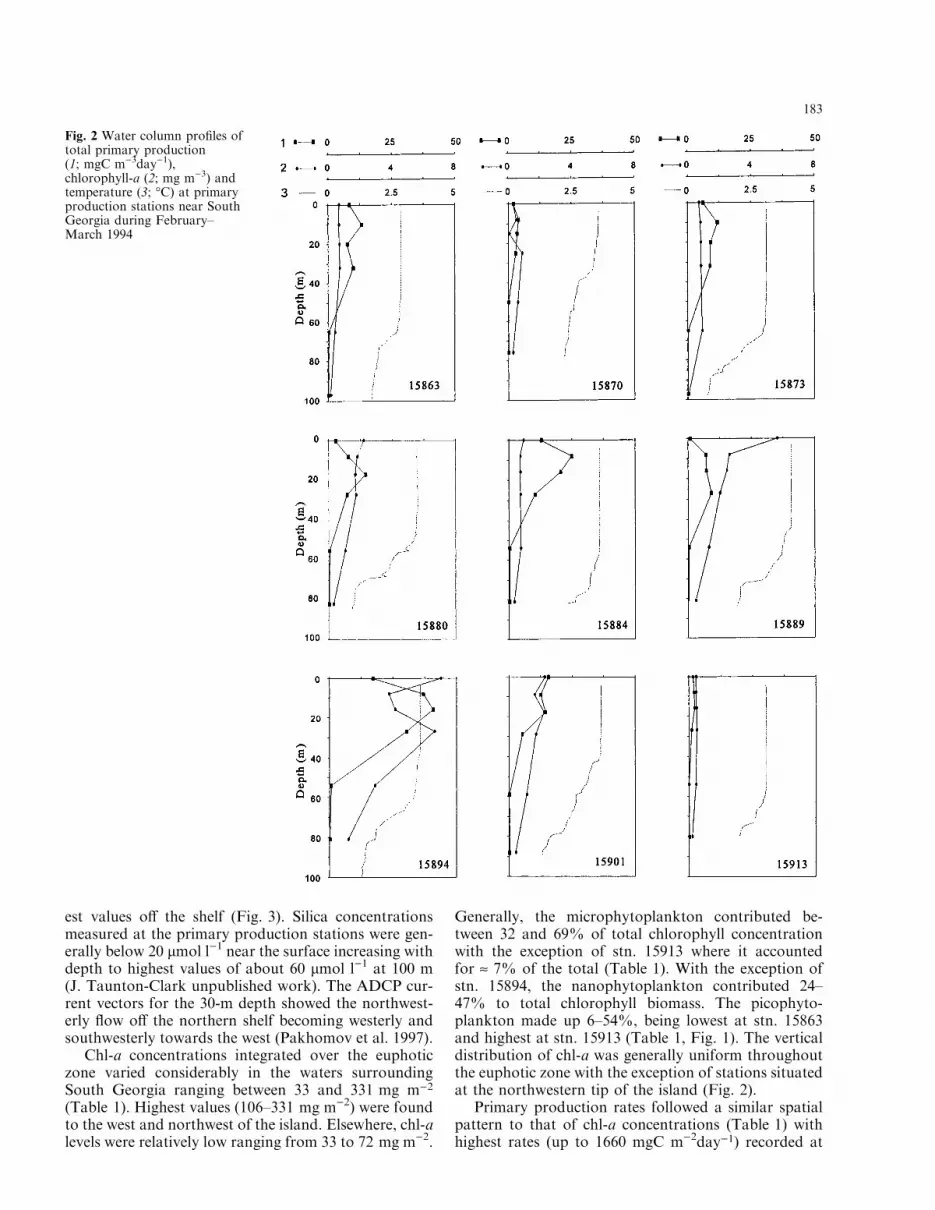
est values o� the shelf (Fig. 3). Silica concentrationsmeasured at the primary production stations were gen-erally below 20 lmol l)1 near the surface increasing withdepth to highest values of about 60 lmol l)1 at 100 m(J. Taunton-Clark unpublished work). The ADCP cur-rent vectors for the 30-m depth showed the northwest-erly ¯ow o� the northern shelf becoming westerly andsouthwesterly towards the west (Pakhomov et al. 1997).
Chl-a concentrations integrated over the euphoticzone varied considerably in the waters surroundingSouth Georgia ranging between 33 and 331 mg m)2
(Table 1). Highest values (106±331 mg m)2) were foundto the west and northwest of the island. Elsewhere, chl-alevels were relatively low ranging from 33 to 72 mg m)2.
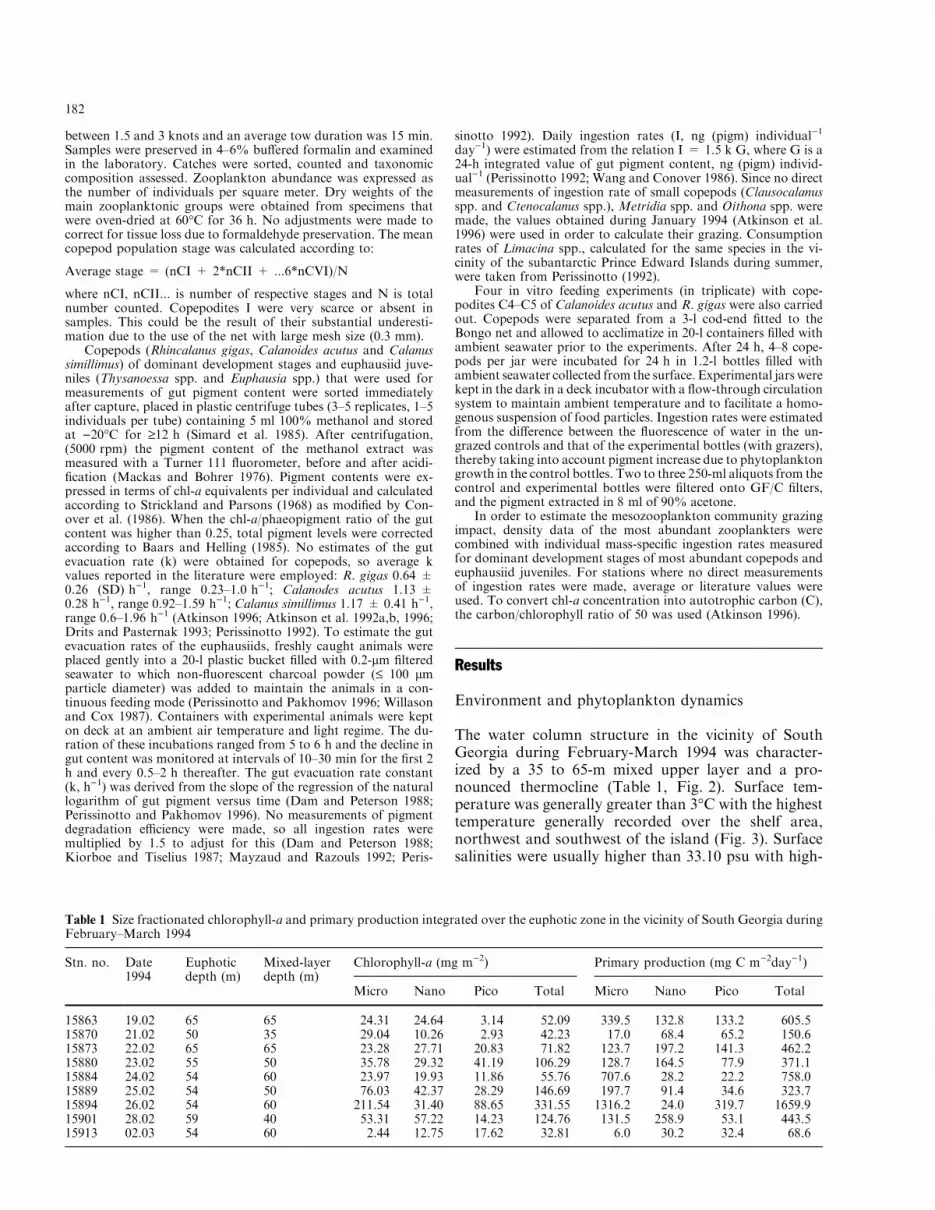
Generally, the microphytoplankton contributed be-tween 32 and 69% of total chlorophyll concentrationwith the exception of stn. 15913 where it accountedfor » 7% of the total (Table 1). With the exception ofstn. 15894, the nanophytoplankton contributed 24±47% to total chlorophyll biomass. The picophyto-plankton made up 6±54%, being lowest at stn. 15863and highest at stn. 15913 (Table 1, Fig. 1). The verticaldistribution of chl-a was generally uniform throughoutthe euphotic zone with the exception of stations situatedat the northwestern tip of the island (Fig. 2).
Primary production rates followed a similar spatialpattern to that of chl-a concentrations (Table 1) withhighest rates (up to 1660 mgC m)2day)1) recorded at
Fig. 2 Water column pro®les oftotal primary production(1; mgC m)3day)1),chlorophyll-a (2; mg m)3) andtemperature (3; °C) at primaryproduction stations near SouthGeorgia during February±March 1994
183
the northwest station. Most frequently, primary pro-duction ranged from 323 to 658 mgC m)2day)1. Lowproduction rates (£ 150 mgC m)2day)1) were measuredin the northeast shelf region of the island (Table 1,Fig. 1). The water column productivity was consistentlyhighest within the top 30 m with a subsurface peakusually at 10±20 m (Fig. 2). Microphytoplankton werethe main primary producers at the stations of highproductivity located to the southeast and west of SouthGeorgia, contributing 56±93% of the total (Table 1).Similarly, the lowest microphytoplankton productionlevels (9±11% of the total) were associated with thelowest primary production levels. Nano- and picophy-toplankton were responsible for 2±58% (mean32�20%) and 3±47% (23�15%) of the total carbon®xed, respectively (Table 1).
Zooplankton community structure and distribution
Mesozooplankton abundances within the top 200-mlayer (Bongo samples) were generally high, rangingfrom 15,698 to 46,907 ind. m)2 (mean 26,107�11,204
ind. m)2). Total zooplankton biomass varied between4.3 and 11.5 g dry weight m)2 (mean 8.0�2.6 g dryweight m)2; Table 2). The mesozooplankton commu-nity was dominated by six copepod species: Calanussimillimus, Rhincalanus gigas, Calanoides acutus,Metridia spp. (mainly M. lucens), Clausocalanus la-ticeps and Ctenocalanus vanus. These species accountedfor 40±88% of total abundance and between 27 and67% of the total biomass. Exceptions were stns. 15907±15912 where Oithona spp. numerically dominated, ac-counting for » 50% of the total abundance, whichprobably re¯ected the smaller mesh size of a WP-2 netused for zooplankton collection at these stations. Mostof the large calanoid copepods were pre-adult (cope-podites C3±C5) or adult stage (Fig. 4) showing largelipid sacs. Particularly advanced developmental stageswere found for Calanoides acutus (average range 5.6±5.9) and R. gigas (4.5±5.3) while Calanus simillimus andM. lucens were represented by younger copepodites(modal stage 3.4±4.0 and 3.1±3.8, respectively; Table 3).
Juvenile euphausiids, Thysanoessa spp. (mostlyT. vicina), Euphausia frigida and E. triacantha were thesecond most important zooplankton group contributingbetween 1 and 20% of total abundance or 15±63% ofthe total biomass. Only a few E. superba furcilia werecaught at three stations (Table 2). At two stations(15863 and 15873), pteropods, mainly Limacina in¯ata(66±89% of total pteropod abundance) as well asL. helicina (9±23%) and L. retroversa (2±11%), werevery important members of the pelagic community ac-counting for 44±53% and 35±45% of zooplanktonabundance and biomass respectively, whereas at theother stations they were of minimal importance.Abundance of hyperiid amphipods was generally low,except at stn. 15859 where they contributed 26% oftotal zooplankton biomass (Table 2). This was largelydue to adult specimens of Themisto gaudichaudi.
Feeding ecology and grazing impact
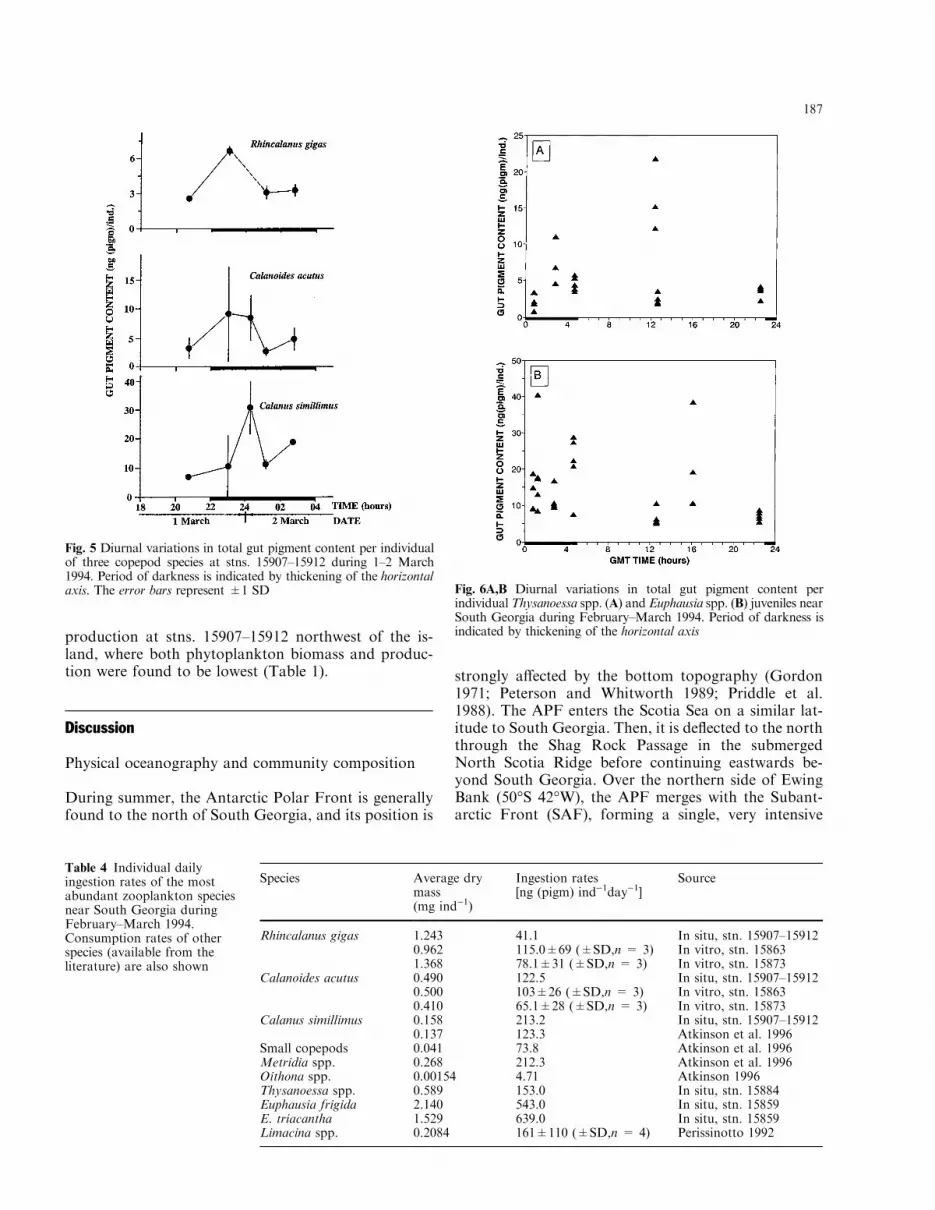
Amongst the copepods, individual gut pigment con-centrations ranged from 2.7 to 6.7 ng (pigm) ind)1 inR. gigas, from 2.1 to 14.8 ng (pigm) ind)1 in Calanoides.acutus and from 2.5 to 44.5 ng (pigm) ind)1 in Calanussimillimus. Generally, elevated gut pigment concentra-tions were observed around midnight compared todawn and dusk, but there was no conclusive evidence ofany signi®cant variability during periods of darkness(Fig. 5). Ingestion rates of R. gigas (C4±C5) and Ca-lanoides acutus (C5-$) were very similar varying be-tween 41 and 123 ng (pigm) ind)1d)1 (Table 4). Theconsumption rate of Calanus simillimus was higher, 213ng (pigm) ind)1day)1.
Individual levels of gut pigment concentration ofeuphausiids varied between 0.8 and 21.8 ng (pigm)ind)1 in Thysanoessa spp. and between 5.1 and 40.5 ng(pigm) ind)1 in Euphausia spp. (E. frigida andE. triacantha) juveniles (Fig. 6). There were no marked
Fig. 3 Surface temperature and salinity around South Georgiaduring February±March 1994
184
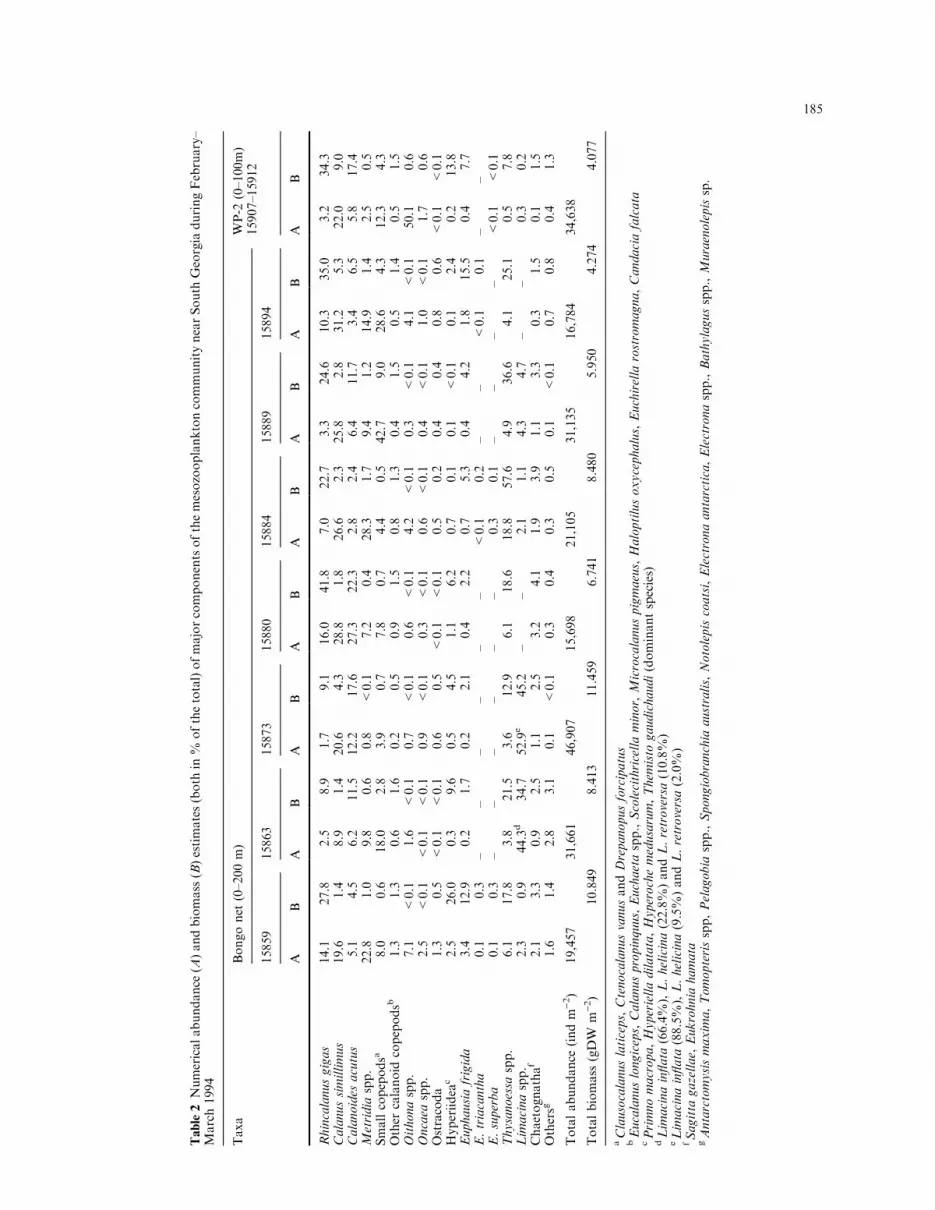
Table2Numericalabundance(A)andbiomass(B)estimates(both
in%
ofthetotal)ofmajorcomponentsofthemesozooplanktoncommunitynearSouth
GeorgiaduringFebruary±
March1994
Taxa
Bongonet(0±200m)
WP-2
(0±100m)
15907±15912
15859
15863
15873
15880
15884
15889
15894
AB
AB
AB
AB
AB
AB
AB
AB
Rhincalanusgigas
14.1
27.8
2.5
8.9
1.7
9.1
16.0
41.8
7.0
22.7
3.3
24.6
10.3
35.0
3.2
34.3
Calanussimillimus
19.6
1.4
8.9
1.4
20.6
4.3
28.8
1.8
26.6
2.3
25.8
2.8
31.2
5.3
22.0
9.0
Calanoides
acutus
5.1
4.5
6.2
11.5
12.2
17.6
27.3
22.3
2.8
2.4
6.4
11.7
3.4
6.5
5.8
17.4
Metridiaspp.
22.8
1.0
9.8
0.6
0.8
<0.1
7.2
0.4
28.3
1.7
9.4
1.2
14.9
1.4
2.5
0.5
Smallcopepodsa
8.0
0.6
18.0
2.8
3.9
0.7
7.8
0.7
4.4
0.5
42.7
9.0
28.6
4.3
12.3
4.3
Other
calanoid
copepodsb
1.3
1.3
0.6
1.6
0.2
0.5
0.9
1.5
0.8
1.3
0.4
1.5
0.5
1.4
0.5
1.5
Oithonaspp.
7.1
<0.1
1.6
<0.1
0.7
<0.1
0.6
<0.1
4.2
<0.1
0.3
<0.1
4.1
<0.1
50.1
0.6
Oncaea
spp.
2.5
<0.1
<0.1
<0.1
0.9
<0.1
0.3
<0.1
0.6
<0.1
0.4
<0.1
1.0
<0.1
1.7
0.6
Ostracoda
1.3
0.5
<0.1
<0.1
0.6
0.5
<0.1
<0.1
0.5
0.2
0.4
0.4
0.8
0.6
<0.1
<0.1
Hyperiidea
c2.5
26.0
0.3
9.6
0.5
4.5
1.1
6.2
0.7
0.1
0.1
<0.1
0.1
2.4
0.2
13.8
Euphausiafrigida
3.4
12.9
0.2
1.7
0.2
2.1
0.4
2.2
0.7
5.3
0.4
4.2
1.8
15.5
0.4
7.7
E.triacantha
0.1
0.3
±±
±±
±±
<0.1
0.2
±±
<0.1
0.1
±±
E.superba
0.1
0.3
±±
±±
±±
0.3
0.1
±±
±±
<0.1
<0.1
Thysanoessa
spp.
6.1
17.8
3.8
21.5
3.6
12.9
6.1
18.6
18.8
57.6
4.9
36.6
4.1
25.1
0.5
7.8
Limacinaspp.
2.3
0.9
44.3d
34.7
52.9e
45.2
±±
2.1
1.1
4.3
4.7
±±
0.3
0.2
Chaetognathaf
2.1
3.3
0.9
2.5
1.1
2.5
3.2
4.1
1.9
3.9
1.1
3.3
0.3
1.5
0.1
1.5
Othersg
1.6
1.4
2.8
3.1
0.1
<0.1
0.3
0.4
0.3
0.5
0.1
<0.1
0.7
0.8
0.4
1.3
Totalabundance
(indm
)2)
19,457
31,661
46,907
15,698
21,105
31,135
16,784
34,638
Totalbiomass(gDW
m)2)
10.849
8.413
11.459
6.741
8.480
5.950
4.274
4.077
aClausocalanuslaticeps,CtenocalanusvanusandDrepanopusforcipatus
bEucalanuslongiceps,Calanuspropinquus,Euchaetaspp.,Scolecithricellaminor,Microcalanuspigmaeus,Haloptilusoxycephalus,Euchirella
rostromagna,Candaciafalcata
cPrimnomacropa,Hyperielladilatata,Hyperochemedusarum,Them
isto
gaudichaudi(dominantspecies)
dLimacinain¯ata
(66.4%),L.helicina(22.8%)andL.retroversa(10.8%)
eLimacinain¯ata
(88.5%),L.helicina(9.5%)andL.retroversa(2.0%)
fSagitta
gazellae,Eukrohnia
hamata
gAntarctomysismaxima,Tomopterisspp,Pelagobiaspp.,Spongiobranchia
australis,Notolepiscoatsi,Electronaantarctica,Electronaspp.,Bathylagusspp.,Muraenolepissp.
185
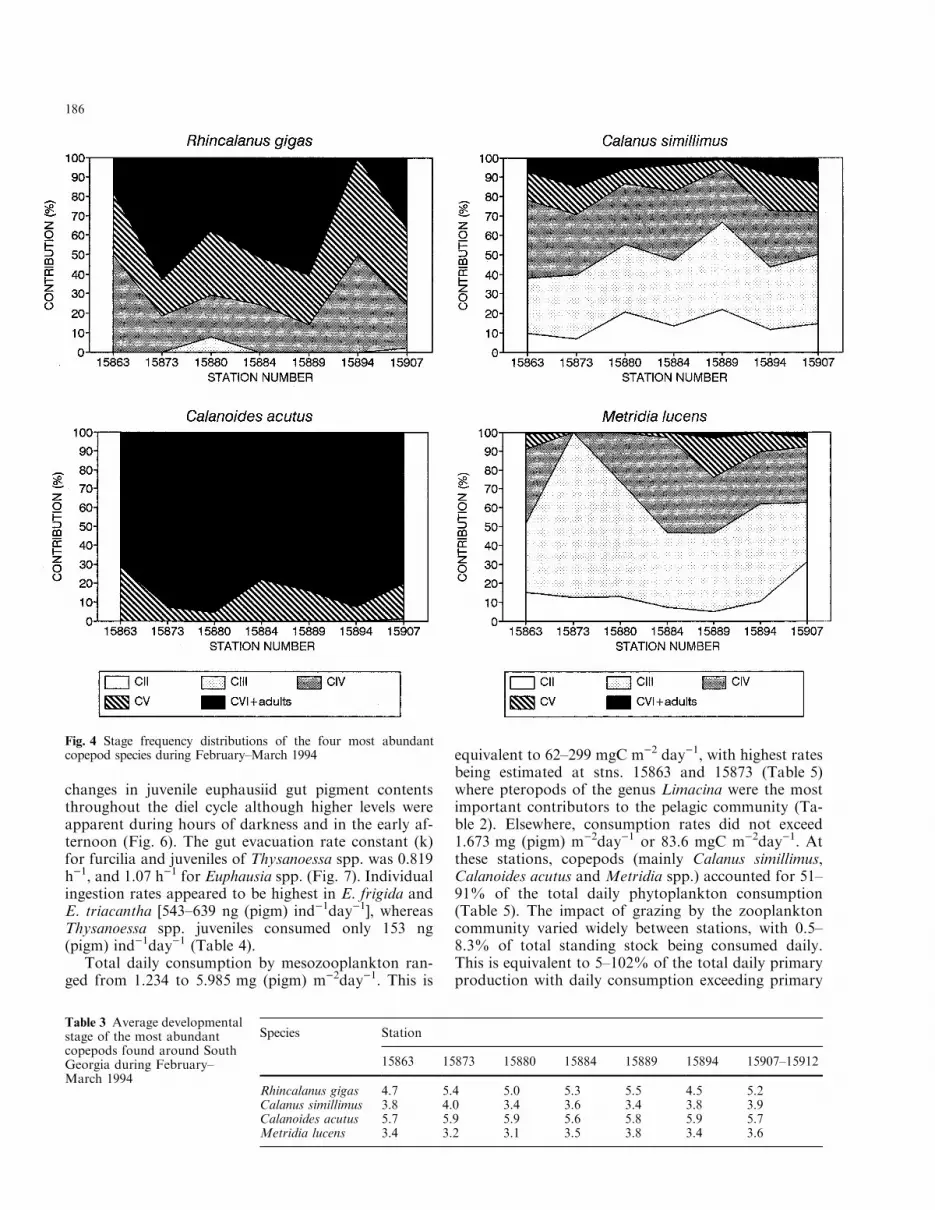
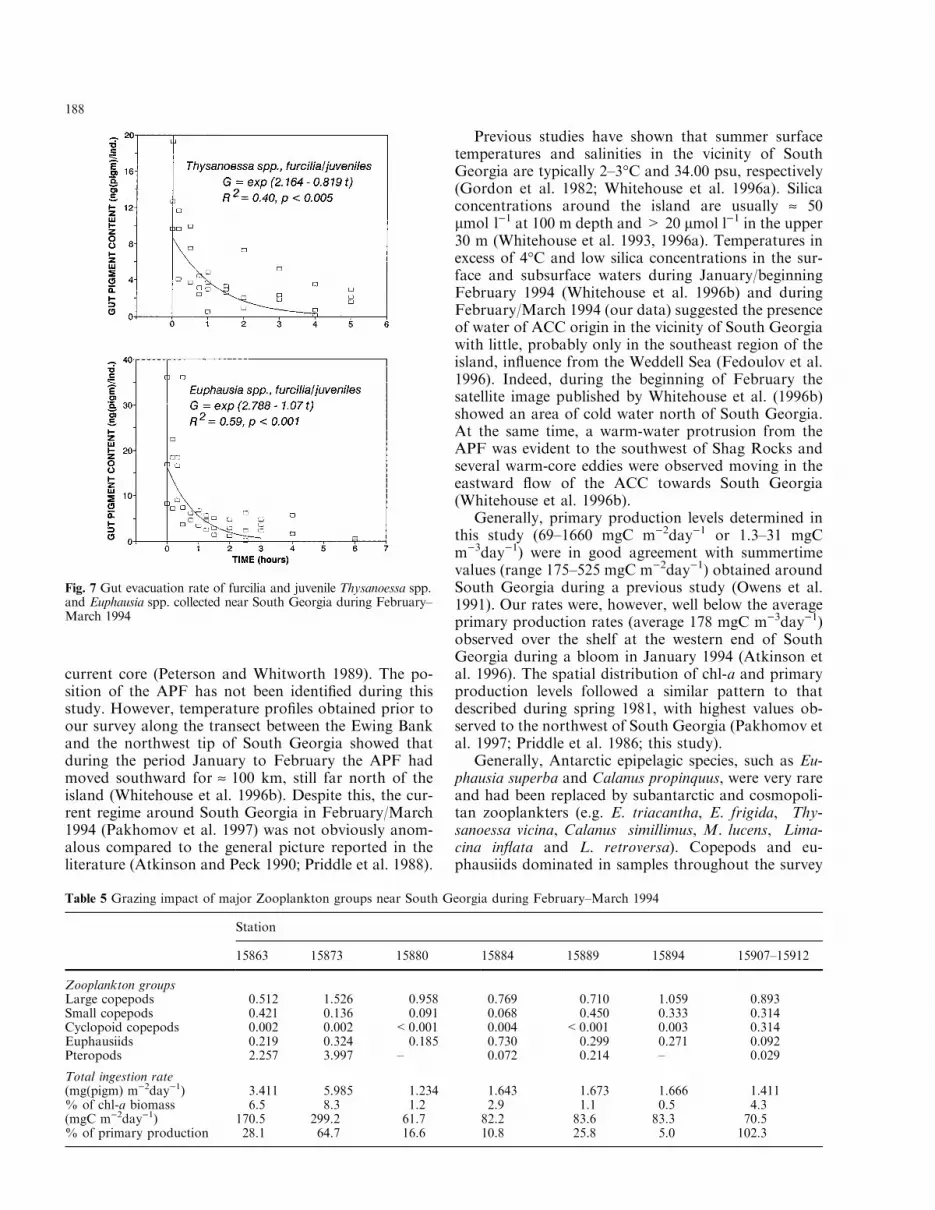
changes in juvenile euphausiid gut pigment contentsthroughout the diel cycle although higher levels wereapparent during hours of darkness and in the early af-ternoon (Fig. 6). The gut evacuation rate constant (k)for furcilia and juveniles of Thysanoessa spp. was 0.819h)1, and 1.07 h)1 for Euphausia spp. (Fig. 7). Individualingestion rates appeared to be highest in E. frigida andE. triacantha [543±639 ng (pigm) ind)1day)1], whereasThysanoessa spp. juveniles consumed only 153 ng(pigm) ind)1day)1 (Table 4).
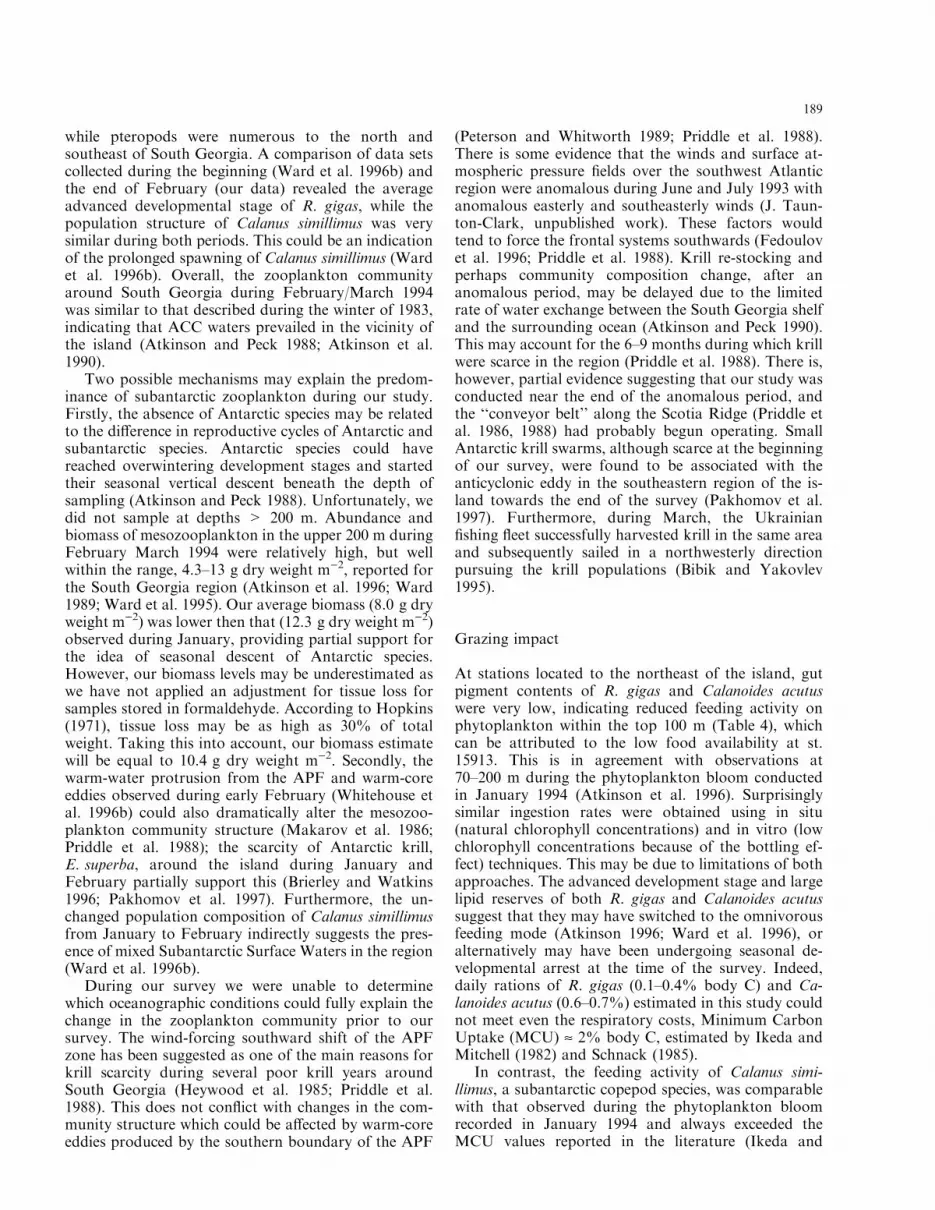
Total daily consumption by mesozooplankton ran-ged from 1.234 to 5.985 mg (pigm) m)2day)1. This is
equivalent to 62±299 mgC m)2 day)1, with highest ratesbeing estimated at stns. 15863 and 15873 (Table 5)where pteropods of the genus Limacina were the mostimportant contributors to the pelagic community (Ta-ble 2). Elsewhere, consumption rates did not exceed1.673 mg (pigm) m)2day)1 or 83.6 mgC m)2day)1. Atthese stations, copepods (mainly Calanus simillimus,Calanoides acutus and Metridia spp.) accounted for 51±91% of the total daily phytoplankton consumption(Table 5). The impact of grazing by the zooplanktoncommunity varied widely between stations, with 0.5±8.3% of total standing stock being consumed daily.This is equivalent to 5±102% of the total daily primaryproduction with daily consumption exceeding primary
Table 3 Average developmentalstage of the most abundantcopepods found around SouthGeorgia during February±March 1994
Species Station
15863 15873 15880 15884 15889 15894 15907±15912
Rhincalanus gigas 4.7 5.4 5.0 5.3 5.5 4.5 5.2Calanus simillimus 3.8 4.0 3.4 3.6 3.4 3.8 3.9Calanoides acutus 5.7 5.9 5.9 5.6 5.8 5.9 5.7Metridia lucens 3.4 3.2 3.1 3.5 3.8 3.4 3.6
Fig. 4 Stage frequency distributions of the four most abundantcopepod species during February±March 1994
186
production at stns. 15907±15912 northwest of the is-land, where both phytoplankton biomass and produc-tion were found to be lowest (Table 1).
Discussion
Physical oceanography and community composition
During summer, the Antarctic Polar Front is generallyfound to the north of South Georgia, and its position is
strongly a�ected by the bottom topography (Gordon1971; Peterson and Whitworth 1989; Priddle et al.1988). The APF enters the Scotia Sea on a similar lat-itude to South Georgia. Then, it is de¯ected to the norththrough the Shag Rock Passage in the submergedNorth Scotia Ridge before continuing eastwards be-yond South Georgia. Over the northern side of EwingBank (50°S 42°W), the APF merges with the Subant-arctic Front (SAF), forming a single, very intensive
Fig. 5 Diurnal variations in total gut pigment content per individualof three copepod species at stns. 15907±15912 during 1±2 March1994. Period of darkness is indicated by thickening of the horizontalaxis. The error bars represent �1 SD
Table 4 Individual dailyingestion rates of the mostabundant zooplankton speciesnear South Georgia duringFebruary±March 1994.Consumption rates of otherspecies (available from theliterature) are also shown
Species Average dry Ingestion rates Sourcemass(mg ind)1)
[ng (pigm) ind)1day)1]
Rhincalanus gigas 1.243 41.1 In situ, stn. 15907±159120.962 115.0�69 (�SD,n = 3) In vitro, stn. 158631.368 78.1�31 (�SD,n = 3) In vitro, stn. 15873
Calanoides acutus 0.490 122.5 In situ, stn. 15907±159120.500 103�26 (�SD,n = 3) In vitro, stn. 158630.410 65.1�28 (�SD,n = 3) In vitro, stn. 15873
Calanus simillimus 0.158 213.2 In situ, stn. 15907±159120.137 123.3 Atkinson et al. 1996
Small copepods 0.041 73.8 Atkinson et al. 1996Metridia spp. 0.268 212.3 Atkinson et al. 1996Oithona spp. 0.00154 4.71 Atkinson 1996Thysanoessa spp. 0.589 153.0 In situ, stn. 15884Euphausia frigida 2.140 543.0 In situ, stn. 15859E. triacantha 1.529 639.0 In situ, stn. 15859Limacina spp. 0.2084 161�110 (�SD,n = 4) Perissinotto 1992
Fig. 6A,B Diurnal variations in total gut pigment content perindividualThysanoessa spp. (A) and Euphausia spp. (B) juveniles nearSouth Georgia during February±March 1994. Period of darkness isindicated by thickening of the horizontal axis
187
current core (Peterson and Whitworth 1989). The po-sition of the APF has not been identi®ed during thisstudy. However, temperature pro®les obtained prior toour survey along the transect between the Ewing Bankand the northwest tip of South Georgia showed thatduring the period January to February the APF hadmoved southward for » 100 km, still far north of theisland (Whitehouse et al. 1996b). Despite this, the cur-rent regime around South Georgia in February/March1994 (Pakhomov et al. 1997) was not obviously anom-alous compared to the general picture reported in theliterature (Atkinson and Peck 1990; Priddle et al. 1988).
Previous studies have shown that summer surfacetemperatures and salinities in the vicinity of SouthGeorgia are typically 2±3°C and 34.00 psu, respectively(Gordon et al. 1982; Whitehouse et al. 1996a). Silicaconcentrations around the island are usually » 50lmol l)1 at 100 m depth and > 20 lmol l)1 in the upper30 m (Whitehouse et al. 1993, 1996a). Temperatures inexcess of 4°C and low silica concentrations in the sur-face and subsurface waters during January/beginningFebruary 1994 (Whitehouse et al. 1996b) and duringFebruary/March 1994 (our data) suggested the presenceof water of ACC origin in the vicinity of South Georgiawith little, probably only in the southeast region of theisland, in¯uence from the Weddell Sea (Fedoulov et al.1996). Indeed, during the beginning of February thesatellite image published by Whitehouse et al. (1996b)showed an area of cold water north of South Georgia.At the same time, a warm-water protrusion from theAPF was evident to the southwest of Shag Rocks andseveral warm-core eddies were observed moving in theeastward ¯ow of the ACC towards South Georgia(Whitehouse et al. 1996b).
Generally, primary production levels determined inthis study (69±1660 mgC m)2day)1 or 1.3±31 mgCm)3day)1) were in good agreement with summertimevalues (range 175±525 mgC m)2day)1) obtained aroundSouth Georgia during a previous study (Owens et al.1991). Our rates were, however, well below the averageprimary production rates (average 178 mgC m)3day)1)observed over the shelf at the western end of SouthGeorgia during a bloom in January 1994 (Atkinson etal. 1996). The spatial distribution of chl-a and primaryproduction levels followed a similar pattern to thatdescribed during spring 1981, with highest values ob-served to the northwest of South Georgia (Pakhomov etal. 1997; Priddle et al. 1986; this study).
Generally, Antarctic epipelagic species, such as Eu-phausia superba and Calanus propinquus, were very rareand had been replaced by subantarctic and cosmopoli-tan zooplankters (e.g. E. triacantha, E. frigida, Thy-sanoessa vicina, Calanus simillimus, M. lucens, Lima-cina in¯ata and L. retroversa). Copepods and eu-phausiids dominated in samples throughout the survey
Fig. 7 Gut evacuation rate of furcilia and juvenile Thysanoessa spp.and Euphausia spp. collected near South Georgia during February±March 1994
Table 5 Grazing impact of major Zooplankton groups near South Georgia during February±March 1994
Station
15863 15873 15880 15884 15889 15894 15907±15912
Zooplankton groupsLarge copepods 0.512 1.526 0.958 0.769 0.710 1.059 0.893Small copepods 0.421 0.136 0.091 0.068 0.450 0.333 0.314Cyclopoid copepods 0.002 0.002 <0.001 0.004 <0.001 0.003 0.314Euphausiids 0.219 0.324 0.185 0.730 0.299 0.271 0.092Pteropods 2.257 3.997 ± 0.072 0.214 ± 0.029
Total ingestion rate(mg(pigm) m)2day)1) 3.411 5.985 1.234 1.643 1.673 1.666 1.411% of chl-a biomass 6.5 8.3 1.2 2.9 1.1 0.5 4.3(mgC m)2day)1) 170.5 299.2 61.7 82.2 83.6 83.3 70.5% of primary production 28.1 64.7 16.6 10.8 25.8 5.0 102.3
188
while pteropods were numerous to the north andsoutheast of South Georgia. A comparison of data setscollected during the beginning (Ward et al. 1996b) andthe end of February (our data) revealed the averageadvanced developmental stage of R. gigas, while thepopulation structure of Calanus simillimus was verysimilar during both periods. This could be an indicationof the prolonged spawning of Calanus simillimus (Wardet al. 1996b). Overall, the zooplankton communityaround South Georgia during February/March 1994was similar to that described during the winter of 1983,indicating that ACC waters prevailed in the vicinity ofthe island (Atkinson and Peck 1988; Atkinson et al.1990).
Two possible mechanisms may explain the predom-inance of subantarctic zooplankton during our study.Firstly, the absence of Antarctic species may be relatedto the di�erence in reproductive cycles of Antarctic andsubantarctic species. Antarctic species could havereached overwintering development stages and startedtheir seasonal vertical descent beneath the depth ofsampling (Atkinson and Peck 1988). Unfortunately, wedid not sample at depths > 200 m. Abundance andbiomass of mesozooplankton in the upper 200 m duringFebruary March 1994 were relatively high, but wellwithin the range, 4.3±13 g dry weight m)2, reported forthe South Georgia region (Atkinson et al. 1996; Ward1989; Ward et al. 1995). Our average biomass (8.0 g dryweight m)2) was lower then that (12.3 g dry weight m)2)observed during January, providing partial support forthe idea of seasonal descent of Antarctic species.However, our biomass levels may be underestimated aswe have not applied an adjustment for tissue loss forsamples stored in formaldehyde. According to Hopkins(1971), tissue loss may be as high as 30% of totalweight. Taking this into account, our biomass estimatewill be equal to 10.4 g dry weight m)2. Secondly, thewarm-water protrusion from the APF and warm-coreeddies observed during early February (Whitehouse etal. 1996b) could also dramatically alter the mesozoo-plankton community structure (Makarov et al. 1986;Priddle et al. 1988); the scarcity of Antarctic krill,E. superba, around the island during January andFebruary partially support this (Brierley and Watkins1996; Pakhomov et al. 1997). Furthermore, the un-changed population composition of Calanus simillimusfrom January to February indirectly suggests the pres-ence of mixed Subantarctic Surface Waters in the region(Ward et al. 1996b).
During our survey we were unable to determinewhich oceanographic conditions could fully explain thechange in the zooplankton community prior to oursurvey. The wind-forcing southward shift of the APFzone has been suggested as one of the main reasons forkrill scarcity during several poor krill years aroundSouth Georgia (Heywood et al. 1985; Priddle et al.1988). This does not con¯ict with changes in the com-munity structure which could be a�ected by warm-coreeddies produced by the southern boundary of the APF
(Peterson and Whitworth 1989; Priddle et al. 1988).There is some evidence that the winds and surface at-mospheric pressure ®elds over the southwest Atlanticregion were anomalous during June and July 1993 withanomalous easterly and southeasterly winds (J. Taun-ton-Clark, unpublished work). These factors wouldtend to force the frontal systems southwards (Fedoulovet al. 1996; Priddle et al. 1988). Krill re-stocking andperhaps community composition change, after ananomalous period, may be delayed due to the limitedrate of water exchange between the South Georgia shelfand the surrounding ocean (Atkinson and Peck 1990).This may account for the 6±9 months during which krillwere scarce in the region (Priddle et al. 1988). There is,however, partial evidence suggesting that our study wasconducted near the end of the anomalous period, andthe ``conveyor belt'' along the Scotia Ridge (Priddle etal. 1986, 1988) had probably begun operating. SmallAntarctic krill swarms, although scarce at the beginningof our survey, were found to be associated with theanticyclonic eddy in the southeastern region of the is-land towards the end of the survey (Pakhomov et al.1997). Furthermore, during March, the Ukrainian®shing ¯eet successfully harvested krill in the same areaand subsequently sailed in a northwesterly directionpursuing the krill populations (Bibik and Yakovlev1995).
Grazing impact
At stations located to the northeast of the island, gutpigment contents of R. gigas and Calanoides acutuswere very low, indicating reduced feeding activity onphytoplankton within the top 100 m (Table 4), whichcan be attributed to the low food availability at st.15913. This is in agreement with observations at70±200 m during the phytoplankton bloom conductedin January 1994 (Atkinson et al. 1996). Surprisinglysimilar ingestion rates were obtained using in situ(natural chlorophyll concentrations) and in vitro (lowchlorophyll concentrations because of the bottling ef-fect) techniques. This may be due to limitations of bothapproaches. The advanced development stage and largelipid reserves of both R. gigas and Calanoides acutussuggest that they may have switched to the omnivorousfeeding mode (Atkinson 1996; Ward et al. 1996), oralternatively may have been undergoing seasonal de-velopmental arrest at the time of the survey. Indeed,daily rations of R. gigas (0.1±0.4% body C) and Ca-lanoides acutus (0.6±0.7%) estimated in this study couldnot meet even the respiratory costs, Minimum CarbonUptake (MCU) » 2% body C, estimated by Ikeda andMitchell (1982) and Schnack (1985).
In contrast, the feeding activity of Calanus simi-llimus, a subantarctic copepod species, was comparablewith that observed during the phytoplankton bloomrecorded in January 1994 and always exceeded theMCU values reported in the literature (Ikeda and
189

Mitchell 1982; Schnack 1985). Furthermore, the stageof development during this study was very similar tothat observed at the beginning of February 1994 to thenortheast of South Georgia (Ward et al. 1996b). Ourdata thus support a suggestion that Calanus simillimusmay stay active in the surface waters for longer thanother large copepods (Atkinson 1991), possibly com-plementing its daily ration with heterotrophic carbon(Atkinson 1996). The low feeding rates of both R. gigasand Calanoides acutus suggest that they were probablyundergoing seasonal arrest.
Generally, individual ingestion rates of R. gigas,Calanus acutus and Calanus simillimus estimated duringthis study tend to fall at the lower end of the range ofestimates reported in the literature (Atkinson 1996;Atkinson et al. 1992a,b, 1996; Drits and Pasternak1993; Lopez and Huntley 1995; Schnack 1985). Thismay be attributed to the limitations of the gut ¯uores-cence technique, which does not provide estimates ofthe contribution of heterotrophic carbon to total dailyration. This implies that daily rations would be under-estimated if based only on chlorophyll consumption.Our estimates of community grazing impact on phyto-plankton are, however, among the highest reported inprevious studies. Generally, zooplankton grazing im-pact is low, accounting for only � 10% of primaryproduction (e.g. Atkinson 1996; Atkinson and Shreeve1995; Morales et al. 1993). During the January 1994phytoplankton bloom, zooplankton grazing probablyremoved < 5% of primary production (Atkinson et al.1996), whereas during a less extensive bloom in January1990, the zooplankton community consumed between25 and 56% of the daily primary production (Ward etal. 1995). It is well known that grazing impact variesseasonally and can also re¯ect the high degree of vari-ability in the spatial distribution of consumers andprimary production levels in the region (Landry et al.1994; Perissinotto 1992; Ward et al. 1995). It was shownthat during the January 1994 bloom, while zooplanktongrazing could not control phytoplankton growth, otherfactors, probably physical, were responsible for thedecline of the bloom (Atkinson et al. 1996). DuringFebruary/March 1994, the estimated grazing impactwas su�cient to control phytoplankton production in atleast two sites. At stns. 15907±15912, the highest graz-ing impact (102% of primary production) was associ-ated with the lowest primary production levels recordedduring the survey, while at stn. 15873 pteropods wereresponsible for the 67% grazing impact on primaryproduction (Table 5). With the exception of two sta-tions, where pteropods accounted for the bulk of totalgrazing, copepods were the most important grazers ofphytoplankton production near South Georgia duringFebruary March 1994, accounting for 51±91% of totalgrazing. At one station only, small euphausiids con-tributed substantially ( » 44%) to total phytoplanktonconsumption.
It must be noted that our estimates of communitygrazing impact should be considered with caution due to
possible sources of error. Firstly, grazing impact onphytoplankton may be underestimated as only the massspeci®c ingestion rates (MSIR) of most abundant/modalage groups of copepods were used in our calculations.Thus, the actual grazing impact could be greater if theMSIR of small-size groups were taken into account(Atkinson 1994). Secondly, in our samples small ca-lanoid and cyclopoid copepods, as well as the early co-pepodite stages of large copepods, were most probablysubstantially undersampled (Atkinson et al. 1996). Thisis supported by the di�erences in abundances ofOithonaspp. sampled with Bongo (300-lm mesh) and WP-2(200-lm mesh) nets (Table 2). Our estimates, therefore,correspond to only the large-size fraction of the com-munity. Previously it has been shown that small speciesmay explain > 50% of grazing pressure while account-ing for < 10% of total copepod stock (Schnack et al.1985). Finally, we have used ingestion rates for ptero-pods obtained in the another ecosystem. Overall, if highzooplankton stock is permanently recorded around theSouth Georgia shelf, it is most likely that, outside bloomperiods, autotrophic food could become very limited,forcing the generally herbivore population to switch toomnivory (Atkinson 1996; Atkinson et al. 1996).
Among the zooplankton, copepods and the Antarc-tic krill, Euphausia superba, are generally regarded asthe major phytoplankton consumers around SouthGeorgia. Hence, they are likely to contribute most tothe vertical transport of organic carbon to the benthiccommunity through sedimentation of faecal materialand vertical migrations. The surveys, conducted duringJanuary/March 1994, indicated very low concentrationsof Antarctic krill, with only a few swarms being foundto the northeast of South Georgia (Brierley and Wat-kins 1996; Pakhomov et al. 1997). In this area, krilldaily grazing impact ranged from 10 to 59% of dailyprimary production. This could locally contribute to thedaily vertical faecal ¯ux of » 45±73 mgC m)2 (Pakho-mov et al. 1997). The results of this study showed that,during this period, the zooplankton community struc-ture was dominated by mesozooplankton species ratherthan Antarctic krill (Atkinson et al. 1996; this study).There is some evidence in the literature that suggeststhat copepods and other mesozooplankton retain car-bon in surface waters as they produce small faecalpellets and exhibit coprophagy and coprohexy withinthe euphotic zone (Fortier et al. 1994). As a conse-quence, the only e�ective sink of organic carbon in thevicinity of South Georgia during this season would takeplace through active vertical migration of small eu-phausiids, pteropods and migrant copepods (Atkinsonand Peck 1988; Atkinson et al. 1992a,b; Ward 1989;Ward et al. 1995).
Acknowledgements We thank the South African Department ofEnvironmental A�airs and Tourism, the Sea Fisheries ResearchInstitute and Rhodes University for providing funds and facilitiesfor this study. We are grateful to our colleagues Valerie Meaton(Rhodes University, Grahamstown) and Diane Gianakouros
190
(Benguela Ecology Programme, University of Cape Town) for theidenti®cation and enumeration of zooplankton samples. Finally,we would like to thank Dr. P.W. Froneman and two anonymousreferees for their invaluable comments on the manuscript.
References
Atkinson A (1991) Life cycles of Calanoides acutus, Calanus si-millimus and Rhincalanus gigas (Copepoda: Calanoida) withinthe Scotia Sea. Mar Biol 109:79±91
Atkinson A (1994) Diets and feeding selectivity among the epi-pelagic copepod community near South Georgia in summer.Polar Biol 14:551±560
Atkinson A (1996) Subantarctic copepods in an oceanic, lowchlorophyll environment: ciliate predation, food selectivity andimpact on prey population. Mar Ecol Prog Ser 130:85±96
Atkinson A, Peck JM (1988) A summer-winter comparison ofzooplankton in the oceanic area around South Georgia. PolarBiol 8:463±473
Atkinson A, Peck JM (1990) The distribution of zooplankton inrelation to the South Georgia shelf in summer and winter. In:Kerry KR, Hempel G (eds) Antarctic ecosystems. Ecologicalchange and conservation. Springer, Berlin Heidelberg NewYork, pp 159±165
Atkinson A, Shreeve RS (1995) Response of the copepod com-munity to a spring bloom in the Bellingshausen Sea. Deep SeaRes 42:1291±1311
Atkinson A, Ward P, Peck JM, Murray AWA (1990) Mesoscaledistribution of zooplankton around South Georgia. Deep SeaRes 37:1213±1227
Atkinson A, Ward P, Williams R, Poulet SA (1992a) Diel verticalmigration and feeding of copepods at an oceanic site nearSouth Georgia. Mar Biol 113:583±593
Atkinson A, Ward P, Williams R, Poulet SA (1992b) Feeding ratesand diel vertical migration of copepods near South Georgia:comparison of shelf and oceanic sites. Mar Biol 114:49±56
Atkinson A, Shreeve RS, Pakhomov EA, Priddle J, Blight P, WardP (1996) Zooplankton response to a phytoplankton bloom nearSouth Georgia, Antarctica. Mar Ecol Prog Ser 144:195±210
Baars MA, Helling GR (1985) Methodical problems in the mea-surements of phytoplankton ingestion rate by gut ¯uorescence.Hydrobiol Bull 19:81±88
Bibik VA, Yakovlev NM (1995) Operation results of Ukrainianvessels at Antarctic krill ®shery in subareas 48.2 and 48.3 inMarch to June 1994: krill size composition. CCAMLR Sci Abs10
Boyd IL, Croxall JP, Lunn NJ, Reid K (1995) Population de-mography of Antarctic fur seals: the costs of reproduction andimplications for life-histories. J Anim Ecol 64:505±518
Brierley AS, Watkins JL (1996) Acoustic targets at South Georgiaand the South Orkney Islands during a season of krill scarcity.Mar Ecol Prog Ser 138:51±61
Conover RJ, Durvasula R, Roy S, Wang R (1986) Probable loss ofchlorophyll-derived pigments during passage through the gutof zooplankton and some of the consequences. LimnolOceanogr 31:878±887
Croxall JP, Rothery P (1995) Population change in gentoo penguinsPygoscelis papua at Bird Island, South Georgia: potential rolesof adult survival, recruitment and deferred breeding. In: DannP, Norman I, Reilly P (eds) The penguins. Surrey Beatty & Sonspty limited, Chipping Norton, NSW, Australia, pp 26±38
Croxall JP, Prince PA, Ricketts C (1985) Relationships betweenprey life cycles and the extent, nature and timing of seal andseabird predation in the Scotia Sea. In: Siegfried WR, CondyPR and Laws RM (eds) Antarctic nutrient cycles and foodwebs. Springer, Berlin Heidelberg New York, pp 516±533
Dam HG, Peterson WT (1988) The e�ect of temperature on thegut clearance rate constant of planktonic copepods. J Exp MarBiol Ecol 123:1±14
Drits AV, Pasternak AF (1993) Feeding of dominant species of theAntarctic herbivores zooplankton (in Russian). In: VoroninaNM (ed) Pelagic ecosystems of the Southern Ocean. NaukaPress, Moscow, pp 250±259
Fedoulov PP, Murphy E, Shulgovsky KE (1996) Environment-krill relations in the South Georgia marine ecosystem.CCAMLR Sci 3:13±30
Fortier L, Le FeÁ vre J, Legendre L (1994) Export of biogeniccarbon to ®sh and to the deep ocean: the role of large plank-tonic microphages. J Plankton Res 16:809±839
Gordon AL (1971) Antarctic Polar Frontal Zone. Antarcticoceanology, Antarctic Research Series 15. American Geo-physical Union, Washington, D.C.
Gordon AL, Molinelli E, Baker T (1982) The Southern Oceanatlas. Columbia University Press, New York
Hardy AC, Gunther ER (1935) The plankton of the SouthGeorgia whaling grounds and adjacent waters 1926±1927.Discovery Rep 11:1±456
Hart TJ (1942) Phytoplankton periodicity in Antarctic surfacewaters. Discovery Rep 21:261±356
Heywood RB, Everson I, Priddle J (1985) The absence of krillfrom the South Georgia zone, winter 1983. Deep Sea Res32:369±378
Hopkins TL (1971) Zooplankton standing crop in the Paci®csector of the Antarctic. Antarct Res Ser 17:347±362
Ikeda T, Mitchell AW (1982) Oxygen uptake, ammonia excretionand phosphate excretion by krill and other Antarctic zoo-plankton in relation to their body size and chemical compo-sition. Mar Biol 71:283±298
JGOFS (Joint Global Ocean Flux Study) (1990) Core measure-ments protocols. JGOFS report No. 6, Scienti®c Committee onOceanic Research. International Council of Scienti®c Unions,Carqueiranne
Kiorboe T, Tiselius PT (1987) Gut clearance and pigment de-struction in an herbivorous copepod, Acartia tonsa, and thedetermination of in situ grazing rates. J Plankton Res 9:525±534
Landry MR, Lorenzen CJ, Peterson WK (1994) Mesozooplanktongrazing in the Southern California Bight. II. Grazing impactand particulate ¯ux. Mar Ecol Prog Ser 115:73±85
Lopez MDG, Huntley ME (1995) Feeding and diel vertical mi-gration cycles of Metridia gerlachei (Giesbrecht) in coastalwaters of the Antarctic Peninsula. Polar Biol 15:21±30
Mackas D, Bohrer R (1976) Fluorescence analysis of zooplanktongut contents and an investigation of diel feeding patterns.J Exp Mar Biol Ecol 25:77±85
Makarov RR, Menshenina LL, Spiridonov VA (1986) Studies ofzooplankton communities in the region of the South Georgiaisland (in Russian). The Antarctic. Nauka Press, Moscow
Mayzaud P, Razouls S (1992) Degradation of gut pigment duringfeeding by a subantarctic copepod: importance of feedinghistory and digestive acclimation. Limnol Oceanogr 37:393±404
Morales CE, Harris RP, Head RN, Tranter PRG (1993) Copepodgrazing in the oceanic northeast Atlantic during a 6 weekdrifting station: the contribution of size classes and verticalmigrants. J Plankton Res 15:185±211
Owens NJP, Priddle J, Whitehouse MJ (1991) Variations in phy-toplanktonic nitrogen assimilation around South Georgia andin the Brans®eld Strait (Southern Ocean). Mar Chem 35:287±304
Pakhomov EA, Perissinotto R, Froneman PW, Miller DGM(1997) Energetics and feeding dynamics of Euphausia superbain the South Georgia region during the summer of 1994.J Plankton Res 19:399±423
Perissinotto R (1992) Mesozooplankton size-selectivity and graz-ing impact on the phytoplankton community of the PrinceEdward Archipelago (Southern Ocean). Mar Ecol Prog Ser79:243±258
Perissinotto R, Pakhomov EA (1996) Gut evacuation rates andpigment destruction in the Antarctic krill Euphausia superba.Mar Biol 125:47±54
191
Peterson PG, Whitworth T III (1989) The Subantarctic and PolarFronts in relation to deep water masses through the south-western Atlantic. J Geophys Res 95:10817±10838
Priddle J, Heywood RB, Theriot E (1986) Some environmentalfactors in¯uencing phytoplankton in the Southern Oceanaround South Georgia. Polar Biol 6:65±79
Priddle J, Croxall JP, Everson I, Heywood RB, Murphy EJ, PrincePA, Sear CB (1988) Large-scale ¯uctuations in distribution andabundance of krill ± a discussion of possible causes. In:Sahrhage D (ed) Antarctic Ocean and resources variability.Springer, Berlin Heidelberg New York, pp 169±182
Robertson AA, Alexander DGW, Miller DGM (1981) Modi®edcollapsible opening and closing midwater trawls (RMT-8 andRMT-2). Fish Bull S Afr 14:103±113
Schnack SB (1985) Feeding by Euphausia superba and copepodspecies in response to varying concentrations of phytoplank-ton. In: Siegfried WR, Condy PR, Laws RM (eds) Antarcticnutrient cycles and food webs. Springer, Berlin HeidelbergNew York, pp 311±323
Schnack SB, Smetacek V, Bodungen B von , Stegmann P (1985)Utilization of phytoplankton by copepods in Antarctic watersduring spring. In: Gray JS, Christiansen ME (eds) Marine bi-ology of polar regions and e�ects of stress on marine organ-isms. Wiley, New York, pp 65±81
Simard Y, Lacroix G, Legendre L (1985) In situ twilight grazingrhythm during diel vertical migrations of a scattering layer ofCalanus ®nmarchicus. Limnol Oceanogr 30:598±606
Strickland JDH, Parsons TR (1968) A practical handbook ofseawater analysis. Bull Fish Res Bard Can 167:1±311
Wang R, Conover RJ (1986) Dynamics of gut pigment in thecopepod Temora longicornis and the determination of in situgrazing rates. Limnol Oceanogr 31:867±877
Ward P (1989) The distribution of zooplankton in an Antarcticfjord at South Georgia during summer and winter. Antarct Sci1:141±150
Ward P, Atkinson A, Murray AWA, Wood AG, Williams R,Poulet SA (1995) The summer zooplankton community atSouth Georgia: biomass, vertical migration and grazing. PolarBiol 15:195±208
Ward P, Shreeve RS, Cripps GC (1996a) Rhincalanus gigas andCalanus simillimus: lipid storage patterns of two species ofcopepod in the seasonally ice-free zone of the Southern Ocean.J Plankton Res 18:1439±1454
Ward P, Shreeve RS, Cripps GC, Trathan PN (1996b) Mesoscaledistribution and population dynamics of Rhincalanus gigas andCalanus simillimus in the Antarctic Polar Open Ocean andPolar Frontal Zone during summer. Mar Ecol Prog Ser140:21±32
Whitehouse MJ, Symon C, Priddle J (1993) Variations in thedistribution of chlorophyll a and inorganic nutrients aroundSouth Georgia, South Atlantic. Antarct Sci 5:367±376
Whitehouse MJ, Priddle J, Symon C (1996a) Seasonal and annualchange in seawater temperature, salinity, nutrient and chloro-phyll a distributions around South Georgia, South Atlantic.Deep Sea Res 43:425±443
Whitehouse MJ, Priddle J, Trathan PN, Brandon MA (1996b)Substantial open-ocean phytoplankton blooms to the north ofSouth Georgia, South Atlantic, during summer 1994. Mar EcolProg Ser 140:187±197
Willason SW, Cox JL (1987) Diel feeding, laminarinase activityand phytoplankton consumption by euphausiids. Biol Ocean-ogr 4:1±24
192