mesozooplankton biomass, composition, and potential grazing pressure on phytoplankton during austral...
TRANSCRIPT
Deep-Sea Research I 45 (1998) 1709—1737
Mesozooplankton biomass, composition, andpotential grazing pressure on phytoplanktonduring austral winter and spring 1993 in the
Subtropical Convergence region nearNew Zealand
Janet Bradford-Grieve!,*, Rob Murdoch!, Mark James",Megan Oliver!, Jeff McLeod!
! National Institute of Water and Atmospheric Research, Box 14901, 301 Evans Bay Parade, Greta Point,Kilbirnie, Wellington, New Zealand
" National Institute of Water and Atmospheric Research, Box 8602, Christchurch, New Zealand
Abstract
The biomass, composition, and grazing rates of three size fractions of mesozooplankton(200—500, 500—1000, and some '1000 lm) were estimated in shelf waters and the water massesassociated with Subtropical Convergence east of New Zealand, in the austral winter and springof 1993, as part of a larger New Zealand study of ocean carbon flux that contributes to the JointGlobal Ocean Flux Study (JGOFS). The total biomass was largest in spring in all water types. Itwas similar to the biomass measurements made previously in subantarctic and subtropicalwater masses in the Southwest Pacific and those from the North Atlantic, except for the springbiomass in subtropical water which was unusually large (86.5 and 101.3 mgm~3 dry weight).Biomass was concentrated in the upper 100 m, especially within the 0—25 or 25—50 m layers,both day and night. Night/day biomass ratios in the surface 100 m were often '2, and arepresumed to be the result of sampling patchy populations as well as vertical migration. Biomasswas greatest for the '1000 lm fraction of the mesozooplankton population, followed by the500—1000, and 200—500 lm fractions, respectively. The unusually small fraction of biomassresiding in the 200—500 lm fraction is assumed to be the result of predation by largermesozooplankton. The mesozooplankton community had maximum gut fluorescence at nightonly at stations where chlorophyll a was '2 mgm~3 and at many of the stations gut fluores-cence was persistently low. This was probably the result of the poor feeding environment, since
*Corresponding author. Tel.: 00 64 4 386 0300; fax: 00 64 4 386 2153; e-mail: [email protected].
0967-0637/98/$—see front matter ( 1998 Elsevier Science Ltd. All rights reserved.PII: S 0 9 6 7 - 0 6 3 7 ( 9 8 ) 0 0 0 3 9 - 9
a large proportion of the primary production resided in the (2 lm fraction. The total meaningestion of phytoplankton was calculated to be 1—40 mgC m~2d~1, based mainly on ingestionby the 200—500 and 500—1000 lm fractions, which were dominated by herbivores or herbivoresand omnivores. The heaviest grazing pressure was in subtropical and Subtropical Convergencewaters, in spring. Total grazing represented (1—4% of daily total integrated primary produc-tion. Phytoplankton carbon ingested usually met only a small fraction of the basic metabolicrequirements of the mesozooplankton. These data, and the fact that spring populations wereapparently actively growing, since they contained a large proportion of developmental stages,imply that mesozooplankton diets were mainly microzooplankton. ( 1998 Elsevier ScienceLtd. All rights reserved.
1. Introduction
Modeling of global atmospheric distributions of CO2
suggests that, overall, theSouthern Hemisphere exhibits no net flux between the atmosphere and ocean,implying an overall balance (e.g. Broecker and Peng, 1992). Nevertheless this does notmean there are no strong sources or sinks in this region, nor that, in the future, theSouthern Hemisphere will remain in balance. The Subtropical Convergence zone hassome of the lowest pCO
2values and therefore is among the largest potential sinks for
CO2
(Takahashi and Azevedo, 1982). Highly productive areas between 40° and 50°Sare associated with the Subtropical Convergence; the utilisation of dissolved inor-ganic nutrients is high here and may become limiting. CO
2flux in this zone is likely to
be driven not only by physical processes but also by biological processes responsiblefor the creation and removal of organic material from surface waters.
Particulate matter in the sea has as its primary source autotrophic phytoplankton,and these cells leave the photic zone either as sinking particles, bound in the faecalpellets produced by grazers, or by vertical migration of zooplankton. The quantities ofphytoplankton and zooplankton present in any water mass, and the match or mis-match of their annual growth cycle, have an important bearing on the rate and natureof the sedimentation of this particulate matter (e.g. Parsons and Lalli, 1988). In orderto understand the nature and quantity of particle flux during different seasons and indifferent water masses it is necessary to measure zooplankton biomass and grazingpressure on phytoplankton.
During 1993, two research voyages were undertaken from R.». Akademik M.A.¸avrentyev in the New Zealand Subtropical Convergence Zone to estimate oceaniccarbon flux, as a contribution to the aims of the Joint Global Ocean Study (JGOFS)(IGBP 1994). The New Zealand Carbon Flux research voyages took place in 12June—4 July and 1—22 October 1993 during the austral early winter and spring, acrossthe Subtropical Convergence Zone east of the country (46°10@—41°30@S) and in coastaland offshore subtropical water west of the country at about 42°40@S (Fig. 1). Duringthese research voyages data were collected on phytoplankton, microzooplanktonand mesozooplankton biomass and composition, grazing, primary production rates,particulate material flux, and associated physical and chemical oceanographic para-meters at two replicate stations within each water type. The aim of the present paper is
1710 J. Bradford-Grieve et al. / Deep-Sea Research I 45 (1998) 1709—1737
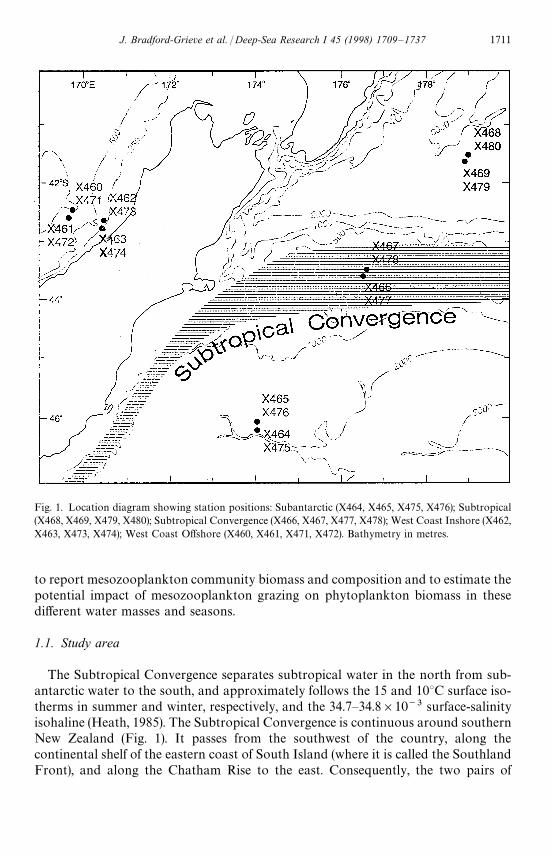
Fig. 1. Location diagram showing station positions: Subantarctic (X464, X465, X475, X476); Subtropical(X468, X469, X479, X480); Subtropical Convergence (X466, X467, X477, X478); West Coast Inshore (X462,X463, X473, X474); West Coast Offshore (X460, X461, X471, X472). Bathymetry in metres.
to report mesozooplankton community biomass and composition and to estimate thepotential impact of mesozooplankton grazing on phytoplankton biomass in thesedifferent water masses and seasons.
1.1. Study area
The Subtropical Convergence separates subtropical water in the north from sub-antarctic water to the south, and approximately follows the 15 and 10°C surface iso-therms in summer and winter, respectively, and the 34.7—34.8]10~3 surface-salinityisohaline (Heath, 1985). The Subtropical Convergence is continuous around southernNew Zealand (Fig. 1). It passes from the southwest of the country, along thecontinental shelf of the eastern coast of South Island (where it is called the SouthlandFront), and along the Chatham Rise to the east. Consequently, the two pairs of
1711J. Bradford-Grieve et al. / Deep-Sea Research I 45 (1998) 1709—1737
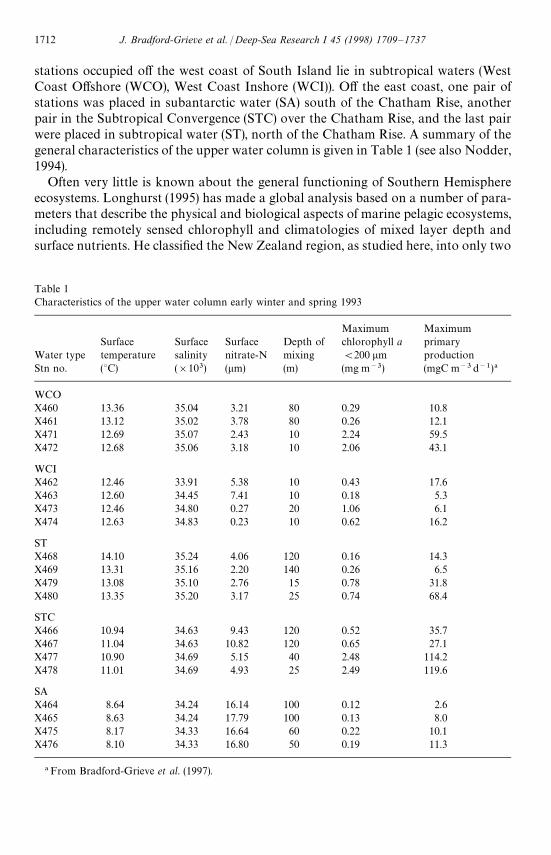
Table 1Characteristics of the upper water column early winter and spring 1993
Maximum MaximumSurface Surface Surface Depth of chlorophyll a primary
Water type temperature salinity nitrate-N mixing (200 lm productionStn no. (°C) (]103) (lm) (m) (mg m~3) (mgC m~3d~1)!
WCOX460 13.36 35.04 3.21 80 0.29 10.8X461 13.12 35.02 3.78 80 0.26 12.1X471 12.69 35.07 2.43 10 2.24 59.5X472 12.68 35.06 3.18 10 2.06 43.1
WCIX462 12.46 33.91 5.38 10 0.43 17.6X463 12.60 34.45 7.41 10 0.18 5.3X473 12.46 34.80 0.27 20 1.06 6.1X474 12.63 34.83 0.23 10 0.62 16.2
STX468 14.10 35.24 4.06 120 0.16 14.3X469 13.31 35.16 2.20 140 0.26 6.5X479 13.08 35.10 2.76 15 0.78 31.8X480 13.35 35.20 3.17 25 0.74 68.4
STCX466 10.94 34.63 9.43 120 0.52 35.7X467 11.04 34.63 10.82 120 0.65 27.1X477 10.90 34.69 5.15 40 2.48 114.2X478 11.01 34.69 4.93 25 2.49 119.6
SAX464 8.64 34.24 16.14 100 0.12 2.6X465 8.63 34.24 17.79 100 0.13 8.0X475 8.17 34.33 16.64 60 0.22 10.1X476 8.10 34.33 16.80 50 0.19 11.3
! From Bradford-Grieve et al. (1997).
stations occupied off the west coast of South Island lie in subtropical waters (WestCoast Offshore (WCO), West Coast Inshore (WCI)). Off the east coast, one pair ofstations was placed in subantarctic water (SA) south of the Chatham Rise, anotherpair in the Subtropical Convergence (STC) over the Chatham Rise, and the last pairwere placed in subtropical water (ST), north of the Chatham Rise. A summary of thegeneral characteristics of the upper water column is given in Table 1 (see also Nodder,1994).
Often very little is known about the general functioning of Southern Hemisphereecosystems. Longhurst (1995) has made a global analysis based on a number of para-meters that describe the physical and biological aspects of marine pelagic ecosystems,including remotely sensed chlorophyll and climatologies of mixed layer depth andsurface nutrients. He classified the New Zealand region, as studied here, into only two
1712 J. Bradford-Grieve et al. / Deep-Sea Research I 45 (1998) 1709—1737
biogeochemical provinces. Most of the water types studied here fall withinthe Westerlies Domain, where seasonal changes in the mixed layer depth are deter-mined principally by the balance between solar heating and stirring effect of themid-latitude westerlies. The remaining water type (SA) he considers to be a specialcase within his Coastal Domain, where oceanic circulation and tides are modified byinteraction with continental topography. He combines this environmental classifica-tion with a classification of plankton cycles. The New Zealand region appears toconform mainly to model 3, which has winter—spring production with nutrientlimitation, whereas SA water apparently conforms to model 7, where there is possiblytopographically forced summer production with maximum phytoplankton biomassattained in autumn.
2. Materials and methods
2.1. Biomass
Size fractionated (200—500, 500—1000, and '1000 lm) mesozooplankton biomasswas determined for each station (Fig. 1) from samples collected around mid-day andmidnight in depth-stratified tows by a 1 m2 MOCNESS (Wiebe et al., 1976) fitted with200 lm mesh nets. The towing speed and rate of descent and ascent were adjusted tomaintain the net frame at a fishing angle of approximately 45°. Tows were divided into0—25, 25—50, 50—100, 100—200, 200—500, and 500—1000 m depth strata. Where bottomdepths were less than 1000 m, the number, and the maximum depth of the deepeststratum, was reduced accordingly. During spring the maximum depth sampled was400 m as a consequence of cable limitations. The mean volume of water filtered per 50vertical metres of water column sampled was 72 m3 (S.D. 45 m3). The only locationwhere clogging of the net by phytoplankton occurred was in STC water in spring inthe 0—25 m samples.
A known fraction of each sample, usually one half but sometimes less, was size frac-tionated by filtering onto preweighed mesh filters for later wet and dry weight deter-mination. These mesh filters were supported by a PVC ring, previously glued onto themesh, and were held in a segmented filter holder made of PVC pipe. These filters andtheir mesozooplankton were rinsed with filtered sea water, placed in a disposable petridish, and immediately frozen. The remaining subsample was preserved in 2% borax-buffered formalin for microscopical examination. In the laboratory the mesh filterswere removed from the freezer and allowed to thaw briefly. Excess moisture wasremoved by blotting the filters on tissue. The sample and mesh filter were weighted toobtain a wet weight. Organisms were then washed from the mesh filter, using filteredsea water, onto a pre-weighed GF/C filter under low vacuum, and rinsed withammonium formate to remove salt. The GF/C filters were dried for at least 10 h ata temperature of no more than 60°C and weighed. The wet and dry weights for eachdepth stratum were calculated in mg m~3. The carbon content (mg m~3) of eachsample was calculated from log (DW)"0.449#0.991 log (C) (Wiebe, 1988), whereDW"dry weight and C"carbon.
1713J. Bradford-Grieve et al. / Deep-Sea Research I 45 (1998) 1709—1737
2.2. Population composition in surface 100 m
Individuals in night samples were identified using the references listed in Bradfordand Chapman (1988). The most common animals in the whole sample or subsampleswere counted in a Bogorov tray. These results were combined with the dry weights ofindividuals and biomass calculations made for each species. A feeding type (herbivore,omnivore, carnivore) was assigned to each species (see Timonin, 1971; Anderson et al.,1979; Mauchline, 1980; Silver and Bruland, 1981; Ritz et al., 1990) and the propor-tional composition of the mesozooplankton in the upper 100 m was calculated.
2.3. Mesozooplankton gut fluorescence
The diel feeding of the mesozooplankton community at each station was investi-gated using a modification of the gut fluorescence method of Mackas and Bohrer(1976). Instead of measuring gut fluorescence for individual species and calculating thetotal community grazing from counts and weights, weight-specific gut fluorescencewas measured and applied to the population biomass. Information on the feedinggroup composition (herbivore, omnivore, carnivore) of each size fraction was used tointerpret these data (see Table 3). Similar errors or approximations occur in ourmodified method and the species-by-species method. In both methods, chlorophylldestruction during digestion may introduce large errors, and carnivorous feeding byomnivores has the potential to introduce gut chlorophyllous material from theirmicrozooplankton prey, which leads to an overestimate of phytoplankton grazingby the mesozooplankton. Also ingestion of non-living particulate chlorophyllous mate-rial (faecal pellets and aggregates) also can lead to an overestimation of the directimpact on phytoplankton populations. In the case of grazing calculated from speciesdata, grazing is probably underestimated, as it is usual for only the most commonspecies to be considered.
Two replicate, vertical mesozooplankton samples were collected from 0 to 100 m, atapproximately 4 hourly intervals over a 24 hour period using vertical hauls of a bongonet of 200 lm mesh and windowless PVC collection buckets. Samples were removedfrom the nets without washing, and immediately fractionated in duplicate into thedifferent size classes (200—500, 500—1000, '1000 lm) by filtering onto mesh filters(see above). These were then rinsed with filtered sea water, placed in disposable petridishes, and immediately frozen at !10°C. The sampling process and fractionationtook about 5 min.
In the laboratory each plankton sample and mesh filter were weighed, then a sub-sample of approximately 50 animals was removed and placed in a grinding tube andthe original sample reweighed to obtain the wet weight of the subsample. Thisoperation was carried out in triplicate so there were three subsamples of 50 animalseach. These 50 animals were ground in a grinding tube with 2 ml of 90% acetone. Theextract was then placed in a centrifuge tube and made up to 10 ml with 90% acetone.The sample was extracted in a refrigerator for at least 10 min then centrifuged for10 min at 3000 r.p.m. Fluorescence of the extract before and after acidificationwas measured on a Turner 10-AU fluorometer fitted with a chlorophyll optical
1714 J. Bradford-Grieve et al. / Deep-Sea Research I 45 (1998) 1709—1737
kit (10-040) and a red-sensitive photo-multiplier tube (10-AU-600). Fluorescence isexpressed as ng phaeopigment per mg dry weight of mesozooplankton (ng phaeo mgDW~1). Similar subsamples were obtained and used to determine the wet/dry weightratio for each original sample. This ratio was used to convert the wet weight ofanimals from gut fluorescence measurement to dry weight. In the few instances wheresalps and the large phytoplankton organisms such as Halosphaera were encounteredin samples these organisms were excluded.
2.4. Ingestion
Gut clearance rates (k) were calculated from the relationship of Dam and Peterson(1988), who related gut evacuation rate to temperature, on the assumption that food isnot limiting, that the defecation rate is constant and equal to the ingestion rate, andthat there is no difference between species. Atkinson et al. (1996) found no diel signalin gut evacuation rate under similar environmental conditions to the present study sothe assumption that the gut evacuation rate is constant is reasonable in the presentcircumstances.
Hourly ingestion rates (I) were calculated from gut fluorescence and calculated gutevacuation rates using the expression I"kP
&, where I is the ingestion rate, k is the gut
clearance rate constant per hour, and P&is the gut pigment content of animals freshly
collected in the field. Ingestion rates were calculated at the time gut pigment wasmeasured and values integrated over 24 h. Total ingestion was calculated by multiply-ing the daily ingestion per unit of mesozooplankton biomass by the average of dayand night biomass in the upper 100 m. These values were converted to carbon byassuming that the carbon: chlorophyll ratio was 40. No account was taken of pigmentdestruction. It appears that pigment destruction occurs mainly when copepods havebeen well fed (Penry and Frost, 1991; Head and Harris, 1996), whereas those ac-climated to low food environments may exhibit a much smaller degradation ofpigment in the gut (Penry and Frost, 1991). Most of the chlorophyll a levels recordedin this study could be classified as low (Table 1), so the conservative course has beentaken and no correction has been made for pigment destruction.
3. Results
3.1. Mesozooplankton biomass
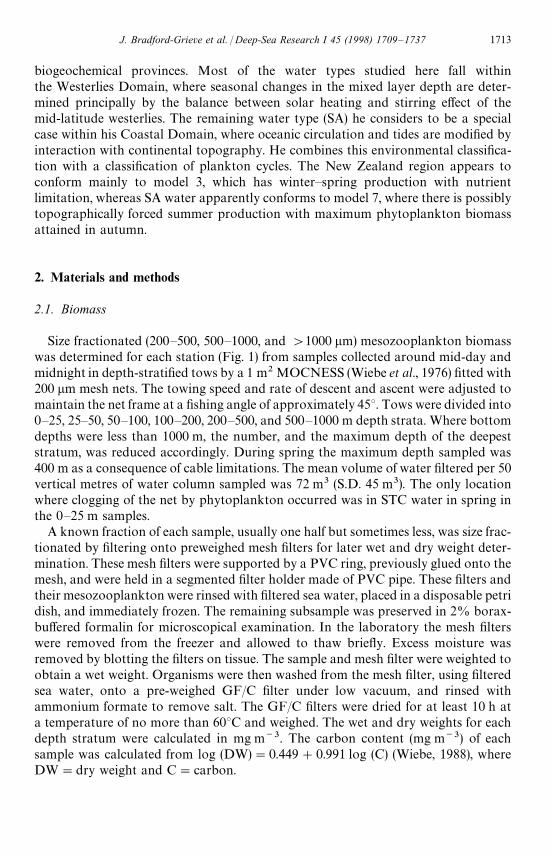
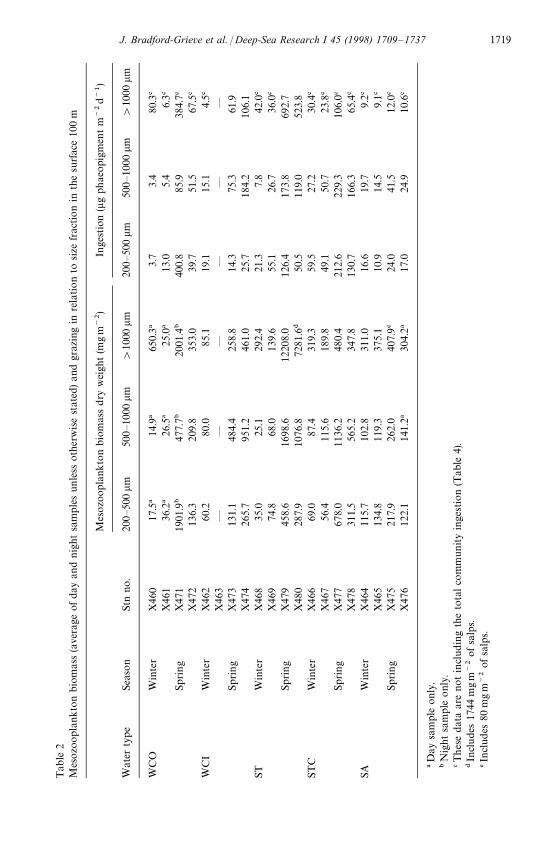
Usually, the largest concentrations of mesozooplankton biomass were located inthe surface 100 m, although relatively large (compared with near surface waters)biomasses of organisms '1000 lm were found deeper than 200 m at some locationsin winter (WCO, ST and SA waters) (Fig. 2). Average total dry biomass in the surface100 m (Table 2) was greater in all water masses in spring than in winter, and thegreatest winter—spring difference in biomass was observed in ST water. The spring—winter difference was associated with biomass increases for all size fractions in spring,except in SA waters where the slight spring increase in biomass was a consequence of
1715J. Bradford-Grieve et al. / Deep-Sea Research I 45 (1998) 1709—1737
Fig. 2. The winter (above) and spring (opposite) vertical distribution of zooplankton biomass (mgC m~3)by size fraction, day and night, for all stations. SA"Subantarctic, ST"Subtropical, STC"SubtropicalConvergence, WCI"West Coast Inshore, WCO"West Coast Offshore.
1716 J. Bradford-Grieve et al. / Deep-Sea Research I 45 (1998) 1709—1737
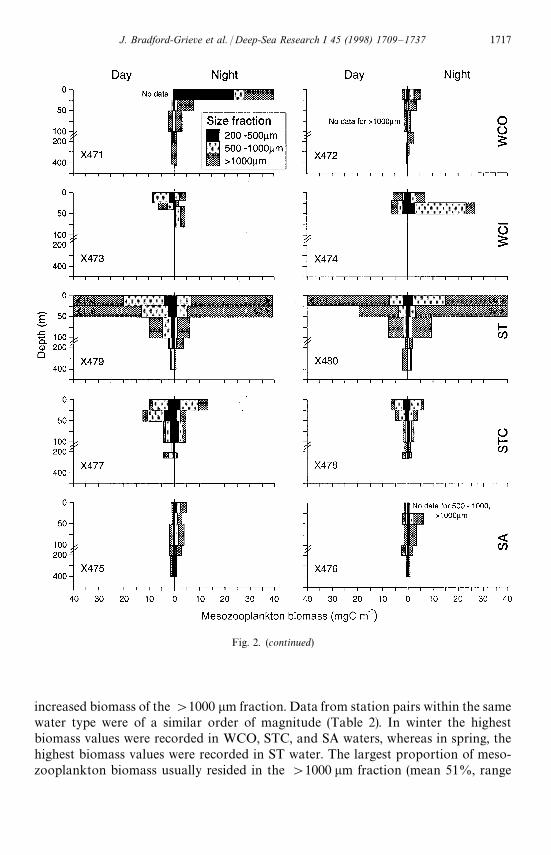
Fig. 2. (continued)
increased biomass of the '1000 lm fraction. Data from station pairs within the samewater type were of a similar order of magnitude (Table 2). In winter the highestbiomass values were recorded in WCO, STC, and SA waters, whereas in spring, thehighest biomass values were recorded in ST water. The largest proportion of meso-zooplankton biomass usually resided in the '1000 lm fraction (mean 51%, range
1717J. Bradford-Grieve et al. / Deep-Sea Research I 45 (1998) 1709—1737
12—95%) and was consistently high in SA water in winter and ST water in spring. The500—1000 lm fraction comprised 21—66% (mean 28%) of the populations, and the200—500 lm fraction comprised 3—51% (mean 21%) of the populations (Table 2).There was no consistent pattern of size fraction proportions, with water type orseason.
Biomass in the upper 100 m was usually greater at night than during the dayexcept four stations out of 16. Night/day ratios ranged from 0.5—5.2 (mean 1.9) inthe 200—500 lm fraction, 0.4—9.8 (mean 2.6) in the 500—1000 lm fraction,and 0.6—13.2 (mean 3.8) in the '1000 lm fraction. Large ratios ('2) were observedmore consistently in the '1000 lm fraction and were notably greatest where thebottom depth was '1000 m and there was a large reservoir of this size fractiondeeper than 200 m in the water column (X465, X468, X469, Fig. 2). In winter, thenight/day biomass ratio was generally much higher than those in the spring (Fig. 2).There was considerable difference in night/day ratios between duplicate stations ina water mass especially in WCI and ST waters in spring and SA water in winter andspring.
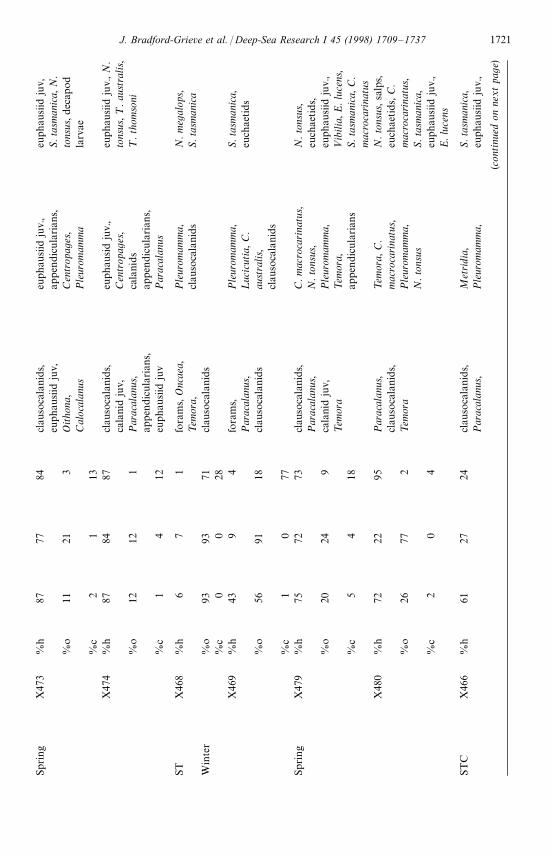
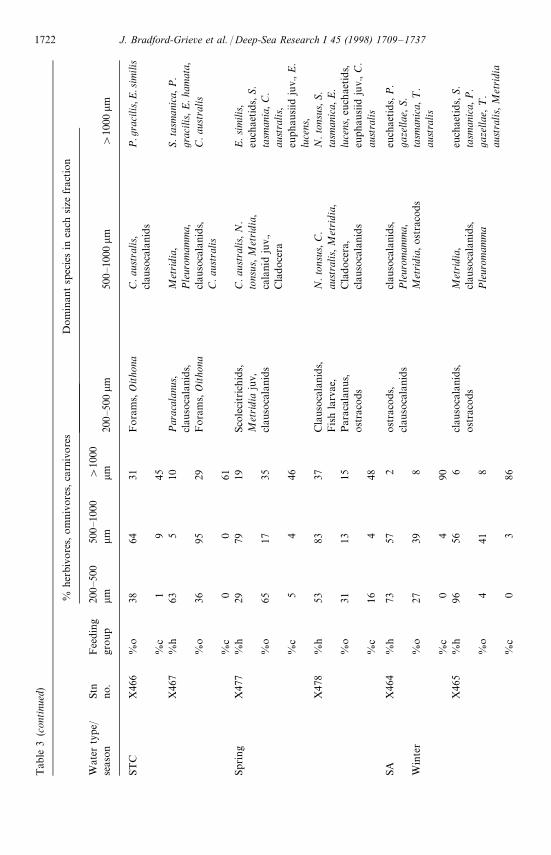
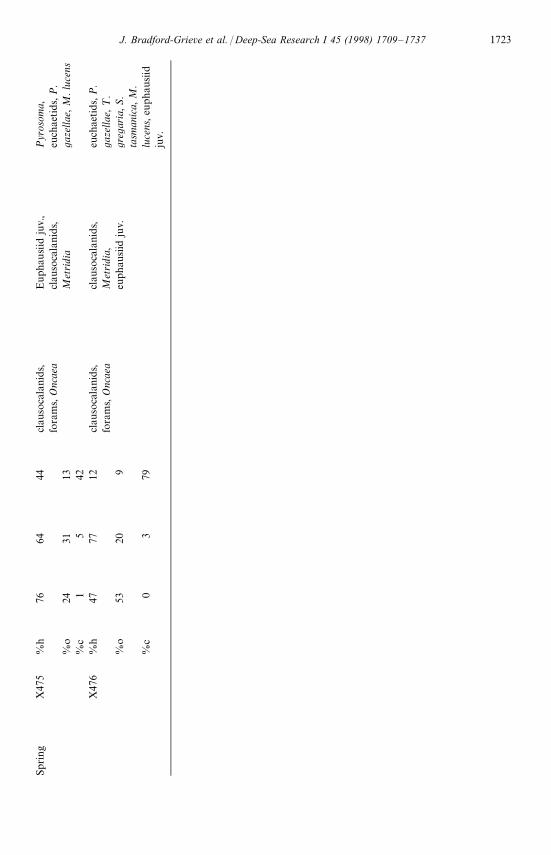
3.2. Population composition
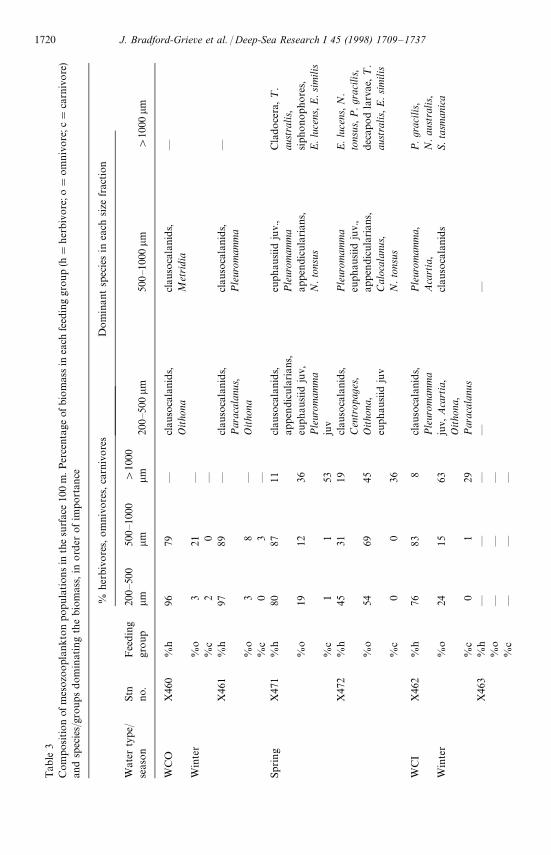
In general the 200—500 and 500—1000 lm size fractions of mesozooplankton in theupper 100 m were dominated by either herbivores or a combination of herbivores andomnivores; carnivores were at most only a few percent of the biomass of the popula-tion (Table 3). The '1000 lm size fraction usually contained a much larger % ofcarnivores (as great as 90% in SA water in winter), although WCI and ST water inspring had a high % (up to 95%) of herbivores and relatively low % (down to 4%) ofcarnivores (Table 3). Herbivores were least plentiful in the smaller size fractions in STwater in winter.
The 200—500 lm fraction was usually dominated by clausocalanid copepodites(Clausocalanus and Ctenocalanus combined), Paracalanus indicus, Oithona spp., andoccasionally other mesozooplankton groups (Table 3). The 500—1000 lm size fractionwas dominated by larger calanoid copepods, copepodites and other groups (includingclausocalanids, Metridia lucens, Pleuromamma gracilis, Neocalanus tonsus, appendi-cularians, Centropages aucklandicus, ¸ucicutia flavicornis, Calanus australis, Calano-ides macrocarinatus, ¹emora turbinata, and euphausiid juveniles). The '1000 lm sizefraction was dominated by amphipods (¹hemisto australis mainly), euphausiids(Euphausia lucens, E. similis, Nyctiphanes australis), large adult calanoid copepods(euchaetids, Calanoides macrocarinatus, Calanus australis, Metridia lucens, Neocalanustonsus, Pleuromamma gracilis), chaetognaths (Pseudosagitta gazellae, Seratosagittatasmanica), and a few other groups (Table 3).
Most species were oceanic and were found across all water types, and includedTransition Zone species such as Nematoscelis megalops, ¹hysanoessa gregaria andClausocalanus ingens. It was only in SA water that subantarctic species such asEuphausia vallentini and Pseudosagitta gazellae were taken, and warm water species(e.g. Calocalanus spp., Eucalanus hyalinus) were common only north of the STC.Coastal species such as Centropages aucklandicus, Paracalanus indicus, and ¹emora
1718 J. Bradford-Grieve et al. / Deep-Sea Research I 45 (1998) 1709—1737
Tab
le2
Mes
ozo
opla
nkto
nbio
mas
s(a
vera
geofday
and
nig
htsa
mple
sun
less
oth
erw
ise
stat
ed)an
dgr
azin
gin
rela
tion
tosize
frac
tion
inth
esu
rfac
e10
0m
Mes
ozo
opla
nkto
nbio
mas
sdry
wei
ght
(mg
m~
2)In
gest
ion
(lg
phae
opig
men
tm
~2d~1)
Wat
erty
pe
Seas
on
Stn
no.
200—5
00lm
500—1
000
lm'
1000
lm20
0—5
00lm
500—1
000
lm'
1000
lm
WC
OW
inte
rX
460
17.5
!14
.9!
650.
3!3.
73.
480
.3#
X46
136
.2!
26.5
!25
.0!
13.0
5.4
6.3#
Spring
X47
119
01.9
"47
7.7"
2001
.4"
400.
885
.938
4.7#
X47
213
6.3
209.
835
3.0
39.7
51.5
67.5
#
WC
IW
inte
rX
462
60.2
80.0
85.1
19.1
15.1
4.5#
X46
3—
——
——
—Sp
ring
X47
313
1.1
484.
425
8.8
14.3
75.3
61.9
X47
426
5.7
951.
246
1.0
25.7
184.
210
6.1
STW
inte
rX
468
35.0
25.1
292.
421
.37.
842
.0#
X46
974
.868
.013
9.6
55.1
26.7
36.0
#
Spring
X47
945
8.6
1698
.612
208.
012
6.4
173.
869
2.7
X48
028
7.9
1076
.872
81.6
$50
.511
9.0
523.
8ST
CW
inte
rX
466
69.0
87.4
319.
359
.527
.230
.4#
X46
756
.411
5.6
189.
849
.150
.723
.8#
Spring
X47
767
8.0
1136
.248
0.4
212.
622
9.3
106.
0#X
478
311.
556
5.2
347.
813
0.7
166.
365
.4#
SAW
inte
rX
464
115.
710
2.8
311.
016
.619
.79.
2#X
465
134.
811
9.3
375.
110
.914
.59.
1#Sp
ring
X47
521
7.9
262.
040
7.9%
24.0
41.5
12.0
#
X47
612
2.1
141.
2!30
4.2!
17.0
24.9
10.6
#
!D
aysa
mpl
eonly
."N
ight
sam
ple
onl
y.#Thes
eda
taar
eno
tin
clud
ing
the
tota
lco
mm
unity
inge
stio
n(T
able
4).
$In
clude
s17
44m
gm
~2
ofsa
lps.
%In
cludes
80m
gm
~2
ofsa
lps.
1719J. Bradford-Grieve et al. / Deep-Sea Research I 45 (1998) 1709—1737
Tab
le3
Com
pos
itio
nof
mes
ozo
opl
ankto
npop
ula
tionsin
the
surfac
e10
0m
.Per
cent
age
ofbio
mas
sin
each
feed
ing
grou
p(h"
her
biv
ore;
o"
om
niv
ore;
c"ca
rniv
ore
)an
dsp
ecie
s/gr
oups
dom
inat
ing
the
biom
ass,
inord
erofim
por
tance
%he
rbiv
ore
s,om
niv
ore
s,ca
rniv
ore
sD
om
inan
tsp
ecie
sin
each
size
frac
tion
Wat
erty
pe/
Stn
Fee
din
g20
0—5
0050
0—1
000
'10
00se
ason
no.
group
lmlm
lm20
0—5
00lm
500—1
000
lm'
1000
lm
WC
OX
460
%h
9679
—cl
auso
cala
nids,
clau
soca
lani
ds,
—O
itho
naM
etridi
aW
inte
r%
o3
21—
%c
20
—X
461
%h
9789
—cl
auso
cala
nids,
clau
soca
lani
ds,
—Par
acal
anus
,Ple
urom
amm
a%
o3
8—
Oitho
na%
c0
3—
Spring
X47
1%
h80
8711
clau
soca
lani
ds,
euphau
siid
juv.
,C
lado
cera
,¹
.ap
pen
dicu
larian
s,Ple
urom
amm
aau
stra
lis,
%o
1912
36eu
phau
siid
juv,
appen
dicu
larian
s,sipho
nopho
res,
Ple
urom
amm
aN
.to
nsus
E.lu
cens
,E.s
imilis
%c
11
53ju
vX
472
%h
4531
19cl
auso
cala
nid
s,Ple
urom
amm
aE.lu
cens
,N.
Cen
trop
ages
,eu
phau
siid
juv.
,to
nsus
,P
.gr
acili
s,%
o54
6945
Oitho
na,
appen
dicu
larian
s,de
capod
larv
ae,¹
.eu
phau
siid
juv
Cal
ocal
anus
,au
stra
lis,E
.sim
ilis
%c
00
36N
.to
nsus
WC
IX
462
%h
7683
8cl
auso
cala
nids,
Ple
urom
amm
a,P.gr
acilis,
Ple
urom
amm
aA
cart
ia,
N.au
stra
lis,
Win
ter
%o
2415
63ju
v,A
cart
ia,
clau
soca
lanid
sS.
tasm
anica
Oitho
na,
%c
01
29Par
acal
anus
X46
3%
h—
——
——
%o
——
—%
c—
——
1720 J. Bradford-Grieve et al. / Deep-Sea Research I 45 (1998) 1709—1737
Spring
X47
3%
h87
7784
clau
soca
lani
ds,
euphau
siid
juv.
,eu
phau
siid
juv,
euphau
siid
juv,
appen
dic
ula
rian
s,S.t
asm
anica,
N.
%o
1121
3O
itho
na,
Cen
trop
ages
,to
nsus
,dec
apod
Cal
ocal
anus
Ple
urom
amm
ala
rvae
%c
21
13X
474
%h
8784
87cl
auso
cala
nids,
euphau
sid
juv.
,eu
phau
siid
juv.
,N.
cala
nid
juv,
Cen
trop
ages
,to
nsus
,¹.au
stra
lis,
%o
1212
1Par
acal
anus
,ca
lani
ds
¹.th
omso
niap
pen
dic
ula
rian
s,ap
pen
dic
ula
rian
s,%
c1
412
euphau
siid
juv
Par
acal
anus
STX
468
%h
67
1fo
ram
s,O
ncae
a,Ple
urom
amm
a,N
.m
egal
ops,
¹em
ora,
clau
soca
lani
ds
S.t
asm
anica
Win
ter
%o
9393
71cl
auso
cala
nids
%c
00
28X
469
%h
439
4fo
ram
s,Ple
urom
amm
a,S.t
asm
anica,
Par
acal
anus
,¸uc
icut
ia,C
.eu
chae
tids
%o
5691
18cl
auso
cala
nids
aust
ralis,
clau
soca
lani
ds
%c
10
77Sp
ring
X47
9%
h75
7273
clau
soca
lani
ds,
C.m
acro
carina
tus,
N.to
nsus
,Par
acal
anus
,N
.to
nsus
,eu
chae
tids,
%o
2024
9ca
lani
dju
v,Ple
urom
amm
a,eu
phau
siid
juv.
,¹em
ora
¹em
ora,
»ib
ilia,
E.lu
cens
,%
c5
418
appe
ndic
ula
rian
sS.t
asm
anica,
C.
mac
roca
rina
tus
X48
0%
h72
2295
Par
acal
anus
,¹em
ora,
C.
N.to
nsus
,sa
lps,
clau
soca
lani
ds,
mac
roca
rina
tus,
euch
aetids,
C.
%o
2677
2¹em
ora
Ple
urom
amm
a,m
acro
carina
tus,
N.to
nsus
S.t
asm
anica,
%c
20
4eu
phau
siid
juv.
,E.lu
cens
STC
X46
6%
h61
2724
clau
soca
lani
ds,
Met
ridi
a,S.t
asm
anica,
Par
acal
anus
,Ple
urom
amm
a,eu
phau
siid
juv.
,
(con
tinu
edon
nextpa
ge)
1721J. Bradford-Grieve et al. / Deep-Sea Research I 45 (1998) 1709—1737
Tab
le3
(con
tinu
ed)
%her
bivo
res,
om
niv
ores
,ca
rniv
ore
sD
om
inan
tsp
ecie
sin
each
size
frac
tion
Wat
erty
pe/
Stn
Fee
din
g20
0—5
0050
0—1
000
'10
00se
ason
no.
group
lmlm
lm20
0—5
00lm
500—1
000
lm'
1000
lm
STC
X46
6%
o38
6431
Fora
ms,
Oitho
naC
.aus
tral
is,
P.g
raci
lis,
E.s
imilis
clau
soca
lani
ds
%c
19
45X
467
%h
635
10Par
acal
anus
,M
etridi
a,S.t
asm
anica,
P.
clau
soca
lani
ds,
Ple
urom
amm
a,gr
acili
s,E
.ham
ata,
%o
3695
29Fora
ms,
Oitho
nacl
auso
cala
nids,
C.a
ustr
alis
C.a
ustr
alis
%c
00
61Sp
ring
X47
7%
h29
7919
Scol
ecitrich
ids,
C.a
ustr
alis,N
.E.sim
ilis,
Met
ridi
aju
v,to
nsus
,Met
ridi
a,eu
chae
tids,
S.
%o
6517
35cl
auso
cala
nids
cala
nid
juv.
,ta
sman
ia,C
.C
ladoce
raau
stra
lis,
%c
54
46eu
phau
siid
juv.
,E.
luce
ns,
X47
8%
h53
8337
Cla
usoca
lani
ds,
N.to
nsus
,C.
N.to
nsus
,S.
Fish
larv
ae,
aust
ralis,
Met
ridi
a,ta
sman
ica,
E.
%o
3113
15Par
acal
anus,
Cla
doce
ra,
luce
ns,eu
chae
tids,
ost
raco
dscl
auso
cala
nids
euphau
siid
juv.
,C.
%c
164
48au
stra
lis
SAX
464
%h
7357
2ost
raco
ds,
clau
soca
lani
ds,
euch
aetids
,P.
clau
soca
lani
ds
Ple
urom
amm
a,ga
zella
e,S.
Win
ter
%o
2739
8M
etridi
a,ost
raco
ds
tasm
anic
a,¹
.au
stra
lis
%c
04
90X
465
%h
9656
6cl
auso
cala
nids,
Met
ridi
a,eu
chae
tids,
S.
ost
raco
dscl
auso
cala
nids,
tasm
anic
a,P
.%
o4
418
Ple
urom
amm
aga
zella
e,¹
.au
stra
lis,
Met
ridi
a%
c0
386
1722 J. Bradford-Grieve et al. / Deep-Sea Research I 45 (1998) 1709—1737
Spring
X47
5%
h76
6444
clau
soca
lani
ds,
Eupha
usiid
juv.
,Pyr
osom
a,fo
ram
s,O
ncae
acl
auso
cala
nids,
euch
aetids,
P.
%o
2431
13M
etridi
aga
zella
e,M
.lu
cens
%c
15
42X
476
%h
4777
12cl
auso
cala
nids,
clau
soca
lani
ds,
euch
aetids
,P.
fora
ms,
Onc
aea
Met
ridi
a,ga
zella
e,¹
.%
o53
209
euphau
siid
juv.
greg
aria
,S.
tasm
anic
a,M
.%
c0
379
luce
ns,eu
phau
siid
juv.
1723J. Bradford-Grieve et al. / Deep-Sea Research I 45 (1998) 1709—1737
turbinata were present in STC water over the Chatham Rise in both winter andsummer.
3.3. Mesozooplankton gut fluorescence
Variation in mesozooplankton gut fluorescence values (Fig. 3) for each size fractionbetween replicate stations was low, except for winter in the STC and ST waters. Thegut fluorescence per unit dry weight recorded off the west coast, both in winter andspring, was similar for all size fractions, and mean values consistently ranged from1—8 ng phaeo mg DW~1. In SA waters values recorded in winter and spring weresimilar within all size fractions. Within these waters, the 200—500 and 500—1000 lmsize fraction mean values generally ranged from 2—6 ng phaeo mgDW~1, whereas the'1000 lm fraction mean values were less than 2 ng phaeo mgDW~1. Mean gutfluorescence values for the 200—500 lm fraction in ST and STC waters were generallyhigher than those recorded for the 500—1000 and '1000 lm fractions. In both thesewater types, mean gut fluorescence values for the two smaller size fractions werehigher in winter relative to spring, and tended to be higher in STC waters comparedwith ST waters.
In general, there was limited evidence of diel patterns in gut fluorescence for themesozooplankton community size fractions sampled within the different water typesin either season (Fig. 3). Higher gut fluorescence values during darkness relative todaylight hours were recorded in all size fractions only in WCO water in spring and inSTC water at one replicate station each in winter and spring. Conversely, in the'1000 lm size fraction sampled in winter within ST waters and 200—500 and 500—1000 lm size fractions sampled in SA waters in spring, gut fluorescence was highestduring daylight hours. In ST and STC waters in winter gut fluorescence of the200—500 lm fraction at each replicate station did not have the same pattern. Forexample, in STC water the two patterns were almost mirror images with maximaoccurring both at sunrise and in early afternoon.
3.4. Ingestion
Calculated gut evacuation rates range from 0.0264—0.0370 min~1 depending on thetemperature of the water. These rates are similar to many of those derived experi-mentally by Atkinson et al. (1996) in South Atlantic subantarctic water for a variety ofcopepod species of different sizes. Gut evacuation rates, calculated from the equationof Dam and Peterson (1988), used for the purposes of calculating community inges-tion, implicitly assume that the present mesozooplankton communities had gut-clearance rates similar to copepods. This assumption is justified for the two smallersize fractions, which were dominated by herbivorous and omnivorous copepods(Table 3), but not for the largest size fraction (except in WCI and ST water in spring)because of the large biomass of other taxa.
The calculated ingestion (Table 2) by mesozooplankton in the upper 100 m inspring was greater than that for winter for all size fractions in all water types. The
1724 J. Bradford-Grieve et al. / Deep-Sea Research I 45 (1998) 1709—1737
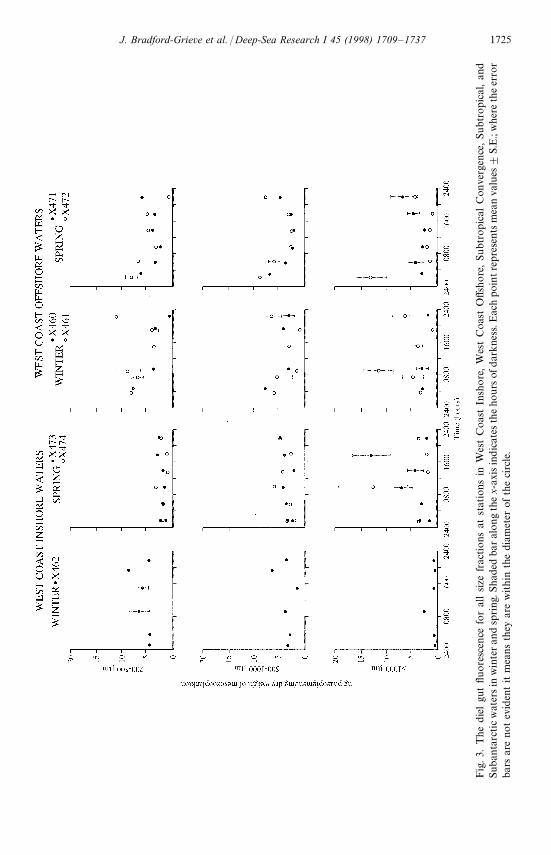
Fig
.3.
The
die
lgu
tflu
ores
cence
for
allsize
frac
tion
sat
stat
ions
inW
est
Coa
stIn
shore
,W
est
Coa
stO
ffsho
re,Subtr
opic
alC
onve
rgen
ce,Su
btro
pic
al,an
dSu
ban
tarc
ticw
ater
sin
win
teran
dsp
ring
.Sha
ded
baral
ong
the
x-ax
isin
dic
ates
the
hours
ofdar
kne
ss.E
ach
poin
tre
pre
sents
mea
nva
lues$
S.E
.;w
her
eth
eer
ror
bars
are
notev
iden
tit
mea
ns
they
are
within
the
diam
eter
ofth
eci
rcle
.
1725J. Bradford-Grieve et al. / Deep-Sea Research I 45 (1998) 1709—1737
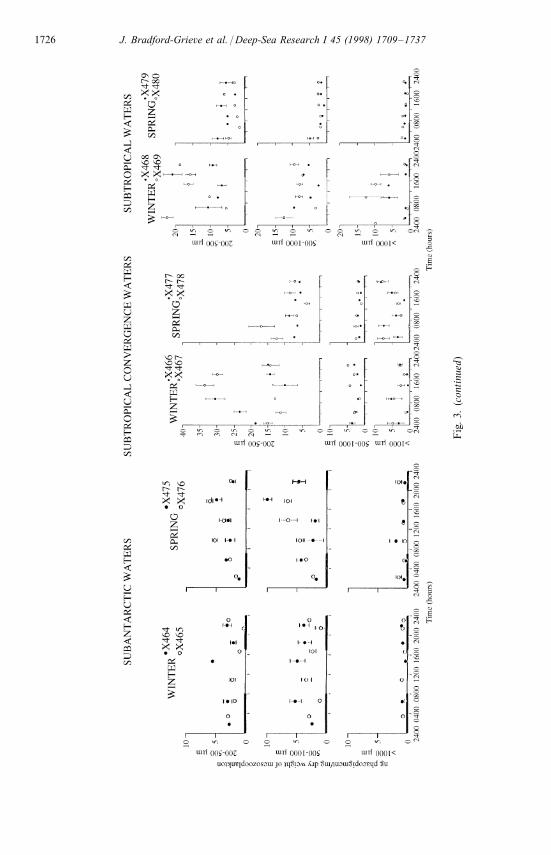
Fig
.3.
(con
tinu
ed)
1726 J. Bradford-Grieve et al. / Deep-Sea Research I 45 (1998) 1709—1737
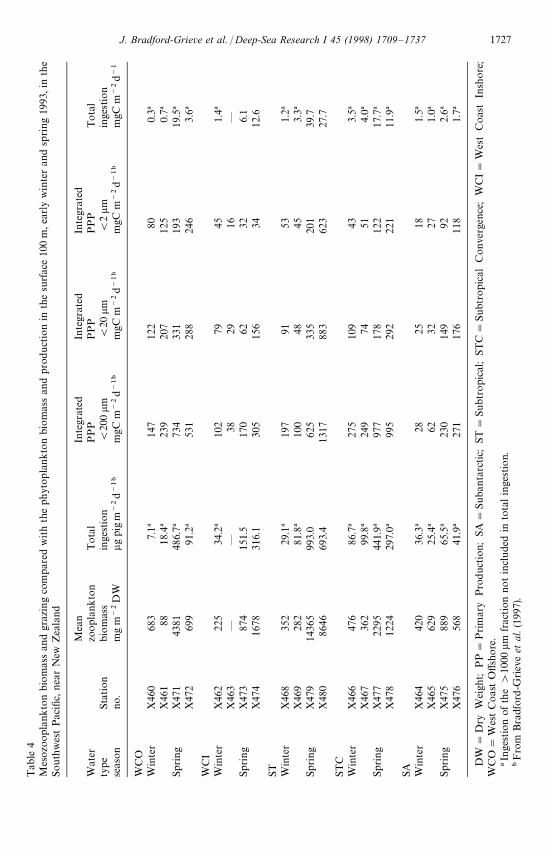
Tab
le4
Mes
ozo
opla
nkto
nbio
mas
san
dgr
azin
gco
mpar
edw
ith
the
phyt
opla
nkto
nbi
om
ass
and
prod
uct
ion
inth
esu
rfac
e10
0m
,ear
lyw
inte
ran
dsp
ring
1993
,in
the
South
wes
tPac
ific,
nea
rN
ewZea
land
Mea
nIn
tegr
ated
Inte
grat
edIn
tegr
ated
Wat
erzo
opla
nkto
nTota
lPPP
PP
PPPP
Tota
lty
pe
Sta
tion
bio
mas
sin
gest
ion
(20
0lm
(20
lm(
2lm
inge
stio
nse
ason
no.
mg
m~
2D
Wlg
pigm
~2d~1"
mgC
m~
2d~1"
mgC
m~
2d~1"
mgC
m~
2d~1"
mgC
m~
2d~1
WC
OW
inte
rX
460
683
7.1!
147
122
800.
3!X
461
8818
.4!
239
207
125
0.7!
Spring
X47
143
8148
6.7!
734
331
193
19.5
!
X47
269
991
.2!
531
288
246
3.6!
WC
IW
inte
rX
462
225
34.2
!10
279
451.
4!X
463
——
3829
16—
Spring
X47
387
415
1.5
170
6232
6.1
X47
416
7831
6.1
305
156
3412
.6
ST
Win
ter
X46
835
229
.1!
197
9153
1.2!
X46
928
281
.8!
100
4845
3.3!
Spring
X47
914
365
993.
062
533
520
139
.7X
480
8646
693.
413
1788
362
327
.7
STC
Win
ter
X46
647
686
.7!
275
109
433.
5!X
467
362
99.8
!24
974
514.
0!Sp
ring
X47
722
9544
1.9!
977
178
122
17.7
!
X47
812
2429
7.0!
995
292
221
11.9
!
SA
Win
ter
X46
442
036
.3!
2825
181.
5!X
465
629
25.4
!62
3227
1.0!
Spring
X47
588
965
.5!
230
149
922.
6!X
476
568
41.9
!27
117
611
81.
7!
DW
"D
ryW
eigh
t;P
P"
Prim
ary
Pro
duc
tion;
SA"
Sub
anta
rctic;
ST"
Subt
ropi
cal;
STC"
Subt
ropic
alC
onve
rgen
ce;
WC
I"W
est
Coas
tIn
shore
;W
CO"
Wes
tC
oas
tO
ffsh
ore
.!In
gest
ion
ofth
e'
1000
lmfrac
tion
notin
clude
din
tota
lin
gest
ion.
"F
rom
Bra
dfor
d-G
riev
eet
al.(1
997)
.
1727J. Bradford-Grieve et al. / Deep-Sea Research I 45 (1998) 1709—1737
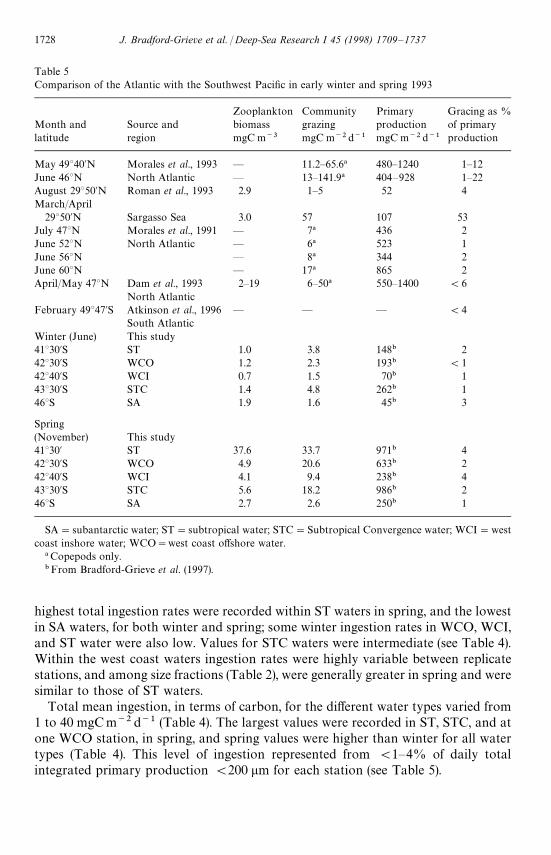
Table 5Comparison of the Atlantic with the Southwest Pacific in early winter and spring 1993
Zooplankton Community Primary Gracing as %Month and Source and biomass grazing production of primarylatitude region mgC m~3 mgC m~2d~1 mgC m~2d~1 production
May 49°40@N Morales et al., 1993 — 11.2—65.6! 480—1240 1—12June 46°N North Atlantic — 13—141.9! 404—928 1—22August 29°50@N Roman et al., 1993 2.9 1—5 52 4March/April
29°50@N Sargasso Sea 3.0 57 107 53July 47°N Morales et al., 1991 — 7! 436 2June 52°N North Atlantic — 6! 523 1June 56°N — 8! 344 2June 60°N — 17! 865 2April/May 47°N Dam et al., 1993 2—19 6—50! 550—1400 (6
North AtlanticFebruary 49°47@S Atkinson et al., 1996 — — — (4
South AtlanticWinter (June) This study41°30@S ST 1.0 3.8 148" 242°30@S WCO 1.2 2.3 193" (142°40@S WCI 0.7 1.5 70" 143°30@S STC 1.4 4.8 262" 146°S SA 1.9 1.6 45" 3
Spring(November) This study41°30@ ST 37.6 33.7 971" 442°30@S WCO 4.9 20.6 633" 242°40@S WCI 4.1 9.4 238" 443°30@S STC 5.6 18.2 986" 246°S SA 2.7 2.6 250" 1
SA"subantarctic water; ST"subtropical water; STC"Subtropical Convergence water; WCI"westcoast inshore water; WCO"west coast offshore water.
! Copepods only."From Bradford-Grieve et al. (1997).
highest total ingestion rates were recorded within ST waters in spring, and the lowestin SA waters, for both winter and spring; some winter ingestion rates in WCO, WCI,and ST water were also low. Values for STC waters were intermediate (see Table 4).Within the west coast waters ingestion rates were highly variable between replicatestations, and among size fractions (Table 2), were generally greater in spring and weresimilar to those of ST waters.
Total mean ingestion, in terms of carbon, for the different water types varied from1 to 40 mgCm~2 d~1 (Table 4). The largest values were recorded in ST, STC, and atone WCO station, in spring, and spring values were higher than winter for all watertypes (Table 4). This level of ingestion represented from (1—4% of daily totalintegrated primary production (200 lm for each station (see Table 5).
1728 J. Bradford-Grieve et al. / Deep-Sea Research I 45 (1998) 1709—1737
4. Discussion
4.1. Biomass and population composition
Mesozooplankton populations in the surface 100 m were typical of the southernTransition Zone. Subantarctic species were at the northern part of their range, warmwater species were at the southern part of their range, and Transition Zone specieswere found across the whole region (e.g. Brinton, 1962). In STC water the presence ofcoastal species indicated that either coastal water had been entrained into the STCover the Chatham Rise in both winter and summer or conditions were suitable therefor the maintenance of these species. A special feature of this environment, similar tothat of the North Pacific, is the appearance, at the surface, of Neocalanus tonsus andCalanoides macrocarinatus in spring. Neocalanus tonsus has a life history very similarto N. plumchrus and N. cristatus (Ohman et al., 1989). It appears to be a TransitionZone species (Bradford-Grieve and Jillett, in press), which fuels its reproductionmainly from stored lipids at subsurface depths in winter and its growth in spring fromnear-surface primary production.
Most of the water types sampled appear to have similar ecological properties if weare to take the proportions of herbivores, omnivores and carnivores as an indicationof conditions (Table 3). That is, herbivores generally dominated the smaller sizefractions and carnivores the largest size fraction. Nevertheless, conditions in a fewwater types and seasons appeared to be different. In ST water in winter omnivoreswere dominant in the small size fractions, suggesting that mortality of small herbi-vores had overtaken their production. In WCI and ST water in spring herbivores weredominant in the largest size fraction as a result of the vertical migration of N. tonsus.In SA water, in winter and spring, carnivores more completely dominated the largestsize fraction, indicating that it was difficult for herbivores to sustain themselves in thislow food environment against the impact of predation.
Mesozooplankton biomass, measured during this study, fell within the distinctiveranges of zooplankton biomass previously recorded in subantarctic and subtropicalwater masses in the Southwest Pacific (Tranter, 1962; Bradford and Roberts, 1978 andreferences therein). Spring biomass data for ST waters, however, exceeded typicalsubtropical zooplankton biomass values by 2—18 times. The relatively high biomassvalues within ST waters in spring was primarily attributable to the presence of largebiomass of the seasonally migrating (Ohman et al., 1989) copepod Neocalanus tonsus insurface waters. There is no evidence of the STC enhancing zooplankton biomass(Vinogradov and Flint, 1988, this study) in spite of enhancement in phytoplanktonbiomass (e.g. Bradford-Grieve et al., 1997; Lutjeharms et al., 1986), although thisconclusion could be the result of a lack of data as most Southern Ocean expeditionsthat have reported zooplankton biomass have hardly extended to the STC. It is possiblethat mesozooplankton accumulates at this front as it does at the Antarctic Convergence(Voronina, 1968). The present biomass data are also similar to those measured in theNorth Atlantic (Table 5) except that the spring ST biomass values were up to an orderof magnitude larger than at 18°N (2.9 mgCm~3) or twice as large as the 46° and 58°Nbiomasses (15.6, May; and 19.3, June mgCm~3) reported by Lenz et al. (1993).
1729J. Bradford-Grieve et al. / Deep-Sea Research I 45 (1998) 1709—1737
Night/day differences in biomass recorded at the stations sampled during this studywere similar to those recorded by Dam et al. (1993) in the North Atlantic, whichwere ascribed to vertical migration. It is unlikely that vertical migration alone wasresponsible for the observed night/day differences in this study because of the largedifferences in night/day ratio recorded between duplicate stations in the same watertype. Daytime avoidance of the net, especially by the euphausiids in the '1000 lmfraction, is a possible explanation, although there was not a consistent increase in thecatch of the larger size fractions at night. A more likely explanation is that we sampledpatchy populations within the different water masses; patchiness would be expected ina physically dynamic region such as the STC. This explanation also accounts for thefew occasions in WCI, STC and ST waters in spring when the night biomasses wereless than those recorded during the day. The means of night and day biomass datawere therefore used in the ingestion calculations.
4.2. Gut fluorescence
In the present study, gut pigment concentrations fell between 1—35 ng phaeomg DW~1 of zooplankton for the 200—500 and 500—1000 lm fractions, which wereusually dominated by herbivorous and omnivorous copepods (Fig. 3, Table 3). Thesepigment concentrations were similar to values measured within other field studies ofzooplankton grazing. Gut pigment content measured for Calanus pacificus, for exam-ple, ranged from (2 to 15.5 ng phaeopigment per individual (Huntley et al., 1987).Assuming a dry adult individual of C. pacificus weighs about 0.28 mg (Omori, 1969),then this species can have gut pigment content per unit weight ranging from(7 to55 ng phaeo mg DW~1.
In many previous studies grazing by species of mesozooplankton reaches a maxi-mum at night (e.g. Mackas and Bohrer, 1976; Morales et al., 1993; Peterson et al.,1990; Atkinson et al., 1996). It was only at spring WCO and STC stations, wheremaximum chlorophyll a concentrations were '2 mgm~3, that there was any evid-ence of gut fullness being at a maximum during night hours in the smaller size frac-tions (Fig. 3). More frequently gut fluorescence per unit mesozooplankton biomasswas variable over a 24 h period and differed between replicate stations, was persistent-ly low, or, occasionally, the pattern was reversed with a slight tendency for a maxi-mum in daylight hours (Fig. 3). There are several possible explanations for theseobservations.
First, the observed patterns may have been a response by the mesozooplanktongrazers to a low phytoplankton food environment. Atkinson et al. (1996) found noc-turnal feeding in a low chlorophyll environment in subantarctic copepods, althoughthey did not give data on the composition of the phytoplankton. NeverthelessPeterson et al. (1990) noticed that Calanoides carinatus, fed on the lowest cellconcentrations (1500 cellsml~1) of ¹halassiosira weissflogii, showed no evidence ofdiel variation in gut pigment content, and little evidence at higher food concentra-tions. Similarly, Dagg and Walser (1987) did not find diel variation in gut pigments inNeocalanus plumchrus feeding in a low chlorophyll environment (0.47 mgm~3), andfeeding appeared to be continuous throughout the day. Most stations in the present
1730 J. Bradford-Grieve et al. / Deep-Sea Research I 45 (1998) 1709—1737
study in the New Zealand region had maximum chlorophyll a concentrations(1 mgm~3, and a large proportion of the phytoplankton population often resided inthe (20 lm fraction. Exceptions were WCO and STC stations, which had maximumchlorophyll a concentrations '2 mg m~3 (Table 1). Therefore it is possible thatthe generally low phytoplankton food environment was responsible for the lack ofapparent diel feeding activity in the mesozooplankton populations sampled aroundNew Zealand.
Second, the variability of water column properties as sampled in the duplicatestations about seven nautical miles apart (Tables 1—4), and evident at much smallertime and space scales (Nodder et al., 1994), may have been responsible for thevariability we observed in the daily gut fluorescence especially in STC and ST water inwinter. In other words, we may not have sampled exactly the same population withthe same environmental conditions over a day.
Third, some of the stations at which gut fluorescence was persistently low over 24 h(X462, X464, X465, X480) were stations where more than 40% of the integratedprimary production resided in the (2 lm fraction. Most of the phytoplanktonstanding stock therefore may have been unavailable as a food source to the mesozoop-lankton grazers (Table 3), since the dominant grazers, primarily copepods, are largelyunable to feed on particles of this size range (Harris, 1982; Huntley, 1981; Lampitt andGamble, 1982). These were not the only stations with persistently low gut fluores-cence. The persistently low gut fluorescence found in the '1000 lm fraction is pre-sumably due to the large proportion of carnivores (Table 3).
4.3. Ingestion and grazing impact
Grazing by mesozooplankton in the 200—500 and 500—1000 lm size fractionsrepresented (4% of the total integrated daily primary production in this study(Table 5) even though populations were usually dominated by herbivores. Harrisonet al. (1993), Morales et al. (1991, 1993), Tsuda et al. (1989), Atkinson (1996) and Dubis-char and Bathmann (1997) also demonstrated similar low grazing impact of oceaniccopepod-dominated mesozooplankton, although Landry et al. (1994) recorded meso-zooplankton grazing of 16—29% of measured primary production in the SouthernCalifornia Bight. In the Subtropical Convergence region near New Zealand our datasuggest that mesozooplankton have only a small impact on primary production andthat microzooplankton were the dominant grazers on phytoplankton during thisstudy (21—194% (mean 93%) of primary production at 10 m) (James and Hall, inpress, 1998).
The gut fluorescence method was used in this study to estimate mesozooplanktoningestion. The assumption that gut evacuation rate represents throughput whilefeeding has been questioned (Penry and Frost, 1990). Nevertheless, this method wasemployed because a number of workers have shown that gut evacuation rates do notchange over short time scales (days) and probably do represent throughput (seeAtkinson et al., 1996 and references therein). The greatest uncertainty concerning thismethod is the level, if any, of pigment destruction that took place. We have made nocorrection for pigment destruction on the assumption that there was little pigment
1731J. Bradford-Grieve et al. / Deep-Sea Research I 45 (1998) 1709—1737
destruction at the low chlorophyll levels in the environments studied (Penry andFrost, 1991). Nevertheless, we cannot discount the possibility that we may haveunderestimated mesozooplankton grazing.
Although the proportion of primary production consumed by mesozooplanktonin the New Zealand region is similar to that obtained from studies within the NorthAtlantic (Table 5), grazing impact by the small size fraction (200—500 lm) was not asdominant as recorded by Morales et al. (1991, 1993). In the present study, the biomassin the 200—500 lm fraction was the least of the three size fractions for more than halfof the stations sampled (Table 2). This difference may be the result of carnivorousfeeding by larger mesozooplankton on the smallest mesozooplankton size fraction aswell as microzooplankton. In the case of ST water in spring, the dominance of the500—1000, and '1000 lm fractions in phytoplankton grazing is because of thedominant role of the large, vertically migrating copepods Neocalanus tonsus (Ohmanet al., 1989) and Calanoides macrocarinatus.
The low proportion of total primary production consumed by the mesozooplanktonin this study, coupled with their large biomass (see Table 2), especially for the largersize fractions, in the STC and ST waters, suggests that the mesozooplankton are notreliant on phytoplankton as an energy source for growth. To examine this further, therespiratory carbon requirements of mesozooplankton (1000 lm were compared to theactual daily carbon ingested in the form of phytoplankton. Estimates of the daily carbonrequired to balance respiration for the mesozooplankton communities (Table 6) werebased on abundance data, individual oxygen consumption rates from James andWilkinson (1988), and conversion of oxygen consumption to respiratory carbon losses(Lampert, 1984). Ingestion calculations assumed a 70% assimilation efficiency.
In general, these calculations show that the phytoplankton carbon ingested appar-ently met only a small fraction of basic metabolic requirements (Table 6) apart fromone WCO winter station. These data, and the fact that spring populations wereapparently actively growing in that they contained a high proportion of developmen-tal stages, imply that the mesozooplankton diets were mainly from non-phytoplank-ton sources of food. The alternative food source is likely to be microzooplankton(Dagg and Walser, 1987; Atkinson, 1996). Atkinson (1996) suggested that copepods inthe low chlorophyll environment of the subantarctic South Atlantic Ocean preferen-tially prey on protozoans.
4.4. The role of mesozooplankton in New Zealand pelagic ecosystems in early winterand spring
The water types studied here have distinct characteristics (temperature, salinity,macronutrients, phytoplankton biomass, productivity and population composition,and zooplankton biomass) (Tables 1 and 3). Nevertheless, Longhurst (1995) classifiedthem into only two basic ecosystem types.
There was also considerable uniformity in population composition and the grazingpotential of the mesozooplankton despite apparent differences in ecosystem type.Potential zooplankton grazing on primary production was very low, even in STCwater in spring where phytoplankton '20 lm dominated biomass and primary
1732 J. Bradford-Grieve et al. / Deep-Sea Research I 45 (1998) 1709—1737
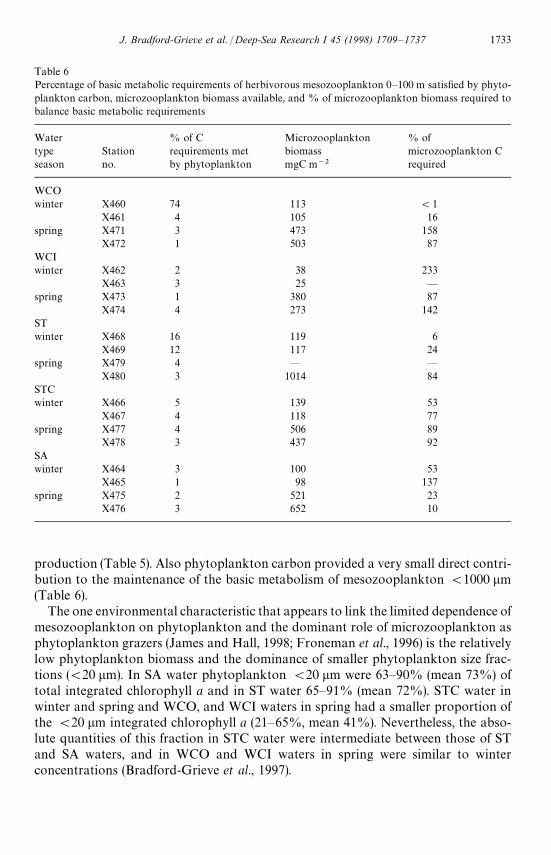
Table 6Percentage of basic metabolic requirements of herbivorous mesozooplankton 0—100 m satisfied by phyto-plankton carbon, microzooplankton biomass available, and % of microzooplankton biomass required tobalance basic metabolic requirements
Water % of C Microzooplankton % oftype Station requirements met biomass microzooplankton Cseason no. by phytoplankton mgC m~2 required
WCOwinter X460 74 113 (1
X461 4 105 16spring X471 3 473 158
X472 1 503 87WCIwinter X462 2 38 233
X463 3 25 —spring X473 1 380 87
X474 4 273 142STwinter X468 16 119 6
X469 12 117 24spring X479 4 — —
X480 3 1014 84STCwinter X466 5 139 53
X467 4 118 77spring X477 4 506 89
X478 3 437 92SAwinter X464 3 100 53
X465 1 98 137spring X475 2 521 23
X476 3 652 10
production (Table 5). Also phytoplankton carbon provided a very small direct contri-bution to the maintenance of the basic metabolism of mesozooplankton (1000 lm(Table 6).
The one environmental characteristic that appears to link the limited dependence ofmesozooplankton on phytoplankton and the dominant role of microzooplankton asphytoplankton grazers (James and Hall, 1998; Froneman et al., 1996) is the relativelylow phytoplankton biomass and the dominance of smaller phytoplankton size frac-tions ((20 lm). In SA water phytoplankton (20 lm were 63—90% (mean 73%) oftotal integrated chlorophyll a and in ST water 65—91% (mean 72%). STC water inwinter and spring and WCO, and WCI waters in spring had a smaller proportion ofthe (20 lm integrated chlorophyll a (21—65%, mean 41%). Nevertheless, the abso-lute quantities of this fraction in STC water were intermediate between those of STand SA waters, and in WCO and WCI waters in spring were similar to winterconcentrations (Bradford-Grieve et al., 1997).
1733J. Bradford-Grieve et al. / Deep-Sea Research I 45 (1998) 1709—1737
It appears that copepods, usually considered to be herbivores, may in fact preferen-tially prey on protozoans and use non-living nutritional sources, especially in alow chlorophyll environment. For example, in feeding experiments, Calanoides acutusCIV and Neocalanus tonsus CV cleared ciliates faster than similarly sized diatomsin the subantarctic Atlantic (Atkinson, 1996), and Verity and Paffenhoffer (1996)showed that late copepodite Eucalanus pileatus preferentially ingested ciliates andheterotrophic dinoflagellates over diatoms. Also Neocalanus cristatus is deduced touse sinking aggregates as a significant source of nutrition in addition to phytoplank-ton and microzooplankton (Dagg, 1993). In early winter and spring mesozooplank-ton in the New Zealand region are probably exerting considerable predation pressureon microzooplankton and smaller mesozooplankton. The percentages of microzoo-plankton biomass as carbon, required to balance basic metabolic requirementsof mesozooplankton (1000 lm, without growth, were modest in WCO and STwater in winter and SA water in spring (Table 6), and a microzooplankton growthrate of (0.3 d~1 would have been sufficient to sustain such a level of predation.In the remaining water types and seasons the percentage of microzooplanktonbiomass required by the mesozooplankton (Table 6) implies that either mesozooplank-ton growth was limited by microzooplankton prey availability (a likely scenarioin WCI and SA water in winter) or that microzooplankton growth was in excessof 1 d~1 and able to sustain a growing population of mesozooplankton.
Have we underestimated the impact of mesozooplankton grazing on thephytoplankton? There are several pieces of independent evidence that allow us toevaluate this possibility. Concurrently collected data on microzooplankton grazingshowed that they represented substantial mortality to phytoplankton (James andHall, 1998). In the STC in spring, there was an accumulation of phytoplankton'20 lm (Bradford-Grieve et al., in press); this could have only occurred if the grazingpressure on this size fraction was less than the daily primary production. The lowproportion of the mesozooplankton that resided in the 200—500 lm fraction linkscircumstantially with the deduced dominance of carnivory in the nutrition ofmesozooplankton in early winter and spring. Therefore, we conclude that our esti-mates of grazing of mesozooplankton on phytoplankton have not been substantiallyunderestimated and that grazing by mesozooplankton is secondary to that of themicrozooplankton.
The dominance of microzooplankton in the grazing of primary production inwinter, spring and summer implies a reduced efficiency of the biological pump in theSTC region (Froneman et al., 1966, this study). Nevertheless, in the STC in spring nearNew Zealand, the apparent preference of copepods for protozoan food allows phyto-plankton '20 lm and chlorophyll concentrations '2 mgm~3 to accumulateand potentially contribute directly to particle flux (Bradford-Grieve et al., 1997). Also,the vertical migration of Neocalanus tonsus and Calanoides macrocarinatus at aboutthe end of January to depths greater than 500 m (Ohman et al., 1989) representsa substantial export of carbon and removal of respiration from surface waters, which,in the case of N. tonsus, returns in spring only as their reproductive products.Therefore, even though there may be a great deal of recycling of carbon by themicrobial loop in the STC region, there appears to be considerable potential for
1734 J. Bradford-Grieve et al. / Deep-Sea Research I 45 (1998) 1709—1737
the export of carbon from the ocean atmosphere boundary which is mediated bycharacteristics of the mesozooplankton.
Acknowledgements
This research was supported by contract CO1518 from the New Zealand Founda-tion for Research Science and Technology.
References
Anderson, O.R., Spindler, M., Be, A.W.H., 1979. Trophic activity of planktonic foraminifera.Journal of Marine Biological Association of the United Kingdom 59, 791—799.
Atkinson, A., 1996. Subantarctic copepods in an oceanic, low chlorophyll environment: ciliatepredation, food selectivity and impact on prey populations. Marine Ecology Progress Series130, 85—96.
Atkinson, A., Ward, P., Murphy, E.J., 1996. Diel periodicity of Subantarctic Copepods:relationships between vertical migration, gut fullness and gut evacuation rate. Journal ofPlankton Research 18, 1387—1405.
Bradford, J.M., 1972. Systematics and ecology of New Zealand east coast plankton sampled atKaikoura. New Zealand Oceanographic Institute Memoir 54, 1—87.
Bradford, J.M., Chapman, B.E., 1988. Epipelagic zooplankton assemblages and a warm-coreeddy off East Cape, New Zealand. Journal of Plankton Research 10, 601—619.
Bradford, J.M., Roberts, P.E., 1978. Distribution of reactive phosphorus and plankton inrelation to upwelling and surface circulation around New Zealand. New Zealand Journal ofMarine and Freshwater Research 12, 1—15.
Bradford-Grieve, J.M., Chang, F.H., Gall, Pickmere, M.S., Richards, F., 1997. Size-fractionatedphytoplankton standing stocks and primary production during austral winter and spring1993 in the Subtropical Convergence region near New Zealand. New Zealand Journal ofMarine and Freshwater Research 31, 201—224.
Bradford-Grieve, J.M., Jillett, J.B., 1998. Ecological constraints on horizontal patterns — withspecial reference to the copepod Neocalanus tonsus (Brady, 1883). In: Pierrot-Butts, A.C., vander spoel, S. (Eds.), Pelaagic Biogeography ICOPBII. Proceedings of the 2nd InternationalConference. Final Report of SCOR/IOC working group 93. IOC Workshop Report 142:i—vii, 1—413.
Brinton, E., 1962. The distribution of Pacific euphausiids. Bulletin it the Scripps Institution ofOceanography of the University of California 8, 51—270.
Broecker, W.S., Peng, T.-H., 1992. Interhemispheric transport of carbon dioxide by oceancirculation. Nature 346, 587—589.
Dagg, M., 1993. Sinking particles as a possible source of nutrition for the large calanoid copepodNeocalanus cristatus in the subarctic Pacific Ocean. Deep-Sea Research 40, 1431—1445.
Dagg, M.J., Walser, W.E., 1987. Ingestion, gut passage, and egestion by the copepodNeocalanus plumchrus in the laboratory and in subarctic Pacific Ocean. Limnology andOceanography 32, 178—188.
Dam, H.G., Peterson, W.T., 1988. The effect of temperature on the gut clearance rate constantof planktonic copepods. Journal of Experimental Marine Biology and Ecology 123, 1—14.
Dam, H.G., Miller, C.A., Jonasdottir, S.H., 1993. The trophic role of mesozooplankton at 47°N,20°W during the North Atlantic Bloom Experiment. Deep-Sea Research 40, 197—212.
1735J. Bradford-Grieve et al. / Deep-Sea Research I 45 (1998) 1709—1737
Dubischar, C.D., Bathmann, U.V., 1997. Grazing impact of copepods and salps on phytoplank-ton in the Atlantic Sector of the Southern Ocean. Deep-Sea Research II 40, 415—433.
Froneman, P.A., Perisinnotto, R., McQuaid, C.D., 1996. Seasonal variations in microzooplank-ton grazing in the region of the Subtropical Convergence. Marine Biology 126, 433—442.
Harrison, W.G., Head, E.J.H., Horne, E.P.W., Irwin, B., Li, W.K.W., Longhurst, A.R.,Para-njape, M.A., Platt, T., 1993. The western North Atlantic Bloom Experiment. Deep-SeaResearch 40, 279—305.
Harris, R.P., 1982. Comparison of the feeding behaviour of Calanus and Pseudocalanus in twoexperimentally manipulated enclosed ecosystems. Journal of the Marine Biological Associa-tion of the United Kingdom 62, 71—91.
Head, E.J.H., Harris, L.R., 1996. Chlorophyll destruction by Calanus spp. grazing on phyto-plankton: kinetics, effects of ingestion rate and feeding history, and a mechanistic interpreta-tion. Marine Ecology Progress Series 135, 223—235.
Heath, R.A., 1985. A review of the physical oceanography of the seas around New Zealand—1982. New Zealand Journal of Marine and Freshwater Research 19, 79—124.
Huntley, M., 1981. Nonselective, nonsaturating feeding by three calanid copepod species in theLabrador sea. Limnology and Oceanography 26, 831—842.
Huntley, M.E., Marin, V., Escritor, F., 1987. Zooplankton grazers as transformers of oceanoptics: A dynamic model. Journal of Marine Research 45, 911—945.
IGBP, 1994. IGBP in action: work plan 1994—1998. The International Geosphere—BiosphereProgramme, ICSU, Stockholm. Report No. 28, 1—151.
James, M.R., Hall, J.R. (in press). Microzooplankton grazing in different water masses associatedwith the Subtropical Convergence off South Island, New Zealand. Deep-Sea Research I.
James, M.R., Wilkinson, V.H., 1988. Biomass, carbon ingestion and ammonia excretion byzooplankton associated with an upwelling plume in western Cook Strait. New ZealandJournal of Marine and Freshwater Research 22, 249—257.
Lampert, W., 1984. The measurement of respiration. In: Downing, J.A., Rigler, F.H. (Eds.),A manual on methods for the assessment of secondary production in freshwaters. pp413—468. Blackwell Scientific Publications, Oxford.
Lampitt, R.S., Gamble, J.C., 1982. Diet and respiration of the small planktonic marine copepodOithona nana. Marine Biology 66, 185—190.
Landry, M.R., Lorenzen, C.J., Petersen, W.K., 1994. Mesozooplankton grazing impact andparticulate flux. Marine Ecology Progress Series 115, 73—85.
Lenz, J.A., Morales, J., Gunkel, J., 1993. Mesozooplankton standing stock during the NorthAtlantic spring bloom study in 1989 and its potential grazing pressure on phytoplankton:a comparison between low, medium and high latitudes. Deep-Sea Research 40, 559—572.
Longhurst, A., 1995. Seasonal cycles of pelagic production and consumption. Progress inOceanography 36, 77—167.
Lutjeharms, J.R.E., Allanson, B.R., Parker, L., 1986. Frontal zones, chlorophyll and primaryproduction patterns in the surface waters of the Southern Ocean south of Cape Town.Elsevier Oceanographic Series 42. In: Nihoul, J.C.J. (Ed.), Marine Interfaces Ecohydro-dynamics. Elsevier, Amsterdam, pp. 105—117.
Mackas, D., Bohrer, R., 1976. Fluorescence analysis of zooplankton gut contents and an investiga-tion of diel feeding patterns. Journal of Experimental Marine Biology and Ecology 25, 77—85.
Mauchline, J., 1980. The biology of mysids and euphausiids. Advances in Marine Biology 18,1—677.
Morales, C.E., Bedo, A., Harris, R.P., Tranter, P.R.G., 1991. Grazing of copepod assemblages inthe north-east Atlantic: the importance of the small size fraction. Journal of PlanktonResearch 13, 455—472.
1736 J. Bradford-Grieve et al. / Deep-Sea Research I 45 (1998) 1709—1737
Morales, C.E., Harris, R.P., Head, R.N., Tranter, P.R.G., 1993. Copepod grazing in the oceanicnortheast Atlantic during a 6 week drifting station: the contribution of size classes andvertical migrants. Journal of Plankton Research 15, 185—211.
Nodder, S.D. (compiler) 1994. Field and laboratory protocols — NIWA Carbon Flux Voyage3014, 1—22 October 1993.
Ohman, M.D., Bradford, J.M., Jillett, J.B., 1989. Seasonal growth and lipid storage of the circum-global, subantarctic copepod, Neocalanus tonsus (Brady). Deep-Sea Research 36, 1309—1326.
Omori, M., 1969. Weight and chemical composition of some important oceanic zooplankton inthe north Pacific Ocean. Marine Biology 3, 4—10.
Parsons, T.R., Lalli, C.M., 1988. Comparative oceanic ecology of the plankton communities of thesubarctic and Pacific oceans. Oceanography and Marine Biology Annual Review 26, 317—359.
Penry, D.L., Frost, B.W., 1990. Re-evaluation of the gut-fullness (gut fluorescence) method forinferring ingestion rates of suspension-feeding copepods. Limnology and Oceanography 35,1207—1214.
Penry, D.L., Frost, B.W., 1991. Chlorophyll a degradation by Calanus pacificus: dependence oningestion rate and digestive acclimation to food resources. Limnology and Oceanography36, 147—159.
Peterson, W., Painting, S., Barlow, R., 1990. Feeding rates of Calanoides carinatus: a composi-tion of five methods including evaluation of the gut fluorescence method. Marine EcologyProgress Series 64, 85—92.
Ritz, D.A., Hose, G.W., Kirkwood, R.J., 1990. Diet of Nyctiphanes australis (Crustacea:Euphausiacea). Australian Journal of Marine and Freshwater Research 41, 365—374.
Roman, M.R., Dam, H.G., Gauzens, A.L., Napp, J.M., 1993. Zooplankton biomass and grazingat the JGOFS Sargasso Sea time series station. Deep-Sea Research I 40, 883—901.
Silver, M.W., Bruland, K.W., 1981. Differential feeding and fecal pellet composition of salps andpteropods, and the possible origin of the deep-water flora and olive-green ‘‘cells’’. MarineBiology 62, 263—273.
Takahashi, T., Azevedo, A.E.G., 1982. The oceans as a CO2
reservoir. In: Interpretation ofClimate and Photochemical Models, Ozone and Temperature Measurements. AmericanInstitute of Physics, New York, pp. 83—109.
Timonin, A.G., 1971. The structure of plankton communities of the Indian Ocean. MarineBiology 9, 281—289.
Tranter, D.J., 1962. Zooplankton abundance in Australian waters. Australian Journal ofMarine and Freshwater Research 13, 106—142.
Tsuda, A., Furuya, K., Nemoto, T., 1989. Feeding of micro- and macro-zooplankton at thesubsurface chlorophyll maximum in the subtropical North Pacific. Journal of ExperimentalMarine Biology and Ecology 132, 41—52.
Verity, P.G., Paffenhoffer, G.-A., 1966. On assessment of prey ingestion by copepods. Journal ofPlankton Research 18, 1767—1779.
Vinogradov, M.E., Flint, M.V. (Eds.), 1988. Pacific subantarctic ecosystems, Nauka, Moscow,304 pp. (English translation).
Voronina, N.M., 1968. The distribution of zooplankton in the Southern Ocean and itsdependence on the circulation of water. Sarsia 34, 277—284.
Wiebe, P.H., 1988. Functional regression equations for zooplankton displacement volume, wetweight, dry weight and carbon: a correction. Fishery Bulletin 86, 833—835.
Wiebe, P.H., Burt, K.H., Boyd, S.H., Morton, A.W., 1976. A multiple opening/closing net andenvironmental sensing system for sampling zooplankton. Journal of Marine Research 34,313—326.
1737J. Bradford-Grieve et al. / Deep-Sea Research I 45 (1998) 1709—1737