structural phase transition in ferroelectric glycine silver nitrate
TRANSCRIPT

This article was published in an Elsevier journal. The attached copyis furnished to the author for non-commercial research and
education use, including for instruction at the author’s institution,sharing with colleagues and providing to institution administration.
Other uses, including reproduction and distribution, or selling orlicensing copies, or posting to personal, institutional or third party
websites are prohibited.
In most cases authors are permitted to post their version of thearticle (e.g. in Word or Tex form) to their personal website orinstitutional repository. Authors requiring further information
regarding Elsevier’s archiving and manuscript policies areencouraged to visit:
http://www.elsevier.com/copyright

Author's personal copy
Solid State Communications 145 (2008) 407–412www.elsevier.com/locate/ssc
Structural phase transition in ferroelectric glycine silver nitrate
Rajul Ranjan Choudhurya,∗, Lata Panickera, R. Chitraa, T. Sakuntalab
a Solid State Physics Division, Bhabha Atomic Research Center, Trombay, Mumbai 400085, Indiab High Pressure Physics Division, Bhabha Atomic Research Center, Trombay, Mumbai 400085, India
Received 25 June 2007; received in revised form 25 October 2007; accepted 10 November 2007 by D.D. SarmaAvailable online 19 November 2007
Abstract
The structural investigation of the ferroelectric phase transition in glycine silver nitrate has revealed that the transition at Tc = 218 K is dueto the displacement of the Ag+ ions from the plane made by the carboxyl oxygens of glycine zwitterions coordinated to it. Since the transitiontakes place between two ordered structures the thermal anomaly at Tc is very weak, the transition enthalpy and transition entropy were found tobe 1H = 6.6 J/mol and the transition entropy 1S = 0.03 J K−1 mol−1 respectively. These crystals are held together by a network of hydrogenbonds. In order to study these interactions the Raman spectrum of GSN was recorded and discussed in the light of ferroelectricity in glycinecomplexes in general.c© 2007 Elsevier Ltd. All rights reserved.
PACS: 77.80.-e; 77.80.Bh; 61.10.Nz
Keywords: A. Ferroelectrics; C. X-ray scattering; D. Phase transitions; D. Heat capacity
1. Introduction
Ferroelectricity has been discovered in many of the glycinecomplexes like triglycine sulfate (TGS) [1], triglycine selenate(TGSe) [1], triglycine fluroberylate (TGFBe) [1], diglycinenitrate (DGN) [2], glycine silver nitrate (GSN) [3], glycinephosphite (GPI) [4] etc. The glycine molecule is a non-rigidmolecule having three internal rotational degrees of freedomwhich result in a large number of rotational conformers ofwhich the lowest energy conformer is planar [5] i.e. it isachiral. The non-planar conformers have small interconversionbarriers to the lowest energy planar conformer. As a result theconformation of the glycine molecule can be easily alteredby the cooperative effects [6] like the long-range dipolarinteraction within the crystalline environment. This can be oneof the reasons for a number of glycine complexes to undergosymmetry breaking structural phase transitions.
All the above mentioned glycine complexes are hydrogen-bonded crystals and the ferroelectric phase transition in all ofthese complexes with the exception of glycine silver nitrate is
∗ Corresponding author.E-mail address: [email protected] (R.R. Choudhury).
found to be of order–disorder type. This fact makes the study ofthe structural phase transition in GSN interesting and importantin order to understand ferroelectricity in glycine complexes.The crystal symmetry of GSN is lowered from P21/a to P21 atthe transition point Tc = 218 K [3]. Rao and Viswamitra [7] haddetermined the ambient temperature crystal structure for GSNin 1972 but no ferroelectric phase structure has been reportedto the present; this is due to the fact that GSN crystals are lightsensitive and hence the single crystal diffraction data needs tobe collected fast. Though the infrared study [8] and the protonmagnetic resonance study [9] on GSN have indicated thatferroelectricity in GSN is in all probability due to the motionof the silver ions (Ag+). Since silver is a very good scattererof X-rays the above stated change at the transition point canbe very effectively studied by X-ray powder diffraction. Inthe present work an X-ray powder diffraction study on GSNwas undertaken to elucidate the low temperature structure andinvestigate the origin of ferroelectricity in these crystals.
Since the ferroelectric phase transition in GSN is in allprobability displacive type the thermal anomaly at the transitiontemperature is expected to be weak; this fact has beentheoretically indicated by the coupled anharmonic oscillatormodel for ferroelectrics [10]. Very weak thermal anomaly at
0038-1098/$ - see front matter c© 2007 Elsevier Ltd. All rights reserved.doi:10.1016/j.ssc.2007.11.010

Author's personal copy
408 R.R. Choudhury et al. / Solid State Communications 145 (2008) 407–412
Tc in GSN was recorded using a high resolution differentialscanning calorimeter. A comparison with the other ferroelectricglycine complexes is reported.
Hydrogen bonding plays a very important role indetermining the physical properties of these soft molecularsolids. Understanding the effect of hydrogen bonding on theferroelectric behavior of the glycine complexes can throw lighton the properties of hydrogen-bonded ferroelectrics in general.In order to study the hydrogen bonding in GSN a Ramanspectrum was recorded at room temperature and discussed inthe light of ferroelectricity in glycine complexes in general.This to the best of our knowledge is the first ever Raman studyon GSN.
2. Experiment
Crystals of GSN were grown in the dark by slow evaporationof an aqueous solution of glycine and silver nitrate mixedtogether in 1:1 stoichiometric ratio. It was observed that thecrystals became brown after prolonged exposure to intense lightlike direct sunlight.
DSC measurement on these crystals of GSN in thetemperature range 173–473 K with heating rate of 10 K/minwas performed using a differential scanning calorimeter (MetlerToledeo make) in order to measure the change in the specificheat at the transition point.
GSN crystals were powdered and loaded on an X-ray sampleholder in the dark; this was then loaded on a Rigaku R-axis D-max powder diffractometer coupled to a rotating anodegenerator (Rigaku make). The sample chamber was coveredfrom the top so as to minimize the light exposure to the sample.The room temperature X-ray pattern was recorded at 6 KW X-ray power using Cu Kα wavelength for the 2θ range 15◦–70◦
at a step of 0.02◦ with 2.3 s of recording time per step. Thecomplete pattern was recorded within 1.8 h (Fig. 1(a)); sincethe pattern had to be recorded fast no further improvementof data statistics especially in the high angle regions could beobtained. This fact is reflected in the higher Rexp values in theRietveld refinement. At this stage no change in the colour of thesample was observe indicating that the sample had not starteddecomposing. Cold nitrogen gas jet at 168 K from an Oxfordcryojet was used to cool the sample below the transition point(218 K). The X-ray pattern was once again recorded under thesame conditions as described above (Fig. 1(b)). Some frostingaround the sample holder was observed while recording thelow temperature diffraction pattern and so a blank run for theempty sample holder was recorded (Fig. 1(c)) in the end underidentical conditions as described above. The regions wherethere could be a possibility of some extra peaks due to the icecrystals were excluded from the low temperature data duringthe structure refinement.
The Raman spectrum of GSN crystal was recorded using the532 nm laser line. Power on the sample was kept below 10 mWto reduce the radiation damage. Crystals were found to be stableand not decomposing during the experimental time. Scatteredlight was detected using a CCD-based (Andor Technology)spectrograph consisting of a home-built 0.9 m monochromator
(a) Room temperature.
(b) Low temperature.
(c) Blank sample holder at ∼168 K.
Fig. 1. Fit of the observed X-ray pattern of GSN to the calculated one: (a) atRT, (b) at ∼168 K. The figure in the inset is the magnified intensity scale forhigh-angle range, (c) blank sample holder at ∼168 K.
together with a super notch filter. Entrance slit was kept at50 µm, which gives a spectral band pass of 3 cm−1. Theintegration time for the recorded spectra was 50 s. The typicalexposure time for recording a spectrum was 100 s.
3. Structure analysis
Rietveld structure refinement was carried out using X-raydiffraction data. The starting model was taken from the roomtemperature structure reported by Rao and Viswamitra [7]. In
Author's personal copy
R.R. Choudhury et al. / Solid State Communications 145 (2008) 407–412 409
Table 1Rietveld refinement details
Room temperature Low temperature
2θ range 15◦–70◦ 15◦–70◦
Peak shape Split Pearson Split PearsonSpace group P21/a P21Cell parameters a = 5.443(1) A, b = 19.444(1) A, c = 5.537(1) A,
β = 99.91(2)◦a = 5.424(2) A, b = 19.440(1) A, c = 5.544(2) A, β = 99.94(3)◦
Cell volume 577.3(3) A3 575.8(6) A3
Rietveld program WinMProf [12] WinMProf [12]No. ofparameter refined
23 31
Rp 11.11 10.82Rwp 13.88 13.20Rexp 6.88 8.14Goof = Rwp/Rexp 2.01 1.621χ2 4.07 2.63RI 11.08 9.98
Table 2Refined atomic coordinates of GSN at RT and LT (∼168 K)
Atom x/a (LT) y/b (LT) z/c(LT) x/a(RT) y/b(RT) z/c(RT)
Ag 0.396 0.004 −0.187 0.145 0.015 −0.177N1 0.816 0.148 0.405 0.672 0.156 0.407O2 0.539 0.054 0.128 0.395 0.062 0.130C2 0.643 0.106 0.526 0.499 0.114 0.528C1 0.482 0.060 0.335 0.338 0.068 0.337O1 0.293 0.032 0.403 0.149 0.040 0.405N2 0.271 0.171 −0.078 0.039 0.184 −0.047O4 0.327 0.195 −0.270 0.095 0.208 −0.239O3 0.375 0.190 0.131 0.143 0.203 0.162O5 0.129 0.119 −0.086 −0.102 0.132 −0.055Ags 0.107 −0.027 0.172N1s −0.485 −0.159 −0.381O2s −0.208 −0.064 −0.104C2s −0.312 −0.116 −0.502C1s −0.151 −0.071 −0.311O1s 0.037 −0.043 −0.379N2s 0.188 −0.198 −0.034O4s 0.132 −0.222 0.157O3s 0.084 −0.217 −0.244O5s 0.330 −0.145 −0.026
The standard deviations in all the three coordinates are of the order of 0.001 at RT and 0.003 at LT.
order to reduce the number of parameters to be refined a rigidbody refinement was done [11] where the conformations of theglycine zwitterion and the nitrate ion were fixed to that obtainedfrom the single crystal X-ray diffraction study at RT. This is areasonable approximation considering that no striking changein the infrared adsorption spectrum of GSN [8] in the internalmode region was observed when the temperature was loweredbelow Tc, indicating no drastic structural changes within themolecular ions. These ions as a whole were allowed to movewithin the unit cell; the refinement details are given in Table 1.Fig. 1(a) and (b) give the fit of the calculated pattern to theobserved data along with the difference profile plot, which isthe most important indicator of the Rietveld refinement [11].Table 2 gives the atomic coordinates in the two phases; theorigin is shifted by 0.25 along the a-axis in the low temperaturephase.
4. DSC analysis
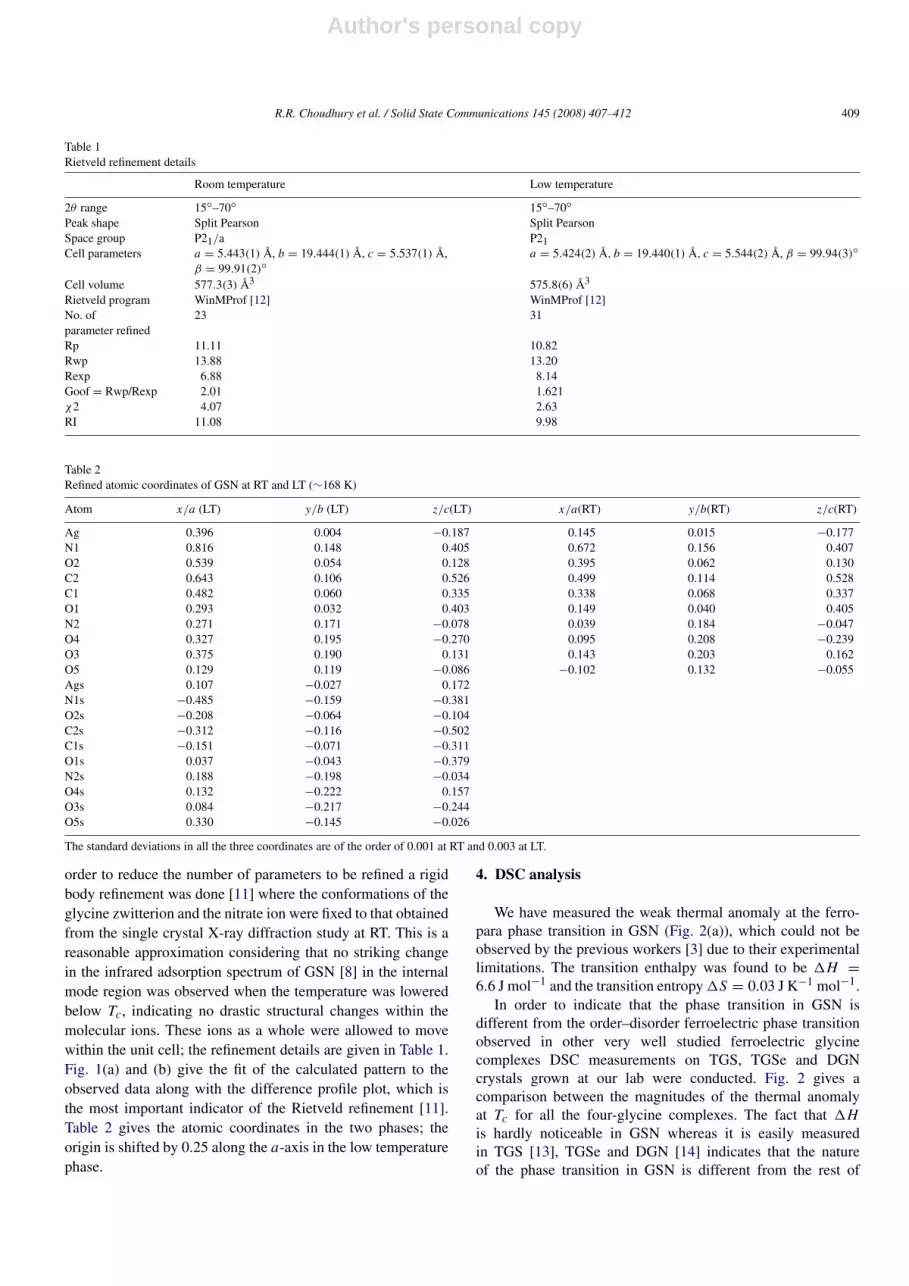
We have measured the weak thermal anomaly at the ferro-para phase transition in GSN (Fig. 2(a)), which could not beobserved by the previous workers [3] due to their experimentallimitations. The transition enthalpy was found to be 1H =
6.6 J mol−1 and the transition entropy 1S = 0.03 J K−1 mol−1.In order to indicate that the phase transition in GSN is
different from the order–disorder ferroelectric phase transitionobserved in other very well studied ferroelectric glycinecomplexes DSC measurements on TGS, TGSe and DGNcrystals grown at our lab were conducted. Fig. 2 gives acomparison between the magnitudes of the thermal anomalyat Tc for all the four-glycine complexes. The fact that 1His hardly noticeable in GSN whereas it is easily measuredin TGS [13], TGSe and DGN [14] indicates that the natureof the phase transition in GSN is different from the rest of
Author's personal copy
410 R.R. Choudhury et al. / Solid State Communications 145 (2008) 407–412
Table 3Comparison between the melting temperature and melting enthalpy of some of the important ferroelectric glycine complexes
S. no. Crystal Melting temperature (K) Ferroelectric transition temperature (K) Melting enthalpy (kJ mol−1)
1 GSN 415 218 30.12 TGS 501 322 131.13 TGSe 471 295 Oxidation + 9.6 +decomposition4 DGN 379 206 15.75 α-glycine 534 – 75.4
Fig. 2. Comparison of the anomaly in the specific heat at Tc for some of theimportant ferroelectric glycine complexes.
Fig. 3. Comparison between the Raman spectra in the NH–stretch region foralpha-glycine, GSN, DGN and TGS.
the complexes. In the displacive case transition takes placebetween two ordered structures; hence the transition entropyand enthalpy are small [15] as in the case of GSN, whereas inthe order–disorder case, since the transition takes place from anordered low temperature phase to a disordered high temperaturephase, the transition entropy is of the order of R ln 2 as observedin TGS, TGSe and DGN.
Table 3 Comparison between the melting temperature andmelting enthalpy of some of the important ferroelectric glycinecomplexes.
Table 3 gives a comparison between the melting pointand melting enthalpy of GSN along with some of the otherferroelectric glycine complexes and pure glycine crystals.Melting point is a good indicative of the strength of hydrogenbonding in these molecular solids. An interesting point to be
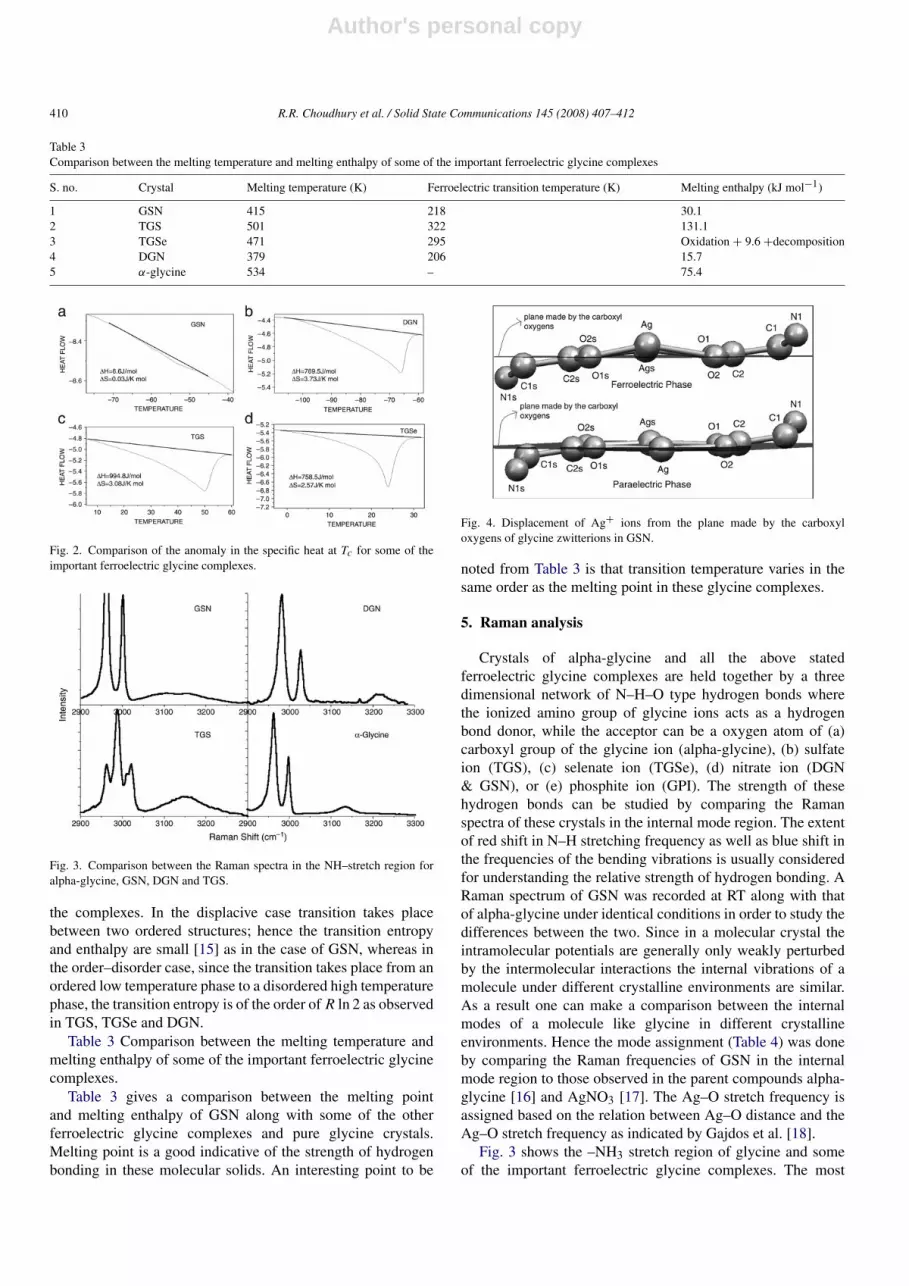
Fig. 4. Displacement of Ag+ ions from the plane made by the carboxyloxygens of glycine zwitterions in GSN.
noted from Table 3 is that transition temperature varies in thesame order as the melting point in these glycine complexes.
5. Raman analysis
Crystals of alpha-glycine and all the above statedferroelectric glycine complexes are held together by a threedimensional network of N–H–O type hydrogen bonds wherethe ionized amino group of glycine ions acts as a hydrogenbond donor, while the acceptor can be a oxygen atom of (a)carboxyl group of the glycine ion (alpha-glycine), (b) sulfateion (TGS), (c) selenate ion (TGSe), (d) nitrate ion (DGN& GSN), or (e) phosphite ion (GPI). The strength of thesehydrogen bonds can be studied by comparing the Ramanspectra of these crystals in the internal mode region. The extentof red shift in N–H stretching frequency as well as blue shift inthe frequencies of the bending vibrations is usually consideredfor understanding the relative strength of hydrogen bonding. ARaman spectrum of GSN was recorded at RT along with thatof alpha-glycine under identical conditions in order to study thedifferences between the two. Since in a molecular crystal theintramolecular potentials are generally only weakly perturbedby the intermolecular interactions the internal vibrations of amolecule under different crystalline environments are similar.As a result one can make a comparison between the internalmodes of a molecule like glycine in different crystallineenvironments. Hence the mode assignment (Table 4) was doneby comparing the Raman frequencies of GSN in the internalmode region to those observed in the parent compounds alpha-glycine [16] and AgNO3 [17]. The Ag–O stretch frequency isassigned based on the relation between Ag–O distance and theAg–O stretch frequency as indicated by Gajdos et al. [18].
Fig. 3 shows the –NH3 stretch region of glycine and someof the important ferroelectric glycine complexes. The most

Author's personal copy
R.R. Choudhury et al. / Solid State Communications 145 (2008) 407–412 411
Table 4Assignment of internal Raman active modes of GSN and their comparison with modes of alpha-glycine and other ferroelectric glycine complexes
S. no. GSN (cm−1) Glycinea (cm−1) TGSb(cm−1) DGNc(cm−1) AgNO3d (cm−1) Assignment
1 109 111 C–C tor2 151 1653 1814 195 1985 210 Ag–O6 358 358 330 338 CCN bend7 493 CO2 rock8 503 498 CO2 rock9 599 602 578 583 CO2 wag
10 692 697 673 684 CO2 bend11 706 707 709 ν4NO312 722 734 734 ν4NO313 825 809 ν2NO314 898 892 900 903 C–C str15 908 922 CH2 rock16 1051 1058 1047 ν1NO317 1031 1034 1035 C–N str18 1093 1108 1104 NH3 rock19 1107 1139 1114 1124 NH3 rock20 1305 1306 ν3NO321 1354 1340 1350 ν3NO322 1316 1301 1302 CH2 twist23 1330 1325 1323 1323 CH2 wag24 1415 1412 1414 1412 CO2 sym str25 1440 1441 1432 CH2 bend26 1451 1455 1480 1480 CH2 sciss27 1508 1504 1493 NH3 def28 1516 1523 NH3 def29 1556 1569 1538 1535 NH3 def30 1600 1595 NH3 as bend31 1630 1634 C–C str +CH2 wag32 1670 1677 1657 CO2 sym str33 285834 289135 2973 2972 2988 2982 CH2 sym str36 3011 3008 3022 3029 CH2 asym str37 3093 3050 NH3 sym str38 3165 3144 3150 3208 NH3 asym str
a J. Raman Spectrosc. 5 (1976) 49–55.b J. Phys. Chem. Solids 55 (1994) 405–411.c Spectrochim. Acta 51A (1995) 197–214.d Raman Spectrosc. 23 (1992) 509–514.
important conclusion that one arrives at by comparing the –NH3 stretch frequencies of the glycine complexes is that thestrength of the N–H–O bond varies as follows: alpha-glycine >
TGS > GSN > DGN. This fact is supported by observedvariation in the melting points of these crystals (Table 3). Theroom temperature crystal structures of all ferroelectric glycinecomplexes were extracted from the Cambridge crystallographicdatabase [19]. One observes N–O distances ranging from: (a)2.770–2.955 A in alpha-glycine, (b) 2.769–3.019 A in TGS,(c) 2.755–3.050 A in TGSe [20], (d) 2.863–2.896 A in GPI,(e) 2.933–3.066 A in GSN and (f) 2.838–3.016 A in DGN,indicating the variation in the strength of N–H–O hydrogenbonds in these complexes. Though from the distances it appearsthat the hydrogen bonds in DGN are stronger than those in GSNdue to dynamic rotation of the acceptor nitrate ion in DGNthese bonds are actually weaker; this fact is supported by thehigher NH as well as nitrate ion (ν1) stretch frequencies of
DGN (weaker hydrogen bonds result in increase in the stretchfrequency) as compared to that in GSN. It is worth commentingthat the ferroelectric transition temperature too varies in thesame order i.e. 322 K for TGS, 295 K of TGSe, 224 K for GPI,218 K for GSN and 206 K for DGN, as the hydrogen bondingstrength in these glycine complexes indicates that the N–H–Obonds play a role directly or indirectly in the ferroelectric phasetransitions in glycine complexes.
Another interesting point observed from Table 4 is thatunlike the TGS and DGN crystals the –CO−
2 modes (CO2 wag,CO2 bend, CO2 sym str) of glycine zwitterions in GSN andalpha-glycine crystals have very negligible differences thoughin GSN–CO−
2 group is coordinated to Ag+ ions and in alpha-glycine it makes strong N–H–O hydrogen bonds with theionized amino group. This might be taken as an indicationthat the strength of the Ag–O coordination bond in GSNand N–H–O hydrogen bonds in alpha-glycine are comparable

Author's personal copy
412 R.R. Choudhury et al. / Solid State Communications 145 (2008) 407–412
though considering the differences between the two types ofinteractions i.e. hydrogen bonding and metal coordination, thesimilarity is surprising. The closeness between the CH2 stretchfrequencies in alpha-glycine and GSN indicates that there existin GSN C–H–O bonds of similar strengths as those in alpha-glycine [21].
The fact that nitrate ion symmetry has been reduced fromD3h in the free ion state to Cs in the crystalline environment ofGSN is reflected in the splitting of the two degenerate modes ν4(in-plane bending) and ν3 (asymmetric stretching) (Table 4) ofthe ion in the Raman spectra [22]. Presence of forbidden out-of-plane deformation mode (ν2) of NO−
3 ion in Raman spectra ofGSN further supports the fact that molecular symmetry of thenitrate ion is lowered in the crystalline environment of GSN.
6. Discussion
The asymmetric unit in the low temperature ferro-phaseof GSN has two independent molecules (Table 2) thatbecome related to each other by an inversion center in thehigh temperature para-phase. Comparison between the roomtemperature and low temperature structure of GSN showed thatthe most significant structural change that leads to the loweringof the crystal symmetry at Tc is the movement of the Ag+ ionsaway from the plane made by the oxygen atoms of the ionizedcarboxyl group of the glycine zwitterions coordinate to themas shown in Fig. 4 (torsion angle O2–Ag–Ags–O2s = 162◦
for T < Tc and =180◦ for T > Tc). Due to the above statedstructural change the center of gravity of the negative charges(due to negatively charged carboxylic groups of glycines andnitrate ions) and the positive charges (due to positively chargedamino groups of glycines and silver ions) within an asymmetricunit no longer coincide. Distance between the two estimatedfrom the low temperature structure using the crystal structure-viewing program MERCURY is of the order of d = 0.2 A.As a result a net electrical dipole moment (µ ≈ qd whereq ≈ 4e) is induced within an asymmetric unit. A unit cellin ferro-phase has two such asymmetric units related to eachother by 2-fold rotation along the b-axis, hence the componentof dipole moment µ along the a and c axis are cancelled outleaving only the b-component of µ which add up to give thenet unit cell dipole moment (µcell ≈ 1.26 D) along b-axis. Theresultant value of spontaneous polarization (Ps) being 0.75 ×
10−4 C/cm2, this estimate of Ps from our phenomenologicalmodel agrees very well with the experimentally obtained valueof Ps = 0.55 × 10⁻⁴ C/cm2 at −195 ◦C [1] indicating thecorrectness of our phenomenological model. The net dipolarinteraction energy [23] (Ei =
∑j [µi · µ j − 3(µi · ri j )(µ j ·
ri j )/|ri j |2]/4πε0|ri j |
3) of a dipole µi located at the i th site ofa hypothetical GSN crystal of size 8a × 8b × 8c was computedto be of the order of 2.01 × 10⁻²¹ J which agrees well withthe thermal energy kBTc = 3.00 × 10⁻²¹ J at the transitionpoint indicating the dipolar interactions bring about the phase
transition at Tc. The direction of spontaneous polarization isreversed when the above stated displacement of the Ag+ ions isreversed.
7. Conclusion
It is concluded from the X-ray as well as the DSCmeasurements that the phase transition in GSN is displacivein nature and results due to the displacement of the Ag+ ionsfrom the plane made by the carboxyl oxygens of glycinescoordinated to it. A phenomenological model for the originof ferroelectricity at Tc is given based on the fact that due tothe movement of Ag+ ion the center of gravity of negativeand positive charges within an asymmetric unit of GSN nolonger coincide in the low temperature phase, resulting in anet spontaneous dipole moment. By comparing the Ramanspectra of ferroelectric glycine complexes it is concluded thatthe ferroelectric transition temperature varies in the sameorder as the strength of N–H–O hydrogen bonds in thesecrystals, indicating that these hydrogen bonds play a role in theferroelectric phase transition in glycine complexes.
References
[1] F. Jona, G. Shirane, Ferroelectric Crystals, Pergamon Press, OxfordLondon, 1962 (Chapter 2).
[2] R. Pepinsky, K. Vedam, S. Hoshino, Y. Okaya, Phys. Rev. 111 (1958)430–432.
[3] R. Pepinsky, Y. Okaya, D.P. Eastman, T. Mitsui, Phys. Rev. 107 (1957)1538–1539.
[4] S. Launer, M. Le Maire, G. Schaack, S. Haussuhl, Ferroelectrics 132(1992) 257.
[5] Ota Bludsky, Jana Chocholousova, Jaroslav Vacek, Friedrich Huisken,Pavel Hobza, J. Chem. Phys. 113 (2000) 4629–4635.
[6] P.W. Anderson, Science 177 (1972) 393–396.[7] J.K.M. Rao, M.A. Viswamitra, Acta Cryst. B 28 (1972) 1481–1495.[8] A.V.R. Warrier, P.S. Narayanan, Proc. Ind. Acad. Sci. 66A (1967) 46–54.[9] K.R.K. Easwaran, J. Phys. Soc. Japn 21 (1966) 1614.
[10] Y. Onodera, N. Kojya, J. Phys. Soc. Jpn 58 (1989) 3227–3235.[11] L.B. Mccusker, R.B. Von Dreele, D.E. Cox, D. Louer, P. Scardi, J. Appl.
Cryst. 32 (1998) 36–50.[12] A. Jouanneaux, CPD Newslett. 21 (1999) 13.[13] S. Hoshino, T. Mitsui, F. Jona, R. Pepinsky, Phys. Rev. 107 (1957)
1255–1258.[14] R. Pepinsky, K. Vedam, S. Hoshino, Y. Okaya, Phys. Rev. 111 (1958) 430.[15] Herve Cailleau, Jean-Louis Baudour, Jean Meinnel, Ary Dworkin,
Fernande Moussa, Claude M.E. Zeyen, Faraday Discussions Chem. Soc.69 (1980) 7–18.
[16] Hans Stenback, J. Raman Spectrosc. 5 (1976) 49–55.[17] Z.X. Shen, W.F. Sherman, M.H. Kuok, S.H. Tang, J. Raman Spectrosc. 23
(1992) 509–514.[18] M. Gajdos, A. Eicher, J. Hafner, Surf. Sci. 531 (2003) 272–286.[19] F.H. Allen, Acta Cryst. B 58 (2002) 380–388.[20] R.R. Choudhury, R. Chitra, Lata Panicker (in press).[21] Z. Berkovitch-Yellin, L. Leiserowitz, Acta Cryst. B 40 (1984) 159–165.[22] Mark R. Waterland, Anne Myers Kelley, J. Chem. Phys. 113 (2000)
6760–6773.[23] R.R. Choudhury, R. Chitra, M. Ramanadham, Physica B 366 (2005)
116–121.