structural frc – design approach and experimental results
TRANSCRIPT

Structural FRC – Design approach and experimental results
www.coinweb.no
SINTEF Building and Infrastructure Håvard Nedrelid (NTNU)
COIN project report 66 – 2015

Håvard Nedrelid (NTNU)
Structural FRC – Design approach and experimental results
FA 2 Competitive construction
SP 2.2 Ductile high tensile strength concrete
COIN Project report 66 – 2015
SINTEF Building and Infrastructure
COIN Project report no 66Håvard Nedrelid (NTNU)Structural FRC – Design approach and experimental results
FA 2 Competitive constructionSP 2.2 Ductile high tensile strength concrete
Keywords:FRC, fibre
Project no.: 102000442-4
ISSN 1891–1978 (online)ISBN 978-82-536-1466-3 (pdf)
© Copyright SINTEF Building and Infrastructure 2015The material in this publication is covered by the provisions of the Norwegian Copyright Act. Without any special agreement with SINTEF Building and Infrastructure, any copying and making available of the material is only allowed to the extent that this is permitted by law or allowed through an agreement with Kopinor, the Reproduction Rights Organisation for Norway. Any use contrary to legislation or an agreement may lead to a liability for damages and con-fiscation, and may be punished by fines or imprisonment.
Address: Forskningsveien 3 B POBox 124 Blindern N-0314 OSLOTel: +47 73 59 30 00Fax: +47 22 69 94 38
www.sintef.no/byggforskwww.coinweb.no
Cooperation partners / Consortium Concrete Innovation Centre (COIN)
Kværner Engineering Contact: Jan-Diederik AdvocaatEmail: [email protected]: +47 67595050
Saint Gobain WeberContact: Geir NordenEmail: [email protected]: +47 22887700
Norcem ASContact: Terje RønningEmail: [email protected]: +47 35572000
NTNUContact: Terje KanstadEmail: [email protected]: +47 73594700
Mapei ASContact: Trond HagerudEmail: [email protected]: +47 69972000
SINTEF Building and InfrastructureContact: Tor Arne HammerEmail: [email protected]: +47 73596856
Skanska Norge ASContact: Sverre SmeplassEmail: [email protected]: +47 40013660
Norwegian Public Roads AdministrationContact: Kjersti K. DunhamEmail: [email protected]: +47 22073940
Unicon ASContact: Stein TosterudEmail: [email protected]: +47 22309035
Veidekke Entreprenør ASAContact: Christine HauckEmail: [email protected]: +47 21055000
Contents
1 General introduction 3
2 The COIN design approach 4
2.1 Basic concept . . . . . . . . . . . . . . . . . . . . . . . . . . . . . . . . . 4
2.2 Design rule proposals . . . . . . . . . . . . . . . . . . . . . . . . . . . . . 5
2.2.1 Moment resistance . . . . . . . . . . . . . . . . . . . . . . . . . . 5
2.2.2 Shear resistance . . . . . . . . . . . . . . . . . . . . . . . . . . . . 6
2.2.3 Calculation of crack widths . . . . . . . . . . . . . . . . . . . . . 6
2.3 Multi-layer models . . . . . . . . . . . . . . . . . . . . . . . . . . . . . . 8
3 Reinforced SC-HFRC members in bending 10
3.1 Introduction . . . . . . . . . . . . . . . . . . . . . . . . . . . . . . . . . . 10
3.2 Experimental program . . . . . . . . . . . . . . . . . . . . . . . . . . . . 10
3.2.1 Brief overview . . . . . . . . . . . . . . . . . . . . . . . . . . . . . 10
3.2.2 Materials . . . . . . . . . . . . . . . . . . . . . . . . . . . . . . . 10
3.2.3 Details of test specimens . . . . . . . . . . . . . . . . . . . . . . . 13
3.2.4 Testing of specimens . . . . . . . . . . . . . . . . . . . . . . . . . 14
3.2.5 Relation between curvature and deflection . . . . . . . . . . . . . 14
3.3 Experimental results . . . . . . . . . . . . . . . . . . . . . . . . . . . . . 16
3.3.1 Reinforced SC-HFRC beams designed for flexural failure . . . . . 16
3.3.2 Reinforced SC-HFRC slabs designed for flexural failure . . . . . . 22
3.3.3 Reinforced SC-HFRC beams designed for shear failure . . . . . . 26
3.3.4 Estimated residual tensile strength from fibre counting . . . . . . 28
3.4 Conclusions . . . . . . . . . . . . . . . . . . . . . . . . . . . . . . . . . . 30
4 Reinforced FRC beams with dapped ends 31
4.1 Introduction . . . . . . . . . . . . . . . . . . . . . . . . . . . . . . . . . . 31
4.2 Experimental program . . . . . . . . . . . . . . . . . . . . . . . . . . . . 31
4.2.1 Brief overview . . . . . . . . . . . . . . . . . . . . . . . . . . . . . 31
4.2.2 Design according to Norwegian practice . . . . . . . . . . . . . . . 32
4.2.3 Details of test specimens . . . . . . . . . . . . . . . . . . . . . . . 36
4.2.4 Materials . . . . . . . . . . . . . . . . . . . . . . . . . . . . . . . 36
4.2.5 Testing of specimens . . . . . . . . . . . . . . . . . . . . . . . . . 38
4.3 Experimental results . . . . . . . . . . . . . . . . . . . . . . . . . . . . . 38
4.3.1 Shear resistance versus strut-and-tie models . . . . . . . . . . . . 38
4.3.2 Load-deflection behaviour . . . . . . . . . . . . . . . . . . . . . . 41
4.4 Conclusions . . . . . . . . . . . . . . . . . . . . . . . . . . . . . . . . . . 41
Appendices 45
Appendix A MatLab Code for multi-layer analysis 45
2

1 General introduction
Fibre-reinforced concrete (FRC) may be defined as concrete containing relatively short,discrete, discontinuous fibres. Even at low fibre contents, the addition of fibres signif-icantly increases the post-cracking toughness and ductility of the concrete1. Anotherbenefit of fibres is reduced crack width and spacing. The fibres tend to bridge the cracksand thereby control the crack development and prevent the occurrence of large crackwidths. The tensile strength may also be increased, but a high volume percentage offibres are then required to get any substantial increase.
The enhanced post-cracking tensile behaviour and improved crack control of concrete maylead to significant improvements in the behaviour of the resulting structural members,both at the serviceability-limit state (SLS) and at the ultimate-limit state (ULS). Useof FRC for structural applications therefore holds the potential for reducing or eveneliminating the conventional bar reinforcement, which in turn may lessen the congestionof reinforcement and lead to more efficient designs.
However, fibres are currently only used for structural parts where reinforcement is notstatically required, e.g. in walls and slabs on grade where only a minimum amount ofreinforcement is needed for crack control. Nonetheless, a vision in COIN is that fibres,one day in the future, will be able to fully or partially replace the conventional steel barsin structural members [1]. However, in order to reach this goal, there is still need for moreexperimental research in order to verify and, if necessary, modify, the tentative designrules published as ‘COIN project report 29’ [2].
The aim of this report is to briefly review the background for the COIN design approachand further evaluate it against experimental data. The data stems from two test programsconducted at NTNU as part of the master’s theses written by Nordhus, Steinnes andSimpson; and Backe-Hansen and Hamstad during spring 2011.
In the former test program [3], the main scope was to examine if the COIN approachfor the calculation of crack widths, moment resistance and shear resistance can be usedto predict the behaviour of RC bending members made of ductile self-compacting FRC.In this respect, a multi-layer beam model was used to simulate the bending behaviourand to estimate the compressive depth of the concrete and the stress in the flexural barsneeded in the crack width calculations.
In the latter test program [4], the possibility of simplifying the detailing of dapped beamends by the use of fibres was investigated. In this respect, the performance of dapped endRC beams made of ductile self-compacting FRC, with simplified reinforcement layout,was compared to that a conventionally dapped end RC beam of ordinary concrete. Thestructural behaviour of the dapped ends was further compared to the COIN design rulesand a strut-and-tie model (STM) was suggested.
1Toughness can be defined as the energy absorption capacity of the material and is related to thearea under the stress-strain curve. Ductility can be defined as the ability of the material to deforminelastically without loss of load-carrying capacity.
3
2 The COIN design approach
2.1 Basic concept
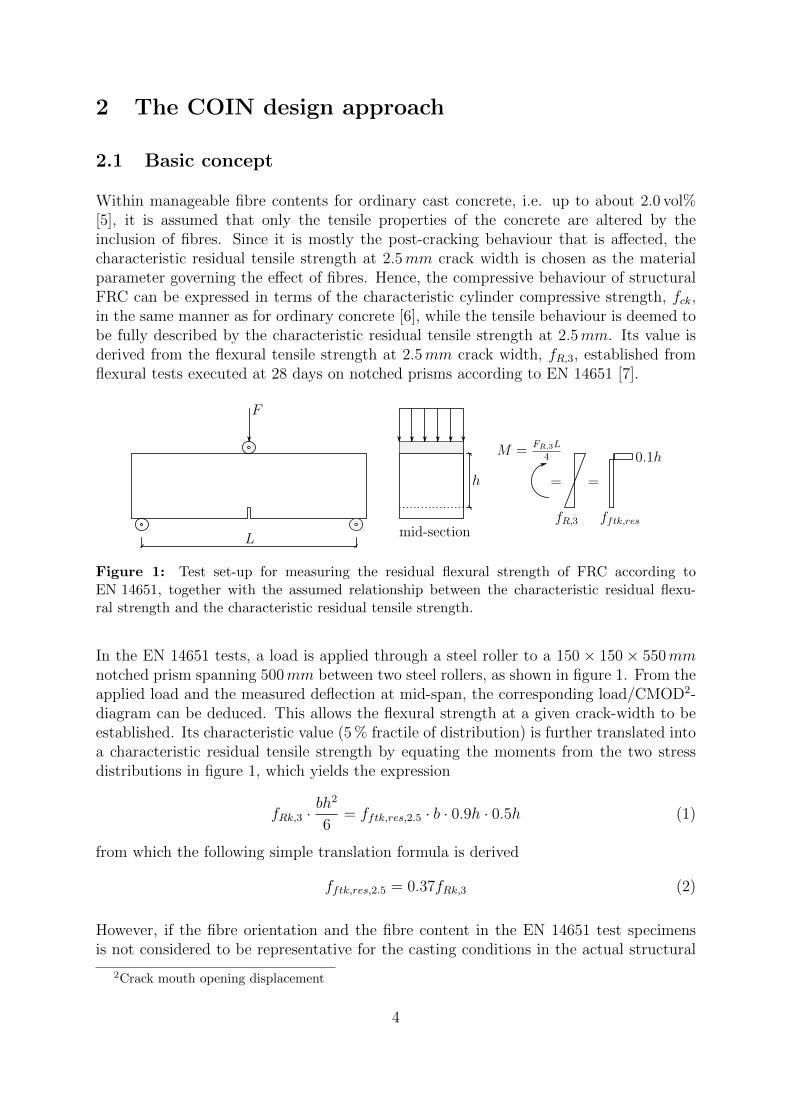
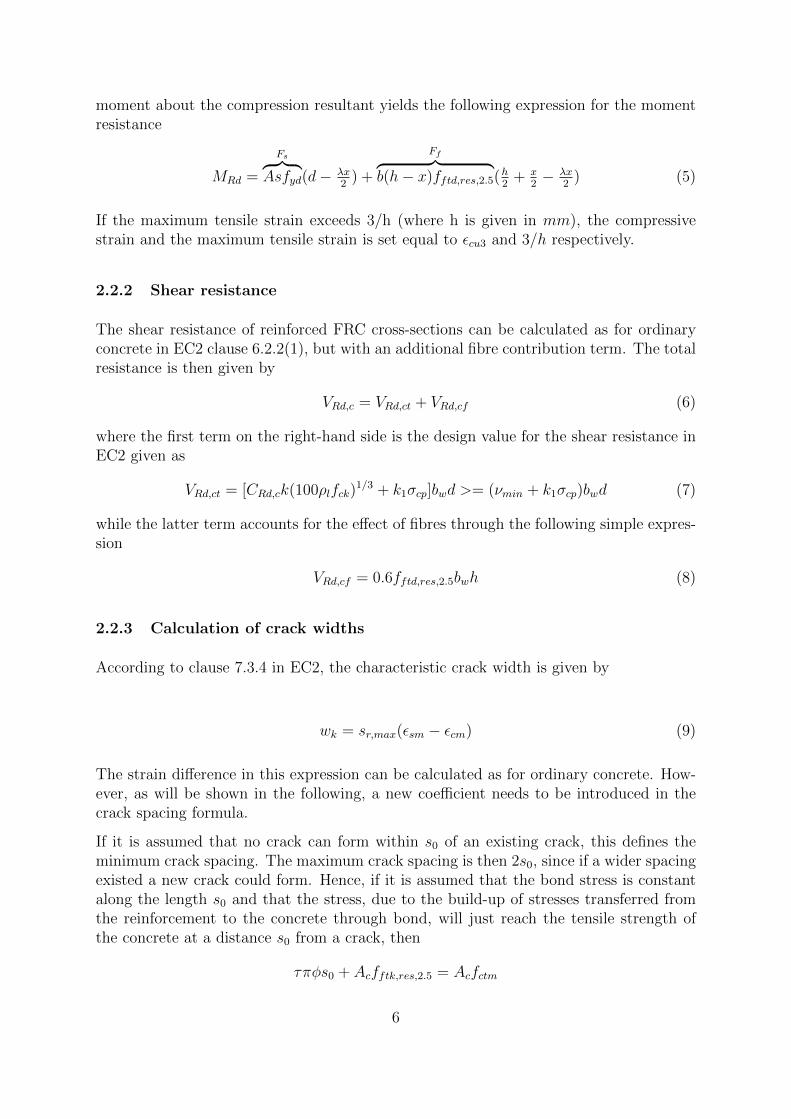
Within manageable fibre contents for ordinary cast concrete, i.e. up to about 2.0 vol%[5], it is assumed that only the tensile properties of the concrete are altered by theinclusion of fibres. Since it is mostly the post-cracking behaviour that is affected, thecharacteristic residual tensile strength at 2.5mm crack width is chosen as the materialparameter governing the effect of fibres. Hence, the compressive behaviour of structuralFRC can be expressed in terms of the characteristic cylinder compressive strength, fck,in the same manner as for ordinary concrete [6], while the tensile behaviour is deemed tobe fully described by the characteristic residual tensile strength at 2.5mm. Its value isderived from the flexural tensile strength at 2.5mm crack width, fR,3, established fromflexural tests executed at 28 days on notched prisms according to EN 14651 [7].
M =FR,3L
4
fR,3 fftk,res
0.1h
= =
L
F
h
mid-section
Figure 1: Test set-up for measuring the residual flexural strength of FRC according toEN 14651, together with the assumed relationship between the characteristic residual flexu-ral strength and the characteristic residual tensile strength.
In the EN 14651 tests, a load is applied through a steel roller to a 150 × 150 × 550mmnotched prism spanning 500mm between two steel rollers, as shown in figure 1. From theapplied load and the measured deflection at mid-span, the corresponding load/CMOD2-diagram can be deduced. This allows the flexural strength at a given crack-width to beestablished. Its characteristic value (5 % fractile of distribution) is further translated intoa characteristic residual tensile strength by equating the moments from the two stressdistributions in figure 1, which yields the expression
fRk,3 ·bh2
6= fftk,res,2.5 · b · 0.9h · 0.5h (1)
from which the following simple translation formula is derived
fftk,res,2.5 = 0.37fRk,3 (2)
However, if the fibre orientation and the fibre content in the EN 14651 test specimensis not considered to be representative for the casting conditions in the actual structural
2Crack mouth opening displacement
4
member, the residual tensile strength should be normalised through the equation
fftk,res,2.5,norm =fftk,res,2.5 · νf,nom
νf (4α− 1)(3)
where
νf,nom = nominal fibre content according to mix design
νf = actual fibre content in the EN 14651 prisms
α = actual fibre orientation factor in the EN 14651 prisms
Moreover, if the fibre orientation factor in the structural member is documented and isnot isotropic (i.e. is not 0.5), the residual tensile strength may be corrected through thefollowing expression
fftk,res,2.5,struct = fftk,res,2.5,norm(4αstruct − 1)νf,struct
νf,nom(4)
where
νf,nom = nominal fibre content according to mix design
νf,struct = actual fibre content in the structural member
αstruct = actual fibre orientation factor in the structural member
2.2 Design rule proposals
2.2.1 Moment resistance
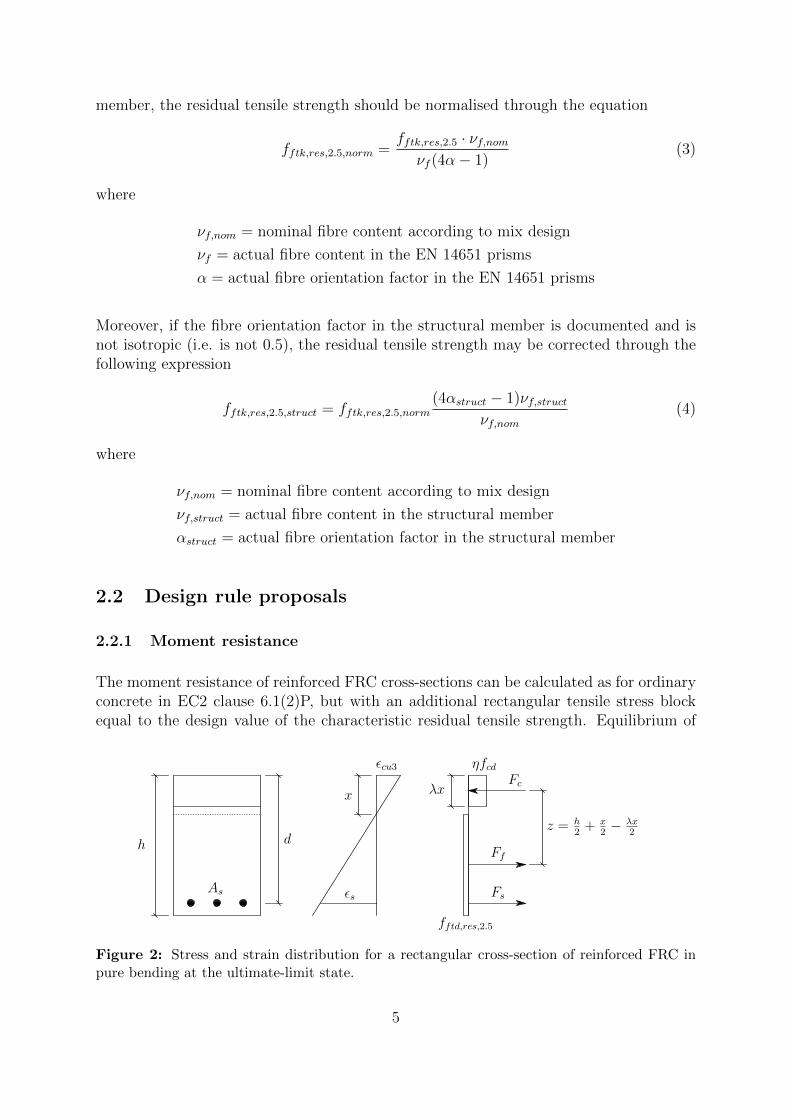
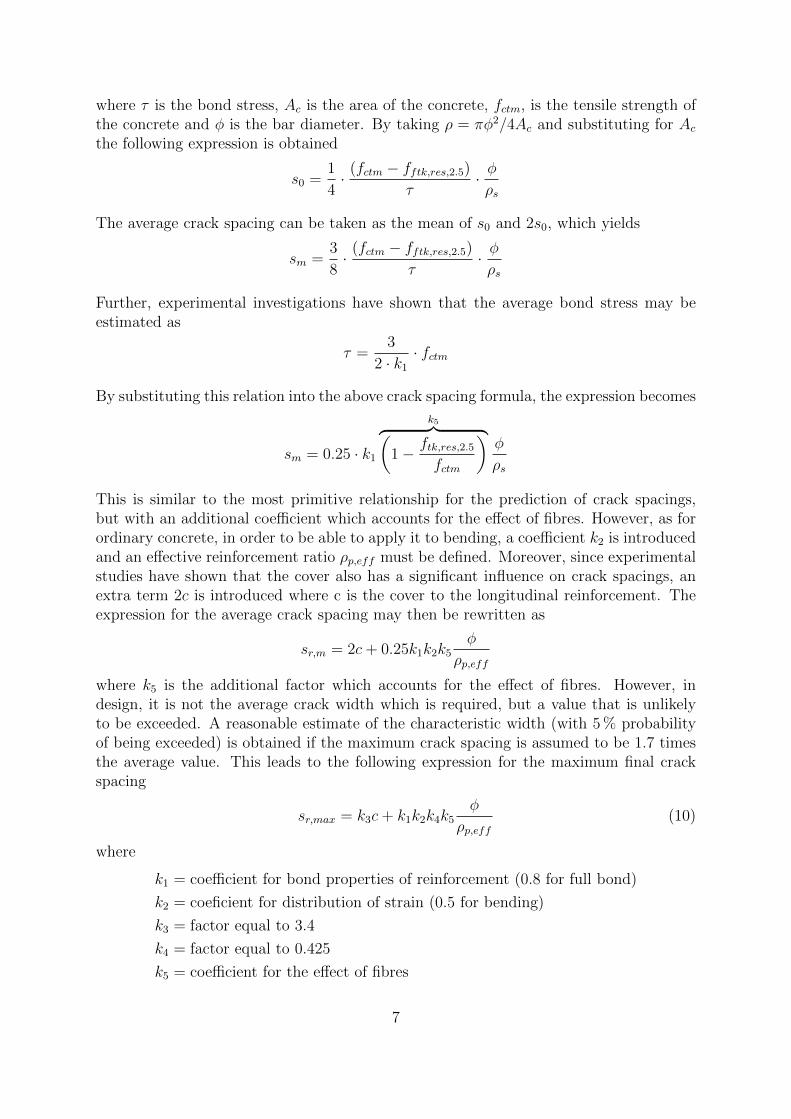
The moment resistance of reinforced FRC cross-sections can be calculated as for ordinaryconcrete in EC2 clause 6.1(2)P, but with an additional rectangular tensile stress blockequal to the design value of the characteristic residual tensile strength. Equilibrium of
h
As
d
x λx
ηfcdFc
Ff
Fs
εcu3
εs
z = h2
+ x2− λx
2
fftd,res,2.5
Figure 2: Stress and strain distribution for a rectangular cross-section of reinforced FRC inpure bending at the ultimate-limit state.
5
moment about the compression resultant yields the following expression for the momentresistance
MRd =
Fs︷ ︸︸ ︷Asfyd(d− λx
2) +
Ff︷ ︸︸ ︷b(h− x)fftd,res,2.5(
h2
+ x2− λx
2) (5)
If the maximum tensile strain exceeds 3/h (where h is given in mm), the compressivestrain and the maximum tensile strain is set equal to εcu3 and 3/h respectively.
2.2.2 Shear resistance
The shear resistance of reinforced FRC cross-sections can be calculated as for ordinaryconcrete in EC2 clause 6.2.2(1), but with an additional fibre contribution term. The totalresistance is then given by
VRd,c = VRd,ct + VRd,cf (6)
where the first term on the right-hand side is the design value for the shear resistance inEC2 given as
VRd,ct = [CRd,ck(100ρlfck)1/3 + k1σcp]bwd >= (νmin + k1σcp)bwd (7)
while the latter term accounts for the effect of fibres through the following simple expres-sion
VRd,cf = 0.6fftd,res,2.5bwh (8)
2.2.3 Calculation of crack widths
According to clause 7.3.4 in EC2, the characteristic crack width is given by
wk = sr,max(εsm − εcm) (9)
The strain difference in this expression can be calculated as for ordinary concrete. How-ever, as will be shown in the following, a new coefficient needs to be introduced in thecrack spacing formula.
If it is assumed that no crack can form within s0 of an existing crack, this defines theminimum crack spacing. The maximum crack spacing is then 2s0, since if a wider spacingexisted a new crack could form. Hence, if it is assumed that the bond stress is constantalong the length s0 and that the stress, due to the build-up of stresses transferred fromthe reinforcement to the concrete through bond, will just reach the tensile strength ofthe concrete at a distance s0 from a crack, then
τπφs0 + Acfftk,res,2.5 = Acfctm
6
where τ is the bond stress, Ac is the area of the concrete, fctm, is the tensile strength ofthe concrete and φ is the bar diameter. By taking ρ = πφ2/4Ac and substituting for Acthe following expression is obtained
s0 =1
4· (fctm − fftk,res,2.5)
τ· φρs
The average crack spacing can be taken as the mean of s0 and 2s0, which yields
sm =3
8· (fctm − fftk,res,2.5)
τ· φρs
Further, experimental investigations have shown that the average bond stress may beestimated as
τ =3
2 · k1· fctm
By substituting this relation into the above crack spacing formula, the expression becomes
sm = 0.25 · k1
k5︷ ︸︸ ︷(1− ftk,res,2.5
fctm
)φ
ρs
This is similar to the most primitive relationship for the prediction of crack spacings,but with an additional coefficient which accounts for the effect of fibres. However, as forordinary concrete, in order to be able to apply it to bending, a coefficient k2 is introducedand an effective reinforcement ratio ρp,eff must be defined. Moreover, since experimentalstudies have shown that the cover also has a significant influence on crack spacings, anextra term 2c is introduced where c is the cover to the longitudinal reinforcement. Theexpression for the average crack spacing may then be rewritten as
sr,m = 2c+ 0.25k1k2k5φ
ρp,eff
where k5 is the additional factor which accounts for the effect of fibres. However, indesign, it is not the average crack width which is required, but a value that is unlikelyto be exceeded. A reasonable estimate of the characteristic width (with 5 % probabilityof being exceeded) is obtained if the maximum crack spacing is assumed to be 1.7 timesthe average value. This leads to the following expression for the maximum final crackspacing
sr,max = k3c+ k1k2k4k5φ
ρp,eff(10)
where
k1 = coefficient for bond properties of reinforcement (0.8 for full bond)
k2 = coeficient for distribution of strain (0.5 for bending)
k3 = factor equal to 3.4
k4 = factor equal to 0.425
k5 = coefficient for the effect of fibres
7
This expression is similar to that given in EC2 clause 7.3.4(3), but with an additionalfactor, k5, which accounts for the effect of fibres.
2.3 Multi-layer models
Hordijk developed a multi-layer model to study the response of plain concrete beamsin bending [8]. However, the model can also be used to study the flexural response ofreinforced FRC beams [9]. The basic principle is that two halves of a bending memberare connected by springs which represents the behaviour of small layers. A linear straindistribution over the height of the cross-section is further assumed. Hence, when thematerial behaviour of the reinforcement and the concrete is known, the response of thebeam can be taken as the sum of the behaviour of all springs, given that equilibrium isfulfilled. Equilibrium is satisfied when the sum of horizontal internal forces is nearly zero,i.e. when
N =n∑i=1
σc,i · b ·h
n+ σsAs + σ′sA
′s ≈ 0 (11)
where
n = number of layers
b = width of cross-section
h = height of cross-section
σc,i = concrete stress in each layer
σs = stress in tensile reinforcement
σ′s = stress in compressive reinforcement
As = area of tensile reinforcement
A′s = area of compressive reinforcement
By multiplying the internal forces in each layer and in the reinforcement with the corre-sponding internal level arm, the internal moment can be found as
M =n∑i=1
σc,i · b ·h
n· zc,i + σsAs · zs + σ′sA
′s · z′s (12)
where
zc,i = distance from mid-height to centre of each layer
zs = distance from mid-height to centroid of tensile reinforcement
z′s = distance from mid-height to centroid of compressive reinforcement
The entire moment-curvature response of the beam can then be simulated by increasingthe curvature in small steps and solving for equilibrium of internal forces within eachstep. This can be done by keeping the strain in the bottom layer constant while thestrain in the top layer is increased until the sum of horizontal internal forces is less than
8

a certain small value. Or, alternatively, by keeping the strain in the top layer constantwhile the strain in the bottom layer is increased until equilibrium is satisfied. If theformer approach is adopted, the procedure within a step can be summarised as follows:
1. Determine the curvature from the strain in the top and bottom layer.
2. Calculate the corresponding strain in each layer and in the reinforcement.
3. Establish the corresponding stresses from the constitutive relations.
4. Find the internal forces and moments from Equation 11 and 12.
5. If the sum of internal forces are not nearly zero, increase the strain in the top layerand repeat the procedure.
The entire moment-curvature relationship of the beam can then be simulated by succes-sively increasing the strain in the bottom layer.
This procedure is straightforward enough, but it relies on a realistic description of thematerial behaviour. For concrete in compression and the reinforcement, the relationshipsgiven in EC2 clause 3.1.7 and 3.2.7 can be used, whereas for the concrete in tension itcan be assumed that the behaviour is linear elastic until the tensile strength is reachedand the stress drops immediately to the residual tensile strength. Or, alternatively, ifthe residual tensile strength is larger than the direct tensile strength, the behaviour isassumed to be linear elastic until the residual tensile strength is reached. In both of thesecases the residual tensile strength is assumed to follow a constant ‘yield’ plateau untilthe failure strain 3/h is reached.
9
3 Reinforced SC-HFRC members in bending
3.1 Introduction
Vibrating the concrete has a negative effect on the distribution and the orientation offibres. Self-compacting concrete (SCC) is therefore likely to enhance the load-carryingcapacity of FRC members due to the alignment of the fibres in the direction of flow.To further increase contribution of the fibres to the structural load-carrying capacity, itshould be aimed for the highest possible concrete ductility. This may be achieved byusing a combination of fibres, sometimes referred to as hybrid-fibre-reinforced concrete(HFRC). An experimental program was therefore undertaken to study the behaviour ofreinforced SC-HFRC members in bending The main scope was to evaluate if the designapproach for shear resistance, moment resistance and crack widths in ‘COIN Projectreport 29’ is applicable. This mainly involves checking if the residual tensile strength at2.5mm crack width, as established from flexural tests on small notched prisms, can beused to predict the effect of fibres in the structural members.
3.2 Experimental program
3.2.1 Brief overview
A series of four reinforced SC-HFRC members were tested. Two types of SC-HFRC wereincluded in the test program: one mix with 1.0 vol% steel fibres + 1.0 vol% syntheticfibres; and one mix with 0.5 vol% steel fibres + 0.5 vol% synthetic fibres. A flexural beamof each concrete type, and a one-way flexural slab and a shear beam of the latter, wereloaded in four-point bending until failure. Each test was replicated one time, resulting ina total number of eight structural members.
3.2.2 Materials
Details of the mix design for the two SC-HFRCs are given in table 1. It can be seen thatthe effective water-cement ratio is about 0.66 and 0.79 for the two mixes respectively.Dramix 65/60 is a cold drawn steel wire fibre with hooked ends (length l = 60mm,aspect ratio l/d = 67, tensile strength σt = 1000MPa), whereas Barchip shogun isa synthetic polymeric fibre with embossed surface texture (length l = 48mm, tensilestrength σt = 550MPa, Youngs modulus E = 10GPa). Moreover, two types of liquidadmixtures were used, Dynamon SP-130 to increase the flowability and Viscostar 3K tocontrol the viscosity. The dry content of these is about 30 % and 4 % respectively.
10

Table 1: Composition of the different concretes utilised in the test program. All componentsare specified by its dry content except for water.
Components in kg/m3 SC-HFRC SC-HFRC2.0 vol% 1.0 vol%
Norcem standard cement 314 288
Limestone powder 78.5 71.9
Effective water 208 228
Ardal aggregate (0− 8mm) 1468 1416
Ardal aggregate (0− 2mm) 259 250
Dynamon SP-130 1.22 1.13
Viscostar 3K 0.06 0.05
Dramix 65/60 78.0 39.0
Barchip Shogun 48 9.10 4.55
Total weight 2416 2298
The mixing procedure was as follows: add the dry components and mix for 2 minutes;add water and the viscosity modifier and about half of the superplastisizer during mixing;mix for 4 minutes and then rest for 10 minutes until potential false set; add more of thesuperplastisizer during mixing based on a visual estimate of the mix consistency; measurethe slump flow; if the desired slump is achieved the concrete is poured back and fibresare added during mixing; if not, more superplastisizer should be added before the fibresare included in the mix.
Two flexural beams were cast from one 2.0 vol% batch, whereas two flexural beams, twoflexural slabs, and two shear beams were cast from four 1.0 vol% batches. Moreover six100mm cubical specimens and three 150 × 150 × 550mm prisms were cast for each ofthe five batches in order to determine the material properties. It should be noted thatfor the 2.0 vol% batch, the slump was not checked before the fibres were added, whichled to an exaggerated use of superplastisizer and the mix separated. This should be keptin mind when ealuating the results.
Table 2: Mean residual tensile strengths from tests according to EN 14651. It should be notedthat the tests were conducted at various ages of the concrete. The slump flow was measured byfilling a standard cone with concrete, with no compaction, and then lifting it up to determinethe spread.
Batch w/c- Fibre Slump Test Residualnr. ratio content flow age tensile
strength(vol%) (mm) (days) (MPa)
1 0.66 2.0 770 29 3.32 0.79 1.0 650 33 1.93 0.79 1.0 590 33 2.14 0.79 1.0 560 20 1.55 0.79 1.0 590 34 1.6
Flexural tests of the notched 150 × 150 × 550mm prisms were performed according to
11

EN 14651. The mean residual tensile strengths established from the tests are presentedin Table 2, while the corresponding load-deflection curves are given in Figure 3.
0 1 2 3 4 50
5
10
15
20
25
Load(kN)
Deflection (mm)
Batch 2
0 1 2 3 4 50
5
10
15
20
25
Load(kN)
Deflection (mm)
Batch 3
0 1 2 3 4 50
5
10
15
20
25
Load(kN)
Deflection (mm)
Batch 4
0 1 2 3 4 50
5
10
15
20
25
Load(kN)
Deflection (mm)
Batch 5
Figure 3: Load-deflection curves for the specimens from Batch 2 to 5. The cracking load canbe recognised as the end of the nearly elastic part of the ascending branch of the curves. It canbe seen that for all beams, the curves continue to rise after cracking. A long ascending partof the load-deflection curves after cracking is preferable, since this is synonymous with a highdegree of ductility of the concrete.
12
3.2.3 Details of test specimens
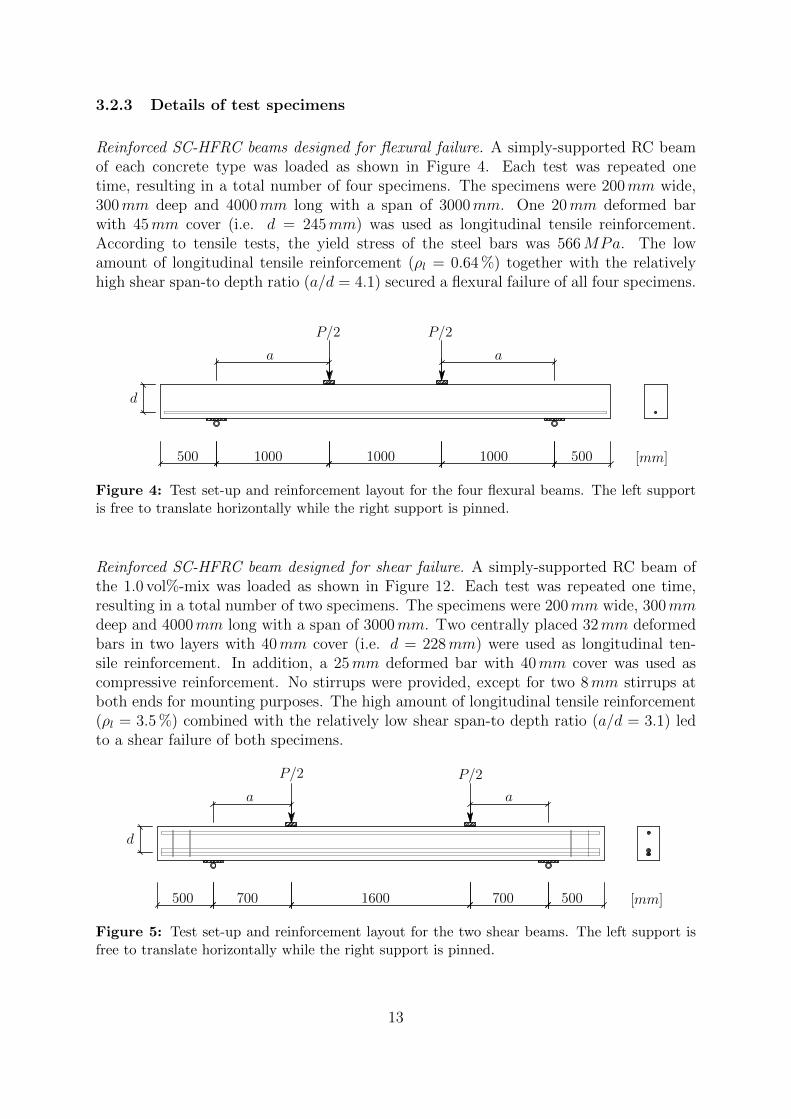
Reinforced SC-HFRC beams designed for flexural failure. A simply-supported RC beamof each concrete type was loaded as shown in Figure 4. Each test was repeated onetime, resulting in a total number of four specimens. The specimens were 200mm wide,300mm deep and 4000mm long with a span of 3000mm. One 20mm deformed barwith 45mm cover (i.e. d = 245mm) was used as longitudinal tensile reinforcement.According to tensile tests, the yield stress of the steel bars was 566MPa. The lowamount of longitudinal tensile reinforcement (ρl = 0.64 %) together with the relativelyhigh shear span-to depth ratio (a/d = 4.1) secured a flexural failure of all four specimens.
500 1000 1000 1000 500
d
P/2 P/2
a a
[mm]
Figure 4: Test set-up and reinforcement layout for the four flexural beams. The left supportis free to translate horizontally while the right support is pinned.
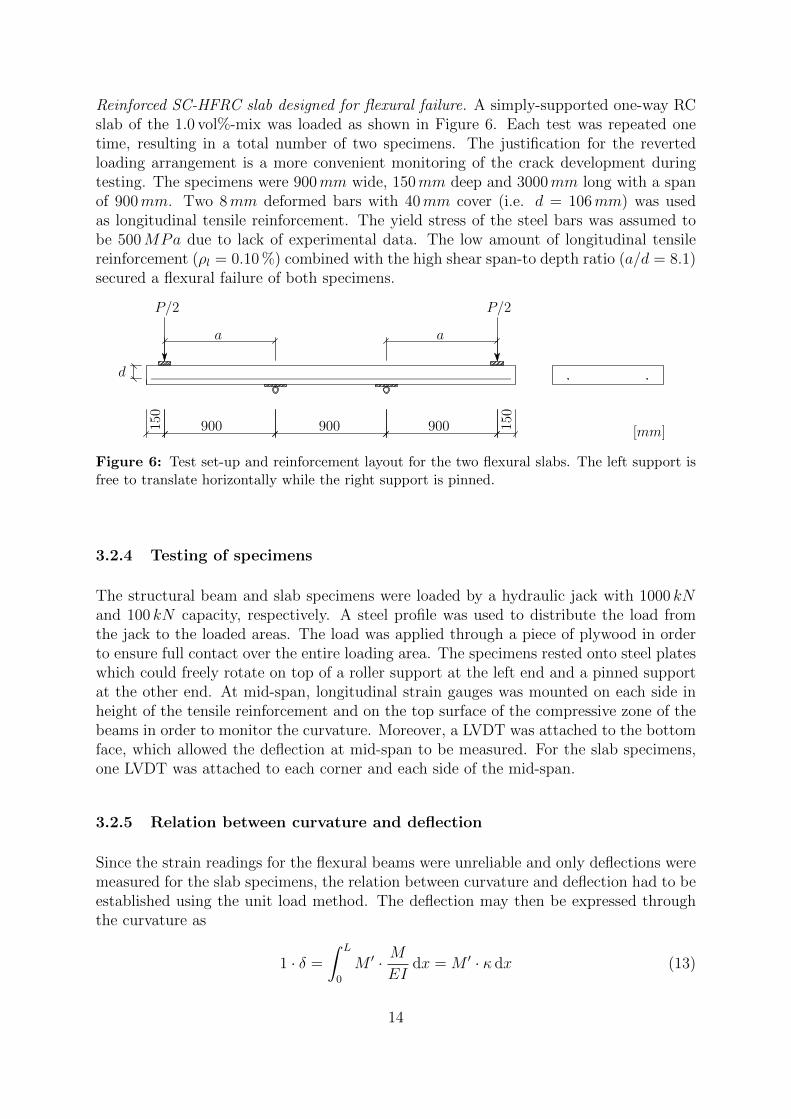
Reinforced SC-HFRC beam designed for shear failure. A simply-supported RC beam ofthe 1.0 vol%-mix was loaded as shown in Figure 12. Each test was repeated one time,resulting in a total number of two specimens. The specimens were 200mm wide, 300mmdeep and 4000mm long with a span of 3000mm. Two centrally placed 32mm deformedbars in two layers with 40mm cover (i.e. d = 228mm) were used as longitudinal ten-sile reinforcement. In addition, a 25mm deformed bar with 40mm cover was used ascompressive reinforcement. No stirrups were provided, except for two 8mm stirrups atboth ends for mounting purposes. The high amount of longitudinal tensile reinforcement(ρl = 3.5 %) combined with the relatively low shear span-to depth ratio (a/d = 3.1) ledto a shear failure of both specimens.
500 700 1600 700 500
a a
[mm]
d
P/2 P/2
Figure 5: Test set-up and reinforcement layout for the two shear beams. The left support isfree to translate horizontally while the right support is pinned.
13
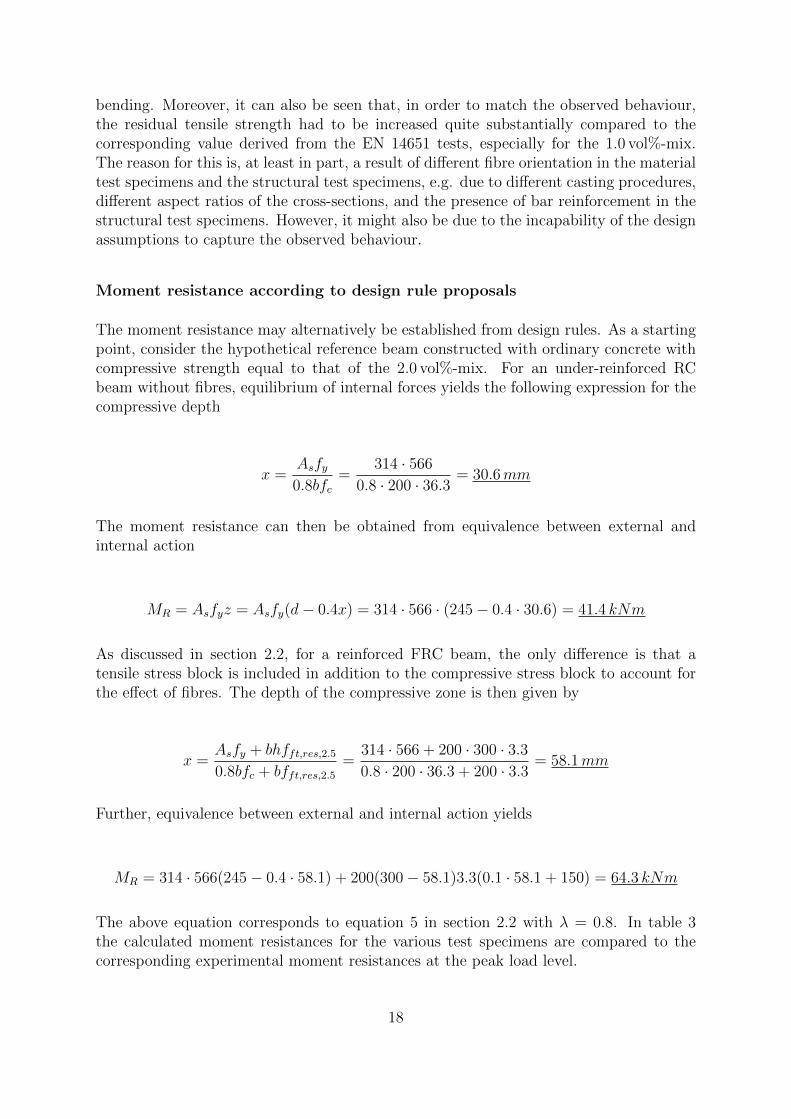
Reinforced SC-HFRC slab designed for flexural failure. A simply-supported one-way RCslab of the 1.0 vol%-mix was loaded as shown in Figure 6. Each test was repeated onetime, resulting in a total number of two specimens. The justification for the revertedloading arrangement is a more convenient monitoring of the crack development duringtesting. The specimens were 900mm wide, 150mm deep and 3000mm long with a spanof 900mm. Two 8mm deformed bars with 40mm cover (i.e. d = 106mm) was usedas longitudinal tensile reinforcement. The yield stress of the steel bars was assumed tobe 500MPa due to lack of experimental data. The low amount of longitudinal tensilereinforcement (ρl = 0.10 %) combined with the high shear span-to depth ratio (a/d = 8.1)secured a flexural failure of both specimens.
a a
P/2 P/2
150
900 900 900 150
d
[mm]
Figure 6: Test set-up and reinforcement layout for the two flexural slabs. The left support isfree to translate horizontally while the right support is pinned.
3.2.4 Testing of specimens
The structural beam and slab specimens were loaded by a hydraulic jack with 1000 kNand 100 kN capacity, respectively. A steel profile was used to distribute the load fromthe jack to the loaded areas. The load was applied through a piece of plywood in orderto ensure full contact over the entire loading area. The specimens rested onto steel plateswhich could freely rotate on top of a roller support at the left end and a pinned supportat the other end. At mid-span, longitudinal strain gauges was mounted on each side inheight of the tensile reinforcement and on the top surface of the compressive zone of thebeams in order to monitor the curvature. Moreover, a LVDT was attached to the bottomface, which allowed the deflection at mid-span to be measured. For the slab specimens,one LVDT was attached to each corner and each side of the mid-span.
3.2.5 Relation between curvature and deflection
Since the strain readings for the flexural beams were unreliable and only deflections weremeasured for the slab specimens, the relation between curvature and deflection had to beestablished using the unit load method. The deflection may then be expressed throughthe curvature as
1 · δ =
∫ L
0
M ′ · MEI
dx = M ′ · κ dx (13)
14

where M’ and M is the variation of virtual and actual moment along the beam length andκ is the curvature corresponding to the actual moment. If it is assumed that the curvatureis of the same shape as the moment diagram as shown in figure 7, the relationship becomes
δ =
A + D︷ ︸︸ ︷2
∫ L3
0
x
2· 3x
Lκ dx+
B + C︷ ︸︸ ︷2
∫ L2
L3
x
2· κ dx =
1
27L2κ+
5
72L2κ =
23
216L2κ (14)
which yields the following simple translation formula
κ =216
23· δL2
∀ δ ≤ δpeak (15)
This relation holds true until the peak load level is attained. After this stage, yielding ofthe flexural bars results in a larger curvature in the constant moment region and a smallercurvature in the shear spans. However, without too much error, it can be assumed thatthe curvature remains constant in the shear spans after peak (i.e. only the curvature inthe constant moment region is assumed to increase with the deflection at mid-span afterpeak). The relation between deflection and curvature may then be written as
δ =1
27L2
(216
23· δpeakL2
)+
5
72L2κ =
8
23δpeak +
5
72L2κ (16)
which, when rearranged, yields the following relation between the curvature and thedeflection at mid-span
κ =72
5·δ − 8
23· δpeak
L2∀ δ > δpeak (17)
A B C D
L/3 L/6 L/6 L/3
κ
M ′ :
κ :
L4
L6
L6
κ κ
Figure 7: Moment diagram for a unit load applied at mid-span together with the curvaturefrom two-point loading applied in the third-points of a simply-supported beam.
15

3.3 Experimental results
3.3.1 Reinforced SC-HFRC beams designed for flexural failure
Experimental load-deflection behaviour
The resulting load-deflection curves for the reinforced SC-HFRC beams designed forflexural failure are given in Figure 8. As expected, the beams of the 2.0 vol%-mix carriesthe highest load and are slightly stiffer. However, with respect to ductility, the beams ofthe 1.0 vol%-mix exhibits the best behaviour.
.0 15 30 45 60
0
40
80
120
160
Load(kN)
Deflection (mm)
RC beams (2.0 vol%-mix)RC beams (1.0 vol%-mix)
Figure 8: Experimental load-deflection curves for the reinforced SC-HFRC beams designedfor flexural failure. It should be noted that the end of the curves do not represent collapse ofthe members, but simply that the tests was stopped.
Comparison with multi-layer model
Owing to the lack of a reference beam without fibres, the effect of fibres on the structuralbehaviour cannot be assessed directly. However, given that a precise estimate of theyield stress of the steel bars is available, the behaviour of an under-reinforced RC beamwithout fibres can be accurately predicted by the multi-layer model presented in section2.3. According to tensile tests, the yield stress of the bars used in the tests was 566MPa.The Youngs modulus was assumed to be 200GPa and the post-yield behaviour wasmodelled as perfectly plastic. The compressive cylinder strength of the concrete wasestablished by multiplying the average cube strength (determined from three 100mmcubical specimens) by 0.8, while the residual tensile strength was an input variable (seeTable 2). Other relevant material parameters for the concrete and the compressive stress-strain relation was derived from the compressive strength using Table 3 and clause 3.1.7in EC2, respectively. The tensile stress-strain relation was modelled as linear elastic
16

followed by a constant ‘yield’ plateau equal to the residual tensile strength. The cross-section was divided into 1000 layers. In order to simulate the bending behaviour, thestrain in the bottom layer was increased in steps of 0.1 h until the tensile strain limit3/h=0.01 for the FRC was reached. Within each step, the strain in the top layer wasincreased in increments of 0.01 h until the sum of internal forces was less than 0.01 kN .
Figure 11 presents the results from the multi-layer analyses together with experimentalmoment-curvature relation for one 2.0 vol% beam and one 1.0 vol% beam. Both theexperimental and the predicted curves are stopped at at the tensile strain limit 3/h forthe fibre-reinforced cross-section (i.e. at a strain equal to 0.01 in the bottom layer). It canbe seen that at this late stage in the bending behaviour, the contribution of the fibres tothe load-carrying capacity is about 75% irrespective of the fibre content. This is partlydue to the 2.0 vol% beams not being fully ductile and partly due to their lower thanexpected peak load-carrying capacity. Based on the measured residual tensile strength,the 2.0 vol% beams was expected to be 63.8/52.8=1.21 times stronger than the 1.0 vol%beams, but in reality they turned out to only be 80.5/71.3=1.13 times stronger. Hence,combined with the fact that the measured residual tensile strength only increased by afactor 3.3/1.9=1.74 by doubling the amount of fibres, it can be concluded that the useof the 2.0 vol% mix cannot be justified with respect to flexural behaviour in the ULS.
0 1 2 3 4 5
x 10−5
0
20
40
60
80
100
Moment(kNm)
Curvature (1/mm)
2.0 vol%-mix
Experimental behaviour5.9MPa (fitted value)3.3MPa (as measured)0.0MPa (without fibres)
0 1 2 3 4 5
x 10−5
0
20
40
60
80
100
Moment(kNm)
Curvature (1/mm)
1.0 vol%-mix
Experimental behaviour4.9MPa (fitted value)1.9MPa (as measured)0.0MPa (without fibres)
Figure 9: Experimental behaviour of one beam specimen of each mix compared to calculationsaccording to the multi-layer procedure. The residual tensile strength in the calculations waseither: fitted to match the experimental data; as measured in the EN 14651 tests; or zero inorder to model the behaviour of a corresponding beam without fibres.
According to the analyses, the compressive strain at the tensile strain limit was 0.016,0.026 or 0.034 for the 2.0 vol%-mix and 0.0021, 0.0029 or 0.0041 for the 1.0 vol%-mix,depending on the the value of the residual tensile strength. Hence, for the highest residualtensile strength, the predicted compressive strain for the 1.0 vol%-mix is higher than thecompressive strain limit given in Table 3 in EC2. However, in this respect, it should bekept in mind that the compressive strain at failure is not really a material parameter but,simply, a safe lower-bound value for the maximum strain at the top of a RC beam in
17
bending. Moreover, it can also be seen that, in order to match the observed behaviour,the residual tensile strength had to be increased quite substantially compared to thecorresponding value derived from the EN 14651 tests, especially for the 1.0 vol%-mix.The reason for this is, at least in part, a result of different fibre orientation in the materialtest specimens and the structural test specimens, e.g. due to different casting procedures,different aspect ratios of the cross-sections, and the presence of bar reinforcement in thestructural test specimens. However, it might also be due to the incapability of the designassumptions to capture the observed behaviour.
Moment resistance according to design rule proposals
The moment resistance may alternatively be established from design rules. As a startingpoint, consider the hypothetical reference beam constructed with ordinary concrete withcompressive strength equal to that of the 2.0 vol%-mix. For an under-reinforced RCbeam without fibres, equilibrium of internal forces yields the following expression for thecompressive depth
x =Asfy0.8bfc
=314 · 566
0.8 · 200 · 36.3= 30.6mm
The moment resistance can then be obtained from equivalence between external andinternal action
MR = Asfyz = Asfy(d− 0.4x) = 314 · 566 · (245− 0.4 · 30.6) = 41.4 kNm
As discussed in section 2.2, for a reinforced FRC beam, the only difference is that atensile stress block is included in addition to the compressive stress block to account forthe effect of fibres. The depth of the compressive zone is then given by
x =Asfy + bhfft,res,2.50.8bfc + bfft,res,2.5
=314 · 566 + 200 · 300 · 3.30.8 · 200 · 36.3 + 200 · 3.3
= 58.1mm
Further, equivalence between external and internal action yields
MR = 314 · 566(245− 0.4 · 58.1) + 200(300− 58.1)3.3(0.1 · 58.1 + 150) = 64.3 kNm
The above equation corresponds to equation 5 in section 2.2 with λ = 0.8. In table 3the calculated moment resistances for the various test specimens are compared to thecorresponding experimental moment resistances at the peak load level.
18
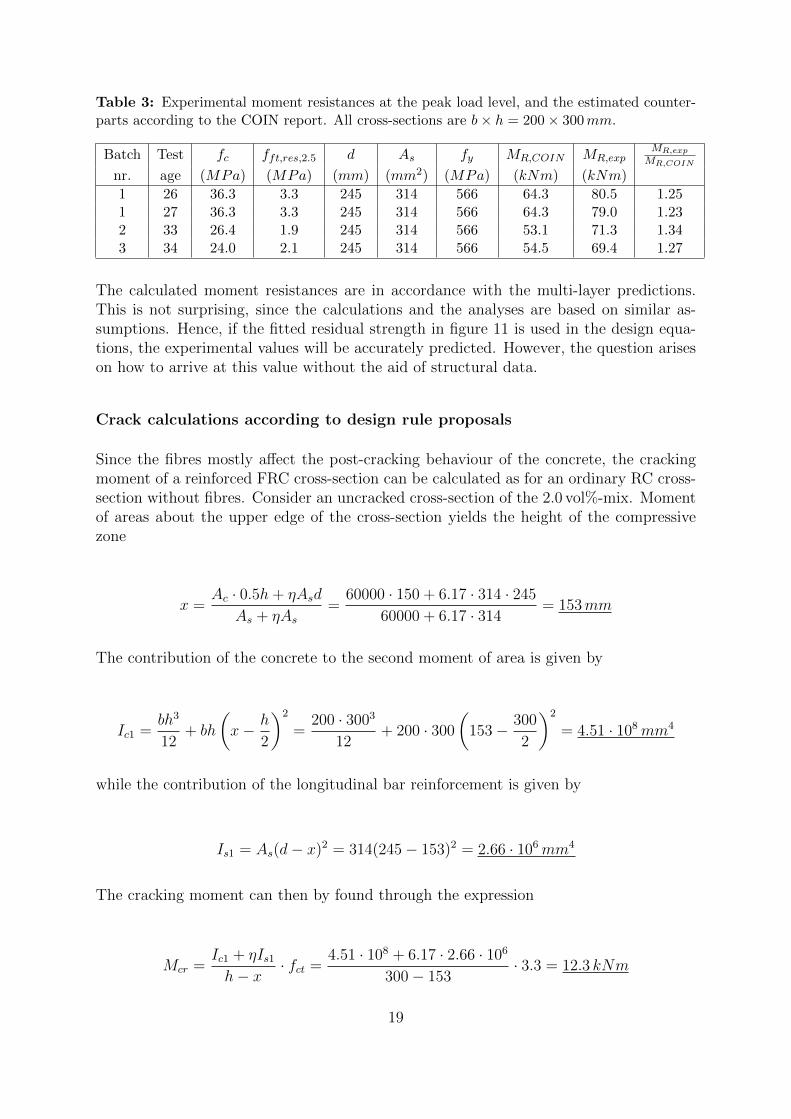
Table 3: Experimental moment resistances at the peak load level, and the estimated counter-parts according to the COIN report. All cross-sections are b× h = 200× 300mm.
Batch Test fc fft,res,2.5 d As fy MR,COIN MR,expMR,exp
MR,COIN
nr. age (MPa) (MPa) (mm) (mm2) (MPa) (kNm) (kNm)
1 26 36.3 3.3 245 314 566 64.3 80.5 1.251 27 36.3 3.3 245 314 566 64.3 79.0 1.232 33 26.4 1.9 245 314 566 53.1 71.3 1.343 34 24.0 2.1 245 314 566 54.5 69.4 1.27
The calculated moment resistances are in accordance with the multi-layer predictions.This is not surprising, since the calculations and the analyses are based on similar as-sumptions. Hence, if the fitted residual strength in figure 11 is used in the design equa-tions, the experimental values will be accurately predicted. However, the question ariseson how to arrive at this value without the aid of structural data.
Crack calculations according to design rule proposals
Since the fibres mostly affect the post-cracking behaviour of the concrete, the crackingmoment of a reinforced FRC cross-section can be calculated as for an ordinary RC cross-section without fibres. Consider an uncracked cross-section of the 2.0 vol%-mix. Momentof areas about the upper edge of the cross-section yields the height of the compressivezone
x =Ac · 0.5h+ ηAsd
As + ηAs=
60000 · 150 + 6.17 · 314 · 245
60000 + 6.17 · 314= 153mm
The contribution of the concrete to the second moment of area is given by
Ic1 =bh3
12+ bh
(x− h
2
)2
=200 · 3003
12+ 200 · 300
(153− 300
2
)2
= 4.51 · 108mm4
while the contribution of the longitudinal bar reinforcement is given by
Is1 = As(d− x)2 = 314(245− 153)2 = 2.66 · 106mm4
The cracking moment can then by found through the expression
Mcr =Ic1 + ηIs1h− x
· fct =4.51 · 108 + 6.17 · 2.66 · 106
300− 153· 3.3 = 12.3 kNm
19
Table 7 lists the calculated cracking moments for the various test specimens. By com-paring them to figure 11, it can be seen that the calculated values correspond quite wellto the point where the moment-curvature relations starts to deviate from linearity. Thissupports the assumption that the cracking moment is not significantly influenced by thepresence of fibres.
Table 4: Calculated cracking moment for the various test specimens. All cross-sections areb × h = 200 × 300mm. The direct tensile strength and the Youngs modulus for the concretewere established from the compressive strength by the expressions given in Table 3 in EC2.
Batch Test fc fct Ec η d As Mcr
nr. age (MPa) (MPa) (MPa) (Es/Ec) (mm) (mm2) (kNm)
1 26 36.3 3.3 32389 6.17 245 314 12.31 27 36.3 3.3 32389 6.17 245 314 12.32 33 26.4 2.7 29438 6.79 245 314 8.63 34 24.0 2.5 28608 6.99 245 314 8.0
An effect of the fibres, however, is to alter the bending stiffness of the cross-sectionafter cracking. Hence, the bending stiffness may not be assumed to vary linearly withthe loading as for ordinary RC beams. The compressive depth of the concrete and thestress in the flexural bars may therefore not be calculated as for an ordinary cracked RCcross-section. This hampers the calculations of crack widths. However, one solution isto extract these quantities from the multi-layer analyses. Using this approach, the straindifference between steel and concrete for a beam of the 2.0 vol%-mix may be calculatedfrom the expression given in EC2 7.3.4(2)
εsm − εcm =243− 0.6 · 3.3
0.018(1 + 6.17 · 0.018)
200000= 0.62 · 10−3 < 0.6 · 243
200000= 0.73 · 10−3
In the above, equation, the compressive depth of the concrete and the stress in theflexural bars were extracted from the multi-layer analysis at a load level equal to 60 % ofthe calculated peak load in table 3, since this corresponded to the load level at which theactual crack widths were measured. The factor kt is set to 0.6 due to short-term loading.The maximum crack spacing can further be established from a formula similar to thatgiven in EC2 7.3.4(3)
sr,max = 3.4 · 45 + 0.8 · 0.5 · 0.425
(1− 3.3
3.3
)20
0.023= 153mm
where k5 is an additional fibre contribution factor as deduced in section 2.2.3. From theabove values, the resulting crack width is finally given by
wk = 153 · 0.73 · 10−3 = 0.11mm
20

In Table 8 the calculated crack widths are presented together with their measured coun-terpart. The effective height, hc,ef in the calculation of the effective area of concrete intension is governed by EC2 clause N.A.7.3.4, i.e. hc,ef = h − d + 1.5φ. It can be seenthat the calculated values agree reasonably well with the experimental data, although thecrack widths for the beams of the first batch was somewhat underestimated. This mightbe due to the fact that the mix from the first batch separated, which might have led to alower direct tensile strength in the resulting test specimens. Further, it should be notedthat the crack widths were measured using an optical comparator with an expected errorin measurement equal to ±0.005mm. Hence, the procedure described above seems to bea feasible method for crack calculations in reinforced FRC. Especially when the average
Table 5: Calculated crack widths, at a load level equal to 60 % of the peak load, together withtheir experimental counterpart. All cross-sections are b× h = 200× 300mm.
Batch fc fct fft,res,2.5 x σs εsm − εcm sr,max wk,COIN wk,expnr. (MPa) (MPa) (MPa) (mm) (MPa) (h) (mm) (mm) (mm)
1 36.3 3.3 3.3 91.2 243 0.73 153 0.11 0.141 36.3 3.3 3.3 91.2 243 0.73 153 0.11 0.142 26.4 2.7 1.9 90.0 280 0.91 208 0.19 0.163 24.0 2.5 2.1 95.0 281 0.95 182 0.17 0.16
crack spacing is considered. In the COIN design approach, this value is calculated asfor ordinary RC beams by dividing the maximum crack spacing by a factor 1.7. Hence,according to the calculations the mean value for the average crack spacing is equal to90mm and 115mm for the beams of the 2.0 vol%-mix and the 1.0 vol%-mix, respectively.This is in good agreement with the measured values 89mm and 105mm. One problemhowever is that the good predictions of the crack widths and spacings are obtained usingthe residual tensile strength as measured, while it had to be increased substantially inorder to fit the experimental moment resistance.
21
3.3.2 Reinforced SC-HFRC slabs designed for flexural failure
Experimental load-deflection behaviour
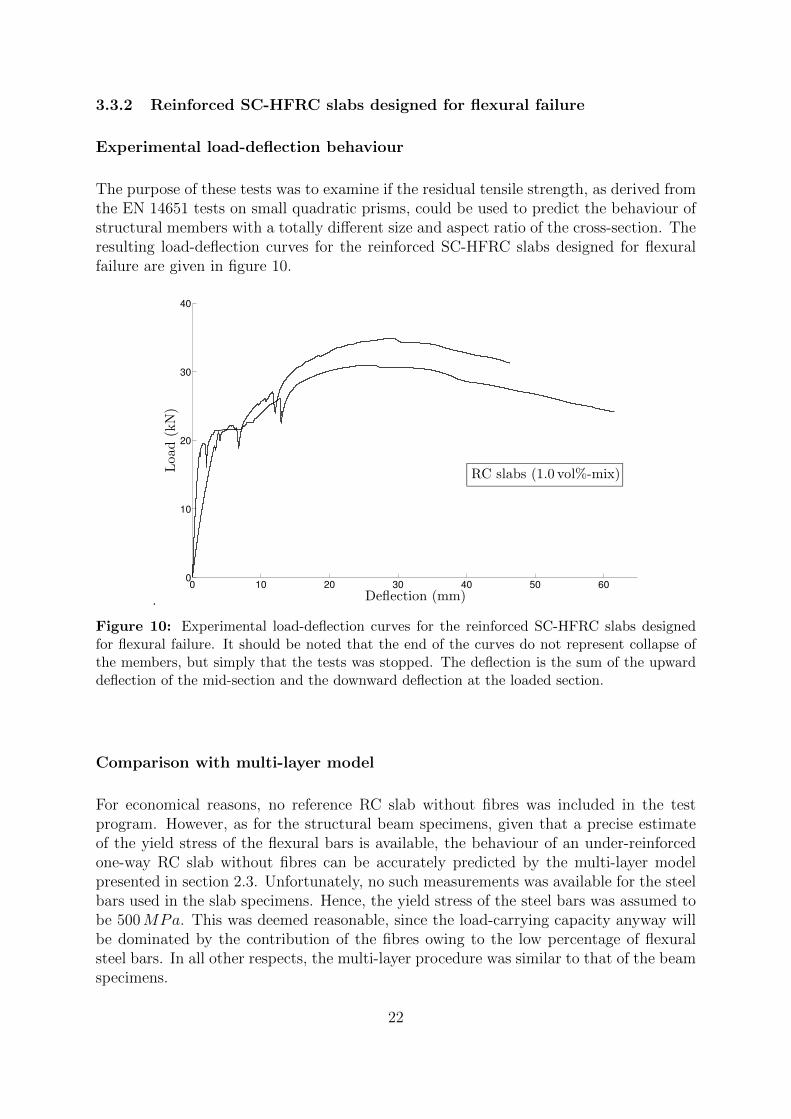
The purpose of these tests was to examine if the residual tensile strength, as derived fromthe EN 14651 tests on small quadratic prisms, could be used to predict the behaviour ofstructural members with a totally different size and aspect ratio of the cross-section. Theresulting load-deflection curves for the reinforced SC-HFRC slabs designed for flexuralfailure are given in figure 10.
.0 10 20 30 40 50 60
0
10
20
30
40
Load(kN)
Deflection (mm)
RC slabs (1.0 vol%-mix)
Figure 10: Experimental load-deflection curves for the reinforced SC-HFRC slabs designedfor flexural failure. It should be noted that the end of the curves do not represent collapse ofthe members, but simply that the tests was stopped. The deflection is the sum of the upwarddeflection of the mid-section and the downward deflection at the loaded section.
Comparison with multi-layer model
For economical reasons, no reference RC slab without fibres was included in the testprogram. However, as for the structural beam specimens, given that a precise estimateof the yield stress of the flexural bars is available, the behaviour of an under-reinforcedone-way RC slab without fibres can be accurately predicted by the multi-layer modelpresented in section 2.3. Unfortunately, no such measurements was available for the steelbars used in the slab specimens. Hence, the yield stress of the steel bars was assumed tobe 500MPa. This was deemed reasonable, since the load-carrying capacity anyway willbe dominated by the contribution of the fibres owing to the low percentage of flexuralsteel bars. In all other respects, the multi-layer procedure was similar to that of the beamspecimens.
22
0 0.2 0.4 0.6 0.8 1
x 10−4
0
5
10
15
20
Moment(kNm)
Curvature (1/mm)
Experimental behaviour1.0MPa (fitted value)1.5MPa (as measured)0.0MPa (without fibres)
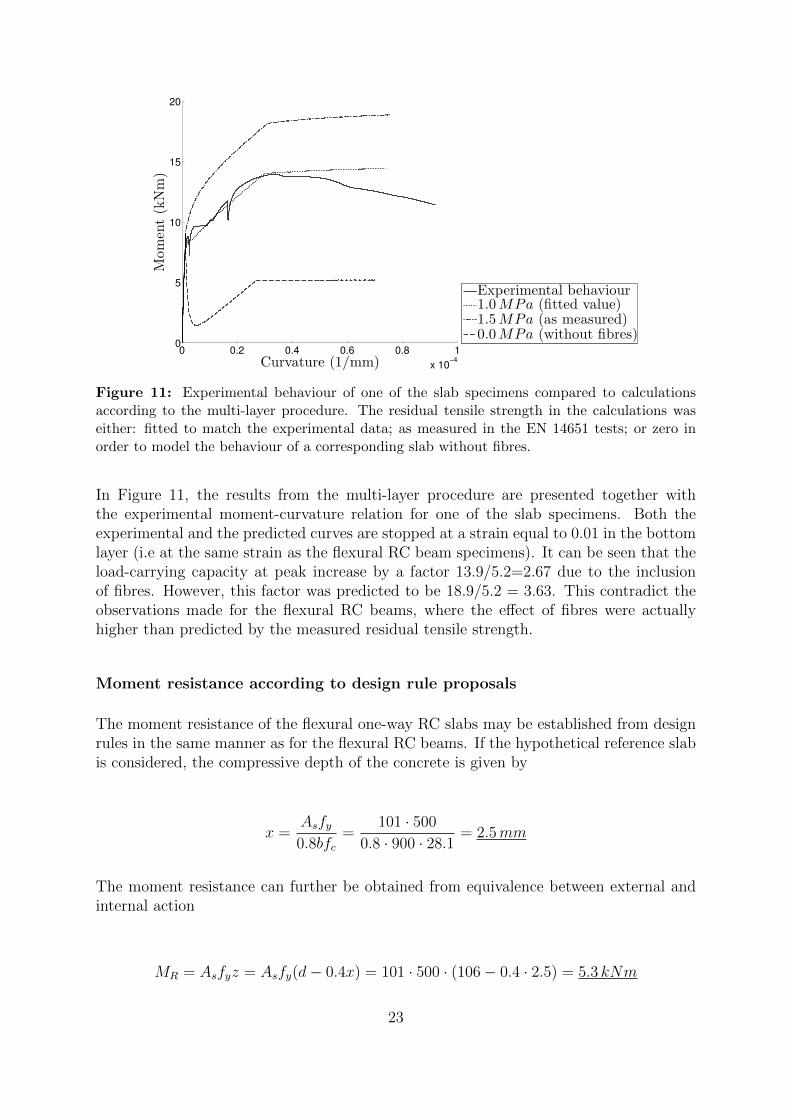
Figure 11: Experimental behaviour of one of the slab specimens compared to calculationsaccording to the multi-layer procedure. The residual tensile strength in the calculations waseither: fitted to match the experimental data; as measured in the EN 14651 tests; or zero inorder to model the behaviour of a corresponding slab without fibres.
In Figure 11, the results from the multi-layer procedure are presented together withthe experimental moment-curvature relation for one of the slab specimens. Both theexperimental and the predicted curves are stopped at a strain equal to 0.01 in the bottomlayer (i.e at the same strain as the flexural RC beam specimens). It can be seen that theload-carrying capacity at peak increase by a factor 13.9/5.2=2.67 due to the inclusionof fibres. However, this factor was predicted to be 18.9/5.2 = 3.63. This contradict theobservations made for the flexural RC beams, where the effect of fibres were actuallyhigher than predicted by the measured residual tensile strength.
Moment resistance according to design rule proposals
The moment resistance of the flexural one-way RC slabs may be established from designrules in the same manner as for the flexural RC beams. If the hypothetical reference slabis considered, the compressive depth of the concrete is given by
x =Asfy0.8bfc
=101 · 500
0.8 · 900 · 28.1= 2.5mm
The moment resistance can further be obtained from equivalence between external andinternal action
MR = Asfyz = Asfy(d− 0.4x) = 101 · 500 · (106− 0.4 · 2.5) = 5.3 kNm
23
For a corresponding reinforced FRC slab, the only difference is that a tensile stress blockis included in addition to the compressive stress block to account for the effect of fibres.The depth of the compressive zone is then given by
x =Asfy + bhfft,res,2.50.8bfc + bfft,res,2.5
=101 · 500 + 900 · 150 · 1.50.8 · 900 · 28.1 + 900 · 1.5
= 11.7mm
Further, equivalence between external and internal action yields
MR = 101 · 500(106− 0.4 · 11.7) + 900(150− 11.7)1.5(0.1 · 11.7 + 75) = 19.3 kNm
In table 6 the calculated moment resistances for the two slab specimens are compared tothe corresponding experimental moment resistances at the peak load level.
Table 6: Experimental moment resistances at the peak load level and the estimated counter-parts according to the COIN report. All cross-sections are b× h = 900× 150mm.
Batch Test fc fft,res,2.5 d As fy MR,COIN MR,expMR,exp
MR,COIN
nr. age (MPa) (MPa) (mm) (mm2) (MPa) (kNm) (kNm)
2 50 29.2 1.9 106 101 500 19.3 14.3 0.744 34 28.1 1.5 106 101 500 19.3 11.4 0.59
As already mentioned, contrary to the beam specimens, the measured value of the resid-ual tensile strength overestimates the moment resistance for the slab specimens quitesubstantially. Hence, by comparing the results in table 3 and 6, it might be hypothesizedthat a cross-section with a high b/h-ratio is likely to have an unfavourable orientation offibres in the structure. This will be discussed further in the subsequent section, wherethe actual orientation of fibres in the structural members are sought determined experi-mentally.
Crack calculations according to design rule proposals
Consider an uncracked section of the slab specimen from batch 4. Moment of areas aboutthe upper edge of the cross-section yields the height of the compressive zone
x =Ac · 0.5h+ ηAsd
As + ηAs=
135000 · 75 + 6.67 · 101 · 106
135000 + 6.67 · 101= 75.1mm
The contribution of the concrete to the second moment of area is given by
Ic1 =bh3
12+ bh
(x− h
2
)2
=900 · 1503
12+ 900 · 150
(75.1− 150
2
)2
= 2.53 · 108mm4
24
while the contribution of the longitudinal bar reinforcement is given by
Is1 = As(d− x)2 = 101(106− 75.1)2 = 96.4 · 103mm4
The cracking moment can then by found through the expression
Mcr =Ic1 + ηIs1h− x
· fct =2.53 · 108 + 6.67 · 96.4 · 103
150− 75.1· 2.8 = 9.5 kNm
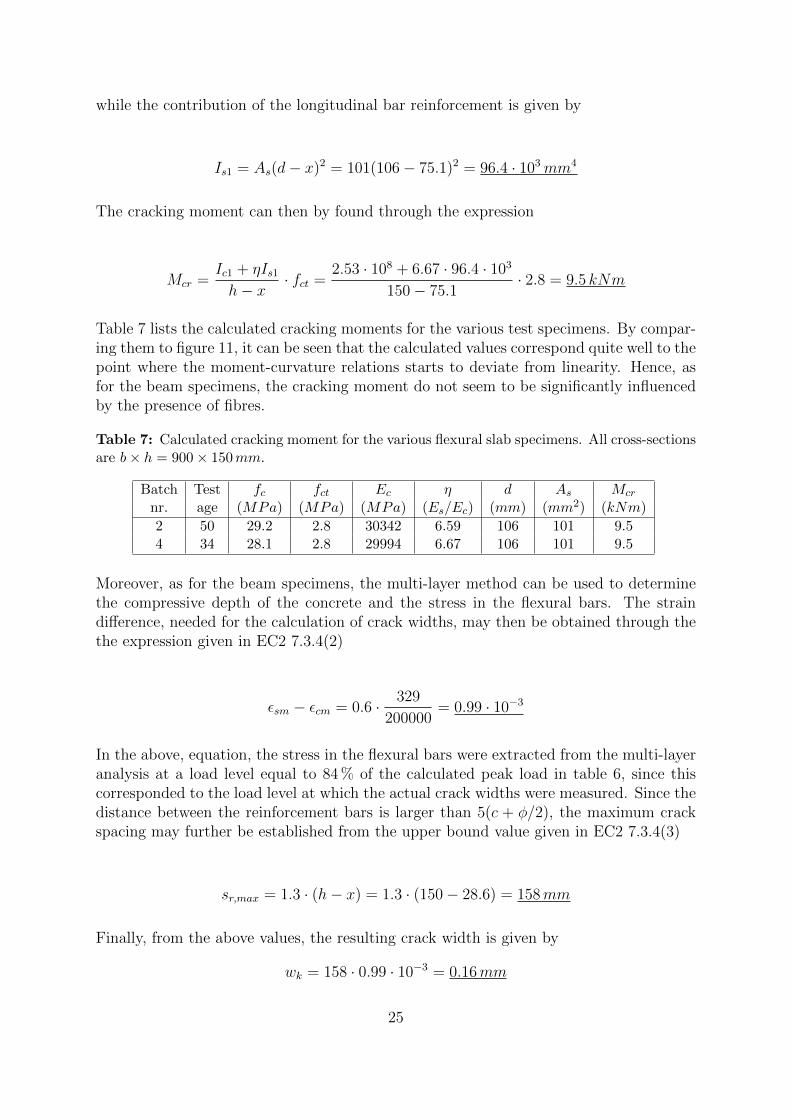
Table 7 lists the calculated cracking moments for the various test specimens. By compar-ing them to figure 11, it can be seen that the calculated values correspond quite well to thepoint where the moment-curvature relations starts to deviate from linearity. Hence, asfor the beam specimens, the cracking moment do not seem to be significantly influencedby the presence of fibres.
Table 7: Calculated cracking moment for the various flexural slab specimens. All cross-sectionsare b× h = 900× 150mm.
Batch Test fc fct Ec η d As Mcr
nr. age (MPa) (MPa) (MPa) (Es/Ec) (mm) (mm2) (kNm)
2 50 29.2 2.8 30342 6.59 106 101 9.54 34 28.1 2.8 29994 6.67 106 101 9.5
Moreover, as for the beam specimens, the multi-layer method can be used to determinethe compressive depth of the concrete and the stress in the flexural bars. The straindifference, needed for the calculation of crack widths, may then be obtained through thethe expression given in EC2 7.3.4(2)
εsm − εcm = 0.6 · 329
200000= 0.99 · 10−3
In the above, equation, the stress in the flexural bars were extracted from the multi-layeranalysis at a load level equal to 84 % of the calculated peak load in table 6, since thiscorresponded to the load level at which the actual crack widths were measured. Since thedistance between the reinforcement bars is larger than 5(c + φ/2), the maximum crackspacing may further be established from the upper bound value given in EC2 7.3.4(3)
sr,max = 1.3 · (h− x) = 1.3 · (150− 28.6) = 158mm
Finally, from the above values, the resulting crack width is given by
wk = 158 · 0.99 · 10−3 = 0.16mm
25

Table 8: Calculated crack widths, at a load level equal to 78 % and 84 of the peak load for thetwo specimens respectively, together with their experimental counterpart. All cross-sections areb× h = 900× 150mm.
Batch fc fct fft,res,2.5 x σs εsm − εcm sr,max wk,COIN wk,expnr. (MPa) (MPa) (MPa) (mm) (MPa) (h) (mm) (mm) (mm)
2 29.2 2.8 1.9 46.9 76.8 0.23 134 0.03 0.164 28.1 2.8 1.5 28.6 329 0.99 158 0.16 0.14
In Table 8 the calculated crack widths are presented together with their measured coun-terpart. The effective height, hc,ef in the calculation of the effective area of concrete intension is governed by the lower limit, hc,ef = h − d + 1.5φ, in EC2clause N.A.7.3.4,whereas the maximum crack spacing is governed by the upper limit sr,max = 1.3(h − x)in EC2 clause 7.3.4(3). It is interesting to note that the while the crack width is wellpredicted for one specimen, the prediction for the other is totally off. This suggests thatthe calculation procedure is not suited for FRC cross-sections with a very low percentageof bar reinforcement, since the calculation of the stress in the flexural bars is all too sen-sitive to the value of the residual tensile strength. Moreover, the average crack spacingwas badly predicted for both specimens: the calculated values were 134/1.7 = 79mmand 158/1.7 = 93mm respectively, while the measured counterparts were 137mm and127mm.
3.3.3 Reinforced SC-HFRC beams designed for shear failure
Experimental load-deflection behaviour
The resulting load-deflection curves for the reinforced SC-HFRC beams designed for shearfailure are given in Figure 12.
.0 5 10 15 20 25 30
0
100
200
300
Load(kN)
Deflection (mm)
Figure 12: Experimental load-deflection curves for the reinforced SC-HFRC beams designedfor shear failure.
26
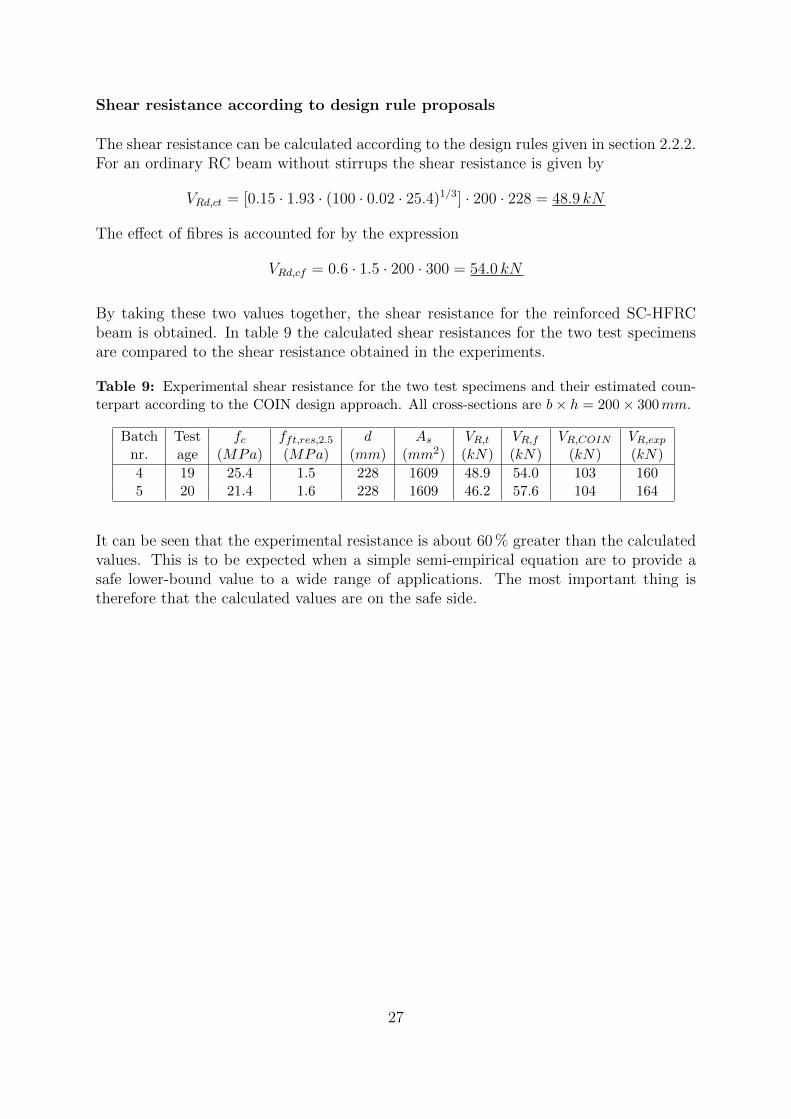
Shear resistance according to design rule proposals
The shear resistance can be calculated according to the design rules given in section 2.2.2.For an ordinary RC beam without stirrups the shear resistance is given by
VRd,ct = [0.15 · 1.93 · (100 · 0.02 · 25.4)1/3] · 200 · 228 = 48.9 kN
The effect of fibres is accounted for by the expression
VRd,cf = 0.6 · 1.5 · 200 · 300 = 54.0 kN
By taking these two values together, the shear resistance for the reinforced SC-HFRCbeam is obtained. In table 9 the calculated shear resistances for the two test specimensare compared to the shear resistance obtained in the experiments.
Table 9: Experimental shear resistance for the two test specimens and their estimated coun-terpart according to the COIN design approach. All cross-sections are b× h = 200× 300mm.
Batch Test fc fft,res,2.5 d As VR,t VR,f VR,COIN VR,expnr. age (MPa) (MPa) (mm) (mm2) (kN) (kN) (kN) (kN)
4 19 25.4 1.5 228 1609 48.9 54.0 103 1605 20 21.4 1.6 228 1609 46.2 57.6 104 164
It can be seen that the experimental resistance is about 60 % greater than the calculatedvalues. This is to be expected when a simple semi-empirical equation are to provide asafe lower-bound value to a wide range of applications. The most important thing istherefore that the calculated values are on the safe side.
27
3.3.4 Estimated residual tensile strength from fibre counting
The actual fibre content in both the En 14651 prisms and the structural test specimens,may be obtained by crushing a given cross-sectional piece to extract the fibres and thensimply weigh the extracted fibres. Then, if the density of the fibres is known, the fibrecontent by volume may easily be calculated for the given piece using the relation ρ = m/V .This has not been done for the specimens in the test program. Hence, the fibre content inthe EN 14651 prisms, νf , and the actual fibre content in the structural members, νf,struct,are assumed to be equal to the nominal fibre content, νf,nom, according to mix design.
The corresponding fibre orientation factors, on the other hand, were determined exper-imentally by counting the fibres crossing one of the sawn surfaces of the cross-sectionalpiece taken out of the member. The procedure was as follows; cover the exposed surfacewith a plastic film; mark the cut fibre cross-sections with a marker; attach a white papersheet to the back of the plastic film for increased contrast and scan it. The number ofdots, i.e. the number of fibres crossing the cross-section, may then be found using animage processing tool or, as a more tedious alternative, by manual counting.
The fibre orientation factor is simply the counted number divided by the the numberof fibres according to the fibre content. Hence, if all the fibres in a cross-section bridgeacross the exposed surface, the fibre orientation factor should be equal to 1. Contrary, ifno fibres bridge across this surface, the fibre orientation factor will be 0. The in-betweencase, α = 0.5, means that the fibres have no preferred direction in the material, i.e. theFRC in the cross-sectional piece taken out of the member is isotropic.
The fibre content of a cross-section is given by the relation
νf =n · AfAc
(18)
By rearranging this equation, the cross-sectional number of fibres according to the fibrecontent may be obtained through the relation
n = νf ·AcAf
(19)
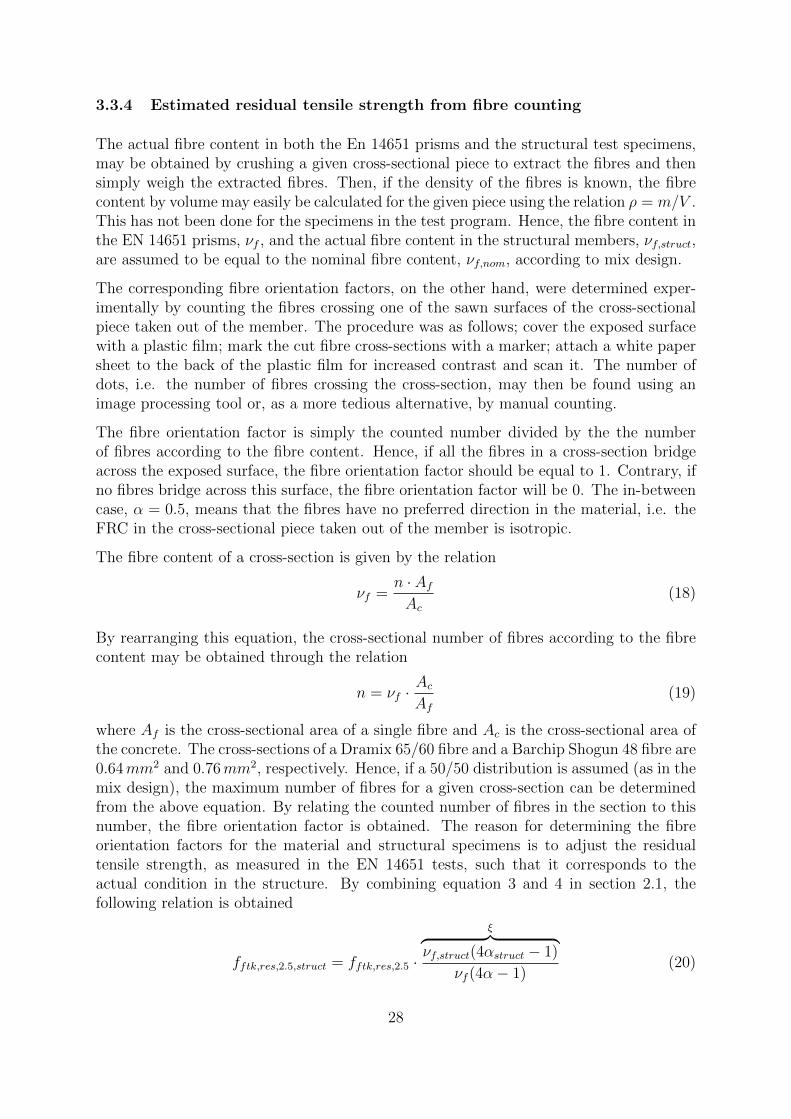
where Af is the cross-sectional area of a single fibre and Ac is the cross-sectional area ofthe concrete. The cross-sections of a Dramix 65/60 fibre and a Barchip Shogun 48 fibre are0.64mm2 and 0.76mm2, respectively. Hence, if a 50/50 distribution is assumed (as in themix design), the maximum number of fibres for a given cross-section can be determinedfrom the above equation. By relating the counted number of fibres in the section to thisnumber, the fibre orientation factor is obtained. The reason for determining the fibreorientation factors for the material and structural specimens is to adjust the residualtensile strength, as measured in the EN 14651 tests, such that it corresponds to theactual condition in the structure. By combining equation 3 and 4 in section 2.1, thefollowing relation is obtained
fftk,res,2.5,struct = fftk,res,2.5 ·
ξ︷ ︸︸ ︷νf,struct(4αstruct − 1)
νf (4α− 1)(20)
28
where the latter term is a factor which account for the different orientation of fibres inthe structure and in the EN 14651 prisms.
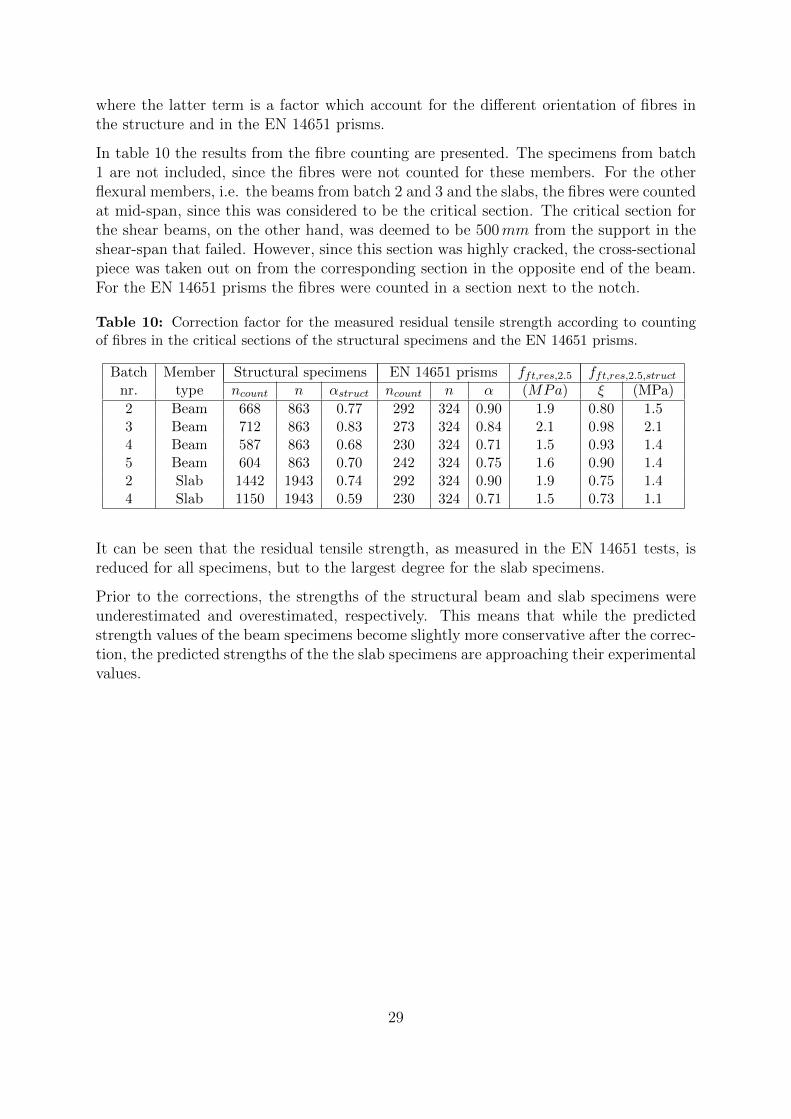
In table 10 the results from the fibre counting are presented. The specimens from batch1 are not included, since the fibres were not counted for these members. For the otherflexural members, i.e. the beams from batch 2 and 3 and the slabs, the fibres were countedat mid-span, since this was considered to be the critical section. The critical section forthe shear beams, on the other hand, was deemed to be 500mm from the support in theshear-span that failed. However, since this section was highly cracked, the cross-sectionalpiece was taken out on from the corresponding section in the opposite end of the beam.For the EN 14651 prisms the fibres were counted in a section next to the notch.
Table 10: Correction factor for the measured residual tensile strength according to countingof fibres in the critical sections of the structural specimens and the EN 14651 prisms.
Batch Member Structural specimens EN 14651 prisms fft,res,2.5 fft,res,2.5,structnr. type ncount n αstruct ncount n α (MPa) ξ (MPa)
2 Beam 668 863 0.77 292 324 0.90 1.9 0.80 1.53 Beam 712 863 0.83 273 324 0.84 2.1 0.98 2.14 Beam 587 863 0.68 230 324 0.71 1.5 0.93 1.45 Beam 604 863 0.70 242 324 0.75 1.6 0.90 1.42 Slab 1442 1943 0.74 292 324 0.90 1.9 0.75 1.44 Slab 1150 1943 0.59 230 324 0.71 1.5 0.73 1.1
It can be seen that the residual tensile strength, as measured in the EN 14651 tests, isreduced for all specimens, but to the largest degree for the slab specimens.
Prior to the corrections, the strengths of the structural beam and slab specimens wereunderestimated and overestimated, respectively. This means that while the predictedstrength values of the beam specimens become slightly more conservative after the correc-tion, the predicted strengths of the the slab specimens are approaching their experimentalvalues.
29

3.4 Conclusions
The motivation behind the test program presented in this section was to investigate ifthe residual tensile strength, as derived from the EN 14651 tests, could be used to predictthe effect of fibres in structural members made of highly ductile SC-HFRC. An importantfinding was that whereas the load-carrying capacity of the flexural beam specimens wasunderestimated, the load-carrying capacity of the flexural slab specimens was overesti-mated. This was not surprising, since a cross-section with a high b/h-ratio is expectedto have a more isotropic fibre distribution due to reduced wall effect.
When the residual tensile strength was corrected for fibre orientation, the predicted mo-ment resistance for the slab specimens approached the experimental value, whereas thepredictions for the beam specimens became slightly more conservative. The predicted re-sistance for the shear beams was about 64 % of the experimental value before correctionand a little less after.
Another interesting finding was that, the moment resistance at the tensile strain limit 3/hfor the flexural beam containing 1.0 vol% fibres was equal to the flexural beam containing2.0 vol% fibres. Hence, the high amount of fibres cannot be justified, at least not whenit comes to the flexural behaviour. However, it should be noted that the 2.0 vol%-mixsegregated during mixing due to excessive use of superplasticizer, which might have ledto an inferior structural behaviour.
Moreover, it was argued that the multi-layer beam model could be used as a tool todetermine the stress in the flexural bars and the compressive depth needed in the crack-width control. By using this procedure, and by adding an extra factor to account for theeffect of fibres in the crack spacing formula, it was shown that the crack widths for theflexural beam specimens could be satisfactorily predicted. However, for the flexural slabspecimens, the amount of steel bars was so low that the stress in these became highlydependent on the actual residual tensile strength of the concrete, which led to more orless arbitrary results.
It should be noted that simple design rules are not expected to be able to fit all experi-mental data. The most important thing is therefore that they are safe for a wide rangeof applications. It is therefore not alarming that some of the estimated values are quiteconservative. Hence, the COIN design approach seems to be provide an adequate set ofrules, at least for the investigated members, with the exception of the lightly reinforcedflexural slab specimens for which the results were non-conservative.
30

4 Reinforced FRC beams with dapped ends
4.1 Introduction
Precast dapped-end RC beams have many useful applications: e.g. as drop-in beamsbetween corbels, as part of beam-to-beam connections or in suspended spans betweencantilevers [10]. Dapped ends enables the construction height of a precast concrete flooror roof structure to be reduced, by recessing the supporting corbel or ledge into the depthof the supported beam and facilitates the erection of a precast concrete structure due tothe greater lateral stability of a dapped member [11]. However, as illustrated in figure 13,the nib at the end of the beam results in a severe stress concentration at the re-entrantcorner. This can initiate diagonal tension cracking at a lower shear than would otherwisebe expected. Hence, if suitable reinforcement is not provided close to the re-entrantcorner, failure can occur with little or no warning [12].
Figure 13: Principal stresses of a symmetric dapped beam under asymmetrical four-pointloading according to elastic analysis using under-integrated quadratic plane-stress elements.The large stress concentrations at the point loads is not representative, since the loading inreality is not that sharp.
Since placing of this reinforcement is laborious and often complicated, it would be highlyadvantageous if some of the traditional bar reinforcement could be substituted by fibres.Although a lot of research exists on the structural performance of FRC, only a fewtests have been conducted to study the performance of dapped-end RC beams withfibres [13],[14],[15],[16]. An experimental program was therefore undertaken to investigatethe effect of fibres on the response of dapped-end RC beams with reduced amount oftraditional bar reinforcement. Moreover, FRC for structural applications has yet to gainwide acceptance due to lack of proper design rules in codes and standards. Hence, a strut-and-tie model (STM), which accounts for the shear-resistance provided by the fibres, isproposed and further validated against the experimental results.
4.2 Experimental program
4.2.1 Brief overview
A series of eight dapped ends were tested to investigate if fibres could be used to simplifythe detailing of precast dapped-end beams. Three types of concrete were included in the
31
test program: an ordinary concrete for reference; a SC-SFRC with 1.0 vol% steel fibres;and a SC-HFRC with 0.75 vol% steel fibers and 0.75 vol% synthetic fibres. The rein-forcement layout was either: (1) according to general practice in the Norwegian precastindustry; (2) with reduced hanger and anchorage reinforcement and no inclined rein-forcement or horizontal stirrups; (3) as previous but without hanger reinforcement; (4)as the second layout but mid-centered to optimise for fibre flow and with a slightly largerdiameter of the hanger reinforcement. The fibre-reinforced specimens of layout 2 and4 performed nearly as well as their conventionally reinforced counterpart, proving thefeasibility of the concept. However, there was almost no difference in behaviour betweenthe two fibre concretes, indicating that steel fibres are to be preferred.
4.2.2 Design according to Norwegian practice
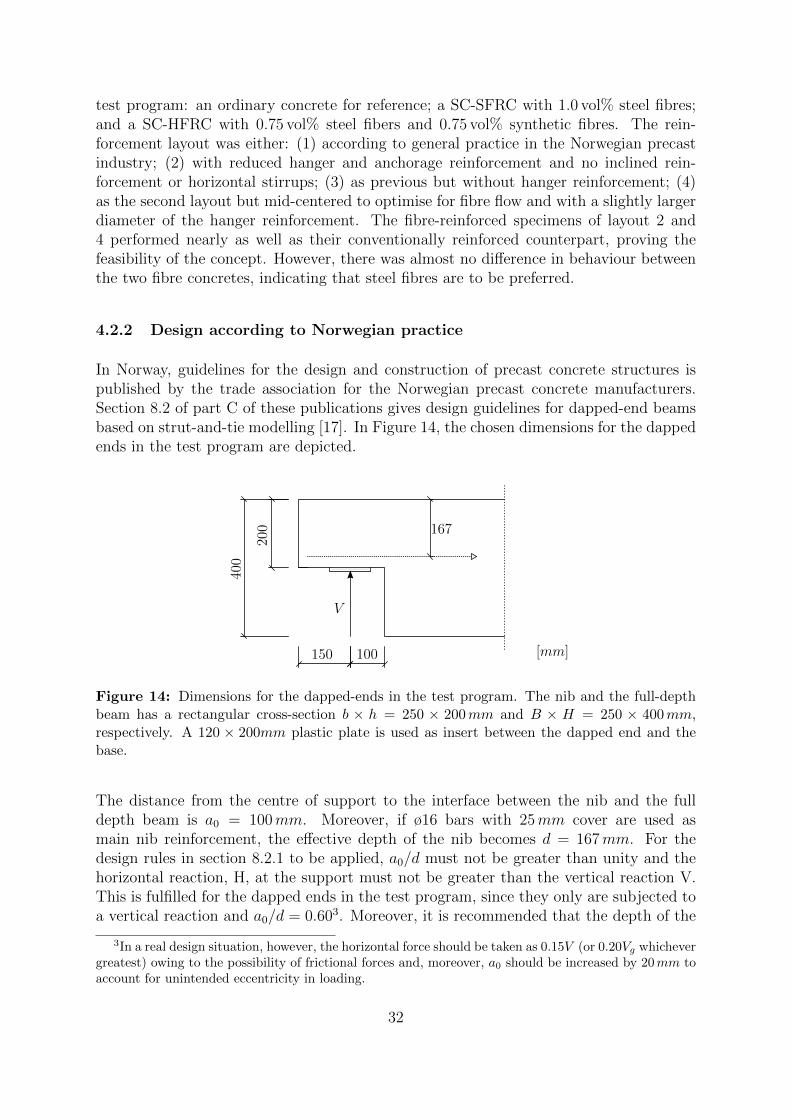
In Norway, guidelines for the design and construction of precast concrete structures ispublished by the trade association for the Norwegian precast concrete manufacturers.Section 8.2 of part C of these publications gives design guidelines for dapped-end beamsbased on strut-and-tie modelling [17]. In Figure 14, the chosen dimensions for the dappedends in the test program are depicted.
167
400
200
V
150 100 [mm]
Figure 14: Dimensions for the dapped-ends in the test program. The nib and the full-depthbeam has a rectangular cross-section b × h = 250 × 200mm and B × H = 250 × 400mm,respectively. A 120 × 200mm plastic plate is used as insert between the dapped end and thebase.
The distance from the centre of support to the interface between the nib and the fulldepth beam is a0 = 100mm. Moreover, if ø16 bars with 25mm cover are used asmain nib reinforcement, the effective depth of the nib becomes d = 167mm. For thedesign rules in section 8.2.1 to be applied, a0/d must not be greater than unity and thehorizontal reaction, H, at the support must not be greater than the vertical reaction V.This is fulfilled for the dapped ends in the test program, since they only are subjected toa vertical reaction and a0/d = 0.603. Moreover, it is recommended that the depth of the
3In a real design situation, however, the horizontal force should be taken as 0.15V (or 0.20Vg whichevergreatest) owing to the possibility of frictional forces and, moreover, a0 should be increased by 20mm toaccount for unintended eccentricity in loading.
32
nib is not less than half the full-depth of the beam and that the length of the nib is lessthan 0.7h. For the chosen dimensions, the former criteria is just satisfied, whereas thelength of the nib is almost twice the recommended value.
Vα
h
l
α
c1
xta
nα
FcA
x
A
B
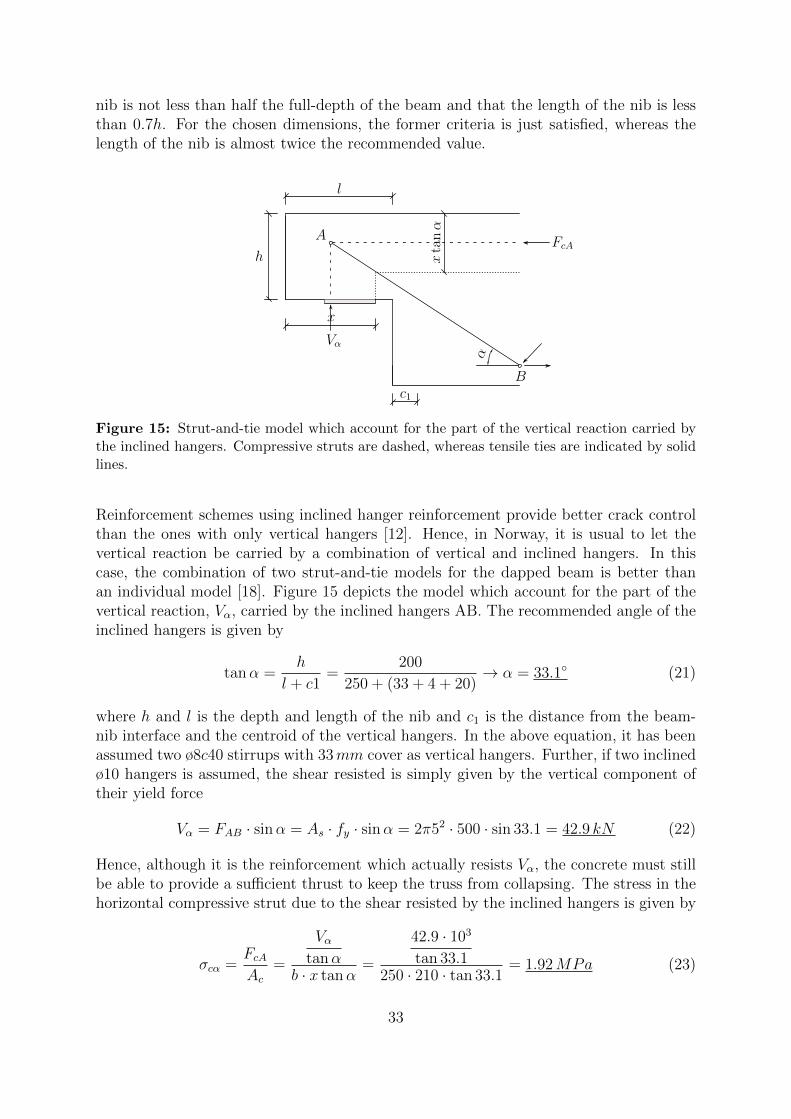
Figure 15: Strut-and-tie model which account for the part of the vertical reaction carried bythe inclined hangers. Compressive struts are dashed, whereas tensile ties are indicated by solidlines.
Reinforcement schemes using inclined hanger reinforcement provide better crack controlthan the ones with only vertical hangers [12]. Hence, in Norway, it is usual to let thevertical reaction be carried by a combination of vertical and inclined hangers. In thiscase, the combination of two strut-and-tie models for the dapped beam is better thanan individual model [18]. Figure 15 depicts the model which account for the part of thevertical reaction, Vα, carried by the inclined hangers AB. The recommended angle of theinclined hangers is given by
tanα =h
l + c1=
200
250 + (33 + 4 + 20)→ α = 33.1◦ (21)
where h and l is the depth and length of the nib and c1 is the distance from the beam-nib interface and the centroid of the vertical hangers. In the above equation, it has beenassumed two ø8c40 stirrups with 33mm cover as vertical hangers. Further, if two inclinedø10 hangers is assumed, the shear resisted is simply given by the vertical component oftheir yield force
Vα = FAB · sinα = As · fy · sinα = 2π52 · 500 · sin 33.1 = 42.9 kN (22)
Hence, although it is the reinforcement which actually resists Vα, the concrete must stillbe able to provide a sufficient thrust to keep the truss from collapsing. The stress in thehorizontal compressive strut due to the shear resisted by the inclined hangers is given by
σcα =FcAAc
=
Vαtanα
b · x tanα=
42.9 · 103
tan 33.1250 · 210 · tan 33.1
= 1.92MPa (23)
33

FcD
a0 c1
u
z
Vvh
C
D
E
F
Figure 16: Strut-and-tie model which account for the part of the vertical reaction carried bythe vertical hangers. Compressive struts are dashed, whereas tensile ties are indicated by solidlines. The horizontal external tensile restraint at node F is provided by the development lengthextension of tie CF [19].
which is well below the compressive strength of the concrete.
Figure 16 depicts the model which account for the part of the vertical reaction, Vvh,carried by the vertical hangers DE. In this case, it is the vertical component of theinclined compression in the nib which resists the shear. However, in order for it to do so,it must be balanced by the tension force in the vertical hangers. Hence, the shear forcethat can be balanced by the two ø8 stirrups is given by
Vvh = FDE = 2 · 2π42 · 500 = 101 kN (24)
which is above 2/3V as recommended [20]. Moreover, the main nib reinforcement mustbe designed so as to balance the outward thrust of the inclined compression leg (and thehorizontal reaction, H, should it exist). If the horizontal strut is taken to be fully utilisedat yield of the vertical hangers, the internal level arm may be approximated as
z ≈ d−Vvh ·
a′︷ ︸︸ ︷(a0 + u
H
V+ c1)
1.6 · b · d · (fc − σcα)= 167− 101 · 103 · (100 + 57)
1.6 · 250 · 167 · (0.85 · 43.2− 1.92)= 160mm
(25)
where the compressive depth has been determined from horizontal equilibrium at D withcompressive strength 0.85fc as defined in EC2 clause 6.5.4(4) and by initially assumingz = 0.8d. The force in the main nib reinforcement corresponding to yield of the verticalhangers is then given by
Fs = FCF +H =Vvh · a′
z+H =
101 · 103 · (100 + 57)
160+ 0 = 99.1 kN (26)
However, in the test specimens, two ø16 bars were used as main nib reinforcement, whichis equivalent to Fs = 2π82 · 500 = 201 kN . This means that the main nib reinforcement
34

is about twice the necessary amount which makes it very unlikely to yield before failureof the dapped end in the tests. Another unwanted failure mode in the tests is failure ofthe inclined compressive leg. This can be checked for by using the formula given in EC2clause 6.2.2(6) as follows
Vmax = 0.5 · bw · d · ν · fc = 0.5 · 250 · 167 · 0.6(
1− 43.2
250
)· 43.2 = 448 kN < V (27)
where the softening effect due to transverse tensile stress is accounted for by the factor ν.Further, to avoid a premature diagonal tension or ‘diagonal splitting’ failure of the nib,horizontal stirrups or ties should be placed in an amount equal to
Ah = 0.5 · As = 0.5 · FCFfy
= 0.5 · 99.1 · 103
500= 99.1mm2 (28)
In the reference beam, two u-shaped ø8c50 closed ties were used, which is twice therecommended amount. Moreover, one u-shaped ø8 tie were used to secure proper endanchorage of the vertical hangers, which corresponds to half the suggested value
Ase = Avh =Vvhfy
=101 · 103
500= 202mm2 (29)
Figure 19 depicts the resulting reinforcement layout. The dapped-end reinforcement isas described in the calculations, whereas three ø25 bars with 33mm cover is used asbeam flexural reinforcement, two ø8 bars with 33mm cover is used as beam compressivereinforcement, and six ø8c250 stirrups is used as beam shear reinforcement. In addition,one ø8 stirrup is placed at the end of the main nib reinforcement for mounting purposes.The main-nib reinforcement is welded to a crossbar at the left end in order to prevent iffrom slipping in the concrete.
Figure 17: Reinforcement layout according to common practice in the Norwegian precastindustry. The steel wire is a lifting hoop used when moving the specimens.
35
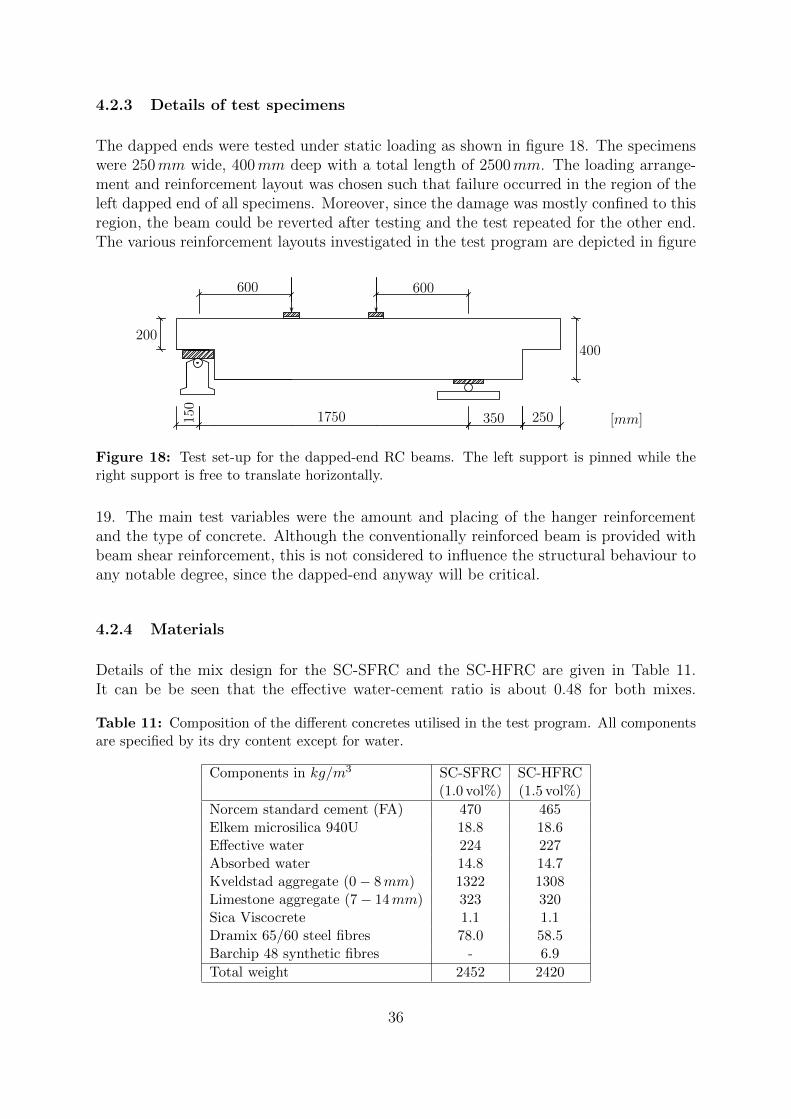
4.2.3 Details of test specimens
The dapped ends were tested under static loading as shown in figure 18. The specimenswere 250mm wide, 400mm deep with a total length of 2500mm. The loading arrange-ment and reinforcement layout was chosen such that failure occurred in the region of theleft dapped end of all specimens. Moreover, since the damage was mostly confined to thisregion, the beam could be reverted after testing and the test repeated for the other end.The various reinforcement layouts investigated in the test program are depicted in figure
200400
150
2501750 350
600 600
[mm]
Figure 18: Test set-up for the dapped-end RC beams. The left support is pinned while theright support is free to translate horizontally.
19. The main test variables were the amount and placing of the hanger reinforcementand the type of concrete. Although the conventionally reinforced beam is provided withbeam shear reinforcement, this is not considered to influence the structural behaviour toany notable degree, since the dapped-end anyway will be critical.
4.2.4 Materials
Details of the mix design for the SC-SFRC and the SC-HFRC are given in Table 11.It can be be seen that the effective water-cement ratio is about 0.48 for both mixes.
Table 11: Composition of the different concretes utilised in the test program. All componentsare specified by its dry content except for water.
Components in kg/m3 SC-SFRC SC-HFRC(1.0 vol%) (1.5 vol%)
Norcem standard cement (FA) 470 465Elkem microsilica 940U 18.8 18.6Effective water 224 227Absorbed water 14.8 14.7Kveldstad aggregate (0− 8mm) 1322 1308Limestone aggregate (7− 14mm) 323 320Sica Viscocrete 1.1 1.1Dramix 65/60 steel fibres 78.0 58.5Barchip 48 synthetic fibres - 6.9
Total weight 2452 2420
36

A
B
C
D
2ø10 inclined hangers
2ø8 vertical hangers*
1ø8 end anchorage*
2ø16 main nib bars
2ø8 horizontal stirrups*
1ø8 vertical hangers*
1ø8 end anchorage*
2ø16 main nib bars
1ø8 end anchorage*
2ø16 main nib bars
1ø12 vertical hangers*
1ø8 end anchorage*
2ø16 main nib bars
SC − SFRC
SC-HFRC
C40/50
SC-SFRC
SC-HFRC
SC-SFRC
SC-HFRC
SC-SFRC
C40/50
Figure 19: Variables investigated investigated in the test program. The dapped-end rein-forcement and the type of concrete varied as described in the text, whereas the beam beamreinforcement (except for the beam shear reinforcement) remained constant. Reinforcementmarked with a star indicates that it is stirrups (i.e. double-legged reinforcement).
Dramix 65/60 is a cold drawn steel wire fibre with hooked ends (length l = 60mm,aspect ratio l/d = 67, tensile strength σt = 1000MPa), whereas Barchip shogun isa synthetic polymeric fibre with embossed surface texture (length l = 48mm, tensilestrength σt = 550MPa, Youngs modulus E = 10GPa). Sica Viscocrete is a high rangewater reducing superplasticizer. It was added in an amount corresponding to 1.6 % ofthe cement weight, i.e. about 7.5 kg/m3. Its dry content is about 15 %. Hence, in table11 the amount is given as 0.016 · 470 · 0.15 = 1.1 kg/m3. The remaining water is includedin the effective water.
37

4.2.5 Testing of specimens
All specimens were tested under four-point loading, as shown in figure 18, using a 1000 kNcapacity hydraulic jack. The loading was displacement controlled at a rate of 0.008mm/s.To measure the load applied to the spreader beam, the load cell of the testing machine wasused. A linear voltage differential transducer (LVDT) was used to measure the verticaldeflection midway between the supports, allowing the overall load-deflection behaviour ofthe specimens to be determined. Moreover, electrical resistance strain gauges were usedto measure the strain in the main nib reinforcement and the hangers, such that the forcein these bars were known at any time.
4.3 Experimental results
4.3.1 Shear resistance versus strut-and-tie models
As already explained, the nib result in a in a significant disturbance of the flow of theinternal forces at the dapped-ends. Hence, the STM truss analogy is used to model thebehaviour of the dapped-ends, in which struts represents the concrete compressive stressfields and ties normally represent one or several layers of reinforcement. However, the tiesmay also alternatively represent a concrete tensile stress field [18], i.e. the effect of fibresmay be modelled by a tie which accounts for the bridging effect of the fibres through theresidual tensile strength.
Figure 20: Close-up of the principal stress results from the elastic analysis in figure 13. Theblue band represent the concrete tensile stress field which is effected through the residual tensilestrength of the concrete.
In figure 20, a close-up of the flow of forces in the dapped-ends according to the elasticanalysis in figure 13 is shown. From this, a fibre concrete tie at arctan (h/l) = 39◦ to thehorizontal axis may be assumed. The thickness of the band may be taken as h/(2H)=0.25of the length of the (90 − 38.7) = 51.3◦ diagonal from the re-entrant corner to the topface of the beam. Hence, a model similar to that in figure 15 may be proposed, but with
38
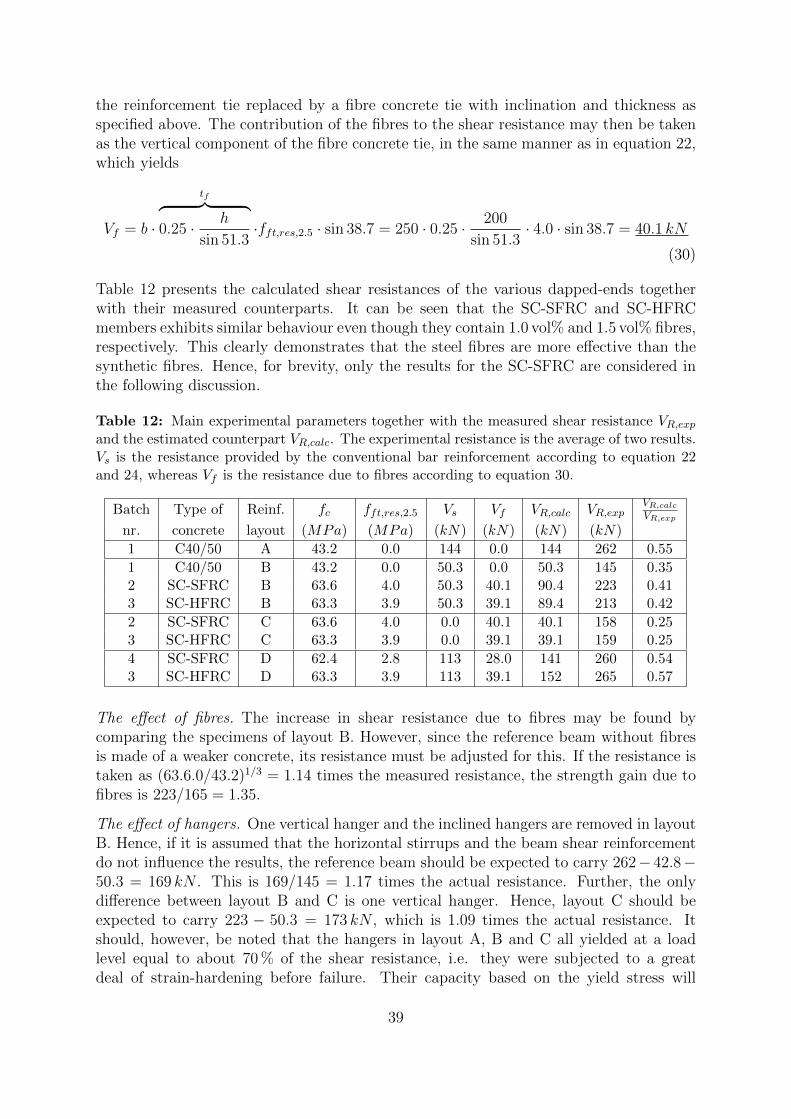
the reinforcement tie replaced by a fibre concrete tie with inclination and thickness asspecified above. The contribution of the fibres to the shear resistance may then be takenas the vertical component of the fibre concrete tie, in the same manner as in equation 22,which yields
Vf = b ·
tf︷ ︸︸ ︷0.25 · h
sin 51.3·fft,res,2.5 · sin 38.7 = 250 · 0.25 · 200
sin 51.3· 4.0 · sin 38.7 = 40.1 kN
(30)
Table 12 presents the calculated shear resistances of the various dapped-ends togetherwith their measured counterparts. It can be seen that the SC-SFRC and SC-HFRCmembers exhibits similar behaviour even though they contain 1.0 vol% and 1.5 vol% fibres,respectively. This clearly demonstrates that the steel fibres are more effective than thesynthetic fibres. Hence, for brevity, only the results for the SC-SFRC are considered inthe following discussion.
Table 12: Main experimental parameters together with the measured shear resistance VR,expand the estimated counterpart VR,calc. The experimental resistance is the average of two results.Vs is the resistance provided by the conventional bar reinforcement according to equation 22and 24, whereas Vf is the resistance due to fibres according to equation 30.
Batch Type of Reinf. fc fft,res,2.5 Vs Vf VR,calc VR,expVR,calc
VR,exp
nr. concrete layout (MPa) (MPa) (kN) (kN) (kN) (kN)
1 C40/50 A 43.2 0.0 144 0.0 144 262 0.55
1 C40/50 B 43.2 0.0 50.3 0.0 50.3 145 0.352 SC-SFRC B 63.6 4.0 50.3 40.1 90.4 223 0.413 SC-HFRC B 63.3 3.9 50.3 39.1 89.4 213 0.42
2 SC-SFRC C 63.6 4.0 0.0 40.1 40.1 158 0.253 SC-HFRC C 63.3 3.9 0.0 39.1 39.1 159 0.25
4 SC-SFRC D 62.4 2.8 113 28.0 141 260 0.543 SC-HFRC D 63.3 3.9 113 39.1 152 265 0.57
The effect of fibres. The increase in shear resistance due to fibres may be found bycomparing the specimens of layout B. However, since the reference beam without fibresis made of a weaker concrete, its resistance must be adjusted for this. If the resistance istaken as (63.6.0/43.2)1/3 = 1.14 times the measured resistance, the strength gain due tofibres is 223/165 = 1.35.
The effect of hangers. One vertical hanger and the inclined hangers are removed in layoutB. Hence, if it is assumed that the horizontal stirrups and the beam shear reinforcementdo not influence the results, the reference beam should be expected to carry 262− 42.8−50.3 = 169 kN . This is 169/145 = 1.17 times the actual resistance. Further, the onlydifference between layout B and C is one vertical hanger. Hence, layout C should beexpected to carry 223 − 50.3 = 173 kN , which is 1.09 times the actual resistance. Itshould, however, be noted that the hangers in layout A, B and C all yielded at a loadlevel equal to about 70 % of the shear resistance, i.e. they were subjected to a greatdeal of strain-hardening before failure. Their capacity based on the yield stress will
39
therefore tend to underestimate the hanger contribution. If this is accounted for, it canbe claimed that the resistance of the dapped-ends are closely related to the amount ofhanger reinforcement.
The effect of mid-centred-layout. If there is no beneficial effect of the mid-centred layout,the specimens of layout D is expected to carry 158 + 113 = 271 kN (or more due tostrain-hardening of the hangers). The measured resistance was actually lower than this.Hence, the ‘optimised’ layout seems to perform worse than a corresponding ordinarylayout. The reason for this might be due to the fact that the force which is lifted up bythe hanger is concentrated over a smaller area. The compressive zone then becomes morehighly stressed, which might have caused a premature failure. Actually, Robinson et al.[16] have argued that the effective width of the concrete strut should be taken as thatconfined by the stirrups, i.e. the distance between the centreline of the reinforcementbars, and not the full width of the beam. This is supported by the fact that the collapseof the layout D beams was caused by failure of the concrete, and not the hangers as forthe other layouts. Hence, although the mid-centred layout may be beneficial from a fibrepoint of view, it might in total come out worse due to a smaller effective width of thecompressive struts.
The effect of the concrete. From table 12, it can be seen that the calculated resistances arevery conservative, especially for the layouts containing a small amount of reinforcement.This is to be expected, since the concrete contribution is omitted in the calculations.According to the experiments, the concrete term can be estimated as 145− 50.3 · 1.10 =90 kN (if 10 % strain-hardening of the hanger is assumed) for the C40/50 concrete whichcorresponds to about 90 · 1.14 = 103 kN for the SC-SFRC. If this value is added to thecalculations, the estimated values will match the experiments.
The shear force at cracking. Werner and Dilger [21] suggested that the shear force exist-ing when cracking occurs at the re-entrant corner can be taken as the shear force whichcontinues to be resisted by the concrete. The shear force was determined from an elasticfinite-element analysis by taking the average of the stresses at the corners of the threeelements which are connected at the re-entrant corner and comparing it to the tensilestrength of the concrete. This procedure will of course be a bit arbitrary, since it de-pends on the mesh configuration. In figure 13, the mesh for a dapped beam of the samedimensions as the test specimens is shown. The size of the elements are 50 × 50mm,which are about three times the maximum size of the aggregate, i.e. about the size whichis used to determine the tensile strength. If this configuration is utilised in the analysisand the tensile stress is taken as the average of the three integration points closest to there-entrant corner, the shear force at cracking becomes 40 kN (if the tensile strength istaken as ft = 0.30 · 43.22/3 = 3.69MPa). This corresponds quite well to the shear forcewhen the cracks were detected in the tests, which was typically around 50 kN . However,the concrete contribution according to the experiments is about twice this value. Thereason for this is probably that the load is applied sufficiently close to the support toallow the concrete to carry a significant load after cracking by arch action.
The effect of the residual tensile strength. Although the residual tensile strength, as de-rived from the EN 14651 tests, is only 2.8MPa for the SC-SFRC beam of layout D, itdoes not seem to affect the experimental load-carrying capacity. The reason for this is
40

probably that the fibre orientation in this case was much more favourable in the structurecompared to that of the EN 14651 tests.
4.3.2 Load-deflection behaviour
In figure 21, the load-deflection behaviour for the SC-SFRC members are compared tothe reference beam. It can be seen that all SC-SFRC members exhibits rather ductilebehaviour, but they are not quite as ductile as the reference beam. However, it is in-teresting to note that the SC-SFRC beams of layout C, i.e. the ones with no hangerreinforcement, do not suffer a brittle failure but exhibits a gradual decay of load-carryingcapacity. This means that it may be possible to skip the hanger reinforcement in lightlyloaded dapped-end RC beams if they are made of ductile fibre-reinforced concrete.
.0 2 4 6 8 10 12 14
0
50
100
150
200
250
300
Shearforce(kN)
Deflection at point mid-span (mm)
C40/50 Layout ASC-SFRC Layout BSC-SFRC Layout CSC-SFRC Layout D
Figure 21: Shear force versus deflection at mid-span for the SC-SFRC members compared tothe reference beam. Only the results for one of the dapped ends are shown for layout A and Bdue to to errors in testing.
Further, it can be seen that by adding one ø8 hanger to layout C (which gives layout B)the shear resistance goes up by 65 kN , which is a little more than the capacity of thehanger. However, if a mid-centered ø12 hanger is added to layout C (which gives layoutD if the remaining reinforcement is also mid-centred), the capacity goes up by 102 kN ,which is a little less than the capacity of the hanger. It therefore seems that the mid-centred layout is unfavourable when it comes to shear resistance, as already mentionedin the previous section. The ductility, on the other hand, seems to be enhanced.
4.4 Conclusions
The behaviour of the SC-SFRC and SC-HFRC members was similar even though theformer contained 1.0 vol% steel fibres and the latter contained 1.5 vol% steel and syntheticfibres in a 50/50 mix. This clearly demonstrates that the steel fibres are more effective
41

than the synthetic fibres, which is maybe not that surprising, since it is well-known thatsteel fibres are to be preferred when it comes to shear-resistance.
The strength gain due to fibres was about 50 kN , which corresponds to that of a ø8vertical stirrup used as hanger reinforcement. Hence, the potential benefits of fibres liesnot so much in its contribution to the strength, but is more related to the possibility ofremoving secondary reinforcement and the beam shear reinforcement, which might leadto a much less labour-intensive production of the precast elements.
The estimated shear resistance of the dapped-ends was almost directly related to thecapacity of the hanger reinforcement. This indicates that the strut-and-tie models usedin the calculations are adequate. The deviations between the experimental and calculatedvalues were therefore believed to be partly due to the neglect of the strain-hardening ofthe steel bars, but foremost a result of the neglect of the concrete contribution to theshear resistance.
Another important observation was that the mid-centred reinforcement layout, which wasexpected to be very favourable, actually performed worse than expected for an ordinarylayout. This might have been due to the fact that a mid-centred layout tend to concentratethe force which are lifted up by the hanger, which might have caused a premature failureof the compressive struts.
It is also interesting to note that the fibre-reinforced dapped-end without hanger rein-forcement did not suffer a brittle failure. This means that it may be possible to skip thehanger reinforcement in lightly loaded dapped-end RC beams if they are made of ductilefibre-reinforced concrete.
The proposed strut-and-tie model, which accounts for the effect of fibres, led to goodpredictions for the dapped-ends in the tests. This is maybe not so impressive, sinceit merely could have been ‘tuned’ to fit the rather limited amount of data in the testprogram. Hence, in order to evaluate the the tentative model presented herein, moreexperimental data is needed. This is the subject of a future article.
42
References
[1] www.coinweb.no.
[2] T. Kanstad et al. Forslag til retningslinjer for dimensjonering, utførelse og kontrollav fiberarmerte konstruksjoner (in norwegian). COIN Project report 29, 2011.
[3] O. S. Nordhus, E. Steinnes, and T. Simpson. Fibre reinforced concrete structure: Useof self compacting ductile fibre reinforced concrete in beams and slabs (in norwegian).Master’s thesis, Norwegian University of Science and Technology, 2011.
[4] T. Backe-Hansen and B. Hamstad. Fibre reinforced concrete structures: Testingof prefabricated beams with dapped beam end (in norwegian). Master’s thesis,Norwegian University of Science and Technology, 2011.
[5] H. Vikan. Concrete workability and fibre content. SINTEF report, SBF BK A07029,2007.
[6] NS-EN 1992-1-1:2004+NA:2008. Eurocode 2: Design of concrete structures. part1-1: General rules and rules for buildings. Standard Norge, 2008.
[7] NS-EN 14651:2005+A1:2007. Test method for metallic fibre concrete. StandardNorge, 2007.
[8] D. Hordijk. Local approach to fatigue of concrete. PhD thesis, Delft University ofTechnology, 1991.
[9] A. L. Døssland. Fibre reinforcement in load carrying concrete strutures. PhD thesis,Norwegian University of Science and Technology, 2008.
[10] W-Y Lu, I-J Lin, S-J Hwang, and Y-H Lin. Shear strength of high-strength concretedapped-end beams. Journal of the Chinese Institute of Engineers, 26(5):671–680,2003.
[11] A.H. Mattock and T.C. Chan. Design and behavior of dapped-end beams. PCIJournal, 24(6):28–45, 1979.
[12] A.H. Mattock and T.S. Theryo. Strength of precast prestressed concrete memberswith dapped ends. PCISFRAD Project No. 6, 1986.
[13] J.M. Ajina. Effect of steel fibers on precast dapped-end beam connections. Master’sthesis, South Dakota State University, 1986.
[14] Z. Fu. Use of fibre and headed bars in dapped end beams. Master’s thesis, McGillUniversity, 2004.
[15] R.N. Mohamed and K.S. Elliott. Shear strength of short recess precast dappedend beams made of steel fibre self-compacting concrete. 33rd Conference on OURWORLD IN CONCRETE & STRUCTURES: 25-27 August, 2008.
[16] G.P. Robinson, A. Palermi, and S.A. Austin. Influence of steel fibre, used in conjuc-tion with unconfined rebar configurations, on the structural performance of precastelements. BEFIB 2012 - Fibre reinforced concrete, 2012.
43

[17] Betongelementboken - Bind C: Elementer og knutepunkter. Betongelementforenin-gen, 2006.
[18] J. Schlaich and K. Schafer. Design and detailing of structural concrete using strut-and-tie models. The structural engineer, 69(6):113–125, 1991.
[19] A.H. Mattock. Strut-and-tie models for dapped-end beams. Concrete International,pages 35–40, February 2012.
[20] A. Steinle and F.S. Rostasy. Zum tragverhalten ausgeklinkter tragerenden. Beton-werk Fertigteil-Technik, 41(6/7), 1975.
[21] M.P. Werner and W.H. Dilger. Shear design od prestressed concrete stepped beams.PCI Journal, 18(4):37–49, 1973.
44

Appendix A MatLab Code for multi-layer analysis
1 f unc t i on [ f ,m, slam , slam1 , x , curv ] = mu l t i l ay e r ( ebot , etop )2
3 % −−−−−−−−−−−−−−−−−−−−−−−−−−−−−−−−−−−−−−−−−−−−−−−4 % H. Nedre l id 02 .06 .20135 % −−−−−−−−−−−−−−− INPUT −−−−−−−−−−−−−−−−−−−−−−−−−6 % fc = concre t e c y l i nd e r s t r ength7 % f r e s = concre t e r e s i d u a l t e n s i l e s t r ength8 % Es = Youngs modulus o f s t e e l bars9 % fy = y i e l d s t r e s s o f s t e e l bars
10 % nlam = number o f l a y e r e s11 % b = width o f c ros s−s e c t i o n12 % h = he ight o f c ros s−s e c t i o n13 % c1 = cover to t e n s i l e bars14 % c2 = cover to compress ive bars15 % n1 = number o f t e n s i l e bars16 % n2 = number o f compress ive bars17 % −−−−−−−−−−−−−−− OUTPUT −−−−−−−−−−−−−−−−−−−−−−−−18 % f = ax i a l f o r c e19 % m = moment20 % slam = s t r e s s in conc re t e l a y e r s21 % slam1 = s t r e s s in t e n s i l e bars22 % x = compress ive depth o f conc r e t e23 % curv = curvature24 % −−−−−−−−−−−−−−−−−−−−−−−−−−−−−−−−−−−−−−−−−−−−−−−25
26 mul t i l ay e r i nput27
28 % CONCRETE PROPERTIES29 i f f c <= 5030 f t = 0 .30∗ ( f c ) ˆ(2/3) ;31 e l s e i f f c > 5032 f t = 2.12∗ l og (1+( f c /10) ) ;33 end34 Ec = (22∗ ( ( f c ) /10) ˆ0 . 3 ) ∗1000 ;35 i f f c <= 5036 ec2 = −2.0/1000;37 ecu2 = −3.5/1000;38 n = 2 . 0 ;39 e l s e i f f c > 5040 ec2 = −(2.0+0.085∗( fc −50) ˆ ( 0 . 5 3 ) ) /1000 ;41 ecu2 = −(2.6+35∗((90− f c ) /100) ˆ4) /1000 ;42 n = 1.4+23.4∗((90− f c ) /100) ˆ4 ;43 end44 i f f r e s > f t45 f t = f r e s ;46 end47
48 % REINFORCEMENT PROPERTIES49 As1 = n1∗ pi ∗( d1 /2) ˆ2 ;50 As2 = n2∗ pi ∗( d2 /2) ˆ2 ;51
52 % INITIAL CALCULATIONS53 d = h−c1−d1 /2 ;54 h1 = h−d ;55 i f n2>056 h2 = c2+n2 /2 ;57 e l s e58 h2 = 0 ;59 end60 curv = ( ebot−etop ) /h ;61 i f curv == 062 x = 0 ;63 e l s e64 x = ( abs ( etop ) ∗h) /( ebot−etop ) ;65 end66
45
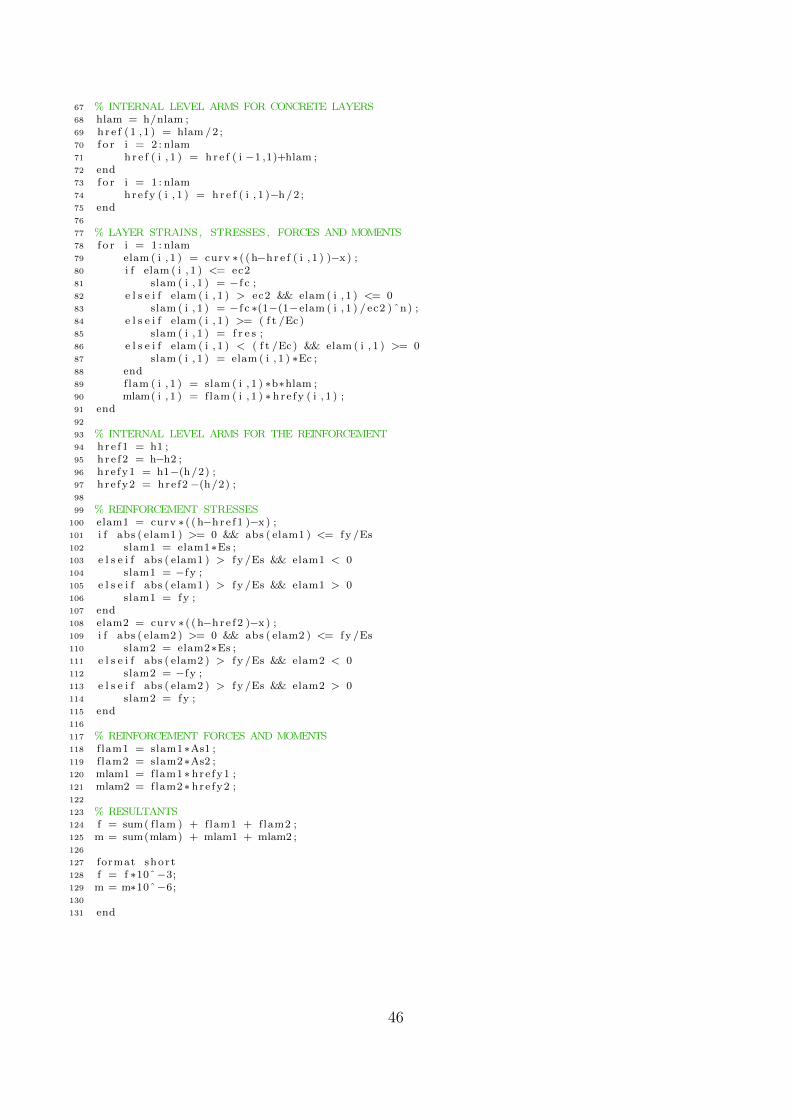
67 % INTERNAL LEVEL ARMS FOR CONCRETE LAYERS68 hlam = h/nlam ;69 hr e f ( 1 , 1 ) = hlam /2 ;70 f o r i = 2 : nlam71 hr e f ( i , 1 ) = hr e f ( i −1 ,1)+hlam ;72 end73 f o r i = 1 : nlam74 hre fy ( i , 1 ) = hr e f ( i , 1 )−h/2 ;75 end76
77 % LAYER STRAINS, STRESSES, FORCES AND MOMENTS78 f o r i = 1 : nlam79 elam ( i , 1 ) = curv ∗ ( ( h−hr e f ( i , 1 ) )−x ) ;80 i f elam ( i , 1 ) <= ec281 slam ( i , 1 ) = −f c ;82 e l s e i f elam ( i , 1 ) > ec2 && elam ( i , 1 ) <= 083 slam ( i , 1 ) = −f c ∗(1−(1−elam ( i , 1 ) / ec2 ) ˆn) ;84 e l s e i f elam ( i , 1 ) >= ( f t /Ec)85 slam ( i , 1 ) = f r e s ;86 e l s e i f elam ( i , 1 ) < ( f t /Ec) && elam ( i , 1 ) >= 087 slam ( i , 1 ) = elam ( i , 1 ) ∗Ec ;88 end89 f lam ( i , 1 ) = slam ( i , 1 ) ∗b∗hlam ;90 mlam( i , 1 ) = flam ( i , 1 ) ∗ hre fy ( i , 1 ) ;91 end92
93 % INTERNAL LEVEL ARMS FOR THE REINFORCEMENT94 hre f 1 = h1 ;95 hre f 2 = h−h2 ;96 hre fy1 = h1−(h/2) ;97 hre fy2 = href2 −(h/2) ;98
99 % REINFORCEMENT STRESSES100 elam1 = curv ∗ ( ( h−hre f 1 )−x ) ;101 i f abs ( elam1 ) >= 0 && abs ( elam1 ) <= fy /Es102 slam1 = elam1∗Es ;103 e l s e i f abs ( elam1 ) > fy /Es && elam1 < 0104 slam1 = −fy ;105 e l s e i f abs ( elam1 ) > fy /Es && elam1 > 0106 slam1 = fy ;107 end108 elam2 = curv ∗ ( ( h−hre f 2 )−x ) ;109 i f abs ( elam2 ) >= 0 && abs ( elam2 ) <= fy /Es110 slam2 = elam2∗Es ;111 e l s e i f abs ( elam2 ) > fy /Es && elam2 < 0112 slam2 = −fy ;113 e l s e i f abs ( elam2 ) > fy /Es && elam2 > 0114 slam2 = fy ;115 end116
117 % REINFORCEMENT FORCES AND MOMENTS118 f lam1 = slam1∗As1 ;119 f lam2 = slam2∗As2 ;120 mlam1 = flam1∗ hre fy1 ;121 mlam2 = flam2∗ hre fy2 ;122
123 % RESULTANTS124 f = sum( flam ) + flam1 + flam2 ;125 m = sum(mlam) + mlam1 + mlam2 ;126
127 format shor t128 f = f ∗10ˆ−3;129 m = m∗10ˆ−6;130
131 end
46
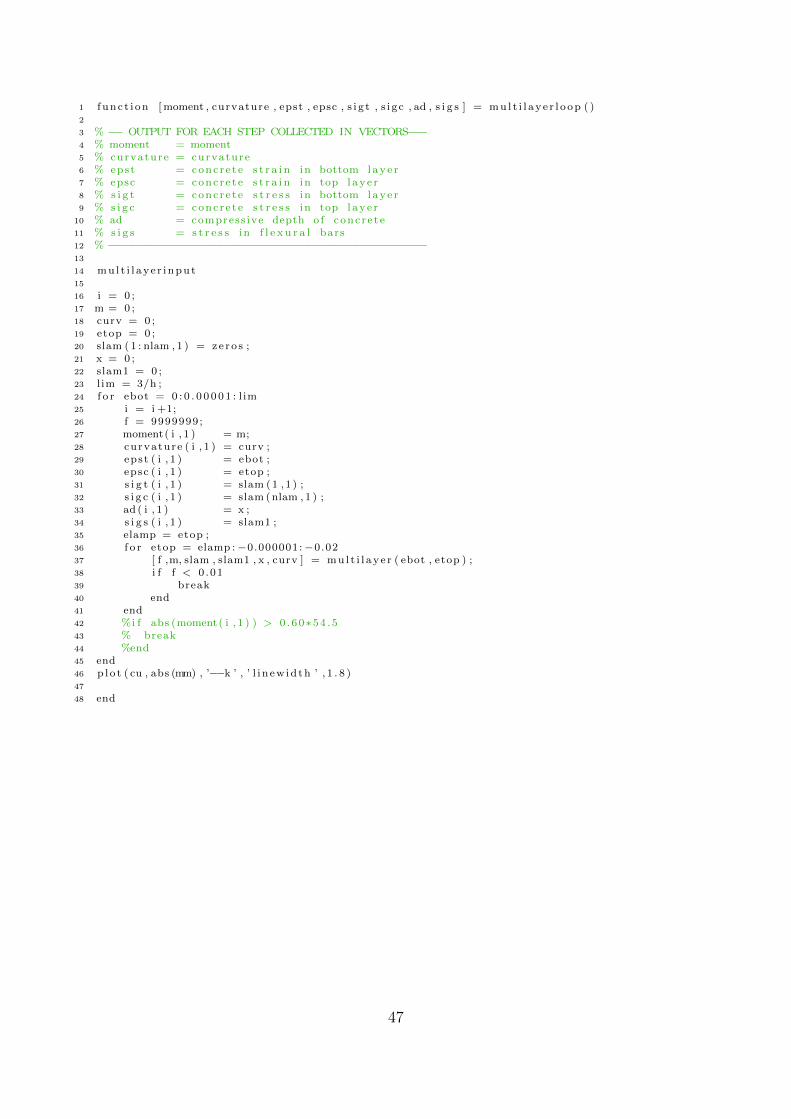
1 f unc t i on [moment , curvature , epst , epsc , s i g t , s i g c , ad , s i g s ] = mu l t i l ay e r l o op ( )2
3 % −− OUTPUT FOR EACH STEP COLLECTED IN VECTORS−−−4 % moment = moment5 % curvature = curvature6 % epst = concre t e s t r a i n in bottom lay e r7 % epsc = concre t e s t r a i n in top l ay e r8 % s i g t = concre t e s t r e s s in bottom lay e r9 % s i g c = concre t e s t r e s s in top l ay e r
10 % ad = compress ive depth o f conc r e t e11 % s i g s = s t r e s s in f l e x u r a l bars12 % −−−−−−−−−−−−−−−−−−−−−−−−−−−−−−−−−−−−−−−−−−−−−−−13
14 mul t i l ay e r i nput15
16 i = 0 ;17 m = 0 ;18 curv = 0 ;19 etop = 0 ;20 slam ( 1 : nlam , 1 ) = ze ro s ;21 x = 0 ;22 slam1 = 0 ;23 l im = 3/h ;24 f o r ebot = 0 : 0 . 0 0 0 0 1 : l im25 i = i +1;26 f = 9999999;27 moment( i , 1 ) = m;28 curvature ( i , 1 ) = curv ;29 epst ( i , 1 ) = ebot ;30 epsc ( i , 1 ) = etop ;31 s i g t ( i , 1 ) = slam (1 , 1 ) ;32 s i g c ( i , 1 ) = slam (nlam , 1 ) ;33 ad ( i , 1 ) = x ;34 s i g s ( i , 1 ) = slam1 ;35 elamp = etop ;36 f o r etop = elamp :−0.000001:−0.0237 [ f ,m, slam , slam1 , x , curv ] = mu l t i l ay e r ( ebot , etop ) ;38 i f f < 0 .0139 break40 end41 end42 %i f abs (moment( i , 1 ) ) > 0 . 60∗54 . 543 % break44 %end45 end46 p lo t ( cu , abs (mm) , ’−−k ’ , ’ l i n ew id th ’ , 1 . 8 )47
48 end
47

SINTEF Building and Infrastructure is the third largest building research institute in Europe. Our objective is to promote environmentally friendly, cost-effective products and solutions within the built environment. SINTEF Building and Infrastructure is Norway’s leading provider of research-based knowledge to the construction sector. Through our activity in research and development, we have established a unique platform for disseminating knowledge throughout a large part of the construction industry.
COIN – Concrete Innovation Center is a Center for Research based Innovation (CRI) initiated by the Research Council of Norway. The vision of COIN is creation of more attractive concrete buildings and constructions. The primary goal is to fulfill this vision by bringing the development a major leap forward by long-term research in close alliances with the industry regarding advanced materials, effi-cient construction techniques and new design concepts combined with more environmentally friendly material production.
Technology for a better society www.sintef.no