striped catfish farming in the mekong delta: vulnerability to development & climate change
TRANSCRIPT
Striped catfish farming in the Mekong Delta:
Vulnerability to development & climate change
Ashley S. Halls, Matthew Johns & Anton Immink
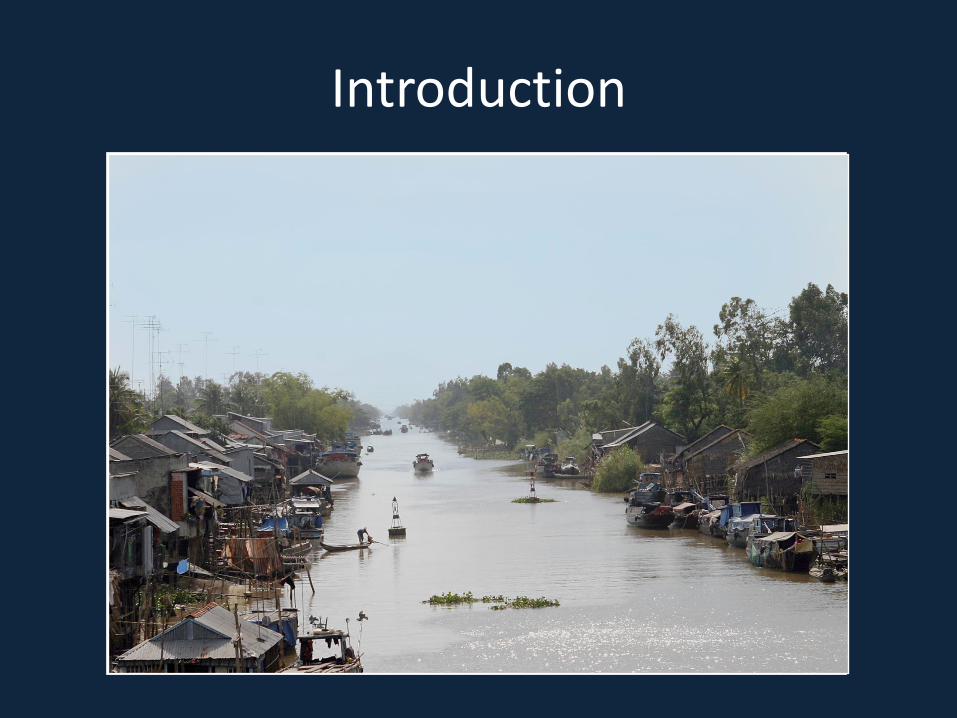
Introduction
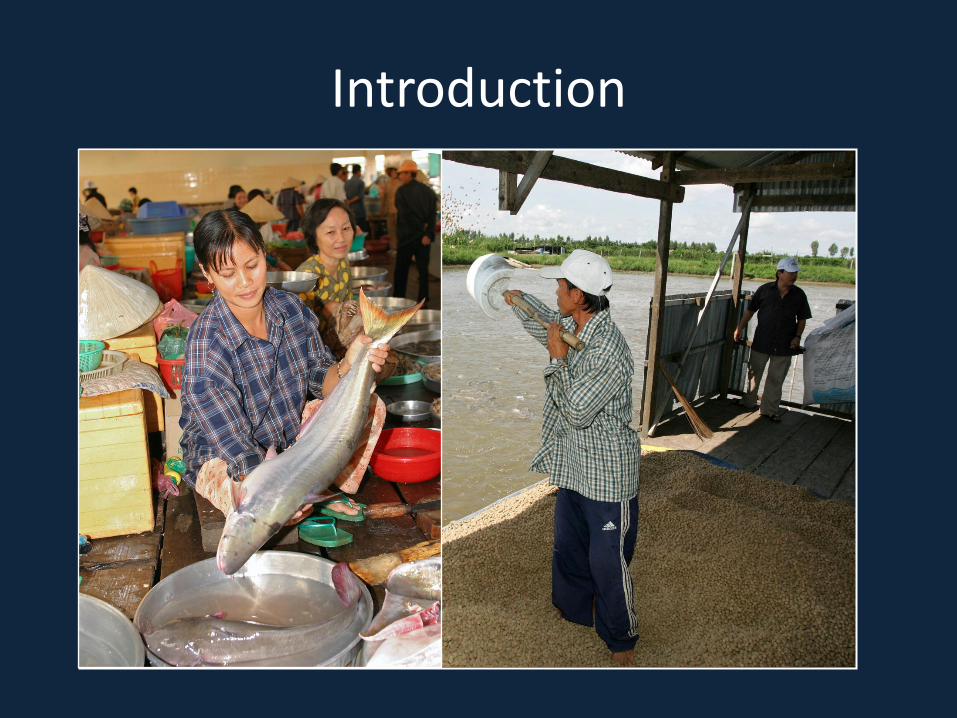
Introduction
Introduction
0
200,000
400,000
600,000
800,000
1,000,000
1,200,000
1,400,000
1,600,000
1,800,000
2,000,000
0
200,000
400,000
600,000
800,000
1,000,000
1,200,000
1,400,000
Val
ue
(0
00
's U
S$)
Pro
du
ctio
n (
ton
ne
s)
Year
Production (tonnes)
Value (000's US$)
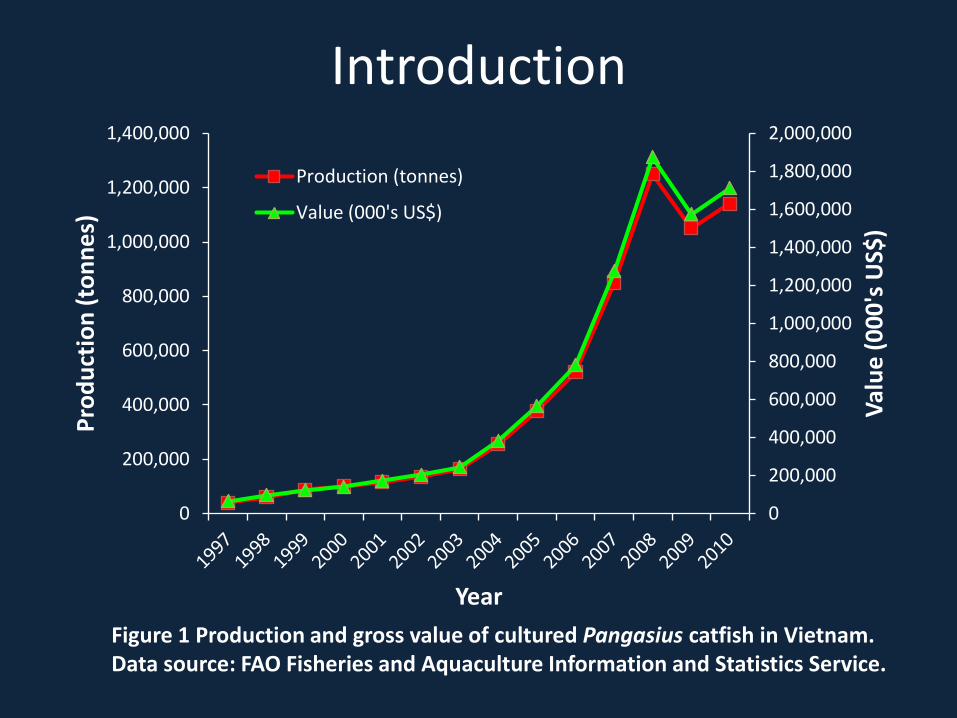
Figure 1 Production and gross value of cultured Pangasius catfish in Vietnam. Data source: FAO Fisheries and Aquaculture Information and Statistics Service.
Introduction
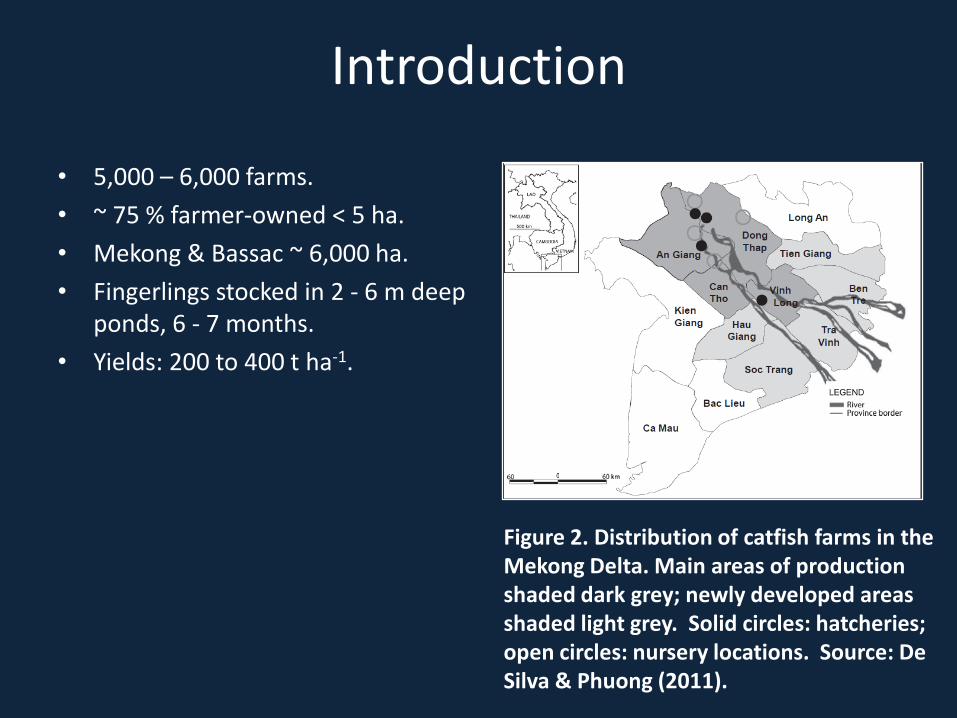
• 5,000 – 6,000 farms.
• ~ 75 % farmer-owned < 5 ha.
• Mekong & Bassac ~ 6,000 ha.
• Fingerlings stocked in 2 - 6 m deep ponds, 6 - 7 months.
• Yields: 200 to 400 t ha-1.
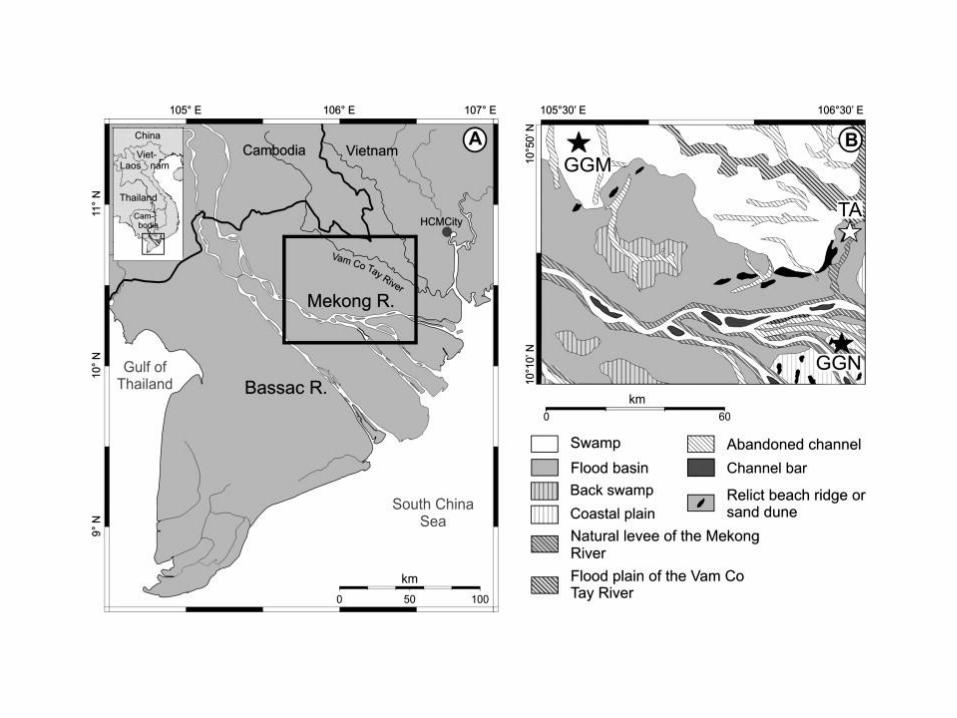
Figure 2. Distribution of catfish farms in the Mekong Delta. Main areas of production shaded dark grey; newly developed areas shaded light grey. Solid circles: hatcheries; open circles: nursery locations. Source: De Silva & Phuong (2011).
Introduction
• Industry will be exposed to changes in biophysical conditions:
• Upstream development;
• Climate change.
• Study purpose:
• Raise awareness of sector’s vulnerability to this exposure
• Mitigate or manage impacts.
Methods
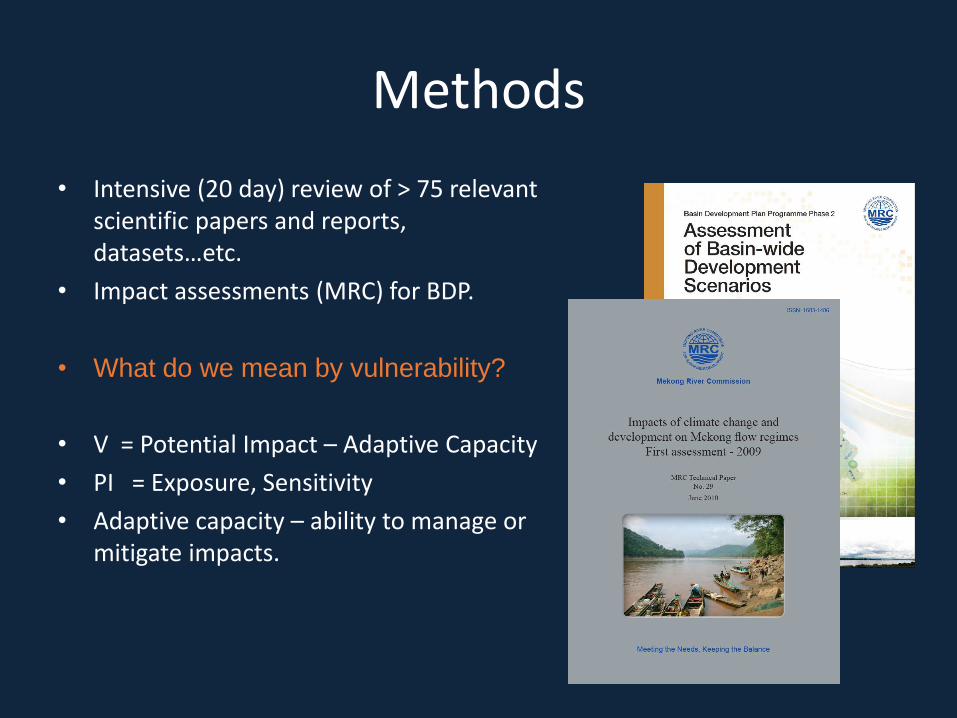
• Intensive (20 day) review of > 75 relevant scientific papers and reports, datasets…etc.
• Impact assessments (MRC) for BDP.
• What do we mean by vulnerability?
• V = Potential Impact – Adaptive Capacity
• PI = Exposure, Sensitivity
• Adaptive capacity – ability to manage or mitigate impacts.
Results: Exposure
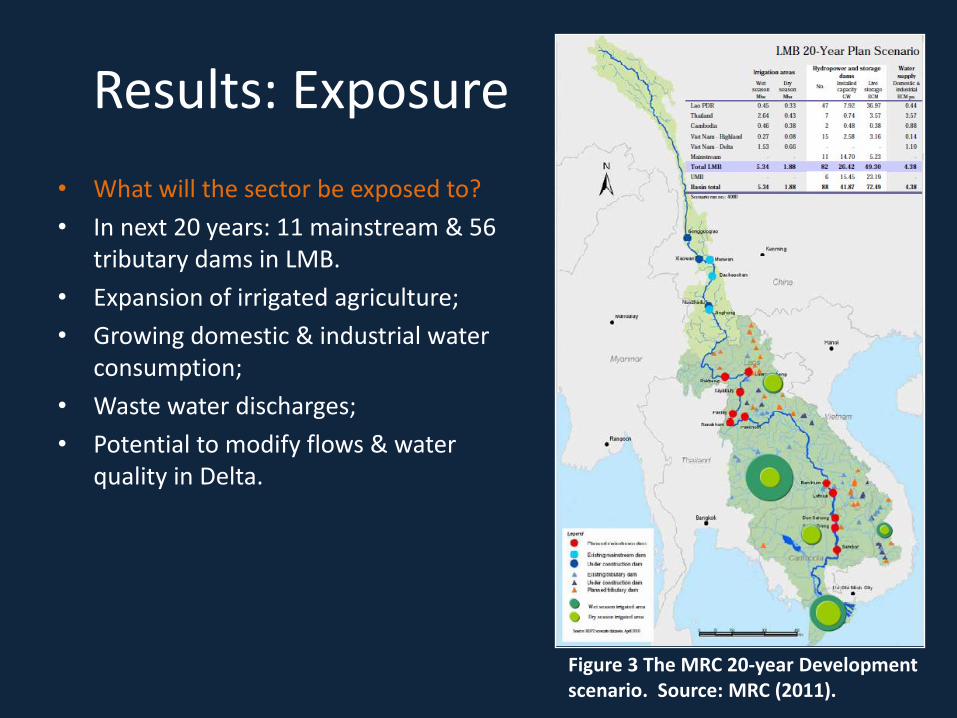
• What will the sector be exposed to?
• In next 20 years: 11 mainstream & 56 tributary dams in LMB.
• Expansion of irrigated agriculture;
• Growing domestic & industrial water consumption;
• Waste water discharges;
• Potential to modify flows & water quality in Delta.
Figure 3 The MRC 20-year Development scenario. Source: MRC (2011).
Exposure
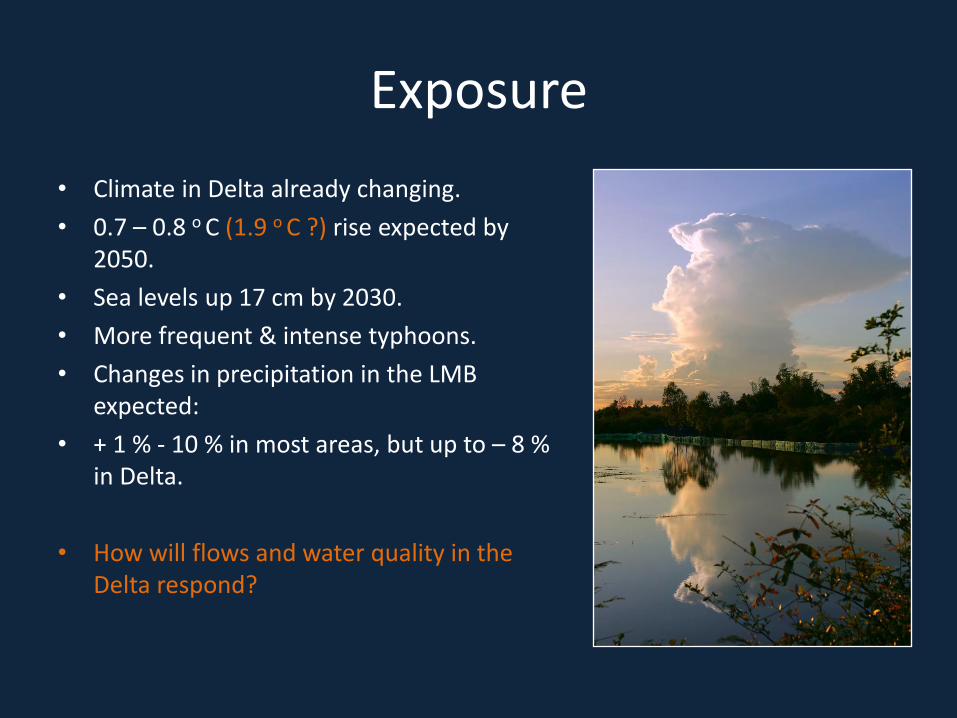
• Climate in Delta already changing.
• 0.7 – 0.8 o C (1.9 o C ?) rise expected by 2050.
• Sea levels up 17 cm by 2030.
• More frequent & intense typhoons.
• Changes in precipitation in the LMB expected:
• + 1 % - 10 % in most areas, but up to – 8 % in Delta.
• How will flows and water quality in the Delta respond?
Exposure
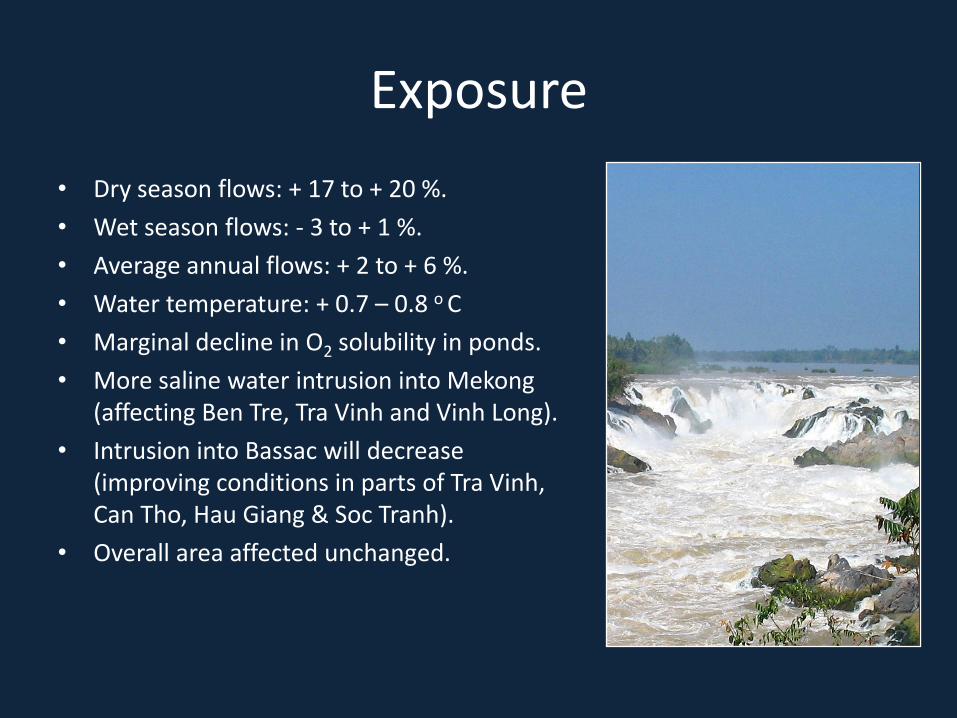
• Dry season flows: + 17 to + 20 %.
• Wet season flows: - 3 to + 1 %.
• Average annual flows: + 2 to + 6 %.
• Water temperature: + 0.7 – 0.8 o C
• Marginal decline in O2 solubility in ponds.
• More saline water intrusion into Mekong (affecting Ben Tre, Tra Vinh and Vinh Long).
• Intrusion into Bassac will decrease (improving conditions in parts of Tra Vinh, Can Tho, Hau Giang & Soc Tranh).
• Overall area affected unchanged.
Exposure
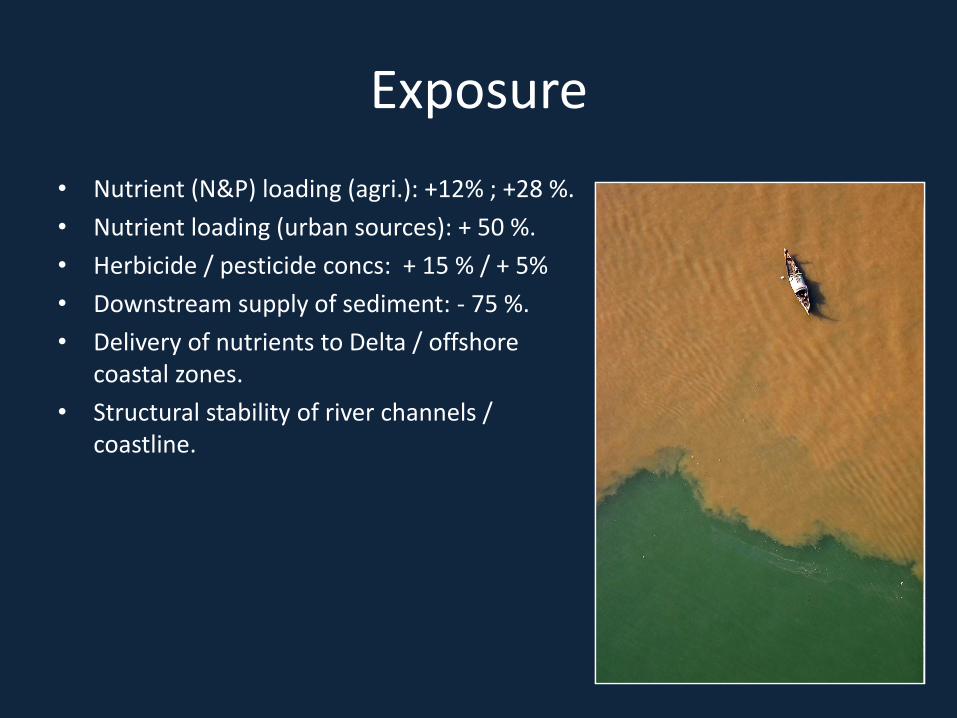
• Nutrient (N&P) loading (agri.): +12% ; +28 %.
• Nutrient loading (urban sources): + 50 %.
• Herbicide / pesticide concs: + 15 % / + 5%
• Downstream supply of sediment: - 75 %.
• Delivery of nutrients to Delta / offshore coastal zones.
• Structural stability of river channels / coastline.
Exposure
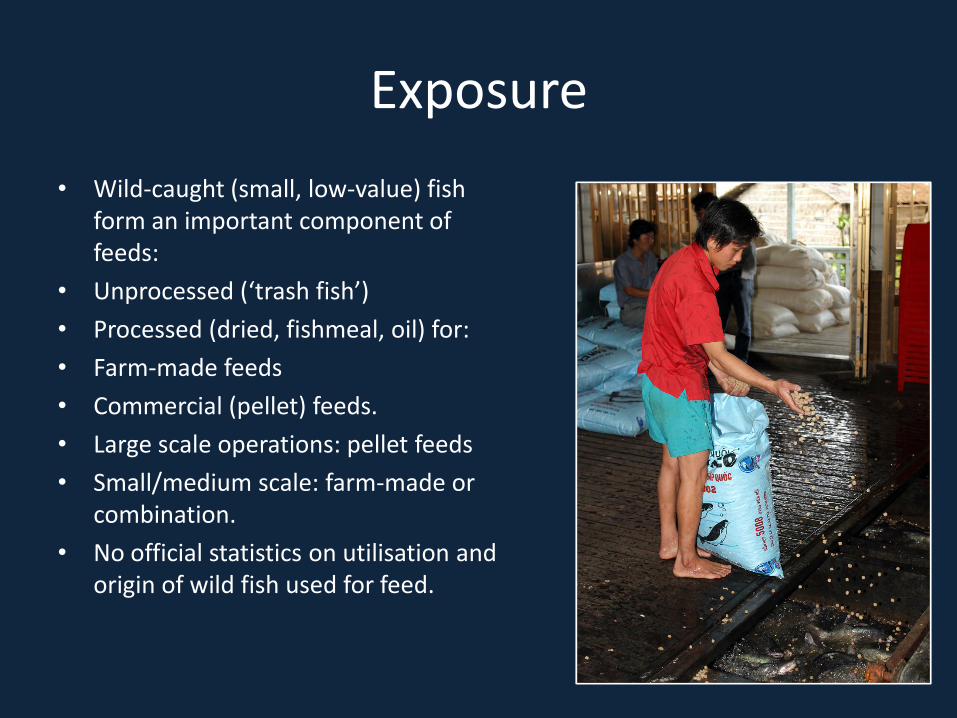
• Wild-caught (small, low-value) fish form an important component of feeds:
• Unprocessed (‘trash fish’)
• Processed (dried, fishmeal, oil) for:
• Farm-made feeds
• Commercial (pellet) feeds.
• Large scale operations: pellet feeds
• Small/medium scale: farm-made or combination.
• No official statistics on utilisation and origin of wild fish used for feed.
Exposure
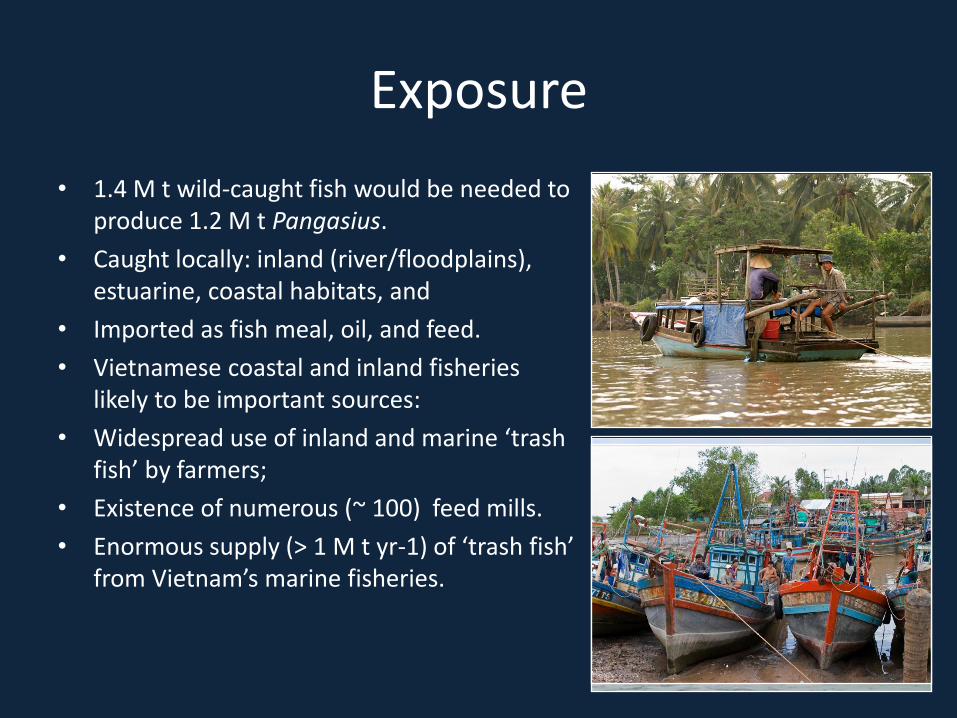
• 1.4 M t wild-caught fish would be needed to produce 1.2 M t Pangasius.
• Caught locally: inland (river/floodplains), estuarine, coastal habitats, and
• Imported as fish meal, oil, and feed.
• Vietnamese coastal and inland fisheries likely to be important sources:
• Widespread use of inland and marine ‘trash fish’ by farmers;
• Existence of numerous (~ 100) feed mills.
• Enormous supply (> 1 M t yr-1) of ‘trash fish’ from Vietnam’s marine fisheries.
Exposure
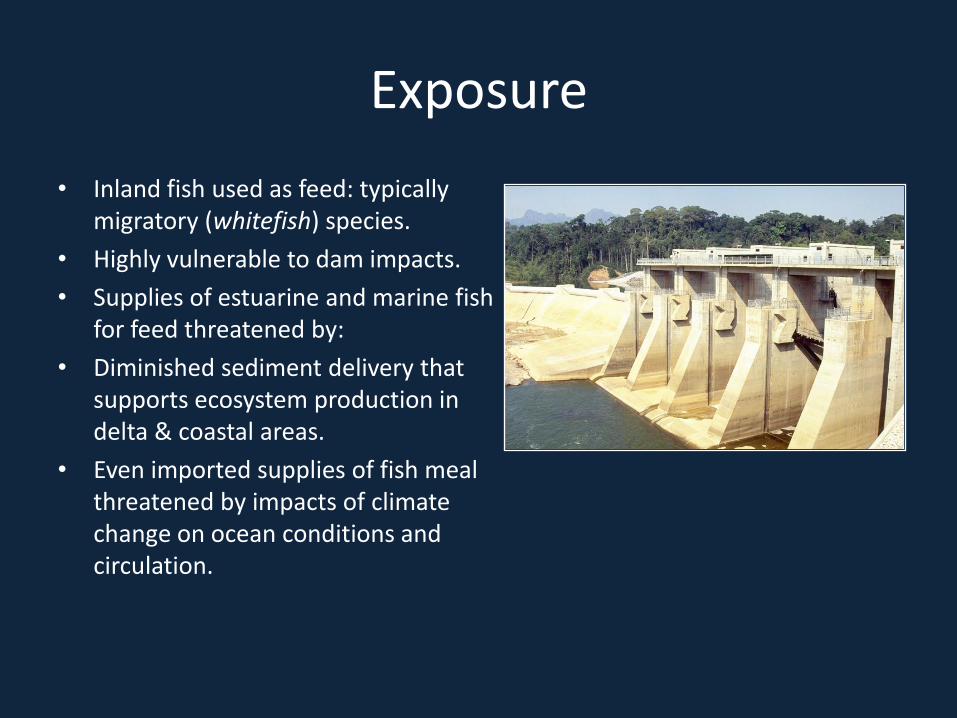
• Inland fish used as feed: typically migratory (whitefish) species.
• Highly vulnerable to dam impacts.
• Supplies of estuarine and marine fish for feed threatened by:
• Diminished sediment delivery that supports ecosystem production in delta & coastal areas.
• Even imported supplies of fish meal threatened by impacts of climate change on ocean conditions and circulation.
Sensitivity & Potential Impacts
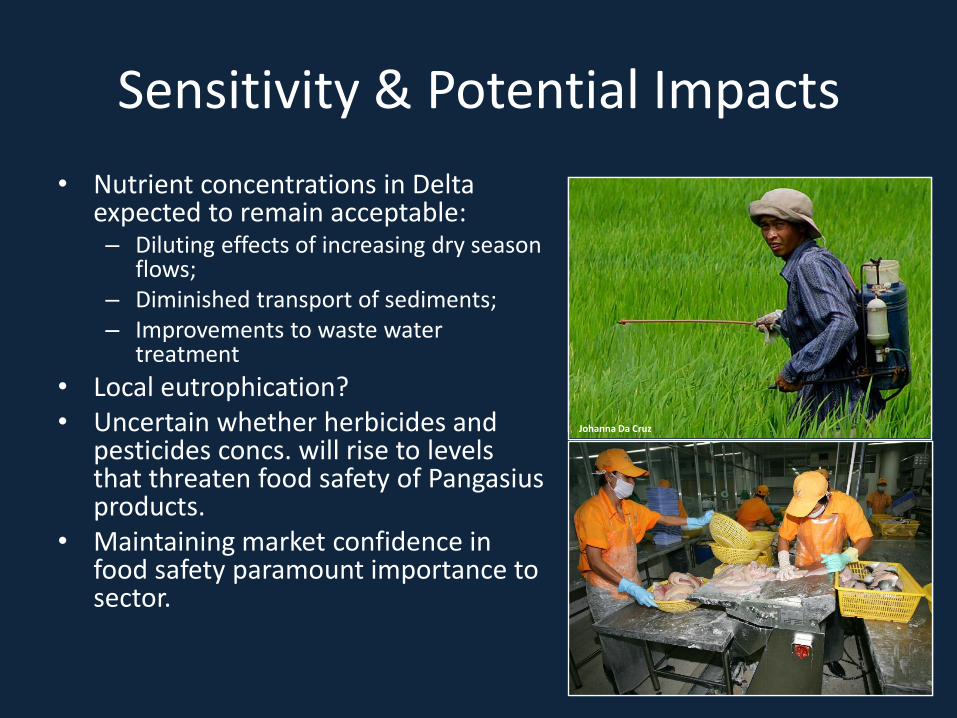
• Nutrient concentrations in Delta expected to remain acceptable: – Diluting effects of increasing dry season
flows; – Diminished transport of sediments; – Improvements to waste water
treatment
• Local eutrophication? • Uncertain whether herbicides and
pesticides concs. will rise to levels that threaten food safety of Pangasius products.
• Maintaining market confidence in food safety paramount importance to sector.
Johanna Da Cruz
Sensitivity & Potential Impacts
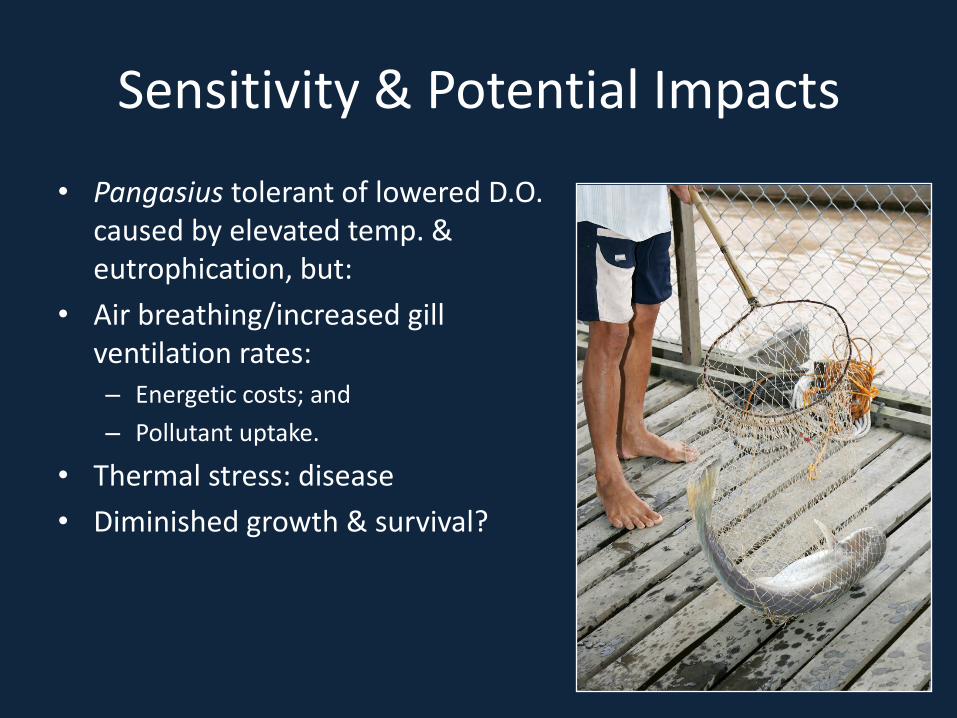
• Pangasius tolerant of lowered D.O. caused by elevated temp. & eutrophication, but:
• Air breathing/increased gill ventilation rates: – Energetic costs; and
– Pollutant uptake.
• Thermal stress: disease
• Diminished growth & survival?
Sensitivity & Potential Impacts
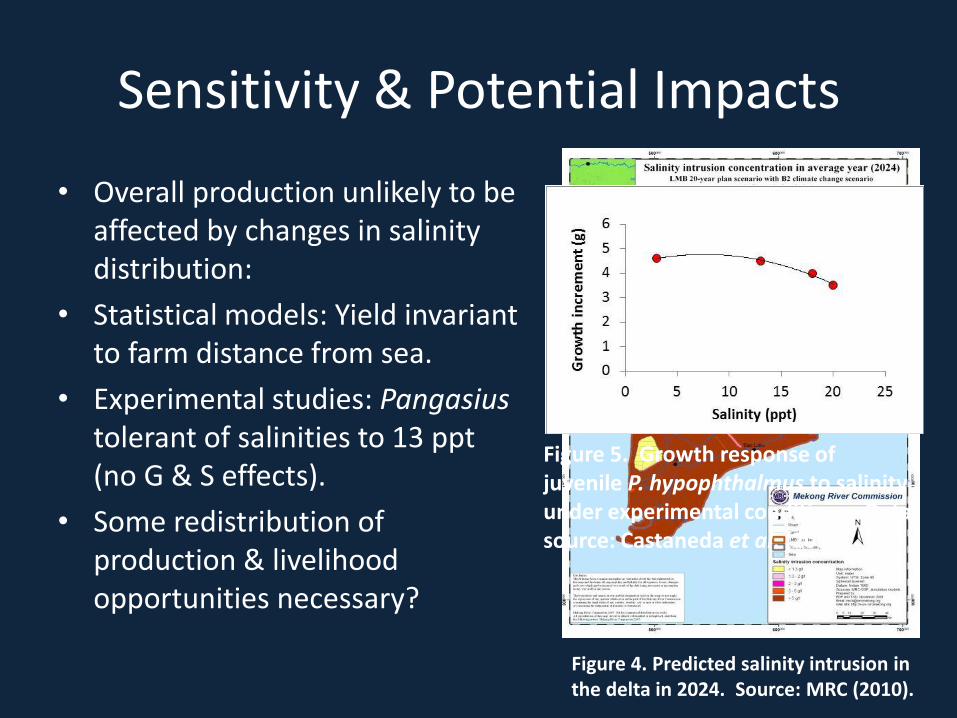
• Overall production unlikely to be affected by changes in salinity distribution:
• Statistical models: Yield invariant to farm distance from sea.
• Experimental studies: Pangasius tolerant of salinities to 13 ppt (no G & S effects).
• Some redistribution of production & livelihood opportunities necessary?
Figure 4. Predicted salinity intrusion in the delta in 2024. Source: MRC (2010).
Figure 5. Growth response of juvenile P. hypophthalmus to salinity under experimental conditions. Data source: Castaneda et al. (2010).

Sensitivity & Potential Impacts
• Marginal profits for most small-scale farmers.
• Sensitive: – Market prices (downward
trend)
– Feed costs (75 – 85 % of var. costs)
• Farmers suspend production until prices rise.
1,50
2,00
2,50
3,00
2003 2004 2005 2006 2007 2008 2009 2010 2011
Exp
ort
val
ue
(US$
/kg)
Year
Figure 6 Unit value of exports, 2003-2010. Data source: Dzung (2012)
Sensitivity & Potential Impacts
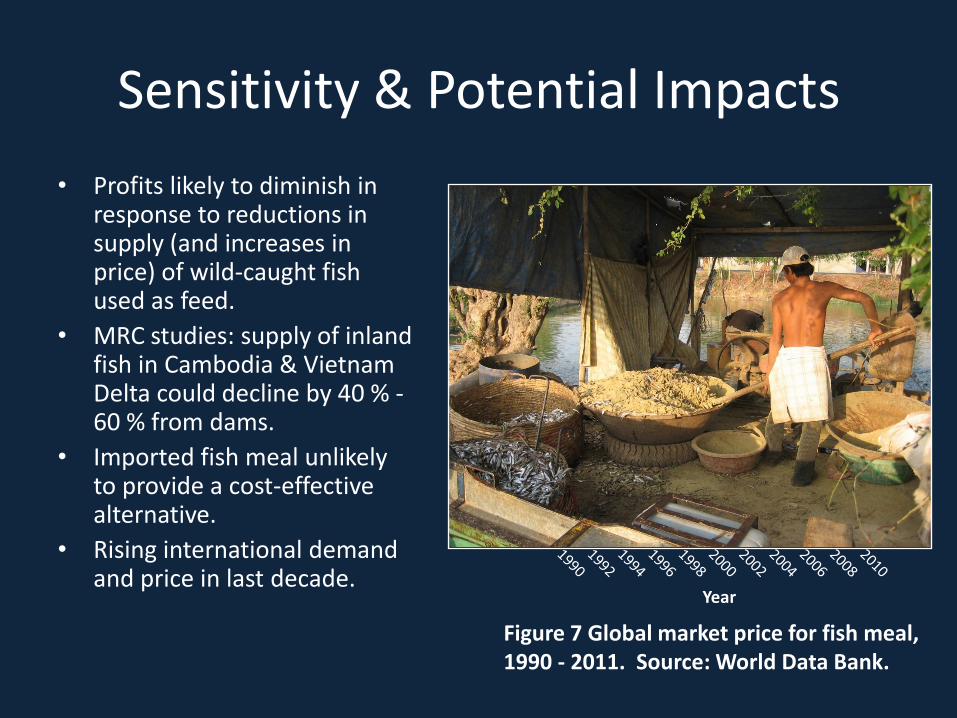
• Profits likely to diminish in response to reductions in supply (and increases in price) of wild-caught fish used as feed.
• MRC studies: supply of inland fish in Cambodia & Vietnam Delta could decline by 40 % - 60 % from dams.
• Imported fish meal unlikely to provide a cost-effective alternative.
• Rising international demand and price in last decade.
0
200
400
600
800
1.000
1.200
1.400
1.600
1.800
$ /
to
nn
e
Year
Fishmeal, $/mt, nominal$
Fishmeal, $/mt, real 2005$
Figure 7 Global market price for fish meal, 1990 - 2011. Source: World Data Bank.
Sensitivity & Potential Impacts
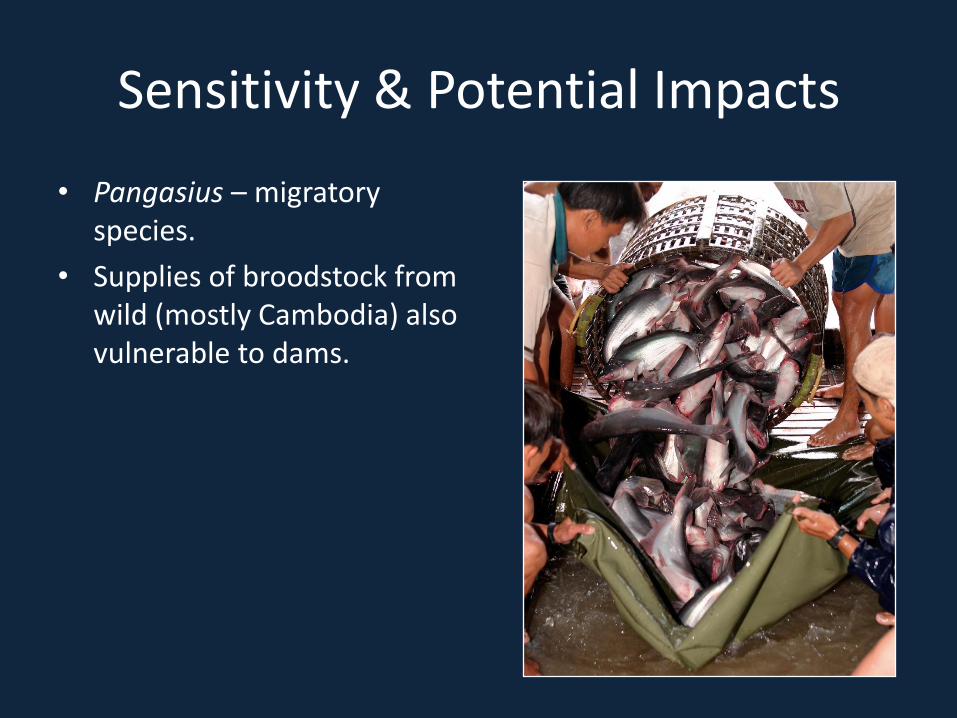
• Pangasius – migratory species.
• Supplies of broodstock from wild (mostly Cambodia) also vulnerable to dams.
Adaptive Capacity
• Where water quality is affected (by pollution, eutrophication and temperature):
• Autonomous adaptation: – feed inputs,
– drug applications,
– stocking densities
• Diminish profit & product safety
• Planned adaptation (more effective but also costly): – Treatment facilities at water intakes and (waste water) off-takes.
– Pond aeration
– Greater regulation over drug use
Adaptive Capacity
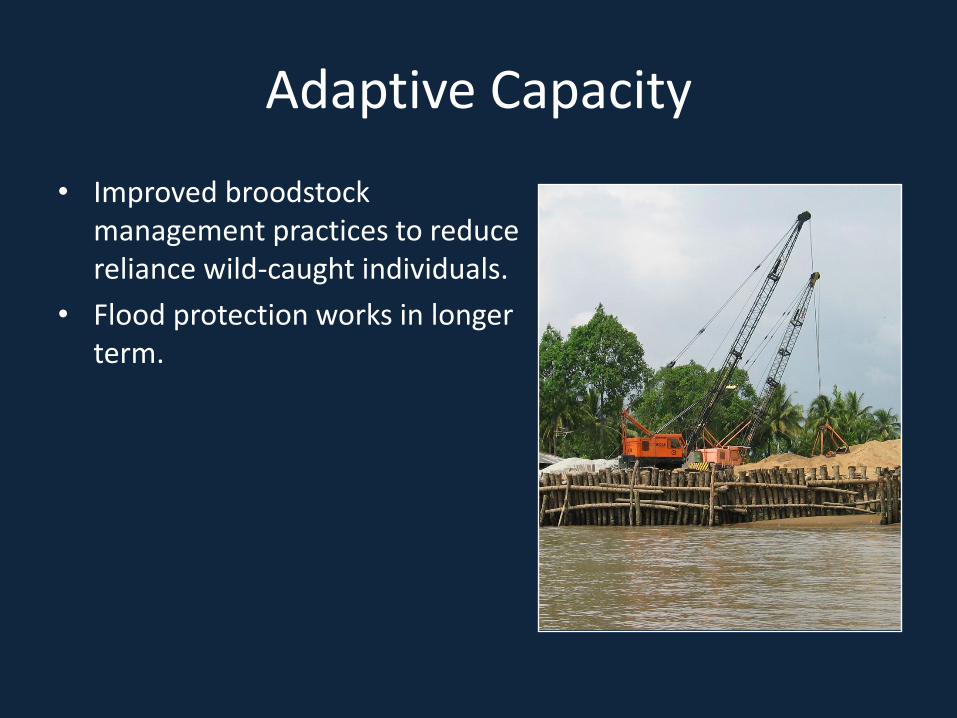
• Improved broodstock management practices to reduce reliance wild-caught individuals.
• Flood protection works in longer term.
Adaptive Capacity
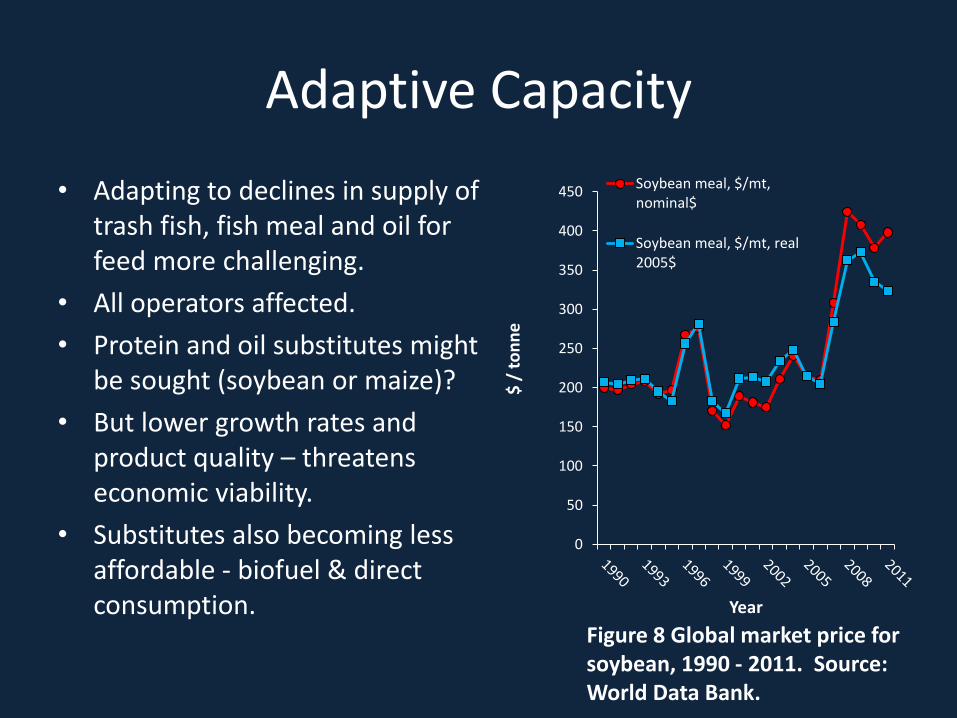
• Adapting to declines in supply of trash fish, fish meal and oil for feed more challenging.
• All operators affected.
• Protein and oil substitutes might be sought (soybean or maize)?
• But lower growth rates and product quality – threatens economic viability.
• Substitutes also becoming less affordable - biofuel & direct consumption.
0
50
100
150
200
250
300
350
400
450
$ /
to
nn
e
Year
Soybean meal, $/mt,nominal$
Soybean meal, $/mt, real2005$
Figure 8 Global market price for soybean, 1990 - 2011. Source: World Data Bank.
Conclusions: Vulnerability
• Sector vulnerable via several pathways of impact.
• Most important impact pathway?
• Particularly whether water quality deteriorate to cause: – Physiological impacts?
– Contaminant-related product safety impacts?
• Very likely that supplies of wild-caught fish used for feed will decline, locally, regionally and globally exacerbating their upward cost trends.
• Doubt surrounds the cost-effectiveness of substitutes.
• Other cost burdens likely: – Farm re-location; flood control; improved broodstock management,
water treatment facilities…etc.
Vulnerability
• To maintain output, demand will need to be inelastic to necessary price rises.
• Unlikely given historic price trends and growing output from other countries e.g. China, Bangladesh, Indonesia…etc.
• Without price rises, declines in profit and output expected, impacting upon dependent livelihoods and wider economy.
• Far reaching implications for food security beyond the Delta.
• Challenges the assertion that aquaculture production will compensate the expected declines in yield from capture fisheries.
Priority Research
• Described in our report : www.sustainablefish.org/
• Reliably determine reliance on wild fish for feed from inland and coastal fisheries most vulnerable to development & CC impacts.
Thank you
Photos: Joe Garrison, MRCS Cuyers & Binh (2008) Johanna Da Cruz Ashley Halls, ASL
Further Information: www.sustainablefish.org/

Priority Research
• Described in our report : www.sustainablefish.org/
• Reliably determine reliance on wild fish for feed from inland and coastal fisheries most vulnerable to development impacts;
• Improve knowledge of physiological responses / tolerances (temp, D.O. salinity);
• Better predict water quality under future basin development scenarios;
• Assess likely food safety of Pangasius products in response to water quality conditions (particularly pollutant and contaminant concentrations);
• Formulate cost-effective feeds using alternative sources of protein/oil to maintain or expand production.
• Improve understanding of international markets for Pangasius products, their driving forces and price elasticity of demand.
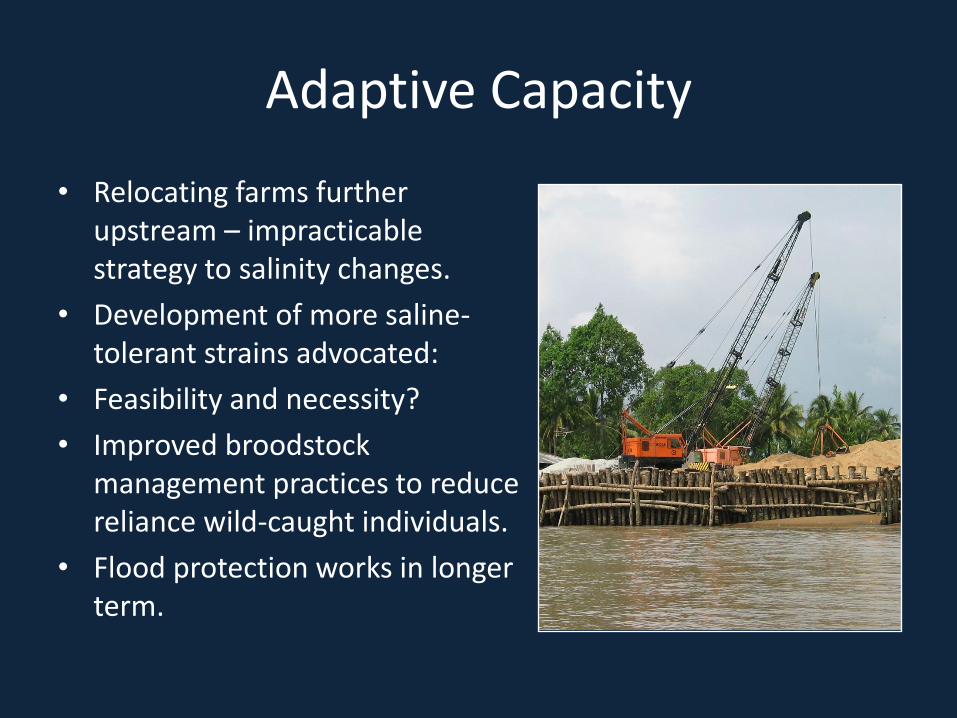
Adaptive Capacity
• Relocating farms further upstream – impracticable strategy to salinity changes.
• Development of more saline-tolerant strains advocated:
• Feasibility and necessity?
• Improved broodstock management practices to reduce reliance wild-caught individuals.
• Flood protection works in longer term.
Economics of Production
• Production costs for household-scale intensive pond-reared P. hypophthalmus are relatively stable but margins are extremely tight. Production costs in early 2009 for commercial-scale striped catfish grow-out producers were approximately VND 15 000/kg (USD 0.83/kg) excluding capital investment costs; this was offset by sale prices of VND 16 000/kg (USD 0.89/kg). At that time household-scale grow-out producers were only being paid VND 14 000-15 000 (USD 0.78 – 0.83/kg) for market sized fish by processing plants but their production costs at approximately VND 13 000 – 14 000 (USD 0.72 – 0.78 kg) excluding capital investment costs were lower . Most grow-out farmers view capital investment costs as a ‘sunk cost’. Profit margins in early 2009 were so tight that striped catfish grow-out farmers in Vietnam were unlikely to recover their capital investment costs fully (FAO 2010).