striated microdischarges in an asymmetric barrier discharge in argon at atmospheric pressure
TRANSCRIPT

PHYSICAL REVIEW E 84, 046404 (2011)
Striated microdischarges in an asymmetric barrier discharge in argon at atmospheric pressure
Tomas Hoder,* Detlef Loffhagen,† Christian Wilke, Helge Grosch, Jan Schafer, Klaus-Dieter Weltmann, andRonny Brandenburg
Leibniz Institute for Plasma Science and Technology, Felix-Hausdorff-Str. 2, D-17489 Greifswald, Germany(Received 16 June 2010; revised manuscript received 19 July 2011; published 17 October 2011)
The investigation of striated microdischarges in barrier discharges in argon at atmospheric pressure is reported.Microdischarges were investigated by means of electrical measurements correlated with intensified CCD cameraimaging. The scaling law theory known from low-pressure glow discharge diagnostics was applied in orderto describe and explain this phenomenon. The investigated microdischarge is characterized as a transientatmospheric-pressure glow discharge with a stratified column. It can be described by similarity parametersi/r ! 0.13 A/cm, pr ! 5 Torr cm, and 3 < !/r < 5 with the current i, pressure p, interval of subsequentstriations !, and radius of the plasma channel r . An attempt to describe the mechanism of creation of a striatedstructure is given, based on an established model of the spatial electron relaxation.
DOI: 10.1103/PhysRevE.84.046404 PACS number(s): 52.35.Mw, 52.70.Kz, 52.80.Hc
I. INTRODUCTION
The appearance of striated structures in glow discharges atlow and medium pressure is well known and has been reviewedin many publications [1–6]. Recently, these structures havealso been observed at atmospheric pressure in glow discharges[7–9], microwave excited discharges [10], hollow cathodeplasmas [11], and plasma jets [12,13]. In particular, thelongitudinal stratification of filaments in an atmospheric-pressure rf plasma jet in argon has been detected in relation toa self-organization effect in Ref. [13].
The stability and reproducibility of the plasma is crucialfor its industrial application and the understanding of striatedstructures is one aspect to be clarified to produce convenientand well-defined plasmas. Frequently, the striated structurewithin the plasma channel at low pressure appears as a resultof a relaxation process induced by a local disturbance, whichcan be caused, for example, by a probe, a short laser pulse, ora discharge constriction [14–17]. However, these instabilitiesare not yet fully understood for atmospheric-pressure plasmas,which have been the subject of extensive research in the lastdecade [18]. For example, varying the discharge parameters(e.g., the applied voltage between electrodes), a sequence ofstate transitions is frequently observed [19]. Periodical andirregular states follow each other. The transitions of these stateswere reached by even very small changes of the parameter.Due to their nonlinear nature, they are direction dependentand show a hysteresis in their behavior [20–24].
In this paper the observation of striated microdischarges inasymmetric argon barrier discharges at atmospheric pressureis reported. Typical pictures of striated microdischarges areshown in Fig. 1 (note that the subscript p-p in the unitskVp-p refers to “peak to peak”). The appearance of the striatedstructure is not related to the presence of the metallic electrodein asymmetric barrier discharge arrangements, where oneelectrode is covered by a dielectric. Indeed, in the case ofsymmetric barrier discharges, where both electrodes arecovered by a dielectric, the striated structure has been found
*[email protected]†[email protected]
as well. However, the appearance of striated microdischargesin the symmetric setup was rare and instable. As can be seenin Fig. 1, the striated structures appear not only within thedischarge channel in the gap, but also directly on the surface ofthe electrodes. Striated structures have been observed for bothpolarities in asymmetric barrier discharges; that is, for the ar-rangement with metallic cathode and dielectric-covered anode(M"D+) as well as with metallic anode and dielectric cathode(M+D"). However, they were too unstable for more detailedresearch in the M+D" arrangement. The irreproducibility ofthis discharge can be caused by the inhomogeneous depositionof the surface charges onto the dielectric surfaces in the barrierdischarge setup. This phenomenon was described in [25,26].
In order to gain better knowledge of the discharge behavior,experimental studies have been performed, consisting ofelectrical measurements which were correlated with imagingof the discharge plasma by means of an intensified CCDcamera. The main features of the experiments are given. Thedevelopment of striated microdischarges is described in detail,and a discussion of the mechanisms of the discharge creation ispresented. In addition, the striated discharge has been analyzedby means of similarity parameters according to the scaling lawtheory given in [27,28] and by solving the inhomogeneousBoltzmann equation of the electrons for a spatially periodicelectric field typical of striations.
II. EXPERIMENTAL SETUP
The discharge cell used for the investigations is shown inFig. 2. Electrodes were placed into an acrylic glass chamberwith the volume of 4 cm3. The mutual distance of the puremetal (stainless steel) and alumina-covered electrode was1.5 mm. The thickness of the dielectric was 1 mm. Thecurvature of both electrode tips was 2 mm. The metal electrodewas energized by high voltage and the other electrode wasgrounded.
The barrier discharge was generated at atmospheric pres-sure by a 60 kHz sinusoidal voltage. A Softal AT6003transformer, QSC Powerlight 9.0 PFC amplifier, and ToellnerTOE 7711A function generator were used. The voltage andcurrent characteristics were measured by Tektronix probes
046404-11539-3755/2011/84(4)/046404(9) ©2011 American Physical Society

TOMAS HODER et al. PHYSICAL REVIEW E 84, 046404 (2011)
(a)
(b)
(c)
FIG. 1. Striated structures in asymmetric barrier discharges withpolarities metallic cathode dielectric anode (a) and metallic anodedielectric cathode (b) as well as in a symmetric barrier dischargearrangement (c). All pictures were taken with an exposure time of500 ns in arrangements with 1.5 mm gap at a flow rate of 150 SCCMand a voltage up to 3 kVp-p.
P6015A and CT-1, respectively, and recorded by a TektronixTDS 3052 oscilloscope.
The discharge atmosphere was sustained in the nonevac-uated chamber with continuous argon flow of known rateflowing to the ambient air at atmospheric pressure. The flowrate of the argon gas was controlled by an MKS multi gascontroller 647B. The view into the chamber was provided by aquartz glass window. Using a quartz lens, the discharge regionwas imaged onto the entrance slit of an ARC SpectraPro-500monochromator with a grating of 1200. An intensified CCD(iCCD) DiCam Pro 25 SVGA camera was used in combinationwith a Questar QM 100BK7 far-field microscope to revealthe two-dimensional structure of a single microdischarge.
FIG. 2. Discharge cell with a gap of 1.5 mm.
Thus, every iCCD picture is a result of only one individualmicrodischarge event luminosity in the following figures.
III. RESULTS AND DISCUSSION
In the first part of this section, experimental results arerepresented and discussed. Then, a qualitative analysis of thestriated microdischarge is given.
A. Experimental results
The appearance of striated structures in microdischargesdepends on two basic parameters: argon flow rate andapplied voltage. The argon gas purity, regulated by the flowrate, is the first important parameter. No striated structureoccurred at argon flow rates below 100 SCCM, whereSCCM denotes cubic centermeter per minute at standardtemperature and pressure. At flow rates above 100 SCCM,no molecular nitrogen or hydroxyl radical bands comparablewith the argon line intensities were detected in the opticalemission spectra, as becomes obvious from Fig. 3. Theargon line intensities at 763.51 nm and 750.38 nm shownin this figure correspond to the transitions of Ar I from4p[3/2]2 to 4s[3/2]2 and 4p#[1/2]0 to 4s #[1/2]1, respectively[29,30]. The respective upper-state energies are 13.17 eVand 13.48 eV.
A quite different increase of both the upper states can beresolved as a function of the argon gas purity (flow rate).Electron impact excitation of excited (mainly the 4s state)
FIG. 3. Intensities of spectral lines at different argon gas flow rates.
046404-2

STRIATED MICRODISCHARGES IN AN ASYMMETRIC . . . PHYSICAL REVIEW E 84, 046404 (2011)
0 5 10Energy U [eV]
10 -6
10 -5
10-4
10 -3
10 -2
10 -1
10 0f 0(U
)/n e [
eV-3
/2]
Parameter x:
E/N = 2 Td
01%
5%
FIG. 4. Isotropic distribution f0(U )/ne as a function of the kineticenergy U at different nitrogen admixtures x in Ar-N2 mixtures.
atoms is the dominant volume process for the generationof the 4p[3/2]2 and 4p#[1/2]0 states of argon during thedischarge phase at atmospheric pressure. The collision crosssection derived, for example, from [31] for electron impactexcitation of 4s atoms resulting in 4p[3/2]2 atoms is largerfor all relevant energies and has a lower threshold energythan the corresponding excitation process leading to the4p#[1/2]0 state. The respective rate coefficient for electronimpact excitation from state i to j depends on the isotropicpart f0 of the electron velocity distribution according to
ki$j =
!2me
" %
0UQi$j (U )
f0(U )ne
dU, (1)
where U , Qi$j , and ne are the kinetic energy of the electrons,the collision cross section, and the density of the electrons withmass me, respectively.
To illustrate the impact of molecular admixtures to argon,Fig. 4 shows the isotropic distribution, normalized to the elec-tron density, at different mixtures Ar:N2 with the composition(1 " x):x for a typical value of the reduced electric field E/Nof 2 Td (see discussion below). The results have been obtainedfrom the solution of the stationary, spatially homogeneousBoltzmann equation using the solution technique given in [32]and the collision cross section data of [33] for argon andof [34] for nitrogen. Because the population of electrons withenergies above 2 eV increases significantly with decreasingadmixture x of nitrogen (increasing argon gas flow rate), therate coefficients and thus the argon line intensities at 763.51and 750.38 nm increase as well. The growth of the argon lineintensity at 763.51 nm in Fig. 3 is steeper than that of the argonline intensity at 750.38 nm due to the corresponding largercollision cross sections for the stepwise excitation mentioned.The finding that the relative intensity of the 763.51 nm lineis larger than that of the 750.38 nm line is in agreementwith [30,35].
In order to clarify the theoretically possible influenceof air or nitrogen impurities on the discharge stratification,an additional experiment in a sealed glass chamber wasperformed. The chamber with the same electrode setup wasevacuated to high vacuum and heated to 700 K for 18 hours.After that it was filled with argon gas of purity of 99.9999%.
FIG. 5. Overview spectrum of the discharge in argon (99.9999%purity) in sealed system, where the striated structure was observed,too.
The overview spectrum of this discharge is shown in Fig. 5.Stratification of the discharge channel was observed in thiscase as well.
It has to be noted that the influence of the gas purityon the stratification of the glow discharge at low pressurehas already been studied by Loudova and coworkers in [36].Using molecular sieves, they observed only the change in thedispersion parameters in the stratified plasma channel in aneon discharge at high purity. There, the stratified structurealso remained present.
In order to prevent the effect of relaxation oscillationsdue to negative differential conductivity [35,37–39], a high-impedance resistor was connected in addition, close to thepowered electrode. The maximum known negative differentialconductivity in atmospheric-pressure rare gas plasmas reachesseveral hundred k" [7,40,41]. A 2 M" resistor was used andstriations remained. Therefore, according to the Kaufmanncondition [42], an induction of the plasma channel stratifica-tion by negative differential conductivity can be excluded.
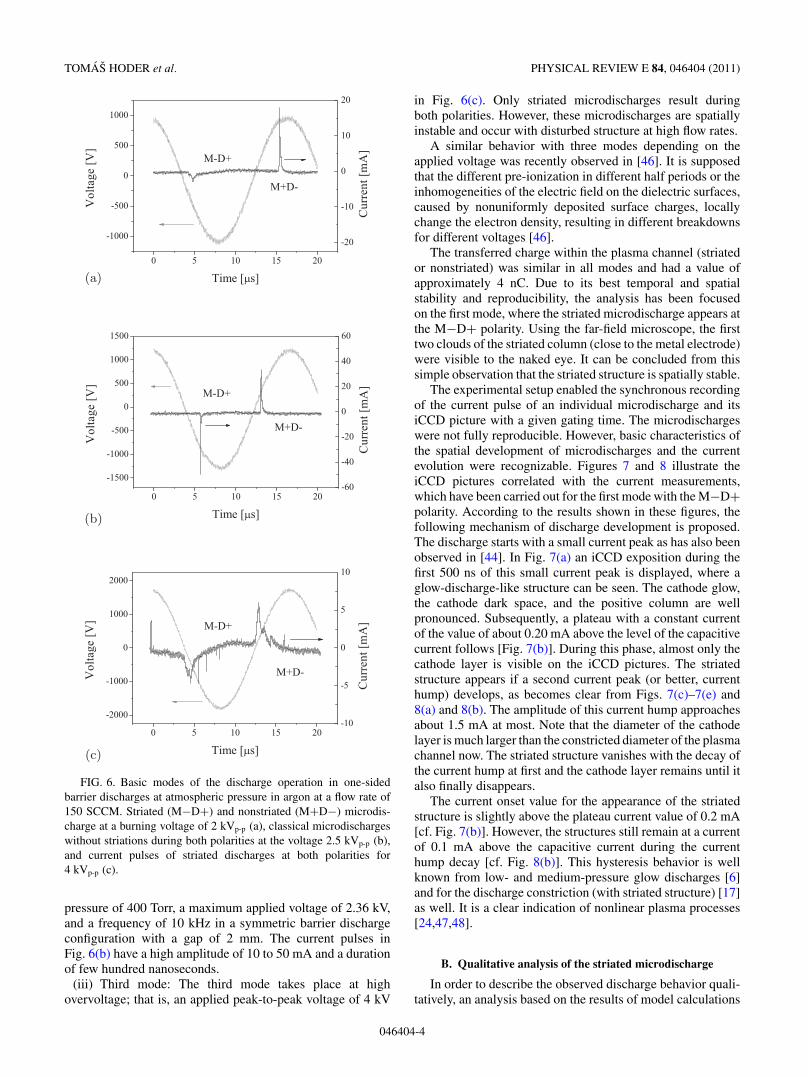
As already mentioned, the second main parameter signif-icantly influencing the discharge behavior was the appliedvoltage. At the flow rate of 150 SCCM, three modes ofthe discharge operation could be distinguished depending onthe applied voltage. The temporal evolution of the appliedvoltage and the discharge current corresponding to thesemodes are displayed in Fig. 6.
(i) First mode: Close to the burning voltage, where theapplied voltage is just large enough to sustain the discharge,the first mode occurs [43]. As can be seen from Fig. 6(a), thestriated discharge is present in this mode only whenthe metal electrode is the cathode (M"D+), while in theother half period (M+D") the discharge appears as a normalmicrodischarge in the argon barrier discharge known fromthe literature [44]. The duration of the current pulse in thecase of striated microdischarges varies between 3 and 5 µsand its amplitude does not exceed 1.5 mA. In the caseof the nonstriated microdischarge, the pulse amplitude wasapproximately 20 mA at a pulse duration of about 500 ns.
(ii) Second mode: When increasing the applied voltagefrom 2 kVp-p to the enhanced voltage of 2.5 kVp-p at theflow rate of 150 SCCM, no striations appear. The shapeof the discharge current peak [cf. Fig. 6(b)] takes the formof normal barrier discharges in atmospheric-pressure argonincluding streamer propagation [45]. It is also similar tothe results reported in, for example, Ref. [44] for an argon
046404-3
TOMAS HODER et al. PHYSICAL REVIEW E 84, 046404 (2011)
(a)
(b)
(c)
FIG. 6. Basic modes of the discharge operation in one-sidedbarrier discharges at atmospheric pressure in argon at a flow rate of150 SCCM. Striated (M"D+) and nonstriated (M+D") microdis-charge at a burning voltage of 2 kVp-p (a), classical microdischargeswithout striations during both polarities at the voltage 2.5 kVp-p (b),and current pulses of striated discharges at both polarities for4 kVp-p (c).
pressure of 400 Torr, a maximum applied voltage of 2.36 kV,and a frequency of 10 kHz in a symmetric barrier dischargeconfiguration with a gap of 2 mm. The current pulses inFig. 6(b) have a high amplitude of 10 to 50 mA and a durationof few hundred nanoseconds.
(iii) Third mode: The third mode takes place at highovervoltage; that is, an applied peak-to-peak voltage of 4 kV
in Fig. 6(c). Only striated microdischarges result duringboth polarities. However, these microdischarges are spatiallyinstable and occur with disturbed structure at high flow rates.
A similar behavior with three modes depending on theapplied voltage was recently observed in [46]. It is supposedthat the different pre-ionization in different half periods or theinhomogeneities of the electric field on the dielectric surfaces,caused by nonuniformly deposited surface charges, locallychange the electron density, resulting in different breakdownsfor different voltages [46].
The transferred charge within the plasma channel (striatedor nonstriated) was similar in all modes and had a value ofapproximately 4 nC. Due to its best temporal and spatialstability and reproducibility, the analysis has been focusedon the first mode, where the striated microdischarge appears atthe M"D+ polarity. Using the far-field microscope, the firsttwo clouds of the striated column (close to the metal electrode)were visible to the naked eye. It can be concluded from thissimple observation that the striated structure is spatially stable.
The experimental setup enabled the synchronous recordingof the current pulse of an individual microdischarge and itsiCCD picture with a given gating time. The microdischargeswere not fully reproducible. However, basic characteristics ofthe spatial development of microdischarges and the currentevolution were recognizable. Figures 7 and 8 illustrate theiCCD pictures correlated with the current measurements,which have been carried out for the first mode with the M"D+polarity. According to the results shown in these figures, thefollowing mechanism of discharge development is proposed.The discharge starts with a small current peak as has also beenobserved in [44]. In Fig. 7(a) an iCCD exposition during thefirst 500 ns of this small current peak is displayed, where aglow-discharge-like structure can be seen. The cathode glow,the cathode dark space, and the positive column are wellpronounced. Subsequently, a plateau with a constant currentof the value of about 0.20 mA above the level of the capacitivecurrent follows [Fig. 7(b)]. During this phase, almost only thecathode layer is visible on the iCCD pictures. The striatedstructure appears if a second current peak (or better, currenthump) develops, as becomes clear from Figs. 7(c)–7(e) and8(a) and 8(b). The amplitude of this current hump approachesabout 1.5 mA at most. Note that the diameter of the cathodelayer is much larger than the constricted diameter of the plasmachannel now. The striated structure vanishes with the decay ofthe current hump at first and the cathode layer remains until italso finally disappears.
The current onset value for the appearance of the striatedstructure is slightly above the plateau current value of 0.2 mA[cf. Fig. 7(b)]. However, the structures still remain at a currentof 0.1 mA above the capacitive current during the currenthump decay [cf. Fig. 8(b)]. This hysteresis behavior is wellknown from low- and medium-pressure glow discharges [6]and for the discharge constriction (with striated structure) [17]as well. It is a clear indication of nonlinear plasma processes[24,47,48].
B. Qualitative analysis of the striated microdischarge
In order to describe the observed discharge behavior quali-tatively, an analysis based on the results of model calculations
046404-4

STRIATED MICRODISCHARGES IN AN ASYMMETRIC . . . PHYSICAL REVIEW E 84, 046404 (2011)
(a)
(b)
(c)
(d)
(e)
FIG. 7. Correlated iCCD and current (i) measurements at differ-ent stages of the discharge development. Argon flow rate is 150 SCCMand iCCD gate is 500 ns.
of the constriction of the positive column of dc glow dischargesin argon at different pressures presented in [49] has beenperformed. The description of the discharges at atmosphericpressure uses, in principle, the same set of equations as that oflow- and medium-pressure glow discharges, where especiallythree-body-collision processes have to be taken into accountin the reaction kinetic model at medium and atmosphericpressure. At low and medium pressure the plasma of glowdischarges can be characterized and described by means of theso-called scaling law theory [6,27,28]. Since the scaling laws
(a)
(b)
FIG. 8. Correlated iCCD and current (i) measurements at the laststage of the discharge development at conditions as in Fig. 7.
were derived from the same set of equations, they have beenapplied to describe the observed phenomena as well. Typicalscaling parameters are, for example, E/N , i/r , pr , and !/r ,where E, N , i, p, r , and ! are the electrical field, neutral gasparticle concentration, current, pressure, radius of the plasmachannel, and spatial wavelength of the striations, respectively.
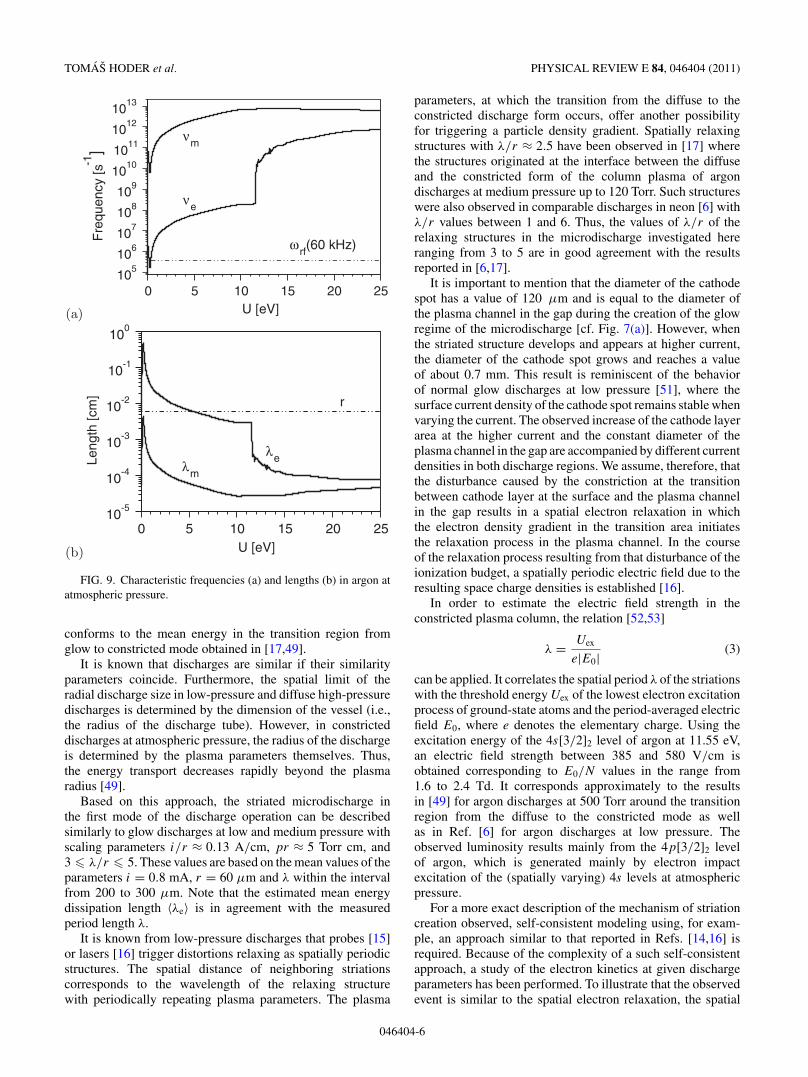
In addition, the characteristic frequencies and lengths ofthe argon plasma at atmospheric pressure have been used.In Fig. 9 the lumped collision frequencies #m(U ) and #e(U )for momentum and energy dissipation, the mean-free path!m(U ) and the energy dissipation frequency !e(U ) accordingto [50] are displayed as a function of the kinetic energy U ofthe electrons. These quantities have been obtained using thecollision cross section data applied in [49]. Because both thedissipation frequencies for momentum and energy dissipationare larger than the frequency $rf of the applied voltage forall relevant energies [Fig. 9(a)], a quasistationary evolutionof the distribution function of the electrons with respect tothe energy and momentum transfer takes place. Therefore, asimilarity law approach for the stable dc glow discharge hasbeen employed in the following.
The energy dissipation length [Fig. 9(b)] considerablyexceeds the mean-free path and possesses a pronouncedenergy dependence with substantially lower values at electronenergies where inelastic collisions occur. It is directly related tothe mean-free path and dissipation frequencies for momentumand energy dissipation for all energy U according to [50]
!e = !m
##m
3#e. (2)
The comparison of !e and !m with the radius r of theplasma channel shows that a nonlocal behavior of the electroncomponent takes place [6]. When averaging !e over theenergy space using f0(U )/ne obtained from the solution ofthe electron Boltzmann equation at E/N = 2 Td (see below),a mean energy dissipation length &!e' of 196 µm results. Thecorresponding mean electron energy is about 3.3 eV, and it
046404-5
TOMAS HODER et al. PHYSICAL REVIEW E 84, 046404 (2011)
(a)
0 5 10 15 20 25U [eV]
105106107108109
1010101110121013
Fre
quen
cy [s
-1]
!m
!e
"rf(60 kHz)
(b)
0 5 10 15 20 25U [eV]
10-5
10-4
10-3
10-2
10-1
100
Leng
th [c
m]
#m
#e
r
FIG. 9. Characteristic frequencies (a) and lengths (b) in argon atatmospheric pressure.
conforms to the mean energy in the transition region fromglow to constricted mode obtained in [17,49].
It is known that discharges are similar if their similarityparameters coincide. Furthermore, the spatial limit of theradial discharge size in low-pressure and diffuse high-pressuredischarges is determined by the dimension of the vessel (i.e.,the radius of the discharge tube). However, in constricteddischarges at atmospheric pressure, the radius of the dischargeis determined by the plasma parameters themselves. Thus,the energy transport decreases rapidly beyond the plasmaradius [49].
Based on this approach, the striated microdischarge inthe first mode of the discharge operation can be describedsimilarly to glow discharges at low and medium pressure withscaling parameters i/r ! 0.13 A/cm, pr ! 5 Torr cm, and3 ! !/r ! 5. These values are based on the mean values of theparameters i = 0.8 mA, r = 60 µm and ! within the intervalfrom 200 to 300 µm. Note that the estimated mean energydissipation length &!e' is in agreement with the measuredperiod length !.
It is known from low-pressure discharges that probes [15]or lasers [16] trigger distortions relaxing as spatially periodicstructures. The spatial distance of neighboring striationscorresponds to the wavelength of the relaxing structurewith periodically repeating plasma parameters. The plasma
parameters, at which the transition from the diffuse to theconstricted discharge form occurs, offer another possibilityfor triggering a particle density gradient. Spatially relaxingstructures with !/r ! 2.5 have been observed in [17] wherethe structures originated at the interface between the diffuseand the constricted form of the column plasma of argondischarges at medium pressure up to 120 Torr. Such structureswere also observed in comparable discharges in neon [6] with!/r values between 1 and 6. Thus, the values of !/r of therelaxing structures in the microdischarge investigated hereranging from 3 to 5 are in good agreement with the resultsreported in [6,17].
It is important to mention that the diameter of the cathodespot has a value of 120 µm and is equal to the diameter ofthe plasma channel in the gap during the creation of the glowregime of the microdischarge [cf. Fig. 7(a)]. However, whenthe striated structure develops and appears at higher current,the diameter of the cathode spot grows and reaches a valueof about 0.7 mm. This result is reminiscent of the behaviorof normal glow discharges at low pressure [51], where thesurface current density of the cathode spot remains stable whenvarying the current. The observed increase of the cathode layerarea at the higher current and the constant diameter of theplasma channel in the gap are accompanied by different currentdensities in both discharge regions. We assume, therefore, thatthe disturbance caused by the constriction at the transitionbetween cathode layer at the surface and the plasma channelin the gap results in a spatial electron relaxation in whichthe electron density gradient in the transition area initiatesthe relaxation process in the plasma channel. In the courseof the relaxation process resulting from that disturbance of theionization budget, a spatially periodic electric field due to theresulting space charge densities is established [16].
In order to estimate the electric field strength in theconstricted plasma column, the relation [52,53]
! = Uex
e|E0|(3)
can be applied. It correlates the spatial period ! of the striationswith the threshold energy Uex of the lowest electron excitationprocess of ground-state atoms and the period-averaged electricfield E0, where e denotes the elementary charge. Using theexcitation energy of the 4s[3/2]2 level of argon at 11.55 eV,an electric field strength between 385 and 580 V/cm isobtained corresponding to E0/N values in the range from1.6 to 2.4 Td. It corresponds approximately to the resultsin [49] for argon discharges at 500 Torr around the transitionregion from the diffuse to the constricted mode as wellas in Ref. [6] for argon discharges at low pressure. Theobserved luminosity results mainly from the 4p[3/2]2 levelof argon, which is generated mainly by electron impactexcitation of the (spatially varying) 4s levels at atmosphericpressure.
For a more exact description of the mechanism of striationcreation observed, self-consistent modeling using, for exam-ple, an approach similar to that reported in Refs. [14,16] isrequired. Because of the complexity of a such self-consistentapproach, a study of the electron kinetics at given dischargeparameters has been performed. To illustrate that the observedevent is similar to the spatial electron relaxation, the spatial
046404-6

STRIATED MICRODISCHARGES IN AN ASYMMETRIC . . . PHYSICAL REVIEW E 84, 046404 (2011)
evolution of the electrons in the gap region of the microdis-charge, acted upon by a modulated electric field typical ofstriations, has been investigated applying the kinetic approachgiven in [54]. Using the spatially periodic electric field [55]
E(z) = E0[1 + % sin(2&z/!)], (4)
with the period-averaged field E0 = "500 V, the modulationdegree % = 0.9, and ! according to Eq. (3) for the spatialregion from the metal electrode at z = 0 and the dielectricanode at z = 0.15 cm, the axially inhomogeneous Boltzmannequation of the electrons including electron-electron collisionshas been solved numerically for argon gas at atmosphericpressure and a gas temperature of 300 K using the solu-tion method described in [56]. Therefore, the Gaussian-likefunction
g(U ) = i
e&r2
h(U )(
2/me
$ %0 Uh(U )dU/3
,
(5)
h(U ) = U exp!
"%
U " Uc
Uw
&2",
with the center energy Uc = 2 eV and the energy width Uw =0.5 eV and partial electron reflection with a probability of 80%have been employed at the metal electrode and the dielectricanode, respectively.
Figure 10 shows the resulting spatial behavior of theelectron density ne, mean energy ue, and isotropic distributionf0(z,U ) for the influx density i/(&r2) = 7 A/cm2 correspond-ing to the scaling parameters derived. The density and mean en-ergy of the electrons vary periodically around 8.3 ) 1013 cm"3
and 3.3 eV, respectively. Their pronounced, spatially periodicstructures are mainly caused by the action of the modulatedelectric field under the conditions considered. The energeticbackscattering of electrons by inelastic collisions with the gasatoms is of minor importance for the density and mean energybehavior, but it leads to a certain reduction of the high energypart of the distribution function illustrated in Fig. 10(b). Theperiodic modulation of the isotropic distribution also leads toa spatial alteration of the corresponding rate coefficients forstepwise ionization and stepwise excitation. The latter processis mainly responsible for the generation of the 4p and 4p#
levels emitting the light pictured by the iCCD camera.
IV. SUMMARY
The striated structure of microdischarges in asymmetricdielectric barrier discharges in argon at atmospheric pressurehas been observed and analyzed by means of electrical mea-surements correlated with intensified CCD camera imaging.Depending on the applied voltage, three different modes ofthe discharge operation could be distinguished at argon flowrates above 100 SCCM. The main features of these modes havebeen given.
The first mode of the discharge operation occurring closeto the burning voltage has been analyzed in more detail. Itfeatures a striated microdischarge when the metal electrodeis the cathode and appears as a normal microdischarge in thebarrier discharge in the other half period when the dielectricrepresents the cathode. The striated structures of the plasmacolumn arise only if a second current peak develops after the
(a)
00.050.10.15z [cm]
0
0.5
1
n e(z)
[1014
cm
-3]
00.050.10.15z [cm]
2
3
4
5
6
7
ue (z) [eV
]
0
0.5
1
-E(z
) [k
V/c
m]
mean energy
metalelectrode
dielectricanode
density
(b)
FIG. 10. Spatial evolution of the density and mean energy of theelectrons (a) and of the isotropic distribution f0(z,U ) (b) in argon atatmospheric pressure under the action of the periodic field (4).
occurrence of a first small current peak and of an adjacentplateau with a constant current of about 0.2 mA above thecapacitive current. But it still remains afterwards for currentsof about 0.1 mA above the capacitive current. This hysteresisbehavior clearly indicates that nonlinear plasma processes takeplace.
The striated microdischarge of the first mode can be char-acterized as a transient atmospheric-pressure glow discharge.The application of the scaling law theory shows that it canbe described by the similarity parameters i/r ! 0.13 A/cm,pr ! 5 Torr cm, and 3 ! !/r ! 5. An estimation of thespatially averaged electric field within the plasma channelleads to a reduced field strength between 1.6 and 2.4 Td. Thiswork shows that the scaling law theory is also well applicableto transient atmospheric-pressure discharges.
The analysis of the spatially periodic luminous structureobserved leads to the conclusion that they result from aspatial electron relaxation initiated by a local disturbance. Theconstriction of the discharge between the cathode layer and
046404-7

TOMAS HODER et al. PHYSICAL REVIEW E 84, 046404 (2011)
the plasma column within the gap (electron density gradient)is assumed to be the cause of the disturbance. This finding issupported by the results obtained from kinetic studies of theelectrons based on the solution of the spatially inhomogeneouselectron Boltzmann equation. Spatiotemporally resolved spec-troscopic measurements are intended to further clarify themechanisms of striated microdischarges.
ACKNOWLEDGMENTS
The authors are grateful to Markus Becker for useful con-sultations and supplying data. This work was partly supportedby the Federal German Ministry of Education and Researchwithin project BMBF FKZ 13N9779 and FKZ 03FO1072 andby the Deutsche Forschungsgemeinschaft within SFB TR 24.
[1] A. V. Nedospasov, Sov. Phys. Usp. 11, 174 (1968).[2] N. L. Oleson and A. W. Cooper, Adv. Electron. Electron Phys.
24, 155 (1968).[3] L. Pekarek, Sov. Phys. Usp. 11, 188 (1968).[4] A. Garscadden, in Gaseous Electronics, edited by M. N.
Hirsh and H. J. Oskam, Vol. 1 (Acamedic, New York, 1978),pp. 65–107.
[5] P. S. Landa, N. A. Miskinova, and Y. V. Ponomarev, Sov. Phys.Usp. 23, 813 (1980).
[6] V. I. Kolobov, J. Phys. D 39, R487 (2006).[7] D. Staack, B. Farouk, A. Gutsol, and A. Fridman, Plasma
Sources Sci. Technol. 17, 025013 (2008).[8] N. Shirai, S. Ibuka, and S. Ishii, IEEE Trans. Plasma Sci. 36,
960 (2008).[9] Y. Yang, J. J. Shi, J. E. Harry, J. Proctor, C. Garner, and M. G.
Kong, IEEE Trans. Plasma Sci. 33, 302 (2005).[10] F. Iza and J. A. Hopwood, IEEE Trans. Plasma Sci. 33, 306
(2005).[11] G. N. Churilov, V. A. Lopatin, P. V. Novikov, and N. G. Vnukova,
Instrum. Exp. Tech. 44, 519 (2001).[12] C. H. Yong, S. U. Han, and J. Y. Won, Appl. Phys. Lett. 93,
051504 (2008).[13] J. Schafer, R. Foest, A. Ohl, and K.-D. Weltmann, Plasma Phys.
Controlled Fusion 51, 124045 (2009).[14] S. Arndt, F. Sigeneger, H. Testrich, and C. Brandt, Plasma Chem.
Plasma Process. 25, 567 (2005).[15] C. Brandt, H. Testrich, R. Kozakov, and C. Wilke, Rev. Sci.
Instrum. 77, 023504 (2006).[16] F. Sigeneger and D. Loffhagen, IEEE Trans. Plasma Sci. 35,
1260 (2007).[17] N. A. Dyatko, Y. Z. Ionikh, I. V. Kochetov, D. L. Marinov,
A. V. Meshchanov, A. P. Napartovich, F. B. Petrov, and S. A.Starostin, J. Phys. D 41, 055204 (2008).
[18] Non-Equilibrium Air Plasmas at Atmospheric Pressure, editedby K. H. Becker, U. Kogelschatz, K. H. Schoenbach, and R. J.Barker (Institute of Physics Publishing, Bristol, 2005).
[19] T. Braun, J. A. Lisboa, and J. A. C. Gallas, Phys. Rev. Lett. 68,2770 (1992).
[20] T. Braun, J. A. Lisboa, R. E. Francke, and J. A. C. Gallas, Phys.Rev. Lett. 59, 613 (1987).
[21] H. Shi, Y. Wang, and D. Wang, Phys. Plasmas 15, 122306 (2008).[22] P. Y. Cheung and A. Y. Wong, Phys. Rev. Lett. 59, 551 (1987).[23] P. Y. Cheung, S. Donovan, and A. Y. Wong, Phys. Rev. Lett. 61,
1360 (1988).[24] J. Qin, L. Wang, D. P. Yuan, P. Gao, and B. Z. Zhang, Phys. Rev.
Lett. 63, 163 (1989).[25] J. Guikema, N. Miller, J. Niehof, M. Klein, and M. Walhout,
Phys. Rev. Lett. 85, 3817 (2000).
[26] M. Klein, N. Miller, and M. Walhout, Phys. Rev. E 64, 026402(2001).
[27] D. Venzke, E. Hayess, and K. Wojaczek, Contrib. Plasma Phys.6, 365 (1966).
[28] C. Wilke, B.-P. Koch, and B. Bruhn, Phys. Plasmas 12, 033501(2005).
[29] C. E. Moore, Atomic Energy Levels, Circular of the NationalBureau of Standards 467, Vol. 1 (US Government PrintingOffice, Washington, DC, 1949).
[30] J. E. Sansonetti and W. C. Martin, J. Phys. Chem. Ref. Data 34,1559 (2005).
[31] O. Zatsarinny and K. Bartschat, J. Phys. B 37, 4693 (2004).[32] H. Leyh, D. Loffhagen, and R. Winkler, Comput. Phys.
Commun. 113, 33 (1998).[33] M. Hayashi, National Institute for Fusion Science, Report No.
NIFS-DATA-72 (2003).[34] The Siglo Data base, CPAT, and Kinema Software,
http://www.siglo-kinema.com.[35] W. H. Long, W. F. Bailey, and A. Garscadden, Phys. Rev. A 13,
471 (1976).[36] K. Loudova and P. David, Czech. J. Phys. B 23, 1018 (1973).[37] Z. L. Petrovic, I. Stefanovic, S. Vrhovac, and J. Zivkovic, J.
Phys. IV France 7, 341 (1997).[38] Z. L. Petrovic and A. V. Phelps, Phys. Rev. E 56, 5920
(1997).[39] S. B. Vrhovac and Z. L. Petrovic, Phys. Rev. E 53, 4012
(1996).[40] N. Shirai, H. Shito, S. Ibuka, and S. Ishii, Appl. Phys. Express
2, 076001 (2009).[41] V. I. Arkhipenko, A. A. Kirillov, Y. A. Safronau, and L. V.
Simonchik, Eur. Phys. J. D 60, 455 (2010).[42] W. Kaufmann, Ann. Phys. (Berlin) 307, 158 (1900).[43] R. Brandenburg, Z. Navratil, J. Jansky, P. St’ahel, D. Trunec,
and H.-E. Wagner, J. Phys. D 42, 085208 (2009).[44] N. Merbahi, N. Sewraj, F. Marchal, Y. Salamero, and P. Millet,
J. Phys. D 37, 1664 (2004).[45] P. Kloc, H.-E. Wagner, D. Trunec, Z. Navratil, and G. Fedoseev,
J. Phys. D 43, 345205 (2010).[46] J. L. Walsch, F. Iza, N. B. Janson, V. J. Law, and M. G. Kong, J.
Phys. D 43, 075201 (2010).[47] F. Gao, S. X. Zhao, X. S. Li, and Y. N. Wang, Phys. Plasmas 17,
103507 (2010).[48] G. M. Petrov and C. M. Ferreira, Phys. Rev. E 59, 3571
(1999).[49] M. Gnybida, D. Loffhagen, and D. Uhrlandt, IEEE Trans. Plasma
Sci. 37, 1208 (2009).[50] R. Winkler, D. Loffhagen, and F. Sigeneger, Appl. Surf. Sci.
192, 50 (2002).
046404-8

STRIATED MICRODISCHARGES IN AN ASYMMETRIC . . . PHYSICAL REVIEW E 84, 046404 (2011)
[51] Y. P. Raizer, Gas Discharge Physics (Springer-Verlag, Berlin,1997).
[52] L. D. Tsendin, Sov. J. Plasma Phys. 8, 96 (1982).[53] Y. B. Golubovskii, R. V. Kozakov, J. Behnke, C. Wilke, and
V. O. Nekutchaev, Phys. Rev. E 68, 026404 (2003).
[54] F. Sigeneger and R. Winkler, Plasma Chem. Plasma Process. 17,281 (1997).
[55] F. Sigeneger, Yu. B. Golubovskii, I. A. Porokhova, and R.Winkler, Plasma Chem. Plasma Process. 18, 153 (1998).
[56] D. Loffhagen, Plasma Chem. Plasma Process. 25, 519 (2005).
046404-9