strategic plan 2022–2025
TRANSCRIPT
Ignitis Group │ 2022 February
Strategic Plan
2022–2025
Disclaimer
This document contains certain forward-looking statements, which include, without limitation, any statements preceded by, followed by or that include the words "may",
"will", "would", "should", "expect", "intend", "estimate", "forecast", "anticipate", "project", "believe", "seek", "plan", "predict", "continue", "commit", "target", "undertaking"
and similar expressions or their negatives.
Such forward-looking statements are based on Ignitis Group's current views and numerous assumptions regarding the Group's present and future business strategies
and the environment in which the Group will operate in the future. Although Ignitis Group believes that the estimates and projections reflected in the forward-looking
statements are reasonable, they involve inherent known and unknown risks, uncertainties and other important factors beyond Ignitis Group's control that could cause its
actual results, performance or achievements to be materially different from future results, performance or achievements expressed or implied by such forward-looking
statements or from the past results, performance or achievements of Ignitis Group. As a result, you should not rely on these forward-looking statements. The military
attack recently launched by Russia in Ukraine and uncertainties related to the changing political situation in the region may have a significant impact to markets volatility
and the projections/assumptions used in the Strategic 2022-2025 plan of Ignitis Group.
Unless required by law, Ignitis Group is under no duty and undertakes no obligation to update or revise any forward-looking statement after the distribution of this
document, whether as a result of new information, future events or otherwise.
2 / 45
Strategic Plan 2022–2025 Content >
Content
Annexes 38
3 / 45
1. Business overview 4
2. Strategic focus 7
3. Green Generation 11
4. Networks 17
6. Flexible Generation 25
5. Customers & Solutions 23
7. Pathway to sustainability 27
8. Financials 30
9. Highlights 35
Content >
4 / 45
Business overview
Content >
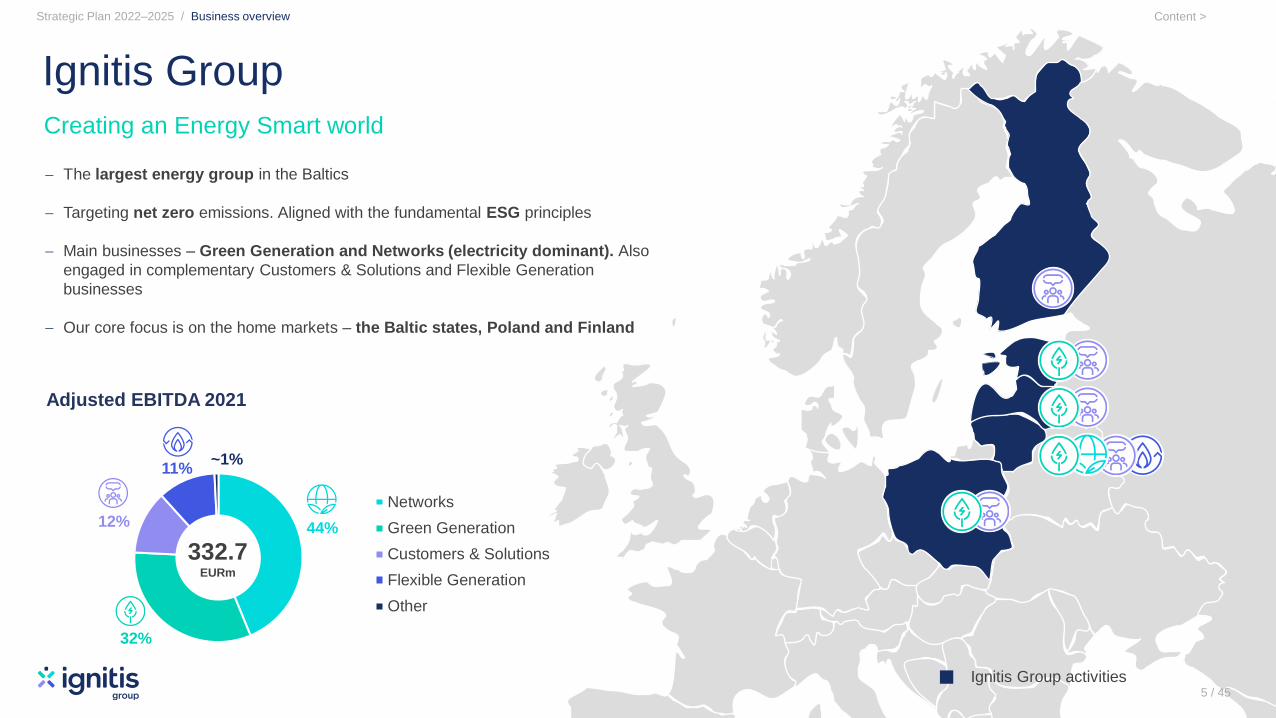
44%
32%
12%
11%~1%
Adjusted EBITDA 2021
Networks
Green Generation
Customers & Solutions
Flexible Generation
Other
Ignitis Group
Ignitis Group activities
332.7EURm
Strategic Plan 2022–2025 / Business overview
5 / 45
Creating an Energy Smart world
− The largest energy group in the Baltics
− Targeting net zero emissions. Aligned with the fundamental ESG principles
− Main businesses – Green Generation and Networks (electricity dominant). Also
engaged in complementary Customers & Solutions and Flexible Generation
businesses
− Our core focus is on the home markets – the Baltic states, Poland and Finland
Content >
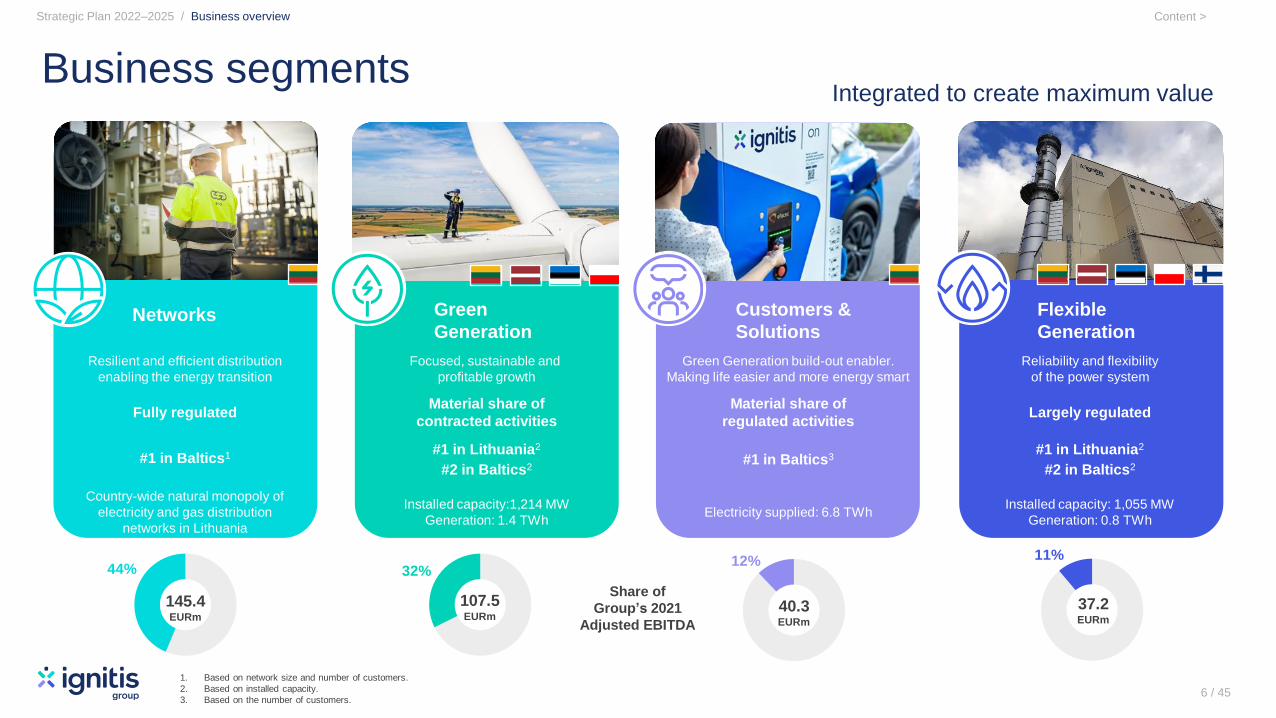
Networks Green
Generation
Customers &
Solutions
Flexible
Generation
Resilient and efficient distribution
enabling the energy transition
Focused, sustainable and
profitable growth
Green Generation build-out enabler.
Making life easier and more energy smart
Reliability and flexibility
of the power system
Fully regulatedMaterial share of
contracted activities
Material share of
regulated activitiesLargely regulated
#1 in Baltics1 #1 in Lithuania2
#2 in Baltics2#1 in Baltics3
#1 in Lithuania2
#2 in Baltics2
Country-wide natural monopoly of
electricity and gas distribution
networks in Lithuania
Installed capacity:1,214 MW
Generation: 1.4 TWhElectricity supplied: 6.8 TWh
Installed capacity: 1,055 MW
Generation: 0.8 TWh
Business segments
Strategic Plan 2022–2025 / Business overview
1. Based on network size and number of customers.
2. Based on installed capacity.
3. Based on the number of customers.
Integrated to create maximum value
6 / 45
32%
107.5EURm
Share of
Group’s 2021
Adjusted EBITDA
12%
40.3EURm
44%
145.4EURm
11%
37.2EURm
Content >

7 / 45
Strategic focus
Content >
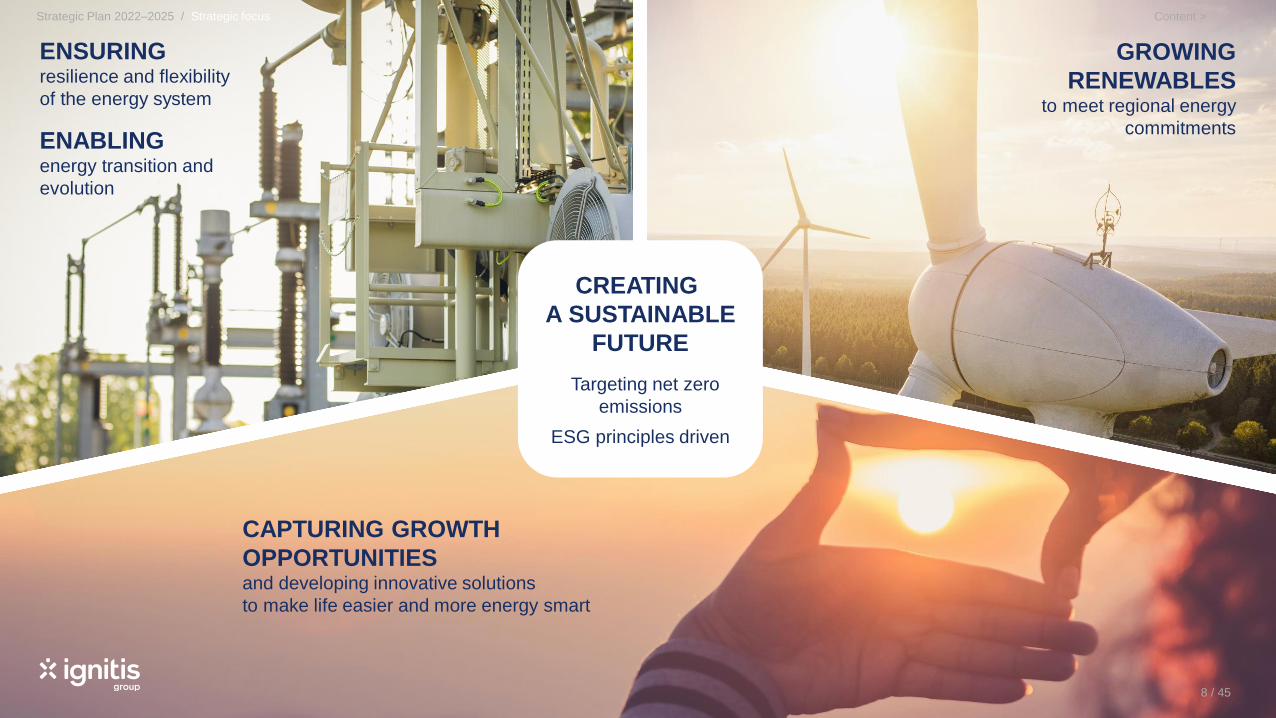
ENSURING resilience and flexibility
of the energy system
ENABLING energy transition and
evolution
CREATING
A SUSTAINABLE
FUTURE
Targeting net zero
emissions
ESG principles driven
CAPTURING GROWTH
OPPORTUNITIESand developing innovative solutions
to make life easier and more energy smart
GROWING
RENEWABLESto meet regional energy
commitments
8 / 45
Strategic Plan 2022–2025 / Strategic focus Content >
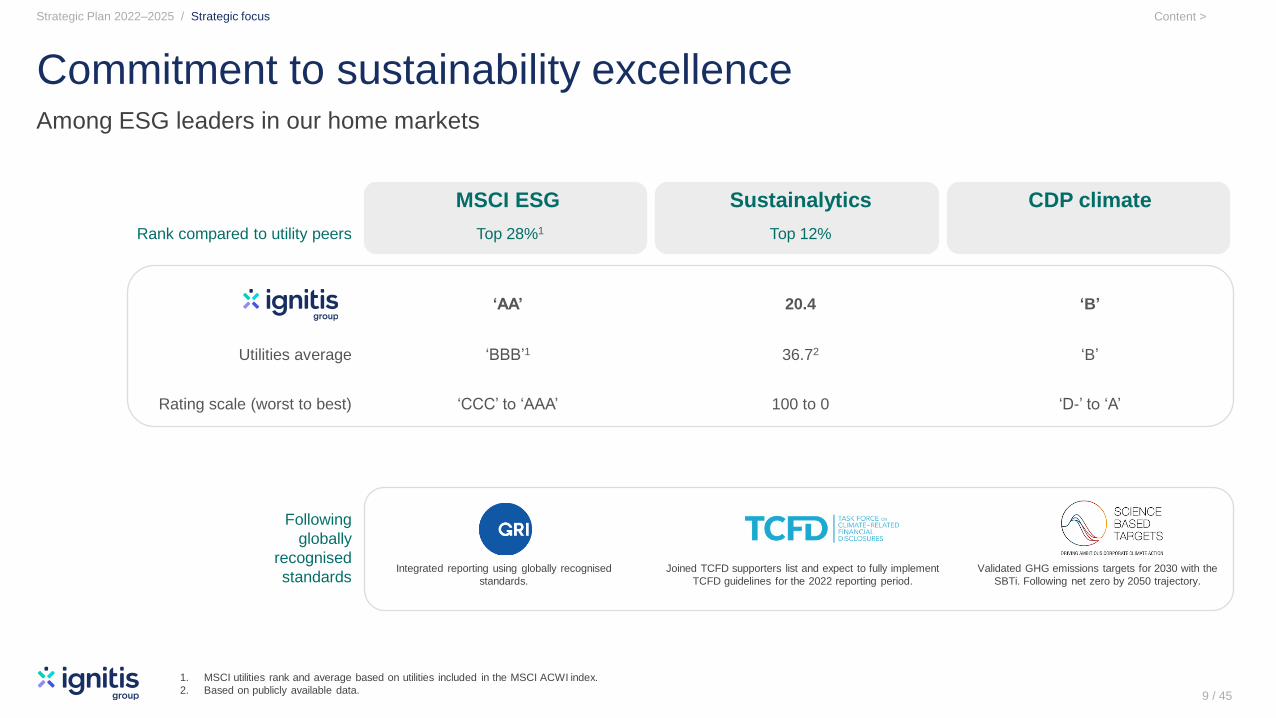
1. MSCI utilities rank and average based on utilities included in the MSCI ACWI index.
2. Based on publicly available data.9
Commitment to sustainability excellence
Strategic Plan 2022–2025 / Strategic focus
9 / 45
MSCI ESG Sustainalytics CDP climate
Rank compared to utility peers Top 28%1 Top 12%
‘AA’ 20.4 ‘B’
Utilities average ‘BBB’1 36.72 ‘B’
Rating scale (worst to best) ‘CCC’ to ‘AAA’ 100 to 0 ‘D-’ to ‘A’
Following
globally
recognised
standards
Among ESG leaders in our home markets
Integrated reporting using globally recognised
standards.
Joined TCFD supporters list and expect to fully implement
TCFD guidelines for the 2022 reporting period.
Validated GHG emissions targets for 2030 with the
SBTi. Following net zero by 2050 trajectory.
Content >
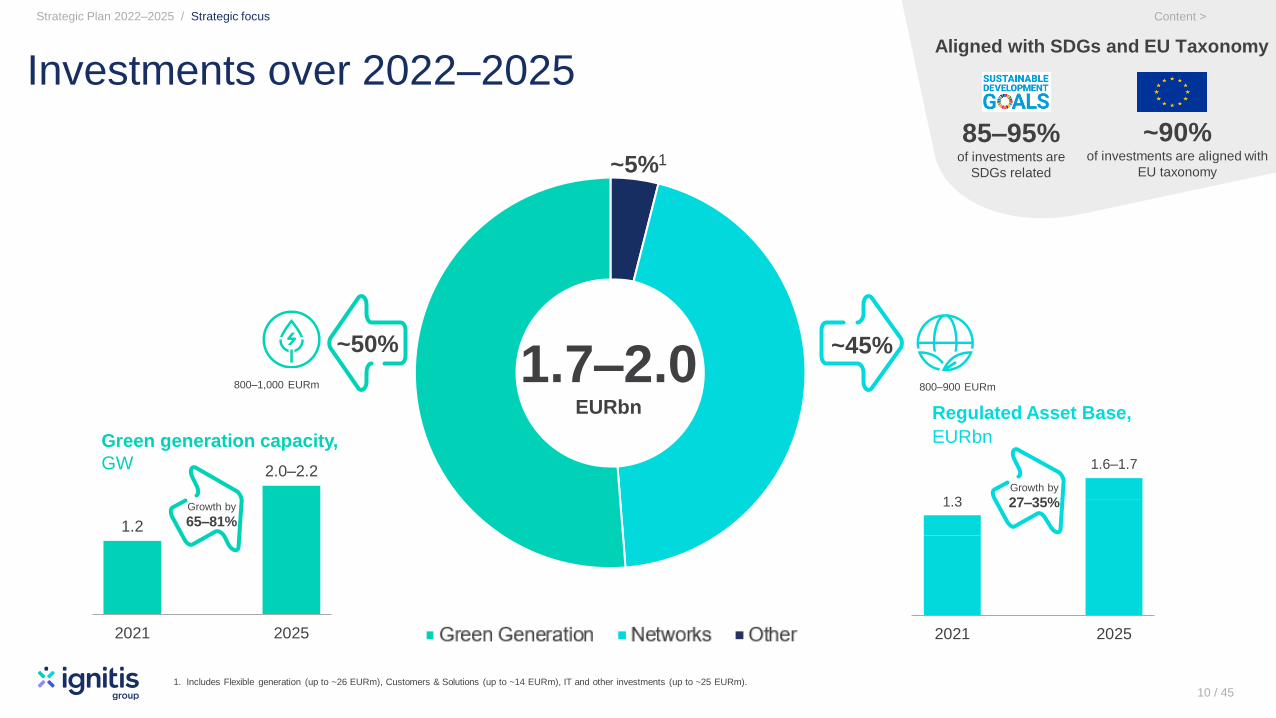
Other Networks Green Generation
Investments over 2022–2025
1.7–2.0EURbn
~50%
~5%1
~45%
Strategic Plan 2022–2025 / Strategic focus
10 / 45
Content >
1.2
2.0–2.2
2021 2025
Green generation capacity,
GW
974
1 421
249
2601.3
0
1.6–1.7
0
500
1000
1500
2000
2500
3000
3500
2021 2025
Regulated Asset Base,
EURbn
Growth by
27–35%Growth by
65–81%
800–1,000 EURm 800–900 EURm
1. Includes Flexible generation (up to ~26 EURm), Customers & Solutions (up to ~14 EURm), IT and other investments (up to ~25 EURm).
Aligned with SDGs and EU Taxonomy
85–95%of investments are
SDGs related
~90%of investments are aligned with
EU taxonomy
Content >
Green GenerationFocused, sustainable and
profitable growth
11 / 45
Content >
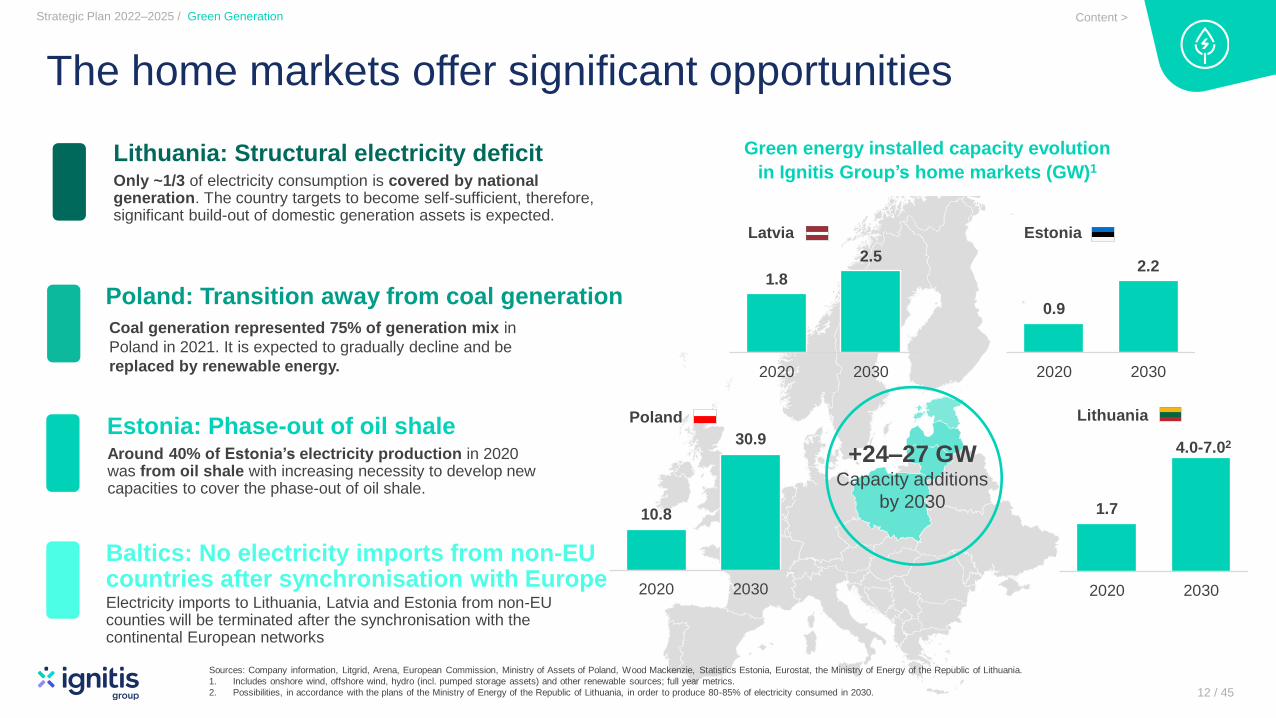
The home markets offer significant opportunities
+24–27 GW Capacity additions
by 203010.8
30.9
2020 2030
1.8
2.5
2020 2030
0.9
2.2
2020 2030
1.7
4.0-7.02
2020 2030
Sources: Company information, Litgrid, Arena, European Commission, Ministry of Assets of Poland, Wood Mackenzie, Statistics Estonia, Eurostat, the Ministry of Energy of the Republic of Lithuania.
1. Includes onshore wind, offshore wind, hydro (incl. pumped storage assets) and other renewable sources; full year metrics.
2. Possibilities, in accordance with the plans of the Ministry of Energy of the Republic of Lithuania, in order to produce 80-85% of electricity consumed in 2030.
Green energy installed capacity evolution
in Ignitis Group’s home markets (GW)1
Poland
Latvia Estonia
Lithuania
Lithuania: Structural electricity deficitOnly ~1/3 of electricity consumption is covered by national generation. The country targets to become self-sufficient, therefore, significant build-out of domestic generation assets is expected.
Poland: Transition away from coal generation
Coal generation represented 75% of generation mix in
Poland in 2021. It is expected to gradually decline and be
replaced by renewable energy.
Estonia: Phase-out of oil shaleAround 40% of Estonia’s electricity production in 2020 was from oil shale with increasing necessity to develop newcapacities to cover the phase-out of oil shale.
Strategic Plan 2022–2025 / Green Generation
12 / 45
Baltics: No electricity imports from non-EU countries after synchronisation with EuropeElectricity imports to Lithuania, Latvia and Estonia from non-EU counties will be terminated after the synchronisation with the continental European networks
Content >
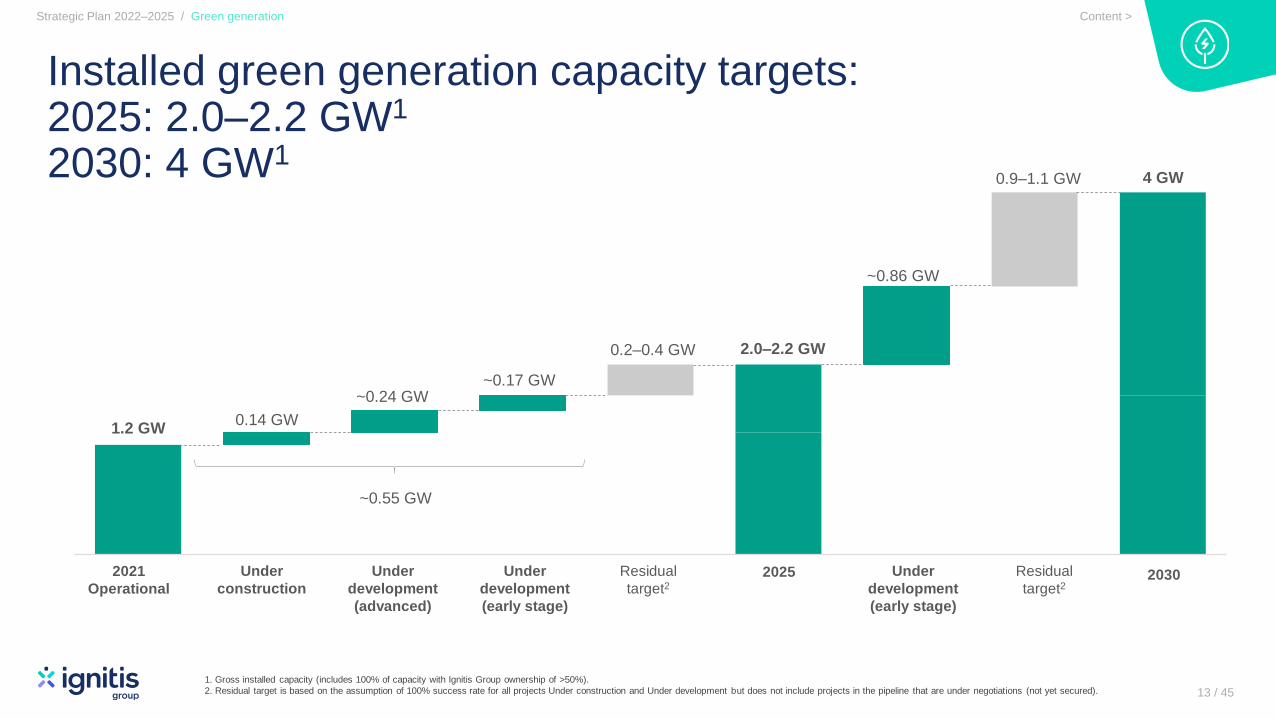
2025
1.2 GW0.14 GW
0.2–0.4 GW 2.0–2.2 GW
4 GW0.9–1.1 GW
2021
Operational
Strategic Plan 2022–2025 / Green generation
13 / 45
Installed green generation capacity targets:2025: 2.0–2.2 GW1
2030: 4 GW1
2030Under
construction
~0.24 GW~0.17 GW
Residual
target2
~0.86 GW
Under
development
(advanced)
Under
development
(early stage)
Residual
target2Under
development
(early stage)
1. Gross installed capacity (includes 100% of capacity with Ignitis Group ownership of >50%).
2. Residual target is based on the assumption of 100% success rate for all projects Under construction and Under development but does not include projects in the pipeline that are under negotiations (not yet secured).
~0.55 GW
Content >
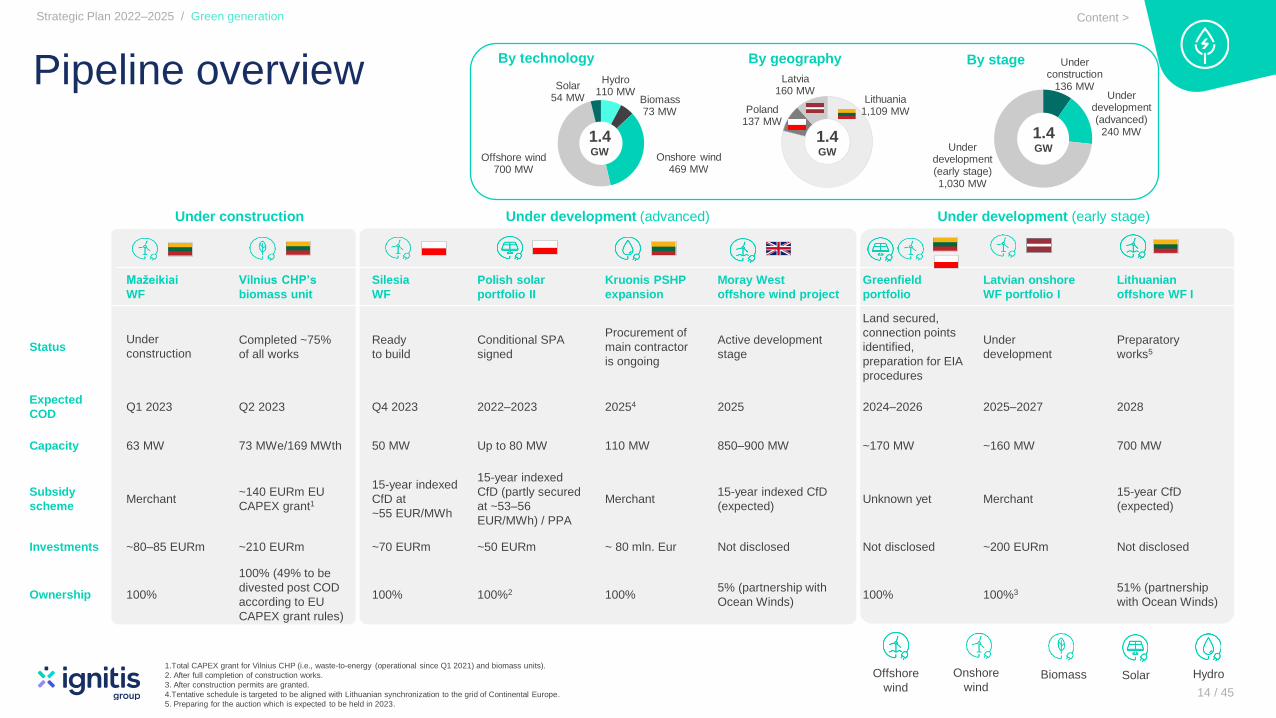
Under construction Under development (advanced) Under development (early stage)
Mažeikiai
WF
Vilnius CHP’s
biomass unit
Silesia
WF
Polish solar
portfolio II
Kruonis PSHP
expansion
Moray West
offshore wind project
Greenfield
portfolio
Latvian onshore
WF portfolio I
Lithuanian
offshore WF I
StatusUnder
constructionCompleted ~75%
of all works
Ready
to build
Conditional SPA
signed
Procurement of
main contractor
is ongoing
Active development
stage
Land secured,
connection points
identified,
preparation for EIA
procedures
Under
development
Preparatory
works5
Expected
CODQ1 2023 Q2 2023 Q4 2023 2022–2023 20254 2025 2024–2026 2025–2027 2028
Capacity 63 MW 73 MWe/169 MWth 50 MW Up to 80 MW 110 MW 850–900 MW ~170 MW ~160 MW 700 MW
Subsidy
schemeMerchant
~140 EURm EU
CAPEX grant1
15-year indexed
CfD at
~55 EUR/MWh
15-year indexed
CfD (partly secured
at ~53–56
EUR/MWh) / PPA
Merchant15-year indexed CfD
(expected)Unknown yet Merchant
15-year CfD
(expected)
Investments ~80–85 EURm ~210 EURm ~70 EURm ~50 EURm ~ 80 mln. Eur Not disclosed Not disclosed ~200 EURm Not disclosed
Ownership 100%
100% (49% to be
divested post COD
according to EU
CAPEX grant rules)
100% 100%2 100%5% (partnership with
Ocean Winds)100% 100%3 51% (partnership
with Ocean Winds)
Content >
Pipeline overview
Strategic Plan 2022–2025 / Green generation
1.Total CAPEX grant for Vilnius CHP (i.e., waste-to-energy (operational since Q1 2021) and biomass units).
2. After full completion of construction works.
3. After construction permits are granted.
4.Tentative schedule is targeted to be aligned with Lithuanian synchronization to the grid of Continental Europe.
5. Preparing for the auction which is expected to be held in 2023.
Onshore
windBiomass Solar HydroOffshore
wind 14 / 45
By technology By geography By stage
Hydro110 MW
Biomass73 MW
Onshore wind469 MW
Offshore wind 700 MW
Solar54 MW
1.4GW
Lithuania1,109 MWPoland
137 MW
Latvia160 MW
1.4GW
Under construction
136 MWUnder
development (advanced)
240 MW
Under development (early stage)1,030 MW
1.4GW
Content >

Base cost ofequity (CAPM)
Developmentstage
Exposure tomerchant
power prices
Technology Project specific Levered IRR Asset rotation Levered IRR(post asset
rotation)
6.8 TWh0.8 TWh
Investment approach
2. Strategic partnerships We aim to partner with strategic investors to adopt new technologies or enter new markets
5. Asset rotation
We intend to sell up to 49% of each project to recycle capital and capture premium
Target return build-up
Strategic Plan 2022–2025 / Green generation
15 / 45
1. Entry stagePrimarily greenfield and early-to-late development stages
4. Sizable offtake capabilitiesWe plan to utilize our supply portfolio to structure offtake agreements and enable Green Generation build-out
Electricity generated vs. supplied
by Ignitis Group in 2021
Generated1 Supplied
1. Excluding opportunistic assets (Elektrėnai, which accounted for 36% of the total generated volume, and Kruonis, with 28% of total generation in 2021).
2. Assuming the whole surplus of electricity supply (6TWh) can be utilised for new wind and solar generation offtake with the load factor of ~35% (80/20 split between wind and solar, with load factors of ~40% and ~20% respectively).
3. Target returnsHigh single to low double digit levered IRR
Risk premia>8x or 6TWh difference
between supply and generation
equivalent to
~2 GW of Green Generation
offtake2.
Content >
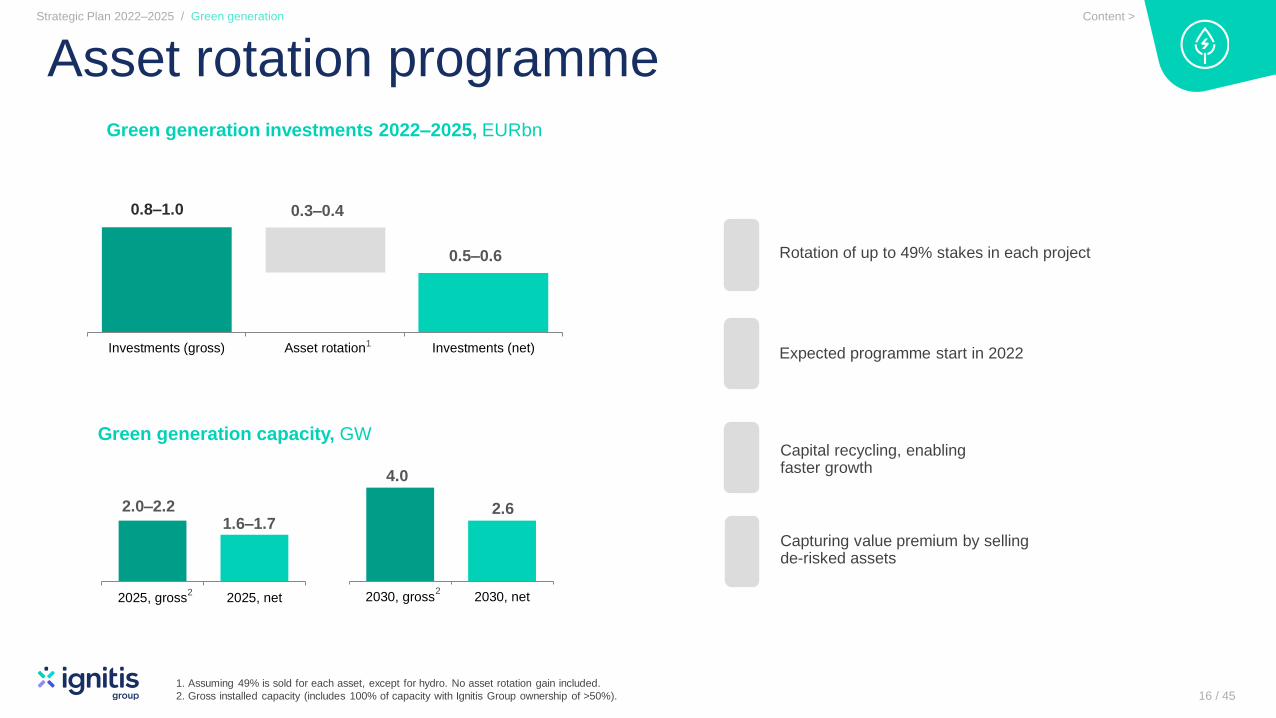
2025, gross 2025, net 2030, gross 2030, net
Investments (gross) Asset rotation Investments (net)
0.8–1.0
Asset rotation programme
1. Assuming 49% is sold for each asset, except for hydro. No asset rotation gain included.
2. Gross installed capacity (includes 100% of capacity with Ignitis Group ownership of >50%). 16 / 45
Strategic Plan 2022–2025 / Green generation
Green generation investments 2022–2025, EURbn
0.3–0.4
0.5–0.6
Green generation capacity, GW
2.0–2.21.6–1.7
4.0
2.6
1
2 2
Expected programme start in 2022
Rotation of up to 49% stakes in each project
Capital recycling, enabling faster growth
Capturing value premium by selling de-risked assets
Content >
Networks Resilient and efficient distribution
enabling energy transition
17 / 45
Content >
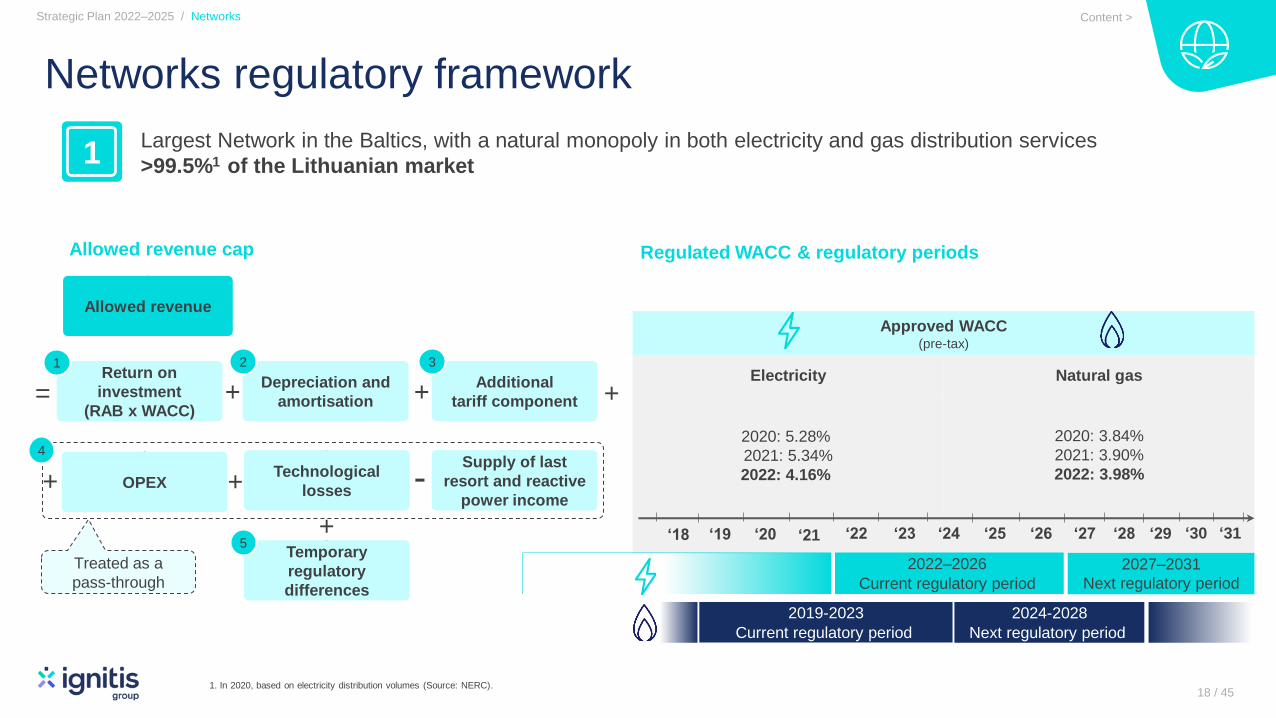
‘21
Approved WACC(pre-tax)
Electricity Natural gas
2020: 5.28%
2021: 5.34%
2022: 4.16%
2020: 3.84%
2021: 3.90%
2022: 3.98%
Networks regulatory framework
Largest Network in the Baltics, with a natural monopoly in both electricity and gas distribution services
>99.5%1 of the Lithuanian market
Allowed revenue cap Regulated WACC & regulatory periods
‘22
2019-2023
Current regulatory period
2022–2026
Current regulatory period
2024-2028
Next regulatory period
2027–2031
Next regulatory period
‘23 ‘24 ‘25 ‘26 ‘27 ‘28‘20‘19‘18
Technological
lossesOPEX
Allowed revenue
Return on
investment
(RAB x WACC)
Depreciation and
amortisation
Supply of last
resort and reactive
power income
Temporary
regulatory
differences
=
+ -
Treated as a
pass-through
1
+
2
4
5+
Additional
tariff component+
3
+
+
Strategic Plan 2022–2025 / Networks
1
18 / 45
‘29 ‘30 ‘31‘21
1. In 2020, based on electricity distribution volumes (Source: NERC).
Content >
Strategic Plan
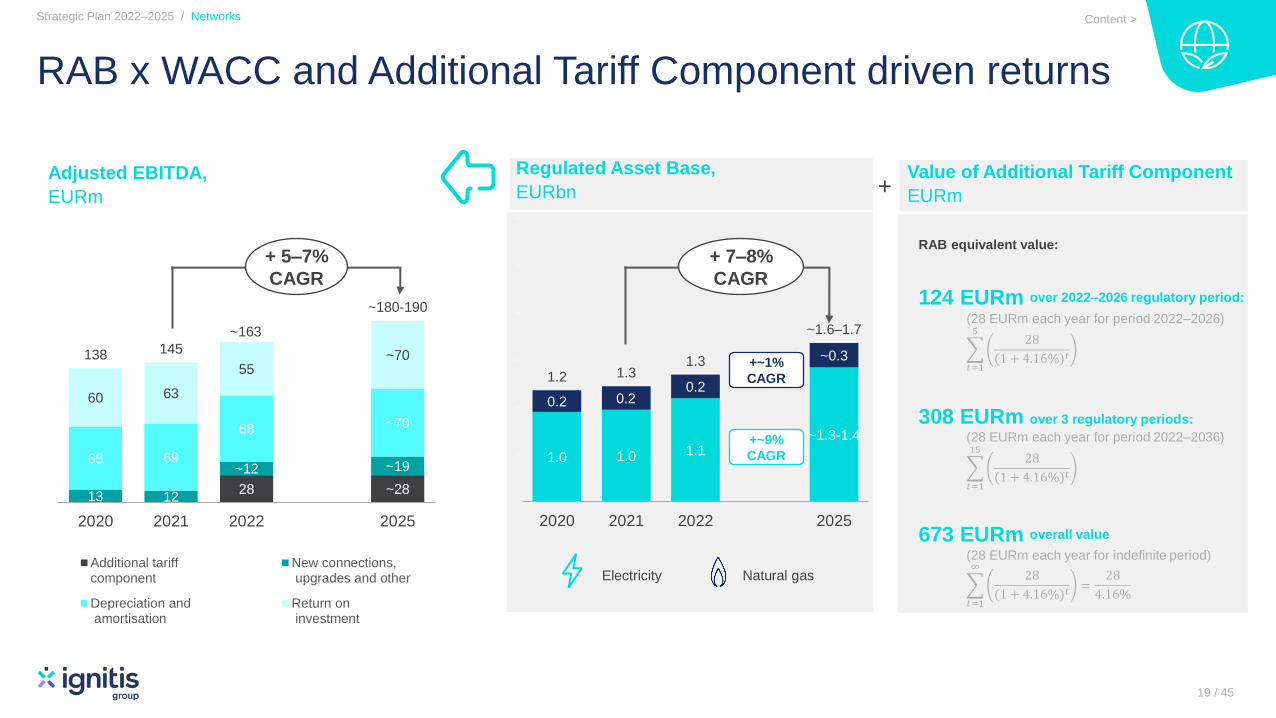
RAB x WACC and Additional Tariff Component driven returns
Regulated Asset Base,
EURbnAdjusted EBITDA,
EURm
28 ~2813 12
~12 ~1965 69
68 ~70
60 63
55~70138 145
~180-190
0
20
40
60
80
100
120
140
160
180
200
2020 2021 2022 2025
Additional tariffcomponent
New connections, upgrades and other
Depreciation and amortisation
Return on investment
1.0 1.0 1.1~1.3-1.4
0.2 0.20.2
~0.3
1.2 1.31.3
~1.6–1.7
0
500
1000
1500
2000
2500
3000
3500
2020 2021 2022 2025
Electricity Natural gas
Strategic Plan 2022–2025 / Networks
Value of Additional Tariff Component
EURm
RAB equivalent value:
124 EURm over 2022–2026 regulatory period:
(28 EURm each year for period 2022–2026)
𝑡=1
528
(1 + 4.16%)𝑡
308 EURm over 3 regulatory periods:
(28 EURm each year for period 2022–2036)
𝑡=1
1528
(1 + 4.16%)𝑡
673 EURm overall value
(28 EURm each year for indefinite period)
𝑡=1
∞28
(1 + 4.16%)𝑡=
28
4.16%
+ 5–7%
CAGR
+ 7–8%
CAGR
19 / 45
~163
+
+~1%
CAGR
+~9%
CAGR
Content >
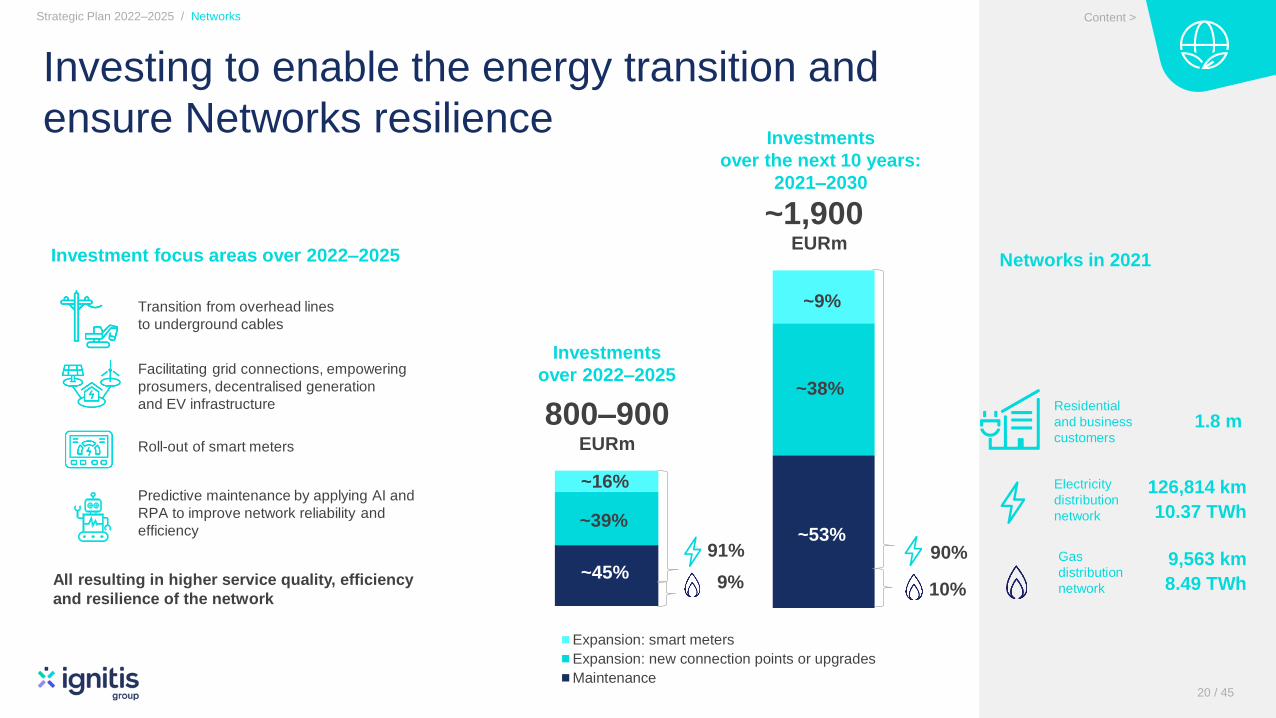
Category 1Expansion: smart meters
Expansion: new connection points or upgrades
Maintenance
0100200300400500600700800900
Category 1
Investing to enable the energy transition and
ensure Networks resilienceInvestments
over the next 10 years:
2021–2030
1.8 mResidential
and business
customers
126,814 km
10.37 TWh
Electricity
distribution
network
Gas
distribution
network
Investments
over 2022–2025
800–900EURm
~1,900EURm
Networks in 2021
Strategic Plan 2022–2025 / Networks
20 / 45
9,563 km
8.49 TWh
91%
9%
90%
10%
~16%
~39%
~45%
Investment focus areas over 2022–2025
All resulting in higher service quality, efficiency
and resilience of the network
Transition from overhead lines
to underground cables
Facilitating grid connections, empowering
prosumers, decentralised generation
and EV infrastructure
Roll-out of smart meters
Predictive maintenance by applying AI and
RPA to improve network reliability and
efficiency
~9%
~38%
~53%
Content >
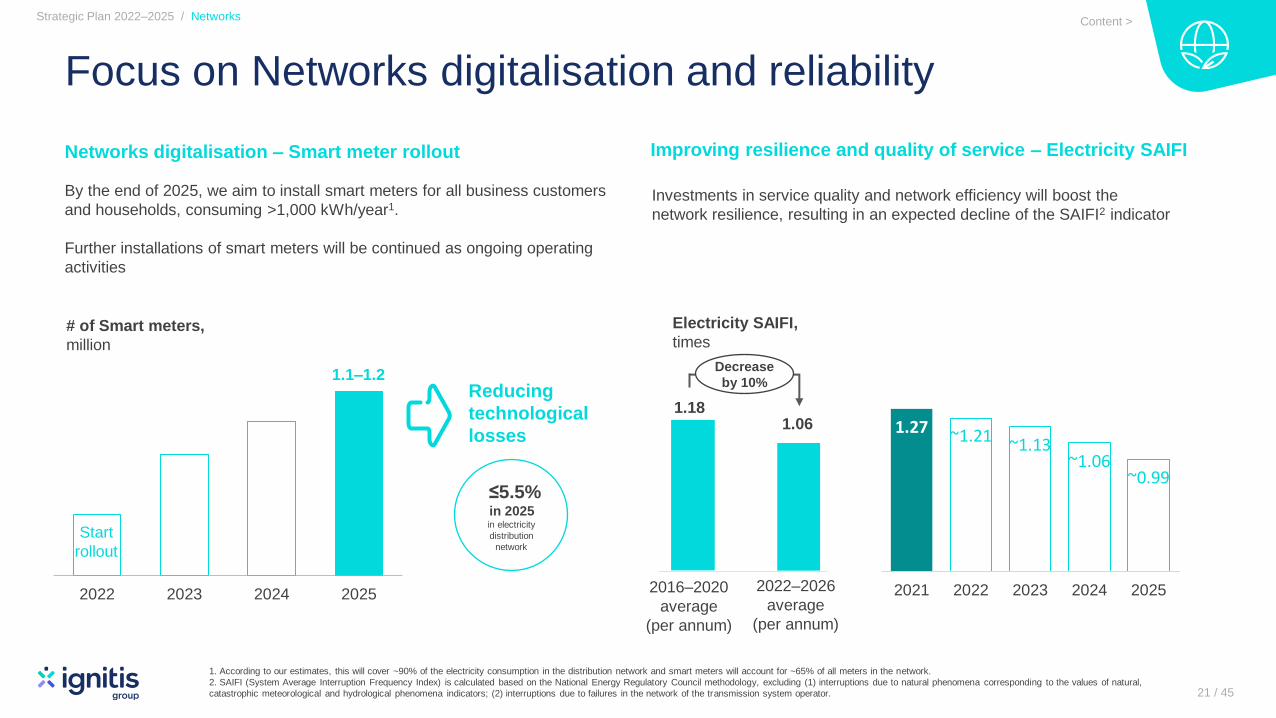
Focus on Networks digitalisation and reliability
Networks digitalisation – Smart meter rollout
1. According to our estimates, this will cover ~90% of the electricity consumption in the distribution network and smart meters will account for ~65% of all meters in the network.
2. SAIFI (System Average Interruption Frequency Index) is calculated based on the National Energy Regulatory Council methodology, excluding (1) interruptions due to natural phenomena corresponding to the values of natural,
catastrophic meteorological and hydrological phenomena indicators; (2) interruptions due to failures in the network of the transmission system operator.
Strategic Plan 2022–2025 / Networks
21 / 45
By the end of 2025, we aim to install smart meters for all business customers
and households, consuming >1,000 kWh/year1.
Further installations of smart meters will be continued as ongoing operating
activities
2022 2023 2024 2025
1.1–1.2
# of Smart meters,
million
Start
rollout
Reducing
technological
losses
≤5.5%in 2025in electricity
distribution
network
1.27 ~1.21 ~1.13~1.06
~0.99 ~76
2021 2022 2023 2024 2025 2026
Decrease
by 10%
1.18
Improving resilience and quality of service – Electricity SAIFI
Investments in service quality and network efficiency will boost the
network resilience, resulting in an expected decline of the SAIFI2 indicator
1.06
2022–2026
average
(per annum)
Electricity SAIFI,
times
2016–2020
average
(per annum)
Content >
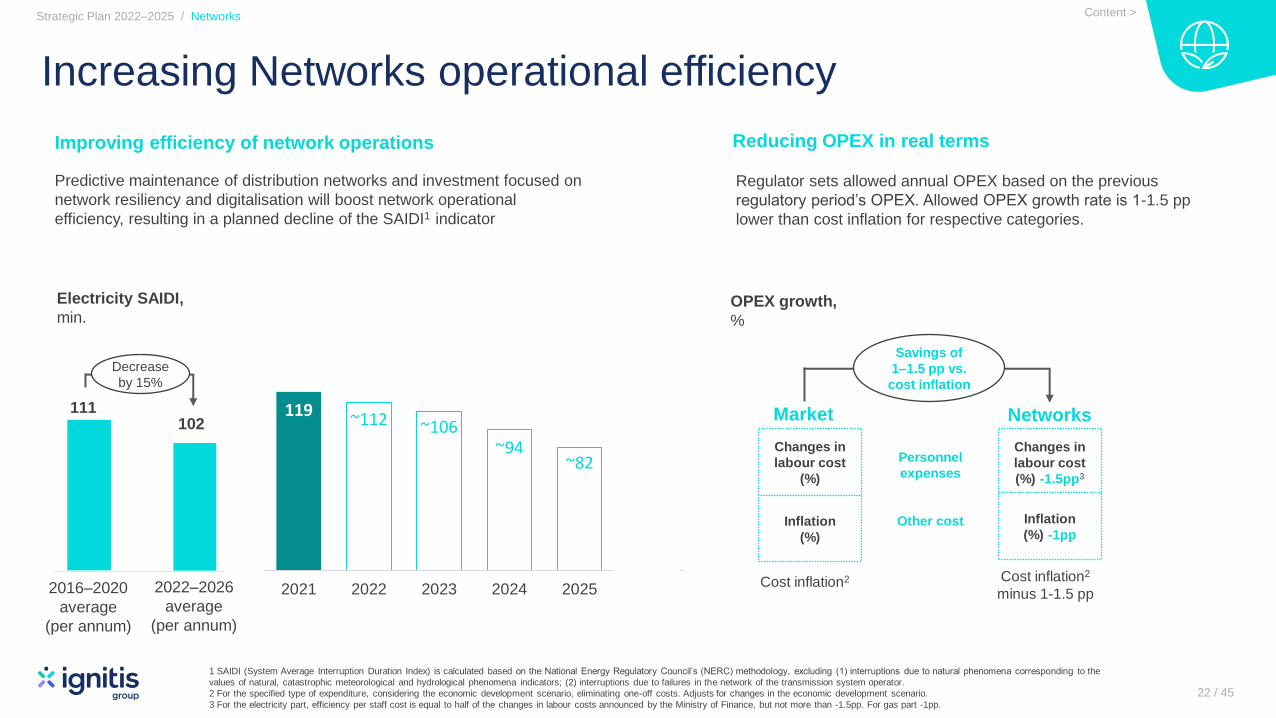
119 ~112 ~106~94
~82
2021 2022 2023 2024 2025 2026
Increasing Networks operational efficiency
Improving efficiency of network operations
Predictive maintenance of distribution networks and investment focused on
network resiliency and digitalisation will boost network operational
efficiency, resulting in a planned decline of the SAIDI1 indicator
1 SAIDI (System Average Interruption Duration Index) is calculated based on the National Energy Regulatory Council’s (NERC) methodology, excluding (1) interruptions due to natural phenomena corresponding to the
values of natural, catastrophic meteorological and hydrological phenomena indicators; (2) interruptions due to failures in the network of the transmission system operator.
2 For the specified type of expenditure, considering the economic development scenario, eliminating one-off costs. Adjusts for changes in the economic development scenario.
3 For the electricity part, efficiency per staff cost is equal to half of the changes in labour costs announced by the Ministry of Finance, but not more than -1.5pp. For gas part -1pp.
Strategic Plan 2022–2025 / Networks
22 / 45
Electricity SAIDI,
min.
2016–2020
average
(per annum)
Reducing OPEX in real terms
Savings of
1–1.5 pp vs.
cost inflation
Regulator sets allowed annual OPEX based on the previous
regulatory period’s OPEX. Allowed OPEX growth rate is 1-1.5 pp
lower than cost inflation for respective categories.
Changes in
labour cost
(%)
OPEX growth,
%
Cost inflation2 Cost inflation2
minus 1-1.5 pp
Inflation
(%)
Changes in
labour cost
(%) -1.5pp3
Inflation
(%) -1pp
Personnel
expenses
Other cost
Decrease
by 15%
111 102
2022–2026
average
(per annum)
Market Networks
Content >
Customers & SolutionsInnovative solutions for easier life
and energy evolution
23 / 45
Content >

Enabling Green Generation build-out.Making life easier and more energy smart for our customers
Strategic Plan 2022–2025 / Customers & Solutions
24 / 45
Utilising synergies with the
Green Generation segment
Large customer base supports the Green
Generation build out through internal
power purchase agreements (PPA’s)
Expanding
in home
markets
We aim to keep the leading position in Lithuania with targeted
70% market share in B2C segment in the deregulated market
at the end of 2023.
1. Retail gas sales plan is in line with SBTi requirements. Scope 3 (sale of natural gas to end-users) target value 2030 (vs. 2020): -25% of GHG emissions (million t CO2 eq).
Reducing GHG emissions from sales of natural gas to end-users (Scope 3) by promoting customer transition from gas to electricity (especially household customers).
24%34%
56%90%
2020 2021 2025 2030
>50%
Green electricity share
in retail supply portfolio, %
~90%
Distributed
Generation
Contributing to our customers' environmental
goals
12.88.9 ~8.4
6.4
6.8 ~8.5
2020 2021 2025
Gas
Electricity
Retail sales volumes, TWh
19.2~16.9
+1.9%
CAGR
15.7
+~5.8%
CAGR
Committed
to reduce
further1
-~1.5%
CAGR
CustomersB2B & B2C
1.6 M in 2021
82
300
2021 2025
Transport
Electrification
EV charging network,
# stations (cumulative)
~4x
Customers
& Solutions
Growing share of green
electricity supplied to
customers (Scope 3).
Developing and scaling innovative energy
solutions and platforms
Remote solar
platform
Green
Generation
>90 MW by the end of 2025
Solar sales
>120 MW over 2022–2025
Largest retail customer
base in the Baltics
Power
Purchase
Agreements
Green energy
supply
Content >
25 / 45
Flexible GenerationReliable and flexible power
system
Content >
Strategic Plan 2022–2025 / Flexible Generation
26 / 45
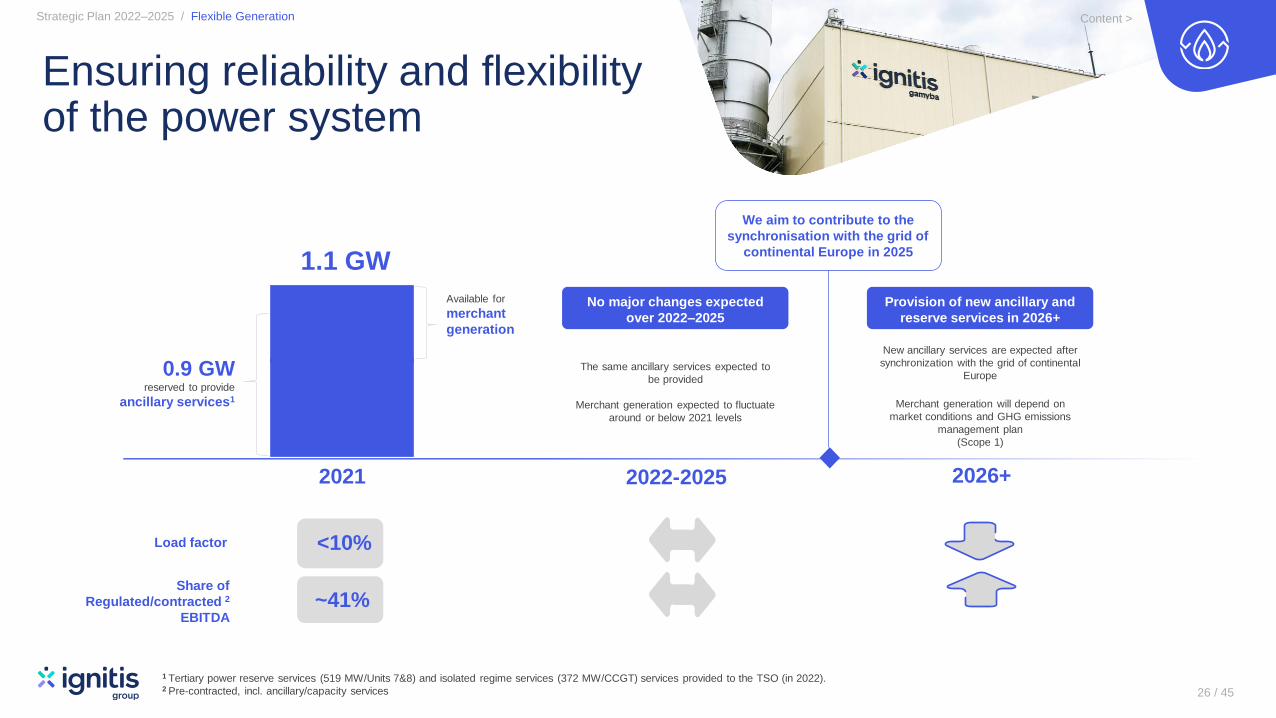
Ensuring reliability and flexibility of the power system
1.1 GW
2021 2022-2025 2026+
<10%
Available for
merchant
generation
0.9 GW reserved to provide
ancillary services1
1 Tertiary power reserve services (519 MW/Units 7&8) and isolated regime services (372 MW/CCGT) services provided to the TSO (in 2022).2 Pre-contracted, incl. ancillary/capacity services
Share of
Regulated/contracted 2
EBITDA
Provision of new ancillary and
reserve services in 2026+
New ancillary services are expected after
synchronization with the grid of continental
Europe
Merchant generation will depend on
market conditions and GHG emissions
management plan
(Scope 1)
Load factor
~41%
No major changes expected
over 2022–2025
The same ancillary services expected to
be provided
Merchant generation expected to fluctuate
around or below 2021 levels
− We aim to contribute to the
synchronisation with the grid of
continental Europe in 2025
Content >
We deliver on our promise of a sustainable future
27 / 45
Content >
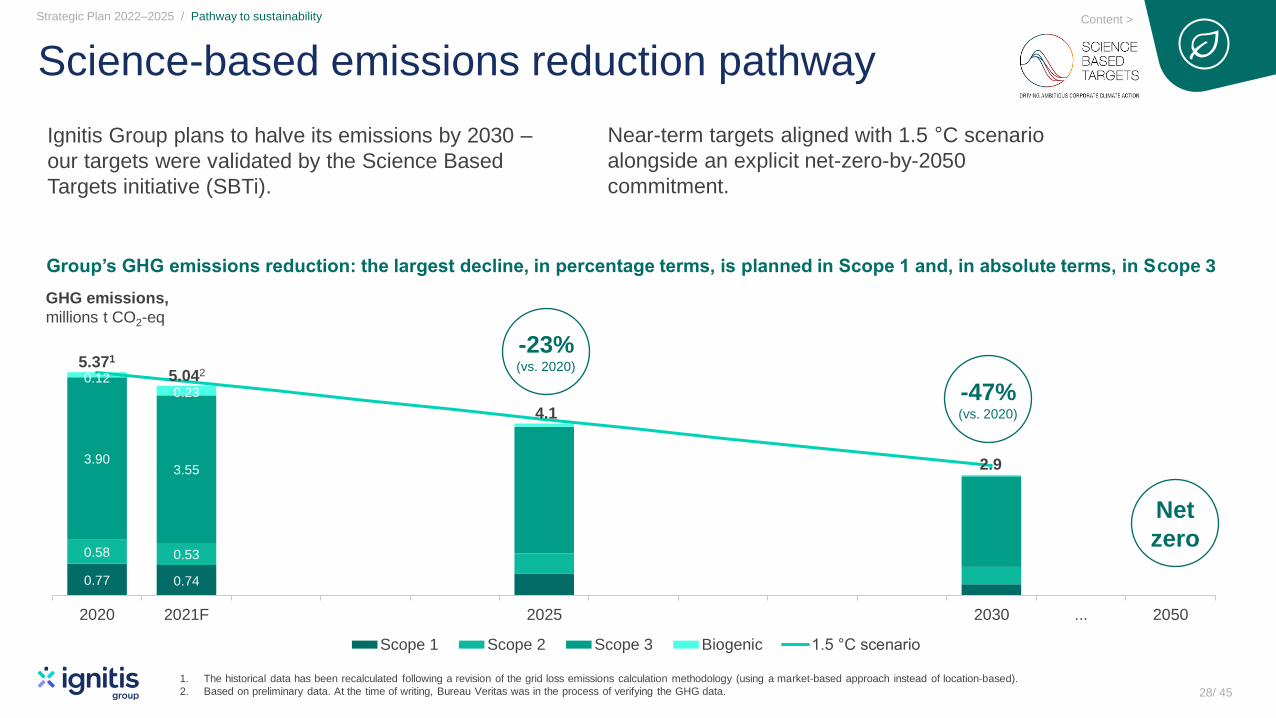
Science-based emissions reduction pathway
Ignitis Group plans to halve its emissions by 2030 –
our targets were validated by the Science Based
Targets initiative (SBTi).
Strategic Plan 2022–2025 / Pathway to sustainability
28/ 45
0.77 0.74
0.58 0.53
3.903.55
0.120.23
2020 2021F 2025 2030 ... 2050
Scope 1 Scope 2 Scope 3 Biogenic 1.5 °C scenario
-23%(vs. 2020)
-47%(vs. 2020)
Net
zero
5.371
5.042
4.1
2.9
Group’s GHG emissions reduction: the largest decline, in percentage terms, is planned in Scope 1 and, in absolute terms, in Scope 3
1. The historical data has been recalculated following a revision of the grid loss emissions calculation methodology (using a market-based approach instead of location-based).
2. Based on preliminary data. At the time of writing, Bureau Veritas was in the process of verifying the GHG data.
GHG emissions,
millions t CO2-eq
Near-term targets aligned with 1.5 °C scenario
alongside an explicit net-zero-by-2050
commitment.
Content >
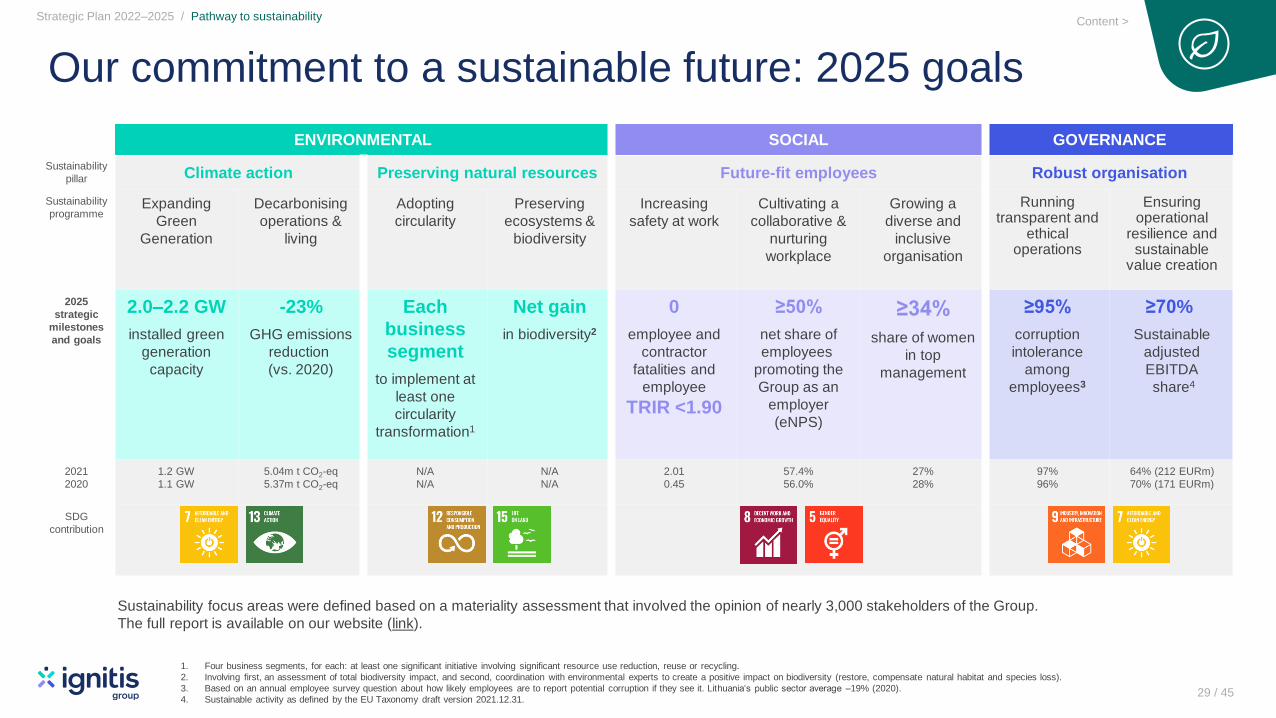
Our commitment to a sustainable future: 2025 goals
Strategic Plan 2022–2025 / Pathway to sustainability
29 / 45
1. Four business segments, for each: at least one significant initiative involving significant resource use reduction, reuse or recycling.
2. Involving first, an assessment of total biodiversity impact, and second, coordination with environmental experts to create a positive impact on biodiversity (restore, compensate natural habitat and species loss).
3. Based on an annual employee survey question about how likely employees are to report potential corruption if they see it. Lithuania‘s public sector average –19% (2020).
4. Sustainable activity as defined by the EU Taxonomy draft version 2021.12.31.
Sustainability
pillar
ENVIRONMENTAL SOCIAL GOVERNANCE
Climate action Preserving natural resources Future-fit employees Robust organisation
Sustainability
programmeExpanding
Green
Generation
Decarbonising
operations &
living
Adopting
circularity
Preserving
ecosystems &
biodiversity
Increasing
safety at work
Cultivating a
collaborative &
nurturing
workplace
Growing a
diverse and
inclusive
organisation
Running transparent and
ethical operations
Ensuring operational
resilience and sustainable
value creation
2025
strategic
milestones
and goals
2.0–2.2 GW
installed green
generation
capacity
-23%
GHG emissions
reduction
(vs. 2020)
Each
business
segment
to implement at
least one
circularity
transformation1
Net gain
in biodiversity2
0
employee and
contractor
fatalities and
employee
TRIR <1.90
≥50%
net share of
employees
promoting the
Group as an
employer
(eNPS)
≥34%
share of women
in top
management
≥95%
corruption
intolerance
among
employees3
≥70%
Sustainable
adjusted
EBITDA
share4
2021
2020
1.2 GW
1.1 GW
5.04m t CO2-eq
5.37m t CO2-eq
N/A
N/A
N/A
N/A
2.01
0.45
57.4%
56.0%
27%
28%
97%
96%
64% (212 EURm)
70% (171 EURm)
SDG
contribution
Sustainability focus areas were defined based on a materiality assessment that involved the opinion of nearly 3,000 stakeholders of the Group.
The full report is available on our website (link).
Content >
Target returns, leverage and
dividends
30 / 45
Financials
Content >

Target returns
Strategic Plan 2022–2025 / Financials
Adjusted ROCE, %
Revised WACC in electricity DSO and
better than usual results in 2021 for
Flexible generation and Customers &
Solutions segments are the key drivers for
lower ROCE in 2022–2025
2021
7.9%
2022–2025
average
5.5-6.5%
31 / 45
332.7
+2.7-5.3%CAGR
2021 2025
Networks
Adjusted EBITDA, EURm
370-410
Green
generation
Flexible
generationCustomers
& Solutions
EBITDA expected to grow
by 11–23% in 2025 vs. 2021
mainly driven by Green
Generation
64% share of sustainable
adjusted EBITDA
>70% share of sustainable
adjusted EBITDA
Content >
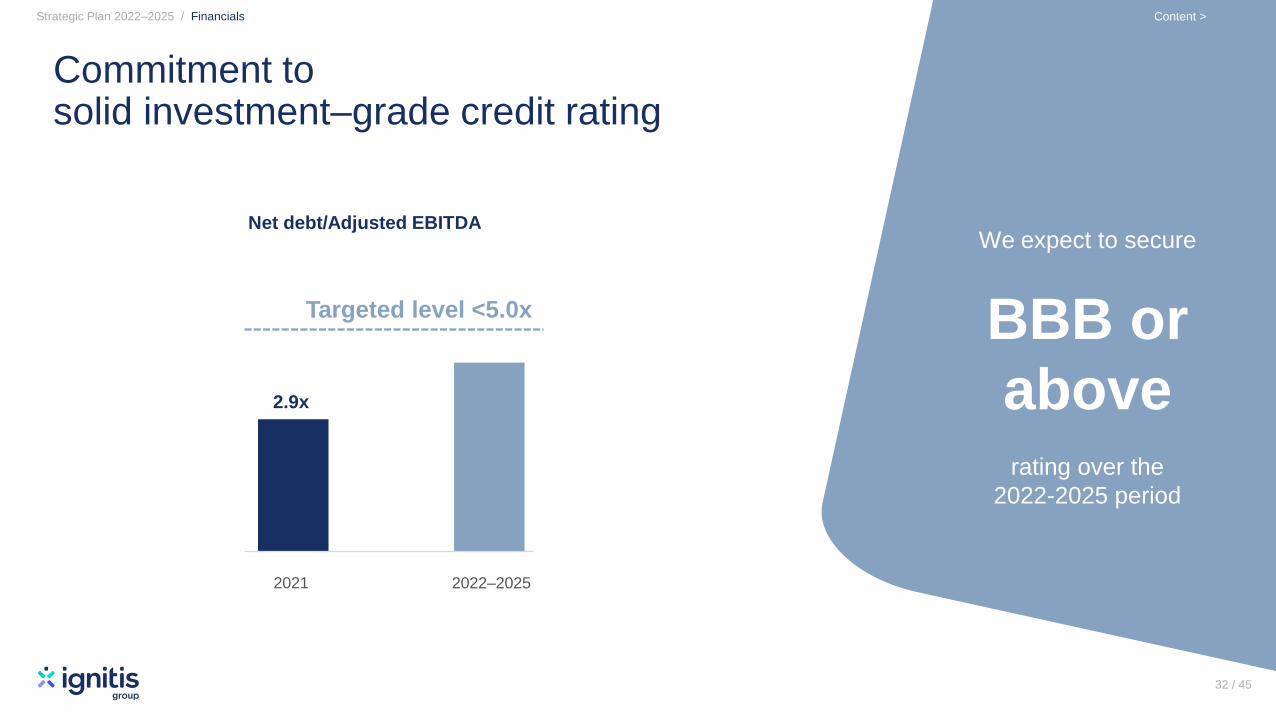
Commitment to solid investment–grade credit rating
Strategic Plan 2022–2025 / Financials
35 / 48
Net debt/Adjusted EBITDA
2020 20242021 2022–2025
2.9x
Targeted level <5.0x
We expect to secure
BBB or
above rating over the
2022-2025 period
32 / 45
Content >

Growing dividends
≥90.2 EURm
≥92.9 EURm
≥95.7EURm87.6
EURm
2021 2025
≥98.5
EURm
Dividend policy
We aim to grow our dividends to shareholders
at a minimum 3% annual rate.
The starting dividend level for 2020 was set at EUR 85
million and EUR 87.6 million declared for 2021.
We also have the flexibility to distribute excess cash if
available.
2022 2023 2024
≥1.23
EUR
≥1.27
EUR
≥1.31
EUR
≥1.35
EUR
Strategic Plan 2022–2025 / Financials
33 / 45
1. Calculated based on the No. of shares (73,040,514 ordinary shares).
2. Implied dividend yield (annual) over the 2022-2025 period is calculated based on the Ignitis group share price: 20.5 €/sh.
Dividend yield for GDR’s: 5.7% in 2021.
1.19
EUR
Minimum annual dividends, EURm(declared during the financial year)
Minimum
DPS1
Dividend
yield2 ~6.0% ~6.2% ~6.4% ~6.6%~5.8%
6.0-6.6%Implied dividend
yield 2022-2025
Content >
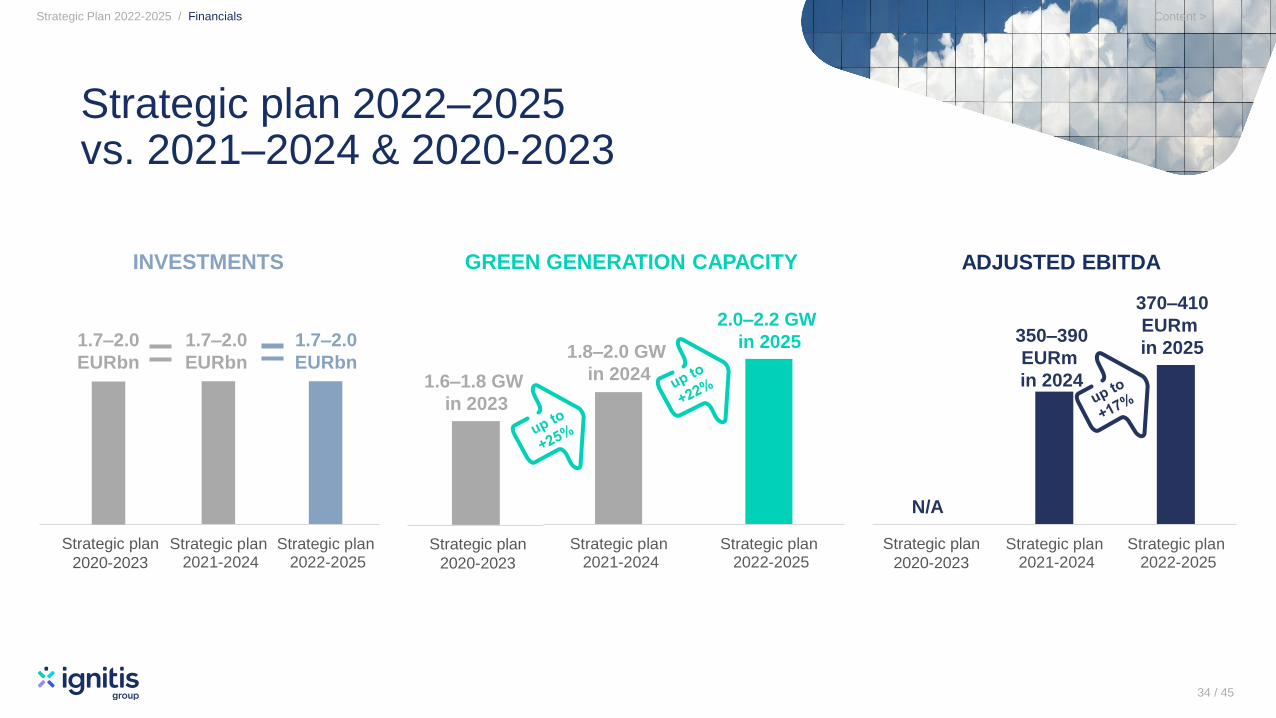
Strategic plan 2022–2025vs. 2021–2024 & 2020-2023
INVESTMENTS ADJUSTED EBITDA
Strategic Plan 2022-2025 / Financials
34 / 45
GREEN GENERATION CAPACITY
Strategic plan 2021-2024
Strategic plan 2022-2025
350–390
EURm
in 2024
370–410
EURm
in 2025
N/A
Strategic plan
2020-2023
Strategic plan 2021-2024
Strategic plan 2022-2025
2.0–2.2 GW
in 20251.8–2.0 GW
in 2024
Strategic plan
2020-2023
1.6–1.8 GW
in 2023
1.7–2.0
EURbn
Strategic plan 2021-2024
Strategic plan 2022-2025
1.7–2.0
EURbn
1.7–2.0
EURbn
Strategic plan
2020-2023
Content >

Highlights
35 / 45
Content >
36
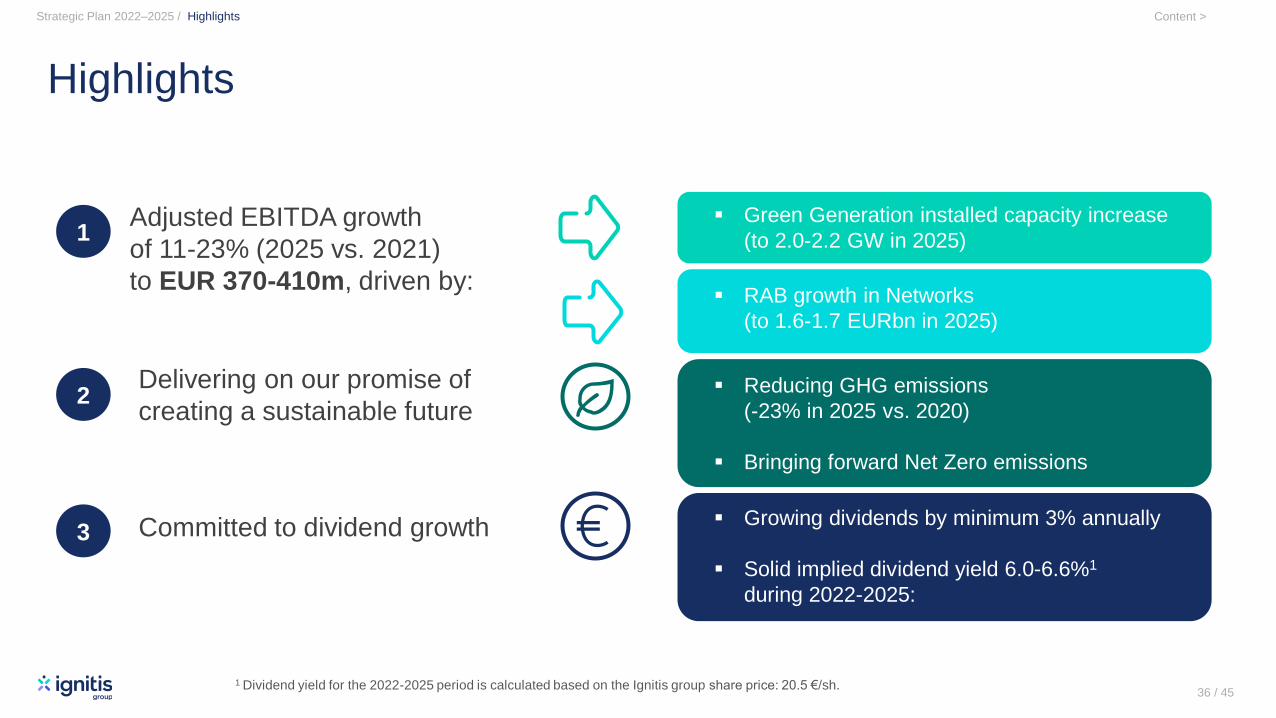
Highlights
Adjusted EBITDA growth
of 11-23% (2025 vs. 2021)
to EUR 370-410m, driven by:
Delivering on our promise of
creating a sustainable future
Committed to dividend growth
36 / 45
Strategic Plan 2022–2025 / Highlights
▪ Green Generation installed capacity increase
(to 2.0-2.2 GW in 2025)
▪ Reducing GHG emissions
(-23% in 2025 vs. 2020)
▪ Bringing forward Net Zero emissions
1
2
3
▪ RAB growth in Networks
(to 1.6-1.7 EURbn in 2025)
▪ Growing dividends by minimum 3% annually
▪ Solid implied dividend yield 6.0-6.6%1
during 2022-2025:
1 Dividend yield for the 2022-2025 period is calculated based on the Ignitis group share price: 20.5 €/sh.
Content >
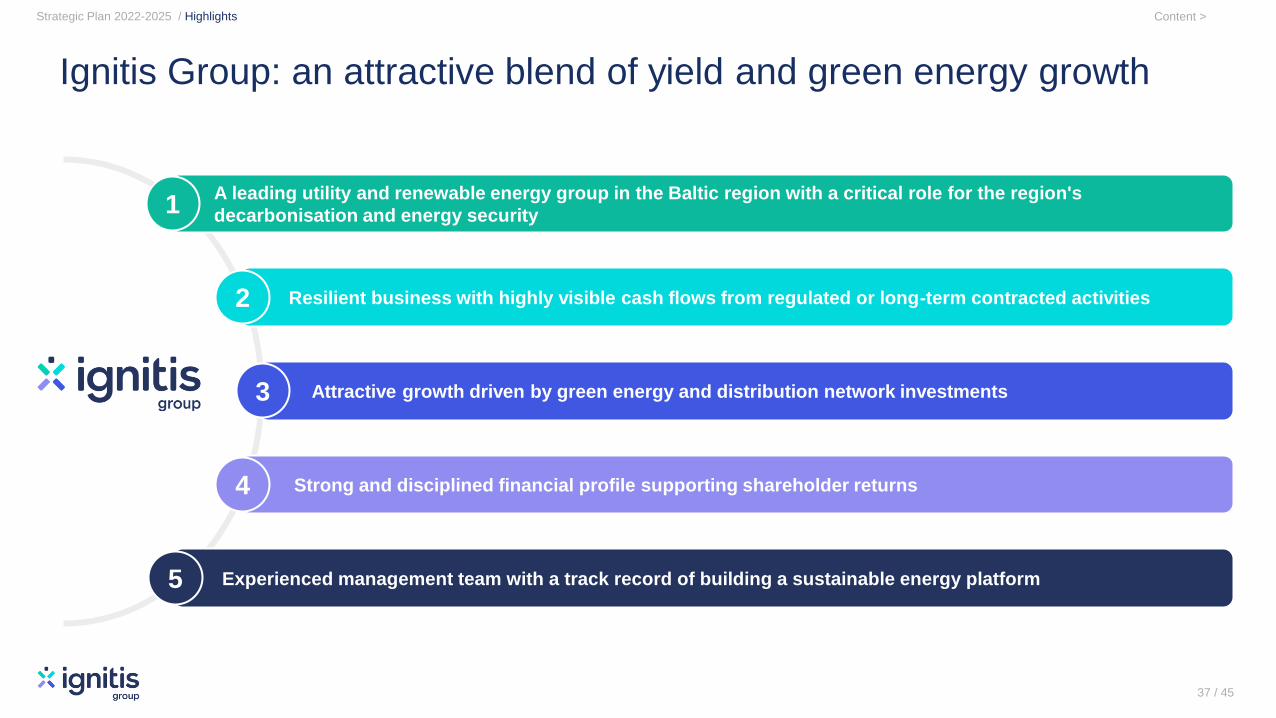
A leading utility and renewable energy group in the Baltic region with a critical role for the region's
decarbonisation and energy security
Resilient business with highly visible cash flows from regulated or long-term contracted activities
Strong and disciplined financial profile supporting shareholder returns
Attractive growth driven by green energy and distribution network investments
Experienced management team with a track record of building a sustainable energy platform
Ignitis Group: an attractive blend of yield and green energy growth
1
2
3
4
5
37 / 45
Strategic Plan 2022-2025 / Highlights Content >
Annexes
38 / 45
Content >
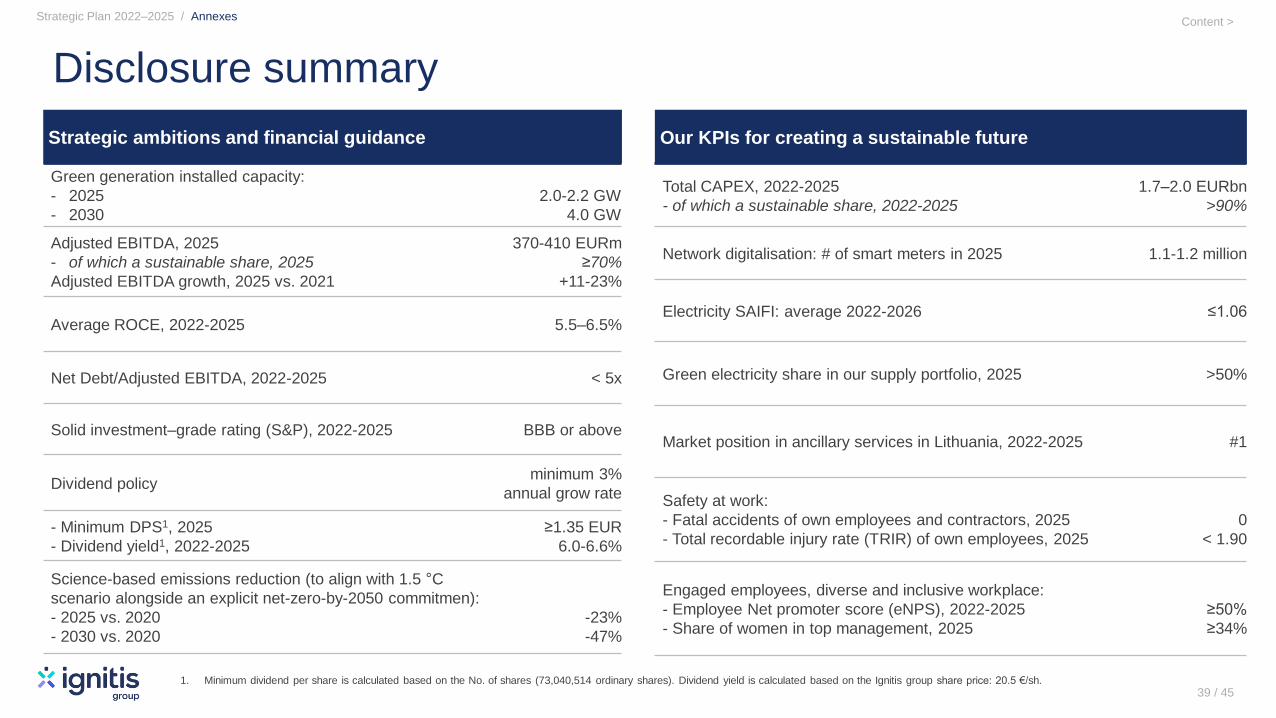
Disclosure summary
Strategic ambitions and financial guidance
Green generation installed capacity:
- 2025
- 2030
2.0-2.2 GW
4.0 GW
Adjusted EBITDA, 2025
- of which a sustainable share, 2025
Adjusted EBITDA growth, 2025 vs. 2021
370-410 EURm
≥70%
+11-23%
Average ROCE, 2022-2025 5.5–6.5%
Net Debt/Adjusted EBITDA, 2022-2025 < 5x
Solid investment–grade rating (S&P), 2022-2025 BBB or above
Dividend policyminimum 3%
annual grow rate
- Minimum DPS1, 2025
- Dividend yield1, 2022-2025
≥1.35 EUR
6.0-6.6%
Science-based emissions reduction (to align with 1.5 °C
scenario alongside an explicit net-zero-by-2050 commitmen):
- 2025 vs. 2020
- 2030 vs. 2020
-23%
-47%
Our KPIs for creating a sustainable future
Total CAPEX, 2022-2025
- of which a sustainable share, 2022-2025
1.7–2.0 EURbn
>90%
Network digitalisation: # of smart meters in 2025 1.1-1.2 million
Electricity SAIFI: average 2022-2026 ≤1.06
Green electricity share in our supply portfolio, 2025 >50%
Market position in ancillary services in Lithuania, 2022-2025 #1
Safety at work:
- Fatal accidents of own employees and contractors, 2025
- Total recordable injury rate (TRIR) of own employees, 2025
0
< 1.90
Engaged employees, diverse and inclusive workplace:
- Employee Net promoter score (eNPS), 2022-2025
- Share of women in top management, 2025
≥50%
≥34%
1. Minimum dividend per share is calculated based on the No. of shares (73,040,514 ordinary shares). Dividend yield is calculated based on the Ignitis group share price: 20.5 €/sh.
39 / 45
Strategic Plan 2022–2025 / Annexes Content >
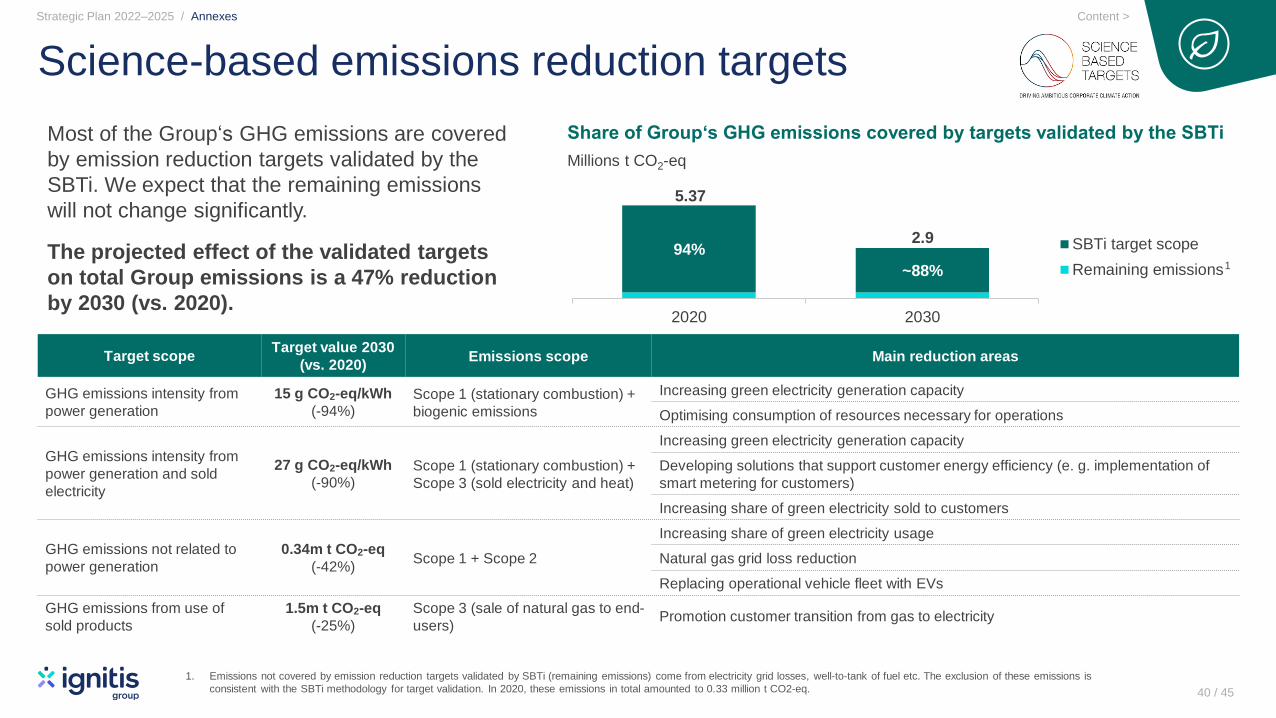
Science-based emissions reduction targets
Target scopeTarget value 2030
(vs. 2020)Emissions scope Main reduction areas
GHG emissions intensity from
power generation
15 g CO2-eq/kWh
(-94%)Scope 1 (stationary combustion) +
biogenic emissions
Increasing green electricity generation capacity
Optimising consumption of resources necessary for operations
GHG emissions intensity from
power generation and sold
electricity
27 g CO2-eq/kWh
(-90%)Scope 1 (stationary combustion) +
Scope 3 (sold electricity and heat)
Increasing green electricity generation capacity
Developing solutions that support customer energy efficiency (e. g. implementation of
smart metering for customers)
Increasing share of green electricity sold to customers
GHG emissions not related to
power generation
0.34m t CO2-eq
(-42%)Scope 1 + Scope 2
Increasing share of green electricity usage
Natural gas grid loss reduction
Replacing operational vehicle fleet with EVs
GHG emissions from use of
sold products
1.5m t CO2-eq
(-25%)
Scope 3 (sale of natural gas to end-
users)Promotion customer transition from gas to electricity
40 / 45
5.37
2.9
Share of Group‘s GHG emissions covered by targets validated by the SBTiMost of the Group‘s GHG emissions are covered
by emission reduction targets validated by the
SBTi. We expect that the remaining emissions
will not change significantly.
The projected effect of the validated targets
on total Group emissions is a 47% reduction
by 2030 (vs. 2020).
1. Emissions not covered by emission reduction targets validated by SBTi (remaining emissions) come from electricity grid losses, well-to-tank of fuel etc. The exclusion of these emissions is
consistent with the SBTi methodology for target validation. In 2020, these emissions in total amounted to 0.33 million t CO2-eq.
Strategic Plan 2022–2025 / Annexes
1
Millions t CO2-eq
94%
~88%
2020 2030
SBTi target scope
Remaining emissions
Content >

We are future-fit, values driven, adaptive and digital organisation
Employee
experience
TOP
Employer
Certification„Continent“
Top of mind employer in Renewables
in regions where we operate
Diverse
workforce
Skills and
competencies
≥23%women in IT and engineering
≥34%women in Top management positions
100%Ensured talent pipeline for strategy
execution
80%People involved into digital skills
training program
80%Having strategic competencies
≥50%Employee NPS
Strategic Plan 2022–2025 / Annexes
41 / 45
(Equal Opportunity Wings)
Ensured excellence in
people practices and
certified as Top Employer1
Received highest
acknowledgement in Lithuania
for equal opportunities in the
workplace2
PEOPLE
future-fit
OUR
CULTURE
WAYS OF WORKING
adaptive and digital
LEADERSHIP
values driven
Our KPI‘s for 2025 2021
1. The certificate was issued in January 2022.
2. In 2021 the Group received three ‘Equal Opportunity Wings’, the highest acknowledgement given by the Office of the Equal Opportunities Ombudsperson in Lithuania.
Creating a sustainable
organisational culture
Content >
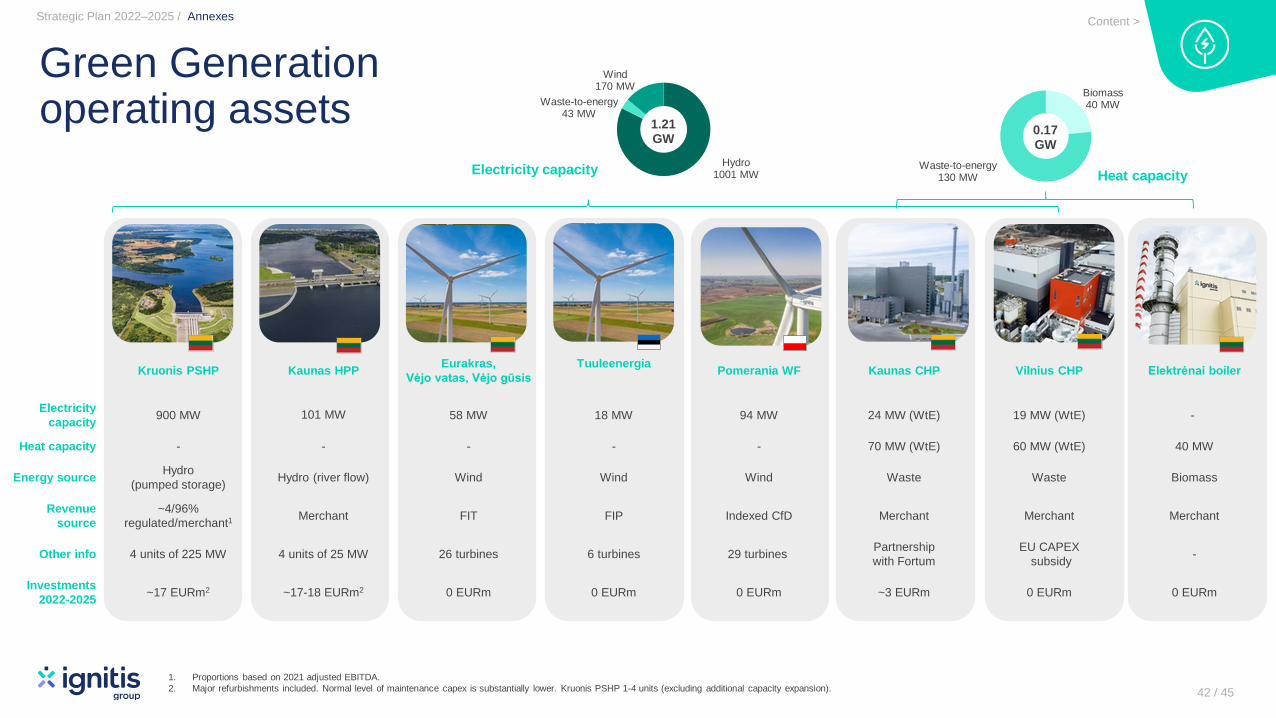
1. Proportions based on 2021 adjusted EBITDA.
2. Major refurbishments included. Normal level of maintenance capex is substantially lower. Kruonis PSHP 1-4 units (excluding additional capacity expansion). 42 / 45
Strategic Plan 2022–2025 / Annexes Content >
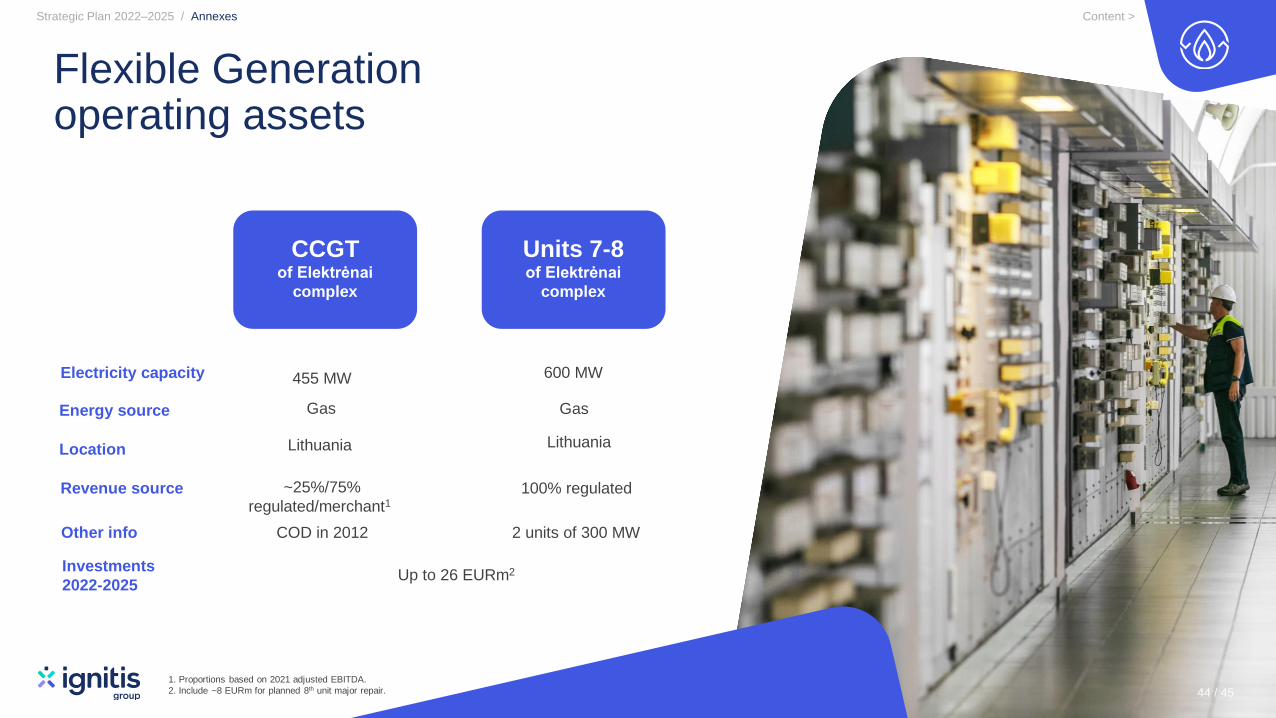
Green Generation operating assets
Biomass40 MW
Waste-to-energy130 MW
0.17GW
Heat capacityHydro
1001 MW
Waste-to-energy43 MW
Wind170 MW
1.21GW
Electricity capacity
Kruonis PSHP Kaunas HPPEurakras,
Vėjo vatas, Vėjo gūsis
TuuleenergiaPomerania WF Kaunas CHP Vilnius CHP Elektrėnai boiler
Electricity
capacity900 MW 101 MW 58 MW 18 MW 94 MW 24 MW (WtE) 19 MW (WtE) -
Heat capacity - - - - - 70 MW (WtE) 60 MW (WtE) 40 MW
Energy sourceHydro
(pumped storage)Hydro (river flow) Wind Wind Wind Waste Waste Biomass
Revenue
source
~4/96%
regulated/merchant1Merchant FIT FIP Indexed CfD Merchant Merchant Merchant
Other info 4 units of 225 MW 4 units of 25 MW 26 turbines 6 turbines 29 turbinesPartnership
with Fortum
EU CAPEX
subsidy-
Investments
2022-2025~17 EURm2 ~17-18 EURm2 0 EURm 0 EURm 0 EURm ~3 EURm 0 EURm 0 EURm
Content >
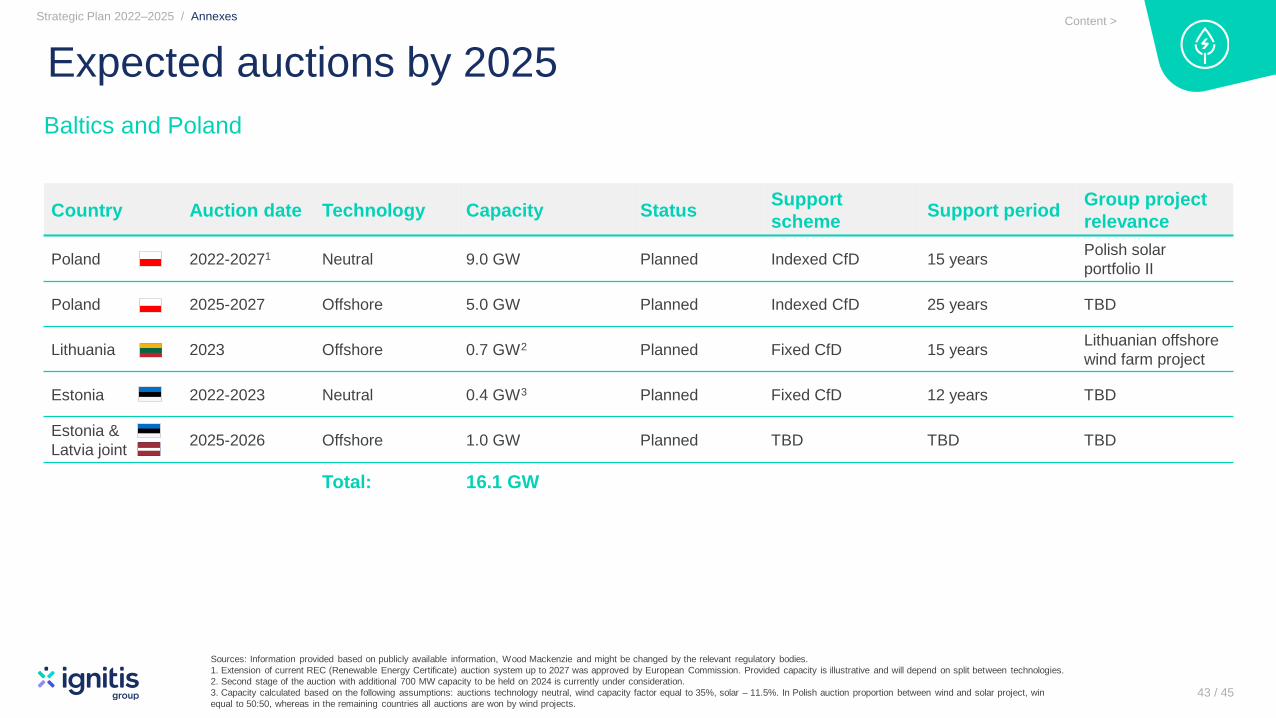
Country Auction date Technology Capacity StatusSupport
schemeSupport period
Group project
relevance
Poland 2022-20271 Neutral 9.0 GW Planned Indexed CfD 15 yearsPolish solar
portfolio II
Poland 2025-2027 Offshore 5.0 GW Planned Indexed CfD 25 years TBD
Lithuania 2023 Offshore 0.7 GW2 Planned Fixed CfD 15 yearsLithuanian offshore
wind farm project
Estonia 2022-2023 Neutral 0.4 GW3 Planned Fixed CfD 12 years TBD
Estonia &
Latvia joint2025-2026 Offshore 1.0 GW Planned TBD TBD TBD
Total: 16.1 GW
43 / 45
Expected auctions by 2025
Sources: Information provided based on publicly available information, Wood Mackenzie and might be changed by the relevant regulatory bodies.
1. Extension of current REC (Renewable Energy Certificate) auction system up to 2027 was approved by European Commission. Provided capacity is illustrative and will depend on split between technologies.
2. Second stage of the auction with additional 700 MW capacity to be held on 2024 is currently under consideration.
3. Capacity calculated based on the following assumptions: auctions technology neutral, wind capacity factor equal to 35%, solar – 11.5%. In Polish auction proportion between wind and solar project, win
equal to 50:50, whereas in the remaining countries all auctions are won by wind projects.
Baltics and Poland
Strategic Plan 2022–2025 / Annexes Content >
Strategic Plan 2022–2025 / Annexes
44 / 45
Electricity capacity
Energy source
Location
Revenue source
Other info
455 MW
Gas
Lithuania
~25%/75%
regulated/merchant1
COD in 2012
600 MW
Gas
Lithuania
100% regulated
2 units of 300 MW
Flexible Generation operating assets
1. Proportions based on 2021 adjusted EBITDA.
2. Include ~8 EURm for planned 8th unit major repair.
Investments
2022-2025Up to 26 EURm2
Content >
CCGTof Elektrėnai
complex
Units 7-8of Elektrėnai
complex
Content >
Strategic Plan 2022–2025 / Annexes
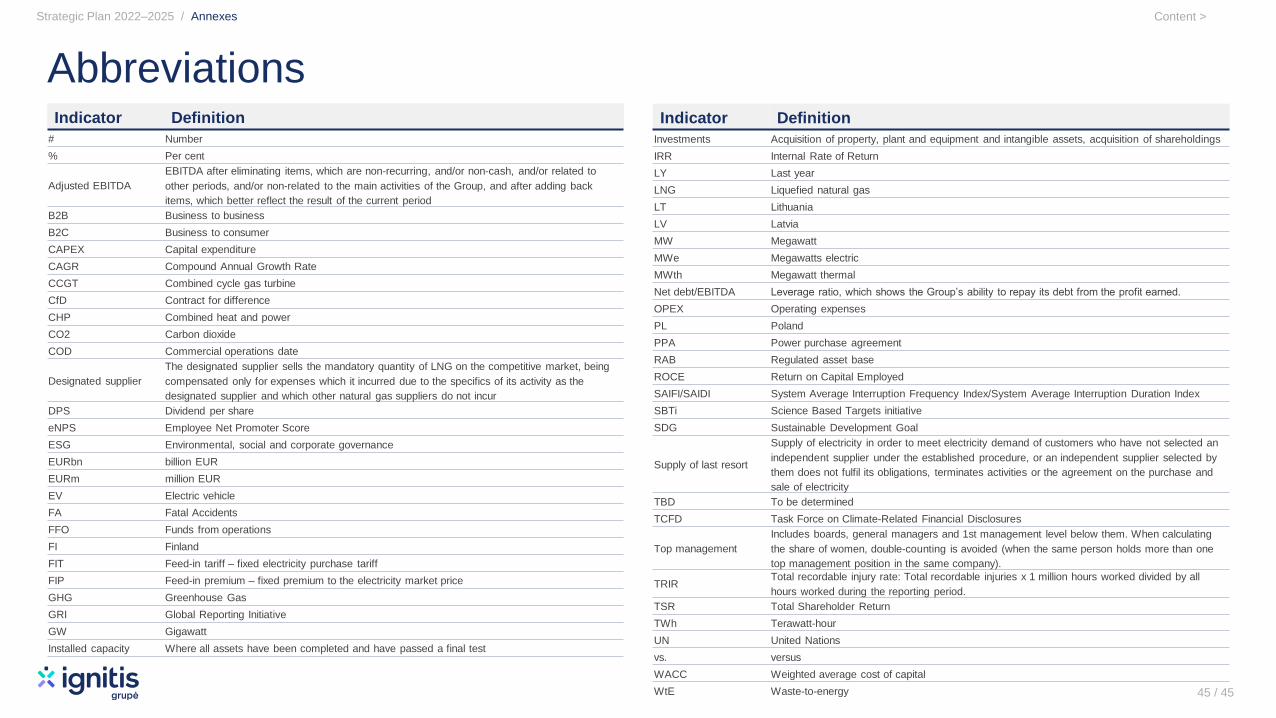
Abbreviations Indicator Definition
# Number
% Per cent
Adjusted EBITDA
EBITDA after eliminating items, which are non-recurring, and/or non-cash, and/or related to
other periods, and/or non-related to the main activities of the Group, and after adding back
items, which better reflect the result of the current period
B2B Business to business
B2C Business to consumer
CAPEX Capital expenditure
CAGR Compound Annual Growth Rate
CCGT Combined cycle gas turbine
CfD Contract for difference
CHP Combined heat and power
CO2 Carbon dioxide
COD Commercial operations date
Designated supplier
The designated supplier sells the mandatory quantity of LNG on the competitive market, being
compensated only for expenses which it incurred due to the specifics of its activity as the
designated supplier and which other natural gas suppliers do not incur
DPS Dividend per share
eNPS Employee Net Promoter Score
ESG Environmental, social and corporate governance
EURbn billion EUR
EURm million EUR
EV Electric vehicle
FA Fatal Accidents
FFO Funds from operations
FI Finland
FIT Feed-in tariff – fixed electricity purchase tariff
FIP Feed-in premium – fixed premium to the electricity market price
GHG Greenhouse Gas
GRI Global Reporting Initiative
GW Gigawatt
Installed capacity Where all assets have been completed and have passed a final test
Indicator Definition
Investments Acquisition of property, plant and equipment and intangible assets, acquisition of shareholdings
IRR Internal Rate of Return
LY Last year
LNG Liquefied natural gas
LT Lithuania
LV Latvia
MW Megawatt
MWe Megawatts electric
MWth Megawatt thermal
Net debt/EBITDA Leverage ratio, which shows the Group’s ability to repay its debt from the profit earned.
OPEX Operating expenses
PL Poland
PPA Power purchase agreement
RAB Regulated asset base
ROCE Return on Capital Employed
SAIFI/SAIDI System Average Interruption Frequency Index/System Average Interruption Duration Index
SBTi Science Based Targets initiative
SDG Sustainable Development Goal
Supply of last resort
Supply of electricity in order to meet electricity demand of customers who have not selected an
independent supplier under the established procedure, or an independent supplier selected by
them does not fulfil its obligations, terminates activities or the agreement on the purchase and
sale of electricity
TBD To be determined
TCFD Task Force on Climate-Related Financial Disclosures
Top management
Includes boards, general managers and 1st management level below them. When calculating
the share of women, double-counting is avoided (when the same person holds more than one
top management position in the same company).
TRIRTotal recordable injury rate: Total recordable injuries x 1 million hours worked divided by all
hours worked during the reporting period.
TSR Total Shareholder Return
TWh Terawatt-hour
UN United Nations
vs. versus
WACC Weighted average cost of capital
WtE Waste-to-energy 45 / 45
Content >