stigmergy in comparative settlement choice and palaeoenvironment simulation
TRANSCRIPT
Stigmergy in Comparative Settlement
Choice and Palaeoenvironment Simulation
EUGENE CH’NG,1VINCE GAFFNEY,
2AND GIDO HAKVOORT
3
1School of Computer Science, International Doctoral Innovation Centre, University of Nottingham
Ningbo China, 199 Taikang East Road, Zhejiang, Ningbo 315100, China; 2School of Archaeological
Sciences, University of Bradford, Bradford, West Yorkshire, United Kingdom; and 3Digital Humanities
Hub, The University of Birmingham, Edgbaston B15 2TT, United Kingdom
Received 27 April 2014; revised 22 September 2014; accepted 2 October 2014
Decisions on settlement location in the face of climate change and coastal inundation may have resulted in
success, survival or even catastrophic failure for early settlers in many parts of the world. In this study, we
investigate various questions related to how individuals respond to a palaeoenvironmental simulation, on an
interactive tabletop device where participants have the opportunity to build a settlement on a coastal land-
scape, balancing safety, and access to resources, including sea and terrestrial foodstuffs, while taking into con-
sideration the threat of rising sea levels. The results of the study were analyzed to consider whether decisions
on settlement were predicated to be near to locations where previous structures were located, stigmergically,
and whether later settler choice would fare better, and score higher, as time progressed. The proximity of
settlements was investigated and the reasons for clustering were considered. The interactive simulation was
exhibited to thousands of visitors at the 2012 Royal Society Summer Science Exhibition at the ‘‘Europe’s Lost
World’’ exhibit. 347 participants contributed to the simulation, providing a sufficiently large sample of data
for analysis.VC 2014 Wiley Periodicals, Inc. Complexity 000: 00–00, 2014
Key Words: stigmergy; simulation; settlement choice; palaeoenvironment; cooperative behavior
1. INTRODUCTION
Global warming at the end of the last Ice Age led to
the inundation of vast landscapes that had once
been home to thousands of people. These lost lands
represent one of the last frontiers of geographical and
archaeological exploration and exist off the coast of
Europe, the Gulf and in the South China Sea, and the
Sunda Shelf. while the inundated landscape cannot be
explored conventionally, pioneering work using seismic
reflectance data has provided the first detailed maps of
the prehistoric topography and the results have received
international recognition as being globally important with
respect of our understanding of these enigmatic land-
scapes but also in respect of our understanding of past
Additional Supporting Information may be found in the
online version of this article.
Correspondence to: Eugene Ch’ng, E-mail: eugene.chng@
nottingham.edu.cn
C O M P L E X I T Y 1Q 2014 Wiley Periodicals, Inc., Vol. 00 No. 00DOI 10.1002/cplx.21616Published online 00 Month 2014 in Wiley Online Library(wileyonlinelibrary.com)
and present response to rising sea levels and climate
change (http://e-a-a.org/EHP_2013.pdf). Following the
publication of these unique datasets from the area of the
North Sea (also known as Doggerland), there has been an
opportunity for further reconstruction of the landscape,
environment, flora, and fauna, through Geographical
Information Systems (GIS) and environmental modeling,
and occasionally, this has involved the use of interactive
virtual environments [1–6]. More recently agent-based
modeling and simulation have emerged as technologies
that might also provide insights into the changing ecology
of Doggerland and related landscapes in the Gulf and
Asia. The potential of such applications to add to the
debate follows from the increasing availability of relevant
data and this suggests that these technologies may provide
a step-change to our understanding of these complex, his-
toric environments [6–11]. The distributed computational
modeling of individual agents and complex ecological
interactions between millions of agents and the environ-
ment will fill gaps in our knowledge that may be the result
of the highly inaccessible nature of these lost landscapes
[12] and, significantly, such studies will permit the genera-
tion of different hypotheses and scenarios to be explored
through dynamic simulations in a manner that has never
previously been imagined by archaeological researchers
[13–16]. While complexity science-based archaeological
simulation that uses human input has never been
attempted before, a similar work by Goldstone and Rob-
erts on self-organization in trail systems in groups of
humans within a virtual environment have demonstrated
the potentials of such work for future studies [17].
The ‘‘Europe’s Lost World’’ group [18], associated with
such landscape research, received an invitation to present
at the Royal Society’s Summer Science Exhibition held at
Carlton House Terrace, London, during the summer of 2012
(July 2–7). The exhibition incorporated an interactive tab-
letop simulation designed to investigate human decisions
when presented with threats including rising tides linked to
climate change and the need to balance requirements to
maximize the opportunities provided by access to terrestrial
and ecological resources required for subsistence.
The research sought to understand comparisons
between modern responses and potential past behavior
and to what extent any decisions were balanced in respect
of safety and basic necessities, using a large tabletop device
as the medium between the simulated past and the pres-
ent. The study also considered whether stigmergy would
apply in such situations [19–21], that is, would future set-
tlers learn from previous inhabitants from the traces of
past occupation left behind on the landscape. Furthermore,
we investigated the clustering of settlements around strate-
gic regions of the landscape in relation to their survival
‘‘scores’’ and investigated the phenomena through statisti-
cal analysis. It is likely that this novel approach of explor-
ing landscape use by merging virtual reconstructions with
human interaction via a tabletop medium may provide us
with insights into behavioral processes underpinning how
early settlers interacted with past landscapes and their per-
ception of earlier traces of occupation.
The article begins with the background to our research
followed by a methodological section covering the recon-
struction of a virtual environment and agent-based model
that incorporates real data from previous studies
[3,4,6,22], using an interactive tabletop as the medium.
Section 3 explains our approach to data collection on the
settlement behaviors of 347 participants. Section 4
presents the statistical analysis of our results and finally,
the article concludes with a discussion and outlines
opportunities for future work.
2. BACKGROUND
The issues of stigmergy are rarely considered within
archaeology but may be an important factor when
researching the complexities of settlement or past behav-
ior. Within hunter-gatherers studies, for instance,
researchers often provide substantive information on the
nature of mobility and the extent of territories that may
be exploited by individual groups. It is probably true that
single hunter-gatherers territories may have been very
extensive in the past and individual groups certainly
ranged across the land according to need and the avail-
ability of seasonal resources. However, in some societies
the territories themselves may also shift cyclically over a
longer period [23, Chapter 6, Figure 52]. Consequently,
landscapes may appear empty to new settlers or migrants
although they may well have been an active part of a sea-
sonally occupied territory or one that may have been
revisited periodically as part of a longer behavioral pat-
tern. In these instances, the proxy traces of past activity
may well have been discernable to groups entering the
landscape for the first time. These situations could have
engendered locales that attracted persistent occupation.
This may have been particularly important during periods,
such as the early Holocene, when marine inundation may
have forced hunter-gatherers groups from traditional lands
and into the seasonally occupied territories of other
groups. How such incomers explored or interpreted the
traces of past occupation is generally never considered by
archaeologists whose evidence is rarely that fine-grained.
However, sites with access to specific resources (and per-
haps identified from cultural markers) may have been the
scenes of violent confrontation during these periods as
competing groups sought to control land and resources
[11, p.175]. It is also notable that at specific periods
hunter-gatherers may have begun to construct other struc-
tures including houses that may have been markers for
important locales as much as places to live in [6,24].
2 C O M P L E X I T Y Q 2014 Wiley Periodicals, Inc.DOI 10.1002/cplx
There is another context in which we might begin to
identify the effects of stigmergy as a past cultural process
and that relates to the evolution of ritual and the creation
of monuments during the Mesolithic period. The emer-
gence of ritual activity and the origins and evolution of
monuments are extremely problematic areas of research
within archaeology. It is clear from the study of later
monuments, including exceptional sites such as Stone-
henge, that, despite the apparent complexity of such
structures, there is no original plan for their development
and that they evolve over very long periods of time. An
example of a very early monument studied by the authors
demonstrates this. The site at Warren Fields in Aberdeen-
shire (Scotland) has been interpreted as a primitive time
reckoner dated toward the beginning of the 8th millen-
nium BC [12]. A series of 12 pits, up to 2, 3 meters in
width and spread over c. 90 meters, seem to mimic the
phases of the moon and may have been used to track
time, month by month, following the moon’s phases. To
ensure that the asynchronicity of the lunar month and
solar year did not impact on seasonal integrity, the struc-
ture was also aligned to provide an annual solar correction
on the winter solstice. However, while the highly distinc-
tive format of the pits, from waxing, gibbous, full through
the waning phases of the moon, appears to suggest a
cohesive and planned monument the structure actually
emerged over a period of hundreds of years. There is no
evidence that this could have been planned and suggests
that an original astronomic observation, and repeated vis-
its to the site, allowed the organic growth of a cohesive
structure with a currently unique time-keeping function.
This is all the more striking when it is appreciated that
the dating for the site suggests that the pits were still
being marked when early farming settlements arrived
some 4000 years later. There is no suggestion that these
communities were related but this does suggest that the
stigmergic effect of this unique monument was still active
over millennia of human settlement and that this may
well have been reflected in the decision to build a very
rare Neolithic timber hall a very short distance from the
pre-existing, Mesolithic monument [25].
The experience of colonizing a totally unknown or
wholly unoccupied landscape must have happened at
some point globally, yet such events, historically, are
extremely rare. Resettlement, possibly into landscapes
which may appear relatively under-utilized, are more fre-
quently attested throughout human history. However, the
experience of such settlement across the tapestry of
human history is rarely well documented even within his-
toric periods. This becomes yet more complex during
remote periods, such as the resettlement of Europe after
the last glaciation, when textual evidence is absent and
even the topography of the land may well have changed
significantly along with the climate, floral and faunal envi-
ronment. In such circumstances, the paucity of direct evi-
dence for settlement, and in the case of early Holocene
inundated landscapes, access to primary evidence may be
limited or impossible. In such instances, researchers must
explore other methodological avenues to try to understand
the behavioral processes associated with settlement
expansion and contraction and, perhaps, ultimately to use
such information to inform future exploration in a
directed manner. In respect of resettlement, the concept
of stigmergy may provide some insight into past behav-
ioral practice. Stigmergy, first coined by Pierre Paul Grasse�
[19] refers to the effect of pre-existing environmental
states on the actions of termites building a mound. Grasse
noted that ‘‘the coordination of tasks and the regulation of
constructions do not depend directly on workers, but the
construction themselves. The worker does not direct his
work, he is guided by it. . .’’ Studies in stigmergy usually
relate to social insects [26–28] and how they coordinate
via stimulus-response mechanism for coordinated behav-
ior. The term is simply defined as ‘‘coordination without
direct communication’’ which social insects such as ants,
bees, and wasps depend on for survival as a collective
organism. It would appear that at an individual level each
insect works in solitude yet, at the collective level, an
apparent work of coordination is observed. Some insects
depended on pheromone trails left behind by other
insects; others rely on information gathered from the envi-
ronment for progressing the construction of nests. While
the term was applied in simple insect behavior, stigmergy
also occurs in highly intelligent species, including human
beings [29,30], and work is being carried out on facilitating
such cooperation in crowd-sourced cuneiform fragment
reconstructions [31].
With this in mind, the interactive tabletop simulation
of human settlement presented at the Royal Society pro-
vided data that could be used to study such behavior.
Analysis of the outputs was specifically guided by the
requirement to understand whether the behavior of partic-
ipants was influenced by traces of earlier participants and
whether this contributed to better performances by later
participants looking for new settlement locations. Three
key theoretical concepts support this goal. The first is
interaction [28,32] which posits that an individual’s behav-
ior will act as a stimulus for modifying the behavior of
another. The other is interattraction, in which animal
within a social species is attracted by other animal of the
same species. The third is the group effect through which
each individual is a source of stimuli for other individuals
creating a diffusion of effect when a critical number of
specific stimuli occur. While our hypothesis suggests that
evidence of the first two behaviors may be found in our
analysis of the datasets, the group effect cannot occur, as
the 347 participants did not build settlements simultane-
ously. Stigmergy as a mechanism, is based on self-
C O M P L E X I T Y 3Q 2014 Wiley Periodicals, Inc.DOI 10.1002/cplx
organizing processes, which in this study stands on Halley
and Winkler’s definition, it is ‘‘an interplay of internal and
external sources of order’’ [33].
3. METHODS: VIRTUAL ENVIRONMENT AND AGENT-BASED
MODEL AND SIMULATION
For these purposes, we reconstructed a theoretical land-
scape that incorporates models of real-world data from
previous studies [3,4,6,8]. The virtual palaeoenvironment is
set during the Early Holocene c. 8000 to 7500 BP (Before
Present). This period, also known as the Early Mesolithic in
Europe is a climatic optimum. The period was represented
as a maximum of temperatures, and evidence suggests it
was warmer than average for the interglacial. During the
period following the last Ice Age C. 18,000 BC, melting ice
sheets ultimately submerged nearly half of Western Europe,
creating bays and inlets along the Atlantic coast, which
provided a new, rich ecosystem that was attractive to
human occupation prior to these lands being lost to the
sea as a consequence of sea level rise. Wetter and warmer,
the period associated with the simulation may have been
associated with a mixed forest of Oak, Elm, Common Lime
(Linden), and Elder that spread northward, together with
Pine and Hazel as the climate ameliorated. The simulation
terrain reflects such features with special attention on
hazel bushes which dot the open areas of the landscape as
these are known to be an important resource during the
period [34]. The coast has marine resources, including
shellfish, also know as a key foodstuff from the archaeolog-
ical record, and these are more abundant in specific areas,
that is, bays and inlets. This section describes briefly the
technical details of the simulation that are relevant to the
mechanics of our methodology. Highly technical details for
the reconstruction of virtual environments, agent-based
models, and interactive tabletop applications are beyond
the scope of this article but can be referenced from various
sources from the authors [8,35,39].
3.1. An Interactive Tabletop for Navigating Ancient
Landscapes
The advent of devices with touch-based natural user
interfaces [36] have revolutionized the way in which users
access information. These touch-based displays have per-
vaded both workflows and leisurely activities for the
majority of modern computer users, or indeed the general
public using mobile devices with similar interfaces. The
choice of a touch-based interactive tabletop display for
answering our research questions is, we believe, appropri-
ate for a number of reasons. Initially, the touch interface
is now common place, and perhaps even expected in
many sections of contemporary society. Such an interface
removes the barrier associated with a computer mouse, or
even an Xbox 360 controller. The horizontal interface
allows a larger portion of the virtual palaeolandscape to
be explored in a much shorter time than a conventional
‘‘first-person’’ experience of a virtual environment. This
invariably decreases the required length of participation
time and thus increases the opportunity for data sam-
pling. Finally, a table configuration allows participants and
audience to gather around in a familiar setting, that is,
around a table. Consequently, a tabletop displays allows
colocated collaboration within a truly social setting [37],
which meets our goal of investigating potential stigmergic
learning and colocated observations concerning virtual
environments and agent-based modeling. It is also impor-
tant to stress that while the tabletop display makes it pos-
sible for modern participants to participate in the creation
of simulated ancient settlements, it is, in the end, a
medium through which we can explore a poorly under-
stood, but important, social process—stigmergy.
3.2. Virtual Environments
The visualization aspects of the terrain and all dynamic
objects within the virtual environment are modeled, tex-
tured and animated in Blender3D before being ported into
the Unity3D engine Integrated Development Environment
(IDE) where autonomous behavior scripts (C# program-
ming language) were embedded. Dynamic objects are
items that have a life cycle within the simulation, as
opposed to landscape features. These objects are autono-
mous, or can be interacted with by participants or other
agents, that is, Mesolithic human agents, Hazel bushes &
nuts, house, village, seafood resources, and so forth. The
simulation is event-based, a participants’ interaction with
the user interface trigger events related to the agent, caus-
ing them to trigger further events within the simulation
until the cycle is completed and the final score calculated
process. The events can be categorized into three types:
System and User Interface Events:
� Participants trigger events through the user interface
which supports starting the simulation, navigating
the landscape, building settlements, selecting confi-
dence levels, username input for storing the simula-
tion score, and ending the game.
� The planting of the flagpole, which participants use
for navigating the landscape, triggers the virtual
camera to navigate to the point on the landscape
where the pole is planted.
� Timer events notify and warn participants of any
imposed time limits, they also trigger sea level rise.
Environmental Events:
� The sea level, as part of the environment, is a
dynamic object and has a simple script that causes
it to rise when triggered at the end of the settlement
build event.
4 C O M P L E X I T Y Q 2014 Wiley Periodicals, Inc.DOI 10.1002/cplx
Dynamic Object Events:
� All agents in the environment have events associated
with them.
� Hazel bushes produce hazel nuts according to an
internal timer event.
� Seafood gizmos dotting the coasts notify human
agents of the presence of marine resource when they
are nearby.
� Human agents roam the landscapes and build settle-
ments when participants confirm the locations. They
also gauge the scores and provide a report at the score
calculation user interface at the end of the game.
� Mesolithic houses trigger the transition of the built pro-
cess visualized in different stages. The completion of
the village settlement triggers the sea level rise, which
tests the coastal proximity of the settlement.
3.3. Agents and Scoring Mechanics
The agents—dynamic objects in the environment—are
simplified interactive versions of recent developments [8].
The simplified version has fewer states and transitions
than the autonomous version used for hypotheses testing
in large simulations. States in a complex simulation of
human agents in our recent work are ‘‘exploratory,’’ ‘‘hun-
ger,’’ ‘‘tiredness,’’ ‘‘dying,’’ and so forth, and the associated
transitions between each state. States for a hazel bush or
an animal agent are birth, growth, reproduction, senes-
cence, and death. The mechanisms of agents in this simu-
lation are simplified because they are partially
autonomous, requiring inputs from human participants
such as where to build a settlement. Terrestrial resource
(forest food, wood, etc.) and marine resource (seafood)
gizmos do not go through state transitions, they merely
emit information about their location and resource infor-
mation for agents to read. Mesolithic houses go through
various state transitions as they are being built for visual-
ization purposes.
The scoring mechanism uses coastal proximity, access to
marine and terrestrial resource as important elements in the
‘‘survivability’’ of a settlement. Coastal proximity has a differ-
ent significance in the simulation in comparison to marine
resource. Coastal proximity in the simulation can have two
consequences. Negatively, being too near the coast means
that the settlement will be in danger of flooding. Positively,
being near the coast will mean that coastal resources will be
more accessible. Coastal proximity includes sources where
fresh water can be found within inlets and streams. Con-
versely, coastal proximity does not necessarily mean that set-
tlements will have access to marine resource, Marine
resource are, again, differentially located in strategic features
of a landscape, including inlets, rivers, and rocky areas. Ter-
restrial resource includes land mammals and hazel nuts
from shrubs, which are usually located in open landscapes.
The simulation places importance on the relative coastal
proximity and marine resource.
The scoring mechanism depends on the location of the
settlement identified by a participant and the available
marine a [Eq. (1)] and terrestrial resources b [Eq. (2)] in
the vicinity, within range r of agent i at time t in the simu-
lation using the Iverson bracket,
a5X
m
j
ffiffiffiffiffiffiffiffiffiffiffiffiffiffiffiffiffiffiffiffiffiffiffiffiffiffiffiffiffiffiffiffiffiffiffiffiffiffiffiffiffi
ðxtj2xti Þ21ðytj2yti Þ
2q
< rji
� �
(1)
b5X
n
k
ffiffiffiffiffiffiffiffiffiffiffiffiffiffiffiffiffiffiffiffiffiffiffiffiffiffiffiffiffiffiffiffiffiffiffiffiffiffiffiffiffiffi
ðxtk2xti Þ21ðytk2yti Þ
2q
< rki
� �
(2)
where j and k are individual resource.
The scoring formula for coastal proximity is,
c5jzti2W t j (3)
where z is the height of agent j in the settlement, and W
is the sea level.
The fitness of the settlement measured with the adapt-
ability measure [1] using the standard for coastal proxim-
ity and lower bound for marine and terrestrial resource.
The total score [Eq. (4)] composed of the three measures
[Eq. (5–7)] is, therefore,
T5aeff1beff1ceff (4)
aeff5flowerða; Lji;Pij;Uji; cjiÞwa (5)
beff5flowerðb; Lki;Pki;Uki; ckiÞwb (6)
ceff5f ðc;Lc;Pc;Uc; ccÞwc (7)
The weightings wa 1wb 1wc5100 posits the score
based on the importance of the resource and environment
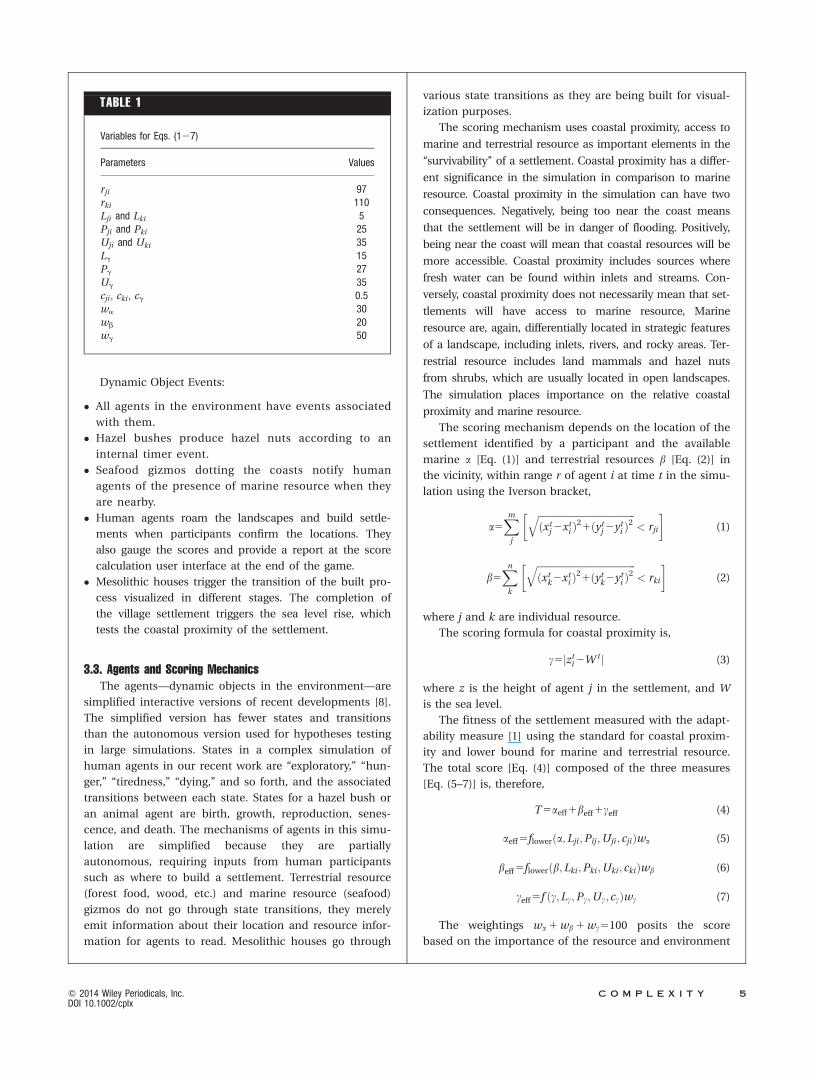
TABLE 1
Variables for Eqs. (127)
Parameters Values
rji 97
rki 110
Lji and Lki 5
Pji and Pki 25
Uji and Uki 35
Lg 15
Pg 27
Ug 35
cji , cki , cg 0.5
wa 30
wb 20
wg 50
C O M P L E X I T Y 5Q 2014 Wiley Periodicals, Inc.DOI 10.1002/cplx
factor toward the survivability of the settlement. In the
simulation presented at the exhibition, the variables in
Table 1 were used.
3.4. Experimental Setup and Data Collection
The tabletop interactive simulation was exhibited to
thousands of visitors on the ‘‘Europe’s Lost World’’ stand at
the 2012 Royal Society Summer Science Exhibition. Our
tabletop exhibit was always crowded, peaking at lunch-
time until the evening. At the end of the exhibition, 347
participants contributed to the simulation, leaving behind
a large sample of datasets for research. The simulation ran
in three sessions from July 3, 10:45 am—July 6, 8:50 pm.
Session 1: July 3, 10:45 am—July 5, 11:08 am, Session 2:
July 5, 11:26 am—July 6, 3:53 pm and Session 3: July 6,
4:01 pm—July 6, 8:50 pm. The experiment is not con-
trolled, participants of all gender and age (8–65) partici-
pated freely, but those who used the simulation had a
clear interest in the Royal Society’s state-of-the-art exhib-
its. The mean time difference between simulation users
was 7.05 min over all the sessions and included all 347
users. The simulation ran for a maximum of 3 min, the
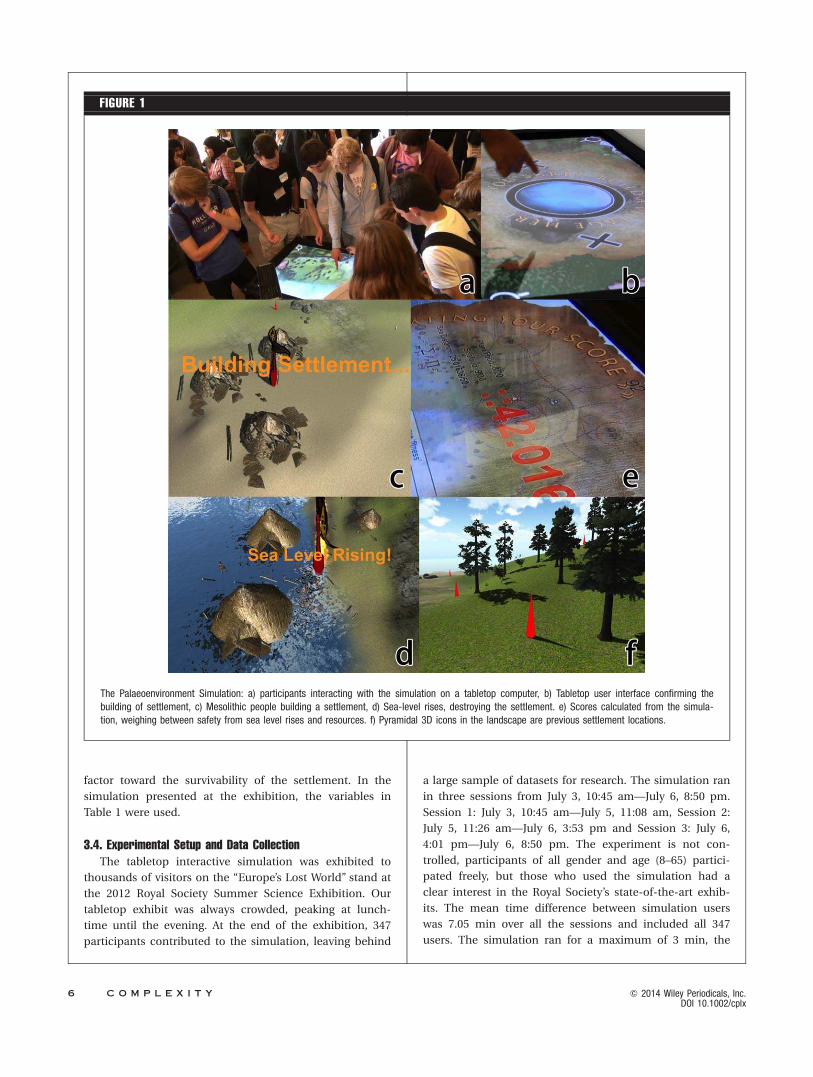
FIGURE 1
The Palaeoenvironment Simulation: a) participants interacting with the simulation on a tabletop computer, b) Tabletop user interface confirming the
building of settlement, c) Mesolithic people building a settlement, d) Sea-level rises, destroying the settlement. e) Scores calculated from the simula-
tion, weighing between safety from sea level rises and resources. f) Pyramidal 3D icons in the landscape are previous settlement locations.
6 C O M P L E X I T Y Q 2014 Wiley Periodicals, Inc.DOI 10.1002/cplx
additional 4 min on average was used for resetting the
simulation, explaining the concept of the simulation to
the next user and viewing of a presimulation user inter-
face tutorial. Most participants did not find the tabletop
interaction difficult to learn, we believe that the learning
curve was minimized due to the touch-based interaction
similar to pervasive devices such as smartphones and tab-
let computers.
Participants went through a simple process in the
simulation.
1. The purpose of the simulation and the background
of the study were explained to the participants
prior to the start of the experiment and included
information on the prehistoric diet and life style,
dangers of coastal inundation, and so forth.
Explaining the imperative of survival to the partici-
pants prepared them for ‘‘survival’’ (knowledge of
survival strategies would have been passed from
generation to generation in prehistory). Care was
taken not to reveal strategic locations in the land-
scape. Participants were made aware of the experi-
ment being undertaken and videoing was
authorized by participants.
2. Prior to starting the simulation, all previous loca-
tions of participants of the session were loaded and
a small red, pyramidal 3D icon (see Figure 1)
placed on the landscape to indicate previous settle-
ments to the current participant. This information
was intended to support the study of stigmergy.
3. Participants navigated and explored the landscape
for the best location to build a Mesolithic settle-
ment. The navigation widget is a large pole with a
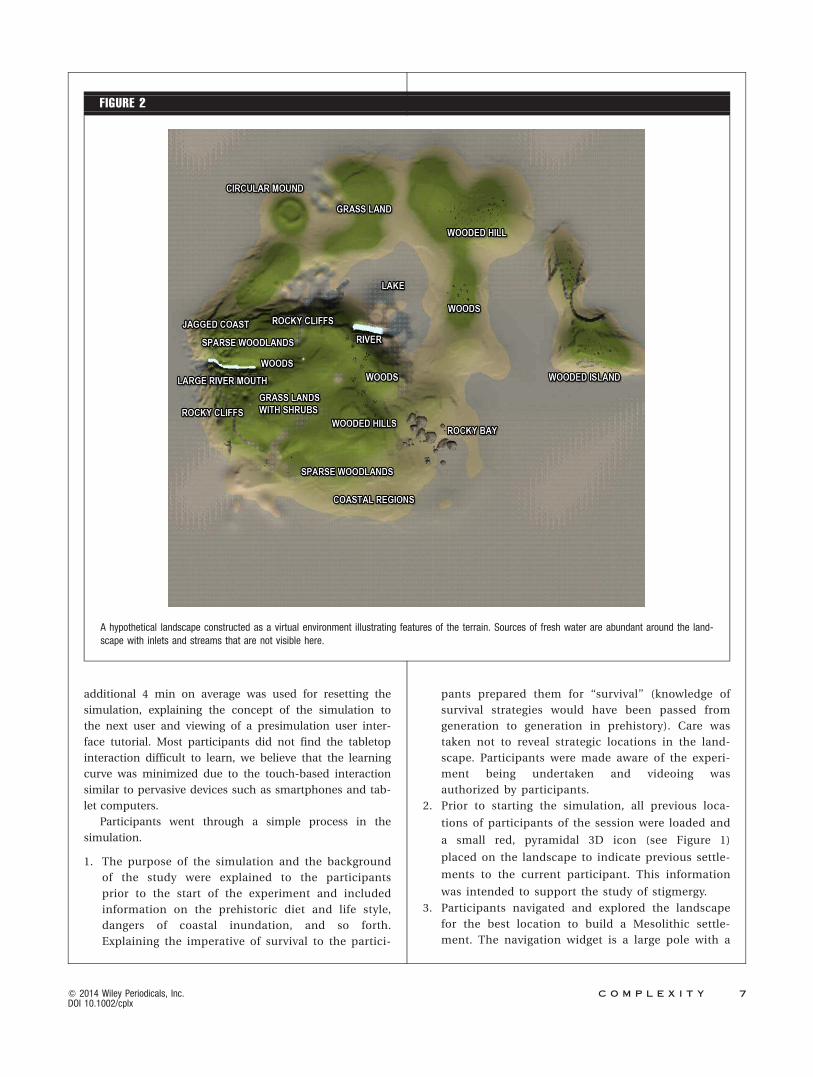
FIGURE 2
A hypothetical landscape constructed as a virtual environment illustrating features of the terrain. Sources of fresh water are abundant around the land-
scape with inlets and streams that are not visible here.
C O M P L E X I T Y 7Q 2014 Wiley Periodicals, Inc.DOI 10.1002/cplx
flag that participants used for planting at a location
which triggers the virtual camera to navigate to the
destination where the flag was placed.
4. Participants selected the ‘‘build’’ option and confirmed
the settlement location with a confidence level indica-
tor (participants indicate how confident they were with
regards to their chosen settlement location)
5. Participants watched as agents built the settlement
6. A visualization of sea level rise occurs (if the sea
level rises above the settlement, a physics simula-
tion of the destruction of the village is triggered)
7. At the end of the sea level rise, the user interface
shows the calculation of the scores
8. Participants input their names.
9. All information (location of settlement as x, y, z,
the confidence level, total score, marine, and ter-
restrial resource scores, time used in seconds, a
timestamp consisting of the year, month, day, hour,
minutes, and seconds) is recorded in a database.
The object of the simulation was to gather data that
allowed researchers to begin to compare modern human
decision-making with prehistoric behavior, and to draw
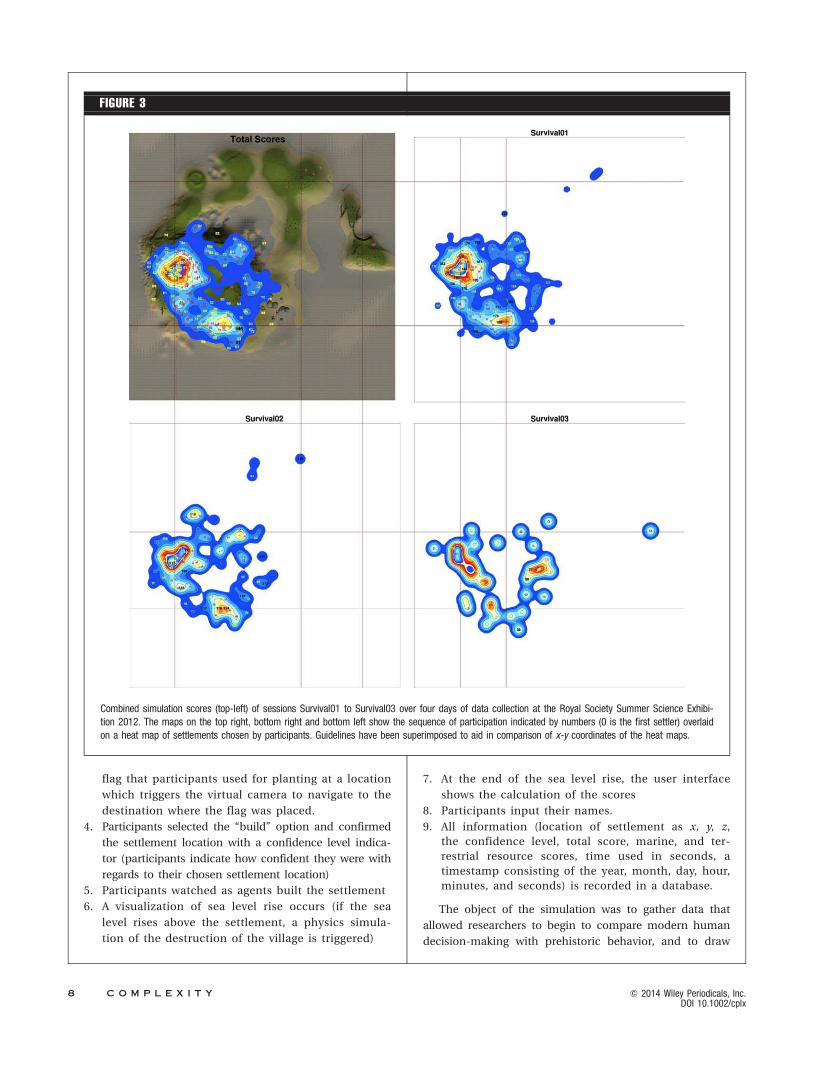
FIGURE 3
Combined simulation scores (top-left) of sessions Survival01 to Survival03 over four days of data collection at the Royal Society Summer Science Exhibi-
tion 2012. The maps on the top right, bottom right and bottom left show the sequence of participation indicated by numbers (0 is the first settler) overlaid
on a heat map of settlements chosen by participants. Guidelines have been superimposed to aid in comparison of x-y coordinates of the heat maps.
8 C O M P L E X I T Y Q 2014 Wiley Periodicals, Inc.DOI 10.1002/cplx
conclusions based on the presumption that when faced
with the need to survive, participants using the simulation
might generate similar behavior to earlier settlers. We
looked for evidence of learning and ascertained whether
stigmergy works in such situations, that is, future settlers
read information left behind by past dwellers on the land-
scape and build there. We expected participants, who
understood the importance of survival, to seek for strategic
locations in situations of urgency rather than choosing less
prosaic factors, that is, the view from a specific location. To
create a sense of urgency for our participants, we limited
the simulation to 180 secs. This imparts a sense of ‘virtual’
urgency to the simulation. Participants were notified when
they had 60 secs left before the sea level begin to rise.
We understood that participants had only a limited
time at the exhibit. We, therefore, replicated the mobility
of prehistoric settlers, who might roam far and wide
before settling down, with a top-down view of the land-
scape, on the tabletop display. This allowed them to
explore much more of the landscape in a far shorter time
than would their prehistoric predecessors.
4. DATA ANALYSIS
Here, we investigated the data collected from partici-
pant interactions with the simulation over a span of 4
days. We first looked at the distribution of settlements
across the landscape. Figure 2 depicts landscape features
FIGURE 4
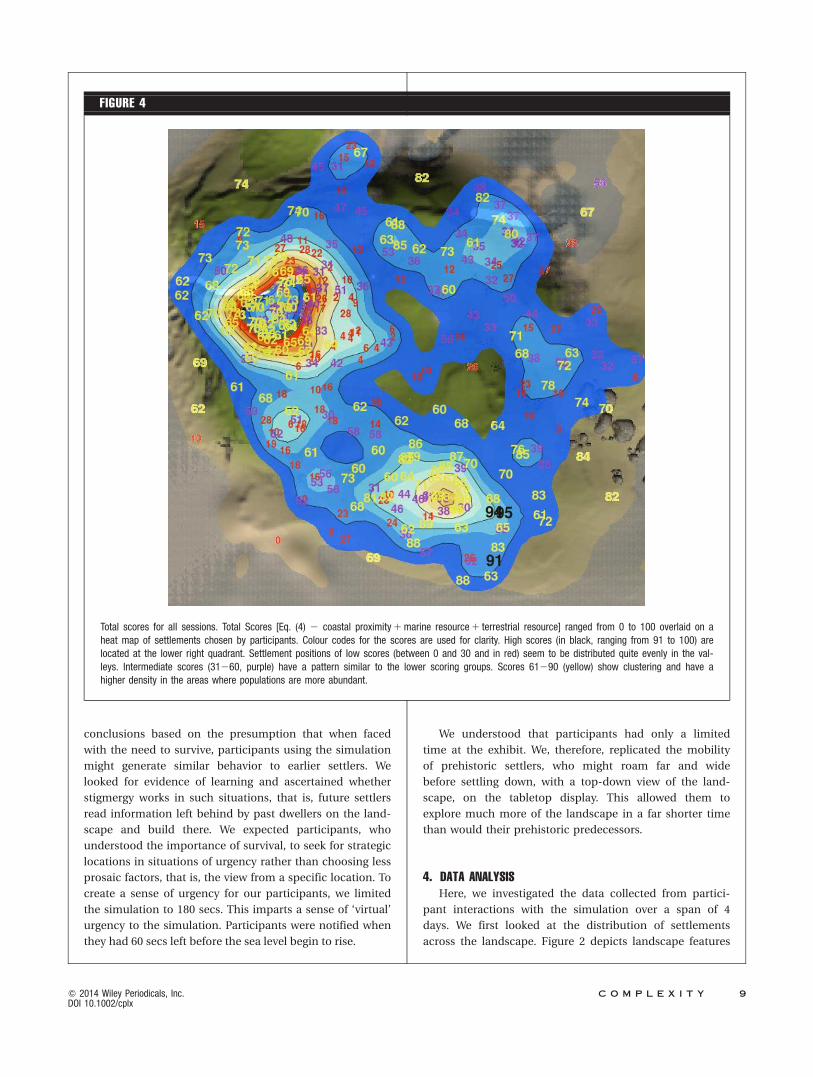
Total scores for all sessions. Total Scores [Eq. (4) 2 coastal proximity1marine resource1 terrestrial resource] ranged from 0 to 100 overlaid on a
heat map of settlements chosen by participants. Colour codes for the scores are used for clarity. High scores (in black, ranging from 91 to 100) are
located at the lower right quadrant. Settlement positions of low scores (between 0 and 30 and in red) seem to be distributed quite evenly in the val-
leys. Intermediate scores (31260, purple) have a pattern similar to the lower scoring groups. Scores 61290 (yellow) show clustering and have a
higher density in the areas where populations are more abundant.
C O M P L E X I T Y 9Q 2014 Wiley Periodicals, Inc.DOI 10.1002/cplx
within the hypothetical environment that our participants
explored. We deliberately made the island small to create
a sense of urgency. We expected that having a small island
also reduce participant exploration time, which increases
our chance of capturing more data from more partici-
pants, thus increasing our sample size. There were only
two small rivers within the small island and they were
intended as a source of portable water. None of the partic-
ipants were told about the best location to build a settle-
ment on the map. The participants were only told
generally about the properties of food, and where hazel
shrubs would grow.
4.1. Settlement Clusters and Heat Maps
Figure 3 shows the heat map and the sequence of settle-
ments built by participants (1, 2, . . ., S) in three separate
but continuous sessions. The figure on the top left (a)
shows the concentration of settlements as a heat map
together with scores (0–100) overlaid on the map. The other
figures (b–c) are data from individual sessions. Session 01
had 121 participants, session 02 had 39 participants, and
session 03 had 187 participants. The heat map for each of
the session and their settlement scores (The Total Score in
Eq. (4)—coastal proximity1marine resource1 terrestrial
resource) is color coded in three ranges, 0–30, 31–60, and
61–100 (see Figures 4 and 5). Comparison of the heat maps
(see figure guide lines) indicates that similar patterns
emerge as the number of participants increases (Session 01
and 02), and that ‘‘settlement builders’’ have a natural
attraction toward certain features of the terrain. We would
expect a similar pattern if the number of participants is
increased in session 03. Participants’ preference seems to
follow a certain priority, such as the large river mouth,
sparse woodlands near coastal areas, and the lake. Our set-
tlement builders kept away from islands, open areas
including grasslands and coasts, ravines, treacherous
coastal areas, and rocky bays.
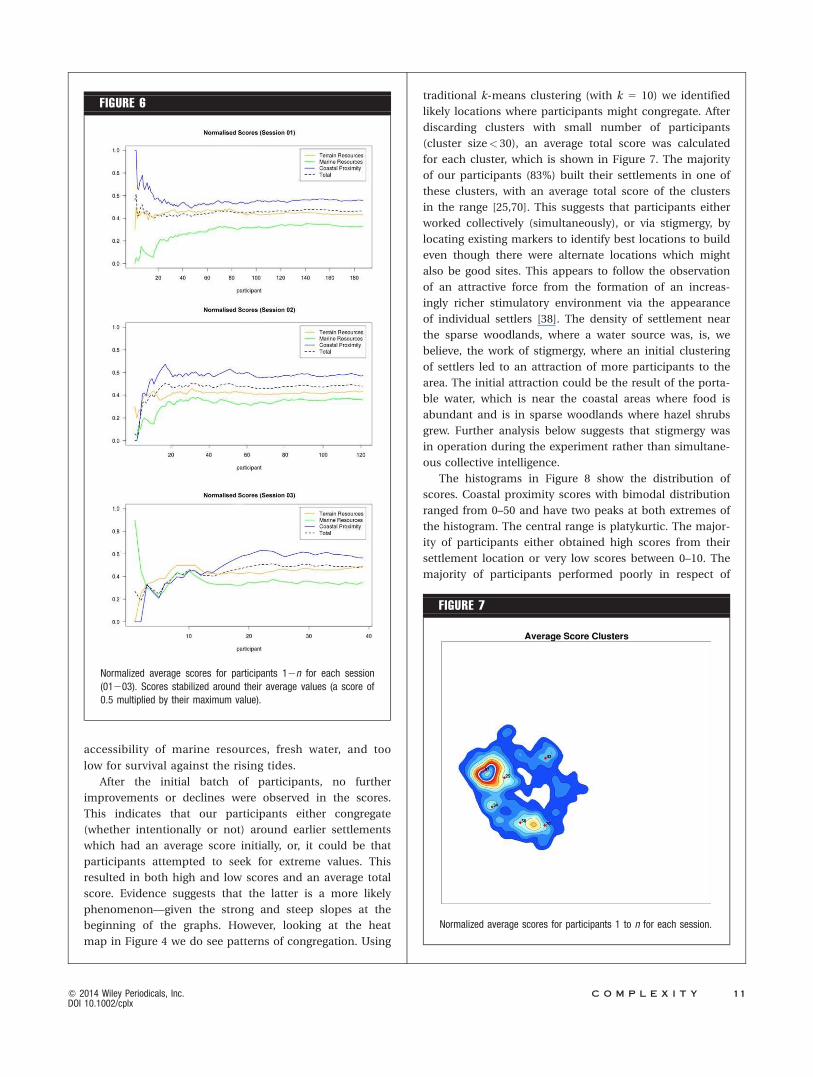
4.2. Evidence of Stigmergy
In Figure 6, we illustrate the normalized average scores
for participant 1 to n for each session (01–03). It was
expected that scores for the sessions would stabilize after
a certain number of participants. Extreme scores would
have a decreasing impact on the overall average. However,
it should still be informative to see how the average scores
progressed over time.
The first thing that is visible from the graphs in Figure 6 is
that scores in all three sessions stabilized roughly around their
average values (a score of 0.5 multiplied by their maximum
value). For sessions 1 and 2 this occurred approximately after
the 100th participant, looking at the trend, session 3 is pro-
jected to follow a similar pattern. Secondly, we can see that the
total score is strongly related to the coastal proximity score as
it follows a similar pattern, this is largely due to coastal prox-
imity’s 0.5 weighted importance.
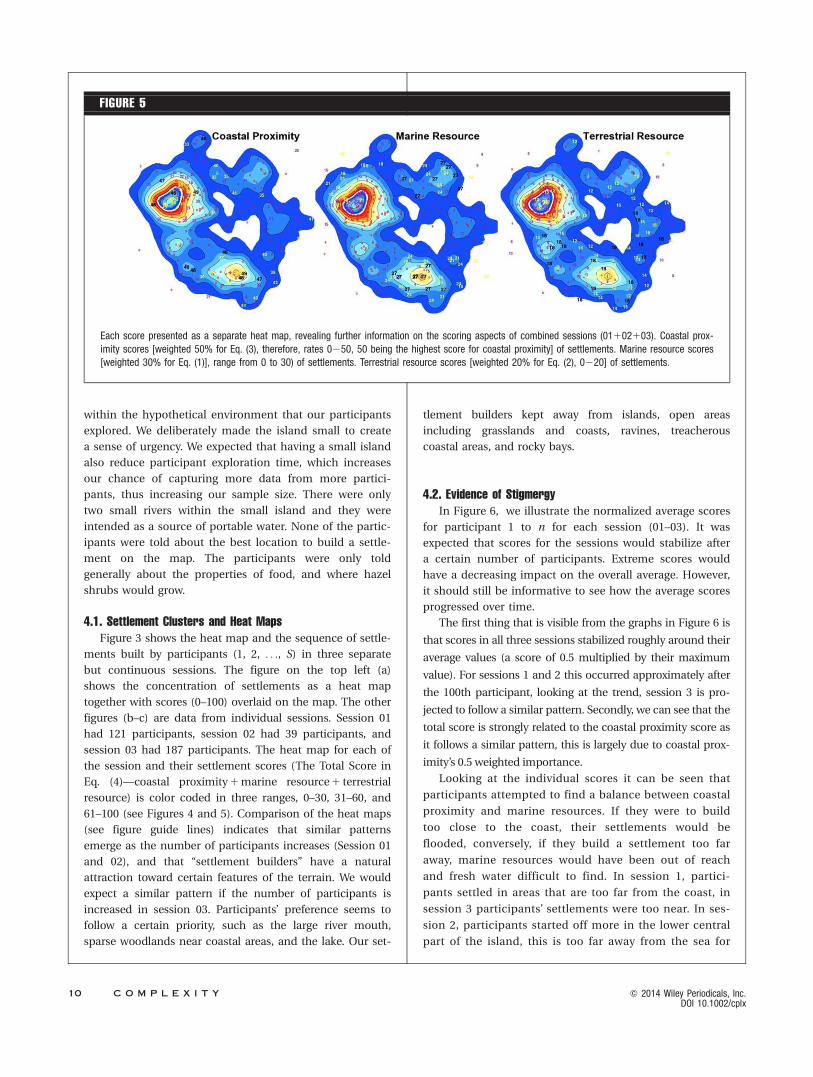
Looking at the individual scores it can be seen that
participants attempted to find a balance between coastal
proximity and marine resources. If they were to build
too close to the coast, their settlements would be
flooded, conversely, if they build a settlement too far
away, marine resources would have been out of reach
and fresh water difficult to find. In session 1, partici-
pants settled in areas that are too far from the coast, in
session 3 participants’ settlements were too near. In ses-
sion 2, participants started off more in the lower central
part of the island, this is too far away from the sea for
FIGURE 5
Each score presented as a separate heat map, revealing further information on the scoring aspects of combined sessions (01102103). Coastal prox-
imity scores [weighted 50% for Eq. (3), therefore, rates 0250, 50 being the highest score for coastal proximity] of settlements. Marine resource scores
[weighted 30% for Eq. (1)], range from 0 to 30) of settlements. Terrestrial resource scores [weighted 20% for Eq. (2), 0220] of settlements.
10 C O M P L E X I T Y Q 2014 Wiley Periodicals, Inc.DOI 10.1002/cplx
accessibility of marine resources, fresh water, and too
low for survival against the rising tides.
After the initial batch of participants, no further
improvements or declines were observed in the scores.
This indicates that our participants either congregate
(whether intentionally or not) around earlier settlements
which had an average score initially, or, it could be that
participants attempted to seek for extreme values. This
resulted in both high and low scores and an average total
score. Evidence suggests that the latter is a more likely
phenomenon—given the strong and steep slopes at the
beginning of the graphs. However, looking at the heat
map in Figure 4 we do see patterns of congregation. Using
traditional k-means clustering (with k 5 10) we identified
likely locations where participants might congregate. After
discarding clusters with small number of participants
(cluster size< 30), an average total score was calculated
for each cluster, which is shown in Figure 7. The majority
of our participants (83%) built their settlements in one of
these clusters, with an average total score of the clusters
in the range [25,70]. This suggests that participants either
worked collectively (simultaneously), or via stigmergy, by
locating existing markers to identify best locations to build
even though there were alternate locations which might
also be good sites. This appears to follow the observation
of an attractive force from the formation of an increas-
ingly richer stimulatory environment via the appearance
of individual settlers [38]. The density of settlement near
the sparse woodlands, where a water source was, is, we
believe, the work of stigmergy, where an initial clustering
of settlers led to an attraction of more participants to the
area. The initial attraction could be the result of the porta-
ble water, which is near the coastal areas where food is
abundant and is in sparse woodlands where hazel shrubs
grew. Further analysis below suggests that stigmergy was
in operation during the experiment rather than simultane-
ous collective intelligence.
The histograms in Figure 8 show the distribution of
scores. Coastal proximity scores with bimodal distribution
ranged from 0–50 and have two peaks at both extremes of
the histogram. The central range is platykurtic. The major-
ity of participants either obtained high scores from their
settlement location or very low scores between 0–10. The
majority of participants performed poorly in respect of
FIGURE 6
Normalized average scores for participants 12n for each session
(01203). Scores stabilized around their average values (a score of
0.5 multiplied by their maximum value).
FIGURE 7
Normalized average scores for participants 1 to n for each session.
C O M P L E X I T Y 11Q 2014 Wiley Periodicals, Inc.DOI 10.1002/cplx
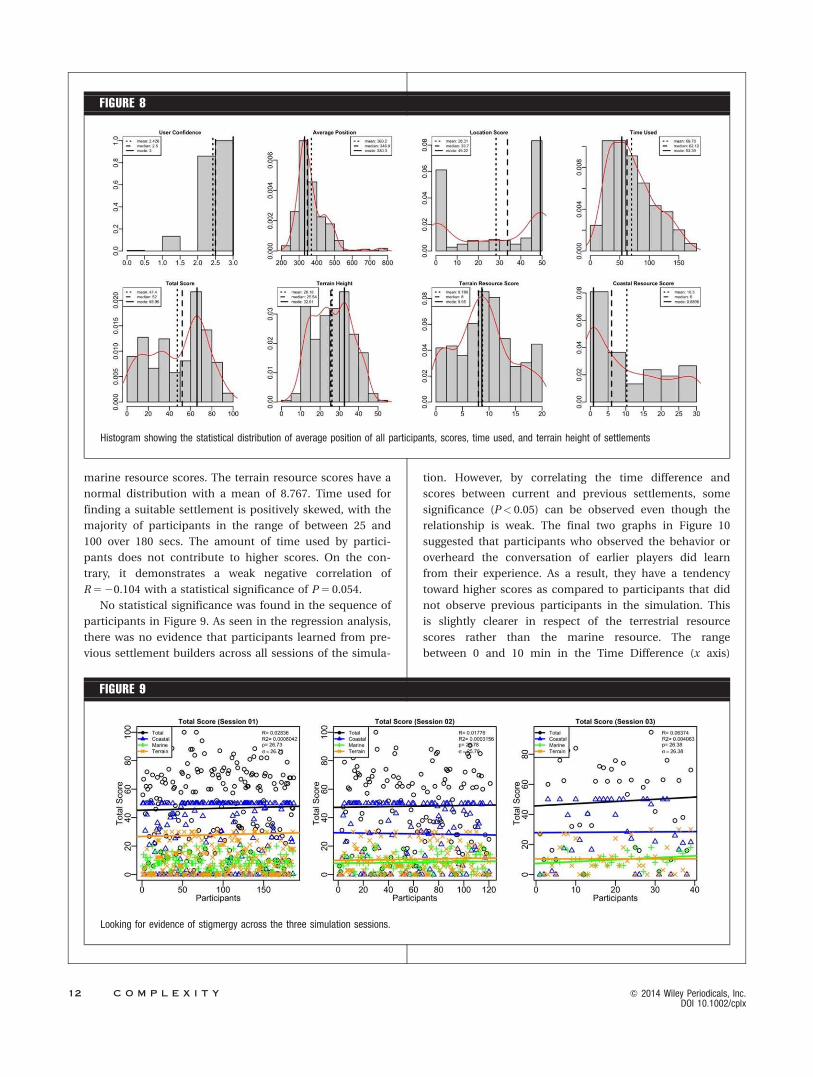
marine resource scores. The terrain resource scores have a
normal distribution with a mean of 8.767. Time used for
finding a suitable settlement is positively skewed, with the
majority of participants in the range of between 25 and
100 over 180 secs. The amount of time used by partici-
pants does not contribute to higher scores. On the con-
trary, it demonstrates a weak negative correlation of
R520.104 with a statistical significance of P5 0.054.
No statistical significance was found in the sequence of
participants in Figure 9. As seen in the regression analysis,
there was no evidence that participants learned from pre-
vious settlement builders across all sessions of the simula-
tion. However, by correlating the time difference and
scores between current and previous settlements, some
significance (P< 0.05) can be observed even though the
relationship is weak. The final two graphs in Figure 10
suggested that participants who observed the behavior or
overheard the conversation of earlier players did learn
from their experience. As a result, they have a tendency
toward higher scores as compared to participants that did
not observe previous participants in the simulation. This
is slightly clearer in respect of the terrestrial resource
scores rather than the marine resource. The range
between 0 and 10 min in the Time Difference (x axis)
FIGURE 8
Histogram showing the statistical distribution of average position of all participants, scores, time used, and terrain height of settlements
FIGURE 9
Looking for evidence of stigmergy across the three simulation sessions.
12 C O M P L E X I T Y Q 2014 Wiley Periodicals, Inc.DOI 10.1002/cplx
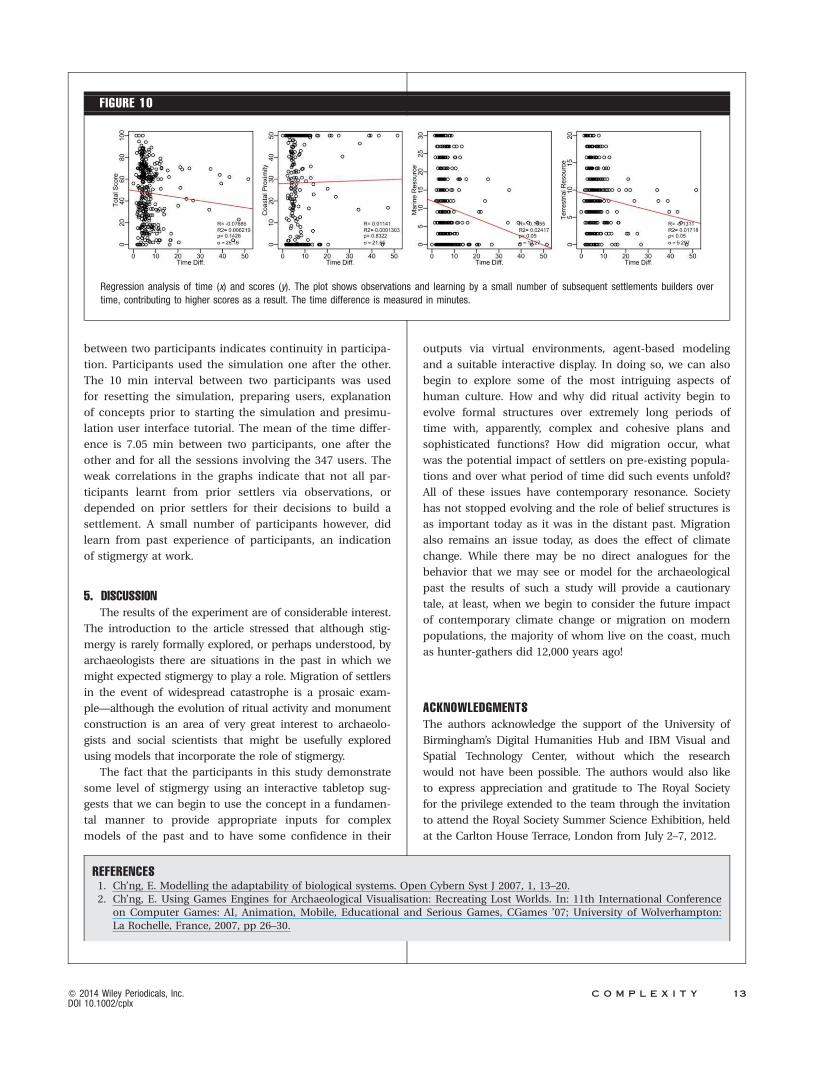
between two participants indicates continuity in participa-
tion. Participants used the simulation one after the other.
The 10 min interval between two participants was used
for resetting the simulation, preparing users, explanation
of concepts prior to starting the simulation and presimu-
lation user interface tutorial. The mean of the time differ-
ence is 7.05 min between two participants, one after the
other and for all the sessions involving the 347 users. The
weak correlations in the graphs indicate that not all par-
ticipants learnt from prior settlers via observations, or
depended on prior settlers for their decisions to build a
settlement. A small number of participants however, did
learn from past experience of participants, an indication
of stigmergy at work.
5. DISCUSSION
The results of the experiment are of considerable interest.
The introduction to the article stressed that although stig-
mergy is rarely formally explored, or perhaps understood, by
archaeologists there are situations in the past in which we
might expected stigmergy to play a role. Migration of settlers
in the event of widespread catastrophe is a prosaic exam-
ple—although the evolution of ritual activity and monument
construction is an area of very great interest to archaeolo-
gists and social scientists that might be usefully explored
using models that incorporate the role of stigmergy.
The fact that the participants in this study demonstrate
some level of stigmergy using an interactive tabletop sug-
gests that we can begin to use the concept in a fundamen-
tal manner to provide appropriate inputs for complex
models of the past and to have some confidence in their
outputs via virtual environments, agent-based modeling
and a suitable interactive display. In doing so, we can also
begin to explore some of the most intriguing aspects of
human culture. How and why did ritual activity begin to
evolve formal structures over extremely long periods of
time with, apparently, complex and cohesive plans and
sophisticated functions? How did migration occur, what
was the potential impact of settlers on pre-existing popula-
tions and over what period of time did such events unfold?
All of these issues have contemporary resonance. Society
has not stopped evolving and the role of belief structures is
as important today as it was in the distant past. Migration
also remains an issue today, as does the effect of climate
change. While there may be no direct analogues for the
behavior that we may see or model for the archaeological
past the results of such a study will provide a cautionary
tale, at least, when we begin to consider the future impact
of contemporary climate change or migration on modern
populations, the majority of whom live on the coast, much
as hunter-gathers did 12,000 years ago!
ACKNOWLEDGMENTS
The authors acknowledge the support of the University of
Birmingham’s Digital Humanities Hub and IBM Visual and
Spatial Technology Center, without which the research
would not have been possible. The authors would also like
to express appreciation and gratitude to The Royal Society
for the privilege extended to the team through the invitation
to attend the Royal Society Summer Science Exhibition, held
at the Carlton House Terrace, London from July 2–7, 2012.
REFERENCES1. Ch’ng, E. Modelling the adaptability of biological systems. Open Cybern Syst J 2007, 1, 13–20.
2. Ch’ng, E. Using Games Engines for Archaeological Visualisation: Recreating Lost Worlds. In: 11th International Conference
on Computer Games: AI, Animation, Mobile, Educational and Serious Games, CGames ’07; University of Wolverhampton:
La Rochelle, France, 2007, pp 26–30.
FIGURE 10
Regression analysis of time (x) and scores (y). The plot shows observations and learning by a small number of subsequent settlements builders over
time, contributing to higher scores as a result. The time difference is measured in minutes.
C O M P L E X I T Y 13Q 2014 Wiley Periodicals, Inc.DOI 10.1002/cplx
3. Ch’ng, E.; Stone, R. J. 3D archaeological reconstruction and visualization: An artificial life model for determining vegetation
dispersal patterns in ancient landscapes. In: Presence: Teleoperators and Virtual Environments, Vol. 15; IEEE Computer
Society: Sydney, Australia, 2006a, 15, 341–352.
4. Ch’ng, E.; Stone, R.J. Enhancing virtual reality with artificial life: Reconstructing a flooded European mesolithic landscape.
Presence 2006b, 15, 341–352.
5. Fitch, S. Time and tide: Modelling the effects of landscape change on population support in the southern North Sea. In: Vis-
ual Heritage in the Digital Age; Springer, London, 2013, pp 275–295.
6. Gaffney, V.L.; Fitch, S.; Smith, D. Europe’s Lost World: The Rediscovery of Doggerland. York: Council for British Archaeology,
CBA Research Report. No. 160, 2009.
7. Benjamin, J. Submerged Prehistory; Oxford: Oxbow, 2011.
8. Ch’ng, E.; Gaffney, V.L. Simulation and visualisation of agent survival and settlement behaviours in the hunter-gatherer colo-
nisation of mesolithic landscapes. In: Visual Heritage in the Digital Age. Springer Cultural Computing Series; Ch’ng, E.; Gaff-
ney, V. L.; Chapman, H., Eds.; 2013.
9. Gaffney, V.L.; Thomson, K.; Fitch, S. Mapping Doggerland: The Mesolithic landscapes of the southern North Sea; Archaeo-
press, 2007.
10. Kohler, T.A.; Varien, M.D. Emergence and Collapse of Early Villages: Models of Central Mesa Verde Archaeology, Vol. 6; Univ
of California Press, CA, 2012.
11. Mithen, S.J. After the Ice: A Global Human History, 20,000–5,000BC; Harvard University Press, Weidenfeld and Nicolson:
Cambridge, MA and London, 2003.
12. Gaffney, V.L.; Fitch, S.; Ramsey, E.; Yorston, R.; Ch’ng, E.; Baldwin, E.; Bates, R.; Gaffney, C.; Ruggles, C.; Sparrow, T.;
McMillan, A.; Cowley, D.; Fraser, S.; Murray, C.; Murray, H.; Hopla, E.; Howard, A. Time and a place: A luni-solar ‘‘time-reck-
oner’’ from 8th millennium BC Scotland. Internet Archaeol 2013, 34.
13. Craenen, B.; Murgatroyd, P.; Theodoropoulos, G.; Gaffney, V.; Suryanarayanan, V. MWGrid: A system for distributed agent-
based simulation in the digital humanities. In: Proceedings of the 2012 IEEE/ACM 16th International Symposium on Dis-
tributed Simulation and Real Time Applications; IEEE Computer Society, Dublin, Ireland, 2012, pp 124–131.
14. Kohler, T.A.; Gumerman, G.J. Dynamics in Human and Primate Societies: Agent-Based Modeling of Social and Spatial Proc-
esses. Oxford University Press on Demand, Oxford, 2000.
15. Lake, M.W. Trends in Archaeological Simulation. J Archaeol Method Theory 2014, 21, 1–30.
16. Murgatroyd, P.; Craenen, B.; Theodoropoulos, G.; Gaffney, V.; Haldon, J. Modelling medieval military logistics: An agent-
based simulation of a Byzantine army on the march. Comput Math Org Theory 2012, 18, 488–506.
17. Goldstone, R.L.; Roberts, M.E. Self-organized trail systems in groups of humans. Complexity 2006, 11, 43–50.
18. Wickham-Jones, C. Europe’s Lost World, 2012. Available at: https://www.facebook.com/pages/Europes-Lost-World/
198528573599200. Accessed on March 06, 2014.
19. Grass�e, P.P. La th�eorie de la stigmergie: essai d’interpr�etation du comportement des termites constructeurs. Insectes Sociaux
1959, 6, 41–81.
20. Grass�e, P.P. Termitologia, Fondation des Soci�et�es. Construction. Tome II; Masson: Paris, 1984.
21. Holland, O.; Melhuish, C. Stigmergy, self-organization, and sorting in collective robotics. Artif Life 1999, 5, 173–202.
22. Ch’ng, E.; Gaffney, V.L.; Chapman, H.P. From Product to Process: New Directions in Digital Heritage. In: Din, H.; Wu, S,
editors. Digital Heritage and Culture: Strategic and Implementation. World Scientific, Singapore, 2014.
23. Binford, L.R.; Cherry, J.F. In Pursuit of the Past; Thames and Hudson: London, 1983.
24. Waddington, C.; Bailey, G.N. Mesolithic settlement in the North Sea Basin: A Case Study from Howick; Oxbow Books:
North-East England, 2007.
25. Murray, H. K.; Murray, J. C.; Fraser, S. M. A Tale of the Unknown Unknowns: A Mesolithic Pit Alignment and a Neolithic
Timber hall at Warren Field, Crathes, Aberdeenshire; Oxbow: Oxford, 2009.
26. Bonabeau, E. Editor’s introduction: stigmergy. Artif Life 1999, 5, 95–96.
27. Goss, S.; Beckers, R.; Deneubourg, J.L.; Aron, S.; Pasteels, J.M. How trail laying and trail following can solve foraging prob-
lems for ant colonies. In: Behavioural Mechanisms of Food Selection, NATO ASI Series, Vol. 20; Hughes, R. N., Ed.; Berlin:
Springer-Verlag, 1990, pp 661–678.
28. Theraulaz, G.; Bonabeau, E. A brief history of stigmergy. Artif Life 1999, 5, 97–116.
29. Helbing, D.; Keltsch, J.; Molnar, P. Modelling the evolution of human trail systems. Nature 1997, 388, 47–50.
30. Helbing, D.; Schweitzer, F.; Keltsch, J.; Moln�ar, P. Active walker model for the formation of human and animal trail systems.
Phys Rev E 1997, 56, 2527–2539. Available at: http://link.aps.org/doi/10.1103/PhysRevE.56.2527.
31. Ch’ng, E.; Lewis, A.; Gehlken, R.E.; Woolley, S.I. A theoretical framework for stigmergetic reconstruction of ancient text. In:
Visual Heritage in the Digital Age. Springer Cultural Computing Series; Ch’ng, E.; Gaffney, V. L.; Chapman, H., Eds.; 2013.
32. Rabaud, E. Ph�enomene Social et Soci�et�es Animales; Felix Alcan, Paris, 1937.
33. Halley, J.; Winkler, D.A. Consistent concepts of self-organization and self-assembly. Complexity 2008, 14, 10–17.
34. Mithen, S.J. Hunter-Gatherer Landscape Archaeology: The Southern Hebrides Mesolithic Project, 1988–1998; Vol. 1; McDo-
nald Institute for Archaeological Research, Cambridge, 2001.
35. Ch’ng, E. The Mirror Between Two Worlds: 3D Surface Computing Interaction for Digital Objects and Environments, in Har-
rison, D., editor. Digital Media and Technologies for Virtual Artistic Spaces, Hershey, PA, IGI Global, 2013.
36. Seow, S.C.; Wixon, D.; Mackenzie, S.; Jacucci, G.; Morrison, A.; Wilson, A. Multitouch and surface computing. In: CHI EA ’09
Proceedings of the 27th International Conference Extended Abstracts on Human Factors in Computing Systems; ACM: New
York, NY, USA, 2009.
14 C O M P L E X I T Y Q 2014 Wiley Periodicals, Inc.DOI 10.1002/cplx

37. Shen, C.; Ryall, K.; Forlines, C.; Esenther, A.; Vernier, F.; Everitt, K.; Wu, M.; Wigdor, D.; Morris, M.R.; Hancock, M.; Tse, E.
Informing the design of direct-touch tabletops. IEEE Comput Graph Appl 2006, 26, 36–46.
38. Theraulaz, G.; Bonabeau, E.; Deneubourg, J.-L. The origin of nest complexity in social insects. Complexity 1998, 3, 15–25.
39. Ch’ng, E.; Stone, R.J.; Arvanitis, T.N. The Shotton river and Mesolithic dwellings: Recreating the past from geo-seismic data
sources. In Cain, K.; Chrysanthou, Y.; Niccolucci, F.; Silberman, N.A., editors. The 5th International Symposium on Virtual
Reality, Archaeology and Cultural Heritage, VAST’04, Brussels, Belgium, 2004, pp 125–134.
C O M P L E X I T Y 15Q 2014 Wiley Periodicals, Inc.DOI 10.1002/cplx