stiffness of mouse aortic elastin and its
TRANSCRIPT
STIFFNESS OF MOUSE AORTIC ELASTIN AND ITS POSSIBLE RELATION TO AORTIC MEDIA STRUCTURE
by
Trisha Elaine Clark
B.Sc., University of Guelph, 2000
B.Ed., University of Ottawa, 2001
A THESIS SUBMITTED IN PARTIAL FULFILMENT OF THE REQUIREMENTS FOR THE DEGREE OF
MASTER OF SCIENCE
in
THE FACULTY OF GRADUATE STUDIES
(Zoology)
THE UNIVERSITY OF BRITISH COLUMBIA (Vancouver)
June 2013
© Trisha Elaine Clark, 2013
ii
Abstract
Aortic elastin allows arterial expansion on systole and subsequent elastic recoil during
diastole, providing crucial capacitance and associated dampening of the cardiac pressure
pulses. The structure and mechanical properties of the aortic wall are not uniform along its
length due to the varying hemodynamic conditions to which it is exposed, but elastin’s
contributions to this variation are not well studied. The artery wall is a composite of two main
structural proteins: elastin and collagen. Autoclaving an intact aorta removes the collagen and
produces a mechanically competent vessel consisting of purified elastin, which can be used to
study elastin’s contribution to arterial mechanics. Although it is generally assumed that elastin’s
material stiffness is constant, a recent study in pigs found that it increased 30% along the
thoracic aorta. I hypothesized that this increase in elastin stiffness was caused by a difference
in the amount of elastin, the amount or orientation of the interlamellar elastin fibres (IEL), the
partitioning of elastin between its three forms, the thickness or orientation of the elastic
lamellae, or the number of elastin struts. Uniaxial tensile testing of autoclaved mouse aortas
showed that elastin’s stiffness is 43% lower in abdominal aortas compared with thoracic aortas,
allowing the mouse aorta to be used as a model to investigate this surprising variation in elastin
stiffness. Elastin structure within the thin mouse aortic walls was imaged with multiphoton laser
scanning microscopy to identify any differences in the elastin structure that could cause the
variation in stiffness. No difference was found between the elastin structure of the thoracic and
abdominal aortas that could account for the difference in elastic modulus; however, I was not
able to count the elastin struts or measure the elastin fibre packing density in the elastic
lamellae and so could not reject these two hypotheses.
iii
Preface
This dissertation is an original intellectual product of the author, T. Clark. The work was
carried out under UBC Animal Care Certificate #A12-0107.
iv
Table of Contents
Abstract .................................................................................................................................... ii
Preface ..................................................................................................................................... iii
Table of Contents .................................................................................................................... iv
List of Tables ........................................................................................................................... vi
List of Figures ........................................................................................................................ vii
List of Abbreviations ............................................................................................................ viii
Glossary .................................................................................................................................. ix
Acknowledgements ................................................................................................................. x
Introduction .............................................................................................................................. 1 Components of the Artery Wall ............................................................................................... 2 Structure of the Artery Wall ..................................................................................................... 2 Function of the Artery Wall ..................................................................................................... 5
Longitudinal Strain .............................................................................................................. 6 Purified Elastin Aortic Stiffness ........................................................................................... 7
Microscopy Technique ............................................................................................................ 7 Mouse Model .......................................................................................................................... 8 Thesis Objectives and Hypotheses ......................................................................................... 9
Materials and Methods .......................................................................................................... 11 Experimental Animals ........................................................................................................... 11 Mechanical Testing............................................................................................................... 11
Experimental Protocols ..................................................................................................... 11 Ring Preparation ........................................................................................................... 11 Mechanical Testing Setup ............................................................................................. 13 Mechanical Testing........................................................................................................ 14 Measuring Hook and Transducer Compliance ............................................................... 15 Autoclaving .................................................................................................................... 16
Data Analysis .................................................................................................................... 17 Determining Ring Dimensions ....................................................................................... 17 Hook and Transducer Compliance ................................................................................ 19 Mechanical Testing........................................................................................................ 19
Statistical Analysis ............................................................................................................ 21 Morphology .......................................................................................................................... 22
Experimental Protocol – Histology .................................................................................... 22 Experimental Protocols – Multiphoton Laser Scanning Microscopy ................................... 22
Sample Preparation ....................................................................................................... 22 Stretch Ratios ................................................................................................................ 23 Multiphoton Laser Scanning Microscopy ....................................................................... 24
Data Analysis .................................................................................................................... 25 Histology ....................................................................................................................... 25 MPLSM Images ............................................................................................................. 25
Statistical Analysis ............................................................................................................ 26
Results .................................................................................................................................... 27 Mechanical Testing............................................................................................................... 27
Initial Length ..................................................................................................................... 32
v
Autoclave Time ................................................................................................................. 33 Effect of Mouse Age and Weight ....................................................................................... 34
Morphology .......................................................................................................................... 35 Histology ........................................................................................................................... 35 Stretch Ratio ..................................................................................................................... 37 Multiphoton Laser Scanning Microscopy ........................................................................... 37
Discussion .............................................................................................................................. 44 Analyzing the Data ............................................................................................................... 44
Comparisons of Size – Large and Small ........................................................................... 44 Techniques .................................................................................................................... 44 Normalizing Force and Displacement ............................................................................ 44 Stretch Ratios and Inflation Pressure ............................................................................ 47
Comparisons of State – Intact and Purified Elastin ............................................................ 48 Autoclave Time .............................................................................................................. 49
Comparisons of Ring Positions – Elastic Modulus............................................................. 51 Morphology .......................................................................................................................... 52
Hypotheses ....................................................................................................................... 52 Hypothesis One: Amount of Elastin ............................................................................... 52 Hypothesis Two: Interlamellar Elastin Fibres (IEF) ........................................................ 53 Hypothesis Three: Partitioning of Elastin ....................................................................... 54 Hypothesis Four: Elastic Lamellae Thickness or Orientation ......................................... 54 Hypothesis Five: Struts .................................................................................................. 55
MPLSM Limitations ........................................................................................................... 56 Future Direction .................................................................................................................... 56 Conclusions .......................................................................................................................... 57
References ............................................................................................................................. 59
Appendix – Experimental Data .............................................................................................. 62
vi
List of Tables
Table 1. Maximum displacement and number of sinusoidal cycles used during tensile testing .............................................................................................................................. 14
Table 2. Cumulative autoclave times for mouse aorta rings. ..................................................... 16
Table 3. Initial lengths of mouse aorta purified elastin rings as calculated by three different methods ........................................................................................................................... 32
Table 4. Aortic media measurements from histology sections of intact aortas at approximately physiological pressures. ............................................................................ 37
Table 5. Circumferential and longitudinal stretch ratios of mouse aortas ................................... 37
Table A-6. Moduli of mouse thoracic and abdominal aorta rings. .............................................. 62
Table A-7. Moduli of mouse thoracic and abdominal aorta rings. .............................................. 63
Table A-8. Moduli of mouse thoracic and abdominal aorta rings. .............................................. 63
Table A-9. Moduli of mouse thoracic and abdominal aorta rings. .............................................. 64
Table A-10. Circumferential and longitudinal stretch ratios of mouse aortas. ............................ 64
Table A-11. Thoracic aorta media thickness, elastic lamellae thickness, and lamellar unit thickness. ......................................................................................................................... 65
Table A-12. Abdominal aorta media thickness, elastic lamellae thickness, and lamellar unit thickness. ......................................................................................................................... 65
Table A-13. Thoracic aorta elastin volume as a percentage of the sample volume, surface area normalized by the number of elastic lamellae and surface area normalized by elastin volume. ................................................................................................................. 66
Table A-14. Abdominal aorta elastin volume as a percentage of the sample volume, surface area normalized by the number of elastic lamellae and surface area normalized by elastin volume. .......................................................................................... 66
vii
List of Figures
Figure 1. The structural regions of the arterial wall ...................................................................... 3
Figure 2. A section of tunica media showing the repeating lamellar units of elastin, collagen, and smooth muscle. ............................................................................................ 4
Figure 3. Typical stress-strain curve of an artery. ........................................................................ 6
Figure 4. Image of a mouse aorta ............................................................................................. 12
Figure 5. Uniaxial tensile testing setup ...................................................................................... 13
Figure 6. Setup used to test the compliance of the hooks and force transducer. ....................... 16
Figure 7. Schematics showing ring dimensions ......................................................................... 17
Figure 8. Curve showing how regression initial length was calculated ....................................... 19
Figure 9. Stress-stretch ratio curves showing range for modulus calculation ............................. 21
Figure 10. Images of aortas with and without agarose gel. ........................................................ 23
Figure 11. Experimental setup used to determine the circumferential stretch ratio at physiological pressure ..................................................................................................... 24
Figure 12. Diagram of elastin in the aorta media. ...................................................................... 26
Figure 13. Force-displacement loading and unloading curves ................................................... 27
Figure 14. Effect of autoclaving on force displacement loading curves ...................................... 28
Figure 15. Stress-stretch ratio curves ........................................................................................ 29
Figure 16. Impact of stress definition, initial length, and autoclave time on elastic modulus ...... 31
Figure 17. Effect of autoclave time on spring constants ............................................................ 33
Figure 18. Effect of age and weight on elastic modulus ............................................................. 35
Figure 19. Light microscopy cross-section of the aorta wall....................................................... 36
Figure 20. MPLSM images of the mouse aorta wall .................................................................. 39
Figure 21. MPLSM images of elastin structures in the mouse aorta wall. .................................. 40
Figure 22. Media thickness of the unloaded aorta wall as determined by MPLSM images ........ 42
Figure 23. Measurements of the mouse aorta media as determined by MPLSM images. ......... 43
Figure 24. Elastic modulus of mouse aorta rings at six positions along the aorta ...................... 54
viii
List of Abbreviations
1int artery ring cut distal to the 1st intercostal artery
6int artery ring cut distal to the 6th intercostal artery
9int artery ring cut distal to the 9th intercostal artery
acel artery ring cut proximal to the celiac artery
EGTA ethyleneglycol tetraacetic acid
IEF interlamellar elastic fibres
ilia artery ring cut proximal to the common iliac bifurcation
L0,p morphological initial length
L0,m mechanical initial length
L0,r regression initial length
lumb artery ring cut proximal to the ilio-lumbar artery
MPLSM multiphoton laser scanning microscopy
PBS phosphate buffered saline
SMC smooth muscle cells
e engineering stress
l lamellar stress
ix
Glossary
Adventitia The outermost layer of the artery wall (tunica adventitia).
Elastic modulus A measure of a material’s stiffness determined from the slope of a stress-strain or stress-stretch ratio curve.
Intact The state of an aorta before autoclaving, when it contains elastin, collagen, and smooth muscle cells.
Media The middle layer of the artery wall (tunica media).
Pre-conditioning The initial stretching of the artery before tensile testing that ensures a consistent mechanical response.
Purified elastin The state of an aorta after autoclaving, when it contains only elastin.
Spring constant A measure of an object’s stiffness determined from the slope of a force-displacement curve.
Strain The displacement or stretch of an object after normalizing for the object’s initial length (L/Lo).
Stress The load (force / cross-sectional area) acting on and deforming an object.
Stretch ratio The displacement or stretch of an object after normalizing for the object’s initial length (L/Lo).
Volume fraction The volume of elastin in the sample divided by the total volume of the sample.
x
Acknowledgements
First I would like to thank Bob Shadwick for his guidance and for being a wonderful supervisor in every respect. The positive atmosphere in the lab made me enjoy coming to school every day. I also owe a big thank you to Margo Lillie for her help throughout this whole project. She always had an open door and patiently answered my many questions. My committee members Wayne Vogl and John Gosline also provided assistance and guidance for which I am grateful.
Thank you to the Shadwick, Gosline, and Altshuler lab members for helping make the lab such a great place to work and for the many cookie runs. Thank you to Micha Ben-Zvi for starting my love-hate relationship with Matlab.
The wonderful images and second half of this thesis would not have been possible without the help of the Bioimaging Facility staff and in particular Kevin Hodgson’s technical assistance with the laser beams. I would also like to thank the staff of the Animal Resource Unit who kindly took the time to help with my project.
My parents have always been there to listen and support me through several degrees and careers; without them I wouldn’t be where I am today. My husband has lived with me through the trials and tribulations of this grad school adventure; thank you, Randy, for your encouragement and for always supporting all of my projects.
1
Introduction
William Harvey first described the circulation of the blood in 1628 (Harvey, 1628). Prior
to this it was thought that blood was produced in the liver, transported to the heart via the veins,
combined with “vital spirits” in the heart and delivered to the body via the arteries. It is now
known that arteries are not only a conduit for blood, but also smooth the pulsatile flow of blood
through the arterial system. Arteries’ expansion on systole and subsequent elastic recoil during
diastole provide capacitance for the system and dampen the pressure and flow pulses from the
heart’s contractions, resulting in a near constant flow of blood in the capillaries (Hales, 1733;
Taylor, 1964). Stephen Hales discovered this phenomenon in 1733 and likened the arterial
expansion and recoil to an air chamber on a contemporary fire engine (Hales, 1733). This air
chamber analogy was popularized by Otto Frank (with the German translation Windkessel) and
it became known as the Windkessel model. However, this model is over-simplified for a
mammalian system due to complex reflections of pressure and flow waves at branch points in
the arterial tree, such as the common iliac bifurcation, and interaction of the reflections with new
waves from the next heartbeat (Attinger, 1964; Taylor, 1964; Fung, 1993). Fine tuning of the
elasticity in the arteries affects these pressure-flow relationships and ultimately the energetic
output required of the heart. For example, the pressure in the aortic arch is lower than expected
because of the reflection of the pressure wave and so the pressure that the heart must work
against is lower. The structure of the aortic wall is therefore not uniform along its length due to
the variable pressure and flow waves to which it is exposed. This thesis used a mouse model to
further investigate the finding by Lillie and Gosline (Lillie and Gosline, 2007) that the stiffness
(elastic modulus) of the elastic component of the pig thoracic aortic wall increases distally along
the aorta.
2
Components of the Artery Wall
There are three main structural components in the artery wall of vertebrates: elastic
fibres, collagen, and smooth muscle. Elastic fibres are composed of elastin and glycoprotein
microfibrils. Elastin, microfibrils, and collagen are all proteins produced by the smooth muscle
cells. The molecules of elastin, a rubber-like protein, have a random conformation (Aaron and
Gosline, 1980) and are covalently cross-linked to each other (Aaron and Gosline, 1981). Elastin
has a low elastic modulus, or low stiffness, meaning that it is highly extensible when pulled with
a given force. In other words, a particular stress (the force acting per cross-sectional area)
produces a relatively high strain (change in length relative to the original length). In contrast,
collagen has a highly ordered, triple-helical structure and a high elastic modulus, or high
stiffness. The elastic modulus of elastin (1 MPa; Aaron and Gosline, 1981) is three orders of
magnitude lower than that of collagen (1650 MPa; Ker, 1981). Elastic fibres will hereafter be
referred to as elastin.
Because the artery wall is a composite of a very stiff and a very compliant material, the
mechanical properties will change along the arterial tree as the proportions of these two
components change. In the thoracic aorta 60% of the total protein (elastin and collagen) is
elastin, compared with 30% in the abdominal aorta (Harkness et al., 1957) and 28% in the
carotid artery (Fischer and Llaurado, 1966). Therefore the elastic modulus (stiffness) of the
arterial wall increases with increasing distance from the heart (by 1.5 times in the abdominal
aorta compared with the thoracic at 100 mm Hg; Harkness et al., 1957; Bergel, 1960; Fischer
and Llaurado, 1966). The lower elastic modulus of the thoracic aorta allows it to expand on
systole, thereby providing capacitance to the system by way of a reservoir of blood to be
delivered during diastole.
Structure of the Artery Wall
The arterial wall of mammals is composed of three layers (see Figure 1). The innermost
layer, the tunica intima, is made up of endothelial cells. The outermost layer, the tunica
3
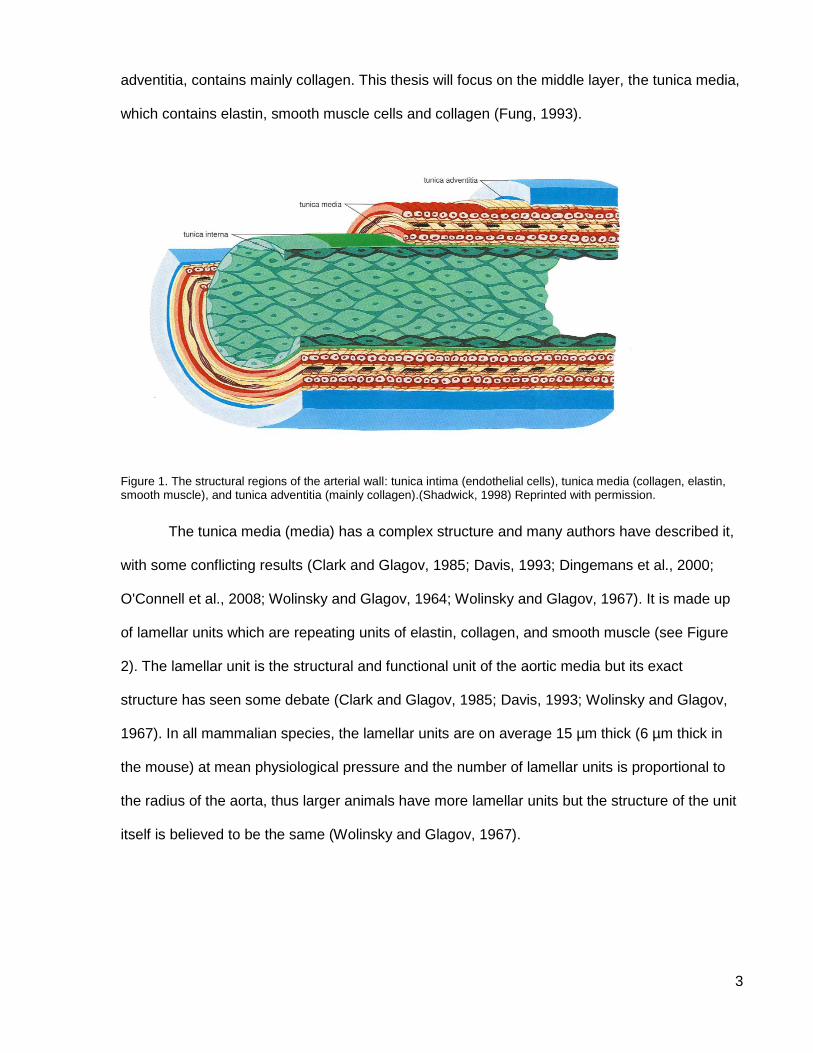
adventitia, contains mainly collagen. This thesis will focus on the middle layer, the tunica media,
which contains elastin, smooth muscle cells and collagen (Fung, 1993).
Figure 1. The structural regions of the arterial wall: tunica intima (endothelial cells), tunica media (collagen, elastin, smooth muscle), and tunica adventitia (mainly collagen).(Shadwick, 1998) Reprinted with permission.
The tunica media (media) has a complex structure and many authors have described it,
with some conflicting results (Clark and Glagov, 1985; Davis, 1993; Dingemans et al., 2000;
O'Connell et al., 2008; Wolinsky and Glagov, 1964; Wolinsky and Glagov, 1967). It is made up
of lamellar units which are repeating units of elastin, collagen, and smooth muscle (see Figure
2). The lamellar unit is the structural and functional unit of the aortic media but its exact
structure has seen some debate (Clark and Glagov, 1985; Davis, 1993; Wolinsky and Glagov,
1967). In all mammalian species, the lamellar units are on average 15 µm thick (6 µm thick in
the mouse) at mean physiological pressure and the number of lamellar units is proportional to
the radius of the aorta, thus larger animals have more lamellar units but the structure of the unit
itself is believed to be the same (Wolinsky and Glagov, 1967).
4
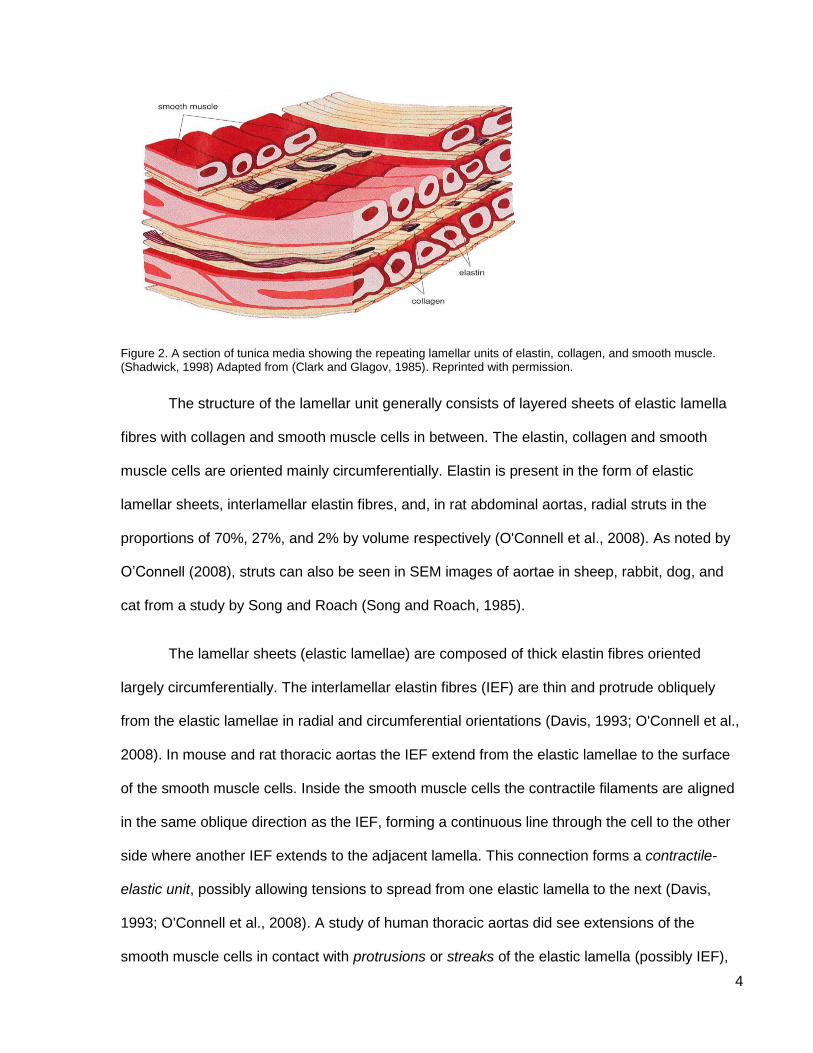
Figure 2. A section of tunica media showing the repeating lamellar units of elastin, collagen, and smooth muscle. (Shadwick, 1998) Adapted from (Clark and Glagov, 1985). Reprinted with permission.
The structure of the lamellar unit generally consists of layered sheets of elastic lamella
fibres with collagen and smooth muscle cells in between. The elastin, collagen and smooth
muscle cells are oriented mainly circumferentially. Elastin is present in the form of elastic
lamellar sheets, interlamellar elastin fibres, and, in rat abdominal aortas, radial struts in the
proportions of 70%, 27%, and 2% by volume respectively (O'Connell et al., 2008). As noted by
O’Connell (2008), struts can also be seen in SEM images of aortae in sheep, rabbit, dog, and
cat from a study by Song and Roach (Song and Roach, 1985).
The lamellar sheets (elastic lamellae) are composed of thick elastin fibres oriented
largely circumferentially. The interlamellar elastin fibres (IEF) are thin and protrude obliquely
from the elastic lamellae in radial and circumferential orientations (Davis, 1993; O'Connell et al.,
2008). In mouse and rat thoracic aortas the IEF extend from the elastic lamellae to the surface
of the smooth muscle cells. Inside the smooth muscle cells the contractile filaments are aligned
in the same oblique direction as the IEF, forming a continuous line through the cell to the other
side where another IEF extends to the adjacent lamella. This connection forms a contractile-
elastic unit, possibly allowing tensions to spread from one elastic lamella to the next (Davis,
1993; O'Connell et al., 2008). A study of human thoracic aortas did see extensions of the
smooth muscle cells in contact with protrusions or streaks of the elastic lamella (possibly IEF),
5
but most of the interlamellar elastin was described as a network of elastin that had few
connections to the elastic lamellae (Dingemans et al., 2000). The radial elastin struts are thick
and project radially from one elastic lamella to the next. The smooth muscle cells between
elastic lamellae are oriented circumferentially with a radial tilt and are surrounded on all sides by
elastin: elastic lamellae next to their luminal and adventitial surfaces, radial struts on one side
and IEF on the other. Collagen fibres are oriented circumferentially in parallel layers in close
proximity to the smooth muscle cells (O'Connell et al., 2008).
Function of the Artery Wall
The artery wall functions as a composite or two-phase material (Roach and Burton,
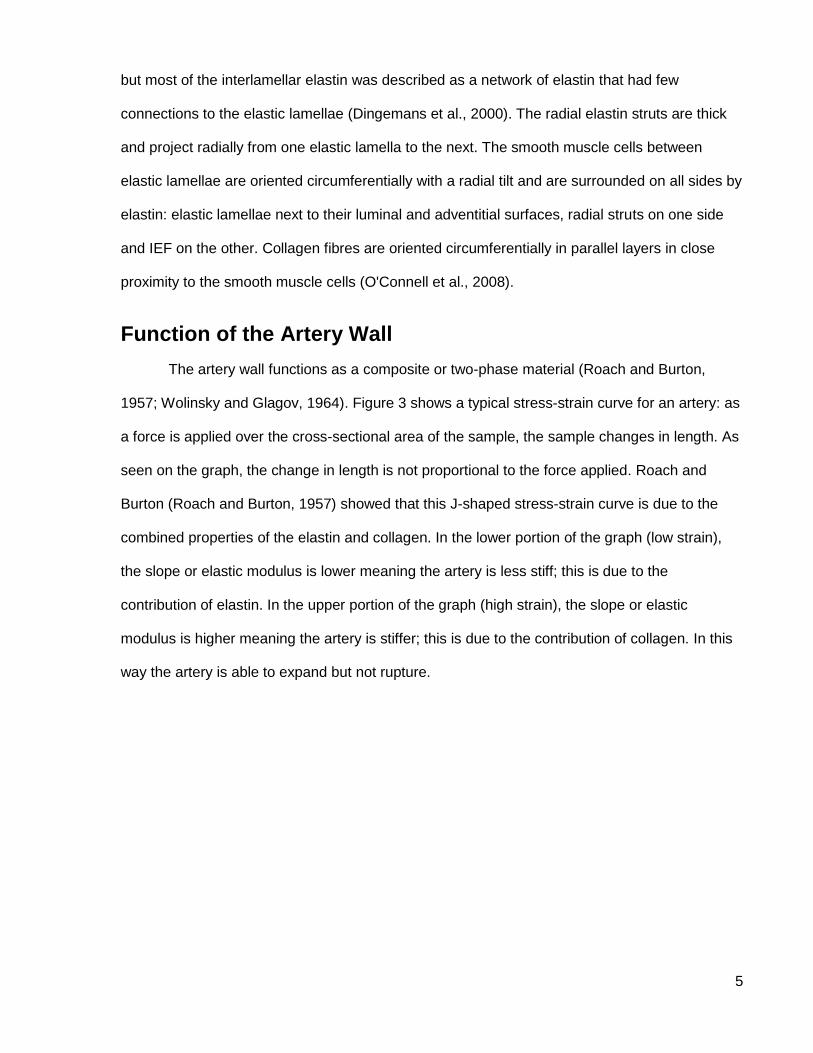
1957; Wolinsky and Glagov, 1964). Figure 3 shows a typical stress-strain curve for an artery: as
a force is applied over the cross-sectional area of the sample, the sample changes in length. As
seen on the graph, the change in length is not proportional to the force applied. Roach and
Burton (Roach and Burton, 1957) showed that this J-shaped stress-strain curve is due to the
combined properties of the elastin and collagen. In the lower portion of the graph (low strain),
the slope or elastic modulus is lower meaning the artery is less stiff; this is due to the
contribution of elastin. In the upper portion of the graph (high strain), the slope or elastic
modulus is higher meaning the artery is stiffer; this is due to the contribution of collagen. In this
way the artery is able to expand but not rupture.
6
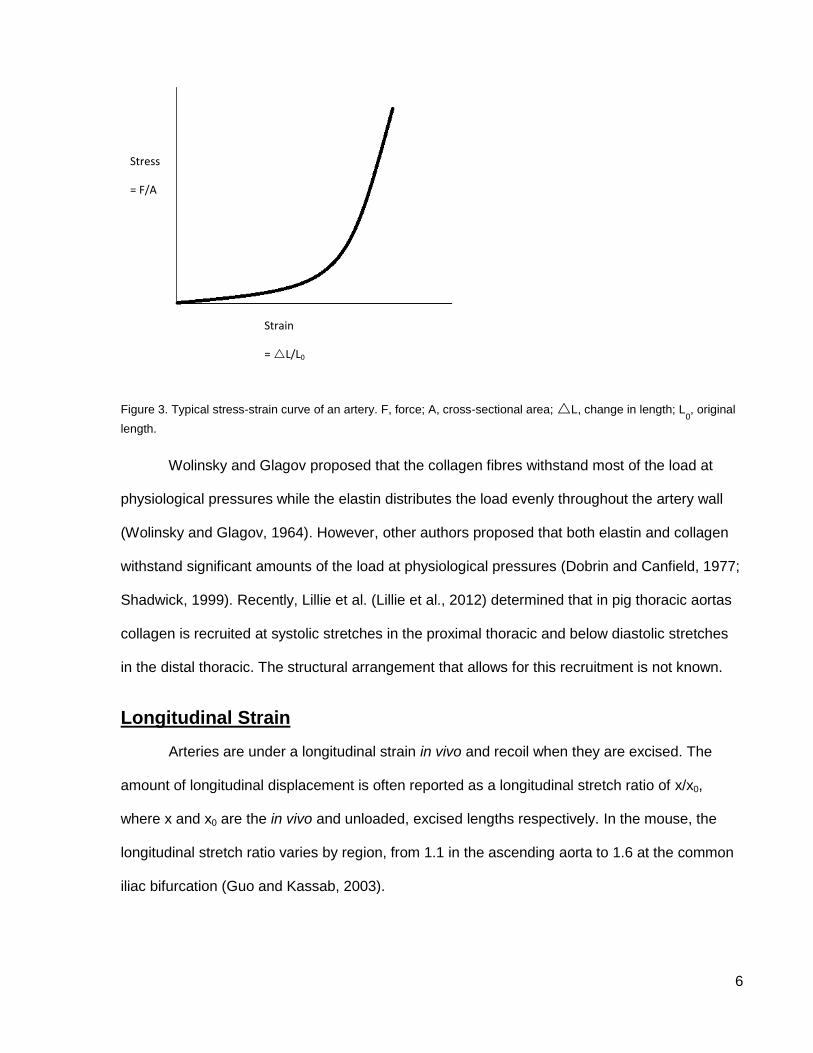
Figure 3. Typical stress-strain curve of an artery. F, force; A, cross-sectional area; L, change in length; L0, original
length.
Wolinsky and Glagov proposed that the collagen fibres withstand most of the load at
physiological pressures while the elastin distributes the load evenly throughout the artery wall
(Wolinsky and Glagov, 1964). However, other authors proposed that both elastin and collagen
withstand significant amounts of the load at physiological pressures (Dobrin and Canfield, 1977;
Shadwick, 1999). Recently, Lillie et al. (Lillie et al., 2012) determined that in pig thoracic aortas
collagen is recruited at systolic stretches in the proximal thoracic and below diastolic stretches
in the distal thoracic. The structural arrangement that allows for this recruitment is not known.
Longitudinal Strain
Arteries are under a longitudinal strain in vivo and recoil when they are excised. The
amount of longitudinal displacement is often reported as a longitudinal stretch ratio of x/x0,
where x and x0 are the in vivo and unloaded, excised lengths respectively. In the mouse, the
longitudinal stretch ratio varies by region, from 1.1 in the ascending aorta to 1.6 at the common
iliac bifurcation (Guo and Kassab, 2003).
Stress
= F/A
Strain
= L/L0
7
Purified Elastin Aortic Stiffness
Elastin and glycoprotein microfibrils are insoluble and resistant to degradation. It is
therefore possible to obtain an aorta consisting only of elastic fibres (termed purified elastin)
through degradation of the other components of the arterial wall. This degradation can be
accomplished by autoclaving the aorta at a high temperature and pressure (121 oC, 101 kPa;
Partridge et al., 1955; Lillie et al., 1994; Lillie et al., 1998; Gundiah et al., 2007), conditions
under which the collagen is denatured and solubilized but the elastin is not because it is
stabilized by permanent covalent crosslinks.
Lillie and Gosline (Lillie and Gosline, 2007) investigated the mechanical properties of
purified elastin rings from pig thoracic aorta and found, surprisingly, that the circumferential
elastic modulus increased with increasing distance from the heart (longitudinal position). The
same trend was found in bovine thoracic aorta (Zou and Zhang, 2009). The elastic modulus of
an intact (non-autoclaved) aorta also increases with increasing longitudinal position, but
presumably this is due to the relative increase in collagen proportion. In a purified elastin ring
where only elastin is present, the difference in elastic modulus may be due to the morphology of
the elastin; for example, relatively more fibres in the distal thoracic aorta oriented
circumferentially versus longitudinally than in the proximal aorta (Lillie and Gosline, 2007). This
thesis investigated the mechanistic basis for the increase in elastic modulus with longitudinal
position using the mouse as a model because of its small size (which is important when using
multiphoton laser scanning microscopy, as will be explained later). The first step in this study
was therefore to verify that the mouse was a suitable model by determining if the elastic
modulus of a purified elastin mouse aorta also changes with increasing longitudinal position.
Microscopy Technique
This thesis used multiphoton laser scanning microscopy (MPLSM) to investigate the
structure of the mouse aorta wall with the aim of explaining any changes in elastic modulus
along the purified elastin mouse aorta.
8
A multiphoton laser scanning microscope (MPLSM) uses a laser to scan a thin plane of
tissue and excite the molecules in that tissue. The laser sends out very short (150 femtosecond)
pulses of light so that two photons of light (from subsequent pulses) interact with a molecule of
the tissue and their combined energy causes an excitation. If the tissue is fluorescent or has
been linked with a fluorescent molecule, the excitation causes it to fluoresce. Since the two
photons interact on only one plane, any emitted fluorescent light must have come from the
plane of interest and is therefore in-focus light from the object of interest. MPLSM is thus carried
out in a darkened environment and all emitted light is collected and processed into a digital
image of the tissue sample (Zipfel et al., 2003).
Elastin autofluoresces so no marker is needed when using this technique. Collagen
doesn’t autofluoresce, but when two photons interact with its surface structure light is emitted at
half the excitation wavelength. This is called second harmonic generation (SHG). The light from
SHG can be collected separately. The light from both sources is then processed to create one
three-dimensional image of both elastin and collagen (Zipfel et al., 2003).
The use of MPLSM in this thesis had several advantages. (1) MPLSM does not affect
the structural integrity of the arterial wall (Megens et al., 2007). (2) MPLSM doesn’t require the
tissue to be fixed or dyed prior to imaging, thereby avoiding any potential artefacts. (3) The
mouse aortic wall is sufficiently thin that it could be imaged in its entirety with minimal scattering
or absorption of light before collection, thereby producing a clear image.
Mouse Model
The mouse is a useful model for diseased and healthy aortic function in other
mammalian taxa. The small size of the mouse aorta (four to six elastic lamellae in the media;
approximately 100 µm aortic wall thickness in no-load state) allowed the entire thickness of the
wall to be imaged using MPLSM.
9
Thesis Objectives and Hypotheses
Many questions remain about the basic structure and function of artery walls. For
example:
How are the elastic lamellar sheets, interlamellar elastin fibres, and smooth muscle cells
connected?
Are elastin and collagen linked mechanically in series or parallel?
How is load transferred from elastin to collagen and at what pressure does this take
place?
The purpose of my thesis was to add to the understanding of the basic structure and
function of arteries, which is necessary to formulate models of arterial function for
bioengineering or disease states. Lillie and Gosline (Lillie and Gosline, 2007) showed that the
elastic modulus of pig purified elastin thoracic aorta increases with longitudinal position; this
thesis investigated how the elastic modulus changes. I used the mouse as a model for this
investigation so first had to verify its suitability by determining if the elastic modulus of purified
elastin aorta increases with longitudinal position in the mouse as it does in the pig. The specific
objectives of my thesis were to:
1) Determine if the elastic modulus of elastin in the intact and purified elastin mouse aorta
changes with longitudinal position.
My prediction was that the elastin in the mouse aorta would become stiffer with
increasing distance from the heart. This was found to be true of pig thoracic
aortas and mouse and pig aortas are similar in other aspects of structure and
function.
2) Identify, using multiphoton laser scanning microscopy, differences in the structural
organization of elastin between the proximal and distal aorta that might contribute to the
10
difference in elastic modulus. There are five hypotheses for what could be changing in
the elastin 3D structure along the aorta: (1) The amount of elastin. (2) The amount of
interlamellar elastin fibres (IEF) or their orientation. (3) The partitioning of elastin
between its three forms (elastic lamellae, IEF, and struts). (4) The elastic lamellae
thickness or orientation. (5) The number of elastin struts. A sixth hypothesis, which is not
tested in this study, is that the cross-linking density of the elastin protein itself could
change along the aorta.
11
Materials and Methods
Two types of experiments were performed: Uniaxial tensile tests to study the mechanical
response of intact and purified elastin aortas and microscopy to determine the elastin 3D
morphology within an intact aorta.
Experimental Animals
For the mechanical testing, female, sexually mature Balb/c mice (n = 9, aged 105 ± 56 d,
weight 23.3 ± 1.9 g) were obtained from the University of British Columbia Animal Care Centre.
For the morphology, female, sexually mature Balb/c mice (n = 8, aged 104 ± 44 d, weight 22.0 ±
1.5 g) were obtained from Charles River and housed at the University of British Columbia
Animal Resource Unit. The animals were euthanized by an Animal Resource Unit technician
according to UBC Animal Care approved protocol and dissections were started as soon as
possible (within one hour of death).
Mechanical Testing
Experimental Protocols
Transverse rings were cut from mouse thoracic and abdominal aortas and stretched
uniaxially in the circumferential orientation to determine their elastic modulus. The rings were
then autoclaved to remove the collagen and smooth muscle cells, and retested.
Ring Preparation
The aorta was carefully excised from the aortic arch to the common iliac bifurcation.
Loosely adhering tissue was carefully removed with fine forceps. Rings approximately 1 mm
wide were cut from the aorta with a fresh razor blade at six locations (see Figure 4), three in the
thoracic aorta: distal to the 1st intercostal artery (1int), 6th intercostal artery (6int), and 9th
intercostal artery (9int), and three in the abdominal aorta: proximal to the celiac artery (acel),
ilio-lumbar artery (lumb), and common iliac bifurcation (ilia).
12
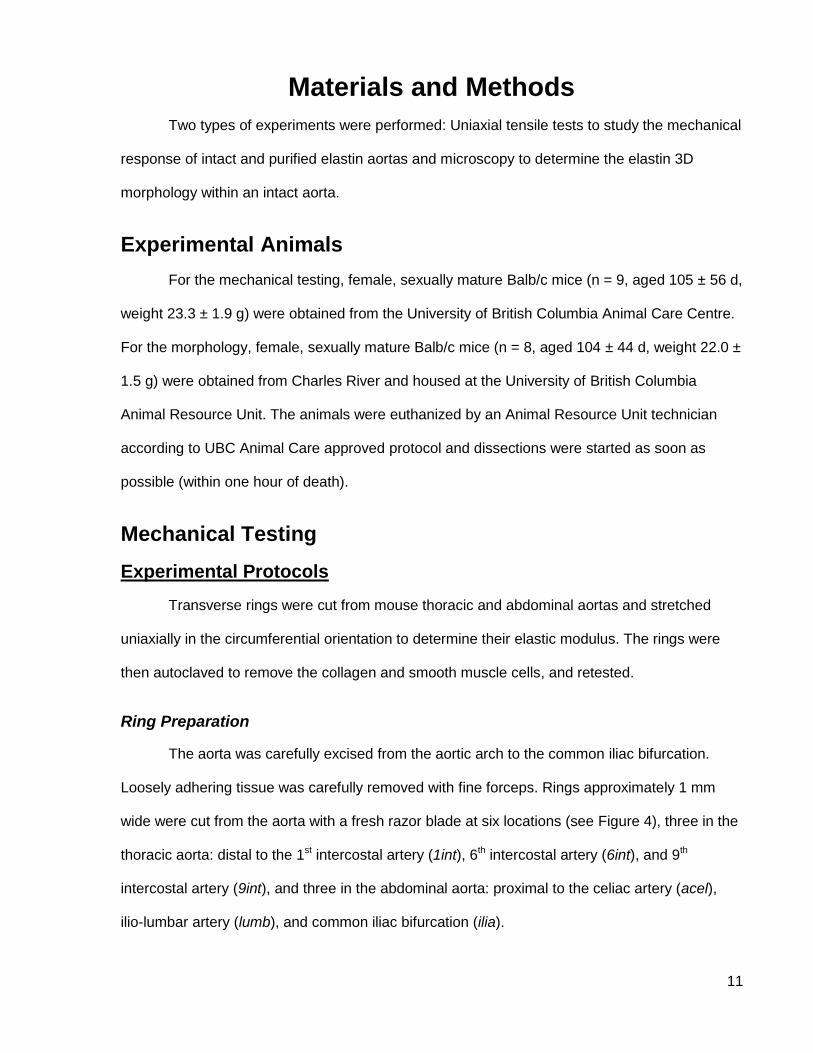
Figure 4. Image of a mouse aorta from the aortic arch (top right) to the common iliac bifurcation (bottom middle). A black line indicates the location of the diaphragm. Red arrows indicate where six rings were cut from the aorta. Three rings were from the thoracic aorta: 1int, 6int, and 9int (distal to the first, sixth, and ninth intercostal artery respectively) and three from the abdominal aorta: acel, lumb, and ilia (proximal to the celiac artery, ilio-lumbar artery, and common iliac bifurcation respectively). The curvature is natural.
Photos of the rings in phosphate buffered saline (PBS) solution were taken using a
Nikon SMZ800 dissecting microscope and QImaging MicroPublisher 3.3 RTV camera (2048 x
1536 pixel resolution) with QCapture 2.70.0 software to determine wall thickness, width and
initial length. The PBS solution had the following composition (in mM): 136.9 NaCl, 2.7 KCl, 6.1
Na2HPO4, and 1.0 KH2PO4.
Prior to testing, the intact rings were soaked in PBS and ethyleneglycol tetraacetic acid
(EGTA) solution for 10 minutes to inactivate the smooth muscle cells in the vessel wall (Cox,
1983). The PBS and EGTA solution had the following composition (in mM): 136.9 NaCl, 2.7
KCl, 7.5 Na2HPO4, 1.0 KH2PO4, and 2.0 EGTA.
The smooth muscle cells are destroyed during autoclaving so this step was not
necessary for purified elastin rings.
6int 9int
acel
lumb
ilia 2 mm
diaphragm
1int
13
Mechanical Testing Setup
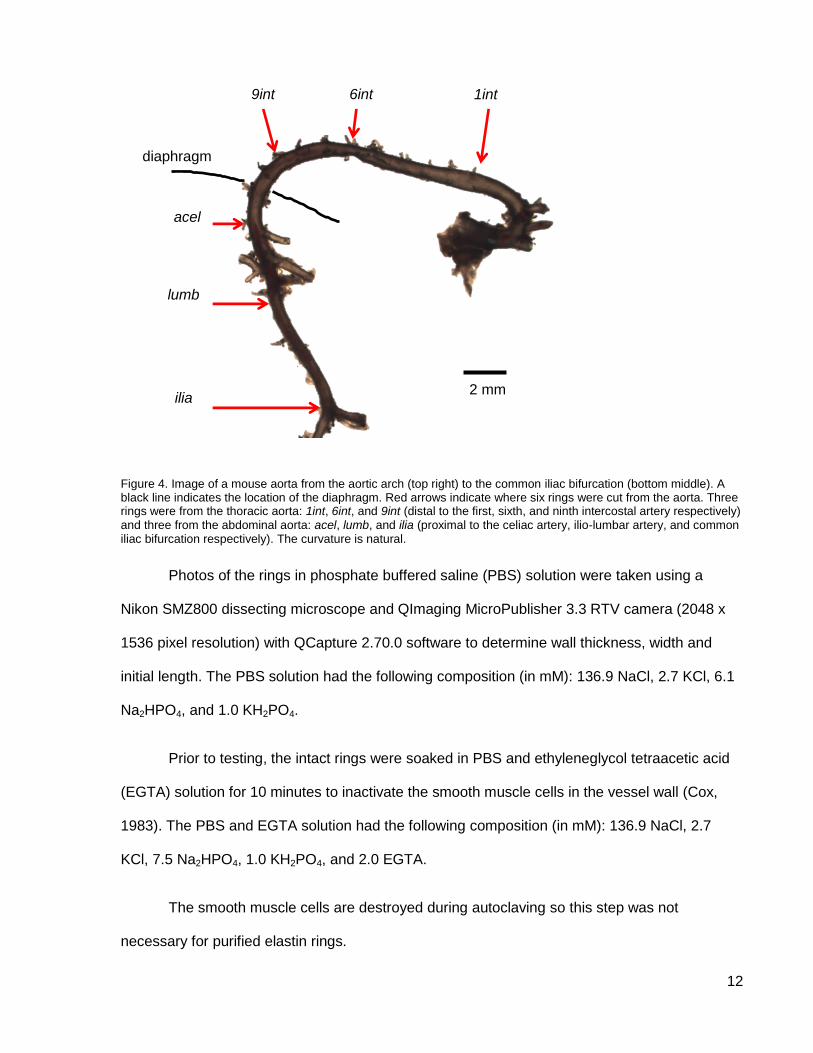
Individual rings were mounted on one of two sets of hooks depending on their size.
Because of the large difference in diameter between the thoracic and abdominal rings, the
same size of hook could not be used for all rings (the larger hooks would not fit in the smaller
rings and the smaller hooks cut into the larger rings during testing). 1int, 6int, 9int and acel rings
were mounted on hooks made from 30-gauge syringe needles with an outer diameter of 0.35
mm. Ilia and lumb rings were mounted on hooks made from acupuncture needles with an outer
diameter of 0.12 mm. The ring sample was placed over the two hooks, as close as possible to
the vertical portion of the hook without interfering with it (see Figure 5). The compliance of the
hooks was measured and accounted for in the data analysis.
Testing was done at room temperature (21 ºC) in a PBS and EGTA bath for intact rings
or a PBS bath for purified elastin rings. The upper hook was attached to a 0.1 N load cell and
hydraulic actuator.
Figure 5. Uniaxial tensile testing setup with the MTS 858 Mini Bionix.(a) Setup showing hooks in PBS bath and 0.1 N load cell. Staedtler permanent marker is shown for scale. (b) Close-up view showing both hooks through an abdominal aorta ring.
b a
2 mm
14
Mechanical Testing
Uniaxial tensile testing was performed using an MTS 858 Mini Bionix (see Figure 5) and
data were recorded with Teststar IIs Station Manager Version 3.5C 1817 software. Testing was
performed under displacement control at 1 Hz in a sinusoidal cycle that was set for a maximum
displacement. The tissues were pre-conditioned until a consistent mechanical response was
obtained. The testing routines were identical for all rings.
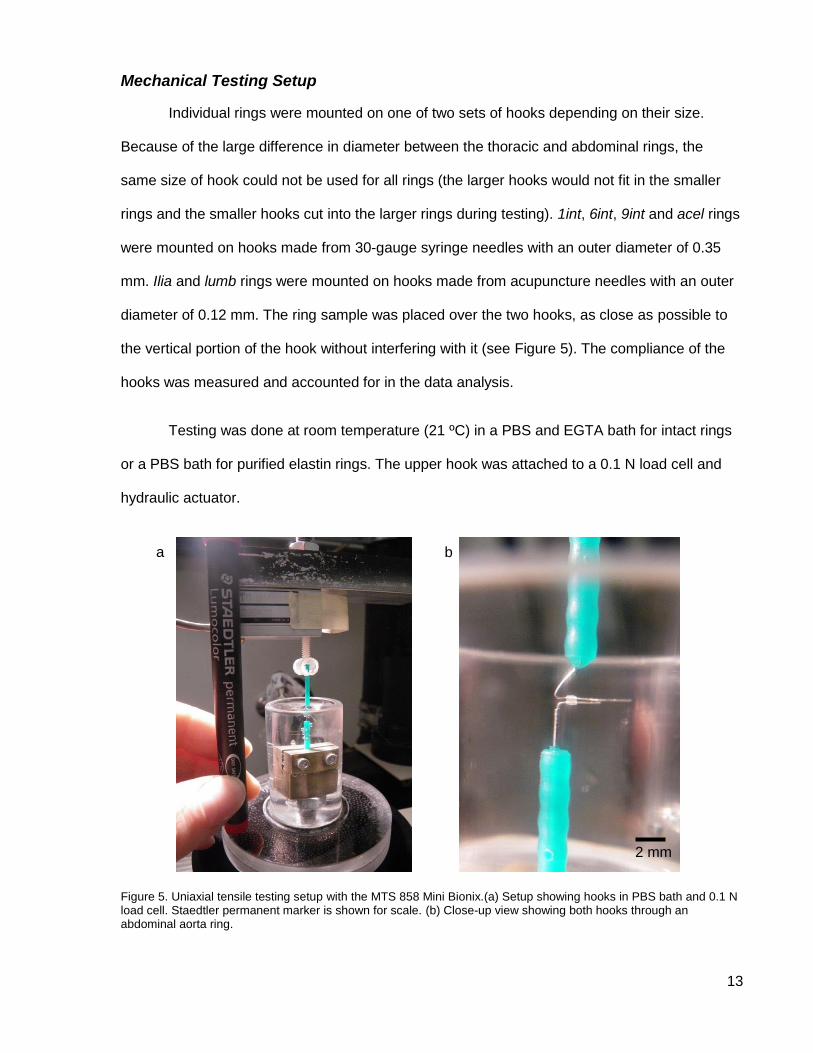
For intact rings (see Table 1), the maximum displacement was set so each ring would be
stretched to similar stretch ratio (approximately 1.5). Displacements were 0.8 mm for 1int, 6int
and 9int rings (thoracic), 0.6 mm for acel rings (abdominal), and 0.4 mm for lumb and ilia rings
(abdominal). The intact rings were pre-conditioned for 20 cycles. Following pre-conditioning, the
initial displacement (distance between hooks) was re-set to take up any slack in the ring, and
then the ring was tested for 20 cycles.
Ring Location
Ring State
Pre-conditioning 1 Pre-conditioning 2 Testing
Maximum displacement
(mm)
# cycles
Maximum displacement
(mm)
# cycles
Maximum displacement
(mm)
# cycles
1int, 6int, 9int
intact 0.8 20 N/A N/A 0.8 20
acel intact 0.6 20 N/A N/A 0.6 20
lumb, ilia
intact 0.4 20 N/A N/A 0.4 20
1int, 6int, 9int, acel
purified elastin
0.4 5 0.2 5 0.4 20
lumb, ilia
purified elastin
0.4 5 N/A N/A 0.4 20
Table 1. Maximum displacement and number of sinusoidal cycles used during tensile testing for pre-conditioning and testing of mouse aorta rings.
15
The purified elastin rings broke easily during testing so a smaller maximum
displacement and second pre-conditioning were used (see Table 1). For 1int, 6int, 9int and acel
rings, the maximum displacement was set to 0.4 mm for five pre-conditioning cycles. The initial
displacement distance was then re-set and the maximum displacement was set to 0.2 mm for
an additional five pre-conditioning cycles. This procedure was determined through trial and error
to result in few broken rings. For the testing cycles, the initial displacement distance was again
re-set and the maximum displacement was set to 0.4 mm for 20 cycles. For lumb and ilia rings,
the maximum displacement was set to 0.4 mm throughout. The rings were pre-conditioned for 5
cycles, the initial displacement distance was re-set and the rings were tested for 20 cycles.
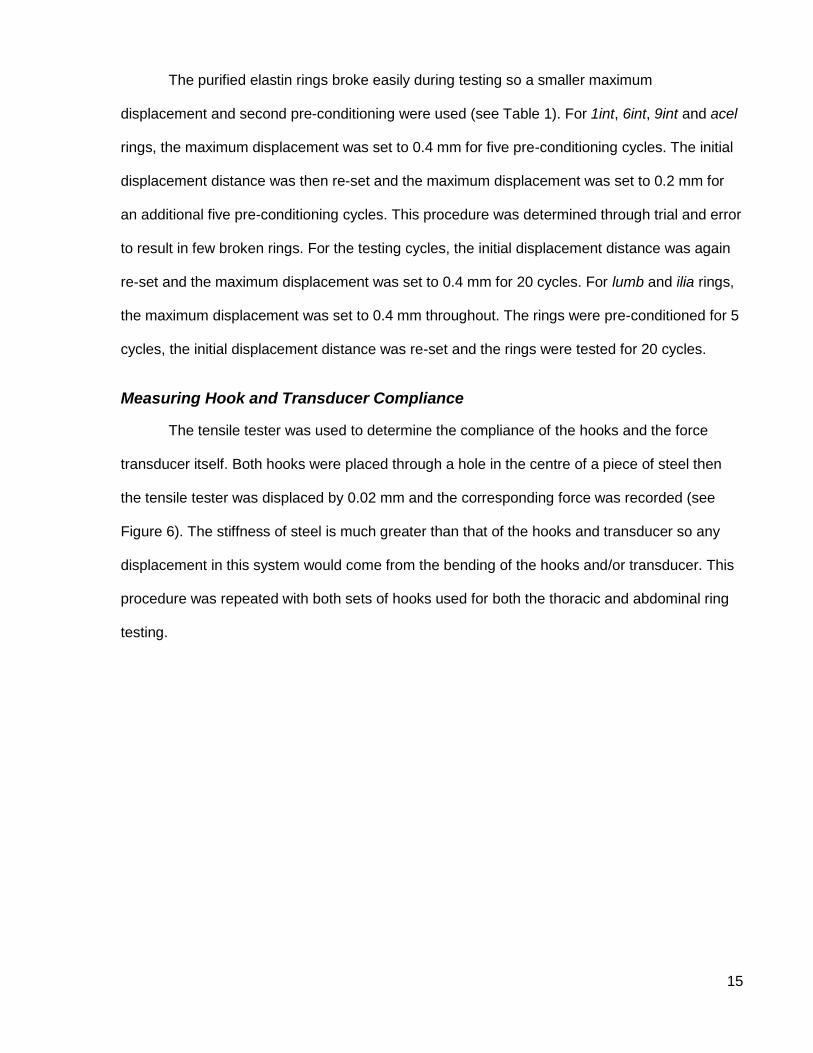
Measuring Hook and Transducer Compliance
The tensile tester was used to determine the compliance of the hooks and the force
transducer itself. Both hooks were placed through a hole in the centre of a piece of steel then
the tensile tester was displaced by 0.02 mm and the corresponding force was recorded (see
Figure 6). The stiffness of steel is much greater than that of the hooks and transducer so any
displacement in this system would come from the bending of the hooks and/or transducer. This
procedure was repeated with both sets of hooks used for both the thoracic and abdominal ring
testing.
16
Figure 6. Setup used to test the compliance of the hooks and force transducer. The hooks were put through a hole in a piece of steel then the tensile tester was displaced 0.02 mm.
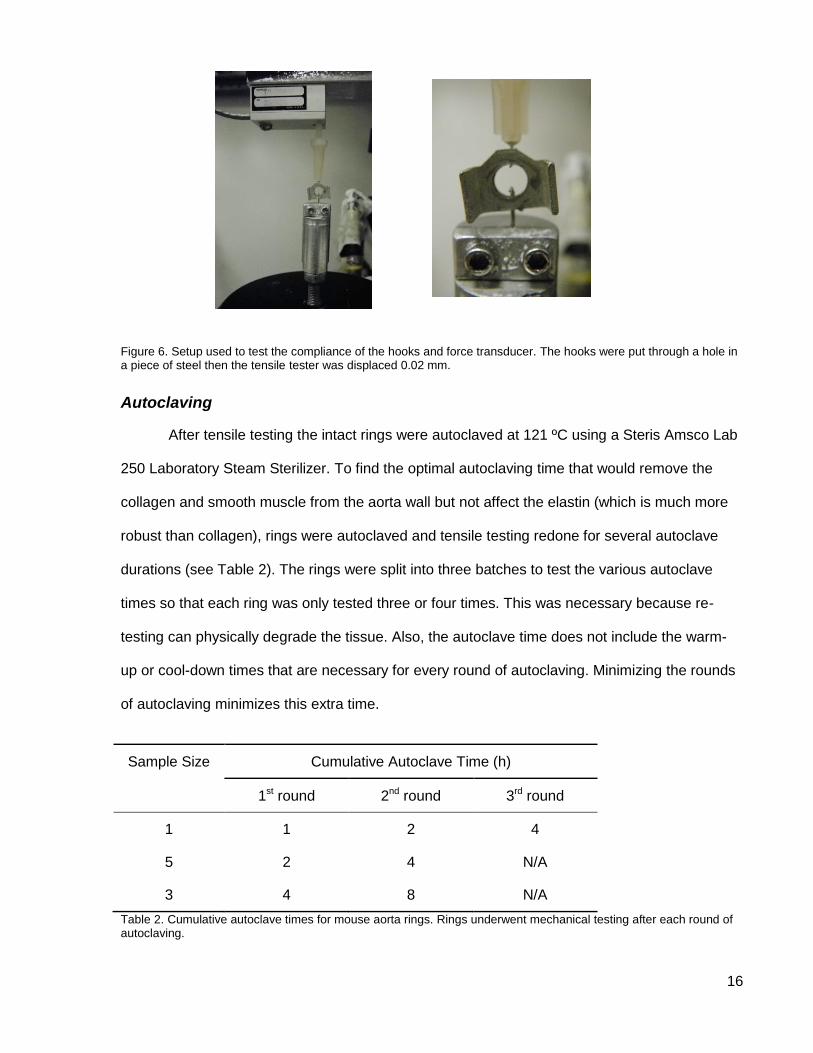
Autoclaving
After tensile testing the intact rings were autoclaved at 121 ºC using a Steris Amsco Lab
250 Laboratory Steam Sterilizer. To find the optimal autoclaving time that would remove the
collagen and smooth muscle from the aorta wall but not affect the elastin (which is much more
robust than collagen), rings were autoclaved and tensile testing redone for several autoclave
durations (see Table 2). The rings were split into three batches to test the various autoclave
times so that each ring was only tested three or four times. This was necessary because re-
testing can physically degrade the tissue. Also, the autoclave time does not include the warm-
up or cool-down times that are necessary for every round of autoclaving. Minimizing the rounds
of autoclaving minimizes this extra time.
Sample Size Cumulative Autoclave Time (h)
1st round 2nd round 3rd round
1 1 2 4
5 2 4 N/A
3 4 8 N/A
Table 2. Cumulative autoclave times for mouse aorta rings. Rings underwent mechanical testing after each round of autoclaving.
17
Data Analysis
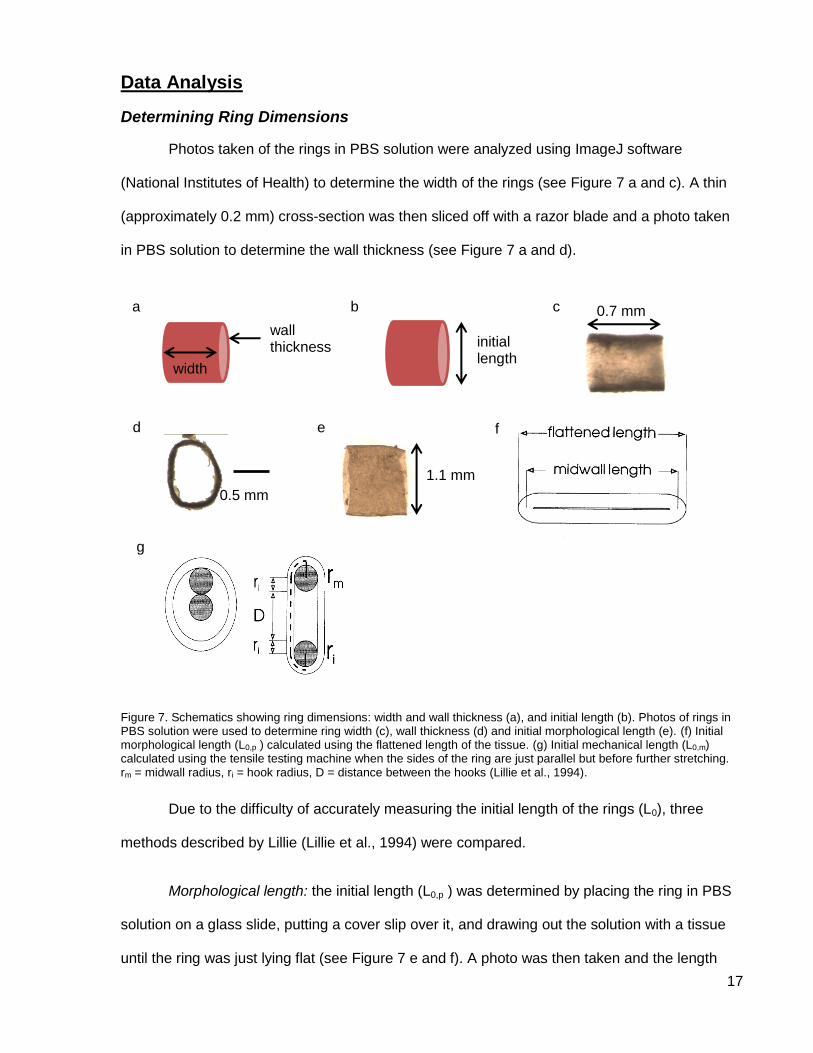
Determining Ring Dimensions
Photos taken of the rings in PBS solution were analyzed using ImageJ software
(National Institutes of Health) to determine the width of the rings (see Figure 7 a and c). A thin
(approximately 0.2 mm) cross-section was then sliced off with a razor blade and a photo taken
in PBS solution to determine the wall thickness (see Figure 7 a and d).
Figure 7. Schematics showing ring dimensions: width and wall thickness (a), and initial length (b). Photos of rings in PBS solution were used to determine ring width (c), wall thickness (d) and initial morphological length (e). (f) Initial morphological length (L0,p ) calculated using the flattened length of the tissue. (g) Initial mechanical length (L0,m) calculated using the tensile testing machine when the sides of the ring are just parallel but before further stretching. rm = midwall radius, ri = hook radius, D = distance between the hooks (Lillie et al., 1994).
Due to the difficulty of accurately measuring the initial length of the rings (L0), three
methods described by Lillie (Lillie et al., 1994) were compared.
Morphological length: the initial length (L0,p ) was determined by placing the ring in PBS
solution on a glass slide, putting a cover slip over it, and drawing out the solution with a tissue
until the ring was just lying flat (see Figure 7 e and f). A photo was then taken and the length
0.7 mm
width
wall thickness
a b c
d
initial length
e
1.1 mm
f
0.5 mm
g
18
measured using ImageJ software. The wall thickness was used to calculate the midwall length
(see Figure 7 f).
Mechanical length: the initial length was calculated using the length at which the sides of
the ring became parallel when mounted on the tensile testing machine (see Figure 7 g), as
determined by sight (with a magnifying glass) prior to testing. This represents the length at
which the ring has been deformed from a cylindrical orientation but before any further
stretching. The initial mechanical length (L0,m) is calculated as
(1)
where rm is the midwall radius, ri is the hook radius and D is the distance between the hooks
(Lillie et al., 1994).
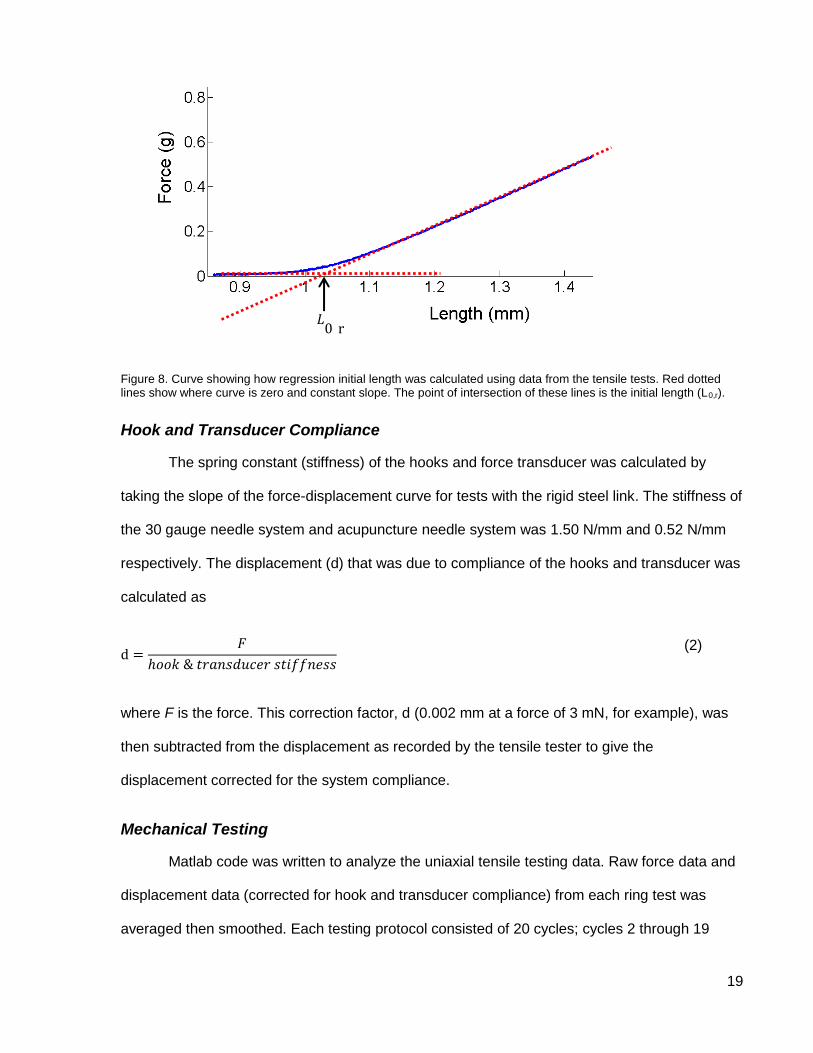
Regression length: the initial length (L0,r ) was determined by plotting the force exerted
against the length of the ring during tensile testing (see Figure 8). The length was calculated as
in Equation 1 except displacement of the tensile tester was used in place of D. A line was drawn
through the initial part of the curve where there is no increase in force and another line drawn
through the curve where it has a constant slope. The point of intersection of these two lines was
taken to be the length at which the force is zero, in other words, the initial length. Note that the
force is greater than zero at the initial length because of the force required to deform the ring
from a cylindrical shape.
19
Figure 8. Curve showing how regression initial length was calculated using data from the tensile tests. Red dotted lines show where curve is zero and constant slope. The point of intersection of these lines is the initial length (L0,r).
Hook and Transducer Compliance
The spring constant (stiffness) of the hooks and force transducer was calculated by
taking the slope of the force-displacement curve for tests with the rigid steel link. The stiffness of
the 30 gauge needle system and acupuncture needle system was 1.50 N/mm and 0.52 N/mm
respectively. The displacement (d) that was due to compliance of the hooks and transducer was
calculated as
(2)
where F is the force. This correction factor, d (0.002 mm at a force of 3 mN, for example), was
then subtracted from the displacement as recorded by the tensile tester to give the
displacement corrected for the system compliance.
Mechanical Testing
Matlab code was written to analyze the uniaxial tensile testing data. Raw force data and
displacement data (corrected for hook and transducer compliance) from each ring test was
averaged then smoothed. Each testing protocol consisted of 20 cycles; cycles 2 through 19
𝐿0 r
20
were averaged; the first and last cycles were discarded. A 5-point running average was then
used to smooth the data.
Two methods were used to calculate stress. Engineering stress (e) was calculated as
(3)
where F is the force on the ring, A is the cross-sectional area of that ring after autoclaving
(purified elastin ring), w is the undeformed width and h is the undeformed wall thickness. The
purified elastin cross-sectional area was used to normalize the forces of both the intact and
purified elastin rings. Since the adventitia had been removed during autoclaving, this area is
that of only the media. The cross-sectional area used in Equation 3 includes not only the elastin
that is resisting the stretch but also the spaces between elastic lamellae. To account for this and
exclude the spaces, lamellar stress (l) was calculated as
(4)
MPLSM was used to determine the number and average thickness of elastic lamellae at
the 6int and ilia ring locations (see MPLSM Images pg. 25). These values were used to
normalize the respective rings.
Stretch ratio () was calculated as the length of the loaded ring divided by the initial
length (L0) of that ring after autoclaving. The purified elastin initial length was used for both the
intact and purified elastin rings.
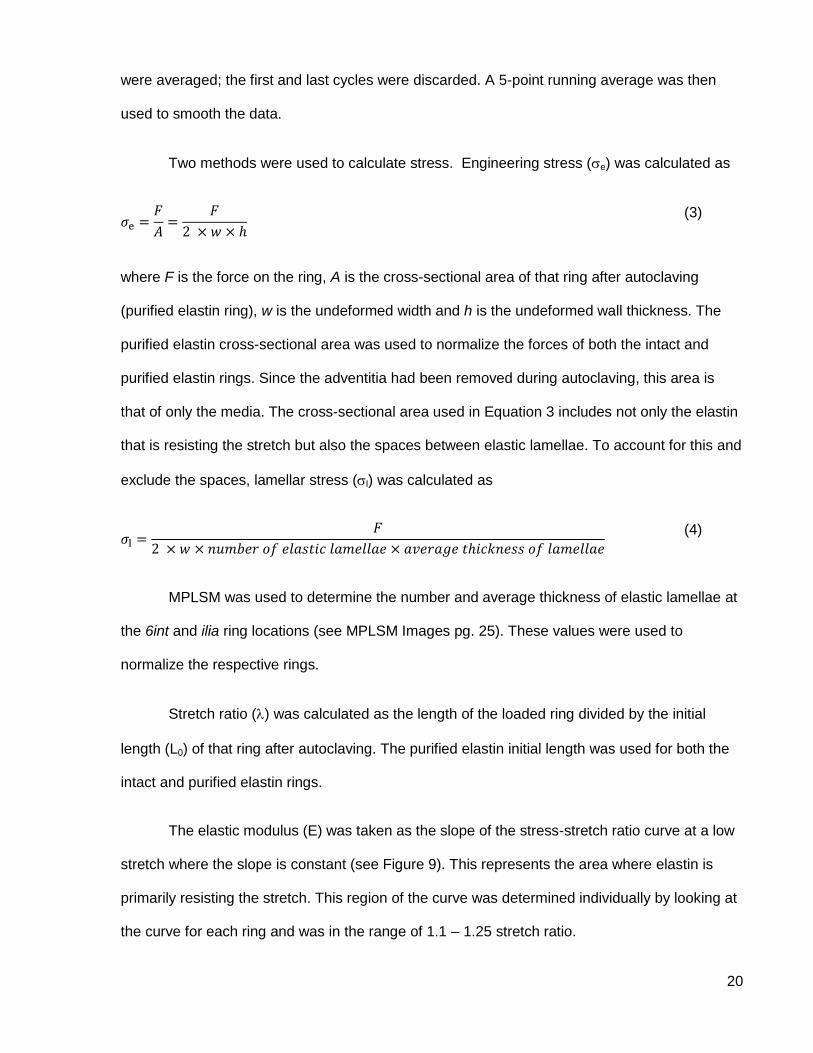
The elastic modulus (E) was taken as the slope of the stress-stretch ratio curve at a low
stretch where the slope is constant (see Figure 9). This represents the area where elastin is
primarily resisting the stretch. This region of the curve was determined individually by looking at
the curve for each ring and was in the range of 1.1 – 1.25 stretch ratio.
21
Figure 9. Stress-stretch ratio curves showing range for modulus calculation for an intact (red) and purified elastin (blue) abdominal ring (ilia position). The slopes of the curves between the two black dotted lines are the elastic moduli.
Statistical Analysis
Data are reported as means ± 95% confidence intervals.
A two-way ANOVA followed by a multiple comparison test (using Matlab software) was
used for the statistical analysis of the elastic moduli at the six positions along the aorta. Data
were missing for some positions due to broken rings, so two mice were excluded from the
statistical analysis (having two broken rings each). One mouse had one broken ring so the
mean modulus at that position was used to replace that missing value. As such, a sample size
of seven was used for the analysis. Statistical significance was assumed at P˂0.05.
Multiple linear regression (using Matlab software) was used to determine whether age or
weight of the mouse had an effect on elastic modulus. If the 95% confidence interval of the
slope of the regression included zero there was no effect.
22
Morphology
Experimental Protocol – Histology
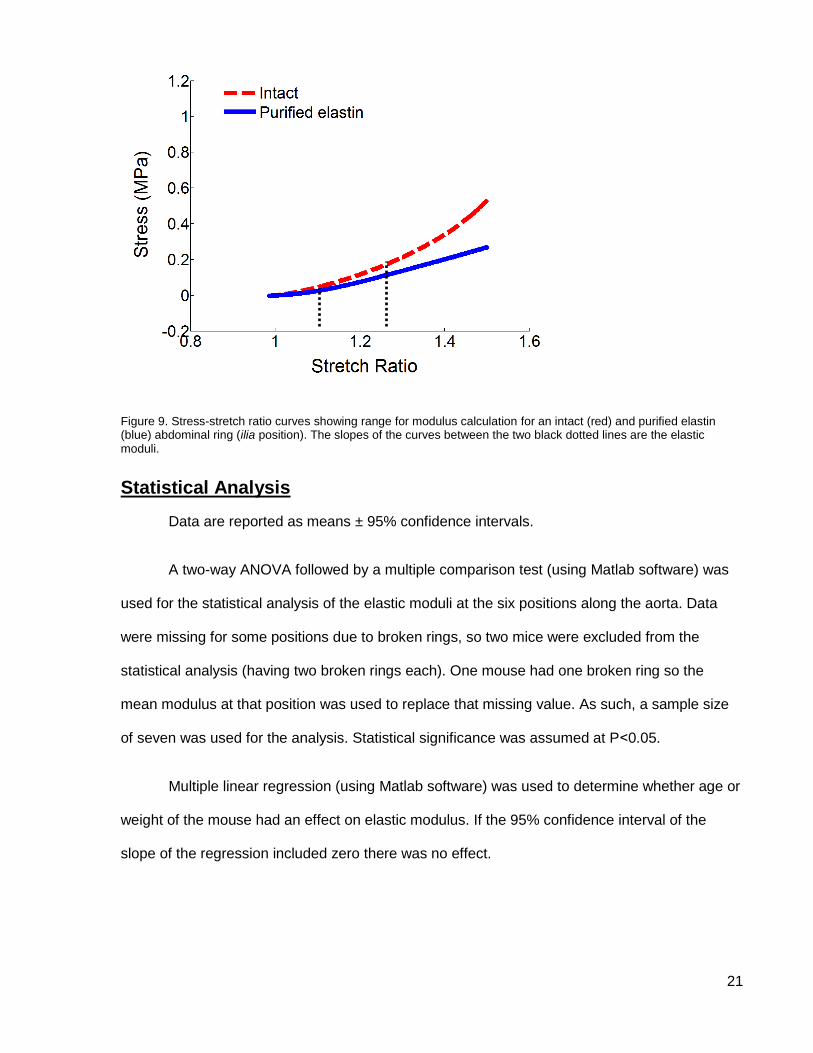
Histological tissues samples were obtained for one female Balb/c mouse (aged 186 d;
from Charles River). Immediately after death the aorta was infused in situ with a fixative solution
(1.5% glutaraldehyde and 1.5% formaldehyde) at approximately physiological pressure. The
aorta was then excised and tissue sections (5 µm thick) prepared using Van Gieson’s stain.
Experimental Protocols – Multiphoton Laser Scanning Microscopy
The aortas of euthanized mice were filled with agarose gel under pressure to maintain
physiological stretch, then excised. The thoracic and abdominal aortas were then imaged using
MPLSM.
Sample Preparation
The aorta of the euthanized mouse was exposed in the body cavity and the vena cava
was severed. A needle was inserted into the left ventricle and warm (approximately 37 ºC) PBS
solution was infused through the aorta to clear it of blood. Warm agarose (1.5% in PBS solution,
gel temperature 36 – 42 ºC, gel strength >1000 g/cm2) was then injected into the aorta via the
left ventricle. The agarose gels upon cooling, thereby maintaining the physiological stretch in
the aorta. The aim was to keep the aorta filled to a pressure of 10 – 16 kPa (75 – 120 mmHg). A
pressure transducer was used to monitor the aortic pressure while the agarose was being
injected, but once the agarose solidified the pressure could not be confirmed. The aorta was
ligated at the aortic arch, the subclavian arteries, the left renal artery, and distal to the common
iliac bifurcation. The aorta was then excised and photos were taken in PBS solution (see Figure
10 a and b, and Stretch Ratios below). Adventitial collagen was then carefully removed by
dissection from a section of the abdominal aorta. This step was necessary to allow the laser of
the MPLSM to penetrate through the thick adventitia in order to image the elastin below. The
thoracic and abdominal aortas were mounted separately, ventral side up, in a chamber filled
with PBS solution.
23
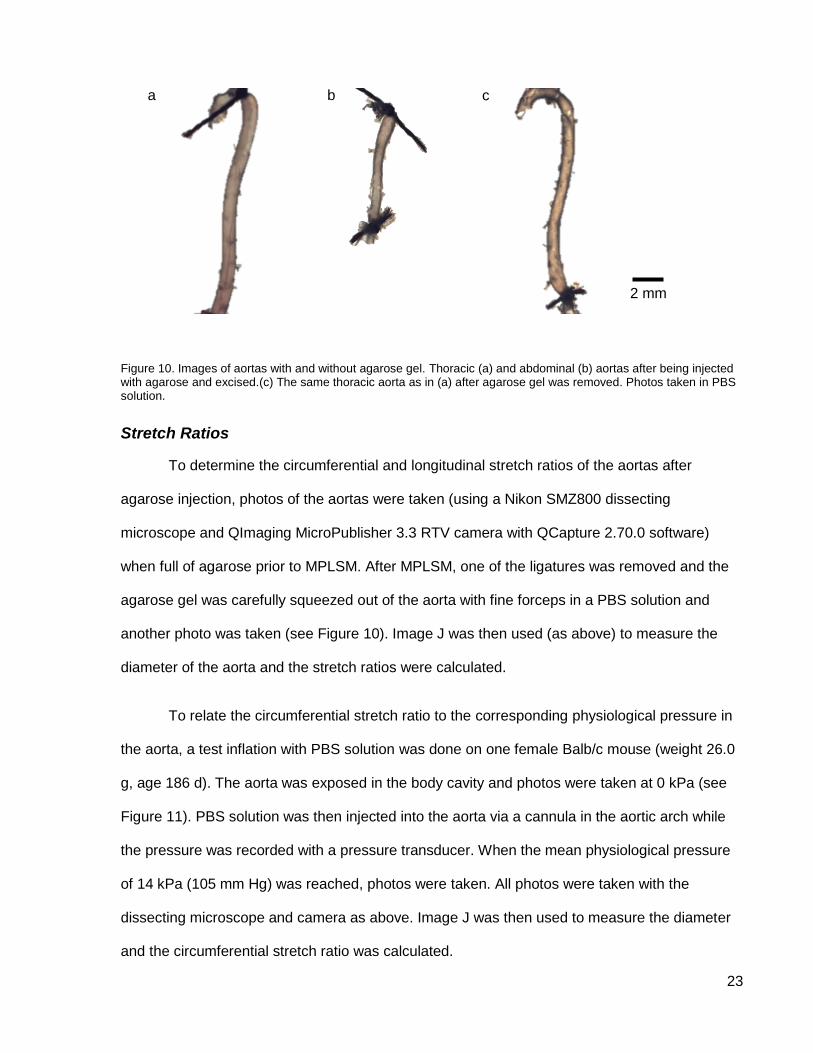
Figure 10. Images of aortas with and without agarose gel. Thoracic (a) and abdominal (b) aortas after being injected with agarose and excised.(c) The same thoracic aorta as in (a) after agarose gel was removed. Photos taken in PBS solution.
Stretch Ratios
To determine the circumferential and longitudinal stretch ratios of the aortas after
agarose injection, photos of the aortas were taken (using a Nikon SMZ800 dissecting
microscope and QImaging MicroPublisher 3.3 RTV camera with QCapture 2.70.0 software)
when full of agarose prior to MPLSM. After MPLSM, one of the ligatures was removed and the
agarose gel was carefully squeezed out of the aorta with fine forceps in a PBS solution and
another photo was taken (see Figure 10). Image J was then used (as above) to measure the
diameter of the aorta and the stretch ratios were calculated.
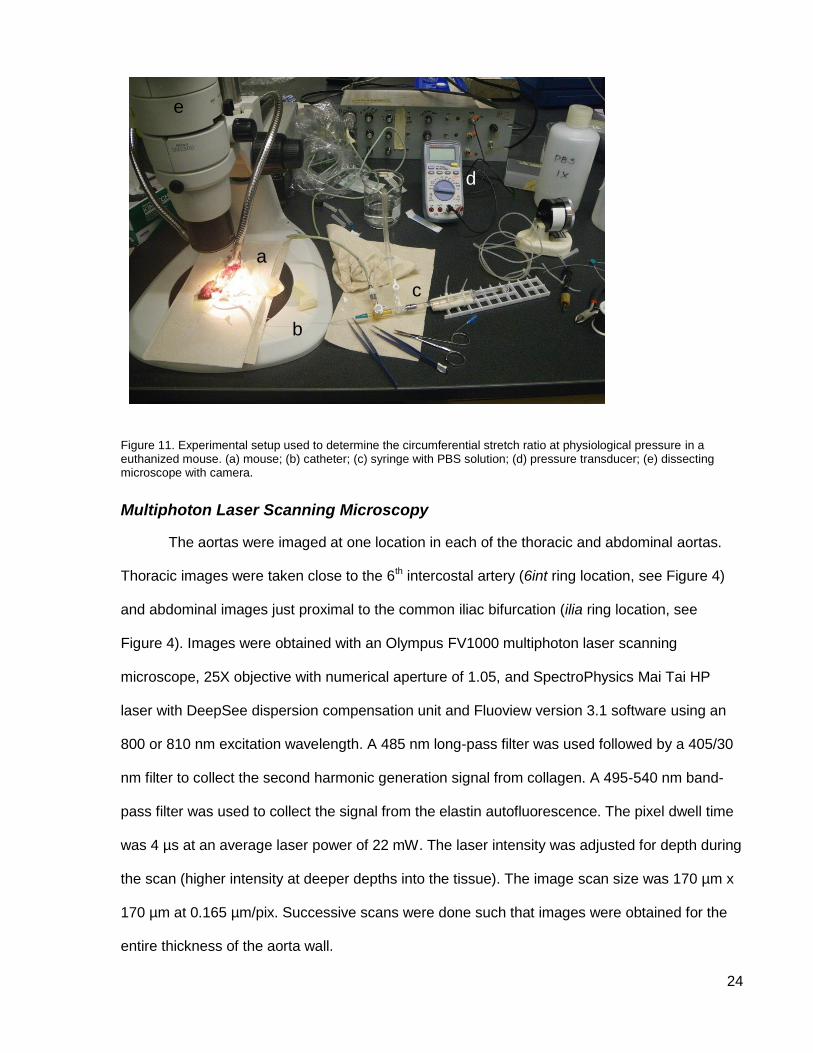
To relate the circumferential stretch ratio to the corresponding physiological pressure in
the aorta, a test inflation with PBS solution was done on one female Balb/c mouse (weight 26.0
g, age 186 d). The aorta was exposed in the body cavity and photos were taken at 0 kPa (see
Figure 11). PBS solution was then injected into the aorta via a cannula in the aortic arch while
the pressure was recorded with a pressure transducer. When the mean physiological pressure
of 14 kPa (105 mm Hg) was reached, photos were taken. All photos were taken with the
dissecting microscope and camera as above. Image J was then used to measure the diameter
and the circumferential stretch ratio was calculated.
a b
2 mm
c
24
Figure 11. Experimental setup used to determine the circumferential stretch ratio at physiological pressure in a euthanized mouse. (a) mouse; (b) catheter; (c) syringe with PBS solution; (d) pressure transducer; (e) dissecting microscope with camera.
Multiphoton Laser Scanning Microscopy
The aortas were imaged at one location in each of the thoracic and abdominal aortas.
Thoracic images were taken close to the 6th intercostal artery (6int ring location, see Figure 4)
and abdominal images just proximal to the common iliac bifurcation (ilia ring location, see
Figure 4). Images were obtained with an Olympus FV1000 multiphoton laser scanning
microscope, 25X objective with numerical aperture of 1.05, and SpectroPhysics Mai Tai HP
laser with DeepSee dispersion compensation unit and Fluoview version 3.1 software using an
800 or 810 nm excitation wavelength. A 485 nm long-pass filter was used followed by a 405/30
nm filter to collect the second harmonic generation signal from collagen. A 495-540 nm band-
pass filter was used to collect the signal from the elastin autofluorescence. The pixel dwell time
was 4 µs at an average laser power of 22 mW. The laser intensity was adjusted for depth during
the scan (higher intensity at deeper depths into the tissue). The image scan size was 170 µm x
170 µm at 0.165 µm/pix. Successive scans were done such that images were obtained for the
entire thickness of the aorta wall.
a
e
b
c
d
25
Data Analysis
Histology
A Zeiss Axio Scope.A1 microscope with AxioCam MRc camera (1388 x 1040 pixel
resolution) and ZEN imaging software (from Zeiss) were used to analyze the histology slides.
The media thickness, lamellar unit thickness, and number of elastic lamellae were measured
using the ZEN software.
MPLSM Images
Stacks of MPLSM images taken through the thickness of the aorta wall were processed
into 3D models and analyzed using Amira Resolve RT software (FEI Company).
The media thickness, lamellar unit thickness, number of elastic lamellae, and elastic
lamella thickness were measured at three places on each cross-sectioned surface of each
scan, for a total of six locations per scan, and an average value calculated. The thickness of the
media, lamellar unit, and elastic lamella varies with circumferential and longitudinal stretch ratio
when the tissue is deformed under pressure. A correction factor was used to convert the
dimensions from the deformed state (which were different for the thoracic and abdominal
aortas) to the undeformed state of each aorta. Assuming the aorta wall deforms at a constant
volume, such that
(5)
where λθ is the circumferential, λz is the longitudinal, and λh is the radial stretch ratio
respectively. The radial stretch ratio is
(6)
where h is the thickness in the deformed state and H is the thickness in the undeformed state.
Combining Equations 5 and 6, the undeformed thickness was calculated as
26
(7)
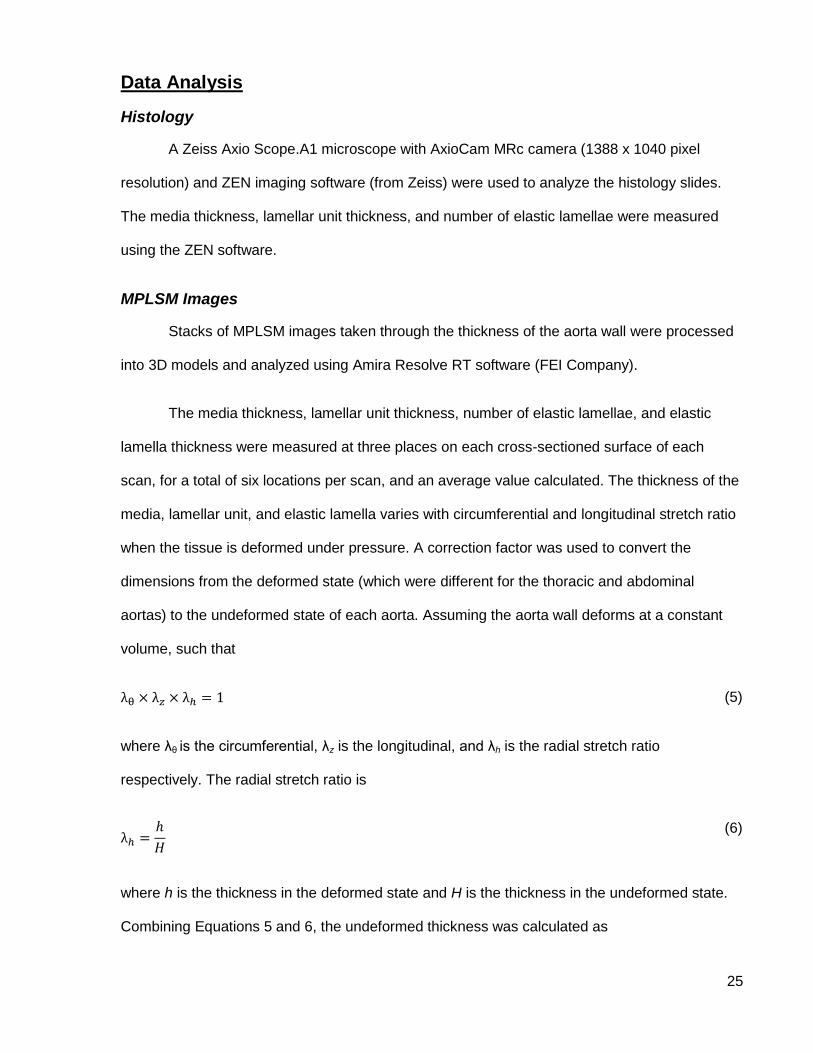
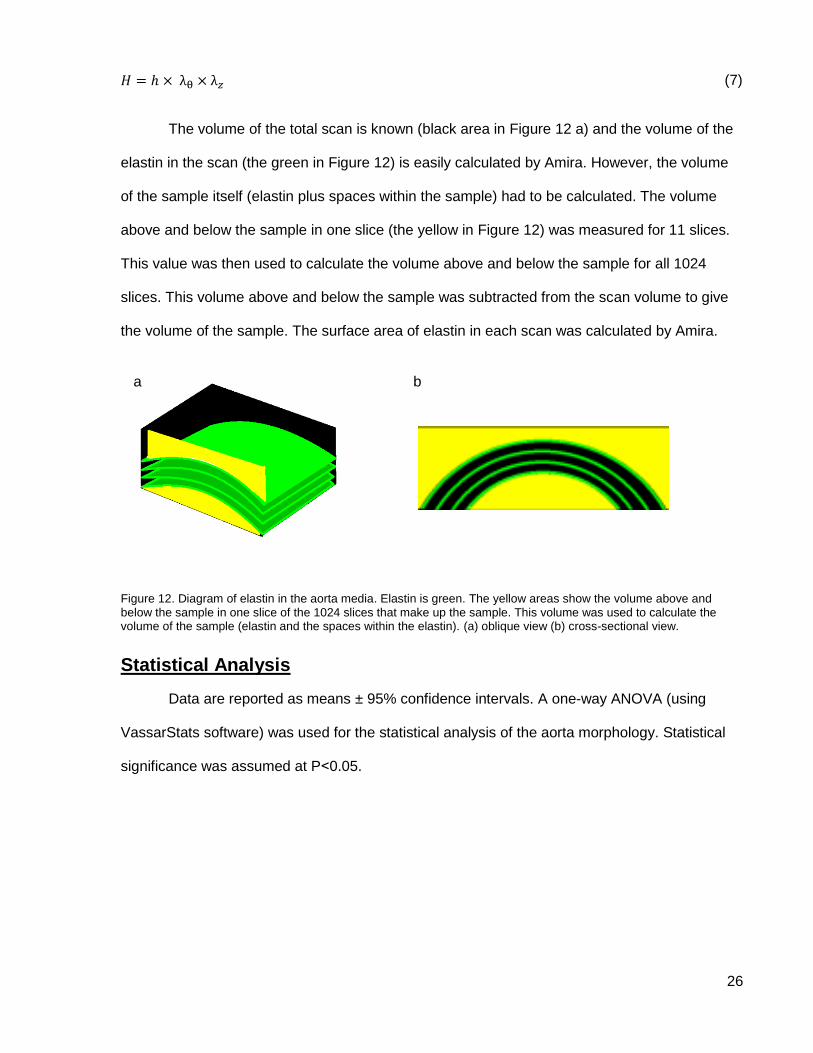
The volume of the total scan is known (black area in Figure 12 a) and the volume of the
elastin in the scan (the green in Figure 12) is easily calculated by Amira. However, the volume
of the sample itself (elastin plus spaces within the sample) had to be calculated. The volume
above and below the sample in one slice (the yellow in Figure 12) was measured for 11 slices.
This value was then used to calculate the volume above and below the sample for all 1024
slices. This volume above and below the sample was subtracted from the scan volume to give
the volume of the sample. The surface area of elastin in each scan was calculated by Amira.
Figure 12. Diagram of elastin in the aorta media. Elastin is green. The yellow areas show the volume above and below the sample in one slice of the 1024 slices that make up the sample. This volume was used to calculate the volume of the sample (elastin and the spaces within the elastin). (a) oblique view (b) cross-sectional view.
Statistical Analysis
Data are reported as means ± 95% confidence intervals. A one-way ANOVA (using
VassarStats software) was used for the statistical analysis of the aorta morphology. Statistical
significance was assumed at P˂0.05.
b a
27
Results
Mechanical Testing
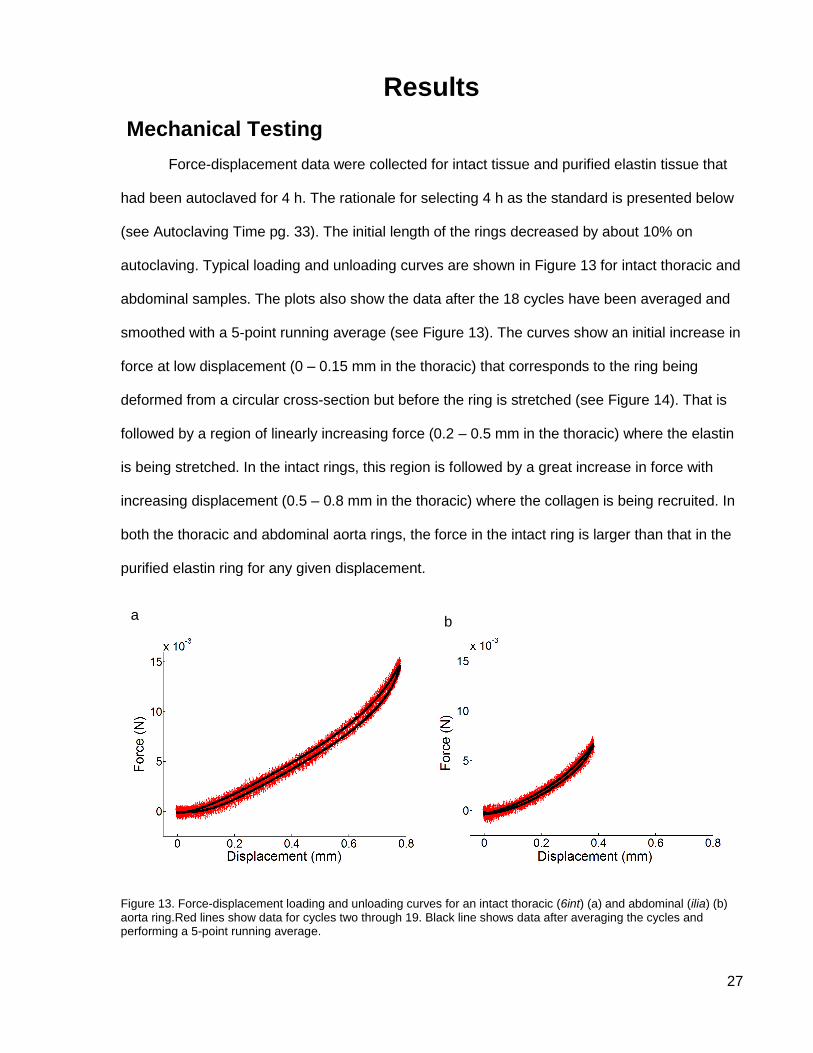
Force-displacement data were collected for intact tissue and purified elastin tissue that
had been autoclaved for 4 h. The rationale for selecting 4 h as the standard is presented below
(see Autoclaving Time pg. 33). The initial length of the rings decreased by about 10% on
autoclaving. Typical loading and unloading curves are shown in Figure 13 for intact thoracic and
abdominal samples. The plots also show the data after the 18 cycles have been averaged and
smoothed with a 5-point running average (see Figure 13). The curves show an initial increase in
force at low displacement (0 – 0.15 mm in the thoracic) that corresponds to the ring being
deformed from a circular cross-section but before the ring is stretched (see Figure 14). That is
followed by a region of linearly increasing force (0.2 – 0.5 mm in the thoracic) where the elastin
is being stretched. In the intact rings, this region is followed by a great increase in force with
increasing displacement (0.5 – 0.8 mm in the thoracic) where the collagen is being recruited. In
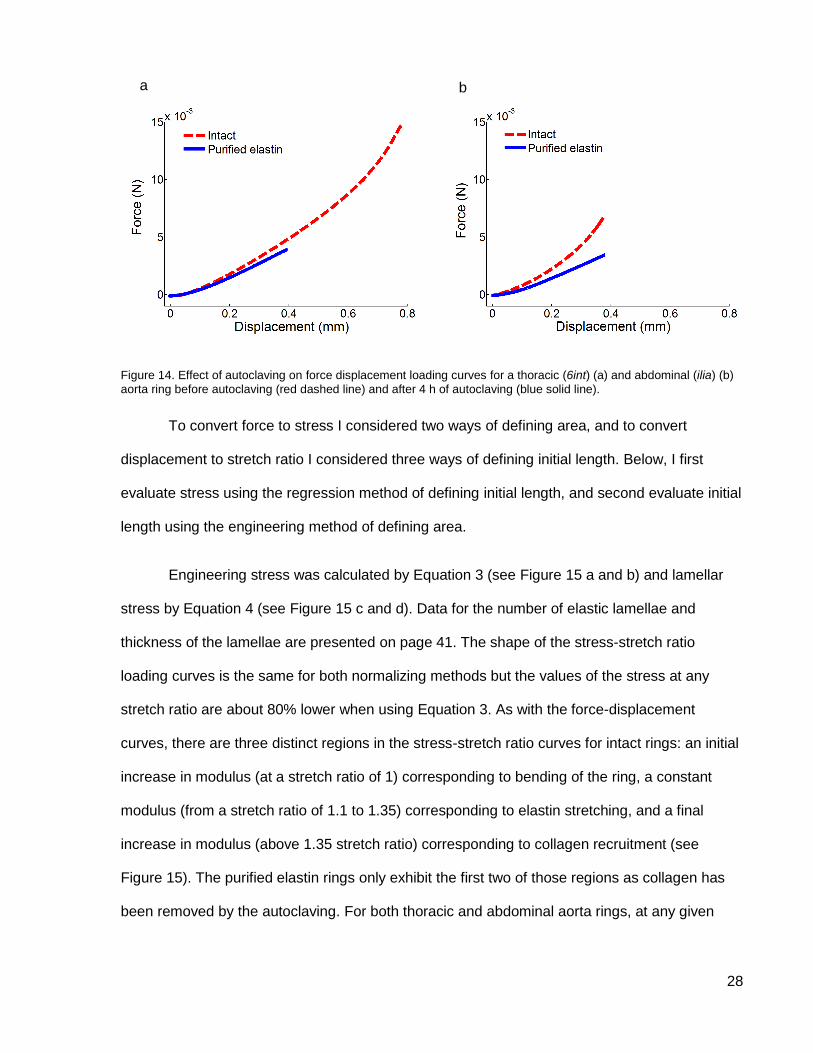
both the thoracic and abdominal aorta rings, the force in the intact ring is larger than that in the
purified elastin ring for any given displacement.
Figure 13. Force-displacement loading and unloading curves for an intact thoracic (6int) (a) and abdominal (ilia) (b) aorta ring.Red lines show data for cycles two through 19. Black line shows data after averaging the cycles and performing a 5-point running average.
b a
28
Figure 14. Effect of autoclaving on force displacement loading curves for a thoracic (6int) (a) and abdominal (ilia) (b)
aorta ring before autoclaving (red dashed line) and after 4 h of autoclaving (blue solid line).
To convert force to stress I considered two ways of defining area, and to convert
displacement to stretch ratio I considered three ways of defining initial length. Below, I first
evaluate stress using the regression method of defining initial length, and second evaluate initial
length using the engineering method of defining area.
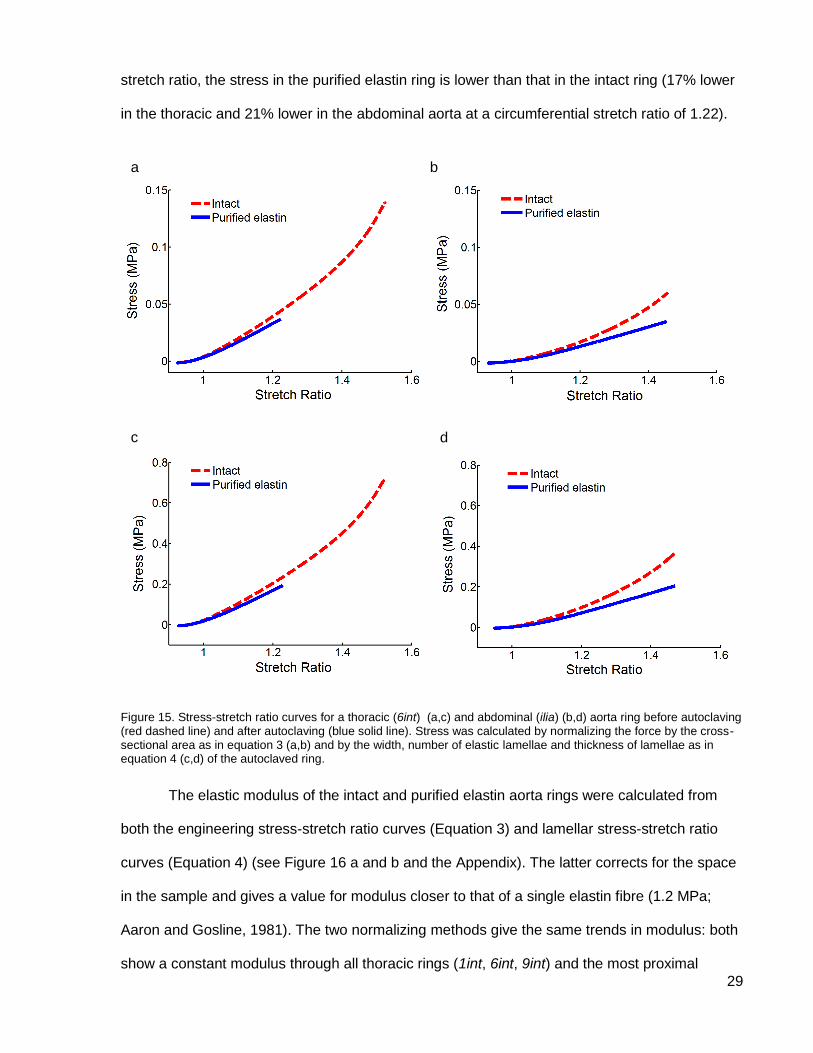
Engineering stress was calculated by Equation 3 (see Figure 15 a and b) and lamellar
stress by Equation 4 (see Figure 15 c and d). Data for the number of elastic lamellae and
thickness of the lamellae are presented on page 41. The shape of the stress-stretch ratio
loading curves is the same for both normalizing methods but the values of the stress at any
stretch ratio are about 80% lower when using Equation 3. As with the force-displacement
curves, there are three distinct regions in the stress-stretch ratio curves for intact rings: an initial
increase in modulus (at a stretch ratio of 1) corresponding to bending of the ring, a constant
modulus (from a stretch ratio of 1.1 to 1.35) corresponding to elastin stretching, and a final
increase in modulus (above 1.35 stretch ratio) corresponding to collagen recruitment (see
Figure 15). The purified elastin rings only exhibit the first two of those regions as collagen has
been removed by the autoclaving. For both thoracic and abdominal aorta rings, at any given
b a
29
stretch ratio, the stress in the purified elastin ring is lower than that in the intact ring (17% lower
in the thoracic and 21% lower in the abdominal aorta at a circumferential stretch ratio of 1.22).
Figure 15. Stress-stretch ratio curves for a thoracic (6int) (a,c) and abdominal (ilia) (b,d) aorta ring before autoclaving (red dashed line) and after autoclaving (blue solid line). Stress was calculated by normalizing the force by the cross-sectional area as in equation 3 (a,b) and by the width, number of elastic lamellae and thickness of lamellae as in equation 4 (c,d) of the autoclaved ring.
The elastic modulus of the intact and purified elastin aorta rings were calculated from
both the engineering stress-stretch ratio curves (Equation 3) and lamellar stress-stretch ratio
curves (Equation 4) (see Figure 16 a and b and the Appendix). The latter corrects for the space
in the sample and gives a value for modulus closer to that of a single elastin fibre (1.2 MPa;
Aaron and Gosline, 1981). The two normalizing methods give the same trends in modulus: both
show a constant modulus through all thoracic rings (1int, 6int, 9int) and the most proximal
a b
c d
30
abdominal (acel) ring, a decrease in modulus in the lumb ring, and greater decrease in the ilia
(most distal) ring. For both normalizing methods and for both intact and purified elastin rings,
there was a clear longitudinal trend; the modulus of the most distal ring (ilia) was significantly
different from that of the thoracic and acel rings. When normalized by Equation 3 (cross-
sectional area) the ilia modulus (0.15 ± 0.04 MPa and 0.12 ± 0.02 MPa) was 42% and 43%
lower than the 6int modulus (0.26 ± 0.03 MPa and 0.21 ± 0.02 MPa) in the intact and purified
elastin rings, respectively. When normalized by Equation 4 (elastic lamellae) the ilia modulus
(0.60 ± 0.07 MPa and 0.47 ± 0.03 MPa) was 32% and 34% lower than the 6int modulus (0.88 ±
0.09 MPa and 0.71 ± 0.05 MPa) in the intact and purified elastin rings respectively.
The modulus of the intact rings was significantly greater than that of the purified elastin
rings at all axial positions. When normalized by Equation 3, the purified elastin ring moduli were
on average 22% and 25% lower than the intact ring moduli in the thoracic and abdominal aorta
respectively.
31
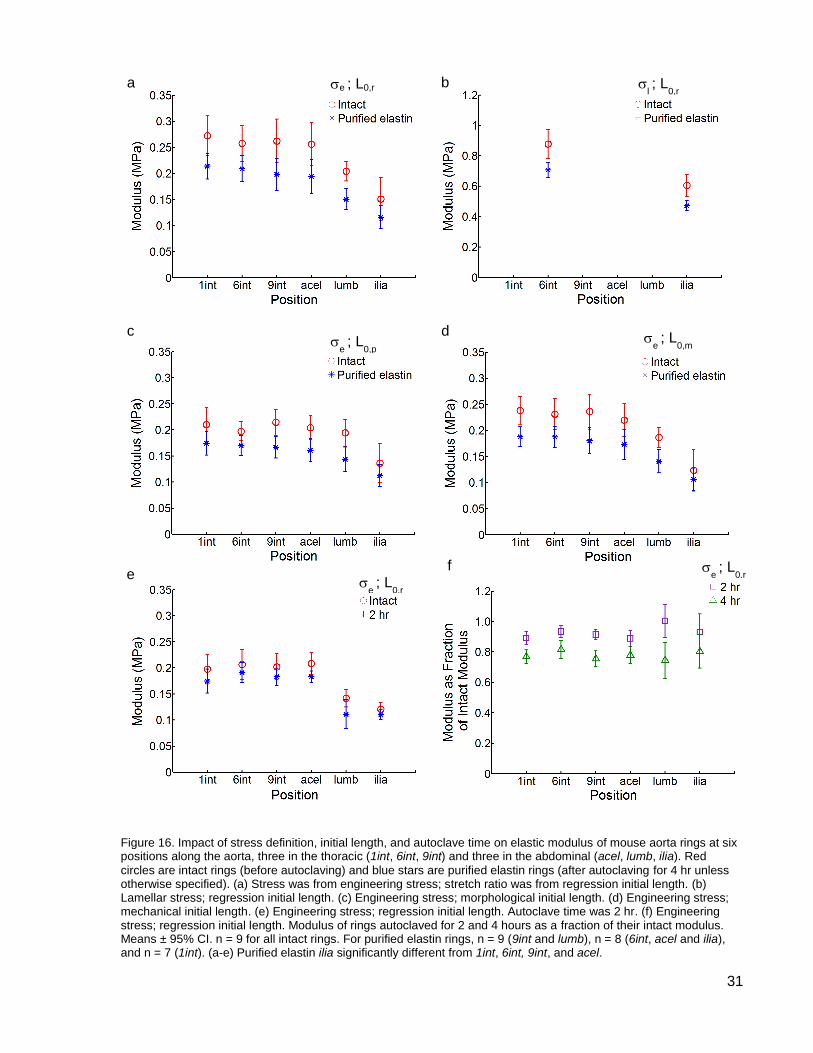
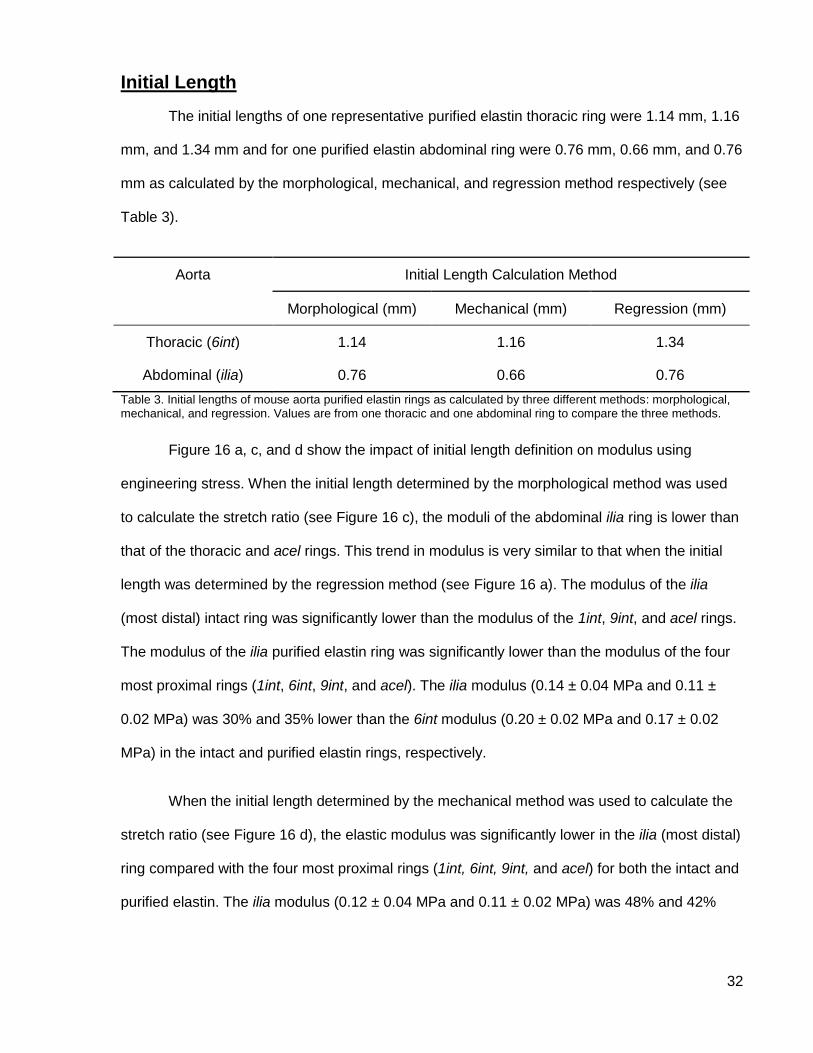
Figure 16. Impact of stress definition, initial length, and autoclave time on elastic modulus of mouse aorta rings at six positions along the aorta, three in the thoracic (1int, 6int, 9int) and three in the abdominal (acel, lumb, ilia). Red
circles are intact rings (before autoclaving) and blue stars are purified elastin rings (after autoclaving for 4 hr unless otherwise specified). (a) Stress was from engineering stress; stretch ratio was from regression initial length. (b) Lamellar stress; regression initial length. (c) Engineering stress; morphological initial length. (d) Engineering stress; mechanical initial length. (e) Engineering stress; regression initial length. Autoclave time was 2 hr. (f) Engineering stress; regression initial length. Modulus of rings autoclaved for 2 and 4 hours as a fraction of their intact modulus. Means ± 95% CI. n = 9 for all intact rings. For purified elastin rings, n = 9 (9int and lumb), n = 8 (6int, acel and ilia), and n = 7 (1int). (a-e) Purified elastin ilia significantly different from 1int, 6int, 9int, and acel.
a b e ; L0,r l ; L
0,r
e ; L
0,p
e ; L
0,m c d
e ; L
0,r
e ; L
0,r
e f
32
Initial Length
The initial lengths of one representative purified elastin thoracic ring were 1.14 mm, 1.16
mm, and 1.34 mm and for one purified elastin abdominal ring were 0.76 mm, 0.66 mm, and 0.76
mm as calculated by the morphological, mechanical, and regression method respectively (see
Table 3).
Aorta Initial Length Calculation Method
Morphological (mm) Mechanical (mm) Regression (mm)
Thoracic (6int) 1.14 1.16 1.34
Abdominal (ilia) 0.76 0.66 0.76
Table 3. Initial lengths of mouse aorta purified elastin rings as calculated by three different methods: morphological, mechanical, and regression. Values are from one thoracic and one abdominal ring to compare the three methods.
Figure 16 a, c, and d show the impact of initial length definition on modulus using
engineering stress. When the initial length determined by the morphological method was used
to calculate the stretch ratio (see Figure 16 c), the moduli of the abdominal ilia ring is lower than
that of the thoracic and acel rings. This trend in modulus is very similar to that when the initial
length was determined by the regression method (see Figure 16 a). The modulus of the ilia
(most distal) intact ring was significantly lower than the modulus of the 1int, 9int, and acel rings.
The modulus of the ilia purified elastin ring was significantly lower than the modulus of the four
most proximal rings (1int, 6int, 9int, and acel). The ilia modulus (0.14 ± 0.04 MPa and 0.11 ±
0.02 MPa) was 30% and 35% lower than the 6int modulus (0.20 ± 0.02 MPa and 0.17 ± 0.02
MPa) in the intact and purified elastin rings, respectively.
When the initial length determined by the mechanical method was used to calculate the
stretch ratio (see Figure 16 d), the elastic modulus was significantly lower in the ilia (most distal)
ring compared with the four most proximal rings (1int, 6int, 9int, and acel) for both the intact and
purified elastin. The ilia modulus (0.12 ± 0.04 MPa and 0.11 ± 0.02 MPa) was 48% and 42%
33
lower than the 6int modulus (0.23 ± 0.03 MPa and 0.19 ± 0.02 MPa) in the intact and purified
elastin rings, respectively.
The regression initial length has been selected as the standard as it was deemed to be
the least subjective (see Initial Length discussion pg. 46).
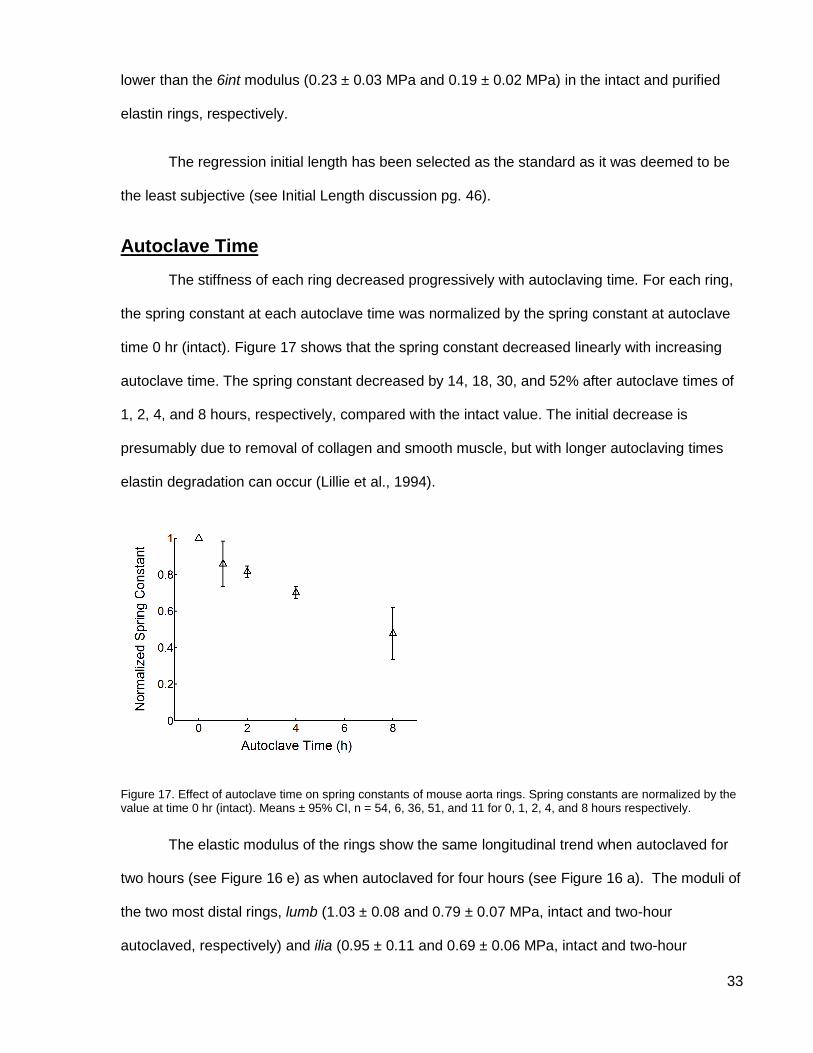
Autoclave Time
The stiffness of each ring decreased progressively with autoclaving time. For each ring,
the spring constant at each autoclave time was normalized by the spring constant at autoclave
time 0 hr (intact). Figure 17 shows that the spring constant decreased linearly with increasing
autoclave time. The spring constant decreased by 14, 18, 30, and 52% after autoclave times of
1, 2, 4, and 8 hours, respectively, compared with the intact value. The initial decrease is
presumably due to removal of collagen and smooth muscle, but with longer autoclaving times
elastin degradation can occur (Lillie et al., 1994).
Figure 17. Effect of autoclave time on spring constants of mouse aorta rings. Spring constants are normalized by the value at time 0 hr (intact). Means ± 95% CI, n = 54, 6, 36, 51, and 11 for 0, 1, 2, 4, and 8 hours respectively.
The elastic modulus of the rings show the same longitudinal trend when autoclaved for
two hours (see Figure 16 e) as when autoclaved for four hours (see Figure 16 a). The moduli of
the two most distal rings, lumb (1.03 ± 0.08 and 0.79 ± 0.07 MPa, intact and two-hour
autoclaved, respectively) and ilia (0.95 ± 0.11 and 0.69 ± 0.06 MPa, intact and two-hour
34
autoclaved, respectively), were significantly lower than that of the thoracic and acel rings
(means 1.33 ± 0.11 and 1.09 ± 0.10, intact and two-hour autoclaved, respectively). The ilia
modulus was 30% and 40% lower than the 6int modulus in the intact and two-hour autoclaved
rings, respectively. Note that a different set of rings was autoclaved for two hours so the data for
intact rings is from different rings in Figure 16 a and e, although the longitudinal trend is the
same in both sets of data.
The moduli of the purified elastin rings after autoclaving for two and four hours have
been expressed as a percent of the moduli of the intact rings (see Figure 16 f). The moduli
dropped on average 8% and 22% after two and four hours of autoclaving respectively.
Four hours has been selected as the standard autoclaving time for the mouse aorta
rings as it was deemed to be the time at which the collagen had been denatured and washed
away but the elastin had not been significantly affected (see Autoclave Time discussion pg. 49).
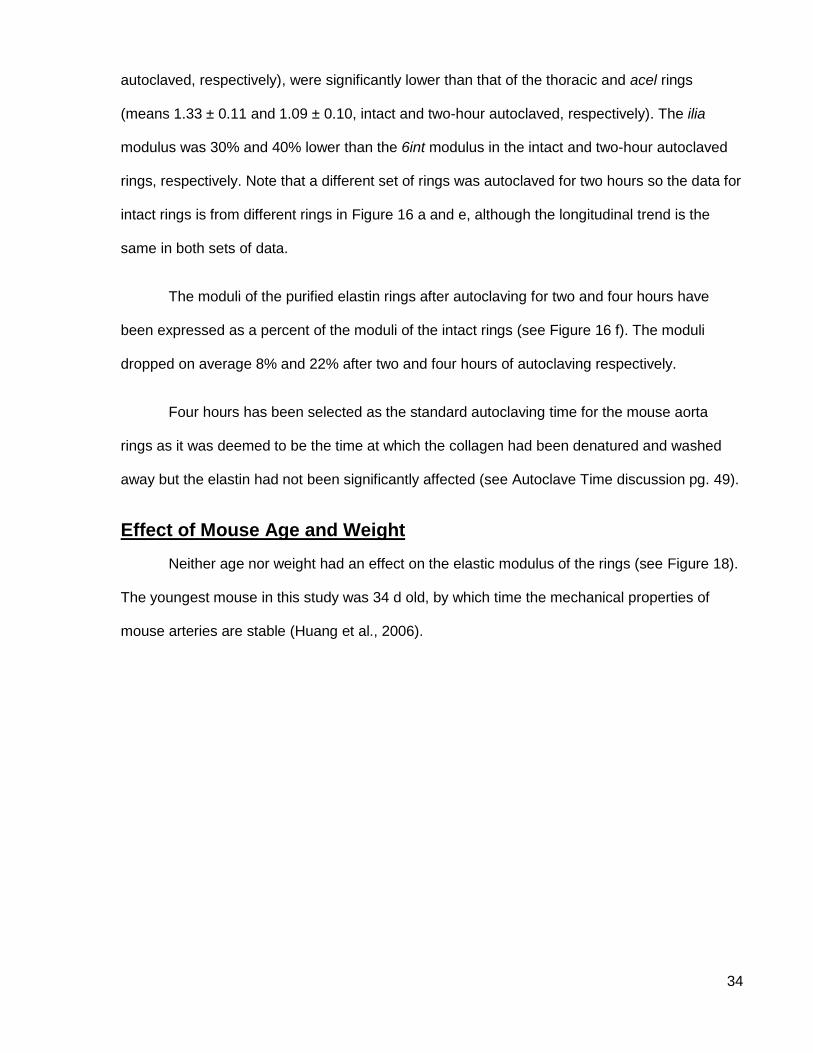
Effect of Mouse Age and Weight
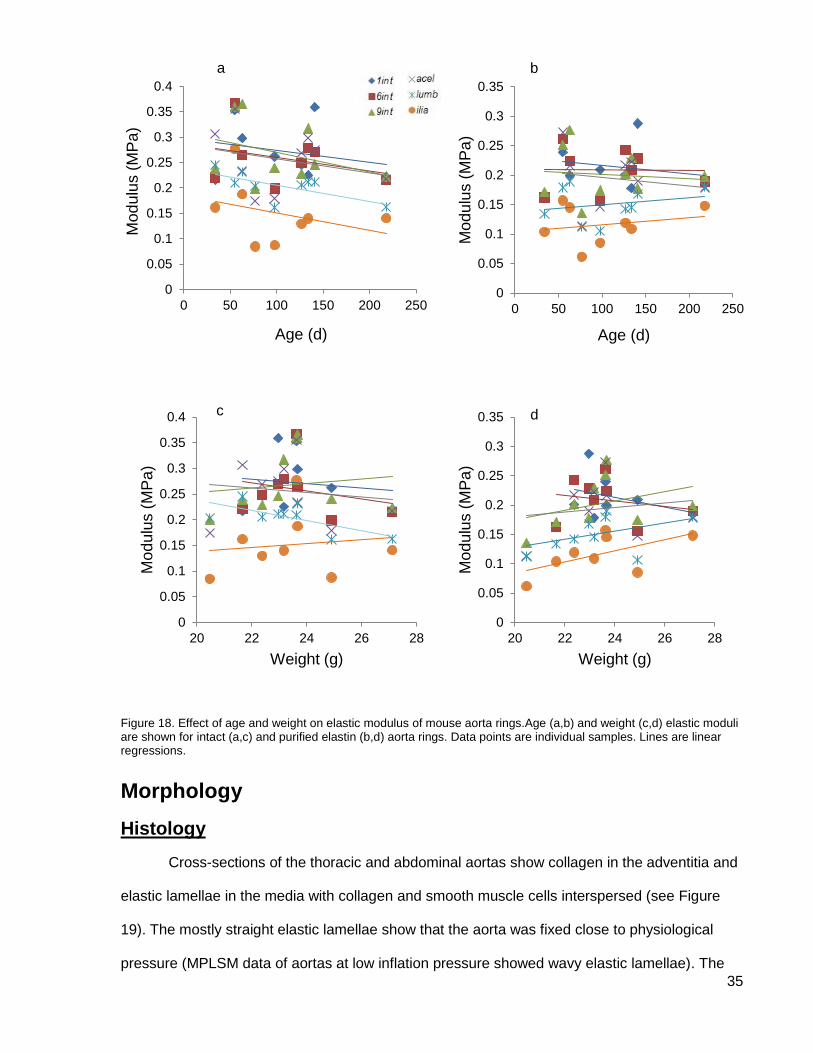
Neither age nor weight had an effect on the elastic modulus of the rings (see Figure 18).
The youngest mouse in this study was 34 d old, by which time the mechanical properties of
mouse arteries are stable (Huang et al., 2006).
35
Figure 18. Effect of age and weight on elastic modulus of mouse aorta rings.Age (a,b) and weight (c,d) elastic moduli are shown for intact (a,c) and purified elastin (b,d) aorta rings. Data points are individual samples. Lines are linear regressions.
Morphology
Histology
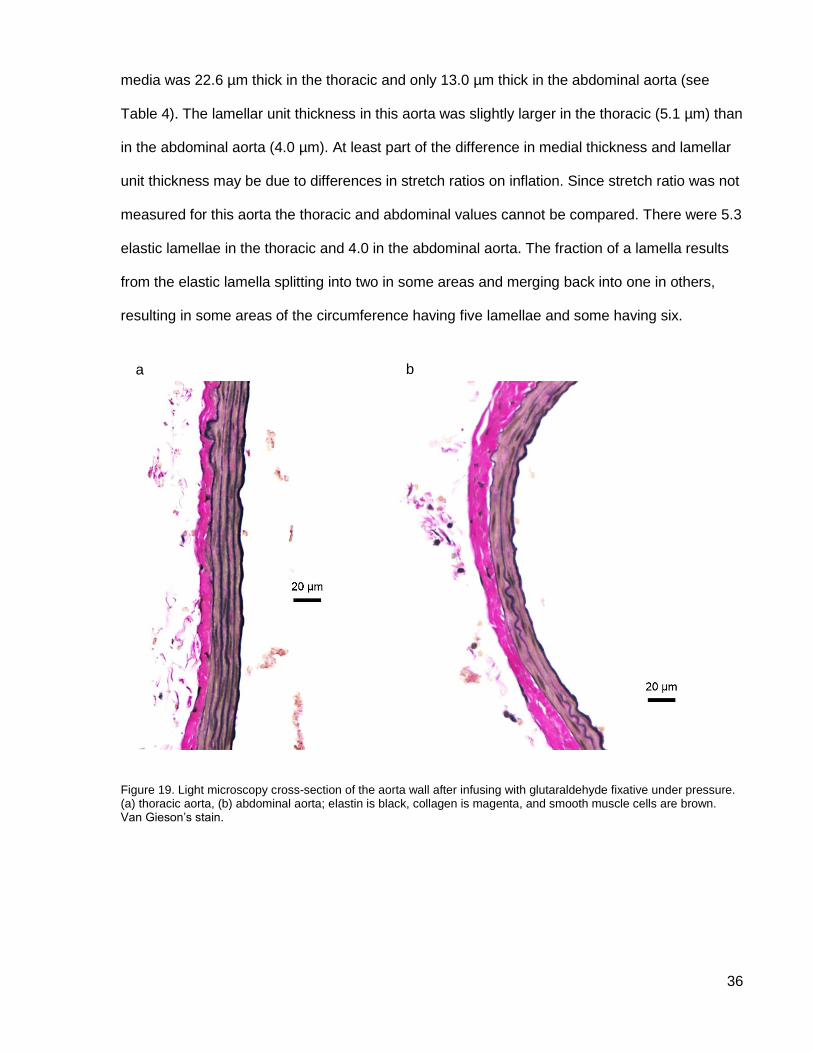
Cross-sections of the thoracic and abdominal aortas show collagen in the adventitia and
elastic lamellae in the media with collagen and smooth muscle cells interspersed (see Figure
19). The mostly straight elastic lamellae show that the aorta was fixed close to physiological
pressure (MPLSM data of aortas at low inflation pressure showed wavy elastic lamellae). The
0
0.05
0.1
0.15
0.2
0.25
0.3
0.35
0.4
0 50 100 150 200 250
Mo
du
lus (
MP
a)
Age (d)
0
0.05
0.1
0.15
0.2
0.25
0.3
0.35
0 50 100 150 200 250
Mo
du
lus (
MP
a)
Age (d)
0
0.05
0.1
0.15
0.2
0.25
0.3
0.35
0.4
20 22 24 26 28
Mo
du
lus (
MP
a)
Weight (g)
0
0.05
0.1
0.15
0.2
0.25
0.3
0.35
20 22 24 26 28
Mo
du
lus (
MP
a)
Weight (g)
a b
c d
36
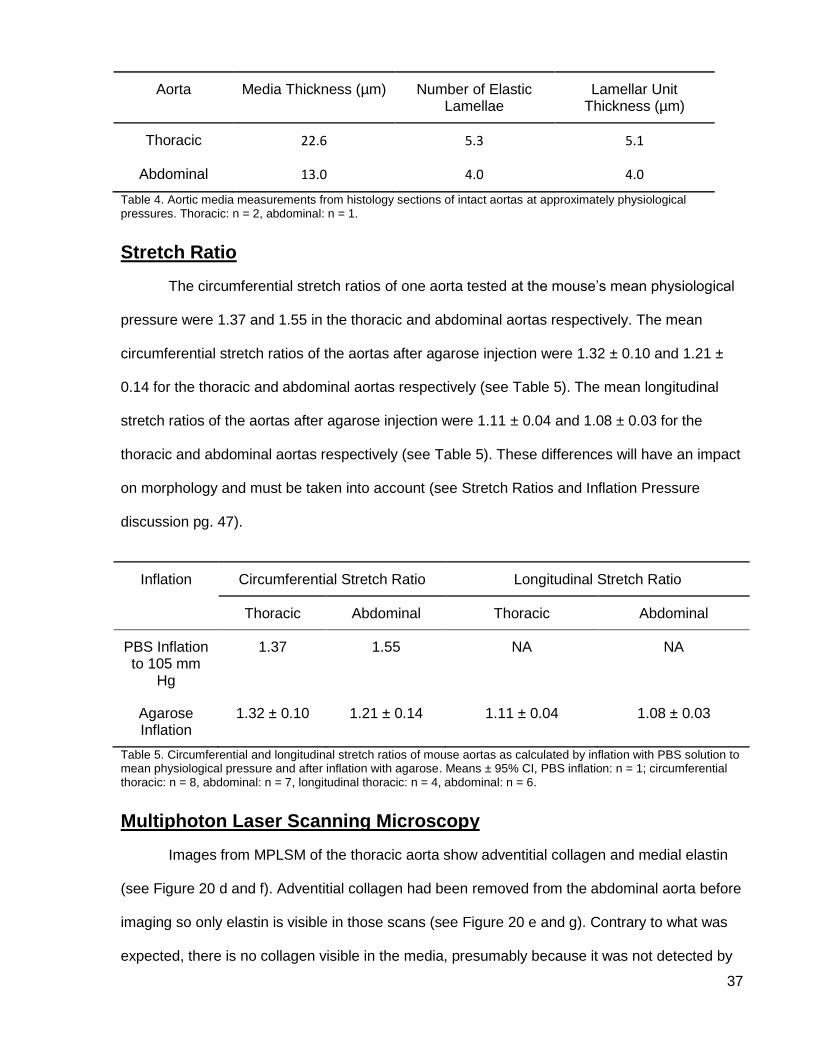
media was 22.6 µm thick in the thoracic and only 13.0 µm thick in the abdominal aorta (see
Table 4). The lamellar unit thickness in this aorta was slightly larger in the thoracic (5.1 µm) than
in the abdominal aorta (4.0 µm). At least part of the difference in medial thickness and lamellar
unit thickness may be due to differences in stretch ratios on inflation. Since stretch ratio was not
measured for this aorta the thoracic and abdominal values cannot be compared. There were 5.3
elastic lamellae in the thoracic and 4.0 in the abdominal aorta. The fraction of a lamella results
from the elastic lamella splitting into two in some areas and merging back into one in others,
resulting in some areas of the circumference having five lamellae and some having six.
Figure 19. Light microscopy cross-section of the aorta wall after infusing with glutaraldehyde fixative under pressure. (a) thoracic aorta, (b) abdominal aorta; elastin is black, collagen is magenta, and smooth muscle cells are brown. Van Gieson’s stain.
b a
37
Aorta Media Thickness (µm) Number of Elastic Lamellae
Lamellar Unit Thickness (µm)
Thoracic 22.6 5.3 5.1
Abdominal 13.0 4.0 4.0
Table 4. Aortic media measurements from histology sections of intact aortas at approximately physiological pressures. Thoracic: n = 2, abdominal: n = 1.
Stretch Ratio
The circumferential stretch ratios of one aorta tested at the mouse’s mean physiological
pressure were 1.37 and 1.55 in the thoracic and abdominal aortas respectively. The mean
circumferential stretch ratios of the aortas after agarose injection were 1.32 ± 0.10 and 1.21 ±
0.14 for the thoracic and abdominal aortas respectively (see Table 5). The mean longitudinal
stretch ratios of the aortas after agarose injection were 1.11 ± 0.04 and 1.08 ± 0.03 for the
thoracic and abdominal aortas respectively (see Table 5). These differences will have an impact
on morphology and must be taken into account (see Stretch Ratios and Inflation Pressure
discussion pg. 47).
Inflation Circumferential Stretch Ratio Longitudinal Stretch Ratio
Thoracic Abdominal Thoracic Abdominal
PBS Inflation to 105 mm
Hg
1.37 1.55 NA NA
Agarose Inflation
1.32 ± 0.10 1.21 ± 0.14 1.11 ± 0.04 1.08 ± 0.03
Table 5. Circumferential and longitudinal stretch ratios of mouse aortas as calculated by inflation with PBS solution to mean physiological pressure and after inflation with agarose. Means ± 95% CI, PBS inflation: n = 1; circumferential thoracic: n = 8, abdominal: n = 7, longitudinal thoracic: n = 4, abdominal: n = 6.
Multiphoton Laser Scanning Microscopy
Images from MPLSM of the thoracic aorta show adventitial collagen and medial elastin
(see Figure 20 d and f). Adventitial collagen had been removed from the abdominal aorta before
imaging so only elastin is visible in those scans (see Figure 20 e and g). Contrary to what was
expected, there is no collagen visible in the media, presumably because it was not detected by
38
the MPLSM. This thesis focused on the mechanical properties of elastin so not being able to
visualize the medial collagen in the MPLSM images was not a hindrance.
Individual image slices (see Figure 20 a and b) are used to reconstruct a 3D model of
the aorta wall (see Figure 20 d - g). Elastic lamellae can be seen, as well as some interlamellar
elastin including elastin struts (see Figure 21).
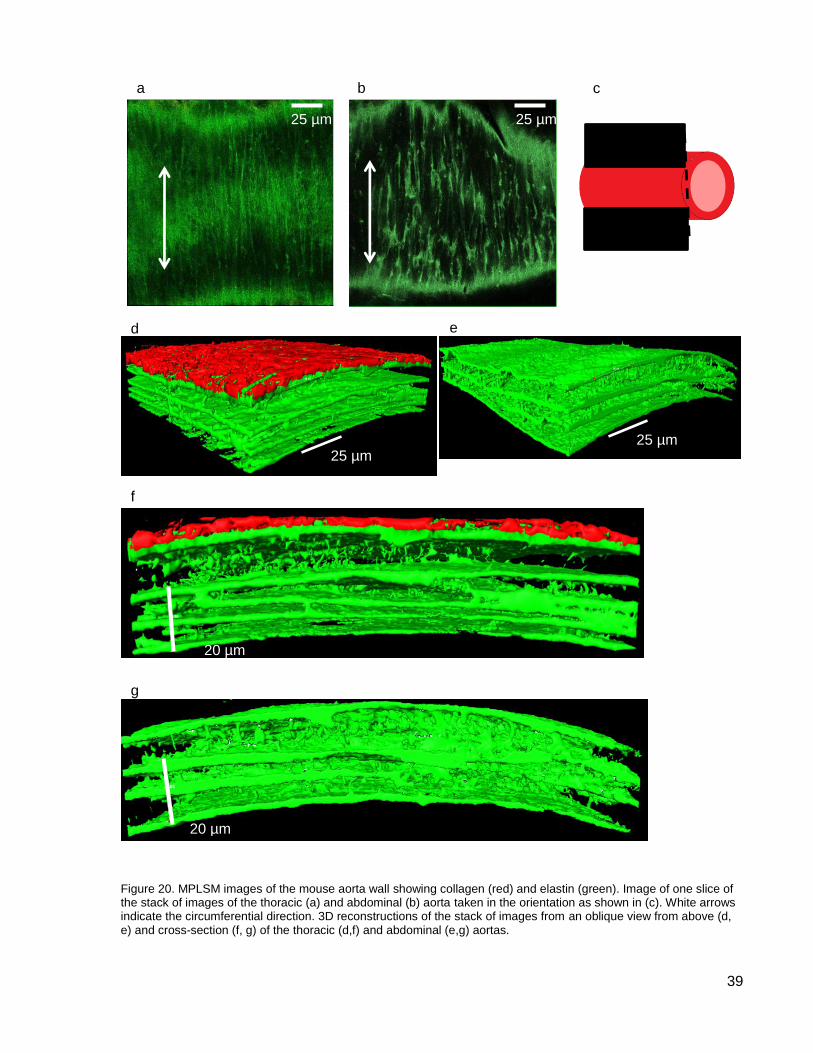
39
Figure 20. MPLSM images of the mouse aorta wall showing collagen (red) and elastin (green). Image of one slice of the stack of images of the thoracic (a) and abdominal (b) aorta taken in the orientation as shown in (c). White arrows indicate the circumferential direction. 3D reconstructions of the stack of images from an oblique view from above (d, e) and cross-section (f, g) of the thoracic (d,f) and abdominal (e,g) aortas.
b
d
f
c a
e
g
25 µm 25 µm
20 µm
20 µm
25 µm 25 µm
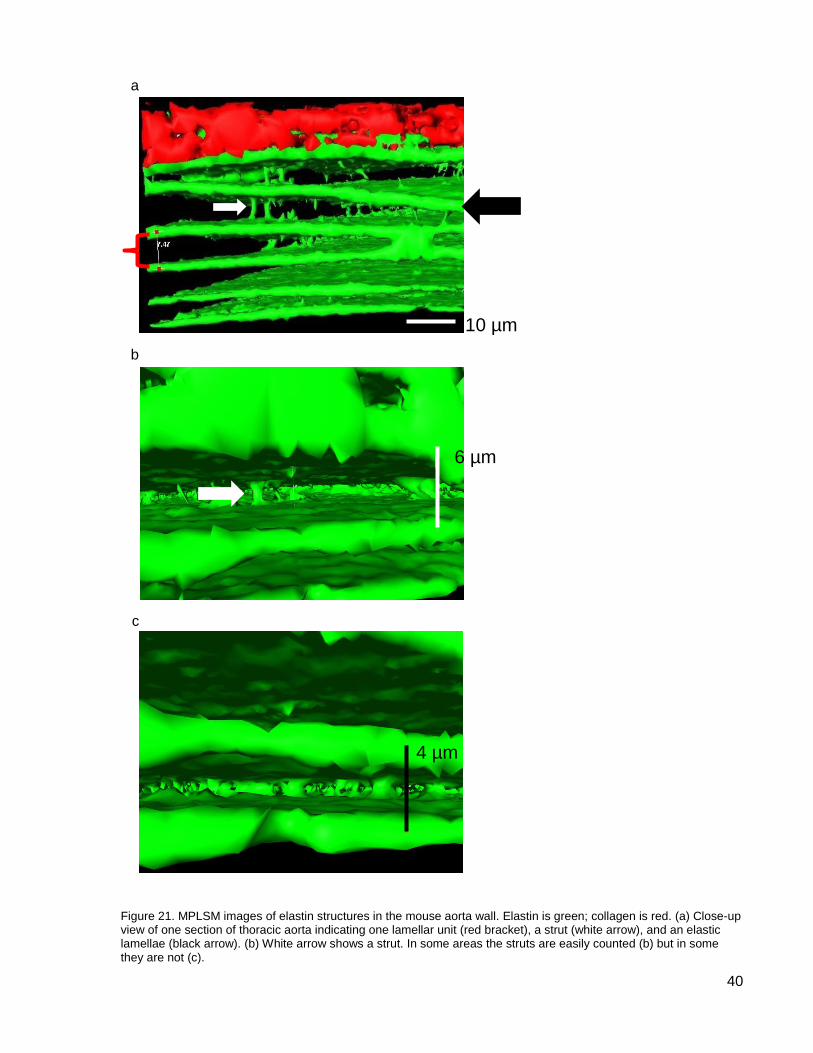
40
Figure 21. MPLSM images of elastin structures in the mouse aorta wall. Elastin is green; collagen is red. (a) Close-up view of one section of thoracic aorta indicating one lamellar unit (red bracket), a strut (white arrow), and an elastic lamellae (black arrow). (b) White arrow shows a strut. In some areas the struts are easily counted (b) but in some they are not (c).
b
c
6 µm
4 µm
a
10 µm
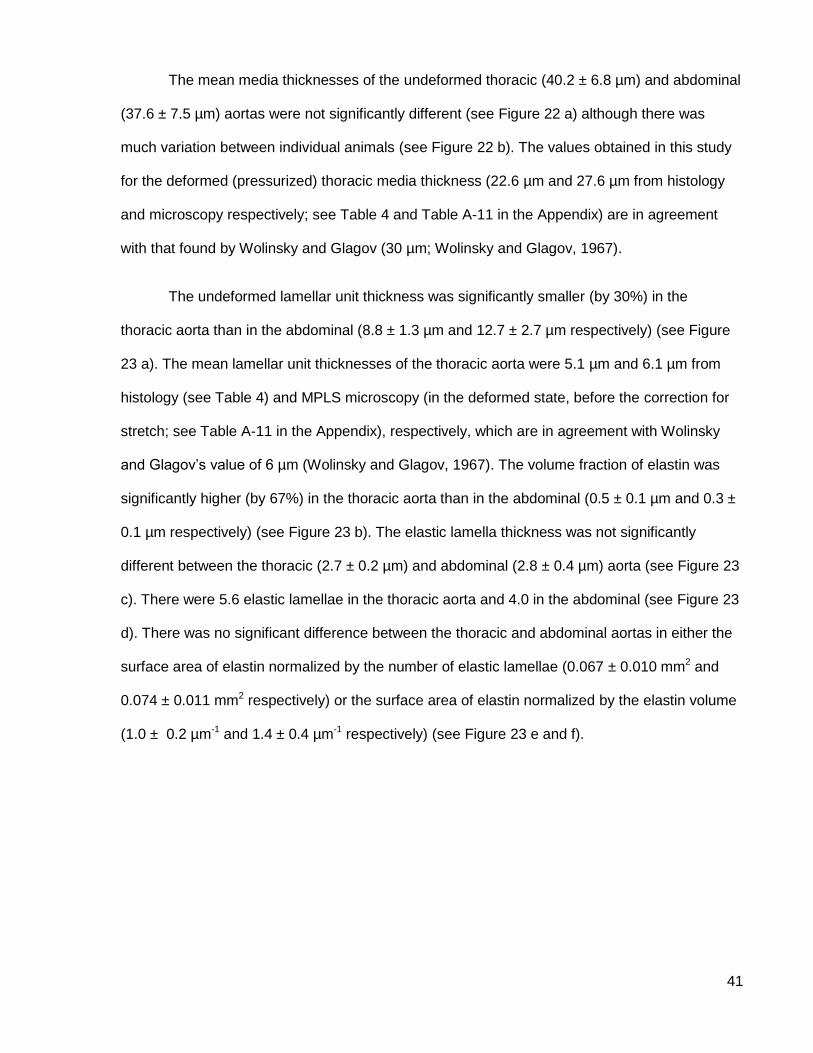
41
The mean media thicknesses of the undeformed thoracic (40.2 ± 6.8 µm) and abdominal
(37.6 ± 7.5 µm) aortas were not significantly different (see Figure 22 a) although there was
much variation between individual animals (see Figure 22 b). The values obtained in this study
for the deformed (pressurized) thoracic media thickness (22.6 µm and 27.6 µm from histology
and microscopy respectively; see Table 4 and Table A-11 in the Appendix) are in agreement
with that found by Wolinsky and Glagov (30 µm; Wolinsky and Glagov, 1967).
The undeformed lamellar unit thickness was significantly smaller (by 30%) in the
thoracic aorta than in the abdominal (8.8 ± 1.3 µm and 12.7 ± 2.7 µm respectively) (see Figure
23 a). The mean lamellar unit thicknesses of the thoracic aorta were 5.1 µm and 6.1 µm from
histology (see Table 4) and MPLS microscopy (in the deformed state, before the correction for
stretch; see Table A-11 in the Appendix), respectively, which are in agreement with Wolinsky
and Glagov’s value of 6 µm (Wolinsky and Glagov, 1967). The volume fraction of elastin was
significantly higher (by 67%) in the thoracic aorta than in the abdominal (0.5 ± 0.1 µm and 0.3 ±
0.1 µm respectively) (see Figure 23 b). The elastic lamella thickness was not significantly
different between the thoracic (2.7 ± 0.2 µm) and abdominal (2.8 ± 0.4 µm) aorta (see Figure 23
c). There were 5.6 elastic lamellae in the thoracic aorta and 4.0 in the abdominal (see Figure 23
d). There was no significant difference between the thoracic and abdominal aortas in either the
surface area of elastin normalized by the number of elastic lamellae (0.067 ± 0.010 mm2 and
0.074 ± 0.011 mm2 respectively) or the surface area of elastin normalized by the elastin volume
(1.0 ± 0.2 µm-1 and 1.4 ± 0.4 µm-1 respectively) (see Figure 23 e and f).
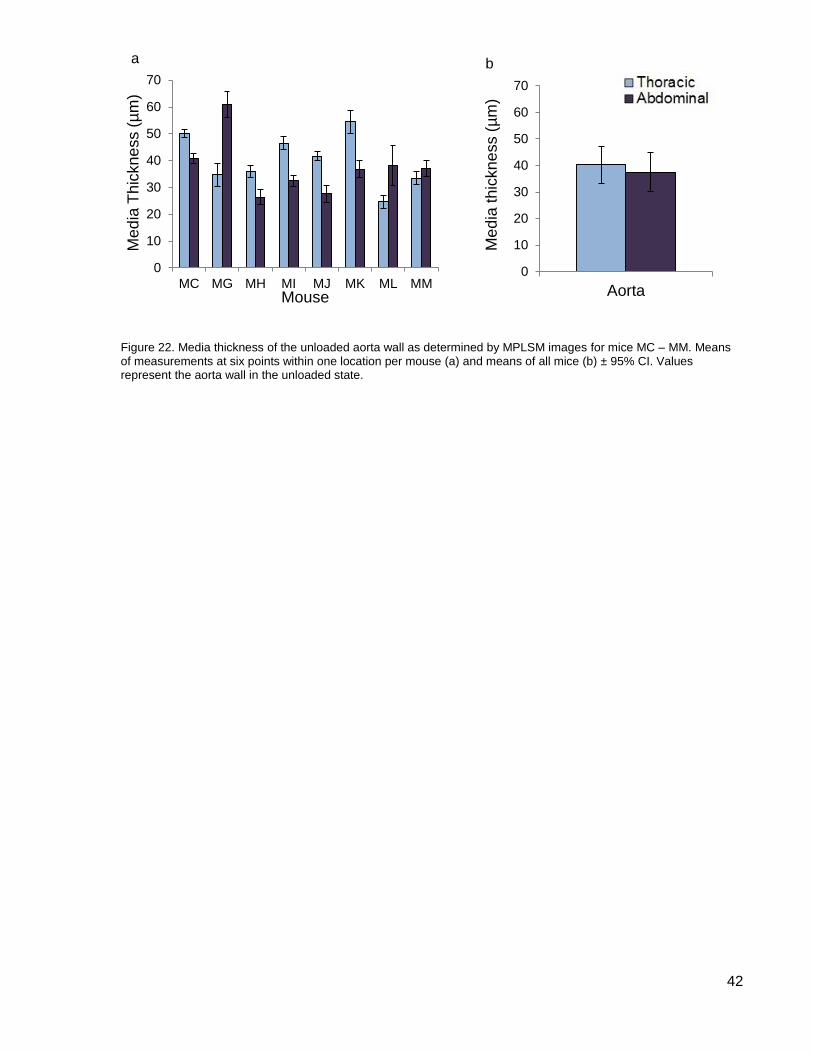
42
Figure 22. Media thickness of the unloaded aorta wall as determined by MPLSM images for mice MC – MM. Means of measurements at six points within one location per mouse (a) and means of all mice (b) ± 95% CI. Values represent the aorta wall in the unloaded state.
0
10
20
30
40
50
60
70
MC MG MH MI MJ MK ML MM
Me
dia
Th
ickne
ss (
µm
)
Mouse
0
10
20
30
40
50
60
70
Aorta
Me
dia
th
ickne
ss (
µm
)
a b
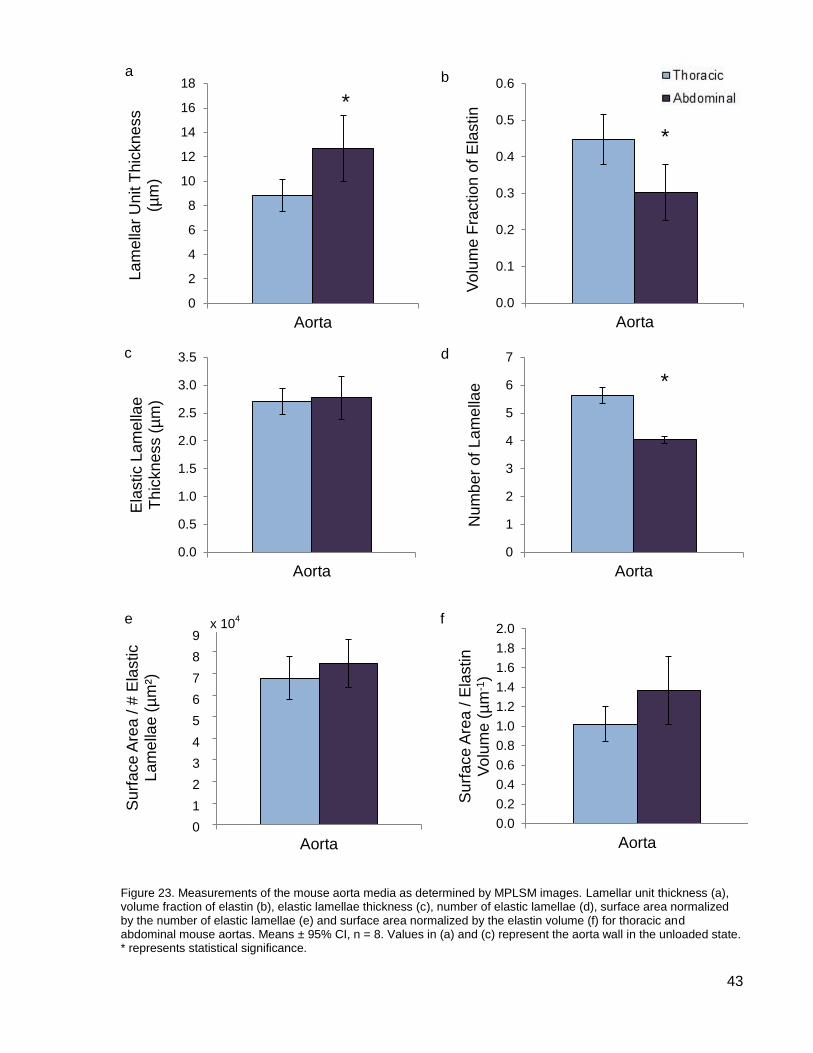
43
Figure 23. Measurements of the mouse aorta media as determined by MPLSM images. Lamellar unit thickness (a), volume fraction of elastin (b), elastic lamellae thickness (c), number of elastic lamellae (d), surface area normalized by the number of elastic lamellae (e) and surface area normalized by the elastin volume (f) for thoracic and abdominal mouse aortas. Means ± 95% CI, n = 8. Values in (a) and (c) represent the aorta wall in the unloaded state. * represents statistical significance.
0
2
4
6
8
10
12
14
16
18
Aorta
La
me
llar
Unit T
hic
kne
ss
(µm
)
0.0
0.1
0.2
0.3
0.4
0.5
0.6
Aorta
Vo
lum
e F
ractio
n o
f E
lastin
0.0
0.5
1.0
1.5
2.0
2.5
3.0
3.5
Aorta
Ela
stic L
am
ella
e
Th
ickne
ss (
µm
)
0
1
2
3
4
5
6
7
Aorta
Num
be
r o
f L
am
ella
e
0
10,000
20,000
30,000
40,000
50,000
60,000
70,000
80,000
90,000
Aorta
Su
rfa
ce
Are
a / #
Ela
stic
La
me
llae
(µ
m²)
0.0
0.2
0.4
0.6
0.8
1.0
1.2
1.4
1.6
1.8
2.0
Aorta
Su
rfa
ce
Are
a / E
lastin
V
olu
me
(µ
m-1
)
*
*
x 104
9
8
7
6
5
4
3
2
1
0
a b
c d
e f
*
44
Discussion
The validity of the data and methods used to normalize the data are first discussed,
followed by a discussion of the four hypotheses.
Analyzing the Data
This study required relatively large thoracic aortas to be compared to much smaller (by
30-50%) abdominal aortas and intact elastin rings to be compared to purified elastin rings. It is
critical to establish that differences in the reported moduli represent material properties of the
aortas and not differences due to size. The size difference is dealt with in part by normalizing
the data according to the dimensions of the rings but size also led to some difficulties in the
techniques that were used. Comparing intact and purified elastin rings has its own difficulties
and also implies knowledge of the autoclave time used to produce a purified elastin ring.
Comparisons of Size – Large and Small
Techniques
Mechanical testing was difficult because the rings are small. One set of hooks could not
be used for all aorta rings because the larger hooks were too large to fit in the abdominal aorta
rings and the small hooks cut into the thoracic aorta rings because of their relatively small
diameter. The relative error in the measurements is also different for each aorta because of
their different sizes.
Normalizing Force and Displacement
The aorta rings were not all the same size and so in order to compare the mechanical
properties of a smaller ring to a larger ring the force and displacement data had to be
normalized for the dimensions of each ring. This was the main challenge in the mechanical
testing part of this thesis and care had to be taken to ensure artefacts weren’t introduced when
normalizing the data. There is more than one way to calculate the cross-sectional area used to
normalize the force and more than one way to calculate the initial length used to normalize the
45
displacement, and different values are obtained (for the same elastin) depending on the method
used. Each method has its own assumptions; these assumptions and the chosen method are
discussed below.
Cross-sectional Area
The conventional method of calculating stress is to normalize force by the cross-
sectional area of the material being stretched (see Equation 3). This thesis uses the engineering
stress (non-deformed cross-sectional area) not the true stress (deformed cross-sectional area)
to avoid the possibility of introducing artefacts through a second use of the initial length of the
ring (which is used to calculate the stretch ratio). When this conventional normalizing method is
used for an aorta wall, the spaces between the elastic lamellae are also included in the cross-
sectional area, resulting in a stress, and therefore also a modulus, that is much smaller than
what it would be if the cross-sectional area of only the elastin was used. One way to resolve this
is to correct for the fibre packing density of elastin; however, this was not done because the
error in measuring density in such small samples was prohibitively high and could possibly have
introduced a size-based bias. Instead, the force was normalized by the area of elastin as
determined by MPLSM data. Wall thickness was based on the number of elastic lamellae and
average lamellar thickness (see Equation 4). Excluding the spaces between the elastic lamellae
brought the resultant moduli close to that of a single elastin fibre (1.2 MPa; Aaron and Gosline,
1981) (see Figure 16 b).
Regardless of the stress calculation used, modulus decreased with distance from the
heart. The modulus of the most distal ring (ilia) was significantly lower than that of the four most
proximal (thoracic and acel) rings and the modulus of the second most distal ring (lumb) was
between that of the proximal and ilia rings (see Figure 16 a and b). As was observed in the pig
thoracic aorta, there is a clear regional difference in elastin mechanics (Lillie and Gosline,
2007).
46
Initial Length
Knowing the initial length of each ring is critical for calculating the stretch ratio of the ring
and therefore also the ring’s modulus. To ensure an appropriate value was obtained, the initial
length was calculated using three different methods: morphological, mechanical and regression
length. Each method resulted in a slightly different value of initial length (see Table 3).
The morphological initial length relied on the same amount of PBS solution being wicked
out from under the cover slip before the photos of the ring were taken. A different volume of
PBS solution under the cover slip would affect how flattened the ring was, and therefore could
affect its length. Even with an established protocol this method was subjective.
The mechanical initial length relied on the experimenter determining by observation (with
the help of a magnifying glass) at what displacement of the tensile tester the sides of the ring
just became parallel. Due to the difficulty of accurately determining this point on such a small
object, this method was thought to be the least accurate; however, a method was required that
could be done during the experiment without handling the tissue as required for morphological
length. It provided an initial length from which the maximum stretch (1.5) was calculated during
the tensile testing.
The initial length by regression represents the length at which the bulk of elastin started
to resist deformation (Lillie et al., 1994). This method relied almost entirely on data from the
tensile tester; the experimenter only determined the region of the force-length curve where it
has a constant slope, a task that was very reproducible on the force-length curve of a purified
elastin ring. This method of calculating the initial length was therefore used throughout the data
analysis because it was deemed to be the least subjective.
Regardless of the initial length used, the modulus of the most distal purified elastin ring
(ilia) was consistently significantly lower than that of the thoracic rings (see Figure 16 a, c, and
d). The purpose of this study was not to determine the definitive elastic modulus of aortic rings,
47
but to look for differences in the modulus at various positions along the aorta. There is a clear
trend with all initial lengths of decreasing modulus with distance from the heart, showing that the
trend is not due to artefacts introduced when calculating the stretch ratio.
Stretch Ratios and Inflation Pressure
I investigated the morphology of the elastin in the aorta wall to identify whether any
difference in the thoracic and abdominal aortas could account for the 43% difference in elastic
modulus of purified elastin rings measured in uniaxial tensile tests (which are independent of
pressure). Preliminary MPLSM tests of unpressurized aortas gave poor results, in part because
of the increased thickness of the wall in the unloaded state, so subsequent MPLSM was done
with the aortas in a loaded state. The physiological stretches (both circumferential and
longitudinal) are different in the thoracic and abdominal aorta, and any difference in stretch had
to be taken into account in the morphology measurements. Although I aimed to obtain
physiological pressures to help in understanding mouse physiology, the exact pressure used for
this part of the study is immaterial since the dimensions were corrected to the unloaded state.
Aldehydes (formaldehyde or glutaraldehyde) are commonly used as a tissue fixative but
they are not compatible with MPLSM because they fluoresce and mask the autofluorescence
from elastin. As an alternative, agarose gel was injected into the aorta such that the bulk of the
gel would physically hold the aorta in a stretched state. However, because the aorta is so small
it was difficult to get both the thoracic and abdominal aortas to physiological pressure before the
gel set, and it was difficult to monitor the pressure with a pressure transducer. To determine
whether the agarose-injected aortas had stretch ratios similar to those under physiological
pressure, the stretch ratios of the aortas after agarose injection were compared with the stretch
ratio obtained by PBS solution inflation to physiological pressure (see Table 5). The mean
circumferential stretch ratio of the thoracic aortas was within 4% of that at physiological
pressure but was 31% lower than previously reported values in mouse tissue (1.96 and 1.9;
Guo and Kassab, 2003; Huang et al., 2006). The mean circumferential stretch ratio of the
48
abdominal aortas was 22% lower than that at physiological pressure and approximately 33%
lower than previously reported values (1.74 and 1.8; Guo and Kassab, 2003; Huang et al.,
2006). The mean longitudinal stretch ratios were 15% and 33% lower than previously reported
values for the thoracic and abdominal aortas, respectively, in mouse tissue (1.3 and 1.6; Guo et
al., 2002). The lower stretch ratios of the abdominal aortas will have implications on the
morphological measurements obtained in this state. The most obvious of these is that the
abdominal media, lamellar unit, and elastic lamellae thicknesses will appear spuriously high
since the aorta wall becomes thinner at higher pressures (Wolinsky and Glagov, 1964). The
problem of the thoracic and abdominal aortas being at different stretch ratios during the MPLSM
is dealt with by converting the values in the deformed state to the values in the undeformed
state. Assuming the aorta wall deforms at constant volume (Lillie et al., 2010), a correction
factor can be calculated to account for the radial stretch when the tissue is stretched in the
longitudinal and circumferential orientations. This value can then be used to convert each of the
measured thickness values to the value in the undeformed state, allowing the thoracic and
abdominal aortas to be compared (see Equations 5-7).
Comparisons of State – Intact and Purified Elastin
Intact arteries have a collagenous adventitial layer whereas it has been removed from
purified elastin arteries during autoclaving. This study is concerned with the media but it cannot
be directly measured in intact rings because of the surrounding adventitia. For this reason many
of the comparisons of intact and purified elastin required for the data analysis are not
straightforward.
The initial length of the purified elastin ring was used to calculate the stretch ratio for
both the intact and the purified elastin ring. Since the same ring was tested before and after
autoclaving and the amount of elastin in that ring does not change, the same initial length was
used for both rings. The initial length of the purified elastin ring was used instead of that of the
intact ring because the purified elastin ring (which is lacking collagen and smooth muscle cells)
49
gives a better approximation of the length of the elastin in the ring (as opposed to the length of
the ring). After autoclaving, the initial length of the rings decreased by about 10% (in both the
thoracic and abdominal aortas), presumably because the bulk of the smooth muscle cells holds
the elastin out, thereby increasing the length of the ring. When the smooth muscle cells are not
there, the elastin recoils and the initial length is decreased. This effect has been seen in other
arteries (Lillie et al., 1994) and does not affect the resultant moduli. Since the elastin is
stretched by 9% in the intact tissue, the modulus is measured at a 9% higher stretch in the
intact than in the purified elastin rings; however, since the curves are linear over a long range,
the slope (modulus) is the same.
Autoclave Time
Elastin is covalently cross-linked and is much more robust than collagen so autoclaving
aortic tissue denatures and washes away collagen (and smooth muscle cells) long before the
elastin is affected (Partridge et al., 1955; Lillie et al., 1994; Gundiah et al., 2007). One of the
goals of this thesis is to determine the mechanical properties of elastin along the aorta by
testing a purified elastin aorta. It is therefore important to know the autoclave time needed to
denature the collagen without affecting the integrity of the elastin to ensure the moduli being
compared are those of purified elastin. The moduli of the intact aortas provide a point of
comparison to ensure the autoclaving time is appropriate.
There is no published protocol for autoclaving mouse aortic tissue. A previous study of
pig aorta rings (Lillie et al., 1994) has shown that collagen denatures into gelatin in about 30
minutes, using tissue shrinkage as the index (Boedtker and Doty, 1956). The gelatin is removed
from the tissue by diffusion during further autoclaving. Lillie et al. (1994) used an autoclave time
of eight hours, and it is reasonable to assume that a shorter autoclave time would be required
for mouse tissue since pig aorta rings are much larger than mouse aorta rings (approximately
20 mm vs. 1 mm diameters respectively) and the denatured collagen will diffuse out of a smaller
ring more quickly.
50
Autoclave times of one, two, four, and eight hours were initially used and the resultant
ring mechanical properties analyzed to determine the optimal autoclave time. Note that all of
these autoclave times are longer than the time required for collagen to be denatured. There was
qualitative evidence for collagen no longer being present in the purified elastin rings in that they
broke much more easily than the intact rings during tensile testing.
The tensile testing data also provides quantitative evidence for collagen having been
removed from the rings. When comparing the loading curves for intact and purified elastin rings
(see Figure 14 and Figure 15), the intact curves have an increasing slope (and therefore much
increased spring constant and modulus) at higher strains, indicating that collagen has been
recruited, whereas the purified elastin curves have a constant slope, even at higher strains,
showing no evidence of collagen recruitment. The modulus is taken at low strains before the
point where collagen would have been recruited so it shouldn’t affect the modulus even if it were
still present in the tissue.
There is not a large difference in the normalized spring constants after two and four
hours of autoclaving (82% and 70% of the intact spring constant respectively). However, after
eight hours the spring constant is much lower (48% of that of the intact) indicating that elastin is
being damaged. The fact that many more of the eight-hour autoclaved rings broke during tensile
testing than the four-hour autoclaved rings may be evidence of elastin degradation.
Focussing on autoclave times of two and four hours, both times resulted in moduli that
were very similar (0.19 vs. 0.21 MPa for 6int and 0.11 vs. 0.12 MPa for ilia, at two and four
hours respectively). This is evidence that after two or four hours of autoclaving, collagen has
been denatured but the effects on elastin are not enough to significantly alter the moduli. An
autoclave time of four hours has been used as the optimum in this study. Since there is more
collagen in the distal aorta, the longer time was chosen to be absolutely sure all collagen had
been removed.
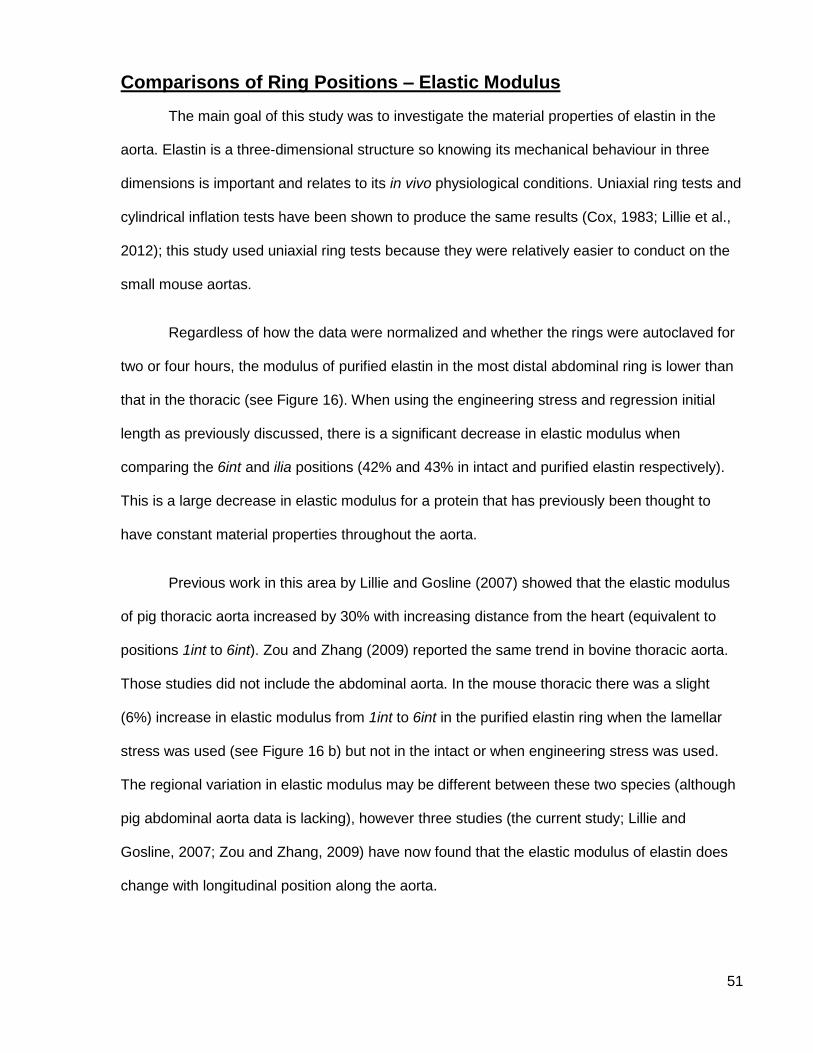
51
Comparisons of Ring Positions – Elastic Modulus
The main goal of this study was to investigate the material properties of elastin in the
aorta. Elastin is a three-dimensional structure so knowing its mechanical behaviour in three
dimensions is important and relates to its in vivo physiological conditions. Uniaxial ring tests and
cylindrical inflation tests have been shown to produce the same results (Cox, 1983; Lillie et al.,
2012); this study used uniaxial ring tests because they were relatively easier to conduct on the
small mouse aortas.
Regardless of how the data were normalized and whether the rings were autoclaved for
two or four hours, the modulus of purified elastin in the most distal abdominal ring is lower than
that in the thoracic (see Figure 16). When using the engineering stress and regression initial
length as previously discussed, there is a significant decrease in elastic modulus when
comparing the 6int and ilia positions (42% and 43% in intact and purified elastin respectively).
This is a large decrease in elastic modulus for a protein that has previously been thought to
have constant material properties throughout the aorta.
Previous work in this area by Lillie and Gosline (2007) showed that the elastic modulus
of pig thoracic aorta increased by 30% with increasing distance from the heart (equivalent to
positions 1int to 6int). Zou and Zhang (2009) reported the same trend in bovine thoracic aorta.
Those studies did not include the abdominal aorta. In the mouse thoracic there was a slight
(6%) increase in elastic modulus from 1int to 6int in the purified elastin ring when the lamellar
stress was used (see Figure 16 b) but not in the intact or when engineering stress was used.
The regional variation in elastic modulus may be different between these two species (although
pig abdominal aorta data is lacking), however three studies (the current study; Lillie and
Gosline, 2007; Zou and Zhang, 2009) have now found that the elastic modulus of elastin does
change with longitudinal position along the aorta.
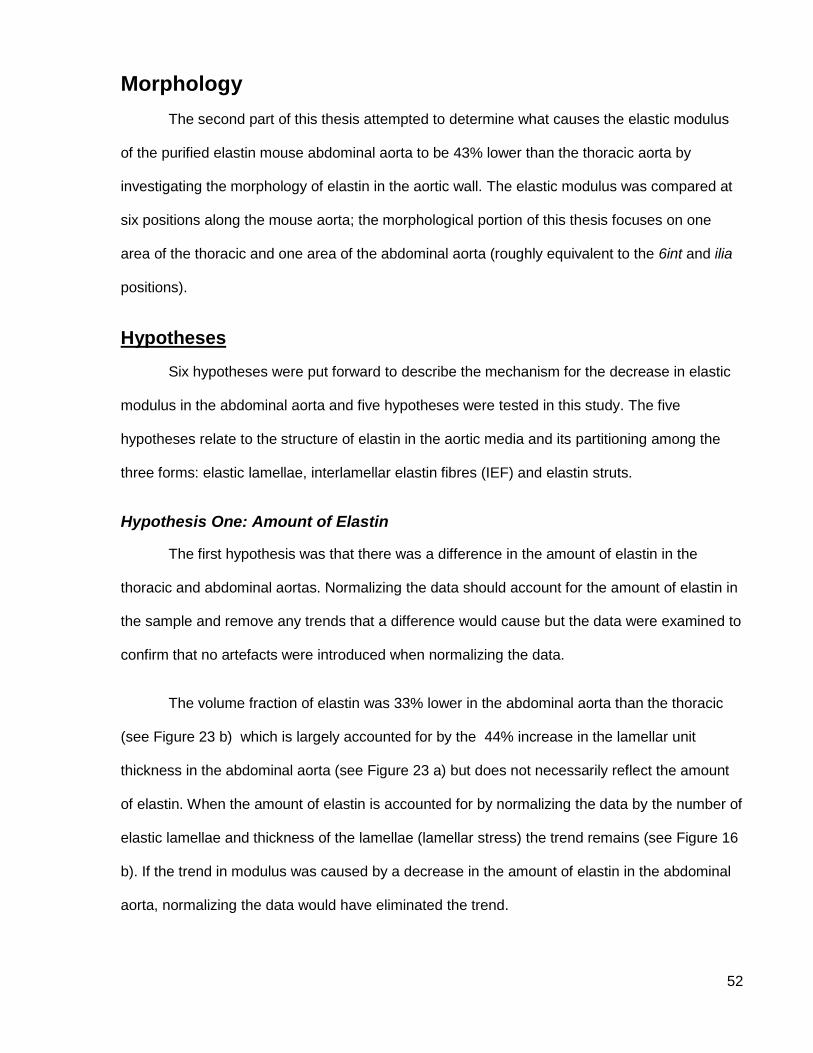
52
Morphology
The second part of this thesis attempted to determine what causes the elastic modulus
of the purified elastin mouse abdominal aorta to be 43% lower than the thoracic aorta by
investigating the morphology of elastin in the aortic wall. The elastic modulus was compared at
six positions along the mouse aorta; the morphological portion of this thesis focuses on one
area of the thoracic and one area of the abdominal aorta (roughly equivalent to the 6int and ilia
positions).
Hypotheses
Six hypotheses were put forward to describe the mechanism for the decrease in elastic
modulus in the abdominal aorta and five hypotheses were tested in this study. The five
hypotheses relate to the structure of elastin in the aortic media and its partitioning among the
three forms: elastic lamellae, interlamellar elastin fibres (IEF) and elastin struts.
Hypothesis One: Amount of Elastin
The first hypothesis was that there was a difference in the amount of elastin in the
thoracic and abdominal aortas. Normalizing the data should account for the amount of elastin in
the sample and remove any trends that a difference would cause but the data were examined to
confirm that no artefacts were introduced when normalizing the data.
The volume fraction of elastin was 33% lower in the abdominal aorta than the thoracic
(see Figure 23 b) which is largely accounted for by the 44% increase in the lamellar unit
thickness in the abdominal aorta (see Figure 23 a) but does not necessarily reflect the amount
of elastin. When the amount of elastin is accounted for by normalizing the data by the number of
elastic lamellae and thickness of the lamellae (lamellar stress) the trend remains (see Figure 16
b). If the trend in modulus was caused by a decrease in the amount of elastin in the abdominal
aorta, normalizing the data would have eliminated the trend.
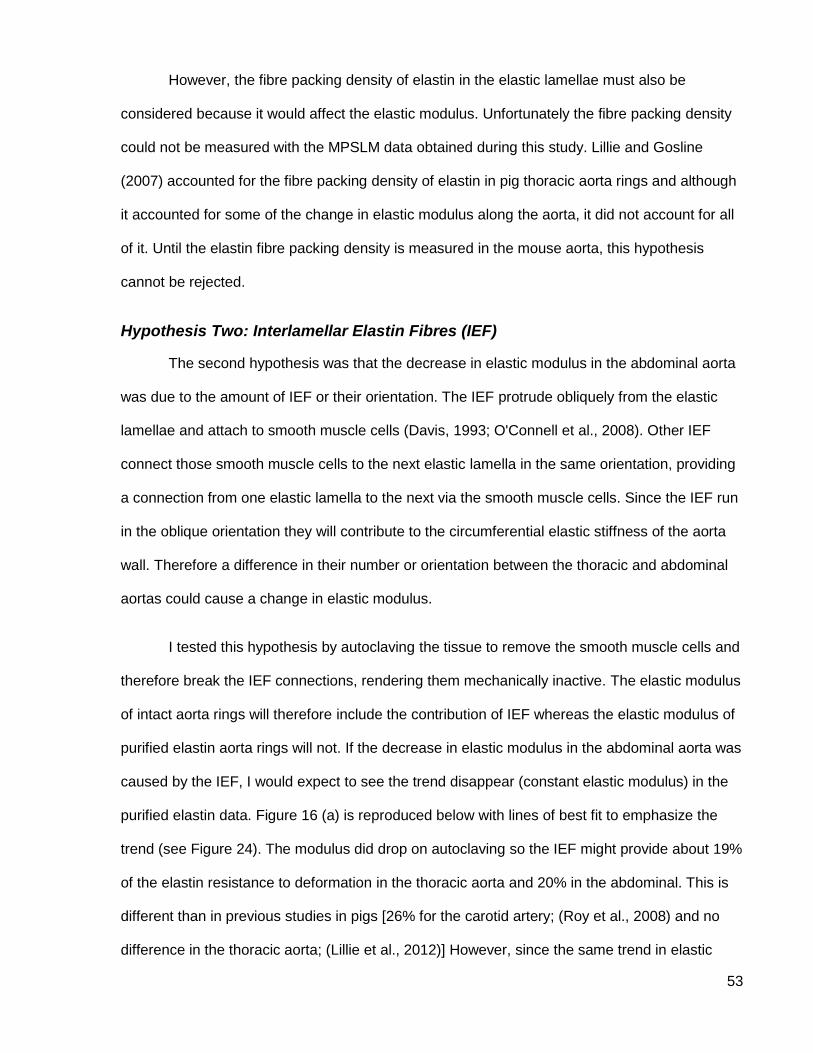
53
However, the fibre packing density of elastin in the elastic lamellae must also be
considered because it would affect the elastic modulus. Unfortunately the fibre packing density
could not be measured with the MPSLM data obtained during this study. Lillie and Gosline
(2007) accounted for the fibre packing density of elastin in pig thoracic aorta rings and although
it accounted for some of the change in elastic modulus along the aorta, it did not account for all
of it. Until the elastin fibre packing density is measured in the mouse aorta, this hypothesis
cannot be rejected.
Hypothesis Two: Interlamellar Elastin Fibres (IEF)
The second hypothesis was that the decrease in elastic modulus in the abdominal aorta
was due to the amount of IEF or their orientation. The IEF protrude obliquely from the elastic
lamellae and attach to smooth muscle cells (Davis, 1993; O'Connell et al., 2008). Other IEF
connect those smooth muscle cells to the next elastic lamella in the same orientation, providing
a connection from one elastic lamella to the next via the smooth muscle cells. Since the IEF run
in the oblique orientation they will contribute to the circumferential elastic stiffness of the aorta
wall. Therefore a difference in their number or orientation between the thoracic and abdominal
aortas could cause a change in elastic modulus.
I tested this hypothesis by autoclaving the tissue to remove the smooth muscle cells and
therefore break the IEF connections, rendering them mechanically inactive. The elastic modulus
of intact aorta rings will therefore include the contribution of IEF whereas the elastic modulus of
purified elastin aorta rings will not. If the decrease in elastic modulus in the abdominal aorta was
caused by the IEF, I would expect to see the trend disappear (constant elastic modulus) in the
purified elastin data. Figure 16 (a) is reproduced below with lines of best fit to emphasize the
trend (see Figure 24). The modulus did drop on autoclaving so the IEF might provide about 19%
of the elastin resistance to deformation in the thoracic aorta and 20% in the abdominal. This is
different than in previous studies in pigs [26% for the carotid artery; (Roy et al., 2008) and no
difference in the thoracic aorta; (Lillie et al., 2012)] However, since the same trend in elastic
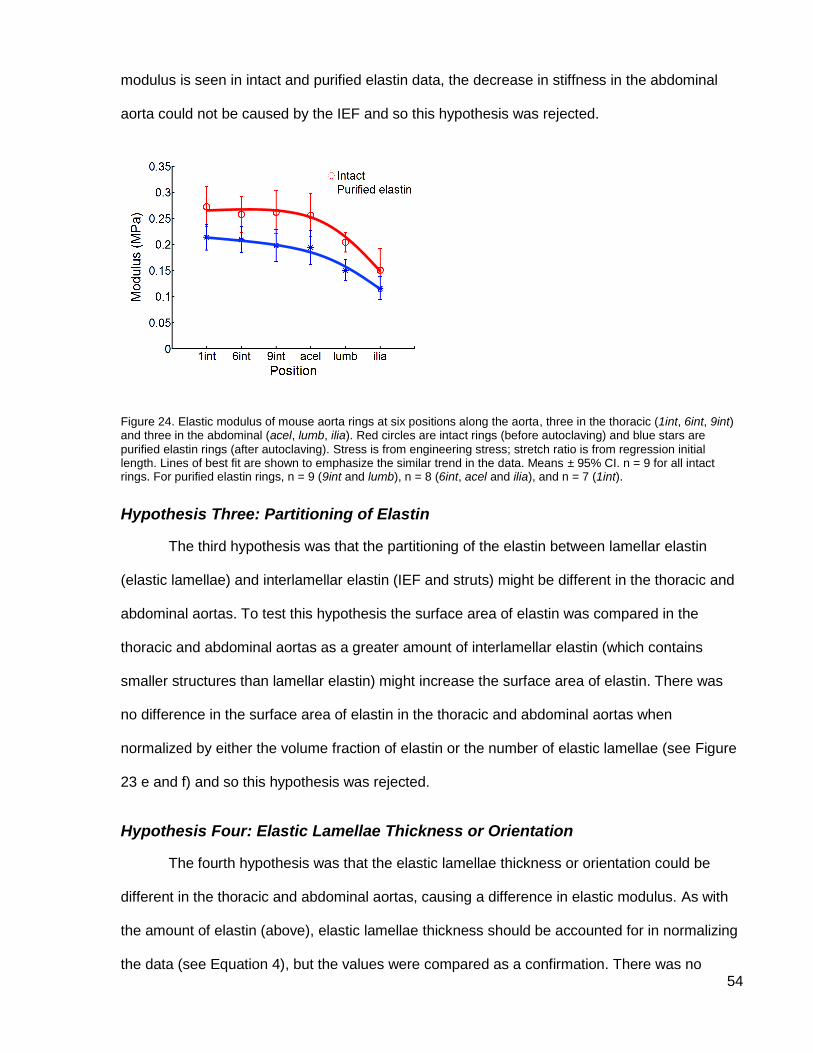
54
modulus is seen in intact and purified elastin data, the decrease in stiffness in the abdominal
aorta could not be caused by the IEF and so this hypothesis was rejected.
Figure 24. Elastic modulus of mouse aorta rings at six positions along the aorta, three in the thoracic (1int, 6int, 9int) and three in the abdominal (acel, lumb, ilia). Red circles are intact rings (before autoclaving) and blue stars are
purified elastin rings (after autoclaving). Stress is from engineering stress; stretch ratio is from regression initial length. Lines of best fit are shown to emphasize the similar trend in the data. Means ± 95% CI. n = 9 for all intact rings. For purified elastin rings, n = 9 (9int and lumb), n = 8 (6int, acel and ilia), and n = 7 (1int).
Hypothesis Three: Partitioning of Elastin
The third hypothesis was that the partitioning of the elastin between lamellar elastin
(elastic lamellae) and interlamellar elastin (IEF and struts) might be different in the thoracic and
abdominal aortas. To test this hypothesis the surface area of elastin was compared in the
thoracic and abdominal aortas as a greater amount of interlamellar elastin (which contains
smaller structures than lamellar elastin) might increase the surface area of elastin. There was
no difference in the surface area of elastin in the thoracic and abdominal aortas when
normalized by either the volume fraction of elastin or the number of elastic lamellae (see Figure
23 e and f) and so this hypothesis was rejected.
Hypothesis Four: Elastic Lamellae Thickness or Orientation
The fourth hypothesis was that the elastic lamellae thickness or orientation could be
different in the thoracic and abdominal aortas, causing a difference in elastic modulus. As with
the amount of elastin (above), elastic lamellae thickness should be accounted for in normalizing
the data (see Equation 4), but the values were compared as a confirmation. There was no
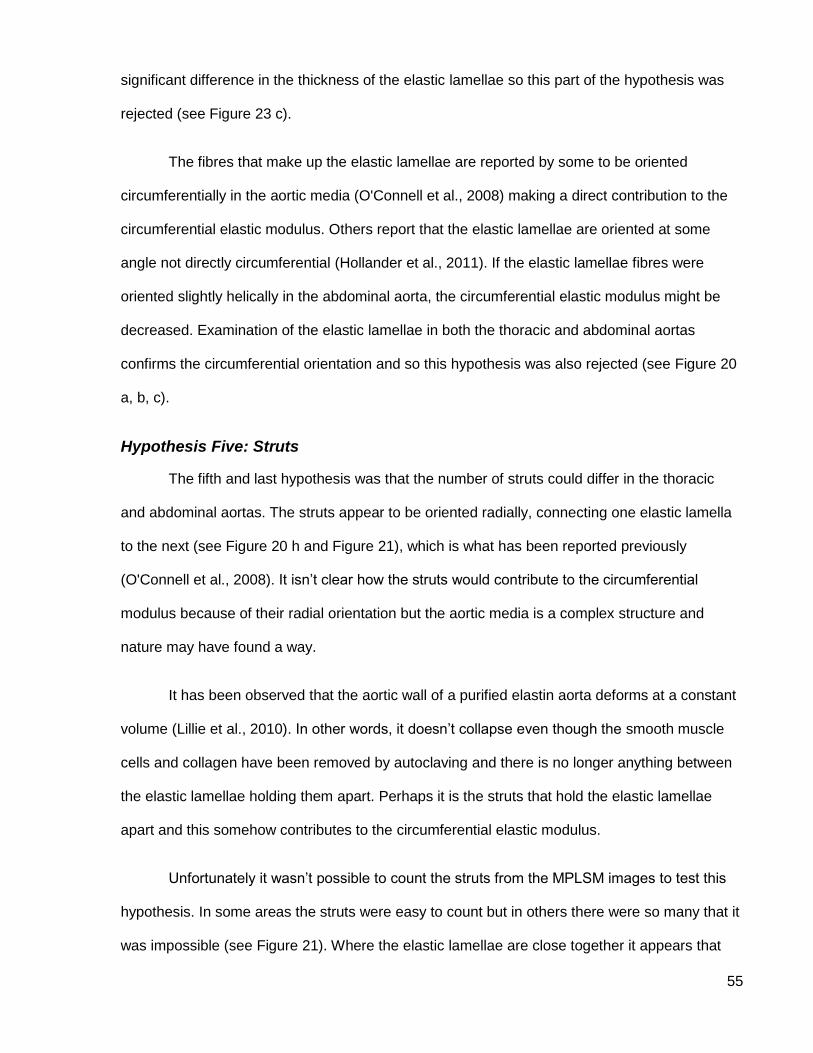
55
significant difference in the thickness of the elastic lamellae so this part of the hypothesis was
rejected (see Figure 23 c).
The fibres that make up the elastic lamellae are reported by some to be oriented
circumferentially in the aortic media (O'Connell et al., 2008) making a direct contribution to the
circumferential elastic modulus. Others report that the elastic lamellae are oriented at some
angle not directly circumferential (Hollander et al., 2011). If the elastic lamellae fibres were
oriented slightly helically in the abdominal aorta, the circumferential elastic modulus might be
decreased. Examination of the elastic lamellae in both the thoracic and abdominal aortas
confirms the circumferential orientation and so this hypothesis was also rejected (see Figure 20
a, b, c).
Hypothesis Five: Struts
The fifth and last hypothesis was that the number of struts could differ in the thoracic
and abdominal aortas. The struts appear to be oriented radially, connecting one elastic lamella
to the next (see Figure 20 h and Figure 21), which is what has been reported previously
(O'Connell et al., 2008). It isn’t clear how the struts would contribute to the circumferential
modulus because of their radial orientation but the aortic media is a complex structure and
nature may have found a way.
It has been observed that the aortic wall of a purified elastin aorta deforms at a constant
volume (Lillie et al., 2010). In other words, it doesn’t collapse even though the smooth muscle
cells and collagen have been removed by autoclaving and there is no longer anything between
the elastic lamellae holding them apart. Perhaps it is the struts that hold the elastic lamellae
apart and this somehow contributes to the circumferential elastic modulus.
Unfortunately it wasn’t possible to count the struts from the MPLSM images to test this
hypothesis. In some areas the struts were easy to count but in others there were so many that it
was impossible (see Figure 21). Where the elastic lamellae are close together it appears that
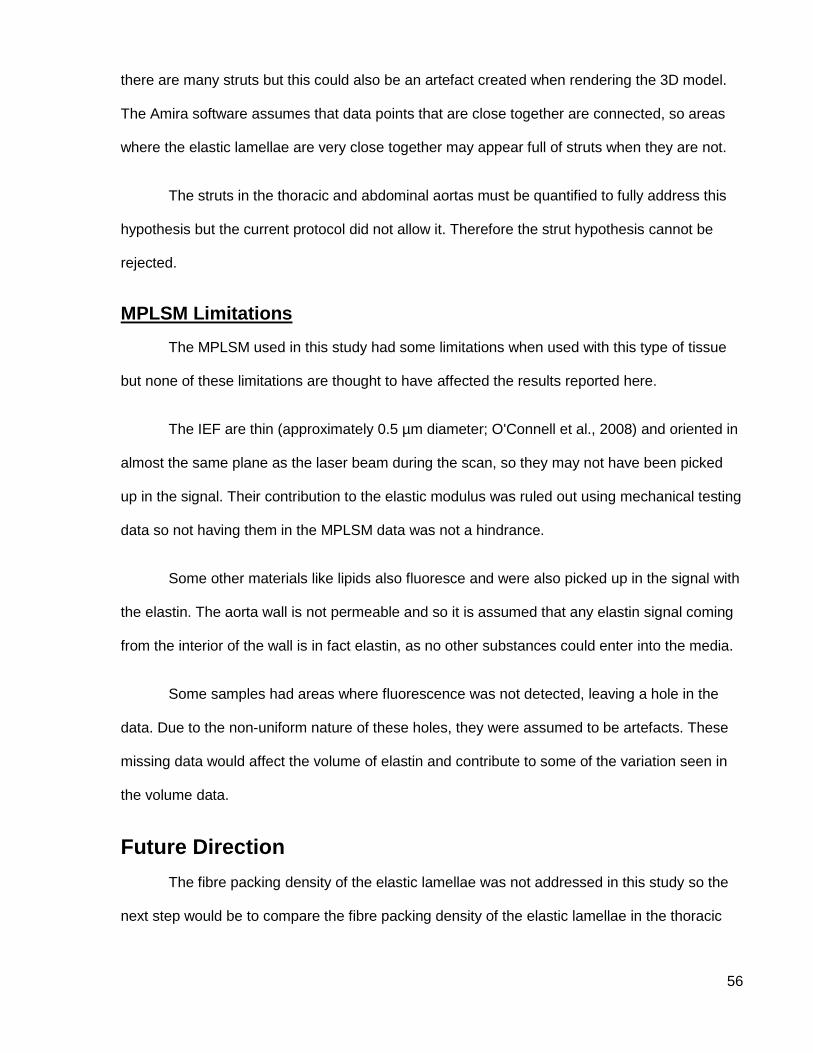
56
there are many struts but this could also be an artefact created when rendering the 3D model.
The Amira software assumes that data points that are close together are connected, so areas
where the elastic lamellae are very close together may appear full of struts when they are not.
The struts in the thoracic and abdominal aortas must be quantified to fully address this
hypothesis but the current protocol did not allow it. Therefore the strut hypothesis cannot be
rejected.
MPLSM Limitations
The MPLSM used in this study had some limitations when used with this type of tissue
but none of these limitations are thought to have affected the results reported here.
The IEF are thin (approximately 0.5 µm diameter; O'Connell et al., 2008) and oriented in
almost the same plane as the laser beam during the scan, so they may not have been picked
up in the signal. Their contribution to the elastic modulus was ruled out using mechanical testing
data so not having them in the MPLSM data was not a hindrance.
Some other materials like lipids also fluoresce and were also picked up in the signal with
the elastin. The aorta wall is not permeable and so it is assumed that any elastin signal coming
from the interior of the wall is in fact elastin, as no other substances could enter into the media.
Some samples had areas where fluorescence was not detected, leaving a hole in the
data. Due to the non-uniform nature of these holes, they were assumed to be artefacts. These
missing data would affect the volume of elastin and contribute to some of the variation seen in
the volume data.
Future Direction
The fibre packing density of the elastic lamellae was not addressed in this study so the
next step would be to compare the fibre packing density of the elastic lamellae in the thoracic
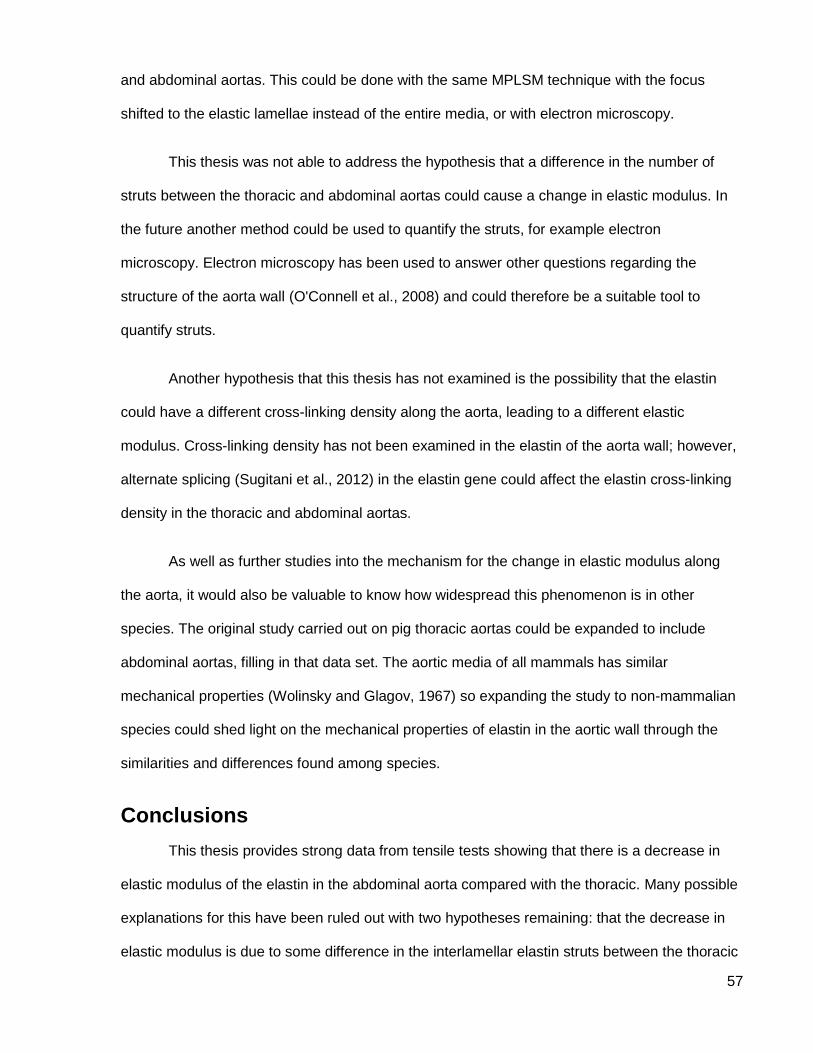
57
and abdominal aortas. This could be done with the same MPLSM technique with the focus
shifted to the elastic lamellae instead of the entire media, or with electron microscopy.
This thesis was not able to address the hypothesis that a difference in the number of
struts between the thoracic and abdominal aortas could cause a change in elastic modulus. In
the future another method could be used to quantify the struts, for example electron
microscopy. Electron microscopy has been used to answer other questions regarding the
structure of the aorta wall (O'Connell et al., 2008) and could therefore be a suitable tool to
quantify struts.
Another hypothesis that this thesis has not examined is the possibility that the elastin
could have a different cross-linking density along the aorta, leading to a different elastic
modulus. Cross-linking density has not been examined in the elastin of the aorta wall; however,
alternate splicing (Sugitani et al., 2012) in the elastin gene could affect the elastin cross-linking
density in the thoracic and abdominal aortas.
As well as further studies into the mechanism for the change in elastic modulus along
the aorta, it would also be valuable to know how widespread this phenomenon is in other
species. The original study carried out on pig thoracic aortas could be expanded to include
abdominal aortas, filling in that data set. The aortic media of all mammals has similar
mechanical properties (Wolinsky and Glagov, 1967) so expanding the study to non-mammalian
species could shed light on the mechanical properties of elastin in the aortic wall through the
similarities and differences found among species.
Conclusions
This thesis provides strong data from tensile tests showing that there is a decrease in
elastic modulus of the elastin in the abdominal aorta compared with the thoracic. Many possible
explanations for this have been ruled out with two hypotheses remaining: that the decrease in
elastic modulus is due to some difference in the interlamellar elastin struts between the thoracic
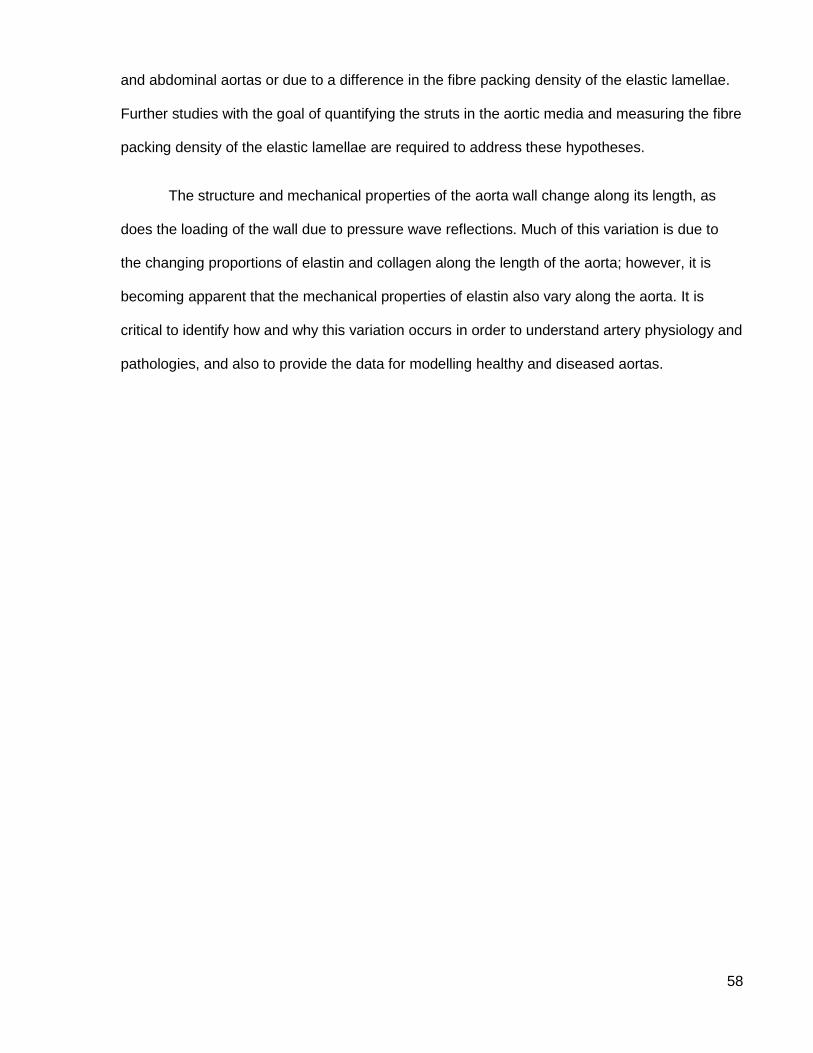
58
and abdominal aortas or due to a difference in the fibre packing density of the elastic lamellae.
Further studies with the goal of quantifying the struts in the aortic media and measuring the fibre
packing density of the elastic lamellae are required to address these hypotheses.
The structure and mechanical properties of the aorta wall change along its length, as
does the loading of the wall due to pressure wave reflections. Much of this variation is due to
the changing proportions of elastin and collagen along the length of the aorta; however, it is
becoming apparent that the mechanical properties of elastin also vary along the aorta. It is
critical to identify how and why this variation occurs in order to understand artery physiology and
pathologies, and also to provide the data for modelling healthy and diseased aortas.
59
References
Aaron, B. B. and Gosline, J. M. (1981). Elastin as a random-network elastomer: a mechanical and optical analysis of single elastin fibres. Biopolymers 20, 1247.
Aaron, B. B. and Gosline, J. M. (1980). Optical properties of single elastin fibres indicate random protein conformation. Nature 287, 865-867.
Attinger, E. O. (1964). Elements of theoretical hydrodynamics. In Pulsatile blood flow (ed. E. O. Attinger). New York:
McGraw-Hill.
Bergel, D. H. (1960). The visco-elastic properties of the arterial wall.
Boedtker, H. and Doty, P. (1956). The Native and Denatured States of Soluble Collagen. J. Am. Chem. Soc. 78,
4267.
Clark, J. and Glagov, S. (1985). Transmural organization of the arterial media. The lamellar unit revisited. Arterioscl. Thromb. Vas. 5, 19-34.
Cox, R. H. (1983). Comparison of arterial wall mechanics using ring and cylindrical segments. Am. J. Physiol. - Heart C. 244, H298-H303.
Davis, E. C. (1993). Smooth muscle cell to elastic lamina connections in developing mouse aorta. Role in aortic medial organization. Lab. Invest. 68, 89-99.
Dingemans, K. P., Teeling, P., Lagendijk, J. H. and Becker, A. E. (2000). Extracellular matrix of the human aortic media: an ultrastructural histochemical and immunohistochemical study of the adult aortic media. Anat. Rec. 258, 1-
14.
Dobrin, P. and Canfield, T. (1977). Identification of smooth muscle series elastic component in intact carotid artery. Am. J. Physiol. - Heart C. 232, H122-H130.
Fischer, G. M. and Llaurado, J. G. (1966). Collagen and elastin content in canine arteries selected from functionally different vascular beds. Circ. Res. 19, 394-399.
Fung, Y. (1993). Biomechanics: mechanical properties of living tissues. New York: Springer-Verlag.
Gundiah, N., B Ratcliffe, M. and A Pruitt, L. (2007). Determination of strain energy function for arterial elastin: Experiments using histology and mechanical tests. J. Biomech. 40, 586-594.
Guo, X., Kono, Y., Mattrey, R. and Kassab, G. S. (2002). Morphometry and strain distribution of the C57BL/6 mouse aorta. Am. J. Physiol. - Heart C. 283, H1829-H1837.
Guo, X. and Kassab, G. S. (2003). Variation of mechanical properties along the length of the aorta in C57bl/6 mice. Am. J. Physiol. - Heart C. 285, H2614-H2622.
Hales, S. (1733). Statistical essays: Containing haemastatics. London.
Harkness, M. L. R., Harkness, R. D. and McDonald, D. A. (1957). The collagen and elastin content of the arterial wall in the dog. P. Roy. Soc. Lond. B Bio.146, 541-551.
Harvey, W. (1628). The circulation of the blood and other writings. New York: Dutton.
Hollander, Y., Durban, D., Lu, X., Kassab, G. and Lanir, Y. (2011). Experimentally validated microstructural 3D constitutive model of coronary arterial media. J. Biomech. Eng. 133.
60
Huang, Y., Guo, X. and Kassab, G. S. (2006). Axial nonuniformity of geometric and mechanical properties of mouse aorta is increased during postnatal growth. Am. J. Physiol. - Heart C. 290, H657-H664.
Ker, R. F. (1981). Dynamic tensile properties of the plantaris tendon of sheep (Ovis aries). J. Exp. Biol. 93, 283-302.
Lillie, M. A., Chalmers, G. W. G. and Gosline, J. M. (1994). The effects of heating on the mechanical properties of arterial elastin. Connect. Tiss. Res. 31, 23-35.
Lillie, M. A., Armstrong, T. E., Gérard, S. G., Shadwick, R. E. and Gosline, J. M. (2012). Contribution of elastin and collagen to the inflation response of the pig thoracic aorta: Assessing elastin's role in mechanical homeostasis. J. Biomech. 45, 2133-2141.
Lillie, M. A., David, G. J. and Gosline, J. M. (1998). Mechanical Role of Elastin-Associated Microfibrils in Pig Aortic Elastic Tissue. Connect. Tiss. Res. 37, 121-141.
Lillie, M. A. and Gosline, J. M. (2007). Mechanical properties of elastin along the thoracic aorta in the pig. J. Biomech. 40, 2214-2221.
Lillie, M. A., Shadwick, R. E. and Gosline, J. M. (2010). Mechanical anisotropy of inflated elastic tissue from the pig aorta. J. Biomech. 43, 2070-2078.
Megens, R. T. A., Reitsma, S., Schiffers, P. H. M., Hilgers, R. H. P., De Mey, J. G. R., Slaaf, D. W., oude Egbrink, M. G. A. and van Zandvoort, M. A. M. J. (2007). Two-photon microscopy of vital murine elastic and muscular arteries. Combined structural and functional imaging with subcellular resolution. J. Vasc. Res. 44, 87-98.
National Institutes of Health. ImageJ 1.46r.
O'Connell, M. K., Murthy, S., Phan, S., Xu, C., Buchanan, J., Spilker, R., Dalman, R. L., Zarins, C. K., Denk, W. and Taylor, C. A. (2008). The three-dimensional micro- and nanostructure of the aortic medial lamellar unit measured using 3D confocal and electron microscopy imaging. Matrix Biol. 27, 171-181.
Partridge, S. M., Davis, H. F. and Adair, G. S. (1955). The chemistry of connective tissues. 2. Soluble proteins derived from partial hydrolysis of elastin. Biochem. J. 61, 11-21.
Roach, M. R. and Burton, A. C. (1957). The reason for the shape of the distensibility curves of arteries. Can. J. Biochem. Physiol. 35, 681-690.
Roy, S., Tsamis, A., Prod'hom, G. and Stergiopulos, N. (2008). On the in-series and in-parallel contribution of elastin assessed by a structure-based biomechanical model of the arterial wall. J. Biomech. 41, 737-743.
Shadwick, R. E. (1999). Mechanical design in arteries. J. Exp. Biol. 202, 3305-3313.
Shadwick, R. E. (1998). Elasticity in arteries: a similar combination of rubbery and stiff materials creates common mechanical properties in blood vessels of vertebrates and some invertebrates. Am. Sci. 86, pp. 535-541.
Song, S. H. and Roach, M. R. (1985). A morphological comparison of aortic elastin from five species as seen with the scanning electron microscope. Acta. Anat. 123, 45-50.
Sugitani, H., Hirano, E., Knutsen, R.H., Shifren, A., Wagenseil, J.E., Ciliberto, C., Kozel, B.A., Urban, Z., Davis, E.C., Broekelmann, T.J. and Mecham, R.P. (2012). Alternative splicing and tissue-specific elastin misassembly act
as biological modifiers of human elastin gene frameshift mutations associated with dominant cutis laxa. J. Biol. Chem. 287, pp. 22055-22067.
Taylor, M. G. (1964). Wave travel in arteries and the design of the cardiovascular system. In Pulsatile blood flow (ed. E. O. Attinger), pp. 343-372. New York: McGraw-Hill.
Wolinsky, H. and Glagov, S. (1964). Structural basis for the static mechanical properties of the aortic media. Circ. Res. 14, 400-413.
61
Wolinsky, H. and Glagov, S. (1967). A lamellar unit of aortic medial structure and function in mammals. Circ. Res. 20, 99-111.
Zipfel, W. R., Williams, R. M. and Webb, W. W. (2003). Nonlinear magic: multiphoton microscopy in the biosciences. Nat. Biotechnol. 21, 1369-1377.
Zou, Y. and Zhang, Y. (2009). An experimental and theoretical study on the anisotropy of elastin network. Ann. Biomed. Eng. 37, 1572-1583.
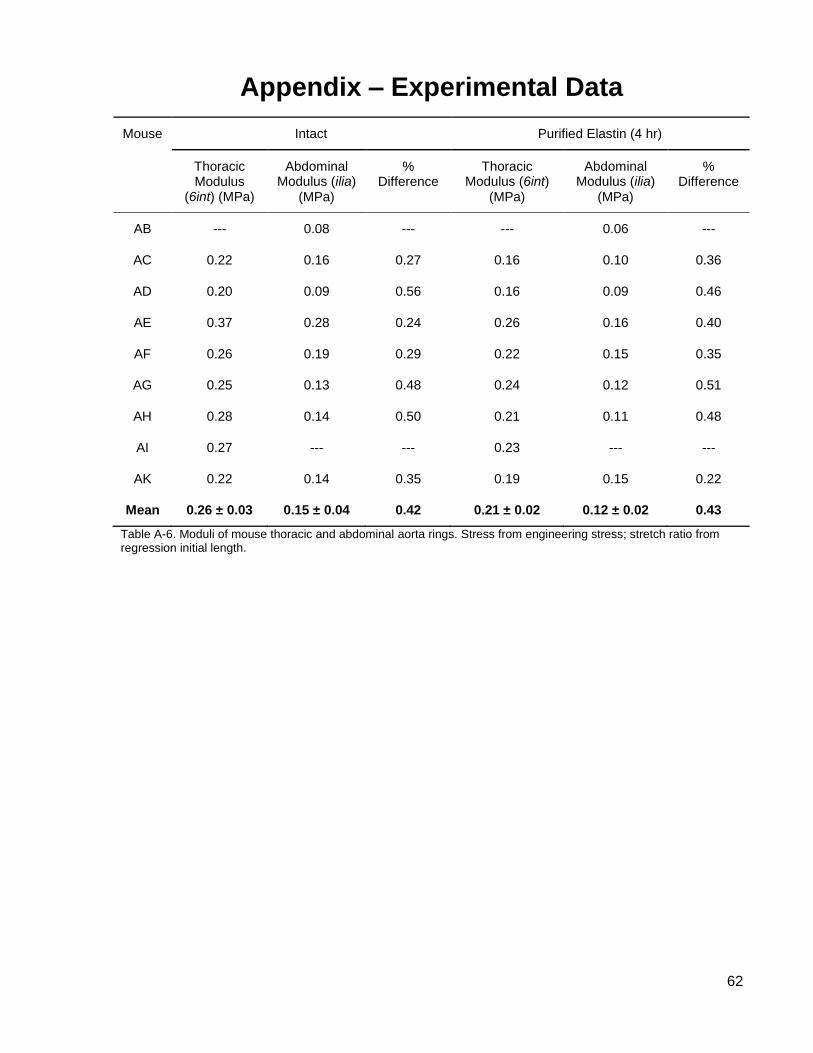
62
Appendix – Experimental Data
Mouse Intact Purified Elastin (4 hr)
Thoracic Modulus
(6int) (MPa)
Abdominal Modulus (ilia)
(MPa)
% Difference
Thoracic Modulus (6int)
(MPa)
Abdominal Modulus (ilia)
(MPa)
% Difference
AB --- 0.08 --- --- 0.06 ---
AC 0.22 0.16 0.27 0.16 0.10 0.36
AD 0.20 0.09 0.56 0.16 0.09 0.46
AE 0.37 0.28 0.24 0.26 0.16 0.40
AF 0.26 0.19 0.29 0.22 0.15 0.35
AG 0.25 0.13 0.48 0.24 0.12 0.51
AH 0.28 0.14 0.50 0.21 0.11 0.48
AI 0.27 --- --- 0.23 --- ---
AK 0.22 0.14 0.35 0.19 0.15 0.22
Mean 0.26 ± 0.03 0.15 ± 0.04 0.42 0.21 ± 0.02 0.12 ± 0.02 0.43
Table A-6. Moduli of mouse thoracic and abdominal aorta rings. Stress from engineering stress; stretch ratio from regression initial length.
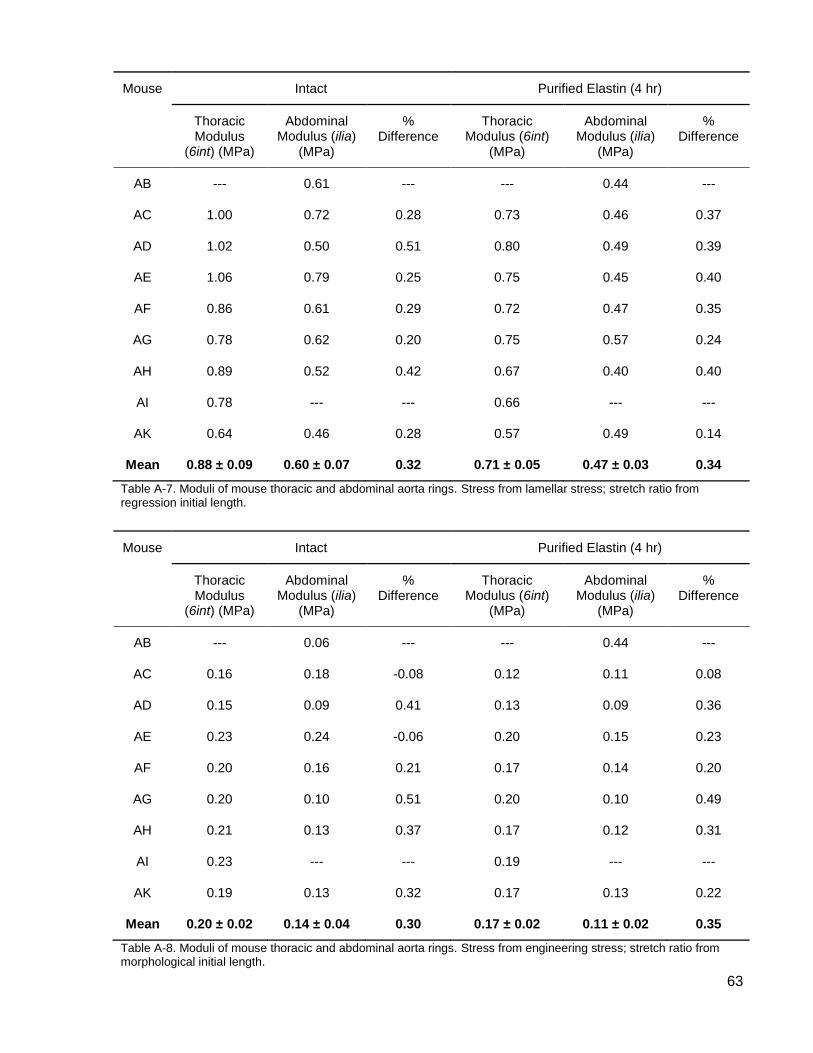
63
Mouse Intact Purified Elastin (4 hr)
Thoracic Modulus
(6int) (MPa)
Abdominal Modulus (ilia)
(MPa)
% Difference
Thoracic Modulus (6int)
(MPa)
Abdominal Modulus (ilia)
(MPa)
% Difference
AB --- 0.61 --- --- 0.44 ---
AC 1.00 0.72 0.28 0.73 0.46 0.37
AD 1.02 0.50 0.51 0.80 0.49 0.39
AE 1.06 0.79 0.25 0.75 0.45 0.40
AF 0.86 0.61 0.29 0.72 0.47 0.35
AG 0.78 0.62 0.20 0.75 0.57 0.24
AH 0.89 0.52 0.42 0.67 0.40 0.40
AI 0.78 --- --- 0.66 --- ---
AK 0.64 0.46 0.28 0.57 0.49 0.14
Mean 0.88 ± 0.09 0.60 ± 0.07 0.32 0.71 ± 0.05 0.47 ± 0.03 0.34
Table A-7. Moduli of mouse thoracic and abdominal aorta rings. Stress from lamellar stress; stretch ratio from regression initial length.
Mouse Intact Purified Elastin (4 hr)
Thoracic Modulus
(6int) (MPa)
Abdominal Modulus (ilia)
(MPa)
% Difference
Thoracic Modulus (6int)
(MPa)
Abdominal Modulus (ilia)
(MPa)
% Difference
AB --- 0.06 --- --- 0.44 ---
AC 0.16 0.18 -0.08 0.12 0.11 0.08
AD 0.15 0.09 0.41 0.13 0.09 0.36
AE 0.23 0.24 -0.06 0.20 0.15 0.23
AF 0.20 0.16 0.21 0.17 0.14 0.20
AG 0.20 0.10 0.51 0.20 0.10 0.49
AH 0.21 0.13 0.37 0.17 0.12 0.31
AI 0.23 --- --- 0.19 --- ---
AK 0.19 0.13 0.32 0.17 0.13 0.22
Mean 0.20 ± 0.02 0.14 ± 0.04 0.30 0.17 ± 0.02 0.11 ± 0.02 0.35
Table A-8. Moduli of mouse thoracic and abdominal aorta rings. Stress from engineering stress; stretch ratio from morphological initial length.
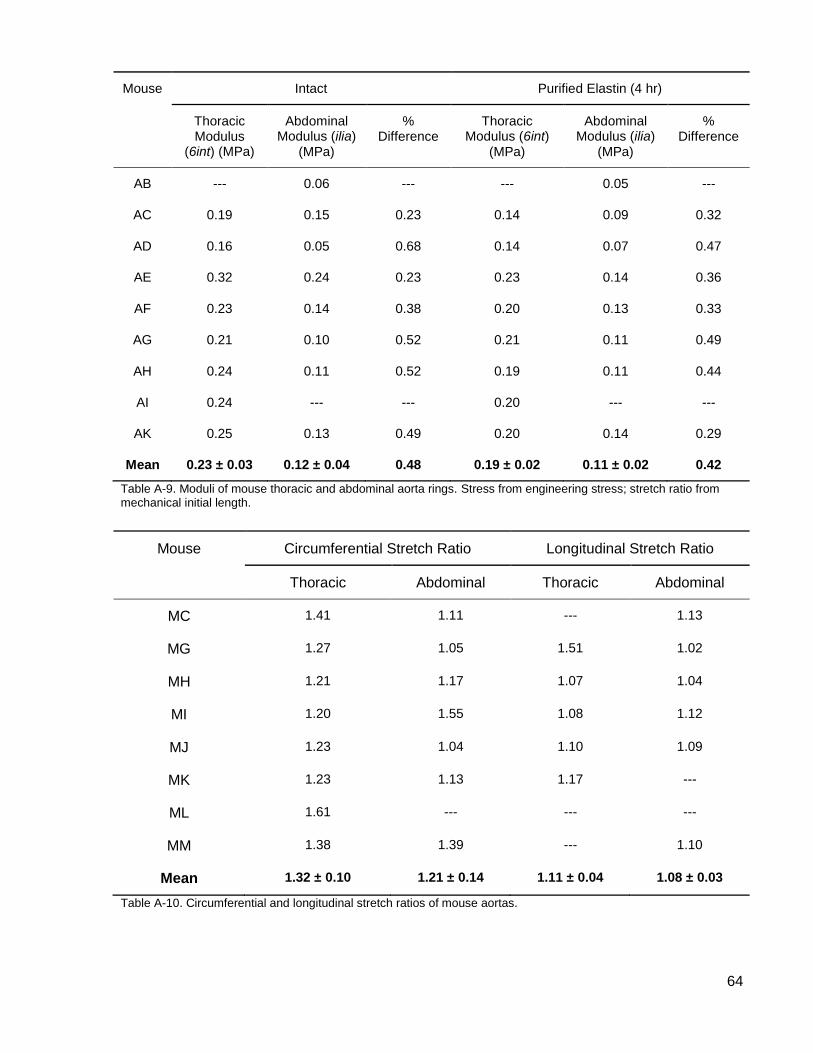
64
Mouse Intact Purified Elastin (4 hr)
Thoracic Modulus
(6int) (MPa)
Abdominal Modulus (ilia)
(MPa)
% Difference
Thoracic Modulus (6int)
(MPa)
Abdominal Modulus (ilia)
(MPa)
% Difference
AB --- 0.06 --- --- 0.05 ---
AC 0.19 0.15 0.23 0.14 0.09 0.32
AD 0.16 0.05 0.68 0.14 0.07 0.47
AE 0.32 0.24 0.23 0.23 0.14 0.36
AF 0.23 0.14 0.38 0.20 0.13 0.33
AG 0.21 0.10 0.52 0.21 0.11 0.49
AH 0.24 0.11 0.52 0.19 0.11 0.44
AI 0.24 --- --- 0.20 --- ---
AK 0.25 0.13 0.49 0.20 0.14 0.29
Mean 0.23 ± 0.03 0.12 ± 0.04 0.48 0.19 ± 0.02 0.11 ± 0.02 0.42
Table A-9. Moduli of mouse thoracic and abdominal aorta rings. Stress from engineering stress; stretch ratio from mechanical initial length.
Mouse Circumferential Stretch Ratio Longitudinal Stretch Ratio
Thoracic Abdominal Thoracic Abdominal
MC 1.41 1.11 --- 1.13
MG 1.27 1.05 1.51 1.02
MH 1.21 1.17 1.07 1.04
MI 1.20 1.55 1.08 1.12
MJ 1.23 1.04 1.10 1.09
MK 1.23 1.13 1.17 ---
ML 1.61 --- --- ---
MM 1.38 1.39 --- 1.10
Mean 1.32 ± 0.10 1.21 ± 0.14 1.11 ± 0.04 1.08 ± 0.03
Table A-10. Circumferential and longitudinal stretch ratios of mouse aortas.
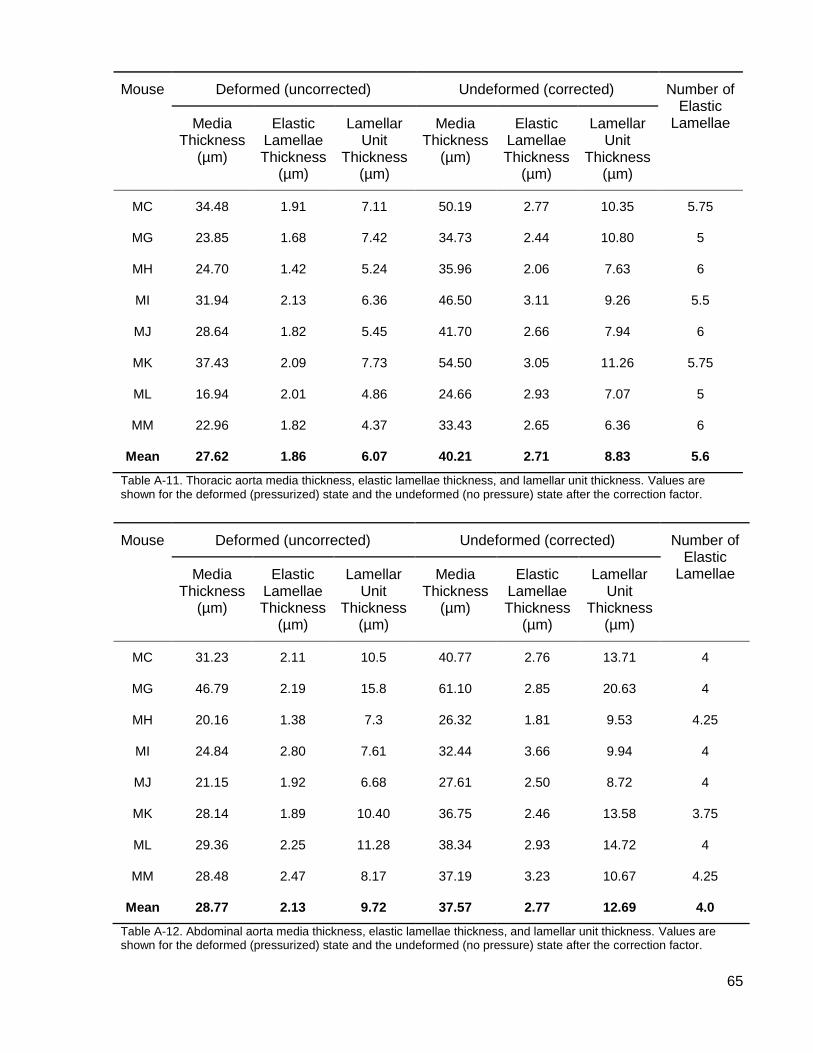
65
Mouse Deformed (uncorrected) Undeformed (corrected) Number of Elastic
Lamellae Media Thickness
(µm)
Elastic Lamellae Thickness
(µm)
Lamellar Unit
Thickness (µm)
Media Thickness
(µm)
Elastic Lamellae Thickness
(µm)
Lamellar Unit
Thickness (µm)
MC 34.48 1.91 7.11 50.19 2.77 10.35 5.75
MG 23.85 1.68 7.42 34.73 2.44 10.80 5
MH 24.70 1.42 5.24 35.96 2.06 7.63 6
MI 31.94 2.13 6.36 46.50 3.11 9.26 5.5
MJ 28.64 1.82 5.45 41.70 2.66 7.94 6
MK 37.43 2.09 7.73 54.50 3.05 11.26 5.75
ML 16.94 2.01 4.86 24.66 2.93 7.07 5
MM 22.96 1.82 4.37 33.43 2.65 6.36 6
Mean 27.62 1.86 6.07 40.21 2.71 8.83 5.6
Table A-11. Thoracic aorta media thickness, elastic lamellae thickness, and lamellar unit thickness. Values are shown for the deformed (pressurized) state and the undeformed (no pressure) state after the correction factor.
Mouse Deformed (uncorrected) Undeformed (corrected) Number of Elastic
Lamellae Media Thickness
(µm)
Elastic Lamellae Thickness
(µm)
Lamellar Unit
Thickness (µm)
Media Thickness
(µm)
Elastic Lamellae Thickness
(µm)
Lamellar Unit
Thickness (µm)
MC 31.23 2.11 10.5 40.77 2.76 13.71 4
MG 46.79 2.19 15.8 61.10 2.85 20.63 4
MH 20.16 1.38 7.3 26.32 1.81 9.53 4.25
MI 24.84 2.80 7.61 32.44 3.66 9.94 4
MJ 21.15 1.92 6.68 27.61 2.50 8.72 4
MK 28.14 1.89 10.40 36.75 2.46 13.58 3.75
ML 29.36 2.25 11.28 38.34 2.93 14.72 4
MM 28.48 2.47 8.17 37.19 3.23 10.67 4.25
Mean 28.77 2.13 9.72 37.57 2.77 12.69 4.0
Table A-12. Abdominal aorta media thickness, elastic lamellae thickness, and lamellar unit thickness. Values are shown for the deformed (pressurized) state and the undeformed (no pressure) state after the correction factor.
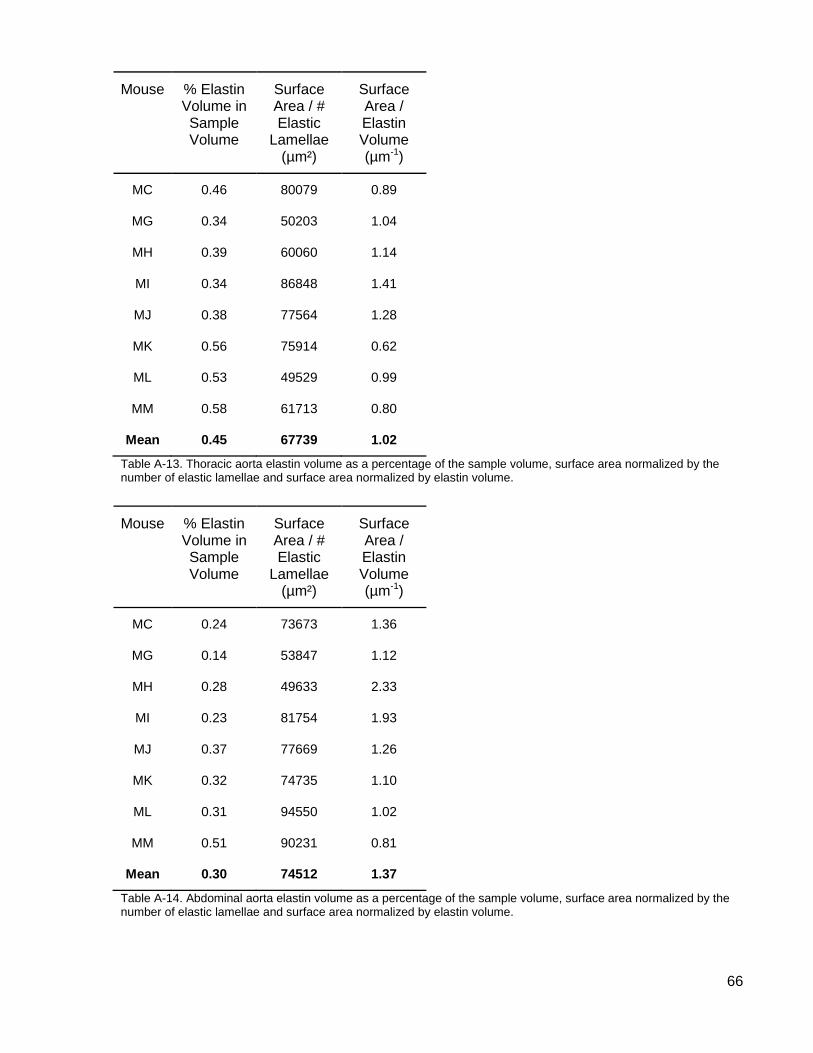
66
Mouse % Elastin Volume in Sample Volume
Surface Area / # Elastic
Lamellae (µm²)
Surface Area / Elastin Volume (µm-1)
MC 0.46 80079 0.89
MG 0.34 50203 1.04
MH 0.39 60060 1.14
MI 0.34 86848 1.41
MJ 0.38 77564 1.28
MK 0.56 75914 0.62
ML 0.53 49529 0.99
MM 0.58 61713 0.80
Mean 0.45 67739 1.02
Table A-13. Thoracic aorta elastin volume as a percentage of the sample volume, surface area normalized by the number of elastic lamellae and surface area normalized by elastin volume.
Mouse % Elastin Volume in Sample Volume
Surface Area / # Elastic
Lamellae (µm²)
Surface Area / Elastin Volume (µm-1)
MC 0.24 73673 1.36
MG 0.14 53847 1.12
MH 0.28 49633 2.33
MI 0.23 81754 1.93
MJ 0.37 77669 1.26
MK 0.32 74735 1.10
ML 0.31 94550 1.02
MM 0.51 90231 0.81
Mean 0.30 74512 1.37
Table A-14. Abdominal aorta elastin volume as a percentage of the sample volume, surface area normalized by the number of elastic lamellae and surface area normalized by elastin volume.