statistical diary - national institute of educational
TRANSCRIPT
UNION TERRITORY OF
DAMAN AND DIU
STATISTICAL DIARY
(2011-12)
DEPARTMENT OF PLANNING AND STATISTICS U.T. ADMINISTRATION OF DAMAN AND DIU
SECRETARIAT, DAMAN.
ii
FOREWORD
Information technology has enhanced the capacity of
Statistical data and various results of survey and studies
carried out. With this motive, the Department of Planning
and Statistics, which is a nodal agency for all statistical
activities in UT of Daman and Diu has published Statistical
Diary : 2011-12. This publication serves as a measuring rod
of various programmes and focus on socio-economic
development of Daman and Diu.
I am sure that this Diary will be very useful for
planners, researchers, general public, data users and will serve
as a handy reference booklet on almost all aspects.
The work done by the Department of Planning and
Statistics, in preparation of this Diary is appreciable.
( Gyanesh Bharti)
Finance Secretary & Secretary (Planning & Statistics )
iii
P R E F A C E
The Department of Planning and Statistics has been bringing out Statistical Diary of U.T. of Daman and Diu every year. This is the 23rd
It is hoped that this publication will be useful for Government Officers and employees, planners, policy makers, researchers and various agencies and will serve the purpose of a reference book of basic statistics about U.T. of Daman and Diu.
edition of ‘Statistical Diary : 2011-12’ of this U.T. The main object of this Diary is to present up-to-date statistical data on various socio-economic aspects of the U.T. of Daman and Diu. It contains various kinds of Statistics such as Administrative Statistics, Population Statistics, Socio Economic Statistics, Developmental Statistics, Financial Statistics etc, pertaining to the financial year 2011-12.
I am grateful to all concerned Government / Semi –Government Offices of Administration of Daman and Diu as well as Central Government, local bodies and other Organizations for their cooperation in providing requisite information for incorporation in the publication.
I express sincere thanks to our Secretary ( Planning & Statistics ), for his valuable guidance for preparation of this Diary.
I appreciate the work done by Research Assistant of Department of Planning and Statistics regarding co-ordination and supervision over preparation of this Diary.
The collection of data, compilation and data entry has been done by a Statistical Investigator of this Department. I acknowledge and appreciate her efforts rendered in bringing out the works presented in the Diary.
I am also thankful to all Staff of Department of Planning & Statistics, as well as Government Printing Press, Daman who were involved in preparation of this Diary.
The Department is constantly endeavouring to improve the quality of the publication. Any suggestions for further improvement in the content of this Diary would be most welcome for our future issues.
Date : 24 /09/2012 ( Dr. S. D. Bhardwaj )
Deputy Director Deptt. of Planning & Statistics,
Administration of Daman and Diu
iv
I N D E X
Sl. No.
PARTICULARS PAGE
No.
1. MAPS OF DAMAN AND DIU
1.1 Location Map of U.T. of Daman and Diu ( i ) 1.2 Map of Daman District ( ii ) 1.3 Map of Diu District ( iii )
(A) 2. GENERAL INFORMATION
2.1 Location 1 2.2 History 1 2.3 Geography 4 2.4 Climate 5 2.5 Administrative Set Up 6 2.6 Political Structure 8
(B) POPULATION STATISTICS
3. Area and Population
3.1 Area 9 3.2 Population 9 3.3 Population Trend 9 3.4 Population Characteristics 9 3.5 Population of Special Categories 10 3.6 Castewise Population of SC & ST 11
4. Houses and Households
4.1 Number of Census Houses 12 4.2 Uses of Census Houses 12 4.3 Households with Amenities 13
5. Population Distribution
5.1 Village Wise Population 14 5.2 Ward Wise Population 15 5.3 Areawise Population by Religion 16 5.4 Districtwise Population by Religion 16 5.5 Population by Language 17 5.6 Population in Five Years Age Groups 18
v
(b)
Sl. No. PARTICULARS PAGE No.
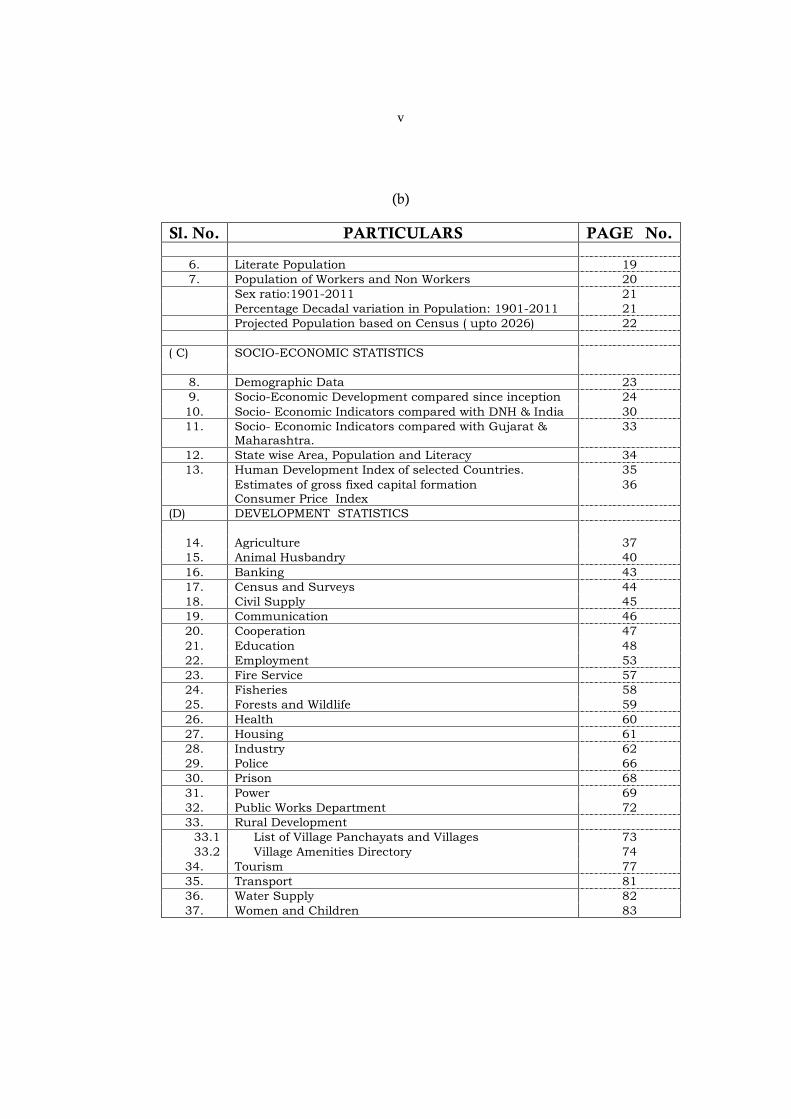
6. Literate Population 19 7. Population of Workers and Non Workers 20 Sex ratio:1901-2011 21 Percentage Decadal variation in Population: 1901-2011 21 Projected Population based on Census ( upto 2026) 22
( C) SOCIO-ECONOMIC STATISTICS
8. Demographic Data 23 9. Socio-Economic Development compared since inception 24 10. Socio- Economic Indicators compared with DNH & India 30 11. Socio- Economic Indicators compared with Gujarat &
Maharashtra. 33
12. State wise Area, Population and Literacy 34 13. Human Development Index of selected Countries. 35
Estimates of gross fixed capital formation Consumer Price Index
36
(D) DEVELOPMENT STATISTICS
14. Agriculture 37 15. Animal Husbandry 40 16. Banking 43 17. Census and Surveys 44 18. Civil Supply 45 19. Communication 46 20. Cooperation 47 21. Education 48 22. Employment 53 23. Fire Service 57 24. Fisheries 58 25. Forests and Wildlife 59 26. Health 60 27. Housing 61 28. Industry 62 29. Police 66 30. Prison 68 31. Power 69 32. Public Works Department 72 33. Rural Development
33.1 List of Village Panchayats and Villages 73 33.2 Village Amenities Directory 74
34. Tourism 77 35. Transport 81 36. Water Supply 82 37. Women and Children 83
vi
(c )
Sl. No.
PARTICULARS PAGE
No.
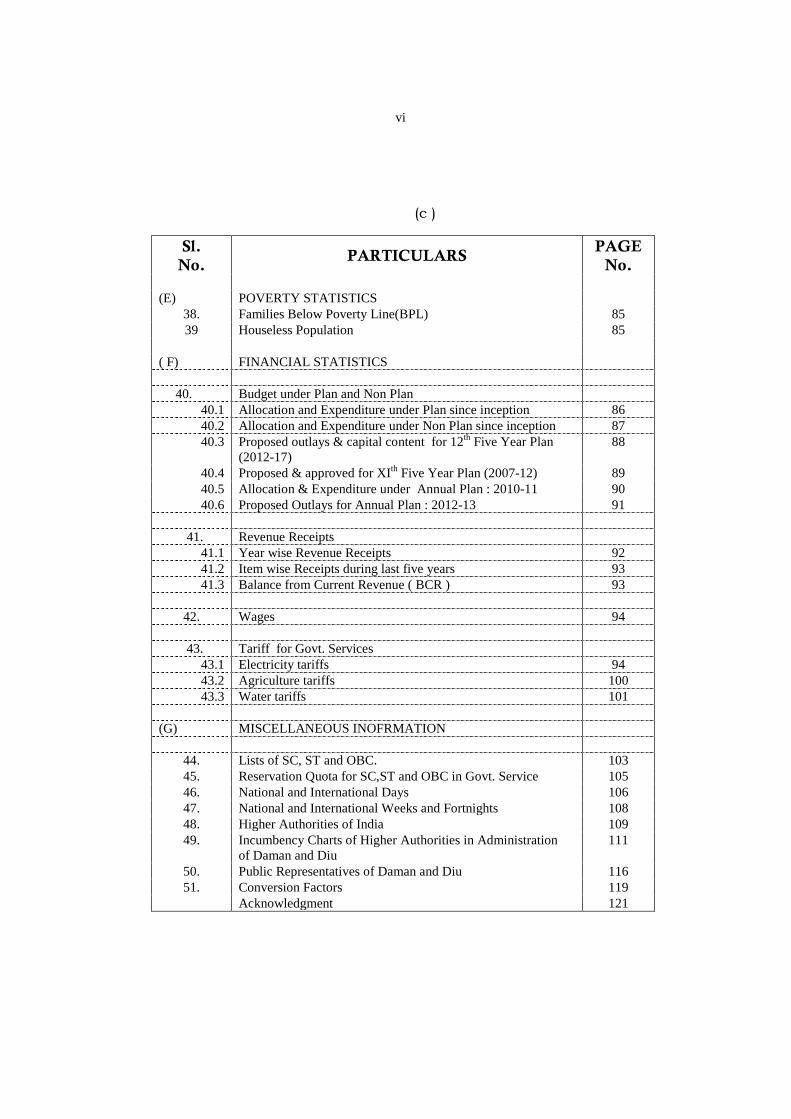
(E) POVERTY STATISTICS 38. Families Below Poverty Line(BPL) 85 39 Houseless Population 85
( F) FINANCIAL STATISTICS
40. Budget under Plan and Non Plan
40.1 Allocation and Expenditure under Plan since inception 86 40.2 Allocation and Expenditure under Non Plan since inception 87 40.3 Proposed outlays & capital content for 12th 88 Five Year Plan
(2012-17) 40.4 Proposed & approved for XIth 89 Five Year Plan (2007-12) 40.5 Allocation & Expenditure under Annual Plan : 2010-11 90 40.6 Proposed Outlays for Annual Plan : 2012-13 91
41. Revenue Receipts
41.1 Year wise Revenue Receipts 92 41.2 Item wise Receipts during last five years 93 41.3 Balance from Current Revenue ( BCR ) 93
42. Wages 94
43. Tariff for Govt. Services
43.1 Electricity tariffs 94 43.2 Agriculture tariffs 100 43.3 Water tariffs 101
(G) MISCELLANEOUS INOFRMATION
44. Lists of SC, ST and OBC. 103 45. Reservation Quota for SC,ST and OBC in Govt. Service 105 46. National and International Days 106 47. National and International Weeks and Fortnights 108 48. Higher Authorities of India 109 49. Incumbency Charts of Higher Authorities in Administration
of Daman and Diu 111
50. Public Representatives of Daman and Diu 116 51. Conversion Factors 119
Acknowledgment 121
1
2. GENERAL INFORMATION
2.1
LOCATION
U.T. of Daman and Diu comprises two districts namely Daman and Diu.
Both Districts are situated on western coast of India at a distance of about 700 kms.
Daman is the head Quarter of this U.T.
Daman is on main land near southern portion of Gujarat State. Vapi is the
nearest Railway Station ( 13 kms) which is on Western Railway between Mumbai and
Surat. Vapi is 167 kms from Mumbai Central and 95 kms from Surat.
Diu is an island near Una of Junagarh District in Gujarat State. Nearest
Railway Station is Delwada at the distance of 9 kms from Diu. But important trains
are linked with Veraval which is 90 kms from Diu. A portion of Diu District is on
main land which is named as Ghoghla. A small part of Diu known as Simar is
situated in Gujarat at a distance of 25 kms from Diu.
2. 2 After Liberation on 19
HISTORY th December, 1961 from Portuguese Rule of more than
four centuries, Daman and Diu became a part of the U.T. of Goa, Daman and Diu
under Government of India. After delinking of Goa, which attained statehood, U.T.
of Daman and Diu came into existence on 30th
Brief history of Daman and Diu Districts are furnished below as per District
Census Hand Book of Census of India, 1981.
May, 1987.
2
DAMAN DISTRICT
The District of Daman is known to have formed part of the country known
as Lata which was one the seven divisions of the Aparant or Konkan Vishaya,
between 2
:
nd Century B.C. to 13th Century A.D. The Daman District is included in the
intervening region and therefore must have formed part of the Mauryan empire at
least at the time of Ashoka. After the Mauryan power was weakened, the district was
under the rule of Satkarni I, the Satavahana ruler in the end of 2nd Century B.C.
After that during the 1st
After the rule of Abhir kings, the district was under the rule of Traikutakas
during the 5
Century A.D. the District of Daman seemed to have been
ruled by Kshaharatas who were the provincial governors i.e Kshatrapas under the
Kushana emperors. During A.D. 125, Satkarni drove away the Kshaharatas and ruled
the districts. But the Satavahana rule was shortlived. The Kshaharatas of Ujjain re-
conquered the district by about A.D 150 from the Satavahana ruler Satakarni and
Daman District again passed under the rule of Kshaharatas of Ujjain till A.D. 249.
After the Kshatrapas, the district was ruled by the Abhir Kings till A.D. 416.
th
Century A.D. who were the feudatories of the Abhiras. By A.D. 500,
the Traikutaka power seems to have been destroyed by the Vakataka king Harishena.
The District then was under the power of the Kalachuris of Mahishmati King
Krishnaraja and his successors till A.D. 609. King Mangales of Chalukyas of Badami
routed out the last king Budharaja of Kalachuris by about A.D. 609. The Chalukyas
of Badami ruled the district till A.D. 671 and their descendants known as Lata or
Navasari Chalukyas ruled from Navasarika, modern Navasari, on the bank of the
river Purna to the north of Daman. They ruled independently as feudatories of the
Badami Chalukyas of the Deccan. In the next eight centuries, Daman came under the
control of a large number of Hindu kings and chieftains.
3
Madmud Shah Begada, Sultan of Gujarat, seems to have conquered fort
Parnera on the river Par and port of Daman and levied tribute from Jagatshah in
1465. Naranshah who succeeded Jagatshah ruled from A.D. 1470 to 1500 and
Dharmshah II from 1500 to 1531.
Daman was acquired by the Portuguese from the Shah of Gujarat. They
noticed the port of Daman for the first time in 1523. They attacked it several times
and finally obtained it in 1559 by means of a treaty with the Shah. Thereafter, it was
under the rule of Portuguese till its liberation in 1961.
DIU DISTIRCT
The documented history of the District of Diu begins with the Maurya rule
(c.322-220 B.C). Emperor Chandragupta Maurya had extended his supremacy over
Saurashtra and had appointed Pushagupta as Governor of the province of Saurashtra
with the Head-quarters in village Girnar near Junagadh. Yavanaraj Tushappa ruled
over Saurashtra as Governor of Emperor Ashoka (c.273-237 B.C.). Emperor Ashoka
had sent Yavana Thero named Dhammarakhito as evangelist to the western sea
board including Diu. His grandson Samprati (c.229-220 B.C.) seems to have ruled
over Saurashtra from Ujjain. He propagated Jainism and erected many Jain Temples.
The Jain traditions from Diu seems to belong to this period.
:
The District seems to be under the rule of Indo-Greek kings Eukratides
(c.171-150 B.C. ), Meanandar (c.115 to 90 B.C.) and Appollodotes II of the 1st
Century B.C. No historical information is available for the period of 150 years from
the 1st Century B.C. to about A.D. 50. During the A.D. 1st
Century , the district
seems to have been ruled by Kshaharatas who had established their rule over western
part of India including Saurashtra. For more than the next thousand years, Diu
formed part of the kingdoms of dynasties that ruled over the western India including
4
Gujarat. The last king of the Vaja dynasty ruler of Somnath Patan ruled over Diu in
the first decade of the fifteenth century. Thereafter, Diu came under the control of the
Muslims Sultans of Gujarat who seem to have ruled Diu for the next one and a half
centuries.
Early in 1535, the Portuguese Governor De Cunha had led his expedition for
the capture of the town in Diu, but was defeated by the Sultan. However, around that
period, the Gujarat Sultan Bahadur Shah’s kingdom was overwhelmed by Mughal
invasion. Pressed by Mughal king Humayun on one side and the Portuguese at the
gates of Diu, Bahadur Shah entered into a treaty with Nuno da Cunha on October
25, 1535 who agreed to assist Bahadur Shah against his enemy by land and sea. In
turn he received permission to construct a fortress at Diu and a site was granted for
this purpose in the harbour. After the Mughal danger was receded, the Shah of
Gujarat realised his mistake in allowing the Portuguese to construct the fort. Finally
Diu was conquered by the Portuguese in 1546 who ruled there till 1961.
Source: Series 29: Goa, Daman and Diu, District Census Hand Book, Census of India, 1981.
2. 3 Both the Districts of Daman and Diu are near Gujarat State separated by
about 700 kms from one another.
GEOGRAPHY
Daman District is situated nearly 200 kms north from Mumbai and is
surrounded by Valsad District of Gujarat State in North, East and South. Daman
Ganga River coming from Nasik passes through middle of Daman District dividing
it into two parts namely Moti Daman and Nani Daman.
DAMAN :
5
The District of Daman is situated on the western –coast of India between the
parallels 20˚- 27′- 58″ and 20̊ - 22′- 00″ of latitude north and between the meridians
72˚-49′- 42″ and 72̊ - 54′- 43″ of longitude east of Greenwich. Its length from the
extreme north to south measures 11 kms and width from east to west, measures 8
kms. The altitude is 12 metres above the sea level.
Diu District is an inland on southern portion of Gujarat Peninsula. It is
joined with Una District of Gujarat State by two bridges over a sea creek.
DIU :
The District of Diu is situated between the parallels 20˚-44′-34″ and 20˚-42′-
00″ of latitude north and between the meridians 71˚ -00′-24″ and 70̊ -52′-26″ of
longitude east of Greenwich. Its length from the extremes north and south, measures
4.6 kms and width from east to west measures 13.8 kms. The altitude is 6 metres
above sea level. The topography is generally plain. The hillocks attain maximum
height of 30 metres.
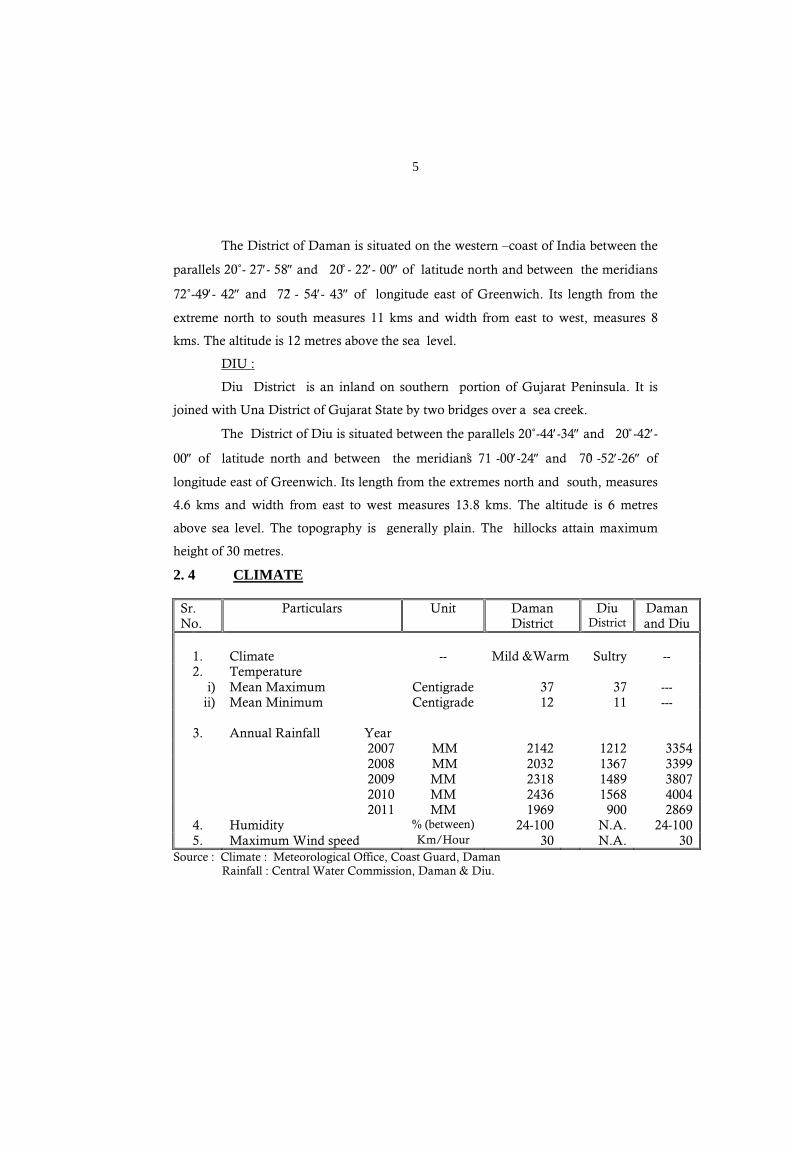
2. 4 CLIMATE
Sr. No.
Particulars Unit Daman District
Diu District
Daman and Diu
1. Climate -- Mild &Warm Sultry -- 2. Temperature
i) Mean Maximum Centigrade 37 37 --- ii) Mean Minimum Centigrade 12 11 ---
3. Annual Rainfall Year
2007 MM 2142 1212 3354 2008
2009 2010
MM MM MM
2032 2318 2436
1367 1489 1568
3399 3807 4004
2011 MM 1969 900 2869 4. Humidity % (between) 24-100 N.A. 24-100 5. Maximum Wind speed Km/Hour 30 N.A. 30
Source : Climate : Meteorological Office, Coast Guard, Daman Rainfall : Central Water Commission, Daman & Diu.
6
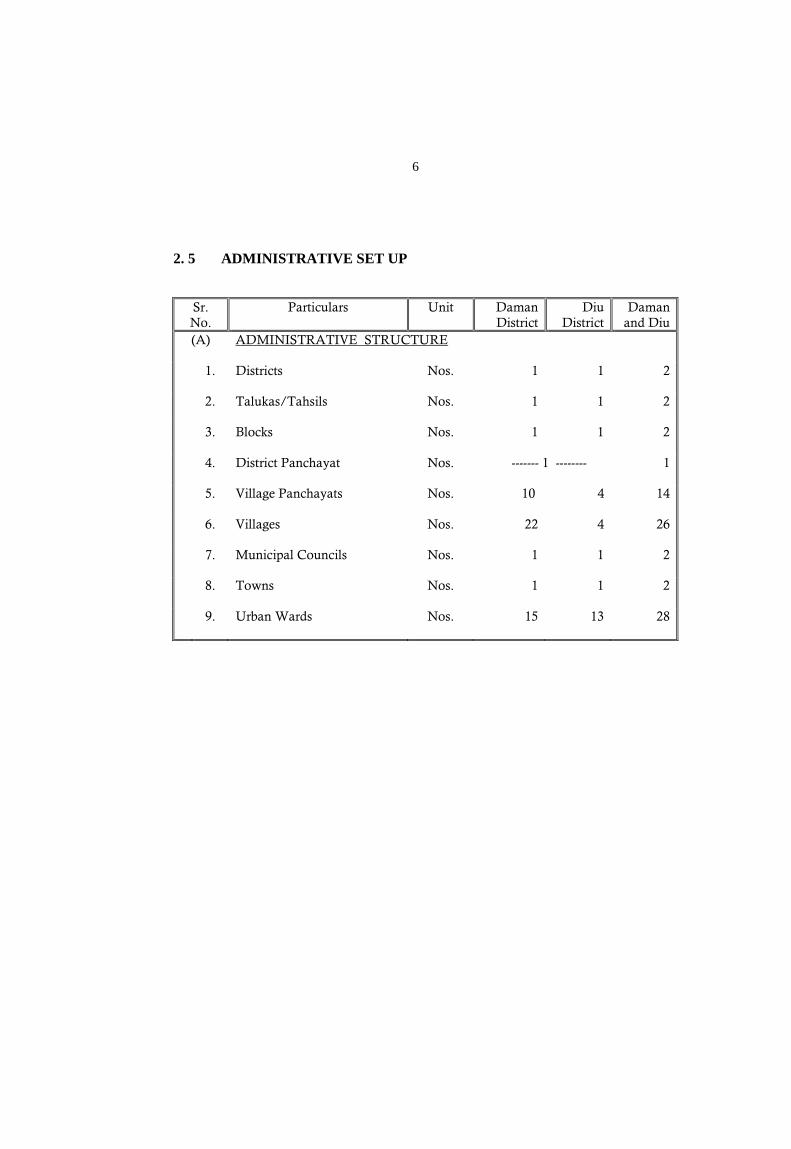
2. 5 ADMINISTRATIVE SET UP
Sr. No.
Particulars Unit Daman District
Diu District
Daman and Diu
(A) ADMINISTRATIVE STRUCTURE
1. Districts Nos. 1 1 2
2. Talukas/Tahsils Nos. 1 1 2
3. Blocks Nos. 1 1 2
4. District Panchayat Nos. ------- 1 -------- 1
5. Village Panchayats Nos. 10 4 14
6. Villages Nos. 22 4 26
7. Municipal Councils Nos. 1 1 2
8. Towns Nos. 1 1 2
9. Urban Wards Nos. 15 13 28
7
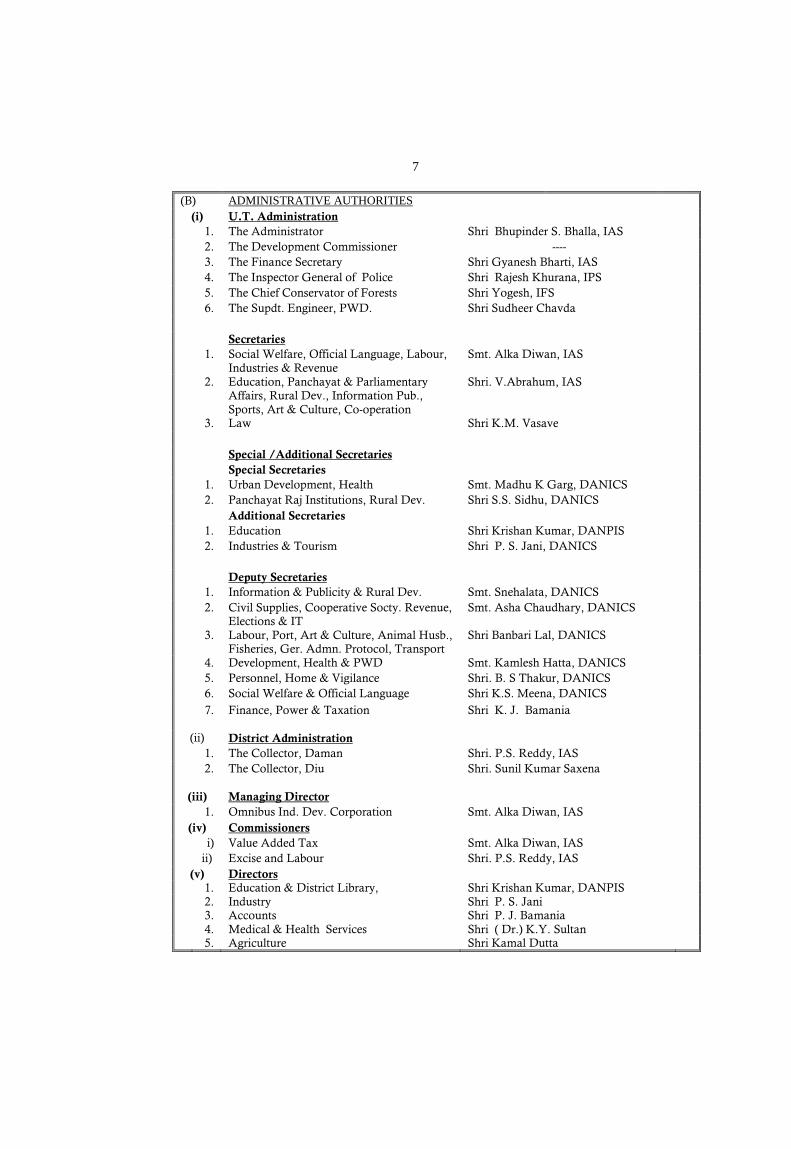
(B) ADMINISTRATIVE AUTHORITIES
(i) U.T. Administration 1. The Administrator Shri Bhupinder S. Bhalla, IAS 2. The Development Commissioner ---- 3. The Finance Secretary Shri Gyanesh Bharti, IAS 4. The Inspector General of Police Shri Rajesh Khurana, IPS 5. The Chief Conservator of Forests Shri Yogesh, IFS 6. The Supdt. Engineer, PWD. Shri Sudheer Chavda Secretaries 1. Social Welfare, Official Language, Labour,
Industries & Revenue Smt. Alka Diwan, IAS
2. Education, Panchayat & Parliamentary Affairs, Rural Dev., Information Pub., Sports, Art & Culture, Co-operation
Shri. V.Abrahum, IAS
3. Law Shri K.M. Vasave Special /Additional Secretaries Special Secretaries 1. Urban Development, Health Smt. Madhu K Garg, DANICS 2. Panchayat Raj Institutions, Rural Dev. Shri S.S. Sidhu, DANICS Additional Secretaries 1. Education Shri Krishan Kumar, DANPIS 2. Industries & Tourism Shri P. S. Jani, DANICS Deputy Secretaries 1. Information & Publicity & Rural Dev. Smt. Snehalata, DANICS 2. Civil Supplies, Cooperative Socty. Revenue,
Elections & IT Smt. Asha Chaudhary, DANICS
3. Labour, Port, Art & Culture, Animal Husb., Fisheries, Ger. Admn. Protocol, Transport
Shri Banbari Lal, DANICS
4. Development, Health & PWD Smt. Kamlesh Hatta, DANICS 5. Personnel, Home & Vigilance Shri. B. S Thakur, DANICS 6. Social Welfare & Official Language Shri K.S. Meena, DANICS 7. Finance, Power & Taxation
Shri K. J. Bamania
(ii) District Administration 1. The Collector, Daman Shri. P.S. Reddy, IAS 2. The Collector, Diu
Shri. Sunil Kumar Saxena
(iii) Managing Director 1. Omnibus Ind. Dev. Corporation Smt. Alka Diwan, IAS (iv) Commissioners
i) Value Added Tax Smt. Alka Diwan, IAS ii) Excise and Labour Shri. P.S. Reddy, IAS
(v) Directors 1. Education & District Library, Shri Krishan Kumar, DANPIS 2. Industry Shri P. S. Jani 3. Accounts Shri P. J. Bamania 4. Medical & Health Services Shri ( Dr.) K.Y. Sultan 5. Agriculture Shri Kamal Dutta
8
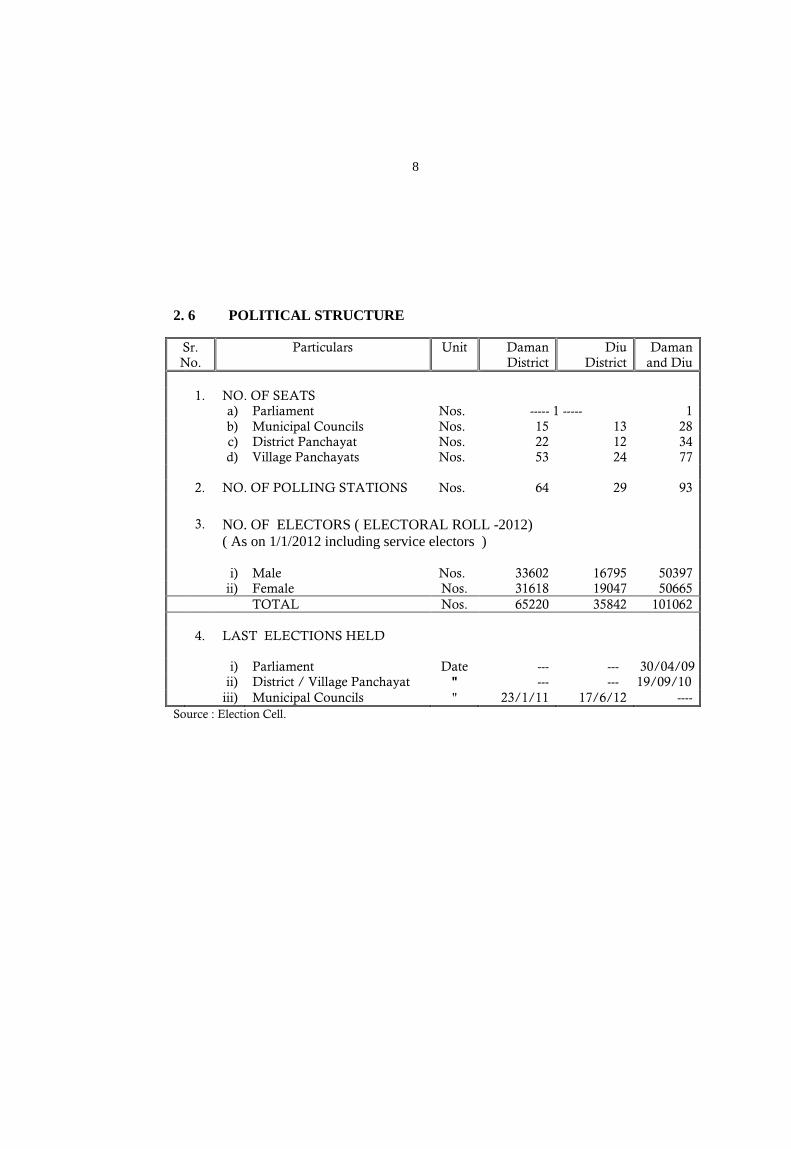
2. 6 POLITICAL STRUCTURE
Sr. No.
Particulars Unit Daman District
Diu District
Daman and Diu
1. NO. OF SEATS a) Parliament Nos. ----- 1 ----- 1 b) Municipal Councils Nos. 15 13 28 c) District Panchayat Nos. 22 12 34 d) Village Panchayats Nos. 53 24 77 2. NO. OF POLLING STATIONS Nos. 64 29 93
3. NO. OF ELECTORS ( ELECTORAL ROLL -2012) ( As on 1/1/2012 including service electors )
i) Male Nos. 33602 16795 50397 ii) Female Nos. 31618 19047 50665 TOTAL Nos. 65220 35842 101062 4. LAST ELECTIONS HELD i) Parliament Date --- --- 30/04/09 ii) District / Village Panchayat " --- --- 19/09/10 iii) Municipal Councils " 23/1/11 17/6/12 ---- Source : Election Cell.
9
(B) POPULATION STATISTICS
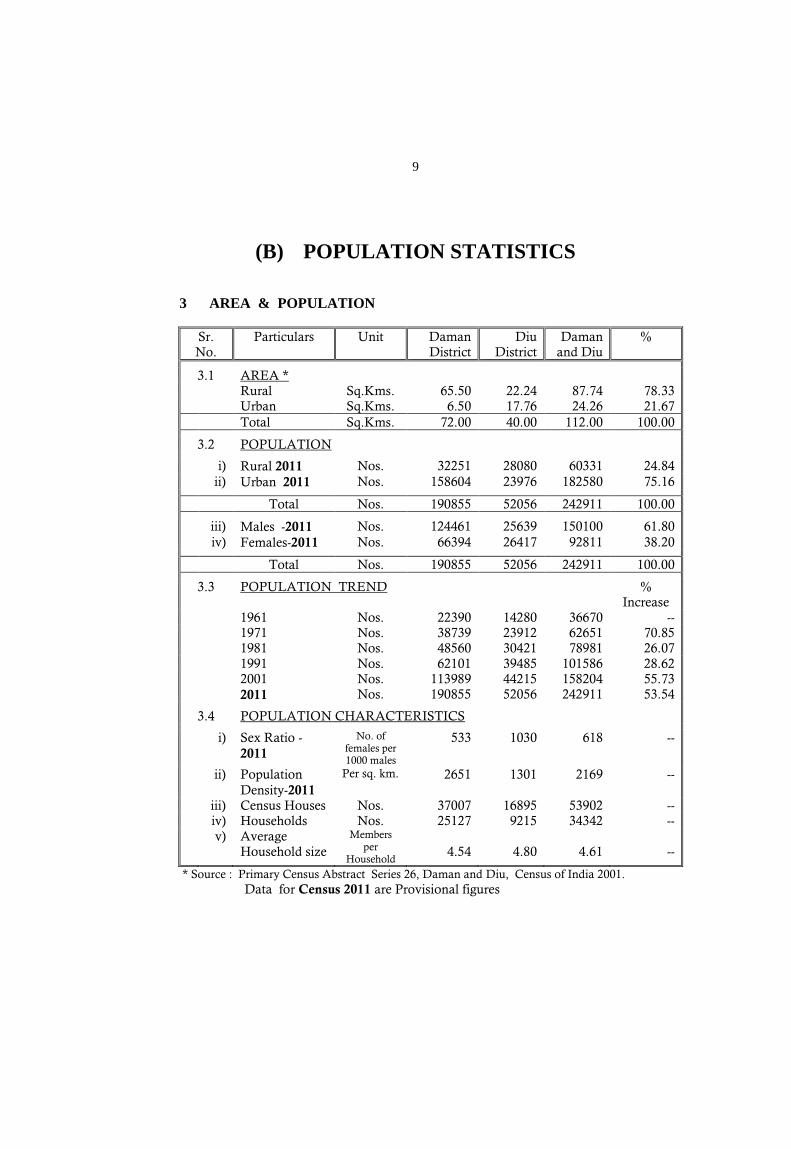
3 AREA & POPULATION
Sr. No.
Particulars Unit Daman District
Diu District
Daman and Diu
%
3.1 AREA * Rural Sq.Kms. 65.50 22.24 87.74 78.33 Urban Sq.Kms. 6.50 17.76 24.26 21.67 Total Sq.Kms. 72.00 40.00 112.00 100.00
3.2 POPULATION
i) Rural 2011 Nos. 32251 28080 60331 24.84 ii) Urban 2011 Nos. 158604 23976 182580 75.16
Total Nos. 190855 52056 242911 100.00
iii) Males -2011 Nos. 124461 25639 150100 61.80 iv) Females-2011 Nos. 66394 26417 92811 38.20
Total Nos. 190855 52056 242911 100.00
3.3 POPULATION TREND % Increase
1961 Nos. 22390 14280 36670 -- 1971 Nos. 38739 23912 62651 70.85 1981 Nos. 48560 30421 78981 26.07 1991 Nos. 62101 39485 101586 28.62 2001
2011 Nos. Nos.
113989 190855
44215 52056
158204 242911
55.73 53.54
3.4 POPULATION CHARACTERISTICS
i) Sex Ratio -2011
No. of females per 1000 males
533 1030 618
--
ii) Population Density-2011
Per sq. km. 2651 1301 2169 --
iii) Census Houses Nos. 37007 16895 53902 -- iv) Households Nos. 25127 9215 34342 -- v) Average
Household size Members
per Household
4.54
4.80
4.61
--
* Source : Primary Census Abstract Series 26, Daman and Diu, Census of India 2001. Data for Census 2011 are Provisional figures
10
Sr. No.
Particulars Daman District
Diu District
Daman and Diu
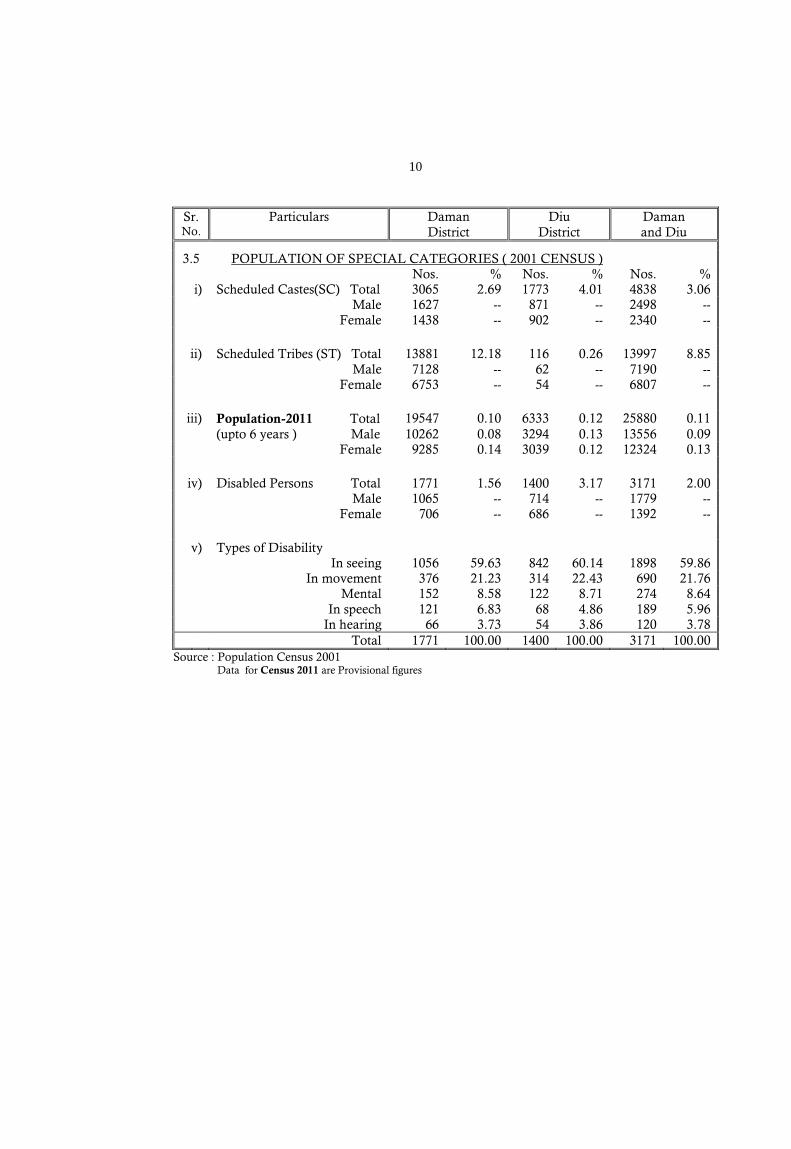
3.5 POPULATION OF SPECIAL CATEGORIES ( 2001 CENSUS ) Nos. % Nos. % Nos. %
i) Scheduled Castes(SC) Total 3065 2.69 1773 4.01 4838 3.06 Male 1627 -- 871 -- 2498 -- Female 1438 -- 902 -- 2340 --
ii) Scheduled Tribes (ST) Total 13881 12.18 116 0.26 13997 8.85 Male 7128 -- 62 -- 7190 -- Female 6753 -- 54 -- 6807 -- iii) Population-2011 Total 19547 0.10 6333 0.12 25880 0.11
(upto 6 years ) Male 10262 0.08 3294 0.13 13556 0.09 Female 9285 0.14 3039 0.12 12324 0.13 iv) Disabled Persons Total 1771 1.56 1400 3.17 3171 2.00
Male 1065 -- 714 -- 1779 -- Female 706 -- 686 -- 1392 --
v) Types of Disability In seeing 1056 59.63 842 60.14 1898 59.86 In movement 376 21.23 314 22.43 690 21.76 Mental 152 8.58 122 8.71 274 8.64 In speech 121 6.83 68 4.86 189 5.96 In hearing 66 3.73 54 3.86 120 3.78 Total 1771 100.00 1400 100.00 3171 100.00
Source : Population Census 2001 Data for Census 2011 are Provisional figures
11
Sr. No.
Year Unit Daman District
Diu District
Daman and Diu
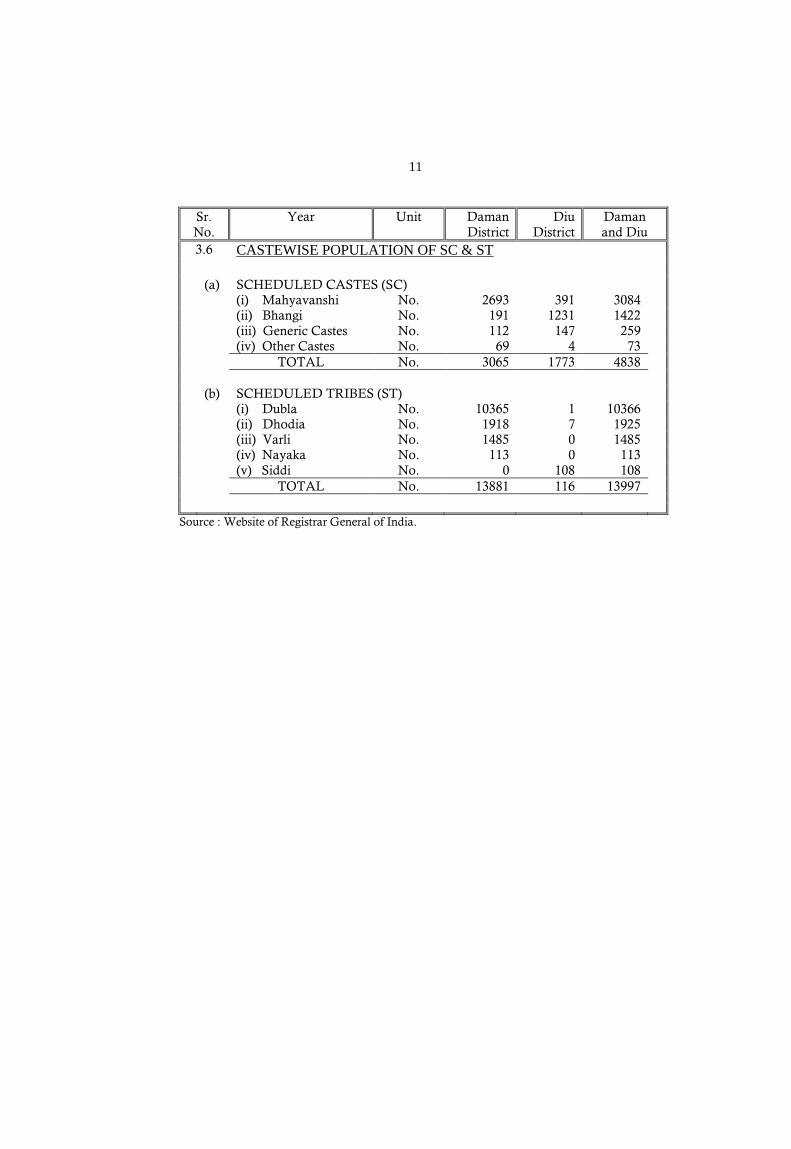
3.6 CASTEWISE POPULATION OF SC & ST
(a) SCHEDULED CASTES (SC) (i) Mahyavanshi No. 2693 391 3084 (ii) Bhangi No. 191 1231 1422 (iii) Generic Castes No. 112 147 259 (iv) Other Castes No. 69 4 73 TOTAL No. 3065 1773 4838 (b) SCHEDULED TRIBES (ST) (i) Dubla No. 10365 1 10366 (ii) Dhodia No. 1918 7 1925 (iii) Varli No. 1485 0 1485 (iv) Nayaka No. 113 0 113 (v) Siddi No. 0 108 108 TOTAL No. 13881 116 13997
Source : Website of Registrar General of India.
12
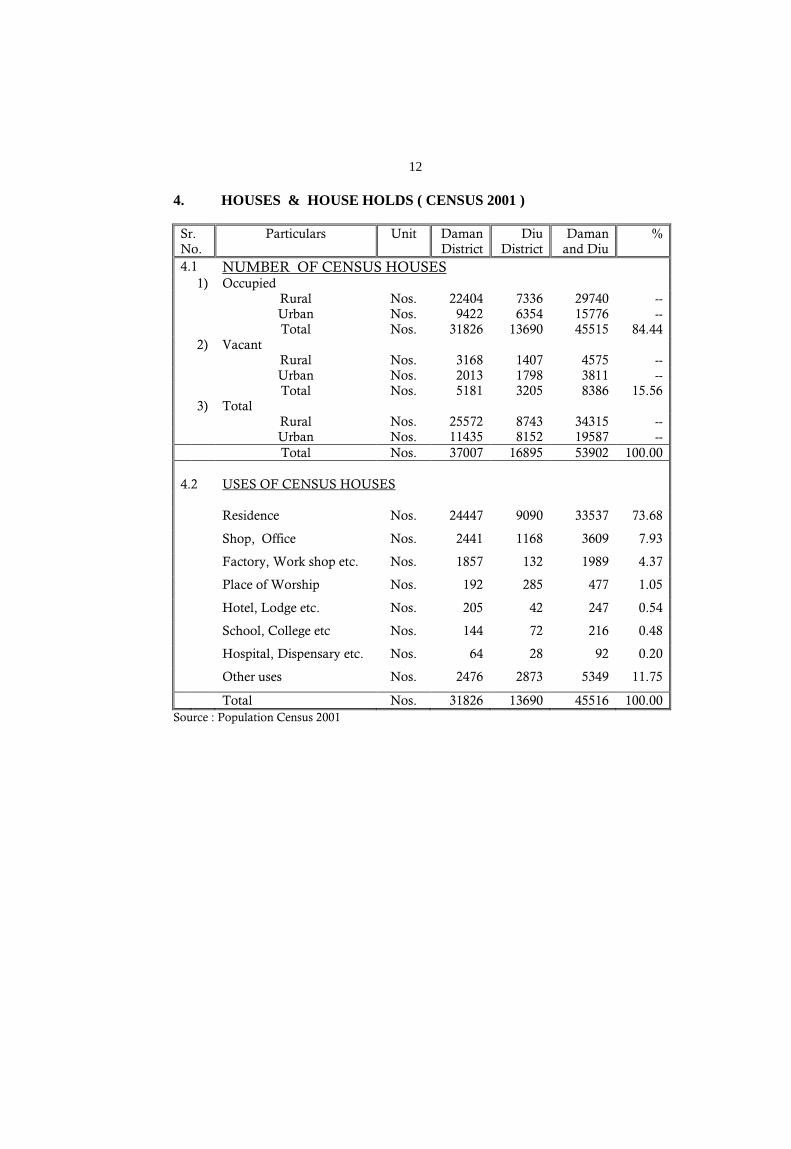
4. HOUSES & HOUSE HOLDS ( CENSUS 2001 )
Sr. No.
Particulars Unit Daman District
Diu District
Daman and Diu
%
4.1 NUMBER OF CENSUS HOUSES 1) Occupied
Rural Nos. 22404 7336 29740 -- Urban Nos. 9422 6354 15776 -- Total Nos. 31826 13690 45515 84.44
2) Vacant Rural Nos. 3168 1407 4575 -- Urban Nos. 2013 1798 3811 -- Total Nos. 5181 3205 8386 15.56
3) Total Rural Nos. 25572 8743 34315 -- Urban Nos. 11435 8152 19587 -- Total Nos. 37007 16895 53902 100.00 4.2 USES OF CENSUS HOUSES Residence Nos. 24447 9090 33537 73.68
Shop, Office Nos. 2441 1168 3609 7.93
Factory, Work shop etc. Nos. 1857 132 1989 4.37
Place of Worship Nos. 192 285 477 1.05
Hotel, Lodge etc. Nos. 205 42 247 0.54
School, College etc Nos. 144 72 216 0.48
Hospital, Dispensary etc. Nos. 64 28 92 0.20
Other uses Nos. 2476 2873 5349 11.75
Total Nos. 31826 13690 45516 100.00 Source : Population Census 2001
13
Sr. No.
Particulars Unit Daman District
Diu District
Daman and Diu
%
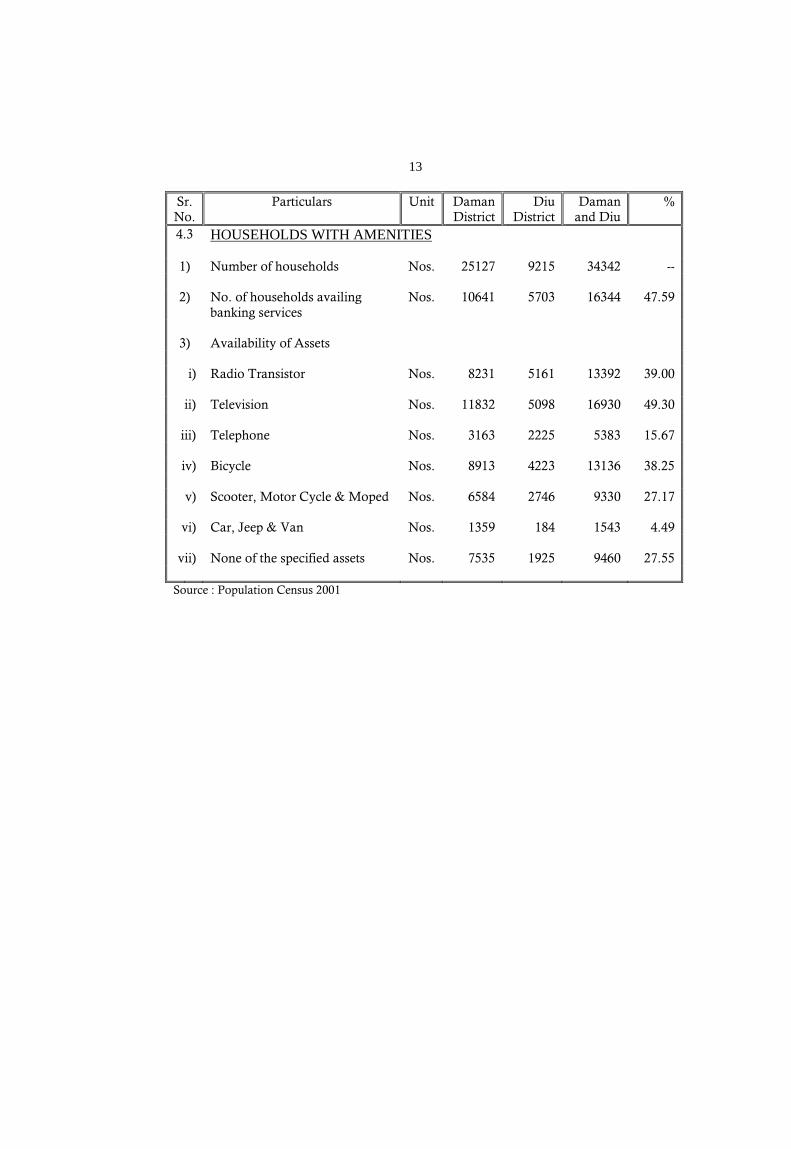
4.3 HOUSEHOLDS WITH AMENITIES 1) Number of households Nos. 25127 9215 34342 --
2) No. of households availing
banking services Nos. 10641 5703 16344 47.59
3) Availability of Assets
i) Radio Transistor Nos. 8231 5161 13392 39.00
ii) Television Nos. 11832 5098 16930 49.30
iii) Telephone Nos. 3163 2225 5383 15.67
iv) Bicycle Nos. 8913 4223 13136 38.25
v) Scooter, Motor Cycle & Moped Nos. 6584 2746 9330 27.17
vi) Car, Jeep & Van Nos. 1359 184 1543 4.49
vii) None of the specified assets Nos. 7535 1925 9460 27.55 Source : Population Census 2001
14
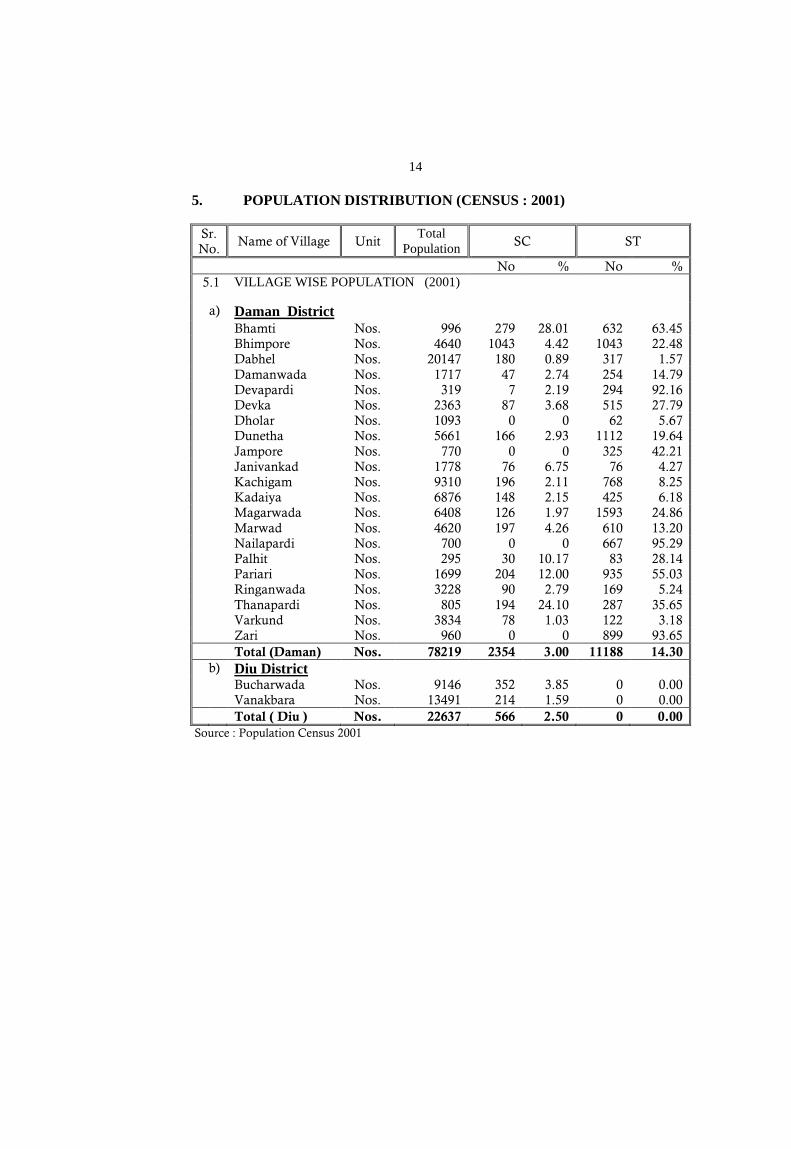
5. POPULATION DISTRIBUTION (CENSUS : 2001)
Sr. No.
Name of Village Unit Total
Population SC ST
No % No % 5.1 VILLAGE WISE POPULATION (2001)
a) Daman District Bhamti Nos. 996 279 28.01 632 63.45 Bhimpore Nos. 4640 1043 4.42 1043 22.48 Dabhel Nos. 20147 180 0.89 317 1.57 Damanwada Nos. 1717 47 2.74 254 14.79 Devapardi Nos. 319 7 2.19 294 92.16 Devka Nos. 2363 87 3.68 515 27.79 Dholar Nos. 1093 0 0 62 5.67 Dunetha Nos. 5661 166 2.93 1112 19.64 Jampore Nos. 770 0 0 325 42.21 Janivankad Nos. 1778 76 6.75 76 4.27 Kachigam Nos. 9310 196 2.11 768 8.25 Kadaiya Nos. 6876 148 2.15 425 6.18 Magarwada Nos. 6408 126 1.97 1593 24.86 Marwad Nos. 4620 197 4.26 610 13.20 Nailapardi Nos. 700 0 0 667 95.29 Palhit Nos. 295 30 10.17 83 28.14 Pariari Nos. 1699 204 12.00 935 55.03 Ringanwada Nos. 3228 90 2.79 169 5.24 Thanapardi Nos. 805 194 24.10 287 35.65 Varkund Nos. 3834 78 1.03 122 3.18 Zari Nos. 960 0 0 899 93.65 Total (Daman) Nos. 78219 2354 3.00 11188 14.30
b) Diu District Bucharwada Nos. 9146 352 3.85 0 0.00 Vanakbara Nos. 13491 214 1.59 0 0.00 Total ( Diu ) Nos. 22637 566 2.50 0 0.00
Source : Population Census 2001
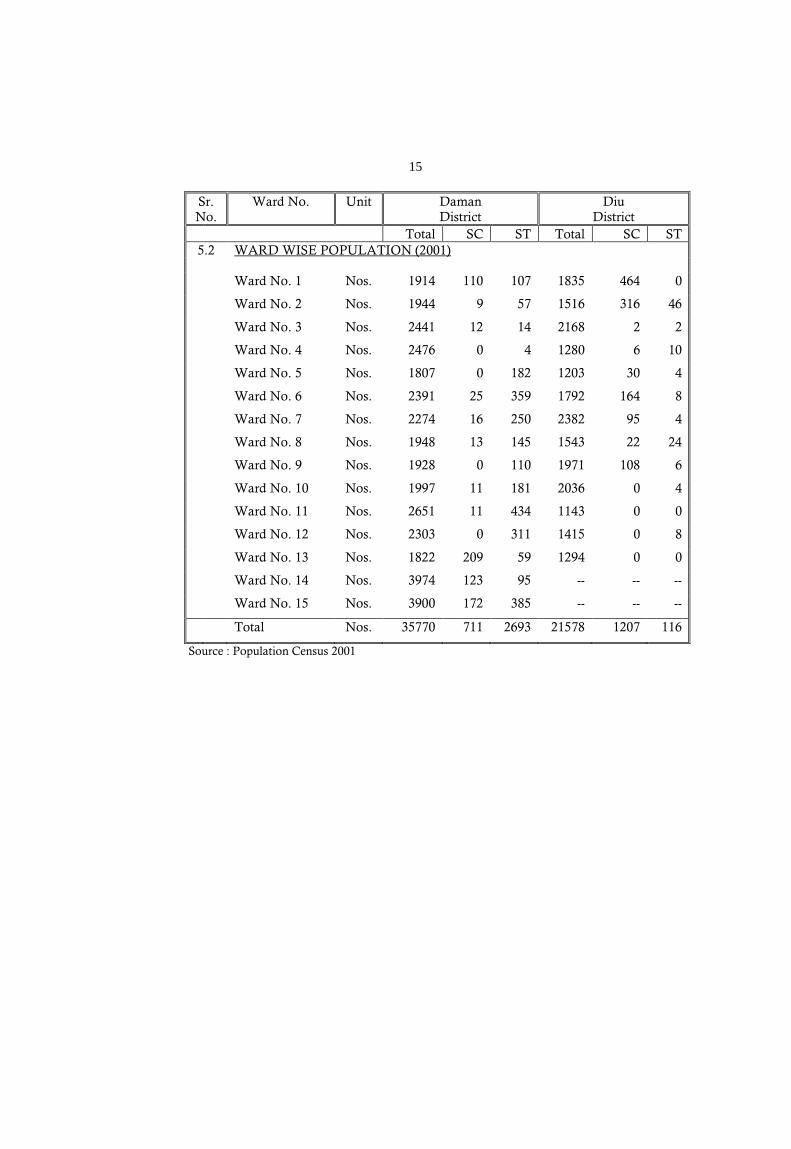
15
Sr. No.
Ward No. Unit Daman District
Diu District
Total SC ST Total SC ST 5.2 WARD WISE POPULATION (2001) Ward No. 1 Nos. 1914 110 107 1835 464 0
Ward No. 2 Nos. 1944 9 57 1516 316 46
Ward No. 3 Nos. 2441 12 14 2168 2 2
Ward No. 4 Nos. 2476 0 4 1280 6 10
Ward No. 5 Nos. 1807 0 182 1203 30 4
Ward No. 6 Nos. 2391 25 359 1792 164 8
Ward No. 7 Nos. 2274 16 250 2382 95 4
Ward No. 8 Nos. 1948 13 145 1543 22 24
Ward No. 9 Nos. 1928 0 110 1971 108 6
Ward No. 10 Nos. 1997 11 181 2036 0 4
Ward No. 11 Nos. 2651 11 434 1143 0 0
Ward No. 12 Nos. 2303 0 311 1415 0 8
Ward No. 13 Nos. 1822 209 59 1294 0 0
Ward No. 14 Nos. 3974 123 95 -- -- --
Ward No. 15 Nos. 3900 172 385 -- -- --
Total Nos. 35770 711 2693 21578 1207 116
Source : Population Census 2001
16
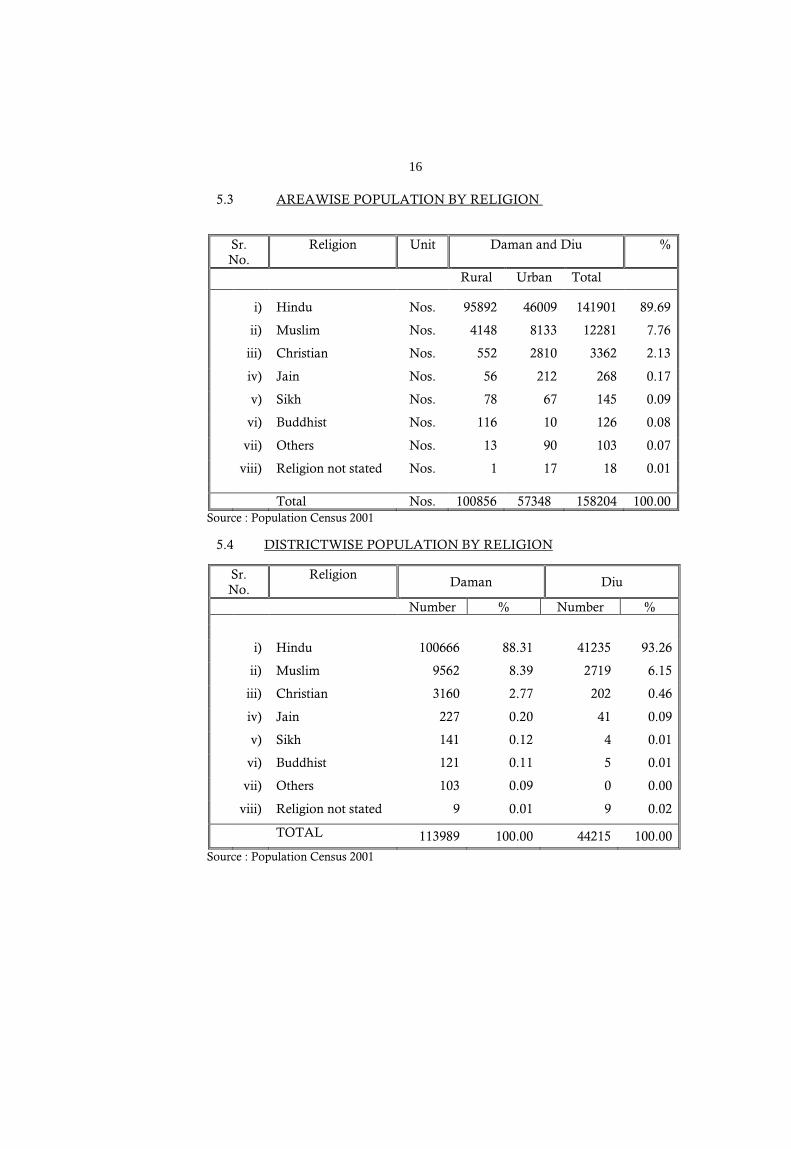
5.3 AREAWISE POPULATION BY RELIGION
Sr. No.
Religion Unit Daman and Diu %
Rural Urban Total
i) Hindu Nos. 95892 46009 141901 89.69
ii) Muslim Nos. 4148 8133 12281 7.76
iii) Christian Nos. 552 2810 3362 2.13
iv) Jain Nos. 56 212 268 0.17
v) Sikh Nos. 78 67 145 0.09
vi) Buddhist Nos. 116 10 126 0.08
vii) Others Nos. 13 90 103 0.07
viii) Religion not stated Nos. 1 17 18 0.01
Total Nos. 100856 57348 158204 100.00 Source : Population Census 2001
5.4 DISTRICTWISE POPULATION BY RELIGION
Sr. No.
Religion Daman Diu
Number % Number %
i) Hindu 100666 88.31 41235 93.26
ii) Muslim 9562 8.39 2719 6.15
iii) Christian 3160 2.77 202 0.46
iv) Jain 227 0.20 41 0.09
v) Sikh 141 0.12 4 0.01
vi) Buddhist 121 0.11 5 0.01
vii) Others 103 0.09 0 0.00
viii) Religion not stated 9 0.01 9 0.02
TOTAL 113989 100.00 44215 100.00
Source : Population Census 2001
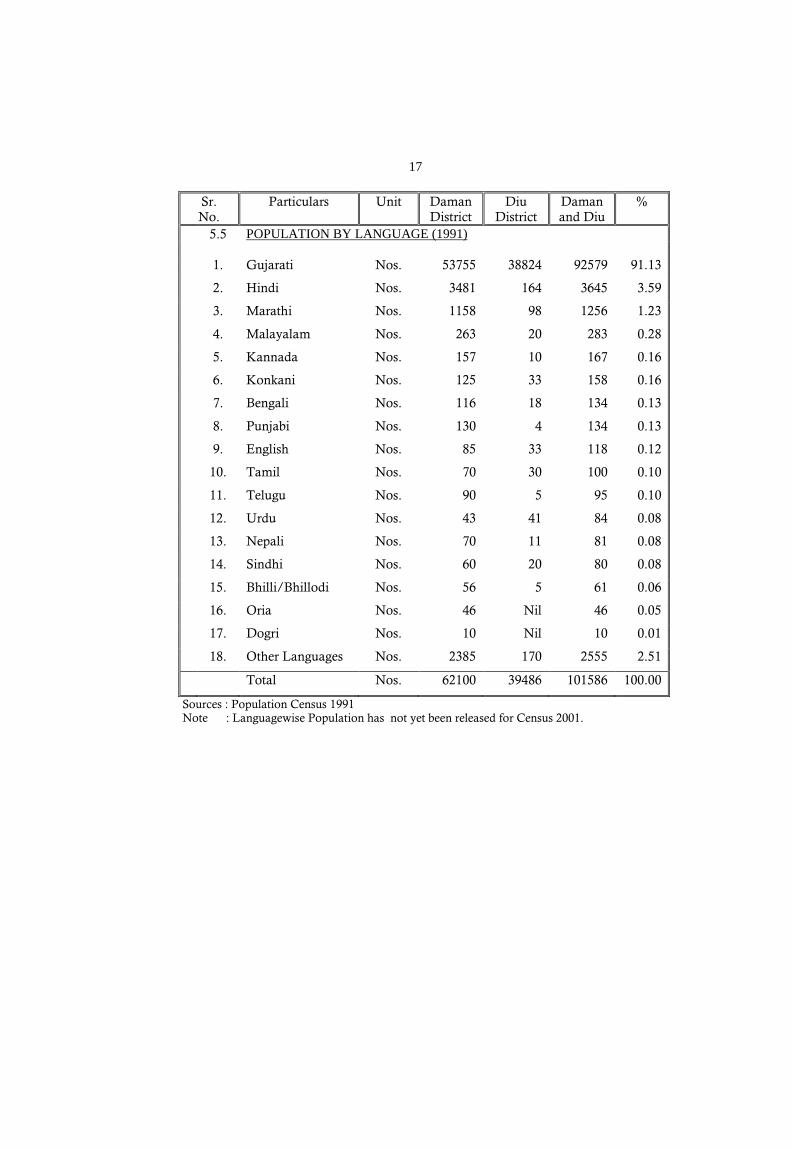
17
Sr. No.
Particulars Unit Daman District
Diu District
Daman and Diu
%
5.5 POPULATION BY LANGUAGE (1991) 1. Gujarati Nos. 53755 38824 92579 91.13
2. Hindi Nos. 3481 164 3645 3.59
3. Marathi Nos. 1158 98 1256 1.23
4. Malayalam Nos. 263 20 283 0.28
5. Kannada Nos. 157 10 167 0.16
6. Konkani Nos. 125 33 158 0.16
7. Bengali Nos. 116 18 134 0.13
8. Punjabi Nos. 130 4 134 0.13
9. English Nos. 85 33 118 0.12
10. Tamil Nos. 70 30 100 0.10
11. Telugu Nos. 90 5 95 0.10
12. Urdu Nos. 43 41 84 0.08
13. Nepali Nos. 70 11 81 0.08
14. Sindhi Nos. 60 20 80 0.08
15. Bhilli/Bhillodi Nos. 56 5 61 0.06
16. Oria Nos. 46 Nil 46 0.05
17. Dogri Nos. 10 Nil 10 0.01
18. Other Languages Nos. 2385 170 2555 2.51
Total Nos. 62100 39486 101586 100.00
Sources : Population Census 1991 Note : Languagewise Population has not yet been released for Census 2001.
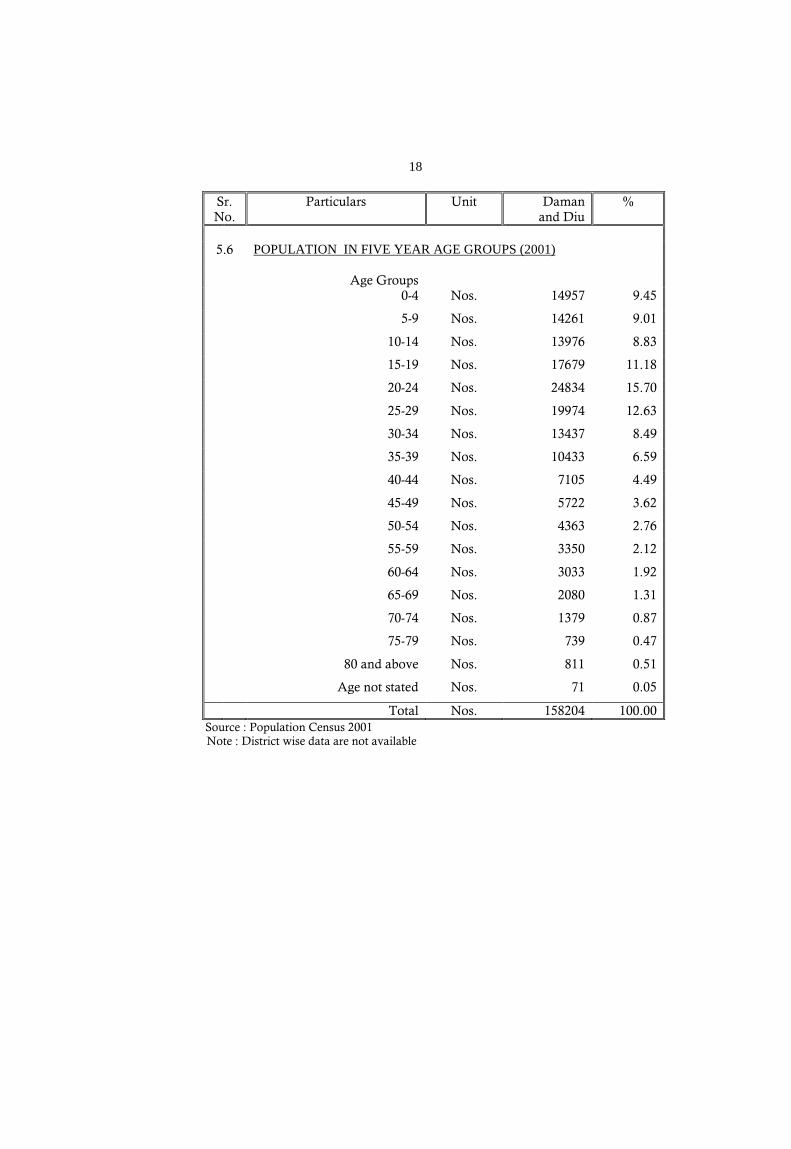
18
Sr. No.
Particulars Unit Daman and Diu
%
5.6 POPULATION IN FIVE YEAR AGE GROUPS (2001)
Age Groups 0-4 Nos. 14957 9.45
5-9 Nos. 14261 9.01
10-14 Nos. 13976 8.83
15-19 Nos. 17679 11.18
20-24 Nos. 24834 15.70
25-29 Nos. 19974 12.63
30-34 Nos. 13437 8.49
35-39 Nos. 10433 6.59
40-44 Nos. 7105 4.49
45-49 Nos. 5722 3.62
50-54 Nos. 4363 2.76
55-59 Nos. 3350 2.12
60-64 Nos. 3033 1.92
65-69 Nos. 2080 1.31
70-74 Nos. 1379 0.87
75-79 Nos. 739 0.47
80 and above Nos. 811 0.51
Age not stated Nos. 71 0.05
Total Nos. 158204 100.00 Source : Population Census 2001
Note : District wise data are not available
19
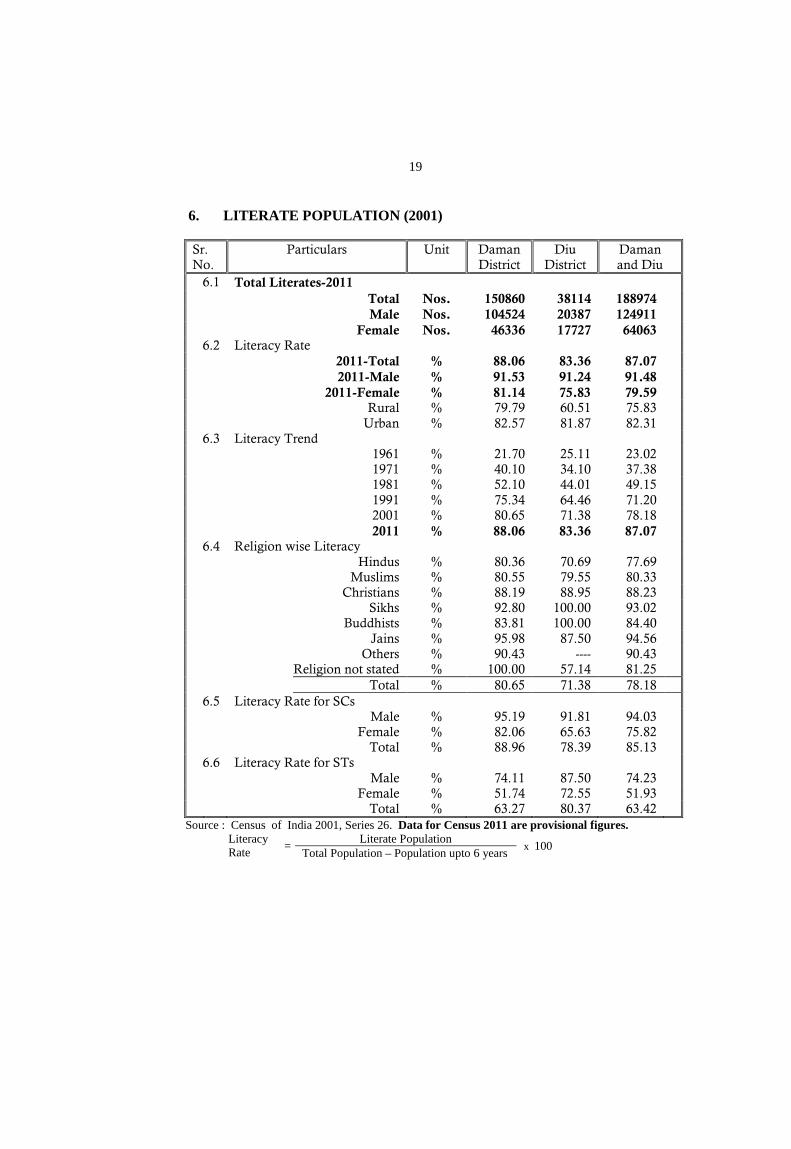
6. LITERATE POPULATION (2001) Sr. No.
Particulars Unit Daman District
Diu District
Daman and Diu
6.1 Total Literates-2011 Total Nos. 150860 38114 188974 Male Nos. 104524 20387 124911 Female Nos. 46336 17727 64063
6.2 Literacy Rate 2011-Total % 88.06 83.36 87.07 2011-Male % 91.53 91.24 91.48 2011-Female % 81.14 75.83 79.59 Rural % 79.79 60.51 75.83 Urban % 82.57 81.87 82.31
6.3 Literacy Trend 1961 % 21.70 25.11 23.02 1971 % 40.10 34.10 37.38 1981 % 52.10 44.01 49.15 1991 % 75.34 64.46 71.20 2001
2011 % %
80.65 88.06
71.38 83.36
78.18 87.07
6.4 Religion wise Literacy Hindus % 80.36 70.69 77.69 Muslims % 80.55 79.55 80.33 Christians % 88.19 88.95 88.23 Sikhs % 92.80 100.00 93.02 Buddhists % 83.81 100.00 84.40 Jains % 95.98 87.50 94.56 Others % 90.43 ---- 90.43 Religion not stated % 100.00 57.14 81.25 Total % 80.65 71.38 78.18
6.5 Literacy Rate for SCs Male % 95.19 91.81 94.03 Female % 82.06 65.63 75.82 Total % 88.96 78.39 85.13
6.6 Literacy Rate for STs Male % 74.11 87.50 74.23 Female % 51.74 72.55 51.93 Total % 63.27 80.37 63.42
Source : Census of India 2001, Series 26. Data for Census 2011 are provisional figures. Literacy Rate = Literate Population
x 100 Total Population – Population upto 6 years
20
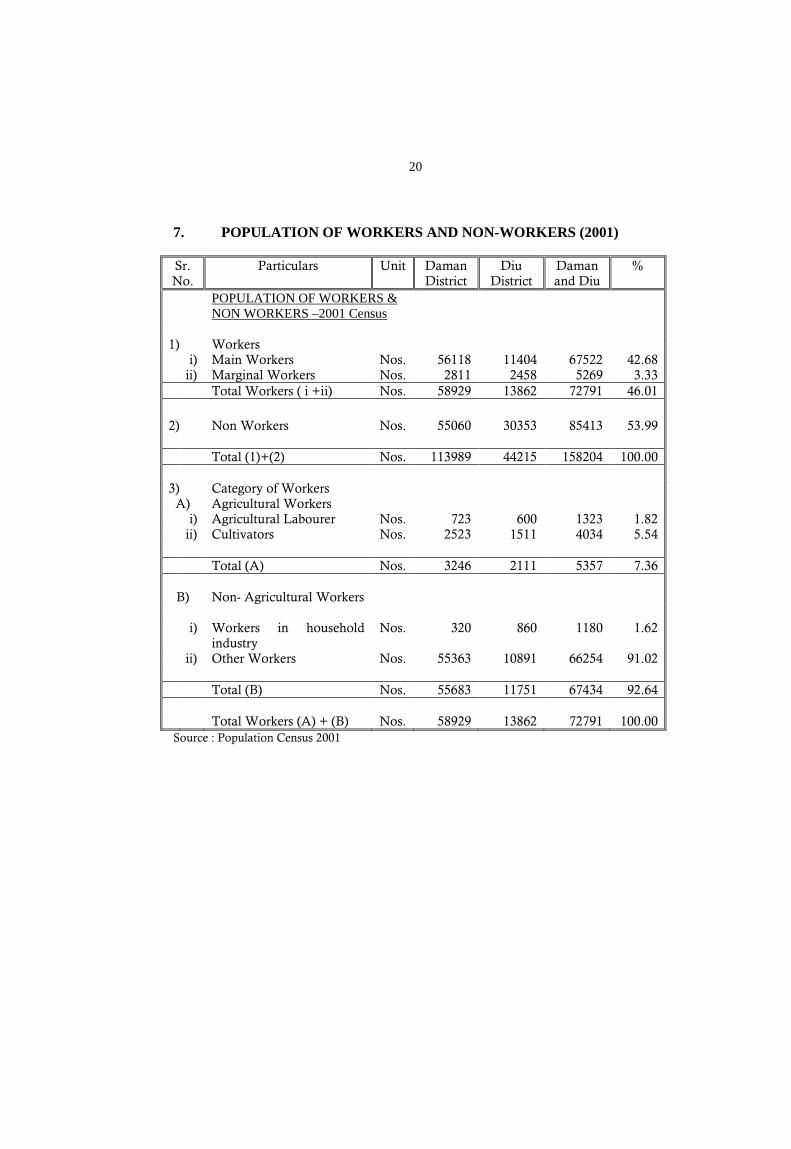
7. POPULATION OF WORKERS AND NON-WORKERS (2001) Sr. No.
Particulars Unit Daman District
Diu District
Daman and Diu
%
POPULATION OF WORKERS & NON WORKERS –2001 Census
1) Workers i) Main Workers Nos. 56118 11404 67522 42.68
ii) Marginal Workers Nos. 2811 2458 5269 3.33 Total Workers ( i +ii) Nos. 58929 13862 72791 46.01 2) Non Workers Nos. 55060 30353 85413 53.99 Total (1)+(2) Nos. 113989 44215 158204 100.00 3) Category of Workers
A) Agricultural Workers i) Agricultural Labourer Nos. 723 600 1323 1.82
ii) Cultivators Nos. 2523 1511 4034 5.54 Total (A) Nos. 3246 2111 5357 7.36 B) Non- Agricultural Workers
i) Workers in household
industry Nos. 320 860 1180 1.62
ii) Other Workers Nos. 55363 10891 66254 91.02 Total (B) Nos. 55683 11751 67434 92.64 Total Workers (A) + (B) Nos. 58929 13862 72791 100.00 Source : Population Census 2001
21
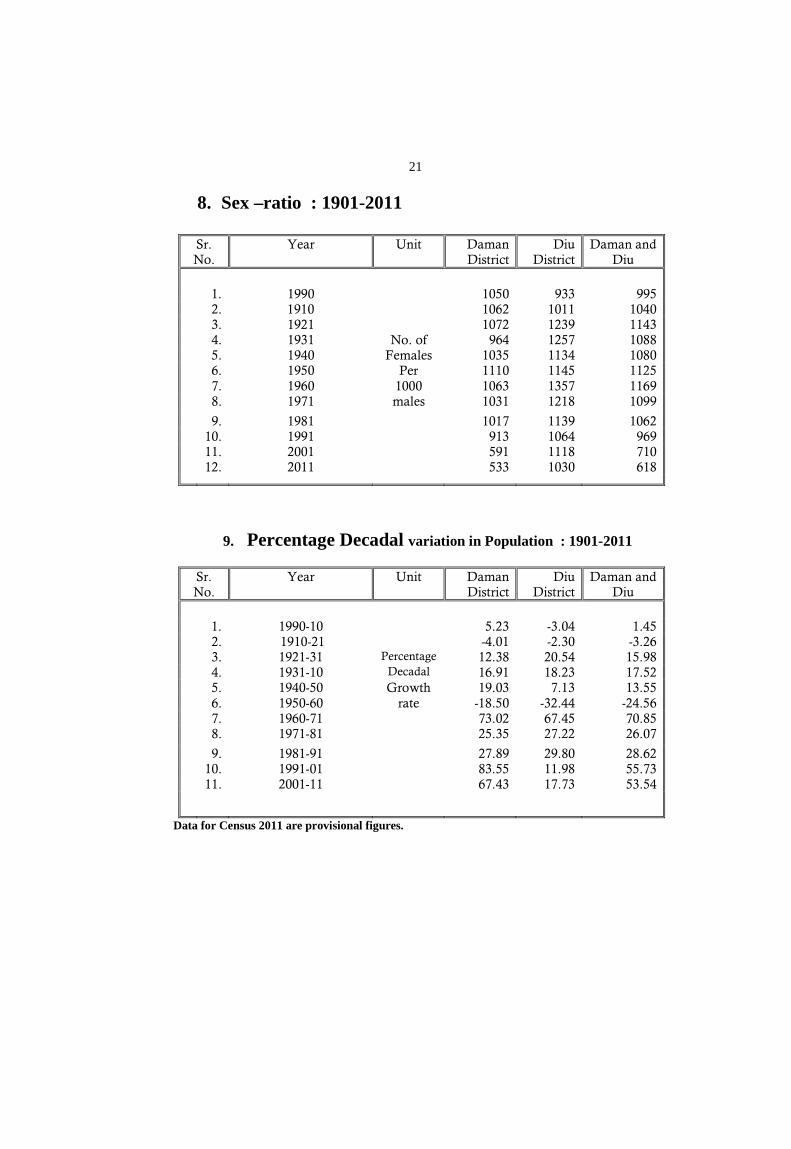
8. Sex –ratio : 1901-2011
Sr. No.
Year Unit Daman District
Diu District
Daman and Diu
1. 1990 1050 933 995
2. 1910 1062 1011 1040 3. 1921 1072 1239 1143 4. 1931 No. of 964 1257 1088 5. 1940 Females 1035 1134 1080 6. 1950 Per 1110 1145 1125 7. 1960 1000 1063 1357 1169 8. 1971 males 1031 1218 1099
9. 1981 1017 1139 1062 10. 1991 913 1064 969 11. 2001 591 1118 710 12. 2011 533 1030 618
9. Percentage Decadal variation in Population : 1901-2011
Sr. No.
Year Unit Daman District
Diu District
Daman and Diu
1. 1990-10 5.23 -3.04 1.45
2. 1910-21 -4.01 -2.30 -3.26 3. 1921-31 Percentage 12.38 20.54 15.98 4. 1931-10 Decadal 16.91 18.23 17.52 5. 1940-50 Growth 19.03 7.13 13.55 6. 1950-60 rate -18.50 -32.44 -24.56 7. 1960-71 73.02 67.45 70.85 8. 1971-81 25.35 27.22 26.07
9. 1981-91 27.89 29.80 28.62 10. 1991-01 83.55 11.98 55.73 11. 2001-11 67.43 17.73 53.54
Data for Census 2011 are provisional figures.
22
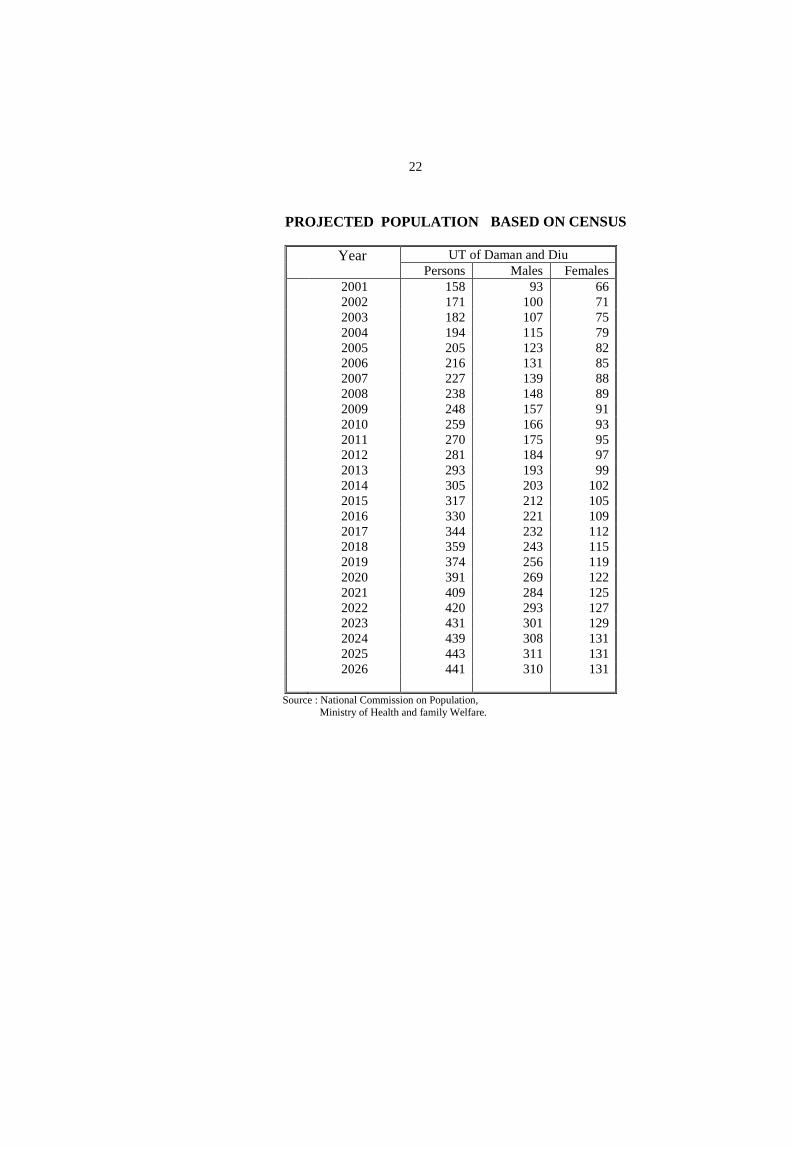
BASED ON CENSUS
Source : National Commission on Population, Ministry of Health and family Welfare.
PROJECTED POPULATION
Year UT of Daman and Diu Persons Males Females
2001 158 93 66 2002 171 100 71 2003 182 107 75 2004 194 115 79 2005 205 123 82 2006 216 131 85 2007 227 139 88 2008 238 148 89 2009 248 157 91 2010 259 166 93 2011 270 175 95 2012 281 184 97 2013 293 193 99 2014 305 203 102 2015 317 212 105 2016 330 221 109 2017 344 232 112 2018 359 243 115 2019 374 256 119 2020 391 269 122 2021 409 284 125 2022 420 293 127 2023 431 301 129 2024 439 308 131 2025 443 311 131 2026 441 310 131
23
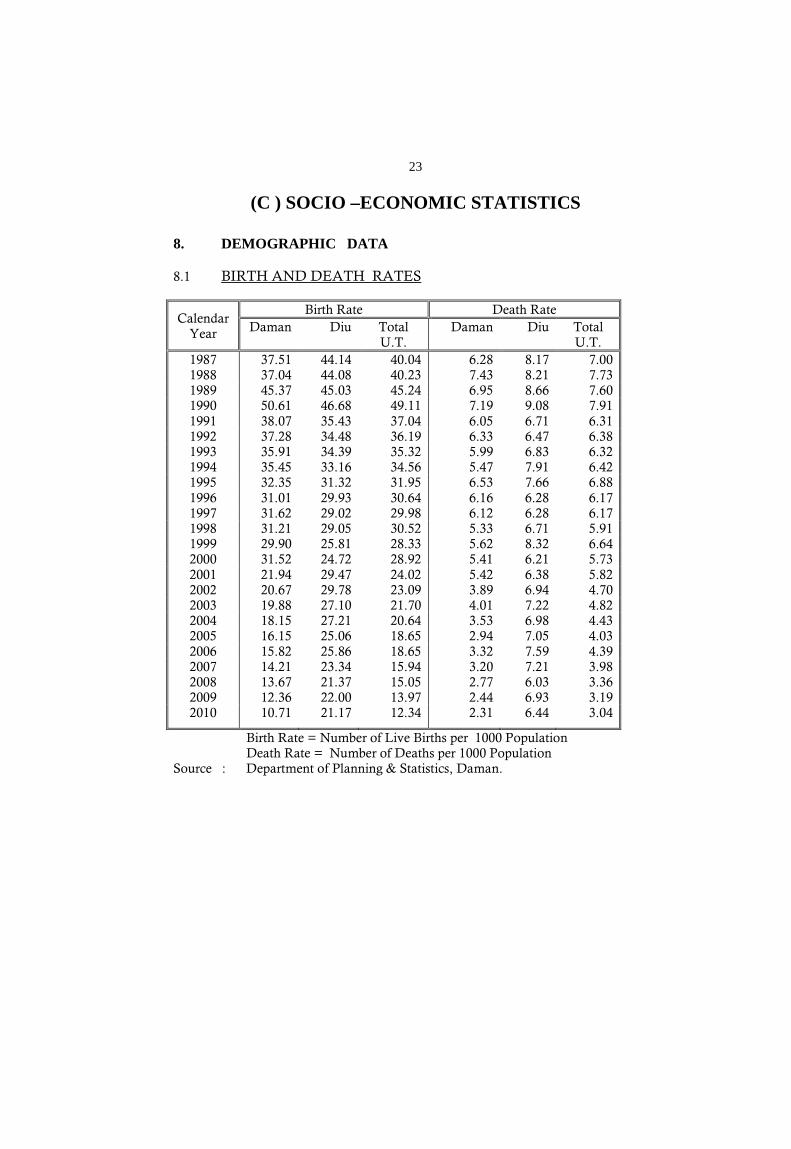
(C ) SOCIO –ECONOMIC STATISTICS 8. DEMOGRAPHIC DATA 8.1 BIRTH AND DEATH RATES
CalendarYear
Birth Rate Death Rate Daman Diu Total
U.T. Daman Diu Total
U.T. 1987 37.51 44.14 40.04 6.28 8.17 7.00 1988 37.04 44.08 40.23 7.43 8.21 7.73 1989 45.37 45.03 45.24 6.95 8.66 7.60 1990 50.61 46.68 49.11 7.19 9.08 7.91 1991 38.07 35.43 37.04 6.05 6.71 6.31 1992 37.28 34.48 36.19 6.33 6.47 6.38 1993 35.91 34.39 35.32 5.99 6.83 6.32 1994 35.45 33.16 34.56 5.47 7.91 6.42 1995 32.35 31.32 31.95 6.53 7.66 6.88 1996 31.01 29.93 30.64 6.16 6.28 6.17 1997 31.62 29.02 29.98 6.12 6.28 6.17 1998 31.21 29.05 30.52 5.33 6.71 5.91 1999 29.90 25.81 28.33 5.62 8.32 6.64 2000 31.52 24.72 28.92 5.41 6.21 5.73 2001 21.94 29.47 24.02 5.42 6.38 5.82 2002 20.67 29.78 23.09 3.89 6.94 4.70 2003 19.88 27.10 21.70 4.01 7.22 4.82 2004 18.15 27.21 20.64 3.53 6.98 4.43 2005 16.15 25.06 18.65 2.94 7.05 4.03 2006 15.82 25.86 18.65 3.32 7.59 4.39 2007 14.21 23.34 15.94 3.20 7.21 3.98 2008 2009
13.67 12.36
21.37 22.00
15.05 13.97
2.77 2.44
6.03 6.93
3.36 3.19
2010 10.71 21.17 12.34 2.31 6.44 3.04
Birth Rate = Number of Live Births per 1000 Population Death Rate = Number of Deaths per 1000 Population
Source : Department of Planning & Statistics, Daman.
24
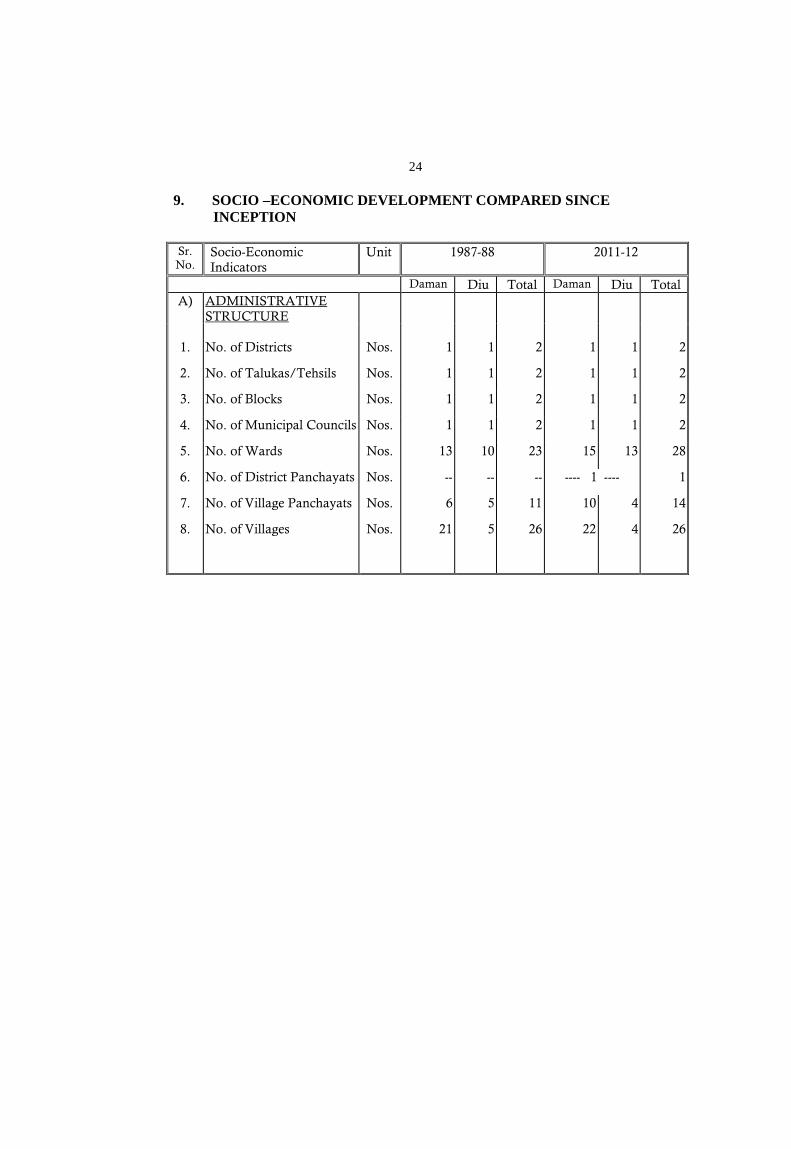
9. SOCIO –ECONOMIC DEVELOPMENT COMPARED SINCE
INCEPTION Sr. No.
Socio-Economic Indicators
Unit 1987-88 2011-12
Daman Diu Total Daman Diu Total A) ADMINISTRATIVE
STRUCTURE
1. No. of Districts Nos. 1 1 2 1 1 2
2. No. of Talukas/Tehsils Nos. 1 1 2 1 1 2
3. No. of Blocks Nos. 1 1 2 1 1 2
4. No. of Municipal Councils Nos. 1 1 2 1 1 2
5. No. of Wards Nos. 13 10 23 15 13 28
6. No. of District Panchayats Nos. -- -- -- ---- 1 ---- 1
7. No. of Village Panchayats Nos. 6 5 11 10 4 14
8. No. of Villages Nos. 21 5 26 22 4 26
25
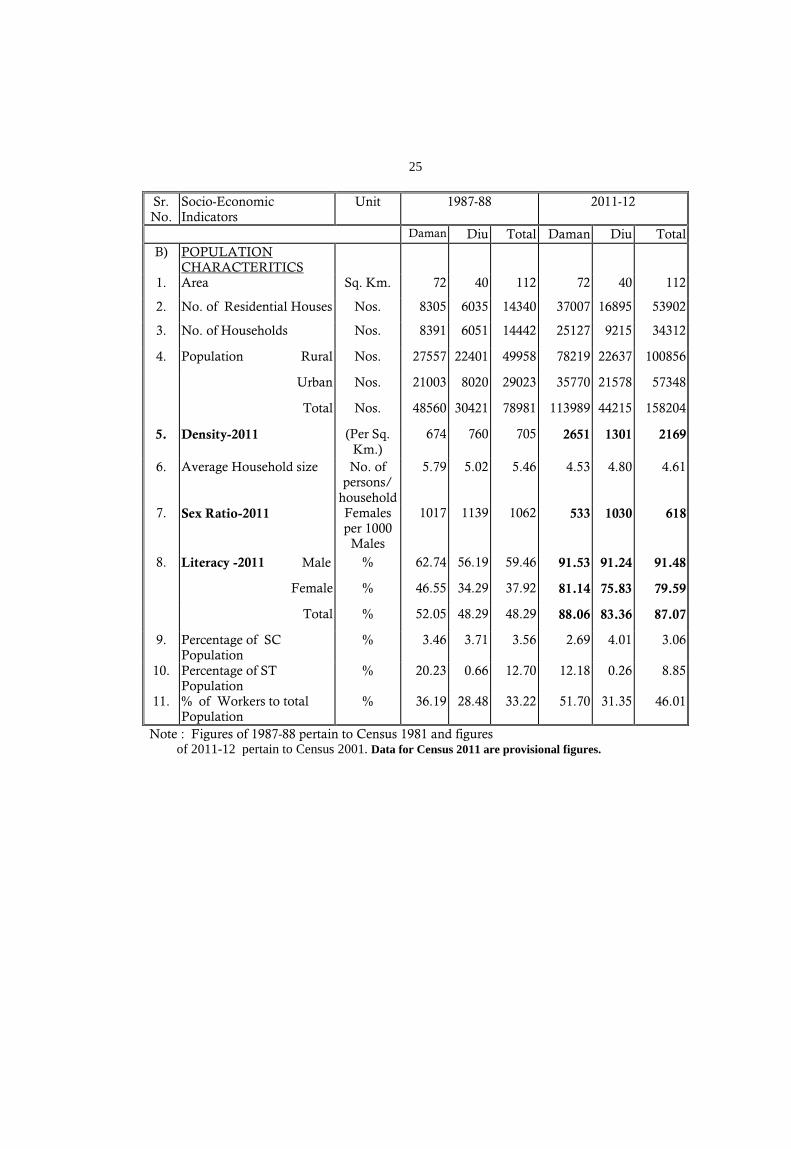
Sr. No.
Socio-Economic Indicators
Unit 1987-88 2011-12
Daman Diu Total Daman Diu Total B) POPULATION
CHARACTERITICS
1. Area Sq. Km. 72 40 112 72 40 112
2. No. of Residential Houses Nos. 8305 6035 14340 37007 16895 53902
3. No. of Households Nos. 8391 6051 14442 25127 9215 34312
4. Population Rural Nos. 27557 22401 49958 78219 22637 100856
Urban Nos. 21003 8020 29023 35770 21578 57348
Total Nos. 48560 30421 78981 113989 44215 158204
5. Density-2011 (Per Sq. Km.)
674 760 705 2651 1301 2169
6. Average Household size No. of persons/
household
5.79 5.02 5.46 4.53 4.80 4.61
7. Sex Ratio-2011 Females per 1000
Males
1017 1139 1062 533 1030 618
8. Literacy -2011 Male % 62.74 56.19 59.46 91.53 91.24 91.48
Female % 46.55 34.29 37.92 81.14 75.83 79.59
Total % 52.05 48.29 48.29 88.06 83.36 87.07
9. Percentage of SC Population
% 3.46 3.71 3.56 2.69 4.01 3.06
10. Percentage of ST Population
% 20.23 0.66 12.70 12.18 0.26 8.85
11. % of Workers to total Population
% 36.19 28.48 33.22 51.70 31.35 46.01
Note : Figures of 1987-88 pertain to Census 1981 and figures of 2011-12 pertain to Census 2001. Data for Census 2011 are provisional figures.
26
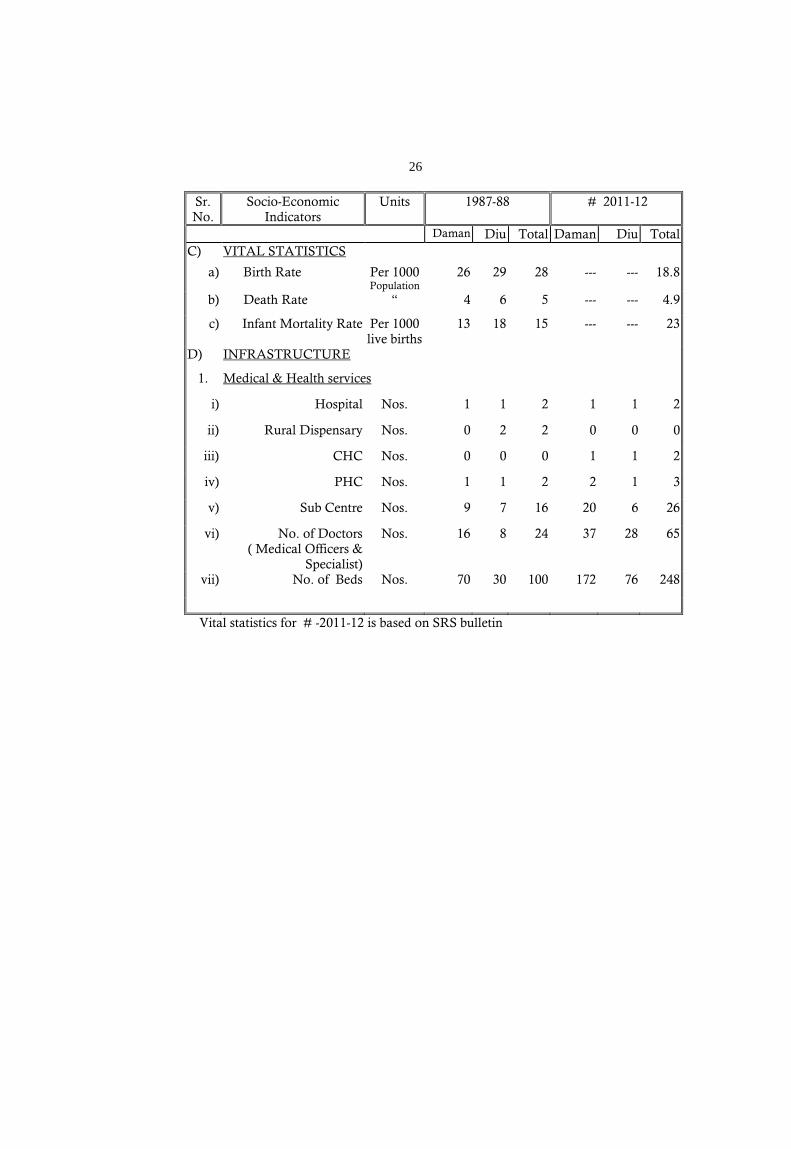
Sr. No.
Socio-Economic Indicators
Units 1987-88
# 2011-12
Daman Diu Total Daman Diu Total C) VITAL STATISTICS
a) Birth Rate Per 1000 Population
26 29 28 --- --- 18.8
b) Death Rate “ 4 6 5 --- --- 4.9
c) Infant Mortality Rate Per 1000 live births
13 18 15 --- --- 23
D) INFRASTRUCTURE
1. Medical & Health services
i) Hospital Nos. 1 1 2 1 1 2
ii) Rural Dispensary Nos. 0 2 2 0 0 0
iii) CHC Nos. 0 0 0 1 1 2
iv) PHC Nos. 1 1 2 2 1 3
v) Sub Centre Nos. 9 7 16 20 6 26
vi) No. of Doctors ( Medical Officers &
Specialist)
Nos. 16 8 24 37 28 65
vii) No. of Beds Nos. 70 30 100 172 76 248
Vital statistics for # -2011-12 is based on SRS bulletin
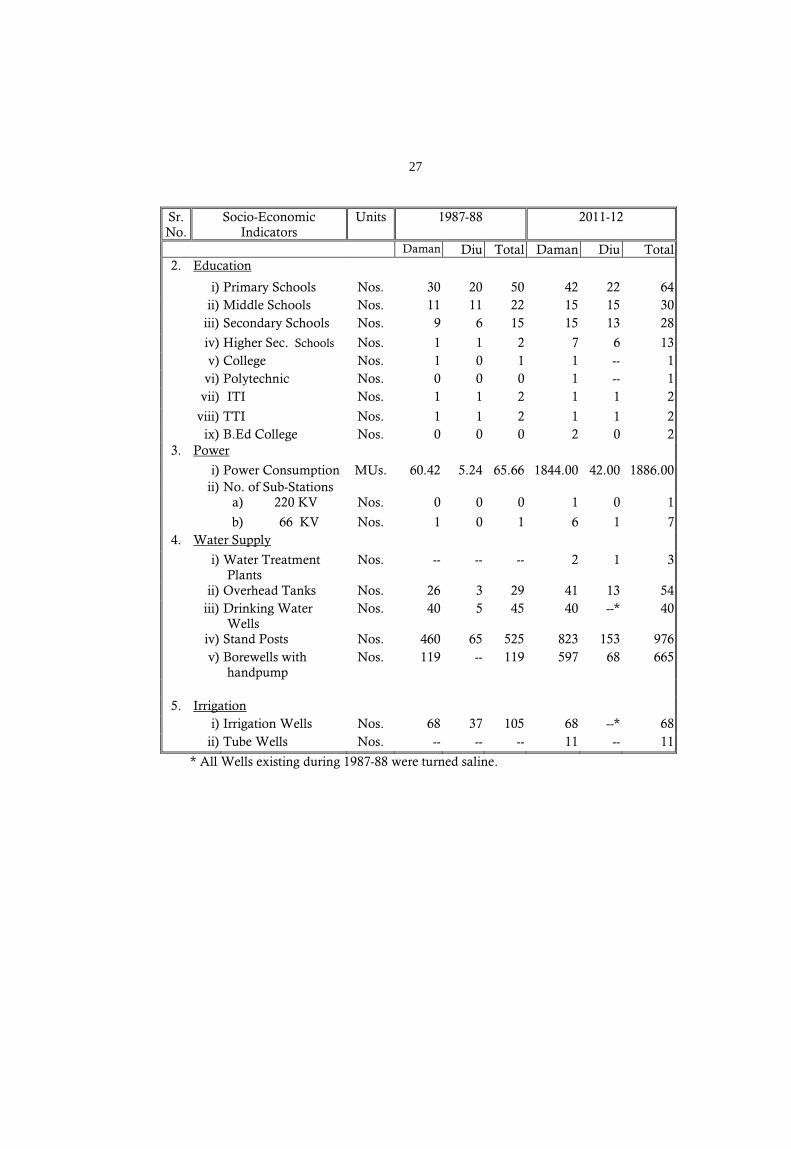
27
Sr. No.
Socio-Economic Indicators
Units 1987-88
2011-12
Daman Diu Total Daman Diu Total 2. Education
i) Primary Schools Nos. 30 20 50 42 22 64 ii) Middle Schools Nos. 11 11 22 15 15 30
iii) Secondary Schools Nos. 9 6 15 15 13 28
iv) Higher Sec. Schools Nos. 1 1 2 7 6 13 v) College Nos. 1 0 1 1 -- 1
vi) Polytechnic Nos. 0 0 0 1 -- 1 vii) ITI Nos. 1 1 2 1 1 2
viii) TTI Nos. 1 1 2 1 1 2 ix) B.Ed College Nos. 0 0 0 2 0 2
3. Power
i) Power Consumption MUs. 60.42 5.24 65.66 1844.00 42.00 1886.00 ii) No. of Sub-Stations
a) 220 KV Nos. 0 0 0 1 0 1
b) 66 KV Nos. 1 0 1 6 1 7 4. Water Supply
i) Water Treatment Plants
Nos. -- -- -- 2 1 3
ii) Overhead Tanks Nos. 26 3 29 41 13 54 iii) Drinking Water
Wells Nos. 40 5 45 40 --* 40
iv) Stand Posts Nos. 460 65 525 823 153 976 v) Borewells with
handpump Nos. 119 -- 119 597 68 665
5. Irrigation
i) Irrigation Wells Nos. 68 37 105 68 --* 68 ii) Tube Wells Nos. -- -- -- 11 -- 11
* All Wells existing during 1987-88 were turned saline.
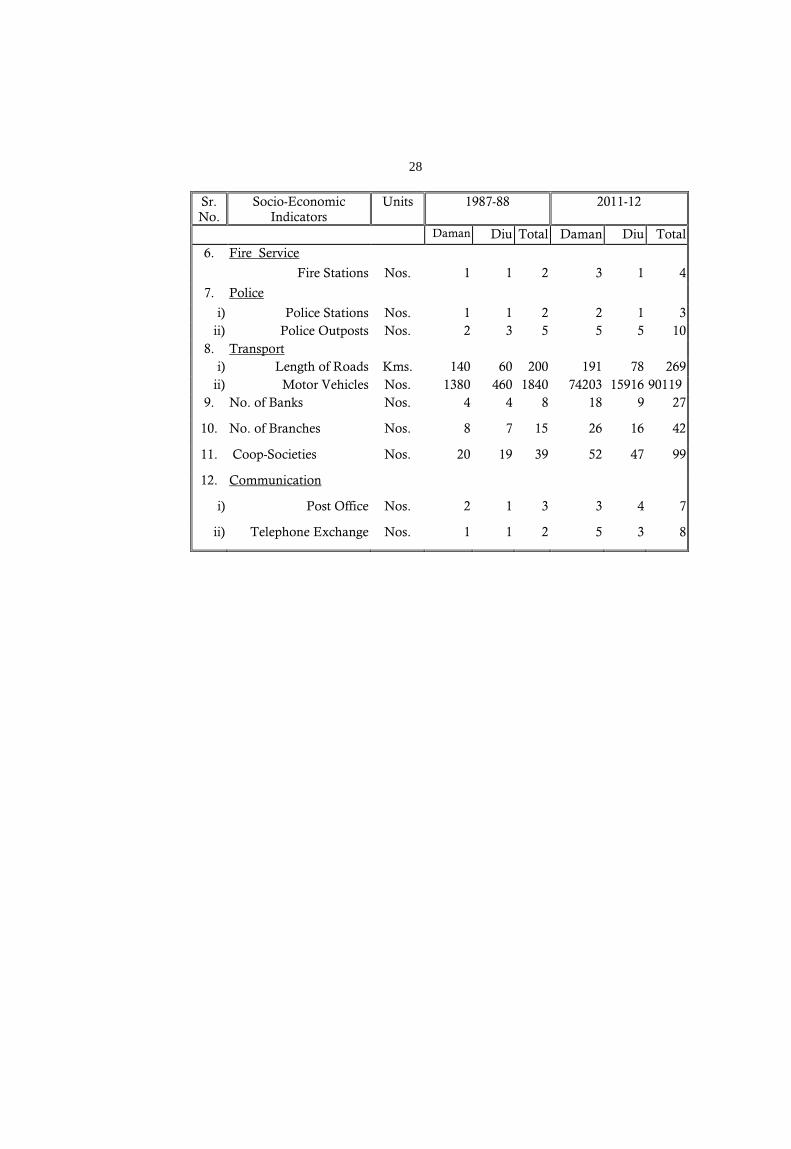
28
Sr. No.
Socio-Economic Indicators
Units 1987-88
2011-12
Daman Diu Total Daman Diu Total
6. Fire Service
Fire Stations Nos. 1 1 2 3 1 4
7. Police
i) Police Stations Nos. 1 1 2 2 1 3 ii) Police Outposts Nos. 2 3 5 5 5 10
8. Transport i) Length of Roads Kms. 140 60 200 191 78 269
ii) Motor Vehicles Nos. 1380 460 1840 74203 15916 90119 9. No. of Banks Nos. 4 4 8 18 9 27
10. No. of Branches Nos. 8 7 15 26 16 42
11. Coop-Societies Nos. 20 19 39 52 47 99
12. Communication
i) Post Office Nos. 2 1 3 3 4 7
ii) Telephone Exchange Nos. 1 1 2 5 3 8
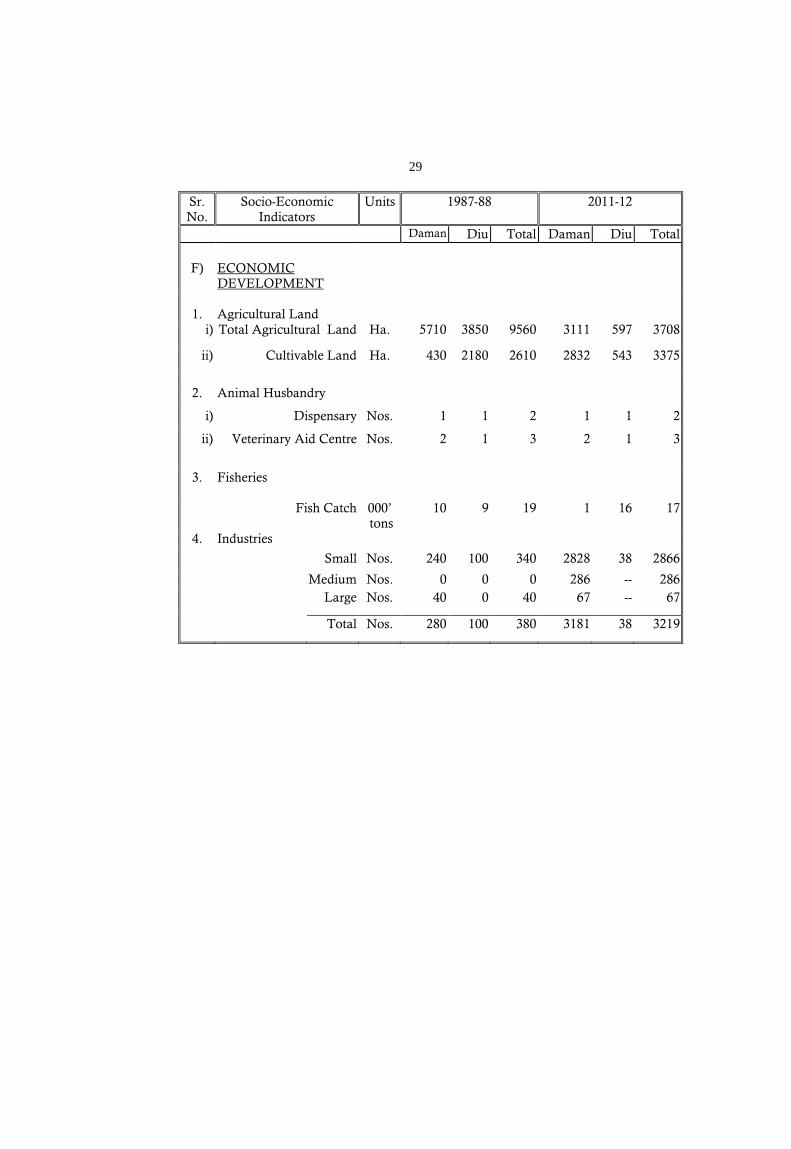
29
Sr. No.
Socio-Economic Indicators
Units 1987-88 2011-12
Daman Diu Total Daman Diu Total
F) ECONOMIC DEVELOPMENT
1. Agricultural Land
i) Total Agricultural Land Ha. 5710 3850 9560 3111 597 3708
ii) Cultivable Land Ha. 430 2180 2610 2832 543 3375
2. Animal Husbandry
i) Dispensary Nos. 1 1 2 1 1 2
ii) Veterinary Aid Centre Nos. 2 1 3 2 1 3
3. Fisheries
Fish Catch
000’ tons
10 9 19 1 16 17
4. Industries
Small Nos. 240 100 340 2828 38 2866
Medium Nos. 0 0 0 286 -- 286 Large Nos. 40 0 40 67 -- 67
Total Nos. 280 100 380 3181 38 3219
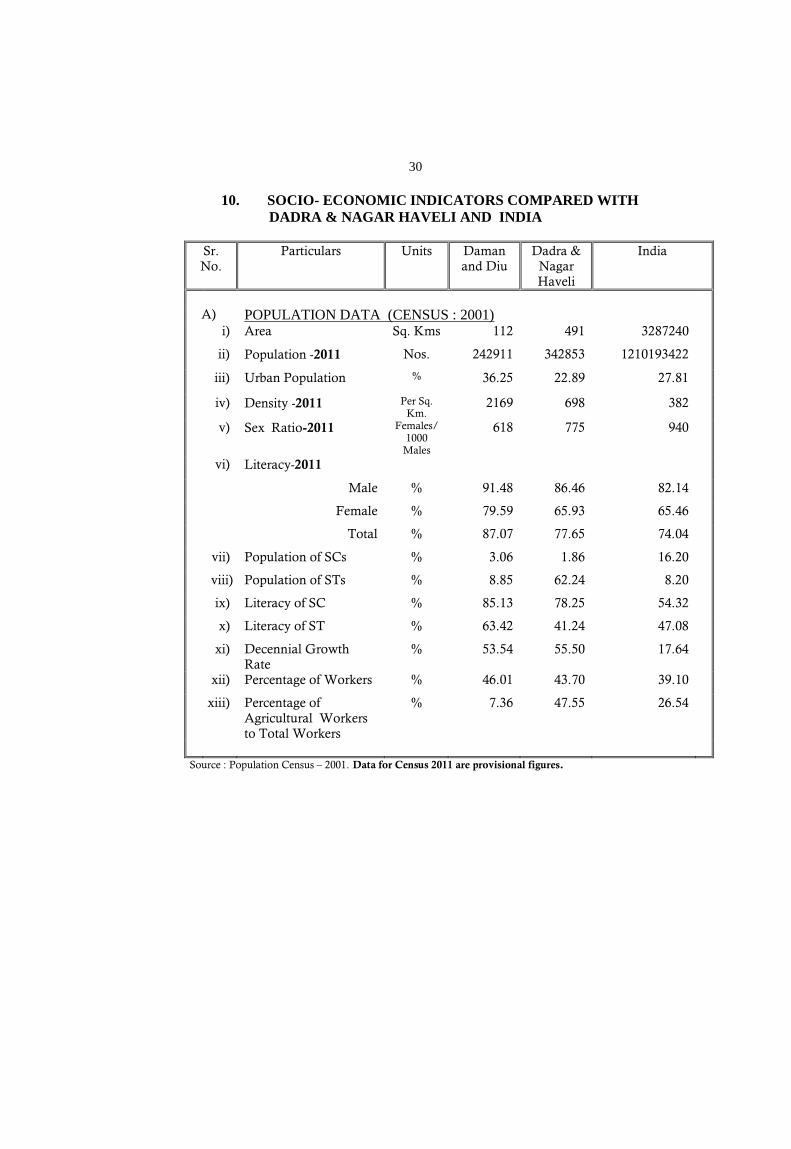
30
10. SOCIO- ECONOMIC INDICATORS COMPARED WITH
DADRA & NAGAR HAVELI AND INDIA
Sr. No.
Particulars Units Daman and Diu
Dadra & Nagar Haveli
India
A) POPULATION DATA (CENSUS : 2001)
i) Area Sq. Kms 112 491 3287240
ii) Population -2011 Nos. 242911 342853 1210193422
iii) Urban Population % 36.25 22.89 27.81
iv) Density -2011 Per Sq. Km.
2169 698 382
v) Sex Ratio-2011 Females/ 1000
Males
618 775 940
vi) Literacy-2011
Male % 91.48 86.46 82.14
Female % 79.59 65.93 65.46
Total % 87.07 77.65 74.04
vii) Population of SCs % 3.06 1.86 16.20
viii) Population of STs % 8.85 62.24 8.20
ix) Literacy of SC % 85.13 78.25 54.32
x) Literacy of ST % 63.42 41.24 47.08
xi) Decennial Growth Rate
% 53.54 55.50 17.64
xii) Percentage of Workers % 46.01 43.70 39.10
xiii) Percentage of Agricultural Workers to Total Workers
% 7.36 47.55 26.54
Source : Population Census – 2001. Data for Census 2011 are provisional figures.
31
Sr. No.
Particulars Units Daman and Diu
Dadra & Nagar Haveli
India
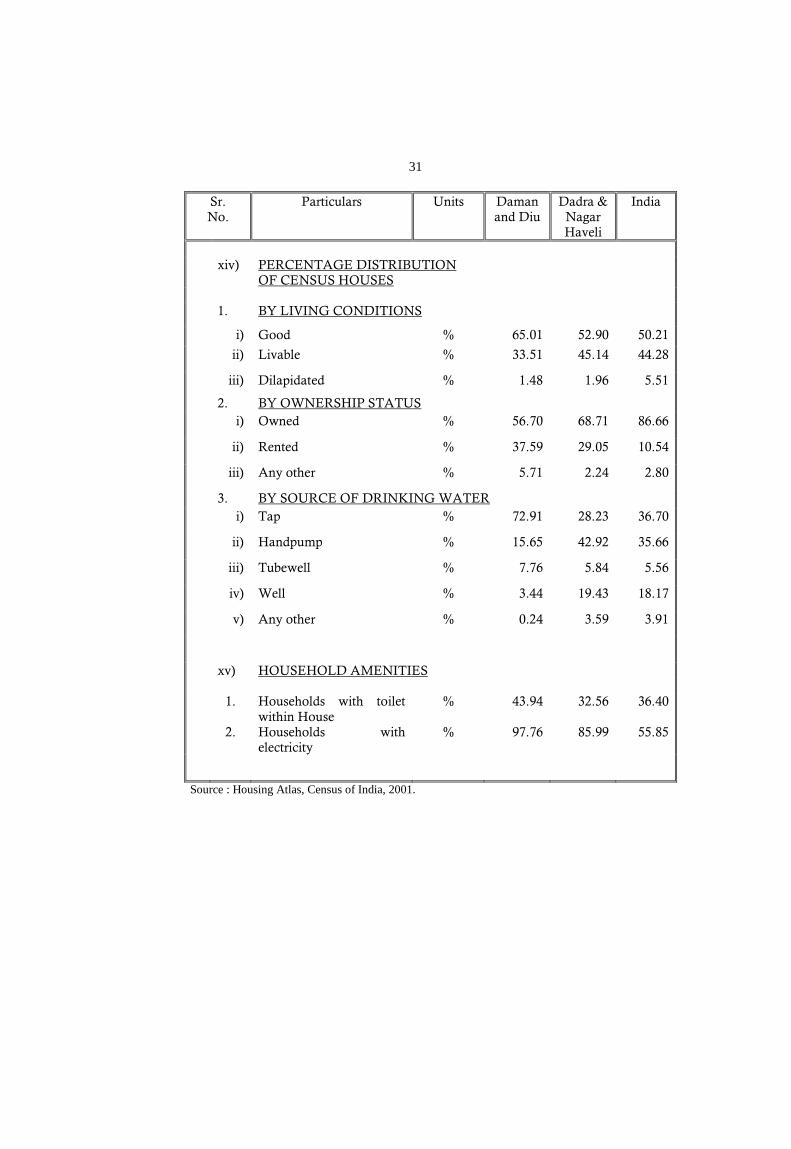
xiv) PERCENTAGE DISTRIBUTION
OF CENSUS HOUSES
1. BY LIVING CONDITIONS
i) Good % 65.01 52.90 50.21
ii) Livable % 33.51 45.14 44.28
iii) Dilapidated % 1.48 1.96 5.51
2. BY OWNERSHIP STATUS i) Owned % 56.70 68.71 86.66
ii) Rented % 37.59 29.05 10.54
iii) Any other % 5.71 2.24 2.80
3. BY SOURCE OF DRINKING WATER i) Tap % 72.91 28.23 36.70
ii) Handpump % 15.65 42.92 35.66
iii) Tubewell % 7.76 5.84 5.56
iv) Well % 3.44 19.43 18.17
v) Any other % 0.24 3.59 3.91
xv) HOUSEHOLD AMENITIES 1. Households with toilet
within House % 43.94 32.56 36.40
2. Households with electricity
% 97.76 85.99 55.85
Source : Housing Atlas, Census of India, 2001.
32
Sr. No.
Particulars Units Daman and Diu
Dadra & Nagar Haveli
India
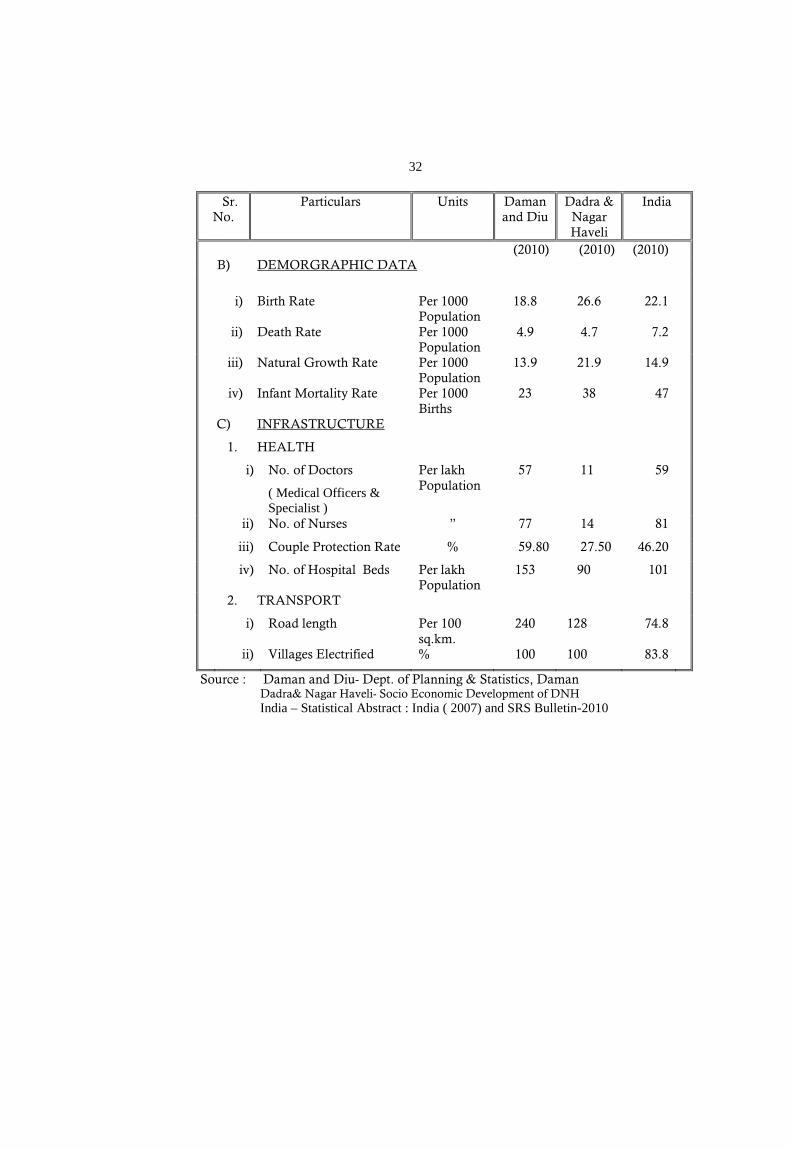
(2010) (2010) (2010) B) DEMORGRAPHIC DATA
i) Birth Rate Per 1000 Population
18.8 26.6 22.1
ii) Death Rate Per 1000 Population
4.9 4.7 7.2
iii) Natural Growth Rate Per 1000 Population
13.9 21.9 14.9
iv) Infant Mortality Rate Per 1000 Births
23 38 47
C) INFRASTRUCTURE
1. HEALTH
i) No. of Doctors
( Medical Officers & Specialist )
Per lakh Population
57 11 59
ii) No. of Nurses ” 77 14 81
iii) Couple Protection Rate % 59.80 27.50 46.20
iv) No. of Hospital Beds Per lakh Population
153 90 101
2. TRANSPORT
i) Road length Per 100 sq.km.
240 128 74.8
ii) Villages Electrified % 100 100 83.8
Source : Daman and Diu- Dept. of Planning & Statistics, Daman Dadra& Nagar Haveli- Socio Economic Development of DNH India – Statistical Abstract : India ( 2007) and SRS Bulletin-2010
33
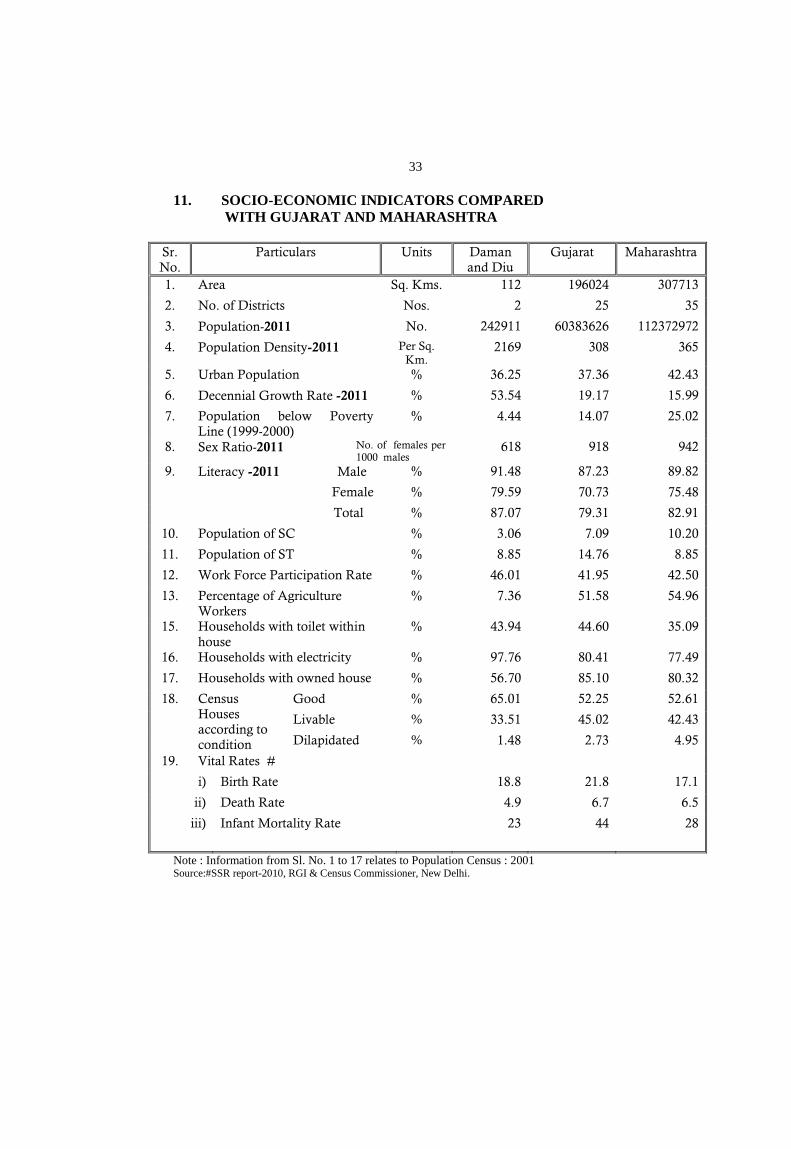
11. SOCIO-ECONOMIC INDICATORS COMPARED WITH GUJARAT AND MAHARASHTRA
Sr. No.
Particulars Units Daman and Diu
Gujarat Maharashtra
1. Area Sq. Kms. 112 196024 307713
2. No. of Districts Nos. 2 25 35
3. Population-2011 No. 242911 60383626 112372972
4. Population Density-2011 Per Sq. Km.
2169 308 365
5. Urban Population % 36.25 37.36 42.43
6. Decennial Growth Rate -2011 % 53.54 19.17 15.99
7. Population below Poverty Line (1999-2000)
% 4.44 14.07 25.02
8. Sex Ratio-2011 No. of females per 1000 males
618 918 942
9. Literacy -2011 Male % 91.48 87.23 89.82
Female % 79.59 70.73 75.48
Total % 87.07 79.31 82.91
10. Population of SC % 3.06 7.09 10.20
11. Population of ST % 8.85 14.76 8.85
12. Work Force Participation Rate % 46.01 41.95 42.50
13. Percentage of Agriculture Workers
% 7.36 51.58 54.96
15. Households with toilet within house
% 43.94 44.60 35.09
16. Households with electricity % 97.76 80.41 77.49
17. Households with owned house % 56.70 85.10 80.32
18. Census Houses according to condition
Good % 65.01 52.25 52.61
Livable % 33.51 45.02 42.43
Dilapidated % 1.48 2.73 4.95
19. Vital Rates #
i) Birth Rate 18.8 21.8 17.1
ii) Death Rate 4.9 6.7 6.5
iii) Infant Mortality Rate 23 44 28
Note : Information from Sl. No. 1 to 17 relates to Population Census : 2001 Source:#SSR report-2010, RGI & Census Commissioner, New Delhi.
34
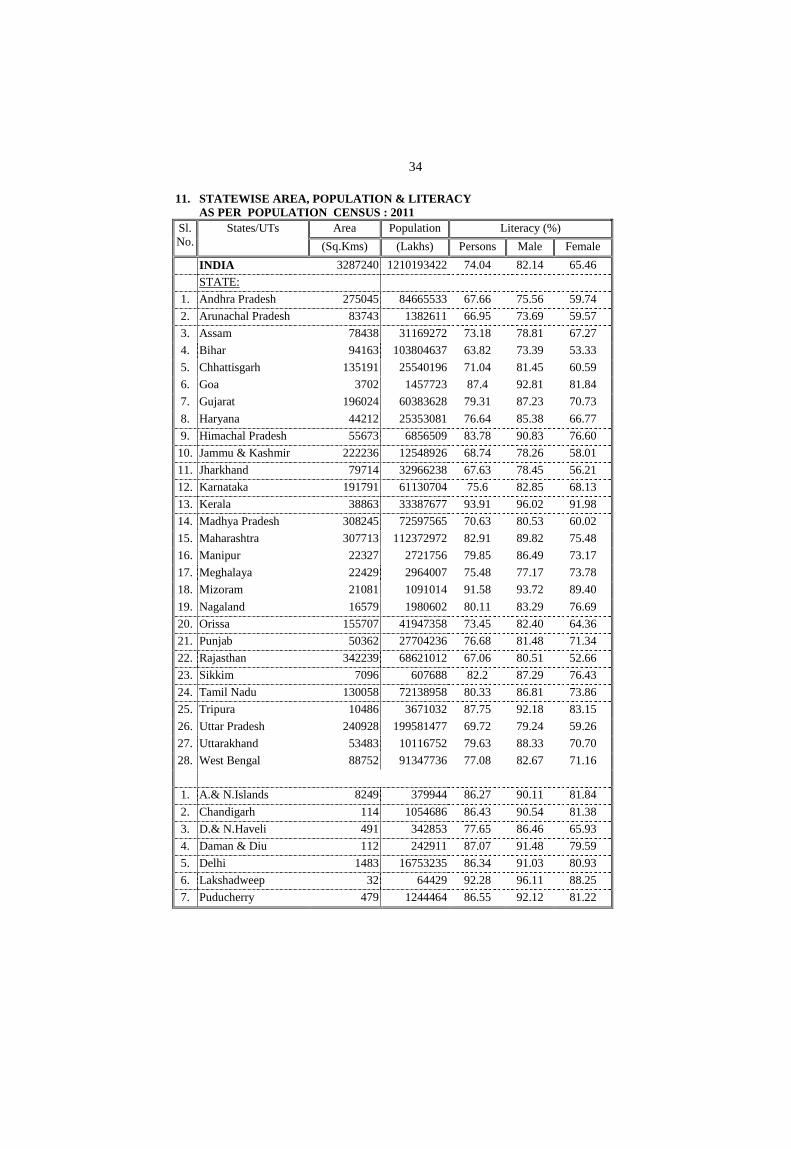
11. STATEWISE AREA, POPULATION & LITERACY
AS PER POPULATION CENSUS : 2011 Sl. No.
States/UTs Area Population Literacy (%) (Sq.Kms) (Lakhs) Persons Male Female
INDIA 3287240 1210193422 74.04 82.14 65.46 STATE: 1. Andhra Pradesh 275045 84665533 67.66 75.56 59.74 2. Arunachal Pradesh 83743 1382611 66.95 73.69 59.57 3. Assam 78438 31169272 73.18 78.81 67.27 4. Bihar 94163 103804637 63.82 73.39 53.33 5. Chhattisgarh 135191 25540196 71.04 81.45 60.59 6. Goa 3702 1457723 87.4 92.81 81.84 7. Gujarat 196024 60383628 79.31 87.23 70.73 8. Haryana 44212 25353081 76.64 85.38 66.77 9. Himachal Pradesh 55673 6856509 83.78 90.83 76.60
10. Jammu & Kashmir 222236 12548926 68.74 78.26 58.01 11. Jharkhand 79714 32966238 67.63 78.45 56.21 12. Karnataka 191791 61130704 75.6 82.85 68.13 13. Kerala 38863 33387677 93.91 96.02 91.98 14. Madhya Pradesh 308245 72597565 70.63 80.53 60.02 15. Maharashtra 307713 112372972 82.91 89.82 75.48 16. Manipur 22327 2721756 79.85 86.49 73.17 17. Meghalaya 22429 2964007 75.48 77.17 73.78 18. Mizoram 21081 1091014 91.58 93.72 89.40 19. Nagaland 16579 1980602 80.11 83.29 76.69 20. Orissa 155707 41947358 73.45 82.40 64.36 21. Punjab 50362 27704236 76.68 81.48 71.34 22. Rajasthan 342239 68621012 67.06 80.51 52.66 23. Sikkim 7096 607688 82.2 87.29 76.43 24. Tamil Nadu 130058 72138958 80.33 86.81 73.86 25. Tripura 10486 3671032 87.75 92.18 83.15 26. Uttar Pradesh 240928 199581477 69.72 79.24 59.26 27. Uttarakhand 53483 10116752 79.63 88.33 70.70 28. West Bengal 88752 91347736 77.08 82.67 71.16
1. A.& N.Islands 8249 379944 86.27 90.11 81.84 2. Chandigarh 114 1054686 86.43 90.54 81.38 3. D.& N.Haveli 491 342853 77.65 86.46 65.93 4. Daman & Diu 112 242911 87.07 91.48 79.59 5. Delhi 1483 16753235 86.34 91.03 80.93 6. Lakshadweep 32 64429 92.28 96.11 88.25 7. Puducherry 479 1244464 86.55 92.12 81.22
35
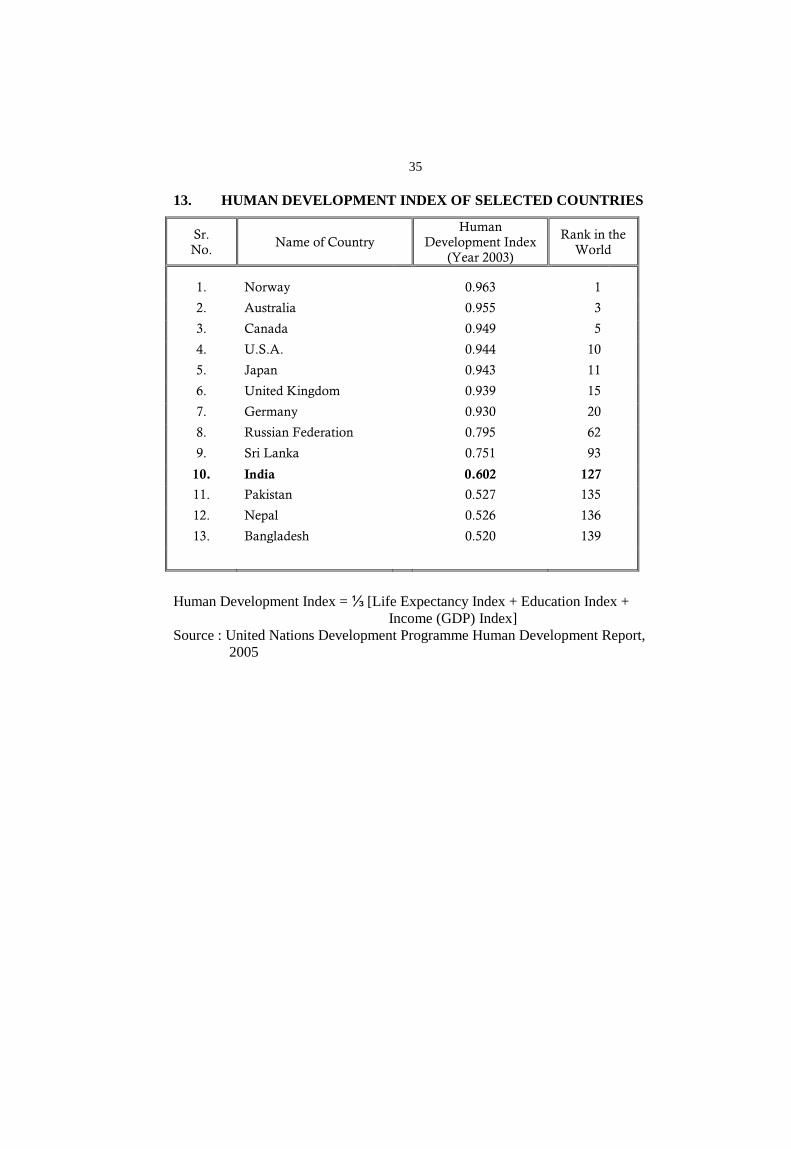
13. HUMAN DEVELOPMENT INDEX OF SELECTED COUNTRIES
Sr. No.
Name of Country Human
Development Index (Year 2003)
Rank in the World
1. Norway 0.963 1
2. Australia 0.955 3
3. Canada 0.949 5
4. U.S.A. 0.944 10
5. Japan 0.943 11
6. United Kingdom 0.939 15
7. Germany 0.930 20
8. Russian Federation 0.795 62
9. Sri Lanka 0.751 93
10. India 0.602 127
11. Pakistan 0.527 135
12. Nepal 0.526 136
13. Bangladesh 0.520 139
Human Development Index = ⅓ [Life Expectancy Index + Education Index +
Income (GDP) Index] Source : United Nations Development Programme Human Development Report,
2005
36
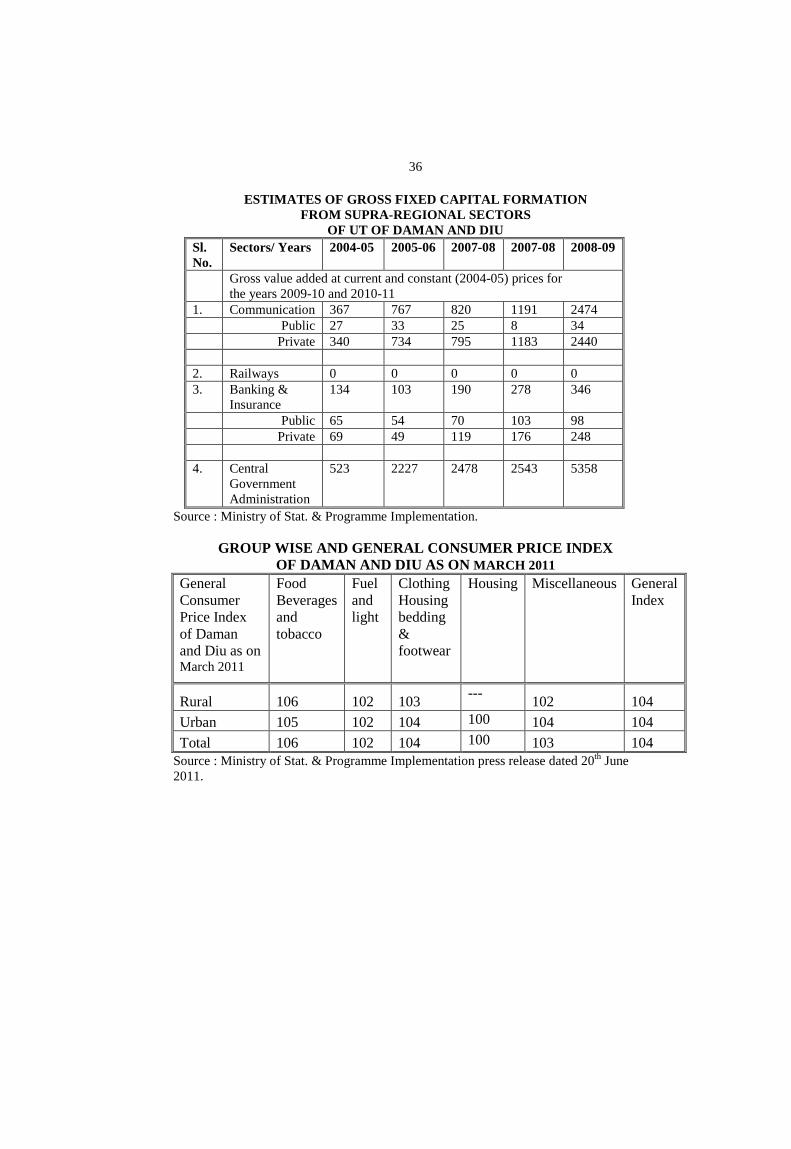
ESTIMATES OF GROSS FIXED CAPITAL FORMATION
FROM SUPRA-REGIONAL SECTORS OF UT OF DAMAN AND DIU
Sl. No.
Sectors/ Years 2004-05 2005-06 2007-08 2007-08 2008-09
Gross value added at current and constant (2004-05) prices for the years 2009-10 and 2010-11
1. Communication 367 767 820 1191 2474 Public 27 33 25 8 34 Private 340 734 795 1183 2440 2. Railways 0 0 0 0 0 3. Banking &
Insurance 134 103 190 278 346
Public 65 54 70 103 98 Private 69 49 119 176 248 4. Central
Government Administration
523 2227 2478 2543 5358
Source : Ministry of Stat. & Programme Implementation.
GROUP WISE AND GENERAL CONSUMER PRICE INDEX OF DAMAN AND DIU AS ON MARCH 2011
General Consumer Price Index of Daman and Diu as on March 2011
Food Beverages and tobacco
Fuel and light
Clothing Housing bedding & footwear
Housing Miscellaneous General Index
Rural 106 102 103 --- 102 104 Urban 105 102 104 100 104 104 Total 106 102 104 100 103 104
Source : Ministry of Stat. & Programme Implementation press release dated 20th
June 2011.
37
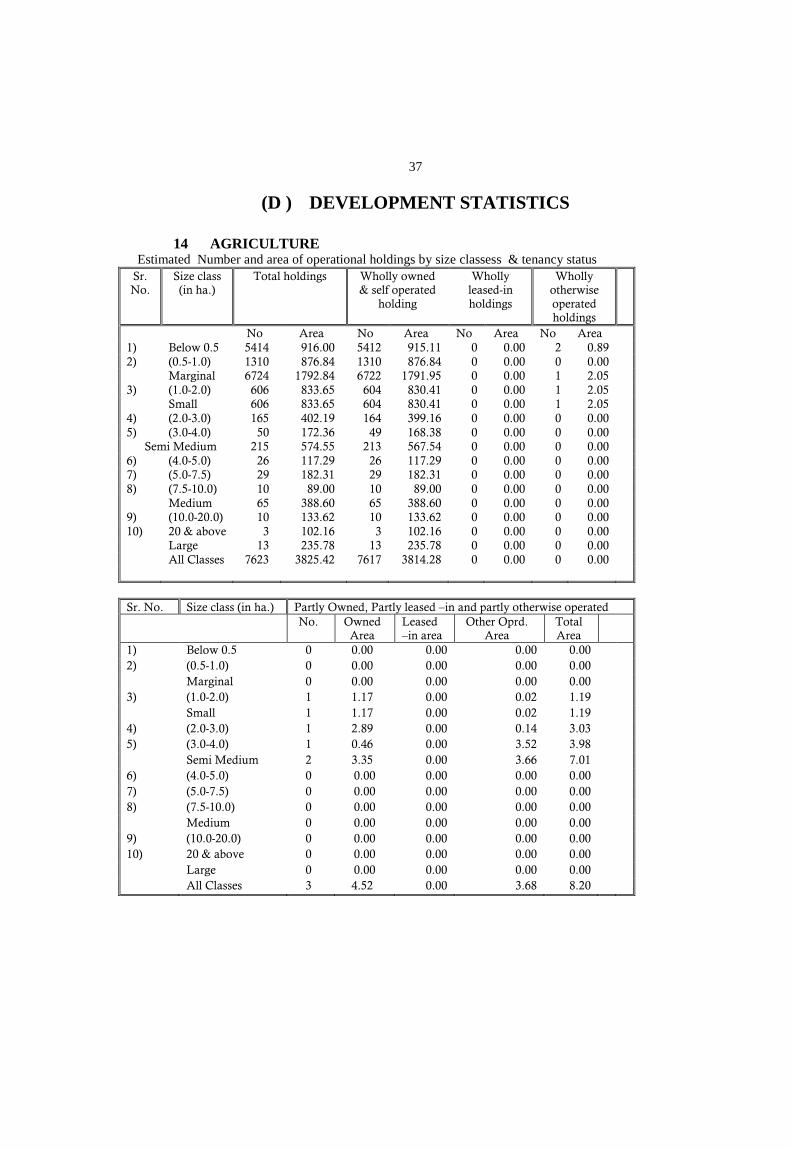
(D ) DEVELOPMENT STATISTICS 14 AGRICULTURE
Estimated Number and area of operational holdings by size classess & tenancy status Sr. No.
Size class (in ha.)
Total holdings Wholly owned & self operated
holding
Wholly leased-in holdings
Wholly otherwise operated holdings
No Area No Area No Area No Area 1) Below 0.5 5414 916.00 5412 915.11 0 0.00 2 0.89 2) (0.5-1.0) 1310 876.84 1310 876.84 0 0.00 0 0.00 Marginal 6724 1792.84 6722 1791.95 0 0.00 1 2.05 3) (1.0-2.0) 606 833.65 604 830.41 0 0.00 1 2.05 Small 606 833.65 604 830.41 0 0.00 1 2.05 4) (2.0-3.0) 165 402.19 164 399.16 0 0.00 0 0.00 5) (3.0-4.0) 50 172.36 49 168.38 0 0.00 0 0.00 Semi Medium 215 574.55 213 567.54 0 0.00 0 0.00 6) (4.0-5.0) 26 117.29 26 117.29 0 0.00 0 0.00 7) (5.0-7.5) 29 182.31 29 182.31 0 0.00 0 0.00 8) (7.5-10.0) 10 89.00 10 89.00 0 0.00 0 0.00 Medium 65 388.60 65 388.60 0 0.00 0 0.00 9) (10.0-20.0) 10 133.62 10 133.62 0 0.00 0 0.00 10) 20 & above 3 102.16 3 102.16 0 0.00 0 0.00 Large 13 235.78 13 235.78 0 0.00 0 0.00 All Classes 7623 3825.42 7617 3814.28 0 0.00 0 0.00
Sr. No. Size class (in ha.) Partly Owned, Partly leased –in and partly otherwise operated No. Owned
Area Leased –in area
Other Oprd. Area
Total Area
1) Below 0.5 0 0.00 0.00 0.00 0.00 2) (0.5-1.0) 0 0.00 0.00 0.00 0.00 Marginal 0 0.00 0.00 0.00 0.00 3) (1.0-2.0) 1 1.17 0.00 0.02 1.19 Small 1 1.17 0.00 0.02 1.19 4) (2.0-3.0) 1 2.89 0.00 0.14 3.03 5) (3.0-4.0) 1 0.46 0.00 3.52 3.98 Semi Medium 2 3.35 0.00 3.66 7.01 6) (4.0-5.0) 0 0.00 0.00 0.00 0.00 7) (5.0-7.5) 0 0.00 0.00 0.00 0.00 8) (7.5-10.0) 0 0.00 0.00 0.00 0.00 Medium 0 0.00 0.00 0.00 0.00 9) (10.0-20.0) 0 0.00 0.00 0.00 0.00 10) 20 & above 0 0.00 0.00 0.00 0.00 Large 0 0.00 0.00 0.00 0.00 All Classes 3 4.52 0.00 3.68 8.20
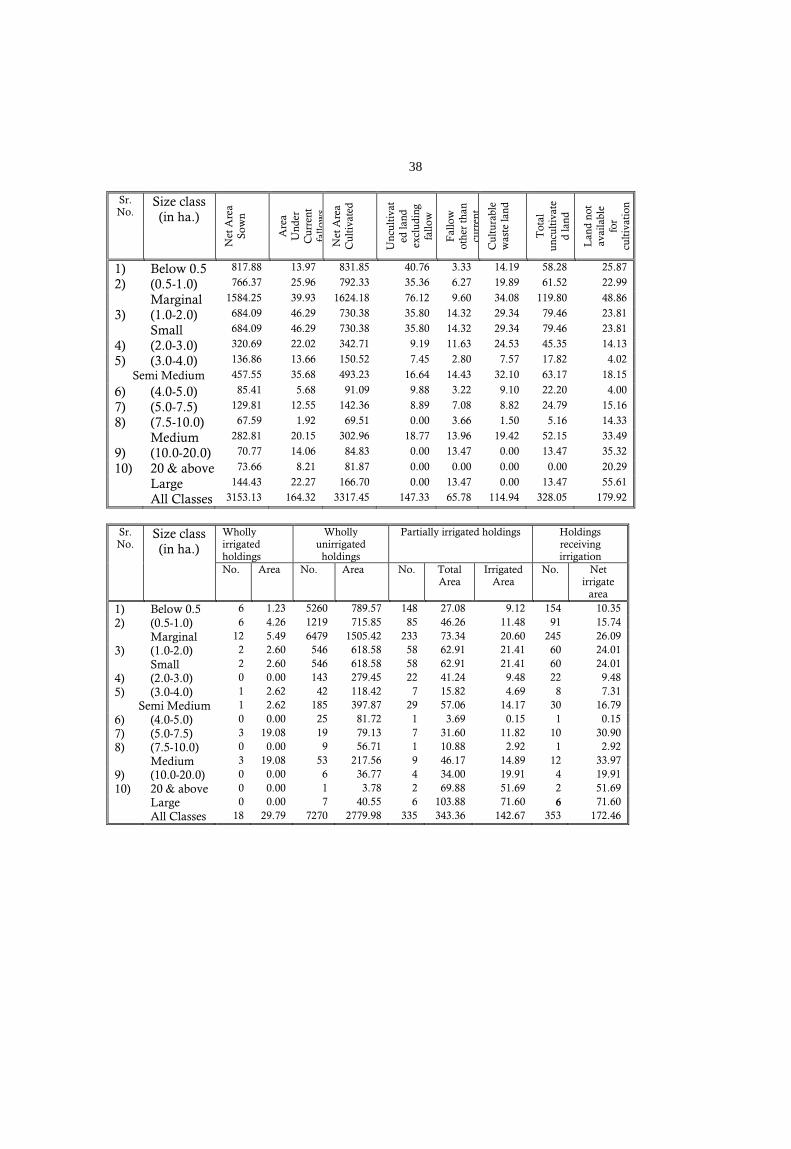
38
Sr. No.
Size class (in ha.)
Net
Are
a So
wn
Are
a U
nder
C
urre
nt
fallo
ws
Net
Are
a C
ulti
vate
d
Unc
ultiv
ated
land
ex
clud
ing
fallo
w
Fal
low
ot
her
than
cu
rren
t C
ultu
rabl
e w
aste
land
Tot
al
uncu
ltiva
ted
land
Lan
d no
t av
aila
ble
for
culti
vati
on
1) Below 0.5 817.88 13.97 831.85 40.76 3.33 14.19 58.28 25.87
2) (0.5-1.0) 766.37 25.96 792.33 35.36 6.27 19.89 61.52 22.99
Marginal 1584.25 39.93 1624.18 76.12 9.60 34.08 119.80 48.86
3) (1.0-2.0) 684.09 46.29 730.38 35.80 14.32 29.34 79.46 23.81
Small 684.09 46.29 730.38 35.80 14.32 29.34 79.46 23.81
4) (2.0-3.0) 320.69 22.02 342.71 9.19 11.63 24.53 45.35 14.13
5) (3.0-4.0) 136.86 13.66 150.52 7.45 2.80 7.57 17.82 4.02
Semi Medium 457.55 35.68 493.23 16.64 14.43 32.10 63.17 18.15
6) (4.0-5.0) 85.41 5.68 91.09 9.88 3.22 9.10 22.20 4.00
7) (5.0-7.5) 129.81 12.55 142.36 8.89 7.08 8.82 24.79 15.16
8) (7.5-10.0) 67.59 1.92 69.51 0.00 3.66 1.50 5.16 14.33
Medium 282.81 20.15 302.96 18.77 13.96 19.42 52.15 33.49
9) (10.0-20.0) 70.77 14.06 84.83 0.00 13.47 0.00 13.47 35.32
10) 20 & above 73.66 8.21 81.87 0.00 0.00 0.00 0.00 20.29
Large 144.43 22.27 166.70 0.00 13.47 0.00 13.47 55.61
All Classes 3153.13 164.32 3317.45 147.33 65.78 114.94 328.05 179.92
Sr. No.
Size class (in ha.)
Wholly irrigated holdings
Wholly unirrigated
holdings
Partially irrigated holdings Holdings receiving irrigation
No. Area No. Area No. Total Area
Irrigated Area
No. Net irrigate
area
1) Below 0.5 6 1.23 5260 789.57 148 27.08 9.12 154 10.35 2) (0.5-1.0) 6 4.26 1219 715.85 85 46.26 11.48 91 15.74 Marginal 12 5.49 6479 1505.42 233 73.34 20.60 245 26.09 3) (1.0-2.0) 2 2.60 546 618.58 58 62.91 21.41 60 24.01 Small 2 2.60 546 618.58 58 62.91 21.41 60 24.01 4) (2.0-3.0) 0 0.00 143 279.45 22 41.24 9.48 22 9.48 5) (3.0-4.0) 1 2.62 42 118.42 7 15.82 4.69 8 7.31 Semi Medium 1 2.62 185 397.87 29 57.06 14.17 30 16.79 6) (4.0-5.0) 0 0.00 25 81.72 1 3.69 0.15 1 0.15 7) (5.0-7.5) 3 19.08 19 79.13 7 31.60 11.82 10 30.90 8) (7.5-10.0) 0 0.00 9 56.71 1 10.88 2.92 1 2.92 Medium 3 19.08 53 217.56 9 46.17 14.89 12 33.97 9) (10.0-20.0) 0 0.00 6 36.77 4 34.00 19.91 4 19.91 10) 20 & above 0 0.00 1 3.78 2 69.88 51.69 2 51.69 Large 0 0.00 7 40.55 6 103.88 71.60 6 71.60 All Classes 18 29.79 7270 2779.98 335 343.36 142.67 353 172.46
39
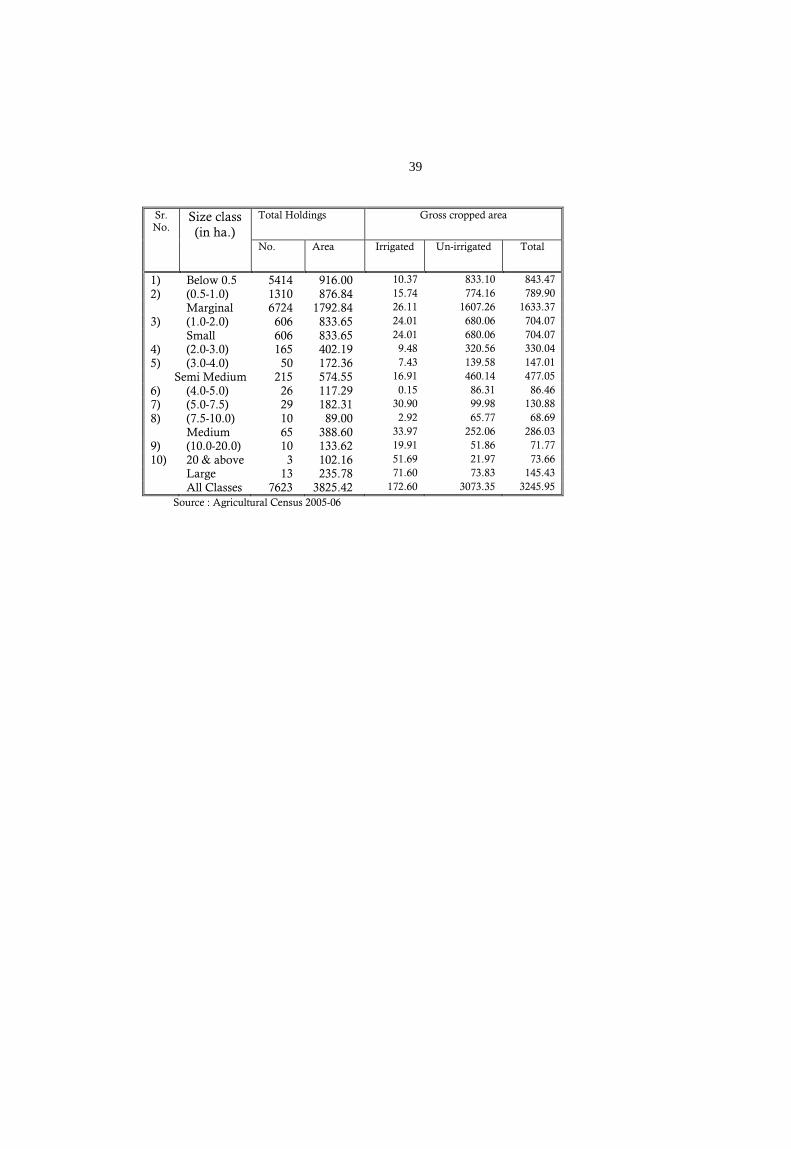
Sr. No.
Size class (in ha.)
Total Holdings Gross cropped area
No. Area Irrigated Un-irrigated Total
1) Below 0.5 5414 916.00 10.37 833.10 843.47 2) (0.5-1.0) 1310 876.84 15.74 774.16 789.90 Marginal 6724 1792.84 26.11 1607.26 1633.37 3) (1.0-2.0) 606 833.65 24.01 680.06 704.07 Small 606 833.65 24.01 680.06 704.07 4) (2.0-3.0) 165 402.19 9.48 320.56 330.04 5) (3.0-4.0) 50 172.36 7.43 139.58 147.01 Semi Medium 215 574.55 16.91 460.14 477.05 6) (4.0-5.0) 26 117.29 0.15 86.31 86.46 7) (5.0-7.5) 29 182.31 30.90 99.98 130.88 8) (7.5-10.0) 10 89.00 2.92 65.77 68.69 Medium 65 388.60 33.97 252.06 286.03 9) (10.0-20.0) 10 133.62 19.91 51.86 71.77 10) 20 & above 3 102.16 51.69 21.97 73.66 Large 13 235.78 71.60 73.83 145.43 All Classes 7623 3825.42 172.60 3073.35 3245.95
Source : Agricultural Census 2005-06
40
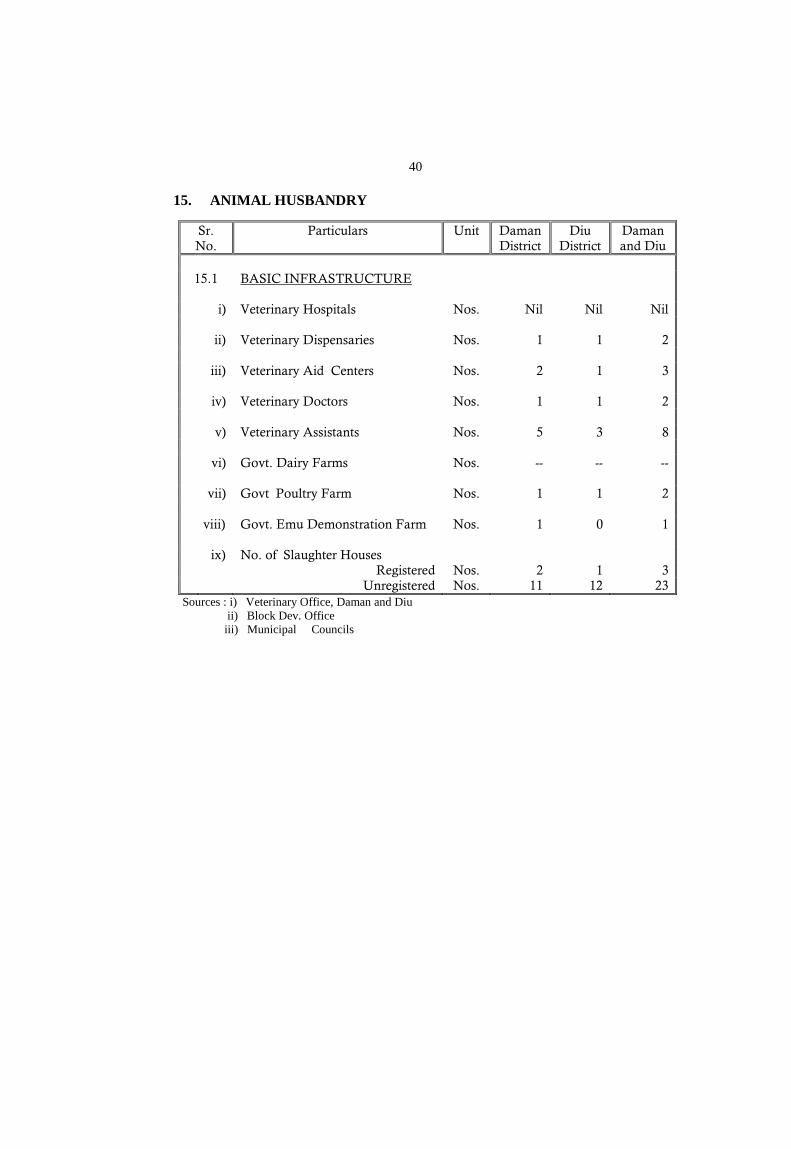
15. ANIMAL HUSBANDRY
Sr. No.
Particulars Unit Daman District
Diu District
Daman and Diu
15.1 BASIC INFRASTRUCTURE
i) Veterinary Hospitals Nos. Nil Nil Nil ii) Veterinary Dispensaries Nos. 1 1 2 iii) Veterinary Aid Centers Nos. 2 1 3 iv) Veterinary Doctors Nos. 1 1 2 v) Veterinary Assistants Nos. 5 3 8 vi) Govt. Dairy Farms Nos. -- -- -- vii) Govt Poultry Farm Nos. 1 1 2 viii) Govt. Emu Demonstration Farm
Nos. 1 0 1
ix) No. of Slaughter Houses Registered Nos. 2 1 3 Unregistered Nos. 11 12 23
Sources : i) Veterinary Office, Daman and Diu ii) Block Dev. Office iii) Municipal Councils
41
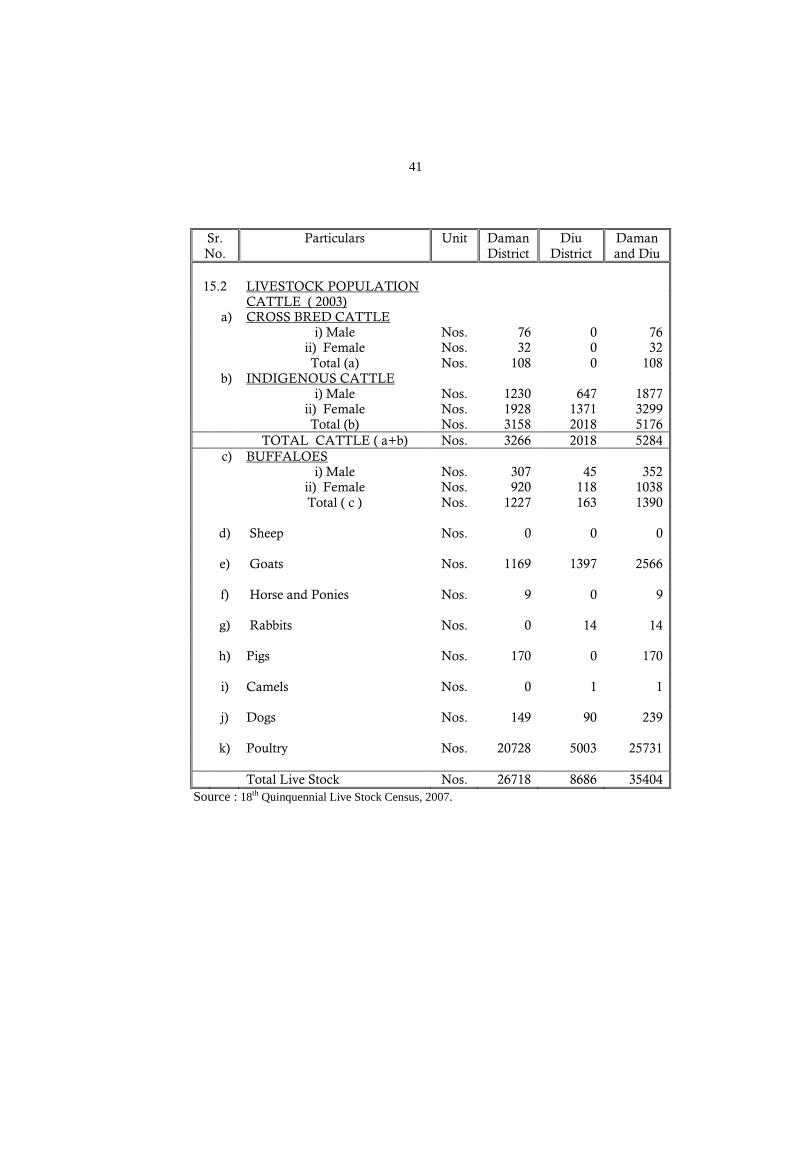
Sr. No.
Particulars Unit Daman District
Diu District
Daman and Diu
15.2 LIVESTOCK POPULATION CATTLE ( 2003)
a) CROSS BRED CATTLE i) Male Nos. 76 0 76 ii) Female Nos. 32 0 32 Total (a) Nos. 108 0 108
b) INDIGENOUS CATTLE i) Male Nos. 1230 647 1877 ii) Female Nos. 1928 1371 3299 Total (b) Nos. 3158 2018 5176 TOTAL CATTLE ( a+b) Nos. 3266 2018 5284
c) BUFFALOES i) Male Nos. 307 45 352 ii) Female Nos. 920 118 1038 Total ( c ) Nos. 1227 163 1390 d) Sheep Nos. 0 0 0 e) Goats Nos. 1169 1397 2566 f) Horse and Ponies Nos. 9 0 9 g) Rabbits Nos. 0 14 14 h) Pigs Nos. 170 0 170 i) Camels Nos. 0 1 1 j) Dogs Nos. 149 90 239 k) Poultry Nos. 20728 5003 25731 Total Live Stock Nos. 26718 8686 35404
Source : 18th
Quinquennial Live Stock Census, 2007.
42
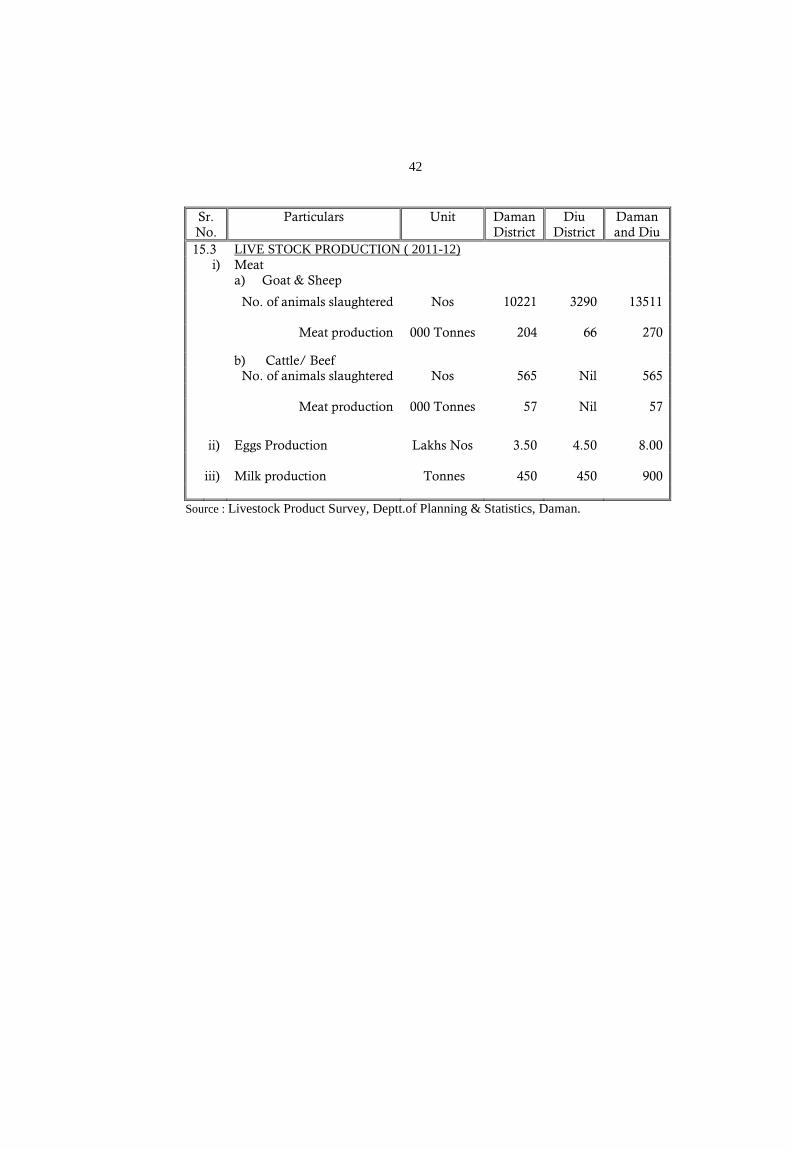
Sr. No.
Particulars Unit Daman District
Diu District
Daman and Diu
15.3 LIVE STOCK PRODUCTION ( 2011-12) i) Meat a) Goat & Sheep
No. of animals slaughtered Nos 10221 3290 13511 Meat production 000 Tonnes 204 66 270
b) Cattle/ Beef No. of animals slaughtered Nos 565 Nil 565 Meat production 000 Tonnes 57 Nil 57
ii) Eggs Production Lakhs Nos 3.50 4.50 8.00
iii) Milk production Tonnes 450 450 900
Source : Livestock Product Survey, Deptt.of Planning & Statistics, Daman.
43
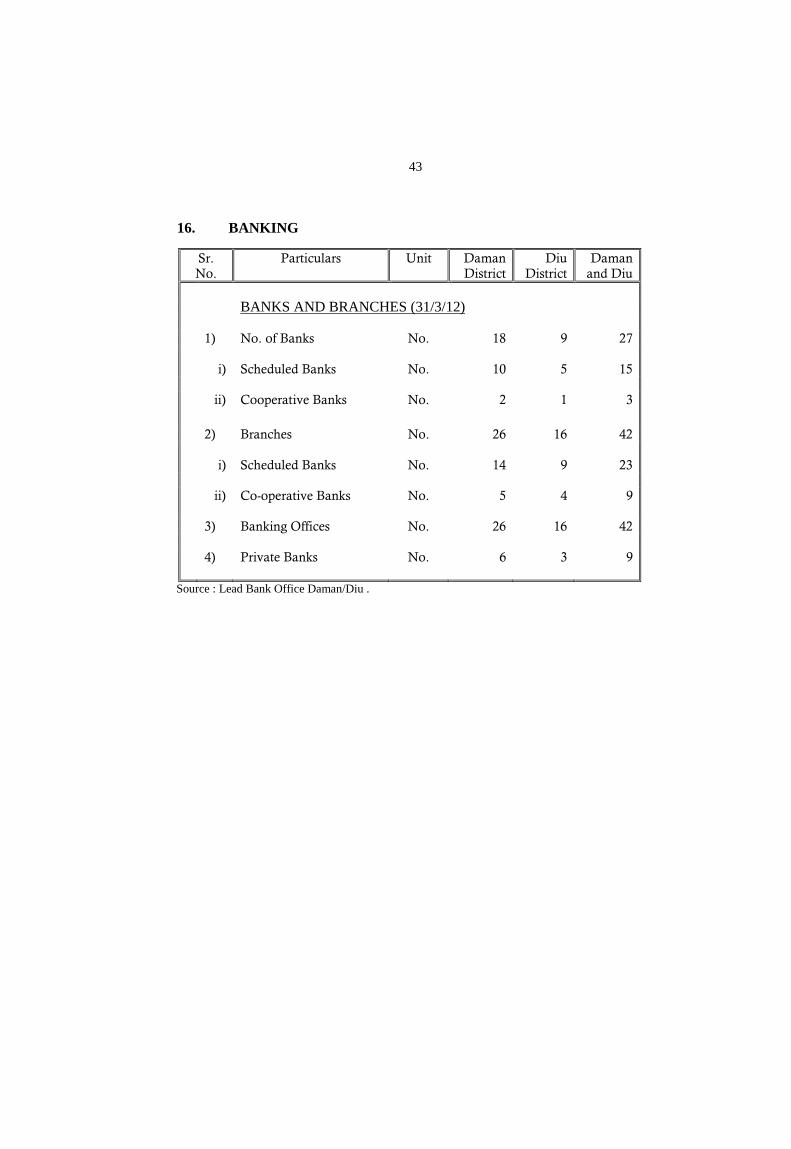
16. BANKING
Sr. No.
Particulars Unit Daman District
Diu District
Daman and Diu
BANKS AND BRANCHES (31/3/12)
1) No. of Banks No. 18 9 27 i) Scheduled Banks No. 10 5 15 ii) Cooperative Banks No. 2 1 3
2) Branches No. 26 16 42 i) Scheduled Banks No. 14 9 23 ii) Co-operative Banks No. 5 4 9 3) Banking Offices No. 26 16 42 4) Private Banks
No. 6 3 9
Source : Lead Bank Office Daman/Diu .
44
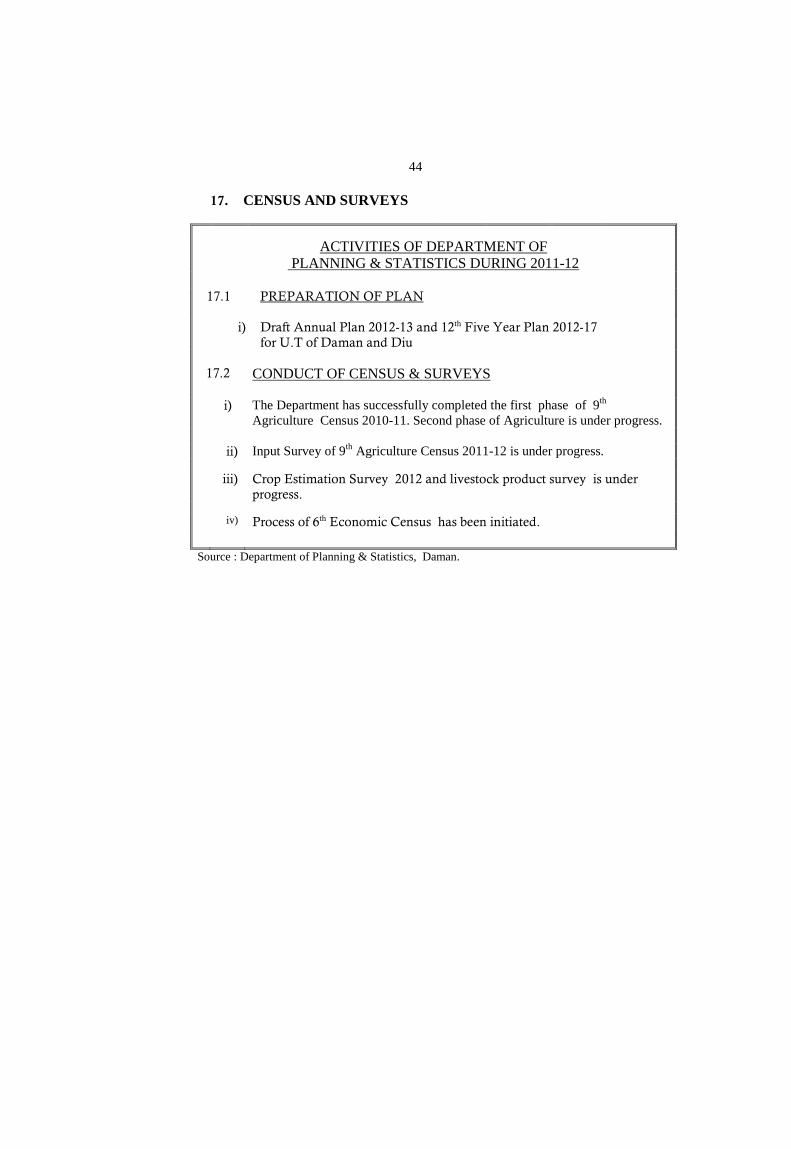
17. CENSUS AND SURVEYS
ACTIVITIES OF DEPARTMENT OF PLANNING & STATISTICS DURING 2011-12
17.1 PREPARATION OF PLAN
i) Draft Annual Plan 2012-13 and 12th Five Year Plan 2012-17 for U.T of Daman and Diu
17.2 CONDUCT OF CENSUS & SURVEYS
i) The Department has successfully completed the first phase of 9th
Agriculture Census 2010-11. Second phase of Agriculture is under progress. ii) Input Survey of 9th Agriculture Census 2011-12 is under progress. iii) Crop Estimation Survey 2012 and livestock product survey is under
progress. iv) Process of 6th Economic Census has been initiated.
Source : Department of Planning & Statistics, Daman.
45
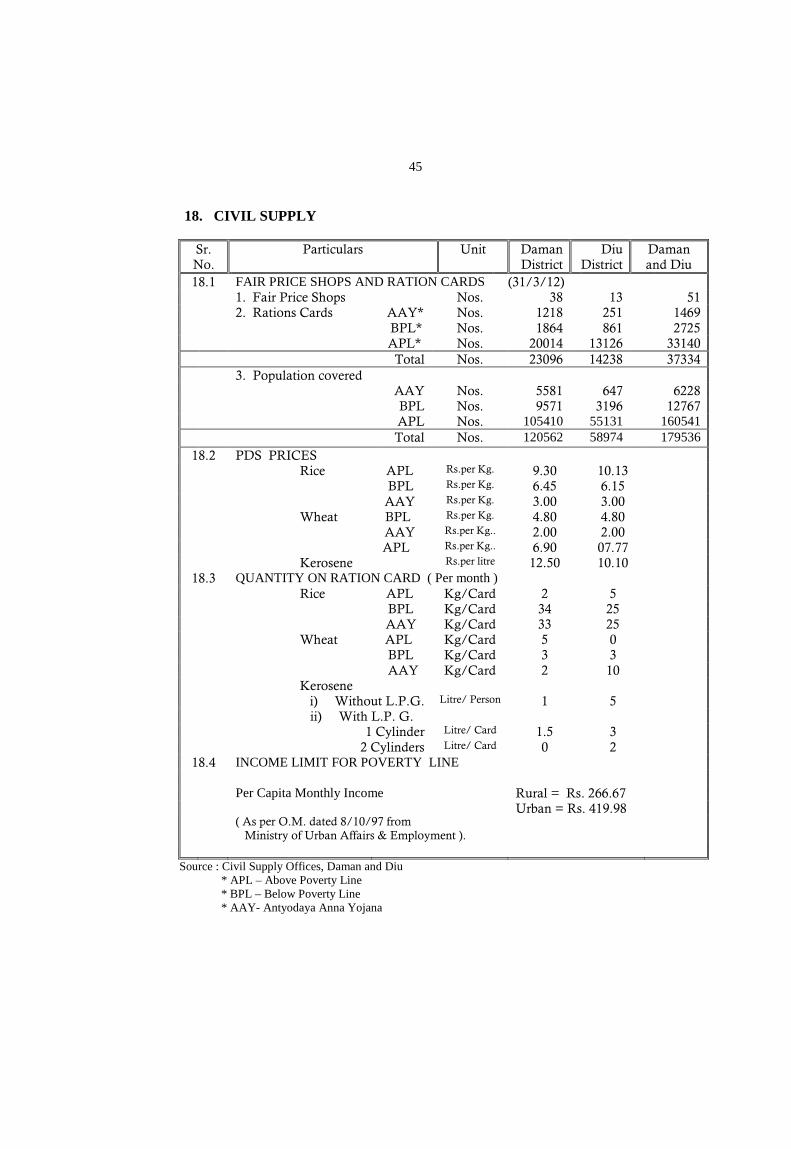
18. CIVIL SUPPLY
Sr. No.
Particulars Unit Daman District
Diu District
Daman and Diu
18.1 FAIR PRICE SHOPS AND RATION CARDS (31/3/12) 1. Fair Price Shops Nos. 38 13 51 2. Rations Cards AAY* Nos. 1218 251 1469 BPL* Nos. 1864 861 2725 APL* Nos. 20014 13126 33140 Total Nos. 23096 14238 37334 3. Population covered AAY Nos. 5581 647 6228 BPL Nos. 9571 3196 12767 APL Nos. 105410 55131 160541 Total Nos. 120562 58974 179536 18.2 PDS PRICES Rice APL Rs.per Kg. 9.30 10.13 BPL Rs.per Kg. 6.45 6.15 AAY Rs.per Kg. 3.00 3.00 Wheat BPL Rs.per Kg. 4.80 4.80 AAY Rs.per Kg.. 2.00 2.00 APL Rs.per Kg.. 6.90 07.77 Kerosene Rs.per litre 12.50 10.10 18.3 QUANTITY ON RATION CARD ( Per month ) Rice APL Kg/Card 2 5 BPL Kg/Card 34 25 AAY Kg/Card 33 25 Wheat APL Kg/Card 5 0 BPL Kg/Card 3 3 AAY Kg/Card 2 10 Kerosene i) Without L.P.G. Litre/ Person 1 5 ii) With L.P. G. 1 Cylinder Litre/ Card 1.5 3 2 Cylinders Litre/ Card 0 2 18.4 INCOME LIMIT FOR POVERTY LINE
Per Capita Monthly Income Rural = Rs. 266.67
( As per O.M. dated 8/10/97 from Ministry of Urban Affairs & Employment ).
Urban = Rs. 419.98
Source : Civil Supply Offices, Daman and Diu
* APL – Above Poverty Line * BPL – Below Poverty Line * AAY- Antyodaya Anna Yojana
46
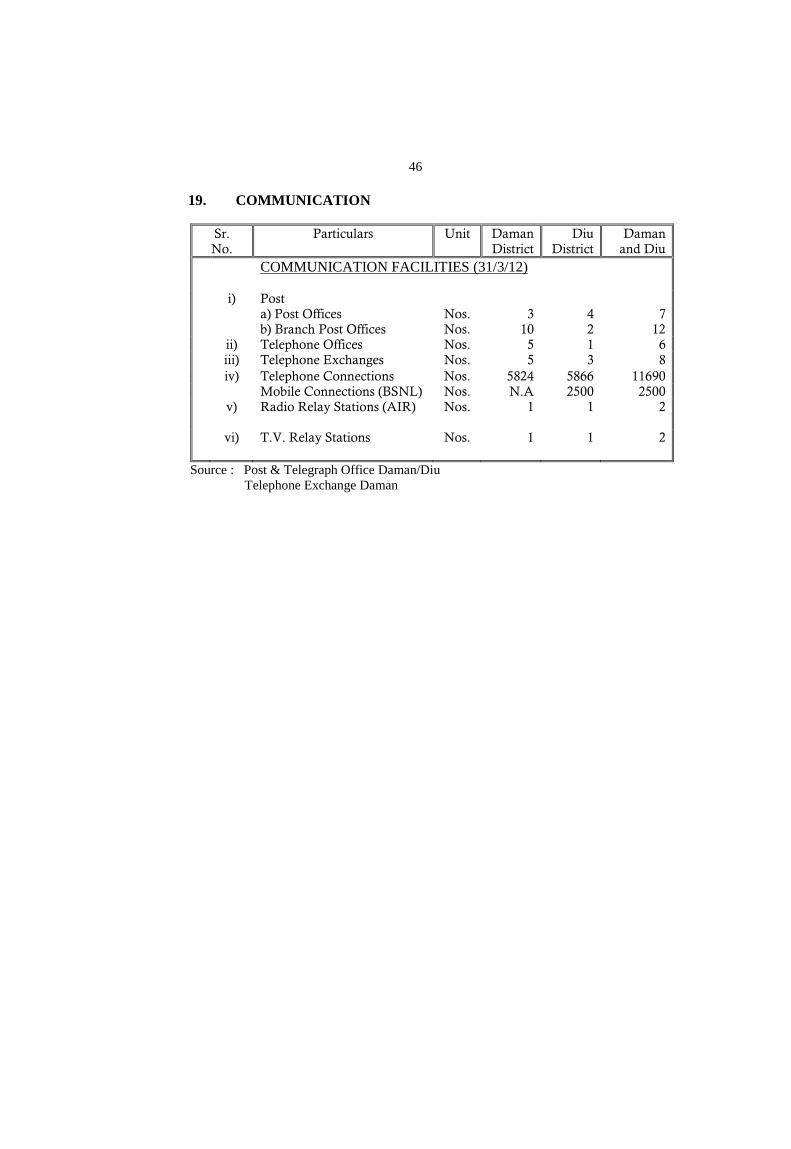
19. COMMUNICATION
Sr. No.
Particulars Unit Daman District
Diu District
Daman and Diu
COMMUNICATION FACILITIES (31/3/12) i) Post a) Post Offices Nos. 3 4 7 b) Branch Post Offices Nos. 10 2 12 ii) Telephone Offices Nos. 5 1 6 iii) Telephone Exchanges Nos. 5 3 8 iv) Telephone Connections Nos. 5824 5866 11690 Mobile Connections (BSNL) Nos. N.A 2500 2500 v) Radio Relay Stations (AIR) Nos. 1 1 2 vi) T.V. Relay Stations Nos. 1 1 2
Source : Post & Telegraph Office Daman/Diu Telephone Exchange Daman
47
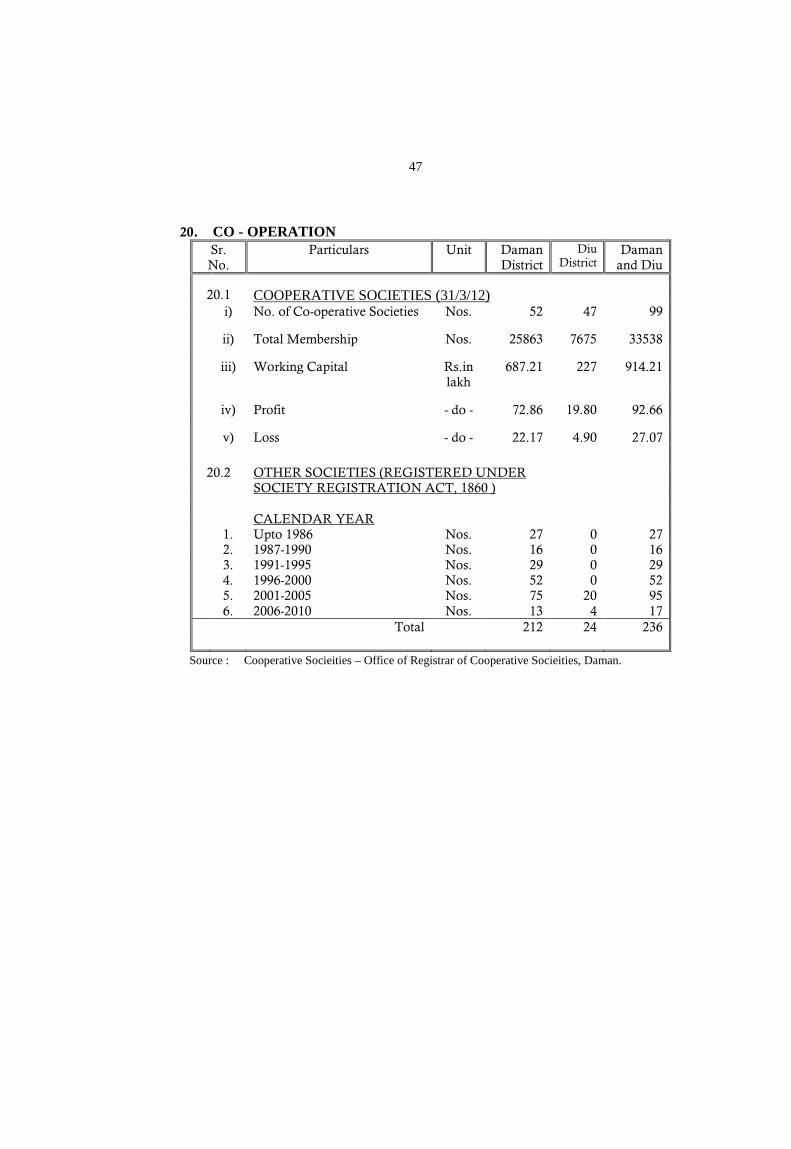
20. CO - OPERATION
Sr. No.
Particulars Unit Daman District
Diu District
Daman and Diu
20.1 COOPERATIVE SOCIETIES (31/3/12)
i) No. of Co-operative Societies Nos. 52 47 99 ii) Total Membership Nos. 25863 7675 33538 iii) Working Capital Rs.in
lakh 687.21 227 914.21
iv) Profit - do - 72.86 19.80 92.66 v) Loss - do - 22.17 4.90 27.07
20.2 OTHER SOCIETIES (REGISTERED UNDER SOCIETY REGISTRATION ACT, 1860 )
CALENDAR YEAR 1. Upto 1986 Nos. 27 0 27 2. 1987-1990 Nos. 16 0 16 3. 1991-1995 Nos. 29 0 29 4. 1996-2000 Nos. 52 0 52 5. 2001-2005 Nos. 75 20 95 6. 2006-2010 Nos. 13 4 17 Total 212 24 236
Source : Cooperative Socieities – Office of Registrar of Cooperative Socieities, Daman.
48
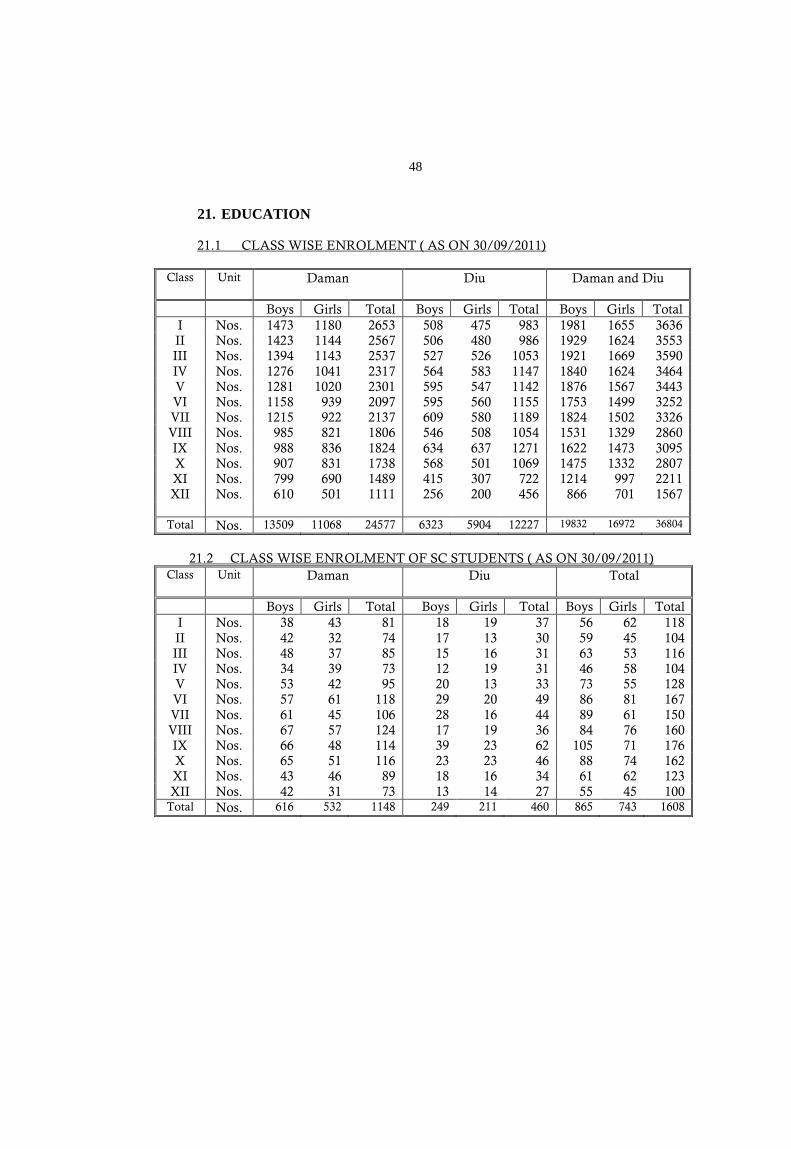
21. EDUCATION
21.1 CLASS WISE ENROLMENT ( AS ON 30/09/2011)
Class
Unit Daman Diu Daman and Diu
Boys Girls Total Boys Girls Total Boys Girls Total I Nos. 1473 1180 2653 508 475 983 1981 1655 3636 II Nos. 1423 1144 2567 506 480 986 1929 1624 3553 III Nos. 1394 1143 2537 527 526 1053 1921 1669 3590 IV Nos. 1276 1041 2317 564 583 1147 1840 1624 3464 V Nos. 1281 1020 2301 595 547 1142 1876 1567 3443 VI Nos. 1158 939 2097 595 560 1155 1753 1499 3252 VII Nos. 1215 922 2137 609 580 1189 1824 1502 3326 VIII Nos. 985 821 1806 546 508 1054 1531 1329 2860 IX Nos. 988 836 1824 634 637 1271 1622 1473 3095 X Nos. 907 831 1738 568 501 1069 1475 1332 2807 XI Nos. 799 690 1489 415 307 722 1214 997 2211 XII Nos. 610 501 1111 256 200 456 866 701 1567
Total Nos. 13509 11068 24577 6323 5904 12227 19832 16972 36804
21.2 CLASS WISE ENROLMENT OF SC STUDENTS ( AS ON 30/09/2011)
Class
Unit Daman Diu Total
Boys Girls Total Boys Girls Total Boys Girls Total I Nos. 38 43 81 18 19 37 56 62 118 II Nos. 42 32 74 17 13 30 59 45 104 III Nos. 48 37 85 15 16 31 63 53 116 IV Nos. 34 39 73 12 19 31 46 58 104 V Nos. 53 42 95 20 13 33 73 55 128 VI Nos. 57 61 118 29 20 49 86 81 167 VII Nos. 61 45 106 28 16 44 89 61 150 VIII Nos. 67 57 124 17 19 36 84 76 160 IX Nos. 66 48 114 39 23 62 105 71 176 X Nos. 65 51 116 23 23 46 88 74 162 XI Nos. 43 46 89 18 16 34 61 62 123 XII Nos. 42 31 73 13 14 27 55 45 100
Total Nos. 616 532 1148 249 211 460 865 743 1608
49
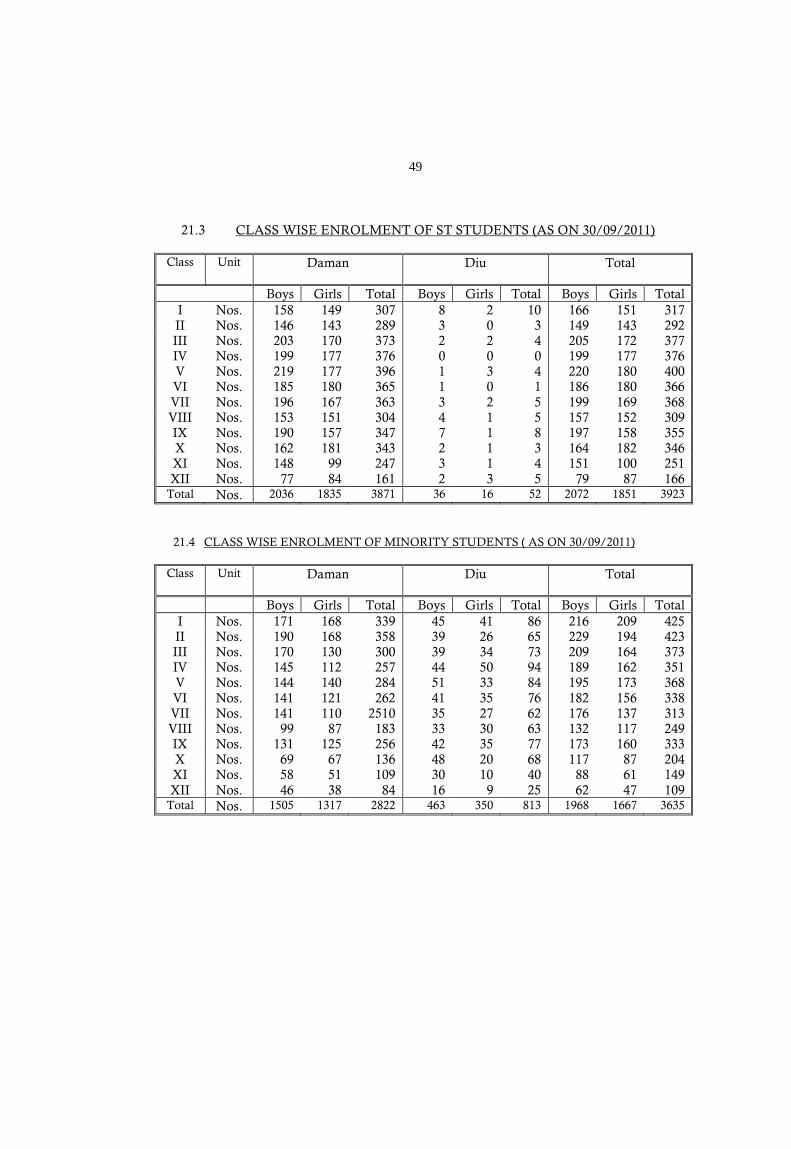
21.3 CLASS WISE ENROLMENT OF ST STUDENTS (AS ON 30/09/2011)
Class
Unit Daman Diu Total Total
Boys Girls Total Boys Girls Total Boys Girls Total I Nos. 158 149 307 8 2 10 166 151 317 II Nos. 146 143 289 3 0 3 149 143 292 III Nos. 203 170 373 2 2 4 205 172 377 IV Nos. 199 177 376 0 0 0 199 177 376 V Nos. 219 177 396 1 3 4 220 180 400 VI Nos. 185 180 365 1 0 1 186 180 366 VII Nos. 196 167 363 3 2 5 199 169 368 VIII Nos. 153 151 304 4 1 5 157 152 309 IX Nos. 190 157 347 7 1 8 197 158 355 X Nos. 162 181 343 2 1 3 164 182 346 XI Nos. 148 99 247 3 1 4 151 100 251 XII Nos. 77 84 161 2 3 5 79 87 166
Total Nos. 2036 1835 3871 36 16 52 2072 1851 3923
21.4 CLASS WISE ENROLMENT OF MINORITY STUDENTS ( AS ON 30/09/2011)
Class
Unit Daman Diu Total Total
Boys Girls Total Boys Girls Total Boys Girls Total I Nos. 171 168 339 45 41 86 216 209 425 II Nos. 190 168 358 39 26 65 229 194 423 III Nos. 170 130 300 39 34 73 209 164 373 IV Nos. 145 112 257 44 50 94 189 162 351 V Nos. 144 140 284 51 33 84 195 173 368 VI Nos. 141 121 262 41 35 76 182 156 338 VII Nos. 141 110 2510 35 27 62 176 137 313 VIII Nos. 99 87 183 33 30 63 132 117 249 IX Nos. 131 125 256 42 35 77 173 160 333 X Nos. 69 67 136 48 20 68 117 87 204 XI Nos. 58 51 109 30 10 40 88 61 149 XII Nos. 46 38 84 16 9 25 62 47 109
Total Nos. 1505 1317 2822 463 350 813 1968 1667 3635
50
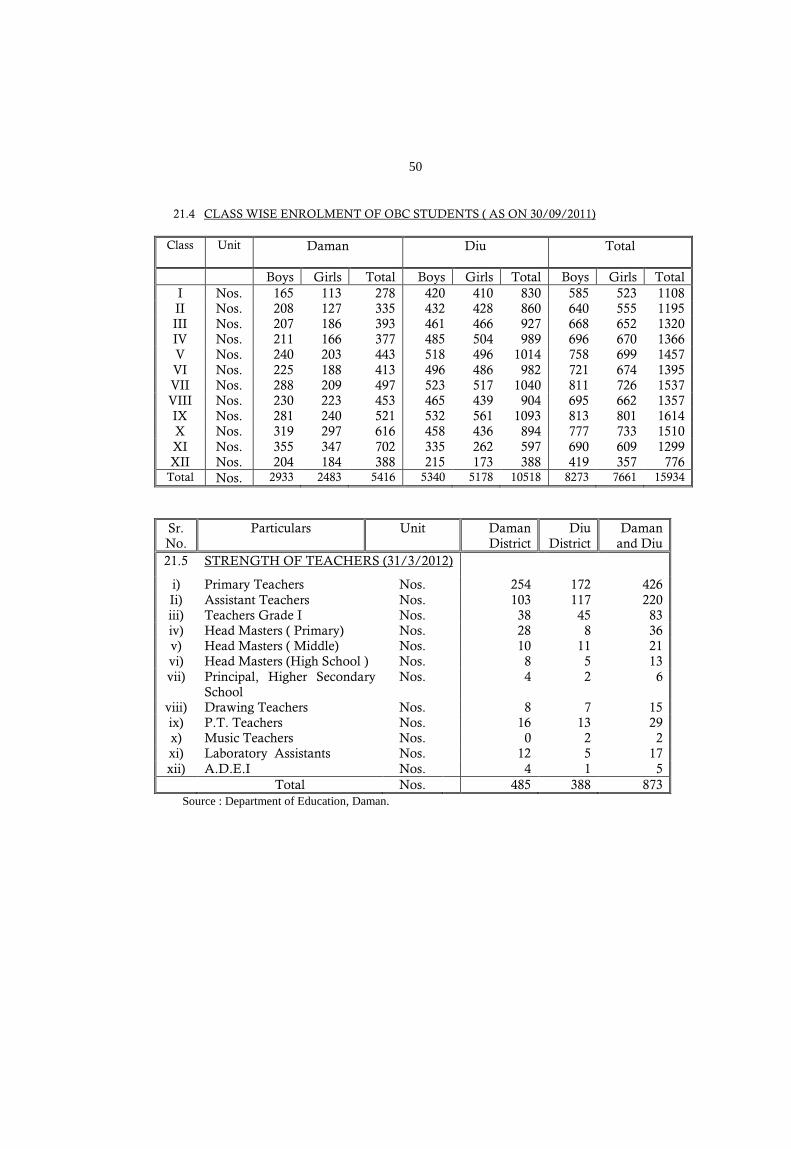
21.4 CLASS WISE ENROLMENT OF OBC STUDENTS ( AS ON 30/09/2011)
Class
Unit Daman Diu Total Total
Boys Girls Total Boys Girls Total Boys Girls Total I Nos. 165 113 278 420 410 830 585 523 1108 II Nos. 208 127 335 432 428 860 640 555 1195 III Nos. 207 186 393 461 466 927 668 652 1320 IV Nos. 211 166 377 485 504 989 696 670 1366 V Nos. 240 203 443 518 496 1014 758 699 1457 VI Nos. 225 188 413 496 486 982 721 674 1395 VII Nos. 288 209 497 523 517 1040 811 726 1537 VIII Nos. 230 223 453 465 439 904 695 662 1357 IX Nos. 281 240 521 532 561 1093 813 801 1614 X Nos. 319 297 616 458 436 894 777 733 1510 XI Nos. 355 347 702 335 262 597 690 609 1299 XII Nos. 204 184 388 215 173 388 419 357 776
Total Nos. 2933 2483 5416 5340 5178 10518 8273 7661 15934
Sr. No.
Particulars Unit Daman District
Diu District
Daman and Diu
21.5 STRENGTH OF TEACHERS (31/3/2012)
i) Primary Teachers Nos. 254 172 426 Ii) Assistant Teachers Nos. 103 117 220 iii) Teachers Grade I Nos. 38 45 83 iv) Head Masters ( Primary) Nos. 28 8 36 v) Head Masters ( Middle) Nos. 10 11 21 vi) Head Masters (High School ) Nos. 8 5 13 vii) Principal, Higher Secondary
School Nos. 4 2 6
viii) Drawing Teachers Nos. 8 7 15 ix) P.T. Teachers Nos. 16 13 29 x) Music Teachers Nos. 0 2 2 xi) Laboratory Assistants Nos. 12 5 17 xii) A.D.E.I Nos. 4 1 5
Total Nos. 485 388 873 Source : Department of Education, Daman.
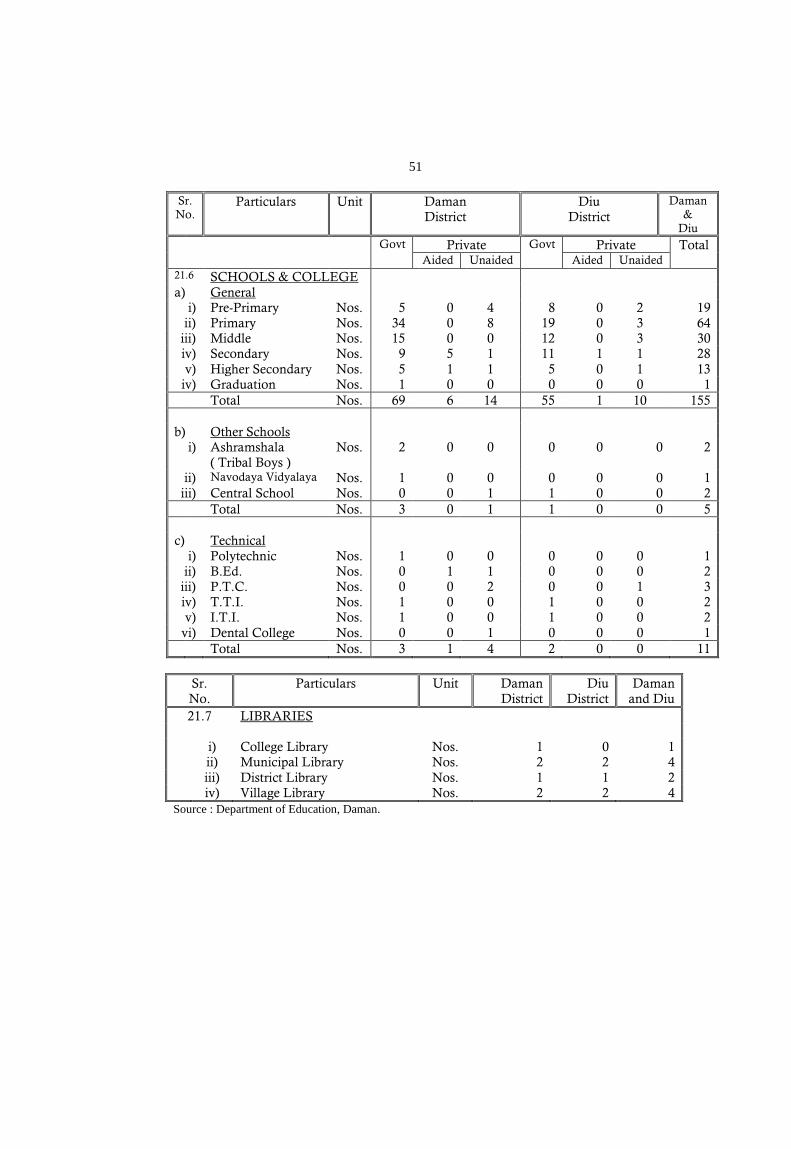
51
Sr. No.
Particulars Unit Daman District
Diu District
Daman &
Diu
Govt Private Govt Private Total Aided Unaided Aided Unaided 21.6 SCHOOLS & COLLEGE a) General
i) Pre-Primary Nos. 5 0 4 8 0 2 19 ii) Primary Nos. 34 0 8 19 0 3 64
iii) Middle Nos. 15 0 0 12 0 3 30 iv) Secondary Nos. 9 5 1 11 1 1 28 v) Higher Secondary Nos. 5 1 1 5 0 1 13
iv) Graduation Nos. 1 0 0 0 0 0 1 Total Nos. 69 6 14 55 1 10 155 b) Other Schools
i) Ashramshala ( Tribal Boys )
Nos. 2 0 0 0 0 0 2
ii) Navodaya Vidyalaya Nos. 1 0 0 0 0 0 1 iii) Central School Nos. 0 0 1 1 0 0 2
Total Nos. 3 0 1 1 0 0 5 c) Technical
i) Polytechnic Nos. 1 0 0 0 0 0 1 ii) B.Ed. Nos. 0 1 1 0 0 0 2
iii) P.T.C. Nos. 0 0 2 0 0 1 3 iv) T.T.I. Nos. 1 0 0 1 0 0 2 v) I.T.I. Nos. 1 0 0 1 0 0 2
vi) Dental College Nos. 0 0 1 0 0 0 1 Total Nos. 3 1 4 2 0 0 11
Sr. No.
Particulars Unit Daman District
Diu District
Daman and Diu
21.7 LIBRARIES i) College Library Nos. 1 0 1 ii) Municipal Library Nos. 2 2 4 iii) District Library Nos. 1 1 2 iv) Village Library Nos. 2 2 4
Source : Department of Education, Daman.
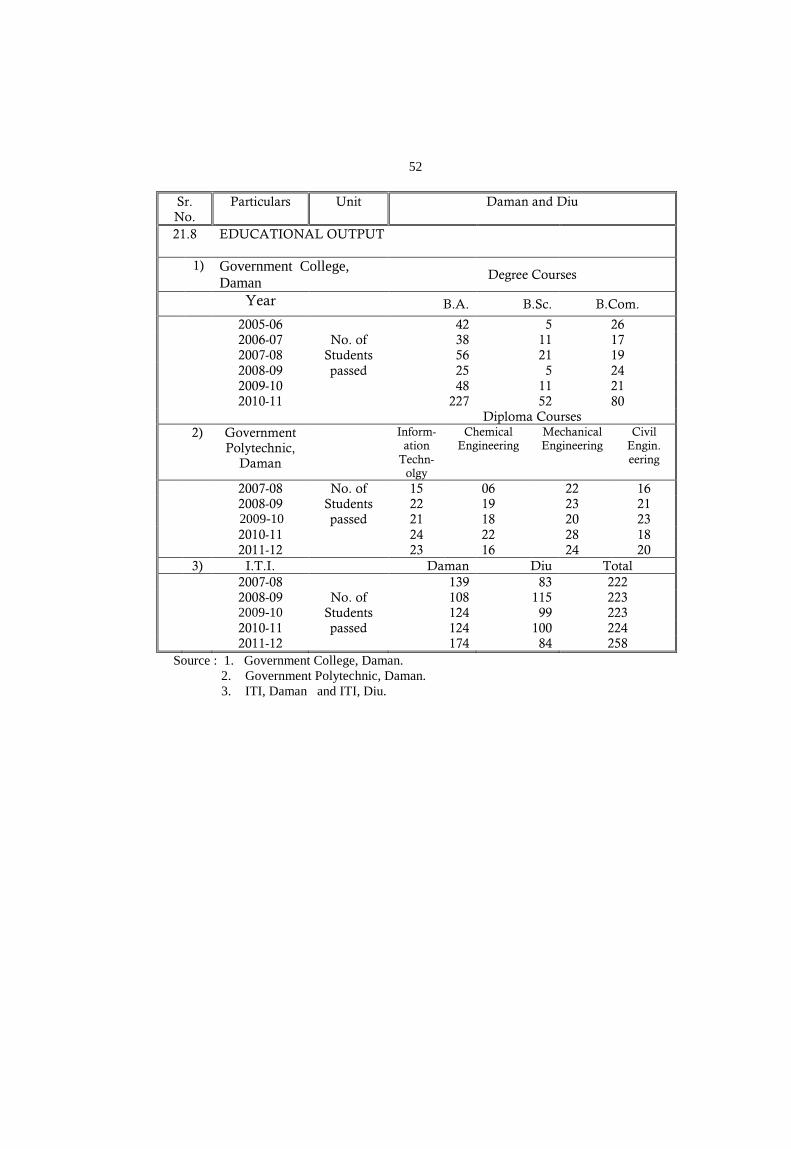
52
Sr. No.
Particulars Unit Daman and Diu
21.8 EDUCATIONAL OUTPUT
1) Government College, Daman Degree Courses
Year B.A. B.Sc. B.Com.
2005-06 No. of
Students passed
42 5 26 2006-07 38 11 17 2007-08 56 21 19 2008-09 25 5 24 2009-10 48 11 21 2010-11 227 52 80 Diploma Courses 2) Government
Polytechnic, Daman
Inform-ation
Techn-olgy
Chemical Engineering
Mechanical Engineering
Civil Engin. eering
2007-08 No. of Students passed
15 06 22 16 2008-09
2009-10 22 21
19 18
23 20
21 23
2010-11 24 22 28 18 2011-12 23 16 24 20 3) I.T.I. Daman Diu Total 2007-08
No. of Students passed
139 83 222 2008-09
2009-10 108 124
115 99
223 223
2010-11 124 100 224 2011-12 174 84 258 Source : 1. Government College, Daman.
2. Government Polytechnic, Daman. 3. ITI, Daman and ITI, Diu.
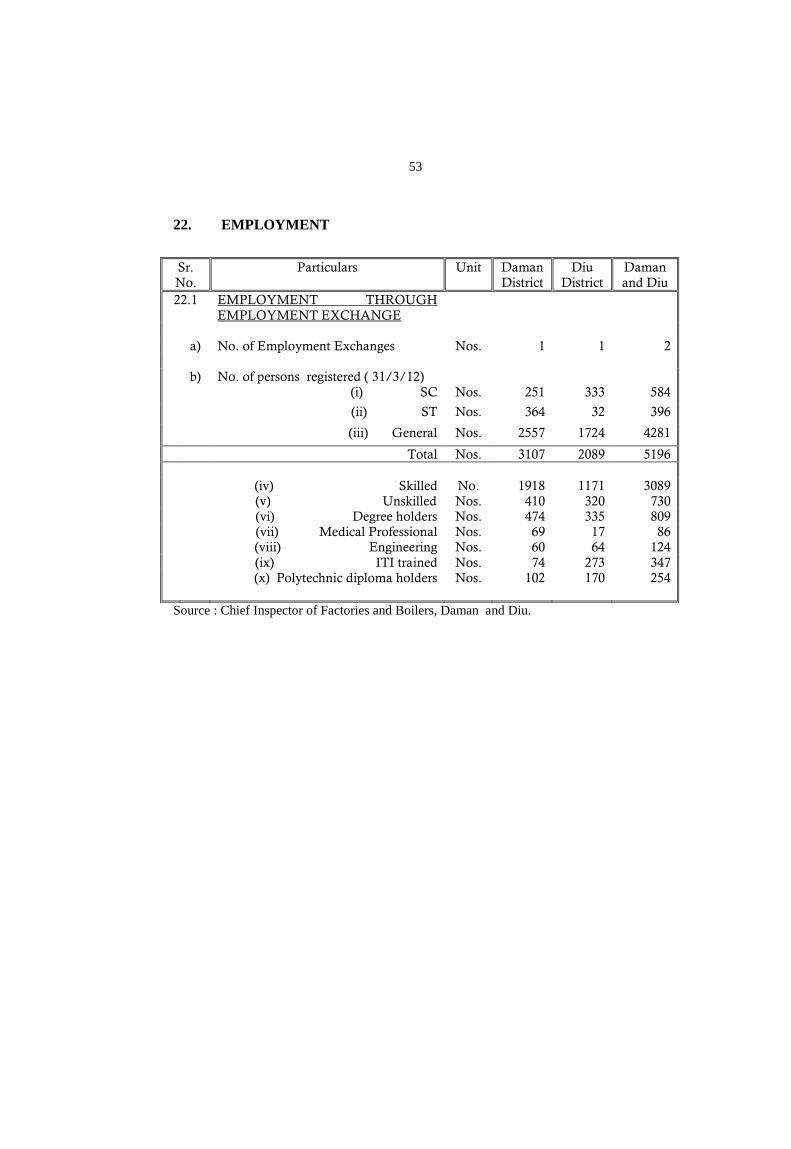
53
22. EMPLOYMENT Sr. No.
Particulars Unit Daman District
Diu District
Daman and Diu
22.1 EMPLOYMENT THROUGH EMPLOYMENT EXCHANGE
a) No. of Employment Exchanges Nos. 1 1 2 b) No. of persons registered ( 31/3/12) (i) SC Nos. 251 333 584
(ii) ST Nos. 364 32 396
(iii) General Nos. 2557 1724 4281
Total Nos. 3107 2089 5196 (iv) Skilled No. 1918 1171 3089 (v) Unskilled Nos. 410 320 730 (vi) Degree holders Nos. 474 335 809 (vii) Medical Professional Nos. 69 17 86 (viii) Engineering Nos. 60 64 124 (ix) ITI trained Nos. 74 273 347 (x) Polytechnic diploma holders Nos. 102 170 254 Source : Chief Inspector of Factories and Boilers, Daman and Diu.
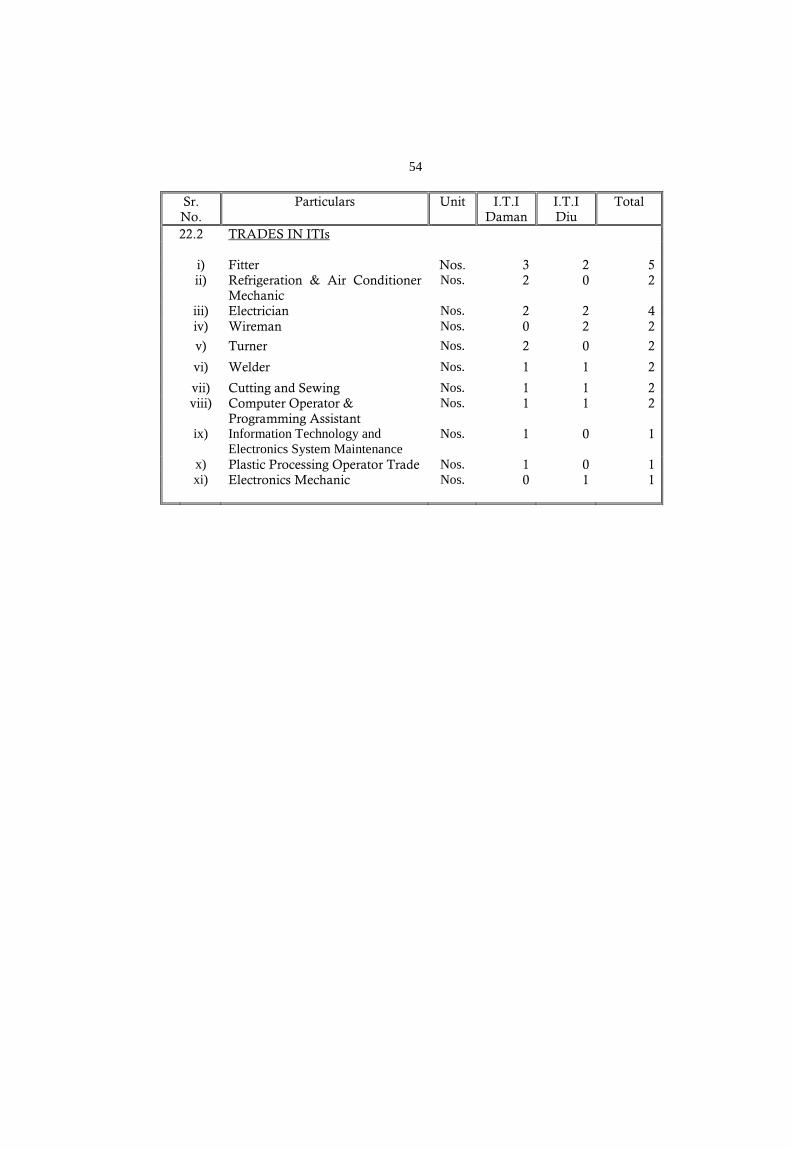
54
Sr. No.
Particulars Unit I.T.I Daman
I.T.I Diu
Total
22.2 TRADES IN ITIs i) Fitter Nos. 3 2 5 ii) Refrigeration & Air Conditioner
Mechanic Nos. 2 0 2
iii) Electrician Nos. 2 2 4 iv) Wireman Nos. 0 2 2
v) Turner Nos. 2 0 2
vi) Welder Nos. 1 1 2
vii) Cutting and Sewing Nos. 1 1 2 viii) Computer Operator &
Programming Assistant Nos. 1 1 2
ix) Information Technology and Electronics System Maintenance
Nos. 1 0 1
x) Plastic Processing Operator Trade Nos. 1 0 1 xi) Electronics Mechanic Nos. 0 1 1
55
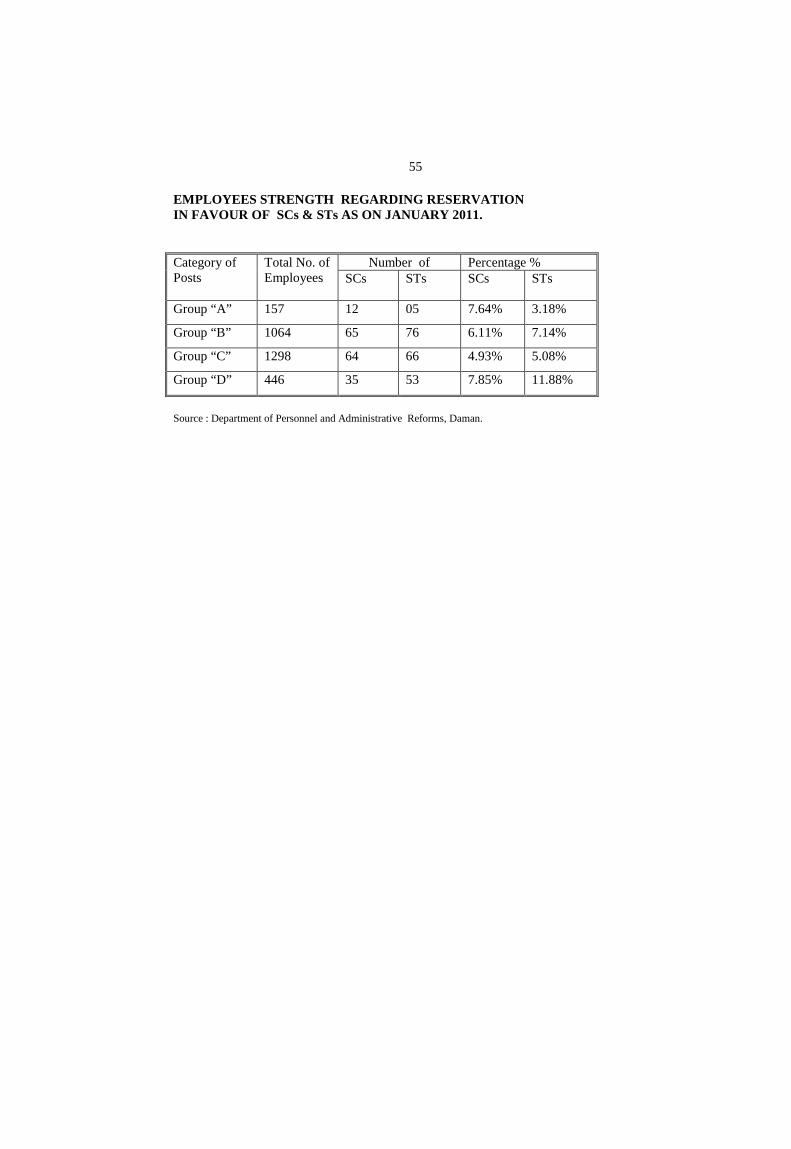
EMPLOYEES STRENGTH REGARDING RESERVATION IN FAVOUR OF SCs & STs AS ON JANUARY 2011. Category of Posts
Total No. of Employees
Number of Percentage % SCs STs SCs STs
Group “A” 157 12 05 7.64% 3.18%
Group “B” 1064 65 76 6.11% 7.14%
Group “C” 1298 64 66 4.93% 5.08%
Group “D” 446 35 53 7.85% 11.88%
Source : Department of Personnel and Administrative Reforms, Daman.
56
Sr. No.
Particulars Unit Daman and Diu
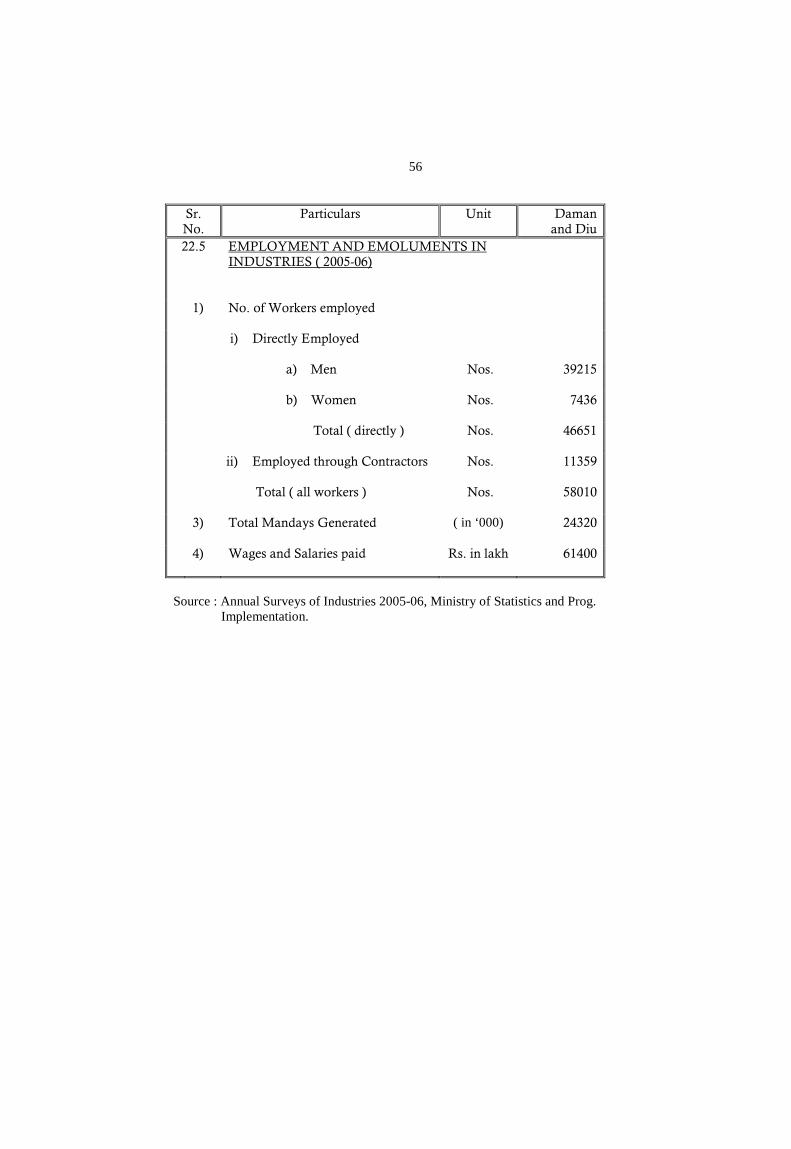
22.5 EMPLOYMENT AND EMOLUMENTS IN INDUSTRIES ( 2005-06)
1) No. of Workers employed
i) Directly Employed
a) Men Nos. 39215
b) Women Nos. 7436
Total ( directly ) Nos. 46651
ii) Employed through Contractors Nos. 11359
Total ( all workers ) Nos. 58010
3) Total Mandays Generated ( in ‘000) 24320
4) Wages and Salaries paid Rs. in lakh 61400
Source : Annual Surveys of Industries 2005-06, Ministry of Statistics and Prog.
Implementation.
57
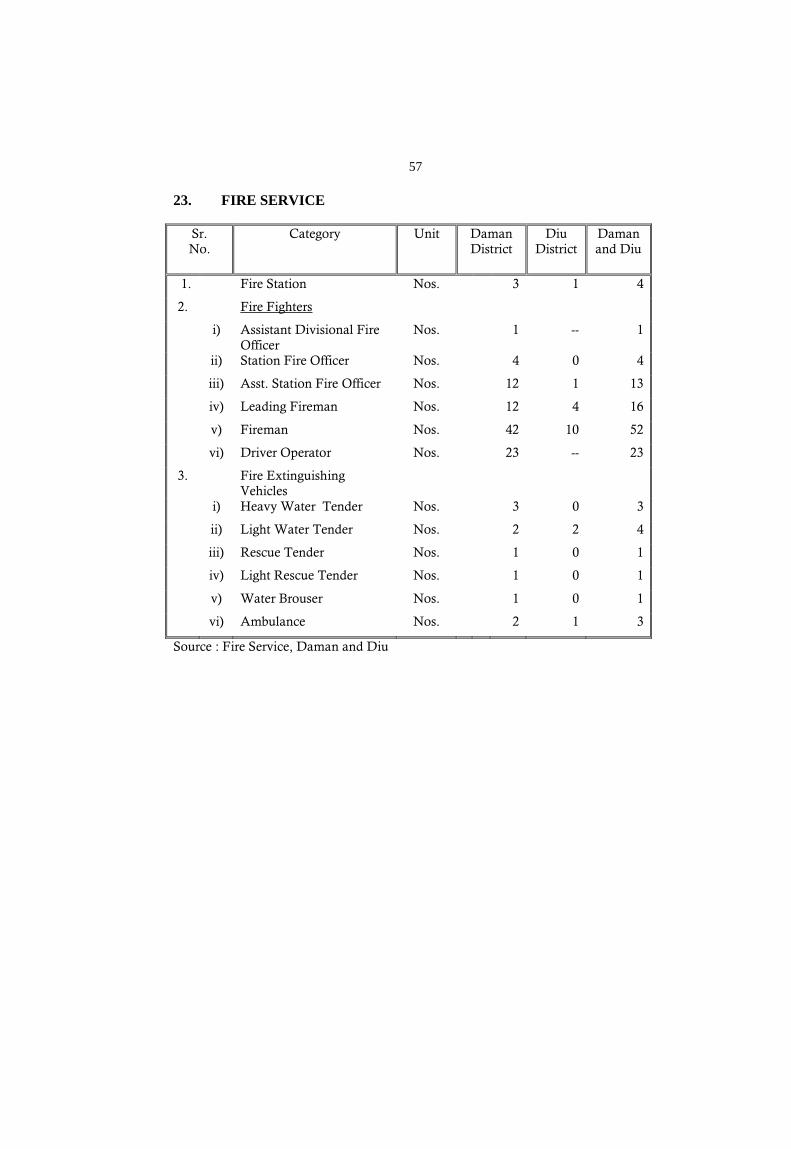
23. FIRE SERVICE
Sr. No.
Category
Unit Daman District
Diu District
Daman and Diu
1. Fire Station Nos. 3 1 4
2. Fire Fighters
i) Assistant Divisional Fire Officer
Nos. 1 -- 1
ii) Station Fire Officer Nos. 4 0 4
iii) Asst. Station Fire Officer Nos. 12 1 13
iv) Leading Fireman Nos. 12 4 16
v) Fireman Nos. 42 10 52
vi) Driver Operator Nos. 23 -- 23
3. Fire Extinguishing Vehicles
i) Heavy Water Tender Nos. 3 0 3
ii) Light Water Tender Nos. 2 2 4
iii) Rescue Tender Nos. 1 0 1
iv) Light Rescue Tender Nos. 1 0 1
v) Water Brouser Nos. 1 0 1
vi) Ambulance Nos. 2 1 3
Source : Fire Service, Daman and Diu
58
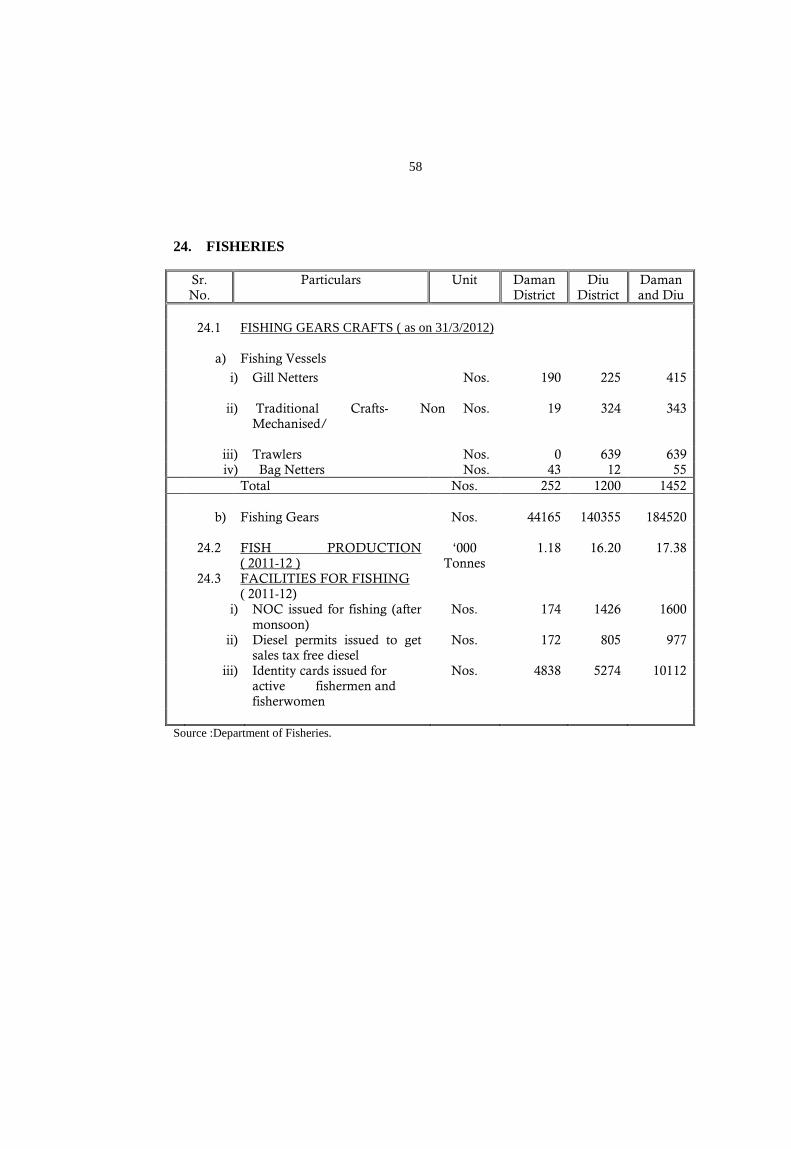
24. FISHERIES
Sr. No.
Particulars Unit Daman District
Diu District
Daman and Diu
24.1 FISHING GEARS CRAFTS ( as on 31/3/2012) a) Fishing Vessels
i) Gill Netters Nos. 190 225 415 ii) Traditional Crafts- Non
Mechanised/ Nos. 19 324 343
iii) Trawlers Nos. 0 639 639 iv) Bag Netters Nos. 43 12 55 Total Nos. 252 1200 1452 b) Fishing Gears Nos. 44165 140355 184520 24.2 FISH PRODUCTION
( 2011-12 ) ‘000
Tonnes 1.18 16.20 17.38
24.3 FACILITIES FOR FISHING ( 2011-12) i) NOC issued for fishing (after
monsoon) Nos. 174 1426 1600
ii) Diesel permits issued to get sales tax free diesel
Nos. 172 805 977
iii) Identity cards issued for active fishermen and fisherwomen
Nos. 4838 5274 10112
Source :Department of Fisheries.
59
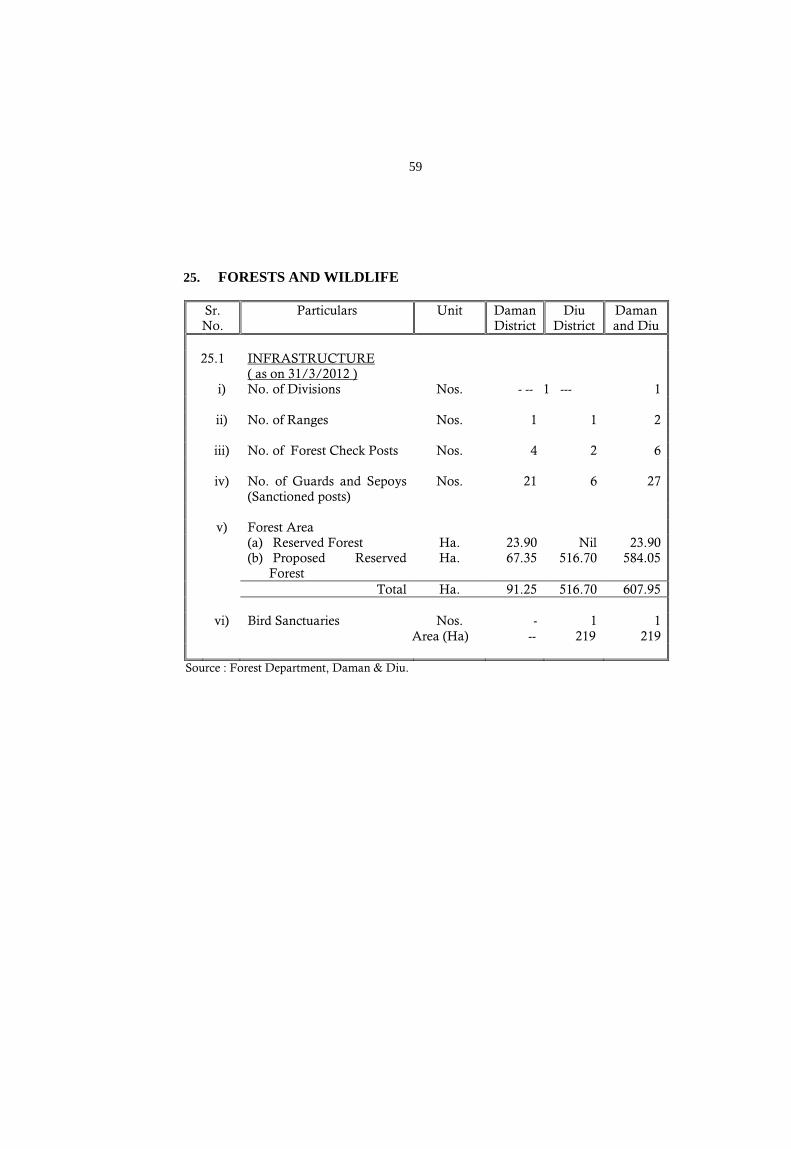
25. FORESTS AND WILDLIFE
Sr. No.
Particulars Unit Daman District
Diu District
Daman and Diu
25.1 INFRASTRUCTURE
( as on 31/3/2012 )
i) No. of Divisions Nos. - -- 1 --- 1 ii) No. of Ranges Nos. 1 1 2 iii) No. of Forest Check Posts Nos. 4 2 6 iv) No. of Guards and Sepoys
(Sanctioned posts) Nos. 21 6 27
v) Forest Area (a) Reserved Forest Ha. 23.90 Nil 23.90 (b) Proposed Reserved
Forest Ha. 67.35 516.70 584.05
Total Ha. 91.25 516.70 607.95 vi) Bird Sanctuaries Nos. - 1 1 Area (Ha) -- 219 219
Source : Forest Department, Daman & Diu.
60
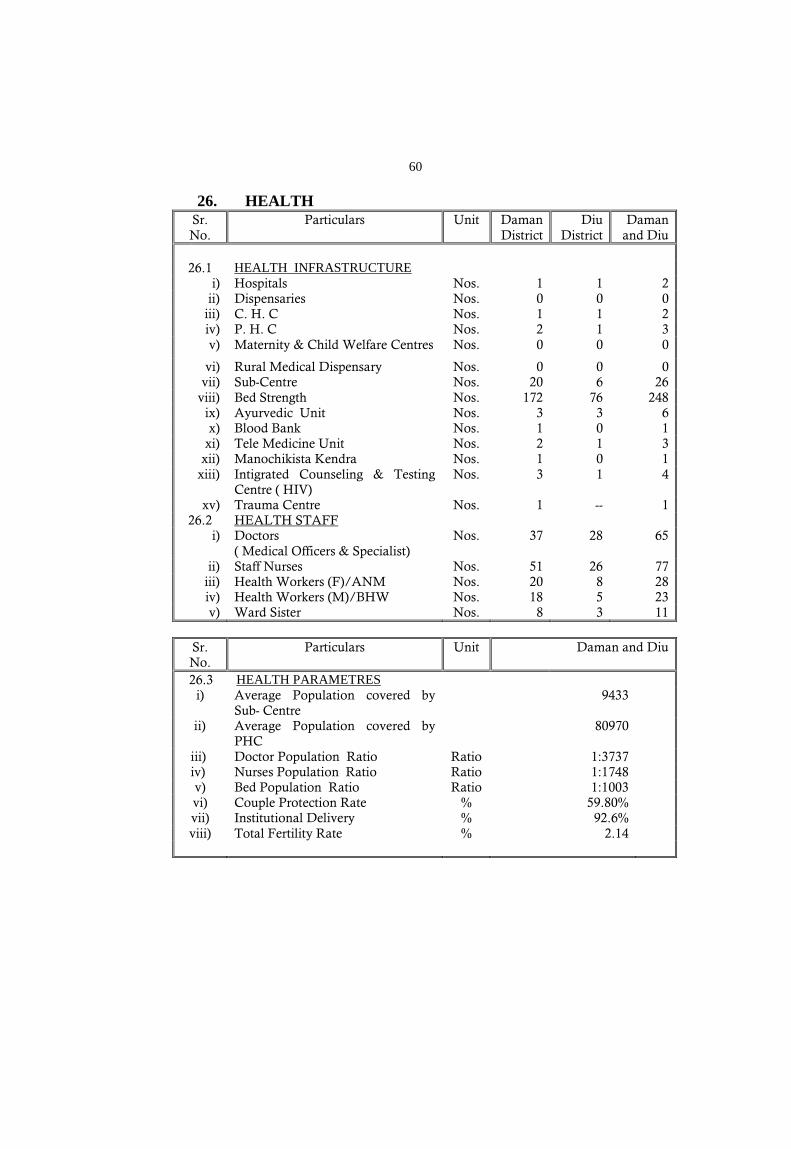
26. HEALTH
Sr. No.
Particulars Unit Daman District
Diu District
Daman and Diu
26.1 HEALTH INFRASTRUCTURE
i) Hospitals Nos. 1 1 2 ii) Dispensaries Nos. 0 0 0 iii) C. H. C Nos. 1 1 2 iv) P. H. C Nos. 2 1 3 v) Maternity & Child Welfare Centres Nos. 0 0 0
vi) Rural Medical Dispensary Nos. 0 0 0 vii) Sub-Centre Nos. 20 6 26
viii) Bed Strength Nos. 172 76 248 ix) Ayurvedic Unit Nos. 3 3 6 x) Blood Bank Nos. 1 0 1 xi) Tele Medicine Unit Nos. 2 1 3
xii) Manochikista Kendra Nos. 1 0 1 xiii) Intigrated Counseling & Testing
Centre ( HIV) Nos. 3 1 4
xv) Trauma Centre Nos. 1 -- 1 26.2 HEALTH STAFF
i) Doctors ( Medical Officers & Specialist)
Nos. 37 28 65
ii) Staff Nurses Nos. 51 26 77 iii) Health Workers (F)/ANM Nos. 20 8 28 iv) Health Workers (M)/BHW Nos. 18 5 23 v) Ward Sister Nos. 8 3 11
Sr. No.
Particulars Unit Daman and Diu
26.3 HEALTH PARAMETRES i) Average Population covered by
Sub- Centre 9433
ii) Average Population covered by PHC
80970
iii) Doctor Population Ratio Ratio 1:3737 iv) Nurses Population Ratio Ratio 1:1748
v) Bed Population Ratio Ratio 1:1003 vi) Couple Protection Rate % 59.80% vii) Institutional Delivery % 92.6% viii) Total Fertility Rate % 2.14
61
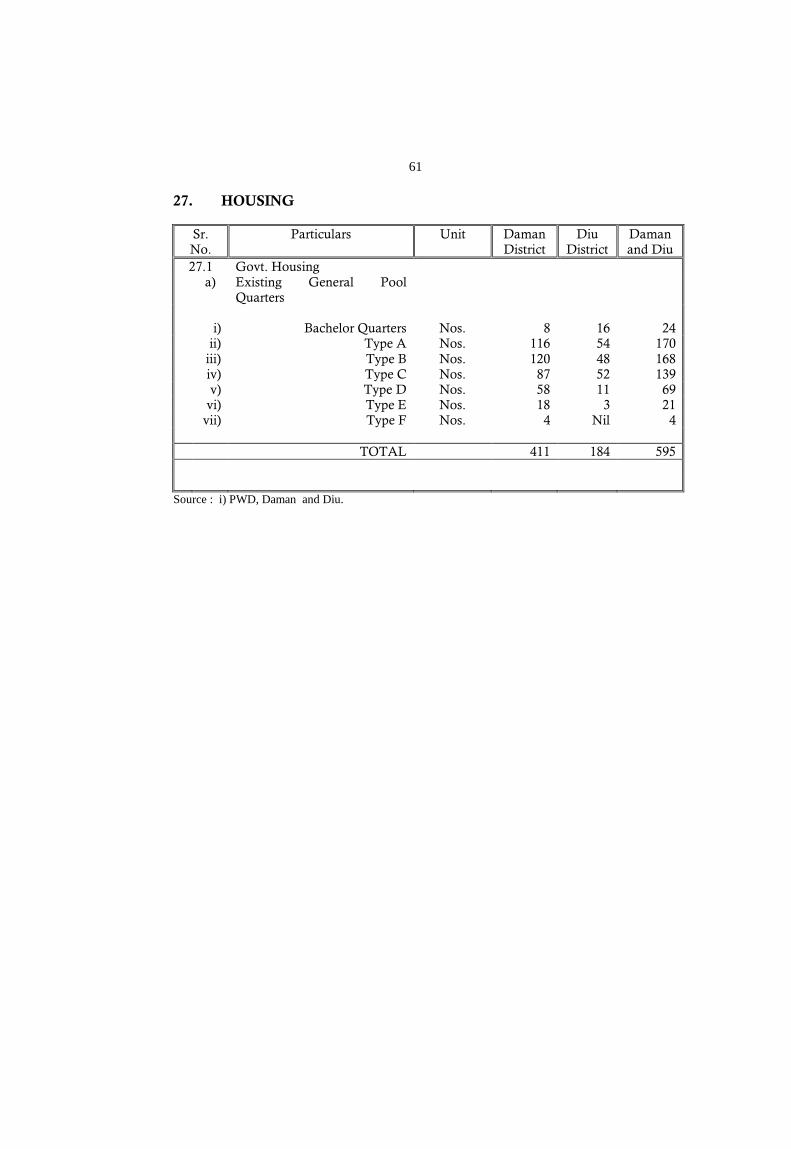
27. HOUSING
Sr. No.
Particulars Unit Daman District
Diu District
Daman and Diu
27.1 Govt. Housing a) Existing General Pool
Quarters
i) Bachelor Quarters Nos. 8 16 24 ii) Type A Nos. 116 54 170 iii) Type B Nos. 120 48 168 iv) Type C Nos. 87 52 139 v) Type D Nos. 58 11 69 vi) Type E Nos. 18 3 21 vii) Type F Nos. 4 Nil 4 TOTAL 411 184 595
Source : i) PWD, Daman and Diu.
62
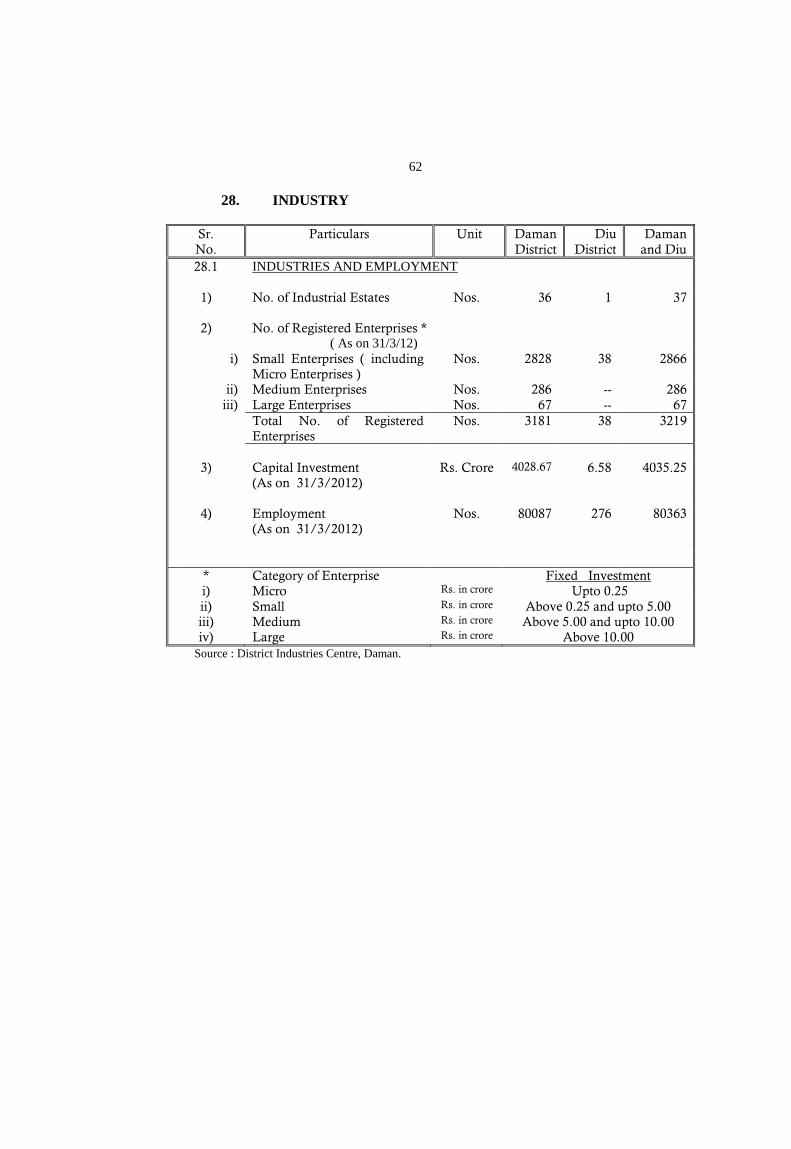
28. INDUSTRY
Sr. No.
Particulars Unit Daman District
Diu District
Daman and Diu
28.1 INDUSTRIES AND EMPLOYMENT
1) No. of Industrial Estates Nos. 36 1 37
2) No. of Registered Enterprises * ( As on 31/3/12)
i) Small Enterprises ( including Micro Enterprises )
Nos. 2828 38 2866
ii) Medium Enterprises Nos. 286 -- 286 iii) Large Enterprises Nos. 67 -- 67 Total No. of Registered
Enterprises Nos. 3181 38 3219
3) Capital Investment
(As on 31/3/2012) Rs. Crore 4028.67 6.58 4035.25
4) Employment Nos. 80087 276 80363
(As on 31/3/2012)
* Category of Enterprise Fixed Investment i) Micro Rs. in crore Upto 0.25 ii) Small Rs. in crore Above 0.25 and upto 5.00 iii) Medium Rs. in crore Above 5.00 and upto 10.00 iv) Large Rs. in crore Above 10.00
Source : District Industries Centre, Daman.
63
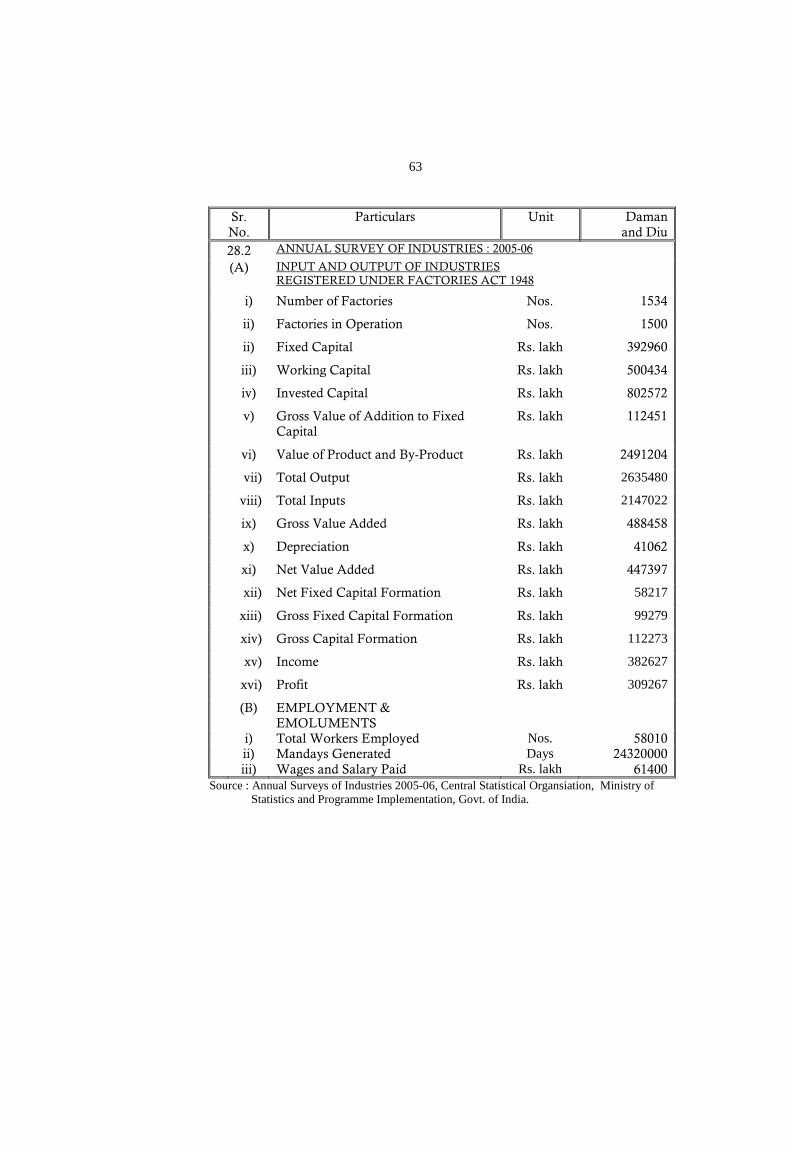
Sr. No.
Particulars Unit Daman and Diu
28.2 ANNUAL SURVEY OF INDUSTRIES : 2005-06 (A) INPUT AND OUTPUT OF INDUSTRIES
REGISTERED UNDER FACTORIES ACT 1948
i) Number of Factories Nos. 1534
ii) Factories in Operation Nos. 1500
ii) Fixed Capital Rs. lakh 392960
iii) Working Capital Rs. lakh 500434
iv) Invested Capital Rs. lakh 802572
v) Gross Value of Addition to Fixed Capital
Rs. lakh 112451
vi) Value of Product and By-Product Rs. lakh 2491204
vii) Total Output Rs. lakh 2635480
viii) Total Inputs Rs. lakh 2147022
ix) Gross Value Added Rs. lakh 488458
x) Depreciation Rs. lakh 41062
xi) Net Value Added Rs. lakh 447397
xii) Net Fixed Capital Formation Rs. lakh 58217
xiii) Gross Fixed Capital Formation Rs. lakh 99279
xiv) Gross Capital Formation Rs. lakh 112273
xv) Income Rs. lakh 382627
xvi) Profit Rs. lakh 309267
(B) EMPLOYMENT & EMOLUMENTS
i) Total Workers Employed Nos. 58010 ii) Mandays Generated Days 24320000 iii) Wages and Salary Paid Rs. lakh 61400
Source : Annual Surveys of Industries 2005-06, Central Statistical Organsiation, Ministry of Statistics and Programme Implementation, Govt. of India.
64
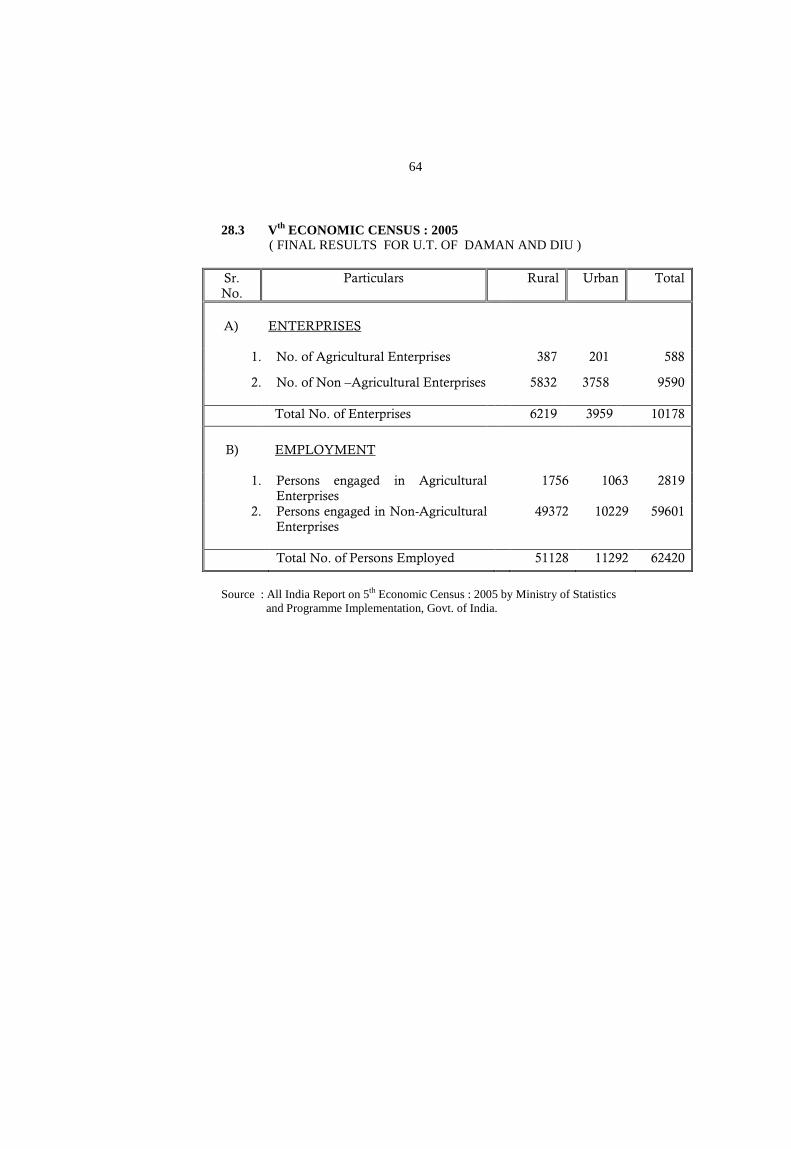
28.3 Vth
( FINAL RESULTS FOR U.T. OF DAMAN AND DIU ) ECONOMIC CENSUS : 2005
Sr. No.
Particulars Rural Urban Total
A) ENTERPRISES
1. No. of Agricultural Enterprises 387 201 588
2. No. of Non –Agricultural Enterprises
5832 3758 9590
Total No. of Enterprises 6219 3959 10178
B)
EMPLOYMENT
1. Persons engaged in Agricultural Enterprises
1756 1063 2819
2. Persons engaged in Non-Agricultural Enterprises
49372 10229 59601
Total No. of Persons Employed 51128 11292 62420
Source : All India Report on 5th
and Programme Implementation, Govt. of India. Economic Census : 2005 by Ministry of Statistics
65
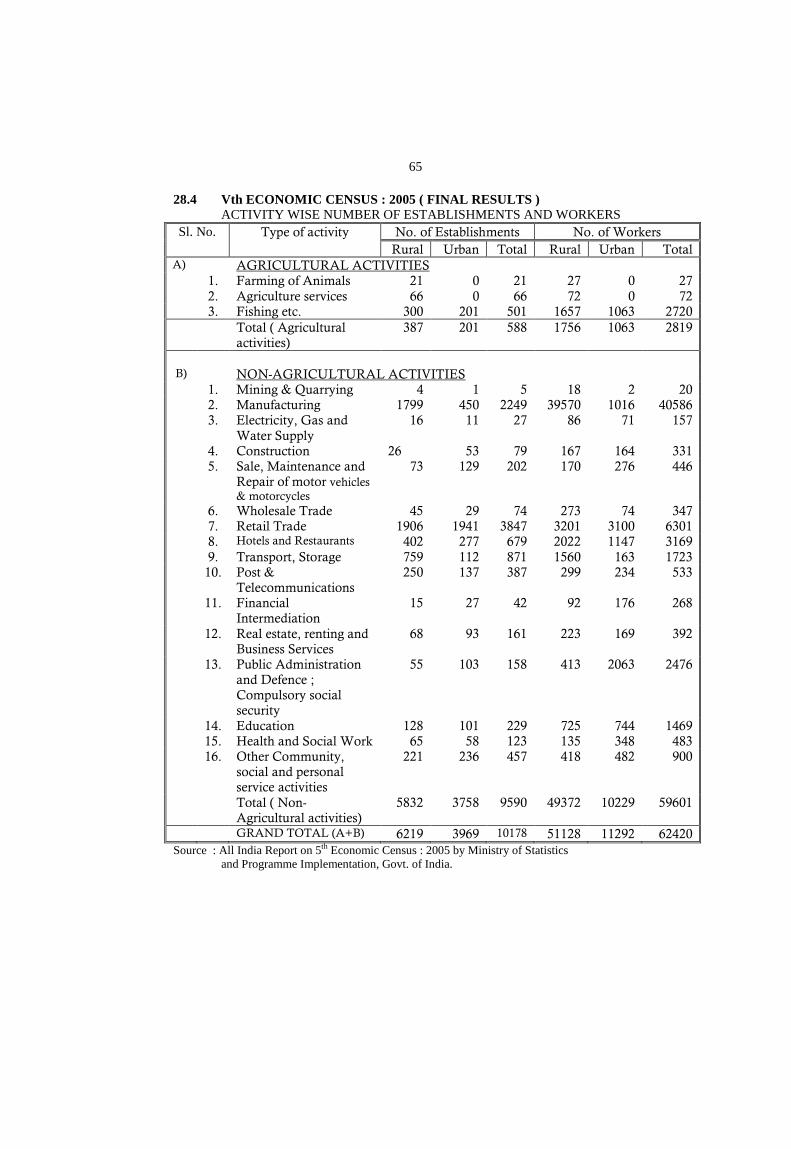
28.4 Vth ECONOMIC CENSUS : 2005 ( FINAL RESULTS )
ACTIVITY WISE NUMBER OF ESTABLISHMENTS AND WORKERS Sl. No.
Type of activity No. of Establishments No. of Workers
Rural Urban Total Rural Urban Total A) AGRICULTURAL ACTIVITIES
1. Farming of Animals 21 0 21 27 0 27 2. Agriculture services 66 0 66 72 0 72 3. Fishing etc. 300 201 501 1657 1063 2720 Total ( Agricultural
activities) 387 201 588 1756 1063 2819
B) NON-AGRICULTURAL ACTIVITIES 1. Mining & Quarrying 4 1 5 18 2 20 2. Manufacturing 1799 450 2249 39570 1016 40586 3. Electricity, Gas and
Water Supply 16 11 27 86 71 157
4. Construction 26 53 79 167 164 331 5. Sale, Maintenance and
Repair of motor vehicles & motorcycles
73 129 202 170 276 446
6. Wholesale Trade 45 29 74 273 74 347 7. Retail Trade 1906 1941 3847 3201 3100 6301 8. Hotels and Restaurants 402 277 679 2022 1147 3169 9. Transport, Storage 759 112 871 1560 163 1723 10. Post &
Telecommunications 250 137 387 299 234 533
11. Financial Intermediation
15 27 42 92 176 268
12. Real estate, renting and Business Services
68 93 161 223 169 392
13. Public Administration and Defence ; Compulsory social security
55 103 158 413 2063 2476
14. Education 128 101 229 725 744 1469 15. Health and Social Work 65 58 123 135 348 483 16. Other Community,
social and personal service activities
221 236 457 418 482 900
Total ( Non-Agricultural activities)
5832 3758 9590 49372 10229 59601
GRAND TOTAL (A+B) 6219 3969 10178 51128 11292 62420 Source : All India Report on 5th
and Programme Implementation, Govt. of India. Economic Census : 2005 by Ministry of Statistics
66
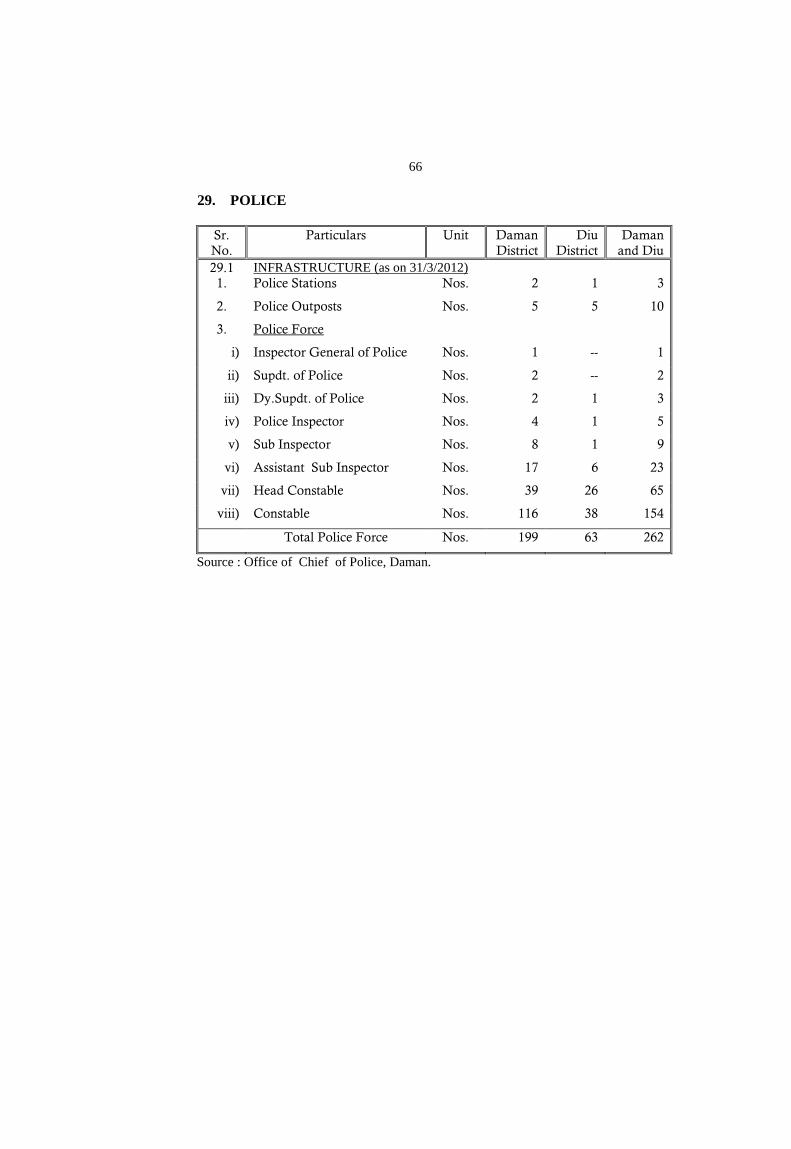
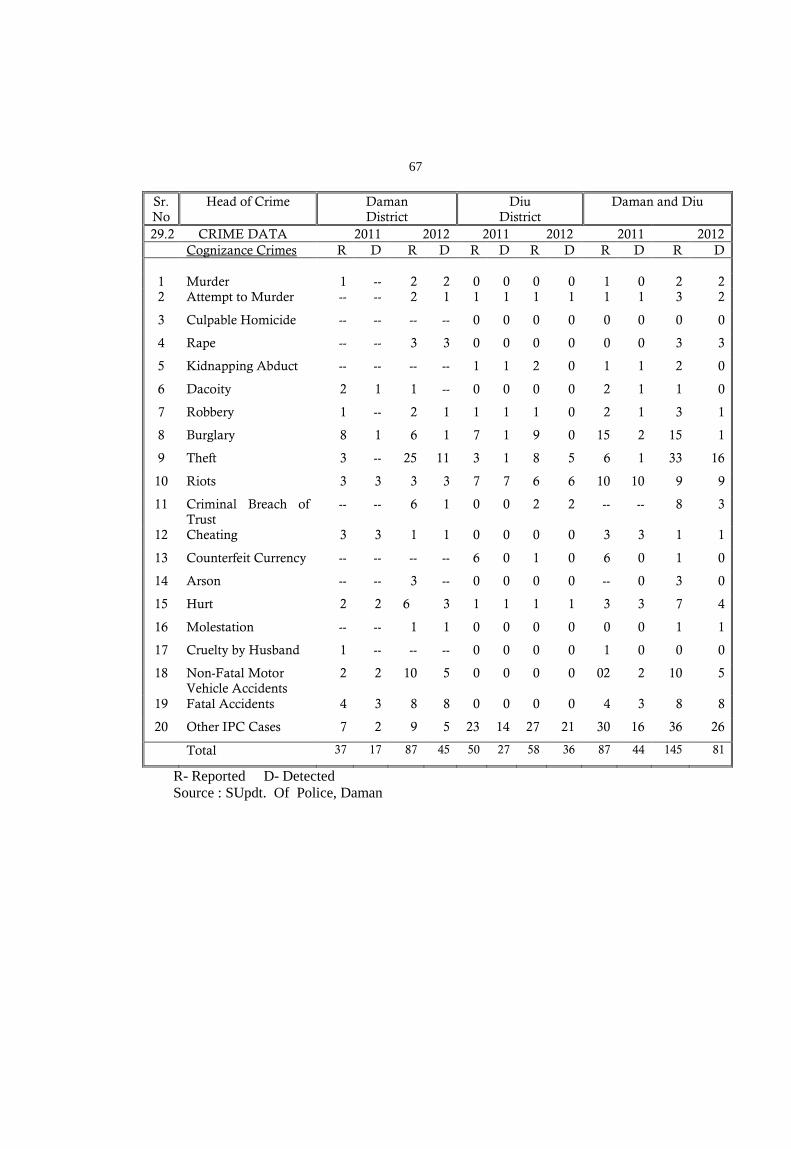
29. POLICE
Sr. No.
Particulars Unit Daman District
Diu District
Daman and Diu
29.1 INFRASTRUCTURE (as on 31/3/2012) 1. Police Stations Nos. 2 1 3
2. Police Outposts Nos. 5 5 10
3. Police Force
i) Inspector General of Police Nos. 1 -- 1
ii) Supdt. of Police Nos. 2 -- 2
iii) Dy.Supdt. of Police Nos. 2 1 3
iv) Police Inspector Nos. 4 1 5
v) Sub Inspector Nos. 8 1 9
vi) Assistant Sub Inspector Nos. 17 6 23
vii) Head Constable Nos. 39 26 65
viii) Constable Nos. 116 38 154
Total Police Force Nos. 199 63 262
Source : Office of Chief of Police, Daman.
67
Sr. No
Head of Crime Daman District
Diu District
Daman and Diu
29.2 CRIME DATA 2011 2012 2011 2012 2011 2012 Cognizance Crimes R D R D R D R D R D R D 1 Murder 1 -- 2 2 0 0 0 0 1 0 2 2 2 Attempt to Murder -- -- 2 1 1 1 1 1 1 1 3 2
3 Culpable Homicide -- -- -- -- 0 0 0 0 0 0 0 0
4 Rape -- -- 3 3 0 0 0 0 0 0 3 3
5 Kidnapping Abduct -- -- -- -- 1 1 2 0 1 1 2 0
6 Dacoity 2 1 1 -- 0 0 0 0 2 1 1 0
7 Robbery 1 -- 2 1 1 1 1 0 2 1 3 1
8 Burglary 8 1 6 1 7 1 9 0 15 2 15 1
9 Theft 3 -- 25 11 3 1 8 5 6 1 33 16
10 Riots 3 3 3 3 7 7 6 6 10 10 9 9
11 Criminal Breach of Trust
-- -- 6 1 0 0 2 2 -- -- 8 3
12 Cheating 3 3 1 1 0 0 0 0 3 3 1 1
13 Counterfeit Currency -- -- -- -- 6 0 1 0 6 0 1 0
14 Arson -- -- 3 -- 0 0 0 0 -- 0 3 0
15 Hurt 2 2 6 3 1 1 1 1 3 3 7 4
16 Molestation -- -- 1 1 0 0 0 0 0 0 1 1
17 Cruelty by Husband 1 -- -- -- 0 0 0 0 1 0 0 0
18 Non-Fatal Motor Vehicle Accidents
2 2 10 5 0 0 0 0 02 2 10 5
19 Fatal Accidents 4 3 8 8 0 0 0 0 4 3 8 8
20 Other IPC Cases 7 2 9 5 23 14 27 21 30 16 36 26
Total 37 17 87 45 50 27 58 36 87 44 145 81
R- Reported D- Detected Source : SUpdt. Of Police, Daman
68
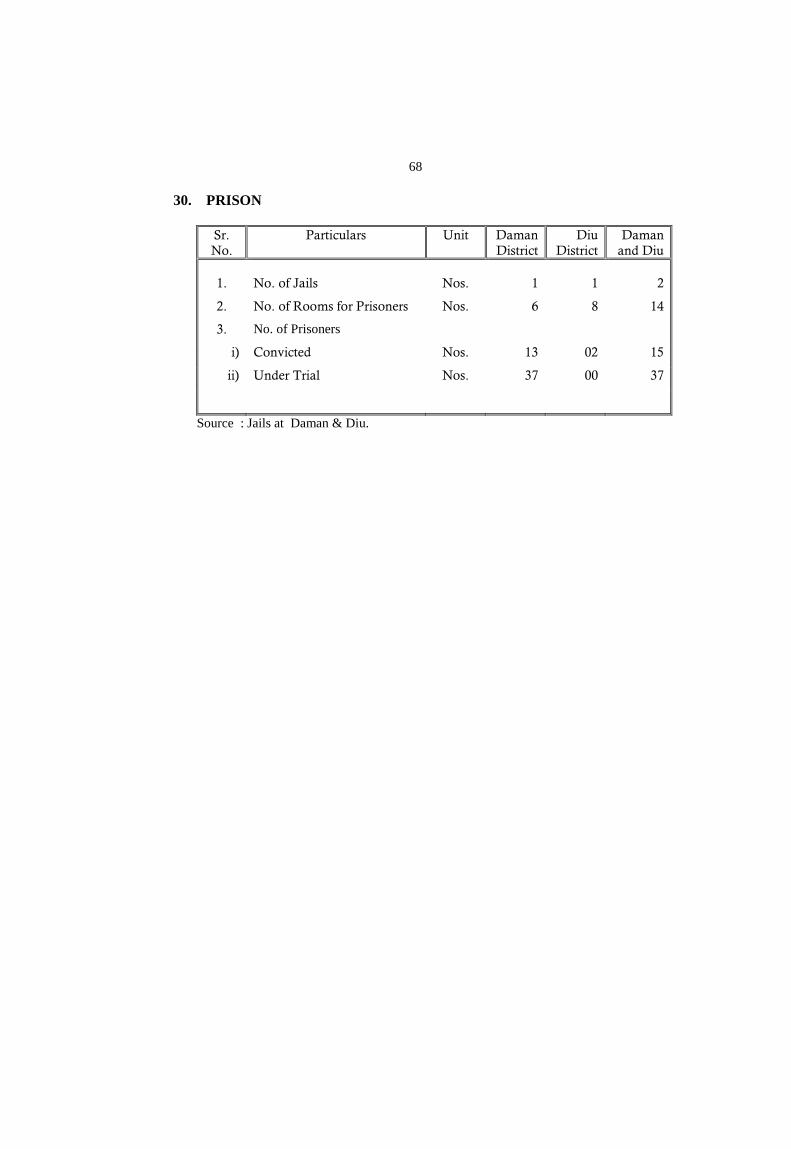
30. PRISON
Sr. No.
Particulars Unit Daman District
Diu District
Daman and Diu
1. No. of Jails Nos. 1 1 2
2. No. of Rooms for Prisoners Nos. 6 8 14
3. No. of Prisoners
i) Convicted Nos. 13 02 15
ii) Under Trial Nos. 37 00 37
Source : Jails at Daman & Diu.
69
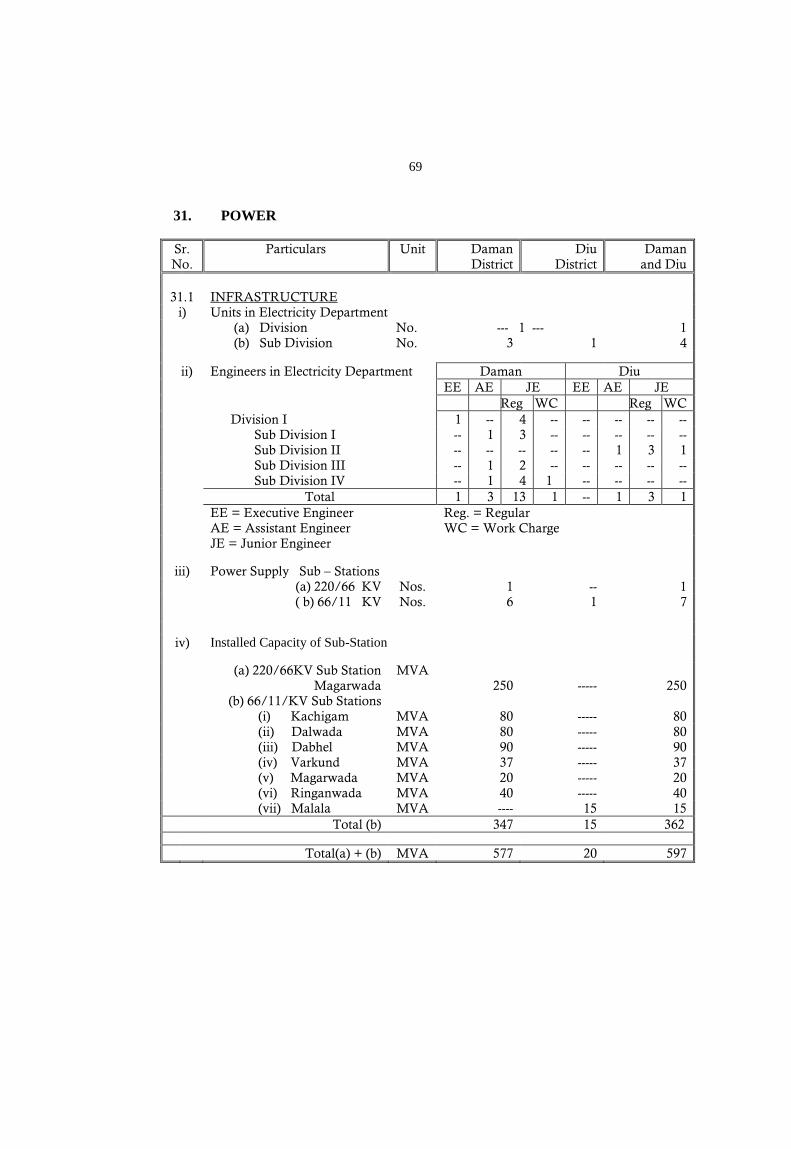
31. POWER Sr. No.
Particulars Unit Daman District
Diu District
Daman and Diu
31.1 INFRASTRUCTURE
i) Units in Electricity Department (a) Division No. --- 1 --- 1 (b) Sub Division No. 3 1 4
ii) Engineers in Electricity Department Daman Diu EE AE JE EE AE JE Reg WC Reg WC Division I 1 -- 4 -- -- -- -- -- Sub Division I -- 1 3 -- -- -- -- -- Sub Division II -- -- -- -- -- 1 3 1 Sub Division III -- 1 2 -- -- -- -- -- Sub Division IV -- 1 4 1 -- -- -- -- Total 1 3 13 1 -- 1 3 1 EE = Executive Engineer Reg. = Regular AE = Assistant Engineer WC = Work Charge JE = Junior Engineer
iii) Power Supply Sub – Stations
(a) 220/66 KV Nos. 1 -- 1 ( b) 66/11 KV Nos. 6 1 7
iv) Installed Capacity of Sub-Station (a) 220/66KV Sub Station
Magarwada MVA
250
-----
250 (b) 66/11/KV Sub Stations (i) Kachigam MVA 80 ----- 80 (ii) Dalwada MVA 80 ----- 80 (iii) Dabhel MVA 90 ----- 90 (iv) Varkund MVA 37 ----- 37 (v) Magarwada MVA 20 ----- 20 (vi) Ringanwada MVA 40 ----- 40 (vii) Malala MVA ---- 15 15 Total (b) 347 15 362
Total(a) + (b) MVA 577 20 597
70
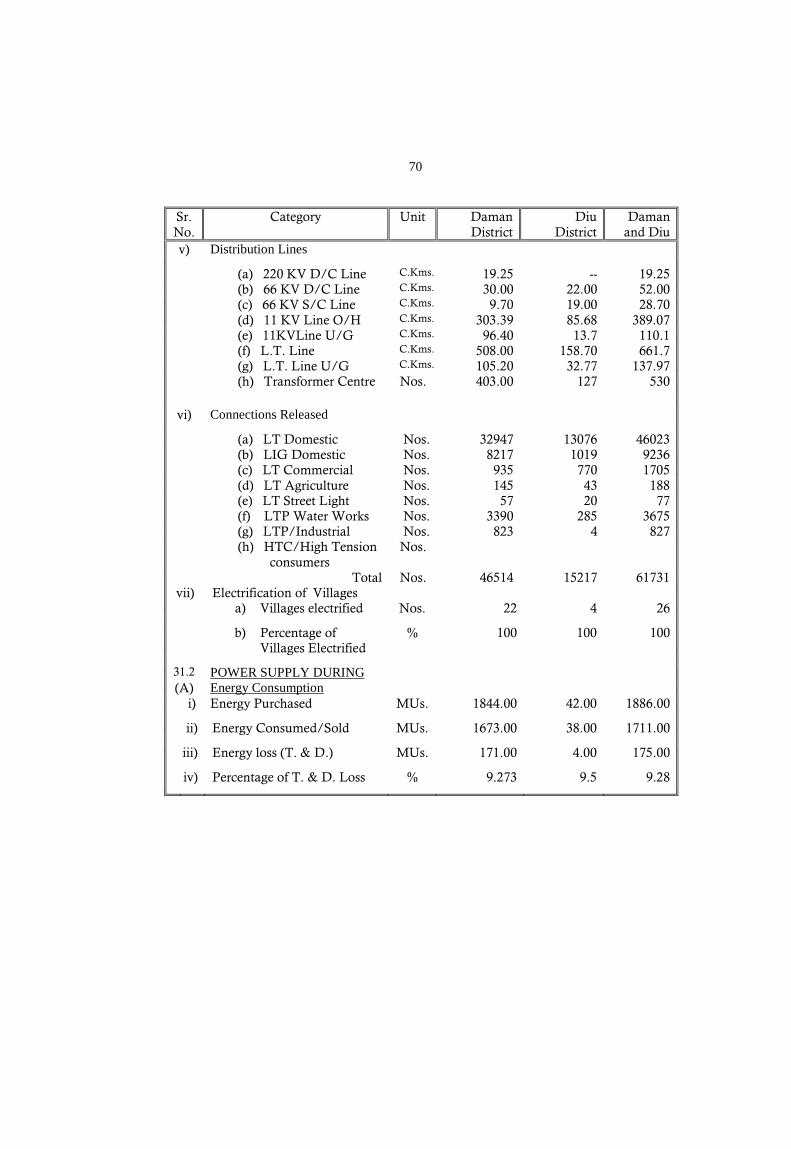
Sr. No.
Category Unit Daman District
Diu District
Daman and Diu
v) Distribution Lines
(a) 220 KV D/C Line C.Kms. 19.25 -- 19.25 (b) 66 KV D/C Line C.Kms. 30.00 22.00 52.00 (c) 66 KV S/C Line C.Kms. 9.70 19.00 28.70 (d) 11 KV Line O/H C.Kms. 303.39 85.68 389.07 (e) 11KVLine U/G C.Kms. 96.40 13.7 110.1 (f) L.T. Line C.Kms. 508.00 158.70 661.7 (g) L.T. Line U/G C.Kms. 105.20 32.77 137.97 (h) Transformer Centre Nos. 403.00 127 530
vi) Connections Released
(a) LT Domestic Nos. 32947 13076 46023 (b) LIG Domestic Nos. 8217 1019 9236 (c) LT Commercial Nos. 935 770 1705 (d) LT Agriculture Nos. 145 43 188 (e) LT Street Light Nos. 57 20 77 (f) LTP Water Works Nos. 3390 285 3675 (g) LTP/Industrial Nos. 823 4 827 (h) HTC/High Tension
consumers Nos.
Total Nos. 46514 15217 61731 vii) Electrification of Villages a) Villages electrified Nos. 22 4 26
b) Percentage of Villages Electrified
% 100 100 100
31.2 POWER SUPPLY DURING (A) Energy Consumption
i) Energy Purchased MUs. 1844.00 42.00 1886.00
ii) Energy Consumed/Sold MUs. 1673.00 38.00 1711.00
iii) Energy loss (T. & D.) MUs. 171.00 4.00 175.00
iv) Percentage of T. & D. Loss % 9.273 9.5 9.28

71
Sr. No.
Category Unit Daman District
Diu District
Daman and Diu
(B) Categorieswise Consumption of Power
a) Domestic MUs. 47.68 16.85 64.53
b) Commercial MUs. 23.22 7.00 30.22
c) Industrial MUs. 1600.12 9.00 1609.12
d) Agriculture/ Irrigation MUs. 1.94 0.7 2.64
e) Others MUs. 197.16 2.00 169.16
Total MUs. 1840.12 35.55 1875.67 (C ) Revenue Generation Unit Amount (Rs. in lakhs)
i) Revenue from sale of energy Rs. in lakh 77561.23 ii) Miscellaneous Revenue Rs. in lakh 145.85
iii) Total Revenue received (i+ii) Rs. in lakh 77707.08
iv) Cost of energy purchased Rs. in lakh 77673.46
v) Gross Profit (iii-iv) Rs. in lakh 33.62
Source : Electricity Department, Daman.
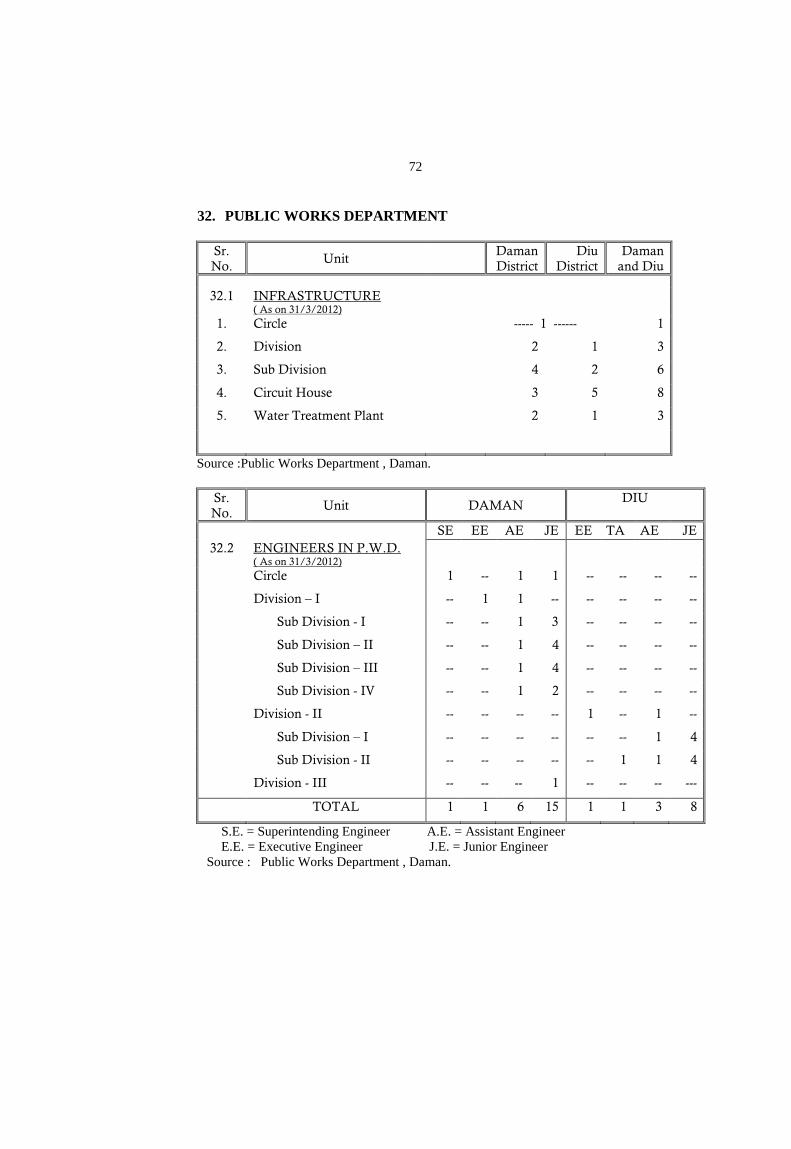
72
32. PUBLIC WORKS DEPARTMENT
Sr. No.
Unit Daman
District Diu
District Daman
and Diu
32.1 INFRASTRUCTURE ( As on 31/3/2012)
1. Circle ----- 1 ------ 1
2. Division 2 1 3
3. Sub Division 4 2 6
4. Circuit House 3 5 8
5. Water Treatment Plant 2 1 3
Source :Public Works Department , Daman.
Sr. No.
Unit DAMAN DIU
SE EE AE JE EE TA AE JE 32.2 ENGINEERS IN P.W.D.
( As on 31/3/2012) Circle 1 -- 1 1 -- -- -- --
Division – I -- 1 1 -- -- -- -- --
Sub Division - I -- -- 1 3 -- -- -- --
Sub Division – II -- -- 1 4 -- -- -- --
Sub Division – III -- -- 1 4 -- -- -- --
Sub Division - IV -- -- 1 2 -- -- -- --
Division - II -- -- -- -- 1 -- 1 --
Sub Division – I -- -- -- -- -- -- 1 4
Sub Division - II -- -- -- -- -- 1 1 4
Division - III -- -- -- 1 -- -- -- ---
TOTAL 1 1 6 15 1 1 3 8
S.E. = Superintending Engineer A.E. = Assistant Engineer E.E. = Executive Engineer J.E. = Junior Engineer
Source : Public Works Department , Daman.
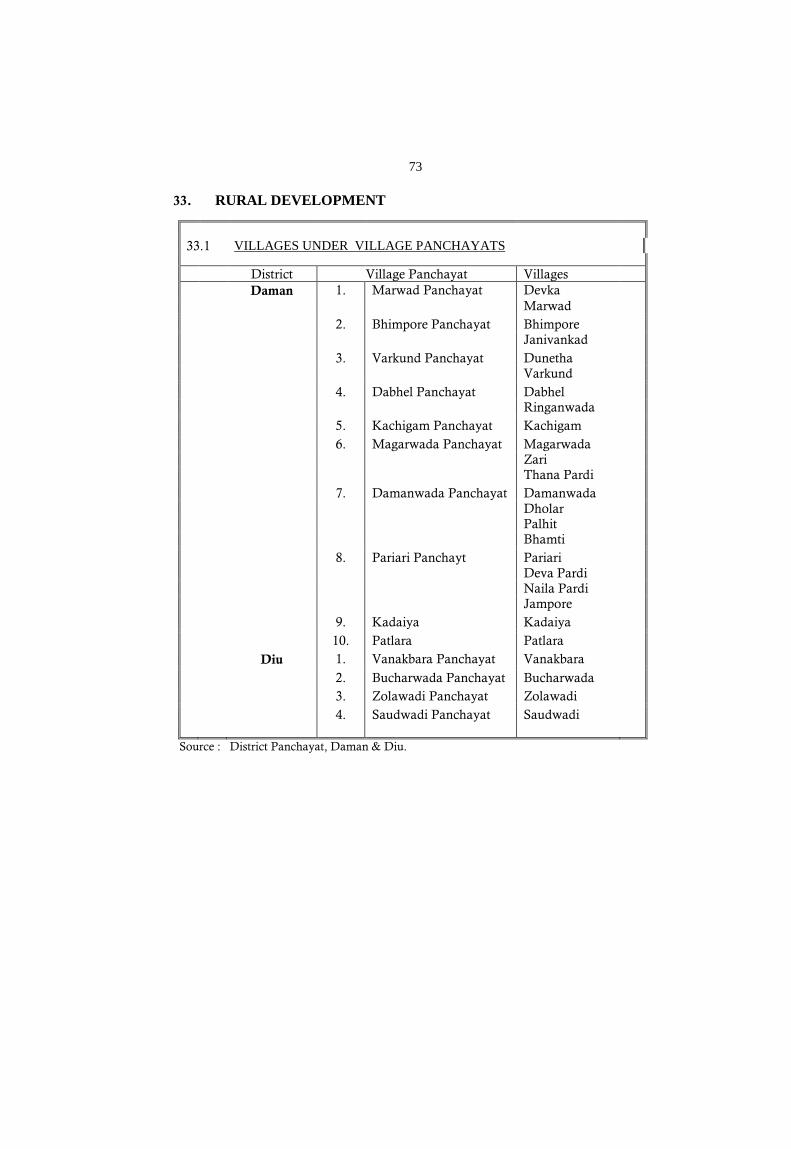
73
33. RURAL DEVELOPMENT
33.1 VILLAGES UNDER VILLAGE PANCHAYATS
District Village Panchayat Villages Daman 1. Marwad Panchayat Devka Marwad
2. Bhimpore Panchayat Bhimpore Janivankad
3. Varkund Panchayat Dunetha Varkund
4. Dabhel Panchayat Dabhel Ringanwada
5. Kachigam Panchayat Kachigam
6. Magarwada Panchayat Magarwada Zari Thana Pardi
7. Damanwada Panchayat Damanwada Dholar Palhit Bhamti
8. Pariari Panchayt Pariari Deva Pardi Naila Pardi Jampore
9. Kadaiya Kadaiya
10. Patlara Patlara
Diu 1. Vanakbara Panchayat Vanakbara
2. Bucharwada Panchayat Bucharwada
3. Zolawadi Panchayat Zolawadi
4. Saudwadi Panchayat Saudwadi
Source : District Panchayat, Daman & Diu.
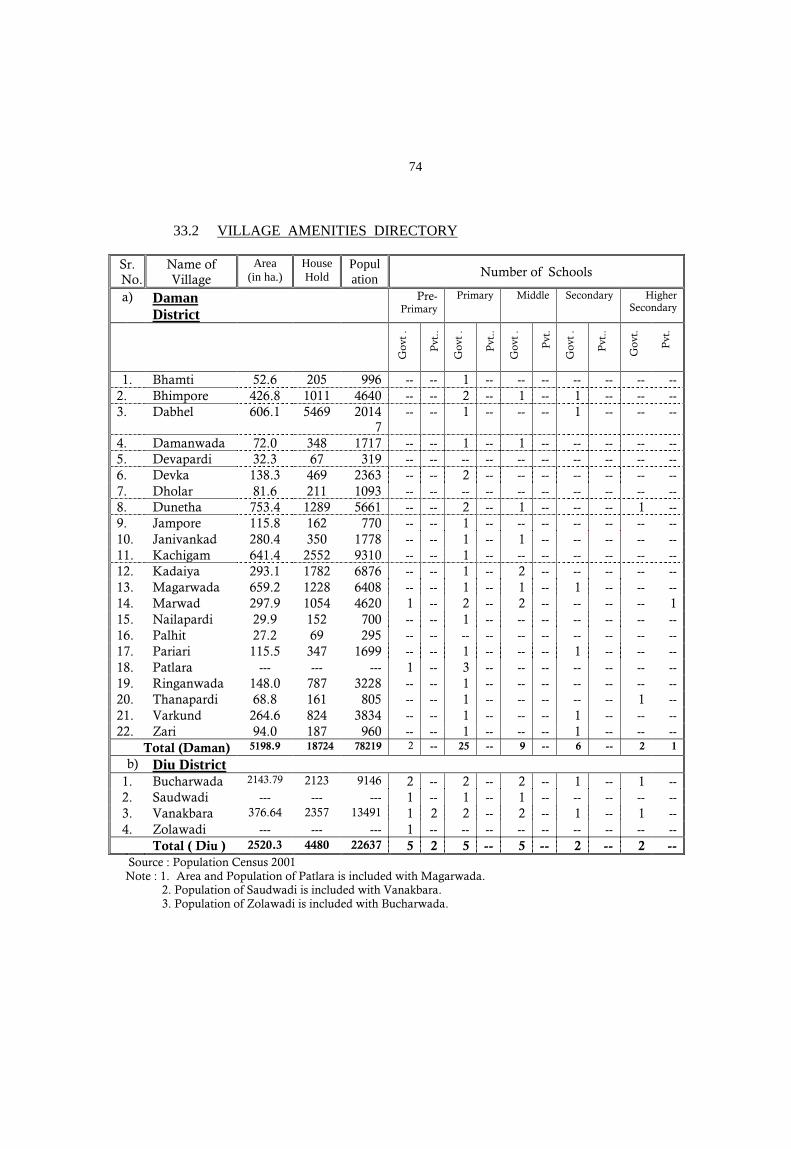
74
33.2 VILLAGE AMENITIES DIRECTORY
Sr. No.
Name of Village
Area (in ha.)
House Hold
Population Number of Schools
a) Daman District
Pre-Primary
Primary Middle Secondary Higher Secondary
Gov
t .
Pvt
..
Gov
t .
Pvt
..
Gov
t .
Pvt
.
Gov
t .
Pvt
..
Gov
t.
Pvt
.
1. Bhamti 52.6 205 996 -- -- 1 -- -- -- -- -- -- -- 2. Bhimpore 426.8 1011 4640 -- -- 2 -- 1 -- 1 -- -- -- 3. Dabhel 606.1 5469 2014
7 -- -- 1 -- -- -- 1 -- -- --
4. Damanwada 72.0 348 1717 -- -- 1 -- 1 -- -- -- -- -- 5. Devapardi 32.3 67 319 -- -- -- -- -- -- -- -- -- -- 6. Devka 138.3 469 2363 -- -- 2 -- -- -- -- -- -- -- 7. Dholar 81.6 211 1093 -- -- -- -- -- -- -- -- -- -- 8. Dunetha 753.4 1289 5661 -- -- 2 -- 1 -- -- -- 1 -- 9. Jampore 115.8 162 770 -- -- 1 -- -- -- -- -- -- -- 10. Janivankad 280.4 350 1778 -- -- 1 -- 1 -- -- -- -- -- 11. Kachigam 641.4 2552 9310 -- -- 1 -- -- -- -- -- -- -- 12. Kadaiya 293.1 1782 6876 -- -- 1 -- 2 -- -- -- -- -- 13. Magarwada 659.2 1228 6408 -- -- 1 -- 1 -- 1 -- -- -- 14. Marwad 297.9 1054 4620 1 -- 2 -- 2 -- -- -- -- 1 15. Nailapardi 29.9 152 700 -- -- 1 -- -- -- -- -- -- -- 16. Palhit 27.2 69 295 -- -- -- -- -- -- -- -- -- -- 17. Pariari 115.5 347 1699 -- -- 1 -- -- -- 1 -- -- -- 18. Patlara --- --- --- 1 -- 3 -- -- -- -- -- -- -- 19. Ringanwada 148.0 787 3228 -- -- 1 -- -- -- -- -- -- -- 20. Thanapardi 68.8 161 805 -- -- 1 -- -- -- -- -- 1 -- 21. Varkund 264.6 824 3834 -- -- 1 -- -- -- 1 -- -- -- 22. Zari 94.0 187 960 -- -- 1 -- -- -- 1 -- -- --
Total (Daman) 5198.9 18724 78219 2 -- 25 -- 9 -- 6 -- 2 1
b) Diu District 1. Bucharwada 2143.79 2123 9146 2 -- 2 -- 2 -- 1 -- 1 -- 2. Saudwadi --- --- --- 1 -- 1 -- 1 -- -- -- -- -- 3. Vanakbara 376.64 2357 13491 1 2 2 -- 2 -- 1 -- 1 -- 4. Zolawadi --- --- --- 1 -- -- -- -- -- -- -- -- --
Total ( Diu ) 2520.3 4480 22637 5 2 5 -- 5 -- 2 -- 2 -- Source : Population Census 2001 Note : 1. Area and Population of Patlara is included with Magarwada. 2. Population of Saudwadi is included with Vanakbara. 3. Population of Zolawadi is included with Bucharwada.
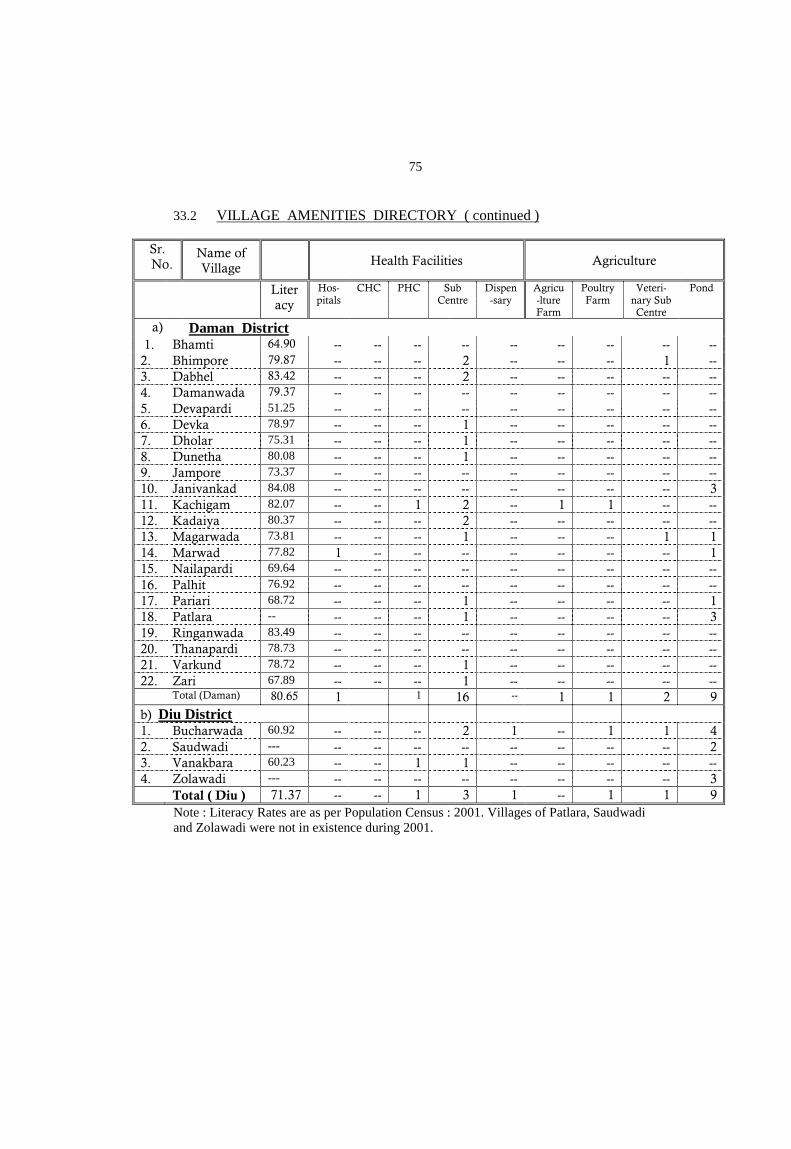
75
33.2 VILLAGE AMENITIES DIRECTORY ( continued )
Sr. No.
Name of Village
Health Facilities Agriculture
Literacy
Hos-pitals
CHC PHC
Sub Centre
Dispen-sary
Agricu-lture Farm
Poultry Farm
Veteri-nary Sub Centre
Pond
a) Daman District 1. Bhamti 64.90 -- -- -- -- -- -- -- -- --
2. Bhimpore 79.87 -- -- -- 2 -- -- -- 1 -- 3. Dabhel 83.42 -- -- -- 2 -- -- -- -- -- 4. Damanwada 79.37 -- -- -- -- -- -- -- -- -- 5. Devapardi 51.25 -- -- -- -- -- -- -- -- -- 6. Devka 78.97 -- -- -- 1 -- -- -- -- -- 7. Dholar 75.31 -- -- -- 1 -- -- -- -- -- 8. Dunetha 80.08 -- -- -- 1 -- -- -- -- -- 9. Jampore 73.37 -- -- -- -- -- -- -- -- -- 10. Janivankad 84.08 -- -- -- -- -- -- -- -- 3 11. Kachigam 82.07 -- -- 1 2 -- 1 1 -- -- 12. Kadaiya 80.37 -- -- -- 2 -- -- -- -- -- 13. Magarwada 73.81 -- -- -- 1 -- -- -- 1 1 14. Marwad 77.82 1 -- -- -- -- -- -- -- 1 15. Nailapardi 69.64 -- -- -- -- -- -- -- -- -- 16. Palhit 76.92 -- -- -- -- -- -- -- -- -- 17. Pariari 68.72 -- -- -- 1 -- -- -- -- 1 18. Patlara -- -- -- -- 1 -- -- -- -- 3 19. Ringanwada 83.49 -- -- -- -- -- -- -- -- -- 20. Thanapardi 78.73 -- -- -- -- -- -- -- -- -- 21. Varkund 78.72 -- -- -- 1 -- -- -- -- -- 22. Zari 67.89 -- -- -- 1 -- -- -- -- -- Total (Daman) 80.65 1 1 16 -- 1 1 2 9 b) Diu District 1. Bucharwada 60.92 -- -- -- 2 1 -- 1 1 4 2. Saudwadi --- -- -- -- -- -- -- -- -- 2 3. Vanakbara 60.23 -- -- 1 1 -- -- -- -- -- 4. Zolawadi --- -- -- -- -- -- -- -- -- 3 Total ( Diu ) 71.37 -- -- 1 3 1 -- 1 1 9
Note : Literacy Rates are as per Population Census : 2001. Villages of Patlara, Saudwadi and Zolawadi were not in existence during 2001.
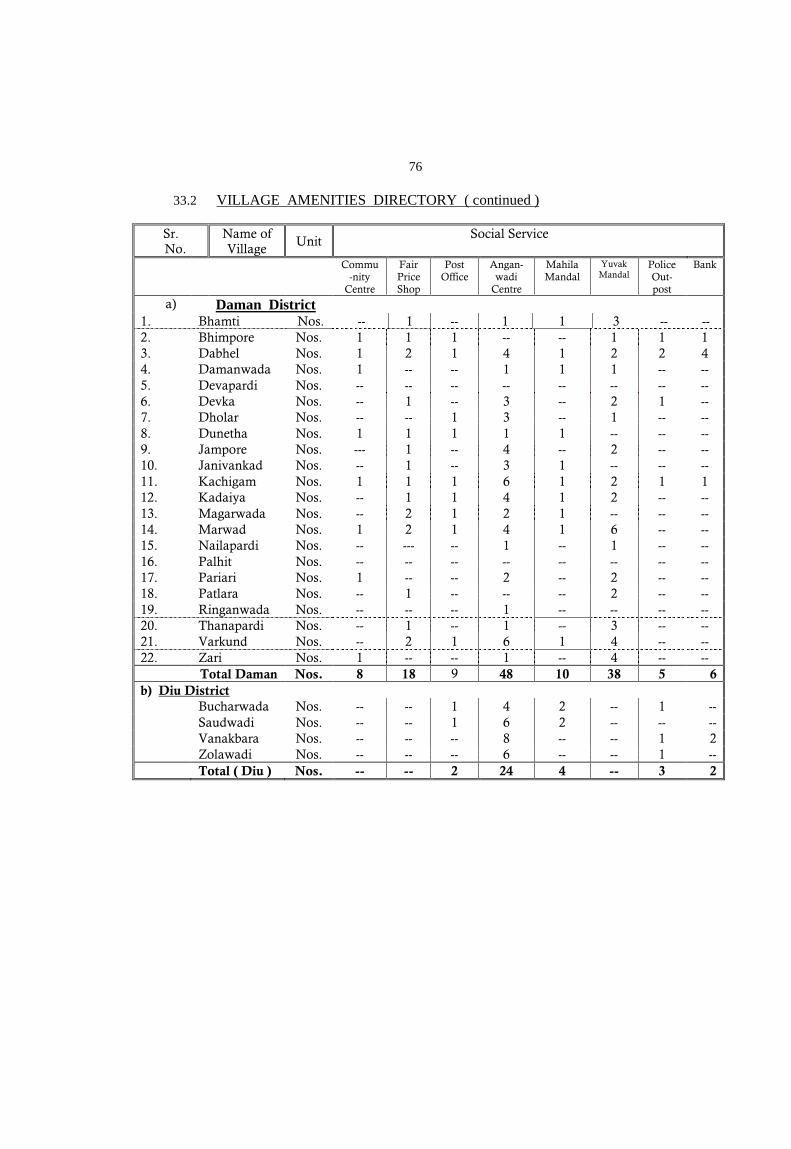
76
33.2 VILLAGE AMENITIES DIRECTORY ( continued )
Sr. No.
Name of Village
Unit Social Service
Commu-nity
Centre
Fair Price Shop
Post Office
Angan-wadi
Centre
Mahila Mandal
Yuvak Mandal
Police Out-post
Bank
a) Daman District 1. Bhamti Nos. -- 1 -- 1 1 3 -- -- 2. Bhimpore Nos. 1 1 1 -- -- 1 1 1 3. Dabhel Nos. 1 2 1 4 1 2 2 4 4. Damanwada Nos. 1 -- -- 1 1 1 -- -- 5. Devapardi Nos. -- -- -- -- -- -- -- -- 6. Devka Nos. -- 1 -- 3 -- 2 1 -- 7. Dholar Nos. -- -- 1 3 -- 1 -- -- 8. Dunetha Nos. 1 1 1 1 1 -- -- -- 9. Jampore Nos. --- 1 -- 4 -- 2 -- -- 10. Janivankad Nos. -- 1 -- 3 1 -- -- -- 11. Kachigam Nos. 1 1 1 6 1 2 1 1 12. Kadaiya Nos. -- 1 1 4 1 2 -- -- 13. Magarwada Nos. -- 2 1 2 1 -- -- -- 14. Marwad Nos. 1 2 1 4 1 6 -- -- 15. Nailapardi Nos. -- --- -- 1 -- 1 -- -- 16. Palhit Nos. -- -- -- -- -- -- -- -- 17. Pariari Nos. 1 -- -- 2 -- 2 -- -- 18. Patlara Nos. -- 1 -- -- -- 2 -- -- 19. Ringanwada Nos. -- -- -- 1 -- -- -- -- 20. Thanapardi Nos. -- 1 -- 1 -- 3 -- -- 21. Varkund Nos. -- 2 1 6 1 4 -- -- 22. Zari Nos. 1 -- -- 1 -- 4 -- --
Total Daman Nos. 8 18 9 48 10 38 5 6 b) Diu District Bucharwada Nos. -- -- 1 4 2 -- 1 -- Saudwadi Nos. -- -- 1 6 2 -- -- -- Vanakbara Nos. -- -- -- 8 -- -- 1 2 Zolawadi Nos. -- -- -- 6 -- -- 1 -- Total ( Diu ) Nos. -- -- 2 24 4 -- 3 2
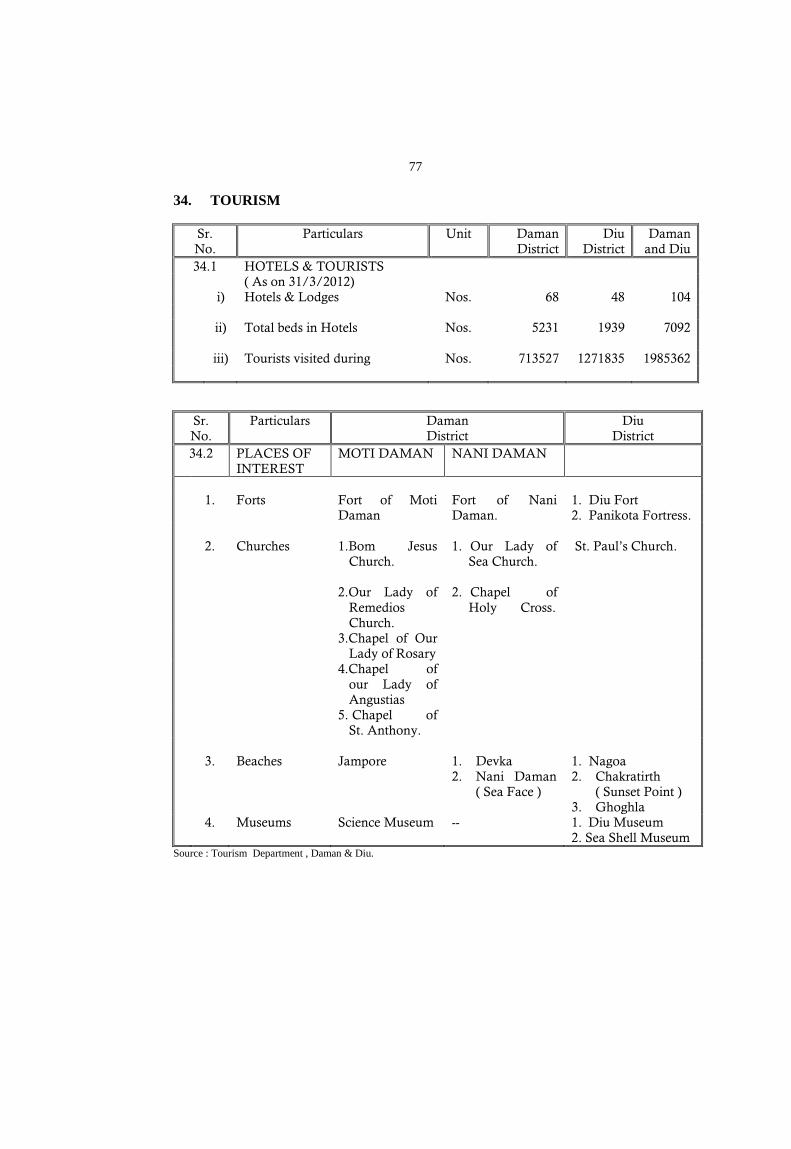
77
34. TOURISM
Sr. No.
Particulars Unit Daman District
Diu District
Daman and Diu
34.1 HOTELS & TOURISTS ( As on 31/3/2012) i) Hotels & Lodges Nos. 68 48 104 ii) Total beds in Hotels Nos. 5231 1939 7092 iii) Tourists visited during Nos. 713527 1271835 1985362
Sr. No.
Particulars Daman District
Diu District
34.2
PLACES OF INTEREST
MOTI DAMAN NANI DAMAN
1. Forts Fort of Moti
Daman Fort of Nani Daman.
1. Diu Fort 2. Panikota Fortress.
2. Churches 1.Bom Jesus Church.
1. Our Lady of Sea Church.
St. Paul’s Church.
2.Our Lady of Remedios Church.
2. Chapel of Holy Cross.
3.Chapel of Our Lady of Rosary
4.Chapel of our Lady of Angustias
5. Chapel of St. Anthony.
3. Beaches Jampore 1. Devka
2. Nani Daman ( Sea Face )
1. Nagoa 2. Chakratirth
( Sunset Point ) 3. Ghoghla
4. Museums Science Museum -- 1. Diu Museum 2. Sea Shell Museum
Source : Tourism Department , Daman & Diu.
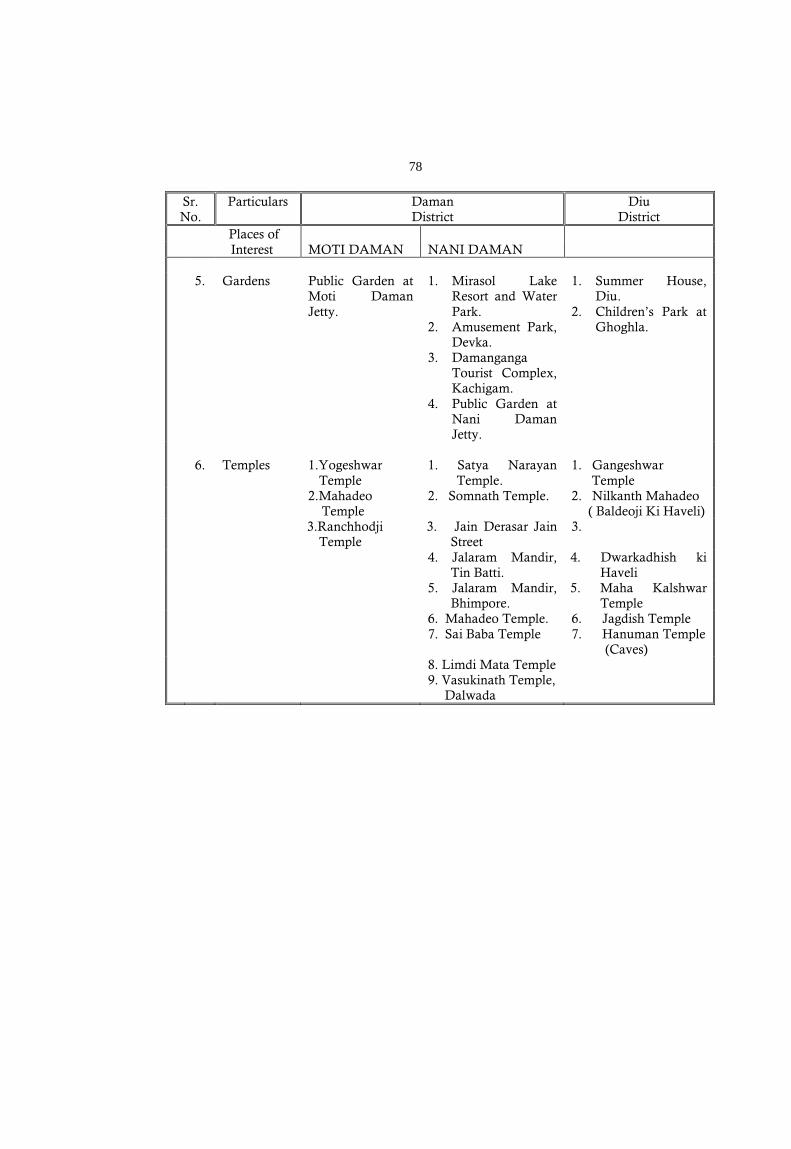
78
Sr. No.
Particulars Daman District
Diu District
Places of Interest
MOTI DAMAN NANI DAMAN
5. Gardens Public Garden at
Moti Daman Jetty.
1. Mirasol Lake Resort and Water Park.
2. Amusement Park, Devka.
3. Damanganga Tourist Complex, Kachigam.
4. Public Garden at Nani Daman Jetty.
1. Summer House, Diu.
2. Children’s Park at Ghoghla.
6. Temples 1.Yogeshwar
Temple 1. Satya Narayan
Temple. 1. Gangeshwar Temple
2.Mahadeo Temple
2. Somnath Temple. 2. Nilkanth Mahadeo ( Baldeoji Ki Haveli)
3.Ranchhodji Temple
3. Jain Derasar Jain Street
3.
4. Jalaram Mandir, Tin Batti.
4. Dwarkadhish ki Haveli
5. Jalaram Mandir, Bhimpore.
5. Maha Kalshwar Temple
6. Mahadeo Temple. 6. Jagdish Temple 7. Sai Baba Temple
7. Hanuman Temple (Caves)
8. Limdi Mata Temple 9. Vasukinath Temple,
Dalwada
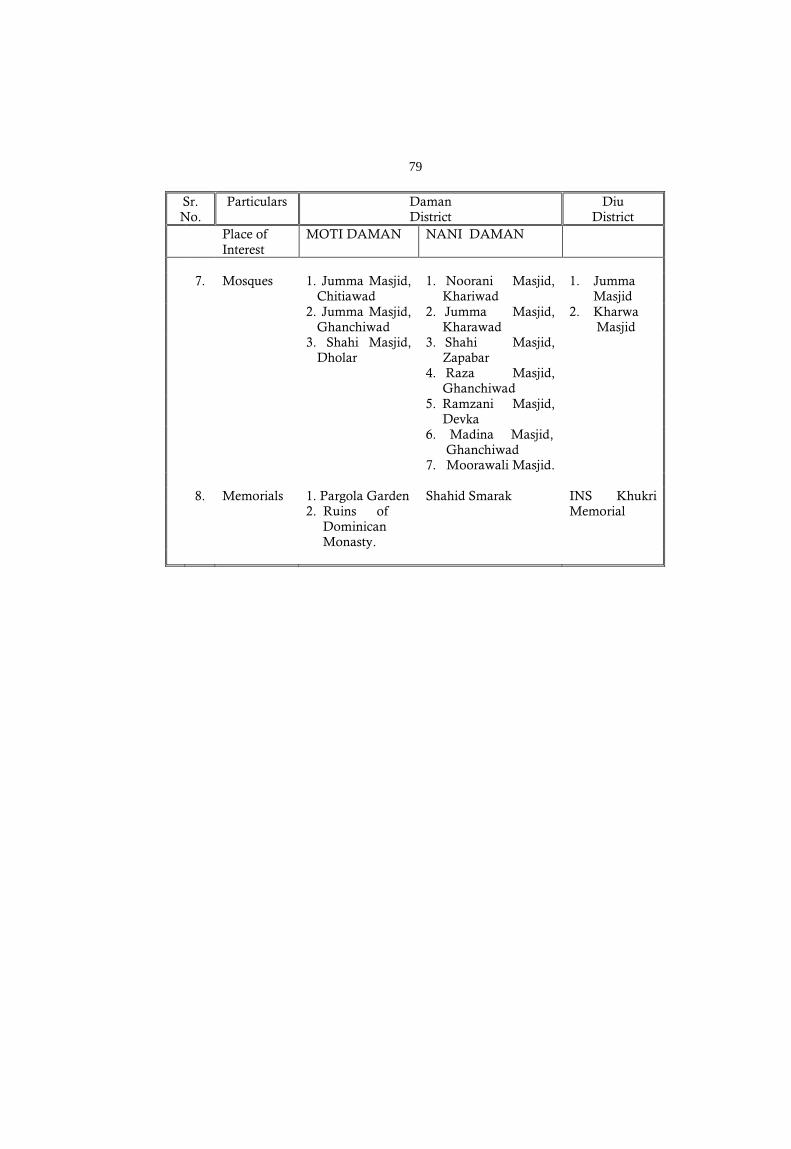
79
Sr. No.
Particulars Daman District
Diu District
Place of Interest
MOTI DAMAN NANI DAMAN
7. Mosques 1. Jumma Masjid,
Chitiawad 1. Noorani Masjid,
Khariwad 1. Jumma
Masjid 2. Jumma Masjid,
Ghanchiwad 2. Jumma Masjid,
Kharawad 2. Kharwa Masjid
3. Shahi Masjid, Dholar
3. Shahi Masjid, Zapabar
4. Raza Masjid, Ghanchiwad
5. Ramzani Masjid, Devka
6. Madina Masjid, Ghanchiwad
7. Moorawali Masjid. 8. Memorials 1. Pargola Garden Shahid Smarak INS Khukri
Memorial 2. Ruins of Dominican Monasty.
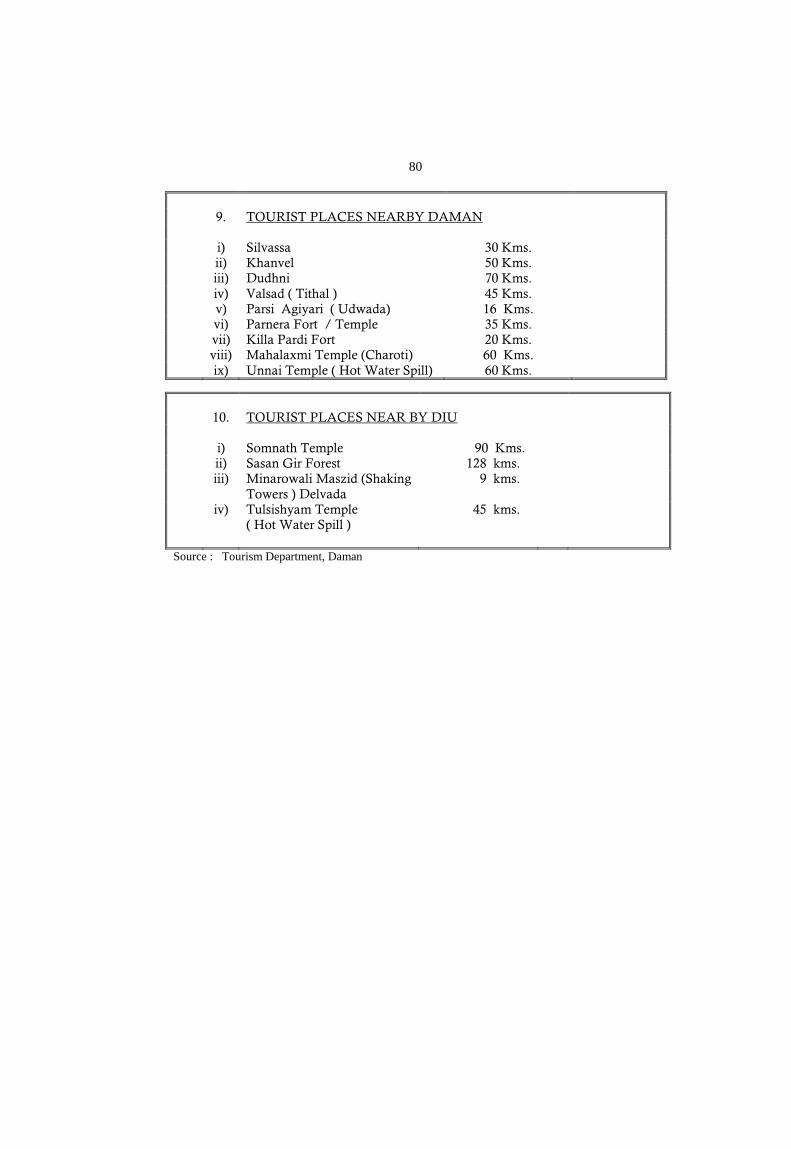
80
9. TOURIST PLACES NEARBY DAMAN i) Silvassa 30 Kms. ii) Khanvel 50 Kms. iii) Dudhni 70 Kms. iv) Valsad ( Tithal ) 45 Kms. v) Parsi Agiyari ( Udwada) 16 Kms. vi) Parnera Fort / Temple 35 Kms. vii) Killa Pardi Fort 20 Kms.
viii) Mahalaxmi Temple (Charoti) 60 Kms. ix) Unnai Temple ( Hot Water Spill) 60 Kms.
10. TOURIST PLACES NEAR BY DIU i) Somnath Temple 90 Kms. ii) Sasan Gir Forest 128 kms. iii) Minarowali Maszid (Shaking
Towers ) Delvada 9 kms.
iv) Tulsishyam Temple ( Hot Water Spill )
45 kms.
Source : Tourism Department, Daman
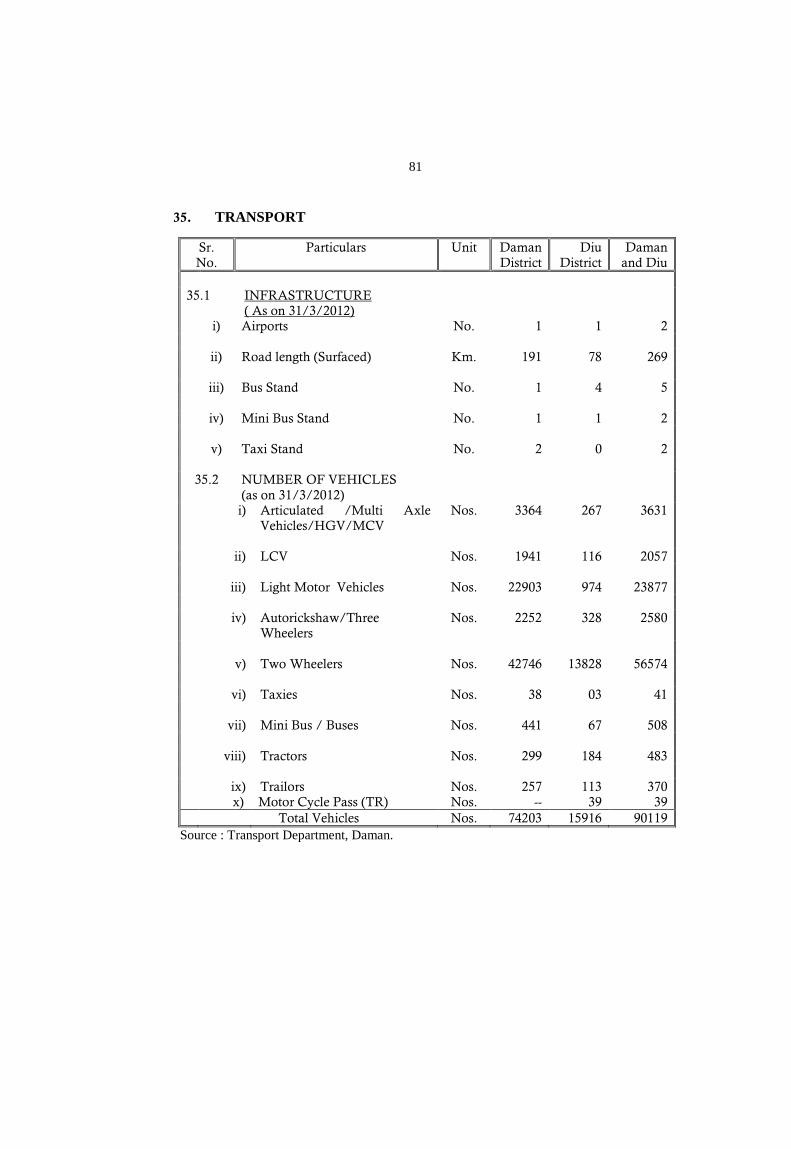
81
35. TRANSPORT
Sr. No.
Particulars Unit Daman District
Diu District
Daman and Diu
35.1 INFRASTRUCTURE
( As on 31/3/2012)
i) Airports No. 1 1 2 ii) Road length (Surfaced) Km. 191 78 269 iii) Bus Stand No. 1 4 5 iv) Mini Bus Stand No. 1 1 2 v) Taxi Stand No. 2 0 2 35.2 NUMBER OF VEHICLES
(as on 31/3/2012)
i) Articulated /Multi Axle Vehicles/HGV/MCV
Nos. 3364 267 3631
ii) LCV Nos. 1941 116 2057 iii) Light Motor Vehicles Nos. 22903 974 23877 iv) Autorickshaw/Three
Wheelers Nos. 2252 328 2580
v) Two Wheelers Nos. 42746 13828 56574 vi) Taxies Nos. 38 03 41 vii) Mini Bus / Buses Nos. 441 67 508 viii) Tractors Nos. 299 184 483 ix) Trailors Nos. 257 113 370 x) Motor Cycle Pass (TR) Nos. -- 39 39 Total Vehicles Nos. 74203 15916 90119
Source : Transport Department, Daman.
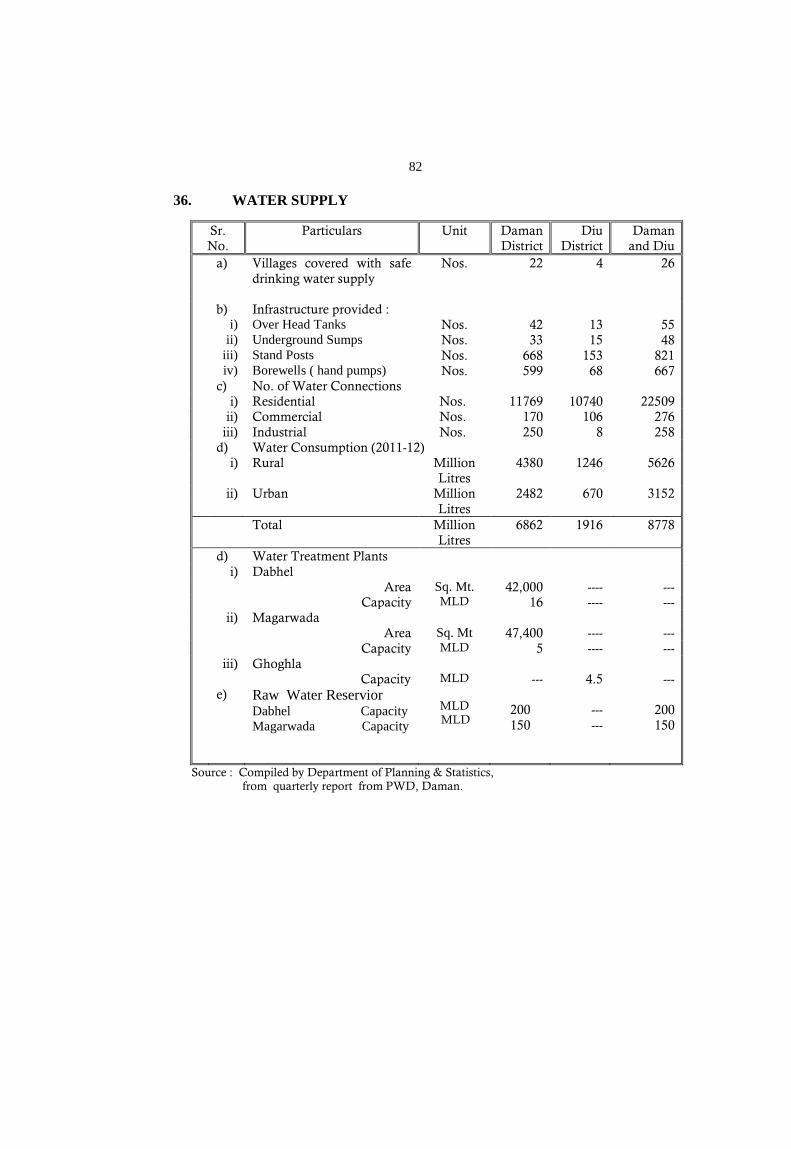
82
36. WATER SUPPLY
Sr. No.
Particulars Unit Daman District
Diu District
Daman and Diu
a) Villages covered with safe drinking water supply
Nos. 22 4 26
b)
i) ii)
iii) iv)
Infrastructure provided : Over Head Tanks Underground Sumps Stand Posts Borewells ( hand pumps)
Nos. Nos. Nos. Nos.
42 33
668 599
13 15
153 68
55 48
821 667
c) No. of Water Connections i) Residential Nos. 11769 10740 22509 ii) Commercial Nos. 170 106 276 iii) Industrial Nos. 250 8 258 d) Water Consumption (2011-12) i) Rural Million 4380 1246 5626 Litres ii) Urban Million 2482 670 3152 Litres Total Million 6862 1916 8778 Litres d) Water Treatment Plants i) Dabhel Area Sq. Mt. 42,000 ---- --- Capacity MLD 16 ---- --- ii) Magarwada Area Sq. Mt 47,400 ---- --- Capacity MLD 5 ---- --- iii) Ghoghla
e) Capacity Raw Water Reservior Dabhel Capacity Magarwada Capacity
MLD
MLD MLD
---
200 150
4.5
--- ---
---
200 150
Source : Compiled by Department of Planning & Statistics, from quarterly report from PWD, Daman.
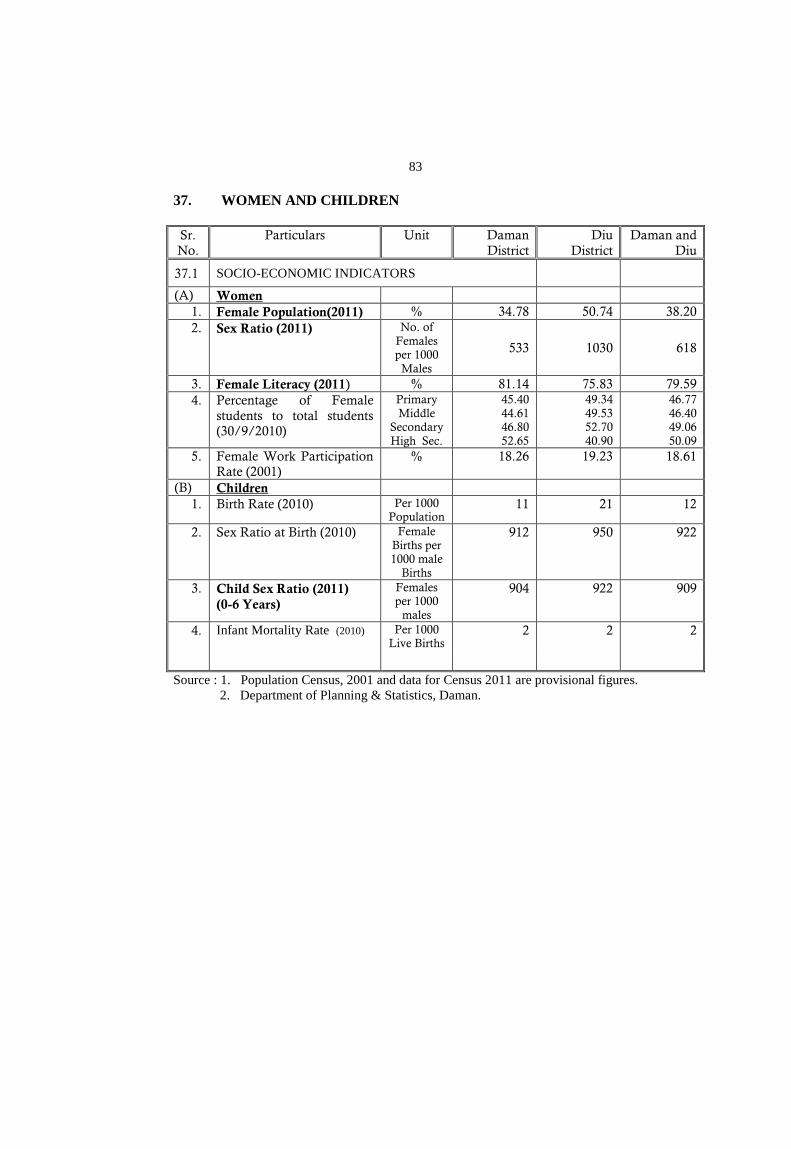
83
37. WOMEN AND CHILDREN
Sr. No.
Particulars Unit Daman District
Diu District
Daman and Diu
37.1 SOCIO-ECONOMIC INDICATORS
(A) Women 1. Female Population(2011) % 34.78 50.74 38.20 2. Sex Ratio (2011) No. of
Females per 1000
Males
533 1030 618
3. Female Literacy (2011) % 81.14 75.83 79.59 4. Percentage of Female
students to total students (30/9/2010)
Primary Middle
Secondary High Sec.
45.40 44.61 46.80 52.65
49.34 49.53 52.70 40.90
46.77 46.40 49.06 50.09
5. Female Work Participation Rate (2001)
% 18.26 19.23 18.61
(B) Children 1. Birth Rate (2010) Per 1000
Population 11 21 12
2. Sex Ratio at Birth (2010) Female Births per 1000 male
Births
912 950 922
3. Child Sex Ratio (2011) (0-6 Years)
Females per 1000
males
904 922 909
4. Infant Mortality Rate (2010) Per 1000 Live Births
2 2 2
Source : 1. Population Census, 2001 and data for Census 2011 are provisional figures. 2. Department of Planning & Statistics, Daman.
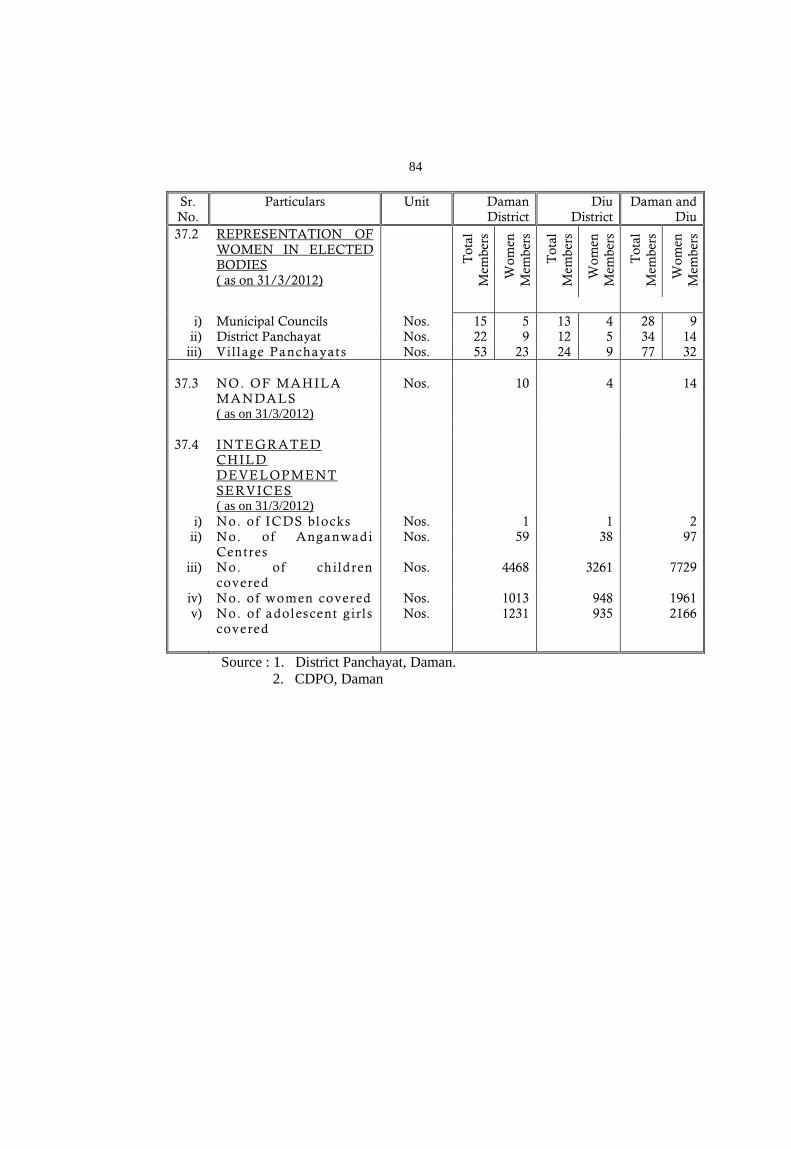
84
Sr. No.
Particulars Unit Daman District
Diu District
Daman and Diu
37.2 REPRESENTATION OF WOMEN IN ELECTED BODIES ( as on 31/3/2012)
Tot
al
Mem
bers
Wom
en
Mem
bers
Tot
al
Mem
bers
Wom
en
Mem
bers
Tot
al
Mem
bers
Wom
en
Mem
bers
i) Municipal Councils Nos. 15 5 13 4 28 9
ii) District Panchayat Nos. 22 9 12 5 34 14 iii) Vil lage Panchayats Nos. 53 23 24 9 77 32
37.3 NO. OF MAHILA
MANDALS ( as on 31/3/2012)
Nos. 10 4 14
37.4 INTEGRATED
CHILD DEVELOPMENT SERVICES ( as on 31/3/2012)
i) No. of ICDS blocks Nos. 1 1 2 ii) No. of Anganwadi
Centres Nos. 59 38 97
iii) No. of children covered
Nos. 4468 3261 7729
iv) No. of women covered Nos. 1013 948 1961 v) No. of adolescent g irls
covered Nos. 1231 935 2166
Source : 1. District Panchayat, Daman.
2. CDPO, Daman
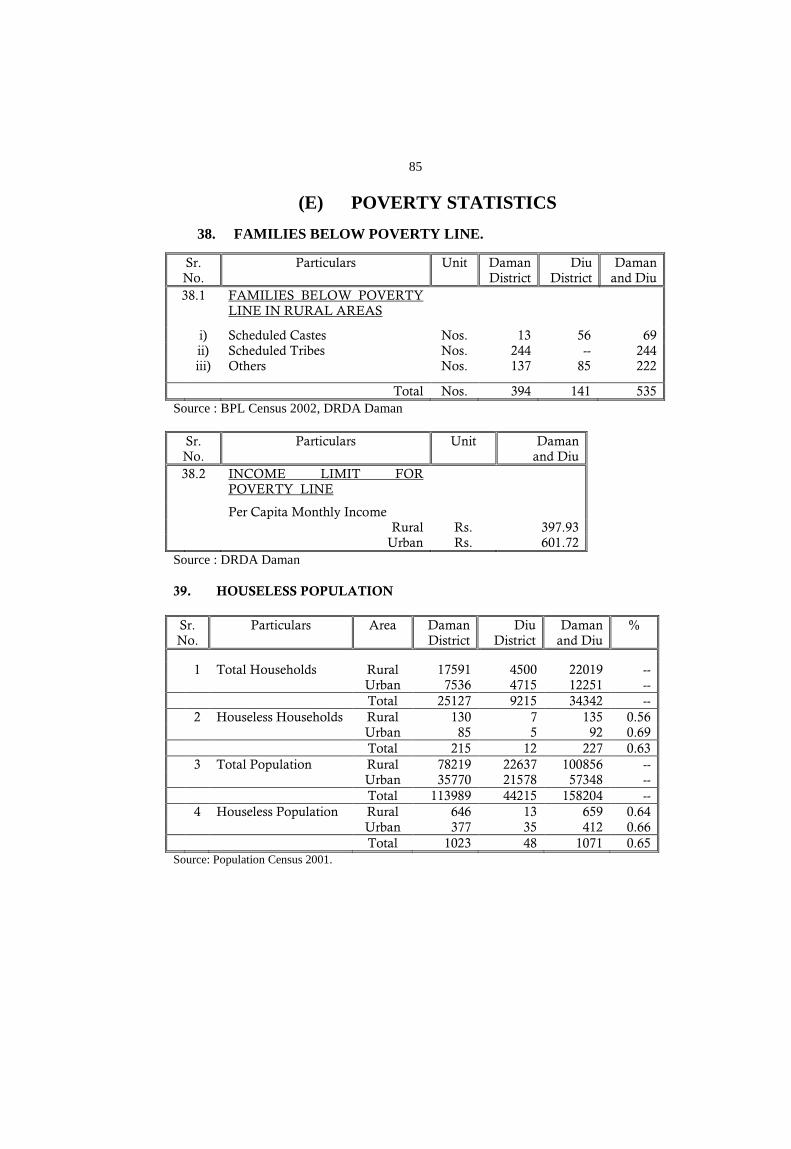
85
(E) POVERTY STATISTICS 38. FAMILIES BELOW POVERTY LINE.
Sr. No.
Particulars Unit Daman District
Diu District
Daman and Diu
38.1 FAMILIES BELOW POVERTY LINE IN RURAL AREAS
i) Scheduled Castes Nos. 13 56 69 ii) Scheduled Tribes Nos. 244 -- 244 iii) Others Nos. 137 85 222
Total Nos. 394 141 535 Source : BPL Census 2002, DRDA Daman
Sr. No.
Particulars Unit Daman and Diu
38.2 INCOME LIMIT FOR POVERTY LINE
Per Capita Monthly Income Rural Rs. 397.93 Urban Rs. 601.72 Source : DRDA Daman 39. HOUSELESS POPULATION Sr. No.
Particulars Area Daman District
Diu District
Daman and Diu
%
1 Total Households Rural 17591 4500 22019 -- Urban 7536 4715 12251 -- Total 25127 9215 34342 -- 2 Houseless Households Rural 130 7 135 0.56 Urban 85 5 92 0.69 Total 215 12 227 0.63 3 Total Population Rural 78219 22637 100856 -- Urban 35770 21578 57348 -- Total 113989 44215 158204 -- 4 Houseless Population Rural 646 13 659 0.64 Urban 377 35 412 0.66 Total 1023 48 1071 0.65 Source: Population Census 2001.
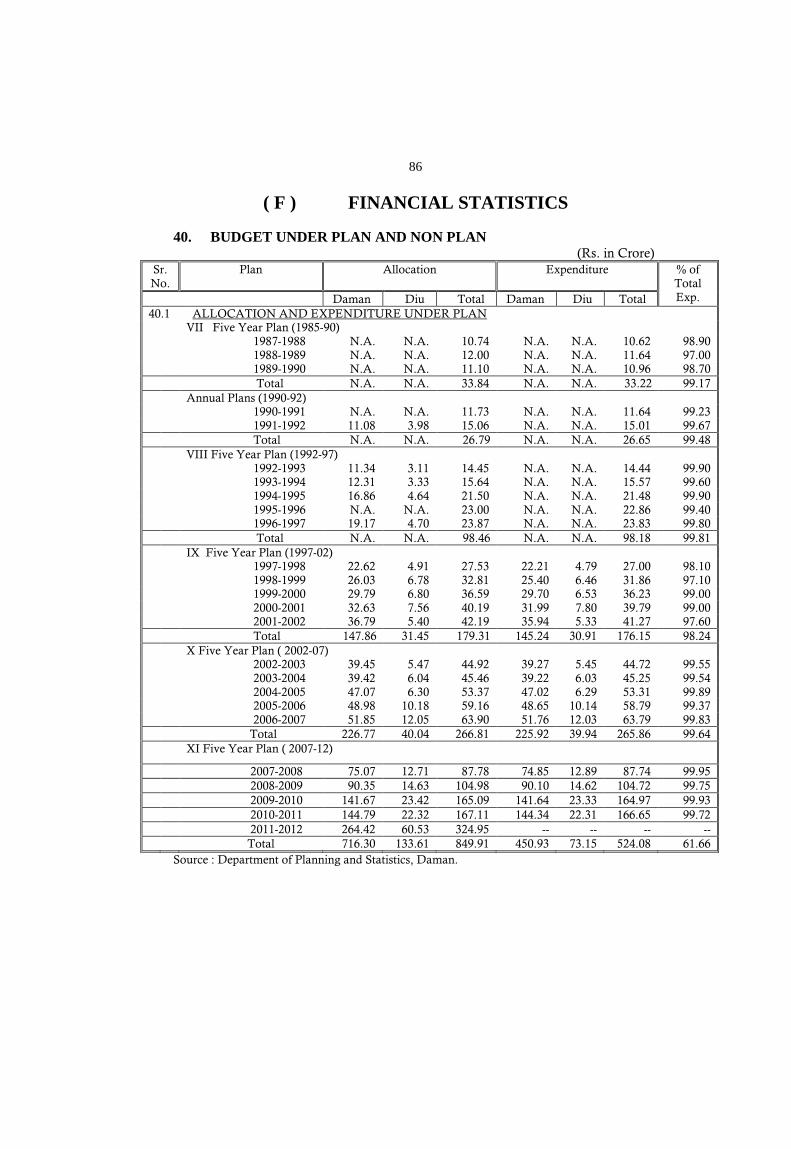
86
( F ) FINANCIAL STATISTICS
40. BUDGET UNDER PLAN AND NON PLAN (Rs. in Crore)
Sr. No.
Plan Allocation Expenditure % of Total Exp. Daman Diu Total Daman Diu Total
40.1 ALLOCATION AND EXPENDITURE UNDER PLAN VII Five Year Plan (1985-90) 1987-1988 N.A. N.A. 10.74 N.A. N.A. 10.62 98.90 1988-1989 N.A. N.A. 12.00 N.A. N.A. 11.64 97.00 1989-1990 N.A. N.A. 11.10 N.A. N.A. 10.96 98.70 Total N.A. N.A. 33.84 N.A. N.A. 33.22 99.17 Annual Plans (1990-92) 1990-1991 N.A. N.A. 11.73 N.A. N.A. 11.64 99.23 1991-1992 11.08 3.98 15.06 N.A. N.A. 15.01 99.67 Total N.A. N.A. 26.79 N.A. N.A. 26.65 99.48 VIII Five Year Plan (1992-97) 1992-1993 11.34 3.11 14.45 N.A. N.A. 14.44 99.90 1993-1994 12.31 3.33 15.64 N.A. N.A. 15.57 99.60 1994-1995 16.86 4.64 21.50 N.A. N.A. 21.48 99.90 1995-1996 N.A. N.A. 23.00 N.A. N.A. 22.86 99.40 1996-1997 19.17 4.70 23.87 N.A. N.A. 23.83 99.80 Total N.A. N.A. 98.46 N.A. N.A. 98.18 99.81 IX Five Year Plan (1997-02) 1997-1998 22.62 4.91 27.53 22.21 4.79 27.00 98.10 1998-1999 26.03 6.78 32.81 25.40 6.46 31.86 97.10 1999-2000 29.79 6.80 36.59 29.70 6.53 36.23 99.00 2000-2001 32.63 7.56 40.19 31.99 7.80 39.79 99.00 2001-2002 36.79 5.40 42.19 35.94 5.33 41.27 97.60 Total 147.86 31.45 179.31 145.24 30.91 176.15 98.24 X Five Year Plan ( 2002-07) 2002-2003 39.45 5.47 44.92 39.27 5.45 44.72 99.55 2003-2004 39.42 6.04 45.46 39.22 6.03 45.25 99.54 2004-2005 47.07 6.30 53.37 47.02 6.29 53.31 99.89 2005-2006 48.98 10.18 59.16 48.65 10.14 58.79 99.37 2006-2007 51.85 12.05 63.90 51.76 12.03 63.79 99.83 Total 226.77 40.04 266.81 225.92 39.94 265.86 99.64 XI Five Year Plan ( 2007-12)
2007-2008 75.07 12.71 87.78 74.85 12.89 87.74 99.95 2008-2009 90.35 14.63 104.98 90.10 14.62 104.72 99.75 2009-2010 141.67 23.42 165.09 141.64 23.33 164.97 99.93 2010-2011 144.79 22.32 167.11 144.34 22.31 166.65 99.72 2011-2012 264.42 60.53 324.95 -- -- -- -- Total 716.30 133.61 849.91 450.93 73.15 524.08 61.66
Source : Department of Planning and Statistics, Daman.
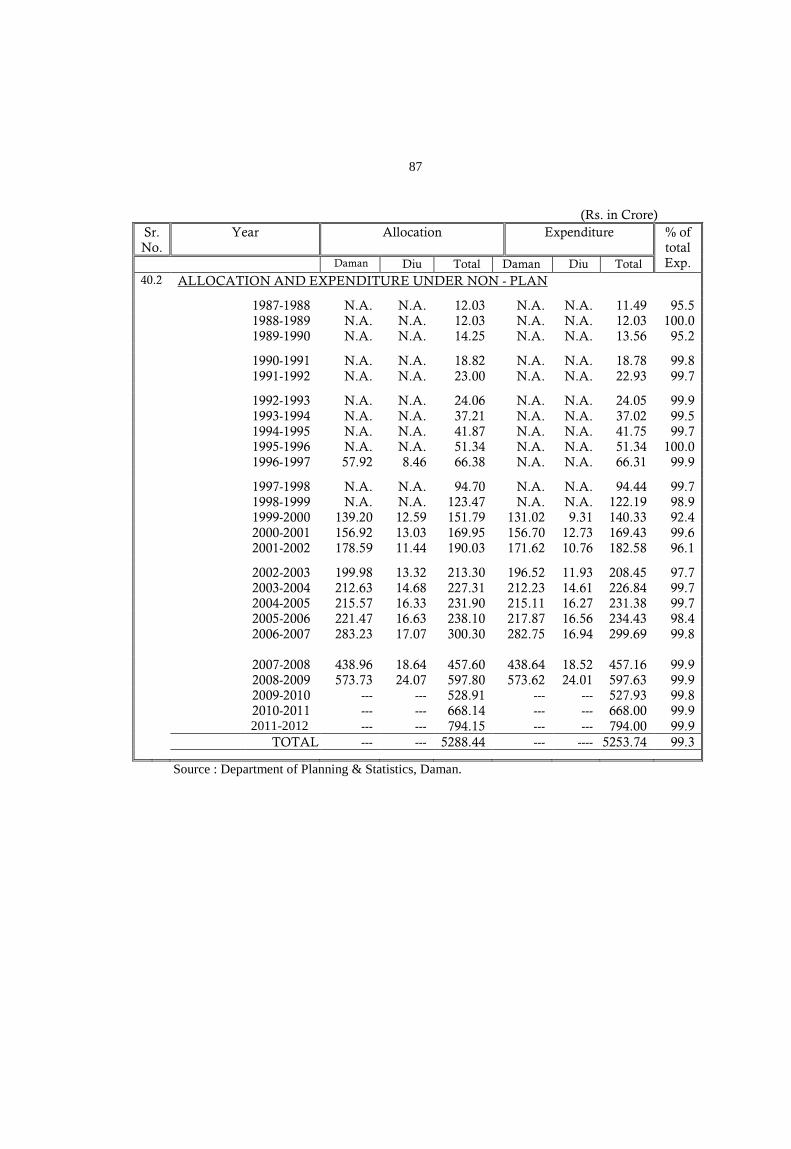
87
(Rs. in Crore) Sr. No.
Year Allocation Expenditure % of total Exp. Daman Diu Total Daman Diu Total
40.2 ALLOCATION AND EXPENDITURE UNDER NON - PLAN
1987-1988 N.A. N.A. 12.03 N.A. N.A. 11.49 95.5 1988-1989 N.A. N.A. 12.03 N.A. N.A. 12.03 100.0 1989-1990 N.A. N.A. 14.25 N.A. N.A. 13.56 95.2
1990-1991 N.A. N.A. 18.82 N.A. N.A. 18.78 99.8 1991-1992 N.A. N.A. 23.00 N.A. N.A. 22.93 99.7
1992-1993 N.A. N.A. 24.06 N.A. N.A. 24.05 99.9 1993-1994 N.A. N.A. 37.21 N.A. N.A. 37.02 99.5 1994-1995 N.A. N.A. 41.87 N.A. N.A. 41.75 99.7 1995-1996 N.A. N.A. 51.34 N.A. N.A. 51.34 100.0 1996-1997 57.92 8.46 66.38 N.A. N.A. 66.31 99.9
1997-1998 N.A. N.A. 94.70 N.A. N.A. 94.44 99.7 1998-1999 N.A. N.A. 123.47 N.A. N.A. 122.19 98.9 1999-2000 139.20 12.59 151.79 131.02 9.31 140.33 92.4 2000-2001 156.92 13.03 169.95 156.70 12.73 169.43 99.6 2001-2002 178.59 11.44 190.03 171.62 10.76 182.58 96.1
2002-2003 199.98 13.32 213.30 196.52 11.93 208.45 97.7 2003-2004 212.63 14.68 227.31 212.23 14.61 226.84 99.7 2004-2005 215.57 16.33 231.90 215.11 16.27 231.38 99.7 2005-2006 221.47 16.63 238.10 217.87 16.56 234.43 98.4 2006-2007 283.23 17.07 300.30 282.75 16.94 299.69 99.8 2007-2008 438.96 18.64 457.60 438.64 18.52 457.16 99.9 2008-2009 573.73 24.07 597.80 573.62 24.01 597.63 99.9 2009-2010 --- --- 528.91 --- --- 527.93 99.8 2010-2011
2011-2012 --- ---
--- ---
668.14 794.15
--- ---
--- ---
668.00 794.00
99.9 99.9
TOTAL --- --- 5288.44 --- ---- 5253.74 99.3
Source : Department of Planning & Statistics, Daman.
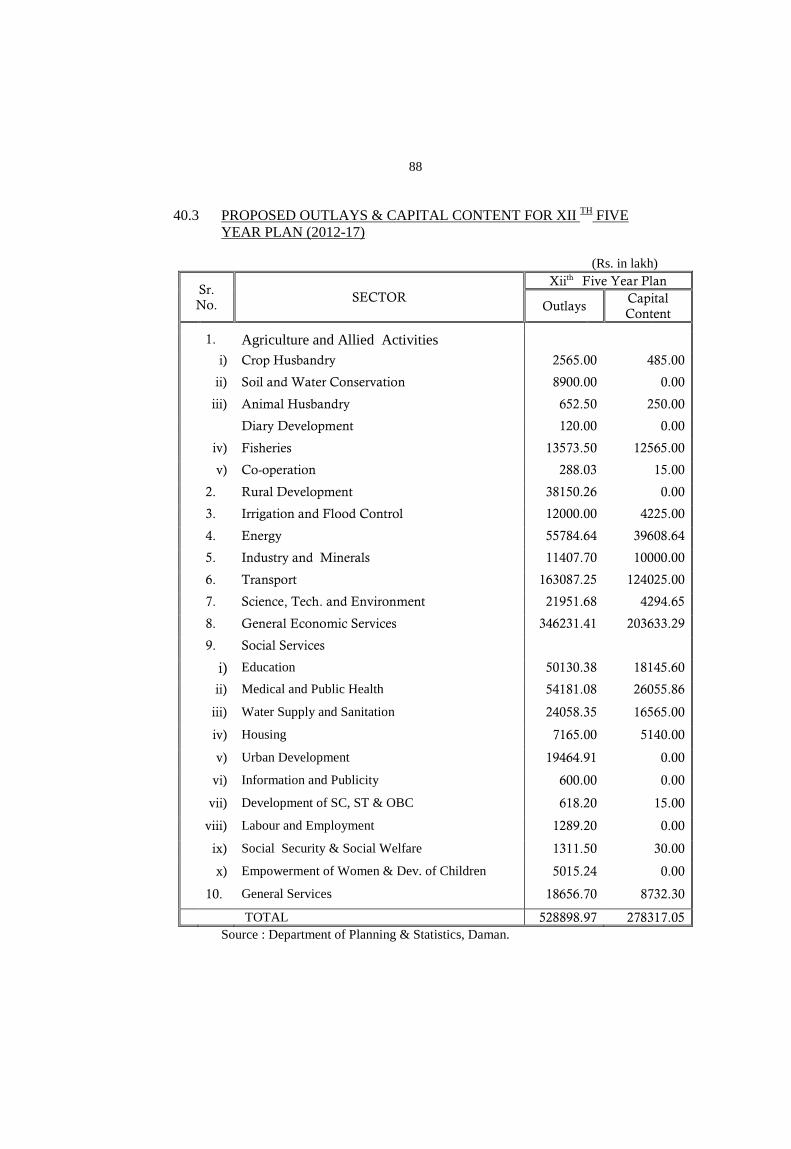
88
40.3 PROPOSED OUTLAYS & CAPITAL CONTENT FOR XII TH
FIVE YEAR PLAN (2012-17)
(Rs. in lakh)
Sr. No.
SECTOR Xiith Five Year Plan
Outlays Capital Content
1. Agriculture and Allied Activities
i) Crop Husbandry 2565.00 485.00
ii) Soil and Water Conservation 8900.00 0.00
iii) Animal Husbandry 652.50 250.00
Diary Development 120.00 0.00
iv) Fisheries 13573.50 12565.00
v) Co-operation 288.03 15.00
2. Rural Development 38150.26 0.00
3. Irrigation and Flood Control 12000.00 4225.00
4. Energy 55784.64 39608.64
5. Industry and Minerals 11407.70 10000.00
6. Transport 163087.25 124025.00
7. Science, Tech. and Environment 21951.68 4294.65
8. General Economic Services 346231.41 203633.29
9. Social Services
i) Education 50130.38 18145.60
ii) Medical and Public Health 54181.08 26055.86
iii) Water Supply and Sanitation 24058.35 16565.00
iv) Housing 7165.00 5140.00
v) Urban Development 19464.91 0.00
vi) Information and Publicity 600.00 0.00
vii) Development of SC, ST & OBC 618.20 15.00
viii) Labour and Employment 1289.20 0.00
ix) Social Security & Social Welfare 1311.50 30.00
x) Empowerment of Women & Dev. of Children 5015.24 0.00
10. General Services 18656.70 8732.30
TOTAL 528898.97 278317.05 Source : Department of Planning & Statistics, Daman.
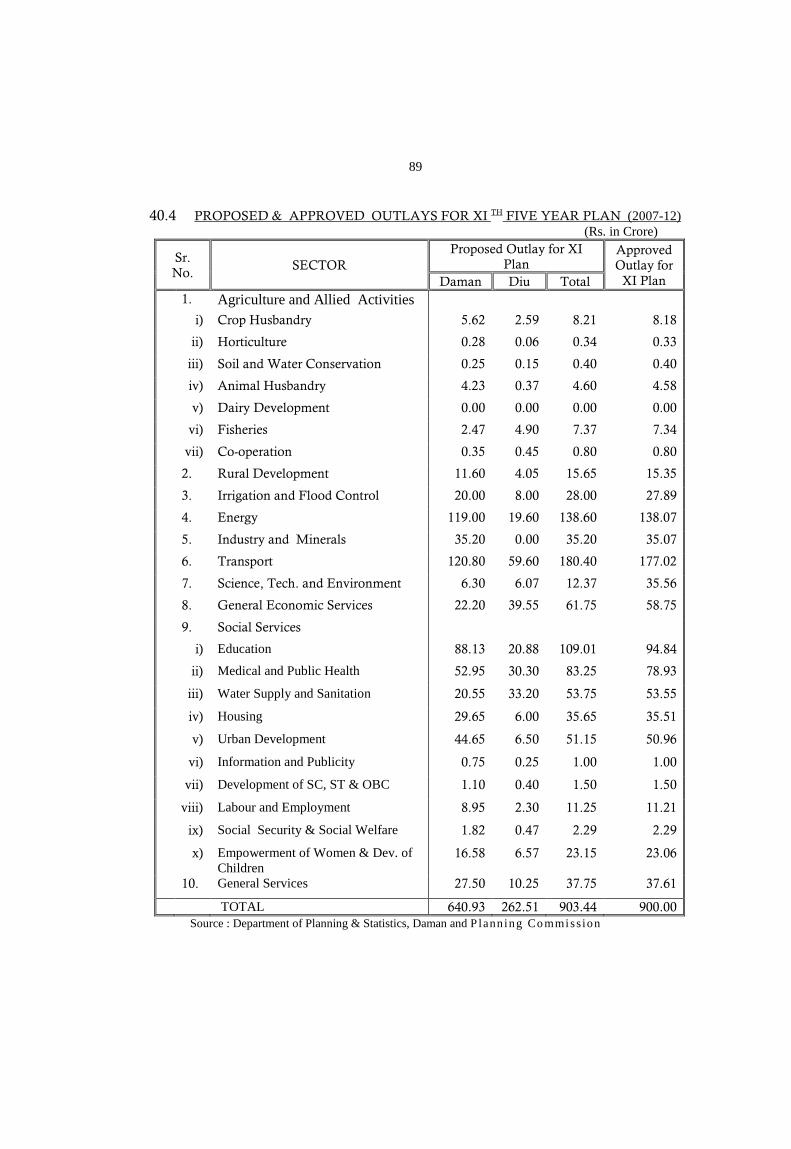
89
40.4 PROPOSED & APPROVED OUTLAYS FOR XI TH
(Rs. in Crore) FIVE YEAR PLAN (2007-12)
Sr. No.
SECTOR Proposed Outlay for XI
Plan Approved Outlay for
XI Plan Daman Diu Total 1. Agriculture and Allied Activities
i) Crop Husbandry 5.62 2.59 8.21 8.18
ii) Horticulture 0.28 0.06 0.34 0.33
iii) Soil and Water Conservation 0.25 0.15 0.40 0.40
iv) Animal Husbandry 4.23 0.37 4.60 4.58
v) Dairy Development 0.00 0.00 0.00 0.00
vi) Fisheries 2.47 4.90 7.37 7.34
vii) Co-operation 0.35 0.45 0.80 0.80
2. Rural Development 11.60 4.05 15.65 15.35
3. Irrigation and Flood Control 20.00 8.00 28.00 27.89
4. Energy 119.00 19.60 138.60 138.07
5. Industry and Minerals 35.20 0.00 35.20 35.07
6. Transport 120.80 59.60 180.40 177.02
7. Science, Tech. and Environment 6.30 6.07 12.37 35.56
8. General Economic Services 22.20 39.55 61.75 58.75
9. Social Services
i) Education 88.13 20.88 109.01 94.84
ii) Medical and Public Health 52.95 30.30 83.25 78.93
iii) Water Supply and Sanitation 20.55 33.20 53.75 53.55
iv) Housing 29.65 6.00 35.65 35.51
v) Urban Development 44.65 6.50 51.15 50.96
vi) Information and Publicity 0.75 0.25 1.00 1.00
vii) Development of SC, ST & OBC 1.10 0.40 1.50 1.50
viii) Labour and Employment 8.95 2.30 11.25 11.21
ix) Social Security & Social Welfare 1.82 0.47 2.29 2.29
x) Empowerment of Women & Dev. of Children
16.58 6.57 23.15 23.06
10. General Services 27.50 10.25 37.75 37.61
TOTAL 640.93 262.51 903.44 900.00 Source : Department of Planning & Statistics, Daman and P lanning Co mmiss ion
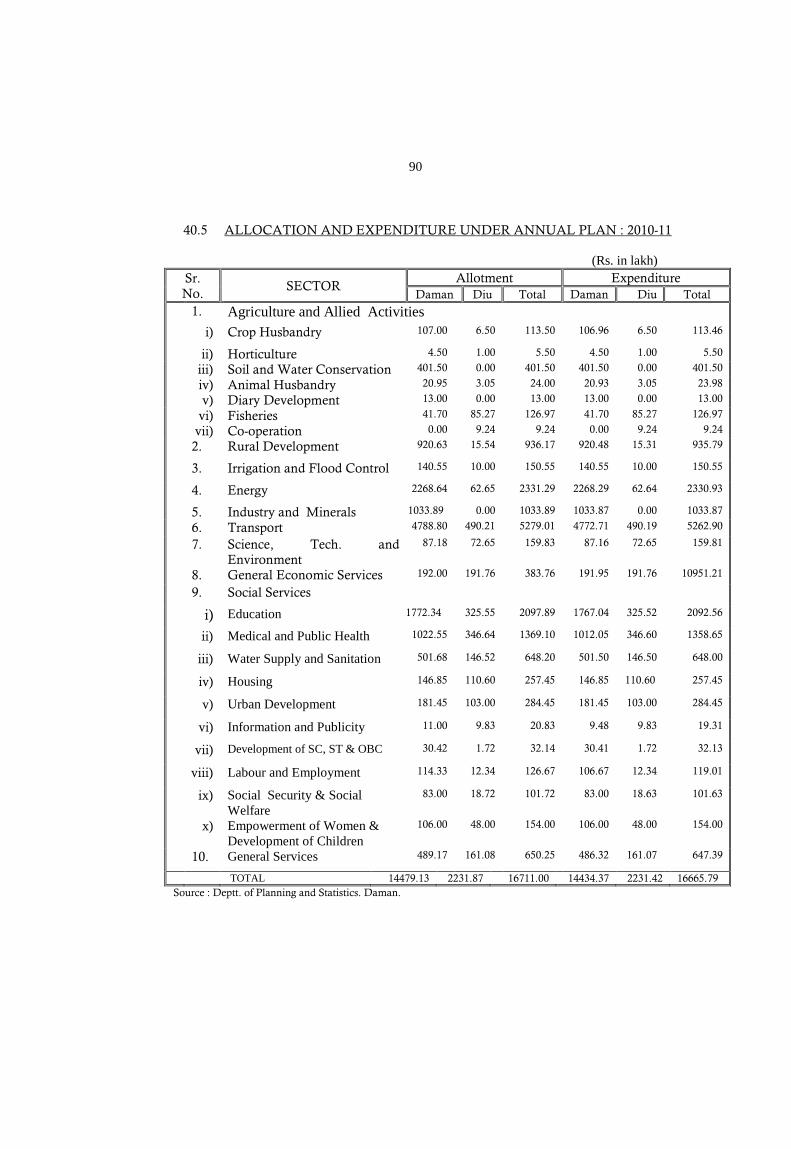
90
40.5 ALLOCATION AND EXPENDITURE UNDER ANNUAL PLAN : 2010-11
(Rs. in lakh) Sr. No.
SECTOR Allotment Expenditure
Daman Diu Total Daman Diu Total
1. Agriculture and Allied Activities
i) Crop Husbandry 107.00 6.50 113.50 106.96 6.50 113.46
ii) Horticulture 4.50 1.00 5.50 4.50 1.00 5.50
iii) Soil and Water Conservation 401.50 0.00 401.50 401.50 0.00 401.50
iv) Animal Husbandry 20.95 3.05 24.00 20.93 3.05 23.98
v) Diary Development 13.00 0.00 13.00 13.00 0.00 13.00
vi) Fisheries 41.70 85.27 126.97 41.70 85.27 126.97
vii) Co-operation 0.00 9.24 9.24 0.00 9.24 9.24
2. Rural Development 920.63 15.54 936.17 920.48 15.31 935.79
3. Irrigation and Flood Control 140.55 10.00 150.55 140.55 10.00 150.55
4. Energy 2268.64 62.65 2331.29 2268.29 62.64 2330.93
5. Industry and Minerals 1033.89 0.00 1033.89 1033.87 0.00 1033.87
6. Transport 4788.80 490.21 5279.01 4772.71 490.19 5262.90
7. Science, Tech. and Environment
87.18 72.65 159.83 87.16 72.65 159.81
8. General Economic Services 192.00 191.76 383.76 191.95 191.76 10951.21
9. Social Services
i) Education 1772.34 325.55 2097.89 1767.04 325.52 2092.56
ii) Medical and Public Health 1022.55 346.64 1369.10 1012.05 346.60 1358.65
iii) Water Supply and Sanitation 501.68 146.52 648.20 501.50 146.50 648.00
iv) Housing 146.85 110.60 257.45 146.85 110.60 257.45
v) Urban Development 181.45 103.00 284.45 181.45 103.00 284.45
vi) Information and Publicity 11.00 9.83 20.83 9.48 9.83 19.31
vii) Development of SC, ST & OBC 30.42 1.72 32.14 30.41 1.72 32.13
viii) Labour and Employment 114.33 12.34 126.67 106.67 12.34 119.01
ix) Social Security & Social Welfare
83.00 18.72 101.72 83.00 18.63 101.63
x) Empowerment of Women & Development of Children
106.00 48.00 154.00 106.00 48.00 154.00
10. General Services 489.17 161.08 650.25 486.32 161.07 647.39
TOTAL 14479.13 2231.87 16711.00 14434.37 2231.42 16665.79 Source : Deptt. of Planning and Statistics. Daman.
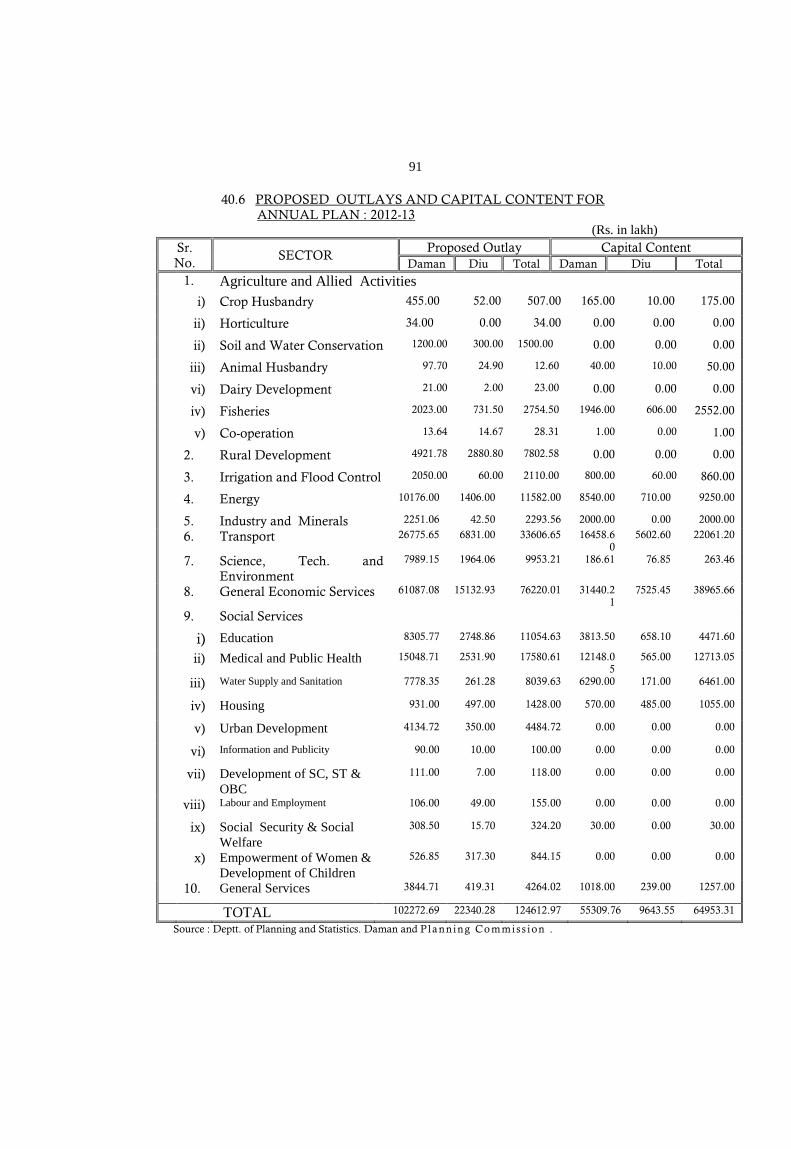
91
40.6 PROPOSED OUTLAYS AND CAPITAL CONTENT FOR
ANNUAL PLAN : 2012-13 (Rs. in lakh)
Sr. No.
SECTOR Proposed Outlay Capital Content
Daman Diu Total Daman Diu Total
1. Agriculture and Allied Activities
i) Crop Husbandry 455.00 52.00 507.00 165.00 10.00 175.00
ii) Horticulture 34.00 0.00 34.00 0.00 0.00 0.00
ii) Soil and Water Conservation 1200.00 300.00 1500.00 0.00 0.00 0.00
iii) Animal Husbandry 97.70 24.90 12.60 40.00 10.00 50.00
vi) Dairy Development 21.00 2.00 23.00 0.00 0.00 0.00
iv) Fisheries 2023.00 731.50 2754.50 1946.00 606.00 2552.00
v) Co-operation 13.64 14.67 28.31 1.00 0.00 1.00
2. Rural Development 4921.78 2880.80 7802.58 0.00 0.00 0.00
3. Irrigation and Flood Control 2050.00 60.00 2110.00 800.00 60.00 860.00
4. Energy 10176.00 1406.00 11582.00 8540.00 710.00 9250.00
5. Industry and Minerals 2251.06 42.50 2293.56 2000.00 0.00 2000.00
6. Transport 26775.65 6831.00 33606.65 16458.60
5602.60 22061.20
7. Science, Tech. and Environment
7989.15 1964.06 9953.21 186.61 76.85 263.46
8. General Economic Services 61087.08 15132.93 76220.01 31440.21
7525.45 38965.66
9. Social Services
i) Education 8305.77 2748.86 11054.63 3813.50 658.10 4471.60
ii) Medical and Public Health 15048.71 2531.90 17580.61 12148.05
565.00 12713.05
iii) Water Supply and Sanitation 7778.35 261.28 8039.63 6290.00 171.00 6461.00
iv) Housing 931.00 497.00 1428.00 570.00 485.00 1055.00
v) Urban Development 4134.72 350.00 4484.72 0.00 0.00 0.00
vi) Information and Publicity 90.00 10.00 100.00 0.00 0.00 0.00
vii) Development of SC, ST & OBC
111.00 7.00 118.00 0.00 0.00 0.00
viii) Labour and Employment 106.00 49.00 155.00 0.00 0.00 0.00
ix) Social Security & Social Welfare
308.50 15.70 324.20 30.00 0.00 30.00
x) Empowerment of Women & Development of Children
526.85 317.30 844.15 0.00 0.00 0.00
10. General Services 3844.71 419.31 4264.02 1018.00 239.00 1257.00
TOTAL 102272.69 22340.28 124612.97 55309.76 9643.55 64953.31
Source : Deptt. of Planning and Statistics. Daman and P lanning Co mmiss ion .
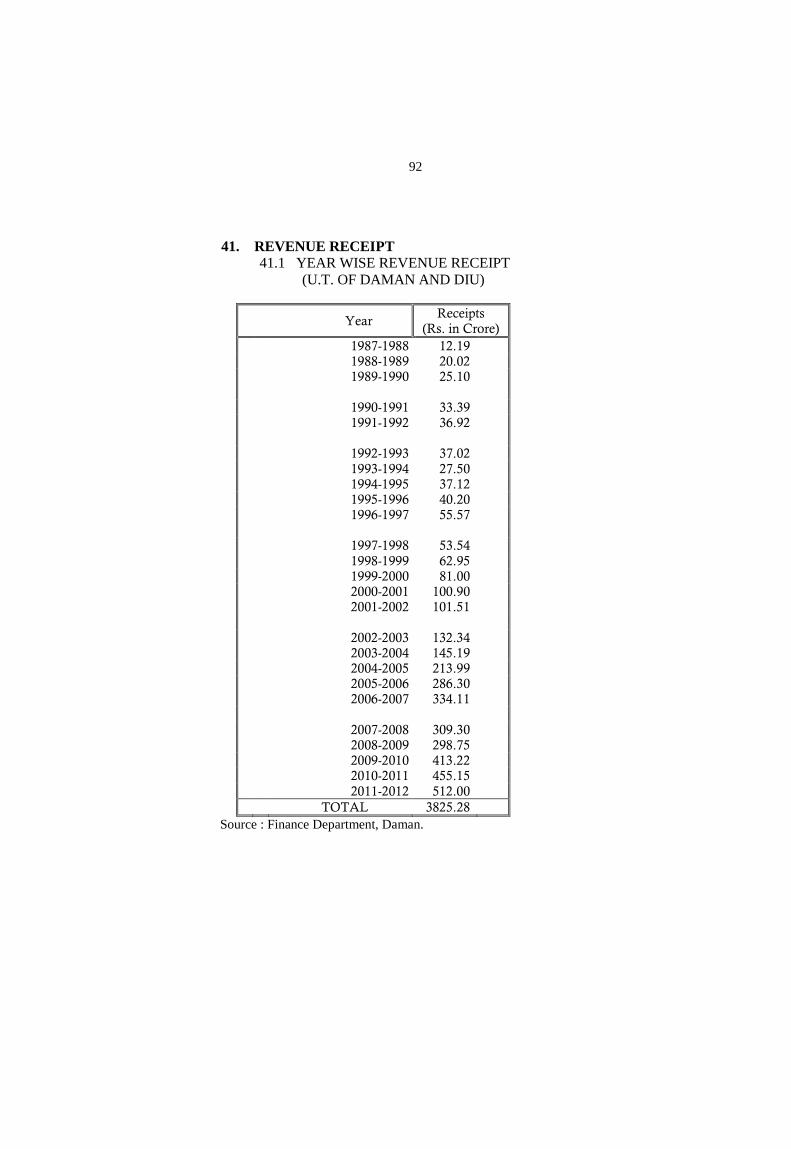
92
41. REVENUE RECEIPT 41.1 YEAR WISE REVENUE RECEIPT
(U.T. OF DAMAN AND DIU)
Year Receipts
(Rs. in Crore) 1987-1988 12.19 1988-1989 20.02 1989-1990 25.10 1990-1991 33.39 1991-1992 36.92 1992-1993 37.02 1993-1994 27.50 1994-1995 37.12 1995-1996 40.20 1996-1997 55.57 1997-1998 53.54 1998-1999 62.95 1999-2000 81.00 2000-2001 100.90 2001-2002 101.51 2002-2003 132.34 2003-2004 145.19 2004-2005 213.99 2005-2006 286.30 2006-2007 334.11 2007-2008 309.30 2008-2009 298.75 2009-2010 413.22 2010-2011 455.15 2011-2012 512.00 TOTAL 3825.28
Source : Finance Department, Daman.
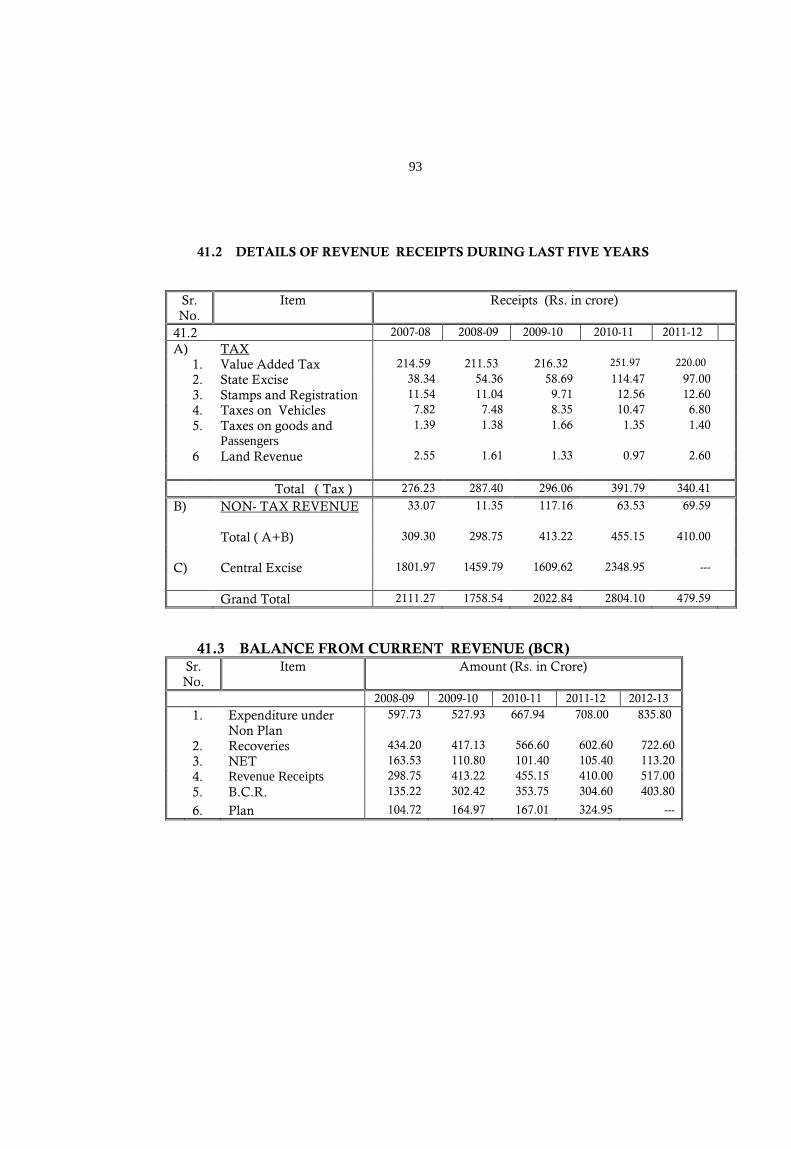
93
41.2 DETAILS OF REVENUE RECEIPTS DURING LAST FIVE YEARS
Sr. No.
Item Receipts (Rs. in crore)
41.2 2007-08 2008-09 2009-10 2010-11 2011-12
A) TAX 1. Value Added Tax 214.59 211.53 216.32 251.97 220.00 2. State Excise 38.34 54.36 58.69 114.47 97.00 3. Stamps and Registration 11.54 11.04 9.71 12.56 12.60 4. Taxes on Vehicles 7.82 7.48 8.35 10.47 6.80 5. Taxes on goods and
Passengers 1.39 1.38 1.66 1.35 1.40
6 Land Revenue 2.55 1.61 1.33 0.97 2.60 Total ( Tax ) 276.23 287.40 296.06 391.79 340.41 B) NON- TAX REVENUE 33.07 11.35 117.16 63.53 69.59 Total ( A+B) 309.30 298.75 413.22 455.15 410.00 C) Central Excise 1801.97 1459.79 1609.62 2348.95 --- Grand Total 2111.27 1758.54 2022.84 2804.10 479.59 41.3 BALANCE FROM CURRENT REVENUE (BCR)
Sr. No.
Item Amount (Rs. in Crore)
2008-09 2009-10 2010-11 2011-12 2012-13
1. Expenditure under Non Plan
597.73 527.93 667.94 708.00 835.80
2. Recoveries 434.20 417.13 566.60 602.60 722.60 3. NET 163.53 110.80 101.40 105.40 113.20 4. Revenue Receipts 298.75 413.22 455.15 410.00 517.00 5. B.C.R. 135.22 302.42 353.75 304.60 403.80
6. Plan 104.72 164.97 167.01 324.95 ---
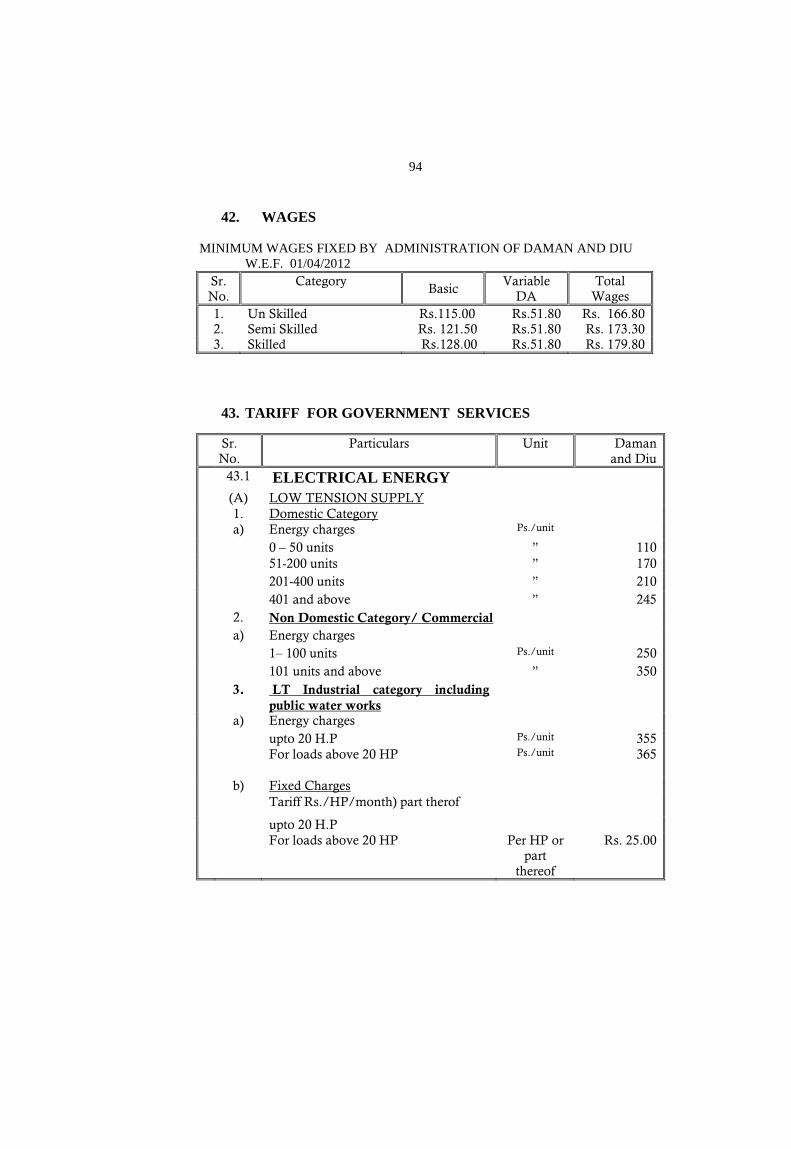
94
42. WAGES
MINIMUM WAGES FIXED BY ADMINISTRATION OF DAMAN AND DIU W.E.F. 01/04/2012
Sr. No.
Category Basic
Variable DA
Total Wages
1. Un Skilled Rs.115.00 Rs.51.80 Rs. 166.80 2. Semi Skilled Rs. 121.50 Rs.51.80 Rs. 173.30 3. Skilled Rs.128.00 Rs.51.80 Rs. 179.80
43. TARIFF FOR GOVERNMENT SERVICES
Sr. No.
Particulars Unit Daman and Diu
43.1 ELECTRICAL ENERGY (A) LOW TENSION SUPPLY 1. Domestic Category a) Energy charges Ps./unit 0 – 50 units ” 110 51-200 units ” 170 201-400 units ” 210 401 and above ” 245 2. Non Domestic Category/ Commercial a) Energy charges 1– 100 units Ps./unit 250 101 units and above ” 350 3. LT Industrial category including
public water works
a) Energy charges upto 20 H.P Ps./unit 355 For loads above 20 HP Ps./unit 365 b) Fixed Charges Tariff Rs./HP/month) part therof
upto 20 H.P For loads above 20 HP Per HP or
part thereof
Rs. 25.00
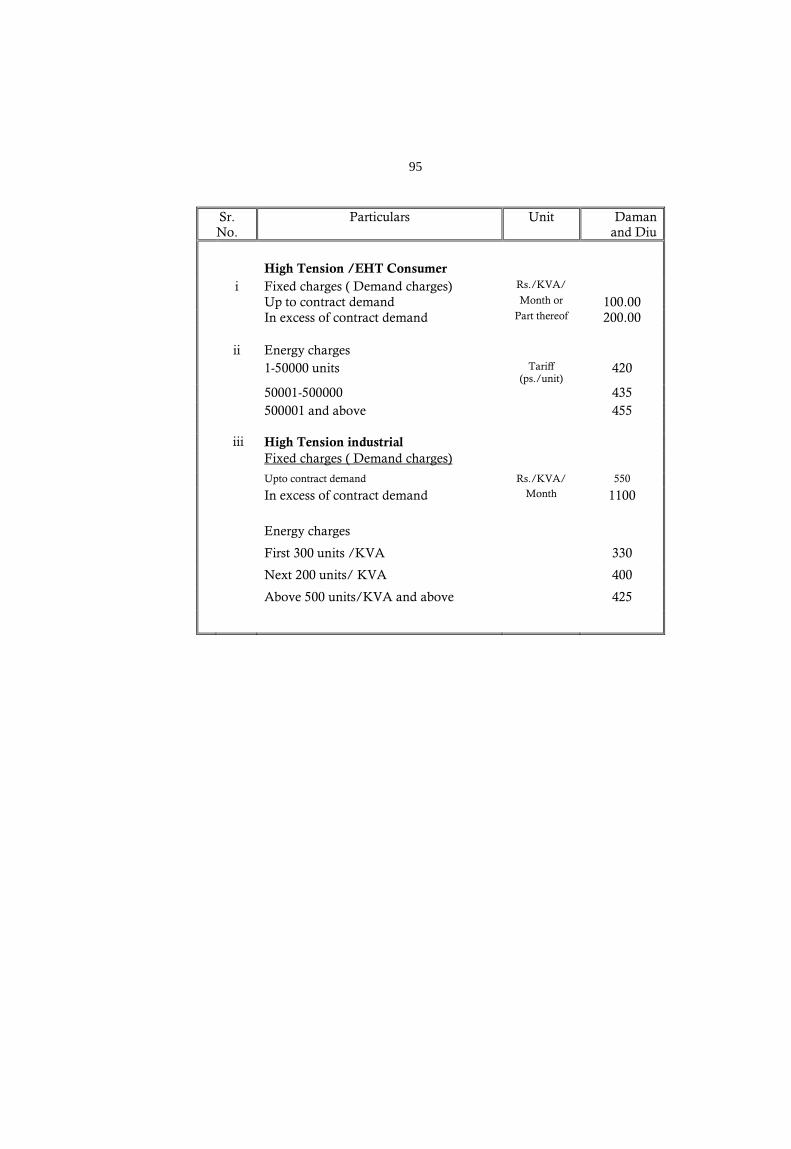
95
Sr. No.
Particulars Unit Daman and Diu
High Tension /EHT Consumer
i Fixed charges ( Demand charges) Rs./KVA/ Up to contract demand Month or 100.00 In excess of contract demand Part thereof 200.00 ii Energy charges 1-50000 units Tariff
(ps./unit) 420
50001-500000 435 500001 and above 455 iii High Tension industrial Fixed charges ( Demand charges)
Upto contract demand Rs./KVA/ 550
In excess of contract demand Month 1100
Energy charges
First 300 units /KVA 330
Next 200 units/ KVA 400
Above 500 units/KVA and above 425
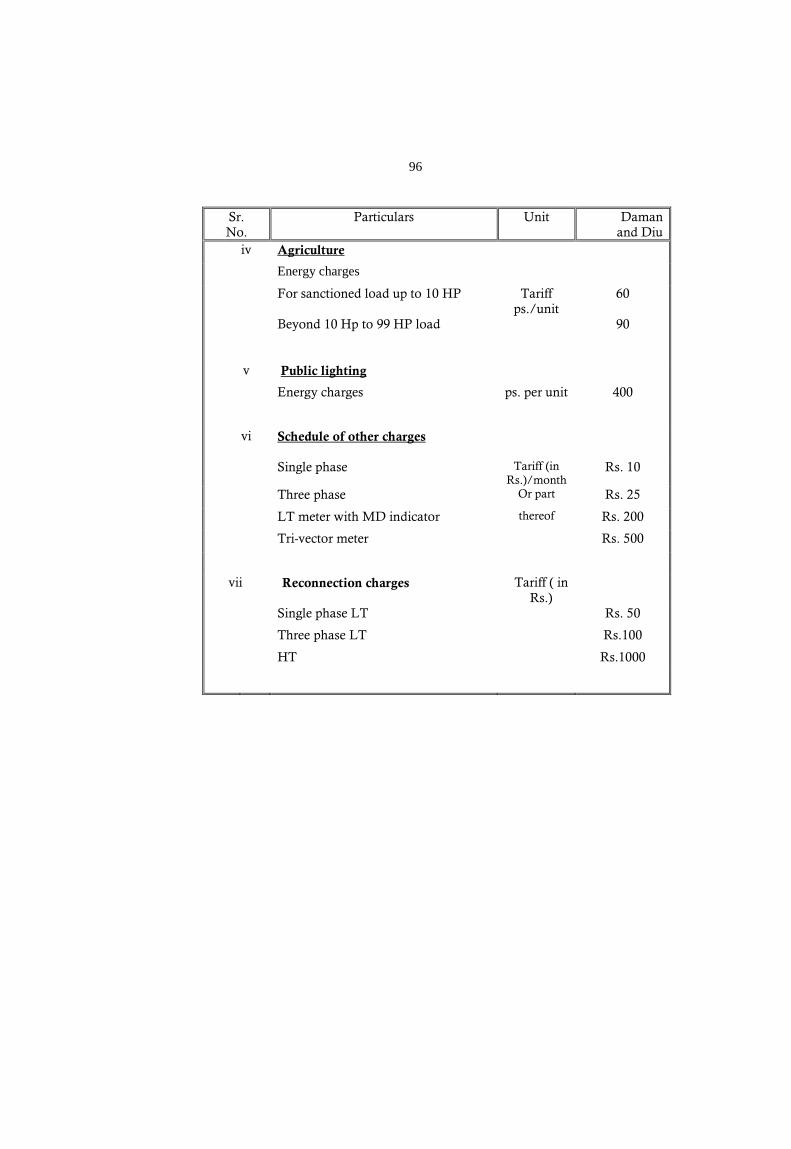
96
Sr. No.
Particulars Unit Daman and Diu
iv Agriculture
Energy charges
For sanctioned load up to 10 HP Tariff ps./unit
60
Beyond 10 Hp to 99 HP load 90
v Public lighting
Energy charges ps. per unit 400
vi Schedule of other charges
Single phase Tariff (in Rs.)/month
Rs. 10
Three phase Or part Rs. 25
LT meter with MD indicator thereof Rs. 200
Tri-vector meter Rs. 500
vii Reconnection charges Tariff ( in Rs.)
Single phase LT Rs. 50
Three phase LT Rs.100
HT Rs.1000
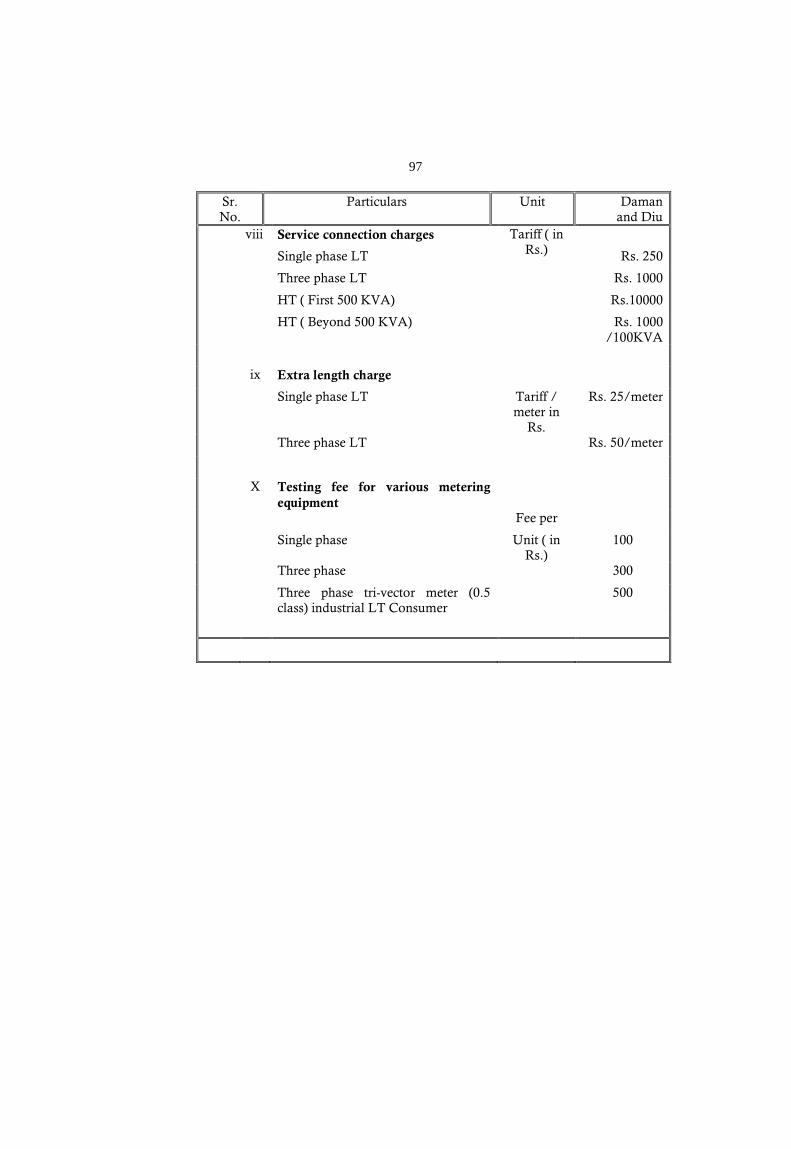
97
Sr. No.
Particulars Unit Daman and Diu
viii Service connection charges Tariff ( in Rs.)
Single phase LT Rs. 250
Three phase LT Rs. 1000
HT ( First 500 KVA) Rs.10000
HT ( Beyond 500 KVA) Rs. 1000 /100KVA
ix Extra length charge
Single phase LT Tariff / meter in
Rs.
Rs. 25/meter
Three phase LT Rs. 50/meter
X Testing fee for various metering equipment
Fee per
Single phase Unit ( in Rs.)
100
Three phase 300
Three phase tri-vector meter (0.5 class) industrial LT Consumer
500
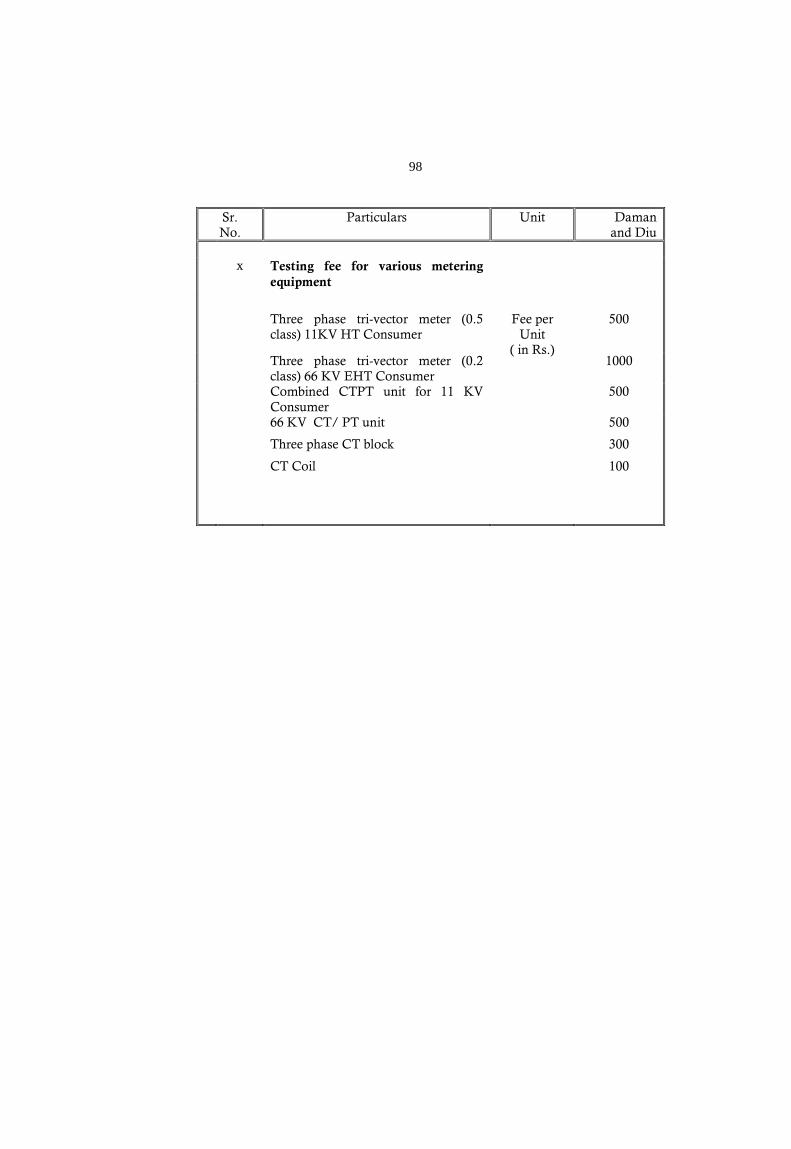
98
Sr. No.
Particulars Unit Daman and Diu
x Testing fee for various metering
equipment
Three phase tri-vector meter (0.5 class) 11KV HT Consumer
Fee per Unit
( in Rs.)
500
Three phase tri-vector meter (0.2 class) 66 KV EHT Consumer
1000
Combined CTPT unit for 11 KV Consumer
500
66 KV CT/ PT unit 500
Three phase CT block 300
CT Coil 100
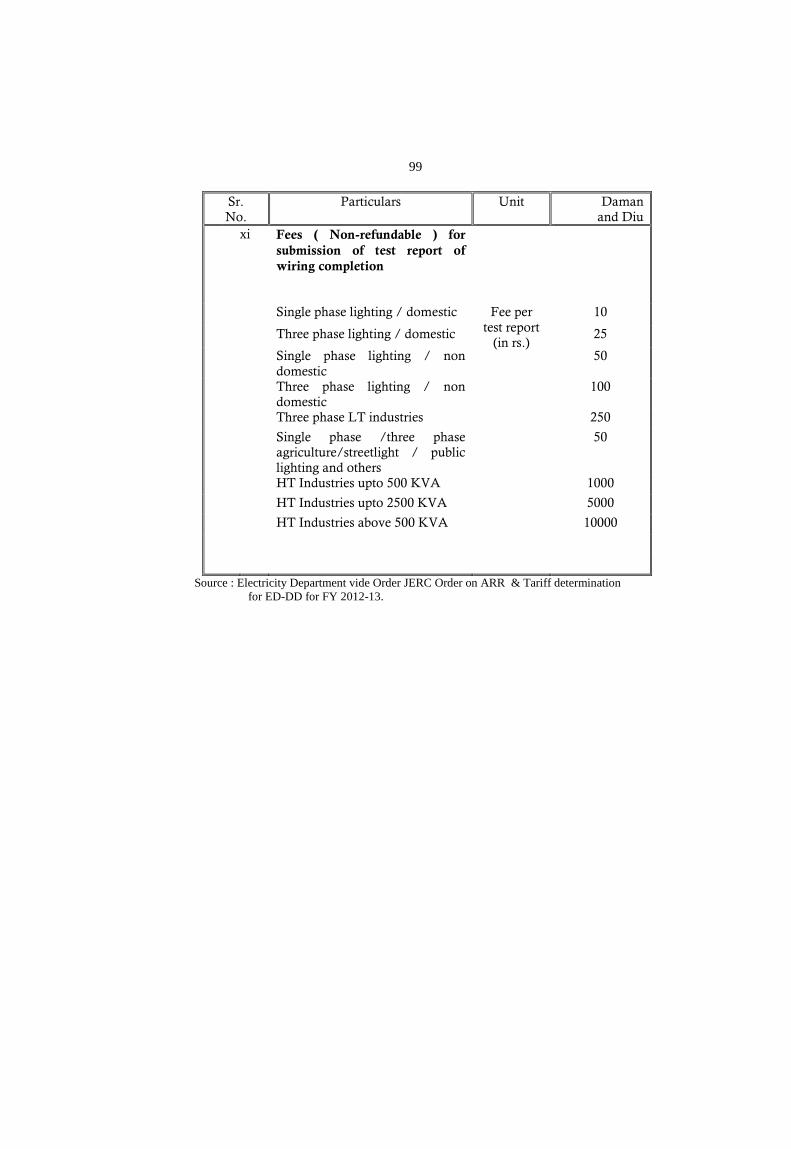
99
Sr. No.
Particulars Unit Daman and Diu
xi Fees ( Non-refundable ) for submission of test report of wiring completion
Single phase lighting / domestic Fee per test report
(in rs.)
10
Three phase lighting / domestic 25
Single phase lighting / non domestic
50
Three phase lighting / non domestic
100
Three phase LT industries 250
Single phase /three phase agriculture/streetlight / public lighting and others
50
HT Industries upto 500 KVA 1000
HT Industries upto 2500 KVA 5000
HT Industries above 500 KVA 10000
Source : Electricity Department vide Order JERC Order on ARR & Tariff determination for ED-DD for FY 2012-13.
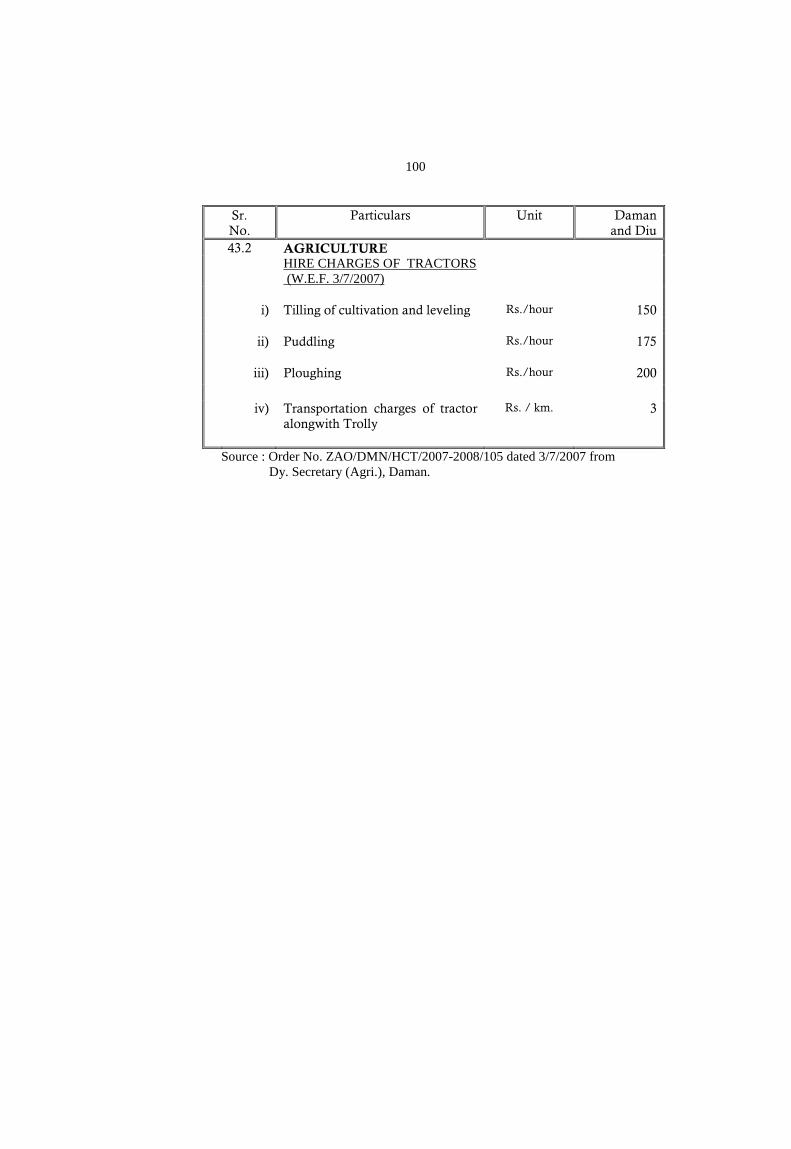
100
Sr. No.
Particulars Unit Daman and Diu
43.2 AGRICULTURE
HIRE CHARGES OF TRACTORS (W.E.F. 3/7/2007)
i) Tilling of cultivation and leveling Rs./hour 150 ii) Puddling Rs./hour 175 iii) Ploughing Rs./hour 200
iv) Transportation charges of tractor
alongwith Trolly Rs. / km. 3
Source : Order No. ZAO/DMN/HCT/2007-2008/105 dated 3/7/2007 from
Dy. Secretary (Agri.), Daman.
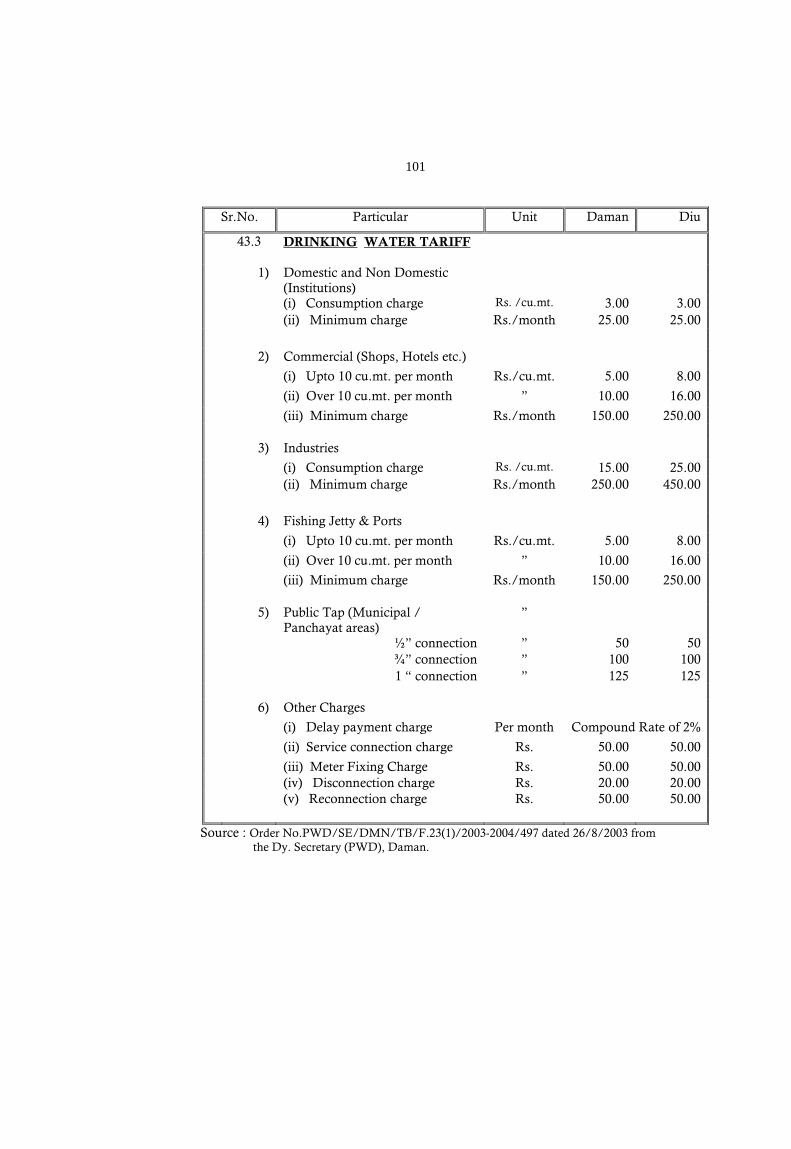
101
Sr.No. Particular Unit Daman Diu
43.3 DRINKING WATER TARIFF
1) Domestic and Non Domestic (Institutions)
(i) Consumption charge Rs. /cu.mt. 3.00 3.00 (ii) Minimum charge Rs./month 25.00 25.00
2) Commercial (Shops, Hotels etc.)
(i) Upto 10 cu.mt. per month Rs./cu.mt. 5.00 8.00
(ii) Over 10 cu.mt. per month ” 10.00 16.00
(iii) Minimum charge Rs./month 150.00 250.00 3) Industries
(i) Consumption charge Rs. /cu.mt. 15.00 25.00 (ii) Minimum charge Rs./month 250.00 450.00
4) Fishing Jetty & Ports
(i) Upto 10 cu.mt. per month Rs./cu.mt. 5.00 8.00
(ii) Over 10 cu.mt. per month ” 10.00 16.00
(iii) Minimum charge Rs./month 150.00 250.00 5) Public Tap (Municipal /
Panchayat areas) ”
½” connection ” 50 50 ¾” connection ” 100 100 1 “ connection ” 125 125 6) Other Charges
(i) Delay payment charge Per month Compound Rate of 2%
(ii) Service connection charge Rs. 50.00 50.00
(iii) Meter Fixing Charge Rs. 50.00 50.00 (iv) Disconnection charge Rs. 20.00 20.00 (v) Reconnection charge Rs. 50.00 50.00
Source : Order No.PWD/SE/DMN/TB/F.23(1)/2003-2004/497 dated 26/8/2003 from the Dy. Secretary (PWD), Daman.
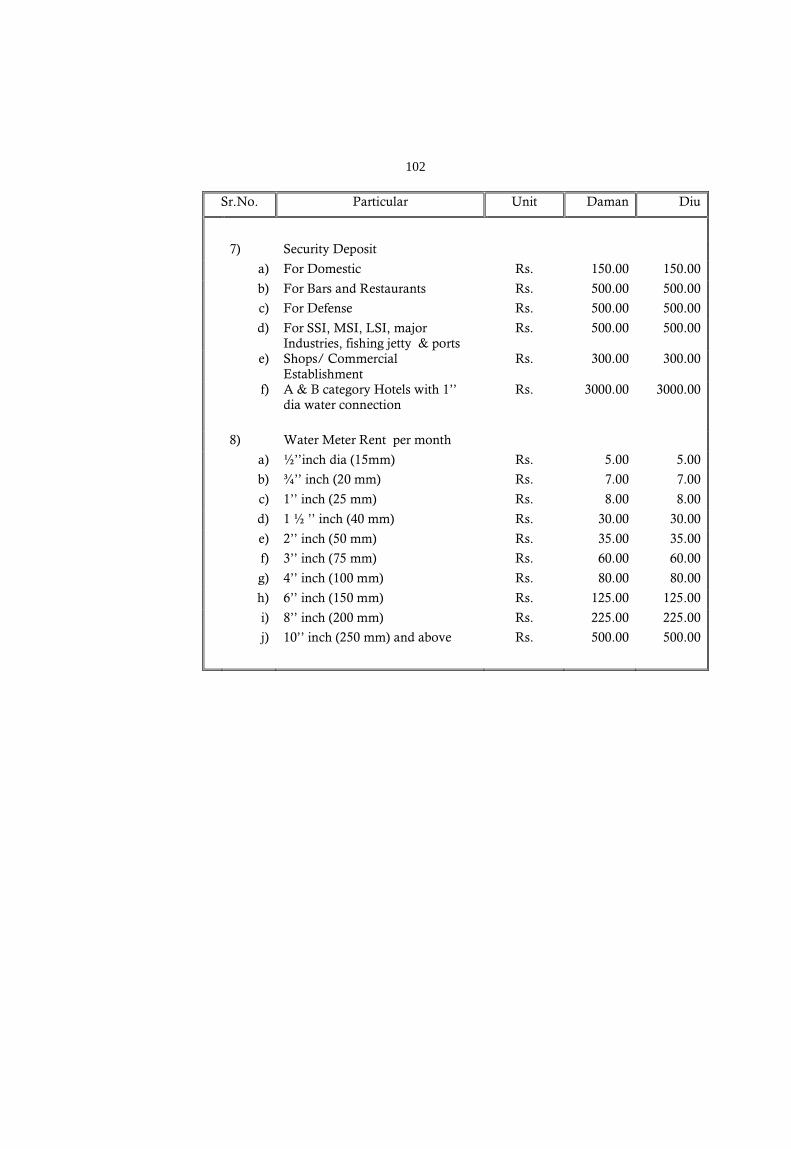
102
Sr.No. Particular Unit Daman Diu
7) Security Deposit
a) For Domestic Rs. 150.00 150.00
b) For Bars and Restaurants Rs. 500.00 500.00
c) For Defense Rs. 500.00 500.00
d) For SSI, MSI, LSI, major Industries, fishing jetty & ports
Rs. 500.00 500.00
e) Shops/ Commercial Establishment
Rs. 300.00 300.00
f) A & B category Hotels with 1’’ dia water connection
Rs. 3000.00 3000.00
8) Water Meter Rent per month
a) ½’’inch dia (15mm) Rs. 5.00 5.00
b) ¾’’ inch (20 mm) Rs. 7.00 7.00
c) 1’’ inch (25 mm) Rs. 8.00 8.00
d) 1 ½ ’’ inch (40 mm) Rs. 30.00 30.00
e) 2’’ inch (50 mm) Rs. 35.00 35.00
f) 3’’ inch (75 mm) Rs. 60.00 60.00
g) 4’’ inch (100 mm) Rs. 80.00 80.00
h) 6’’ inch (150 mm) Rs. 125.00 125.00
i) 8’’ inch (200 mm) Rs. 225.00 225.00
j) 10’’ inch (250 mm) and above Rs. 500.00 500.00
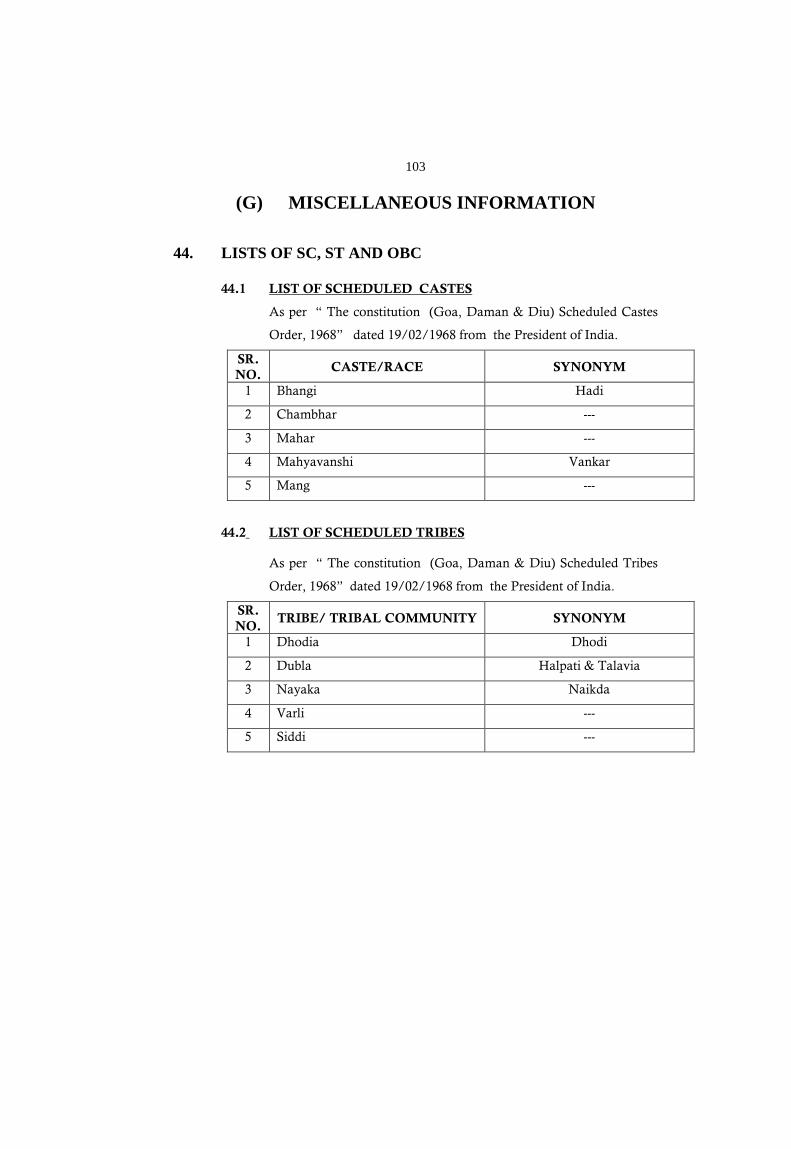
103
(G) MISCELLANEOUS INFORMATION 44. LISTS OF SC, ST AND OBC
44.1 LIST OF SCHEDULED CASTES
As per “ The constitution (Goa, Daman & Diu) Scheduled Castes
Order, 1968” dated 19/02/1968 from the President of India.
SR. NO.
CASTE/RACE SYNONYM
1 Bhangi Hadi
2 Chambhar ---
3 Mahar ---
4 Mahyavanshi Vankar
5 Mang ---
44.2 LIST OF SCHEDULED TRIBES
As per “ The constitution (Goa, Daman & Diu) Scheduled Tribes
Order, 1968” dated 19/02/1968 from the President of India.
SR. NO.
TRIBE/ TRIBAL COMMUNITY SYNONYM
1 Dhodia Dhodi
2 Dubla Halpati & Talavia
3 Nayaka Naikda
4 Varli ---
5 Siddi ---
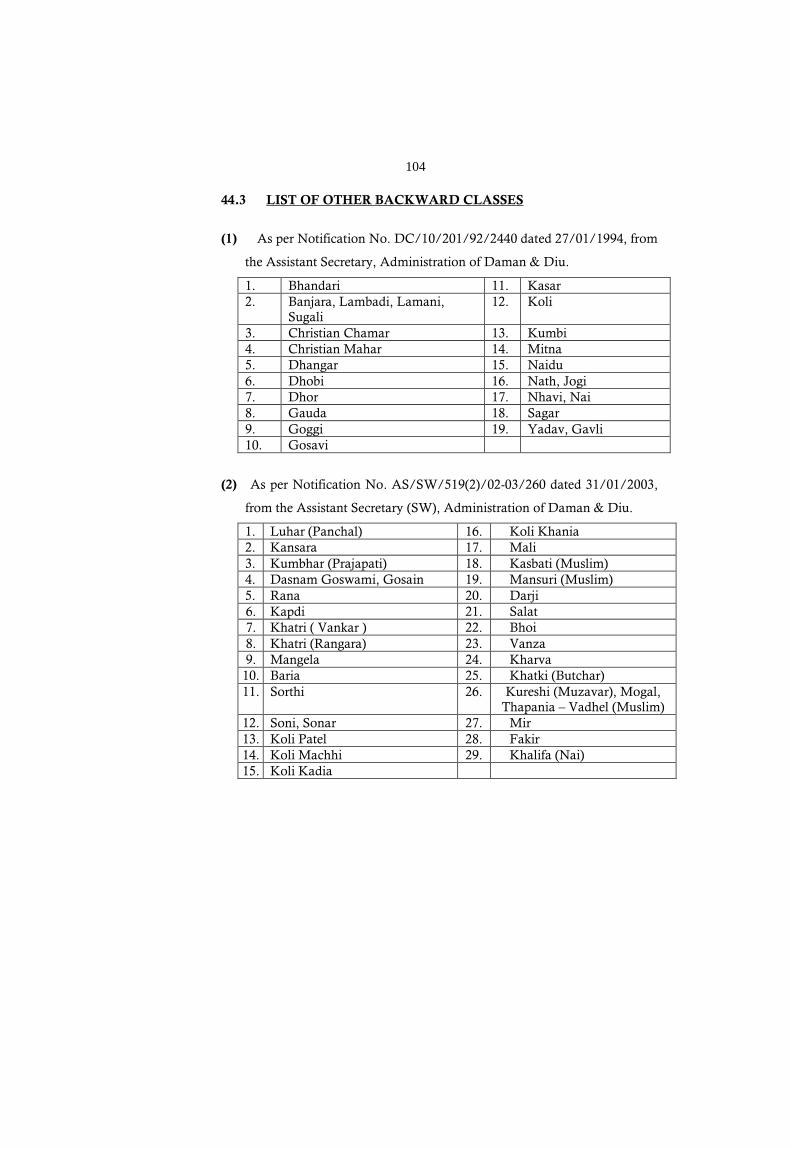
104
44.3 LIST OF OTHER BACKWARD CLASSES
(1) As per Notification No. DC/10/201/92/2440 dated 27/01/1994, from
the Assistant Secretary, Administration of Daman & Diu.
1. Bhandari 11. Kasar 2. Banjara, Lambadi, Lamani,
Sugali 12. Koli
3. Christian Chamar 13. Kumbi 4. Christian Mahar 14. Mitna 5. Dhangar 15. Naidu 6. Dhobi 16. Nath, Jogi 7. Dhor 17. Nhavi, Nai 8. Gauda 18. Sagar 9. Goggi 19. Yadav, Gavli 10. Gosavi
(2) As per Notification No. AS/SW/519(2)/02-03/260 dated 31/01/2003,
from the Assistant Secretary (SW), Administration of Daman & Diu.
1. Luhar (Panchal) 16. Koli Khania 2. Kansara 17. Mali 3. Kumbhar (Prajapati) 18. Kasbati (Muslim) 4. Dasnam Goswami, Gosain 19. Mansuri (Muslim) 5. Rana 20. Darji 6. Kapdi 21. Salat 7. Khatri ( Vankar ) 22. Bhoi 8. Khatri (Rangara) 23. Vanza 9. Mangela 24. Kharva 10. Baria 25. Khatki (Butchar) 11. Sorthi 26. Kureshi (Muzavar), Mogal,
Thapania – Vadhel (Muslim) 12. Soni, Sonar 27. Mir 13. Koli Patel 28. Fakir 14. Koli Machhi 29. Khalifa (Nai) 15. Koli Kadia
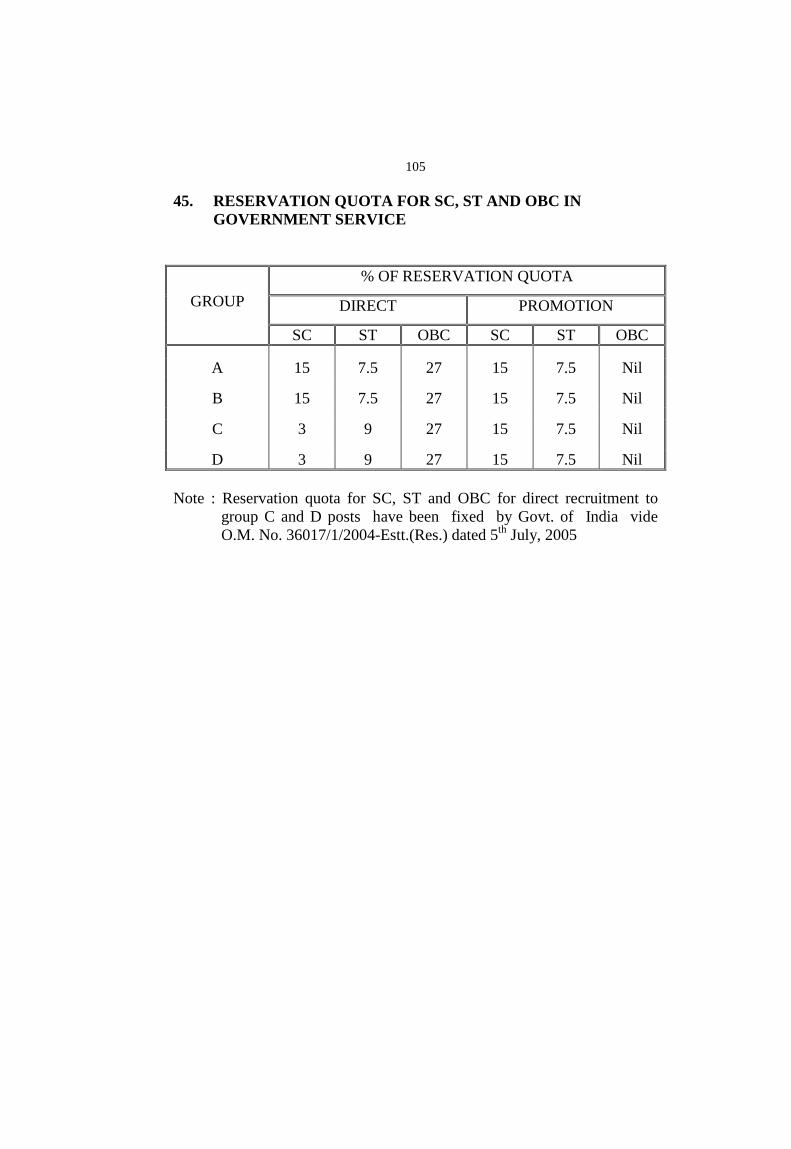
105
45. RESERVATION QUOTA FOR SC, ST AND OBC IN
GOVERNMENT SERVICE
GROUP % OF RESERVATION QUOTA
DIRECT PROMOTION
SC ST OBC SC ST OBC
A 15 7.5 27 15 7.5 Nil
B 15 7.5 27 15 7.5 Nil
C 3 9 27 15 7.5 Nil
D 3 9 27 15 7.5 Nil Note : Reservation quota for SC, ST and OBC for direct recruitment to
group C and D posts have been fixed by Govt. of India vide O.M. No. 36017/1/2004-Estt.(Res.) dated 5th
July, 2005
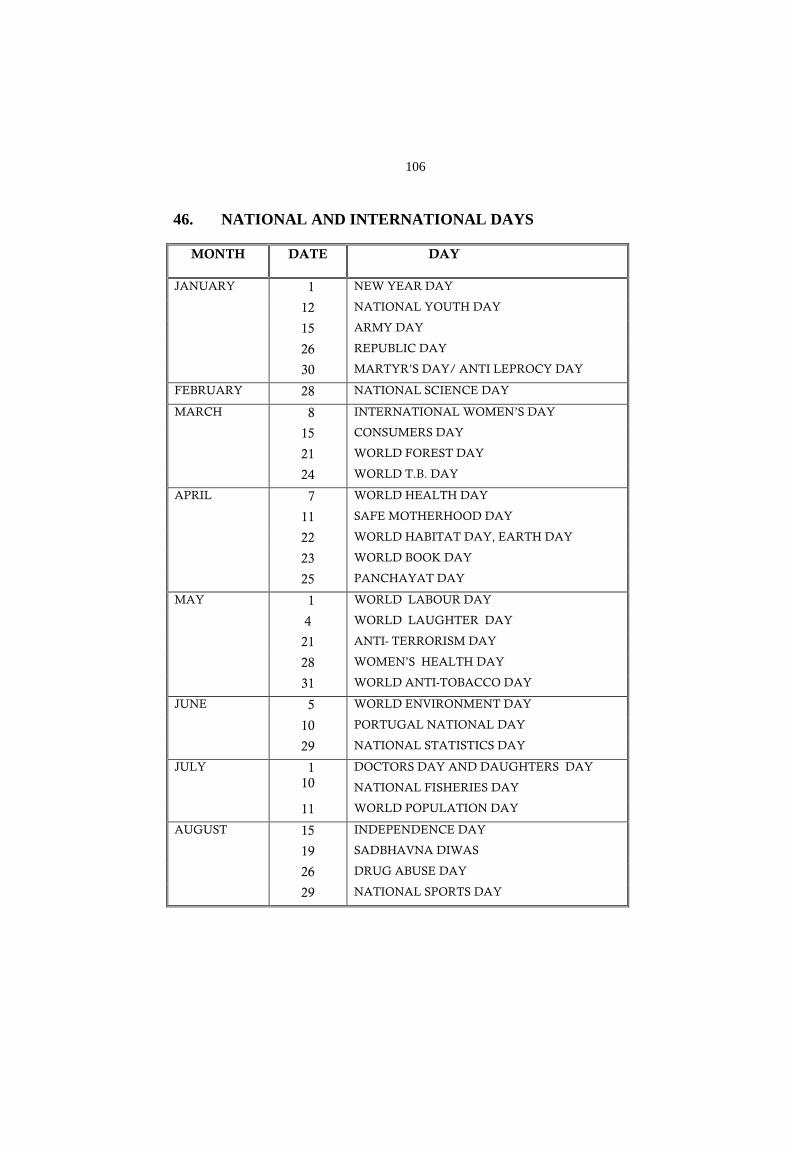
106
46. NATIONAL AND INTERNATIONAL DAYS
MONTH DATE DAY
JANUARY 1 NEW YEAR DAY
12 NATIONAL YOUTH DAY
15 ARMY DAY
26 REPUBLIC DAY
30 MARTYR’S DAY/ ANTI LEPROCY DAY
FEBRUARY 28 NATIONAL SCIENCE DAY
MARCH 8 INTERNATIONAL WOMEN’S DAY
15 CONSUMERS DAY
21 WORLD FOREST DAY
24 WORLD T.B. DAY
APRIL 7 WORLD HEALTH DAY
11 SAFE MOTHERHOOD DAY
22 WORLD HABITAT DAY, EARTH DAY
23 WORLD BOOK DAY
25 PANCHAYAT DAY
MAY 1 WORLD LABOUR DAY
4 WORLD LAUGHTER DAY
21 ANTI- TERRORISM DAY
28 WOMEN’S HEALTH DAY
31 WORLD ANTI-TOBACCO DAY
JUNE 5 WORLD ENVIRONMENT DAY
10 PORTUGAL NATIONAL DAY
29 NATIONAL STATISTICS DAY
JULY 1 10
DOCTORS DAY AND DAUGHTERS DAY
NATIONAL FISHERIES DAY
11 WORLD POPULATION DAY
AUGUST 15 INDEPENDENCE DAY
19 SADBHAVNA DIWAS
26 DRUG ABUSE DAY
29 NATIONAL SPORTS DAY
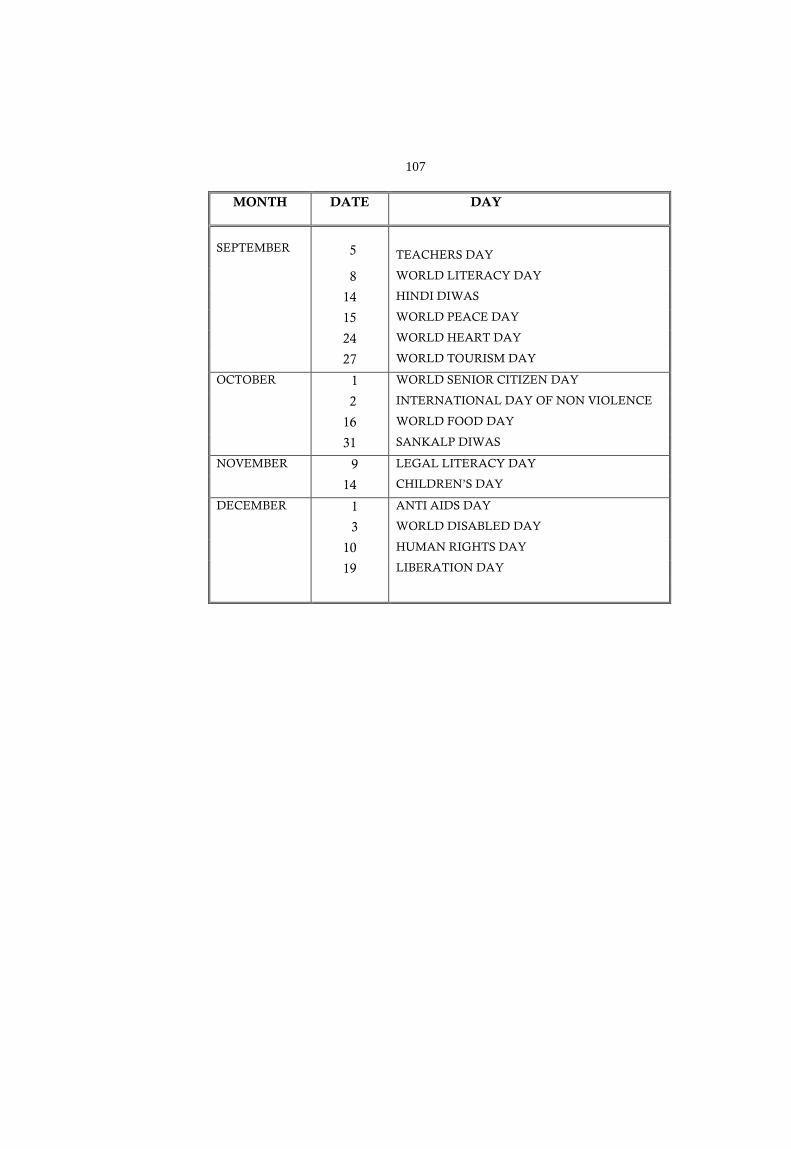
107
MONTH DATE DAY
SEPTEMBER
5
TEACHERS DAY
8 WORLD LITERACY DAY
14 HINDI DIWAS
15 WORLD PEACE DAY
24 WORLD HEART DAY
27 WORLD TOURISM DAY
OCTOBER 1 WORLD SENIOR CITIZEN DAY
2 INTERNATIONAL DAY OF NON VIOLENCE
16 WORLD FOOD DAY
31 SANKALP DIWAS
NOVEMBER 9 LEGAL LITERACY DAY
14 CHILDREN’S DAY
DECEMBER 1 ANTI AIDS DAY
3 WORLD DISABLED DAY
10 HUMAN RIGHTS DAY
19 LIBERATION DAY
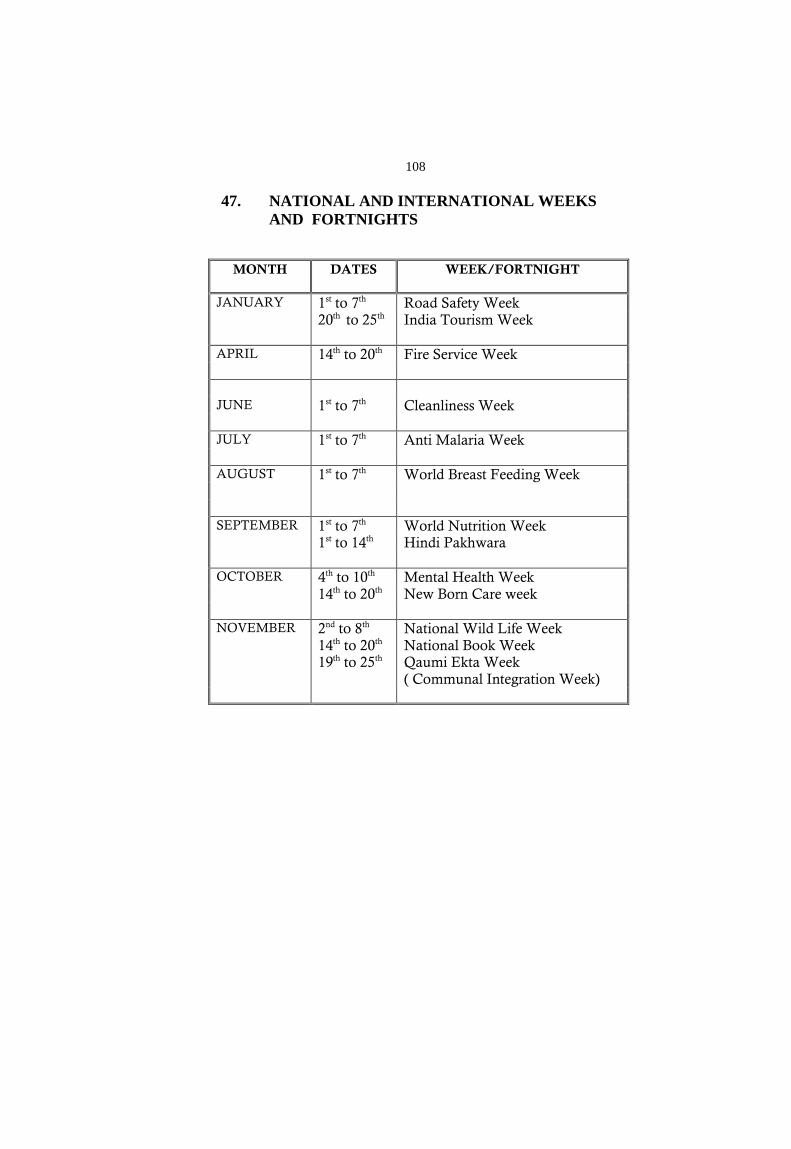
108
47. NATIONAL AND INTERNATIONAL WEEKS
AND FORTNIGHTS
MONTH DATES WEEK/FORTNIGHT
JANUARY 1st to 7 Road Safety Week th 20th to 25th India Tourism Week APRIL 14th to 20th Fire Service Week JUNE 1st to 7th Cleanliness Week JULY 1st to 7th Anti Malaria Week AUGUST 1st to 7th World Breast Feeding Week SEPTEMBER 1st to 7th World Nutrition Week 1st to 14th Hindi Pakhwara OCTOBER 4th to 10 Mental Health Week th 14th to 20 New Born Care week th NOVEMBER 2nd to 8th
14
th to 20th
19
th to 25th
National Wild Life Week
National Book Week Qaumi Ekta Week ( Communal Integration Week)
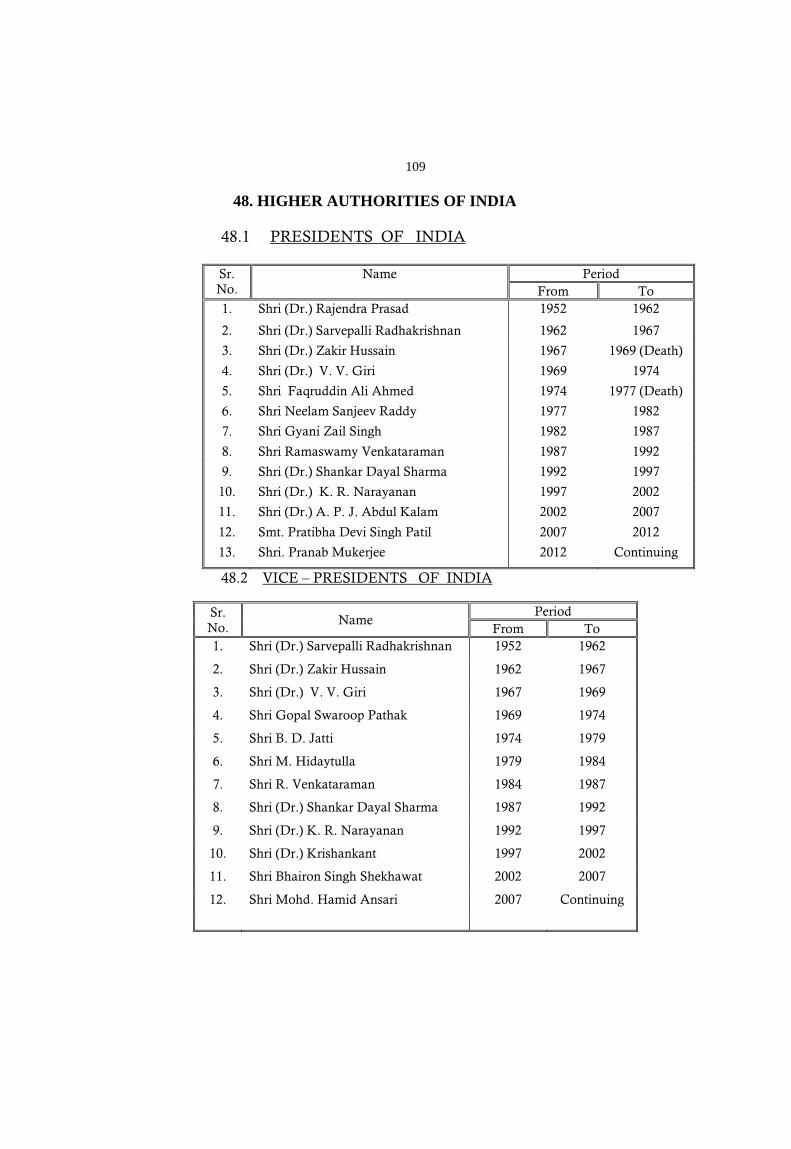
109
48. HIGHER AUTHORITIES OF INDIA
48.1 PRESIDENTS OF INDIA
Sr. No.
Name Period From To
1. Shri (Dr.) Rajendra Prasad 1952 1962
2. Shri (Dr.) Sarvepalli Radhakrishnan 1962 1967
3. Shri (Dr.) Zakir Hussain 1967 1969 (Death)
4. Shri (Dr.) V. V. Giri 1969 1974
5. Shri Faqruddin Ali Ahmed 1974 1977 (Death)
6. Shri Neelam Sanjeev Raddy 1977 1982
7. Shri Gyani Zail Singh 1982 1987
8. Shri Ramaswamy Venkataraman 1987 1992
9. Shri (Dr.) Shankar Dayal Sharma 1992 1997
10. Shri (Dr.) K. R. Narayanan 1997 2002
11. Shri (Dr.) A. P. J. Abdul Kalam 2002 2007
12. Smt. Pratibha Devi Singh Patil 2007 2012
13. Shri. Pranab Mukerjee 2012 Continuing
48.2 VICE – PRESIDENTS OF INDIA
Sr. No.
Name Period
From To 1. Shri (Dr.) Sarvepalli Radhakrishnan 1952 1962
2. Shri (Dr.) Zakir Hussain 1962 1967
3. Shri (Dr.) V. V. Giri 1967 1969
4. Shri Gopal Swaroop Pathak 1969 1974
5. Shri B. D. Jatti 1974 1979
6. Shri M. Hidaytulla 1979 1984
7. Shri R. Venkataraman 1984 1987
8. Shri (Dr.) Shankar Dayal Sharma 1987 1992
9. Shri (Dr.) K. R. Narayanan 1992 1997
10. Shri (Dr.) Krishankant 1997 2002
11. Shri Bhairon Singh Shekhawat 2002 2007
12. Shri Mohd. Hamid Ansari 2007 Continuing
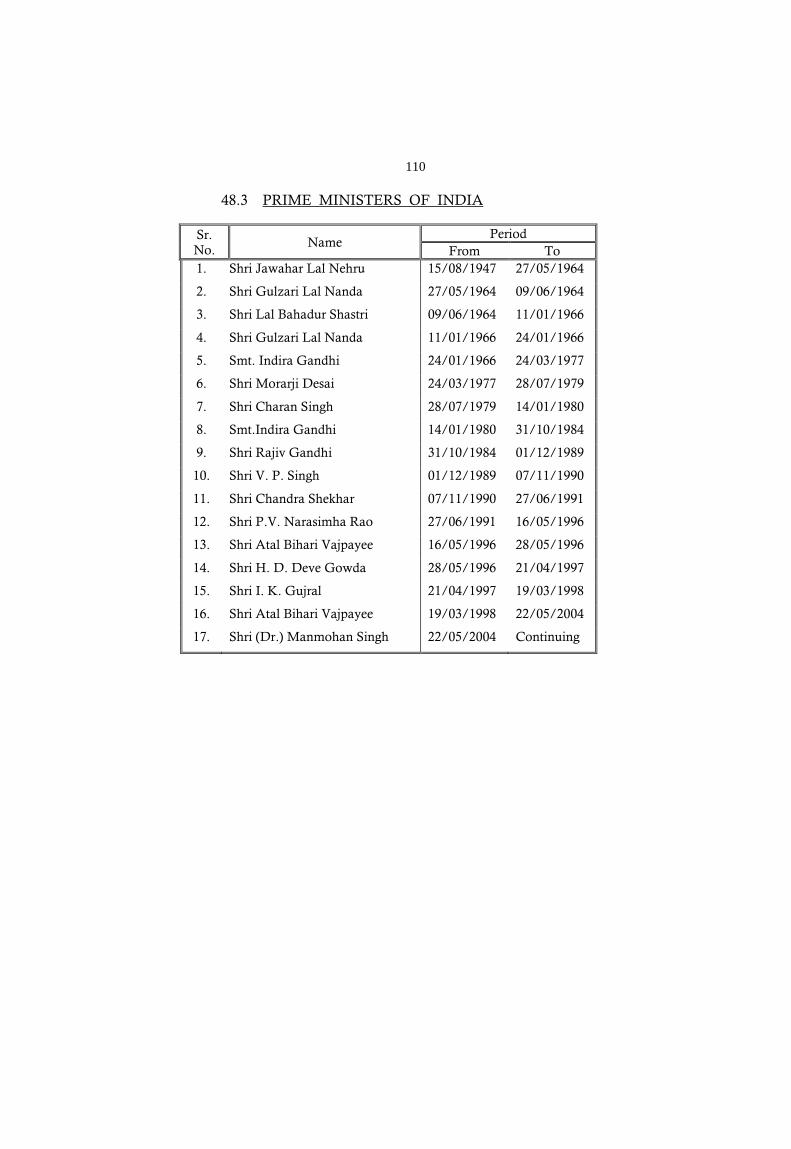
110
48.3 PRIME MINISTERS OF INDIA
Sr. No.
Name Period From To
1. Shri Jawahar Lal Nehru 15/08/1947 27/05/1964
2. Shri Gulzari Lal Nanda 27/05/1964 09/06/1964
3. Shri Lal Bahadur Shastri 09/06/1964 11/01/1966
4. Shri Gulzari Lal Nanda 11/01/1966 24/01/1966
5. Smt. Indira Gandhi 24/01/1966 24/03/1977
6. Shri Morarji Desai 24/03/1977 28/07/1979
7. Shri Charan Singh 28/07/1979 14/01/1980
8. Smt.Indira Gandhi 14/01/1980 31/10/1984
9. Shri Rajiv Gandhi 31/10/1984 01/12/1989
10. Shri V. P. Singh 01/12/1989 07/11/1990
11. Shri Chandra Shekhar 07/11/1990 27/06/1991
12. Shri P.V. Narasimha Rao 27/06/1991 16/05/1996
13. Shri Atal Bihari Vajpayee 16/05/1996 28/05/1996
14. Shri H. D. Deve Gowda 28/05/1996 21/04/1997
15. Shri I. K. Gujral 21/04/1997 19/03/1998
16. Shri Atal Bihari Vajpayee 19/03/1998 22/05/2004
17. Shri (Dr.) Manmohan Singh 22/05/2004 Continuing
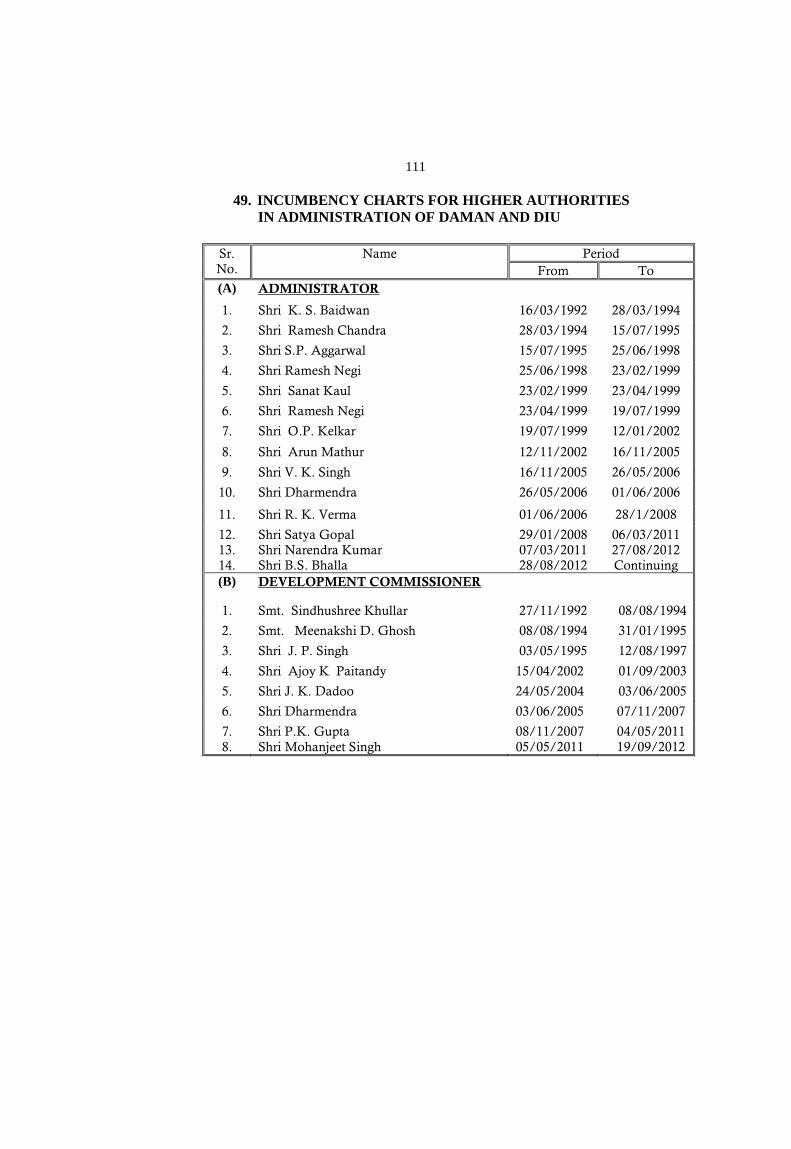
111
49. INCUMBENCY CHARTS FOR HIGHER AUTHORITIES
IN ADMINISTRATION OF DAMAN AND DIU
Sr. No.
Name Period From To
(A) ADMINISTRATOR
1. Shri K. S. Baidwan 16/03/1992 28/03/1994
2. Shri Ramesh Chandra 28/03/1994 15/07/1995
3. Shri S.P. Aggarwal 15/07/1995 25/06/1998
4. Shri Ramesh Negi 25/06/1998 23/02/1999
5. Shri Sanat Kaul 23/02/1999 23/04/1999
6. Shri Ramesh Negi 23/04/1999 19/07/1999
7. Shri O.P. Kelkar 19/07/1999 12/01/2002
8. Shri Arun Mathur 12/11/2002 16/11/2005
9. Shri V. K. Singh 16/11/2005 26/05/2006
10. Shri Dharmendra 26/05/2006 01/06/2006
11. Shri R. K. Verma 01/06/2006 28/1/2008
12. 13. 14.
Shri Satya Gopal Shri Narendra Kumar Shri B.S. Bhalla
29/01/2008 07/03/2011 28/08/2012
06/03/2011 27/08/2012 Continuing
(B) DEVELOPMENT COMMISSIONER
1. Smt. Sindhushree Khullar 27/11/1992 08/08/1994
2. Smt. Meenakshi D. Ghosh 08/08/1994 31/01/1995
3. Shri J. P. Singh 03/05/1995 12/08/1997
4. Shri Ajoy K Paitandy 15/04/2002 01/09/2003
5. Shri J. K. Dadoo 24/05/2004 03/06/2005
6. Shri Dharmendra 03/06/2005 07/11/2007
7. 8.
Shri P.K. Gupta Shri Mohanjeet Singh
08/11/2007 05/05/2011
04/05/2011 19/09/2012
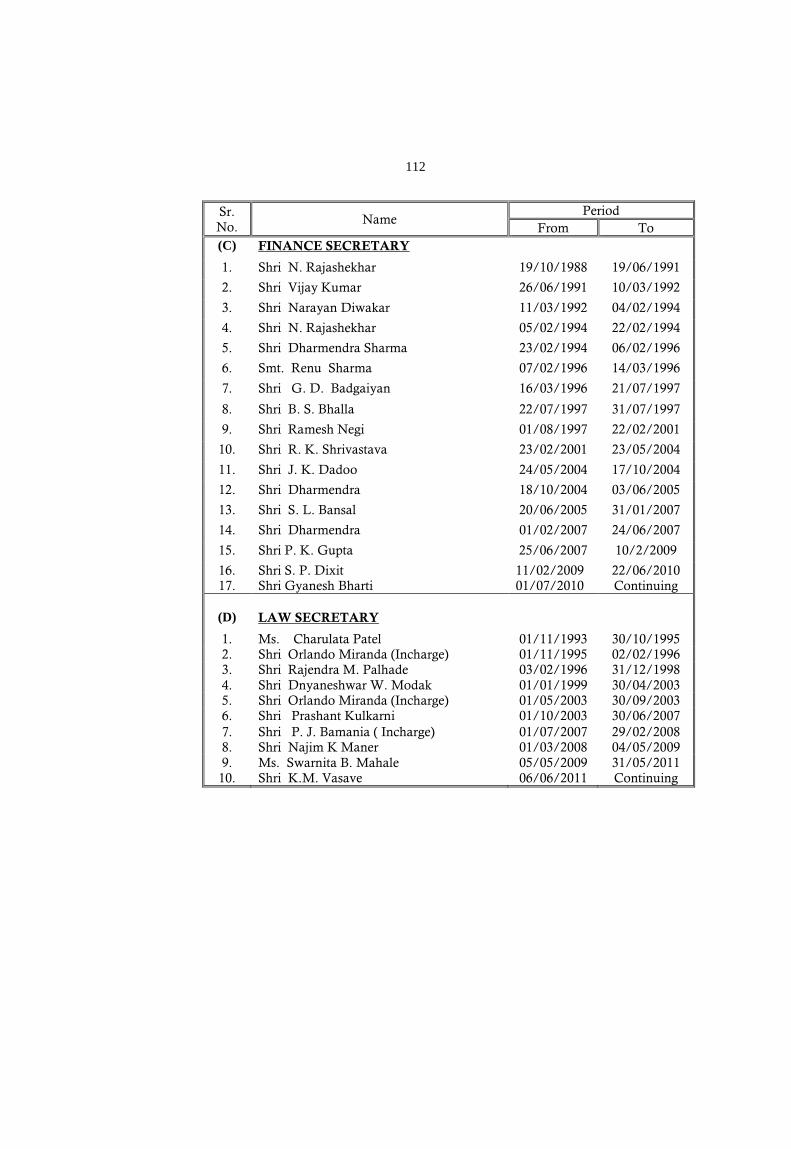
112
Sr. No.
Name Period
From To (C) FINANCE SECRETARY
1. Shri N. Rajashekhar 19/10/1988 19/06/1991
2. Shri Vijay Kumar 26/06/1991 10/03/1992
3. Shri Narayan Diwakar 11/03/1992 04/02/1994
4. Shri N. Rajashekhar 05/02/1994 22/02/1994
5. Shri Dharmendra Sharma 23/02/1994 06/02/1996
6. Smt. Renu Sharma 07/02/1996 14/03/1996
7. Shri G. D. Badgaiyan 16/03/1996 21/07/1997
8. Shri B. S. Bhalla 22/07/1997 31/07/1997
9. Shri Ramesh Negi 01/08/1997 22/02/2001
10. Shri R. K. Shrivastava 23/02/2001 23/05/2004
11. Shri J. K. Dadoo 24/05/2004 17/10/2004
12. Shri Dharmendra 18/10/2004 03/06/2005
13. Shri S. L. Bansal 20/06/2005 31/01/2007
14. Shri Dharmendra 01/02/2007 24/06/2007
15. Shri P. K. Gupta 25/06/2007 10/2/2009
16. 17.
Shri S. P. Dixit Shri Gyanesh Bharti
11/02/2009 01/07/2010
22/06/2010 Continuing
(D) LAW SECRETARY
1. Ms. Charulata Patel 01/11/1993 30/10/1995 2. Shri Orlando Miranda (Incharge) 01/11/1995 02/02/1996 3. Shri Rajendra M. Palhade 03/02/1996 31/12/1998 4. Shri Dnyaneshwar W. Modak 01/01/1999 30/04/2003 5. Shri Orlando Miranda (Incharge) 01/05/2003 30/09/2003 6. Shri Prashant Kulkarni 01/10/2003 30/06/2007 7. Shri P. J. Bamania ( Incharge) 01/07/2007 29/02/2008 8. Shri Najim K Maner 01/03/2008 04/05/2009 9. 10.
Ms. Swarnita B. Mahale Shri K.M. Vasave
05/05/2009 06/06/2011
31/05/2011 Continuing
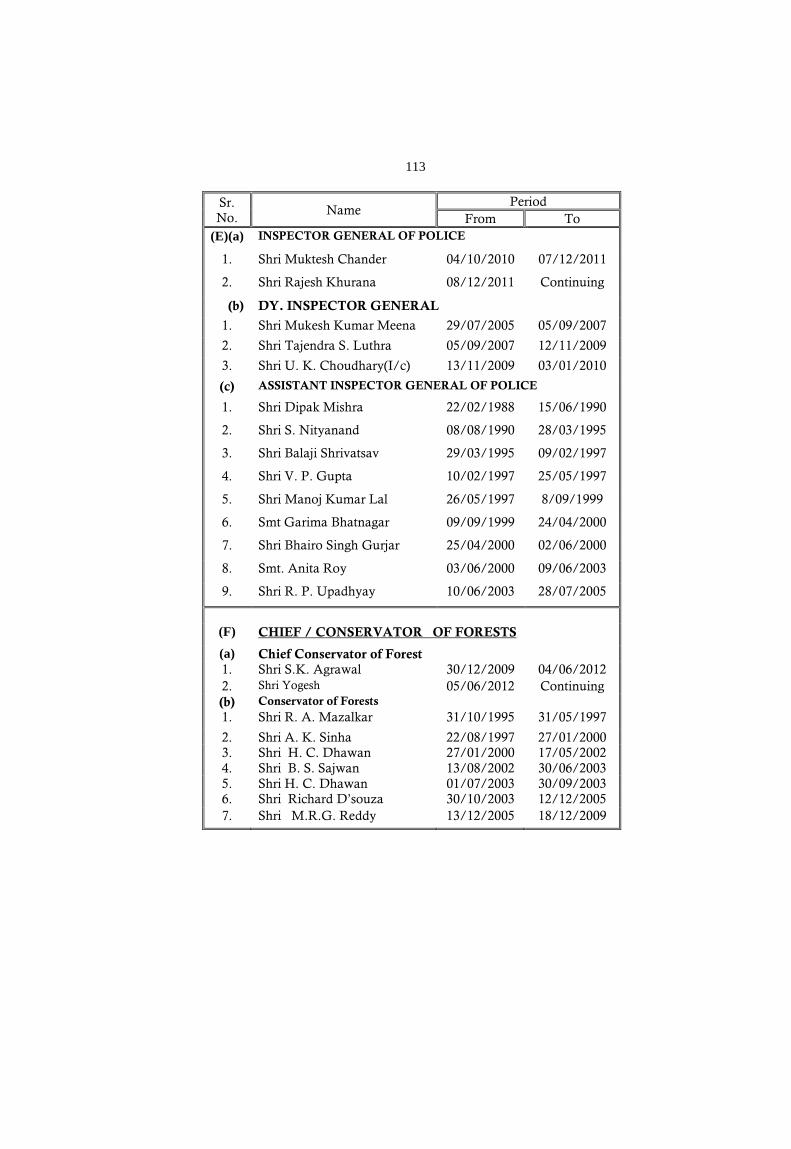
113
Sr. No.
Name Period
From To (E)(a) INSPECTOR GENERAL OF POLICE
1. Shri Muktesh Chander 04/10/2010 07/12/2011
2. Shri Rajesh Khurana 08/12/2011 Continuing
(b) DY. INSPECTOR GENERAL
1. Shri Mukesh Kumar Meena 29/07/2005 05/09/2007
2. Shri Tajendra S. Luthra 05/09/2007 12/11/2009
3. Shri U. K. Choudhary(I/c) 13/11/2009 03/01/2010
(c) ASSISTANT INSPECTOR GENERAL OF POLICE
1. Shri Dipak Mishra 22/02/1988 15/06/1990
2. Shri S. Nityanand 08/08/1990 28/03/1995
3. Shri Balaji Shrivatsav 29/03/1995 09/02/1997
4. Shri V. P. Gupta 10/02/1997 25/05/1997
5. Shri Manoj Kumar Lal 26/05/1997 8/09/1999
6. Smt Garima Bhatnagar 09/09/1999 24/04/2000
7. Shri Bhairo Singh Gurjar 25/04/2000 02/06/2000
8. Smt. Anita Roy 03/06/2000 09/06/2003
9. Shri R. P. Upadhyay 10/06/2003 28/07/2005
(F) CHIEF / CONSERVATOR OF FORESTS
(a) Chief Conservator of Forest 1. Shri S.K. Agrawal 30/12/2009 04/06/2012 2. Shri Yogesh 05/06/2012 Continuing (b) Conservator of Forests 1. Shri R. A. Mazalkar 31/10/1995 31/05/1997
2. Shri A. K. Sinha 22/08/1997 27/01/2000 3. Shri H. C. Dhawan 27/01/2000 17/05/2002 4. Shri B. S. Sajwan 13/08/2002 30/06/2003 5. Shri H. C. Dhawan 01/07/2003 30/09/2003 6. Shri Richard D’souza 30/10/2003 12/12/2005 7. Shri M.R.G. Reddy 13/12/2005 18/12/2009
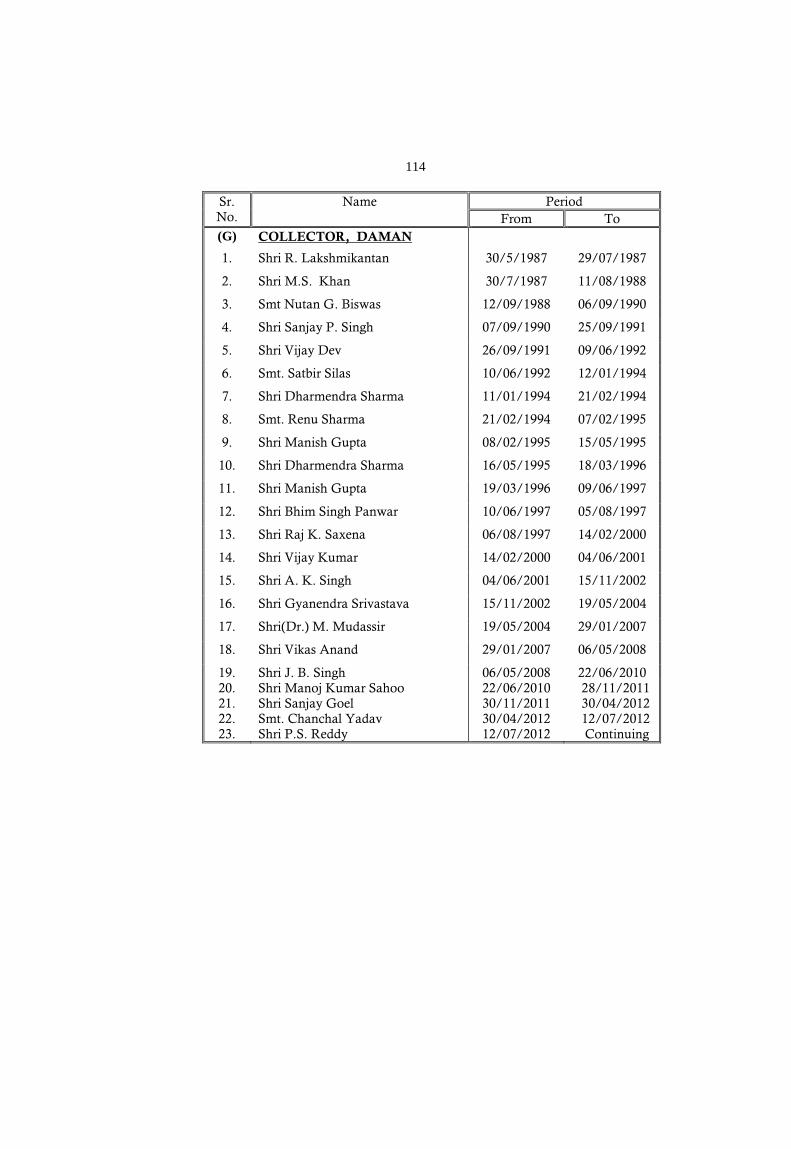
114
Sr. No.
Name Period From To
(G) COLLECTOR, DAMAN
1. Shri R. Lakshmikantan 30/5/1987 29/07/1987
2. Shri M.S. Khan 30/7/1987 11/08/1988
3. Smt Nutan G. Biswas 12/09/1988 06/09/1990
4. Shri Sanjay P. Singh 07/09/1990 25/09/1991
5. Shri Vijay Dev 26/09/1991 09/06/1992
6. Smt. Satbir Silas 10/06/1992 12/01/1994
7. Shri Dharmendra Sharma 11/01/1994 21/02/1994
8. Smt. Renu Sharma 21/02/1994 07/02/1995
9. Shri Manish Gupta 08/02/1995 15/05/1995
10. Shri Dharmendra Sharma 16/05/1995 18/03/1996
11. Shri Manish Gupta 19/03/1996 09/06/1997
12. Shri Bhim Singh Panwar 10/06/1997 05/08/1997
13. Shri Raj K. Saxena 06/08/1997 14/02/2000
14. Shri Vijay Kumar 14/02/2000 04/06/2001
15. Shri A. K. Singh 04/06/2001 15/11/2002
16. Shri Gyanendra Srivastava 15/11/2002 19/05/2004
17. Shri(Dr.) M. Mudassir 19/05/2004 29/01/2007
18. Shri Vikas Anand 29/01/2007 06/05/2008
19. Shri J. B. Singh 06/05/2008 22/06/2010 20. 21. 22. 23.
Shri Manoj Kumar Sahoo Shri Sanjay Goel Smt. Chanchal Yadav Shri P.S. Reddy
22/06/2010 30/11/2011 30/04/2012 12/07/2012
28/11/2011 30/04/2012 12/07/2012 Continuing
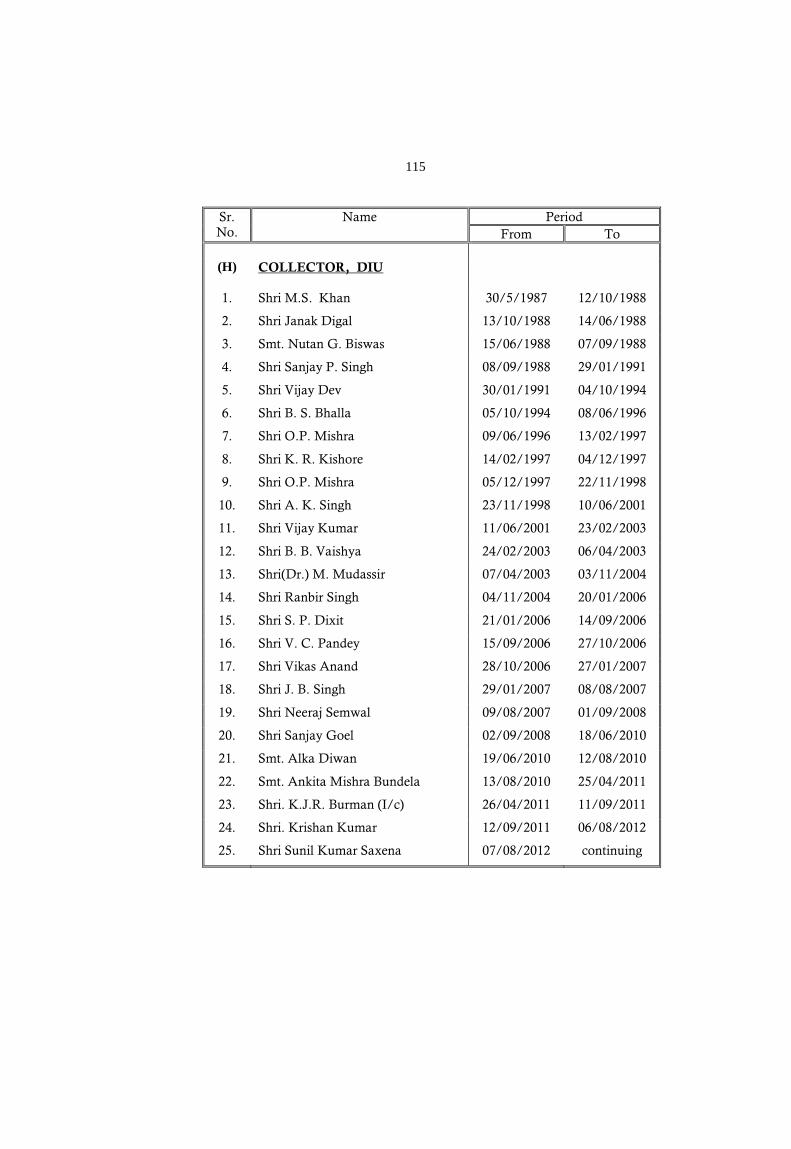
115
Sr. No.
Name Period From To
(H) COLLECTOR, DIU
1. Shri M.S. Khan 30/5/1987 12/10/1988
2. Shri Janak Digal 13/10/1988 14/06/1988
3. Smt. Nutan G. Biswas 15/06/1988 07/09/1988
4. Shri Sanjay P. Singh 08/09/1988 29/01/1991
5. Shri Vijay Dev 30/01/1991 04/10/1994
6. Shri B. S. Bhalla 05/10/1994 08/06/1996
7. Shri O.P. Mishra 09/06/1996 13/02/1997
8. Shri K. R. Kishore 14/02/1997 04/12/1997
9. Shri O.P. Mishra 05/12/1997 22/11/1998
10. Shri A. K. Singh 23/11/1998 10/06/2001
11. Shri Vijay Kumar 11/06/2001 23/02/2003
12. Shri B. B. Vaishya 24/02/2003 06/04/2003
13. Shri(Dr.) M. Mudassir 07/04/2003 03/11/2004
14. Shri Ranbir Singh 04/11/2004 20/01/2006
15. Shri S. P. Dixit 21/01/2006 14/09/2006
16. Shri V. C. Pandey 15/09/2006 27/10/2006
17. Shri Vikas Anand 28/10/2006 27/01/2007
18. Shri J. B. Singh 29/01/2007 08/08/2007
19. Shri Neeraj Semwal 09/08/2007 01/09/2008
20. Shri Sanjay Goel 02/09/2008 18/06/2010
21.
22.
23.
Smt. Alka Diwan
Smt. Ankita Mishra Bundela
Shri. K.J.R. Burman (I/c)
19/06/2010
13/08/2010
26/04/2011
12/08/2010
25/04/2011
11/09/2011
24.
25.
Shri. Krishan Kumar
Shri Sunil Kumar Saxena
12/09/2011
07/08/2012
06/08/2012
continuing
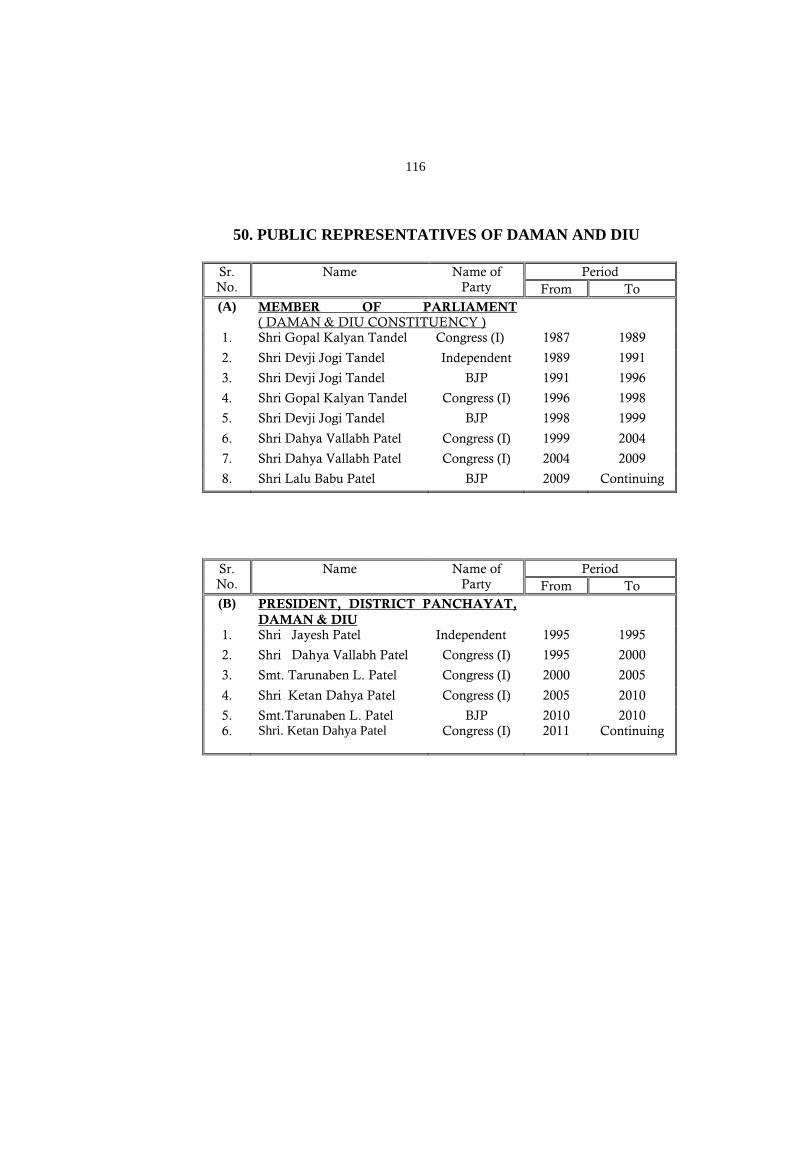
116
50. PUBLIC REPRESENTATIVES OF DAMAN AND DIU Sr. No.
Name Name of Party
Period From To
(A) MEMBER OF PARLIAMENT ( DAMAN & DIU CONSTITUENCY )
1. Shri Gopal Kalyan Tandel Congress (I) 1987 1989
2. Shri Devji Jogi Tandel Independent 1989 1991
3. Shri Devji Jogi Tandel BJP 1991 1996
4. Shri Gopal Kalyan Tandel Congress (I) 1996 1998
5. Shri Devji Jogi Tandel BJP 1998 1999
6. Shri Dahya Vallabh Patel Congress (I) 1999 2004
7. Shri Dahya Vallabh Patel Congress (I) 2004 2009
8. Shri Lalu Babu Patel BJP 2009 Continuing
Sr. No.
Name Name of Party
Period From To
(B) PRESIDENT, DISTRICT PANCHAYAT, DAMAN & DIU
1. Shri Jayesh Patel Independent 1995 1995
2. Shri Dahya Vallabh Patel Congress (I) 1995 2000
3. Smt. Tarunaben L. Patel Congress (I) 2000 2005
4. Shri Ketan Dahya Patel Congress (I) 2005 2010
5. 6.
Smt.Tarunaben L. Patel Shri. Ketan Dahya Patel
BJP Congress (I)
2010 2011
2010 Continuing
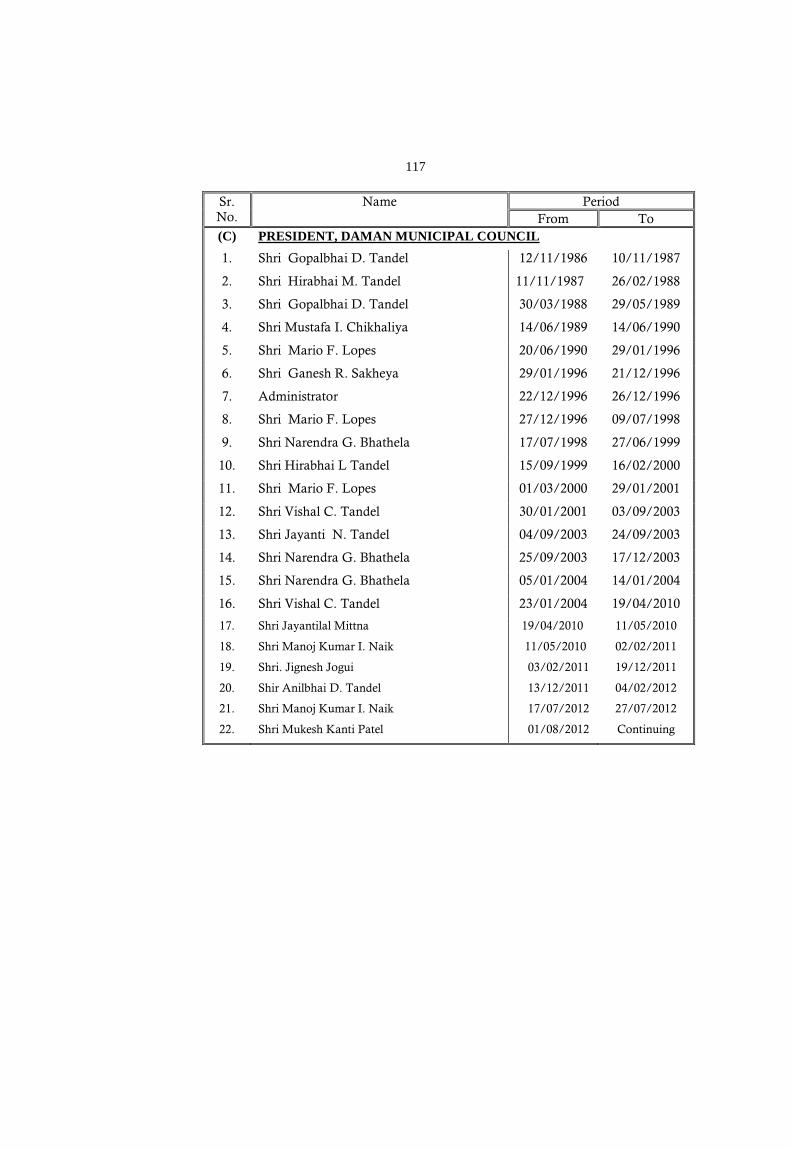
117
Sr. No.
Name Period From To
(C) PRESIDENT, DAMAN MUNICIPAL COUNCIL
1. Shri Gopalbhai D. Tandel 12/11/1986 10/11/1987
2. Shri Hirabhai M. Tandel 11/11/1987 26/02/1988
3. Shri Gopalbhai D. Tandel 30/03/1988 29/05/1989
4. Shri Mustafa I. Chikhaliya 14/06/1989 14/06/1990
5. Shri Mario F. Lopes 20/06/1990 29/01/1996
6. Shri Ganesh R. Sakheya 29/01/1996 21/12/1996
7. Administrator 22/12/1996 26/12/1996
8. Shri Mario F. Lopes 27/12/1996 09/07/1998
9. Shri Narendra G. Bhathela 17/07/1998 27/06/1999
10. Shri Hirabhai L Tandel 15/09/1999 16/02/2000
11. Shri Mario F. Lopes 01/03/2000 29/01/2001
12. Shri Vishal C. Tandel 30/01/2001 03/09/2003
13. Shri Jayanti N. Tandel 04/09/2003 24/09/2003
14. Shri Narendra G. Bhathela 25/09/2003 17/12/2003
15. Shri Narendra G. Bhathela 05/01/2004 14/01/2004
16. Shri Vishal C. Tandel 23/01/2004 19/04/2010
17.
18.
19.
20.
21.
22.
Shri Jayantilal Mittna
Shri Manoj Kumar I. Naik
Shri. Jignesh Jogui
Shir Anilbhai D. Tandel
Shri Manoj Kumar I. Naik
Shri Mukesh Kanti Patel
19/04/2010
11/05/2010
03/02/2011
13/12/2011
17/07/2012
01/08/2012
11/05/2010
02/02/2011
19/12/2011
04/02/2012
27/07/2012
Continuing
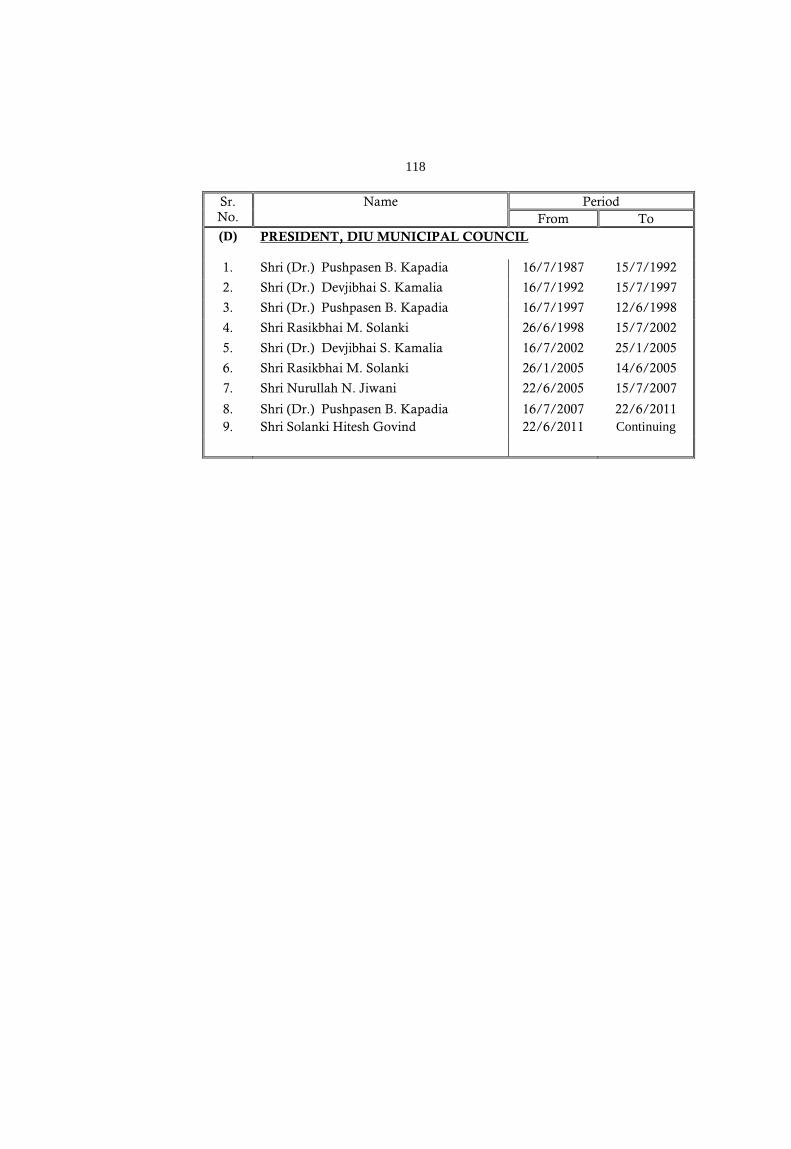
118
Sr. No.
Name Period From To
(D) PRESIDENT, DIU MUNICIPAL COUNCIL
1. Shri (Dr.) Pushpasen B. Kapadia 16/7/1987 15/7/1992
2. Shri (Dr.) Devjibhai S. Kamalia 16/7/1992 15/7/1997
3. Shri (Dr.) Pushpasen B. Kapadia 16/7/1997 12/6/1998
4. Shri Rasikbhai M. Solanki 26/6/1998 15/7/2002
5. Shri (Dr.) Devjibhai S. Kamalia 16/7/2002 25/1/2005
6. Shri Rasikbhai M. Solanki 26/1/2005 14/6/2005
7. Shri Nurullah N. Jiwani 22/6/2005 15/7/2007
8. 9.
Shri (Dr.) Pushpasen B. Kapadia Shri Solanki Hitesh Govind
16/7/2007 22/6/2011
22/6/2011 Continuing
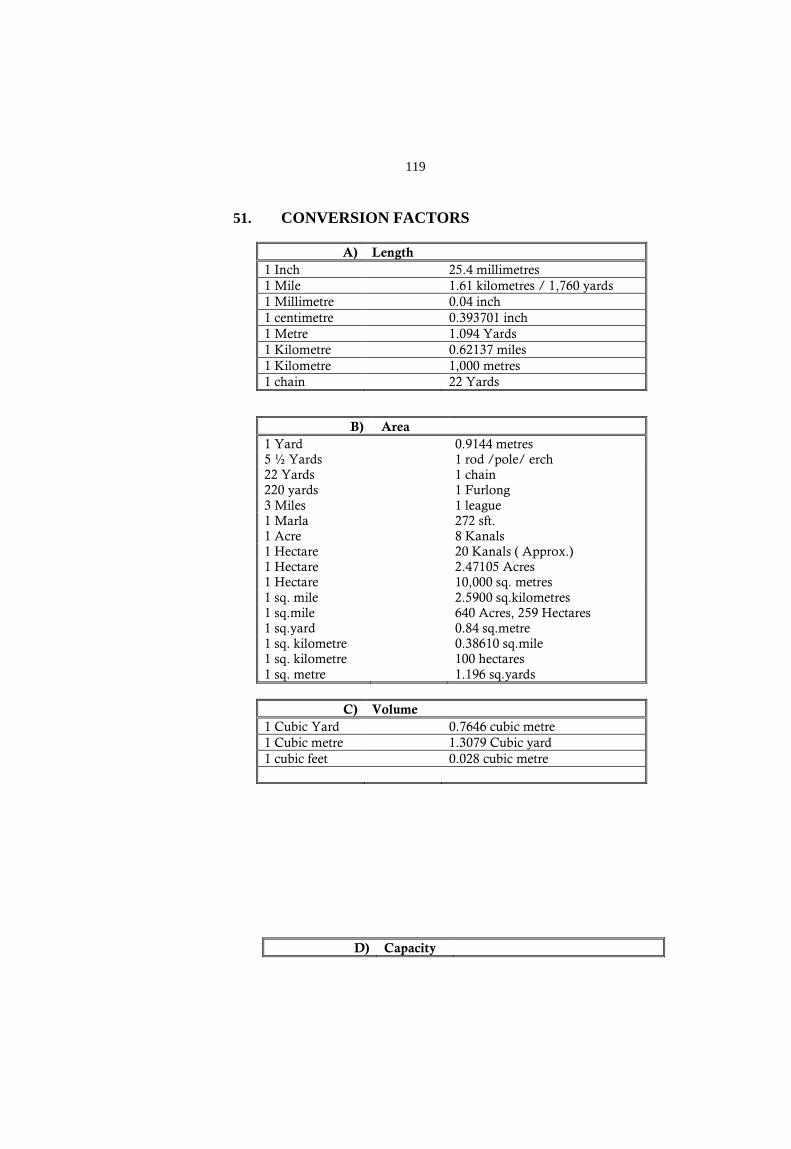
119
51. CONVERSION FACTORS
A) Length 1 Inch 25.4 millimetres 1 Mile 1.61 kilometres / 1,760 yards 1 Millimetre 0.04 inch 1 centimetre 0.393701 inch 1 Metre 1.094 Yards 1 Kilometre 0.62137 miles 1 Kilometre 1,000 metres 1 chain 22 Yards
B) Area 1 Yard 0.9144 metres 5 ½ Yards 1 rod /pole/ erch 22 Yards 1 chain 220 yards 1 Furlong 3 Miles 1 league 1 Marla 272 sft. 1 Acre 8 Kanals 1 Hectare 20 Kanals ( Approx.) 1 Hectare 2.47105 Acres 1 Hectare 10,000 sq. metres 1 sq. mile 2.5900 sq.kilometres 1 sq.mile 640 Acres, 259 Hectares 1 sq.yard 0.84 sq.metre 1 sq. kilometre 0.38610 sq.mile 1 sq. kilometre 100 hectares 1 sq. metre 1.196 sq.yards
C) Volume 1 Cubic Yard 0.7646 cubic metre 1 Cubic metre 1.3079 Cubic yard 1 cubic feet 0.028 cubic metre
D) Capacity
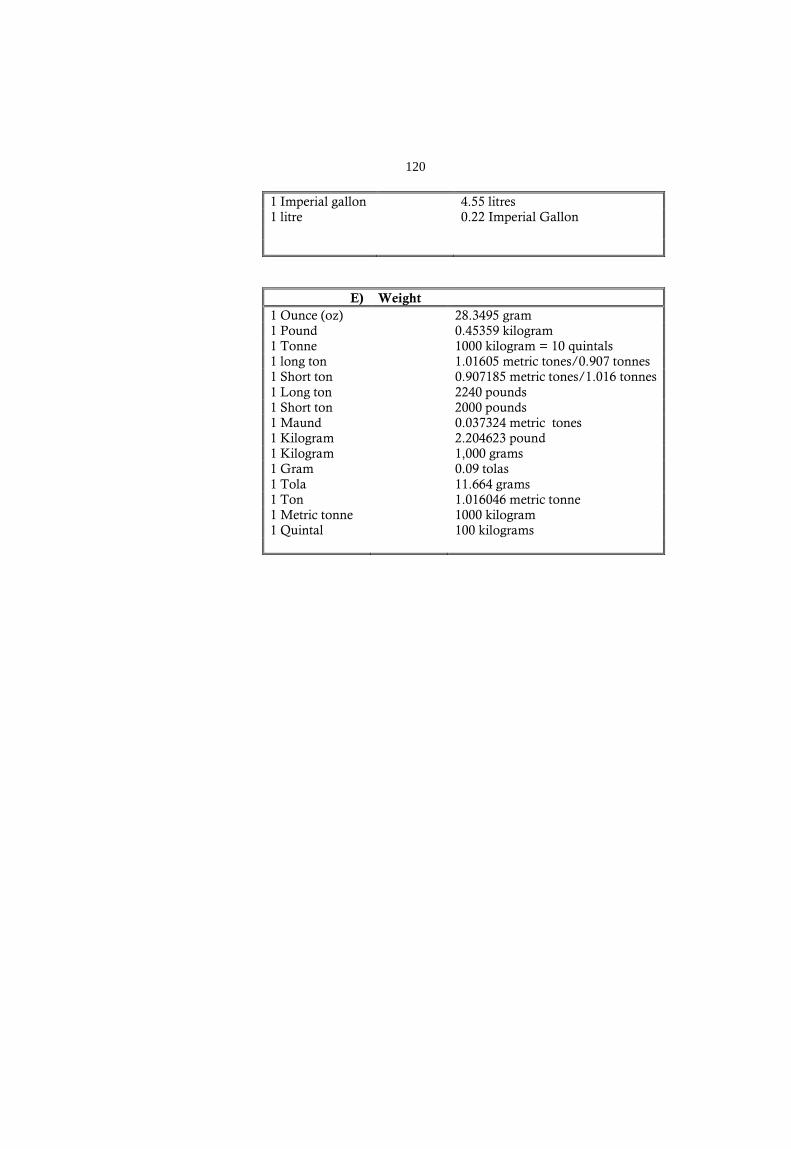
120
1 Imperial gallon 4.55 litres 1 litre 0.22 Imperial Gallon
E) Weight 1 Ounce (oz) 28.3495 gram 1 Pound 0.45359 kilogram 1 Tonne 1000 kilogram = 10 quintals 1 long ton 1.01605 metric tones/0.907 tonnes 1 Short ton 0.907185 metric tones/1.016 tonnes 1 Long ton 2240 pounds 1 Short ton 2000 pounds 1 Maund 0.037324 metric tones 1 Kilogram 2.204623 pound 1 Kilogram 1,000 grams 1 Gram 0.09 tolas 1 Tola 11.664 grams 1 Ton 1.016046 metric tonne 1 Metric tonne 1000 kilogram 1 Quintal 100 kilograms
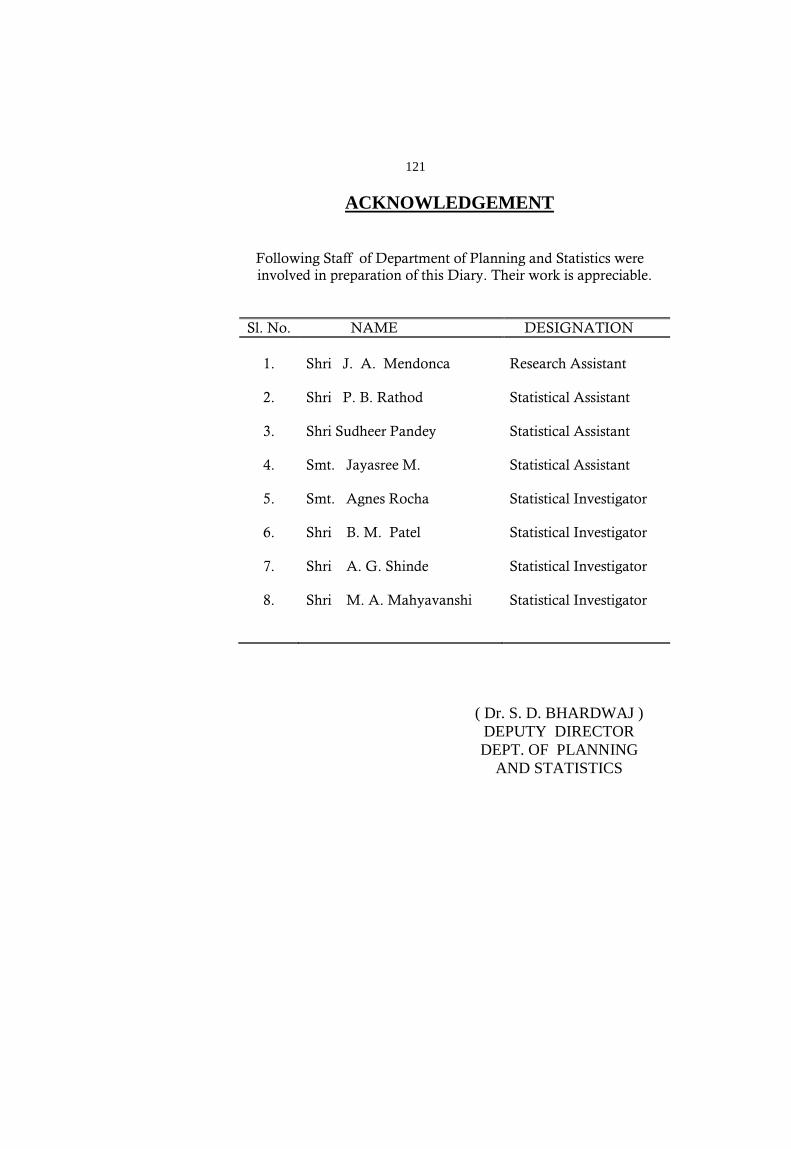
121
ACKNOWLEDGEMENT
Following Staff of Department of Planning and Statistics were involved in preparation of this Diary. Their work is appreciable.
Sl. No. NAME DESIGNATION
1. Shri J. A. Mendonca Research Assistant
2.
3.
Shri P. B. Rathod Shri Sudheer Pandey
Statistical Assistant Statistical Assistant
4. Smt. Jayasree M. Statistical Assistant
5. Smt. Agnes Rocha Statistical Investigator
6. Shri B. M. Patel Statistical Investigator
7. Shri A. G. Shinde Statistical Investigator
8. Shri M. A. Mahyavanshi Statistical Investigator
( Dr. S. D. BHARDWAJ ) DEPUTY DIRECTOR DEPT. OF PLANNING
AND STATISTICS