#states agenic v7 ational development . - usaid
TRANSCRIPT
INTERVET# STATES AG ENIC V7 (TFOR
ATIONAL DEVELOPMENT .AINT Y
No 9 - ||
DATA,THROUGH 1965 -ISSUED ==PreMeta
1 96.º
\
JOINT ECONOMIC DIVISION
UNITED STATES AGENCY FOR INTERNATIONAL
DEVELOPMENT - VIETNAM
ANNUAL STATISTICAL
BULLETIN
NO. 9
DATA THROUGH 1965
ISSUED SEPTEMBER 1966
JOINT ECONOMIC DIVISION
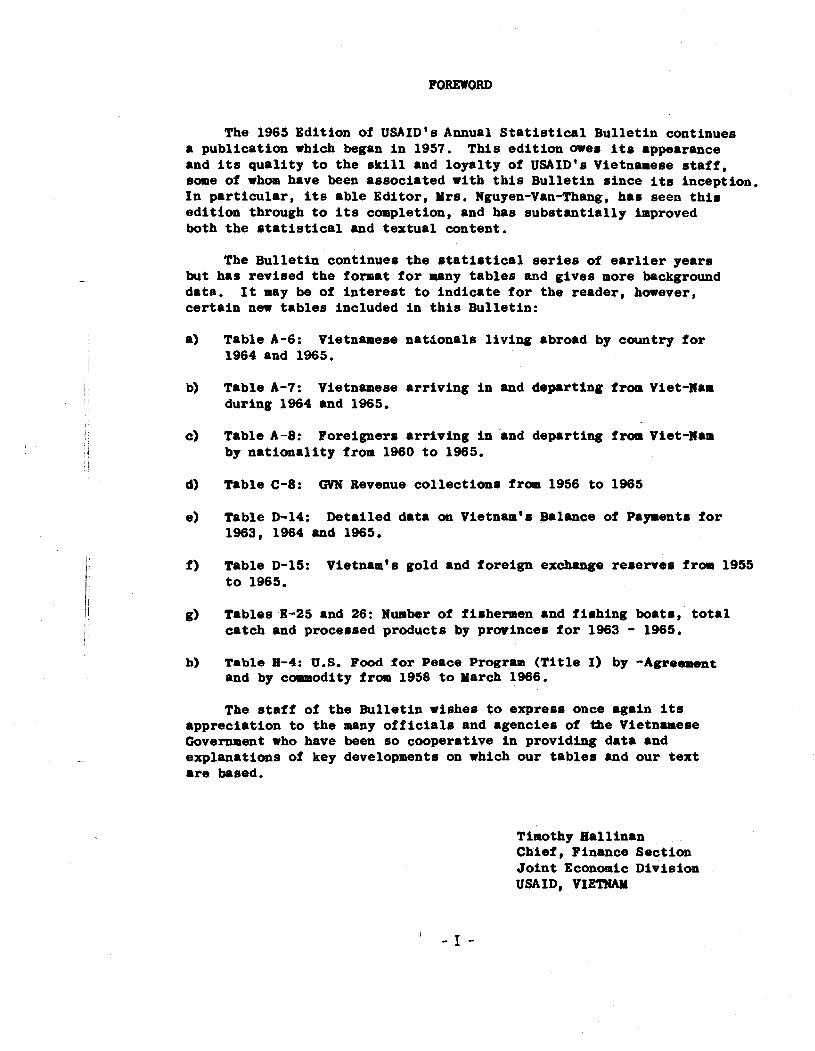
FOREWORD
The 1965 Edition of USAID's Annual Statistical Bulletin continues a publication which began in 1957. This edition owes its appearance and its quality to the skill and loyalty of USAID'S Vietnamese staff, some of whom have been associated with this Bulletin since its inception. In particular, its able Editor, Mrs. Nguyen-Van-Thang, has seen this edition through to its completion, and has substantially improved both the statistical and textual content.
The Bulletin continues the statistical series of earlier years but has revised the format for mnny tables and gives more background data. It may be of interest to indicate for the reader, however, certain new tables included in this Bulletin:
Table A-6: Vietnamese natdonals living abroad by country for 1964 and 1965.
Table A-7: Vietnamese arriving in and departing from Viet-#am during 1964 and 1965.
Table A-8: Foreigners arriving in and departing fran Viet-#am by nationality from 1960 to 1965.
Table C-8: GVN Revenue collections from 1956 to 1965
Table D-14: Detailed data on Vietnam's Balance of Payments for 1963, 1964 and 1965.
Table D-15: Vietnam's gold and foreign exchange reserves from 1955 to 1965.
Tables E-25 and 26: Number of fishermen and fishing boats, total catch and processed products by prwinces for 1963 - 1965. Table H-4: 0.8. Food for Peace Program (Title I) by -Agreement and by commodity from 1958 to March 1966.
The staff of the Bulletin wishes to express once again its appreciation to the many officials and agencies of the Vietnamese Government who have been so cooperative in providing data and explanations of key developments on which our tables and our text are based.
Timothy Hallinan Chief, Finance Section Joint Economic Division USAID, VIETNAM
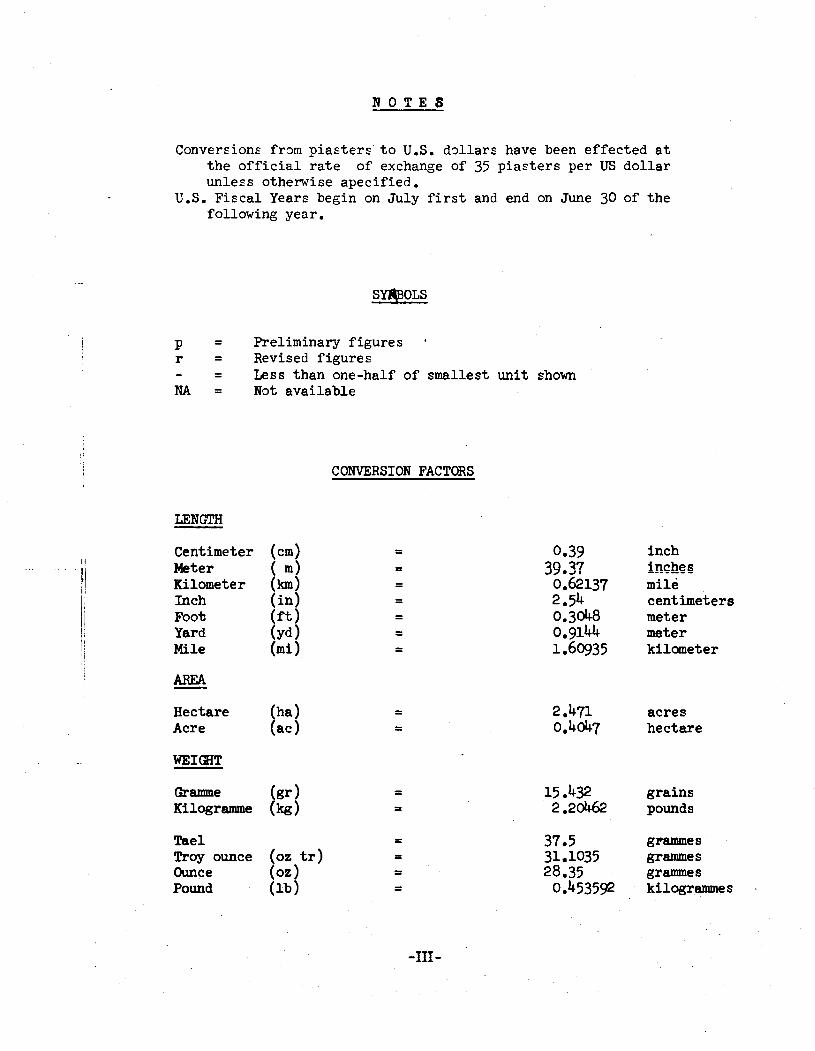
N O T E S
Conversions f r m piasters t o U.S. dollars have been effected a t the o f f i c i a l ra te of exchange of 35 piasters per US dollar unless otherwise apecified .
U.S. Fiscal Years begin on July f i r s t and end on June 30 of the following year.
p = Preliminaryfigures r = Revised figures - = Less than one-half of smallest unit shown NA = Not available
CONVERSION FACTORS
Centimeter Meter Kilometer Inch Foot Yard Mile
0.39 inch 39.3? inches
0.62137 mile 2 .54 centimeters 0.3048 meter 0.9144 meter 1.60935 kilometer
2.471 acres 0.4047 hectare
Hectare Acre
15.432 grains 2.20462 pounds
Gramme Kilogramme
Tael Troy ounce Ounce Pound
37.5 gramme s 31 -1035 grammes 28.35 grammes
0.453592 kilogrammes
(oz t r ) (02)
( l b )
STATISTICAL TABLES
SECTION A . POPULATION AND UBOR Page
Population Totals 1943-1365 . . . . . . . . . . . . Location of Major Ethnic Groups . 1963 . . . . . . ~dministrative Changes . . . . . . . . . . . . . . Population. Area and Densities by Provinces . 1& Population of Saigon . 1962 . . . . . . . . . . . . Vietnamese Residents Overseas by Country 1964-1965 Vietnamese Arriving and Departing 1964-1965 . . . . Foreigners Arriving and Departing 1960-1965 . . . . Civilian Employment by !L'ype of Activity . 1960 . . Employment in Plantations 1959-1963 ......... Employment in Government 1960-1965 . . . . . . . . Employment in Industrial and Commercial Establishments 1960-1964 . . . . . . . . . . . .
Estimated Daily Wages in Plantations 1961-1965 . . Estimated Daily Wages in Industrial and Commercial Establishments 1961-1965 . . . . . . . . . . . .
Rural Income Expenditure Sample Survey 1965 . . . . SECTION B . PRICES
B-1 Family Budget Survey in Saigon . 1963 . . . . . . . . . B-2 Consumer Price Index for Lower Income Families
in Saigon 1954-1965 . . . . . . . . . . . . . . . . . B-3 Retail Prices of Selected Commodities in Saigon .
Lower Income Families 1954-1965 . . . . . . . . . . . B-4 Consumer Price Index for Middle Inc~me Families
in Saigon 1954-1965 . . . . . . . . . . . . . . . . . B-5 Retail Prices of Selected Commodities in Saigon .
Middle Income Families 1954-1965 . . . . . . . . . . B-6 Wholesale Price Index in Saigon 1954-1965 . . . . . . . B-7 Import Prices: Wholesale Prices of Selected
U.S. Financed Imports 1963-1965 . . . . . . . . . . . SECTION C . FINANCE
Assets and Liabilities of National Bank of . . . . . . . . . . . . . . . . . Viet-Nm1957-1965 Assets and Liabilities of Commercial Banks of . . . . . . . . . . . . . . . . . Wet-Nam 1957-1965 . . . . . . . . . . . . . . . . Money Supply 1957-1965 Free Market Gold and Currency Prices 1957-1965 . . . . . . . . . . . . . . . . Saving Bank Activity f 957-1965 Clearing House Operations 1957-1965 . . . . . . . . . . GVN National Budget 1960-1966 ............. GVN Revenue Collections 1956-1965 ~~.~~~~~~~~
Page
SECTION D . FOREIGN TRADE
. . . . . . . . . . . . . . . Export Licensing 1960-1965 55 Export Shipments by Country of Destination 1954-1965 . . 57 Export Shipments by Major Commodity 1954-1965 . . . . . 59 Export Shipments by Commodity and by Country . 1965 . . 60 Commercial Import ~icenses . Summary 1960-1965 . . . . . 61 Commercial Import Arrivals . Summary 1960-1965 . . . . . 61 Commercial Import Licenses . U.S. Financed 1960-1965 . . 63 Commercial Import Licenses . GVN and Third Country . . . . . . . . . . . . . . . . . . Financed 1960-1965 66 Import Arrivals by Country of Origin 1954-1965 . . . . 67 Import Arrivals by Major Commodity 1956-1965 . . . . . . 69 Import Arrivals by Country and by Commodity . 1965 . . . 71 Import Arrivals by Type of Financing 1956-1965 . . . . . 73 Import Arrivals by Type of Financing and by Country . 1965 75 . . . . . . . . . . . . Balance of Payments 1958 . 1965 77 Gold and Foreign Exchange Reserves 1.955 . 1965 . . . . . 82
1 1 SECTION E . AGRIClJLTliRE Agricultural Production Index 1958-1965 . . . . . . . . 85 . . . . . . . . . . . . . . . Size of Rice Farms . 1960 87 Rice Cultivation and Production 1957-1966 . . . . . . . 89 Rice Production by Province 1963-1966 . . . . . . . . . 91 Rice . Domestic Shipments 1957-1965 . . . . . . . . . . 95 Rice . Stoc:ks in Saigon and in Delta Provinces 1960-1965 97 . . . . . . . . . . . . . . . . . . Rice Exports 1955-1965 99 Rice . Wholesale and Retail Prices in Saigon 1955-1965 . 99 . . . . . . . . . . . . . . Rubber Plantations 1957-1965 103 . . . . . . . . . . . . . . Rubber Production 1957-1965 103 Rubber . Yield per Hectare in Large Plantations 1957-1965 103 Rubber . Monthly Production in Large Plantations 1963-65 105 Rubber . Domestic Consumption and Stocks 1957-1965 . . . 105 . . . . . . . . . . . . . . . . Rubber Exports 1957-1965 109 Rubber Export Prices FOB Saigon 1958-1965 . . . . . . . 109 Rubber . Age of Plantations . . . . . . . . . . . . . . 109 Miscellaneous Crops . Area Cultivated 1959-1965 . . . . 111 Miscellaneous Crops . Production 1959-1965 . . . . . . . 113 Livestock and Poultry 1957-1965 . . . . . . . . . . . . 115 H ~ g s . . . . . . . . . . . . . . . . . . . . . . . . . . 115 Forestry . Estimated Area . 1957 . . . . . . . . . . . . 116 Forestry: Production, Arrivals at Saigon and Prices 1955-1965 . . . . . . . . . . . . . . . . . . . . . . 117 . . . . . . . . . . . . . . Fertilizer Imports 1957-1965 118
Fertilizers . Estimated Utilization in Viet-Nan 1963-64 118 Fisheries . Number of Fishermen and Fishing Boats . . . . . . . . . . . . . . . . . . . . . . 1963-1965 121 Fisheries . Total Catch & Processed Products 1963-1965 . 121 National Agricultural Credit Office 1954-1965 . . . . . 124
Page
SECTIGN 1" . INDUSTRY
. . . . . . . . . . Industr ia l P r~suc t ion Index 1963-1?65 130 Textile Industry 1960.1965 . . . . . . . . . . . . . . . . 133 Textile Incorts 1360-1-965 . . . . . . . . . . . . . . . . 135 Sugar Production and Processing 1-357-1965 . . . . . . . . 137 . . . . . . . . . . . . . . . . . Swar I m v r t s 1957-1365 137 . . . . . . . . Froduction i n Other Industries 1357-1365 133 Elec t r ic i ty Prx~uct ion 1957-1966 . . . . . . . . . . . . 142 Elec t r ic i ty ~msmlp t ion 1957-1965 . . . . . . . . . . . . 142 Construction . Buildin2 Permit Activity 1960-1965 . . . . 143 Petroleum Products . Imports 1955-1965 . . . . . . . . . 145 Petroleum Products . Civilian Sales 1955-1965 . . . . . . 145
SECTION G . TRAILSPORTATION AND C O ~ ~ I U N I C A T I O N
. . . . . . . . . . . . . . . . . . . . . G-1 Roads 1956-1964 149 G-2 Motw Vehicles 1956-1965 . . . . . . . . . . . . . . . . 149 . . . . . . . . . . . . . . G-3 Internal T r a n s p r t 1957-1965 151 G-4 International Transport 1957-1365 . . . . . . . . . . . . 151 . . . . . . . . . . . . . . . . G-5 Communications 1958-1965 153
SECTION H . U.S. ECONONIC A I D TO FBPUBLIC OF VIET-NCIM
Obligations and Loan Authorizations 1954-1965 . . Mans . Disbursements & Repaymeats 1956-1965 . . Commercial Import Program 1954-1965 . . . . . . . Food For Peace . Ti t le I: Agreements 1958-1966 . Food For Peace . Ti t l e I: Statue of US Treasury Food For Peace . Ti t l e I: Authorizations, License
Approvals and Payments 1958-1965 . . . . . . . Summary of Counterpart Fund and US-Omed Pias ter
A C C O ~ ~ ~ S 1954-1965 . . . . . . . . . . . . . . Counterpart Fund Operations 1954-1965 . . . . . . US-Owned Pias ter Accounts 1956-i965 . . . . . .
Map1 Indochinese Peninsula . . . . . . . . . . . . . . . . . . x Map 2 Major Soi l Regions . . . . . . . . . . . . . . . . . . . . x i i Map 3 Population Densities by Provinces ............. 4 . . . . . . . . . . . . . . . Map 4 Rice . Areas of Production 9 Map 5 Rubber -Areas of Production . . . . . . . . . . . . . . 104 Map 6 Tea. Coffee. Tobacco. Sugar-Cane and Coconuts . . . . . . . . . . . . . . . . . . . Areas of Production 112 Map 7 Fishing Harbors . . . . . . . . . . . . . . . . . . . . . 120
Page
CHARTS
Chart 1 Chart 2 Chart 3 Chart 4 Chart 5 Chart 6 Chart 7 Chart 8 Chart 9 . Chart 1 0 Chart 11 Chart 12 Chart 13 Chart 14 Chart 15 Chart 16 Chart 17 Chart 18 Chart 19 Chart 20 Chart 21 Chart 22 Chart 23 Chart 24
. . . . . . . . . . . . . . Economic Indica tors Consuner Pr ices . Lower Income Families . . . . Consumer Pr i ces . Middle Income Families . . . Consumer Pr i ces . Seasonal Pa t t e rn . . . . . . Money Supply . . . . . . . . . . . . . . . . . . Money Supply and Consumer Pr ices . . . . . . . Export Shiprnents . By C o u n t c 3f Destinat ion . Export Shipments . By Commodity . . . . . . . . Import Arr iva ls . By Commodity . . . . . . . . Import Arr iva ls ..By Country of Origin . . . . Import Arr iva ls . By Type of Financing . . . . Balance of Payments . . . . . . . . . . . . . . Estimated Size of Rice Farm i n 1360 . . . . . . Rice . Area under cu l t iva t ion and Production . Rice . Cul tu ra l Calendar . . . . . . . . . . . Rice and Brokens Exports . . . . . . . . . . . Rice . Wholesale and R e t a i l P r i ces i n Saigon . Rubber . Land under c u l t i v a t i o n and Production Rubber Exports . . . . . . . . . . . . . . . . I n d u s t r i a l Production Index . . . . . . . . . . . . . . . . . . . . Text i le Fabrics Production Text i le Imports . . . . . . . . . . . . . . . . U.S. Economic Aid t o Viet-Nam . . . . . . . . . Counterpart and US-@med P i a s t e r Accounts . . .
. VIII .
BACKGROUND * Geographp
h o protuberances purh routh i n t o the t r o p i c a l seas from the A8i.n continent . One of these 1s Ind ia and the o ther , the e a s t e m o s t one, is t h e Indochinese peninsula; t h i s includes Burma, Thailand and the r t a t e s of what was formerly French Indochina, and tapers off southward i n Malaya which is connected t o i t only by a narrow isthmus. The eas tern pa r t of the Indochinere peninsula is occupied today by t h e Kingdoms of Laor and Cambodia and t h e two Republics of Vietnam. Laos is a completely landlocked nation occupying the middle reaches of the Mekong River, hemmed i n on the eaat by t h e Vietnam and on t h e routh by Cambodia and Thailand; t h e Lao t ima a r e of revera l races, most of them speaking Thai d i a l e c t s . Cambodia is inhabited by Khmers who have been i n occupation of t h e lower reacher of the Mekong River f o r many centur ies . They have a coas t l ine on t h e Gulf of Slam but a r e separated from the China Sea t o the e a s t by the Bepublic of South Vietntm, which, becauae t h e Yekong turn. e a a t t o empty i n t o t h e China Sea, con t ro l r the mouth of t h e r i v e r .
Although t h e t h r e e peoples, having j o i n t l y experienced French occupation, have t h e i r second language i n common m d have s imi la r adminir t ra t ive m d academic i n r t i t u t i o n s , the con t raa t r i n t h e i r cul ture6 a r e immediately apparent. The Vietnameae der ive t h e i r c u l t u r e from China. They p r a c t i s e a Chineae v a r i e t y of Buddhiam; they #peak a language i n which many tenns a r e derived from Chinere, i n a fashion a imi lar t o the re la t ionsh ip between English and French: they wrote t h e i r language i n Chinese charactera u n t i l t h e adoption of the western alphabet; they a r e much more a imi lar t o the Chineae i n f a c i a l appearance and body build than t h e i r neighbors. The Laos and t h e Khmer. on the o the r hand b r a c t i r e the aame v a r i e t y of Buddhism found i n Burma and Ceylon, w r i t e i n alphabeta derived f r a Ind ia m d , i n t h e r u r a l a rea r l i v e i n houses b u i l t on stilts i n c o n t r a r t to the Vietnameae who build t h e i r houses on t h e ground. This l a s t oharacter- i r t i c is s o noticeable t h a t on a t l e a a t ane occaaion t h e boundary between Vietnam m d Lao6 ram f ixed by t h i s f ea tu re . I n shor t , t h e f r o n t i e r between Vietnam and it. neighbor6 is a r e a l c u l t u r a l b a r r i e r , a t r u e a p l i t between Xndiln m d Chinese c u l t u r a l influencea.
The noma1 way f o r a Vietnameae peaaant t o bring h i s produce t o the market i r to divide t h e load inao two baaketfuls and then place mach a t the end of a bamboo pole r e r t i n g on him shoulder. The geogravhy of t h e two Republics of Vietnam ham been of ten compared t o mch a load of rice, for the a rea conaia t r e r a e n t i a l l y of two f e r t i l e , intensively cu l t iva ted r i v e r d e l t a s j o h e d by a long s t r i p of c o a s t l i n e m d sparsely inhabited h ighlmd. The northern d e l t a l a t h a t of the Red River m d t h a t i n the routh war b u i l t by the Yekong. The Geneva armistice accord s p l i t t h e country i n two, i n e f f e c t aevering t h e bamboo pole close t o its middle, ao t h a t the Red River d e l t a and i t 6 half of the connecting coar t l i n e i r under Caarmunirt control .
South Vietnam cons i s t s of aeveral r a t h e r w e l l defined regions. Saigon i n located near t h e nor th end of the Yekong d e l t a , about twenty miles both from t h e aea (it is a por t thmks to a meandering but deep r iver) and near
* These notes w e r e wr i t t en by M r . Newton B. Knox of the In te rna t iona l Statistical Program Office, Bureau of the Census who served on the USOM r t a f f a s General S t a t i r t i c a l Adviror to the Government of Vietnam (June 1963).
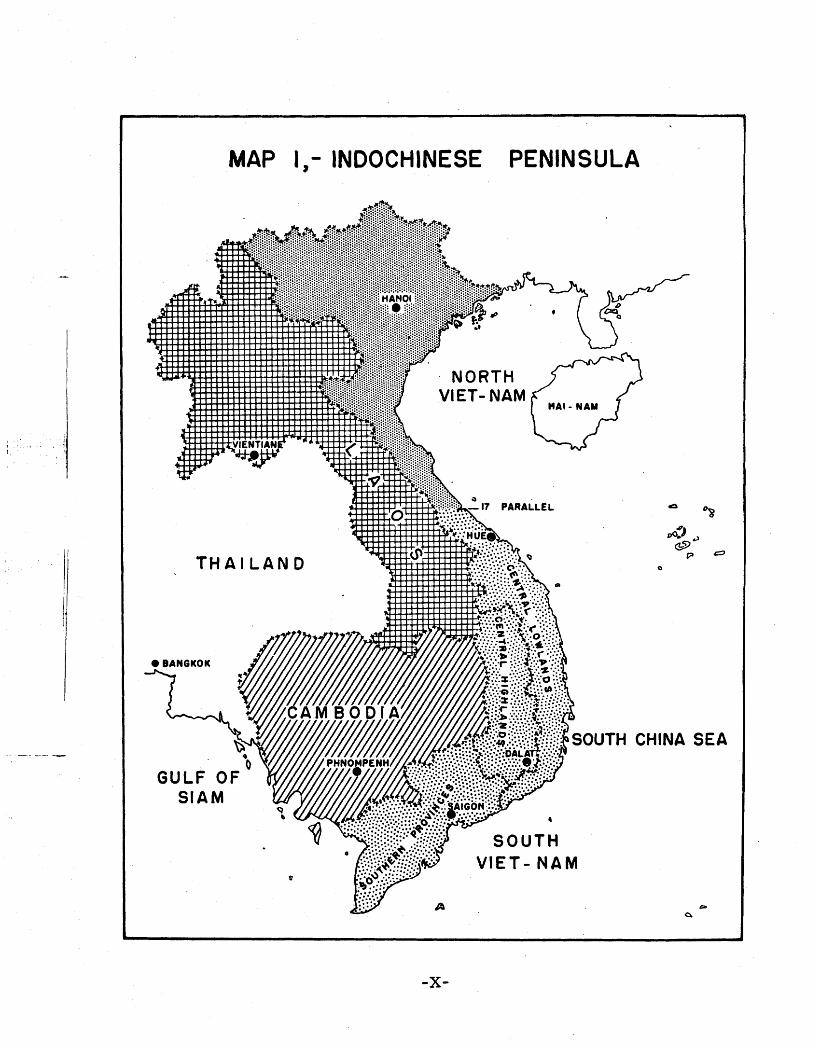
MAP I ,- INDOCHINESE PENINSULA
T H A I L A N D
SEA
CI
,
the h i l l s t o the north t h a t mark the beginning of t he Highlands. The Highlands cons t i tu te a l l of South Vietnam north of Saigon except f o r the coas ta l area, which cons i s t s of a ae r ies of broad val leys cu t i n t o t he mountains by the drainage t o the ocean. These val leys a re in tensively cul t ivated i n r i c e and, pa r t i cu la r ly , four o r f i v e hundred miles north of Saigon where Laos crowds t he Vietnamese border c lose t o t he China sea, a r e extensive enough t o displace the Highlands. Thus, i n e f f ec t , Vietnam north of Saigon cons i s t s of a h i l l y region with a l t i t udes of about 3,000 f e e t in ter rupted along the coast by funnel shaped a l l u v i a l val leys which i n turn a re connected by ra i l road and highway. The lower, southern par t of the h i l l y region is dotted with great rubber plantations. To the north, on higher ground, a r e the t e a plantat ions, but the Highlands north of the h i l l s t a t i on of Dalat, e ight hours dr ive north of Saigon, is a sparsely inhabited malarial region kept f o r decades a s a game refuge and t h e reservation of the indigenous Highlanders, who preceded the Vietnamese i n the occupation of t he area. Many of the coasta l val leys mpport toms of some importance. Tourane with its protected bay w r s t&e f i r s t c i t y occupied by the French and Hue, t o the north of it, was t h e s e a t of t he l a s t Vietnamese empire.
The Mekong d e l t a cons t i tu tes a l l of Vietnam south and e a s t of Saigon and, except f o r an i so la ted knob t ha t rises unexpectedly near t h e Cambodia border; it is t h e r i v e r s ra the r than t he h i l l s t h a t form the outstanding fea tu res of
I I t h e landscape. The region is traversed by t he variouu branches of the Mekong
which divide it i n t o th ree na tu ra l regions: t h e pa r t between the Mekong and t he Highlands i n which Baigon is located (Mytho, t he por t on t h e Mekong, is about 40 miles f r oa 8aigon); the pa r t betreen the northern branch of the Mekong and the southern one knom a s t h e Basrac, ( t h i e area, i n t r u t h an i s l and , i s t h e most heavily populated ru r a l region i n South Vietnam) and t he Trans- Bassac, a group of provinces ly ing between the B8ssac and t he Gulf of Siam. This area is one r e l a t i ve ly recently occupied by the Vietnamese and con t ras t s
I1 with t he other two i n the f a c t t h a t , whereas north of t he Barsac landholdings a r e m a l l , generally in tensively worked by t he amer, under i r r i g a t i o n and
/ 1 rupporting a dense population, i n t he Trans-Barsac holdings a r e extensive,
I worked by sh8re croppers 8nd lacking i n t h e typ ica l rice paddy lweer t h a t I permit control led flooding.
Administrative H i s t o q
The V i e t n m s e h8ve been organlaad thrarghout recorded h i s to ry i n t o groups of furilier or ig ina l ly luu ln iment of c lanr , c8ll.d by thetm"Xa'; which has bean t rans la ted by the French i n t o "vi l l rgaU and by t h iu writer i n t o "~Cnmrhip".
Tha h i r t o ry of Vietnam has one p r r a l l e l to t h a t of t he United S t a t e r . I t i r one of cantinuour migration, only it was 8outh-d a l m g the coast, away f r a China, t h e o r i g ina l h a e l a n d of t he Vietr. V i e t n a m re8nr Sauth V i e t r and p r e m u b l y t he descendants of t he North Vietr are still i n China; the South Vietr had 8lre8dy l o s t contact with the North Vietr 8nd er t8bl i rh .d theaselver la what i r now North Vietnam ovar 2,OW years ago. The r i g r a t i on continued f r a that t ire u n t i l t h e prorent day, f o r t h e routhem, rort t i p of t h e country
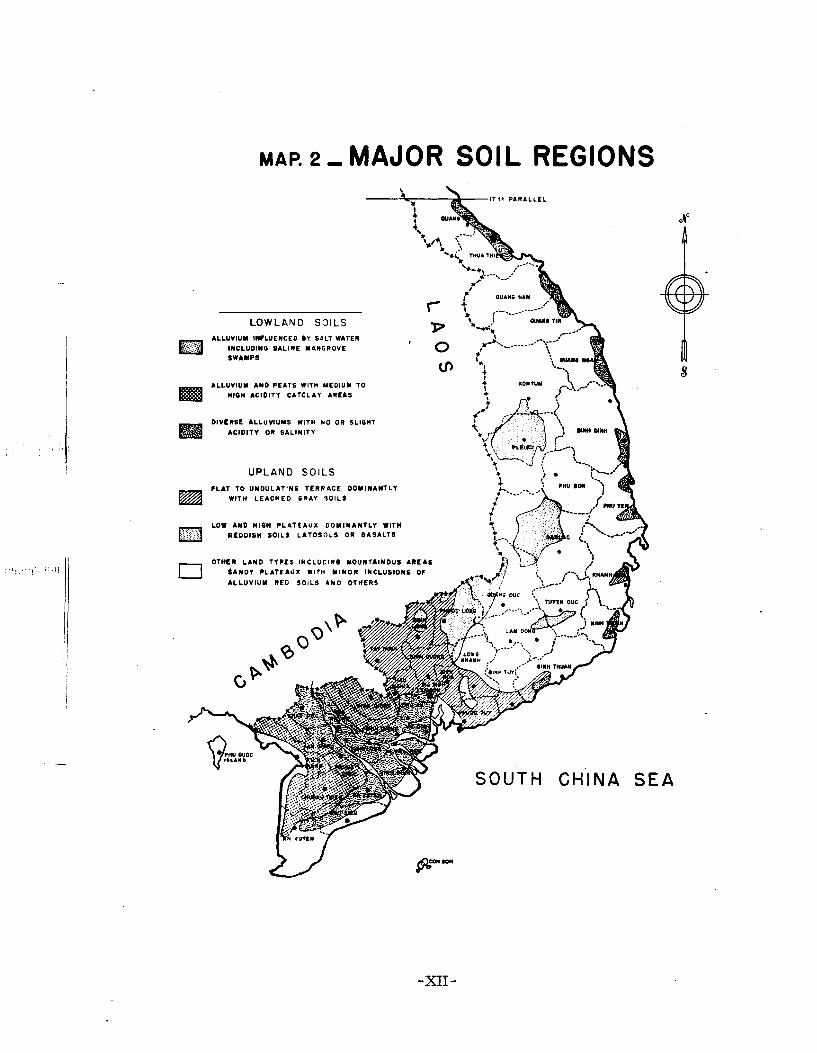
MAP. 2, MAJOR SOIL REGIONS
L O W L A N D S O I L S ALLUVIUM INFLUENCED BY SALT WATER
INCLUDIMO SALINE MANGROVE SWAMPS
LLLUVIUM AND PEATS w m n MEDIUM TO HlOH ACIDITY CATCLAY AREAS
DIVERSE ALLUVIUMS WITH k O OR SLlQHT ACID ITY OR SALIN ITY
U P L A N D S O I L S
FLAT TO UMDULATING TERRACE DOMINANTLY
w m n L E A C H E D G R A Y S O I L S
LOW AND nlen P L n r r u x DOMINLNTLY wwn n REDDISH SOILS LATOSOLS OR BASALT8
was only s e t t l e d by Vietnamese, with a large admixture of Cantonese and Fukienese, within the l a s t generations. This movement has displaced former inhabi tants of both Polynesian and Khmer r a c i a l groups, who have sought refuge i n the h i l l s , where they have become Vietnam's unassimilated highland tribesmen. But the Vietnamese migration was commonly i n l a rge groups r a t h e r than small f ami l i e s o r individuals . Often e n t i r e Tomships f inding themselves hemmed i n by t h e i r neighbors, would move south. This occurred abundantly, under the leadership of Catholic par ish p r i e s t s , a f t e r the p a r t i t i o n of Vietnam i n 1954.
The Emperors of Vietnam were, except f o r severa l periods of rebel l ion , vassa l s of t h e Emperor of China (some times i n f a c t , a t o the r s i n name only) and, while t ry ing t o maintain the continuity of t h e i r om dynasties, they followed t h e Chinese aystem of avoiding the crea t ion of a heredi tary feudal aris tocracy. The mandarinate was chosen by v r i t t e n examination and was divided i n t o two branches: m i l i t a r y and c i v i l , t h i s l a s t f u l f i l l i n g t h e twin functions of cour t i e r and administrator. Prordtion was by Imperial Decree and, on t h e death of a mandarin, h i s t i t les, pr iv i leges and worldly possessions reverted t o t h e Emperor, who, however, could confer a l a s t grea t boon by d i n g him the t u t e l a r y d e i t y of a tomship , an honor which was e t e r n a l , provided t h e Tomship continued t o be loyal and pay i t a taxes.
The French entered Vietnam i n t h e second half of t h e nineteenth Century on the heels of t h e missionaries and t h e i r penetrat ion w a s a long dram out a f f a i r receiving amazingly l i t t l e support from the French eovernment. During t h e i r occupation the French found it convenient t o divide Vietnam i n t o th ree areas ; Tonkin, embracing the d e l t a of t h e Red River i n the North, Cochin- china, conmisting of t h e d e l t a of t h e Mekong i n t h e South, and Annam t h e long coas t l i n e i n between, where t h e French p e r a i t t e d t h e Emperora to continue t o re ign a t their ancient c a p i t a l of Hue. The French took se r ious ly t h e i r "miasion c i v i l i s a t r i c e n and propagated t h e i r f a i t h , hilt schools and highwaya, organized rubber and t ea p lanta t ions , hilt cities well shaded by trees and gradually, beginning with t h e appointment of advisors, converted t h e rrmdarinate i n t o a c i v i l service. This c i v i l se rv ice eventually developed i n t o somewhat of a plum f o r many French funct ionar ies and most of t h e Vietnamese found themselves i n t h e lwer ranks, but t h e French gave the Vietnamese good educational oppor tuni t ies both in Vietnam and i n France; they developed close f r iendships and o f ten intermarried with them, with t h e r e s u l t thmt today, i n con t ras t t o Indaam8i8, olocre 8nd f r i end ly tie8 exist betreon the Vietnamese 8nd the former "eoloni8li8t8".
TEo last p a r 8 of French r u l e rere time8 of war and turroil. The Vichy ?runch coloni81 a u t h o r i t i e s 8cwpted J 8 ~ 8 n e 8 e occuP8tion hat the om8ruru8 of w a r mom brought the Japneme, the Wenoh and meveral Vietnamese group8 i n t o c o n f l i c t 8nd. obor t ly mfter t h e carntn -8 l i b e r a t e d by R r i t i s h troops, a o n f l i c t developed in to terrorism and terrorlam i n t o open war between the Frencb and the V i e t - M i n h , t h e Vietnamese underground independence movement. The b a t t l e of Dien Bien Phu brought about both a f i n a l de fea t of French a r a i e s and a a p l i t between t h e Comnunist and non-Coamrunist wings of the Viet-Minh. The Geneva Araistice Agreement signed on J u l y 20, 1954 divided Vietnam and provided f o r s h i f t 8 i n the population.
However, parer i n t h e southern p a r t of Vietnam was divided between armies supported r e spec t ive ly by two Cao Dai r e l i g i o u s groups, t h e Binh-Xuyen syndica te of gamblers, t h e Emperor, t h e Hoa Hao r e l i g i o u s f a c t i o n s and a Cathol ic bishop. Eventual ly, a f t e r f i g h t i n g both i n t h e country and i n Saigon, a h i t h e r t o n e u t r a l p o l i t i c i a n Ngo-Dinh-Diem, succeeded i n u n i t i n g t h e country and e s t a b l i s h i n g a republican.government. H e was confirmed i n power i n an e l e c t i o n undertaken i n October 1955, wnich i n e f f e c t deposed t h e Emperor.
For over two thousand years , u n t i l f i r s t t h e French and then t h e cu r ren t regime decided it could not t o l e r a t e Communist i n sp i r ed Tomship a u t h o r i t i e s
- and made t h e o f f i c e s appoint ive, t h e r u l i n g counci l s of t h e Tomships had been e l e c t e d by t h e members, c o n s t i t u t i n g a very anc ient but genuine t r a d i t i o n i n democracy. The Townships were t h e primary p o l i t i c a l u n i t s of Vietnam and t h e Emperors, a s w e l l a s t he French, contented themselves genera l ly with p e w i t t i n g
I t h e Tomships t o run t h e i r o m a f f a i r s , but mnking them ( r a t h e r than t h e I canponent indiv iduals ) respons ib le f o r t h e c o l l e c t i o n of t a x e s and t h e recrui tment of
l abor f o r roads, canals, f lood con t ro l measures and defense. The Townships, many of which today number upto 10,000 people, were con t ro l l ed by t h e Emperors I by means of n l i g i o u s pressure. Each Township had a t u t e l a r y d e i t y , o f t e n 1 an ances tor o r c u l t u r e hero from t h e p a s t , but each m e wae o f f i c i a l l y d e i f i e d by t h e Emperor of V i e t n m i n h i s capaci ty of C e l e s t i a l Overlord and could i n e f f e c t be deposed by t h e Emperor i n case t h e Township misbehaved;
1 t h i s was considered t o be a g r e a t calamity.
Thus t h e connection between t h e Emperor and the ind iv idua l members of t h e Tomship w a s a tenuous one and under t h e Republic was being gradual ly modified i n t o a more d i r e c t r e l a t ionsh ip . Th i s t r a n s i t i o n has made t h i s t h e weakest l i n k i n t h e whole Vietnamese s o c i o - p o l i t i c a l f a b r i c and it was p rec i se ly a t
, I / I t h i s poin t t h a t t h e Communists sought t o introduce a d e s t m c t i v e wedge, with
enough success t h a t r u r a l s e c u r i t y condi t ions d e t e r i o r a t e d s e r i o u s l y i n 1960, A s a matter of f a c t it was found t h a t t h e only way t o r e e s t a b l i s h t h e confidence
I I
of t h e r u r a l populat ion i n t h e government was t o permit tnu reestabl ishment of e l e c t e d o f f i c i a l s and f o s t e r t h e development of l o c a l self-defense measures. I t was discovered t h a t t h e Townships had grown t o o l a r g e t o f a c i l i t a t e t h e s e processes , so i n 1962, i n e f f e c t , t h e a t t r i b u t e s of t h e o l d Townships were
1 conferred upon hamlets of which usual ly between f o u r and e i g h t go to make up a Township. These hamlets, once organized f o r l o c a l defense aga ins t canmunist
** terrorists and permit ted t o elect t h e i r e l d e r s , were known a s s t r a t e g i c hamlets" By t h e end of t h e f i r s t year of t h e program, A p r i l 1963, 6,000 such hamlets had been e s t ab l i shed . More recent tires have seen a tendency f o r increased
- - emphasis on the r o l e of t h e Tomships , although hamlets are sti l l t h e smallest u n i t e concerned wi th s e c u r i t y and defense problems.
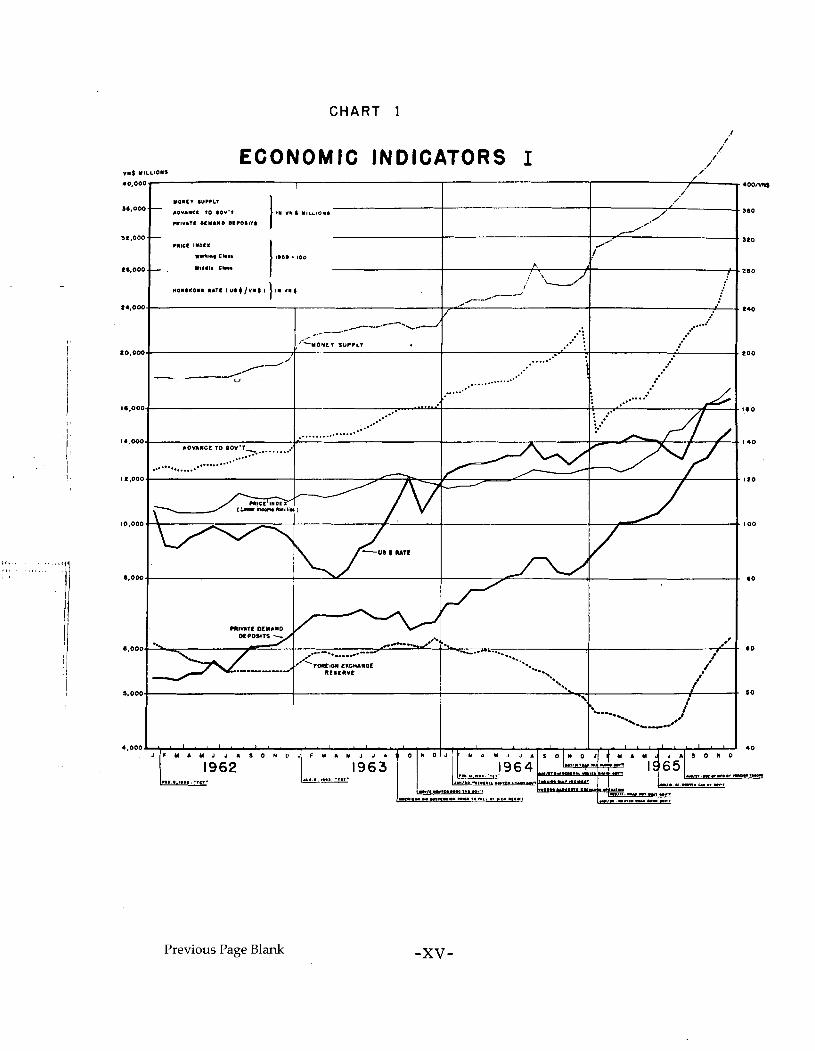
CHART 1 I
/'
v"$ l l L L l O l S
ECONOMIC INDICATORS I .0.00
S 6 . 0 0
32.001
t8 .001
1 4 . 0 0
tO.Oo(
1. .OO(
14.00C
1 t .OOC
10.00c
8 , O W
6,OOC
e, o o a
4 . 0 0 0
Previous Page Blank
SECTION - A
POPULATION & LABOR
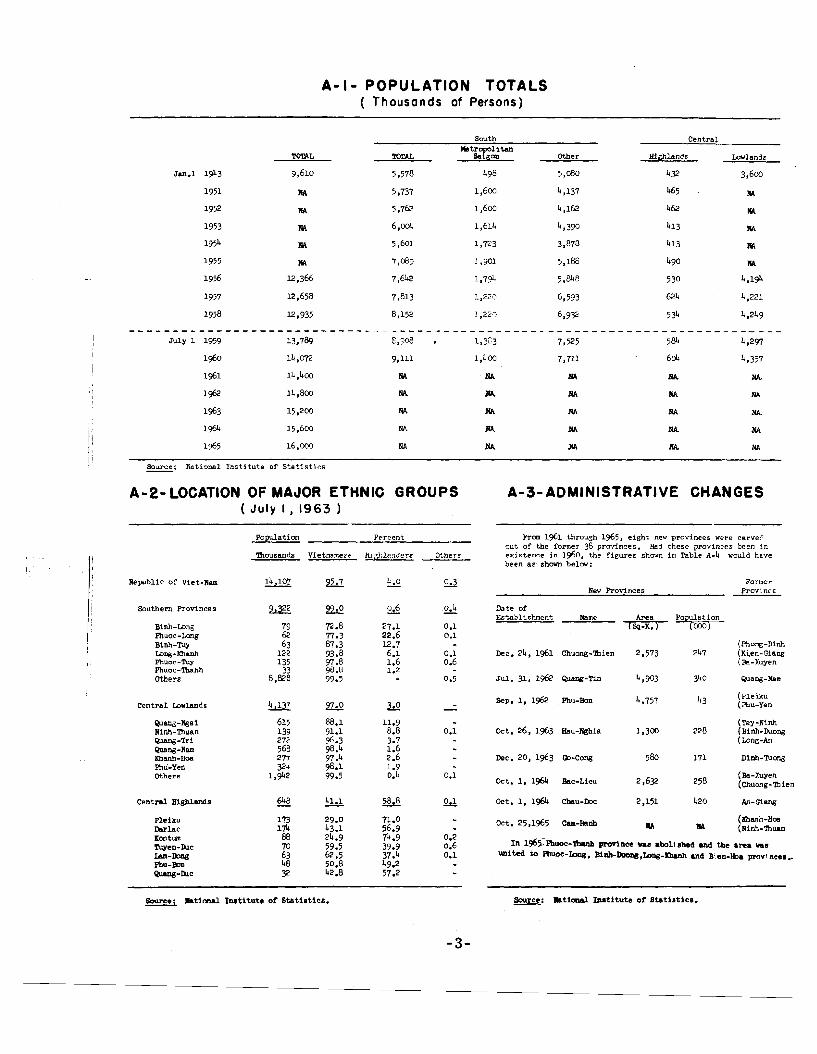
In Vietnam, each person must, according t o law, r e g i s t e r himself and the m e m b e r s of h i s bousehold a t the loca l pol ice s t a t i o n . Each bousehold is required- keep i t s r e g i s t r a t i o n up t o date. Because such updating of ten l ags behind t h e pol ice a t i r r e g u l a r i n t e r v a l s conduct a r e - reg i s t ra t ion . Thus, t h e accuracy of the data va r ies according t o the date of the l a s t re- r e g i s t r a t i o n . The summation of these data a r e the f igures shown here through
- 1958, with the exception of Saigon which is discussed below.
I n 1959, the NIS c i rcu la r i zed the l o c a l a u t h o r i t i e s t o obta in a more up-to-date l i r t i n g of a11 townships f o r use i n a planned General Census of Population. Althaugh the Census was never taken because of poor secur i ty conditions, t h i s preparatory work provided a saewha t more accurate est imate of population f o r 1959, and a basis f o r r e f in ing r e g i s t r a t i o n data i n f u t u r e
I
I years. A rpec ia l e f f o r t was u d e to ad jus t a11 data f o r 1960 t o a given t i m e period, and it i r f e l t that t h e 1960 data a r e a f a i r l y good est imate
I of the population. With a de te r io ra t ion i n secur i ty , however, r e g i s t r a t i o n 1 data a r e becoming more and more incomplete. From 1961 on, f i g u r e s a r e an
ext rapola t ion of t h e 1960 t o t a l using an est imate of about 2.8% growth per year. This estimated growth r a t e is t h e r e s u l t of a Population Increase Survey conducted 1 by the NIS i n 1961. Data shown i n Table A-1 a r e extrapolated f i g u r e r f o r the population of t h e e n t i r e area of Republic of Vietnam including V.C. a reas while thore i n Table A-4 a r e reported by the province chiefs .
For t h e Saigon Metropolitan Are8,trends d i f f e r from the rest of the country. During t h e war and a f t e r p a r t i t i o n , u n y people moved t o t h e new c a p i t a l . Since r e g i s t r a t i o n war d i f f i c u l t t h e data through 1957 a r e l i t t l e more than guerres. I n 1958, the MIS conducted i t 6 f i r r t sample survey and came up with an es- t i u t e of 1.2 r i l l i o n , which seers rearonable r ince mlny Saigon refugees had by then been remettled elsewhere. I n 1962, t h e NIS conducted i ts eecoad sample nrrvey of the population of Saigon and c u e up with the to t81 of 1.4 mil l ion. Thum t h e growth r a t e f o r the 1958 - 1962 period was about 4%.
I I I n January 1965 t h e DOXIADIS Ammocirter - Consultants on Development and i Xkimticm prep8red f o r the Government of V i e t - N . r a Development Program and
Plan f o r Saigon Metropolitan Area. According t o t h e i r r epor t the population of the Saigon Metropolitan a rea i n 1958 and 1965 war 1.8 mil l ion and 2.4 rillioa respect ively
Only data f o r Vietnueme and Highlanderr a r e sham; Cubodianm and Lrotimm being of minority c o n u n i t i e r a r e grauped under "0thermW . Although t h e r e are a l a r g e number of people of Chinese o r ig in , momtly i n Cholon, thore who hrve t a m Vie tnuesb citizenmhip a r e reg i s t e red a8 V i e t n o e m .
A- I - POPULATION TOTALS ( Thousands of Persons)
South Central
T m "tLG2" ~ m . 1 1943 9,610
1951 l?A
1952 IW
1953 RR
1954 RR
1955 RR
1956 12,366
1957 12,658
1958 12,935
- - - - - - - - - - - - - - - - - - - - - - - - - - - - July 1 1959 13.789
1960 1 4 , W
1961 1L,400
1962 14,800
1963 15,200
1W 15,600
1965 1 6 , m
Source: k t i m a l I n s t i t u t e of S t a t i s t i c s - A-2- LOCATION OF MAJOR ETHNIC GROUPS
( July 1 , 1963 1
Population Percent.
Zhousands Vietnamese Hlghlenbers Other:
Southern Provinces 2 ~ 2 2 - 0.6 .0.4 - Binh-Long Phuoc-Long Binh-Tq Long-Khanh Phuoc-Tuy F'huoc-Tnanh Gthers
Central L a l a n d s u 97.0 2s Q w - H g a i 615 88.1 11.9 linh-Zhuan 91.1 8.8 0.1 9uang-Tri 275 139 96.3 3.7 Quang-Nam 568 98.4 1.6 l(hanh-Hoa 277 97.4 2.6 Phu-Yen 324 98.1 1.9 Others 1 - 9 2 99.5 O.L 0.1
Central Jiighlands 648 - 41.1 - 58.8 Ed
Pleiku Kmrlac w t u m W e n - k c --mns Phu-Ban Q.ng-mc
A-3-ADMINISTRATIVE CHANGES
Rw 1961 through 1965, e igh t new provinces were carve6 out of the forner 36 provinces. Hsd these provinces been ir. existence in 1960, the f igures shum i n Table A-4 v o d d have been a s s h m belw:
Forner New Provinces Provlnce
Date of Establishment Wme P o p y l ; o n
4,757 (Pleiku "3 (mu-yen
Source: lhtiond I n s t i t u t e of S t a t i r t i c r . -
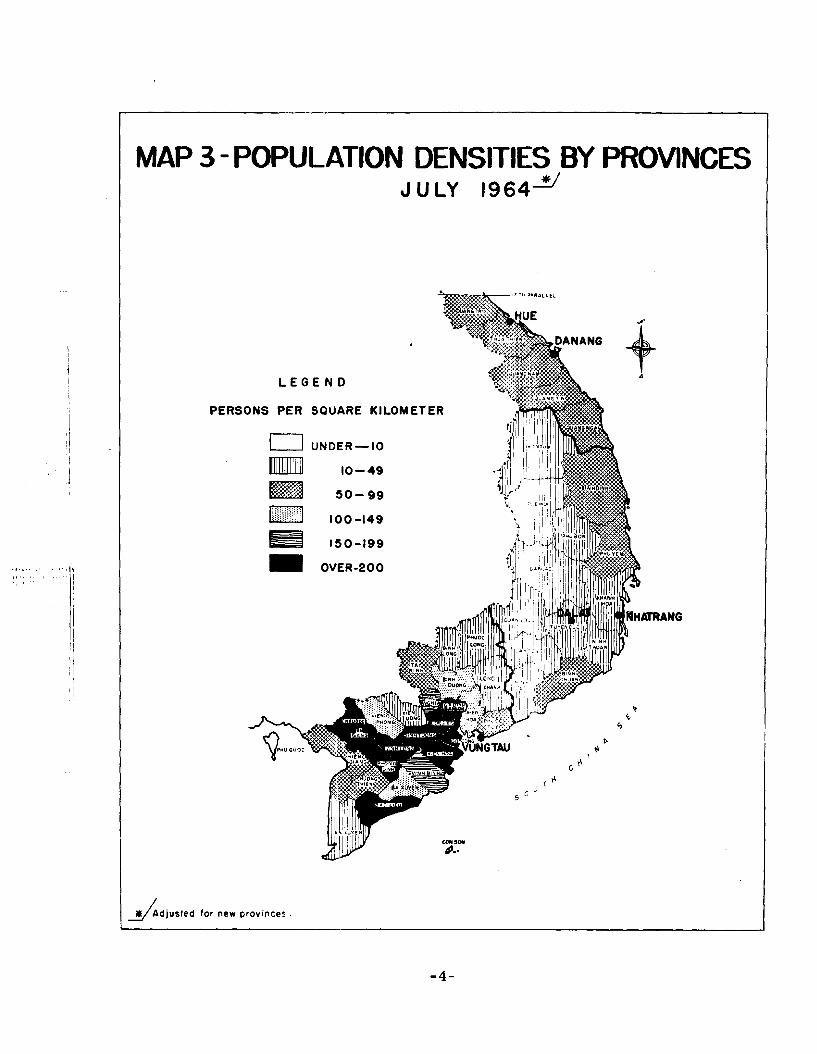
MAP 3 - POPULATION DENSITIES BY PROVINCES JULY 1964 M
L E G E N D
PERSONS PER SQUARE KILOMETER
0 UNDER-I0
10-49
5 0 - 9 9 1.1
100 -149
150-199
OVER-LOO
_t/,djusled for new provinces
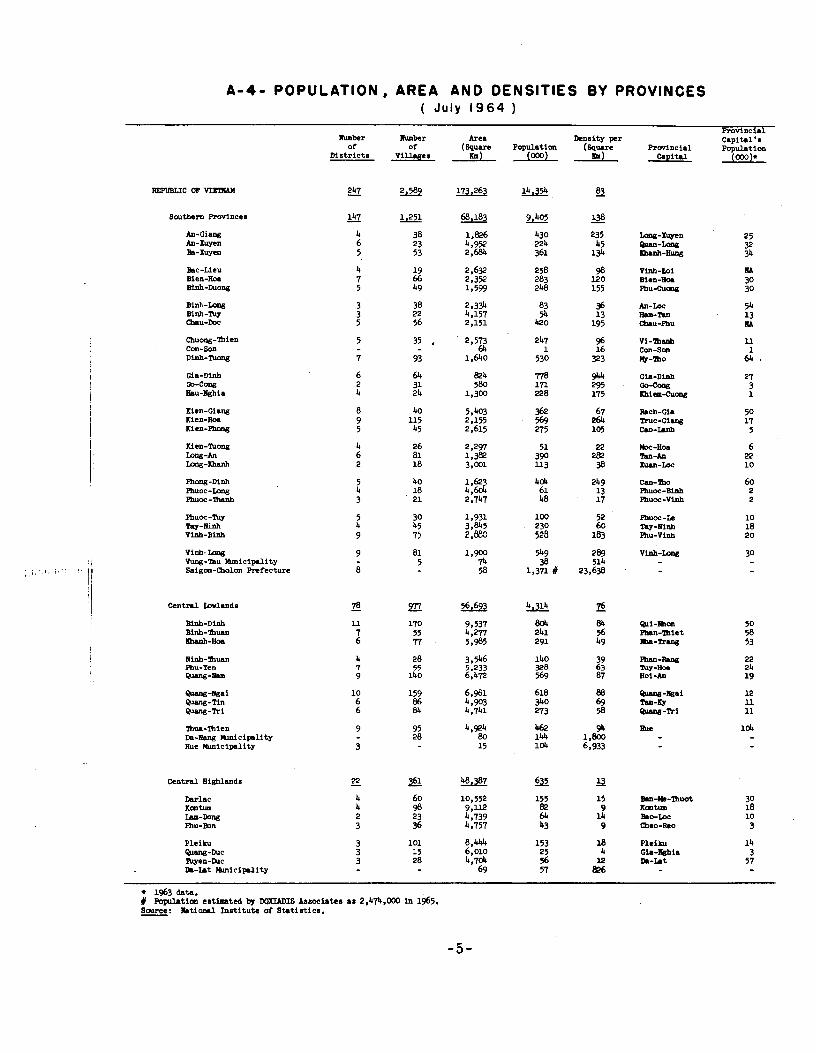
A - 4 - POPULATION, AREA AND DENSITIES BY PROVINCES ( July 1964 )
Southern Provinces
An-Ciang An-Wen Ba-Weu
a - l c m g Binh-Tuy mu-roc
muong-mien Con-Son Dm-Tuong
Central Iorlands
!lhur-mien Da-Bang Mmiciplity Hue Mmiciplity
Central Highlands
Rumber Of
Districts
247 - 147 -
4 6 5
4 7 5
3 3 5
5
7
6 2 4
8 9 5
4 6 2
5 4 3
5 4 9
9
8
78 - ll 7 6
4 7 9
10 6 6
9
3
22 - 4 4 2 3
3 3 3
lhlmkr Of
villages
* 1.251
38 23 53
19 €6 49
38 22 56
35 , 93
64 31 24
40 l l 5 45
26 81 18
40 18 21
30 45 75
81 5
170 55 n 28 55
140
159 86 84
95 28
&L 60 98
9 101 15 28
Area
2&r 173.263
68,183
1,826 4,952 2,684
2,632 2,352 1,599
2,334 4,157 2,151
2,573 64
1,640
824 580
1,300
5,403 2,155 2,615
2,297 1,382 3,001
1,623
::% 1,931 3,845 2 ,%0
1,900 74 58
g,& 9,537 4,277 5,985
2% 6,4R
6,981 4,903 4,741
4,924 80 15
10,552 9,- 4,739 4,757
8,444 6,010 4,704
69
Population l E L
9.405 430 224 361
258 283 248
83 54
420
247 1
530
778 in 228
362 569 275
51 390 U 3
404 61 48
100 230 528
549 38
1,371 #
w 804 241 291
140 328 569
618 340 273
462 144 104
532 155 82 64 43
153 25 56 57
Density per
23.z 4
138 - 235
45 134
98 120 155
% 13
195
2 323
su, 295 175
67 264 105
22 282 38
249 13 17
52 60 183
289 514
23,638
76 - 84 56 49
39 63 87
88
3 94
1,800 6,933
Y 15 9
14 9
18 4
12 626
Provlnc i a l Capital's Population xs!?L
25 32 34
M 30 30
54 13 M
11 1
64 3
27 3 1
50 17 5
6 22 10
60 2 2
10 18 20
30
+ 1963 data. Y Popul~tica c s t h t e d by DPXIADIS Associates as 2,474,000 in 1965. Sauce: H a t i d Institute of Statistics. -
-5 -
The National I n s t i t u t e of S t a t i s t i c s conducted a meccmd a m p l e survey of the population of Saigon i n June 1962 following the f i rmt one taken i n J u l y 1958. The resultm of the survey were publimhed i n French only.
S ize of sample
The c i t y was divided i n t o blockm and sub-blocks. Blockm which involved gardens, public buildings l i k e schools, camems and hosp i t a l s were eliminated. Of t h e remainder, one block out of 5 was se lec ted for enumeration. Due a t t e n t i o n ram given t o d i s t r i b u t i n g the melected blocks properly mo t h a t working-class
I a reas , c m e r c i a l d i s t r i c t s , etc. were represented.
' i Other da ta obtained i n the murvey I
Besides t h e da ta on population by age, sex, n a t i o n a l i t y , r e l i g i o n and a b i l i t y of reading and wr i t ing , t h e rurvey covers da ta , not premented here , on languages apoken, education, occupation and employment.
Na t iona l i ty
Individuals of mixed Chinese and Vietnamese ancestry a r e considered Vietnameme unlems they register a s Chinsse,
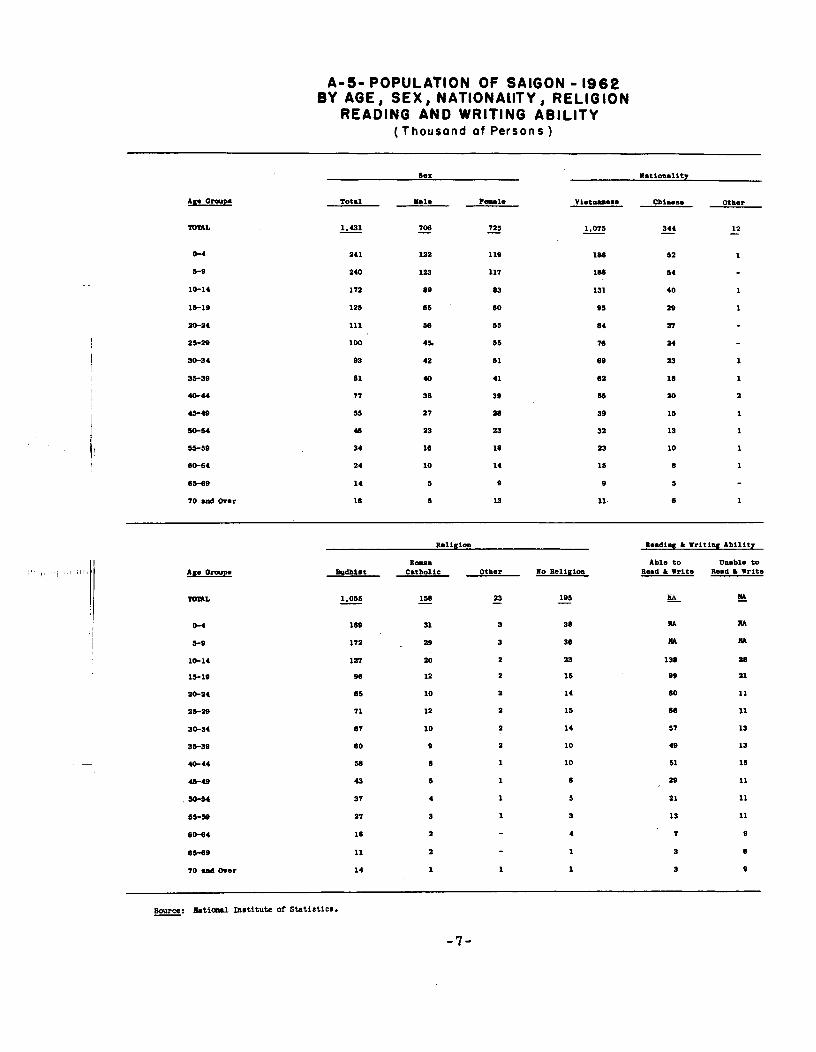
A-5- POPULATION OF SAIGON - 1962 BY AGE, SEX, NATIONALITY, RELlG ION
READING AND WRITING ABILITY (Thousand af Persons )
Am Gmpn
m L
0-4
5-9
10-14
15-19
m a 4
25-28
30-34
35-39
40-44
45-49
50-54
55-59
80-84
85-89
70 8nd Over
vietDYene
1,075 -
loo
loo
131
95
84
78
69
82
55
39
32
13
15
9
11
Other
12 -
1
1
1
1
1
2
1
1
1
1
1
Beligion Pending k Writing Abili ty
Age Ompm B Q . ~ Able t o Unnble t o
mdhimt Cntholic Other Ilo Beligion Bend k Write Bend k Write
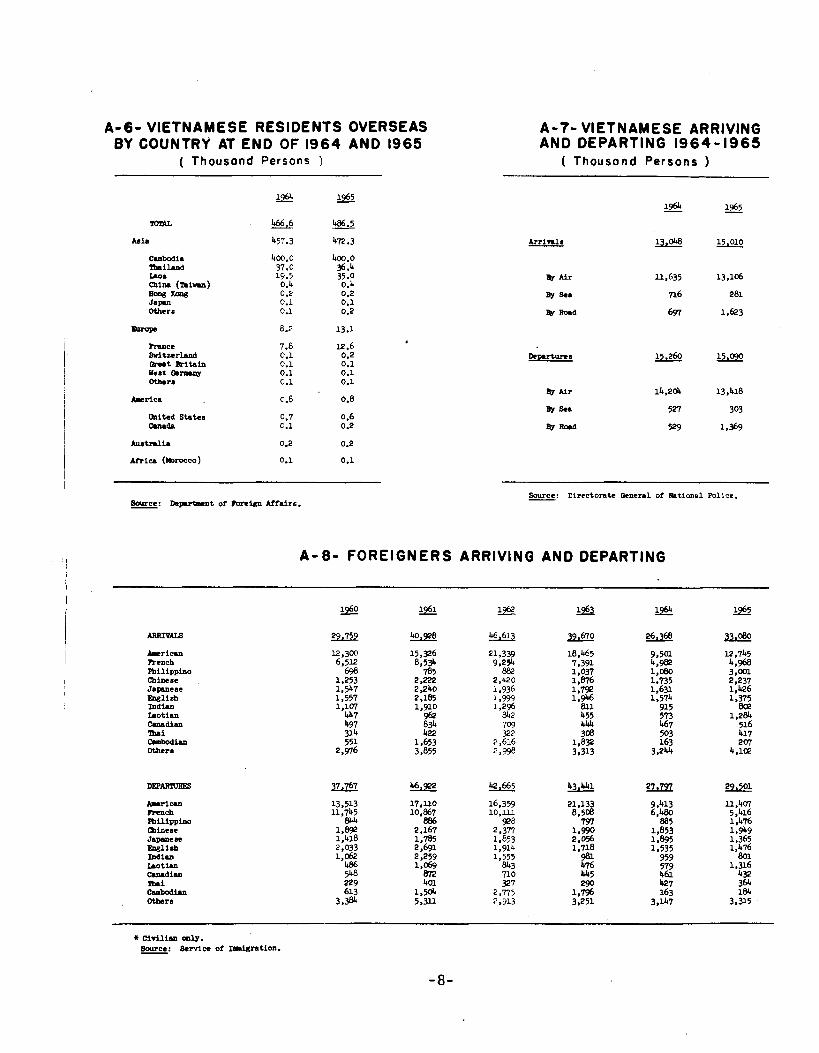
A-6- VlET NAMESE RESIDENTS OVERSEAS BY COUNTRY AT END OF 1964 AND 1965
( Thousond Persons )
A-7- VIETNAMESE ARRIVING AND DEPARTING 1964-1965
( Thousond Persons )
Cambodia 400.0 400.0 l t n i h d 37.0 36.4 Laos 19.5 35.0 chi= (mi-) 0.4 0.4 Eons w 0.2 0.2 J.pur 0.1 0.1 Othera 0.1 0.2
Prance S v i t r c r h d Qut Britain West O c m Others
America 0.8 0.8
United States a&
Source: Directorate General of Rational Police. - Bnuce: D e w n t of Toretan Affairs. -
A-8- FOREIGNERS ARRIVING AND DEPARTING
ARRIVALS
kcr ican bench milippino Cnimae Japanese %li6h Indian Laotian Canadian 'lhi Cubodian Others
DEPmlmm
CIVILIAN E3IPLODrnT
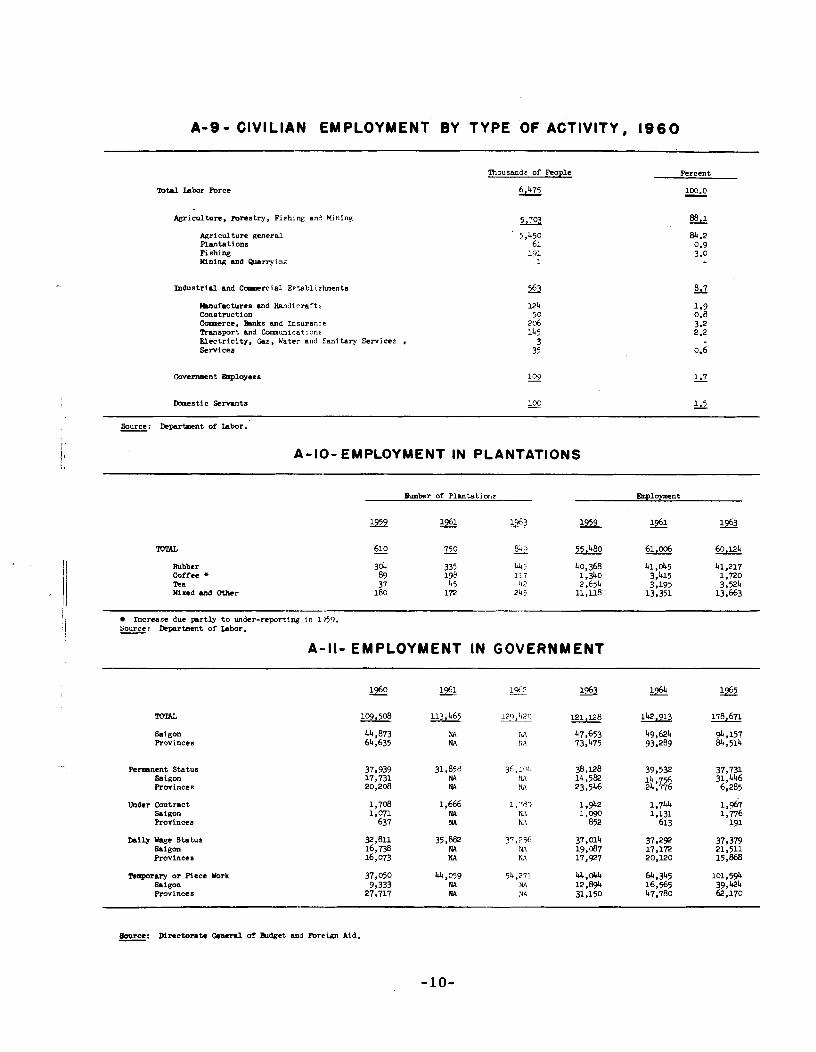
Civi l ian hployment by type of Activity
This i s a summation of the r e su l t s of the 1960 establishment surveys plus estimates of employment outside establishments, including agriculture and danestic servants.
Esnployment in Plantations
The Department of Labor conducts sample surveys of employment i n plantations every two years. The f i r s t three surveys were conducted in years 1957, 1959 and 1961. The fourth survey was undertaken from June 1963 t o February 1964, and showed an increase in the number of
I plantations and a decrease in the number of employees. The reasons f o r t h i s were increased insecur i ty whi'ch forced some la rge plantations t o
I l i m i t t h e i r ac t iv i ty , the decline in the market price of rubber and tea, I and an increase in the number of small plantations using l e s s than 50 I
employees. Of 849 plantations during 1963, only 26 plantations used more than 500 employees, and 709 plantations used l e s s than 50 employees compared with 27 and 601 respectively in 1961. Thraugh four successive
I surveys,the percentage of male workers declined from a peak of 6% t o 58% while the percentage of female workers increased.
Ehvlosment i n Government
Pr ior t o 1965, Government c i v i l employees were c lass i f ied i n t o two categories: those working i n Saigon and those working i n the Provinces. Since 1965, government employees have been c lass i f ied according t o whether they a r e on the Central or the provincial payrolls .
The number of temporaw employees increased substant ia l ly fran 1964 t o 1965 due t o the requirements of the Pacification and the Rural Reconstruction Programs.
A - 9 - CIVILIAN EMPLOYMENT BY TYPE OF ACTIVITY, 1 9 6 0
mtJ. h h r Porce
Agriculture, Porestry, Fishing and Mining
Agriculture general Plantations fishing Uiniw and Qarryin?
Industrial and Coaa~rc ia l Es-.abli:hmenta
h u f e c t u r e a and Ha.dicraftr constmction C-rce, hnks and Insurance Trmsport and Cumnunications Electricity, Gas, Water and Sanitary Services , Services
Percent
100.0 -
Government Dnployees
Domestic S m t s 1.5 - I Source: Department of labor. I ~ - / / I i A-10- EMPLOYMENT IN PLANTATIONS
$
Eumter of Plantations Emplployment
Rubber coffee +
%a Uixed and Other
Increase due partl.v t o under-reporting I n 1359.
I Source: Departwnt of Iabor. - I A - l l - EMPLOYMENT IN GOVERNMENT
Saigon Rgvinces
-- Pelrmnent Status
Snigon Rovinces
Under Contract Saigon Provinces
m i l a wage Status Saigon Provinces
R q o r a r y o r Piece Work Saigon Rovinces
Source: Mrec ton t e Cencrrl or mdget and mreign Aid. -
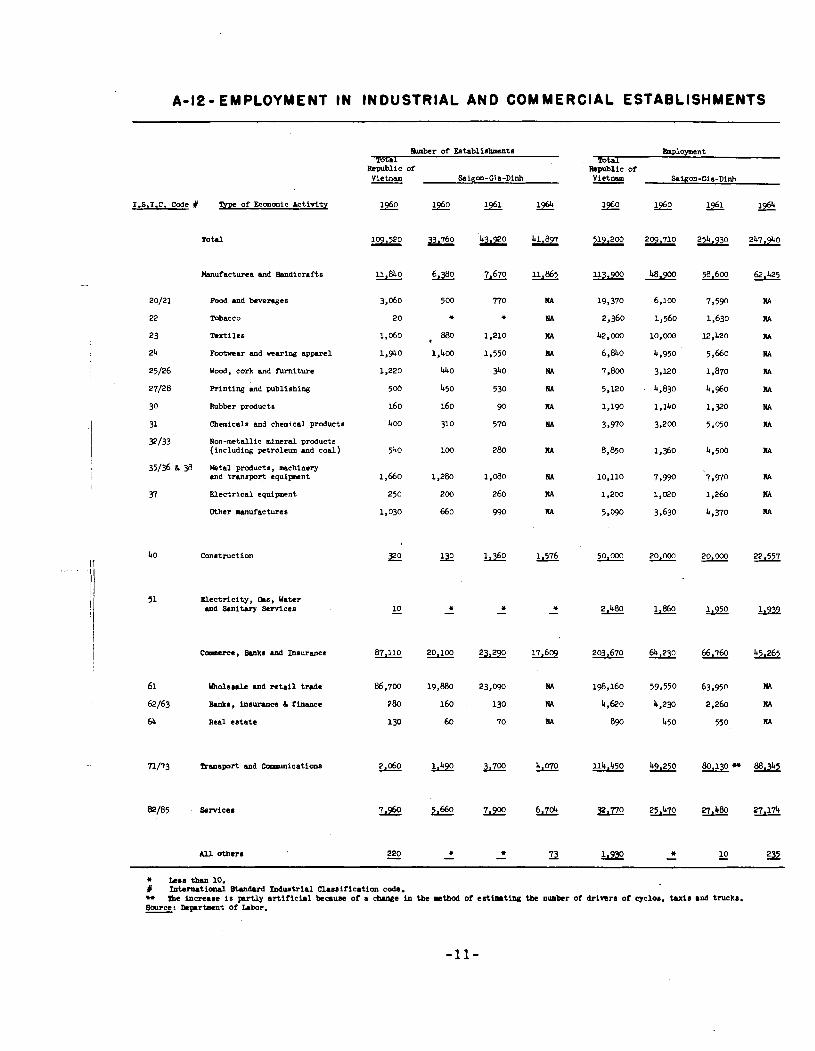
A-12- EMPLOYMENT I N INDUSTRIAL AND COMMERCIAL ESTABLISHMENTS
I.S.I.C. Code # Type of Ecglanic Activitx
Total
)lanufacturea and BIlndicrafts
Ebod and beverages
Tobacco
Textiles
Footwear and rearing apparel
Wood, cork and furniture
Printing and publishing
Rubkr products
Chemicals and chemical products
Ron-metallic mineral products (including petroleum and coal)
ktal prcducts, machinery and transport equipcent
E lec t r ica l equipment
Other m u f a c t u r e s
Construction
Elec t r ic i ty , C.8. Water and Sanitary Services
c o a n r c e , ankn and Insurance
Yholerrle m d r e t a i l t rade
Brinks, i n r u ~ c e 6 finance
Real e s t a t e
'Banaport and Cammications
A l l other8
h b e r of Eatablishmcnts Total
Republic of Vietnam - 9%
1l.840
3 - 6 0
20
1,060
1,940
1.220
500
160
400
540
1,660
250
1,030
z!?
10 -
87.1lo
86,700
280
130
* L252
n o -
Pmployment Total
m u b i i ~ or
+ Icrr than 10. # I n t e n u t i o n r l Wandud Industrial Clmsrification code.
m e increme i s prtly m r t i f i c i a l because of a ch.nge in the r t b o d of e r t l a t i n g the number of drivers of q c l o r , t ax i8 mud t ruckr. 8 w c e : hprtmnt Of XAbor. -
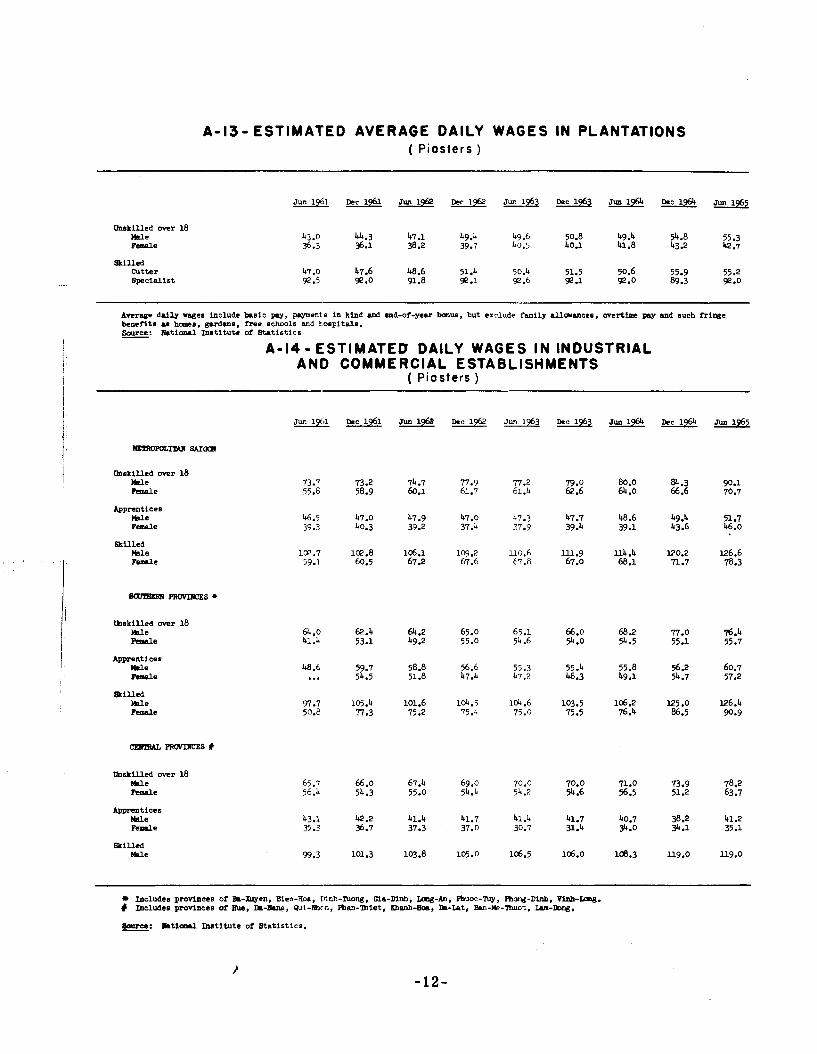
A-13- ESTIMATED AVERAGE DAILY WAGES IN PLANTATIONS ( Piosters )
IlnskiUed over 18 k l e Peaale
skilled Cutter Gpcislist
Average daily rages include hsic pay, p4ment.s in kind and end-of-year hanu, but exclude family rllwrncea, overtime pay sad such fringe benefits u h e n , gudurs, free schools end tospitsls. Sauce: Aaticmal Institute of Statistics -
A-14 - ESTIMATED DAILY WAGES IN INDUSTRIAL AND COMMERCIAL ESTABLISHMENTS
( Piosters )
chiskilled over 18 k l e Female
Apprentices M e Female
Skilled M e Rnale
lhskilled over 18 M e W e
Apprentices W e W e
Willed M e Peinnle
Unskilled over 18 M e M e
Apprentices M e Female
Include8 pmvlnns of Ba-Xuyen, Bien-Hoa, Irinh-Thong, Ma-Dinh, --An. Phuoc-Tuy, EBmg-Dinh, V i n h - m . # Includes provinces of Eue, Ih-kng, Qui -Wm, Phan-lhiet, Khanh-Am, Ih-Iat, Ean-#-lhuot, Lm-w.
Iloluee: lhtiaorl Institute of 8tatistics. -
RURAL INCOME EXPENDITURE SAMPLE SURVEY ( RIES ) ---- --oo==---
The Rural Income Expenditure Sample Survey (RIES) conducted by USAIDfiIETHAH i n June-July 1964 was t h e f irst known at tempt by e i t h e r t h e United S t a t e s Operat ions Mission t o Viet-Nam o r t h e Vietnamese Government t o secure basic da ta of income and expenditure p a t t e r n s which would be broadly r ep re sen ta t ive of t h e Vietnamese m r a l population.
The p r inc ipa l t a s k of t h e RIES was t o produce bas i c s t a t i s t i c s of t h e earn ing and spending p a t t e r n s cha rac t e r i z ing t h e r u r a l Vietnamese households.
Income and expenditure da t a were c o l l e c t e d f o r 29 provinces.
The Sample
S ince t h e RIES covered only r u r a l households and s i n c e t h e r e was no sample frame i n ex i s t ence t o f i t t h e d e f i n i t i o n s adapted f o r i t s purpose, t h e frame had t o be assembled. The A g r i c u l t u r a l Economics and S t a t i s t i c s Serv ice of t h e GVN s e l e c t e d t h e Sample populat ion t o be surveyed.
The primary sampling u n i t i n t h i s survey was t h e household.
In te rv iewers - Schoolteachers who r e s i d e e i t h e r i n t h e survey hamlet o r i n t h e v i l l a g e i n which t h e hamlet was loca ted served a s in te rv iewers .
Superv isors - The F i e l d Supervisors were P rov inc i a l S t a t i s t i c a l Agents of t h e A g r i c u l t u r a l Economics and S t a t i s t i c s Se rv i ce , Min i s t ry of Rural A f f a i r s , Government of Viet-Nam.
The household was defined a s cons i s t i ng of a l l those persons l i v i n g and t ak ing 75 percent of t h e i r meals . together . Th i s d e f i n i t i o n , whi le usable , was ad jus ted o f t e n because of t h e d i v e r s e l i v i n g arrangements found among t h e Vietnamese country people.
The m r a l Vietnamese peasants a r e gene ra l ly poor. The RIES shows t h a t average household income is 16,700 VN$ annually. Th i s amount t o a per c a p i t a income of approximately 3,100YN$. I n US d o l l a r s a t a r a t e of 73 t o 1, household and per c a p i t a income a r e 230 US$ and 42 US$ r e spec t ive ly . The incame of t h e household i s r e l a t e d t o t h e number of persons i n t h e household a b l e t o c o n t r i b u t e income. For most households, sources of income o t h e r than farming and f i s h i n g a r e s u b s t a n t i a l .
I t is p 0 S ~ i b l e t h a t t h e s e f i g u r e s i n d i c a t i n g a l o w pe r c a p i t a income unde r s t a t e t h e r e a l income of t h e s e people. The main reaeon f o r t h i e is t h e geography of South Viet-Nam, wrth i t 8 t r o p i c a l c l ima te and s u b s t a n t i a l amount of product ive land s u i t a b l e f o r cultivation and loca ted c l o s e t o populated a reas .
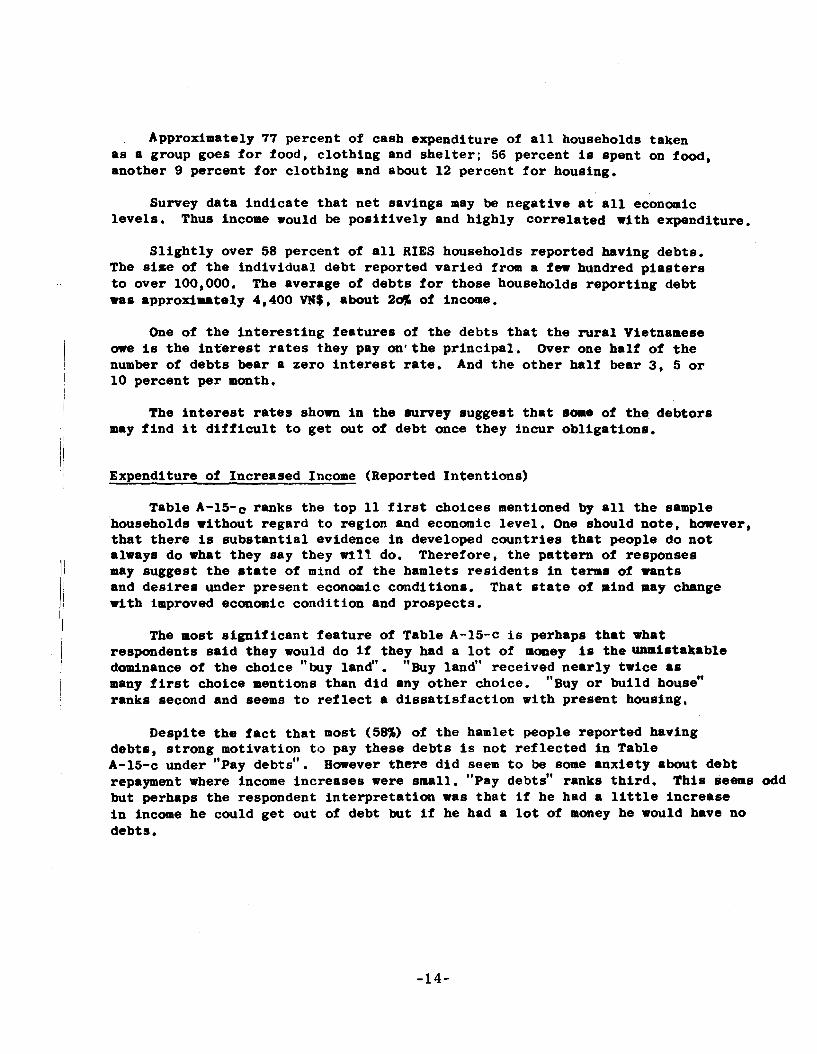
Approximately 77 percent of cash expenditure of a l l households taken a s a group goes f o r food, c lo th ing and s h e l t e r ; 56 percent is spent on food, another 9 percent f o r c lo th ing and about 12 percent f o r housing.
Survey da ta i n d i c a t e t h a t n e t savings may be negat ive a t a l l economic l eve l s . Thus income would be p o s i t i v e l y and highly c o r r e l a t e d wi th expenditure.
S l i g h t l y over 58 percent of a l l RlES households repor ted having debts . The s h e of t h e indiv idual debt repor ted va r i ed from a few hundred p i a s t e r s t o over 100,000. The average of deb t s f o r those households r epor t ing debt was approximately 4,400 VNS, about 20% of income.
One of t h e i n t e r e s t i n g f e a t u r e s of t h e debts t h a t t h e r u r a l Vietnamese owe is t h e i n t e r e s t r a t e s they pay o n ' t h e p r inc ipa l . Over one ha l f of t h e number of deb t s bear a ze ro i n t e r e s t r a t e . And t h e o t h e r hnlf bear 3, 5 o r 1 0 percent per month.
The i n t e r e s t r a t e s shorn i n t h e rurvey suggest t h a t role of t h e deb to r s may f i n d it d i f f i c u l t t o g e t out of debt once they incur obl iga t ions .
Expenditure of Increased Income (Reported In t en t ions )
Table A-15-c ranks t h e top 11 f i r s t choices mentioned by a11 t h e sample households without regard t o region and economic l eve l . One should no te , however, t h a t t h e r e i s s u b s t a n t i a l evidence i n developed coun t r i e s t h a t people do n o t always do what they say they wl1I do. Therefore, t he p a t t e r n of responses may suggest t h e s t a t e of mind of t h e hamlets r e s i d e n t s i n terns of wants and d e s i r e s under present economic condit ions. That s t a t e of mind may change wi th improved economic condi t ion and prospects .
The most s i g n i f i c a n t f e a t u r e of Table A-15-c i s perhaps t h a t what respondents s a i d they would do i f they had a l o t of money i s t h e Umis t akab le
11 dominance of t h e choice "buy land". Buy land1' received n e a r l y twice as many f i r s t choice mentions than d i d any o t h e r choice. " ~ u y o r bu i ld house" ranks second and seems t o r e f l e c t a d i s s a t i s f a c t i o n wi th present housing,
Despi te t h e f a c t t h a t most (58% of t h e hamlet people repor ted having debts , s t r o n g motivation t o pay these debts i s not r e f l e c t e d i n Table A-15-c under "pay debts". However there d i d seem t o be some anxie ty about debt repayment where income inc reases w e r e small. "Pay debts" ranks t h i r d . Th i s seems odd but perhaps t h e respondent i n t e r p r e t a t i o n was t h a t i f he had a l i t t l e inc rease i n income he could g e t ou t of debt but i f he had a l o t of money he would have no debts .
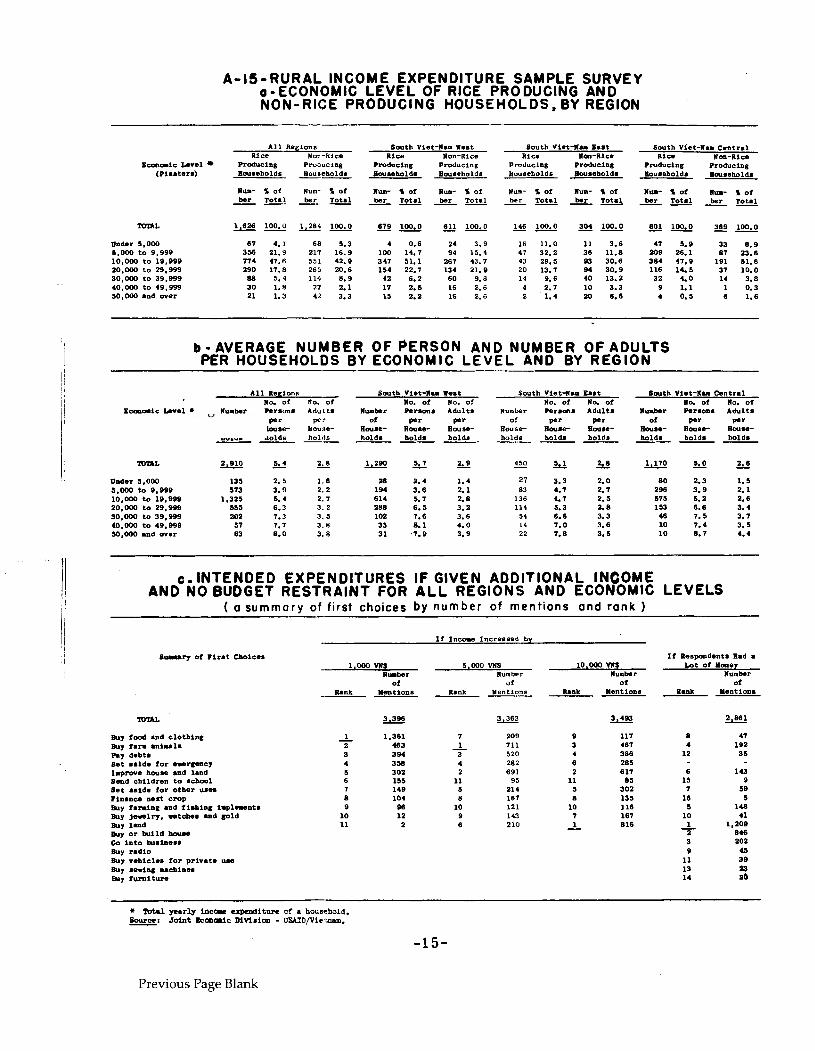
A-15-RURAL INCOME EXPENDITURE SAMPLE SURVEY 0 -ECONOMIC LEVEL OF RICE PRODUCING AND NON-RICE PRODUCING HOUSEHOLDS, BY REGION
A l l Regions - South Viet-Ham west South V i e t - N u Bast South Viet-Xu Cen t ra l Rice Non-Rice Rice Ilon-Rice Rice Ilon-Rice Rice Non-Rice
B a m a i c Level Roducing Producing Producing Producing Producing Producing Producing Producing ( ~ i a a t e r s ) Bouaeholds nouseholds Bouaeholda BouseholdB Bouscbolds Bouaeholda Bou8eholda Bouseholda
nus- % of Num- % Of Hum- Z of Hum- i of Nua- % of nus- Z of Hum- Z of Hum- i of ber Total ber To ta l ber To ta l ber Total ber To ta l ber To ta l ber Tot81 ber To ta l ---- ---- ---- --
Under 5.000 67 4.1 68 5.3 4 0.6 24 3.9 16 11.0 11 3.6 7 5.9 33 8.9 0.000 t o 9.999 356 21.9 217 16.9 100 1 . 7 91 15.4 47 32.2 36 11.8 209 26.1 87 23.6 10,000 t o 19,999 774 47.6 551 42.9 347 51.1 267 43.7 43 29.5 83 30.6 384 47.9 191 51.8 20,000 t o 29,999 290 17.8 265 20.6 154 12.7 134 21.9 20 13.7 M 30.9 116 14.5 37 10.0 30,000 t o 39.999 88 5.4 114 8.9 42 6.2 60 9.8 14 9.6 40 13.2 32 4.0 14 3.8 - 40.000 t o 49.999 30 1.8 27 2.1 17 2.5 16 2.6 4 2.7 10 3.3 9 1.1 1 0.3 50,000 and w e r 21 1.3 42 3.3 15 2.2 16 2.6 2 1.4 al 6.6 4 0.5 6 1.6
b - AVERAGE NUMBER OF PERSON AND NUMBER OF ADULTS PER HOUSEHOLDS BY ECONOMlC LEVEL AND BY REGION
A l l Regions - No. of No, of
Number Persona Adult8 of P ' PP '
Bouae- B o u s e noure- hold8 holds hold5 - - --
South Vie t -nu west no. Of NO. Of
numter P e r ~ n 8 Adults o r p r ~r
n0U.e- Rou.0- Rouse- holds bold8 holds ---
South Viet-Nu Eaat NO. Of NO. Of
Number Per8m8 Adult. of wr per
South Viet-llm Cen t ra l no. Of no. Of
I(\nber Persons Adul t s of w r p a r
Rouse- Rouse- Rouse- holds holds holds --- Bouse- B o u a e Bouae-
holds hold. holds ---
' I Under 5.000 5.000 to 9.999 10,000 t o 19.999 20.000 t o 29.988 30,000 t o 39.989 40.000 t o 49,999 50,000 m d w a r
c. INTENDED EXPENDITURES IF GIVEN ADDITIONAL INCOME AND NO BUDGET RESTRAINT FOR ALL REGIONS AND ECONOMlC LEVELS
( a summary of first choices by number of ment ions and rank )
I f Income Increased by
I f R e a m d e n t s Rad a 1.000 mi$
number Of
Rank Meations -- 5.000 vN$
Number of
Rank Mentions --
10,000 W S number
Of Rank Mentions --
IS of Money llumber
of Rmnk Mentions --
Buy food and c l o t h i n g Buy farm u l i u 1 a R y debt. 8 e t 88ide f o r e w r m c y Improve house and land S m d ch i ld ren t o 8chool S e t a s ide f o r o t h e r uses l i n s n c e n e r t c r o p Buy f a r u n g and fimhing implements Buy j e . w l r ~ . . r t ch .a m d gold Buy l M d Buy o r h l i l d hGlm GO i n t o h l s ine8s Buy r a d i o Buy vehicle8 f o r p r i v a t e uu Buy a w i n g u e h i n e a Buy f ~ r n i t u r r
+ Total year ly i n c a r e r p n d i t u r e of a household. Sauce: ~ o f n t kmcmlc Dlvlaicm - UWJD/VieYam. -
Previous Page Blank
SECTION - B
PRICES
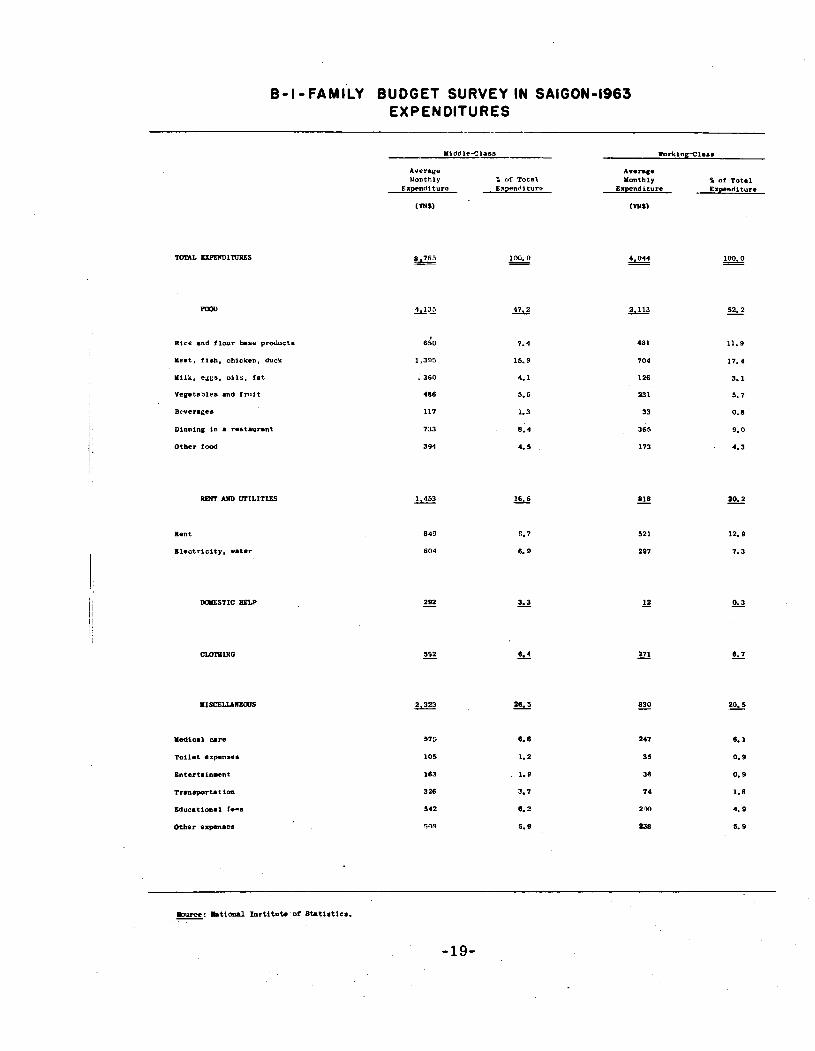
FAMILY BUDGET SURVEY
In 1963, th.? National Institute of Statistics (NIS) conducted an expenditure survey of family budgets in Saigon, Dalat, and seven other provinces.
This survey was designed to collect and record data on general living conditions and allocation of family income among alternative expenditures.
Survey Method - The methodology applied by NIS was to question families from selected social classes in difSerent localities and in alternate periods. The survey lasted one year, divided into four periods, each period was of three months duration.
Survey Pattern - In Saigon, the survey pattern included two groups, each group consisted of 900 families. The family group was either of working or middle class origin. In period I and 111, the first select group of 900 families was tested. In period XI and 111, the second 900 families were questioned.
Questionnaire The questionnaire was ~ 0 n S t ~ c t e d so 8s to obtain information covering daily, weekly, and monthly expenses.
Composition of Families: - -- 1) Lower - income families:
The standard budget adopted is that of a family of seven including four children under 14 with the daily expenses on food under VN$ 10 piaster per person,
2) Middle - income families: The standard budget adopted is that of a family of seven including
three children under 74 and a domestic servant with daily expenses a food of VN$ 10 piaster and over per person.
B - I -FAMILY BUDGET SURVEY IN SAIGON-1963 EXPENDITURES
Average A v e n s e Yonthly ?; of T o t s 1 Monthly S of T o t a l
E x ~ e n d i t u r e Expendi ture E x w n d i t u r e Expendi ture
Rice and f l o u r b s e proLucts
Meat, f i s h . c h i c k e n , duck
Y i l h , edgs, o i l s , f a t
V e g e t a b l e s and f nai t
B w e n f e s
Dinning i n a r t b t a u r w n t
O t h e r food
Rent
B l e c t r i c i t y , w a t e r
Medical -re
T o i l e t expens¶n
B n t a r t a i n w e n t
T r m n p o r t a t i o n
E d u c a t i o n a l f-n
O t h e r expanacs
bum: Bti-1 I n r t i t u t e of B t a t i a t i c a , -
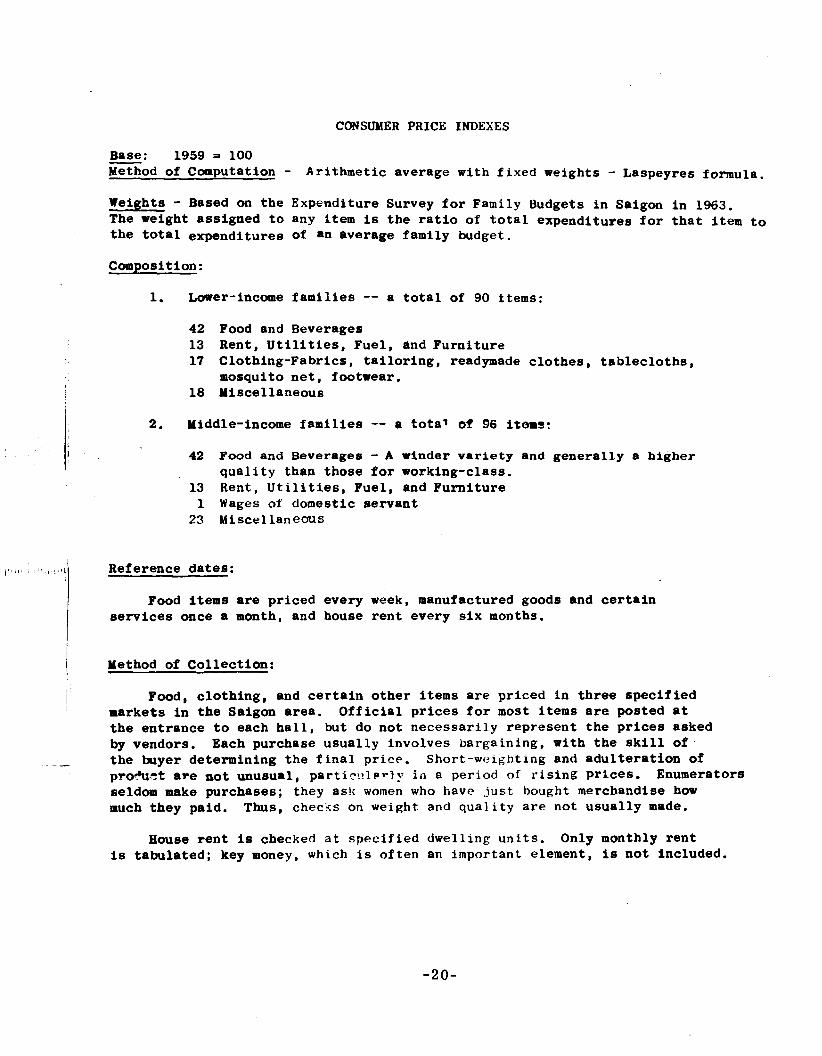
CONSUMER PRICE INDEXES
Base: 1959 = 100 - Method of Computation - Arithmetic average with fixed weights - Laspeyres formula. Weights - Based on the Expenditure Survey for Family Budgets in Saigon in 1963. The weight assigned to any item is the ratio of total expenditures for that item to the total expenditures of an average family budget.
Composition: -
1. ~oaer-income families -- a total of 90 items: 42 Food and Beverages 13 Rent, Utilities, Fuel, and Furniture 17 Clothing-Fabrics, tailoring, readymade clothes, tablecloths,
mosquito net, footwear. 18 Miscellaneous
2. Middle-income families -- a total of 96 items: 42 Food and Beverages - A winder variety and generally a higher
quality than those for working-class. 13 Rent, Utilities, Fuel, and Furniture 1 Wages of domestic servant
23 Miscellaneaus
Reference dates:
Food items are priced every week, manufactured goods and certain services once a month, and house rent every six months.
1 Method of Collection:
I I Food, clothing, and certain other items are priced in three specified
markets in the Saigon area. Official prices for most items are posted at the entrance to each hall, but do not necessarily represent the prices asked by vendors. Each purchase usually involves bargaining, with the skill of
- the buyer determining the final price. Short-weighting and adulteration of pto?u?t are not unusual, partic!!lerlt; in a period of rising prices. Enumerators seldom make purchases; they ask women who have just bought merchandise how much they paid. Thus, checks on weight and quality are not usually made.
House rent is checked at specified dwelling units. Only monthly rent is tabulated; key money, which is often an important element, is not included.
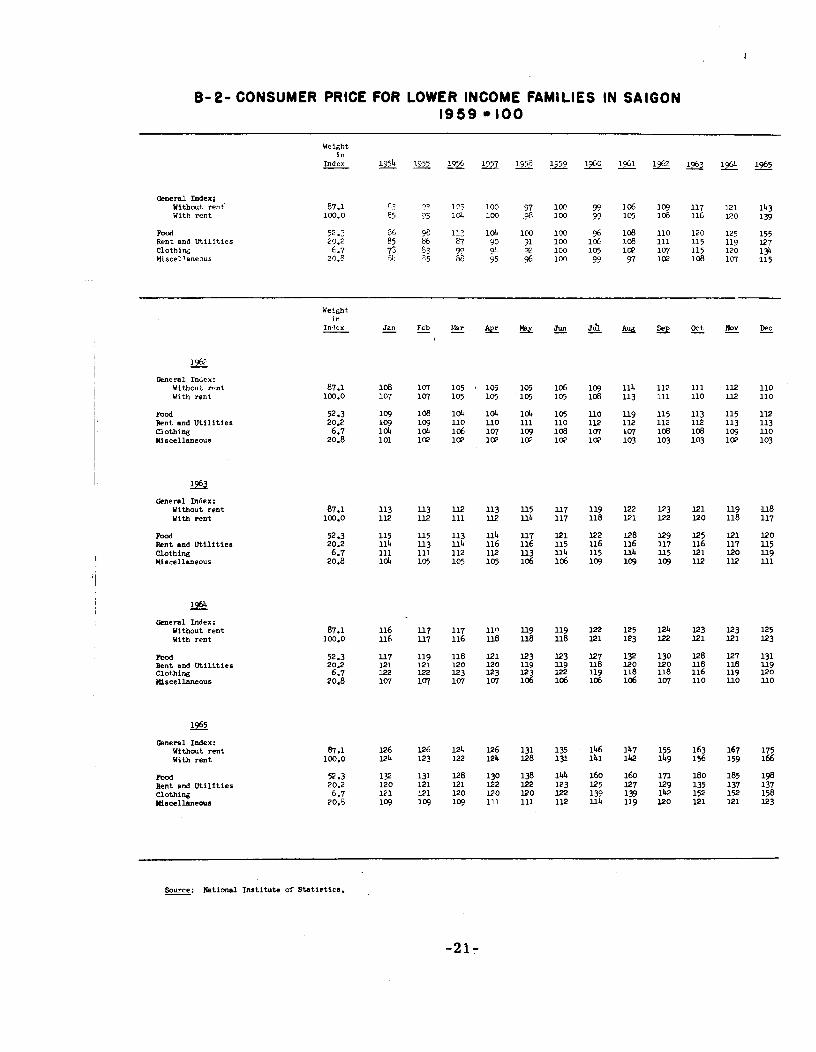
8-21 CONSUMER PRICE FOR LOWER INCOME FAMILIES IN SAIGON 1 9 5 9 100
General Index; Without rent' With rent
rn Rent and Ut i l i t i es Cl0thlry; Miscellanexr
General Index: Ylthoui rent K i t h rent
mod Rent and U t i l i t i e s Clothing Miscellaneous
General Index: Without rent With rent
PDod Rent and Ut i l i t i es Clothing Miscellaneous
General Index: Without rent With rent
Pood Bent and Ut i l i t i es Clothi= Wscellmeous
General Index: Withcut rent With r e n t
Pood Rent and U t i l i t i e s Clothina Niscellaneoun
87.1 113 113 ll2 113 115 117 119 122 123 121 l l 9 118 100.0 112 112 111 ll2 ~ l b 117 118 121 122 120 118 117
20.2 111 113 116 116 116 115 116 116 ili 116 117 115 111 111 112 112 113 l l h 115 114 115 121 120 119
6'7 16 105 105 105 106 106 103 1'3 1'3 112 112 111 20.8
52.3 20.2 7 2 ;: 2: E ; 3 :Po 2: :: ; :3; 6.7 122 122 123 123 123 122 119 118 118 116 u g 120
20.8 1W 14 107 lq 106 106 106 106 107 110 UO 110
poi5 log 10q log 111 111 112 114 i i9 120 121 121 123
Source: Rational Ins t i tu te of S ta t i s t ics . -
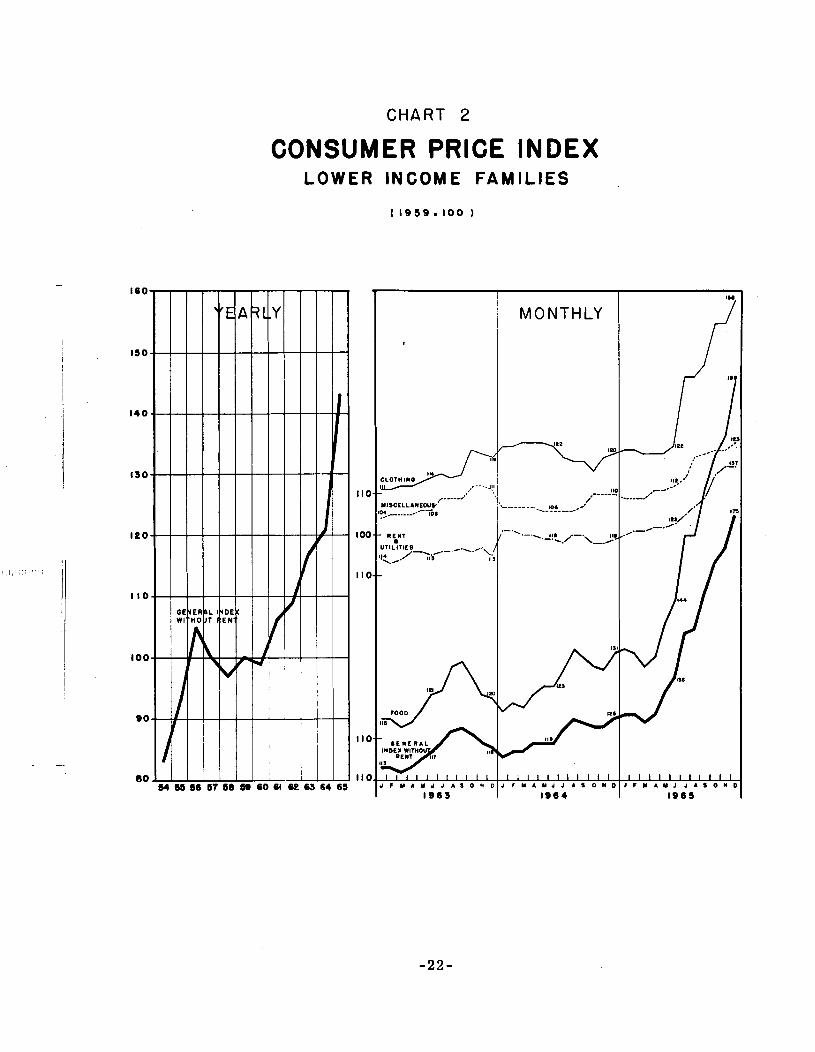
CHART 2
CONSUMER PRICE INDEX LOWER INCOME FAMILIES
MONTHLY
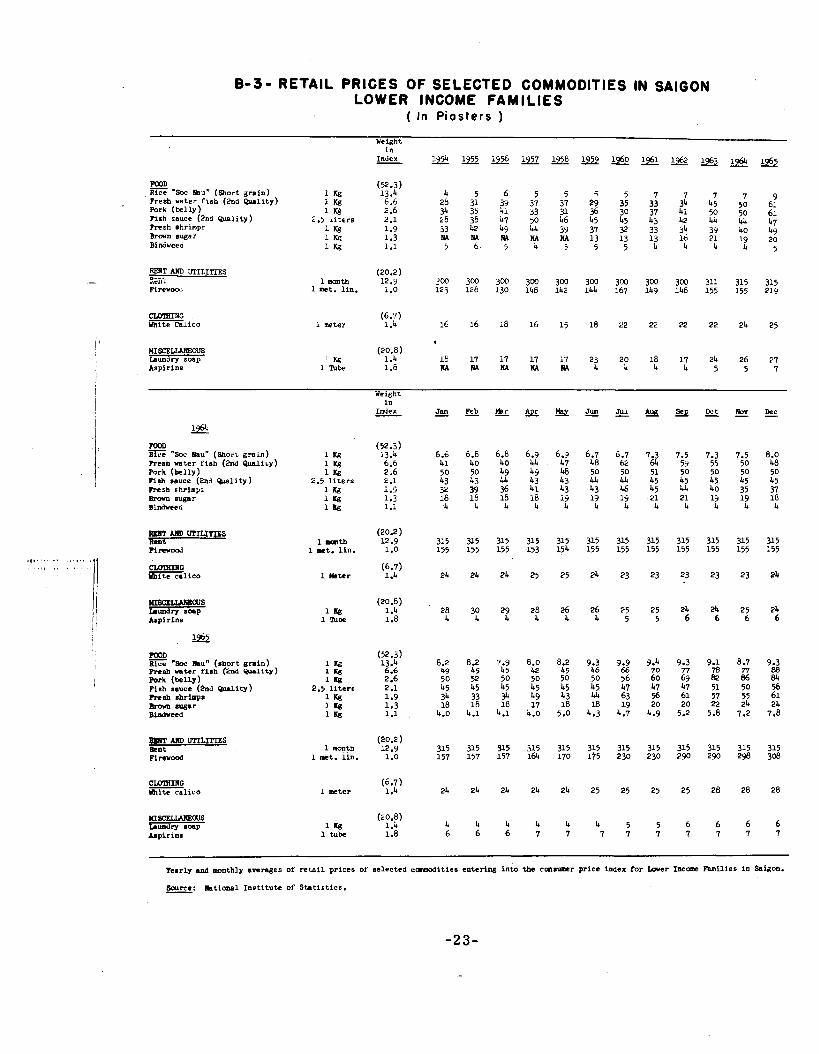
8-30 RETAIL PRICES OF SELECTED COMMODITIES IN SAIGON LOWER INCOME FAMILIES
( In P i a s t e r s )
POOD - Rice "Soc Iiau" (Short x n i n ) --- Resh ra te r f i sb (2nd & i t y ) i Kg 6.6 26 3i 3; 3; 3< 29 3g 33 3i 4; 50 I 61 Y Pork (belly) 1 M 2 .6 34 35 *A 33 31 36 30 37 41 50 50 61 F i r h sauce (2nd Wnlity) 2.5 i i zers 2.1 56 36 47 20 L6 45 45 43 42 4L I& 47 Fresh shrimps 1 Kg 1.9 33 '.2 49 U 39 37 32 53 34 39 40 49 Brarn sugar 1 K& 1.3 RA RA K4 M NA 13 13 13 16 21 19 20 Bindweed 1 K3 I .1 j b . j b 5 5 5 4 4 4 4 5
W I ~ O U S Laundry soap Aspirins
(20.2) 1 month 12.9 ?00 300 300 3W 300 300 300 300 300 311 315 315
1 met. l in . i.0 i25 126 130 146 142 144 167 llrg 146 155 155 219
(20.8) w, 1.4 16 17 i 7 17 17 23 20 18 17 24 26 27
1 Tube 1.6 n A M M M K 4 4 4 4 4 5 5 7
HYH, - n (52.3) Bice ~ o c mu" ( ~ h o r ~ grain) 1 Kg i 3.4 6.6 6.6 6.6 6.9 6.3 6.7 6.7 7.3 7.5 7.3 7.5 8.0 Presh n t e r f i sh (2nd P u a l i ~ y ) 1 Kg 6.6 41 40 40 U 47 48 62 64 59 55 50 48 Pork (belly) 1 l(g 2.6 50 50 by 46 50 50 51 50 50 50 50 Fish sauce (End ~ l i t y ) 2.5 l i t e r s 2.1 43 43 43 43 44 44 45 45 45 45 45 Resh rhrimys 1 K3 i.9 P 39 36 41 43 46 45 44 40 35 37 Bmm sugar 1 Kg 1.3 1 1 16 i8 :: 1 l 1 21 19 19 U3 Bindweed 1 l(g 1.1 4 4 4 4 4 4 4 4 4 4
I(LBCELUWOU6 laundry soap b p i r i n s
(20.6) 1 U 1.4 28 30 29 28 26 26 35 25 24 24 25 24
1 mbe 1.8 4 4 4 4 4 4 5 5 6 6 6 6
rOOD - ( 9 . 3 ) Rice .SOC mu" (short g n i n ) 1 KS 13.4 6.2 8.2 7.9 8.0 8.2 9.3 3.9 9.4 9.3 9.1 8.7 9.3 mlb n t e r fish (2nd B u l i t y ) 1 l[g 6.6 49 45 45 42 45 46 65 70 78 77 88 Pork (belly) 1 SS 2.6 50 52 50 50 50 50 56 60 82 86 84 Fish sauce (2nd ~ r d i t y ) 2.5 l i t e r s 2.1 45 45 45 47 47 47 51 50 56 Fresh shrimps 1 Kg 1.9 33 Y, :: 2 63 56 61 57 55 61 Ikom w a r 1 U 1.3 16 18 17 18 18 1 9 20 20 22 24 24 Bindweed 1 Kg 1.1 4.0 4.1 4.1 4.0 5.0 4.3 4.7 4.9 5.2 5.8 7.2 7.8
C I M f I m G m i t e calico
(20.2 l m ~ i2.9 315 315 315 315 315 315 315 315 315 315
1 met, l in . 1.0 157 157 157 164 170 175 230 230 290 290 :g % (6.7)
i n t e r 1.4 2L 24 24 24 24 25 25 25 25 28 28 28
(20.8) 1 U 1.4 4 4 4 4 4 4 5 5 6 6 6 6
1 tube 1.8 6 6 6 7 7 7 7 7 7 7 7 7
--
yearly md mntbly avenge6 of reur i l prices of #elected c m x d l t i e 8 entering into the cmsumer price index for h e r I a c m Families in Saigon.
Scurce: mtiamal Ins t i tu te of S ta t i r t ics . -
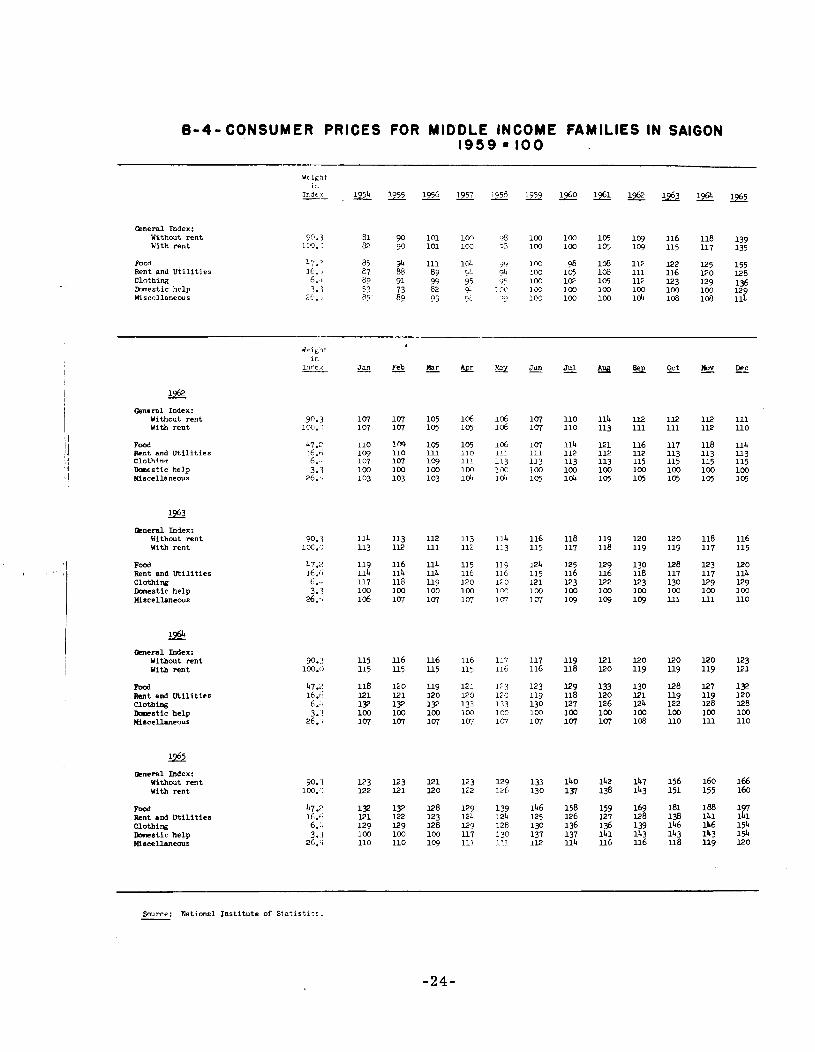
0-4-CONSUMER PRICES FOR MIDDLE INCOME FAMILIES IN SAIGON 1959 = 100
Oeneral Index: Without r e n t With r e n t
Fool Rent and u t i l i t i e s C l o t h i w mmestic hc lp Miscellaneous
?C. 1 S1 90 101 103 06 103 103 105 1 116 118 139 193. ' 82 $0 101 lCC 2: 1 103 105 109 115 117 135
47. ' 85 111 I& 99 lm 9 1m 112 122 125 155 I( . E7 83 gL 04 I00 105 108 111 116 l 2 0 128 6. I 80 91 95 7'. 100 1s 105 112 123 129 136 3.1 5: 73 62 + ::v ID5 100 100 103 z. > 85 60 93 9 100 loo loo 1 :2 :2 E8
d e 1 6 1 t
i I n I". < ' -- Jm~.3"AJunJulA~oct~~
~ ' is. General Index:
Wlthout r e n t 90. I 14 14 105 1 16 14 110 114 Ili. 1 U 112 1ll With r e n t 1CC. 1 107 14 105 105 1 6 14 110 113 111 111 112 110
mod Rent and U t i l i t i e s Cloth4 nq
h e s t i c help )liacellaneous
& n e r d Index: Without r e n t With r e n t
Food Rent and U t i l i t i e s Clothing Domestic help mscel laneous
General Index: Without r en t w i t h r e n t
Pood Rent and U t i l i t i e s Clothing h a e s t i c he lp Uiscellaneous
a n e r a l Index: Without r e n t With r en t
Food Rent and U t i l i t i e s Clothing h s t i c he lp Uiscellaneous
Smrce: Nationel I n s t i t u t e of S t a t i s t i e r . -
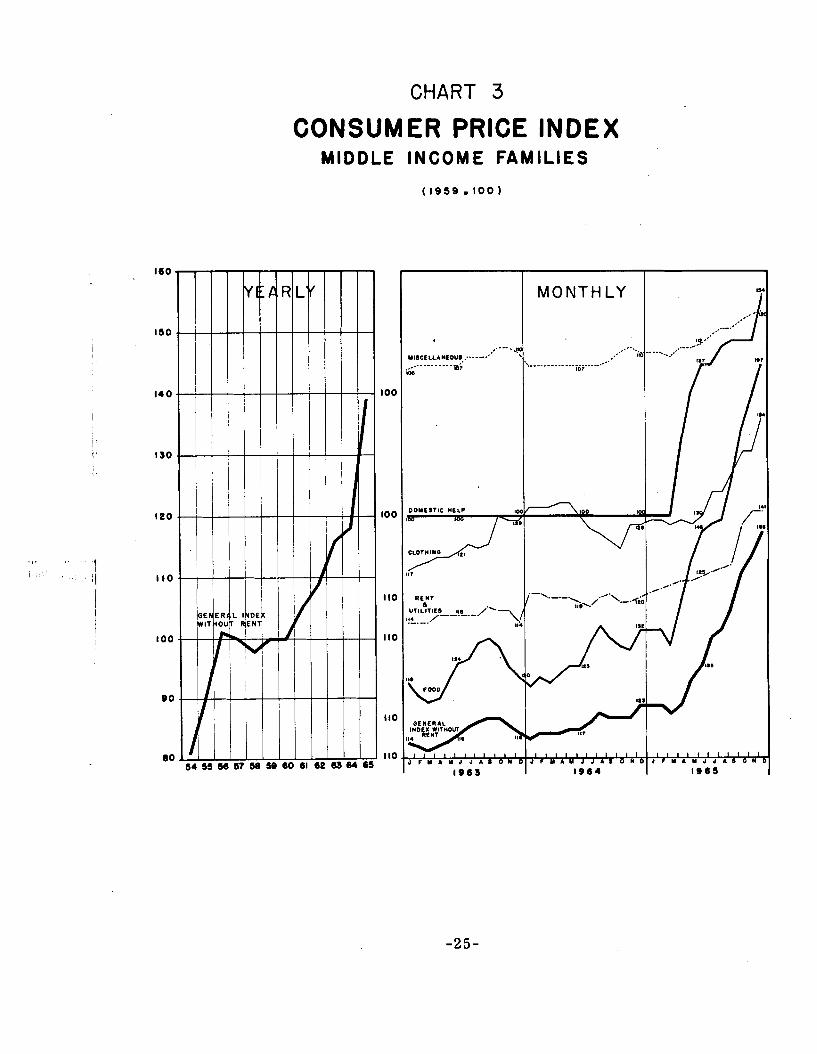
CHART 3
CONSUMER PRICE INDEX MIDDLE INCOME FAMILIES
loo
I la
IIC
I I C
I la
DOMESTIC HELP
I/"
RENT
MONTHLY
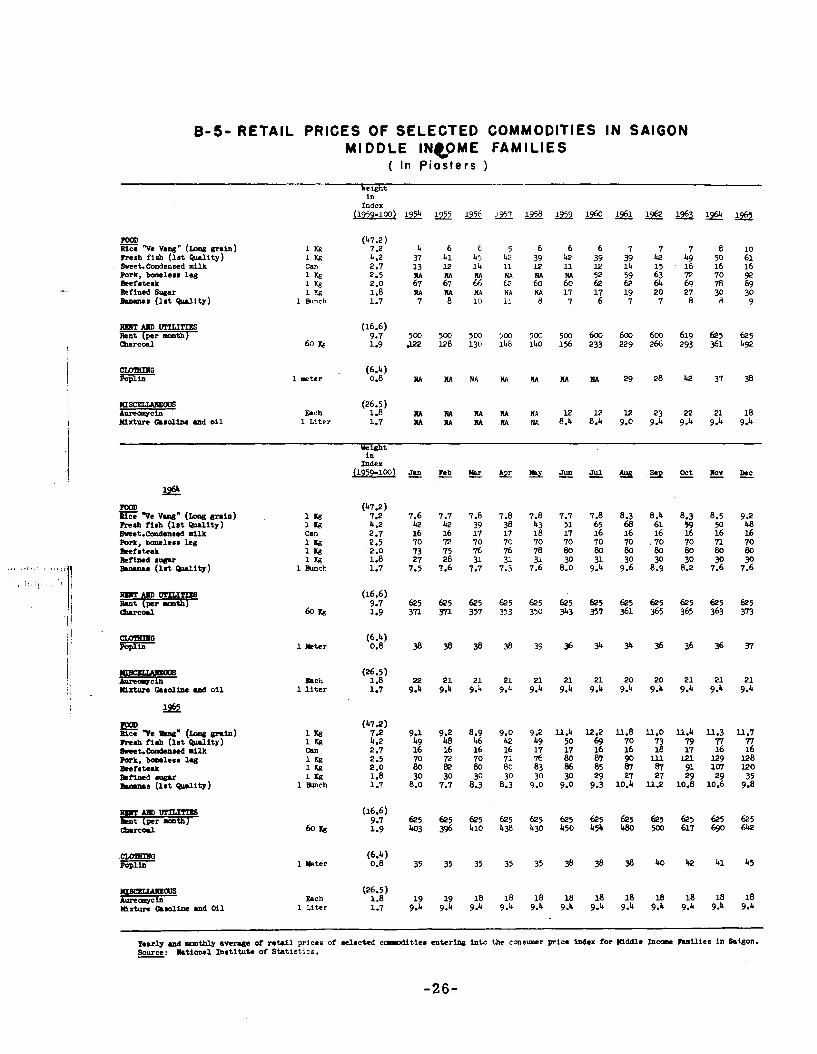
8-59 RETAIL PRICES OF SELECTED COMMODITIES I M I D D L E I N W M E FAMILIES
( In P i a s t e r s )
Weight
roo0 - Rice We vang" ( b n g grain) m s b f i ~ h (1st Quality) Sreet. Candensed milk Pork, bcmelesm leg Beefstcmk Refined Sugar ~ao . l u s ( h t w i t y )
RmTmlmLnms k n t (per month) Cnarccal
i n Index
(1959=100)
(47.2) 7.2 4.2 2.7 2.5 2 .o 1.8 1.7
(16.6) 9.7 1.9
(6.4) 0.8
(26.5) 1 .8 1.7
boo 600 619 625 625 229 266 293 361 492
lOaD - Rice "Ve 'cn (m -in) h . h flab (1st B u l i t y )
weight in
Index (1959.100)
(47.2 7.2 4.2 2 .7 2.5 2.0 1.8 1.7
(16.6) 9.7 1.9
(6.4) 0.8
(26.5) 1.8 1.7
( 475 ) 7.2 4.2 2.7 2.5 2 .o 1.8 1.7
(16.6) 9.7 1.9
(6.4) 0.8
(26.5) 1.8 1.7
3.2 l l .4 12.2 l l .8 11.0 ll.4 11.3 49 17 I, 50 8 2 3 Z 2 76 80 87 lll 121 129 83 86 85 87 91 107 30 30 29 27 27 29 29
9.0 9.0 9.3 10.4 ll.2 10.8 10.6
yearly .nd montbly ave rqe of r e t a i l prices of selected c o a d i t i e s entering in to the consumer price index for Yiddle Inccme Families in bigon. source: llational Inmtitute of Statist ics. -
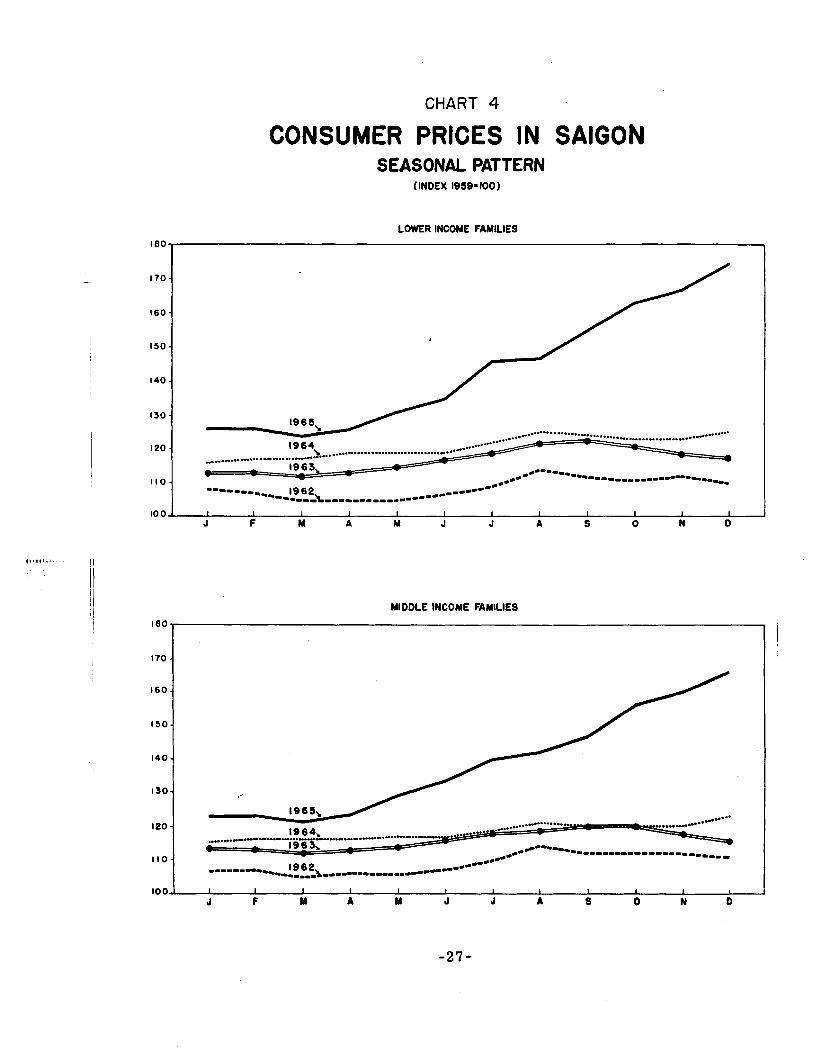
CHART 4
CONSUMER PRICES IN SAIGON SEASONAL PATTERN
(INDEX 1959=100)
LOWER INCOME FAMILIES
MIDDLE INCOME FAMILIES
WHOLESALE PRICES I N SAIGON
Base: 1959 = 100. I n 1959, value of general index i n o r i g i n a l s e r i e s (1949 = 100) was 179.
Method of Computation: Geometric average with f ixed weights,
Weights: Propor t ionate t o the value of commodities so ld i n Saigon i n 1949. Inc ludes consumption i n Saigon p lus exports .
Composition: A t o t a l of 49 items:. 3 Rice and paddy
14 Other food products and beveraues 8 Fuel and o i l
10 Raw mate r i a l s , inc luding rubber with a weight of 8.4% 7 Semi-finished products 7 Manufactured products
Reference Dates:
S ince 1957, r i c e p r i c e s have been co l l ec t ed each day by t h e National Bank of Viet-Warn and t h e f i g u r e s represent a monthly average of t hese quota t ions . For o the r products , p r i c e s a r e co l l ec t ed once a month toward t h e end of t h e month.
Method of Col lec t ion:
For products o t h e r than r i c e , mail r e p o r t s a r e received from a s p e c i f i e d list of domestic d i s t r i b u t o r s , expor t e r s and t r a d e a s soc ia t ions wi th telephone follow-up f o r non-responses. I n some cases , a s f o r example wheat f l o u r and sugar , t h e o f f i c i a l p r i c e i d used when such a p r i c e e x i s t s . For rubber , t h e p r i c e i s t h e market p r i c e for rubber expor ts t o t h e French Franc Area. For r i c e , s ee Notes t o Table E-2.
Average Wholesale P r i c e s f o r Se lec ted Commodities
P r i c e s used i n t h e index f o r r i c e , rubber and hogs are shown i n Sec t ion E-Agriculture
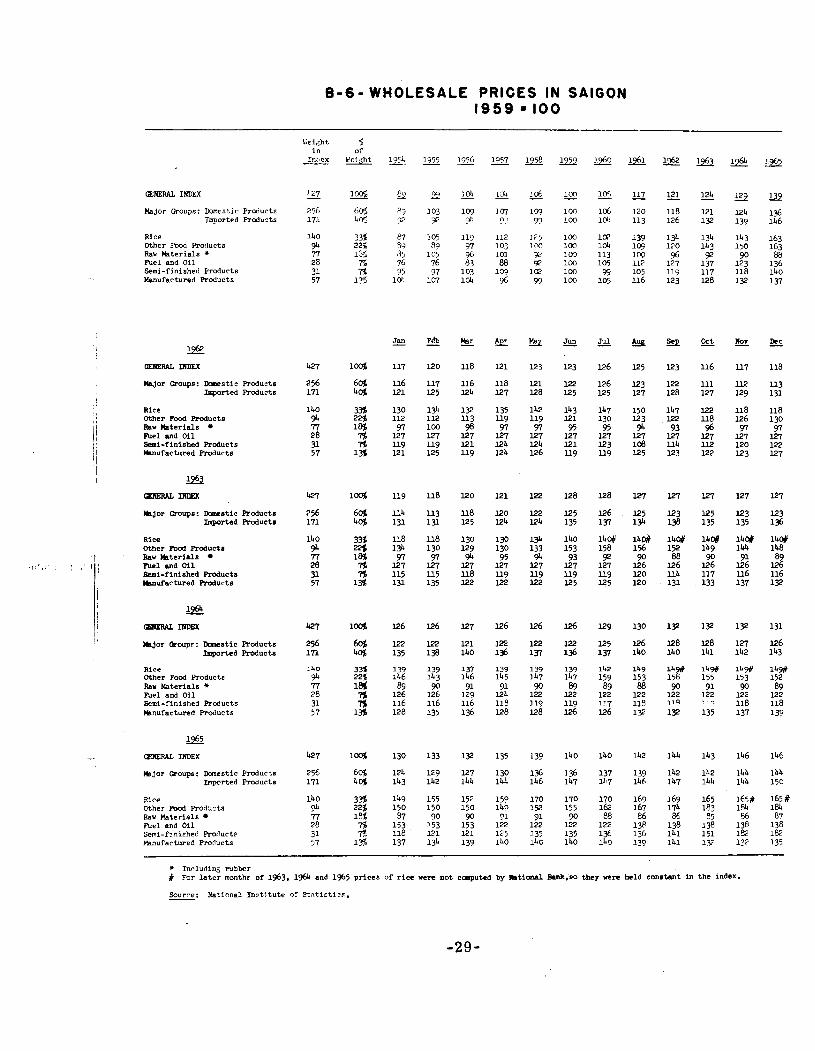
8-6 - WHOLESALE PRICES IN SAIGON 1 9 5 S m 100
k j o r Groups: Donestir Prmjucts Lmorted Roducts
Rice Other .Food Rotlucts Rau Materials + Fuel and Oil Semi-finished Products
- h u f a c t u r e d Rcduc t s
llajor Qoups: Dmes t i c Rcduc t s Imported Rcduc t s
Rice Other Fvcd Prcducts
I Raw l l a t e r i a l s
140 3% 130 1% 132 135 142 143 147 150 147 lZ? ~8 94 22% 112 112 113 l l 9 119 121 130 123 122 l l8 126 n 1% 97 100 98 97 gl 95 95 94 93 96 gl 28 127 127 127 127 127 127 127 127 127 127 127 3 & u 9 119 121 124 124 121 123 108 u 4 l,.lZ 120 57 1% 121 125 l l 9 124 126 l l 9 u9 125 123 122 123 11 Fuel and Oil
Semi-finished R c d u c t s
i Yrnufactured Products
I
k j o r e n u p s : m a t i c Roduc t8 256 6 s 114 113 118 120 122 125 126 125 123 i25 123 123 ~mpnrted Rcduct8 171 4 s 131 131 125 124 124 135 137 134 138 135 135 136
Rice 140 33% l l 8 118 130 130 134 140 1 4 M 1 4 M l4C# 1406 140Y 140# Other Pwd R o d u c t l
1 ' Ran k t e r i a l s . 1 1 . , ' ' I m e 1 and oi l
&.mi-finished Roduc t s )(mufactwed Prcducts
k j o r &ups: Dcmestic R c d u c t s Imported Roduc t s
R i c e Other Focd Roducts R a w k t e r i a l s + m e 1 and Oil &mi-finished Roduc t s l h n u f a c t w d Rcduc t s
.-- a R A L INDEX
l h j o r Qoupe: Dmes t i c Products Imported Roducte
Rice Other Pood Prono-ts Raw P a t e r i a l s Fuel and Oil Semi-finishe? Roduc t s Yaxfsc tu red Pmtlucts
- - -
+ Inr luding rubber f For l a t e r months of 1963. 1964 and 1965 p r i ces of r i c e were not computed by L t i o n a l M , s o they vcre held con8tant in the index.
S?urpe: National I n r t % t u t e of 3.ntirti:r. -
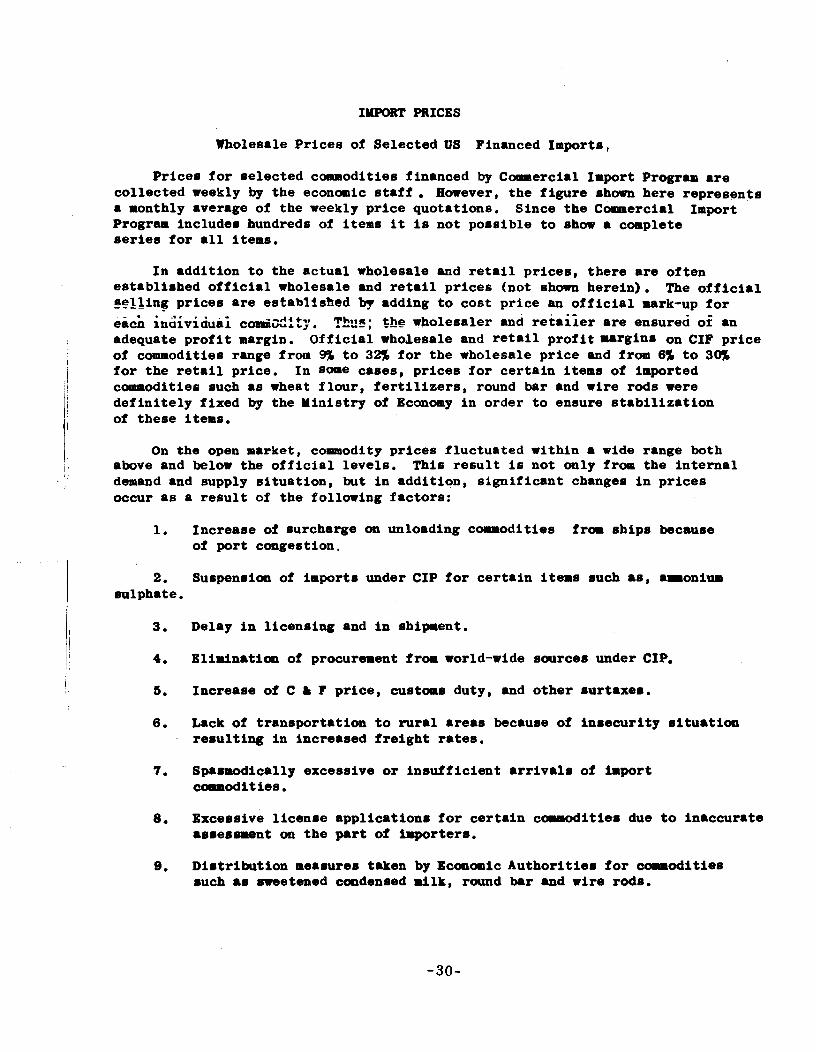
IYPORT PRICES
Wholesale Pr ices of Selected US Financed Imports,
P r i ces f o r se lec ted commodities finanoed by Commercial Import Program a r e col lec ted weekly by the economic s t a f f . However, t h e f igure shom here represents a monthly average of the weekly p r i ce quotat ions. Since t h e Comercia1 Import Program includes hundreds of i t e m s it i s not possible t o show a complete series f o r a11 i t e m s .
I n addi t ion t o the ac tua l wholesale and r e t a i l p r i ces , the re a r e of ten - es tabl ished o f f i c i a l wholesale and r e t a i l p r i ces (not shown herein) . The o f f i c i a l
s e l l i n g p r ices a r e es tabl ished by adding t o cos t p r i ce an o f f i c i a l mark-up f o r 3 . . .
ei& ;nalvlauai conni;ixXt;.. the wholesaler and r e t a i l e r a r e ensured o i an I adequate p r o f i t margin. O f f i c i a l wholesale and r e t a i l p r o f i t u r g i n l l on CIF p r ice I
of commodities range from 9% t o 32% f o r the wholesale p r i ce and from 6% t o 30J I f o r the r e t a i l price. In Some cases, p r i ces f o r ce r t a in items of imported
commodities such a s wheat f l o u r , f e r t i l i z e r s , round bar and w i r e rods were / ' d e f i n i t e l y f ixed by the Ministry of Economy i n order t o ensure s t a b i l i z a t i o n I I 11 of these items.
On the open market, c o ~ a ~ o d i t y p r i ces f luc tuated within a wide range both above and below the o f f i c i a l levels . This r e m l t i s not only f r a the i n t e r n a l I
demand and supply s i tua t ion , but i n addi t ion , s ign i f i can t changes i n p r i c e s occur a s a r e s u l t of the following fac to r s :
1. Increase of surcharge on unloading c m o d i t i e s f r a ships because of por t congestion.
2. Suspension of imports under CIP f o r c e r t a i n items such r e , a ron ium mlphate .
Delay i n l icens ing and i n shipment.
Elimination of procurement from world-wide saurces under CIP.
Increase of C & ? pr ice , cuetome duty, and o the r surtaxee.
Lack of t ranspor ta t ion t o r u r a l a reas because of ineecur i ty s i t u a t i o n reeu l t ing i n increased f r e i g h t r a t e s .
Gpaenodically excessive o r in8uf f i c ien t a r r i v a l e of import commodit lee.
Exceesive l i cense appl ica t ione f o r c e r t a i n caurodi t iee due t o inaccurate reees r r sn t on t h e p8rt of importerm.
Die t r ibut ion measures taken by Economic Author i t lee f o r commodities such r e oreetened condensed milk, round bar 8nd w i r e rods.
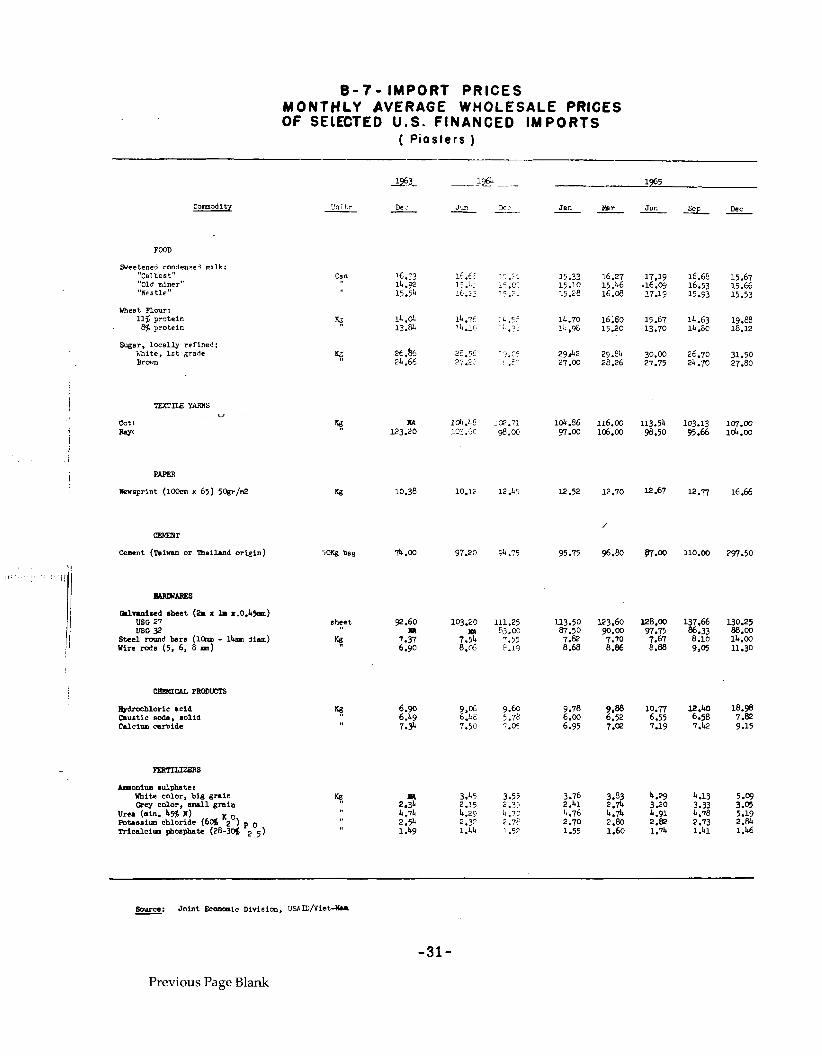
8 - 7 0 IMPORT PRICES MONTHLY AVERAGE WHOLESALE PRICES OF SELECTED U.S. FINANCED IMPORTS
( P i a s t e r s )
Sveetened condense3 milk: "Caltest" "Old miner"
Wheat Flour: 11% protein &$ protein
Sugar. loca l ly ref ined: Khite, 1 ~ t grade Brmm
cotton yam. (grade 30 1 ) Rayon yarn (120 denier(
PAPER
m a p r i n t (1- x 6 5 ) 5Ogr/.nZ
CDEnT
Cement (Taiwan o r mai land o r i g i n )
USC 27 VSG 32
Stee l rovnd bars ( l b - 1 4 m diem) w i r e reds (5, 6. 8 m)
Bydmchloric ac id Caustic soda, ao l id Calcium carbide
FERTILIZERS
Amonium .u1pIlnte: White color , b i a g ra in Grey color, a d 1 g ra in
Urea b i n . 45% A) Potasa im chloride ( 6 6 '2') h i c a l c i m phosphate (28-3% P205)
Previous Page Blank
Previous Page Blank
SECTION - C
FINANCE
ASSETS AND LIABILITIES OF HATIOHAL WNE OF VIET-WAY
The National Bank of Viet-Nam was created on D e c e m b e r 31, 1954, following the agreement signed on D e c e m b e r 29, 1954, t r ans fe r r ing t h e power t o i s sue bank notes from the French Government t o the Governments of Viet-Nam,' Laos and Cambodia. The Bank commenced operat ions i n January 1955 when it took over t h e Viet-Nam a s s e t s and l i a b i l i t i e s of the former Currency Board of Viet-Naa, Laos and C a a W i a .
The National Bank of Viet-Nam has the exclusive p r iv i l ege of i ssuing banknotes and coins i n Viet-Nam, safeguarding the value of Vietnamese currency, and control l ing the use of c r e d i t and foreign exchange.
Consolidated Debt of Government cdaprises a f ixed amount of 10,681 mil l ion p i a s t e r s , mainly the counterpart of the note i ssue assumed by t h e National Bank a t i t s inception (8,331 mil l ion p i a s t e r s ) .
Temporary Advances t o the Government f i r s t begun i n December 1959 with an amount of VN$ 100 mil l ion a r e loans extended t o Government t o he lp it cope with i ts increased spending f o r t h e defense and development of the country. Theee should not exceed 40 per cent of t o t a l revenues col lec ted i n t h e previoue year f o r the National Budget and other budgets including r e c e i p t s from fore ign a i d source. However, t h i s amount exceeded t h a t l i m i t i n 1964 and a t the end of 1965 it passed largely the t o t a l revenues col lec ted i n 1964 - VN$ 28.1 b i l l i o n of advance compared with VN$20.4 b i l l i o n s of r ece ip t s col lec ted
Gold and Foreign Zxchange Reserves Data show the countervalue i n p i a s t e r s of gold and foreign exchange holdings a t the o f f i c i a l rate of exchange. The d o l l a r value i s s h a m a s a memorandum entry.
Deposits include deposi ts of the General Treasury, t h e c o m e r c i a l b s k s , the Counterpart Fund, US-OPned loca l currency accounts, GVN agencies and fore ign i n s t i t u t i o n s .
General Treasury
Besides the National Bank of V i e t - N a m and the commercial banks (Table C-2), banking operat ions a r e conducted by the General Treasury, which not only a c t s f o r the Government i n c e r t a i n matters but a180 receives deposi ts from the p r iva te sector . The balance sheets of the General Treasury a r e not avai lable f o r publicat ion.
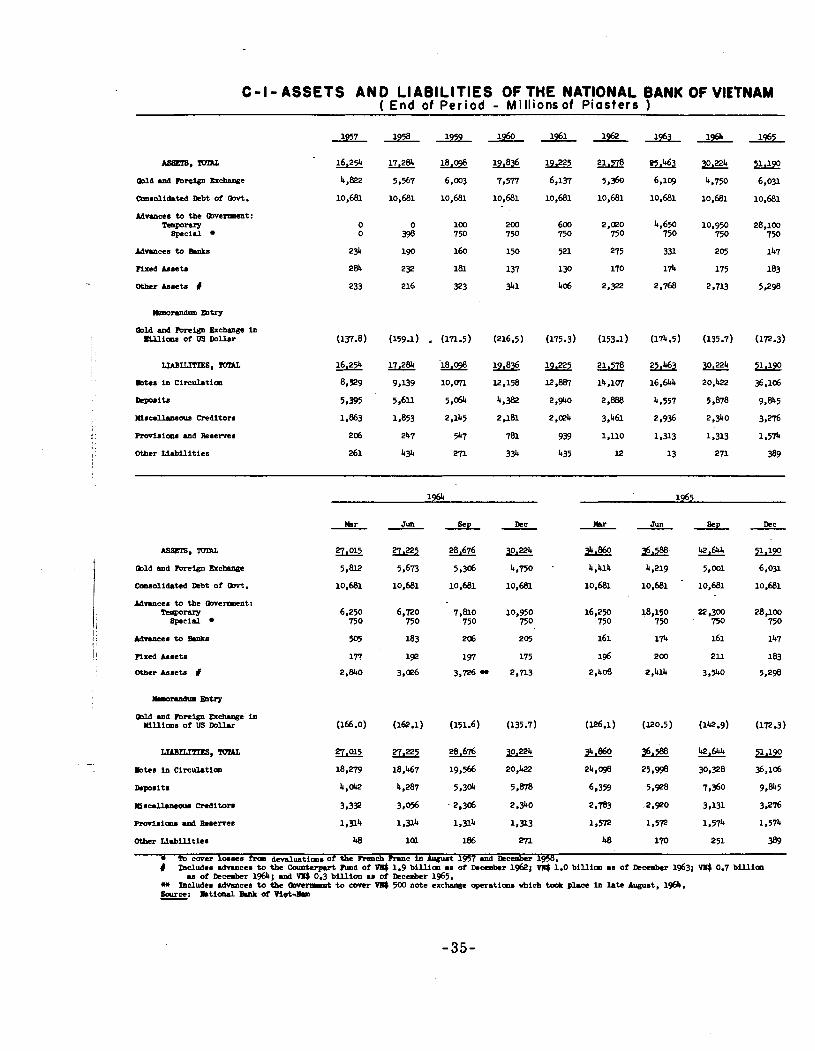
C-I -ASSETS AND LIABILITIES OFTHE NATIONAL BANK OFVIETNAM ( End of Pe r iod - Mill ionsof P iasters )
-, - ~ l l d md m- hehawe
Conaolidatcd Qbt of m.
Advances to the Gmnnent: m r a r g
spccirl
Advances to Bmka
Hxed Assets
Other Assets #
IUB-, TOTAL
b t c s in C i r c S t i o .
nposi ts
Wsccllsncoua Creditors
Pmvlsiaw and Resema
Other l iabi l i t ies
msm, 'KmL
cbld and mi@ mchanec
cmmPlid.tcd Qbt of m.
Advances to the (bvertnnt: Temporarg
spccid
?Ired Asrets
Other Asnetn #
cbla and mrcign Fxchmge in Wllians of US Dollu
Dec
Lx%? 6,031
10.681
28,100 750
147
183
5.293
(172.3)
%L%? 36.106
9,845
3.276
1,574
389
* TO c m v lomws troa deva1uatio.m of tbc M c h h c in t 1957 and Qcember 1 . . # Includes mdwcem to the Camtarpart M d of VH$ 1.9 biU%s of De-r 1962; 2 1 . 0 b i l l io . ms of Q c n k r 1963; VF) 0.7 b i l l io .
M of Qcc lk r 1964; and Vl l$ 0.3 billion as of Qccskr 1965. - Includes advance# to the amenrmt to corer VH$ 500 note exc- operati- rhich took p . in late Wmt. 1964. Bauce: I L t i a u l hrlk of Vi*.llm -
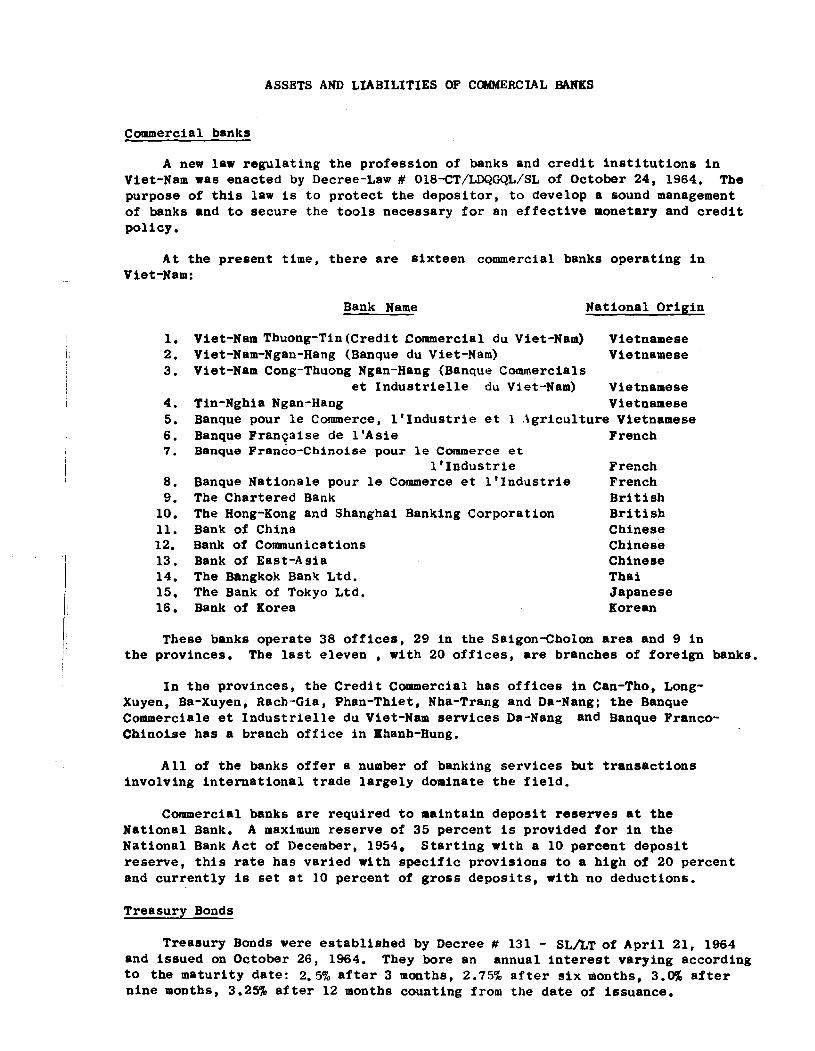
ASSETS AND LIABILITIES OF CaMMERCIAL BANKS
Cormnercial banks
A new law r egu la t i ng t h e profess ion of banks and c r e d i t i n s t i t u t i o n s i n Viet-Nam was enacted by Decree-Law # 018-CT/LDQGQL/SL of October 24, 1964. The purpose of t h i s law is t o p r o t e c t t h e depos i to r , t o develop a sound management of banks and t o secure the t o o l s necessary f o r an e f f e c t i v e monetary and c r e d i t po l icy .
A t t h e presen t t ime, t h e r e a r e s ix t een commercial banks opera t ing i n Viet-Nam:
Bank Name National Or ig in
Viet-Nam Thuong-Tin (Cred i t Commercial du Viet-Nam) Vietnamese Viet-Nam-Ngan-Hang (Banque du Viet-Nam) Vietnamese Viet-Nam Cong-Thuong Ngan-Hang (Banque Commercials
e t I n d u s t r i e l l e du Viet-Nam) Vietnamese Tin-Nghia Ngan-Hang Vietnamese Banque pour l e Commerce, l ' l n d u s t r i e e t 1 . Ig r i cu l tu re Vietnamese Banque Franqaise de 1 'Asie French Benque ~ r a n c o - c h i n o i s e pour l e Commerce et
1 ' I n d u s t r i e French Banque Nat ionale pour le Commerce e t l ' l n d u s t r i e French The Chartered Bank B r i t i sh The Bong-gong and Shanghai Banking Corporat ion B r i t i s h Bank of China Chinese Bank of Communications Chinese Bank of East-Asia Chinese The Bangkok Bank Ltd. Thai The Bank of Tokyo Ltd. Japanese Bank of Korea Korean
These banks opera te 38 o f f i c e s , 29 i n t h e Saigon-Cholan a r ea and 9 i n t h e provinces. The l a s t e leven , with 20 o f f i c e s , a r e branches of f o r e i g n banks.
I n t h e provinces , t be C r e d i t Commercial has o f f i c e s i n Can-Tho, Long- Xuyen, Ba-Xuyen, Racb-Cia, Phan-Thiet, Nha-Trang and Da-Nang; t h e Banque Commerciale et I n d u s t r i e l l e du Viet-Nam s e r v i c e s Da-Nang and Banque Franco- Chinoise has a branch o f f i c e i n Phanh-Hung.
A l l of t h e banks o f f e r a number of banking s e r v i c e s but t r a n s a c t i o n s involving i n t e r n a t i o n a l t r a d e l a r g e l y dominate t h e f i e l d .
Commercial banks a r e requi red t o maintain depos i t r e se rves a t t h e Nat ional Bank. A maximum re se rve of 35 percent i s provided f o r i n t h e Nat iona l Bank A c t of December, 1954, S t a r t i n g wi th a 10 percent depos i t r e se rve , t h i s r a t e has var ied with s p e c i f i c p rovis ions to a high of 20 percent and c u r r e n t l y is s e t a t 10 percent of g r o s s depos i t s , wi th no deduct ions,
Treasury Bonds
Treasury Bonds were e s t ab l i shed by Decree # 131 - SLAT of A p r i l 21, 1964 and i ssued on October 26, 1964. They bore an annual i n t e r e s t varying according t o t h e matur i ty date: 2.5% a f t e r 3 months, 2.75% a f t e r s i x months, 3.0% a f t e r n i n e months, 3.2% a f t e r 12 months counting from the d a t e of issuance.
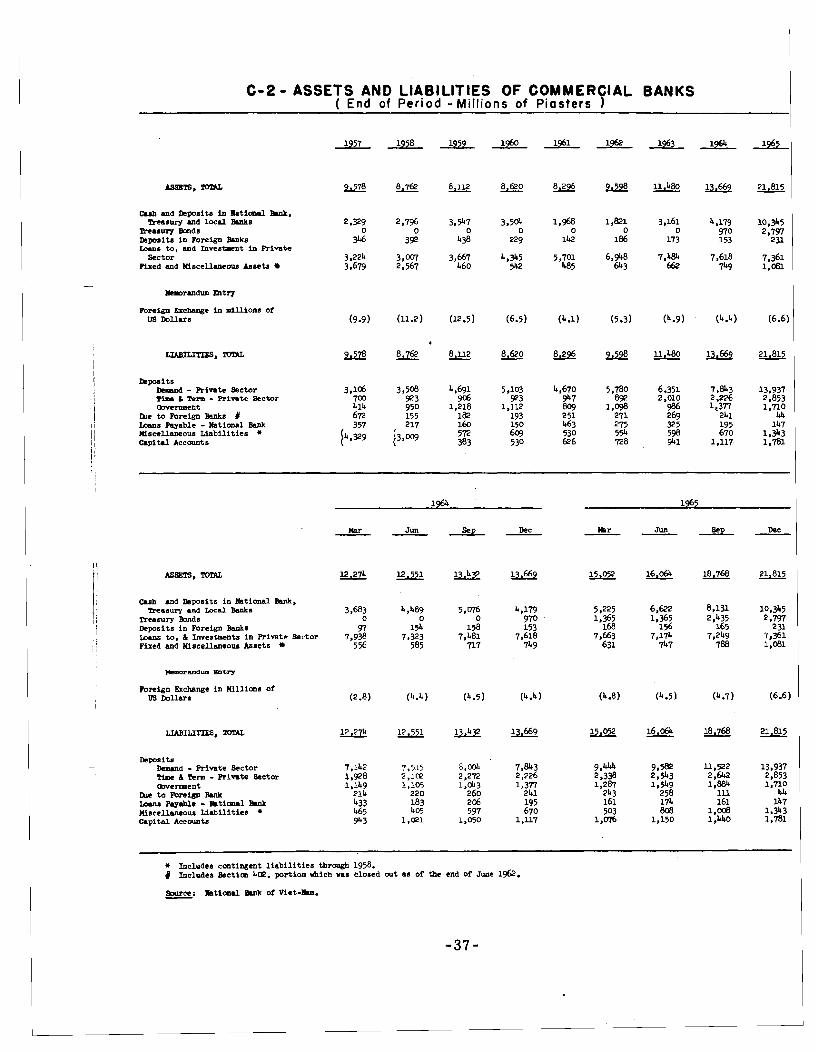
C-2 - ASSETS AND LIABILITIES OF COMMERCIAL BANKS ( End of Per iod -Mi l l ions of Piasters )
mail and Dcposits in llaticosl mnk. Treasury and local h u k s 2 3 9
Treasury M d s 0 &posits in Foreign Banks 346 Loans t o , and Invesbent in R i v n k
Sector 3.224 bed and U l s c e l h m w &sets 3,679
Foreign Exehaoge in millions of us Dollars (9.9)
Qposits D m m d - Rivn t e Sector 3.105 tin & Ttrm - Private Sector 700 ~ovcmment 414
h e to mmign m s I 672 Loans Payable - National Bank 357 Ulscdlaneous Liabi l i t ies + Capital Accounts 14.99
Cuh and Lkposits i n National Bank, Treasury and Local Banks
Treasury BDnds Deposits in Foreign Banks Loaos to , & InverVents i n R iva t c Sector Fixed and Hscellaneous Assets
Foreign &change i n ~ l l i o n s of us Dollars
I kps i t . Iklnrad - R i v a t e Sector Timc 6 Term - Rivn t e Sector m m n t
h e t o mm* BMk Loaos Fay.hle - mtiau l Brnh Hscelhneous Liabi l i t ies + Capital Accounts
Jun
12.551
4 $42
154 7,323
585
(4.4)
12.551
?,5[5 2 , l r e 1,105
220 183 4-
1 ,a1
Sep
&&
5 .46 0
158 7,481
n 7
(4.5)
&!!2
8.m 2,272 1 ,043
260 206 597
1,050
Dec
4,179 970 153
7,618 749
(4.4)
r3,669
7,843 2,226 1 . 3 n
241 195 670
1 ,U7
+ Includes contingent l i a b i l i t i e s through 1958. Includes Bcctim 4CQ. portion vbich was closed out as of the end of June 1962.
MONEY SUPPLY
The Money Supply t a b l e is der ived from Consol idated Balance S h e e t s of t h e monetary and banking system.
"money supply", as used i n t h i s t a b l e , is l i m i t e d concep tua l ly to t h e p r i v a t e sector, 1.e. t h e sum of Notes i n C i r c u l a t i o n 8nd P r i v a t e Demand Depos i t s .
I n o r d e r t o i s o l a t e t h e i n f l a t i o n a r y and d e f l a t i o n a r y f a c t o r s a c t i v e i n t h e monetary and banking system, both t h e F a c t o r s i n C rea t i on of money supply and t h e F a c t o r s i n N e u t r a l i z a t i o n are presen ted .
a . F a c t o r s i n C rea t i on
I n t e r n a t i o n a l Assets c o n s i s t of n e t c l a ims on f o r e i g n agenc ies , (W, IBRD, IDA), gold and f o r e i g n exchange ho ld ings of t h e Nat iona l Bank of V i e t - N a m and f o r e i g n a s s e t s of commercial banks less t h e balance of exchange e q u a l i z a t i o n accounts and of f o r e i g n agenc ies accounts , t h e T rea su ry ' s o b l i g a t i o n t o t h e Ex-fm Bank.
F inanc ing of Government (Cleims on Government) i n c l u d e s a f i x e d amount of 10,681 m i l l i o n p i a s t e r s of Government d e b t s mainly t h e monet izat ion of advances t o fndo-China assumed by t h e Na t i ona l Bank a t i ts incep t i on , but a l s o temporary advances extended t o t h e Government by t h i s agency, and c r e d i t from t h e P r i v a t e S e c t o r (commercial banks, f i rms and i nd iv idua l s ) .
F inanc ing of Business (Claims on Business) i nvo lve s d e b t s and investments con t r ac t ed by t h e p r i v a t e s e c t o r from t h e banking spatem.
b. F a c t o r s i n N e u t r a l i z a t i o n
Quasi-Money i nc ludes t i m e and term d e p o s i t s w i th Commercial banks and Treasury ( i nc lud ing s av ings d e p o s i t s and d e p o s i t s a g a i n s t letters of c r e d i t ) .
Government Depos i t s i nc lude d e p o s i t s of Treasury and government agenc ies and p u b l i c e n t e r p r i s e s w i t h t h e Nat iona l Bank and Commercial Banks.
Depos i t s from Proceeds of Fore ign A i d i nc lude US Aid Counte rpar t and Sec. 402, Sec 505 and PI., 480 T i t l e 1, U. S. -owned local currency funds and o t h e r Fore ign Aid accounts and a p o r t i o n of 5/7 t a x l ev i ed on Fore ign Aid-financed imports.
O the r Fac to r s . T h i s item is a r e s i d u a l of t h e ca rpu t a t i on .
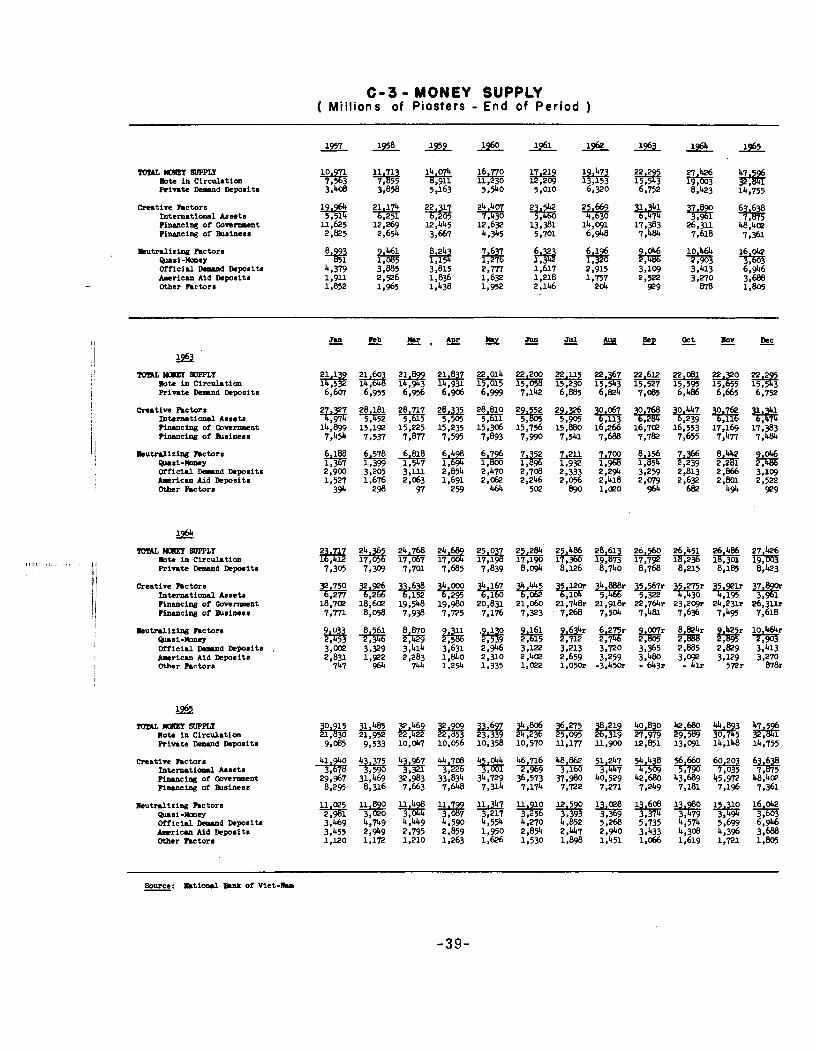
C - 3 - MONEY SUPPLY ( Millions of Piasters - End of Period )
Lutrr l iz- h c t o r r 10 464 16 042 W r i - W e y Official Dcrnd Deposit8
% % * * 4,379 3,885 3,815 2 . m 1,617 2,915 3,109 3,413 6,946
h r i c u r Aid Deposits 1 2,526 1,836 1,632 1,218 1,757 2,522 3,270 3,688 Other h c t o r r 1,852 1,965 1,438 1,952 2,146 204 929 878 1,805
m mrEl SVPPLY lbtc in Circulation R i p r t e DCllld Deposits
Cmmtive Factors Intenmtional Assets ?inaucilI# of Conl.lacnt ?inaucilI# of h s ines s
Lu t r r l i z iog h c t o r s Wsi-lbncy Official W d Deposits b r i c l n Aid Deposits Other Rc to r s
TUmL b u m r n L Y mtc in Circulation R i p r t e Dewd Rpor i t r
Crut ive h c t o r s Intenmtional &net6 mmcilI# of OovcllllcDt FhancilI# of b r i n e r r
TUmL Bmm SUPPLY note in Circulmtion R i p r t e Demvld Rposi ts
Cmmtirc h c t o r r I n t e m t i a u l Assets m c i n g of Government m c i n g of a s i n e s s
Ilcutrrlizing h c t o r s W s i - W e y OIiicial W d Rposi ts b r i m Aid R p o ~ i t r Other h c t o r s
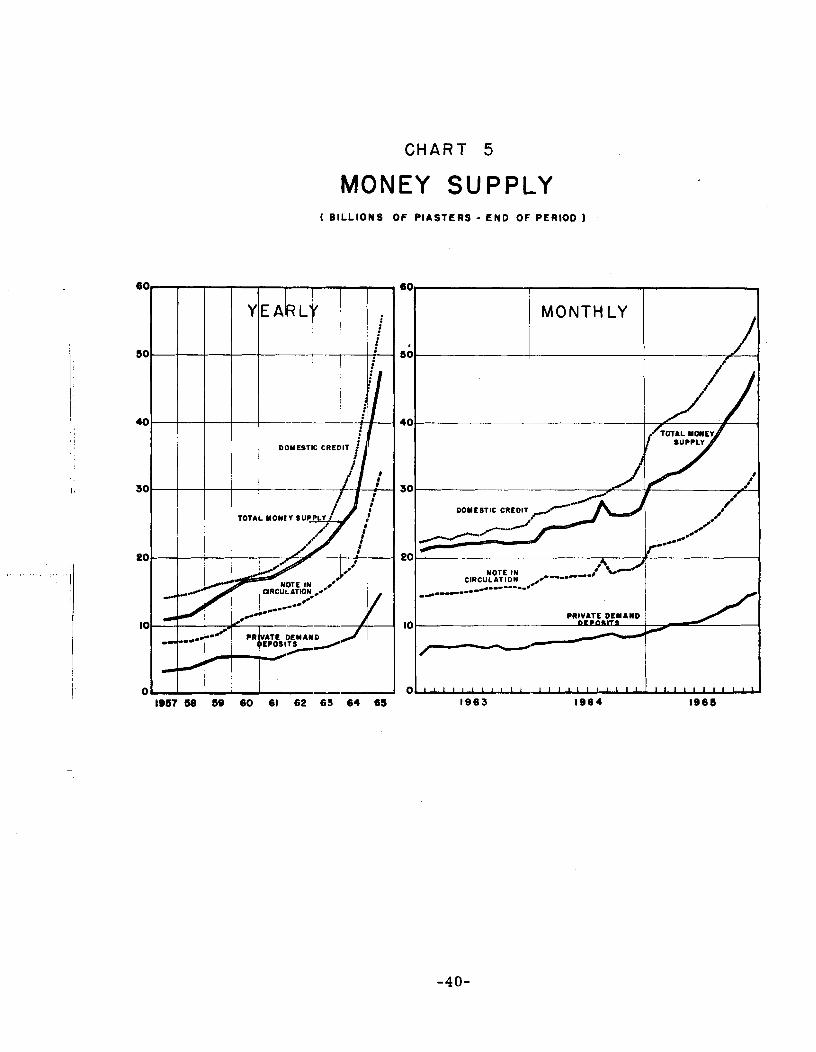
C H A R T 5
MONEY SUPPLY ( BILLIONS OF PIASTERS - END OF PERIOD 1
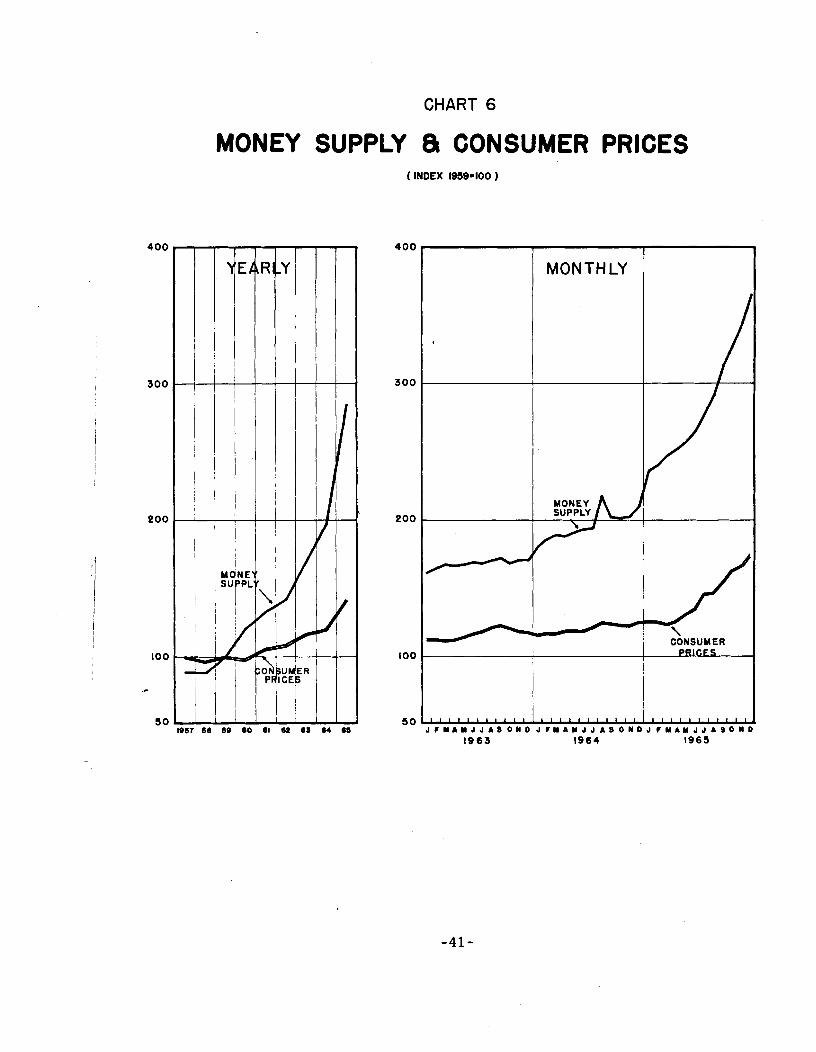
CHART 6
MONEY SUPPLY & CONSUMER PRICES ( INDEX 1959-100 )
YON€ SUPPL
MONTHLY 1
1963
L f Y A Y J J A S O N 0 J C Y A Y J J A S O N O J f Y A Y J J A S O N
1964 1965
FREE MARKET GOLD AND CURRENCY PRICES
Exchange Rates f o r US Do*
O f f i c i a l Rate - There i s no agreed par value f o r t b e Vietnamese p ias te r . The old r a t e , es tabl ished i n May 1953, i s 35 p i a s t e r s per U.S. d o l l a r ; the new r a t e es tabl ished i n June 1966 is 80 p i a s t e r s per US d o l l a r .
Free Market - After the withdrawal of the French Expeditionary Corpa i n the f i r s t half of 1956, the supply of foreign exchange dropped off sharply. Demand f o r exchange f o r prof i t and other t r a n s f e r s , however, remained high and i n large pa r t could not be s a t i s f i e d . This para lys is of t r a n s f e r s dl'scouraged new investment and l ed t o disinvestment largely through i l l e g a l channels. I n order t o s t a b i l i z e the s i t u a t i o n a f r e e market with l imited access was created on June 30, 1956. The National Exchange o f f i c e d i r e c t s the operations of t h i s market. An Exchange Equalization Fund (Fonrls de Regularisation de Change) was s e t up t o intervene i n t h i s market should supply and demand be too f a r out of balance. From 1457 through 1962, the r a t e varied from VN$ 7 3 . 3 6 / U S $ 1 to VN$ 73.41/138$ 1 and remained a t VN$ 73.50/US$ 1 since 1963,
The f r e e market and the ixchenge E ~ u n l i z a t i o n Fund were abrogated i n June 1966 and the Free Market r a t e was replaced by the r a t e of VN$118 per U.S. d o l l a r ( 3 f f i c i a l r a t e VN$80 plus i2conomic Consolidation Surtax or Subsidy VN$38 per U. S, dol lar ) . Rates f o r imports and exports
See notes t o Foreign Trade t ab les
Gold Pr ices
I n Saigon, p r io r t o June 1966 the re was no organized gold market. The purchase of gold, whethar f o r j w e l r y o r i n leaf or bar, was f r e e ; it was sold by l icensed jeweler8 8nd goldsmiths. External t ransact ion8 i n gold were control led by t h e National Exchange Office.
Beginning June 18, 1966, a Fund f o r the S t a b i l i z a t i o n of t h e Gold Market was establiehed and t h e National Bank of Vie t -Ham nor sell8 gold bars t o gold dealer8 through the Commercial Banks. The wholemale pr ice of gold 18 set up d a i l y by t h e Management Board of tha Fund f o r the S t a b i l i z a t i o n of the Gold Market i n order to hamonize t h e i n t e r n a l gold market. The re ta i l p r i ce of gold is calcula ted by adding t o the wholesale p r i ce t h e banking commlmmion (0.751), t h a wholamala p r o f i t margin (10%). and the luxury t a x (10%)
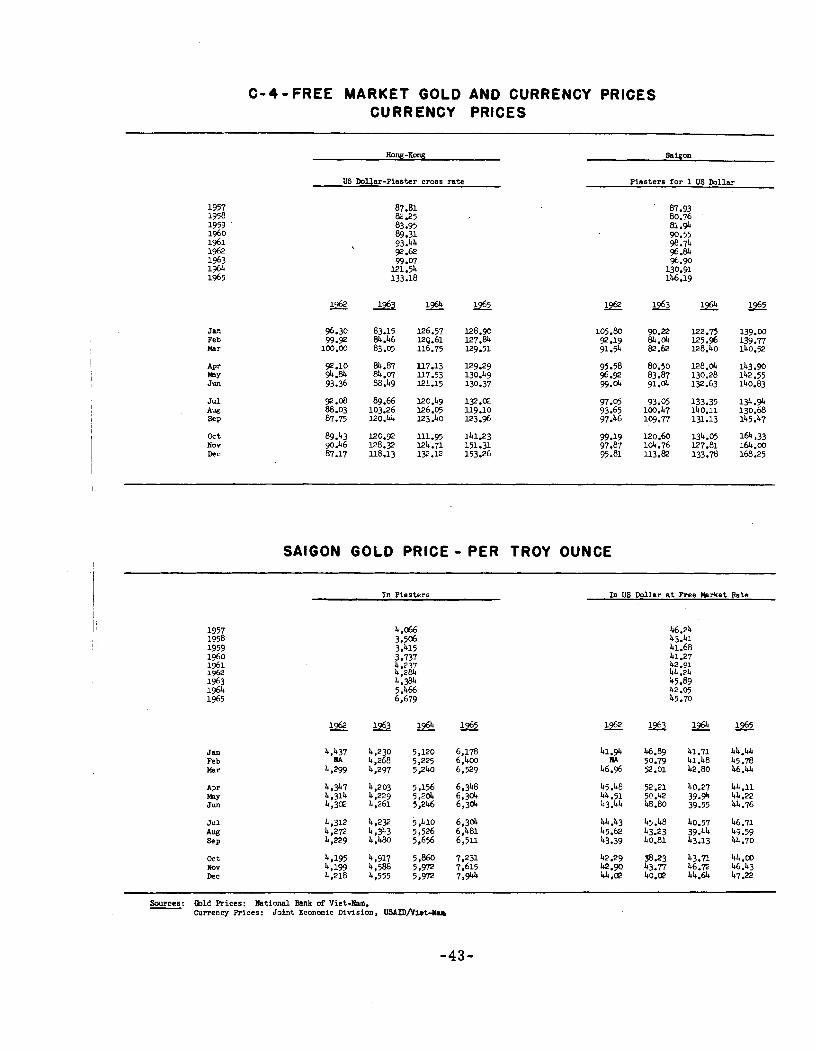
C - 4 - FREE MARKET GOLD AND CURRENCY PRICES CURRENCY PRICES
HOW -gong saigon
US DolJar-Piaster cross rate Piasters for 1 US Dollar
1957 1958 1959 1960 1961 1962 1963 1 9 a 1965
Jan Feb Har
APr B Y Jun
Jul Aw SeP
Oct NOV Llec
SAIGON GOLD PRICE - PER TROY OUNCE I
I !
In Piasters In US Dollar a t Free Mrket Rate
Jan Feb Har
Oc t WV Llec
Sources: mid Prices: National Bank of Viet-Aam. - Currency Prices: Joint Economic Division, USAID/Vlet-XU
-43-
SAVINGS BANK AND CLEARING HOUSE OPERATIONS
Savings Bank - The Savings Bank of Saigon was founded i n 1887. I t is governed by a Board of Administrators of 10 members, the.chairman of which i s the Prefect of Saigon. I t is placed under the technical control of the Treasurer General of V i e t - N a m . The minimum deposit is 10 p ias te r s . The maximum deposit paying In t e r e s t i e 40,000 p ias te r s . The r a t e of i n t e r e s t is fixed a t 1.5 percent per year.
I n 1962, the C r e d i t Commercial opened a savings Departrant i n Saigon and same provincial branches. Data on savingein t h i s bank a r e included i n Table C-2 under " ~ i m e and Term Deposits - Private Sectoi ' ,
Clearing House - The Clearing Houme is s i tua ted a t t h e o f f i c e of t he National Bank of Viet-Nam, Saigon Branch. Clearing takem place twice a day under t he control of a qua l i f i ed representat ive of the National Bank. Every p r iva te bank r u s t #end delegatesto submittheir checkm, b i l l s . etc. f o r mettlement.
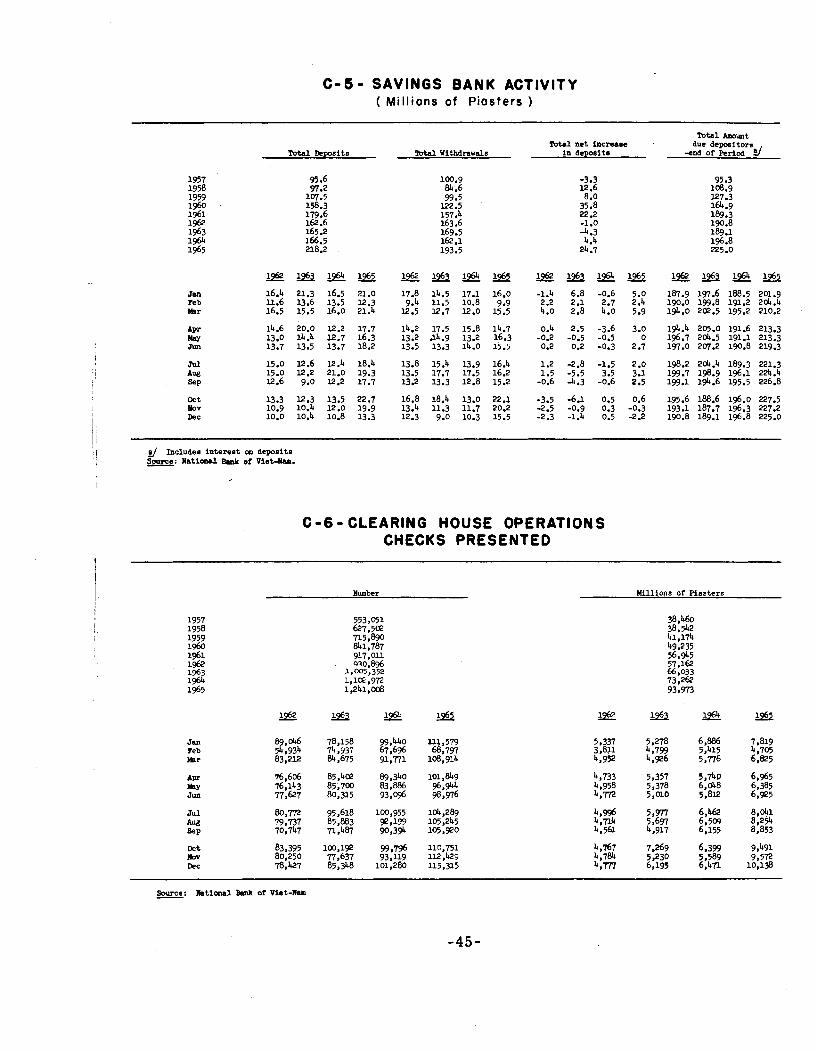
C - 5 - SAVINGS BANK ACTIVITY ( Millions of Piasters )
Total Amount Total net inclrase due depositors
T o t d Qposits 'Ibtd Withdmvals in depobits -end of Period d
Jan Peb Ihr
Oct mv Dec
d Includes interest m deposits Sauee: Natiaul Brink of Viet-Han. -
C - 6 - CLEARING HOUSE OPERATIONS CHECKS PRESENTED
Mlllions of Pissters
Jan Peb Ihr
Jul h &P
Oct Rov Dec
Sauce: R a t i d B.nh of Viet-Ram -
P r i o r t o t h e November 1, 1963 revolu t ion , t h e C i v i l Budget was prepared by t h e Di rec to ra t e General of t h e Budget upon i n s t r u c t i o n s from t h e Presidency. It was then presented t o t h e National Assembly f o r approval. Beginning i n 1964,the budget was prepared by t h e Di rec to ra t e General of Budget with t h e cooperat ion of a l l c i v i l i 8 n and m i l i t a r y agencies. It was then promulgated by t h e National High Council.
The GVN f i s c a l year corresponds t o t h e calendar year. Obl iga t ions aga ins t t h e budget of a given year must be made wi th in t h a t ca lendar year. Actual cash expenditures a r e permitted aga ins t ob l iga t ions under t h a t budget during an add i t i ona l "complementary period". For most budget i tems, t h i s i s a f ive-month period running through May of t h e fol lowing year , but f o r c a p i t a l ou t l ays up t o t h r e e years may elapse.
Rela t ion of US Aid t o t he National Budget
The va lue of commodities imported f o r d i r e c t u se i n J o i n t GVN/US economic, t echn ica l , and counterinsurgency a c t i v i t i e s is n o t included i n t h e GVN National Budget. However, l o c a l currency generated by imports of a i d commodities f o r s a l e through commercial channels e n t e r s t h e National Budget a s a US con t r ibu t ion t o support t h e GVN m i l i t a r y budget. U n t i l 1962 t h i s category accounted f o r t h e f u l l amount of p i a s t e r s generated by s a l e s of a i d commodity imports. Beginning 1962, wi th t h e exchange r a t e reform which r a i sed t h e base p i a s t e r r a t e f o r a i d commodity s a l e s from VN$35 per d o l l a r t o VN$60, a l l a d d i t i o n a l p i a s t e r s c o l l e c t e d an a i d imports i n t h e form of customs and o t h e r import t a x e s rever ted t o t h e National Budget d i r e c t l y a s customs revenue r a t h e r than i n d i r e c t l y a s a id . On June 18, 1966 ,-xchange r a t e was reformed once more and brought t h e base p i a s t e r r a t e f o r a id commodity s a l e s t o VN$118 per d o l l a r . ( O f f i c i a l r a t e VNS80 plus Economic Consolidation Sur tax VN$38). A l l o t h e r p i a s t e r c o l l e c t i o n s on a i d imports continued t o e n t e r t h e National Budget a s customs revenue.
The monetary reform of June 1966, which changed t h e p i a s t e r r a t e f o r t h e U S d o l l a r w i l l cut d o m the est imated amount of VN$ 17.0 b i l l i o n advances from the N B W f o r 19G6.
A l l d a t a i n t he accompanying t a b l e a r e based on planned budget f i g u r e s r a t h e r than on ac tua l revenues and expenditures . Through 1965 cash expenditures were genera l ly q u i t e c l o s e t o planned budget expenditure f i g u r e s , except f o r t he Economic Develop:n%it h d g e t , under which payments f e l l considerably sho r t of l i qu ida t ed expenditures .
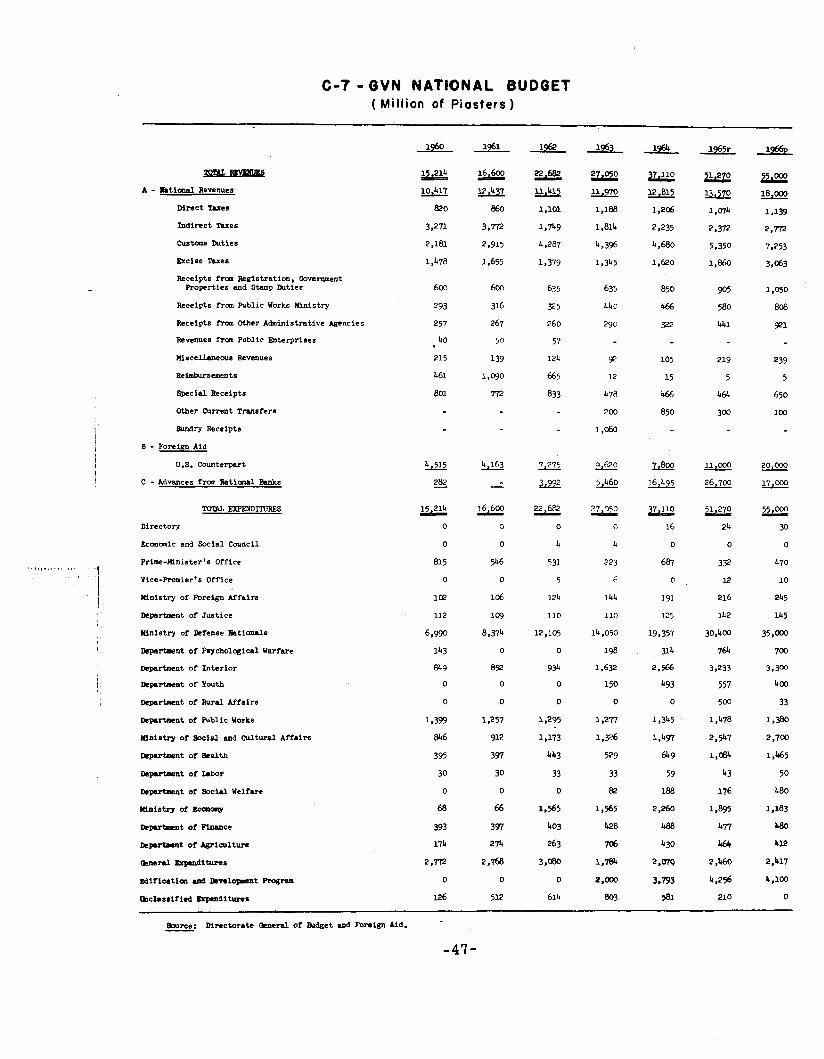
C - 7 - GVN NATIONAL BUDGET ( Million of Piasters )
v A - S a t i d Revenues
M r a c t Taxes
Cust-31~6 h t i e s
Excise Tares
Receipts from Registrat ion, Government Properties and Stamp h t i e s
Receipts from Public Works Kinistry
Receipts from Other Administrative Agencies
Revenues from Public B t e r p r i s e s
l l iscellawous Revenues
Reimburaementa
Special Receipts
Other C u r r a t h M s f e r s
Sundry Receipts
B - Foreign Aid
U.S. Counterpart
C - Advances from W a t i o ~ l Banks
m FXPFM)IWS
Direc ton
Economic and Social Council
Rime-Minister's Office
Vice-premier's Office
Ministry of Foreign Affairs
Deprtmcnt of Jus t ice
Wlnis ty of Ikfende Rationale
Dcpartaent of Psychological Warfare
Dcpartmcnt of In te r ior
Dep.rtment of Youth
DcpartPcnt of Rural Affairs
D r p v t r n t of Public Works
tun is t ry of mid md ~ u l t u x Affairs
Dcpartaent of Health
D e p u h e n t of hbor
Depvt ren t of Social Welfare
tun is t ry Of scalmls
Q m t of Pinrace
Qpvtreot Of & T i C U l t W
Qneral Brpnditurca
m i f i c a t i c a md ~ m i o p n t mnm mclasr i f ied lh-pnditwer
Bource: Mrac tora te lX%-znl of a d g e t and Foreign Aid. -
ACTUAL GVN REVENUE COLLECTIONS
Pr incipal charac te r i s t i c s of the Vietnamese revenue system may be summarized as follows:
- Central Government revenues a re dominant, accounting f o r near ly 90 per cent of t o t a l cen t ra l , provincial , and l o c a l government revenues.
- Within the t o t a l revenue col lec t ion of t h e Central Government, customs dut ies and. foreign a i d account f o r more than 60 percent of the revenue.
The assessment and col lec t ion of cen t ra l government taxes i s divided among the General Directorate of Taxation, the General Directorate of Custorr.~ and the General Treasury, a l l of which are under the ju r id ic t ion of the Minister f o r Finance. Before January 1, 1966, t h e General Treasury col lec ted a l l d i r e c t taxes, o ther taxes being collected by the General Directorate of Taxation. From January 1, 1966, t h e General Directorate of Taxation col lec ted a l l domestic taxes. A l l dut ies and taxes levied on imports and exports a r e collected by the General Directorate of Customs.
Revenue from U,S. Aid i s t ransferred from the Counterpart Fund t o the National Bank of Vietnam mostly f o r use t o support the GVN Military Budget.

C - 8 - ACTUAL GVN REVENUE COLLECTIONS * ( In V N $ Millions )
Direct m e 8
Indirect Tuns
C u s W lLIties
Bci8e Taxes
Regi8tntion -8
Receipts f'nnn O o r e m t Agencies
M m c e h e o o s Receipt8
Eeimbursernts, Refunds
Special Receipts
?oreign Aid
Total
Direct Taxes
Indirect T w s
Cum- lLIties
B c i r e Taxes
Receipt8 trcm Omrnment Agencies
Mscelhuecls Receipts
Reimbur8anents, Refunds
Bpccial Receipts
fore- Aid
Total
s Direct Taxes
Indirect m e s
Cuetams lLIties
B c i s e Taxes
Regiatntion l b e s
Receipta imm Government Agencies
M s c e h e o u s receipts
Reimbursements, Refunds
Special Receipts
POrei5l Aid
Total
A z
137
214
365
169
92
49
4
5
7
394
1,436
es 2.59
397
21
la?
78
P
14
R 4
1 . n 6
ckt - 53
192
597
135
70
94
35
31
465
1.6-
l l 3
238
616
854
129
97
57
21
1.208
3.333
Dec -
115
198
528
log
75
91
58
n
704
1.m
101
194
628
3 l l
96
96
67
48
2.159
3.700
Collection8 in 1963 and ea r l i e r a r e on "17-month basis". collections in 1964 and 1965 a re on a 12-month basis. &urce: Directorat; & n e n l of EuQet and Freign Aid. -
Previous Page Blank
SECTION - D
FOREIGN TRADE a n d
BALANCE OF PAYMENTS
Previous Page Blank
E X P O R T S
U n t i l 1957, most expor ts of r i c e moved a t t h e o f f i c i a l r a t e . Rubber and c e r t a i n o t h e r commodities were exported under EFAC (Compte Exportat ion-Frais Accessoires) arrangements whereby t h e expor t e r could r e t a i n abroad 15% of export proceeds: use 3% f r e e l y and 12qC f o r t h e imports of c e r t a i n spec i f i ed goods which were not a l l w e d t o be imported a t t h e o f f i c i a l r a t e , Exporters of duck f e a t h e r s , bones, l a r d and c e r t a i n o t h e r i t e m s could export under b a r t e r arrangements whereby they could r e t a i n abroad from 30% t o 100% of proceeds and use them f o r import of c e r t a i n s p e c i f i e d items.
From 1957 t o 1961, t h e proceeds of a l l expor t s were r e p a t r i a t e d , 65% a t t h e o f f i c i a l r a t e and 35% a t t h e f r e e market r a t e , o r an e f f e c t i v e r a t e of VN$ 48.48 t o US$1. The N ~ t i o n a l Exchange Of f i ce provided VN$35 of t h i s amount and t!.e r e m i n d e r came from t h e Exchange Equal iza t ion Fund. Export i ncen t ives fo? kany i t e m s continued t o be f inanced from t h e Import- Export Equal izat ion fund.
Beginning June 1.960, t h e procedure was s impl i f ied . The Exchange Equal iza t ion Fund was removed from t h e f i e l d of merchandise t r ansac t ions , a s i n g l e r a t e of VN$<8.48 t o US$ 1 w a s e s t ab l i shed f o r expor ts and a l l equa l i za t ion of expo; t earn ings and import payments was made by t h e Import-Export Equal iza t ion Fund.
On January 1, 1C54 a l l p r i o r Funds, t axes and procedures were abolished except f o r sffiall b a r t e r arrangements wi th Cambodia and Laos. I n p r inc ip l e , expor ts a r e computed a t YN$ 35 t o US$ 1 p l u s a uniform subsidy of VN$ 25 t o US$ 1. I n f a c t , however, only rice expor ts ( l a r g e l y from government s tockp i l e s ) moved a t t h i s rate. Rubber expor ts were sub jec t t o a t a x which brought t h e p i a s t e r y i e l d t o VN$ 45.65 p e r US$ 1; o t h e r expor ts received premiums ranging from V??$ 5 t o YN$ 15.
A Fund was set up a t t h e National Bank, " t h e account f o r Support and Subsidy of Externa l ~ r a d e " i n t o which t h e proceedsof t h e Five- Sevenths Sur t ax on imports a r e deposi ted and from which t h e VN$ 25 export subsidy is paid. Export premiums a r e a l s o borne by t h e account.
S ince 1964, expor ts were stil l computed a t t h e same rate of VN$ 60/1 a s i n 1962 and 1963 ( inc luding t h e uniform subsidy of Y#$ 25 t o US$ 1). Rice expor t s were suspended i n November 1964 a s a r e s u l t of t h e f l o o d devastat ion. Rubber, one of t h e leading expor ts , b r ings a p i a s t e r y i e l d of VN$ 45.65 per US$ 1 s i n c e a 40% t a x i s s t i l l app l i ed t o t h i s i t e m .
With a v i e r t o o f f s e t t i n g t h e reduct ion i n fo re ign exchange earn ings from t h e ban on rice expor ts , secondary ccnmnodities expor t s r e r e l i b e r a l i e e d b y t h e f o l l o r i n g means:
- The t a x on duck f e a t h e r expor ts was c u t by h a l f , from 3- t o 15% (KIB value) e f f e c t i v e March 1964.
- Premiums, which a r e given t o speci f ied c m o d i t i e s on top of the uniform subsidy were ra ised from YN$ 5 t o W$ 40 per US$ 1 e f f e c t i v e March 1965.
- A new incentive p r iv i l ege was applied i n Ju ly 1964 t o handicraft a r t i c l e s and a few other select secondary export items (but excluding rubber, r i c e and der ivat ives , coffee, l i v e buffaloes, marine s a l t , white sand, beer, c iga re t t e s , black t ea ) . Exporters of t h i s merchandise a r e allowed t o use 25 per cent of t h e i r foreign exchange earnings repa t r i a ted i n the previous quar ter t o import c e r t a i n speci f ied luxury goods such a s sugar preparations, da i ry products, f r e s h and d r ied f r u i t s , beverage, chinese medicines, high c o s t t e x t i l e f a b r i c s , mater ia ls f o r mosquito ne t s , woolen blanket, and specia l lypapers . Beginning i n Apr i l , 1964, t h i s list was extended t o motion pic tures , children toys and t o i l e t and beauty products. Exporters benef i t t ing from t h i s pr iv i lege were a l s o authorized t o ask a licensed importer t o import f o r t h e i r om account one o r severa l coaanodities l i s t e d above i f they did not hold appropriate import business licence. Effec t ive January 1, 1965, imports e l i g i b l e f o r f inancing under these 2% export re tent ion r i g h t s were not e l i g i b l e f o r foreign exchange a l loca t ions under regular import l icensing, with t h e exception of motion pic tures .
I n l i n e r i t h t h i s incentive policy, o ther measures were contemplated by the Export Development Center established i n November 1964 t o boost export potent ia l . These involve ind i rec t and d i r e c t ass is tance by t h i s agency:
- indi rec t : t o guarantee c r e d i t s t o approved exporters by banks o r o ther i n s t i t u t i o n s , and t o insure export c r e d i t s i n regard t o n a t u r a l d i s a s t e r e , p r i c e , t h e exchange r a t e and r i s k s on payments involved i n exports.
- di rec t : t o hypothecate exportable goods s tored i n warehouses i n Saigon o r i n provinces, t o extend working funds t o exporters t o buy merchandise d i r e c t l y from producers f o r exportat ion o r t o a s s i s t t h e development of t h e i r a c t i v i t y i n Viet-#am o r abroad by loaning c a p i t a l t o producers of exportable manufactures.
Effec t ive June 17, 1966, exports a r e computed a t VN$ 80 t o US$ 1 plus a uniform subsidy of V10$ 38 t o US$ 1 (Eccmamic Consolidation Subsidy) Export premiums were abolished and the t a x on duck fea the rs exported was moved from 1% t o 202, t h e t a x on expartea mhmr n s stil l 4096.
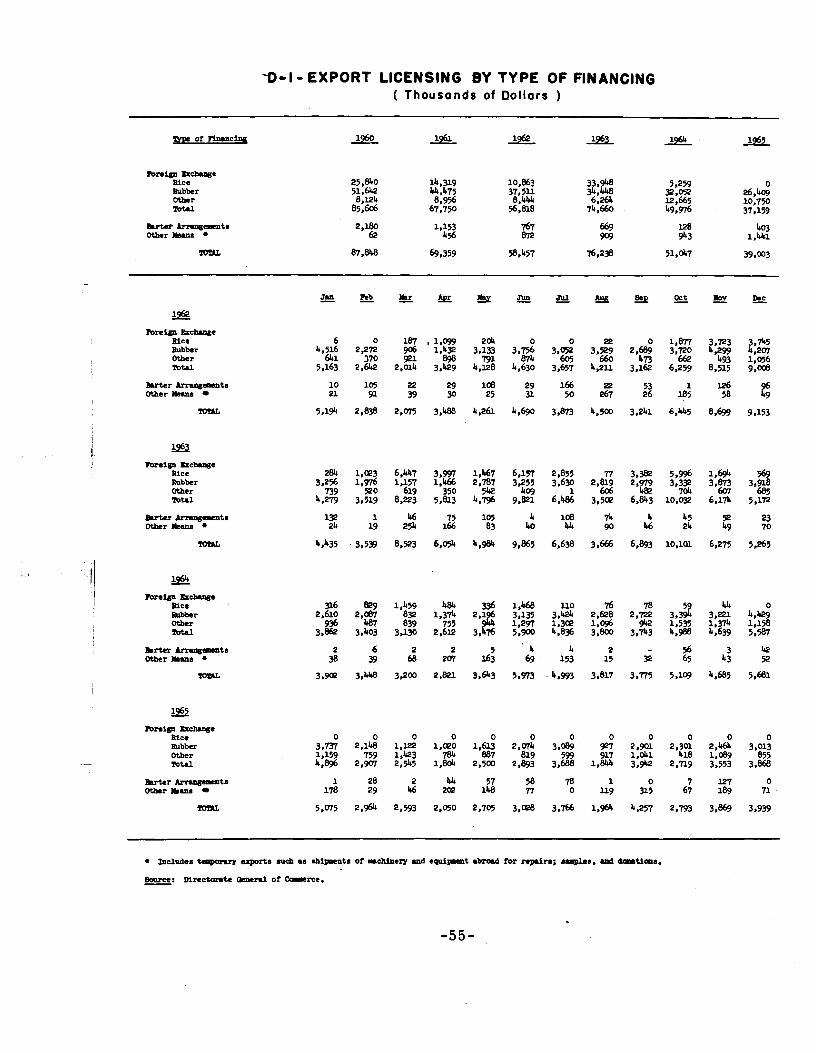
-0- I - EXPORT LICENSING BY TYPE OF FINANCING ( Thousands of Dollars )
Brrtcr m a ~ l l t n Other l k n 8
Foreign Ihcbuqe Rice Fatbber Other -1
Bvtcr A m u w m m t s Other L m s
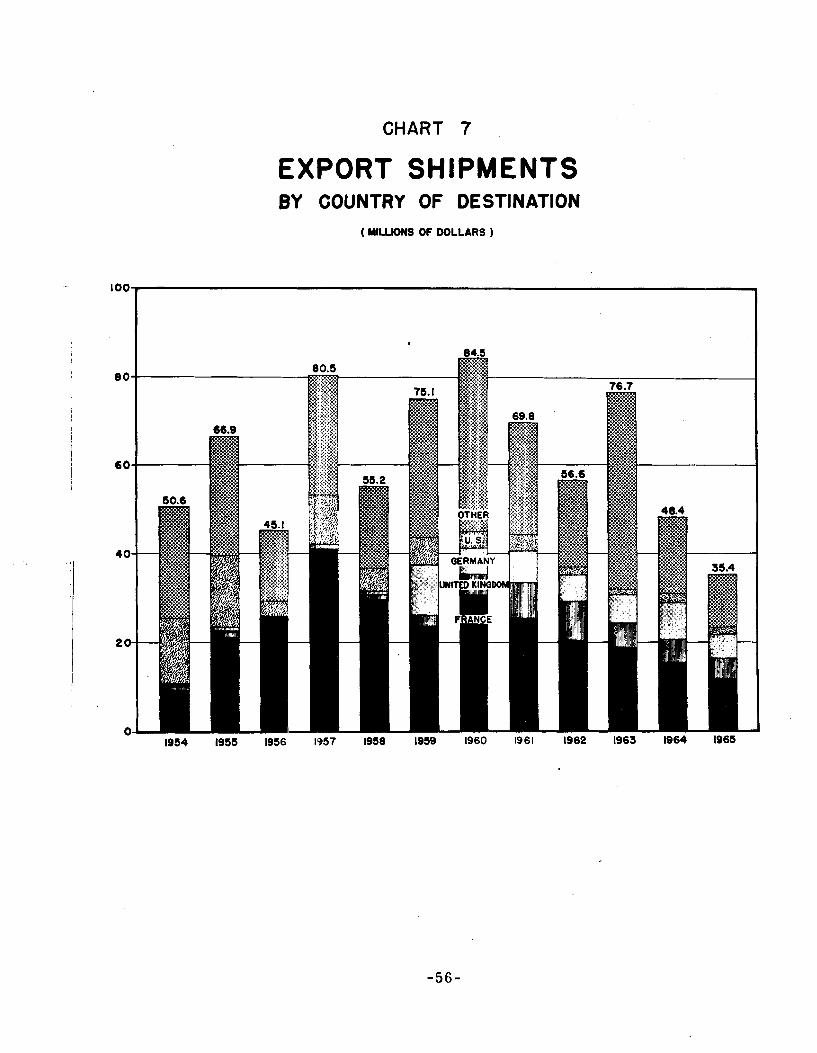
CHART 7
EXPORT SHIPMENTS BY COUNTRY OF DESTINATION
( MILUONS OF DOLLARS )
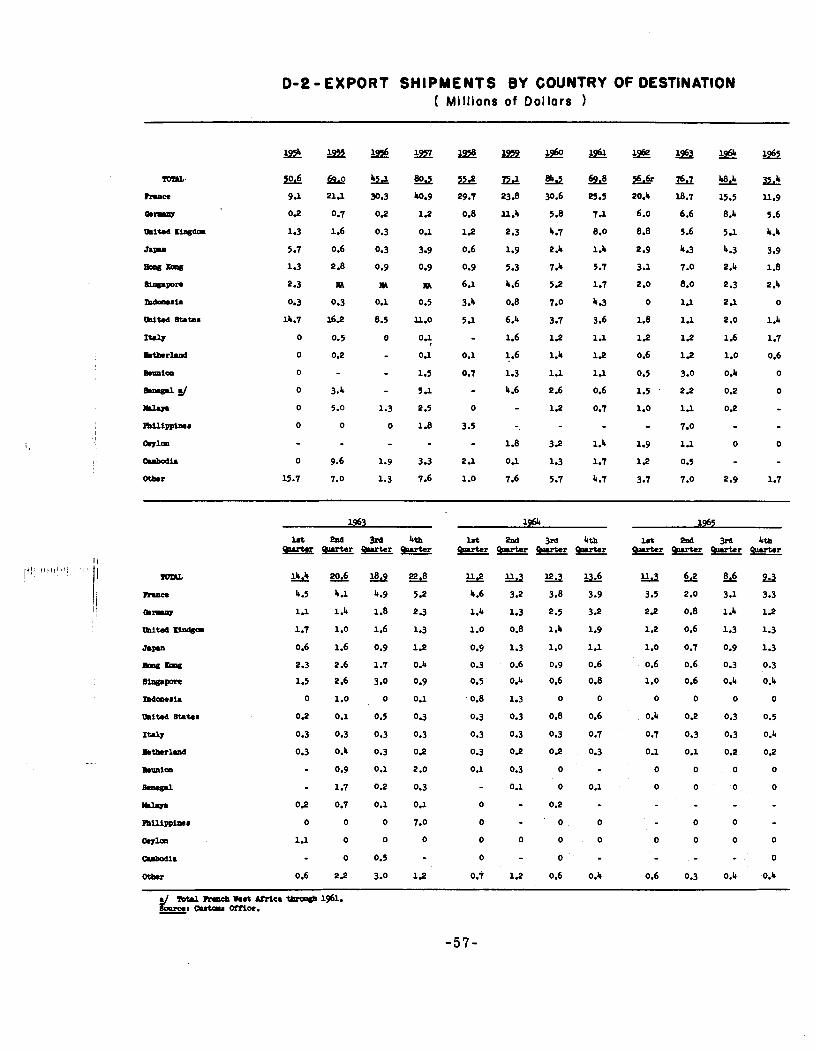
D-2 - EXPORT SHIPMENTS BY COUNTRY OF DESTINATION ( Mill ions of Dol lars
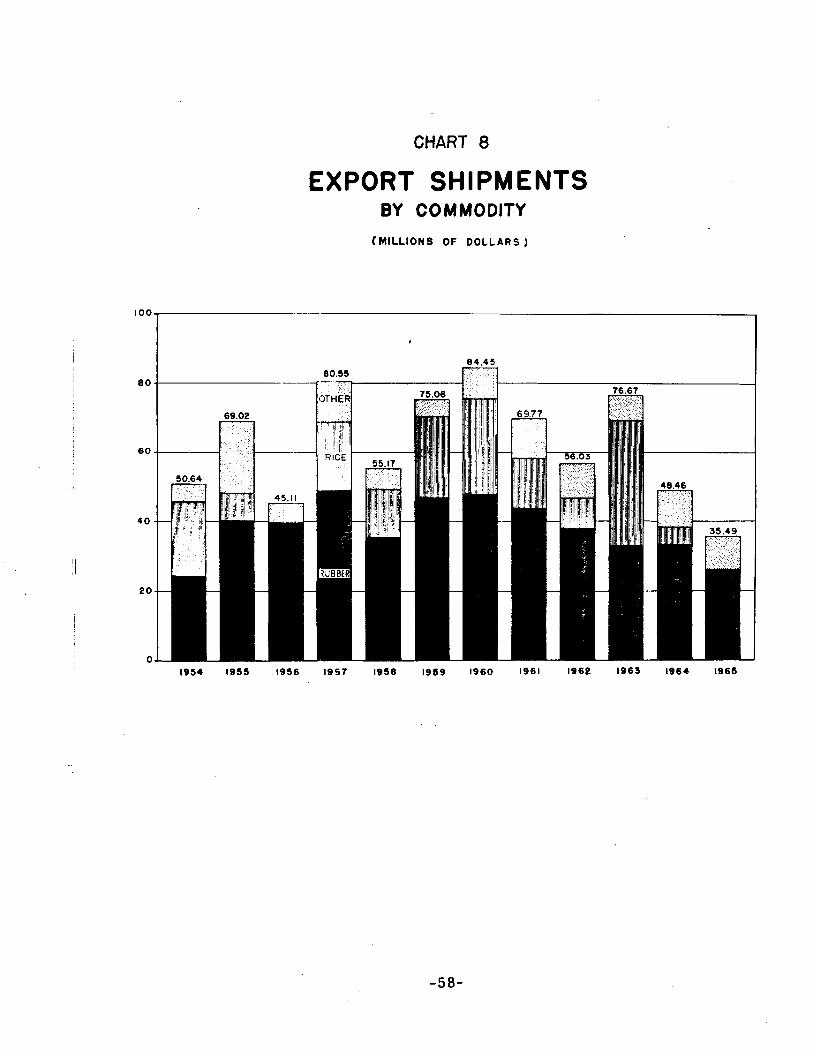
CHART 8
EXPORT SHIPMENTS BY COMMODITY
(MILLIONS OF D O L L A R S )
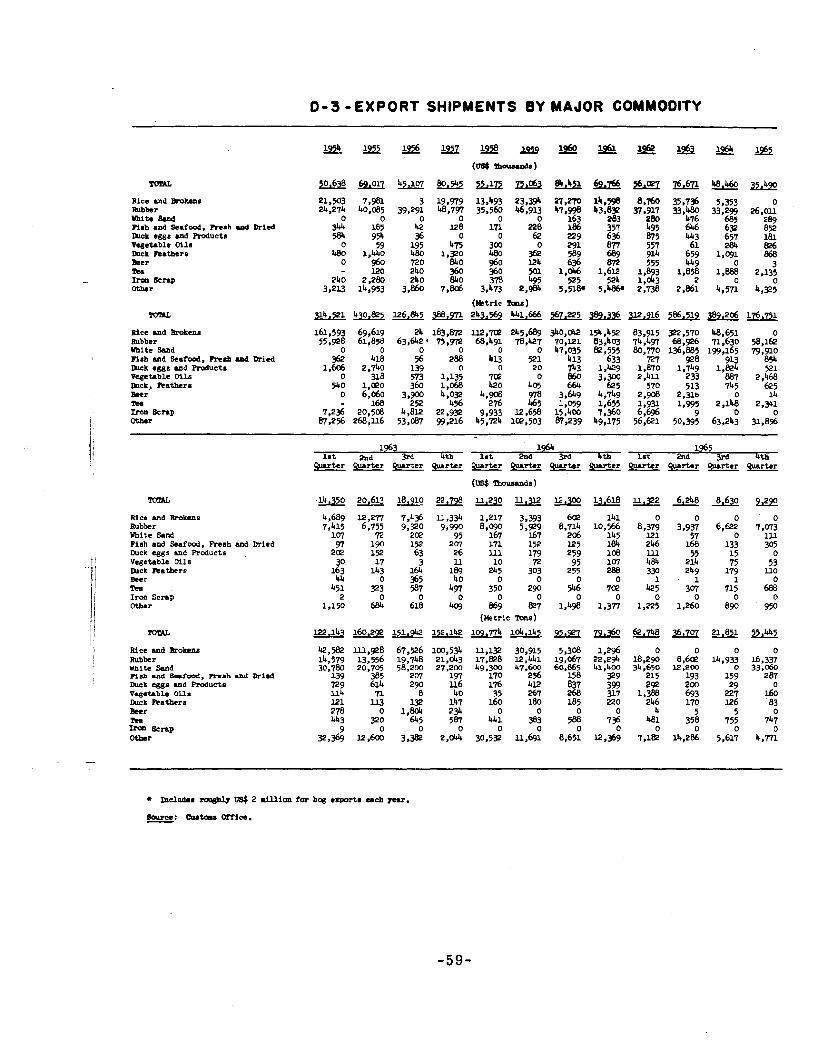
0 - 3 -EXPORT SHIPMENTS BY MAJOR COMMODITY
Rice m d Prokens 161,593 69,619 24 183,872 112,702 245,689 j40,042 154,452 83.915 92,570 48.651 0 Rubber 55.928 61.858 63,6421 75,972 68,491 78,427 70,Ul 83,403 74,497 65,926 71,630 58.162 White Sand 0 0 0 0 0 0 47,035 IP.555 80,770 136,885 199,165 79,910 n a b md Searood, h . b and Dried 362 418 56 288 413 521 413 633 R 7 928 913 854 mck eggs .ad RPdvcts 1,606 2.740 139 0 0 20 743 1.429 1.870 1.749 1,824 521 Vqetable Oils 0 3 8 573 1,135 702 0 860 3,300 2.4I-l 233 887 2,468 tuck. R a t h r a 540 1.020 360 1.068 420 405 664 625 570 513 745 625 mr 0 6.060 3 . 9 4,032 4,908 978 3.649 4.749 2 . 9 2 . m o 14 ~a - 168 225 456 276 465 1,059 1,655 1.93 1,995 2,148 2.34; ~ m n scrap 7,236 20,508 4,812 22.932 9,933 12,628 15,400 7,360 6,696 9 o
t Oehr 87.256 268,ll6 53,087 9,216 45,724 102,503 87,239 49,175 56,621 50.395 63.243 3.8%
TOTAL
Rice md &%kens Rubber m i t e Sand Fish and Seafood, Fresh and Dried Duck eggs and Products Vegetable Oils tuck Rathers
/ 1- scrap
I other
ii I TOTAL
Rice M d Brolrans Rubber m i t e sand m.h md Gcriood, m s b md Dried Duck eg@ md Roducta vc%etable O i l 8 Ihck Rathers Beer Ik 1- Scrap Other
1563 1964 1s t 2nd 3rd k t h l a t 2nd 3rd 4th Ist
W t e r Quarter Qarter Quarter Quarter Wrbr Quarter Qvter Qmrter
(Metric - 8 )
1965 2nd 3rd 4th
W e r Quarter Quarter
16a 133 305 55 15 0
214 75 53 249 179 L l O
1 1 0
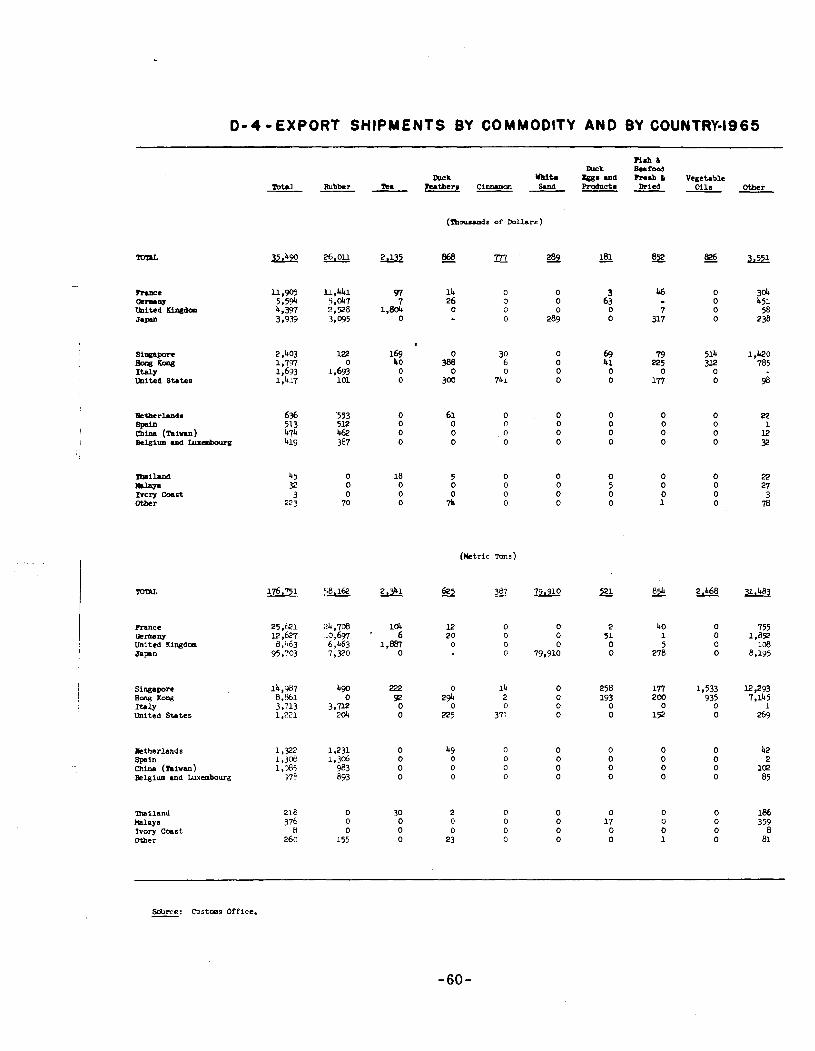
SHIPMENTS BY COMMODITY AND BY COUNTRY-1965
Hall& 8cafood h a h &
Dried Vegetable
o i l s Other
lbai land lussr Ivory coast other
( M t r i c Tuns)
TOTAL
Rance Cemw United Kingdom Japan
755 1,852 lca
8,195
Singapore Ao% K O W I t r l y United States
Rtherlands S p i n China ( h i v a n ) BeQium m d Luxembourg
ltmiland h l a y a Ivory c m s t Other
Sobrce: Customs Office. -
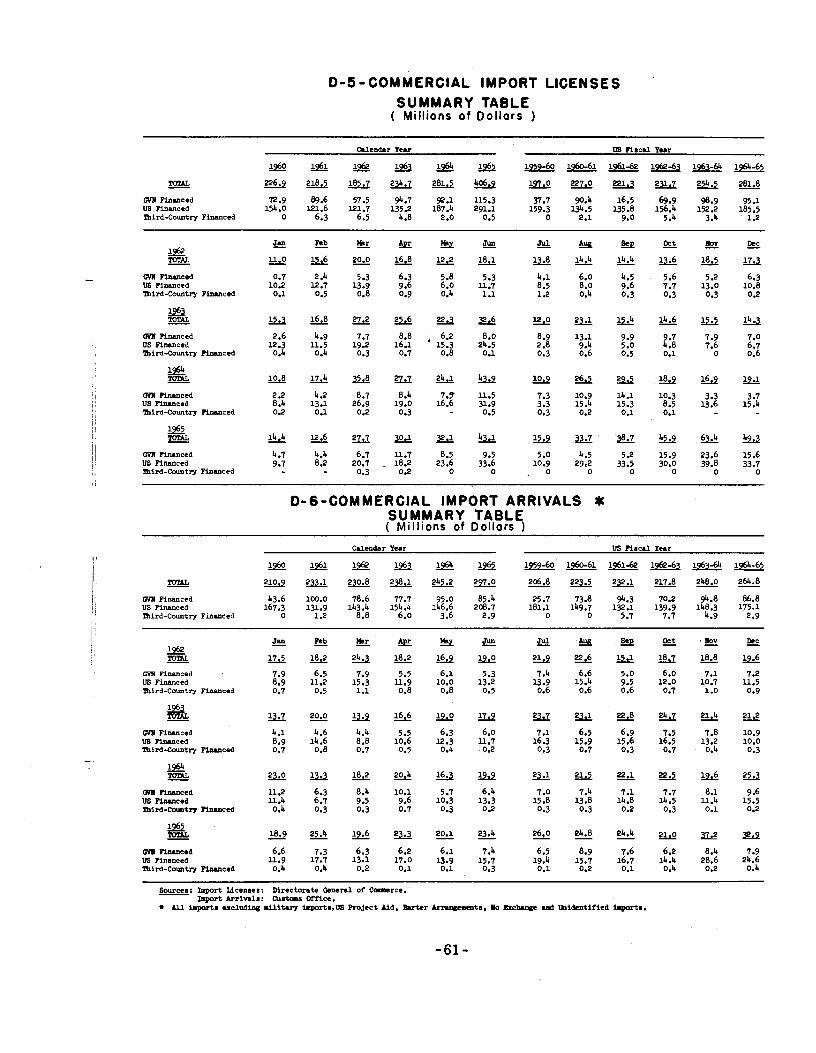
0-5-COMMERCIAL IMPORT LICENSES SUMMARY TABLE
( Millions of Dol lars )
Orlendar Y e u W m r c r l Year
TOTAL - -218.5-m- - 2 2 1 t l 2 5 4 . 5 -
(i~11 Pinmced I2.9 89.6 57.5 94.7 92.1 115.3 37.7 90.4 16.5 69.9 98.9 95.1 US Mnanced 191.0 ~3.6 121.7 135.2 187.4 291.1 159.3 134.5 U5.8 156.4 152.2 185.5 mird-Country Financed 0 6.3 6.5 4.8 2.0 0.5 0 2.1 9.0 5.4 3.4 1.2
J a l l * b E & @ c ! L w o c t a o v - Dcc
- - l l . O l & 2 O . o l 6 - 8 ~ ~ l J g 1 4 . 4 1 4 . 4 u 1 8 . 5 - (;Ya Financed 0.7 2.4 5.3 6.3 5.8 5.3 4.1 6.0 4.5 5.6 5.2 6.3 U6 Financed 10.2 12.7 13.9 9.6 6.0 11.7 8.5 8.0 9.6 7.7 13.0 10.8 mini-country ~ inrnced 0.1 0.5 0.8 0.9 0.4 1.1 1.2 0.4 0.3 0.3 0.3 0.2
liYll Financed 2.6 4.9 7.7 8.8 , 6.2 8.0 8.9 13.1 9.9 9.7 7.9 7.0 US Financed 12.3 11.5 19.2 16.1 15.3 24.5 2.8 9.4 5.0 4.8 7.6 6.7 m i n i - ~ o u n t r y Pinrnced 0.4 0.4 0.3 0.7 0.8 0.1 0.3 0.6 0.5 0.1 0 0.6
(WII m m c e d 2.2 4.2 8.7 8.4 7.9 11.5 7.3 10.9 14.1 10.3 3.3 3.7 US Pinrnced 8.4 13.1 26.9 19.0 16.6 31.9 3.3 15.4 15.3 8.5 13.6 15.4 mini-country Flnmced 0.2 0.1 0.2 0.3 - 0.5 0.3 0.2 0.1 0.1
OYll Pirunced 4.7 4.4 6.7 11.7 8.5 9.5 5.0 4.5 5.2 15.9 23.6 15.6 US Financed 9.7 8.2 20.7 -18.2 23.6 33.6 10.9 299 33.5 30.0 39.8 33.7 mini-country Pinmced - 0.3 0.2 0 0 0 0
0-6-COMMERCIAL IMPORT ARRIVALS * SUMMARY TABLE ( Millions of Dollars )
Crlendar Year US F i scr l Year
s l& 1959-60 1960-61 1961-62 1962-63 1563-64 1964-65
TOTAL - ~ ~ 2 4 5 . 2 2 9 7 . 0 - 2 0 6 . 8 m w 2 1 7 . 8 2 4 8 . 0 2 6 4 . 8 OYll Fimnced 43.6 100.0 78.6 77.7 95.0 85.4 25.7 73.8 94.3 70.2 94.8 86.8 US P i ~ n c e d 167.3 13.9 143.4 154.4 146.6 208.7 181.1 149.7 132.1 139.9 148.3 175.1 mird-Country Pinmced 0 1.2 8.8 6.0 3.6 2.9 0 0 5.7 7.7 4.9 2.9
m Financed US Firwced mid-Country PiMnced
OYll Financed V8 Flnmced mini-try m e e d
Wll Flnmced US Flnmced min i -countr~ m m c e d
on Flnmcea US Financed mini-Country Flnmced
5 & .= - Dcc
l& la lg2&
5.0 6.0 7.1 7.2 9.5 12.0 10.7 11.5 0.6 0.7 1.0 0.9
Sources: Import Licenses: Directorate General of Coaprce. Import hinl.: Cuatm6 CfYlce.
r ~1 import. ucludiug nilituy impartr,~8 ~ o j e c t id, b r t e r -to, lo R C ~ aod midentifled import..
IHPORTS FINANCED BY U.S. A I D
Agency f o r International Development
From i t s inception i n 1955 through 1961, a l l imports o f f i c i a l l y recorded a t the r a t e of VN$ 35 t o US$ 1. However beginning in 1957, the effect ive r a t e was increased by means of production tax levied on a l l US-financed imports a t a minimum ra t e of VN$ 40 per US$, and an average r a t e of VN$ 42; i n addition, a perequation tax was levied on a few items.
Since January 1962, these two taxes were replaced by a Five-Sevenths tax (VN$ 25 per US$ 1) of which the proceeds are deposited i n t o the Counterpart Fund. Custms duties are now credited t o the GVN account ra ther than t o the Counterpart Account. Customs duties on these CIP imports generally average lower than those on Gld-financed imports which include a s ignif icant f ract ion of high taxes on luxury and semi-luxury imports.
Effective June 17, 1966, the new exchange r a t e of the pias ter : ~ ~ $ 8 0 per US$ 1, and the Economic Consolidation Surtax of VN$ 38 per US$ 1, are applied t o A I D imports.
Requests f o r l icenses a r e made t o the Directorate General of Commerce; authorized l icenses are transmitted t o the American Aid Section of the National Bank fo r approval. Importers a re not required t o obtain separate approval f o r exchange from the National Exchange Office. Licenses a re issued under Procurement Authorizations (PA). These a r e authorizations from the Agency f o r International Development t o purchase cer ta in specified commodities. Foreign suppliers a r e paid by A.I.D. i n dollars: the importer pays p ias te rs which are deposited in to the Counterpart Fund .
From the inception of the Program t o the end of 1960, the ciollar funds authorized could be spent i n any f r ee world country. Since December 5, 1960, however, due t o the drain of US gold holdings, new funds authorized a re l imited t o purchases in e i t he r the U.S. or i n developing countries. Since July 1, 1962 these funds may not usua;ly be spent i n Austria, Belgium, Canada, Cuba, Denmark, France, Germany, I t a l y , Japan, Luxembourg, MonhCor the Netherlands, New Zealand, Norway, South Africa, Spain, Sweden, Switzerland and the United Kingdom. Waivers of t h i s ru le have been granted where there would otherwise have been serious impairment of program goals.
Food f o r Peace (Formely called Public Law 480)
PL 480 i s the Agricultural Trade Development and Assistance Act. Under T i t l e I of the Act, surplus agr icu l tu ra l commodities may be sold t o fr iendly countries fo r the currency of t h a t country. These goods are licensed i n the same way as Procurement Authorizations.
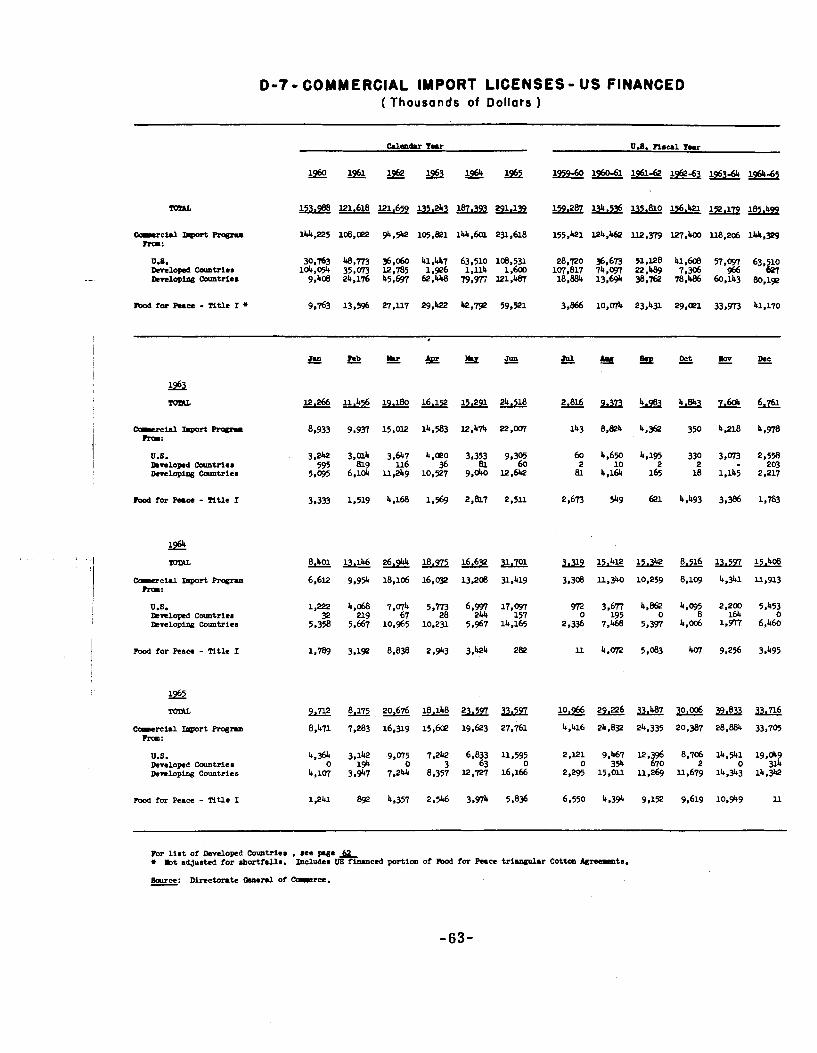
D-7- COMMERCIAL IMPORT LICENSES- US FINANCED ( Thousands of Dollars )
rn for Puce - n t l e I 3,333 1.519 4,168 1.569 2,817 2.5ll
U.S. Rve lopd C m t r i e r Rvelopisg Covntriea
rood f o r Peace - Tit le 1 1,789 3.192 8.838 2.943 3.424 262
s52 TOML
Courci .1 Iapbrt Rogm Roo:
U.S. Developed Carntriea Developing Countries
R-A for Peace - Tit le I 1.241 892 4.357 2.546 3 . H 5.836
For l i r t of Developed Cormtrier . see p e e + bt adjusted fo r ahortfsllr . Includer U8 financed portion of ReJ for Race trimnguhr Cot- Agroemnta.
IMPORTS FINANCED BY GVN AND THIRD COUNTRIES
GVN Financed
P r i o r t o 1957, a very l i m i t e d volume of imports moved a t t h e o f f i c i a l r a t e of VN$ 3 5 per US$ 1.
Customs d u t i e s were l ev i ed on most imports and t h e r e was a s p e c i a l t a x on c e r t a i n imported goods such a s gaso l ine , t e x t i l e s and wheat f l o u r . The funds from t h i s t ax were depos i ted i n t o an account wi th t h e Treasury ( i n t o t h e Import-Export Equal iza t ion Fund) and used f o r s u b s i d i e s t o encourage expor t s of secondary items.
During 1957, EFAC was abol ished and b a r t e r arrangements were discouraged. Items on a l im i t ed l ist of products were a l l w e d * be imported a t t h e o f f i c i a l r a t e ; t h i s was c a l l e d " ~ e g u l a r " procedure and included imports on government account. A perequation t a x ranging from 20% t o 100% was l ev i ed on many of t he se imports. Receipts were depos i ted i n t o t h e Import-Export Equal iza t ion Fund.
Another l ist of products was allowed t o be imported f o r high-cost exchange; t h i s was c a l l e d " ~ p e c i a l " procedure, and t h e high c o s t r e s u l t e d from t h e imposi t ion of a s t a b i l i z a t i o n s u r t a x which brought t h e e f f e c t i v e c o s t of US$ 1 from VN$ 110 t o VN$ 74 over t h e years . The Exchange Equal iza t ion Fund which had been set up f o r i n v i s i b l e t r a n s a c t i o n s was broadened t o cover merchandise. The p i a s t e r s paid f o r fo re ign exchange by importers under " ~ p e c i a l " procedure were deposi ted up t o t h e amount of t h e f r e e market r a t e i n t o t h i s fund, and the remainder i n t o t h e Import-Export Equal iza t ion Fund.
During t h i s per iod , customs d u t i e s were progress ive ly increased on most items and a production t a x was l ev i ed on imports f i r s t a t 15%, 2556, 35%, but increased i n J u l y 1961 t o 18%. 30%, 42%.
On January 1, 1962 a l l p r i o r funds, t a x e s and procedures were abol ished. Imports a r e computed a t VNS 35 t o US$ 1 p l u s a VN$ 25 t o US$ 1 " s u r t a x f o r Nat ional Defense and Economic ~eveloplpent" (Five- Servenths Sur tax) . Imports were sub jec t t o g r e a t l y increased import taxes: customs d u t i e s ranging from 15% t o 210% and a u s t e r i t y t a x from 15% t o 3 0 a
A Fund was set up a t t h e Nat ional Bank, " the Account f o r Support and Subsidy of Externa l ~ r a d e " i n t o which t h e proceeds of t h e Five- Sevenths Su r t ax on imports a r e deposi ted and from which t h e VN$ 25 export subsidy i s paid.
S ince 1964, imports continued t o moved a t t h e r a t e of VN$ 60/US$1. However, r e s t r i c t i o n s were placed on a c e r t a i n number of imports: luxury products , commodities no t necessary t o t h e economy, and a r t i c l e s which can be manufactured l o c a l l y . These r e s t r i c t i o n s took t h e form of e i t h e r (a) high import t axes (customs d u t i e s ranging from 15% t o 210% and a u s t e r i t y t axes on s e l e c t e d items of an a d d i t i o n a l 15% t o 45%) o r (b) t h e levy of o the r add i t i ona l t a x e s (perequat ion t a x e s over and
above the ex i s t ing customs d u t i e s and a u e t e r i t y t a x a s In the case of c e r t a i n yarns: t h i s perequation t a x is levied e f f e c t i v e J u l y 1964 a t the r a t e s of 24% and 3% on CIF value f o r cot ton and spun rayon respectively) o r (c) the temporary o r i n d e f i n i t e suspension of importation. By con t ras t , ce r t a in o the r i m p o r t s such a s f e r t i l i z e r s , raw mater ia ls f o r l o c a l industry, c a p i t a l goods were l i b e r a l i z e d . Since November 1964, incent ive awards t o machinery and equipment imports dest ined f o r i n d u s t r i a l development were granted i n the forn of subeidy of 20 per cent on CIF value ca lcula ted a t the r a t e of 60/1. The average subsidy r a t e on f e r t i l i z e r s was 3% on the CIF cost .
Imports from France were temporarily prohibi ted s ince January 1964 but exceptions were made f o r a few items which a r e st i l l authorized t o be imported such a s spare p a r t s and accessories f o r French-made motor c a r s (taxicabs).
On March 5, 1966, a new perequation t a x is implemented on GVN own foreign exchange imports, r a t e ranging from VN$ 5 per US$ 1 t o Y#b 140 per US$ 1, with an average r a t e of VN$ 40 per US$ 1.
Effec t ive June 17, 1966, the new exchange r a t e of the p ias t e r : VN$ 80
i per US$ 1, and the Economic Consolidation Surtax of VN$ 38 per US$ 1, a r e applied t o a11 imports.
I
I I n general, requests f o r import and export l i censes a r e made t o t h e Direc tora te General of Commerce, and approved l i censes a r e passed t o the Natdopal Exchange Off ice .
Third Country Financed I! a. French Loans
I 1
These a r e commercially imported goods coming i n under loans made by French banks f o r purchase i n France. French exporters a r e paid i n France under the export guarantee system k n o m a s COFACE. The Importer pays p l a s t e r s to the Government of Vlet-Nan, which has undertaken t o repay France i n Francs over a period of f i v e years. Licenses a r e required and customs du t i e s a r e levied on these goods.
b. Japanese Reparations
A pa r t of t h e Japanese Reparations Agreement provided f o r a grant of $7.5 mi l l ion f o r the purchase of commercial-type goods i n Japan. The import procedures involved a r e s imi la r t o those employed with U.S. financed Procurement Authorizations. Import taxes a r e levied on these goods. The l icens ing f o r these imports ran u n t i l Apr i l 1963.
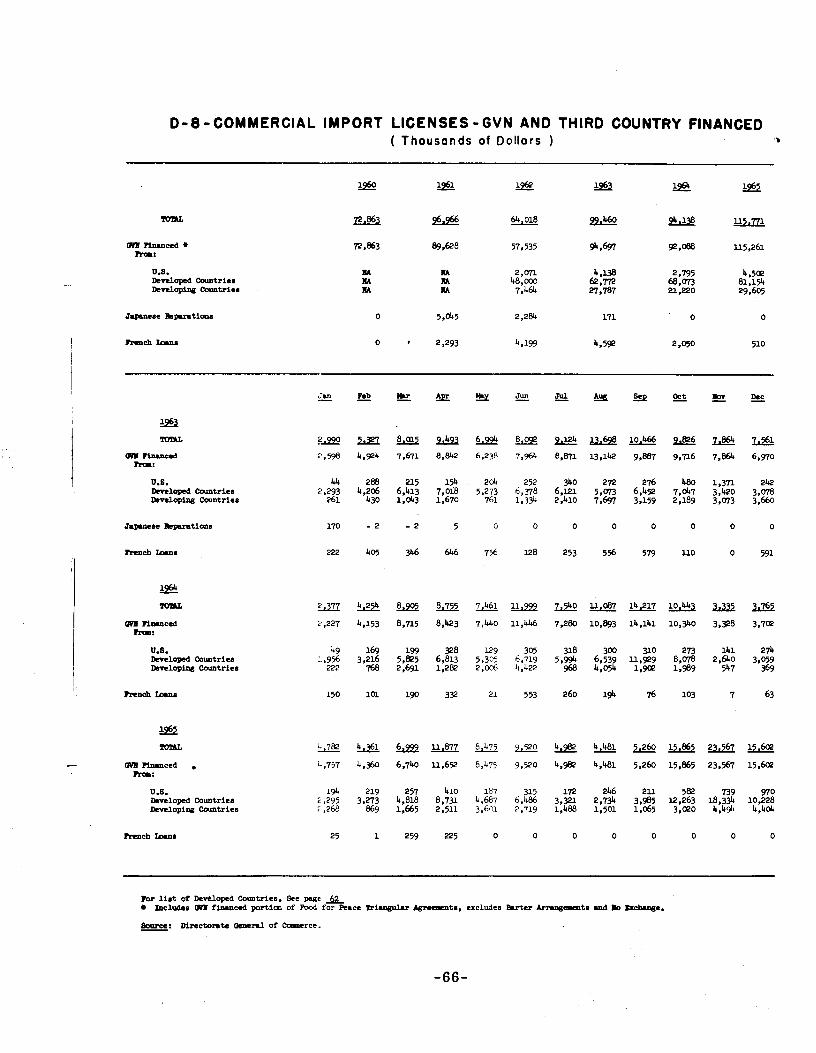
D-8-COMMERCIAL IMPORT LICENSES-GVN AND THIRD COUNTRY FINANCED ( T h o u s a n d s of D o l l a r s ) 'B
0.8. Developed Caurtriem Developing Comtriem
0.6. Developed Ccuntriea Developing Ccuntriea
U.8. 49 169 199 328 129 305 318 300 310 273 141 274 evel loped Comtriea 1.9% 3,216 5@5 6,813 5,305 6,719 5,994 6.539 ~ , 9 2 9 8.078 2,640 3.059 evel loping countries n2 768 2,691 1 2 2 , m 4,422 968 4.054 1.9 1.989 547 369
Trench kana 150 101 190 3 9 21 553 260 1* 76 103 7 63
h r list of helopd Countries, See page & Includea m financed portim of Pood for Race Pi- &raeRnta, excludes Bvter -ta mad lo Ezch.ose.
6owce: h c t o n t e ~ m d of Onmerce. -
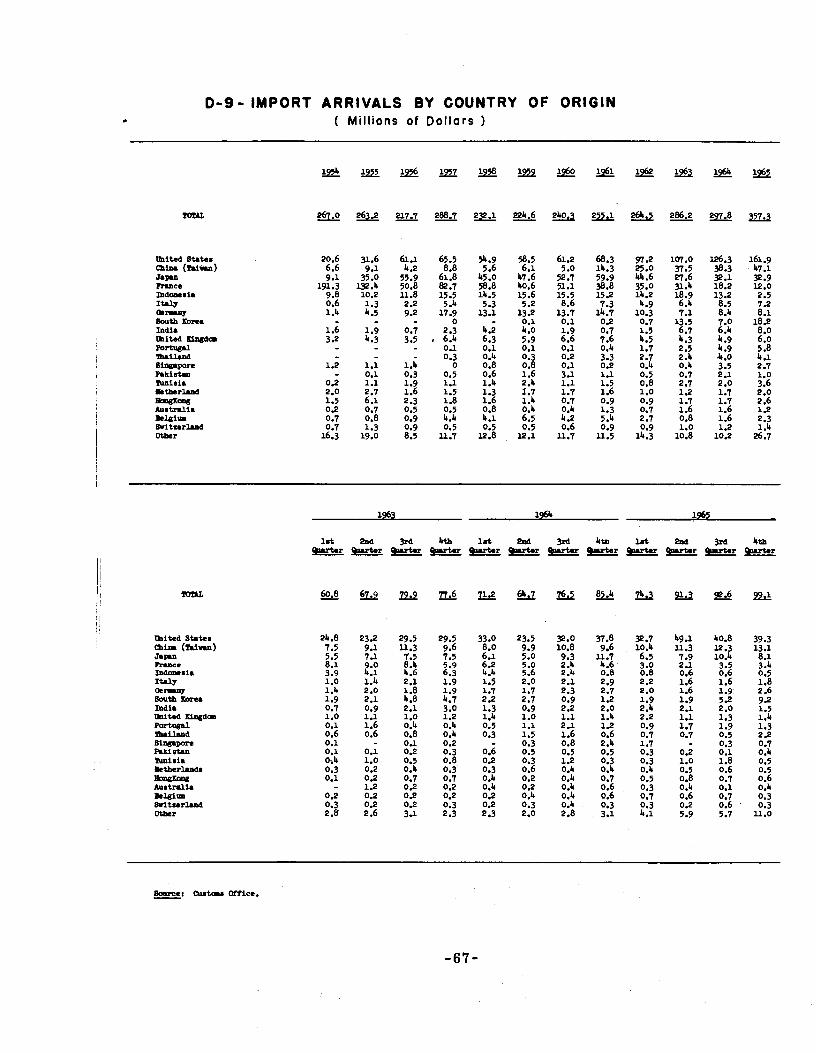
0-9- I M P O R T A R R I V A L S BY COUNTRY O F O R I G I N ( Millions of Dol lars )
-it& mte. C h h (man) J.pn m c e rndomli. I* -- South Korea Indi. mi- mrbrgrl zh.iluId s*pM h k i s t u l N n i l i . i*tberl.and -ma& Aultlmli. mlgim IMtrcrl.and Otber
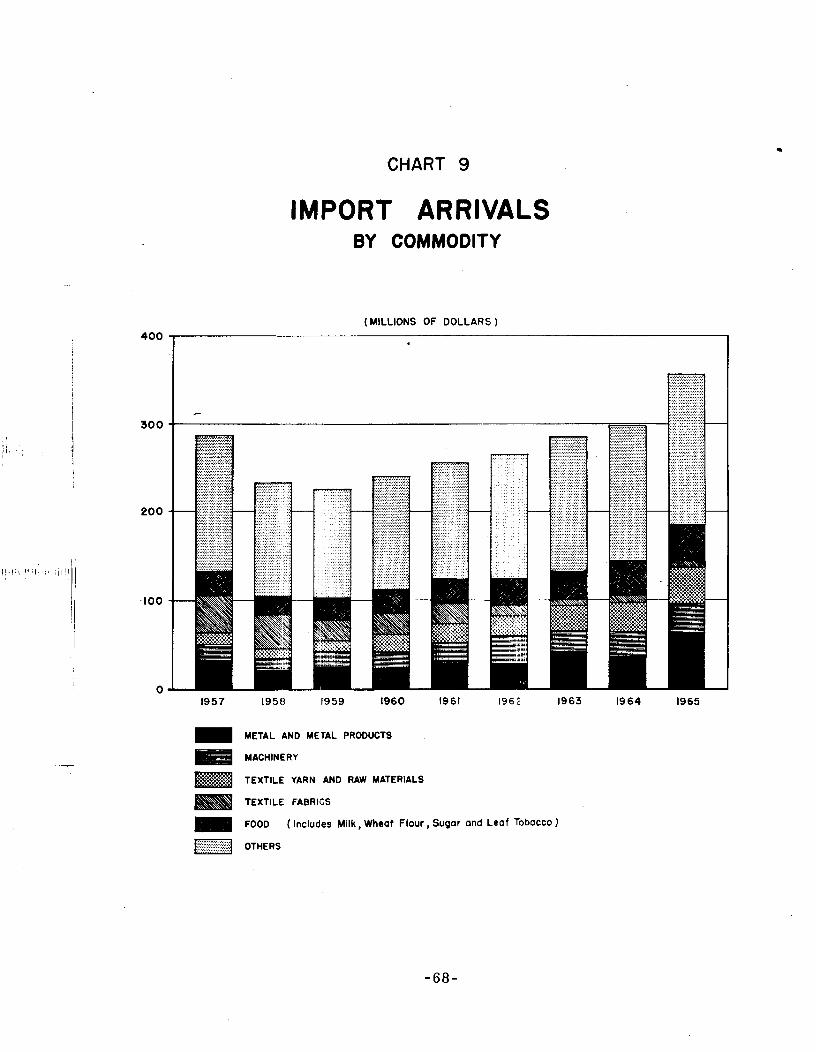
CHART 9
IMPORT ARRIVALS BY COMMODITY
( MILLIONS OF DOLLARS )
400 1
1957 195t3 1959 1960 1961 196 E 1963 1964 1965
METAL AND METAL PRODUCTS
MACHINERY
TEXTILE YARN AND RAW MATERIALS
TEXTILE FABRICS = FOOD ( Includes Milk, Wheat Flour, Sugar and Leaf ToboCC0 )
OTHERS
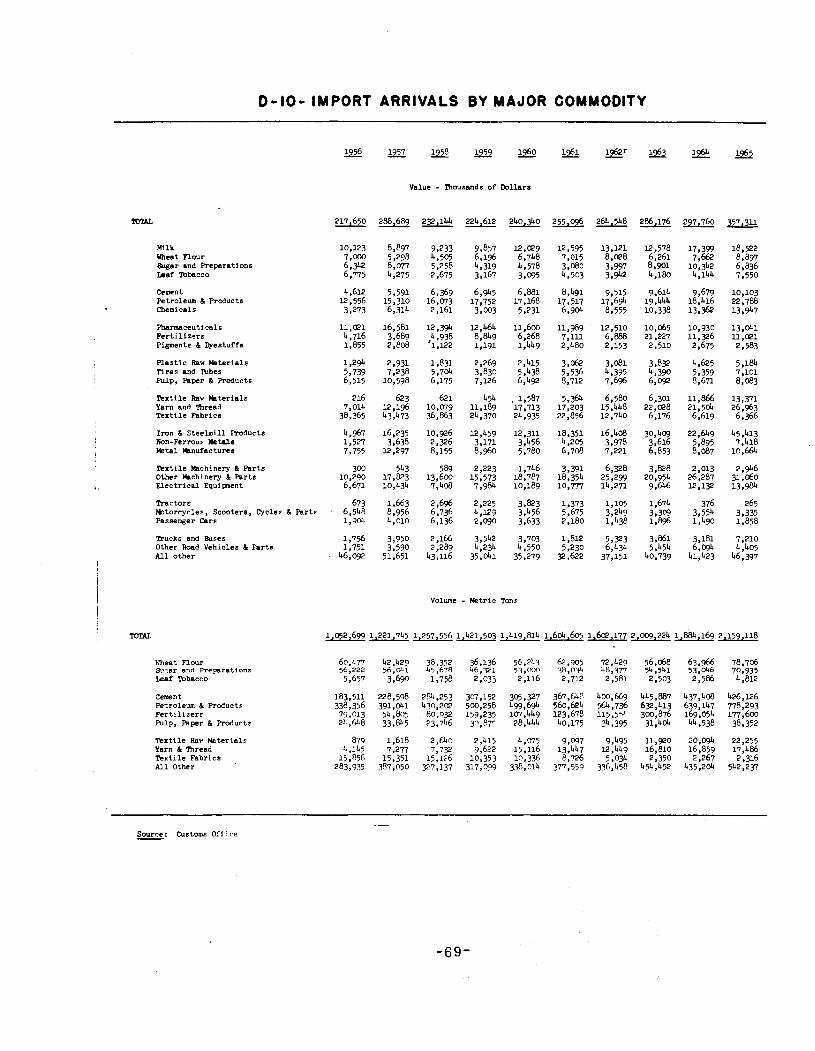
D-10- IMPORT ARRIVALS BY MAJOR COMMODITY
Value - lhousands of Dollars
m lk meat Plour Sugar and Preparations k a f ~ ~ c c o
Cement Petroleum & Products Chemicals
Pharmaceuticals F e r t i l i z ~ r s Pigments & Dyestuffs
Plastic Rav Miterials Tires and mbes Pulp, Paper & Products
h x t i l e Rav k t e r i a l s Yarn and lhread Textile hb r i ca
Iron & Steelmill Products Aon-Ferrous Metals e t a 1 mnufactures
h x t i l e Michinew & R r t s Other Machinery & R r t s Electricnl Equipnent
Trnctors 673 1,663 2,696 2.225 3.823 1.373 ~ t o r c y c l e a , S c w t e r s , ~ y c l e s & ~ r t - 6,548 8,956 6,736 4,129 3,456 5,675 Passenger Cars 1,sdl 4,010 6,136 2,090 3,633 2,180
Trucks and mses Other Road Vehicles & Parts All other
Volume - Metric Tom
mea t Flour surar and Preparations Leaf Tobacco
Cement Petroleum & Products Ferti l izers Pulp, Paper & Ploducts
Textile Raw Materials Yarn & l'nread Textile Fabrics All Other
-- - --
- -- Source: Customs Oil i r e -
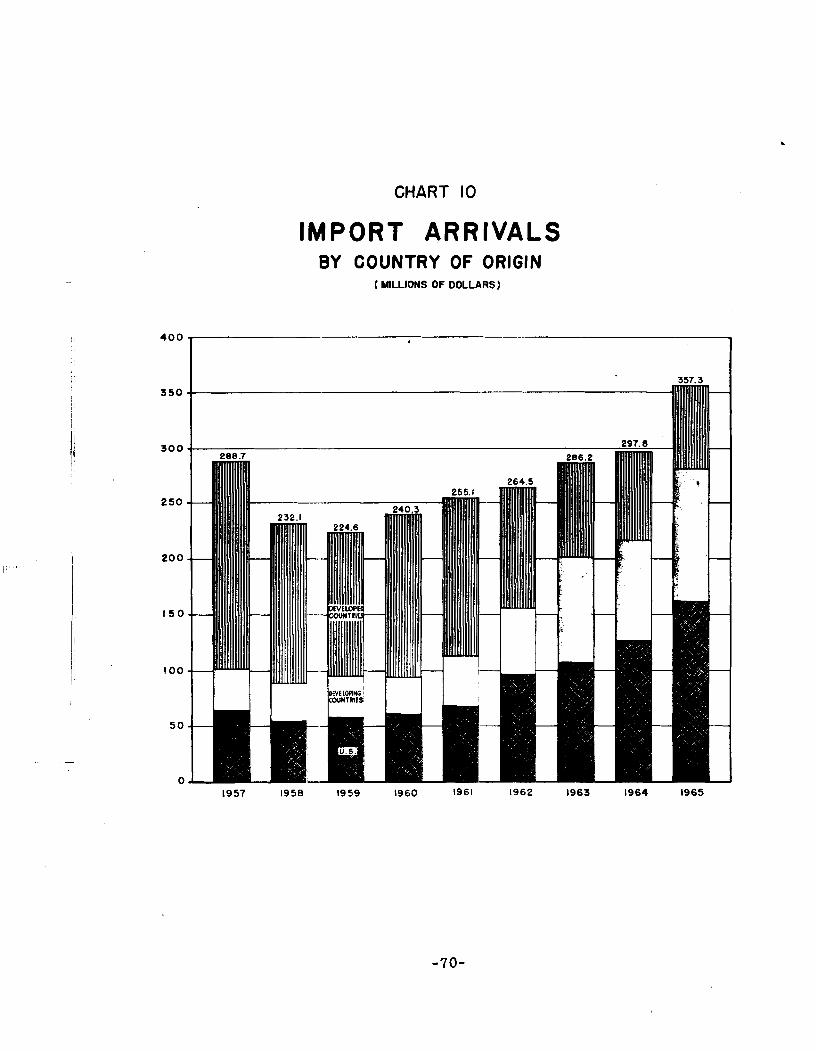
CHART 10
IMPORT ARRIVALS BY COUNTRY OF ORIGIN
( MLLlCMS O F DOLLARS)
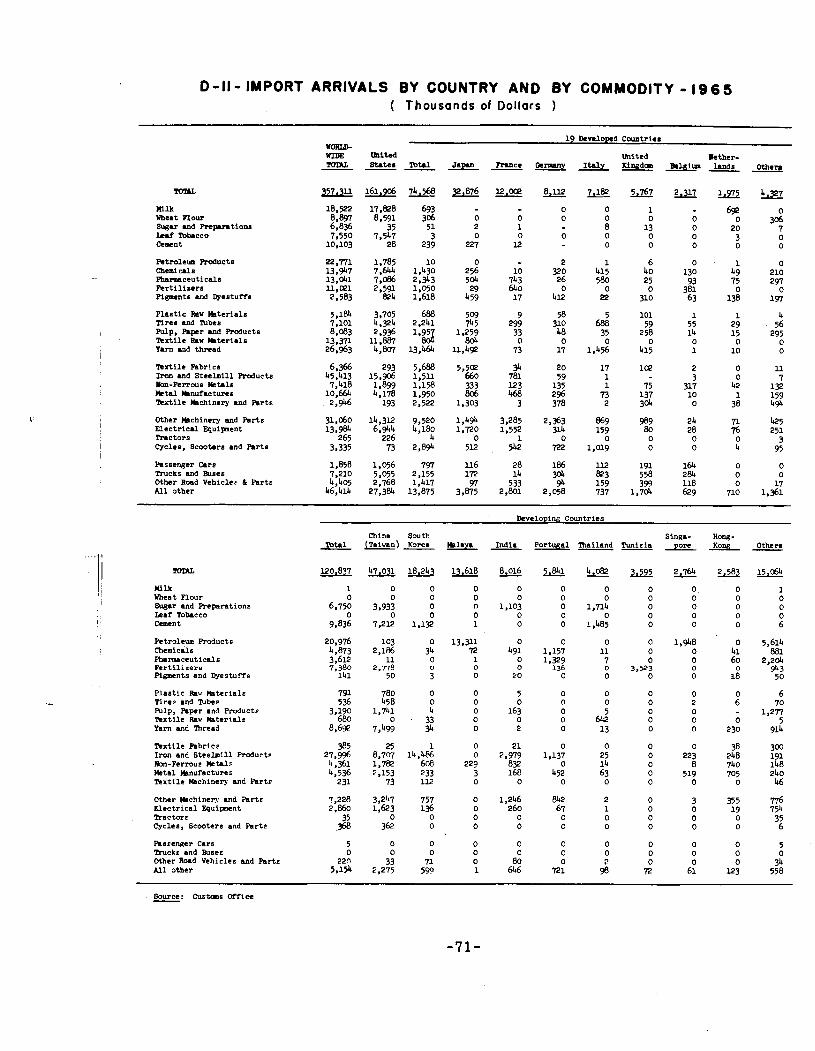
D - 1 1 - IMPORT ARRIVALS BY COUNTRY AND BY COMMODITY - 19 6 5 ( Thousands of Dollars )
Milk mea t R o w Sugu and R e m t i o n a Leaf Tbbacco Ccacnt
Rtmleum Products Chemicals Pharmaceuticals Perti l izers P ig~cn t s and Cyestuffs
Plaatic Raw k t e r i a l s Tlrea and mbes Pulp. Faper md Products Textile Raw k t e r i a l s Y u n and thread
Tertile Pabrics Iron and Steelmill Products Ikn-PelTouS M-16 M t a l knufacturcs Tertile kchiacry and Parts
Other kchinery and Parts Electrical Equipent Tractors Cycles. Scooters and Parta
Passeqer Care Trucks and Eases mhcr R W ~ vehicles & Parts All other
- Total
71r,56a
693 305 51 3
239
10 1.430 2.343 1.050 1.618
688 2,241 1 . 9 a
13.464
5.688 1.5U 1.158 1,950 2.522
9,520 4,180
4 2.894
797 2.155 1.417
13,875
Uhited Bether- m c e Ocrnny I ta ly Kingdm Belgium h d s
ni lk m e a t Flour mu and Preparations I raf Tbtacco Cement
Petr&wm Roducts Chemicals Dhalmaceuticals R r t i l i r e r e Pigments and Dyestuffs
Plastic F a w lb ter ia la Tires and mbea Pulp. Paper and Roducts Textile Raw h t e r i e e Yam and mread
Tertile Pabrics Iron and Steelmill Roducts Rm-Ferrous Mta l r M t a l knufacturer Textile lbchinery and Parts
Other kchinery and Tarts Electrical Equipent Tractors Cycles. Scooters and Parts
Paasewer Cars 'hucks and Eases Other Rmd Vehicles md Parte All other
China South (Taiwan) Korea k l a y a
Sinua- India Portuual mailand Tunisia pore
IMPORrj BY TYPE OF FlNANCmG
US Financed
PA'S: - Procurement Authorizations: These are authorizat ions from the Agency f 9 r In ternat ional Development t o purchase c e r t a i n specif ied commdities. F x e i g n suppliers are paid by A.I.D. i n d o l l a r s the importer Days p i a s t e r s which a re deposited i n t o the Counterpart Fund.
Direct Dollars: These a r e do l l a r s which were granted or loaned t o Viet-Nam i n 1955 and 1956 agains t which a r r i v a l s taking place u n t i l t h e end of 1965.
Triangular Francs. Between 1955 and 1.958, A.I.D. granted t o Viet-Nam the French francs a r i s i n g from sa les by the U.S. t o France of surplus agr icu l tu ra l c m m o ~ ~ i t i e s c Certain impgrts from France were charged agains t these fran,:s u n t i l 1962.
Food f o r Peace - T i t l e I (~ormely PL 4 8 0 - ~ i t l e I ) See notes t o t ab le D-7.
Public Aid There are ggods which come in under the Dollar Project p a r t of the A.I.D. Program, under Development Loan Funds, or under T i t l e I1 and I11 o? P ~ b l i c Law 480. No l i cens ing i s required, and no import taxes are levied on these goods.
GVN Financed -I
See notes t o t ab le D-8
i French Loans and Japanese Reparat ims
I See notes t 9 t ab le D-8
Other Non - US.
This includes Barter Arrangements and imports without a l loca t ion of f x e i g n exchange. The l a t t e r includes imports by end users with branches abrgad, imports of machinery an? o ther goods const i tu t ing
-- in-kind investment i n production f a c i l i t i e s i n Viet-Nam, imports of samples, imports of avia t ion gas, lubr ican t s and spare p a r t s f w i n t e r n a t i m a l a i r l i n e s and other small imports f o r which the National Exchange Office (o f f i ce National des Changes) can be assured do not i n v ~ l v e i l l e g a l procurement of foreign exchange by the importer.
Unidentified.
This includes grants of merchandise under the Colombo Plan, goods or equipment imported under a government t o - government, g i f t s from other c a m t r i e s and sundry imports.
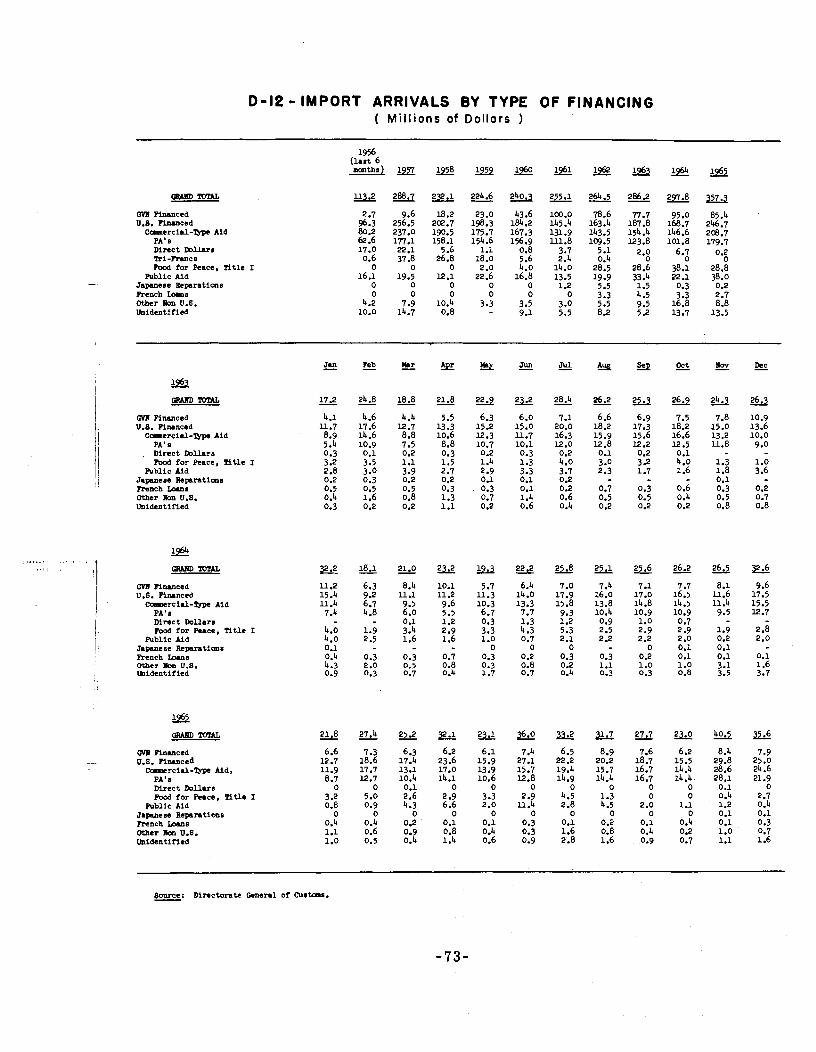
D- le - IMPORT ARRIVALS BY TYPE OF FINANCING ( M i l l i o n s of Dol lors )
GYll IYnmced 11.8. IYnmced
C-ercial-Type Aid PA's Mrect ~ h r s Fr i -Rmcs rood for Peace, TItle I
Public Aid Jnpanese Beparations Rench h s Other Aon U S . Unidentified
Ma Pinamed U.S. Pilvnced
C-ercial-Typc Aid PA's
, ~ i r e c t m l l a r s rood for Peace, Ti t le I
Public Aid Japanem Reparations h n c h LOUIS Other Aon U.8. Unidentified
xi% CiUmTDW. p . 0 1 8 . 1 Q W U 2 2 . 2 2 5 . 8 2 5 . 1 S 2 6 . 2 U
WE Financed 11.2 6.3 8.4 10.1 5.7 6.4 7.0 7.4 7.1 7.7 8.1 9.6 US. Financed 15.4 9.2 u.1 11.2 u . 3 14.0 17.9 16.0 17.0 16.5 U.6 17.5
camtrcill-Typc id u . 4 6.7 9.5 9.6 10.3 13.3 15.8 13.8 14.8 14.5 11.4 15.5 PA'B 7.4 4.8 6.0 5.5 6.7 7.7 9.3 10.4 10.9 10.9 9.5 12.7 mrec t Dollar8 - 0.1 1.2 0.3 1.3 1.2 0.9 1.0 0.7 rood for &ace, n t l e I 4.0 1.9 3.4 2.9 3.3 4.3 5.3 2.5 2.9 2.9 1.9 2.8
Public Aid 4.0 2.5 1.6 1.6 1.0 0.7 2.1 2.2 2.2 2.0 0.2 2.0 Jnpmese Repantions 0.1 0 0 0 0 0.1 0.1 Rench Lorns 0.4 0.3 0.3 0.7 0.3 0.2 0.3 0.3 0.2 0.1 0.1 0.1 M e r mn u.9. 4.3 2.0 0.5 0.8 0.3 0.8 0.2 1.1 1.0 1.0 3.1 1.6 midentifled 0.9 0.3 0.7 0.4 1.7 0.7 0.4 0.3 0.3 0.8 3.5 3.7
CVl h m c e d u.S. Pinmced
-mill-Typc Aid, PA's ~ i r e c t Dollars P o d f o r Pence, Ti t le I
Publlc Aid J n w e s e Repantions Rench XMII~ Other Bon US. Unidentified
Source: Mrec ton t c General of Curt-s. -
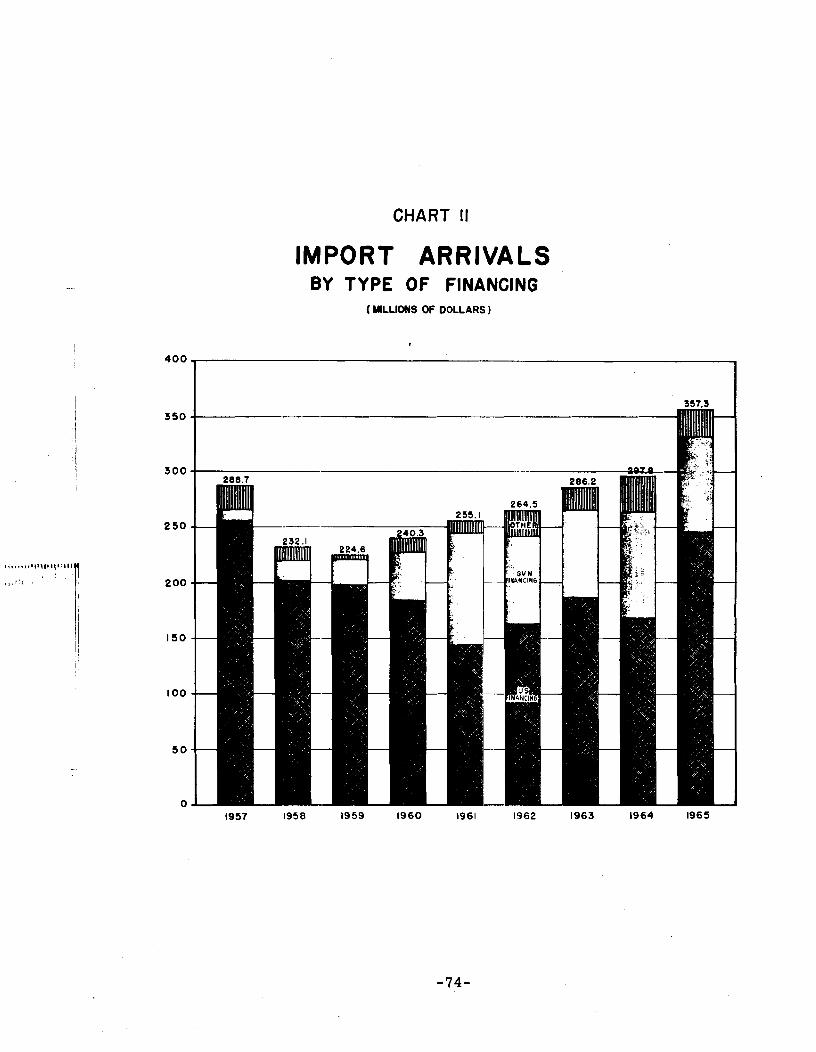
CHART II
IMPORT ARRIVALS BY TYPE OF FINANCING
( mucms OF DOLLARS
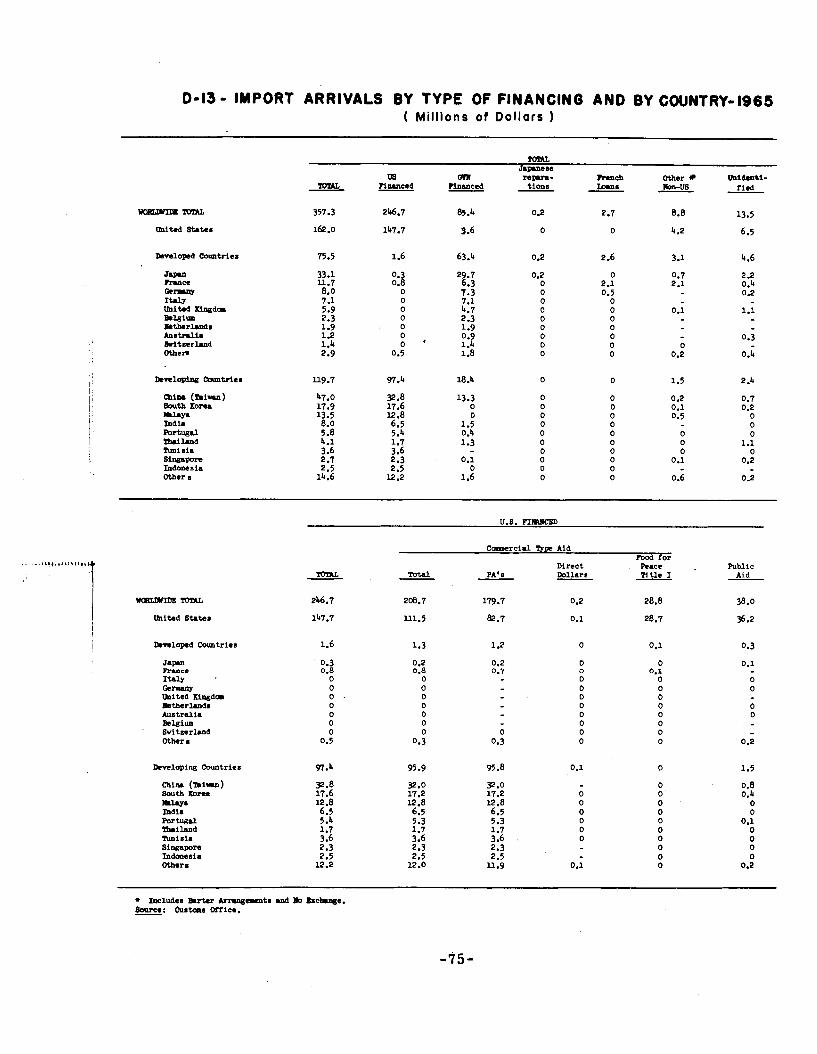
0-13 - IMPORT ARRIVALS BY T Y P E OF FINANCING AND BY COUNTRY-1965 ( Mill ions of Dol lars 1
TOmL Japrnele
08 GVE repra- h e h Other midenti- TOML ?io.nced Weed tions W s Ilon-US tied
UIIM (mi-) South Korea w India Portugal l h i l a n d nmis ia sillg.po= Indonesia Other s
Comwrcial Type Aid Food for
Direct k a c c Public TOTAL Total PA's Dollars Tltle I - Aid
J a m RME~ Italy '
Germany United Mpgdm lIetherlmdr Australia Belgium S v i t z e r h d Others
&velaping Countries
Chi- ( h i m ) south 5 r w w. Indl. Portugal l h i h d Nnis i . Singapon Indonesia Other8
BALA.NCE OF PAYMENTS
Goods and Services
Exports a r e F.O.B. and imports CIF.mder "services" ,"Traveln includes scholarships financed by fore ign a i d ; "Investment 1ncorneV includes i n t e r e s t paynents i n p i a s t e r s on U.S. loans ; and "Government n.i.e." includes on t:?e payments s ide t h e c rn t ra-ent ry of t h e "Services" por t ion of fore ign g ran t s , and on t h e r e c e i p t s s ide the U.S. uses of
- counterpart and U.S.-mned p i a s t e r s .
"Other Services" mainly represent t r ansac t ions through the f r e e market, including fore ign t o u r i s t and m i l i t a r y and diplomatic expendi- t u r e s i n Vietnam.
Transfer Payments
This includes a l l t r a n s f e r payments and c a p i t a l movements in t h e non-monetary sec to r except U.S. a i d which i s shmm separately. "Private Transfer Payments" includes migrants ' t r a n s f e r s , remit tances, and t h e cont ra-ent r ies f o r imports and exports without exchange. "Other P r iva te Capi ta l" represents l a r g e l y changes In EFAC accounts.
Foreign Aid and Loans
This includes e l l g rants and loans under both A.I.D. and Food f o r Peace programs. Chmges i n p i a s t e r l i a b i l i t i e s t o t h e U.S. Government r e s u l t i n g from s a l e s of surplus a g r i c u l t u r a l commodities a r e converted a t t h e standard r a t e of VN$ 35 t o US$ 1 even though t h e p i a s t e r s may have been generated (i .e. entered i n tmports) a t a mixed r a t e . The r e s u l t i n g e r r o r i s r e f l e c t e d i n Errors and Ckniseims. "Other count r ies" includes g ran t s of goods and serv ices from France, Germany, Japan and i n t e r n a t i o n a l organizat ions.
Monetary Movements
Changes i n a s s e t s and l i a b i l i t i e s during 1958 and 1959 have been adjus ted t o exclude the decrease r e s u l t i n g from t h e devaluat ion of t h e French f ranc and the re fo re d i f f e r from t h e d o l l a r f i g u r e s shown i n Tables C - 1 and C-2. In add i t ion , s t a r t i n g with 1960, t h e da ta on Commercial Banks a r e based on a new s e r i e s on a gross b a s i s , whereas da ta i n Table C-2 a r e on a n e t bas i s .
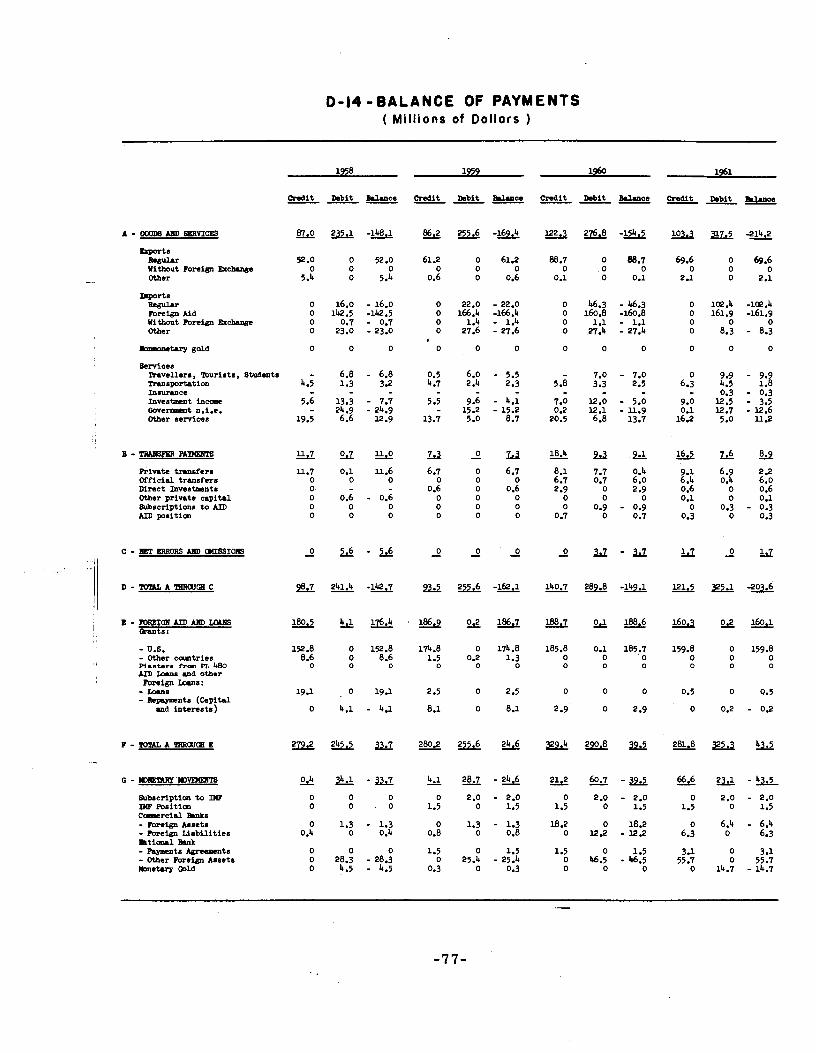
0-14 -BALANCE OF PAYMENTS ( Mil l ions of Dollars )
Cmdit Debit BrLnce Credit Debit BrLnce --- ---
Pports h&U 52.0 0 52.0 61.2 0 61.2 Without Foreign E m h e 0 0 0 0 0 0 Otber 5.4 - 0 5.4 0.6 o 0.6
4 Q r t s Regular o 16.0 - 16.0 0 22.0 -22.0 Fore- Ald 0 142.5 -142.5 0 166.4 -166.4 without mrei.go B c W e 0 0.7 - 0.7 0 1.4 - 1.4 Other 0 23.0 -23.0 0 27.6 -27.6
Credit Debit BrLnce Cmbit Debit U c e ---
Bcrslces 'Rmvellers, m i l t s , Studsnts - 6.8 - 6.8 0.5 6.0 - 5.5 - 7.0 - 7.0 0 9.9 - 9.9 ansp sport at ion 4.5 1.3 3.2 4.7 2.4 2.3 5.8 3.3 2.5 6.3 4.5 1.8 ln8vrurce - 0.3 - 0.3 ~&vestrmnt i n c o r 5.6 13.3 - 7.7 5.5 9.6 - 4.1 7.0 12.0 - 5.0 9.0 12.5 - 3.5 Cove-t n.i.e. - 24.9 - 24.9 - 15.2 -15.2 0.2 12.1 - u.9 0.1 12.7 -12.6 Otber services 19.5 6.6 12.9 13.7 5.0 8.7 20.5 6.8 13.7 16.2 5.0 11.2
~ i v a t e tranlferl ~ 1 . 7 0.1 ~ 1 . 6 0 6.7 0 0
6.7 8.1 7.7 0.4 9.1 6.9 2.2 Official transfers 0 0 6.7 0.7 6.0 6.4 0.4 6.0 ~ r e c t I n v e s m t s o 0.6 o 0.6 2.9 0 2.9 0.6 0 0.6 Other private capital 0 0.6 - 0.6 0 0 0 0 0 0 0.1 0 0.1 Wlbacriptima to AID 0 0 0 0 0 0 0 0.9 - 0.9 0 0.3 - 0.3 Am positial 0 0 0 0 0 0 0.7 0 0.7 0.3 0 0.3
C - ERRORS AH) OCIISSIOm 2 Q - G - O - 0 - 0 2 M - M 0 1.7 LZ -
D - m A W G i C c& 241.4-142.7 - - a 140.7 w - u 121.5 --a
- U.S. 152.8 0 152.8 174.8 0 174.8 185.8 0.1 185.7 159.8 0 159.8 - Other camtries 8.6 o 8.6 1.5 0.2 1.3 0 0 o 0 0 0 Plasters froa PL b& 0 0 0 0 0 0 0 0 0 0 0 AID Lans and other
Foreign Iaana: - Lans 19.1 0 19.1 2.5 0 2.5 0 0 0 0.5 0 Q.5 - Re-nt. (Cepitrl and interests) 0 4.1 - 4.1 8.1 0 8.1 2 -9 0 2.9 0 0.2 - 0.2
F - TOTAL A 9liRaJGi E a a o . n - 2 4 . 6 281.8
&bacriptim to 0 0 0 0 2.0 - 2.0 0 2.0 - 2.0 0 m m s i t i a l 0 0 . O 1.5 0 1.5 1.5 0 1.5 1.5 C-rcial Banhs - mrei.go Anact. 0 1.3 - 1.3 0 1.3 - 1.3 18.2 0 18.2 0 - ~ i g n Liabilit ies 0.4 0 0.4 0.8 0 0.8 0 l2.2 -Y .2 6.3 rntiorul mlk - m t . 9 Agrcarnts 0 0 0 1.5 0 1.5 1.5 0 1.5 3.1 - Otber Forelgo Ansets 0 28.3 - 28.3 0 25.4 - 25.4 0 46.5 - 46.5 55.7 h e t a r y mid 0 4.5 - 4.5 0.3 0 0.3 0 0 0 0
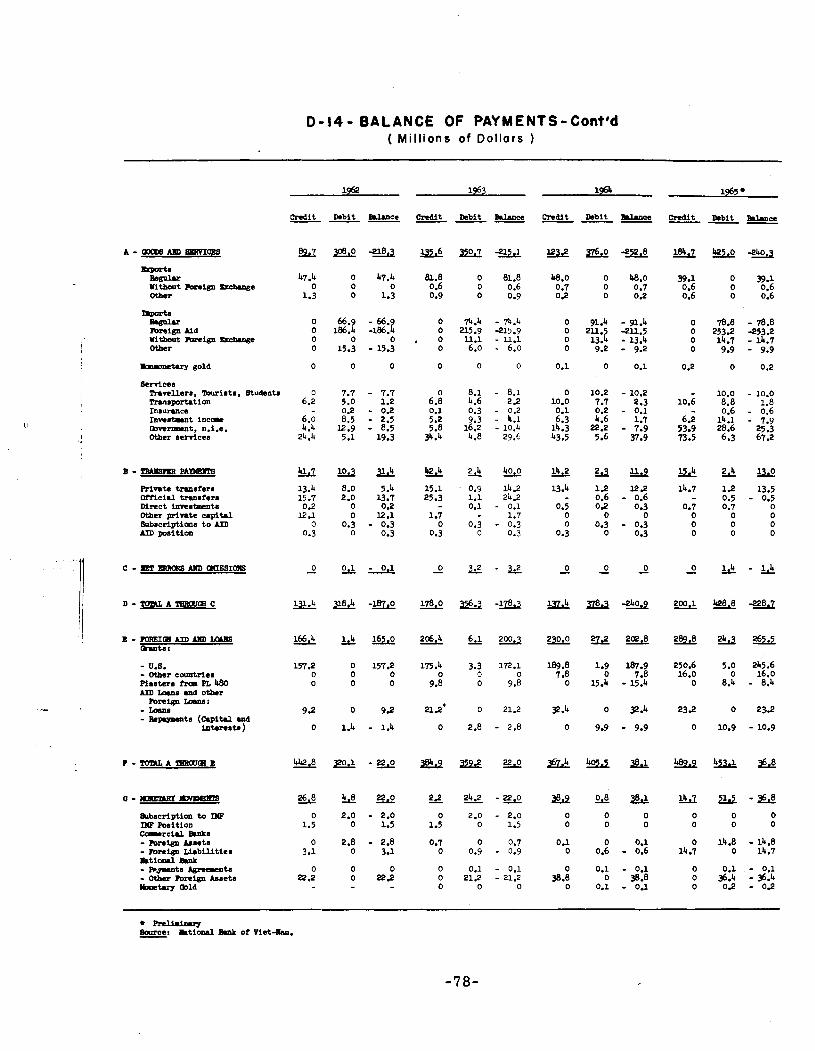
D - 1 4 - BALANCE OF PAYMENTS-Cont8d ( Mil l ions of Do l l a rs )
.orUrnetuy gold
service. h v e l l e r a . Zkuiatm, Btudentl hmrportation Inaururce ~ n v e m t m t i n c a r k w e m n t , n.1.e. Other lervlces
Private t n n s f e r l Qmcirl tranafera Direct imc.8cnt. Other private capital Subscriptiml t o AID *ID position
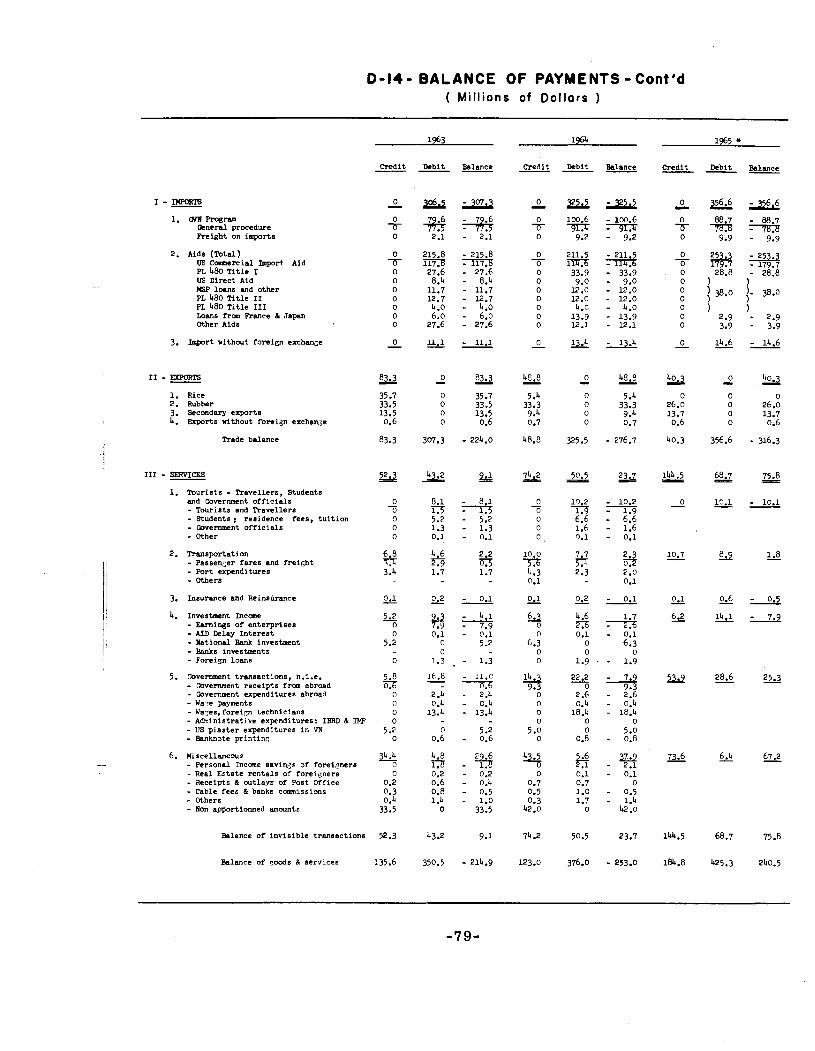
0-14- BALANCE OF PAYMENTS - Cont'd ( Mi l l ions of Do l la rs )
1. WIOFnxram -nerd procedure Reight on imparts
2. Aid8 (Total) US Cnmrc i a l Import Aid PL 480 Ti t le I US Direct Aid Eejp loans and other PL 480 nth 11 PL 480 Title I11 Loans f r m Rance k Japan Other Aids
3. Import without foreign exchan;e
1. Rice 2. Rubber 3. Second- erports 4. mports without foreign exchmxe
Trade balance
1. Tourists - Travellers, Students and Government off ic ia ls - Tourists and Travellers - Students: residence fees, tuit ion - Government officials - Other
2. Transportation - Passenner fares and f re isht - Port expenditures - Others
3. Insurance and Reinsivance
4. Investment Income - Earnings of enterprises - AID Delay Interest - National Bank investment - Banks investments - Foreien loans
5. cavernment transactions, n.i.e. - Gwernment receipts from abroad - Government expendltures abroad - Wav payments - Wa~es, f o r e i q technicians - Administrative expenditures: IBRD & IMF - US piaster expenditures in !IN - Banknote printing
6. Miscellaneous - Personal Income savin,os of fo r e ipe r s - Real Estate rentals of foreigners - Receipts & outlays of Post Office - Cable fees & banks comnissions - Others - Non apportionned amounts
Balance of invisible transactions
Balance of R&S & services
Credit - 0 - 0 a-
0
0 - 0 0 0 0 0 0 0
0 -
35.7 33.5 13.5 0.6
83.3
52.3 - 0 - 0 3 0 0
6.8 n 3.4
0.1
5.2 - 0 0
5.2
0
5.8 rn 0 0 0 0
5 .2 0
34 -4 - 0 0
0.2 0.3 0.4
33.5
52.3
135.6
Debit
325.2
3% 2.1
215.8 m 27.6 8.4
11.7 12.7 4 .o 6.0
27.6
n.1 -
0 - 0 0 0 0
307.3
43.2 - 8.1 - 1.5 5.2 1.3 0.1
4.6 rn 1.7
0.2 - 9.3 - 7.9 0.1 0 0
Balance
-307.3
+g - 2.1
- 215.8 -117.8 - 27.6 - 8.4 - 11.7 - 12.7 - 4.0 - 6.0 - 27.6
- 11.1
83.3 - 35.7 33.5 13.5 0.6
- 224.0
2
8.1 % - 5.2 - 1.3 - 0.1
2.2 0.5 1.7
- 0.1
- 4.1 - 7.9 - 0.1
5 .n
Debit
2322 lW.6 -m;t
9.2
211.5 m 33.9 9.0
l2.n 12.0 4.0
13.9 l2.1
l&
0 - 0 0 0 0
325.5
50.5 - % 6.6 1.6 0.1
7.7 3-3 2.3
0.2 - 4.6 T;6 0.1
0 0
1.9
22.2 0
2.6 0.4
18.4 0 0
0.8
5.6 r;r 0.1 0.7 1.0 1.7
0
50.5
376.0
Balance -
- lW.6 ?aT - 9.2
- 211.5 -114-;6 - 33.9 - 9.0 - 12.0 - 12.0 - 4.0 - 13.9 - 12.1
&
48.8 - 5.4
33.3 9.4 0.7
- 276.7
23.7 - - 10.2 - 1.9 - 6.6 - 1.6 - 0.1
2.3 - 0.2 2.0 0.1
- 0.1
1.7 x - 0.1 6.3
0 - 1.9
3 9.3 - 2.6
- 0.4 - 18.4
0 5.0 - 0.8
- %? - 0.1
0 - 0.5 - 1.4
42.0
23.7
- 253.0
Credit
0 - 0 a-
0
0 - 0
0 0 0 0 0 0
0 -
Q
0 26.0 13.7 0.6
40.3
1u .5 PL
0 -
10.7 -
0.1
9
73.6 -
144.5
184.8
Debit
956.6 88.7 78;8
9.9
253.3 m ) 28.8
1 lBS0 2.9 3.9
14.6 -
0 - 0 0 0 0
356.6
68.7 - 10.1 -
LL2
0.6 - 14.1 -
28.6
6.4 -
68.7
425.3
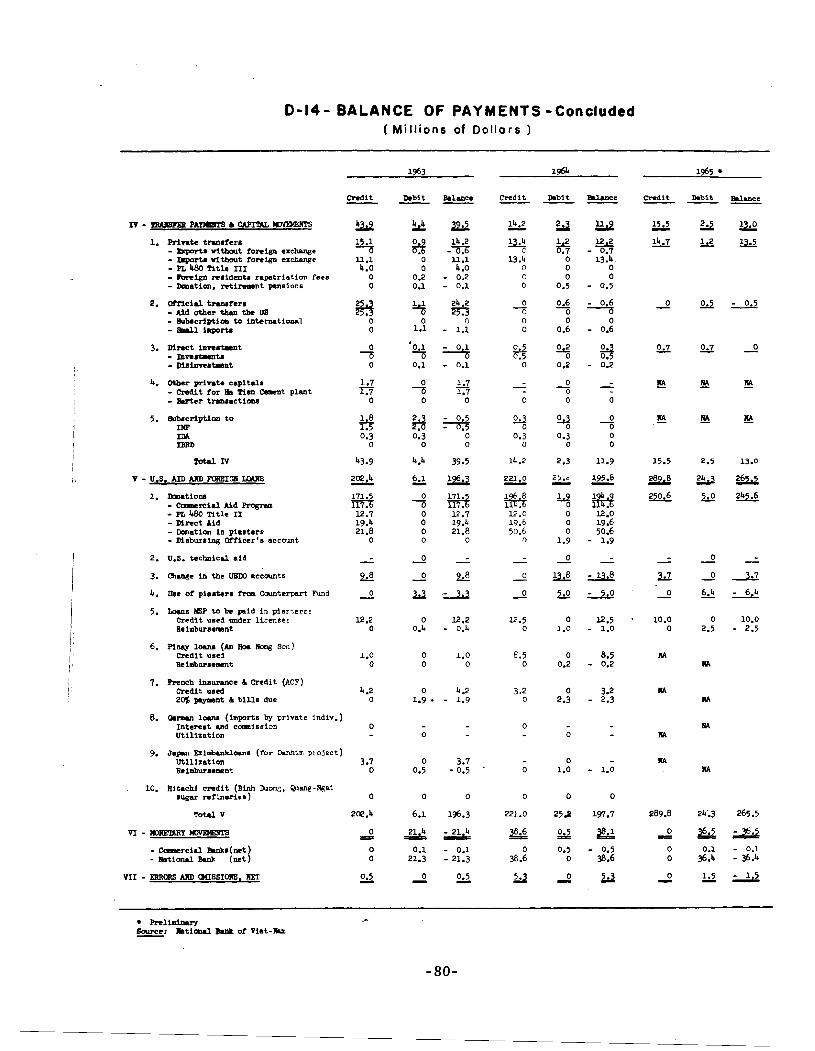
0-14 - BALANCE OF PAYMENTS -Concluded ( Millions of D o l l a r s 1
credit -
1. wnte t-arer~ 15.1 - -8 w ~ t b ~ ~ t fomign exchmge 7 - m r t a uitbout r o ~ i g n exchange U.1 - n keo ~ o n t 111 4.0 - mlgn realdents rapatriation Pees 0 - Dollation, nti-t pensions 0
2. O m c i 3 transfer8 - Aid other th.n tbc W - &bacrlp.ioo t o i n t c ~ t i 0 M l - sell impart. 0
4. Otber printe capitals - 1.7 - Credit for lh Men Oepnt plant 1.7 - Bvte r t ~ l a c t i a u 0
v - U.S. AID m P(WEI!a IMRS 202.4 - 1. Dolllti0M - Camnercial Aid Rogrm - PL 4& ntk 11 - Mrmct Aid - Daoation in piartera 21.8 - Maburling Orricer's account 0
2. U.S. technical aid - 3. m e in the USDO accounts 2s
5. LOME W to k p i d in pinr:ers: Credit uaed under license: 12.2 Reimbursement 0
7. h n c h iaaurance & Credit (ACF) redi it uaed 4.2 2% p y ~ a t & b i l l s due 0
8. Osraur l o u u (imports by private indiv.) Intereat nnd cotmuission 0 Utilization
9. Jaw EximbanUana (for Drnhim project) Utilization 3.7 Reimbwaement 0
10. Aitachi credit (Binh h o w , Qan.+?-.Mai augar refineries) 0
VII - ERRORG Am WSIORS, llET 0.5 0
Credit mait -- - credit -
15.5 -
0 -
0.7 -
?!!
, E!
15.5
5 250.6 -
- x 0 -
10.0 0
K4
K4
K4
n4
289.8
0 - 0 0
0 -
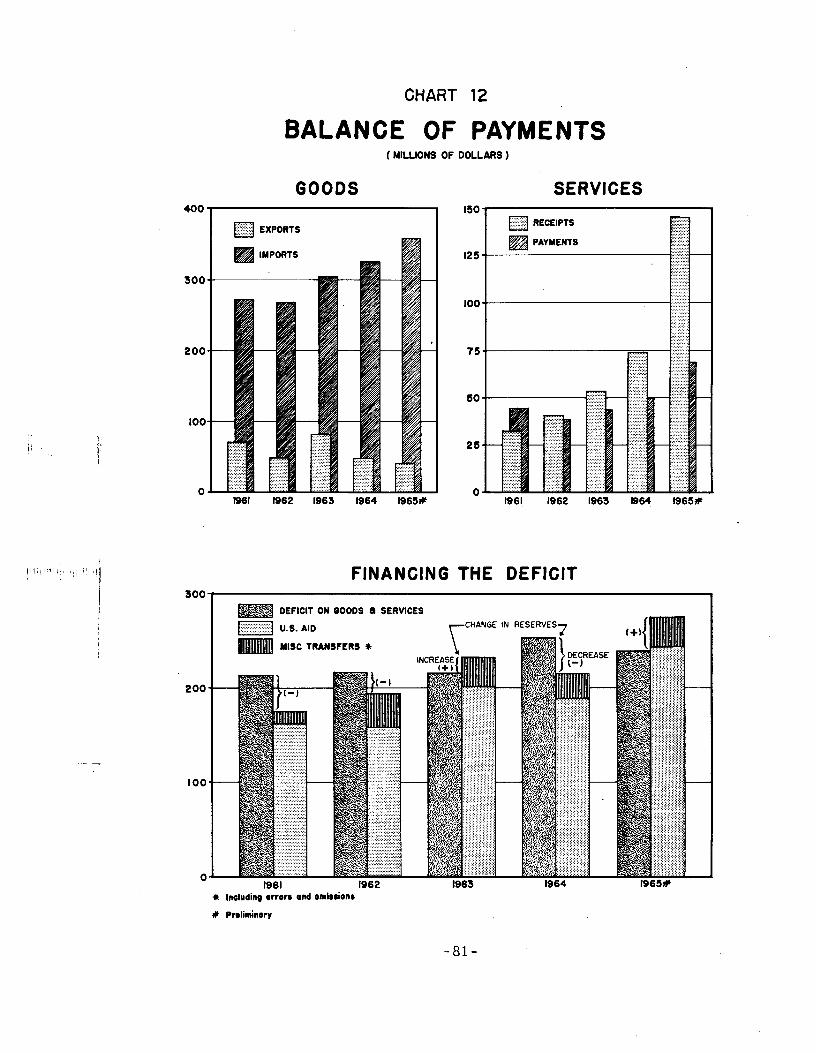
CHART 12
BALANCE OF PAYMENTS ( MILLIONS OF DOLLARS )
GOODS 400
n EXPORTS I SERVICES
FINANCING THE DEFICIT
ik Including error8 and omi8uon8
# Pnlimhory
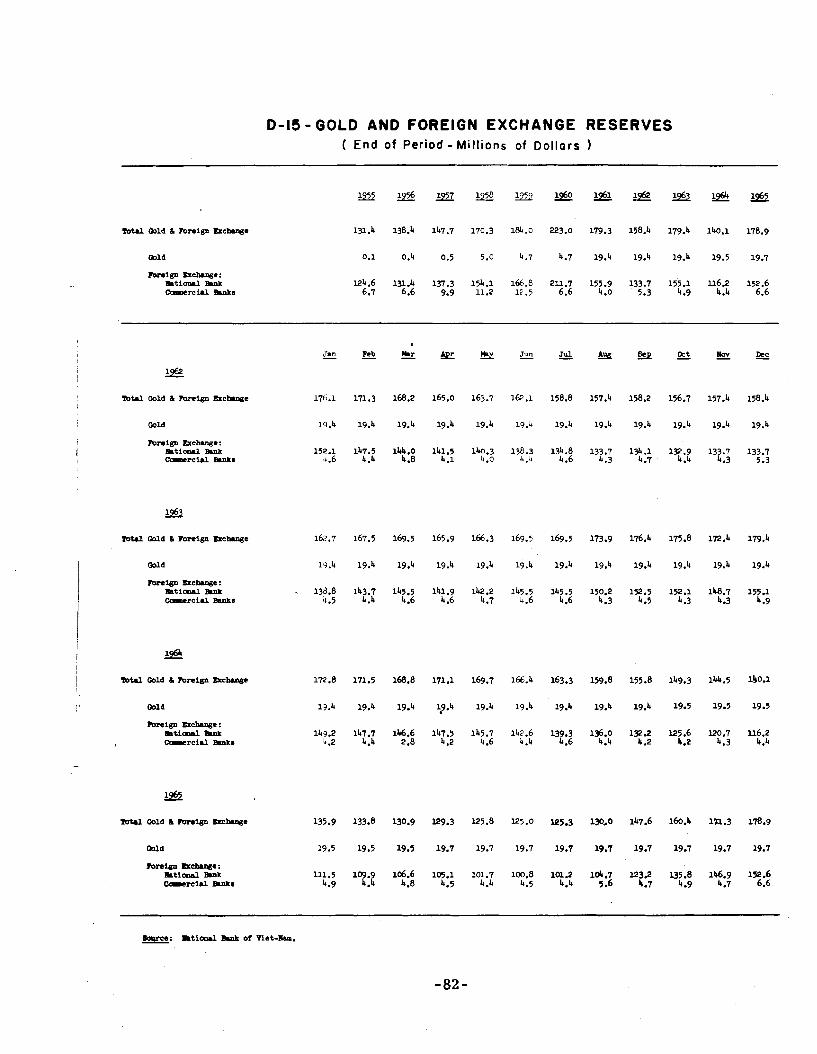
D-I5 - GOLD AND FOREIGN EXCHANGE RESERVES ( End of Period -Mi l l ions of Do l l a rs 1
Gold
cold
hreign Bcbnge : b t i d Bulk w r c i r l mnkl
m l d
hreign mctnnge: b t i d 8.nL Colcrcial ankl
m l d
SECTION - E
AGRICULTURE
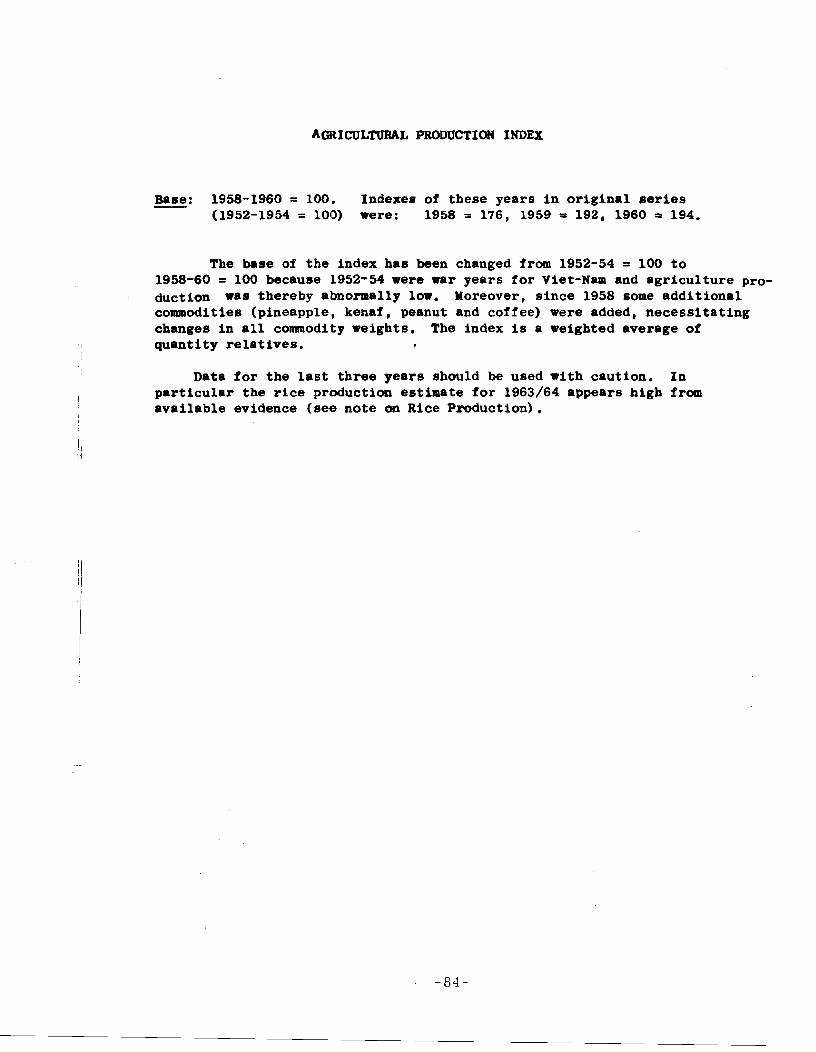
A[iRICULTURAL PRODUCTION INDEX
Bame: 1958-1960 = 100. Indexes of these years i n o r i g i n a l s e r i e s - (1952-1954 = 100) were: 1958 = 176, 1959 = 192, 1960 = 194.
The base of t h e index has been changed from 1952-54 = 100 t o 1958-60 = 100 becaulre 1952-54 w e r e war years f o r Viet-Nam and agr icu l tu re pro- duction was thereby abnormally lor. Moreover, s ince 1958 some add i t iona l commodities (pineapple, kenaf, peanut and coffee) were added, necess i t a t ing changes i n a l l commodity weights. The index i s a weighted average of quant i t y r e l a t i v e s .
Data f o r t h e l a s t th ree years should be used with caution. I n p a r t i c u l a r t h e r i c e production est imate f o r 1963/64 appears high from ava i l ab le evidence (see note on Rice Production).
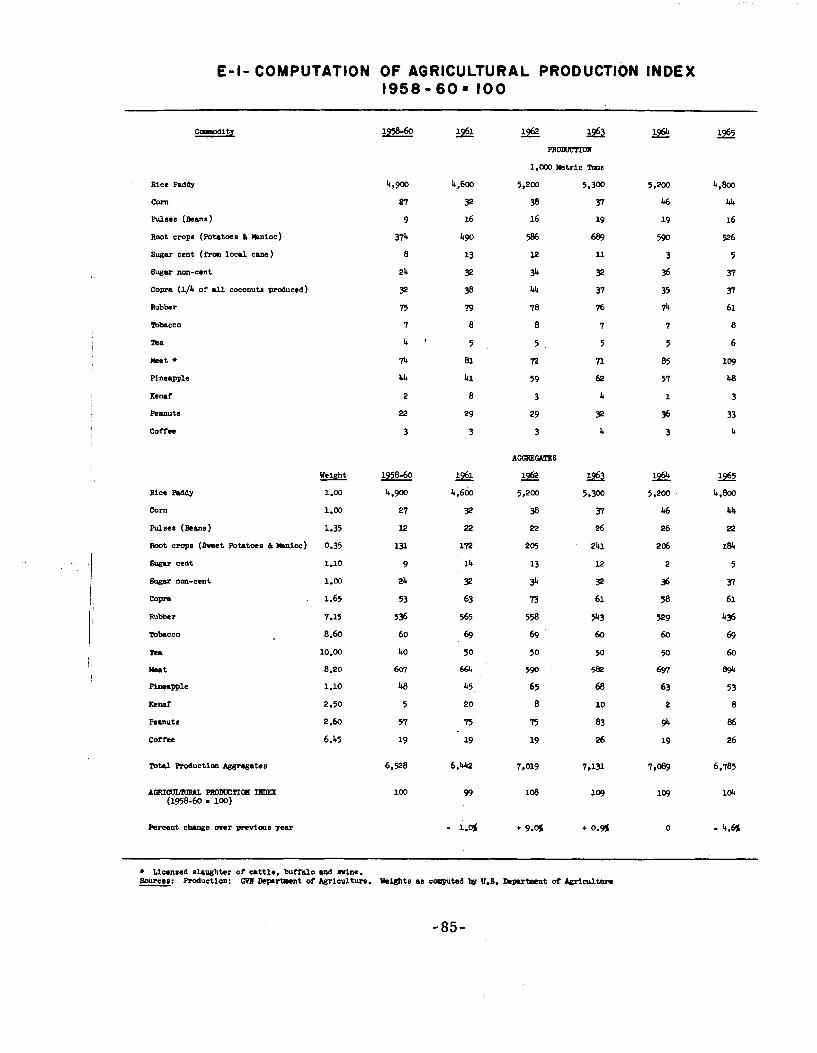
E-I- COMPUTATION OF AGRICULTURAL PRODUCTION INDEX 1958 - 6 0 = 100
Rice Paddy
corn
Pulses (8cana)
Root crops (Futatoes & Wrnioc)
Sugar cent (?ram l o c d cme)
sugar non-cent
Copra (114 of all coconuts produced)
Rubber
lbbacco
Tea 1
Mat +
Pineapple
Kt&
Ranuta
coffee
I
Rice Paddy
Corn
Pulsea (Beans)
Root c r o p (Sweet Potatoes & ~ b n i o c )
I 'I ~ u g u cent
I Sugar nm-cent
copra
Rubber
Ranuts
mtrl Production ~ggreg .ks
Ihrcent chmge over previcus year
+ Licensed alaughkr of c a t t l e , buffalo mud mine. Eaurces: Production: CVN m r b c n t of Agriculture. Heights a6 ccmputed by U.8. hp+tmcnt of Agriculture -
-85-
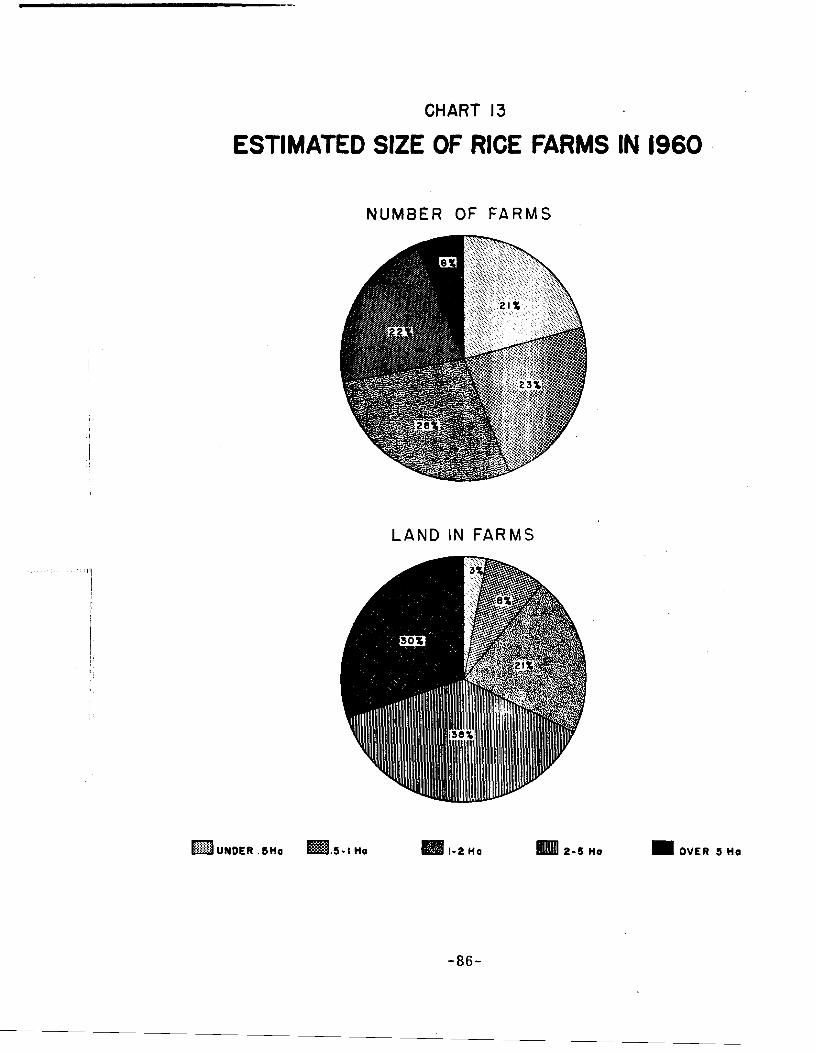
CHART 13
ESTIMATED SIZE OF RICE FARMS IN 1960
NUMBER OF FARMS
L A N D IN FARMS
f7.J UNDER .5Ha .5- I Ha 1-2 Ha 2-5 Ha OVER J Ha
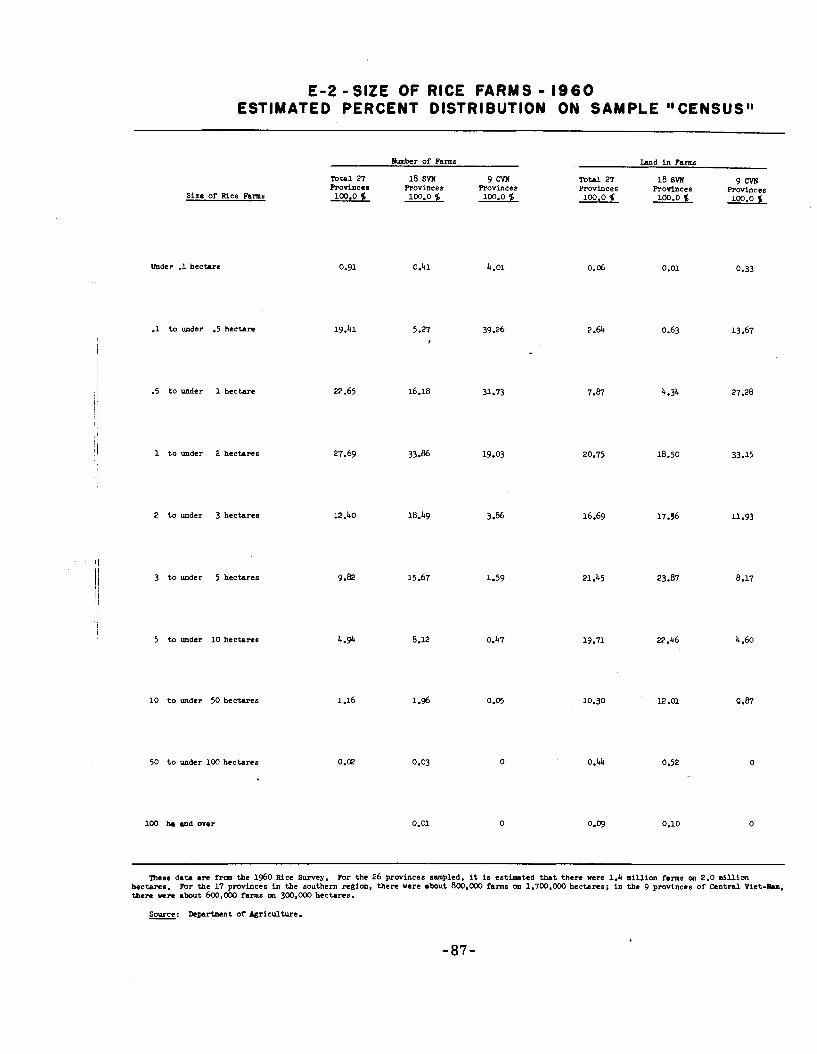
E - 2 -S IZE OF RICE FARMS - 1960 ESTIMATED PERCENT DISTRIBUTION ON SAMPLE ''CENSUSI1
Number of Farms land in Farms
Total 27 18 SW 9CVN Total 27 18 svn Provincen Provinces Provinces Provinces Provinces Provinces
9 m
100.0 % 100.0 $ 100.0 % 100.0 $ 100.0 5 100.0 $ Size of Rice Parms
.1 t o under .5 hectare
.5 t o under 1 hectare
1 t o under 2 hectares
2 t o under 3 hectares
3 t o under 5 hectares
5 to under 10 hectares
10 to under 50 hectares
50 t o under 100 hectares
100 hn nnd over
mese data from the 1960 Rice Survey. For the 26 provinces sampled, it i s estimated t ha t there were 1.4 million farms on 2.0 million hectares. Ebr the 17 provinces in the southern rekion, there were about 800,030 ianns cm 1,700,000 hectares; in the 9 provinces of Central V i e t - h , there vcre about 600,030 arms on 300,000 hectares.
RICE aTIVATION AND PRODUCTION
Rice crop year begins June f i r s t of one year and ends May 30 of the next. A l l s ingle crop r i c e regardless of the date of harvest . throughout the crop year i s designated a s 1st crop. Wherever there i s multicropping of r i c e , the 1st crop a f t e r June i s designated a s 1 s t crop and a l l succeeding crops t o t he end of the crop year, a s 2nd crop,
Data for 1957/58 and previous years a r e based on estimates made by provincial Agricultural Service o f f ic ia l s . The Department of Agriculture began t o conduct annual r i c e surveys, based on a sample cutt ing technique, i n 1958/59. Data f o r 1958/59 are a mixture of survey data and provincial estimates. Data fo r 1959/60 through 1964/65 a re based largely on the survey; only 'a few low-production provinces a r e not sampled.
A comparison of the r e su l t s of the Survey with estimates made by provincial o f f i c i a l s indicates t h a t the l a t t e r being subject t o quotas fo r delivery of provincial surpluses t o Saigon may tend generally t o overstate average and understate y ie ld , leading t o a general understatement of production. For example, f o r 1957/58, production may have been a s h i :h as 4.1 m5.1lion metric tons ra ther than 3.2 million; and f o r 1958/59 l.-here the mixed f izures are shown, production may have been 4.6 million tons ra ther than 4.4 million. On the other hand the Department survey data mag tend t o overstate production s l ight ly . Survey data f o r the past three years a re par t i cu la r ly subject t o question because increased insecuri ty has severely limited o f f i c i a l access t o some survey areas. In par t i cu la r , the estimate fo r 1%3/64 seems high by perhaps 100,000 t o 200,000 tonr. The 1964165 figures were semi-official ly reduced t o 5,031,000 tons. The 1965/66 figures seem closer t o rea l i ty ; however, in only f i f t e en provinces was the r i c e survey conducted, and f igures f o r the remainini: provinces are estimates made on a bas is t h a t i s open t o question.
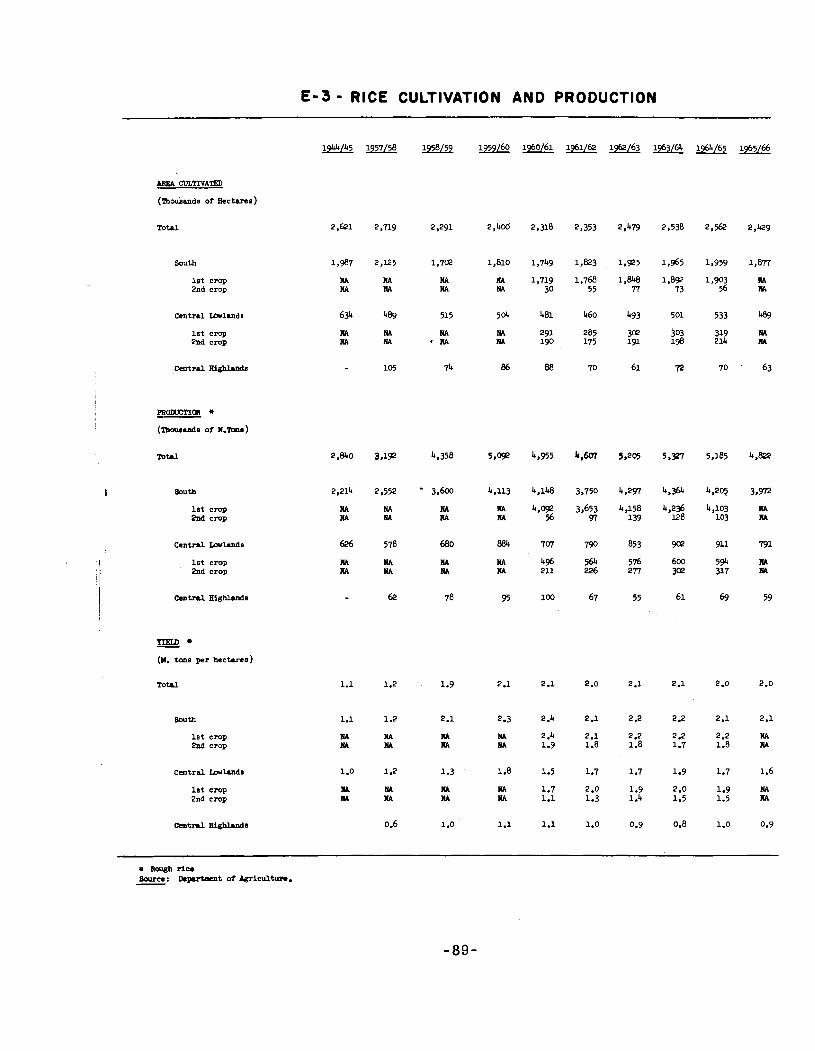
€13 - R I C E CULTIVATION AND PRODUCTION
Total
south
1st crop 2nd crop
Central Lbulsnds
1st crop 2nd crop
South
1st crop 2n6 crop
Central lovlands
1st crop 2nd crop
Central Highlands
ma
(Y. tons per hectares)
Total
1st crop 2nd crop
Central Ia lands
1st crop 2nd crop
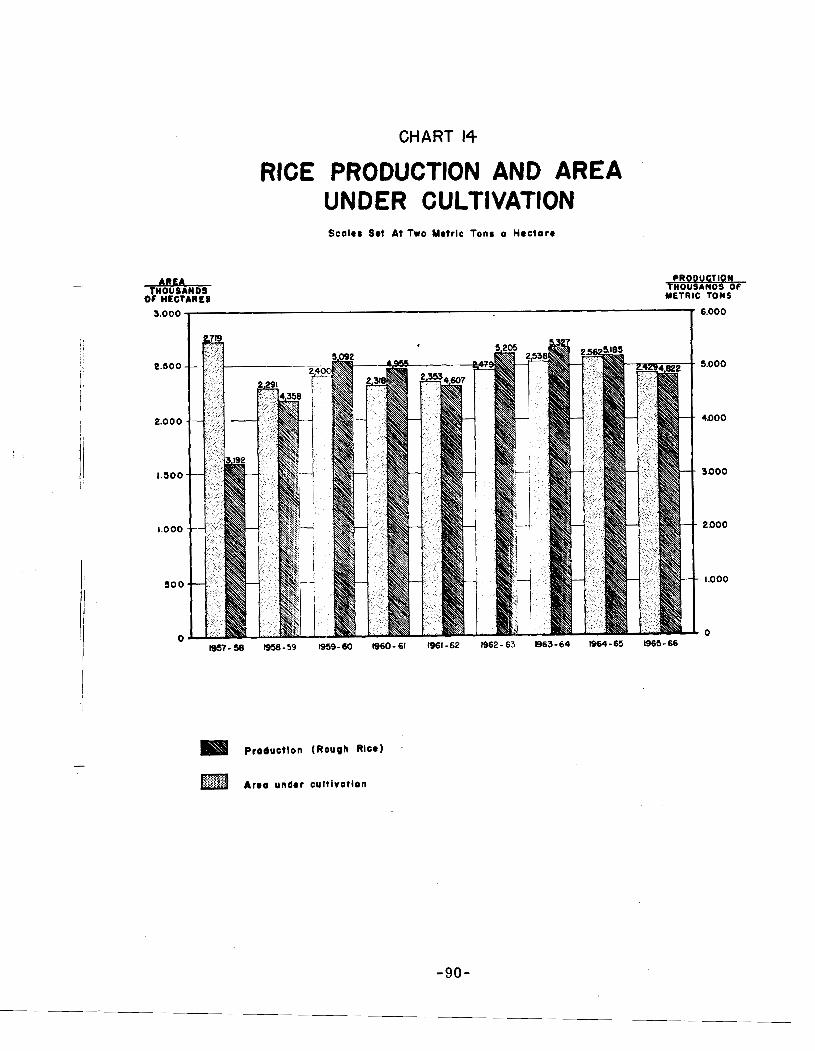
CHART 14
RICE PRODUCTION AND AREA UNDER CULTIVATION Scale8 Set At Two Metric Tons a Hectare -
OF HECTARES
PRODUCTION fnousrnos OF METRIC TOWS
Produttlon (Rough Rice)
a Area under cultivation
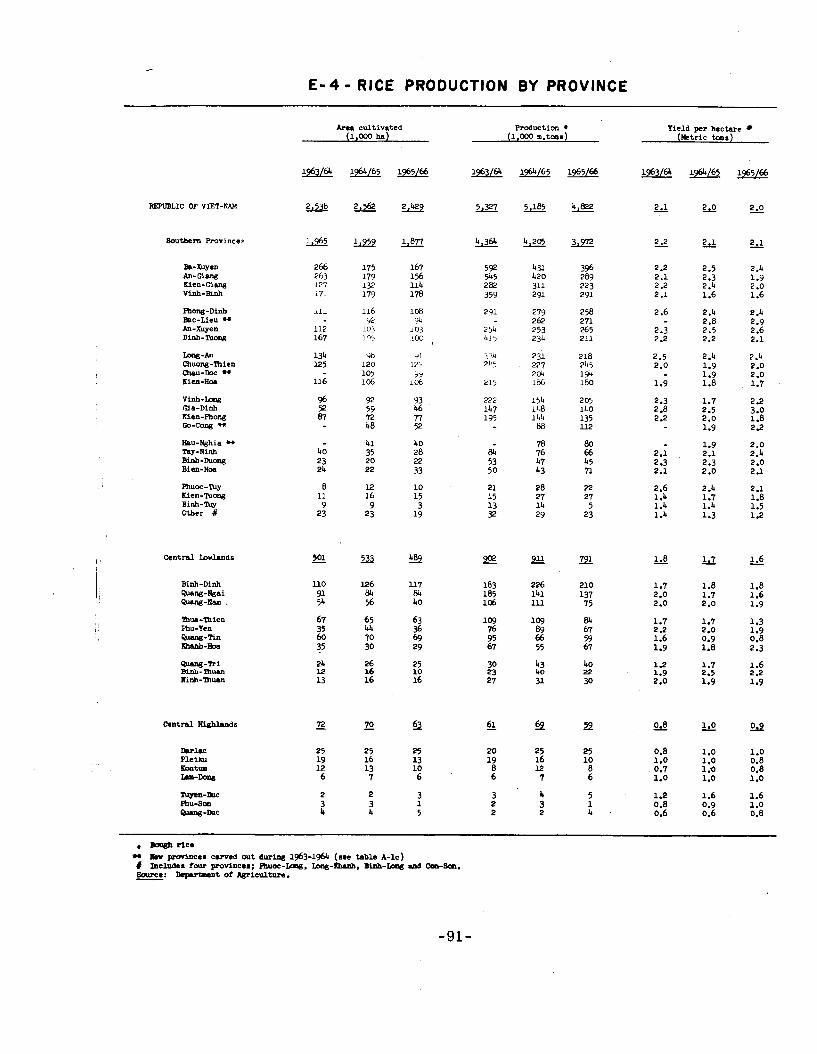
-- E - 4 - RICE PRODUCTION BY PROVINCE
Area cultivated (1,000 ha)
Yield per hectare ( k t r i c h a )
mong-Dfnb Bnc-Lieu * An-Xuyen Dinh-?\low
Vinh-Lmlg Ma-Dinh Uen-Phong Co-cow *
Central lowlands
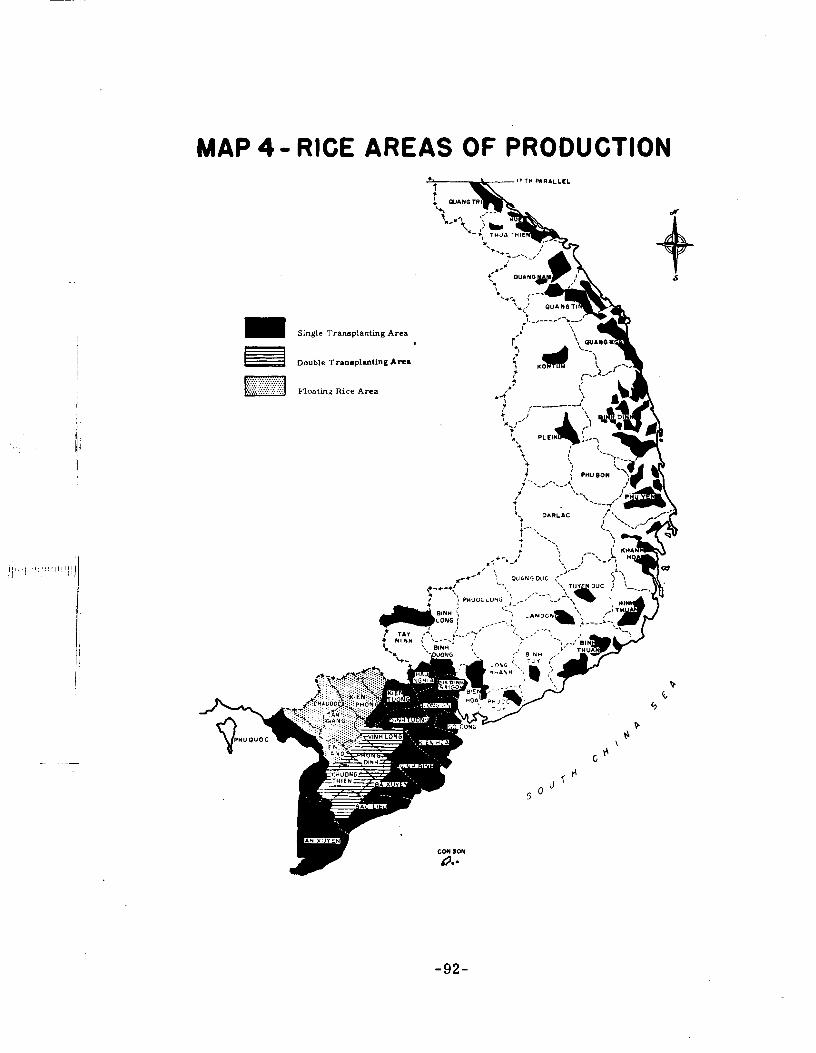
MAP 4 - RICE AREAS OF PRODUCTION
/
I '. DARLAC
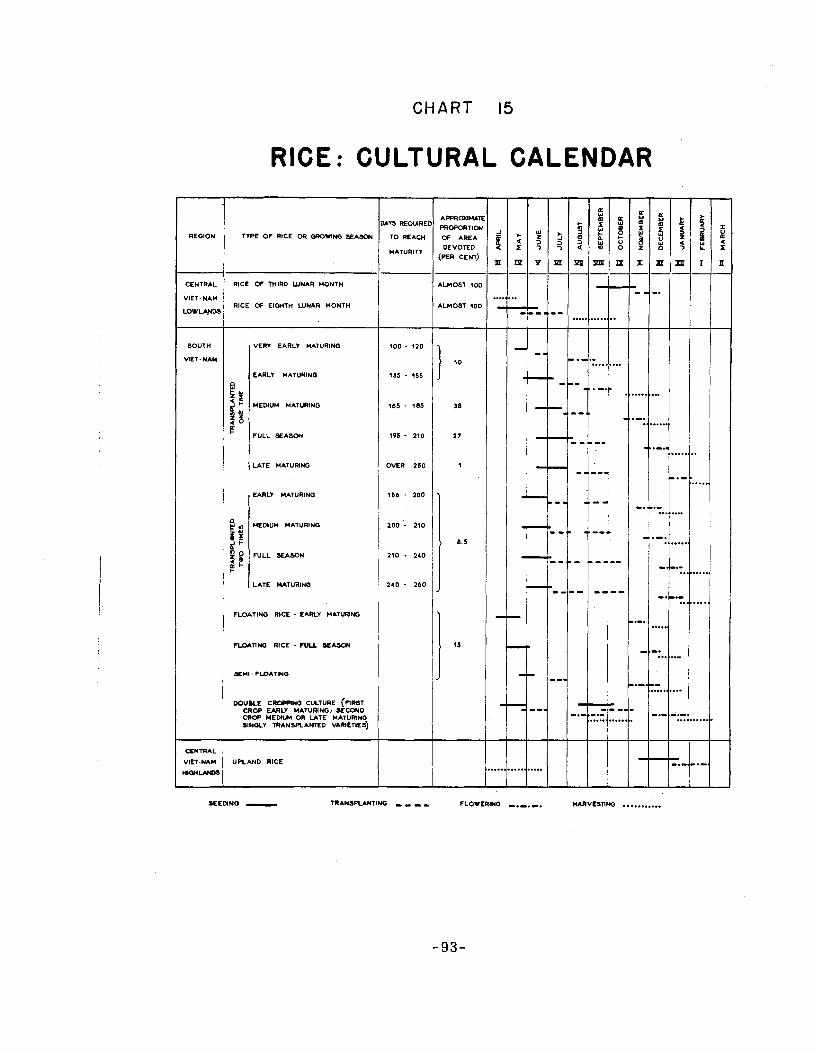
REGION
CENTRAL
VIET. NAM
LOWLAND!
SOUTH
VIET. W M
CENTRAL
VIE7+dAM
C H A R T 15
RICE: CULTURAL CALENDAR
TYPE O F RlCE W GROVlffi SEASON
RlCE OF THIRD W W R MONTH
RlCE E l W T H WUAR MONTH
-
VERY EARLY MATURING
1 EARLY MATURING
( LATE MATURING
! "J s
2 6
+
I EARLY MATURING
MEMUM MATURING
FULL SEASON
I LATE LUTURING
Z 2 +
FLOATING RICE - EARLY MATURING
MEMUM MATURING
F U Y n N O RlCE - NU SEA3U4
DOUBLE CROPRNG CVLTURE (FIRST CROP EARLY MATURINGx SECOND CROP M E M W OR U T E MATURING SINOCV ~ N S R A H T E O VARIETIES)
UPLAND RICE
WS REOUlREl
TO REACH
MATURITY
r o o - 120
r35 - q55
165 - 105
195 - 210
OVER 250
186 - 200
100 - 210
210 - 240
240 - 260
APPROXIH*T p u o m m a
(X AREA DEVOTED
(PER CENT)
ALMOST 1OC
ALMOST roc
SEEMNG - TRANSPUNTING , , , , FLOWERING -.,.,.
DOBESTIX: SHIPMENTS OF RICE
T h i s information i s gathered d a i l y by t h e Saigon - Cholon road and p o r t pol ice . Rice De l ive r i e s t o Saigon from t h e Del ta do not correspond wi th ac tua l quan t i ty received because de l ive ry of under 500 k i l o s f o r mi l led r i c e and under 1,000 k i l o s f o r rough r i c e r e q u i r e s no l i cense . Rice is received by barge and t ruck and i s consumed i n Saigon. I f t h e r e is a su rp lus i n Saigon it is shipped t o non-rice-producing provinces i n t h e Ematern p a r t of South Viet-Nam and t o Cen t ra l Vie t Nam, o r it i s exported.
Rice eupluses moving from t h e Del ta t o Saigon a r e of s eve ra l types. The major por t ion t r a d i t i o n a l l y cons is ted of a moderately poor grade of r i c e c l a s sed a s No, 1, 25% brokens, which was t ransshipped through Saigon t o feed t h e r i c e - d e f i c i t provinces of Cen t ra l Viet-Nam; However some of t h i s r i c e was consumed by Saigon's working c l a s ses . Another major suplus grade was Java o r "red" r i c e , produced from f l o a t i n g rough r i c e , grown i n t h e f lood zones of t he Del ta along t h e Cambodia border, p r i n c i p a l l y i n An- Giang and Chau-Doc but a l s o i n Kien Phong and Kien Giang provinces, Java "red" i s a poor q u a l i t y r i c e l i t t l e des i r ed by Vietnamese and u s e f u l mainly f o r expor t . F i n a l l y , t h e r e a r e small amounts of t h e h igher q u a l i t y Nanh Chon and Nang Huong (perfumed) rice, which a r e consumed by Saigon's wea l th i e r r e s i d e n t s . This r i c e comes mainly from Phuoc Tuy and Phong Dinh provinces. I n general a l l of t h e r i c e from t h e lower d e l t a i s shipped t o Saigon by canal I n l a r g e junks.
I n t h e p a s t , except f o r t h e r e l a t i v e l y small q u a n t i t i e s of t h e h ighes t and lowest q u a l i t i e s consumed i n Saigon, t h e g rea t bulk of t h e lower d e l t a surp lus passed through c a p i t a l , I n " averagew years , t h e r e were 200,000 tons f o r export and 300,000 tons f o r Eas tern South and Cen t ra l Vietnam
Suppl ies f o r Saigon, by c o n t r a s t , have l a r g e l y come from adjacent provinces, such a s Long-An and Dinh Tuong, where s taggered ha rves t s kept t h e c a p i t a l w e l l suppl ied t h e year round.
A f a c t o r o f . 6 0 i s used to convert rough r i c e t o mi l led r i c e equiva lent . This f a c t o r , which i s t h e one used i n o f f i c i a l Vietnamese pub l i ca t ions , i s more r e a l i s t i c given t h e q u a l i t y of Vietnamese r i c e mi l l i ng , than t h e .64 f a c t o r f requent ly quoted i n works on t h e sub jec t ,
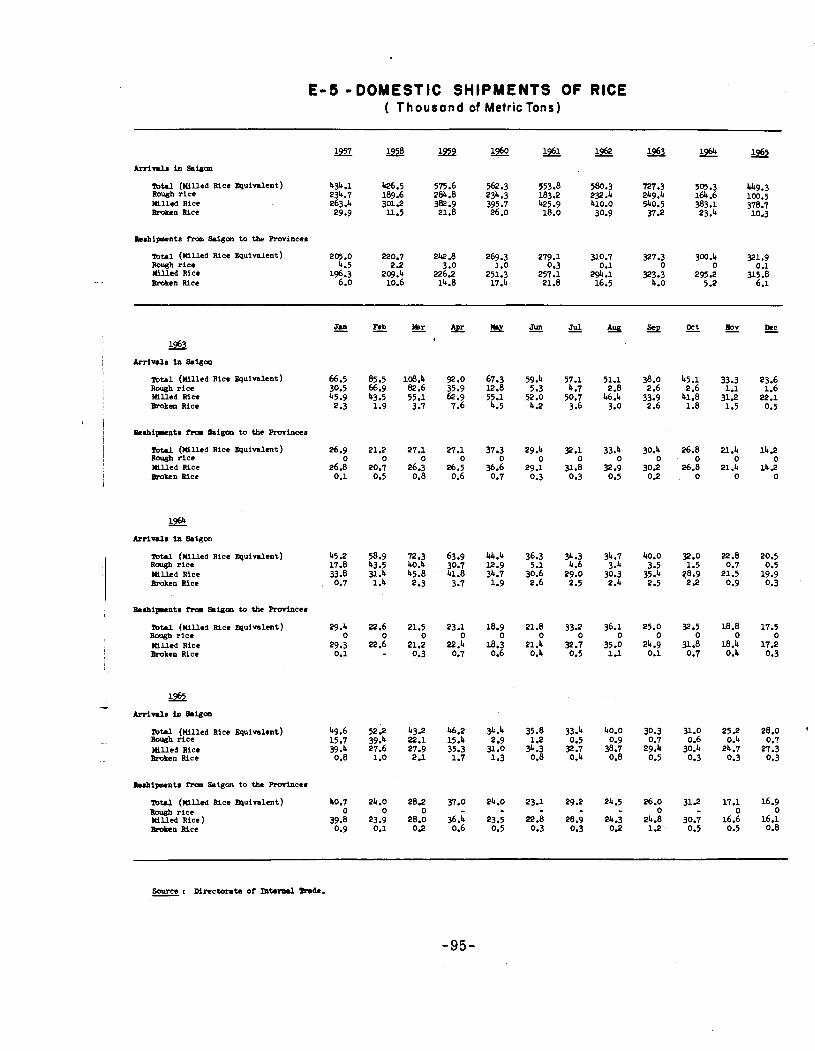
E-5 -DOMESTIC SHIPMENTS OF RICE ( Thousand of Metric Tons)
mtrl (Milled Rice nu iva l en t ) 431r.l 426.5 575.6 562.3 553.8 Rough r ice 234.7 189.6 2B.8 234.3 183.2 Milled Rice 263.4 301.2 3e .9 395.7 425.9 Broken Rice 29.9 11.5 21.8 26.0 18.0
mt.1 (Mlled ice ~qu iva l en t ) 205.0 220.1 242.8 269.3 279.1 Rough r ice 4.5 2.2 3.0 1 .O 0.3 Milled Rice 196.3 209.4 226.2 251.3 257.1 Broken Rice 6.0 10.6 14.8 17.4 21.8
mt.1 (Milled ice ~ q u i n l e n t ) Rough r ice Hilled Rice Broken Rice
Bcrbipcnt8 im &I* t o the Rovince8
mtrl (Milled Rice Equivalent) Rargh r ice Milled Rice muken Bice
M (Milled Rice ~pu iv r l en t ) Rargh r ice Milled Rice Broken Bice
Bcrbipcntm im & U a to the Roviacea
m t r l lu l l led Rice mulvalent) Rargh r i c e Milled Rice Broken Rice
m t r l (Wlled Rice Equivalent) Rough r ice Milled Rice Broken Rice
mtrl (&tilled Rice Equivalent) Rough r ice Milled Rice) m i e n Rice
RICE STOCKS
Data shotm i n Table E-6 a r e Government and privately-awned stocks. They indica te the s t a t u s of s tocks a s of the l a s t Monday of t h e month. These stocks a r e placed i n sonle 49 l a rge warehouses and i n 100 wholesalers and r e t a i l e r s ' s to res i n Saigon and reported every Monday t o t h e Ministry of Economy. The Government s tockpi le was used t o supply such r i c e d e f i c i t a reas a s the eas tern provinces i n South Viet-Nam and d i s t r i c t s in Centra l Viet-Nam and t o provide f o r any r i c e shortage due t o f a c t o r s l i k e bad crop, f lood, insecur i ty e tc . Each year a quanti ty of 350,000 t o 400,000 tons of r i c e was bought t o make up t h e Government s tockpi le from which 25,000 tons t o 30,000 tons were released per month t o supply non r i c e producing areas.
I n 1965 Government stocks of Vietnamese r i c e were buls tered by imports, which were p a r t i c u l a r l y used t o provision Central Viet-Name By 1966 imported r i c e cons t i tu ted t h e major por t ion of stocks even in Saigon.
Rice Consumption
USOM est imates t h a t some 12% of rough r i c e produced i s l o s t due t o rodents, i n s e c t s , foreign matter and humidity shrinkage, and perhaps another 8% goes f o r seed, animal feed and i n d u s t r i a l uses. The remaining 8% i s , i n pr inc ip le , avai lable f o r consumption and export. For Saigon, t h e annual r a t e consumption i s estimated a t about 180,000 M.T.
Results of a s e r i e s of survey conducted by t h e National I n s t i t u t e of S t a t i s t i c s i n Saigon and s i x o ther areas from Apri l 1962 t o March 1963 ind ica te t h a t i n Saieon r i c e consumption averaged 318 grams of r i c e per capi ta per day, and i n r u r a l a reas 440 grams per cap i t a per day. In r u r a l Viet-Nam's r i c e surplus area , south of Saigon, the average was 472 grams p r day. In the r i c e - d e f i c i t Central Viet-Nam consumption averaged 432 grams.
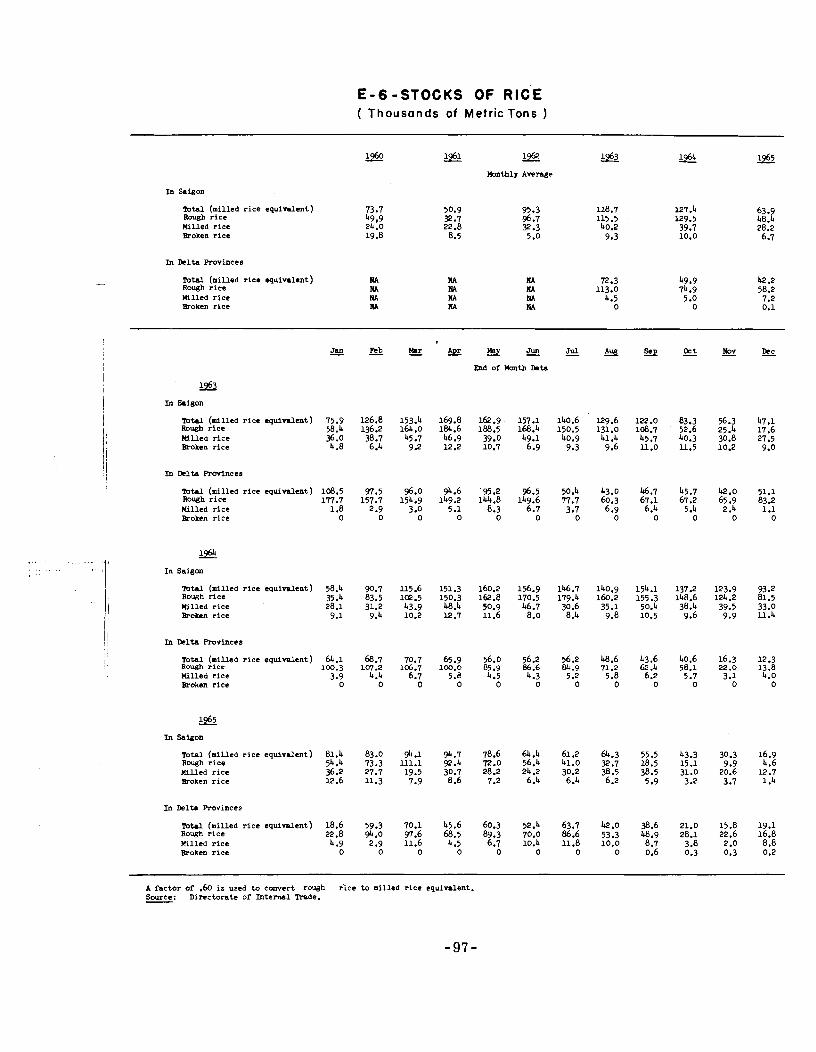
E - 6 - S T O C K S O F R I C E ( Thousands of Metric Tons )
In Saigon
Total (milled r ice equivalent) 73.7 50.9 Rough r ice 49 9 32.7 Milled rice d o 22.8 Broken r ice 19.8 8.5
In Delta Rovinces
Total (milled rice equivalent) RA Rough r ice M Willed rice RA Broken rice M
Total (milled rice equivalent) 75.9 Rough r ice 58.4 Wlled r ice 36.0 Broken rice 4.8
In Delta Rwincea
Total (milled rice equivalent) 108.5 Rough r ice 177.7 Killed r ice Broken rice
1964 - In Saigon
m t d (milled r ice equivalent) 58.4 Rough rice 35.4 Hilled r ice Broken r ice
Tbtal (milled r ice equivalent) 64.1 Rough rice 100.3 Filled r i c e 3.9 Broken r ice 0
952 In Saigon
Tbtal (milled r i c e equivalent) 81.4 Rough r ice 54.4 milled r ice 36.2 Broken r ice 12.6
In Delta Rovinces
TotLl (milled r i c e equivalent) 18.6 Rough r ice 22.8 Milled r i c e 4.9 Broken r ice 0
J W I J U 1
Pmd of Manth Data
Dec -
47.1 17.6 27.5 9.0
51.1 83.2 1.1
0
93 2 81.5 33.0 l l .4
12.3 13.8 4.0
0
16.9 4.6
12.7 1 .4
19.1 16.8 8.8 0.2
A factor of .60 i s used to convert rough r ice to milled r ice equivalent. Source: Directorate of Internal Wade. -
RICE EXPORTS AM) PRICES
Exports
~n 1964 export s dropped t o a lar l e v e l of 48,600 tons , I n 1965 exports were banned and i n f a c t some 128,000 tons were imported from t h e United S ta tes and Thailand, By t h e end of Ju ly 1966 about 4&,000 tons had been imported under a s e r i e s of agreements beginning with t h a t of November 30, 1964.
Pr ices
Wholesale p r i ces a r e thoae col lec ted d a i l y by t h e National Bank of Viet-Nam from dealers i n t h e Saigon wholesale r i c e market. The f igures represent a monthly average of d a i l y quotations. For months i n which t h e National Bank ind ica tes p r i ces a s " ~ o t quoted", est imates made by the Department of Agriculture a r e s h m . For the wholesale p r i c e index a able B-6) the National I n s t i t u t e of S t a t i s t i c s uses t h e p r i ces compiled by the National Bank of Viet-Nam and when such p r ices a r e "Not quoted", t h e "price" i n t h e preceding quoted month i s used. This may lend t o s izeable e r r o r s i n the index, R e t a i l p r i ces a r e those col lec ted by t h e National I n s t i t u t e of S t a t i s t i c s . Rice classed No.1, 25% broken and No.2, 4% broken, a re poor grades and a r e consumed mostly i n t h e Central provinces o r exported. Rice " ~ e Vang" andl%oc Nauflare consumed by Middle Income and Lower Income Families i n Saigon respectively.
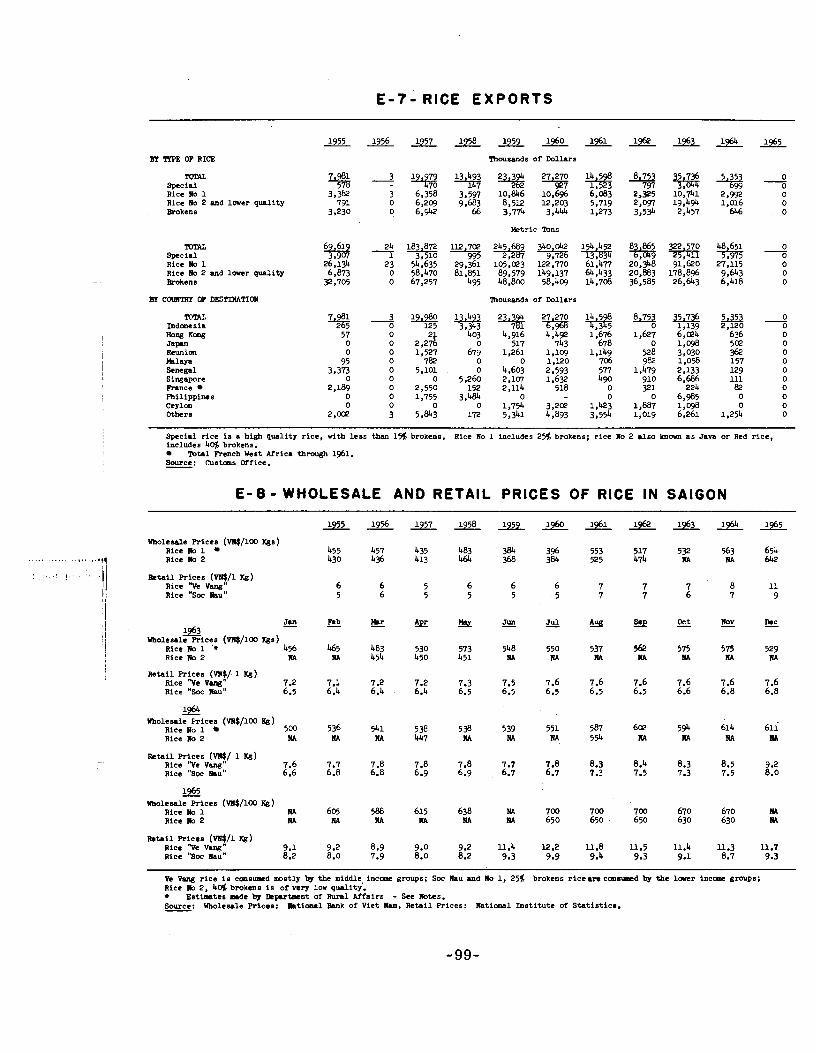
E - 7 - RICE EXPORTS
BI T P E OF RICE
m Special Rice Ro 1 Rice Ro 2 md lower quality Brokens
m m Special Rice Ilo 1 Rice Ro 2 and l w e r quality Wakens
m Indonesia Hang Kong Japan Reunion Mlnya Senegal Singapore Prance milippines Ceylon Ctkra
g % = l g S e a * *
Thousands of Dollars
Mtr ic Tons
Thousands of Dollars
Special rice i s a high quality rice, with less than 1% brokens. Rice Ro 1 includes 25% brokens; rice Ro 2 also I m w as Java or Red rice, includes 409 bmkens.
To ta l Rench West Africa through 1961. Source: Custams Office. -
E - 8 - WHOLESALE AND RETAIL PRICES OF RICE IN SAIGON
Wholede Rices (W$/lW Kgs) Rice Ilo 1 455 457 435 483 384 396 553 517 532 563 654 Rice Ilo 2 430 436 413 464 368 384 525 474 M nA &2
R t a i l Rices ( W / l Kg) Rice "Ve Vmg" Rice "Sa. mu"
Rice Ilo 1 '* 4% 465 483 530 573 548 550 537 562 575 575 529 Rice Ilo 2 M M 45'4 450 451 M nA M nA M nA nA
Retail Rices (W$/ 1 Kg) ice "Ve varrg" 7.2 7.1 7.2 7.2 7.3 7.5 7.6 7.6 7.6 7.6 7.6 7.6 Rice "SOC ~ a u " 6.5 6.4 6.4 6.4 6.5 6.5 6.5 6.5 6.5 6.6 6.8 6.8
3s.i Wholesale Prices (W$/lW Rg)
Rice no 1 500 536 5'41 538 538 539 551 587 602 594 614 61i Rice Ilo 2 M nA nA 447 M M nA 55'4 M M nA M
&ta i l Rices (W$/ 1 Kg) ice "Ve Vang" 7.6 7.7 7.8 7.8 7.8 7.7 7.8 8.3 8.4 8.3 8.5 9 2 Rice "Sa. Rau" 6.6 6.8 6.8 6.9 6.9 6.7 6.7 7.3 7.5 7.3 7.5 8.0
92 Wholesale Rices (W$/100 Rg)
Rice Ilo 1 605 5@8 615 638 M 700 700 7W 670 670 M Rice Ilo 2 M M nA nA nA nA 650 650 650 630 630 M
Retail R ices (*/1 Rg) Rice "Ve Vang" 9.1 9.2 8.9 9.0 9.2 ll.4 12.2 ll .8 ll.5 11.4 U.3 U.7 Rice "Sa. Ilau" 8.2 8.0 7.9 8.0 8.2 9.3 9.9 9.4 9.3 9.1 8.7 9.3
Ve Vmg rice i s cmsurd mostly by tbe middle income groups; Sa. Rau md Ro 1, 25% brokens riceare cm-d by the l o n r incame groups; Rice Ilo 2, 409 brokens i s of very low quality. + E s t h t e s mde by Qpvtocnt of -1 Affaire - See Ilotes. Source: Wholebale Pricea: L t i d BMk of Viet Rm, Retail Prices: l l a t i o ~ l Institute of Statistic#. -
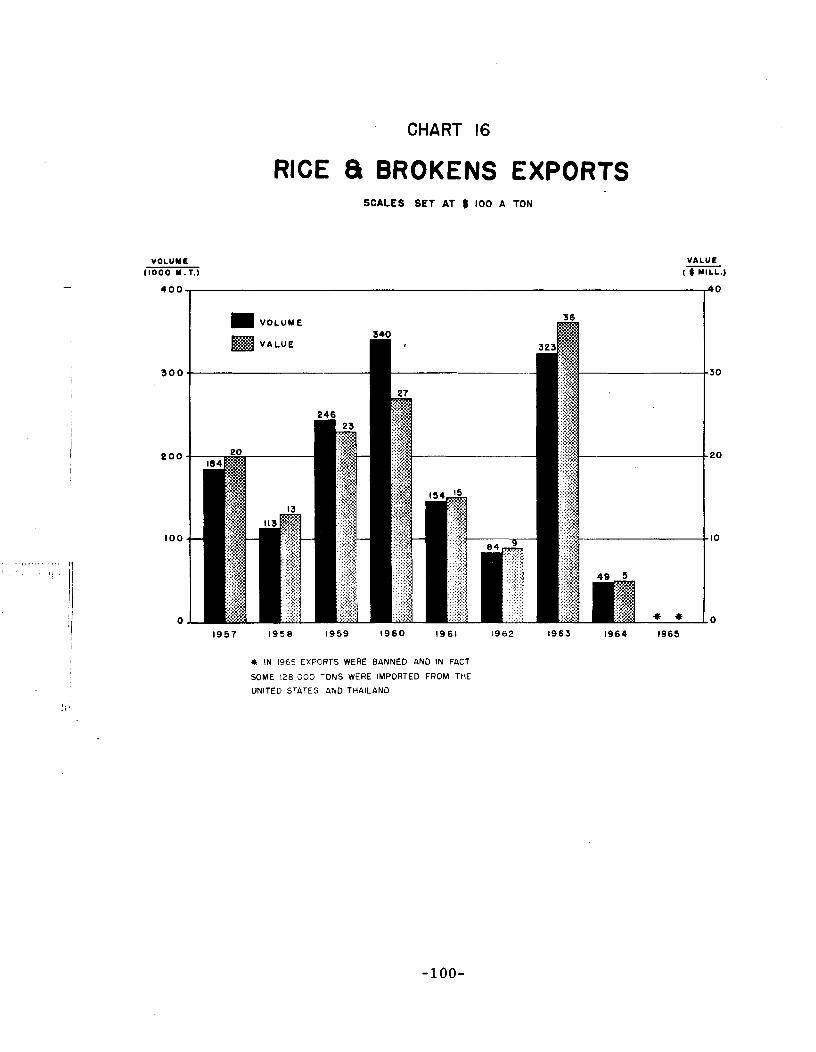
CHART 16
RICE S BROKENS EXPORTS SCALES SET AT $ 100 A TON
VOLUY E VALUE ( 1 0 0 0 Y .T.) ( $ MILL.)
4 0 0 40
* IN 1965 EXPORTS WERE BANNED AND IN FACT
SOME 128.000 -0NS WERE IMPORTED FROM THE
UNITED STATES AND THAILAND
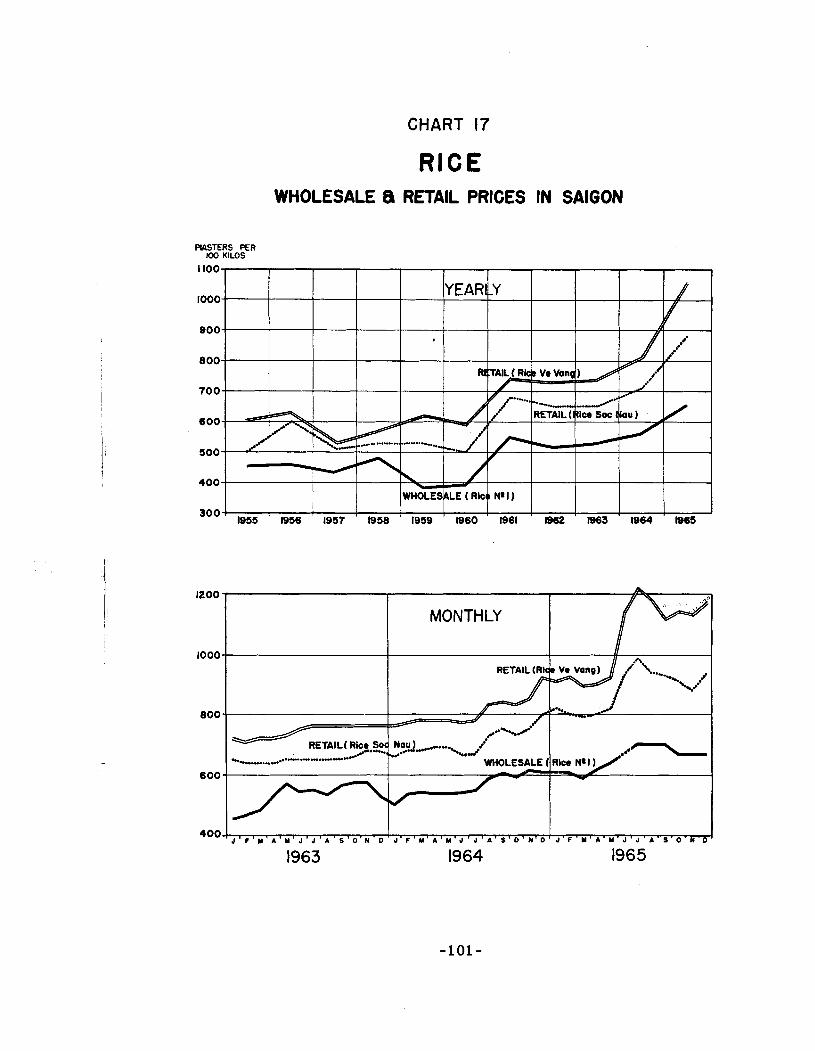
CHART 17
R ICE WHOLESALE 8 RETAIL PRICES IN SAlGON
WSTERS PER 100 KILOS
1100
1000
BOO
800
700
600
500
400
RUBEER PLANTATIONS
Plantat ions have been divided i n t o two groups:
1. Large Planta t ions r e f e r t o members of the Syndicate of Planters and include a l l p lanta t ions of more than 500 hectares. Data on these p lanta t ions a r e gathered by t h e Syndicate and a r e considered t o be r e l i a b l e .
- 2. Other Planta t ions include planta t ions of under 500 hectares and a few la rge p lanta t ions which a r e not members of t h e Syndicate. Data f o r 1944, 1957 and 1958 a r e based on est imates made by t h e Syndicate; d a t a f o r 1959 and a f t e r a r e based on sample surveys conducted by t h e Agriculture
I Department. I I
The f igures reported f o r planted area include a l l land devoted t o rubber t r e e s of a l l ages. Po ten t i a l ly Productive area includes only those t r e e s o ld enough t o be commercially tapped. Actual productive area includes a l l t r e e s ac tua l ly tapped. Yield per hectare i s ca lcula ted on t h e bas i s of ac tua l productive area.
I
In 1965 both the area .under production and t o t a l production decreased sharply due t o poor secur i ty conditions. Some l a r g e p lan ta t ions were completely abandoned such as those i n Phuoc Long, Binh-Duong and Hau-Nghia provinces; othershad t o c u r t a i l t h e i r a c t i v i t y .
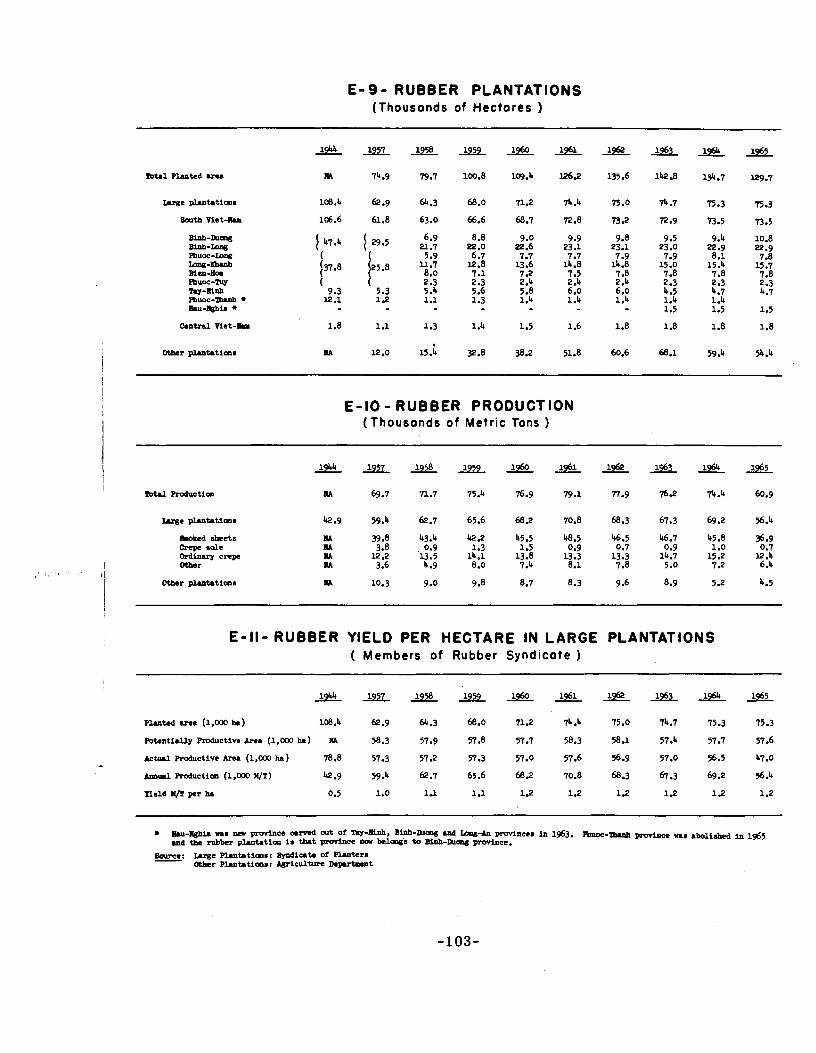
E - 9 - RUBBER PLANTATIONS (Thousands of Hectares )
mt.1 Planted are.
Other phatatims M 12.0 15.1 32.8 38.2 51.8 60.6 68.1 59.4 54.4 I
E - I 0 - RUBBER PRODUCTION
i (Thousands of Metric Tons )
IbDttd shcets Crep eole minuy c=pe Other
E- l l - RUBBER YIELD PER HECTARE IN LARGE PLANTATIONS ( Members of Rubber Syndicate )
mtentia~y Reductive &e. ( 1 , m ha) AA 58.3 57.9 57.8 57.7 58.3 58.1 57.4 57.7 57.6
yield H/T per ha 0.5 1.0 l.l 1.1 1.2 1.2 1.2 1.2 1.2 1.2
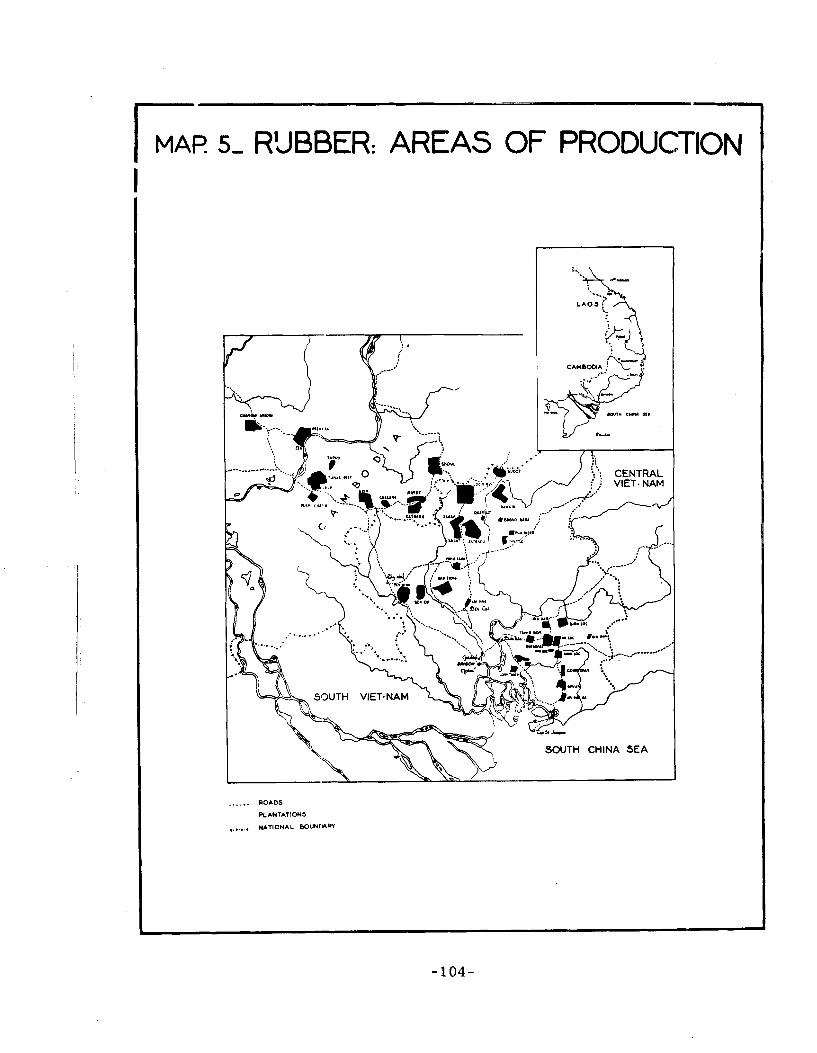
I MAP 5- RYBBER: AREAS OF PRODUCTION
...... ROADS
PLANTATIONS
..,.,,.. NATIONAL BOUN[*\w
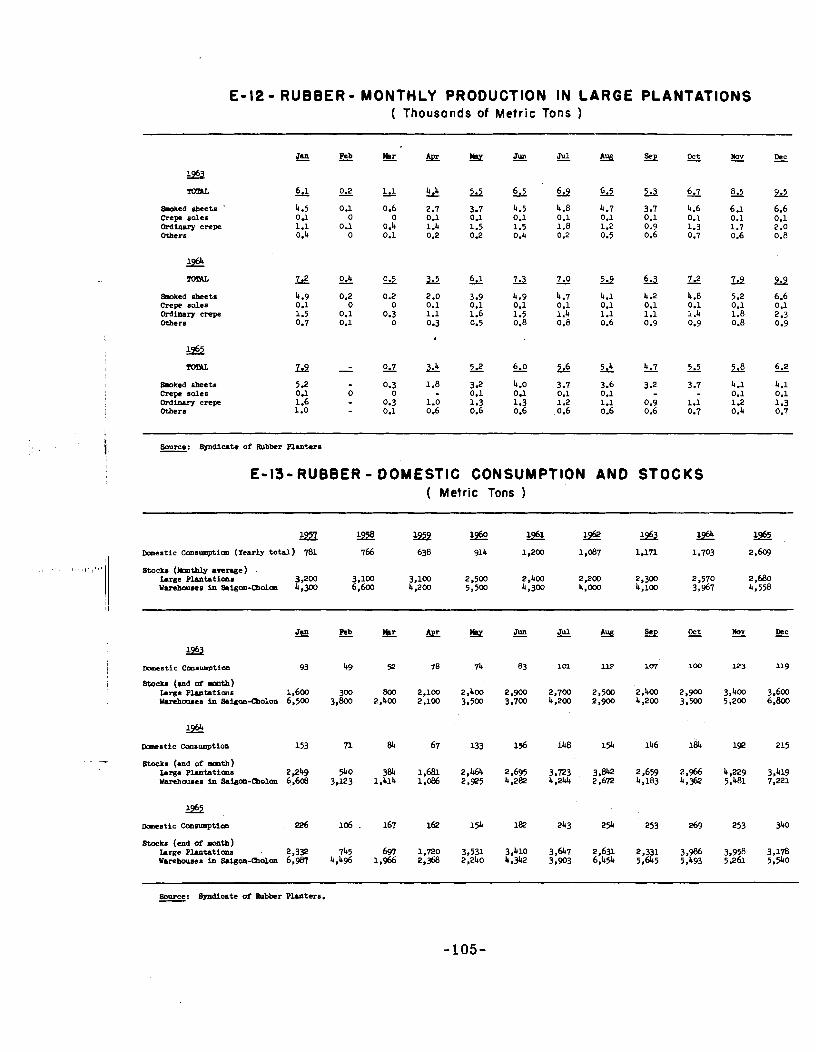
E-12 - RUBBER - MONTHLY PRODUCTION IN LARGE PLANTATIONS ( Thousands of Metric Tons )
w e d Iheets . 4.5 0.1 0.6 2.7 3.7 4.5 4.8 4.7 3.7 4.6 6.1 6.6 Crepe soles 0.1 0 0 0.1 0.1 0.1 0.1 0.1 0.1 0.1 0.1 0.1 Ordinary crepe 1.1 0.1 0.4 1.4 1.5 1.5 1.8 1.2 0.9 1.3 1.7 2 .O Others 0.4 o 0.1 0.2 0.2 0.4 0.2 0.5 0.6 0.7 0.6 0.8
hoked sheets 4.9 0.2 0.2 2.0 3.9 4.9 4.7 4.1 4.2 4.8 5.2 6.6 Crepe soles 0.1 0 0 0.1 0.1 0.1 0.1 0.1 0.1 0.1 0.1 0.1
1.5 0.1 0.3 1.1 1.6 1.5 1.4 1.1 1.1 1.4 1.8 2.3 OrdilmY crepe Others 0.7 0.1 0 0.3 0.5 0.8 0.8 0.6 0.9 0.9 0.8 0.9
Smked sheets Crepe soles Ordinary crepe Others
Source: Syndicate of Rubber Planters - E-13-RUBBER - DOMESTIC CONSUMPTION AND STOCKS
( Metric Tons )
2z m a s t i c coosumption (Yearly to ta l ) 781
I
se ~omestic cansumption
- Stocks (end of amth) urge ~ h t a t i o n s 2,249 540 384 1.681 2,4Y, 2.695 3,R3 3.842 2.659 2,966 4,229 3.419 Warehausesin5alg~-Cholon 6,608 3,123 1,414 1.a 2.95 4,282 4,2W( 2,6R 4,183 4.w 55.81 7,221
stocks (end Of month) h r g e p h t a t i c m s . 2,332 745 691 1,720 3.531 3,410 3.647 2.631 2,331 3,986 3.958 3.178 Warzha~esin5algon-Cholon 6.987 4,496 1.966 2,368 2,240 4.M 3.903 6.454 5.645 5.493 5,261 5.540
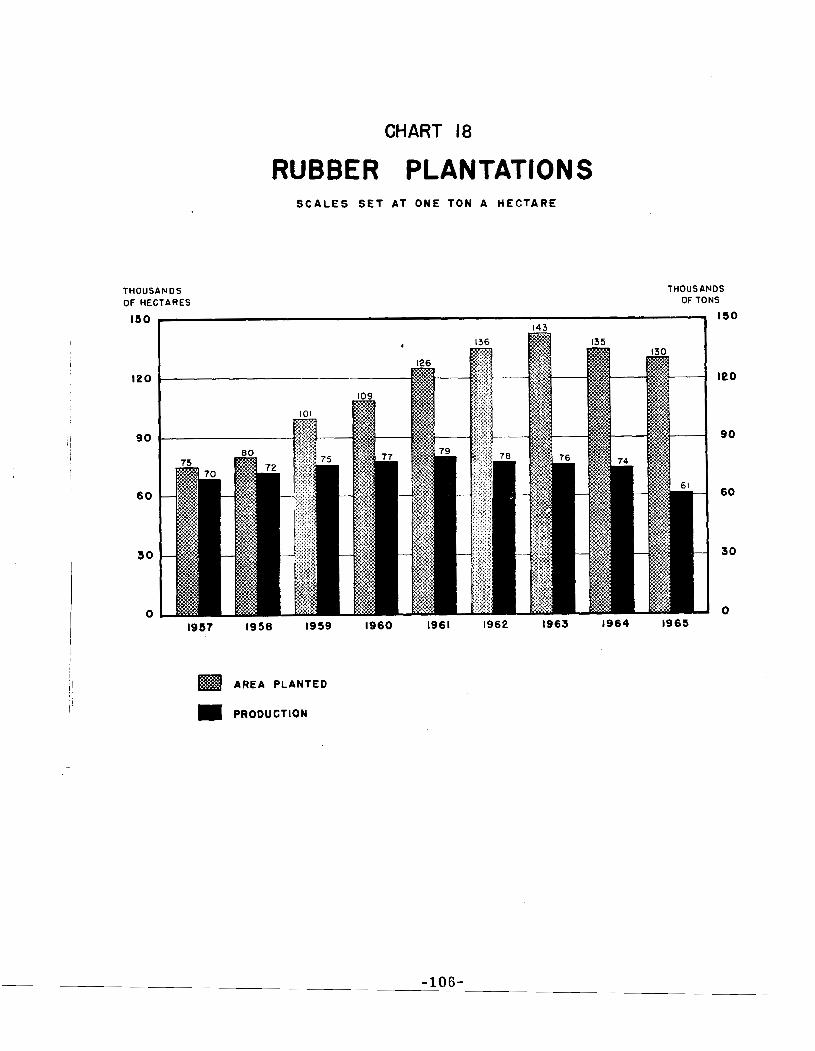
CHART 18
RUBBER PLANTATIONS SCALES S E T AT ONE TON A HECTARE
THOUSANDS OF HECTARES
1 HOUSANDS OF TONS
AREA PLANTED
PRODUCTION
Data represent a c t u a l shipments. I n 1964 expor ts increased i n quantity but decreased i n value a s a r e s u l t of t h e downward t rend of t h e Saigon rubber export p r i ce . The s i t u a t i o n improved i n 1965, and i n 1966 with t h e devaluation of t h e p i a s t e r t h e Saigon export p r i c e became competitive .
Rubber e x ~ o r t prices FOB Saiaon.
The p r i c e s shown a r e obtained from t h e Of f i ce of P r i c e Control . This Off ice sets t h r e e t a b l e s of market p r i c e s each day: one f o r t h e French Franc Area, one f o r t he Dol la r Area and one f o r t h e S t e r l i n g Area. These market p r i c e s a r e based on the minimum p r i c e s quoted i n P a r i s , New York and London. The p r i c e s shown here represent t h e market f o r t h e French Franc Area converted from French f r a n c s per k i l o t o US
1 , c en t s per pound; t h e second c o l u m ~ ~ of t a b l e E-15 represents t h e p i a s t e r
j ; y i e ld t o t h e expor ter f o r each pound of rubber exported t o French Franc Area.
11 . Age of Rubber P lan ta t ions
Data r e f e r t o p l an ta t ions of members of t h e Syndicate of P lan te r s . Tapping is genera l ly begun when a t r e e reaches seven yea r s of age.
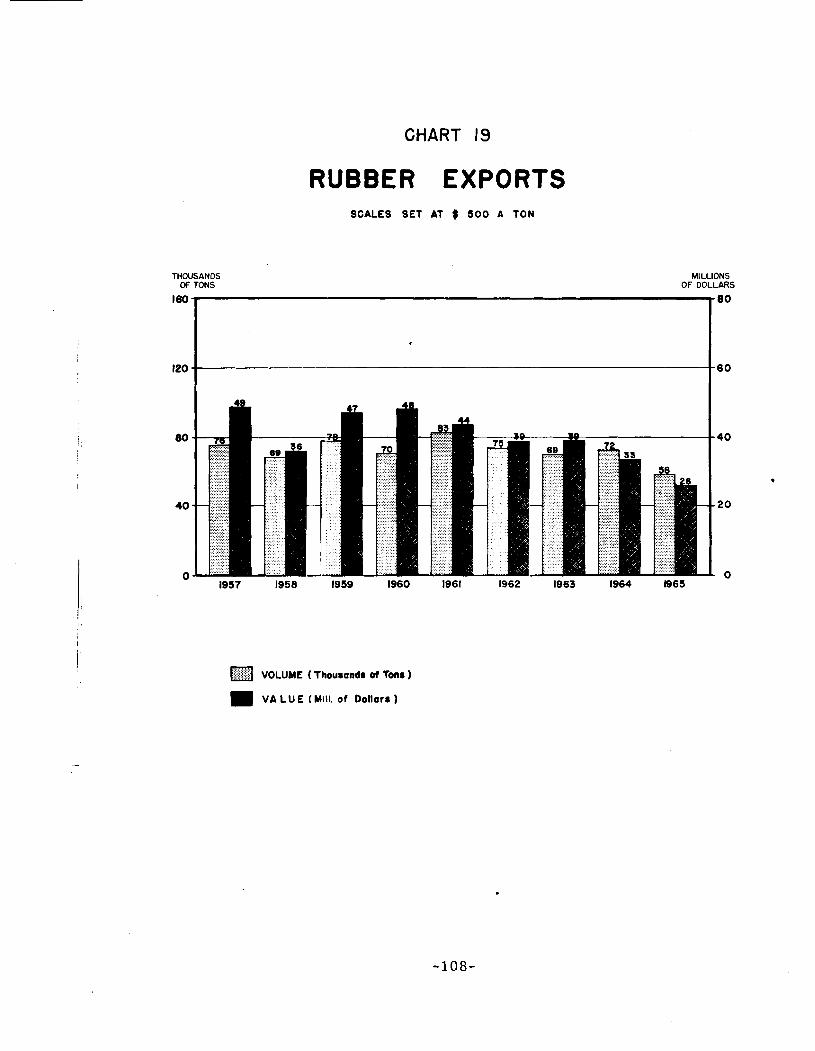
CHART 19
RUBBER EXPORTS SCALES SET AT $ 5 0 0 A TON
THOUSANDS MILLIONS OF TONS OF DOLLARS
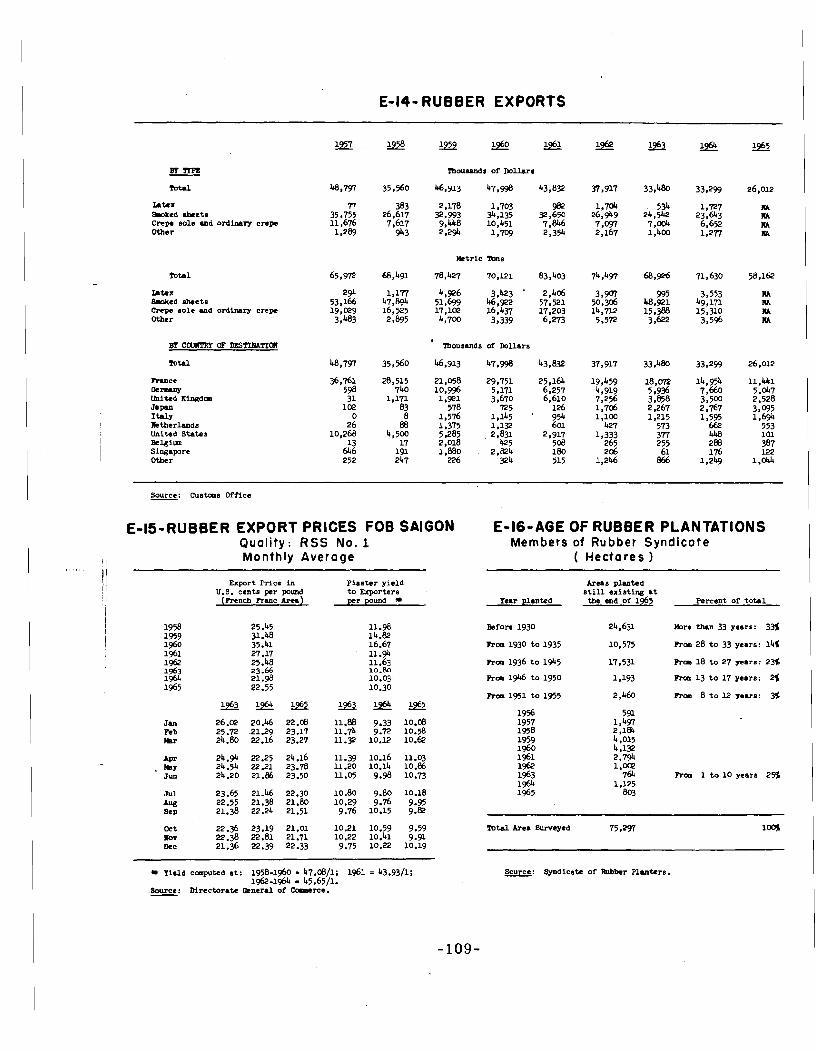
E-14-RUBBER EXPORTS
BYm
mtrl
hter smoked .beets crepe sole md ordinary crepe Other
Total
h t e X 8.oked sheets Crepe mole and ordinary crepe Other
lbouaands of Dollars
Rmce -l=w United Kingdm Japan Itrly k t h e d m d s United States Belgium Singapore Other
Source: Customs Mflce
E-15-RUBBER EXPORT PRICES FOB SAIGON E-16-AGE OF RUBBER PLANTATIONS Quolity: R S S No. 1 Members of Rubber Syndicate Monthly Averoge ( Hectares 1
Export Price in U.S. cents per polmd
(Rcnch R m c Area)
Piaster yield t o Exporters per pound Year planted
Areas planted s t i l l existing a t the end of 1965 Rrcent of t o t a l
Before 1930 24,631 h r e than 33 years: 3%
10,575 Ro. 28 t o 33 years: 14
17.53 Prcm 18 t o 27 years: 2%
1,193 ~m 13 t o 17 years: 2%
Rcm 1951 t o 1955
4;1+ 2,794 1,002
764 R m 1 t o 10 years 25% 1,125
003
10.21 10.59 9.59 Total Area Surveyed 75,297 lm 10.22 10.41 9.91
Source: Syndicate of Rubber Planters. - Yield C q b d a t : 1958-1960 = 47.08/1; 1961 = 43.93/1; 1962-1964 = 45.65/1.
.Source: Directorate General of C a u r c e . -
MISCELLANEOUS CROPS
General
The Government of Viet-Nam reports crop production on a calendar year bas is , Prior t o 1960 data a re based on estimates made by the Provincial Agriculture Service, F'rom 1960 on data a r e based on an annual sample survey, with adjustment made i n cooperation with the Provincial Agriculture Service,
For crops such as corn, sweet potatoes, manioc, soya beans, and peanuts, area f igures incl-ude double counting fo r double cropping, In many areas, pa r t i cu la r ly Central Viet-Nam, sweet potatoes are grown a s a ro ta t ion crop with r ice .
Corn - The p roduc t i~n f igure represents almost en t i r e l y f i e l d corn va r i e t i e s
g rom for d i r ec t human consumption. Very l i t t l e corn i s fed t o animals,
Coconuts
The f igures reported a re an estimate of coconut production. Nearly hal f of the coconuts grown are u t i l i zed . f resh from the t r e e f o r t h e i r milk. The other major use of coconuts i s f o r copra, One thousand r ipe coconuts y ie ld , on an average, 175 k i los of copra. The bulk of Vietnamese copra i s pressed loca l ly f o r o i l used i n soap production.
Tea - 1; Tea represents the t h i r d most important foreign exchange earner f o r
I I Viet-Nam, a f t e r r i c e and rubber. The bulk of the t e a produced i n Viet-Nam I fo r dornestic consumption i s green tea . However, the bulk of the export I t rade i s black t e a , Green tea i s produced mostly i n Lam-Dong and black I t e a mostly i n Dalat and Ple iku. The y i e l d averaged 2,500-3,000 t o n s f r e s h
t ea per hectare and every 5 ki los of f resh t e a gives 1 k i l o of dried tea. Figures shown i n t ab le E-18 are dried t e a of which black t e a accounts for ' 40 percent.
I n 1965, t o t a l export amdunted t o 2,341 metric tons, The United -- Kingdom alone bouzht 1,887 tons of Viet-Nam's tea.
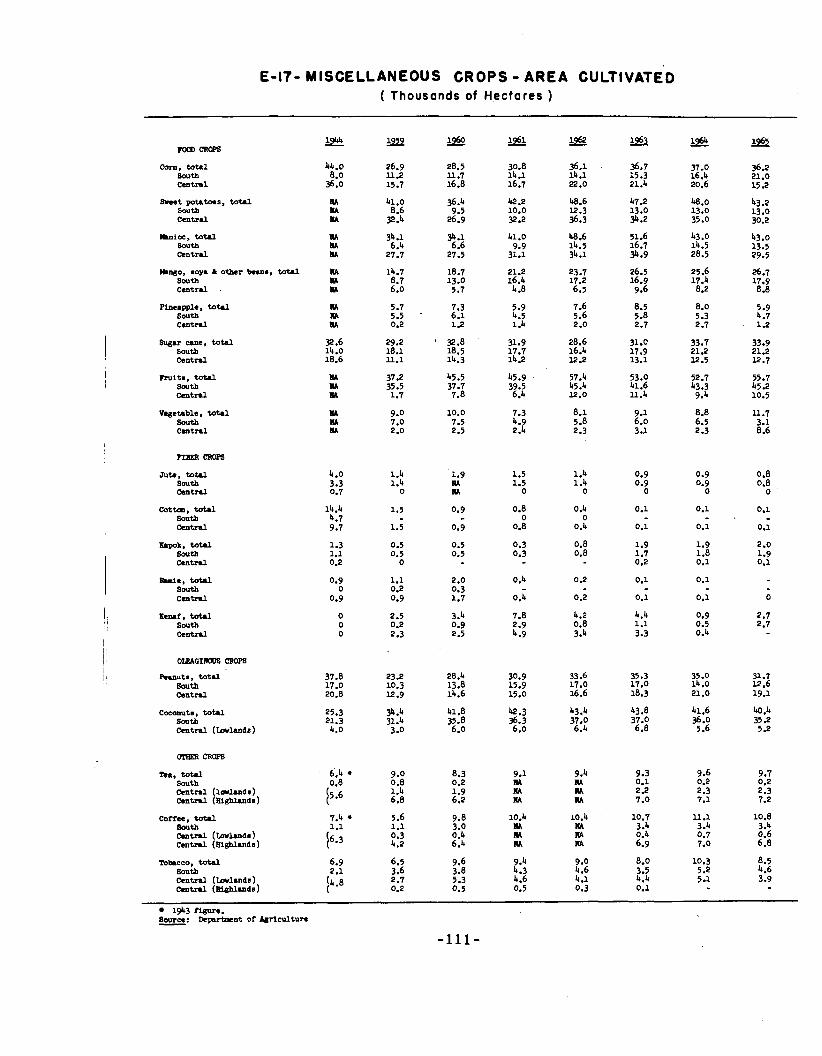
€-I?- MISCELLANEOUS CROPS - AREA CULTIVATED ( Thousands of H e c t a r e s )
Corn, t o t a l &aJth Centrnl
sweet potatas, total South cent r r l
Ilurioc, total south Central
-0, soy. & other kana , total South central .
SlIgU cmc, total South central
n u i t s , total Soutb Ccatrrl
V.getable, totrl South Central
Jute, t o t a l south Cca tn l
Cattm, tow south Central
rnpok, total soutb Centrrl
m e , t0t.l South Central
Kelui, totrl south Centrrl
0mcImJa CROPS
Ranuts, total south cent ra l
Coconuts, total South Central (Lorluldl)
re., total South Central (lwluldr) Central (8ighlmd8)
1943 W e . source: Department ?i Agr l~u l t u r e -
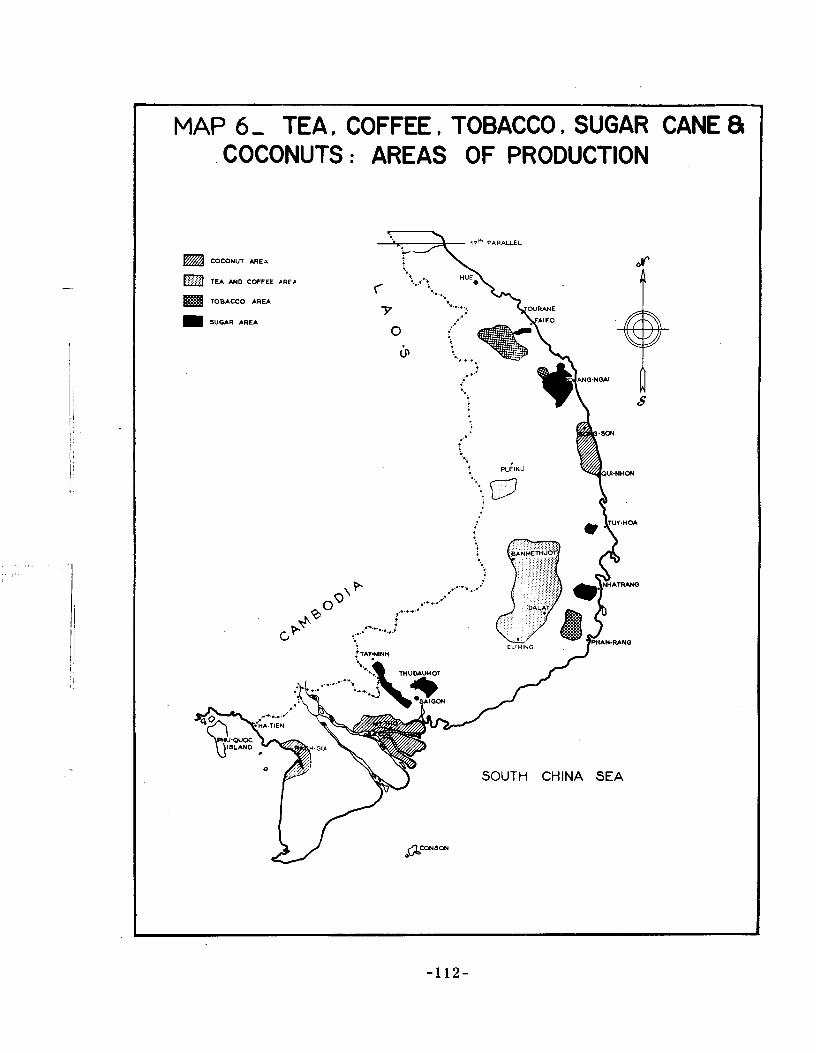
MAP 6 - TEA, COFFEE, TOBACCO. SUGAR CANE 8 COCONUTS : AREAS OF PRODUCTION
COCONUT AREA
f-J TEA W D Co,?FE fiRE@
TOBACCO AREA
SUGAR AREA
17' PARALLEL
C
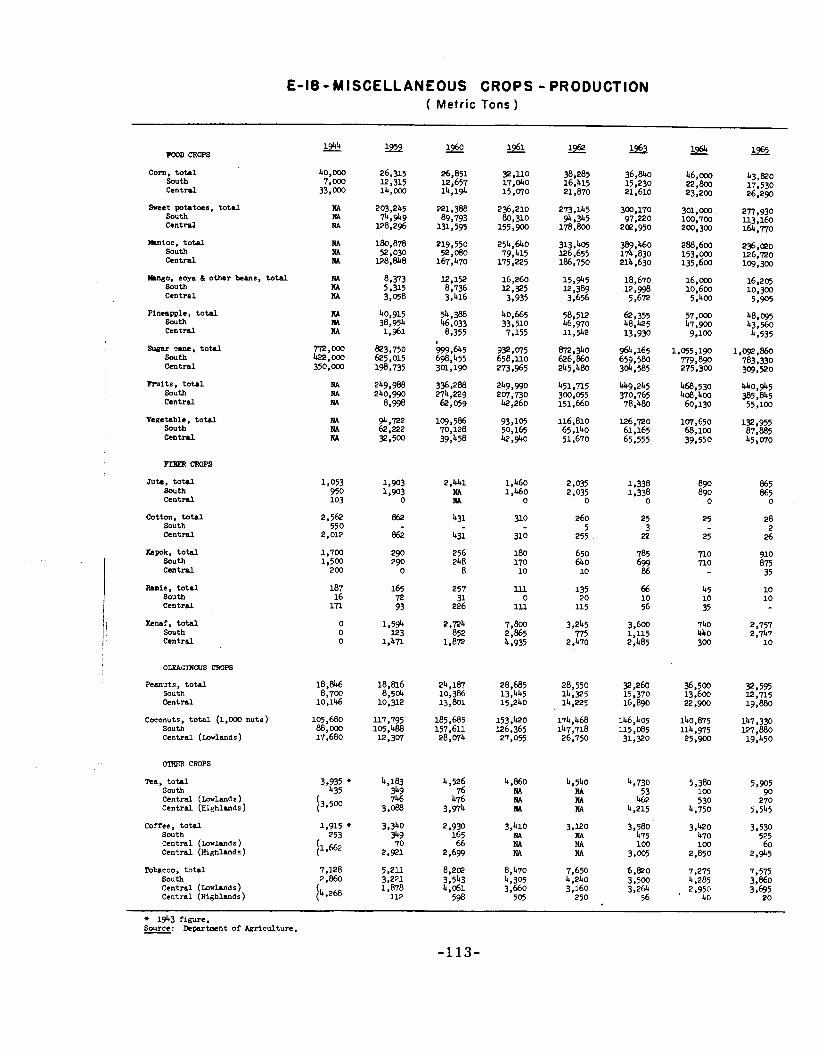
E-18 - MISCELLANEOUS CROPS - PRODUCTION ( Metric Tons )
r n D CROPS
Corn, t o t a l south Centrd
Sveet potatoes, t o t a l South Centrd
m i o c , t o t a l South Centrd
)hngo, soya & other beans, t o t a l South Central
Pineapple, t o t a l South Central
Sugar cure, to ta l South Central
R u i t s , t o t a l South Central
Vegetable, to ta l south Central
IIBER CROPS
Jute, t o t a l South Central
Cotton, to ta l South Central
Kapok, t o t a l south Central
Ramie, t o t a l south Central
Rmaf, t o t a l South Central
OLFAGINWS CROPS
Peanuts, t o t a l South Central
Coconuts, t o t a l (1,000 nuts) South Central (Lowlands)
Tea, t o t a l South Central (Lowlands) Central (~ ighlands )
Coffee, t o t a l South Central (Lowlands ) Central (Highlands)
'robncco, t o t a l South Central (Lowlands) Central (Highlands )
2s
9.110 17.&0 15,070
236,210 80,310
155,900
254,640 79,415
175,225
16,260 12.95 3,935
40,665 33,510 7,155
9 9 , 4 5 6 5 8 , ~ 0 273,965
249,990 24,730 42,260
93,105 50,165 42,940
1,460 1.460
0
310
310
180 170 10
lll 0
lll
7,800 2,865 4,935
28,685 13,445 15,240
153,420 126,365 27,055
4,860 NA RA M
3,410 NA RA luA
8,470 4.305 3.660
505
+ 1943 figure. Source: hpartment of Agriculture. -
LIVESTOCK AND POULTRY
Data through 1959 a r e based on e s t ima tes made by t h e P rov inc ia l Veter inary Se rv ice ; from 1960 on da ta a r e based on sample surveys conducted
by t h e Agr i cu l tu ra l Economics and S t a t i s t i c s Service. I t is l i k e l y t h a t t h e sharp inc reases between 1959 and 1960, a s f o r exau~ i l e with chickens and p igs , a r e due more t o method of c o l l e c t i o n of da t a than t o any r e a l increase .
H O G S
A r r i v a l s a t Saigon
Include hogs a r r i v i n g f o r consumption i n Saigon and f o r t rans- shipment t o hog-def ic i t provinces.
Cont ro l led Slaughter ings
Data are based on r e p o r t s from Saigon and p rov inc ia l s laughterhouses. They include connnerclal s l augh te r and farm s l augh te r f o r home consumption t o t h e ex ten t t h a t t h e l a t t e r a r e repor ted t o t h e s laughterhouses, which by law, they fahould be.
Wholeeale P r i c e s i n Saigon
These a r e t h e da ta c o l l e c t e d by t h e National I n s t i t u t e of S t a t i s t i c s f o r u se i n the wholesale P r i c e Index.
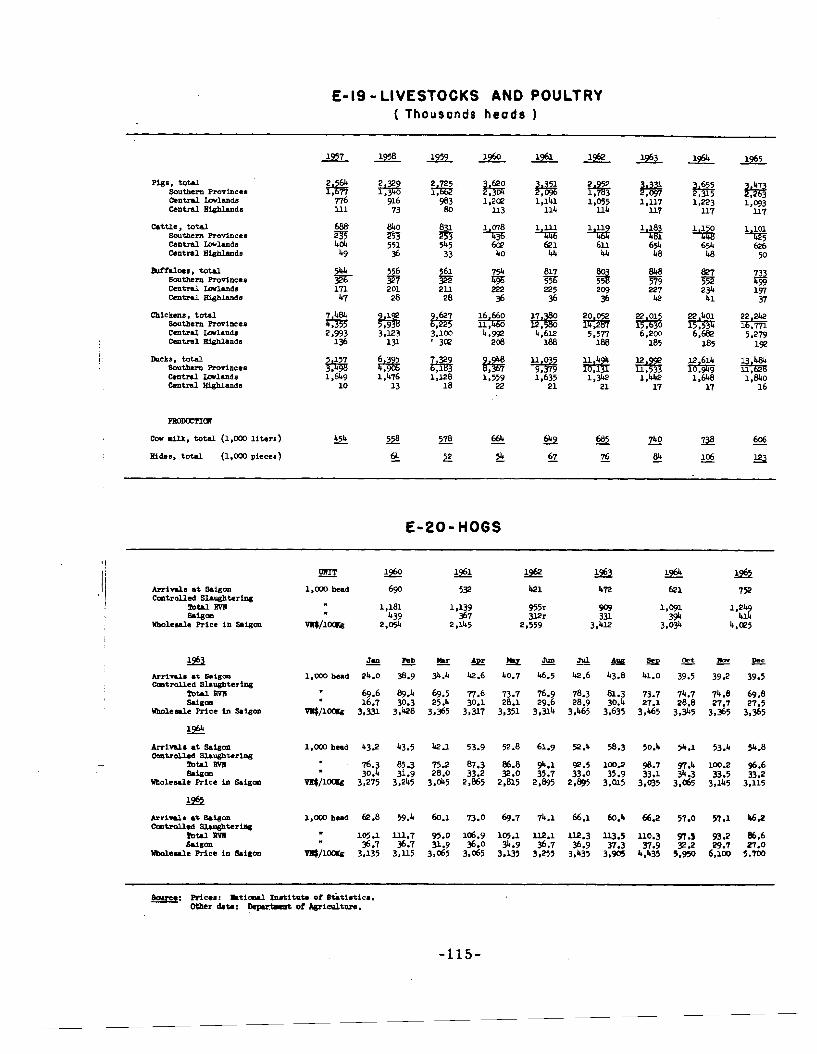
E- IS - LIVESTOCKS AND POULTRY ( Thousands heads )
pigs, total Southern Provinces Centrrl Lalnnds Central Bighhds
cattle, total Southern Rovinces Central Lalnnds Centrnl H&hbnds
BUfnlaa, total Southern Rorlnces Central Lalands Central Highleads
Chickens, tdal Southern Rovinces Central LaLLnda Central Bighlr~~ds
cov milk, total (1,000 l i tera)
Bides, total (1,000 pieces)
E-20- HOGS
L& Jurm~&r~JulA~hactnOVB- ~ r r i d m rt smum 1 , ~ bend 24.0 38.9 34.4 42.6 40.7 46.5 42.6 43.8 41.0 39.5 39.2 39.5 CatmUed Slrughterlq
TOW m 69.6 89.4 69.5 77.6 73.7 76.9 78.3 81.3 73.7 74.7 74.8 69.8 SIi8-n 16.7 30.3 25.4 30.1 28.1 29.6 28.9 30.4 27.1 28.8 27.7 27.5
~holeanle R I C ~ in ~ n i e ~ ~ VR$/lW 3 , m 3,428 3,365 3,317 3,351 3,314 3,465 3.635 3,465 3.345 3,365 3,365
m t r l f i - 105.1 U . 7 95.0 106.9 105.1 U.1 U . 3 u . 5 110.3 97.9 93.2 86.6 W8On 36.7 36.7 3 . 9 36.0 34.9 36.7 36.9 37.3 37.9 9 . 2 29.7 27.0
Whdelrle Rice in Brigon v n $ / l ~ ~ ( e 3,135 3,115 3,065 3.065 3,135 3,255 3,435 3,905 4.435 5,950 6,100 5.m
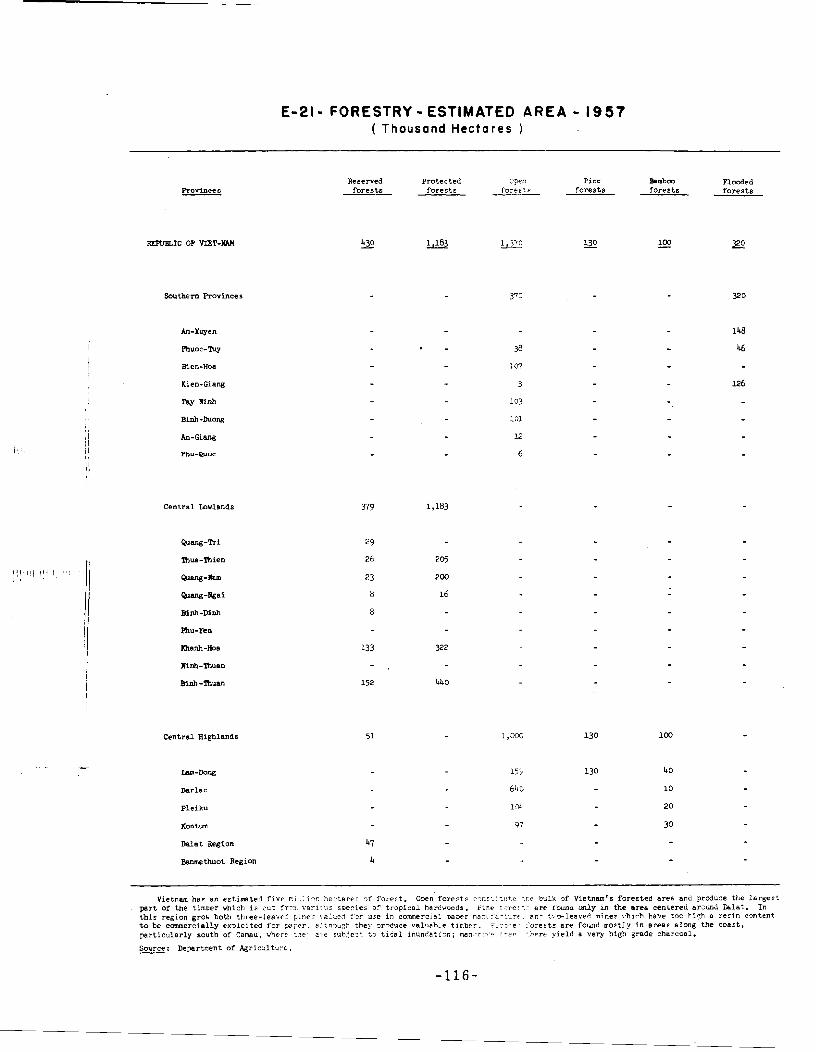
E-21- FORESTRY -ESTIMATED AREA - 1 9 5 7 ( Thousand H e c t a r e s )
Rovinces Reserved Protected 3pen P ine Bamboo Flaoded
f o r e s t s f o r e s t s f o r e s t s f o r e s t s f o r e s t s f o r e s t s
Southern Provinces
Central Lowlands
Centrnl Highlands
ram-mng
Darlac
Pleiku
Kontum
M a t Region
Banme thuot Region
Vietnan has an estimated f i v e r . ~ _ l i ? r . hectare: ?f fo res t . Open f o r e s t s c-r.c::-vutp ..re bulk of Vietnam's forested area and produce the largest pnrZ o r the timber vhich i s ;ut fr-2, rar1::is sDecies of t r o p i c a l hardwocdr. Pine t-re:': e r e i'ouna m l y in the are6 centered araund &la:. In t h i s region grow both three-leave! pine5 s a l u e d fx use in com~erc ia l Dawr R ~ ? c ? B - ~ ? I T T . an' t io - l eave t nines 7-hich have too h i g h a r e r i n c m t c n t ZO be co~lmercinl ly explci ted f o r p p r r , s:;hlugh they Drlduce v a h a b l r timber. F . z > . e f ' a re r t s a r e found mostly i n a reas along the coas t , pa r t i cu la r ly south of Camau, where -.>r.: z l e subje-r ;o t i e s 1 inundation; man-r:.,':. ; r ? r .h?rc- y ie ld a very high grade charcoal.
Source: Departnent o f A g i c d t u r c . -
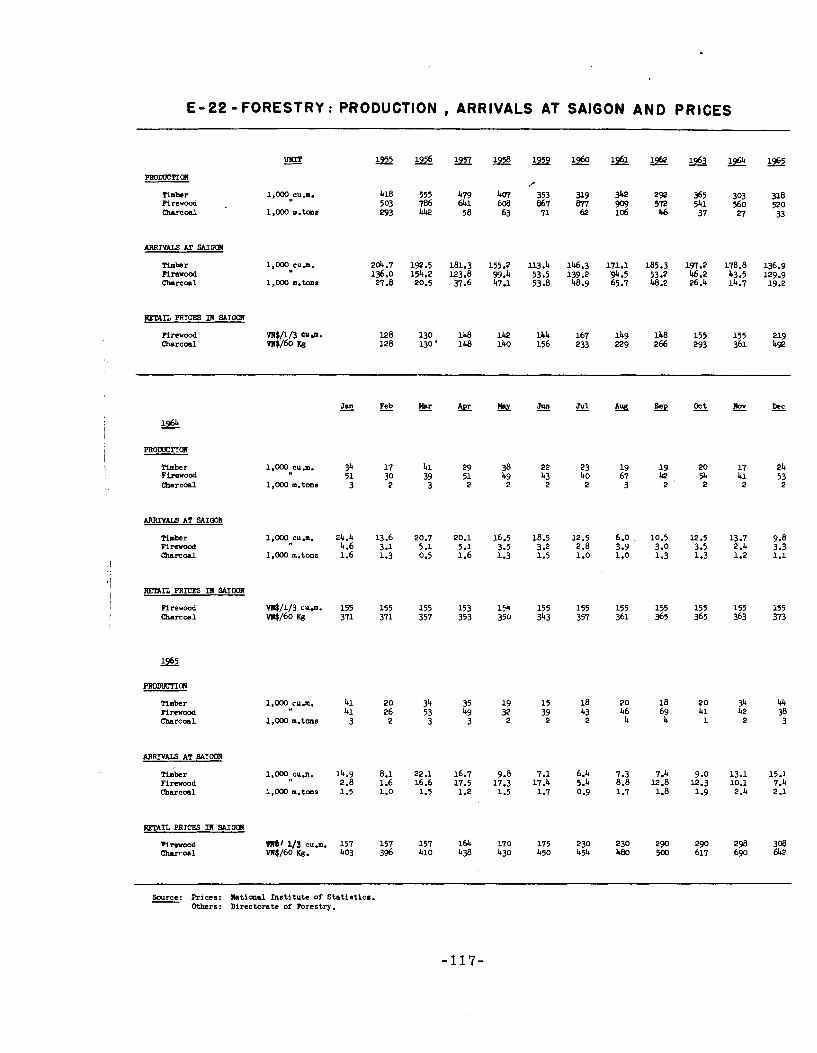
E - 22 - FORESTRY : PRODUCTION , ARRIVALS AT SAIGON A N D P R I C E S
Timber 1,000 cu... Firewood . Chsrcoal 1.000 m.tcma
ARRIVALS AT SAIWA
m b e r nrem Charcoal
RETAIL PRICES S A I M
Firewood Charcoal
I \ f i b e r Firsrood
Charcoal
ARRIVALS AT SAICOR
Timber 1.000cu.m. 24.4 13.6 20.7 20.1 16.5 18.5 12.5 6.0 10.5 12.5 13.7 9.8 Plmd 4.6 3.1 5.1 5.1 3.5 3.2 2.8 3.9 3.0 3.5 2.4 3.3 Charcoal 1,000m.tons 1.6 1.3 0.5 1.6 1.3 1.5 1.0 1.0 1.3 1.3 1.2 1.1
1 !
1 / I Plrewwd I Charcoal
Timber Pirewood Charcoal
ARRIVAL? AT S A I m
Timber Firewood Charcoal
FETAIL PRICES Ilr SAIWA
Wrtraod @11/3cu.m. 157 157 157 164 170 175 230 230 290 290 298 308 Charcoal w $ / ~ o K ~ . 403 3% 410 438 430 450 454 480 500 617 690 642
Source: Prices: Ilatlonrl Ins t i tu te of Statiatica. - Others: Directorate of Forestry.
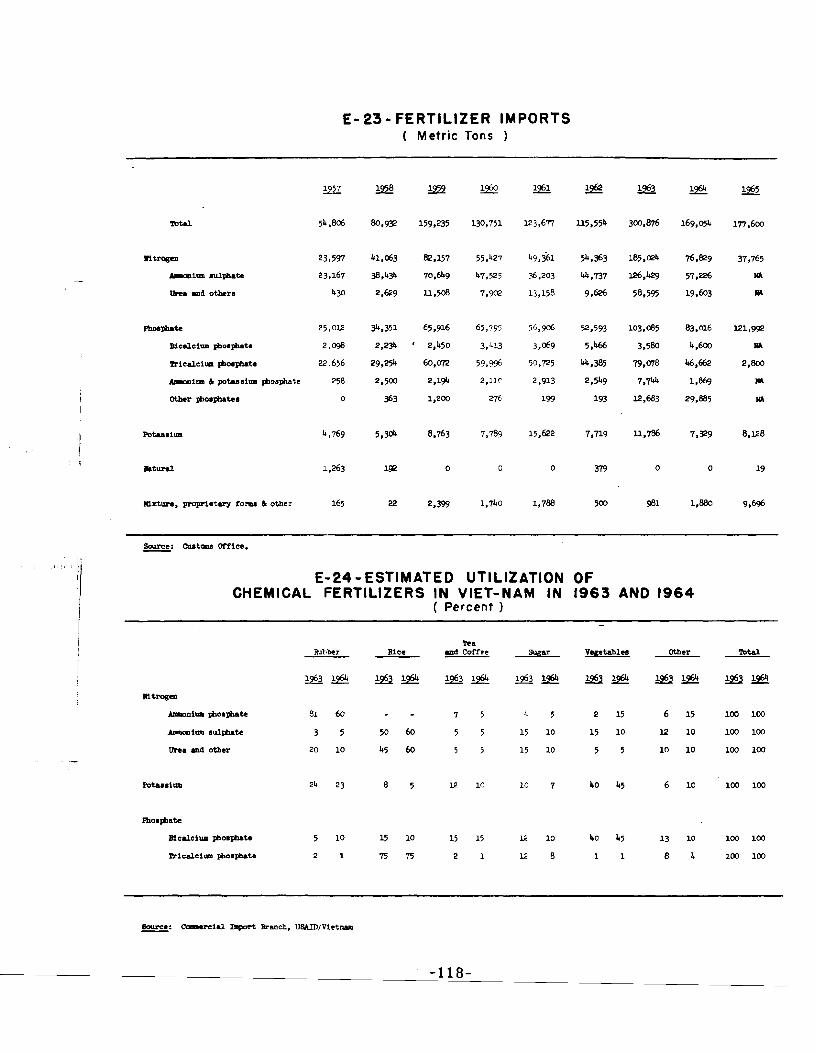
E- 23- FERTILIZER IMPORTS ( Metr ic Tons )
Hlxture, pmprietvy form 6 other
Sauce: autcma m c e . - E-24-ESTIMATED UTILIZATION OF
CHEMICAL FERTILIZERS IN VIET-NAM IN 1963 AND 1964 ( Percent 1
Tca Rubber Rice urd Coffee suRsr Vcgetablel l Otber IlbW - -
9 5 3 1 w -1964 w * M e mtmgm
Aprrmiln pb06ph.a 81 60 - - 7 5 4 5 2 15 6 15 100 100
Ammium aulpllltc 3 5 50 60 5 5 15 10 15 10 12 10 100 100
Lhea and other 20 10 45 60 5 5 15 10 5 5 10 10 100 100
FISHERIES
Before 1957, the fisheries potential of Viet-Nam was exploited only to an extent sufficient to satisfy the demands of the coastal communities.
In 1957, USAID sponsored the establishment of a fisheries department, incorporating both marine and inland fisheries under one agency, now known as the Directorate of Fisheries. The emphasis was focused on a compre- hensive fisheries program incorporating administration, research, shore facility management, fish preservation technology, distribution and marketing,
From the inception of the 1957 fisheries program to the present, considerable progress has been made in the field of developing an overall fishing industry and a fully integrated fish distribution and marketing system:
1 a) Thirteen fresh water fish breeding stations were constructed to assume the distribution of fish fingerlings to rural areas for pond rearing.
I I b) Fifteen fishing harbors were completed where fishermen can I dispose of their catches at a profitable price.
c) Motorized junks with advanced fishing gear which utilize modern catching methods were introduced, making it possible for fishermen to exploit new offshore fishing grounds which heretofore were out of range of sail or oar powered vessels.
d) More and more fishermen have replaced their cotton or hemp nets by synthetic ones.
These were major reasons for the tremendous increase in the fish catch, from 52,000 tons in 1955 to 397,000 tons 1964. The success of the 1 development caused a substantial increase in the number of fishermen, !
i from 50,000 in 1957 to 245,500 in 1964 in 24 marine fishing provinces.
However, storms in November 1964 set back the fishing industry. Further, in 1965 .the security situation forced authorities to tighten control over sea traffic. The resulting ban on fishing in some areas with coastal zones being placed under martial law in others, made coastal movement difficult causing a number of fishermen to use their boats for public transportation rather than fishing. As a result, the total fish catch in 1965 declined about 5% from the 1964 level.
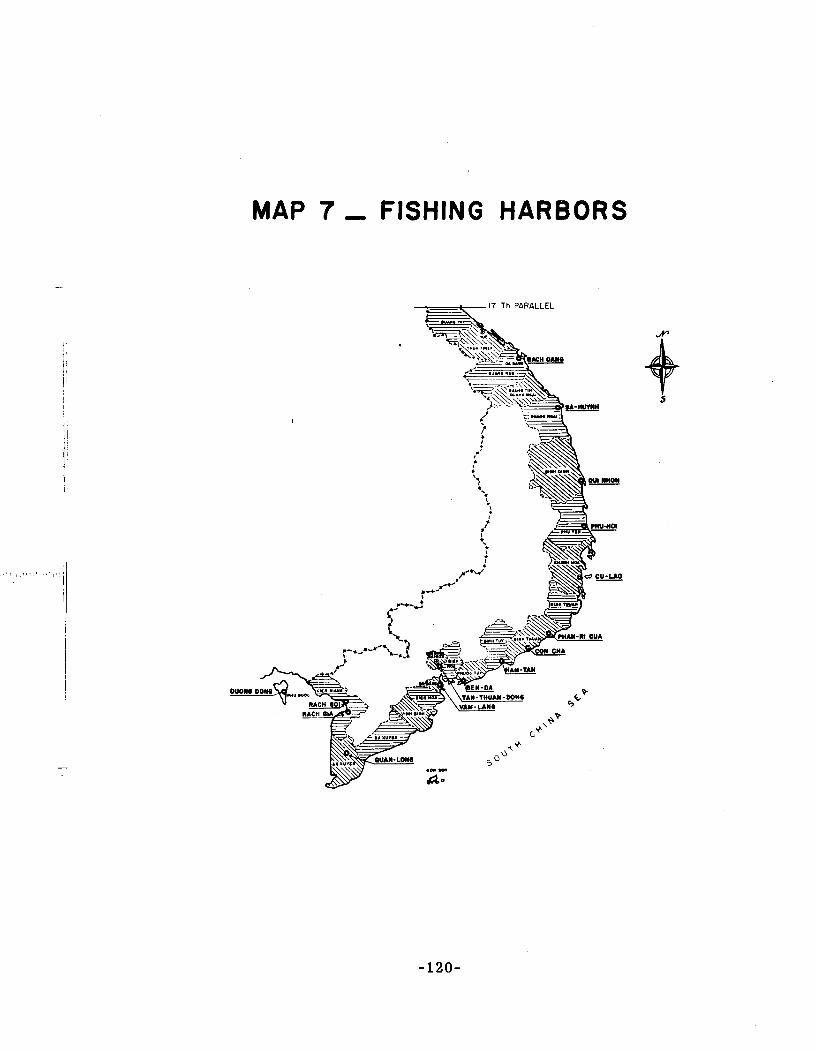
MAP 7 , FISHING HARBORS
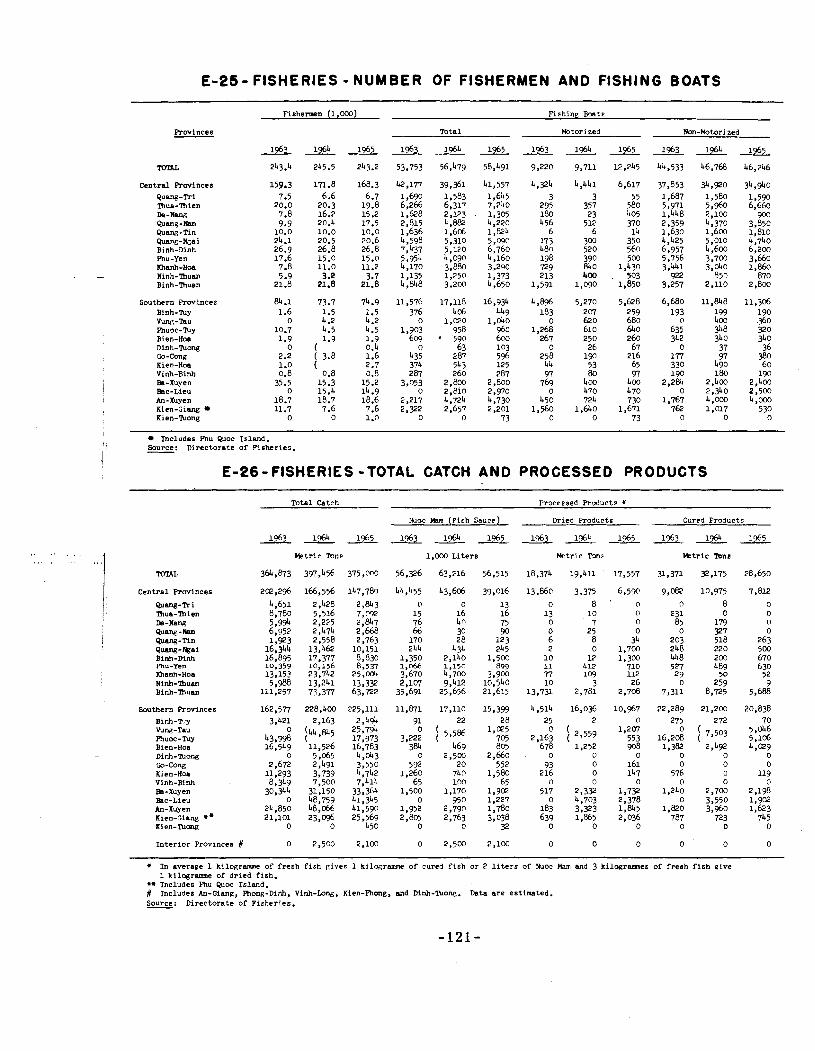
E-25- FISHERIES - NUMBER OF FISHERMEN AND FISHING BOATS
Fishermen (1,000)
Total
* 56,479
39,361 1,583 6,317 2 , Y 3 4 , m 1,606 5,310 5,120 4,090 3,880 1,250 3,200
17,118 406
1,020 958 590 63
287 543 260
2,800 2,810 4,724 2,657
0
Rov inces Non-Hotori zed
Central Rov inces eunng-Tri lhua-mien D e - w Qang-Nam Qaw-Tin puang-Ngai Binh-Dinh Phu-Yen mnh-Hoa Ninh-lhuan Binh-Thuan
Southern Rov inces Binh-Tuy v w - m u Phu'Jc-my Bien-Hoa Dinh-Tuong co-cong Kien-Hoe Vinh-Binh Ea-Xuyen Bac-Lieu An-Xuyen Kien-Ciurg Kien-Tuong
Includes Phu Qoc Is land. Source: Di rec to ra te o r Fisheries .
E-26-FISHERIES -TOTAL CATCH AND PROCESSED PRODUCTS
Total Catch Pncessed Products +
Nuoc H a m (Fish Sauce) Dried Pmducts Cured Products
He t r i c Tons 1,000 L i t e r s Hetr ic m n s He t r i c lbns
Cen t ra l Rov inces
S a t t h e m Rovinces 162,577 228,400 225,111 11.871 17,110 15,399 4,514 16,036 10,967 22,289 21,200 20,838 91 22 28 25 2 n 275 272 70
i , m 5 1,207 5,046 3,22: 1 51586 705 2,16S 2'559 553 16,2$ 71503 5,106
384 469 805 678 1,252 903 1,382 2,492 4,mg 0 2,5W 2,660 0 0 0 0 0 0
5 92 20 552 93 o 161 o 0 0 1,260 740 1,580 216 0 147 576 0 119
65 i n n 65 o o o o o o
~ i n h - n , y 3,421 2,163 2,494 Vwg-Tau 25,794 Ruoc- lW 43,9980 144*845 17,973 Bien-Hoa 16,549 11,526 16,783 Dinh-Tuong 0 5,065 4,343 co-Cong 2,672 2,491 3,550 Kien-Hoa 11,293 3.739 4,742 Vinh-Binh 8,349 7,500 7,414 Ba-Xuyen 30,344 31,150 33,3@4 Eac-Lieu 0 48,759 bl,315 An-Xuyen 2L,850 48,066 41,590 ~ i e n - ~ i a n g ** 21,101 23,096 25.569 Kien-'IUong 0 0 450
I n t e r i o r Provinces # 0 2,500 2,100
+ In average 1 k i l o e r a m e of f r e s h f i s h g ives 1 kilwrrwune o f cured f i s h o r 2 l i t e r s o f Nuoc Mam and 3 k i l o g r m e s of f r e sh f i s h give 1 kilagramme of d r i e d f i sh . Includes Ihu Qoc Is land.
# Includes An-Giang, Phong-Dinh, Vinh-Long, Kien-Fhong, ~d Dinh-l'uow. Data a r e estimated. Source: Direc to ra te of F i she r i e s .
AGRICULTURAL CREDIT
The National Agricultural Credi t Office (NACO) was es tabl ished on Apri l 1, 1957, taking over the a s s e t s and l i a b i l i t i e s of predecessor agencies, pr incipal ly the Credit Agricole Populaire (CAP) and t h e Societe Nationale du Credi t Agricole, de 1'Artisanat e t des Cooperatives (SMCAAC).
Capi ta l Fund
The i n i t i a l c a p i t a l fund f o r NACO was VN$ 248 mil l ion; t h i s was increased rapidly. By the end of 1965, basic c a p i t a l was VN$ 895 mil l ion of which VN$ 565 mil l ion came from U.S. Aid. Equity c a p i t a l is a l s o provided from the 546 re tent ion scheme on d i r e c t loans (Savings accounts) --VN$ 60 mill ion a t t h e end of 1965, and Surplus from Operations -- YR$ 17 r i l l i o n . I n addit ion, #ACO has a c-itaent from the National Bank t o provide loan funds up t o VN$ 300 r i l l i o n a s needed. So f a r , VN$ 250 a i l l i o n have been used. Thus, t o t a l c a p i t a l on December 31, 1965 was VN$ 1,222 mil l ion. I n comparison with 1964 a decrease of VN$ 60 mil l ion i n NACO funding sources was noted f o r 1965, while t h e basic c a p i t a l and loan funds from the National Bank were unchanged t h e Savings accounts and t h e Surplus from operat ions fund were reduced by VN$ 22 mil l ion and VN$ 38 mil l ion respectively.
With respect t o the savings accounts, t h e reduction was ascribed t o a decision by t h e HACO board t o s top co l l ec t ing the 5% on d i r e c t loans which before May 1964 had const i tu ted t h e NACO savings fund, but ins tead, t o reimburse t o the depositors f o r the amount they had contributed t o t h a t fund. I n connection with t h e Surplus from Operations Fund, t h e decrease was caused by an excess of NACO's expenditures over i ts revenues.
I n 1965, because of in te rna l reoganization and increased insecur i ty i n r u r a l areas , NACO a c t i v i t i e s regarding loans extended and co l l ec t ions were the lowest of the period of 1957-1965.
Loans under c a p i t a l fund a r e of three categories:
Short-term loans of 6-18 months, mainly f o r annual crop production. I n t e r e s t i s 1% per month.
Medium-term loans of 18 months t o 5 years, f o r purchase of c a t t l e , farming equipment, etc. I n t e r e s t is a t 8% per year.
Long-term loans of 5 t o 15 years, f o r subs tan t i a l c a p i t a l invested by cooperatives, p lanta t ion owners, and well es tabl ished farmers. I n t e r e s t i s a t 6% per year except f o r cooperatives where it is 5% per year and they charge 1% per month when they reloan t o t h e i r m e m b e r s .
Rubber P l a n t a t i o n Development Fund
Th i s fund c r ea t ed i n August 1958 wi th a c a p i t a l of VN$ 400 m i l l i o n is aimed a t encouraging t h e expansion and renewal of rubber p l an t a t i ons . The loans bear an i n t e r e s t r a t e of !2% p e r yea r and a r e reimbureable w i th in a 5-year per iod , e t a r t i n g from t h e 9 t h year a f t e r t h e d a t e of t h e loan. The fund was c losed out a s of Yay 1961. A t t h a t t i m e t h e t o t a l amount of loans extended was VN$ 315,7 m i l l i o n of which VN$ 29.4 m i l l i o n was d i s t r i b u t e d t o 26 Vietnamese p l a n t e r s and VN$ 286.3 mi l l i on t o 10 French p l a n t e r s . The balance of VN$ 84.3 m i l l i o n was t r a n s f e r r e d back t o t h e Nat iona l Budget.
- P a c i f i c a t i o n Fund ( N o t shown)
T h i s fund was c r ea t ed i n June 1964 wi th a c a p i t a l of VN$ 300 m i l l i o n granted through t h e Nat iona l Budget. Loans under t h e P a c i f i c a t i o n program were intended f o r use i n such a r e a s a s animal husbandry, f i s h e r y and f e r t i l i z e r s programs and were i s sued under s imp l i f i ed procedures i n o rde r to f a c i l i t a t e ac t i on i n response t o r a p i d l y changing needs. Loans i n kind f o r chemical f e r t i l i z e r s were f r e e of i n t e r e s t . A t t h e end of 1965, t o t a l amount of loans extended under t h i s program was VN$ 221.6 m i l l i o n and t o t a l c o l l e c t i o n s was VN$ 41.6 mi l l i on
Reserve f o r bad d e b t s -- --
P r i o r t o 1364, NACO reserved a f i xed amount per year f o r bad deb t s . Th i s r e se rve fund accrued from annual p r o f i t . By t h e end of 1963, t h e bad debt r e se rve was VN$ 37.2 mi l l i on ou t of t h e t o t a l ou ts tanding debt of VN$ 1,112.8 mi l l i on (3.3 per cen t ) . Recent ly , due t o t h e i nc reased
? i n s e c u r i t y and l a r g e r del inquent loans , NACO was forceC t o r e v i s e its r e s e r v e po l icy . A s of 1964 t h e fol lowing r a t i o s were appl ied t o c a l c u l a t e t h e reserve f o r bad debts :
3% f o r one-year overdue debt 15% f o r two-year overdue debt 50% f o r th ree-year overdue debt 90% f o r four-year and-more overdue debt .
With t h e app l i cac io r of t he above r a t i o s , t h e r e s e r v e f o r bad debt a s of December 31, 1965 reached VN$ 219.0 m i l l i o n i n r e l a t i o n t o t h e t o t a l ou ts tanding debt of VN$ 1,059.0 mi l l i on .
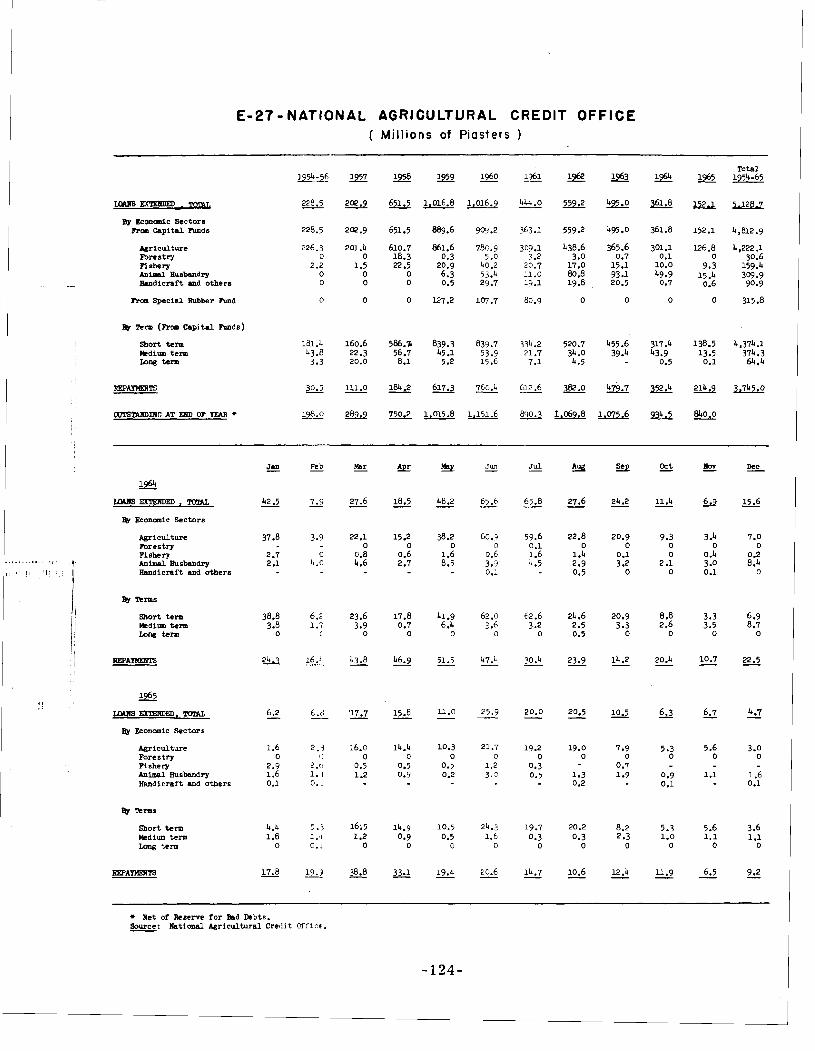
E-27-NATIONAL AGRICULTURAL CREDIT OFFICE ( Millions of Piasters )
By Econcdc Sectors Roa Capital Funds
Agr i cu l tw Forestry Fishery An- Busbandry m d l c r a f t . n d others
Roa Special Rubber Fund
short term bkdium term Law term
22% L(IMSExTmDED.m
% Economic Sectors
Agriculture mres t ry Fishery A n W Husbandry Handicraft and others
By Terms
Short term bkdium term LOW term
XQ LMns EmEmED. TOTAL
% Economic Sectors
Agriculture Forestry Fishery Animal Husbandry Handicraft and others
By Terms
Short term bkdium term
term
Jul -
65.8 -
59.6 0.1 1.6 4.5
62 .6 3.2
0
30.4 -
20.0 -
19.2 0
0.3 0.5
19.7 0.3 0
14.7 -
+ Net of Reserve for Bad Dcbts. Source: lhtional Agricultural Credit Gffice. -
SECTION - F
INDUSTRY
Previous Page Blank
INDUSTRIAL PRODUCTION INDEX
Beginning i n 1962, t h e N a t i o n a l I n s t i t u t e of S t a t i s t i c s h a s prepared a q u a r t e r l y index of t h e i n d u s t r i a l p roduc t ion i n Vietnam. T h i s q u a n t i t y index makes i t p o s s i b l e t o f o l l o w t h e development of t h e n a t i o n a l i n d u s t r i a l p roduc t ion and h e l p s i n a n a l y z i n g t h e economy of t h e coun t ry .
Scope and Coverage
T h i s index covers ca tegory 1 (Mining I n d u s t r y ) c a t e g o r i e s 2 and 3 (Manufacturing Indus t ry ) and ca tegory 5 ( E l e c t r i c i t y , Gas, Water, and H e a l t h and S a n i t a t i o n Serv ices ) of t h e s t a n d a r d I n t e r n a t i o n a l C l a s s i f i c a t i o n , by i n d u s t r y , of a l l branches of economic a c t i v i t y (C.I.T.I.) approved by t h e Uni ted Nat ions Organ iza t ion . However, some a c t i v i t i e s inc luded i n t h e scope of t h e index a r e n o t followed up f o r l a c k of d a t a ; such is t h e c a s e , f o r i n s t a n c e , w i t h s a l t mining, q u a r r y i n g , t h e f u r n i t u r e , p r i n t i n g and e d i t i n g i n d u s t r i e s and s l b s i d i a r y i n d u s t r i e s , e t c . Moreover, h a n d i c r a f t s a r e n o t included i n t h e scope of t h e index. Only e n t e r p r i s e 6 whose 1962 o u t p u t
I
I exceeded 2 ,900,000 p i a s t e r s were taken i n t o c o n s i d e r a t i o n .
Method of P r e p a r a t i o n of t h e Index: -- a . Base Per iod :
I
I b. Produc t s t h a t na!ce up t h e index: -
The year 1962 i s used a s t h e r e f e r e n c e per iod i n t h e p r e p a r a t i o n of t h e index . Data c o n l c ~ ~ ? ~ ~ t h e volume and v a l u e of i n d u s t r i a l p roduc t ion a r e provided by su rveys con luc ted every t h r e e months by t h e N a t i o n a l I n s t i t u t e
I of S t a t i s t i c s . The l is t of e n t e r p r i s e s used i n t h e s e su rveys was t h a t
The i n d . l s t r i a 1 p r o d u c t i o n i n d e x i s b a s e d o n t h e p r o d u c t i o n o f 1 1 9 i tems worked o r manafacturcd by t h e e n t e r p r i s e s t aken i n t o c o n s i d e r a t i o n .
i
These items a r e f i r s t grouped i n t o t h r e e major branches i n conformity w i t h t h e above-mentioned c l a s s i f i c a t i o n , 1 .e . :
obtainkrd from t h e CemuS of e n t e r p r i s e s made i n 1361 and updated accord ing t o d a t a t r a n s m i t t e d hy t h e D i r e c t o r a t e General of Mines, I n d u s t r y and H a n d i c r a f t s and by t h e I n d u s t r i a l Development C e n t e r .
Mining i n d u s t r y Manufactur i3r 1nJus t ry E l e c t r i c i t y , g a s , w a t e r and h e a l t h and s a n i t a t i o n services
Each of t h e two branches " ~ i n i n g industryi' and " ~ l e c t r i c i t ~ , Gas, Water and Hea l th and S a n i t a t i o n ~ e r v i c e s " i n c l u d e s one i t e m o n l y ; t h e 11 Manufacturing ranch" numbers 117 items.
Previous Page Blank -127-
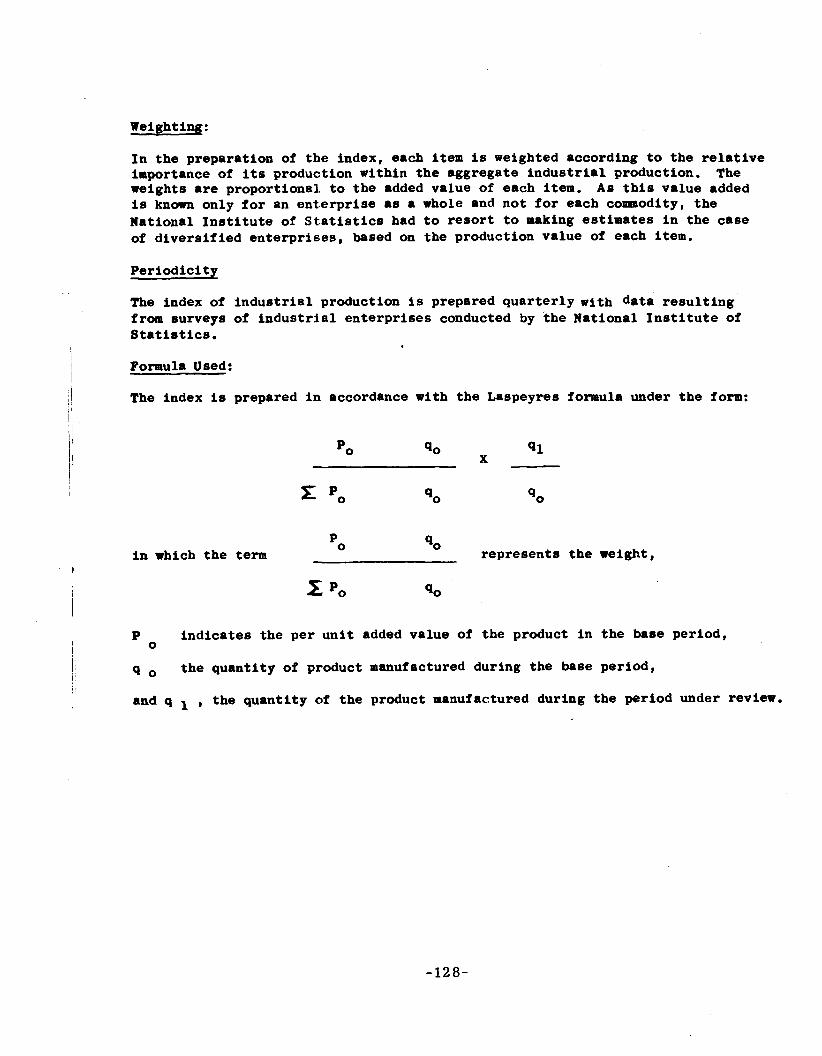
Weighting:
In the preparation of the index, each item is weighted according to the relative importance of its production within the aggregate industrial production. The weights are proportional. to the added value of each item. As this value added is k n o m only for an enterprise as a whole and not for each commodity, the national Institute of Statistics had to resort to making estimates in the case of diversified enterprises, based on the production value of each item.
Periodicity
The index of industrial production is prepared quarterly with data resulting from surveys of industrial enterprises conducted by the National Institute of Statistics.
Formula Used:
The index is prepared in accordance with the Laspeyres formula under the form:
in which the term Po 90
represents the weight,
Z Po 90
P indicates the per unit added value of the product in the base period, 0
q the quantity of product manufactured during the base period,
and q , the quantity of the product manufactured during the period under review.
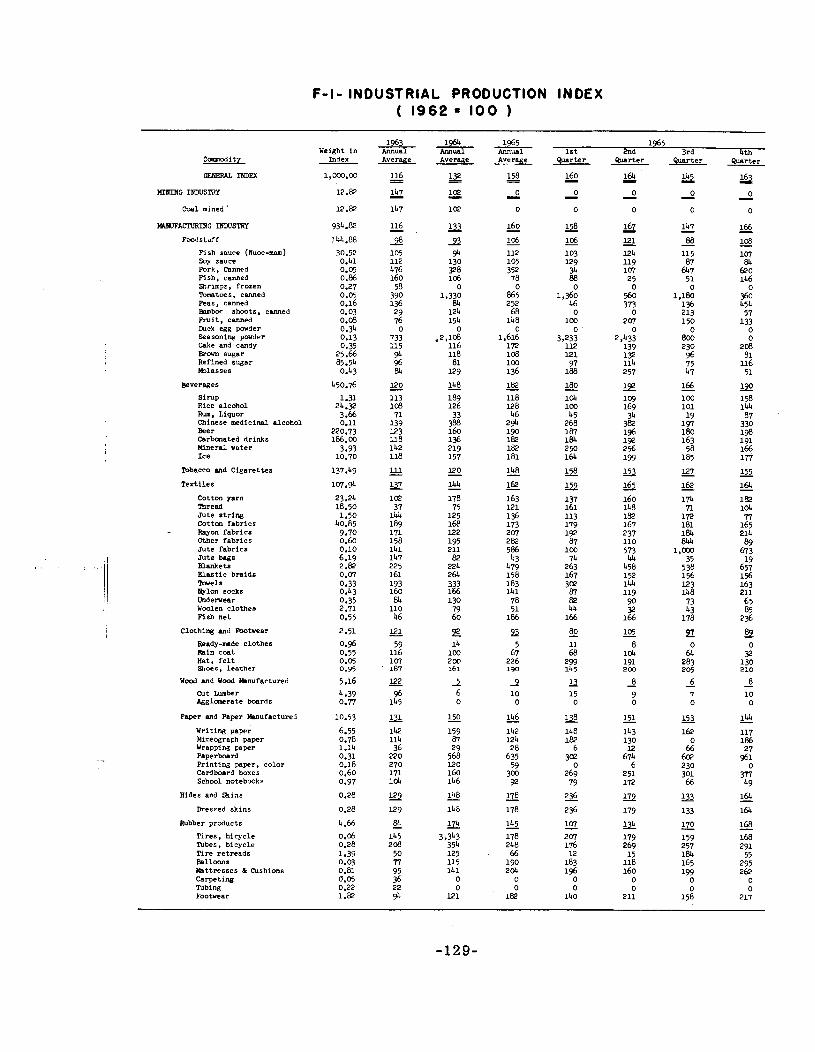
F-I- INDUSTRIAL PRODUCTION INDEX ( 1962 = 100 1
1963 Annual Average
116 = 147 - 147
116 - 3 105 112 476 160
58 390 136 29 76 0
733 115 94 96 84
120 - 113 108 n
139 123 l l 8 142 118
ll1 - LC i m 37
1u 189 171 158 141 147 225 161 193 160 64
110 46
121 - 59
116 107
' 187
122 - 96
145
LC 142 114 36
220 270 171 l # 4
129 - 129
8L - 145 208
50 77 95 36 22 %
Average
158 - - 0 -
1965 1 s t 2nd 3rd 4th
b r t e r - . Weight i n
Index
1,030.00
E.82
12 .82
934.@
1 ~ 4 . e ~
30.52 0.41 0.05 0.86 0.27 0.05 0.16 0.03 0.08 0.34 0.13 0.35
25.66 85.54 0.43
450.76
1.31 24 .9
3.66 0.11
~ 0 . 7 3 186.00
3.93 10.70
137.49
107.94
23.24 18.50 1.50
40.85 9.70 0.60 0.10 6.19 2.82 0.07 0.33 0.43 0.35 2.71 0.55
2.51
0.96 0.55 0.05 0.95
5.16
4.39 0.77
10.53
6.55 0.78 1.14 0.31 0.18 0.60 0.97
0.28
0.28
4.66
0.06 0.28 1.39 0.03 0.81 0.05 0.22 1.82
Qmrter b r t e r b r t e r
3 0 - 0
166 - 108 - 107
84 620 146
0 $0 454 57
133 0
164 - 0 - 0
167 - El - 124 119 107 25
0 $0 373
0 207
0 2,433
139 19 114 257
LE l og 169
34 382 196 192 256 199
165 - 160 148 192 167 237 110 573 44
458 1 % 1u 119 90 P
166
105 - 8
lch 191 200
8 - 9 0
151 - 143 130 E
674 6
251 1R
9 179
179 269
15 118 160
0 0
211
Coal mined
Fish sauce (~uoc-ram) Soy sauce Pork, Canned Fish, canned Shrimps, frozen Tomstoes, canned Peas, canned BBmbor shoots, canned Frui t , canned Kuck eg,q powder Seasoning powder Cake and candy Wovn sugar Refined sugar lb l a s ses
Beverages
s i m p Rice alcohol Rum. Liquor Chinese medicinal alcohol Beer Carbonated drinks nineral water I ce
Tobacco aad Cigaret tes
Texti les
Cotton yarn mread Ju te s t r l n g Cotton fabrics - Rayon fabrics Other f ab r l c s Ju te fabrlcs Ju te bags Blankets Elaht ic bmlds lbuela Nylon mocks Uhdenear Woolen clothea Fish net
Clothing and Footwear
Ready-mde clothes Rain coat Hat, f e l t &as. l ea the r
Wood and Wood Winufactured
Cut Lumber Agglomerate boards
Paper and Paper lhnufacturei
Writine paper b e c e r a p h paper Wrappily paper Paperboard P r i n t i w paper, color Cardboard boxes School notebwks
Hides and Skins
Dressed skins
Rubber products
Tires , hicycle lhbes, bicycle Tire retreads Balloons Wittresses & Cushions Carpeting lhbing Footwear
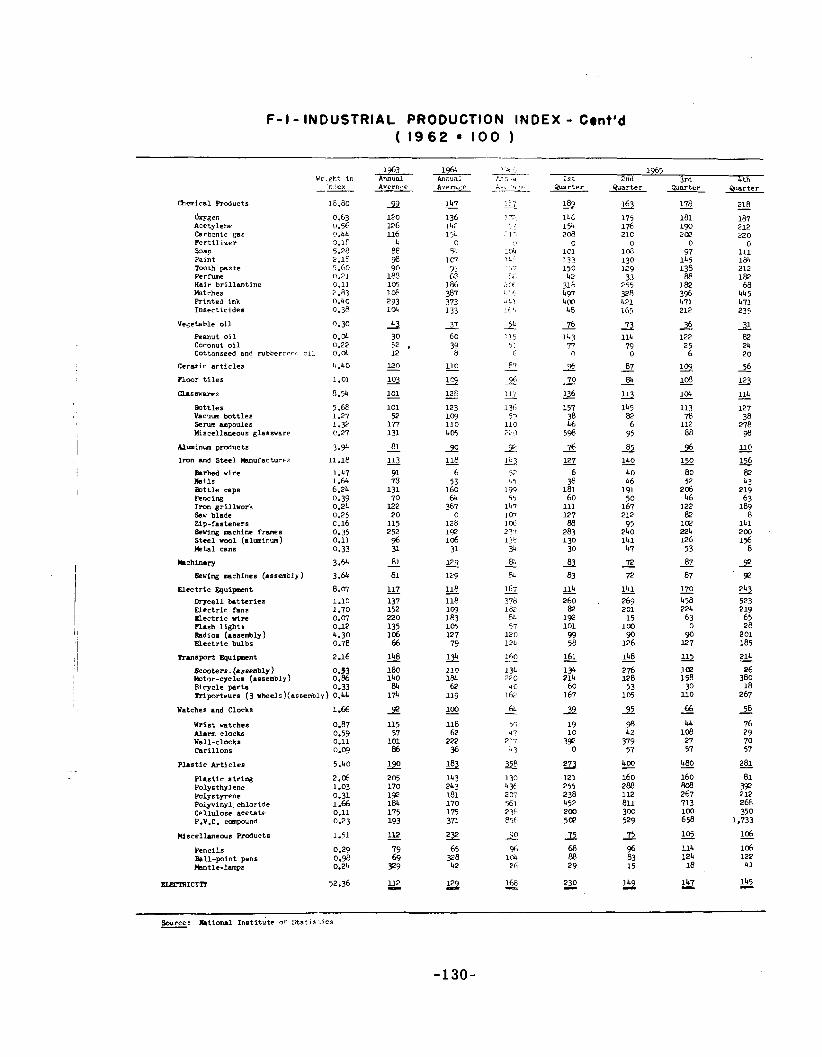
F- I - INDUSTRIAL PRODUCTION INDEX - Cont'd ( 1962 = 100 1
UF iht in n i e x --
Chemical Products 18.80
b x y w 0.63 Acetylene 0.56 Carbonic gas (1.44 F e r t i l i z e r 3.1F Soap 5.28 Paint 2.16 Tooth paste 5.60 ~e r r w 6.21 Hair b r i l l an t ine 0.11 b t c h e s 2 -83 Printed ink 0.40 Insect icides 0.3P
Vegetable o i l 0.30
Peanut o i l 0 . S Coronut o i l 0.22 Cottonseed and rubbercrr, o l i 0.a
Ceramic a r t i c l e s 4.40
Floor t i l e s 1.01
asm mares 8.54
Bottles 5 .a Vac%um bot t l e s 1.27 Serum ampoule s 1 .Y Miscellmeous glaslnare C.27
Aluminum products 3 . 9
Iron and s tee l lhnuCacturrs 11.18
Earbed wire 1.47 Ilai1s 1 .64 Bottle caps 6.24 Fencing 0.39 Iron grillwork 0.24 Saw blade 0.25 Zip-fasteners c.16 Sewing machine frames 0.35 S tee l wool (aluminum) 0.11 M t a l cans 0.33
Uachinrry 3.64
Geving mchines (assembly) 3.64
Electr ic Equipment 8 . q Drycell ba t t e r i es 1.10 U e c t r i c fans 1.70 a e c t r i c vire 0.07 Flash l i g h t s 0.12 Radioa (aaaembly) 4.30 E lec t r i c bulbs 0.78
Frmaport Equipnnt 2.16
Scooters. (assembly) 0.53 bbtor-cycles (assembly ) 0.86 Bicycle p r t o 0.33 M p o r t e u r s (3 wheels)(assenbly) 0 . u
Watches and Clocks 1.66
Wrist watches 0.87 Alarm clocks 0.59 Wall-clocks 0.11 Carillons o m
P las t i c h t i c l e s 5.40
P las t i c s t r i n g 2.05 Polysthylene 1.03 Polystyrene 0.31 Polyvinyl. chloride 1 -66 Cellulose acetate 0.11 P.V.C. camp~und 0.23
123 log 110 LDS
118 log 183
Miscel lmems Roducts
Pencils Pall-point pens Ilantle-lamps
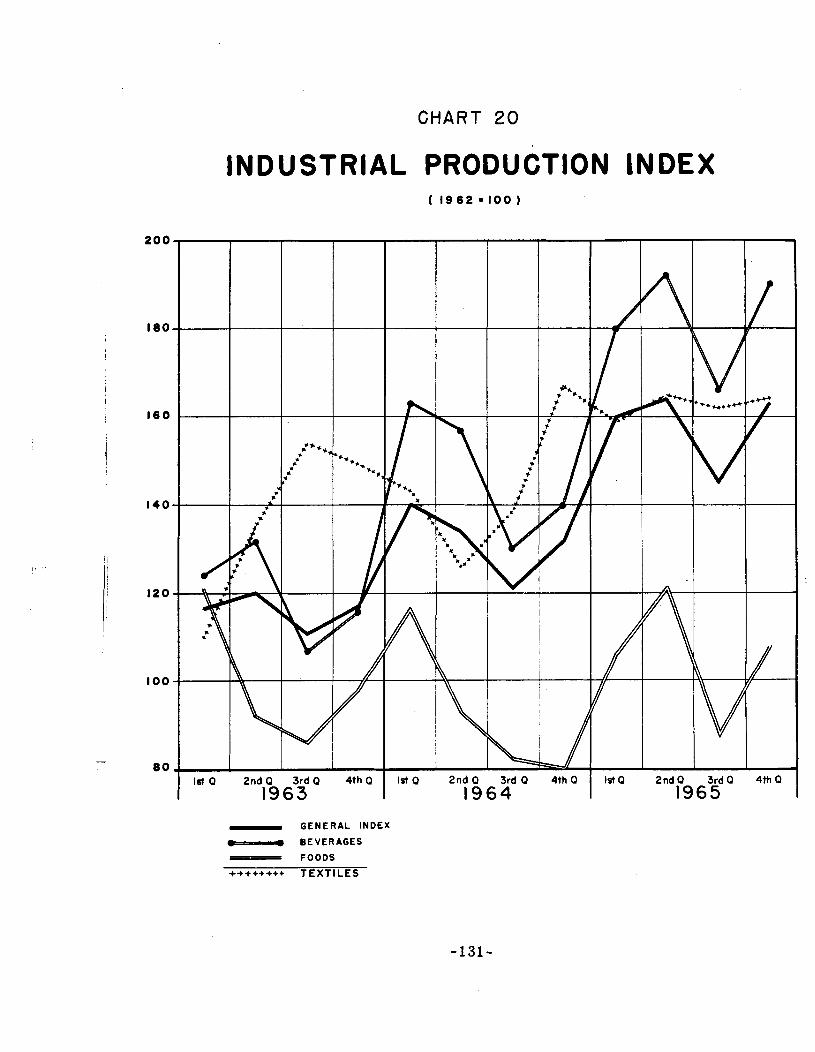
CHART 20
INDUSTRIAL PRODUCTION INDEX
- G E N E R A L I N D E X - B E V E R A G E S
F O O D S
++++++++ TEXTILES
TEXTILE INDUSTRY
Large Plants are plants equipped with automatic looms or machines. Most of these plants are located in Saigon's surrounding area.
Small Plants are plants equipped with locally made looms or machines, handicraft factories and cooperatives. Most of these plants are located in the Central Viet-Nam.
Production data estimates are partly based on the figures of raw material and yarn imports.
In 1965 the production of cotton fabrics was greater than 1964 due to increase in local market requirements. Many commission weavers have responded by installing power looms to replace wooden hand looms. Rayon fabrics production decreased due to some rayon weavers converting looms to produce synthetic and other higher quality fabrics. The Lnstallation of an additional 252 synthetic looms in 1965 resulted in increased production of synthetic fabrics.
Not shorn in the data are 400 spindles producing yarn for blankets.
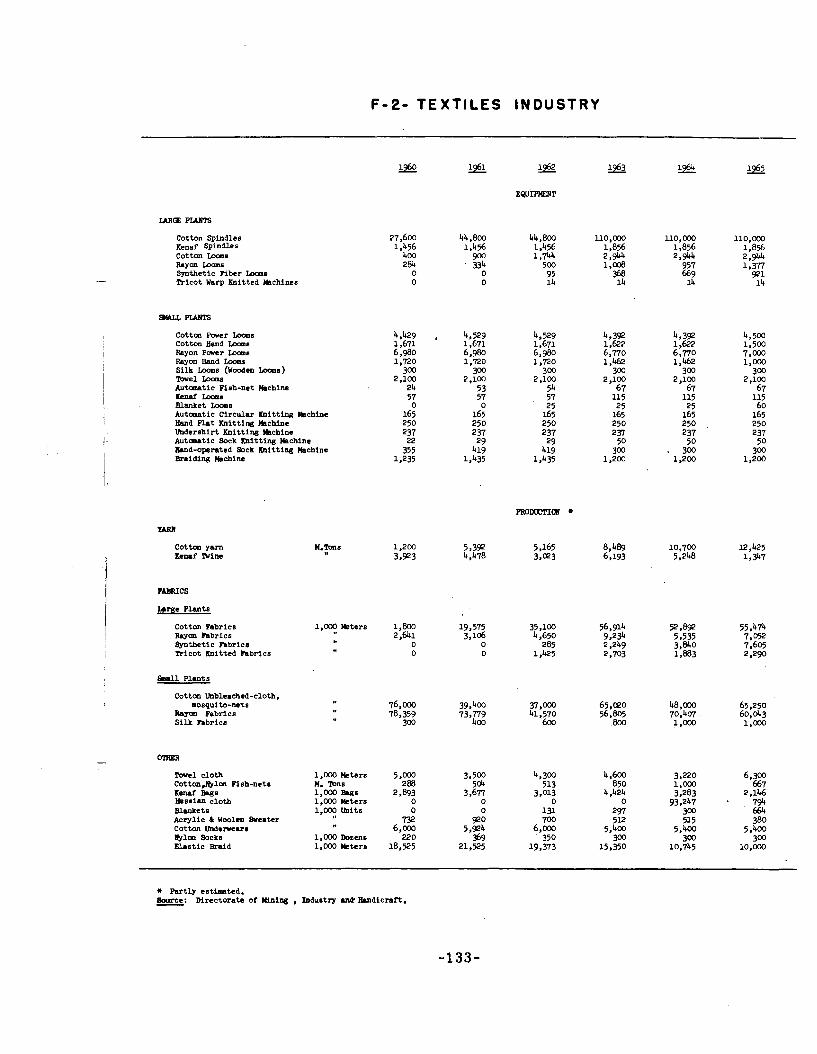
F-2- TEXTILES INDUSTRY
Cotton Spindles e n a f spindle^ Cotton Laoms w o n Looms Synthetic Fiber l a m s b i c o t Warp Knitted llrrchines
Cottm Parer l a m s Cotton Hand l a m s Rayon Pwer Looms Rayon W d Looms Silk Looms (Wooden l a m s ) Tovel Coams Automatic Fish-net kchlne KeIlnfLmms Blanket Locps Automatic Circular Knitting Lhchine Hand Plat Knitting Lhchine Undershirt Knitting Lhchine A u t m t i c Bock Knitting kch ine Xmd-operated Sock Knitting kch ine 6~a id ing kch lne
cotton yarn KeIlaf mnc
l u g e P k n t s
Cotton Fabrics Rsym Pabrics . Synthetic Fabrics T ~ i c o t Knitted Fabrics
1,000 lCters
1.000 k t e r s I(. m s 1.000 BesS 1.000 Meters 1.y units
1.000 Dozens 1.000 k t e r s
-1 Plants
Cottm Unbleached-cloth, mosquito-nets
Ram Pabrics Si lk Fabrics
Towel cloth Cottm,wlon Fish-nets K e M f Bags Hessian cloth Blrnhets Acrylic di Woolen S e a t e r Cotton Underrears mica Sacks Elastic Braid
+ Partly est-ted. Bauce: Directorate of l t ln i~g , I ~ d u s t r y an& Eandicmft. -
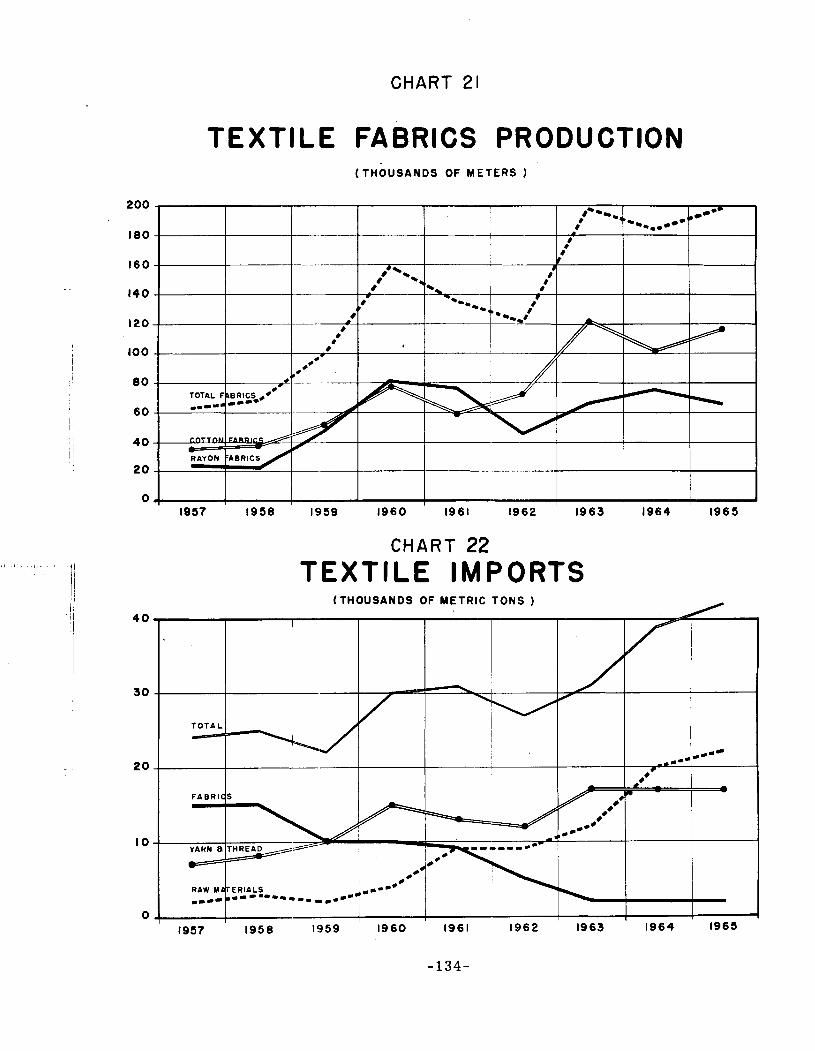
CHART 21
TEXTILE FABRICS PRODUCTION
C H A R T 22 TEXTILE IMPORTS
f THOUSANDS OF METRIC TONS )
*eeV - - -
F A B R I C S 8
** ee
RAW M P T E R I A L S w m D ~ * l - - = - - - - - . - w
I I
1957 1958 1959 1960 1961 1962 1963 1964 1965
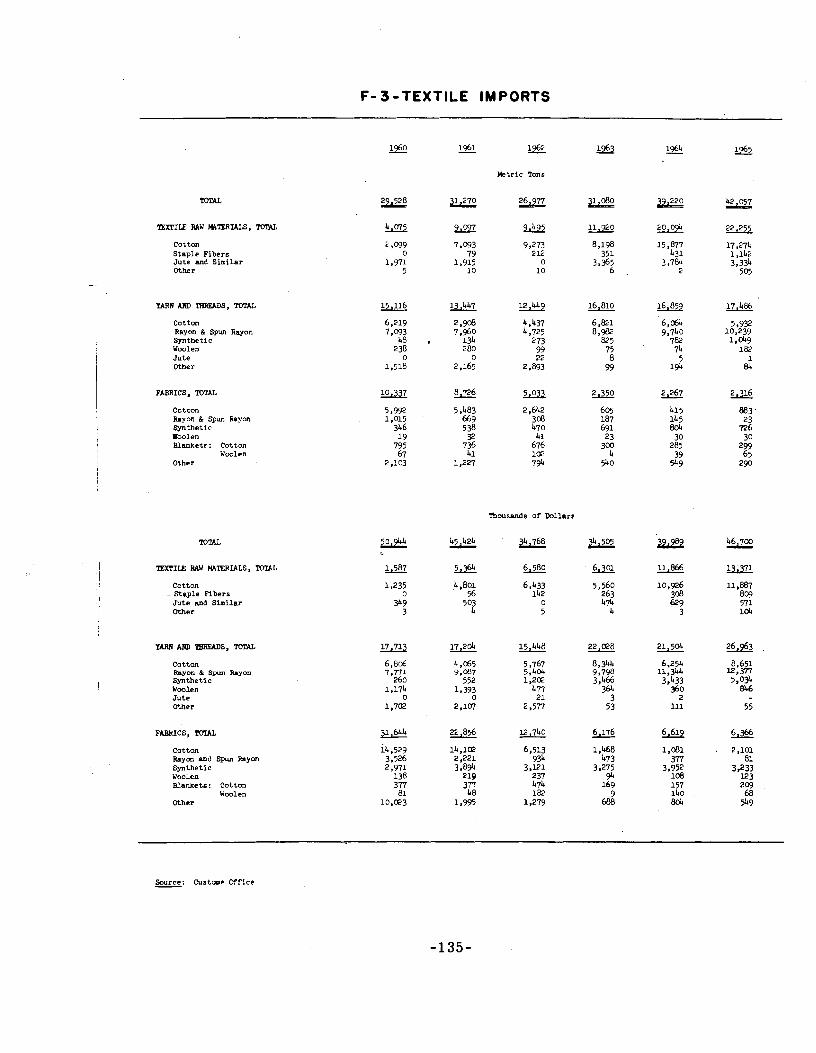
F-3 -TEXTILE IMPORTS
TEXTILE RAW )(Am-, m
COttM Staple Fibers Jute md Similar Other
cotton Rayon & Spun Rayon Synthetic Wwlen Jute Other
FABRICS, TOTAL
Cotton Rayon & Spun Rayon Synthetic Ooolen Blmkets: Cotton
Woolen Other
TOTAL
TEXTILE RAW WTERIALS, TOTAL
Cotton - Staple f ibers
Jute and Similar Other
Cotton b y o n & Spun Won Synthetic Woolen Jute Other
FABRICS, TWXL
Cotton Rayon m d Spun Rayon Synthetic woolen Blankets: Cotton
Wwlen Other
Metric Tons
1964 -
39,220
15,817 431
3,7@ d
g& 6,064 9,740
7@ 74
5 194
+J 415 14 5 m 30
285 39
549
&%!
11,866
10,926 308 629
3
21,504
6.254 11,344 3,433
360
lll
6J&
1,081 3 n
3,952 lQ3 157 140 m
- -
Source: Custmc Office -
S U G A R
Brown sugar r e f e r s t o t h e a r t i s a n sugar produced i n small m i l l s opera t ing on a handicraf t bas i s i n t h e major cane producing regions of Long-An, Gia-Dinh, Tay-Ninh, Binh-Duong, Bien-Hoa, Quang-Ngai and Quang- Nam. Data a r e based on t a x r e p o r t s t o the Ministry of Finance and a r e probably un'derstated s ince many small "mills" do not pay taxes.
Refined sugar r e f e r s t o sugar produced by t h e Cong-Ty Duong Viet-Nam and t h e Vinh-Phu Cong-Ty (s ince 1961). Thei r f a c t o r i e s produce r e f ined sugar from both imported raw sugar and domestic brown sugar. The y i e l d of r e f ined sugar per ton of cane i n these f a c t o r i e s averages 7.4 percent .
Sugar consumption bythe Vietnamese people now s tands a t about 120,000 metric tons a year , o r an average of l e s s than 8 k i l o s per i nhab i t an t per year. A l a r g e quan t i ty of sugar cane i s consumed l o c a l l y being e i t h e r chewed or consumed as cane ju ice .
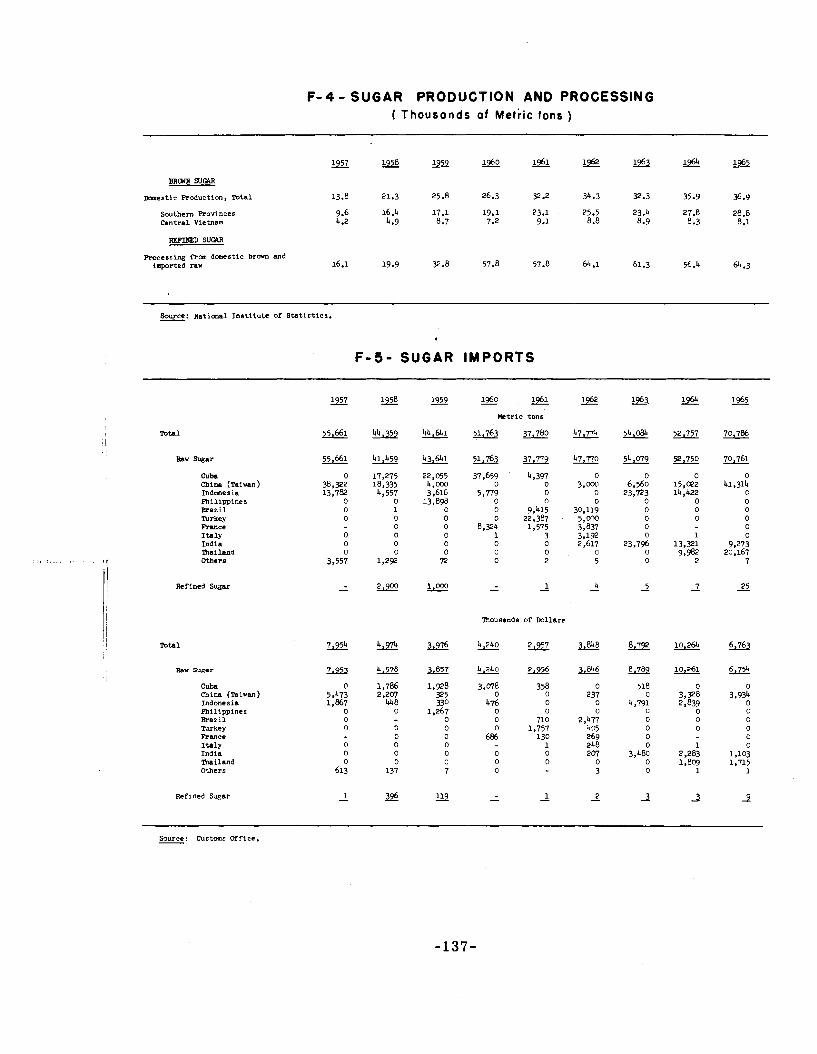
F-4 - SUGAR PRODUCTION AND PROCESSING ( Thousonds of ~ e t k i c tons )
'958 m - 1 9 6 1 1 9 6 5 1960
BRm SUGAR
mmestic RoductiOn, Total 13.8 21.3 25.8 26.3 P 2 34.3 32.3 35.9 36.9
Southern Rovincer Central Vietnam
Processing *am domestic b r m and imported raw 16.1 19.9 P .8 57.8 57.8 64.1 61.3 56.4 64.3
Source: National Institute of Statirticl. -
F-5 - SUGAR IMPORTS
Total
W w Sugar
Cuba China (Taiwan) Indonesia Philippines Brazil lbrkey Rance Italy India '&ailand Others
1957 - 195s - 1960 1962 Metric tons
4 4 , 3 5 9 W 1 , 6 4 1 5 1 , 7 6 3 o l r 7 , n 4 - 5 2 , 7 5 7 7 0 , 7 8 6
Cuba China (Taiwsn) Indonesia Philippines Brazil Turkey R M c e Italy India m i l a n d Others
Source: Curtoms Office. -
PRODUCTION IN OTHER INDUSTRIES
Since the Geneva Agreement of July 1954, the Republic of Vietnam has been cut off from its traditional fuel supply, the northern coal fields. Nong-Son is the only mining area in the present Republic of Viet-Nam. A 'project for its full scale exploitation was approved in the beginning of 1957. The Nong-Son area extends over 3,000 hectares and is located approxi- mately 60 kilometers southwest of Faifoo. It was originally opened in 1881, worked intermittently from 1881 to 1922 by the Tourane Coal Society and operated from 1943 to 1945 by Bank of Indochina. In 1956, there was a preliminary survey of the property by the Directorate of Mining. A contract was signed in September 1956 with,the Nippon Koei, a Japanese drilling firm, for core drilling of 27 holes 50 to 100 meters deep at Nong-Son. A full scale study made by Paul Weir Co. indicates that Nong-Son can produce 150,000 metric tons of marketable coal annually. Toward the end of 1964 it was necessary for the Nong-Son mine to suspend operations because of a heavy flood and deteriorating security conditions.
Salt in Viet-Nam is produced in 17 salinas in Central Viet-Nam and 5 salinas in South Viet-Nam.
Pharmaceuticals
Production and processing of pharmaceuticals are a growing industry in Viet-Nam, but data on output are not available.
Cement
The production of cement in Viet-Nam is assured by a sole plant known by the name of " ~ a - ~ i e n Cement plant". It consists of:
- a clinker unit in Kien-Luong district, Kien-Giang province (340 kilometers southwest of Saigon)
- a crushing and bagging unit in Thu-Duc on the Saigon-Bien-Boa highway. Two French companies, "preparation Industrielle des ~ombustibles" and "~ociete des Draguages et de Travaux ~ublics" were employed by the Vietnamese Government for the construction of these units. The construction work was started in the second quarter of 1962. The whole project cost approximately US$ 15 million for equipment and VN$ 148 million for construction.
In the first phase of plant development the annual output capacity of the Ha-Tien Cement Plant'will be 300,000 tons to be doubled by around 1975 in the second phase.
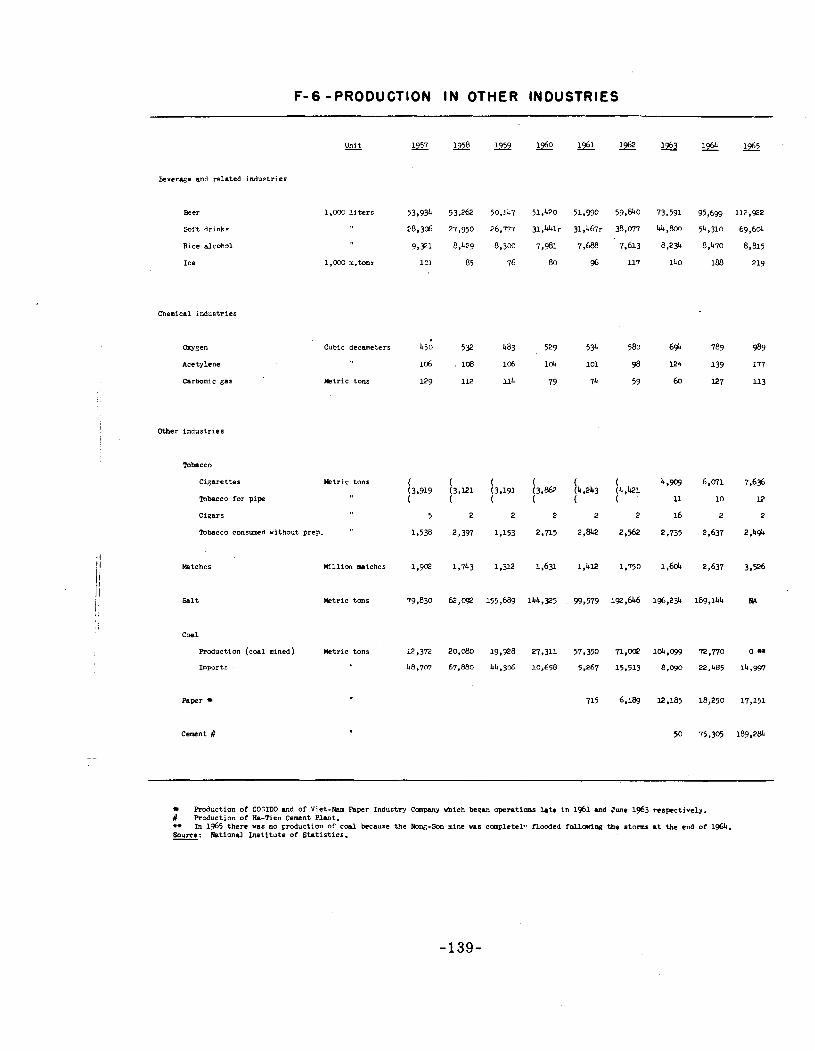
F-6 -PRODUCTION IN OTHER INDUSTRIES
Eeverage and related industr ies
Beer
Soft drinks
Rice alcohol
Ice
Chemical industr ies
1,003 l i t e r s 53,934 53,262 50,147 51,420 51,990 59,840 73.591 95,699 112,922
28,306 27.950 26,777 31,Wilr 31.467~ 38.071 44.800 54,310 69,604
m e e n Cubic decameters
Acetylene
Carbonic gas Eletric tons
Other industr ies
Tobacco
C i ~ a r e t t e s # t r i c tons
Tobacco fo r pipe
Cigars
Tobacco consumed without prep. "
Matches Million matches
S a l t # t r i c tons
Coal
Roduction (coal mined) Metric tons
Tmwrts
Paper
Cement #
Roduction of COCIDO and of Viet-Nam P a p r Industry Cmpany which began o p m t i o n s h t e i n 1961 m d June 1963 respectively. # Roduction of Ha-Tien Cement Plant. +w In 1965 there was no production of con1 because the Now-Son mine was completel., flooded f o l l w i n g the storms a t the end of 1964. Source: National I n s t i t u t e of S ta t i s t i c s . -
ELECTRICITY PRODUCTION & COHSUNPTION
A. Metropolitan Saigon Parer:
The loss of the Danhim 230 KV - 160,000 KW tr.hsmieeion line in Yay 1965, cut-off the major source of electric parer for Metropolitan Saigon and environs, and created a serious power shortage. This shortage was relieved by the emergency addition of 5-1000 KW diesel units borrowed from Thailand, 3-1500 KW dieeel units and 1-12,500 KW gas turbine electric plantfrae the USA. In March 1966, a 33000 KW steam turbine electric plant and a 66 KV transmisssion loop around the city and five new substations were placed in operation; these facilities were constructed under a project financed by Development Loan Fund, D L ~ 163, of $ 12.7 million, VN$ 100 million from the national GVN Budget and VN$ 179.5 million from the revenues of the Electricity of Vietnam, EOV (formerly W E E ) these new additions to the metropolitan Sadgon power system are adequate to satisfy current demands, but not eufficient to meet the increasing demands of connected customers, new industrial, commercial and residential loads, and to provide a normal reserve capacity to permit adequate maintenance of installed equipment,
New industrial loads are typified by the expanding local textile industries, the new Saigon Water System, the Bien Hoa industrial complex, and other small industries (cement, warehousing, etc.) Residential and commercial demands are increasing due to the impact of a war-time conditions, influx of an increasing work force, new housing construction, and a pent-up demand in an - expanding economy.
The metropolitan power system was largely constructed by CEE, a French utility, to serve about 60,000 residential, commercial and industrial customers. Between 1960-64 the registered number of customers increased from 69,756 to 88,540 without a proportionate increase in primary distribution capacity. Today there are about 90,000 customers and it is estimated that in the past two years 60,000 additional potential customers were turned down due to lack of adequate el&trical circuits. Work is progressing as rapidly as possible under difficult conditions to reinforce the secondary power system, including underground cable, overhead lines, substations in order to market the power demand.
B. Provincial Electrification:
The relatively small power systems in the principal province towns and cities have growing demands for power and a general need for rehabilitation replacement and extension of existing power systems. These systems operate under concessions granted to French utilities by provincial governments. The CEE concession for Saigon will terminate in Dec. 1967, as will that for two other French utilities. One French utility has a concession until Dec. 1975, and a Vietnamese company, until May 1968. All these concessions upon termination will be turned over to Electricity of Vietnam, an autonomous government power agency. EOV plans a progressive change-out of existiug marginal capacity and new plant additions in coordination with an intggrated power system for the whole country. In general, the primary & secondary distribution systems are in poor condition, resulting from poor maintenance, lack of parts, labor scarcity, VC sabotage actions. There is a general need to rebuild completely, and to re-equip obsolescent system utilization voltages to conform to the newly adopted standard of 220/380 volts .
C. Rural Electric Coops.
In 1965 three electric power cooperatives were organized in Vietnam with USAID assistance under a contract with the National Rural Electric Cooperative Association (NRECA) of Washington, D.C. These cooperatives were organized in Tuyen Duc, An Giang and Bien Hoa provinces. To date, these are in excess of 20,000 members in these cooperatives. Plans for design and wnstruction of rural power lines is well u n d e ~ a y and power distribution is planned for late in 1967, provided from EOV power systems. For An Giang province, a 3400 KW diesel electric plant is under construction, for operation by BOV.
D. Other Electric Power Program:
The GVN/Ministry of Revolutionary Development is planning to install 30 KW generating plants in 30 separate, selected villages and hamlets throughout Vietnam. This program is planned to expand to cover an additional 60 sites in 1967.
Other GVN power programs cover generator installations for refugee housing, national police, health stations, schools, and government offices in the rural areas.
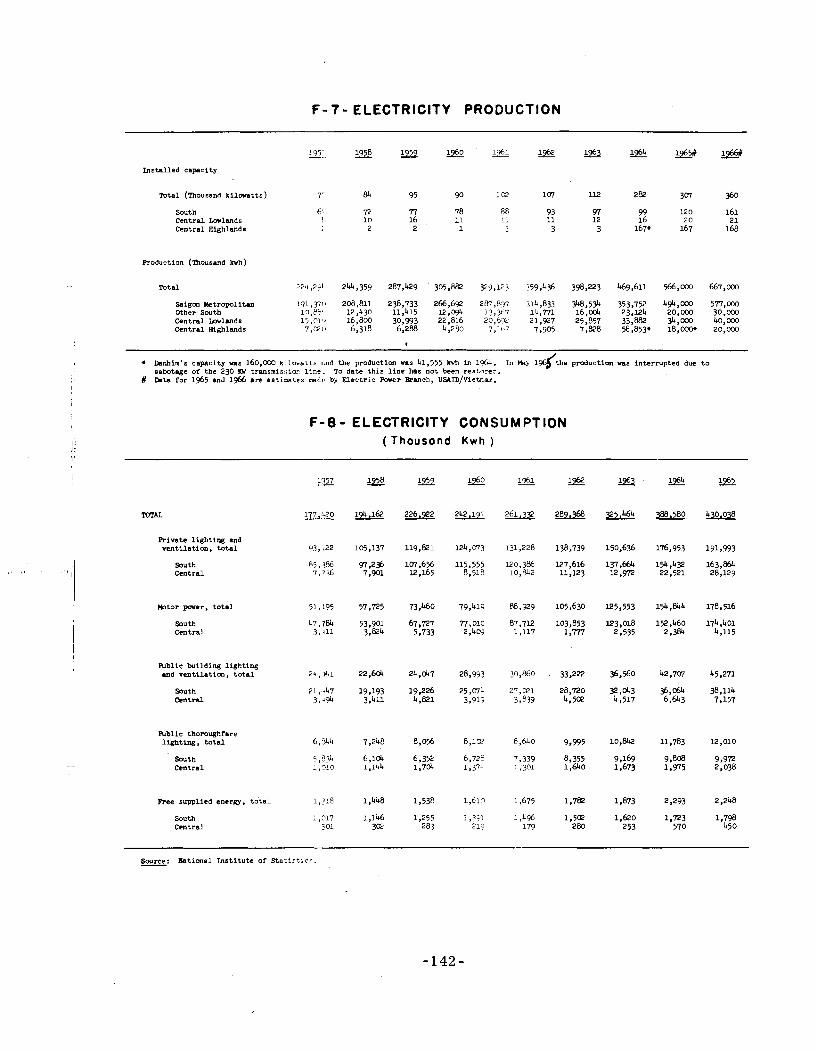
F- 7- ELECTRICITY PRODUCTION --
Ins ta l l ed capacity
Total (Thousand ki lowatts) 7- 84 95 90 322 107 l l 2 282 307 360
South Central l a l a n d s Central Highlands
Total 224,291 244,359 287,429 ' 305,882 329.l23 359.h36 398,223 lr69,611 566,003 667,003
Saigon ~ e t r o p o l i t a n 191,3711 208,811 238,733 266,692 287,837 31L,833 348,534 353.752 4+.003 5n,WO Other S w t h 13,flb, 12,1130 11.U 15,@ 13,3t7 1i.m 1 6 , ~ & 2 3 ~ ~ 4 2 0 . ~ 0 30,003 Central l a l a n d s 15,@1'1 16,800 30,993 22,816 20,13gZ 21,927 25,857 33.882 34,003 40,003 Central Highlands 7 , E o 6,318 6,288 L,250 7 , 1 ~ ~ 7,905 7,828 9 , 8 5 3 0 18,0001, 20,003
l hnhim's capacity was 160,003 kllor-atts m d the production Vas L1,555 kvh Fo 1964. In May l g d t h e production was interrupted due t o sabotage of the 230 XW tnmsmis:iian l i n e . To date th i s l i n e has not been restnree.
# hta for 1565 and 1966 a re e s t i r n a t ~ s madr by E lec t r i c Porer Banch, ~?AIlJ/vietnt~e.
TOTAL
Private l igh t ing and ven t i l a t ion , t o t a l
South Central
m t o r pmer , t o t a l
South Centrd
Public building l igh t ing and ven t i l a t ion , t o t a l
South Central
Public thoroughfare l igh t ing , t o t a l
F-8 - ELECTRICITY CONSUMPTION ( Thousand K w h )
South Central
Free supplied energy, t o t a l 1,::8 1,L48 1,538 1 1,675 1,782 1,873 2,293 2,248
South 1,317 1,146 1,255 1 1,496 1,5(P 1,620 1,723 1,798 Cmtra l 30: 3m 283 213 179 280 253 570 450
Swrce: Rstional I n s t i t u t e of Statistics. -
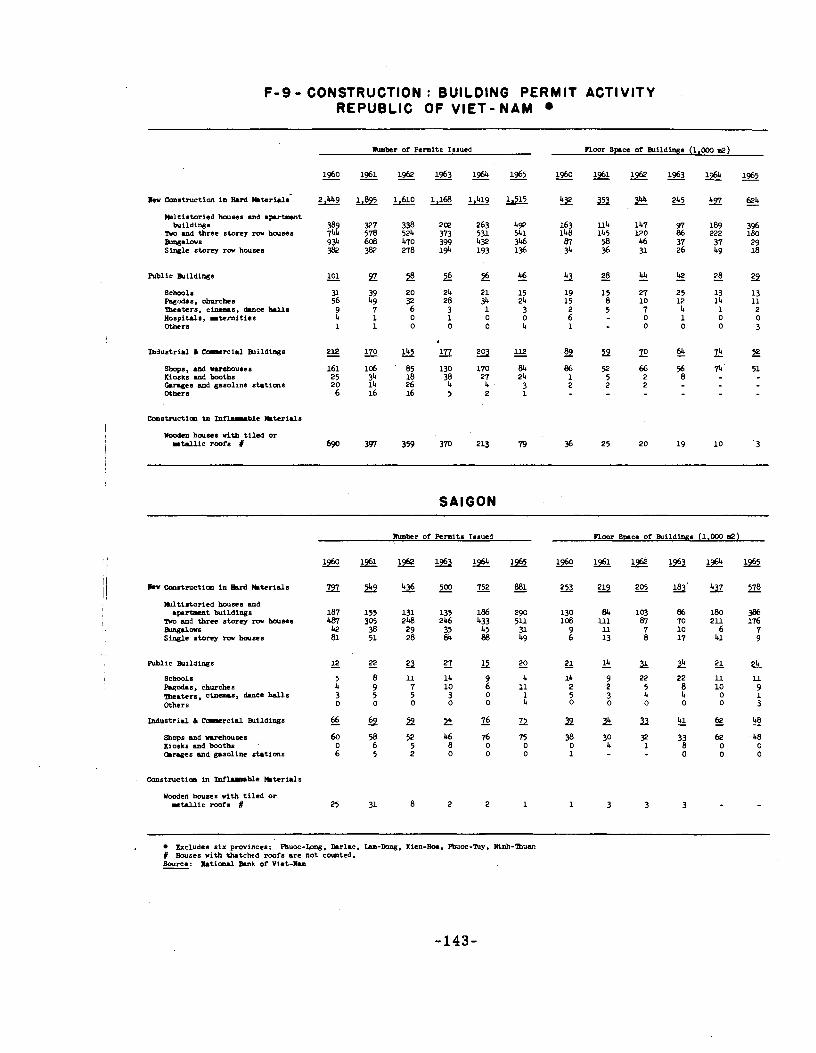
F - 9 - CONSTRUCTION : BUILDING PERMIT ACTIVITY REPUBLIC OF VIET- NAM
lhlmber of Permitz Issued P l w r Space of mildings (1,000 .2)
lkw Construction i n HLrd mteri.ls-
h t l t i s t m i e d houses m d ap.rtpsot tui ldings
ho m d three storey mr houses nlq@ws Single storey rw houses
Schwls Fagodaa, churches mea te r s , cinemas, dance h a l l s Rospitala, a t e m i t i e s Others
Industr ial 6 w r c i a l mi ld ings
Sbaps, and barehouses Mosks m d booths w e e and gasoline s t a t ions Othcra
I Constructim la I n f m b l e Illter1.l~
YoDdm houaea v i th t i l e d o r r t r u i c r m i s R
b t e r of Permits Issued P l w r Smce of B u i l d i n ~ s (1,000 d)
h t l t i r t a r i e d b u s e s m d ap-t tu i ld ings
ho and three storey mr houses Eamg.lws Single storey mr houses
Industr ial 6 CDlcrc ia l Buildings
Shops and rv rhouses Kiosks m d booths m n g e s and gasoline stat ions
Constructim in InflAEmble M t e r i a l s
Uocden houses with t i l e d o r r t r u i c roofs #
, Excludes s i x provinces: Wuoc-Lmg, h r l a c , Lam-Dong. Kien-Ron, Fbuoe-my, Ninh-'lbw # Rovses v i t h t h t c k d m f s are not camted. Source: R a t i d B n k of Viet-Ram -
Present ly , Viet-Nam imports a l l i t s petroleum products from abroad. There a r e t h r e e d i s t r i b u t i o n companies opera t ing here: S h e l l , Cal tex and Eoso Standard Eas tern , Inc. I n A p r i l 1962, a con t rac t f o r cons t ruc t ion of a r e f ine ry was signed by t h e GVN, Esso Standard Eas tern , Inc. and t h e S h e l l Company. Due t o mul t ip le e v e n t s , t h i s p r o j e c t was suspended u n t i l May 1964, when a petroleum r e f i n i n g company was incorporated under t h e name of Cong-Ty Loc Dau Viet-Nam (Viet-Nam Refinery Company) with t h e a d d i t i o n a l p a r t i c i p a t i o n of SOFIDIV (Socie te F inanr i e re pour le Developpement de 1 ' Indus t r i e au Viet-Nam) and Caltex. A r e f ine ry is t o be b u i l t by t h i s corporat ion a t Cau-Dau (on the o u t s k i r t s of Nha-Trang) t o produce a t t h e r a t e of 24 ,000barre ls of re f ined petroleum o i l per day. To d a t e it i s uncer ta in when cons t ruc t ion of t h i s p l an t w i l l begin.
I n t e r n a t i o n a l Bunkering
Airp lanes - Conunercial av ia t ion gas and j e t f u e l come i n t o t h e country without a l l o c a t i o n of fo re ign exchange under an agreement whereby a t t h e end of each year t h e a i r l i n e s repay t h e o i l companies i n t h e currency of t he a i r l i n e ' s country of o r ig in . Such imports a r e excluded from t h e sec t ion on Imports f o r a l l years except 1957. However, bunkering of c i v i l i a n non-jet a i r p l a n e s and some semi- m i l i t a r y a i r c r a f t s such a s those operated by MATS, a r e included i n t h e sec t ion on Sa le s .
Ships - In t e rna t iona l bunkering of sh ips i s excluded from both imports - and s a l e s da ta .
S a l e s - Data f o r many items a r e supplied i n h e c t o l i t e r s and converted - t o met r ic tons by USAID
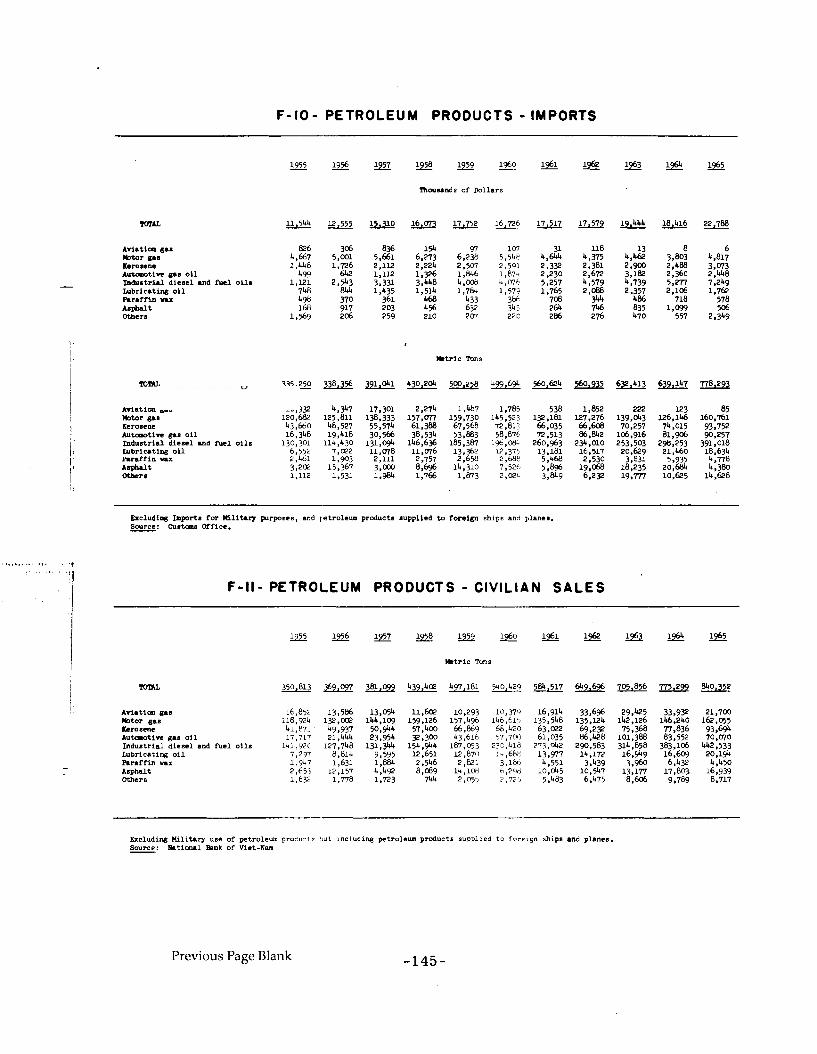
F - I 0 - PETROLEUM PRODUCTS - IMPORTS
Avia t im gar b t o r gaa h m m n e AutoPoti= gas O i l I ndus t r i a l d i e se l and -1 o i l s Lubricating o i l Paraffin m u Asphalt Others
Aviation gas b t o r gas Kerosene A u t e o t i r r gas o i l Indus t r i a l d i e se l m d me1 o i l s Lubricating o i l R r a I I i n n x Aspbalt Otbcrr
Wctrlc Tuns
E x c l u d w Imports for I t l l i t a ry plrposes, and ratroleua producta supplied t o foreigu ships and planea. Scurce: C u a t a s Office. -
F - l l - PETROLEUM PRODUCTS - CIVILIAN SALES
Avi.tian gas b t o r nas ~(crna;; 4i;B7; C9;937 5 0 ; 9 4 $7;400 66;864, 58,420 6 3 ; ~ ~ 2 6 9 ; 2 9 75;368 ~ 1 ; 8 3 6 93;694 Autclot im gas o i l 17,717 21,444 23,954 9 .300 43,616 57,700 61,035 86,428 101,388 83,552 7 0 . 4 0 Indus t r i a l d i e se l and fue l o i l s 14i,PC 127,748 131,344 154.94 187,053 230,hld 777.042 290,583 314,858 383,106 442,533 L u b r i c a t i ~ o i l 7.237 B.81L 9.595 12.651 12.870 14.6% 17.417 14.172 1 6 . 9 9 16.603 20.1'94 Paraffin G x Asphalt Others
Excluding Ui l i t a ry use of petroleum prouu:ts ' i u t including petroleum products supplled t o fnrelgn ships and planes. Source: Rational Bank of Vlet-Nan
Previous Page Blank
SECTION - G
TRANSPORTATION and
COMMUNICATION
Previous Page Blank 1 Ci?
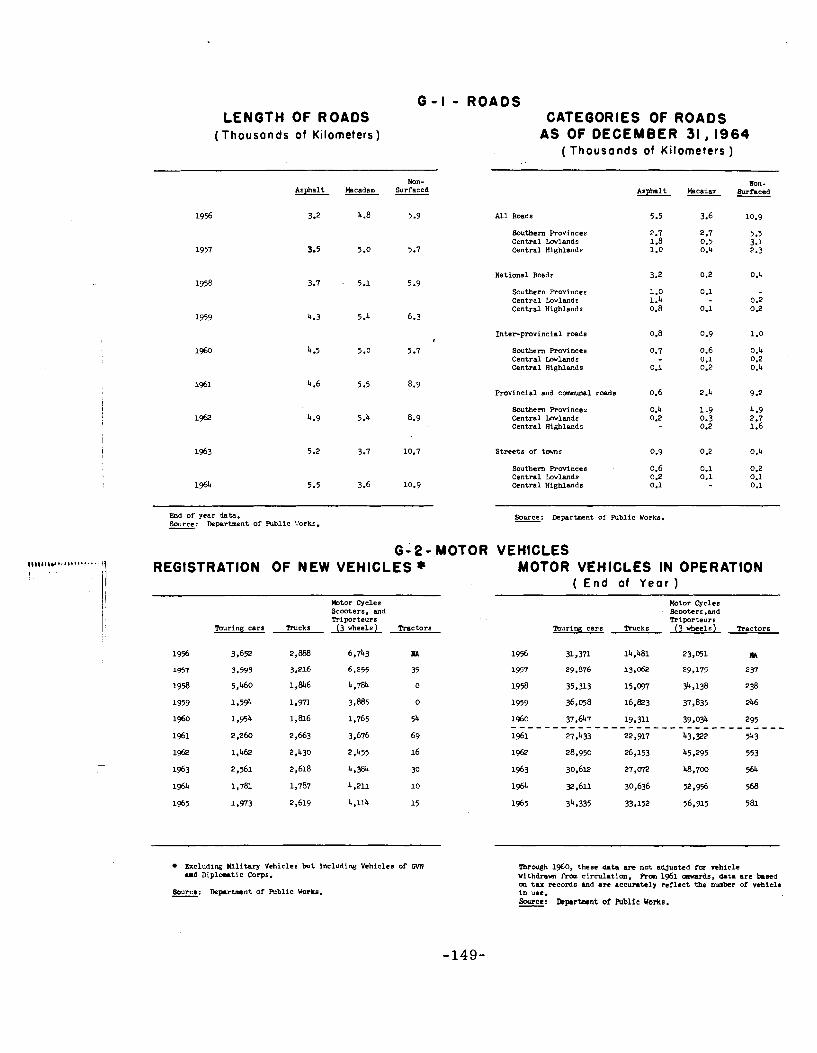
G - I - ROADS LENGTH OF ROADS CATEGORIES OF ROADS
(Thousands of Kilometers) AS OF DECEMBER 31,1964 ( Thousands of Kilometers )
Asphalt
3 2
3.5
3.7
4.3
4.5
4.6
4.9
5.2
5.5
Non- Mtcadam Surfaced --
4.8 5.9
5.0 5.7
5.1 5.9
5.4 6.3
5.0 5.7
5.5 8.9
5.4 8.9
3.7 10.7
3.6 10.9
Ilon- Asphalt Mtcadam Surfaced
A l l Roads 5.5 3.6 10.9
Southern Provinces 2.7 5.5 Central Lovlands 1.8 2'7 0.5 3.1 Central Highlands 1.0 0.4 2.3
National Roads 3 2 0.2 0.4
Southern province^ 1.0 0.1 Central lawlandr 1.4 0.2 Central Highlands 0.8 0.1 0.2
In te rp rov inc ia l roads 0.8 0.9 1.0
Southern Provinces 0.7 0.6 0.4 Central Lavlands 0.1 0.2 Central Highlands 0.1 0.2 0.4
Provincial and c m u n a l roads 0.6 2.4 9.2
Southern Provinces 0.4 1 .9 4.9 Central Lovlands '3.2 0.3 2.7 Central ~ i g h l a n d s 0.2 1.6
S t ree t s of t m r 0.9 0.2 0.4
Southern R w i n c e s 0.6 0.1 0.2 Central law land^ 0.2 0.1 0.1 Central Highlands 0.1 0.1
End of year data. Source: Department of Public Works. Source: Department of Public :corks. -
G-2- MOTOR VEHICLES ,,I, l , ,". .>, .-m-.. . I REGISTRATION OF NEW VEHICLES * MOTOR VEHICLES IN OPERATION
( E n d of Year )
b t o r Cycles Hotor Cycles
lburing cars
3.652
3.593
5.460
1,5*
1,954
2,260
1,462
2,561
1,781
1,973
Trucks
2,888
3.216
1,846
1,971
1,816
2.663
2,430
2,618
1,787
2,619
~ c o o t e r i . and Triporte;rs
(3 wheels) Tractors
- -
Tr ipor te iA lburing cars Trucks (3 vheels) Tractors
E r c l u d i ~ llilituy Vehicles but including Vehicles of C'iN u d D i p l a t i c Corps.
Source: Depr tP ln t of Public Works. - Tarough 1960, these datd are not adjusted for vehicle withdrabn Prom circulat ian. Rm 1961 Qwds, data a r e b a e d on t ax records hnd a m accurately re f l ec t the umber of vehicle i n use. Source: DcprZmcnt of Fublic Uorka. -
TRANSPORT
In te rna l Transport
Boats - The th ree major port6 a re Saigon, Da-Nang (formerly Tourane)
i n Central Viet-Nam and Tan-Chau on the Mekong River close t o the Cambodian border (South Viet-Nam West). Data represent loaded tons departing from a l l ports .
Trains
There a r e two railway Jines: Saigon t o Dong-Ba i n Central V i e t - N a m and Saigon-Locninh near t he Cambodian border (South Viet-Nam East). The l a t t e r l i n e was closed f o r secur i ty reasons i n mid-1961. Data f o r f r e i g h t represent only merchandise on slow f r e igh t t r a i n s ; baggage and merchandise ca r r i ed on passenger t r a i n s a re excluded. By ea r ly 1965 only very shor t sect ions of r a i l remained i n continuing use due t o secur i ty problems.
Planes
The r e l a t i ve ly small amount of goods shipped by a i r f r e i g h t i s largely from Saigon t o o ther provinces.
., .< In ternat ional Transport
Plane - Represents commercial t r a f f i c a t Tan-Son-Nhut a i rpor t .
Shipping - Over 904b of f r e i gh t shown is hadled i n Saigon port .
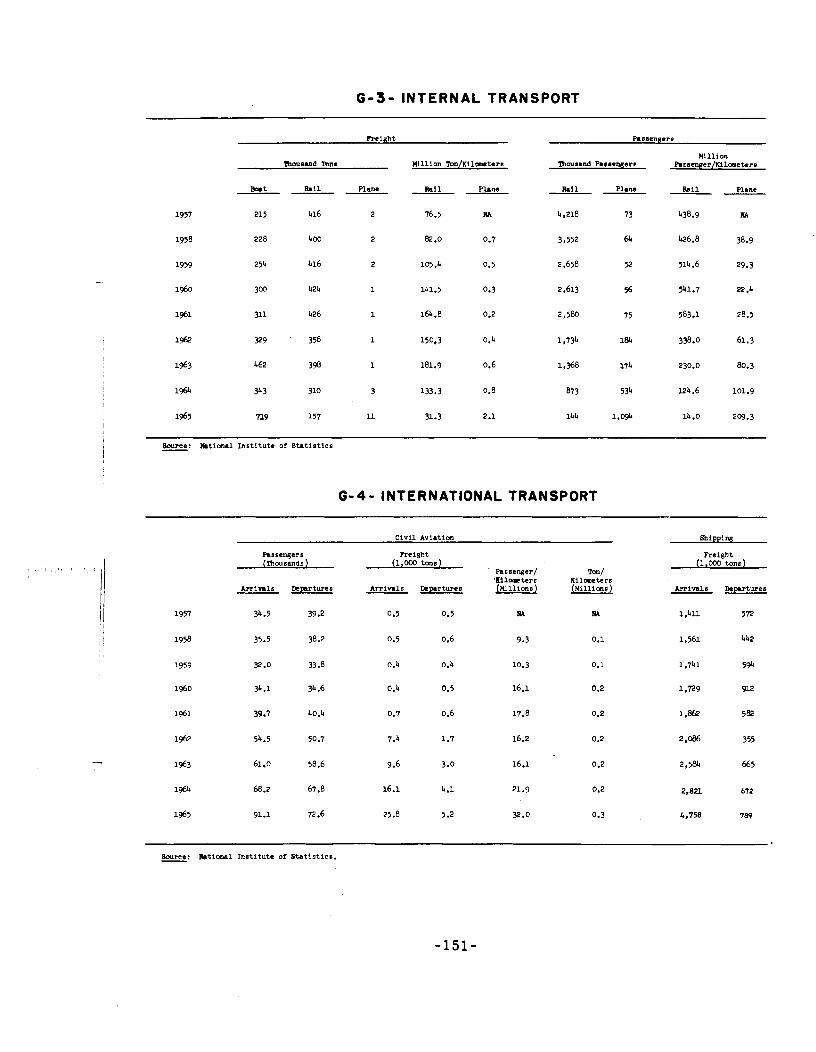
G-3- INTERNAL TRANSPORT
m i g h t
moueand mns M l l i o n I b n / K i l m t e r a
Brt Fla i l Plane F la i l Plane --- -- 1957 215 416 2 76.5 M
1958 228 400 2 82.0 0.7
1959 254 416 2 105.4 0.5
lq60 300 424 1 l'~1.5 0.3
1961 311 426 1 164.8 0.2
Million Ibousand Paeeeagerr h ~ e m g e r / K i l m e t e r s
F l a i l Plane Rail Plane -- -- 4.218 73 438.9 M
1 Source: National I n s t i t u t e of S t a t i s t i c s I -
G-4- INTERNATIONAL TRANSPORT
Civil Aviation Shipping
h a s e y e r s Freight Freight (l%ousnndr) (1,000 t m s ) (1.000 tons)
Passenger/ 'Illlometers Kilometers
Arrivals D c p r t w e s Arrivals Dcparturee i o n s ( ~ i l l i a n r ~ Arrivals Dcpr tu res
-
Source: l l a t i o ~ l Ins t i tu t e of S t a t i s t i c s . -
Domestic P o s t a l Serv ice
Rates a r e 3 p i a s t e r s f o r up t o 20 grams and 4 p i a s t e r s from over 20 grams t o 50 grams; p lus 2 p i a s t e r 8 f o r every 50 grams t h e r e a f t e r . S t a r t i n g wi th 1968 t h e a i r mail r a t e is 4 p i a s t e r s f o r t h e f i r s t 10 grams, 5 p i a s t e r s f o r 20grams,p lus2 .0 p i a s t e r s f o r every 5 grams t h e r e a f t e r .
I n t e r n a t i o n a l P o s t a l Serv ice
E f f e c t i v e August 1, 1966, I n t e r n a t i o n a l A i r Mail p o s t a l rates a r e changed a f t e r t h e devaluat ion of t h e p i a s t e r - Thus, Airmail r a t e s vary from 10.00 p i a s t e r s t o Cambodia and Laos t o 25.00 p i a s t e r s t o South American Count r ies f o r t h e f i r s t 5 grams, p lus from 1.00 p i a s t e r t o 23.00 p i a s t e r s f o r every 5 grams t h e r e a f t e r .
For l o c a l and fo re ign r eg i s t e r ed mai l , postage i s a t ord inary r a t e s p l u s 7 p i a s t e r s .
Telephone
Local c a l l s a r e 5 p i a s t e r s f o r 3 minutes from a pub l i c te lephone booth. T o l l c a l l s rise from 10 p i a s t e r s t o 100 p i a s t e r s f o r domestic 3-minute c a l l s .
Telegraph
The minirnum charge f o r o rd inary telegram sen t w i th in Viet-Nam i s 20 p i a s t e r s f o r 10 words and f o r i n t e r n a t i o n a l o rd inary te legrams, i t i s set a t t h e r a t e app l i cab l e t o t h e country where they a r e s en t .
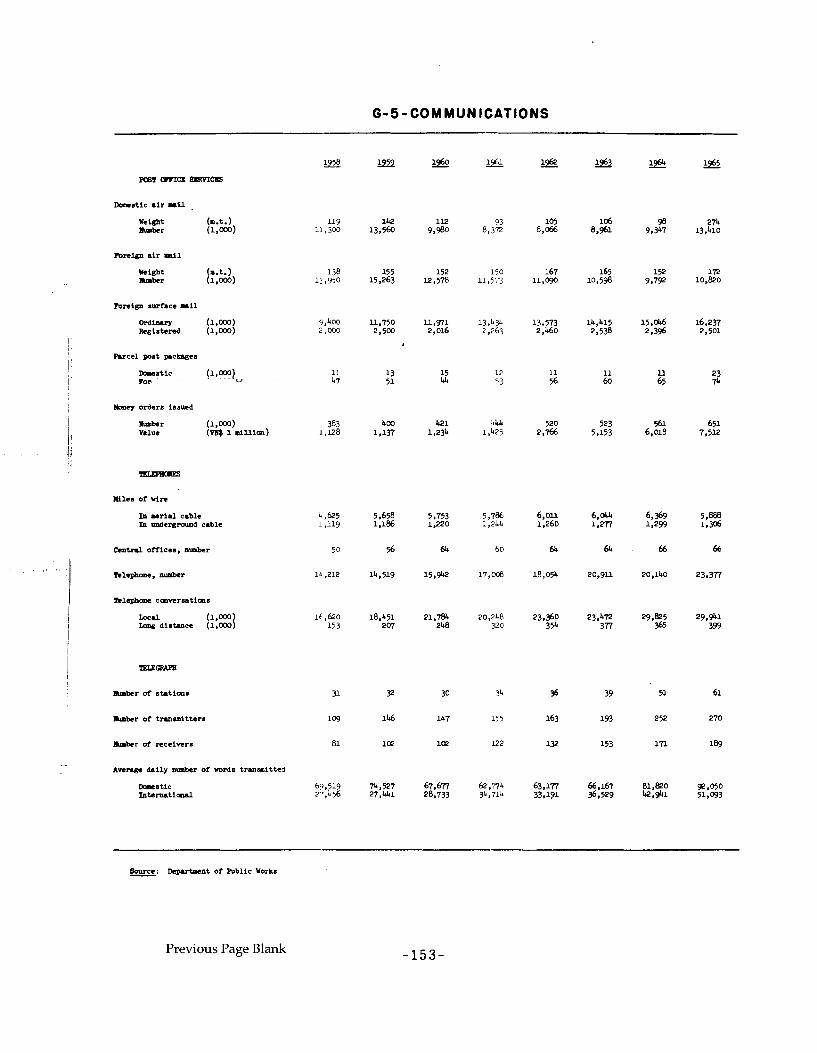
h a t i c a i r mail .
Toreign surface mail
R rce l post packages
Wmey orders issued
In aerial cable In rmdergmund cable
Centnl offices, number
Rlephme, number
lhmber of s u t i m s P P 30 3h 36 39 51 61
- A n * daily number of wrds tmamitted
~ a r s t i c 6~1,519 74,527 67,671 62 ,??L 63,171 66,167 81,820 92,050 I n t e r n a t i d ?.',L56 27,441 28,733 34,71h 33,191 36,529 42,941 51,093
k c - : kpmrbent of Fublic Works -
Previous Page Blank
SECTION - H
USAID
Previous Page Blank
General
U.S. Assistance t o Replbl lc of Vietnam is provided under several different programs, with funds voted by t h e Congress each pa r .
A . Mi l i t a ry Assistance - This program, which i s administered by t h e U.S. Department of Defense, i s t o provide m i l i t a r y equipment, suppl ies and services t o countr ies which cannot af ford t o equip t h e i r m i l i t a r y fo rces a t a l e v e l considered necessary f o r t h e secur i ty of t h a t country o r f o r the common defense of the f r e e world. This b u l l e t i n does not repor t da ta on mi l i t a ry a s s i s t ance t o Replbl ic of Vietnam.
1. Agency f o r In te rna t iona l Development - The program of t h i s agency ( including the predecessor agencies, t h e Mutual Secur i ty Agency, the Foreign Operations Administration, t h e In te rna t iona l Cooperation Administration and t h e Development Loan Fund) is t o he lp countr ies t h a t wish t o improvc s o c i a l and econmfc condit ions by supplying t h e f i n a n c i a l and technica l resources not ava i l ab le wi th in t h e country. Assistance is of th ree kinds:
a . Development Loans. These a r e long-term, low i n t e r e s t loans, general ly used t o f inance p a r t i c u l a r major i n f r a s t r u c t u r e p ro jec t s where p r iva te funds a r e not ava i l ab le , but where t h e projec t is of a commercial na ture and w i l l , i n t i m e , earn s u f f i c i e n t funds t o permit repayment of t h e o r i g i n a l cost.
b. Commercial Aid. These funds go t o import t h e c a p i t a l goads, f u e l s , raw mater ia ls and consumer goods which the people of Vietnam need but cannot buy because the country l acks fore ign exchange. I n operat ion, Vietnamese importers order t h e .goode which they need, and the United S t a t e s pays i n d o l l a r s o r o the r fore ign currencies f o r these goods a s a grant o r loan t o t h e Government. The importers pay f o r t h e goods i n p i a s t e r s which a r e then deposited i n t o a spec ia l account ca l led the Counterpart Fund. These p i a s t e r , belonging t o the Government of Vietnam, a r e used t o supplement Vietnam's o the r revenues and help pay t h e operat ing expenses of the Vietnamese Army o r pay the p i a s t e r cos t of USOM-sponsored e c o n d c development projec ts . There a r e two exceptions t o th i s : Under Section 402 of the Mutual Secur i ty A c t which now terminates, and under the current Food f o r Peace program (see below) surplus a g r i c u l t u r a l commodities a r e sold t o Vietnam f o r p i a s t e r s , and these p i a s t e r s , which a r e owned by the United S t a t e s , a r e granted back t o Vietnam f o r support of t h e i r m i l i t a r y budget.
Other. This is a i d t o the public sec to r and includes: C. - 1) Technical Cooperation and Development Grants. These grants
a r e devoted t o t h e educational needs of the country and the carrying out of demonstration and t r a i n i n g techniques i n such f i e l d s a s ag r i cu l tu re , public administrat ion, industry, l abor and heal th.
2) Projec t Aid. These funds a r e used t o f inance in f ras t ruc tu re projec ts of a non-commercial na ture and a r e , therefore, on a grant basis . However, i n 1957, before the Development Loan Fund came i n t o existence, $25 mi l l ion of these funds were extended on a loan basis.
3) Other. This includes a i d f o r the reset t lement of refugees, t o f inance the counter-insurgency program and other s imi la r types of public aid.
I n addit ion t o programs f o r s p e c i f i c countr ies , A.I.D. has programs which benefi t an e n t i r e region o r most countr ies of the f r e e world. The data i n Table H-1 include Viet-Nam's share of the worldwide Malaria Eradicat ion program, but exclude Vietnam's share of the Asian Economic Development Fund (AEDF). However, the a c t i v i t y under the loan port ion of the APDF which i s being serviced by Vietnam i s shown i n Table H-2.
2. Food f o r Peace - This program (formerly ca l led PL 480) was designed t o he lp r r i ena ly countr ies t o share i n America's ag r i cu l tu ra l abundance. Agr icul tura l commodities which a r e i n surplus supply i n the U.S. ( f o r example wheat, tobacco, e tc) a r e made avai lable t o o ther countr ies i n the following ways:
a . T i t l e I. Sales f o r Local Currencies. Under t h i s t i t l e , countr ies may purchase surplus ag r i cu l tu ra l commodities with t h e i r own currencies. These currencies, which a r e owned by the United S t a t e s , a r e then e i t h e r granted o r loaned back t o the country o r t o p r iva te indust ry within the country, and a small port ion of the currencies i s re ta ined f o r U.S. uses. Note t h a t only t h a t port ion planned f o r grants and loans is considered as assistance. I n the case of Viet-Nam, 10% of the loca l currency i s reserved f o r U. S. uses and the remainder is granted t o Viet-Nam e n t i r e l y f o r support of i t s mi l i t a ry budget under provisions of Section 104 (c) of the basic law. Beginning 1966, the port ion is 15% f o r U S uses and 85% f o r Vietnamese mi l i t a ry budget.
b. T i t l e 11. Emergency Relief . Under t h i s t i t l e , food is given t o countr ies t o help them meet famine o r o ther extraordinary r e l i e f requirements.
c. T i t l e 111. - Donations t o Voluntary Relief Agencies. Under t h i s t i t l e , surplus a g r i c u l t u r a l cammodities a r e donated t o voluntary r e l i e f agencies such a s CARE, National Catholic Welfare Conference, etc, f o r d i s t r i b u t i o n t o needy people.
The data i n t a b l e H-1 represent obl iga t ions and loan 8uthorizat ions, t h a t is, the amount made ava i l ab le f o r use i n a given year. Sometimes, small amounts of these funds a r e not used and a r e , therefore , deobligated; they u y then be reobligated within the same country o r t r ans fe r red t o another country. The data represent the sums obl iga ted from new ob l iga t iona l authori ty, programed f o r each year, adjusted f o r deob- l i g a t i o n s and reobl iga t ions of p r i o r year funds.
U H S (Table H-2)
This tab le gives data on disbursements, amortization and in te res t payments on the s ix loans extended t o Viet-Nan.
The loans were a l l extended i n dol lars ; 4 a re t o be repaid i n pias ters with in te res t a t 3%; 2 may a t the discret ion of the GVN, be repaid e i ther i n pias ters with i n t e r e s t a t 4% or i n dol lars with i n t e r e s t a t S. Loans 1 and 2 a re t o be repaid over a period of 40 years, loans 3 and 5 i n 30 years, loan 4 i n 15 years and loan 6 i n 20 years. In f a c t , Viet-#am repays a11 loans i n piasters.
- Conditions of a11 loans have a maintenance of value clause, 1.e. the
r a t e of exchange t o be used i n making p ias te r i n t e r e s t and principal payments is the effect ive r a t e of exchange a t which U.S. do l la rs a re sold o r offered f o r sa le on the date of payment. For loans 1 ,2 and 3 on the
I table , the Government of Viet-Nam has been making in t e r e s t and principal I payments a t the r a t e of 35 t o US$ 1. Huwever, by agreement reached with I
i the GVN i n June, 1965, effect ive with payments of principal and in t e r e s t
I uwing a f t e r January 1, 1965, a11 repayments a r e t o be made a t the r a t e of
1 VN$ 73.5 t o US$ 1. For loans 4 ,5 and 6, payments a re being made a t VN$ 72.77 t o US$ 1.
t
! Payments f o r i n t e r e s t and principal a re registered a t the time made by the GVN.
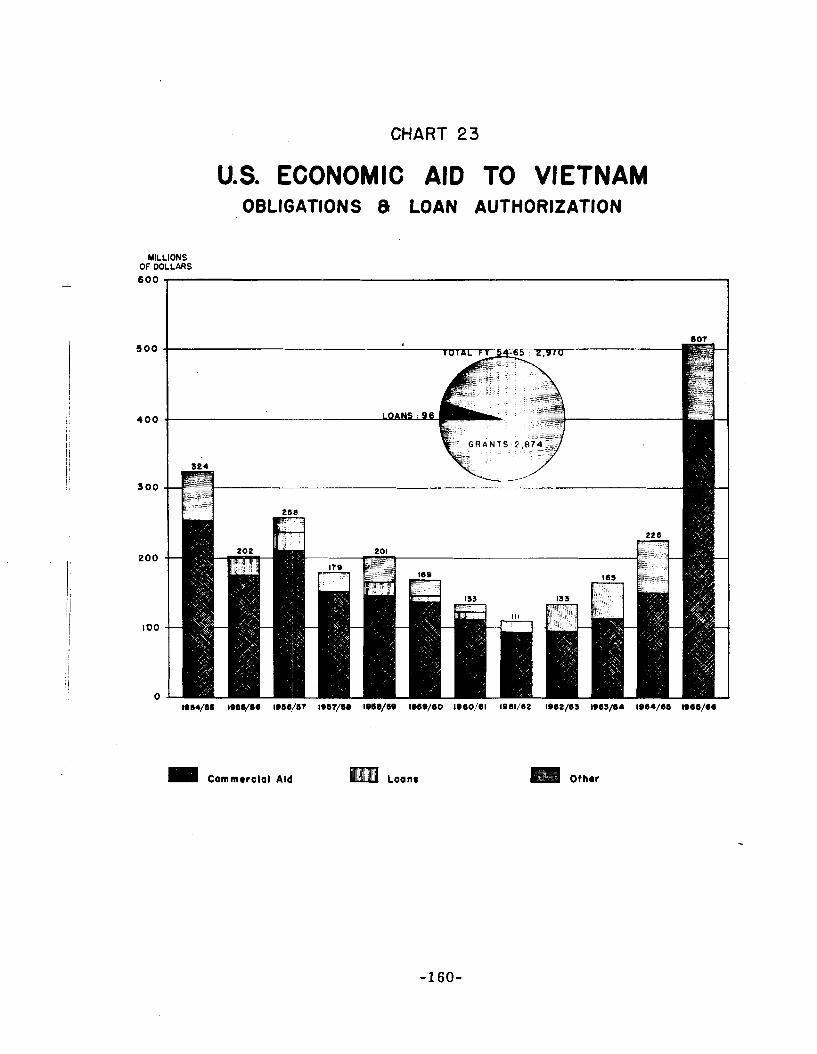
CHART 23
U S ECONOMIC AID TO VIETNAM OBLIGATIONS 8 LOAN AUTHORIZATION
MILLIONS OF DOLLARS
(I Commercial Aid Other
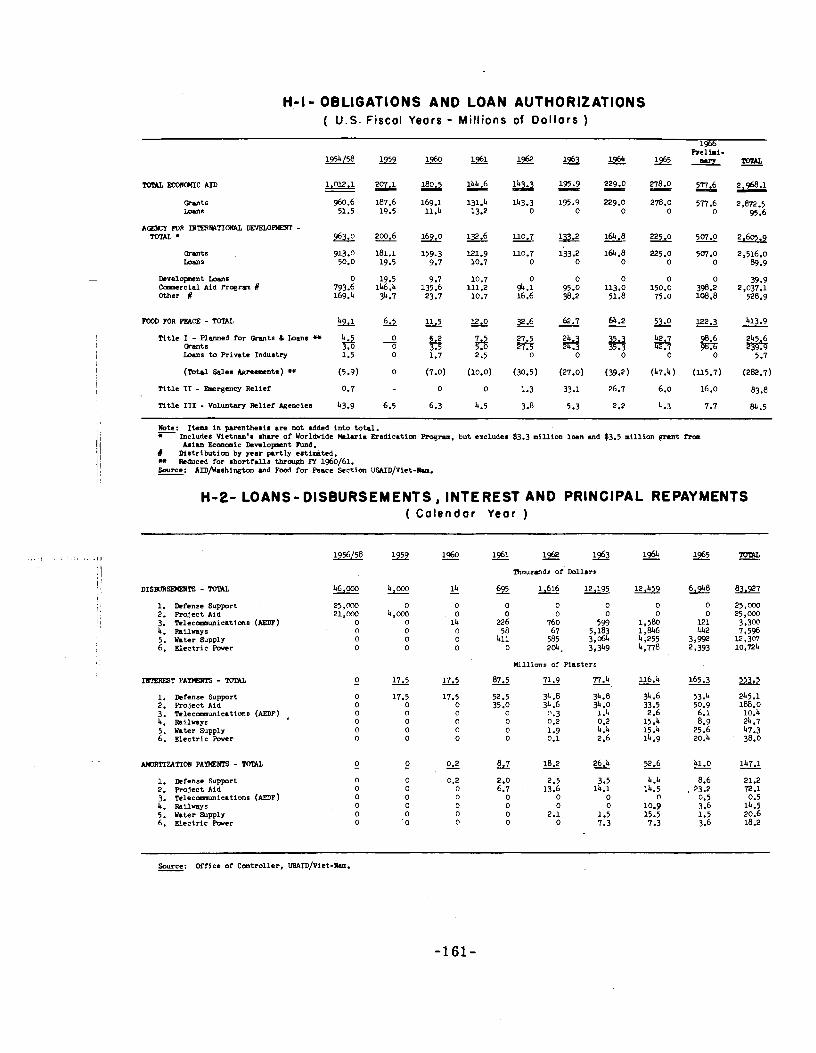
H-I- OBLIGATIONS AND LOAN AUTHORIZATIONS ( U.S . Fiscal Years - Millions of Do l la rs )
19bb
TOTAL ECOllCCIIC AID
Development b a n s CDmmcrcial Aid Program # Other #
T i t l e I - Planned fo r W m t s & Inan6 * 4.5 0 ly.7 (rants 3 3 7 -
5.0 27.5 Loans t o R i v a t e Indurtry 1.5 1.7 2.5 0 0 0 5.7
('lbtd Sales kreements) * (5.9) 0 (7.0) (10.0) (30.5) (27.0) (39.2) (47.4) (ll5.7) (282.7)
T i t l e I1 - Baergency Relief 0.7 0 0 1.3 33.1 26.7 6.0 16.0 83.8
T i t l e 111 - Voluntary &l ie f lgenciea 43.9 6.5 6.3 4.5 3.8 5.3 2.2 4.3 7.7 BL .5
k t e : Items in p m n t h e a i s a r e not added into to ta l . - + Includes Vietnam's share of Worldvide M a r i a R a d i c a t i m Rogram, but excludes $3.3 mil l ion loan and $3.5 mil l ion g r m t frcn
i M i m Econcnic Development Tund. # Dirtr ibut ion by y e w prrtly estimated.
I * Reduced f o r a h o r t f d l s thrcugb FY 1%0/61. Source: AID/Waahington and Pxd f o r Peace Section USAID/Viet-Ram. -
H-2- LOANS-DISBURSEMENTS, INTEREST AND PRINCIPAL REPAYMENTS ( C a l e n d a r Year )
I 1. Defense Support 2. R o J e c t Ald
1 I 3. Tclecomaunicattons ( N F ) 4. Railways 5. Water Supply 6. E lec t r i c Pover
1. Defense Support 2. R o j e c t Aid 3. Tcleccmmunicattcms (AEDP) 4. Railway€ 5. Water Supply 6. E lec t r l c Fwer
1. Dcfense Support 2. R o j e c t Aid 3. Telecamunications (AEDF) 4. Railways 5. Water Supply 6. E lec t r i c F w e r
1961 1 9 6 2 m lhousanda of Dollars
1 , 6 1 6 -
hill ion^ of P ias t e r s
87.5 - 71.9 - - 77.4
Source: Office of Controller. u S ~ ~ ~ / v i e t - R a m . -
COMMERCIAL IYPORT PROGRAM
General
Procurement Authorizat ions - PA ' s a r e i ssued t o cover t h e purchase of c e r t a i n spec i f i ed commodities. The major p a r t o f t h i s procedure covers a wide v a r i e t y of i tems, but a spec ia l por t ion i s t h e Sec. 402 program, shown separa te ly , f o r t h e import of surp lus a g r i c u l t u r a l commodities.
Di rec t Dol la rs - These a r e d o l l a r s which were granted o r - loaned t o Vietnam during 1955 and 1956, aga ins t which l i cens ing tak ing place u n t i l t h e end o* 1963. (See Notes on For. Trade)
Tr iangular Francs - These are French Francs which r e s u l t e d from s a l e s by t h e U.S. t o France of surplus a g r i c u l t u r a l comnodities during 1955-1958. The f r a n c s were granted t o Vietnam, and l i cens ing f o r c e r t a i n imports from France w e r e charged aga ins t these f r ancs a s l a t e a s March 1962.
I i Author iza t ions
This r e f e r s t o t h e issuance of Procurement Author iza t ions by Washingtap. Authorizat iona a r e included on t h e d a t e of t r a n s m i t t a l by theUSAID t o t h e Di rec to ra t e General of Comerce, but s t a r t i n g with June 1959, t h e June f i g u r e s have been adjus ted t o r e f l e c t t h e amounts received by theUSAIDfrom Washington. These da ta a r e on a n e t bas i s , t h a t is, new au thor i za t ions a r e reduced by any deobl iga t ions which occurea during the month.
National Bank Approvals of Licenses
These a r e l i c e n s e s approved by the National Exchange Of f i ce r a t h e r than t h e National Bank and exchange was granted automatical ly.
Payments -
For Procurement Authorizat ions, t h i s r e f e r s t o payments by AID/W on n o t i f i c a t i o n t h a t goods have been put on board ship. For Di rec t Do l l a r s and Triangular Francs a f t e r J u l y 31, 1956, t h i s r e f e r s t o t h e p i a s t e r s paid by importers on n o t i f i c a t i o n t h a t goods have been shipped.
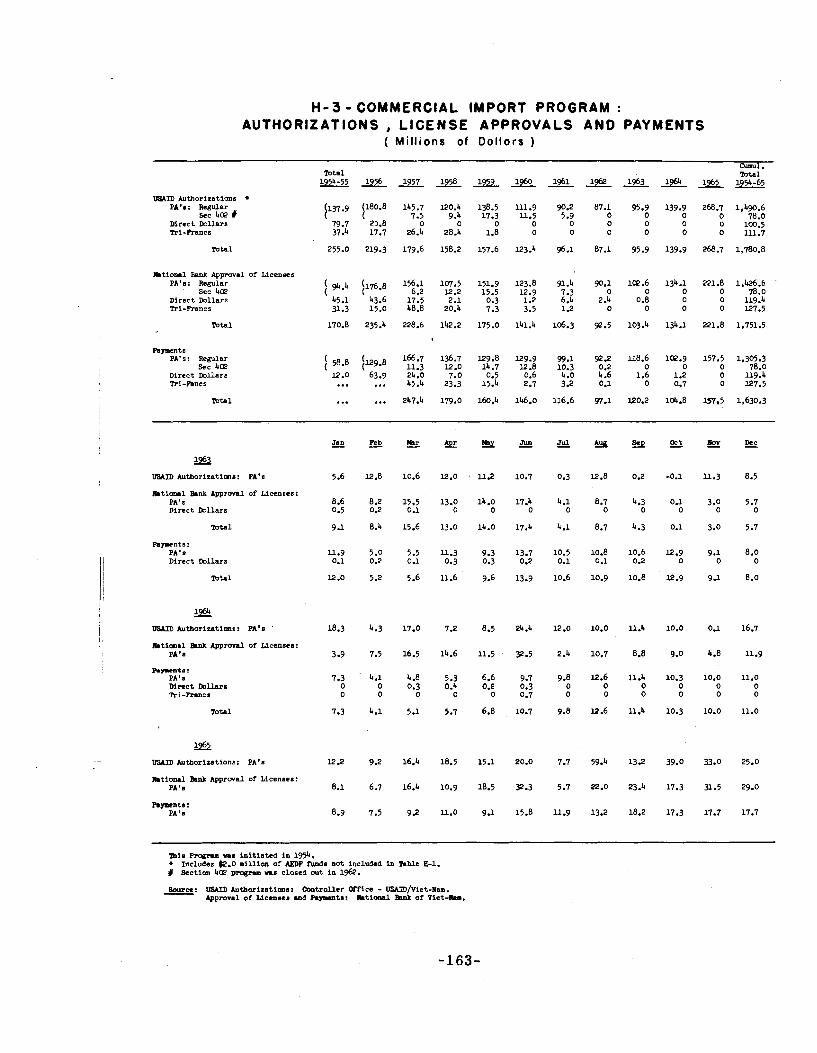
H - 3 - COMMERCIAL IMPORT PROGRAM : AUTHORIZATIONS , LICENSE APPROVALS AND PAYMENTS
( M i l l i o n s of Dol lors )
Total Total 1954-55 1956 1957 1 9 1960 l%l I962 1963 1964 1965
l E 4 I D Authorizatians + PA'#: Regular
5ec 4ce # Direct Dollars Tri-Francs
Total 255.0 219.3 179.6 158.2 157.6 123.4 96.1 87.1 95.9 139.9 268.7 1.780.8
Ltiolul Bank Approval of Licenses PA'a: Regular 194.4 1176.8 156.1 107.5 151.9 123.8 91.4 90.1 1m.6 134.1 221.8 1,426.6 '
Sec 40e 6.2 12.2 15.5 12.9 7.3 0 78.0 Direct Dollars 45.1 43.6 17.5 2.1 0.3 1.2 6.4 2.: 0.8 0 0 119.4 hi-Francs 31.3 15.0 48.8 20.4 7.3 3.5 1.2 0 0 0 0 127.5
Total 170.8 235.4 228.6 142.2 175.0 141.4 106.3 92.5 103.4 134.1 221.8 1,751.5
Pnynnts PA's: Regular
Sec ha? Direct Dollars hi-Phncs
952 VSAID Autborizatima: PA'a
Ltiolul Bank Approval of l icuraes: PA's ~ i r e c t Dollars
Total
P n m n t s : PA's Direct Dollars
Total
9% USAID Authorizations: PA's
L t i a n l Brnk Approval of Licenaea: PA'a
R-ts: PA's Direct t a l l a r s Tri-Prancs
Totdl
2% VSAID Autboriurtions: PA'e
Mt iona l Brnk Approval of Ldcenaes: PA's
R-nta: PA'S
mi8 ~mgnr .IC in i t i a t ed i n 1954. + Includes $2.0 million of AEDP iunda not included i n Table 8-1. # Sectioa 402 p r q r a ~ r r a closed out in 1962.
0ource: UGAID Autboriurtioas: Ccmtroller N f i c e - USAID/viet-~nm. - m p m l of Uceaaes m d -to: Ltionrl Brnk of Viet-lh..
FOOD FOR PEACE TITLE I
AGREEMENTS
Under T i t l e I of PL 480, count r ies may purchase wi th t h e i r own cur renc ie s a g r i c u l t u r a l commodities i n surp lus i n t h e United S t a t e s . By Mar. 21, 66, t h e U.S. and Vietnamese Governments had entered i n t o eleven euch agreements t o t a l l i n g US$ 282.1 1ni1l.ion. Each agreement s p e c i f i e s the r a t e of exchange t o be used i n computing p i a s t e r value; these r a t e s d i f f e r e d over t h e period. The p i a s t e r s shown throughout t h i s t a b l e a r e computed a t t h e r a t e given i n each agreement o r i n amendments where such occurred. On t h i s bas i s , agreements through March 1966 t o t a l l e d VN$ 20,021 mi l l ion .
Theee agreements a l s o p rov ide , fo r t h e quan t i ty and value of goods t o be sold and t h e uses t o which t h e p i a s t e r s w i l l be put. I n Vietnam, agreements t o da t e have provided f o r m r e e kinds of uees:
1. Mi l i t a ry Budget Support (Section 104 (c) - The bulk (8%; before 1966-90%) of the p i a s t e r s generated by T i t l e I S a l e s are used i n t h i s way; they a r e t o be granted back t o t h e GVN t o he lp pay l o c a l c o s t s of the m i l i t a r y establishment. (This is t h e only por t ion of PL 480 p i a s t e r s reported i n Table 8-9).
2. Loane t o P r i v a t e Enterpr i se (Sect ion 104 (e) - These are p i a s t e r loans which may be made t o U.S. business f i n u s i n Vietnam, o r t o Vietnamese f iks f o r establishment of f a c i l i t i e e which would expand t h e market f o r U.S. a g r i c u l t u r a l cormpoditiee.
3. United s t a t e s Uses - These are t h e p i a s t e r s which a r e r e t a ined by t h e U.S. t o pay i ts ob l iga t i ane i n Vietnam, o r f o r o t h e r u ses spec i f i ed i n Publ ic Law 480, and represent p r i o r t o 1966 10% of t o t a l p i a s t e r s from T i t l e 1 Sa les , and from 1966; 15% of t h e t o t a l .
The U.S. maintains severa l accounts a t t he National Bank of Vietnam f o r theee p i a s t e r s : one account f o r each agreement and one o r more accounts f o r each of t h e uses. On n o t i f i c a t i o n t h a t commodities have been shipped, VI? importers pay t h e required p i a s t e r s which a r e deposi ted i n t o t h e agreements accounts. The U.S. Diebursing Of f i ce r t r a n s f e r s p i a e t e r s from theee accounte t o one of t h e %sea" accounts according t o t h e proceduree provided f o r i n each agreement. The p i a s t e r s a r e disbureed from t h e accaunte a e required.
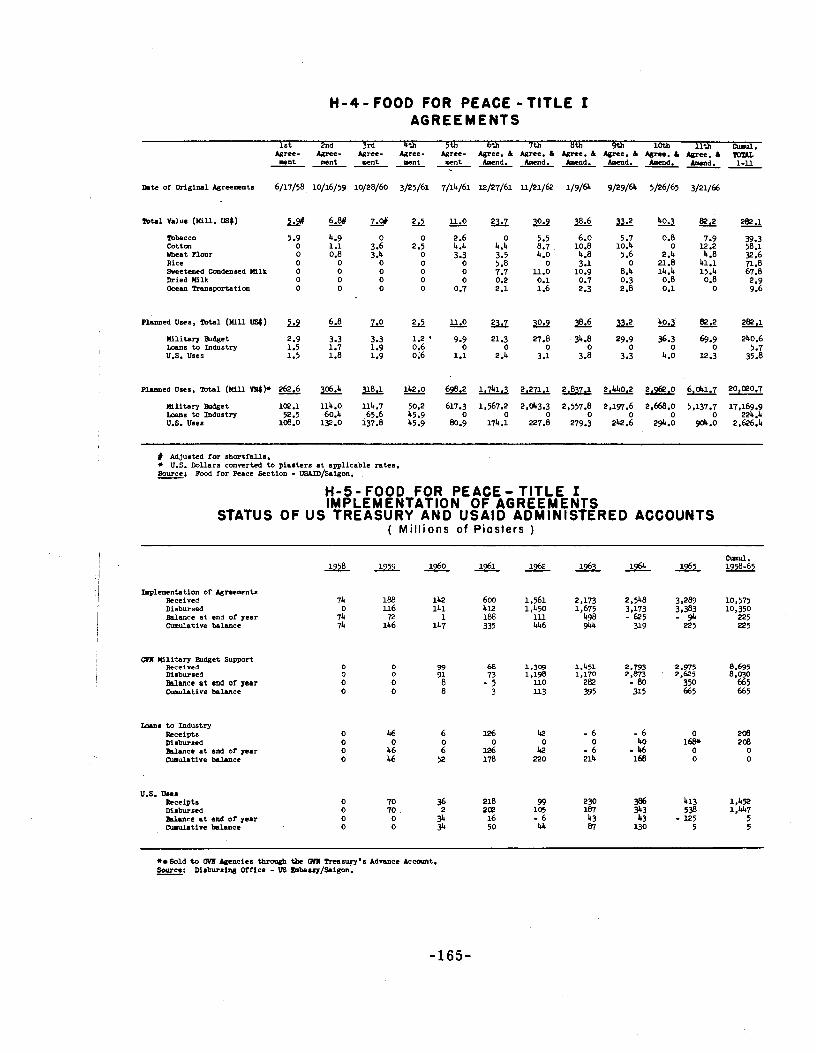
H - 4 - FOOD FOR PEACE -T ITLE I AGREEMENTS
1 s t 2nd 3rd 4th 5th 6th 7th 8th ph 10th l l t h M. Agree- Agm- Agree- Agree- Agree- Agree. 6 Agree. 6 b e . 6 Agree. 6 Agm. 6 Agree. 6 TOPLL Dent ment ment sent ment a n d . a n d . W d . a n d . Apnd. U d . 1-11 ------------
m t e or Original AgreeDent8 6/17/58 10/16/59 10/28/60 3/25/61 7/14/61 12/27/61 ll/21/62 1/9/6h 9/29/64 5/26/65 3/21/66
?OW Value ( m u . US$) 2&
mbscco 5.9 cotton 0 Wheat n o u r o Rice 0 Sveetened Conden8ed H l k 0 Dried Mlk 0 Ocean Tran8portatim 0
Planned U8es. mtal (Uill m) Uilitary &dget 2.9 loans to Industry 1.5 U.S. Uaes 1.5
Planned Uaea, Total ()*ill W$)+ 262.6 mli ta ry w e t la! .l Loans to Induatry 52.5 U.S. Uaea 108.0
# Adjusted for ahortfalla. + U S . Kmllara converted t o pia8tera a t applicable rates. Source; Food for Peace Sectim - USA.ID/Saigon. -
H-5- FOOD FOR PEACE- TITLE I IMPLEMENTATION OF AGREEMENTS
STATUS OF US TREASURY AND USAlD ADMINISTERED ACCOUNTS ( M i l l i o n s of P iasters )
I Implementation of Agreements
I Received Disbursed
I Bnlance a t end of year Cumulative bslance
QIR mli ta ry mdget Support Received Maburaed Balance a t end of year Cuarlative bslance
0 99 68 1.309 l.h51 o 91 73 1,198 1,170 ;;gz . ;:gz 8.030
8.695
0 8 - 5 UO 282 - 80 350 665 0 8 3 113 395 315 665 665
Lam8 t o Industry Receipts Diaburaed Ute a t end of year cumulative halance
U.S. Om?* Receipt8 MIuraed a k n c e a t end of year cumulative halance
6 o l d to O111 Agcncie8 thrwgb tbc OYLl Trea8ufy18 Advance Account. Source: M8buraing Office - US Tn~bs8sy/Saigon. -
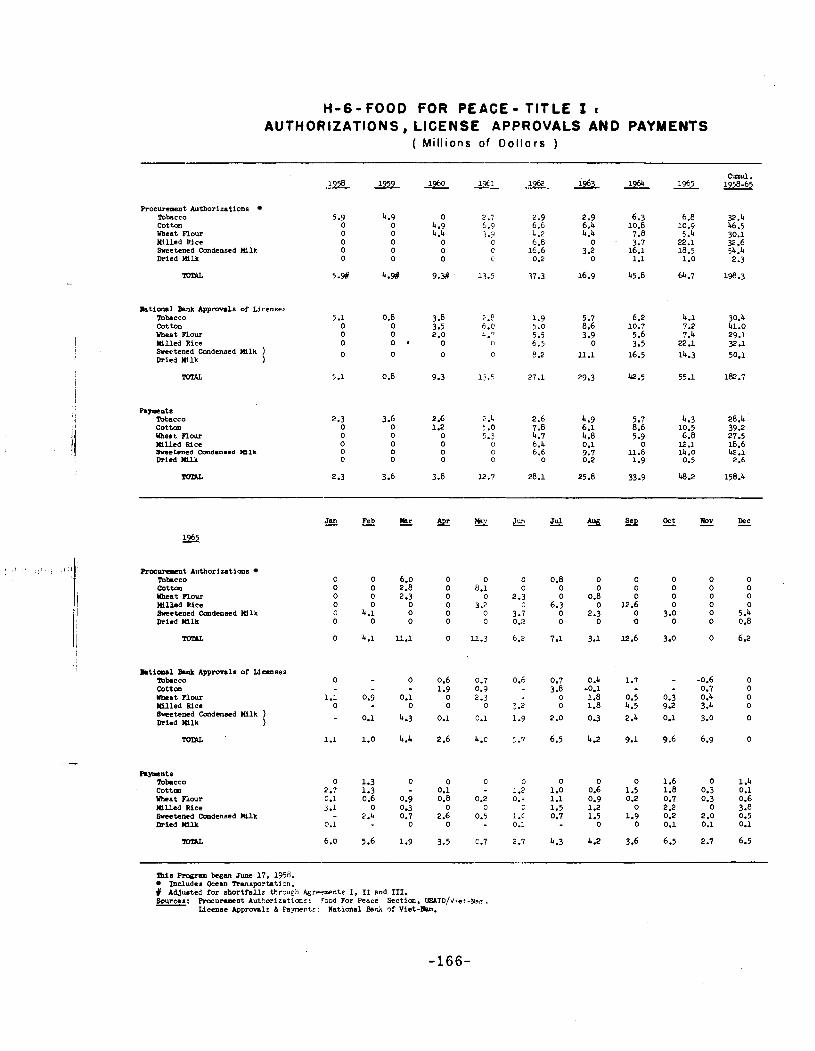
H-6-FOOD FOR PEACE- TITLE I t AUTHORIZATIONS, LICENSE APPROVALS AND PAYMENTS
( Millions o f Do l la rs )
Procurement Authorizaticns Tobacco Cotton Yheat Flour Wl led Rice Sweetened Condensed Milk Dried M i l k
TOTAL
B a t i d Eank Aypronls of Licenses T~bacco Cotton W e a t ?lour Milled Rice Sweetened Cnndureed Milk ) Dried Wlk )
TOTAL
P m n t s lbbacco cot ton m e a t n o u r Mi l l ed Rice Breetened Condensed Milk Dried W k
~ m e ~ . m t Authorizations Tob.CC0 Cot- m e a t R w Milled Rice Brcetened Condensed Milk Dried M l k
latimal Bank A p p m n l s of Licenses mLmcc0 Cotton m a t Flour U l e d Rice Bveetencd Cnndmsed Hilk ) Dried W l k )
Rymenta Tobacco c o t t m Y h a t Flour M l l e d Rice Greetened Condensed I H k Dried W l k
Peb -
0 0 0 0
4.1 0
4.1
0.9
0.1
1.0
1.3 1.3 0.6
0 2.h
5.6
m i 9 ~ o g r u n began ~wle 17, 1958. Includes Ocean Transportat im.
# Adjurted fo r a h o r t h u s t h r s q h A g e e w n t s I, I1 and 111. Sources: Rocurrment Authoriraticnr : Pood For Peace Section. USAID/viet-~rn -
License Approvals k Paynentr: National Benh of Viet-&.
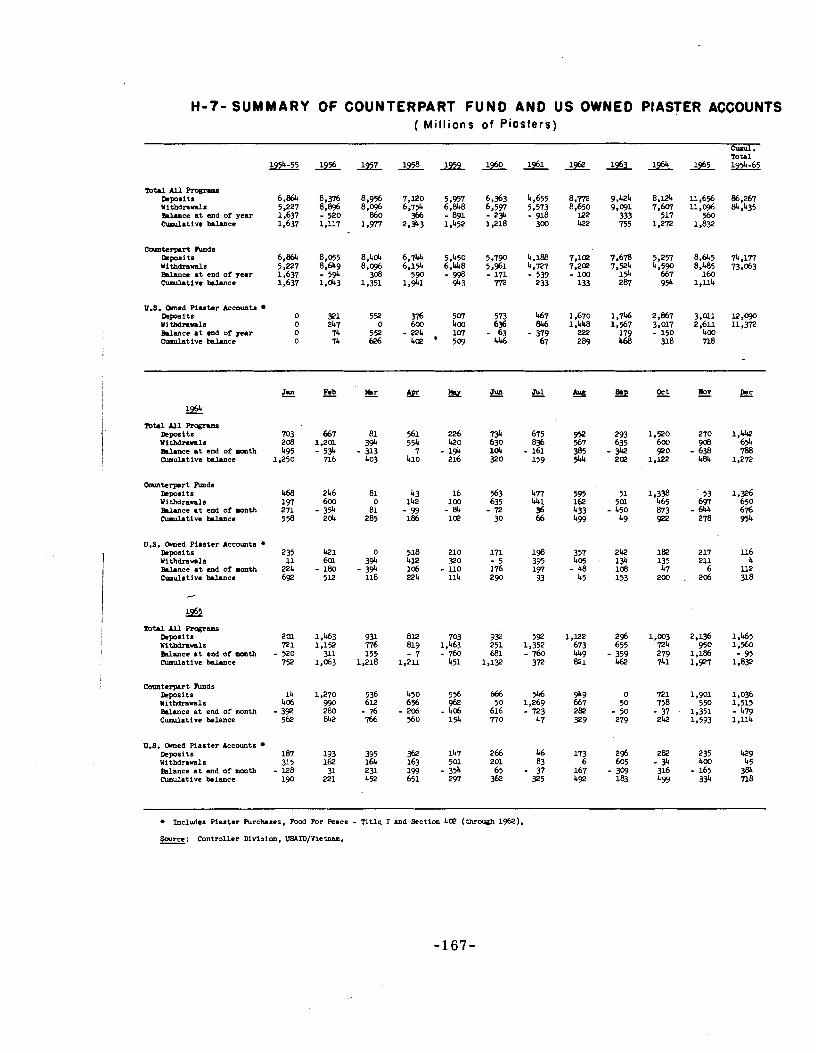
H-7- SUMMARY OF COUNTERPART FUND AND US OWNED PIASTER ACCOUNTS ( Mil l ions of Piasters)
m w m - ~epos i t s 6 - a 8.376 8,956 7,120 5,957 6,363 4,655 8,172 9.424 8,124 u , 6 % 86,267 wi thdnnla 5,227 8 8 % 8,096 6.754 6,848 6.557 5,573 8.650 9.091 7,607 u,W 84,435 u c e a t end of year 1.637 -'520 860 366 - 891 - 234 - 918 122 333 517 560 bnnulative bnlmce 1,637 1 4 7 1.W 2.343 1.452 1.218 300 422 755 1.272 1.832
Carnterprt muds Rposits 6.864 8.055 8,404 6.7U 5,450 5.790 4.188 7.1~2 7.670 5,257 8,645 74.177 witbdmrals 5,227 8.619 8.096 6.154 6,U8 5.961 4,727 7.2m 7.524 4,590 8.485 73,063 Balance a t end of year 1.637 - 59b 308 590 - 998 - 171 - 539 - 100 154 667 160 Cumulative brlance 1,637 1.043 1,351 1,941 943 I72 233 133 287 9 9 l&4
U.S. Omed Piaater Accounts ~epos i t s 0 3?1 5520 g 23 467 1,670 1,746 2,867 3,011 12,090 Y i thdnn l s 0 247 846 1.U 1,567 3,017 2,6ll 11,372 m c e a t end of year 0 74 552 - 224 107 - 63 - 379 222 179 - 150 400 Cumulative balmce o 74 626 4~ 509 4U 67 289 lr68 3 8 n 8
mtd All Rcgnm reposits 703 Withdnnls 208 m c e a t end of nmth 495 Cumulrtive b h c e 1,250
Oarnterprt Rmds Deposits Yithdranls 157 Wlmce a t end of mnth 271 Cumulative blance 558
U.S. Omed Plaster Accounts +
~epos i t s 235 withdrawals 11 U n c e a t end of month 224 ~unulstive balance 692
m w All Rogramn Deposits 201 Yithdrav.1~ 721 Balance a t end of nmth - 520 C d a t i v e balmce 752
Counterpart Punds Deposits 14 Withdmnls 406 U n c e a t end of month - 392 Cumulative b l a m e %2
US. Omed Piaster Accounts reposits 187 Withdrawals 3 5 %Lance a t end of month - 128 Cumulative b lance 190
!!!4
226 420 - 194 216
16 100 - 84 lop
210 P O - l l o l l 4
703 1,463 - 760
451
556 * - 406 154
147 501 - 354 297
+ Includes Plaster Purchases, Food For Peace - Title, I and Sectim 4@ (through I*).
Source: Controller Division, USAID/Vietnam. -
Regular r e f e r s t o counterpart generated a s a r e s u l t of shipnents under t h e Commercial Aid Program. This includes goods coming i n under Procurement Authorizations, Direct Dollars and Triangular Francs. For Procurement Authorizations, deposits .
a r e made a t the time of n o t i f i c a t i o n of shipment; f o r Direct Dollars and Triangular Francs, deposits were made a t t h e time the currencies were granted o r loaned t o t h e Vietnamese Government. A l l deposits a r e made a t the r a t e of VN$ 35 t o US$ 1 with an add i t iona l VN$ 25 t o US$ 1 sur tax s t a r t i n g on January 1, 1962. (see note on Imports financed by US id) Receipts f ron t h i s su r tax t o t a l l e d VN$ 6 , G 4 mil l ion a s of the end of 1965.
Customs Receipts r e fe r s t o the customs dut ies applied t o goods withdrawn from customs under the Commercial Aic! Program p r i o r t o December 31, 1961, except f o r those coming i n under Direct Dollar or Triangular Franc program. Since J z n u a r j 1, 1962 cu~torns rece ip t s a r e no longer deposited i n t ? the Counterpart Fund.
Note: - The data exclude VN$ 947 rnillim r f counterpart generated during 1951-1954 from a i d t o the A s s x i a t e d Sta tes of Indo-China.
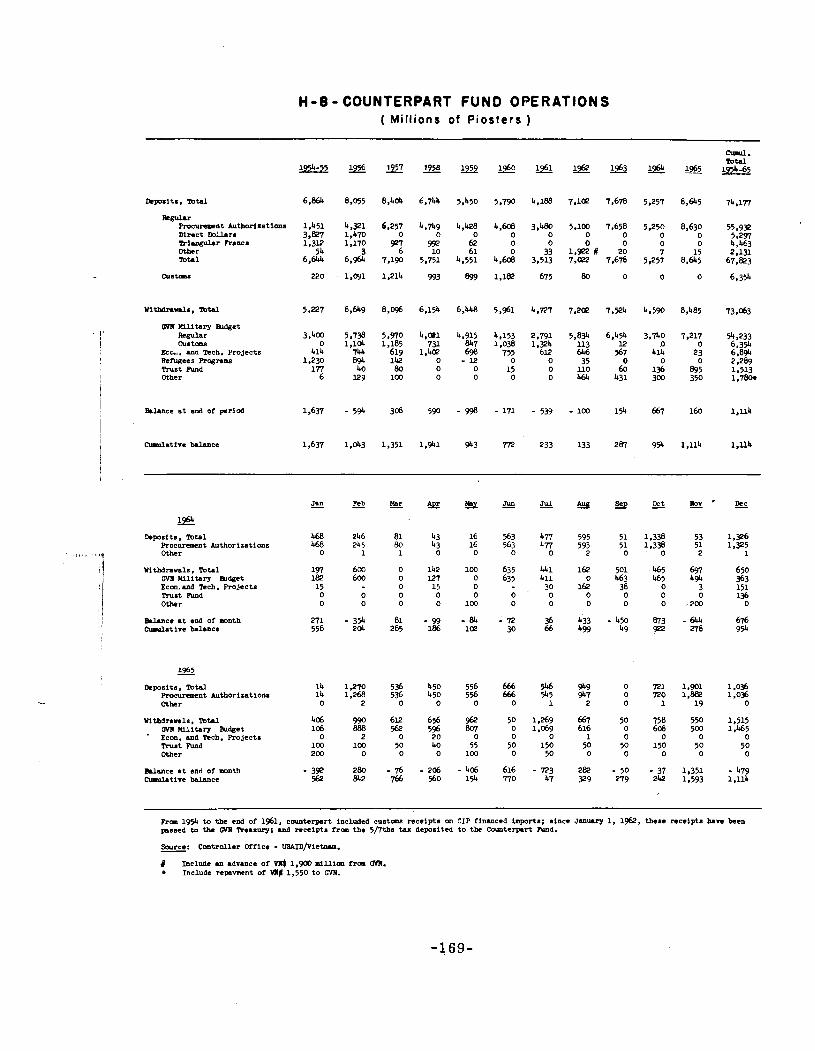
H - 8 - COUNTERPART FUND OPERATIONS ( Mil l ions of P iosters )
~ e p o ~ i t s , mtrl
bgrL.r Ftncurcant Authorizations Direct U r r Trimguhr RMca Other mta1
Cumulative balance
0 35 0 0 l l o 60 0 464 431
Clpul. mtrl 1954-65
74 ,in
55,932 5 - 2 9 4,463 2.131
67,823
6,354
73,063
54,233 6,354 6.894 2,289 1,513 1 ,7-
1.ll4
1,Ub
- P r o c k t Authorizations Other
YitMmwals, Ib ta l CYII military Eudget Econ. and Tech. Projects Trust Fund Other
-ce m t end of month Cumulative brlmce
Deposits, m t d Rocurement Authorizmtions Other
Yithdramls, Tctrl GVR Military mdget Econ. and Rch. Projects ?rust Fund Other
Palance a t end Of DOntb Cumulative bddnce
Feb -
246 245
1
600 600
0 0
- 354 204
1.270 1,268
990 BBB
2 100
0
280 842
Rcm 1954 to tbc end of 1561, counterprt included c u a t m receipta on CIP financed lmporta; aince Jan- 1, 1962, t h e e receipt. h.n k e n pssed to the GVR Treasury; and receipts from the 5/7tha tax deposited t o the Comterprt Amd,
Sauce: Controller Office - VSAlDflietrun. - $ Include M adnnce of VX$ 1.900 million ha0 GVR. + Include repsvment of VI# 1,550 t o ~ Y W .
US-OWNED PIASTER ACCOUNTS
Three types of U.S. -owned p i a s t e r s a r e included i n t a b l e H-9
Sect ion 402 (See Notes t o Commercial Aid i n Table H-1). These sums a r e deposi ted a t t he time of n o t i f i c a t i o n of shipment of t h e commodity, and a r e used e n t i r e l y t o he lp f inance t h e m i l i t a r y budget.
Food For Peace - T i t l e I (See Notes t o Food f o r Peace a i d i n Table - 1 I n Table H-4, t h e t o t a l agreements a r e shown, and t h e amount planned t o be granted o r loaned back t o v i e t i am a r e considered a s a id . 1n t h i s t a b l e , information i s given only on the por t ion t o be granted t o the government.
P i a s t e r Purchase - F i s c a l year 1963 a i d t o Vietnam included an - agreement f o r t h e o u t r i g h t purchase by the U S of US$ 10 mi l l i on of p i a s t e r s . These p i a s t e r s were t o be deposi ted i n t o a s p e c i a l account and used t o f inance the counter-insurgency program.
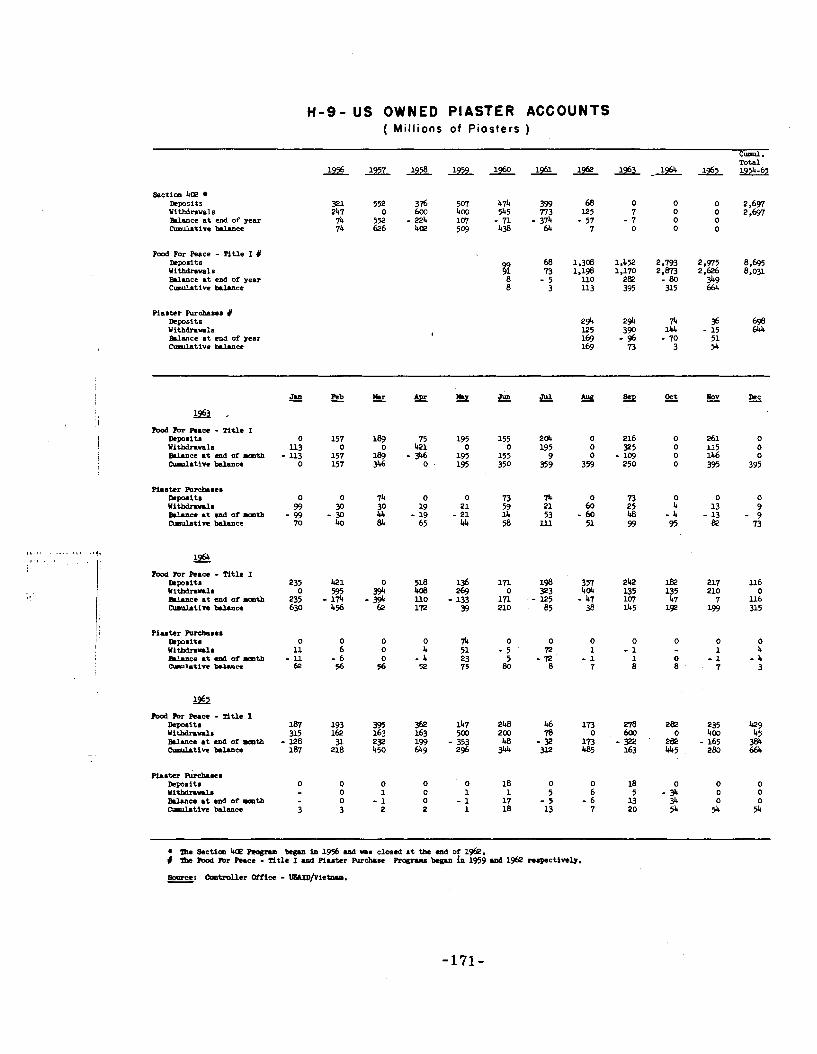
H-9- US OWNED PIASTER ACCOUNTS ( M i l l i o n s of P i o s t e r s )
Bectim 402 Deposits Withdrnval8 m c e a t end of year M a t i v e balrnce
R o d For Race - Title I # Deposits withdnvals Brlurce a t end of year Cmuhtive balrnce
Planter Furchase. # bpoSit8 Withdmnla BLlLIlce a t a d of year W t i v e balrnce
rood IDr mace - 'Hue I DrpDnita 0 157 75 195 155 204 0
0 l? 421 0 216 0 261
Wltbdnvalm U 3 0 0 195 0 9 5 0 115 0 Brlrnce a t end of rmth - U 3 157 189 - 9 0 - 103
? " o . :P 359 359 250 0 146 0
W a t i T Q balm- 0 157 346 0 395 395
Pkmter rnrc&.cn DePoritl 0 W i - n l n 59 sllrnce a t end of rmth - 59 muhti~ balrnce 70
lbod m r Race - Title I Dcpomita 235 witbdmnln 0 sllrnce a t end of rmth 235 - c ~ m u ~ t i r c balrnce 630
rood tor - n u e I Dcpo.itl 167 wi tbdnnln 315 u c e a t end of rmth - 128 cumulative balrnce 187
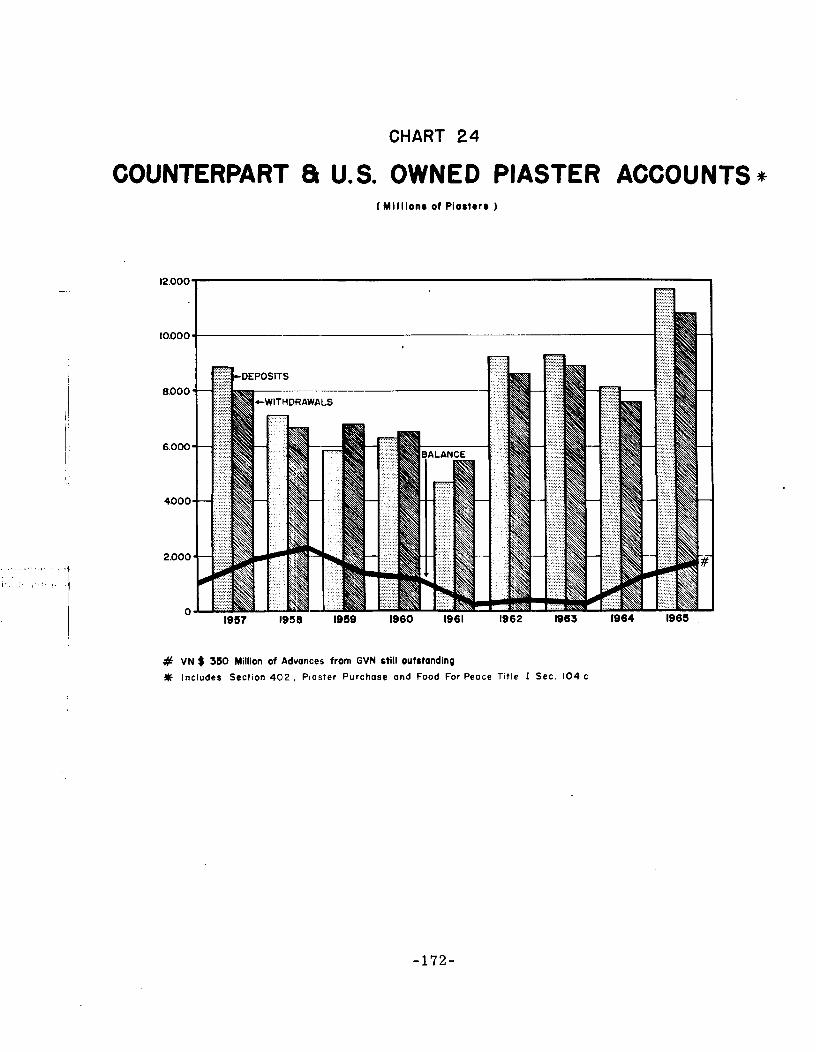
CHART 24
COUNTERPART & U.S. OWNED PIASTER ACCOUNTS * ( M l l l i o n s o f P ias ters )
# VN $ 350 Million of Advances from GVN still outstanding
+ Includes Section 4 0 2 , Piaster Purchase and Food For Peace Title I Sec. 104 c