standardizing the dutch climate adaptation stress test
TRANSCRIPT


Standardizing the Dutch Climate Adaptation Stress test
Thesis at the TU Delft for the MSc degree Civil Engineering –
Watermanagement
By Ingo van Lohuizen
Thesis Committee:
Dr. ir. F. van de Ven (Water Management, Water Resources, TU Delft)
Dr. E. Mostert (Water Management, Water Resources, TU Delft)
Prof. Dr.ir. M. Kok (Hydraulic Engineering, Flood Risk, TU Delft)
Date of publication:
22-08-2018

1
Preface The climate adaptation process and its standardization problem are enormous topics which are almost impossible
to comprehend in one thesis research. While discussing with my supervisor Frans van de Ven, this topic attracted
my attention, not knowing the vast amount of literature and subjects would be broached. I am however someone
who likes context and therefore investigates the whole context of the climate adaptation process. A characteristic
gained by studying spatial planning and civil engineering, two fields of expertise which are highly intertwined and
crucial in understanding both our natural- and social-environment. This culminates in a combination of social,
mostly qualitative, sometimes subjective research and objective technical research. This research is thereby a
predominantly qualitative research discussing spatial- and civil engineering content. There is often no right or
wrong in how to assess and influence a socio-ecological environment as ours, but there is better or worse, based
on our most recent scientific research and current social values.
I tried to investigate how to standardize components within this dilemma and give recommendations, context and
structure for the climate adaptation process as it is currently performed in the Netherlands. This process, as every
research project, asked a lot of time and patience from me and the people around me as they supported this last
phase of my master’s degree.
I have a special thanks to my thesis committee for their feedback, to the water authority Hunze and Aa’s for their
logistical support and my colleagues there for their overall support during these 7 months. I thank everyone for
their support during this last project of my studies!
Ingo van Lohuizen

2
Abstract Due to increasing climate change and its impact on our environment, an increasing amount of policies and
scientific research are focused on climate risk reduction. Recent developments in international and Dutch national
policies (National Adaptation Strategy & Deltaplan: Spatial Adaptation) raised the necessity for authorities to
assess, evaluate and reduce risks posed by the climate on our environment. The assessment of this risk is currently
performed by a stresstest of our environment, concerning heat stress, fluvial- & coastal flooding, drought and
pluvial flooding, followed by a risk dialogue (i.e. risk evaluation) and the creation of an adaptation plan with
adaptive measures.
The goal of standardization is improving unification, which increases comparability, monitoring & evaluation
(M&E) and easier knowledge transfer. The climate adaptation process identifies and evaluates risk to ultimately act
on it. Standardization of the risk approach is thereby focused on creating uniform risk definitions for the different
climate hazards. The standardization exercise performed in this thesis results in directional and not limitative
standards. Standardization recommendations are produced in the form of a standardized stresstest process and
specific risk impact designs defining applicable indicators and standards. A case study and a focus group of process
stakeholders indicate that these designs contribute to the goal of risk comparability, M&E and uniform knowledge
on climate stresstests.
The process undergoing standardization is defined as a risk approach that identifies areas which are
vulnerable to the climatic extremes. Standardization of risks (i.e. stresstest output) is recommended as it creates a
uniform framework wherein decision making on the maximum acceptable risk and the adaptation of our
environment by stakeholders can be achieved. This is in contrast to current standardization practices which
dominantly try to standardize the stresstest input, specifically the hazard component of risk (climatic data). Both
standardization of input and output can complement each other, but it is recommended to create standard
definitions of the climate risks as a combination of hazard- and consequence indicators. Herein both of the risk
components, hazard and consequence are crucial components of the specified risks.
Standardization of the climate risks by defining standard risk types is an analogy on flood risk approach and
the wide collection of international climate vulnerability-/risk assessments; damage-, health- and livability risks.
The interviewed parties (7 in total) agreed on the importance of scientific based cause-effect relationships for
these risks, which can be presented as impact chains. These impact chains can be described by a combination
(such as aggregation of normalized indexes) or different dose-response (economic, utility, mortality) functions for
climate hazard- and one or more consequence indicators. Analysis of the interviews and process analysis
concluded that action perspective is crucial when defining a risk and its impact chain with indicators. When there is
no action perspective present, it is no use in assessing the risk as evaluation of the stresstest results over time will
not show a reduction/change in risk, due to the inability to act. Standardizing the stresstest output (i.e. risk) by
defining the impact chain and its indicators based on proper cause-effect relationships makes it possible to
standardize threshold values and eventually define the required data and input indicators for the stresstest. This
approach of defining risk creates a uniform framework in which stresstest results can be displayed and used for
M&E, based on cause-effect relationships.
The indicators required for risk assessment are highly diverse as they represent climatic, economic,
demographic, institutional, social or physical environment data and characteristics. These can be quantitative- (e.g.
temperature) and qualitative (e.g. road type) indicator types and are often best assessed with different individual
methods. To evaluate or prioritize the resulting risks in one framework, normalization (creation of indexes) is
applied in a case study as a versatile, standardized data processing method for risks and its indicators.
Operationalization in the case study and the focus group concluded that min-max normalization of hazard- and

3
consequence indicators and aggregation into risk indexes is applicable for the climate risks (“hazard”-damage, -
health, -livability) defined in this research. Further aggregation into composite hazard risk indexes or one total
climate risk index were found to be less practical, because crucial information is lost in the process required for
action perspective.
The proposed standardized process design, focused on standardizing the stresstest output by defining the risk
impact chain, was concluded to be a potentially viable new perspective. However, a general view of the focus
group and interviewed parties is that the assessment of consequence indicators could be more difficult, subject to
controversy and was influenced by lack of reliable research which could interfere with correct standardization. It is
a contrasting proposal with current Dutch stresstest standardization practices, which are dominantly focused on
standardizing the hazard input for the stresstest in contrast to defining its output (i.e. risk) as proposed here. The
process design shows clear similarities with the ISO vulnerability assessment guideline; 1) identify cause-effect
relationships, 2) select indicators, 3) select criteria and principles, 4) weigh the risks and normalize, 5) select
aggregation level and 6) include quantitative reference (on data and principles) to the risks. However this guideline
only indicates which steps of the process are important. It does not define ‘how’ these can be standardized as is
done in this research by proposing required cause-effect relationships, indicators, criteria, principles and a
normalization- & aggregation method.
Lastly, a recommendation is given to incorporate standardized risk impact chains in the climate effect atlas
[13]. This could be useful as it is the main climate adaptation platform in the Netherlands which already displays
impact chains through story maps (i.e. reference information). The approach described in this research is also in
harmony with existing climate adaptation approaches such as the “Three points approach”, “Urban Flood
Management” and the Dutch “Weten-Willen-Werken” as they are incorporated in the basic conceptual framework
(Figure 3) of this research.

4
Glossary Abbreviations
DPRA Deltaplan: Spatial Adaptation (“Deltaplan Ruimtelijke Adaptatie”) IPO Input-Process-Output approach M&E Monitoring and Evaluation NBW National Administrative Agreement Water (“Nationaal Bestuursakkoord Water”) 3PA Three points approach PET Physiological Equivalent Temperature UFM Urban Flood Management UHI Urban Heat Island
Definitions
Action perspective Action perspective in climate adaptation can be seen as the capacity of a stakeholder to reduce climate risks by adaptation measures.
Adaptive capacity The ability of a system, environment or actor to change in order to reduce consequences of a hazard [43].
Adaptation The process of changing to suit different conditions [119]. Cope and adjust to new conditions [17]. In this research defined as “the ability to adjust to potential damage, take advantage of opportunities, or respond to consequences” [88] in context of the climate and its effects.
Probability approach In Dutch “kansenbenadering”. Solely based on the chance that an event happens without concern of the subject the event happens upon [2].
Climate “Average weather or statistical description in terms of the mean and variability of relevant quantities (e.g. temperature, precipitation and wind) over a period of time (usually 30 years from WMO)” [88].
Climate adaptation strategy
“… a general plan of action for addressing the impacts of climate, including climate variability and extremes. It will include a mix of policies and measures with the overarching objective of reducing an area’s vulnerability” [5].
Climate change The change of climatic conditions [42], [88]. Climate change scenario “Plausible and often simplified representation of the future climate, based on an
internally consistent set of climatological relationships that has been constructed for explicit use in investigating the consequences of anthropogenic climate change, often serving as input to impact models” [42].
Climate projection A simulated response to a climate scenario by generally using models [88]. Climate stimuli Climate stimuli are climate related physical events, often described as parameters
such as precipitation and temperature, but also runoff or sea level rise [88]. ‘Climate stimuli’ are the characteristics of a physical event and can be a synonym for hazard probability, hazard indicator or physical event in risk approaches.
Composite indicator An aggregated indicator from indicator values of a risk/vulnerability component [88] to get a uniform alignment of indicator values.
Deltaplans In Dutch “Deltaplannen”. A Deltaplan is a national plan, created in cooperation with municipalities, waterboards, provinces and the national government [17]. It is part of the Deltaprogram, a program of the national government which focuses on water safety and enough usable water in the Dutch delta.
Deltaplan: Spatial Adaptation
In Dutch “Deltaplan: Ruimtelijke adaptatie”. It is part of the Deltaprogram 2018.
Exposure Exposure defines and describes the system, environment or actor which is exposed to a certain climatic event (hazard).
Hazard A hazard is a synonym for climate stimuli, impact and physical event/trend in risk

5
approaches. A hazard is defined as the occurrence of a climatic event that has a certain physical impact. The characteristics of a hazard often include probability, extent (scale), duration and intensity (magnitude).
impact chain A specific cause-effect relationship of a hazard (climate stimuli) and consequence combination [96], [88].
Indicator “Quantitative, qualitative or binary variable that can be measured or described, …” [88]. There are indicators for all components of a vulnerability- / risk assessment; climate stimuli, sensitivity, adaptive capacity and exposure.
Normalization “The transformation of indicator values measured on different scales and in different units into unit-less values on a common scale” [88].
Norms A norm or principle can be the synonym of a standard, but is explicitly used in this research as a standardized threshold or boundary condition for indicators.
Hazard Probability The likelihood that a hazard (climatic event) happens is called an event/hazard probability [43], [88].
Regional Regional, as used in this study, is defined as a combination of a rural and urban environment, mainly governed by one or a clear collaboration of municipalities.
Risk Risk is the combination of a hazard and its consequences. The different definitions of risk and vulnerability are explained in paragraph 1.1.5 Risk approach.
Risk approach An approach that identifies and evaluates risks. Resilience norm Represents the maximum tolerable risk. Explained in paragraph 1.1.5 and 3.2.2. Resistance norm Represents the broadly acceptable risk. Explained in paragraph 1.1.5 and 3.2.2. Sensitivity Degree to which a system, environment or actor is affected by climate stimuli
(hazard). This depends on the characteristics of the exposed systems [88]. This can be used as a synonym for vulnerability in risk approaches.
Standardization Standardization is simply defined as the implementation of standards [119]. Standardization aims for unification through implementation of standards. The definition of standardization is elaborated in paragraph 1.1.6 Standardization.
Standards A standard can be an “indicator, norm or approach” and is defined as “a situation or type of behavior that is expected and considered to be typical and a basic feature” [119]. The definition of a standard is elaborated in paragraph 1.1.7 Standards & indicator values.
Stakeholders “Any person, group or organization with an interest in an issue. Sometimes, the term is reserved for well-organized and active groups and organizations, thus excluding general public” [37].
Stresstest A stresstest is a vulnerability- or risk analysis (dependent on the exact definition of both), used in this instance as part of a climate adaptation process. A climate stresstest has some specific characteristics [18]:
Covers a specific area.
Aims at vulnerabilities / risks due to climate change.
Specific attention for vital functions.
Regards parallel developments increasing vulnerabilities (e.g. subsidence due to peat oxidation).
Stresstest input Data and assumptions on indicators used as input for a stresstest to assess climate risks/vulnerabilities. This can for example be precipitation, temperature or water level data, but also demographics or value maps.
Stresstest provider Commonly known as engineering-/project-bureaus which possess the expertise to conduct a stresstest (Deltares, vulnerability analysis). The knowledge portal Spatial Adaptation [120] summarizes a selection of the Dutch stresstest providers.
3PA The three point approach is “a strategy to adapt to new climate conditions” [29]. The strategy is based on three points; 1) Technical optimization by standards, 2) spatial planning and design top cope with extremes beyond the standards and 3) implementing day-to-day values for successful implementation.

6
UFM The process of dialog, design and engineering. The conceptual figure of UFM describes the results of [95].
Vulnerability Degree to which an exposed system, environment or actor is affected by (i.e. risk) and can adapt to the hazard [37].
Vulnerability analysis A “process of identifying and quantifying vulnerabilities” [88]. Weten-willen-werken This is a method used for climate resilient and water robust spatial designs in the
Dutch climate adaptation process [19], [113].

7
Table of contents Preface ........................................................................................................................................................................... 1
Abstract ......................................................................................................................................................................... 2
Glossary ......................................................................................................................................................................... 4
Table of contents ........................................................................................................................................................... 7
1 Introduction ........................................................................................................................................................... 9
Research context .......................................................................................................................................... 9 1.1
Problem statement .................................................................................................................................... 17 1.2
Research questions .................................................................................................................................... 18 1.3
Reading Guide ............................................................................................................................................ 18 1.4
2 Methodology ....................................................................................................................................................... 20
Literature research ..................................................................................................................................... 20 2.1
Qualitative research ................................................................................................................................... 21 2.2
Evaluation................................................................................................................................................... 23 2.3
Design ......................................................................................................................................................... 23 2.4
Normalization and Aggregation ................................................................................................................. 23 2.5
3 Theoretical Framework ........................................................................................................................................ 24
Method....................................................................................................................................................... 24 3.1
Risk approaches ......................................................................................................................................... 25 3.2
Climate hazard- and consequence indicators ............................................................................................ 31 3.3
Norms and principles ................................................................................................................................. 39 3.4
Conclusions on theory ................................................................................................................................ 43 3.5
4 Qualitative Research ............................................................................................................................................ 46
Methods ..................................................................................................................................................... 46 4.1
The stresstest in practice ........................................................................................................................... 50 4.2
Risk evaluation in practice ......................................................................................................................... 60 4.3
Where and how to standardize? ................................................................................................................ 62 4.4
5 Discussion of literature and practice ................................................................................................................... 64
Where to standardize................................................................................................................................. 64 5.1
How to standardize .................................................................................................................................... 66 5.2
6 Designs for standardization ................................................................................................................................. 73
A standard process design ......................................................................................................................... 73 6.1
Impact Chain Designs ................................................................................................................................. 75 6.2
7 Case study: Normalization and Aggregation ....................................................................................................... 87

8
Method....................................................................................................................................................... 88 7.1
Results ........................................................................................................................................................ 98 7.2
8 Stakeholder Feedback Discussion ...................................................................................................................... 113
9 Conclusion ......................................................................................................................................................... 115
10 General Discussion ....................................................................................................................................... 118
Scope of this research .............................................................................................................................. 118 10.1
Climate scenarios ..................................................................................................................................... 118 10.2
An adaptive capacity indicator ................................................................................................................. 118 10.3
A combination of hazard and consequence ............................................................................................. 118 10.4
Similarity with the ISO guideline .............................................................................................................. 119 10.5
Contrast with current national practice ................................................................................................... 119 10.6
11 Recommendations ........................................................................................................................................ 120
12 Bibliography .................................................................................................................................................. 121
13 Appendices ................................................................................................................................................... 126
Appendix A: Interviewee Company Process Diagrams ............................................................................ 126 13.1
Appendix B: Interview hypotheses........................................................................................................... 134 13.2
Appendix C: Elaborated hypotheses from interviews .............................................................................. 136 13.3
Appendix D: Extensive consequence indicator table with references ..................................................... 138 13.4
Appendix E: Value of Human Life functions and values ........................................................................... 141 13.5
Appendix F: WGBT, DI, UHI, SPI, SPEI and SDDI elaboration .................................................................... 142 13.6
Appendix G: Pluvial flood modeling of precipitation events .................................................................... 143 13.7
Appendix H: statistical percentile distribution function .......................................................................... 144 13.8
Appendix I: Applicability of risk assessment tools [122] .......................................................................... 145 13.9
Appendix J: Literature Research Method, Concept Groups/Terms ......................................................... 146 13.10
Appendix K: Literature Research Method, Boolean Terms ...................................................................... 147 13.11
Appendix L: Interview Codes Atlas TI 8 .................................................................................................... 148 13.12
Appendix M: Interview question list ........................................................................................................ 151 13.13

9
1 Introduction Climate change, adapting our environment to reduce its effects and the standardization of these processes are
highly discussed topics with different opinions and controversial subjects. Therefore you will be introduced into
the context of this research wherein definitions are explained in a chronological introduction which will result into
several research questions.
Research context 1.1
1.1.1 Climate change
The effects of the current climate and climate change, the change in climatic conditions [42], is an inescapable fact
in today’s society and environment. The awareness for increased climate change due to anthropogenic influences
is rapidly increasing. Nowadays climate change is thereby also used as a popular term for the increasing climate
change due to our anthropogenic influences. Despite mainstream agreement on the importance of climatic
changes, the magnitude of the impact and how these changes manifest and affect our environment are still
discussed [3], [5], [43]. Research from the Intergovernmental Panel on Climate Change (IPCC) [43] and the Dutch
Meteorological institute (KNMI), however show that it is evident that high water levels, rainfall events, long
periods of drought and increased temperatures in the Netherlands will happen more often and become more
extreme [4].
1.1.2 Climate change adaptation
Even if stringent global mitigation efforts prove to be successful, further climate change will be inevitable [43].
Furthermore, the efforts solely focused on mitigation of climate change effects made “society take low climate
risks for granted” [29]. These reasons drive the need for adaptation; coping and adjusting [17] to adapt our
environment and society to climate change effects [107]. Adaptation is thereby focused on reducing the effects
from “above-normative” events and situations where standards are exceeded and the system can fail.
The incorporation of adaptation in the effort of reducing the climate change risks can be seen as a clear
paradigm shift that started in the 1980’s in European policies. “No longer was adaptation regarded as a ‘fatalistic
strategy’, but as an explicit policy response to manage the unavoidable impacts” [5]. This action became visible in
the form of the Green and White papers of the European Union and from 2005 onwards EU member states started
to develop National Adaptation Strategies (NAS). In the Netherlands this resulted in the Dutch NAS in 2016 and the
“Deltaplan: Spatial Adaptation” [18] as part of the “Deltaprogram 2018” [17] in 2017. In the Deltaplan: Spatial
Adaptation the mission to spatially adapt to climate change was formulated.
In the “Deltaprogram 2018” [17] the top five external developments that can impact the National Deltaprogram
strategies where identified by the Delphi method; 1) increased climate change, 2) technological developments, 3)
energy transition, 4) dynamic and participative social development and 5) the circular economy. The Deltaplan [18]
and previous reports [19], [107] have framed four main climate change hazard and adaptation themes1; pluvial
floodings, fluvial- & coastal floodings, heat stress and droughts.
Pluvial flooding is caused by rainfall events. These rainfall events exist as long-term events (mostly in winter)
or as extreme, short-term events (more in summer). The effects of these events are highly influenced by the sort
of area that is exposed; urban or rural [17], [82]. Urban areas are more affected by short-term events and rural
areas by long-term events due to the systems hydrologic reaction-time [82]. Fluvial- and coastal flooding is caused
by failure of protection works against high hydraulic loads from high water levels in the sea or rivers. Heat stress
1 They are framed as independent themes, but are interlinked as shown by the heat-drought example by Deltares [65]

10
(influenced by temperature, shade, ventilation, moisture, etc.) is a hazard with a low sense of urgency [17], but
nonetheless can be lethal to the vulnerable population (such as elderly people). Drought exists when there is not
enough water of sufficient quality available [17]. This lack of water can be represented by an imbalance between
precipitation and evaporation. Consequences of long-term drought can be; rapid subsidence and foundation
damages, drying up of nature and agricultural loss and water quality problems [17].
1.1.3 Climate adaptation approach
Adaptation can be implemented in different domains such as the
social- (adapt behavior) or spatial (adapt our built environment)
domain. The latter is the focus of this research as it is for the
Deltaplan. There exist different conceptual and practical
approaches for the climate adaptation process of which the Dutch
“Weten-Willen-Werken”2, “Urban Flood Management” and the
“Three points approach” are leading. These can be integrated in
one conceptual approach, represented by the inner circle of Figure
3 wherein all approaches, definitions and frameworks used in this
research can be identified. All three approaches and their
components can be displayed in a linear figure for clarity, but are
by nature always iterative and thus circular (Figure 1).
The “Guide to Spatial Adaption” and consequent policies [107]
approach the spatial adaptation process following the Weten-
Willen-Werken concept from Figure 1 and expands it by introducing
a project-based time-line. The chronological view of this climate
adaptation planning process is shown in Figure 2. This approach
consists chronologically of 1) analysis of the climatic hazards and
system at risk, 2) translation of vulnerabilities and opportunities
into a strategy and 3) implementation of the strategy. The
Deltaplan: Spatial Adaptation [18] aims to accelerate the climate
adaptation process, and reduce location-specific permissiveness by
using this process approach.
Secondly, the Urban Flood Management (UFM) planning-
approach is a framework of dialog, design and engineering as the
result of a study in Water in Triple [95]. It combines three
distinctive approach types into one process approach; scenario-
approach, guiding principle approach and the negotiation-
approach. The design is focused on the water related thematic in
the urban environment.
Lastly, the Three Points Approach (3PA) is a reaction, like
the UFM, to a one-point approach, only formulating and
conforming to standards, as “a strategy to adapt to new climate
conditions” [29]. The strategy is based on three points; 1) technical
2 Translated in English: “Knowing-Wanting-Working”
Figure 2: Chronological view of the
climate adaptation planning process [87].
Figure 1: Concept of an iterative, circular approach
(Modified from [14]).

11
optimization by formulating and meeting standards, 2) spatial planning and design to cope with extremes beyond
the standards and 3) implementing day-to-day values for successful implementation. It gives “some structure” to
the stakeholder interactions in the adaptation process [29].
All approaches acknowledge the necessity of combining social and technical sciences and values in a
climate adaptation approach and thus inherently have to take problem complexity and tacit knowledge into
account [29]. Furthermore they share a combined view of multiple necessary components required for climate
change adaptation.
Figure 3: This is the conceptual framework of this research. The inner circle displays the Climate Adaptation Approach concept by combining UFM, 3PA and weten-willen-werken. The outer circle displays a combined concept of a vulnerability-/risk
assessment from Deltares and the IPCC. Dutch policy as stated in the Deltaprogram 2018 [17] identifies two main components; 1) risk identification (with hazard- and risk analysis) and 2) risk evaluation (with a risk dialogue and adaptation planning).

12
1.1.4 Stresstest
In 2013, the stresstest was introduced by the four coalitions of “Climate Resilient Cities” [113] as a tool to map
climate risks. Several policy documents were released since. One of these, the agenda of the Deltaprogram 2018
[17], stated that every municipality has to complete a climate stresstest before 2020 [17], [99]. This stresstest3 can
be identified as the risk/vulnerability assessment as part of the approach explained in the previous paragraph,
displayed in Figure 3. ISO states that stresstests are “used to identify climate change impact hotspots and to
provide input for adaptation” [88]. It is therefore a “process of identifying and quantifying vulnerabilities” [88]. The
complete stresstest as used in this research is approach- and scenario-based, as an evolution on traditional
scenario-based strategies [8]. It has the following specific characteristics [17], [60]:
Covers a specific geographical area
Aims on vulnerabilities due to climate change
Identify the hazard and consequences under different scenarios
Specific attention for vital functions
Regards parallel developments increasing vulnerabilities (e.g. subsidence due to peat oxidation)
The stresstest as mentioned by Dutch policies and this research is an instrument to identify above-normative
situations which “assesses risk” [8]. It does not, however, prioritize these risks. Deltares altered the definition of a
vulnerability analysis by the IPCC and created a climate vulnerability approach which is displayed as the outer circle
in Figure 3. It can be noticed that this “vulnerability approach” encompasses the vulnerability scan (stresstest) as
shown in Figure 2 by identifying the risk, but also incorporates value judgments and the creation of a protection
strategy which are part of the 2nd
step in Figure 2, “adaptation planning”. The stresstest as defined in Dutch policy4
ends at the “risk map” that identifies risks/vulnerabilities and can be used as input for the decision making
dialogue where these risk are evaluated.
1.1.5 Risk approach
The climate adaptation process builds on a risk-approach for assessing climate risks and/or vulnerabilities. To
adapt, vulnerabilities or risks have to be identified, which involves investigating the sensitivity, exposure and the
adaptive capacity of the systems/people at risk due to the impact of climatic hazards (floods, heat and drought). As
stated in the climate adaptation approach it is necessary to take both social- and technical sciences into account in
a combined (qualitative and quantitative) risk approach to create a risk dialogue that values modern scientific
insights and practices. The different risk approaches will be investigated in this research.
Dutch and international organizations, for example IPCC [43] and ISO [88], substantiate this in how they
approach risk-reduction of climate hazards. The definitions of risk differ for both organizations and change through
time. The risk- or vulnerability approach and the applied definitions are not (yet) uniform defined in global
literature. Most terms can have multiple definitions and synonyms. The next paragraph will state which definitions
and synonyms of risk, vulnerability and their components are present in literature and which are used in this
research.
3 The definitions and use of stresstest, vulnerability/sensitivity analysis/scan/assessment and risk are exchangeable depending on the context and will be explained in the ‘risk-approach’ paragraph. 4 The policy definition is not a precise representation on how practice implements these assessments.

13
Figure 4: Risk and vulnerability definition by combination of the IPCC, ISO, I. Linkov et al., [60] and Dutch policy definitions.
Risk in its most basic definition is a combination5 of a hazard and its consequences. Dutch and international
engineering practice often use Risk = Probability x Consequence [2], [31]. In other literature the definition of risk is
elaborated into Risk = Hazard x Exposure x Sensitivity (R = f{H,E,S}). Here, the probability of a hazardous event is
replaced by the impact (magnitude) of the hazard combined with a division of ‘consequences’ into exposure and
sensitivity. Vulnerability can also be defined differently as IPCC (2014) [43], ISO [88], I. Linkov et al. (2014) [60] and
Dutch policy [31], [82] show. Vulnerability as IPCC [43] stated in their Fifth Assessment Report (AR5) can be part of
risk, where it is a combination of sensitivity, exposure and adaptive capacity. ISO [88] defined Vulnerability = Risk x
Adaptive Capacity (V = f{R, AC}). This ISO [88] definition, as Figure 4 displays, will be used in this research.
Nonetheless vulnerability often refers to a collective term or a combination of exposure, sensitivity and adaptive
capacity, as will be mentioned in the theoretical framework. This will not cause conflict in this research as these
definitions do not interfere as long as it is clear what the definition is. Both have in common that vulnerability and
risk use the same components (hazard, sensitivity, exposure), but vulnerability always includes adaptive capacity.
The separate components of this risk function cannot exist or be defined without one another. For
example; the exposed systems or their vulnerability cannot be defined if the type of hazard is unknown. The
definitions and synonyms of risk, vulnerability and their components are listed in Table 1. These are also displayed
in the glossary.
5 ‘Combination’ is used as terminology as hazard and consequence can be combined in several ways.

14
Table 1: The definitions and often used synonyms of risk, vulnerability and their components.
Term Synonyms Definition Example
Hazard Climate stimuli , impact, physical event
By ISO [88] called climate stimuli which are defined as “the potential occurrence of climate related physical events or trends that affect lives and health as well as property.” A hazard is defined as the occurrence of a climatic event that has a certain physical impact. The characteristics of a hazard often include probability, extent (scale), duration and intensity (magnitude).
Rainfall events with intensity (50 mm/hour), duration (2 hours), probability (once in 5 years) and extent (a city center) or the number of consecutive days with high temperatures/drought.
Consequence Effect The consequence of a certain hazard which entails the exposed systems and to which extent they are affected.
A mortality rate due to flooding or lost harvests due to drought.
Exposure Affected systems, scope
Exposure is defined by the systems, environments and actors that are exposed to a certain hazard (physical event) [43], [88].
“Lives, property, infrastructure, livelihoods, service provision, ecosystems and environmental resources” [88].
Sensitivity Degree to which a system, environment or actor is affected by a hazard. This depends on the characteristics of the exposed systems [43].
Human age affects heat vulnerability; type of material affects damage during a flood.
Adaptive capacity
The ability of a system, environment or actor to change in order to reduce consequences of a hazard [43].
Emergency services with more routes are less vulnerable due to failure of one of those routes.
Vulnerability Degree to which an exposed system, environment or actor is affected by (i.e. risk) and can adapt to the hazard.
Locations at risk with a high adaptive capacity are less vulnerable to that risk.
Two types of risk-reduction can be identified; mitigation and adaptation. Mitigation is widely used to
reduce the magnitude or occurrence probability of a certain hazard. Adaptation tries to reduce the consequences
of a certain hazard by adjusting the exposed systems, reduce their sensitivity or improve the adaptive capacity to
cope better with the hazard. The climate adaptation process focuses on this adaptive risk-reduction, and not
mitigative6 risk-reduction.
Risk approaches that try to cope with rapidly evolving, uncertain7 and more extreme threats, by only
quantifying risk and highly accurate models are not sufficient [36]. It is therefore advocated by social sciences [60],
[83], [87] to supplement the risk approach with a combination of quantitative and qualitative decision analysis
approaches, and incorporation of methodologies grounded in socio-ecological systems (SES). This combined (or
complete) approach can assess risk by combining technical data (indicator values) with decision criteria and value
judgments into a multi-criteria decision model to prioritize risks.
A distinction can be made between reducing the hazardous event from happening and adapting to reduce
the consequences when it happens [31]. Usually in risk approaches, standards are implemented to provide risk
thresholds as is done for fluvial- & coastal flooding in the Netherlands [17]. The broadly acceptable risk norm is
thereby defined by the combination of acceptable probability of a flooding event and its consequences [50] as
shown in the first section of Figure 5. This type of norm can be called a resistance norm, which in case of the Dutch
flooding standards [17], have to be met by law and represent the broadly accepted risk [89]. For some hazards,
6 The Deltaplan: Water safety focuses mainly on mitigative risk-reduction. 7 Uncertainty in decision making is elaborated in the literature research.

15
such as heat and drought these resistance norms do not exist. The Deltaplan: Spatial Adaptation however aims to
reduce the consequences in the case of an event, no matter how extreme, which includes both the normative and
the above-normative situation in Figure 5. But here the question arises “how far do we want to reduce risk when
no resistance norms are given?” Use of (formal or informal) resilience norms (i.e. the capacity to recover from an
event [43]), achieved by solely adaptation measures, could be useful in order to answer this question. The ALARP
method [89] elaborates on resistance-, called ‘broadly acceptable risk’ and resilience, called ‘maximum acceptable
risk’, norms in paragraph 3.2.
Figure 5: The risk line visualizes Risk = Hazard x Consequence with two distinctive development directions; 1) Normative situation, bounded by a resistance norm and 2) events more extreme than the norm [31]. Resilience norms can be used to
determine the acceptable risk in the above-normative situation.
1.1.6 Standardization
“It’s the art of formulating standards, so that they stimulate further development
and immersion in the approach.” [82].
Standardization within the climate adaptation process is ongoing. The Deltaprogram 2018 focuses on unifying
ambition and securing the way vulnerability for multiple extreme events is assessed. The first step of the national
standardization is the “standardized stresstest” from Rioned [76], focused on rainfall events and flooding
scenarios. The International Organization for Standardization (ISO) has also published a concept document for a
standard climate vulnerability assessment [88], wherein the standardization of the process and indicators used in
this process are the main objective. The necessity / goal of standardization can be argued, which will be done in
the ‘Problem statement’ paragraph. Standardization is simply defined as the implementation of standards [119].
Standardization aims for unification through implementation of standards.

16
1.1.7 Standards & indicator values
Standardization and risk assessment literature is based on standards. There exists a multitude of approaches in
formulating standards and can be based on quantitive and qualitative parameters. There exist different types of
standards, such as technical, performance, communication, moral/ethical and legal. This research will focus on
both technical and social (value driven) standards. A standard can be an “indicator (measure), norm (thresholds &
boundary conditions) or approach (model)” and is defined as “a situation or type of behavior that is expected and
considered to be typical and a basic feature” [119]. The NBW-inundation standard is a Dutch norm example which
states how often a certain land cover type can maximally be inundated from the surface water system.
Standardization can aim to compare indicator values, resulting from models to norms [83].
Standardization can thus go deeper than implementing standards as thresholds and boundary conditions (norms),
but also involves making data and parameters comparable to these norms. Every linear process involving input
(e.g. indicators), systems/processes (e.g. approach or model) and output can be conceptualized like an input-
process-output (IPO) approach like displayed in Figure 6. Standardization can be applied on the input, system or
output. Input and output can be indicators or assumptions. This approach can be applied on any system or model
in any form. Standardization can thereby be done by standardizing indicators, value assumptions or approaches.
For example, standardization makes it possible to compare “a rain event with a theoretical return period of 100
years” [29] with the inundation norms. But also unification of data like the “Klimaateffectatlas8” data viewer is an
example of standardization without the existence of norm values. Intensive referencing in policy documents made
this a standardized data source [24], [99].
Figure 6: A conceptual display of an input-process-output (IPO) approach which displays components that can be standardized in a process.
Data and parameters can be represented by indicator values; “a quantitative, qualitative or binary
variable that can be measured or described, in response to a defined criterion” [88]. There are indicators for all
components of the complete risk-analysis; climate stimuli, vulnerability, exposure and adaptive capacity. “The
objective of applying indicators in a vulnerability assessment is to estimate and evaluate effects of climate change
on vulnerability dimensions, by comparing indicator values against critical thresholds” [88]. But, “often,
quantitative information does not exist and/or thresholds (standards) are not defined. Then, evaluation of
indicators will depend on value based, and often qualitative, expert judgements” [88]. Indicator values can thus be
quantitative and qualitative. Standardization of these indicators can be performed by, for example, allocation of
these values into uniform scales.
Quantitative examples of indicator values are the number of nights above a certain degree, the frequency
of a rainfall event or population density, which are based on interval or ratio data. There exist qualitative metrics
[indicators] which can be ranked as ordinal and nominal data, such as culture, environmental awareness,
community sensitivity, ethics and value of vulnerable persons [1], [83]. These are often indirect measurement
methods (or proxies) and sometimes aggregated indicators because “direct measurement of social value is often
very difficult)” [83]. The latter, is as earlier stated a rapidly evolving field of science where practice shows that
social factors are largely absent in existing risk-based planning [3].
8 The Climate Effect Atlas has publicly available data and serves as a centralized data source for maps relating to climate change and its effects.

17
Problem statement 1.2
1.2.1 Goal of standardization
Standardization and legalization of water safety is imbedded in Dutch culture. This is for example displayed by the
‘Waterstaatswet’ from 1900 [51] and its predecessors and all its updates since such as the “Waterwet” shows. In
contrast, Dutch practice (Triangulation interviews, 2018) shows skepticism towards the term ‘standardization’ as it
implies implementation of standards/norms forcefully implemented from national government through
bureaucracy. However, the demand for standard indicators, norms and models is also clearly visible as for example
the reaction of the Dutch Water Authorities to the “Guideline Standardized Stresstest Light” [24] mentions the
demand for standardized design criteria as input for the stresstest. The partial delivery of these standard norms
and indicators by the Rioned Stresstest Rainwater [82] and the questions from municipalities in how far they need
to adapt to extreme climatic events and which indicators, models and thresholds they have to keep in mind
(Triangulation interviews, 2018) substantiate this. Standardization is not by definition negative or positive, but is a
tool serving certain goals and has its pro’s and con’s depending on these goals. Formulating standardization
through norms influence behavior and the consequences of this behavior [83]. When wrongly applied,
standardization can have a negative influence on the achieved goals. Defining the goal and standardization that
supplements it is thereby crucial.
Standardization as unification is an important method to allow extrapolation over time and space [83],
[99]. Using standardized components (indicators, thresholds, models) has several benefits; use proven research
and methods, increased comparability, easier knowledge exchange and national monitoring and evaluation (M&E)
is possible [17], [82]. When an authority (e.g. water authority, province) wants to manage climate adaptation
processes or do M&E on a different time- or spatial scale than other authorities it can be worthwhile that these
processes and results are in a standard format. Lastly and most importantly, standardization is a way towards risk-
reduction of threats by regulators and policymakers [60].
However, standardization can be seen as generalization, which does not mean that extensive
simplification based on assumptions should be allowed [82] to make extrapolation outside the applicable range
possible. Also, by using local data (micro-data) but generic models, complexity is reduced and only macro solutions
are the result [29]. This way of generalization reduces the value of the results and thus the value and usefulness of
an adaptation strategy. The implementation of national norms as thresholds on for example consequence-
reduction of flooding could not be applicable due to the local characteristics (exposure and sensitivity) that define
this threshold.
From an evaluation of the Deltaprogram in 2016 it was concluded that there is still a high degree of
permissiveness and discretion on local government levels, big differences between regions in their spatial
adaptation and a high diversity among stresstest providers [18]. One of the reasons could be that, as shown in an
Australian case study, that the lack of appropriate standards from higher levels of government allowed too much
discretion9 in local governments. Reducing this permissiveness, by forming standards through stakeholder dialogue
[3], can be seen as a goal when the urgency for climate adaptation increases [17] based on the climate projections
[4], [43].
9 Discretion is another word for consultation or deliberation.

18
1.2.2 Research goal
The diversity in climate adaptation stakeholders, enormous diversity in norms/standards, indicators, models and
risk definitions, calls for a way of standardization in spatial climate adaptation methods and practice. This is
initiated and partially answered by the first standardized stresstests by the national government [24], [107] and
Rioned [82] by standardizing the climate data required for the stresstest. However, the process doesn’t necessarily
have to start there or stop there as demand for a risk dialogue within the complete climate adaptation process
“that goes beyond pure technical aspects” [29] drives the need for an integrated (quantitative and qualitative)
view on standardization. Furthermore, the stresstest results identify risks, but do not however, give value
judgements of these risks, nor prioritize actions into a strategy [99].
This research tries to create a standardized design for the climate adaptation process components as
endorsed by ISO [88] and Gloudemans et al. [31]. This is done to make extrapolation over space and time and
benchmarking10 possible. Within this research the standardization of the risk dialogue on the climate extremes, and
its norms & indicators will be dealt with. The risk-dialogue, hazard & consequence, will be addressed, with regard
to social and technical indicators. This research will give an overview of currently used risk approaches, indicators
and norms in Dutch practice and scientific literature to a standardized process design of the stresstest. The process
design recommends where and how to standardize.
Research questions 1.3To achieve a standardized process design this main research question is answered: How and where in the Dutch
climate-adaptation approach should be standardized, focused on heat stress, drought, pluvial-, fluvial- & coastal
flooding?
1. What does literature say on risks, indicators and norms of the climate hazards? a. Which risk-approaches exist? b. Which indicators are used for climate hazards and -consequences? c. Which norms (standards) are formulated for these indicators?
2. Which standards are implemented in practice by expert stakeholders and what part of the climate adaptation process should be standardized?
a. Methods/processes b. Indicators c. Norms
3. What are the similarities and differences between theory and practice? a. Methods/processes/approaches b. Indicators c. Norms
4. How and where in a climate-adaptation process is standardization possible? a. Where to standardize? b. How to standardize?
5. Are normalization and aggregation usable as a standardized data processing method for the climate risks?
Reading Guide 1.4Chapter 2 describes the methodological approach of this research. Chapter 3 will display the theoretical
framework discussing research question 1 based on a literature research. Chapter 4 will display and discuss the
qualitative research results from interviews, document analysis and process analysis, answering research question
2. Chapter 5 will evaluate and compare the results from literature (chapter 3) and practice (chapter 4), providing
answer to research question 3. Chapter 6 will display a standardized process design and specific impact chain
10 A benchmark is a set of standards that can be used as a point of reference for evaluating a quality level.

19
designs concluding question 4. Chapter 7 provides a case study on the applicability of the normalization and
aggregation method for the identified risk impact chain designs. Discussion on the normalization and aggregation
method and the designs is displayed in chapter 8 and answers research question 5. The general conclusion and
discussion of this research are respectively given in chapter 9 and 10. Lastly, recommendations are given for
follow-up research and future policy in chapter 11.

20
2 Methodology
“The nature of the question at hand requires a new type of research programs in
which the relation between science and policy has intensified” [29].
Science and policy become more intertwined and paves the way for more research on values and norms with a
scientific and practical basis. This creates the need to have a combined technical- and social sciences approach.
Therefore semi-qualitative approaches for research, design and data processing methods are used. Table 1 displays
the research methods used for each research question. The paragraphs will elaborate shortly on these methods.
Table 2: Research questions pared with the research methods.
Research Question Literature Research
Qualitative research Evaluation Design Case Study “data
processing method”
Document analysis
Expert Interviews
Focus Group
Literature on indicators, norms
and methods
Theory
Indicators, norms and methods in
practice
Interviewed parties
Interviewed parties
Comparison of literature and
practice
Criteria & discussion
How and where to standardize
Feedback discussion
Develop design
Usability of normalization and
aggregation
Feedback discussion
Normalization &
Aggregation
Literature research 2.1
2.1.1 Desk review
The desk review is the first interaction with literature concerning the research topic. This is used as a triangulation
method to identify the research- introduction, problems, questions and context, forming the basis of the
introduction chapter. This was supplemented by triangulation focus groups. These triangulation focus groups were
climate adaptation meetings from stresstest pilot projects in Groningen, Stadskanaal, Veendam and Leeuwarden.
These were attended for the whole duration of this research with a total of 8 meetings.
2.1.2 Literature research
The literature research resulted in the theoretical framework, which answers the first research question. The
literature is divided in an international literature research and a practical report research from major Dutch
knowledge parties. Both analyze risk-approaches, indicators and norms for the climate risks.
ScienceDirect.com [121] is used as the main source for international literature. The use of one advanced
search engine makes reproduction of the applied search method less complicated. The literature is assessed by its
relevance to the topic. The following search strategy is used:

21
1) Concept groups, displayed in appendix 13.10, are created for risk (societal, economic, individual),
indicators (heat, flood, drought) and norms (heat, flood, drought) and for every concept group terms and
synonyms are identified based on the introductory references and presence in the research questions;
2) A search term with Boolean operators, based on these concepts and terms, is created to be used in the
search engine with its operators is created. These Boolean terms are displayed in appendix 13.11Appendix
K: Literature Research Method, Boolean Terms. With this search term and ScienceDirect.com the
literature search is started. The search results are reduced by;
3) A personal scan that checks if the title has a connection to the researched topic;
4) A availability check of the papers;
5) A relevance check by reading the abstract.
Qualitative research 2.2
Adaptation measures “cannot be calculated by water practitioners in a desk study
alone” [84].
Identified Risks and Adaptation measures to reduce emerge from interaction of a wide variety of stakeholders [84].
Qualitative research is chosen as the method for gathering data from the stakeholders. Three methods are used to
extract information from practice; expert interviews, document analysis and process analysis. A focus group is used
to discuss the resulting designs of this research for feedback.
2.2.1 Document Analysis
The document analysis summarizes the available documents concerning the stresstests from six engineering
companies including the Climate Adaptation Services (CAS). These summaries try to identify the used approaches,
input- and output indicators and norms from practice. They are the basis for the process analysis and interviews.
The summaries provide elaboration and references on the resulting process diagrams from process analysis.
2.2.2 Process analysis
For each interviewed party a process diagram is created including all indicators, norms and methods known to the
researcher by document analysis. The process diagrams are built based on the IPO approach in Figure 6, where
indicators can be input or output. Pathways, if known are created between these indicators and systems / models.
The whole process can be scaled, where a single IPO segment can be combined with another into a bigger
segment, creating a tree diagram. The existing norms/guidelines for every node (indicator or method) are
indicated in the diagrams when present. When a hazard indicator is input for a model these are called primary
hazard indicators. The output hazard indicator is called a secondary hazard indicator.
2.2.3 Expert Interviews
The semi-structured interviews [12] enables to gather more tacit knowledge, extend and elaborate on the
document summary and provides insight in the parties view on the research questions. 7 interviews [12] were
conducted with engineering companies and 1 interview with an educational institute. The results will be based on
the 7 interviews with engineering companies. The interview with J. Kluck from Amsterdam University will be used
as scientific substantiation by adding the most recent knowledge and views from that institute into this research.
Table 3 on the next page gives an overview of all interviews performed for this thesis.

22
Table 3: This table displays an overview of interviewed parties and date of interview.
Provider Contact person Date
Sweco Martijn Steenstra 10-04-2018
Aveco de Bondt Simon Troost 03-04-2018
Witteveen + Bos Leon Valkenburg 06-04-2018
Nelen & Schuurmans Cees-Anton van den Dool 28-03-2018
Arcadis Robert de Kort 19-04-2018
Climate Adaptation Services (CAS) Hasse Goosen 10-04-2018
Tauw Jeroen Kluck 13-04-2018
Amsterdam University of Applied Sciences Jeroen Kluck 13-04-2018
Based on the subsequent introduction, theoretical framework and document analysis a question list is
produced to semi-structure the interview. This is done by following the method in chapter 8 of Key Methods in
Geography [12, Ch. 8]. This question list is available in Appendix 13.13. The question list is divided in a stresstest
(risk identification) and risk dialogue (risk evaluation) part, consistent with the conceptual framework in Figure 6.
The interviews are recorded and directly afterwards notes are taken to capture the tone and key themes
of the interview. The recordings are systematically, but goal oriented transcribed. This means that not every word
is transcribed, but only the parts that are useful for answering the research question. The sentences are also
transcribed in readable sentences, and not the actual word combinations used in the interview, as these can be
incomprehensible for persons that were not present at the interview. The transcriptions are not included as an
appendix to be publicly available, but can be provided by the researcher and agreement of the interviewee.
Both the interviews and document analysis summaries are analyzed with Atlas TI 8. The analysis is done
by using a coding technique wherein the interview is dissected into key information components by coding. Coding
is done by selecting key terms, their components and synonyms, roughly coinciding with key terms from the
literature research and research objectives. The codes used in Atlas TI 8 are displayed in Appendix 13.12. The
resulting key components are then exported to excel and evaluated by consensus and priority as Appendix 13.2 &
13.3.
2.2.4 Focus group
For feedback on the designed standardize diagrams and the normalization & aggregation method, a focus group is
used. The focus group is semi-structured [12]. Before a 1 hour discussion on the results a presentation is given of
these results. Audio recording of the focus group is mainly done as an outsider that tries to engage as little as
possible in the discussion. The researcher can however steer the conversation towards topics discussed. Table 4 on
the next page summarizes the participants. Sweco is included as a participant because they provided the model
output products used in the case study and performed the recent stresstest for the case study area Groningen and
Ten Boer. They therefore communicated intensively with the stakeholders involved in this stresstest and can have
a useful vision on the produced case study results.

23
Table 4: This is a stakeholder overview of the focus group participants.
Contact person Organization
Martijn Schuit Municipality of Groningen
Karel Veeneman Water authority Fryslan
Meinte Blaas Rijkswaterstaat
Carolien Bouwense Province of Groningen
Wilfried Heijnen Water Authority Hunze en Aa’s
Martin Haan SWECO
Evaluation 2.3As stated in paragraph 2.2.3 the resulting indicators, norms and methods are semi-quantitatively evaluated mainly
by priority and consensus between stakeholders and between practice and literature. More on this method is
given in chapter 5.
Design 2.4This research aims to design a standardized process framework and specific risk impact chains, including both
social and technical indicators used in the risk-narrative of the climate adaptation process. This is executed by
creating standard process flow diagrams with the IPO approach, the same method as applied for the company
process diagrams in appendix 13.1.
Normalization and Aggregation 2.5ISO [88] and the Guide to Data Analysis [72] show that the method of normalization and aggregation of indicators
for the purpose of standardizing the vulnerability- or risk assessment can be a useful data processing method.
When combining social and technical indicators, the diversity in data types makes normalization a method wherein
prioritizing and standardization possible. Normalized indicators can be used for statistical methods like extra-/
interpolation, regression analysis and benchmark or comparison studies. These are all objectives within the scope
of M&E, a primary goal of standardization. Subchapter 7.1 will further elaborate on the practical steps of the
normalization and aggregation method.

24
3 Theoretical Framework
1) What does literature say on risks, indicators and norms of the climate
hazards?
Within policy, climate extremes, their impact and the need for adaptation are widely recognized. However, the
recognition of climate extremes far outpaces studies specifically focused on this highly-recognized aspect of
climate [90], [96]. Thereby, several themes in this literary framework are more elaborated than others due to
sometimes limited available research or tangible results.
Climate change adaptation is dealing with multiple risks, which makes the context of climate change a
multi-hazard risk context. The use of multi-criteria, -variate or -hazard approaches are common and extensive as
[45], [61], [90], [103], [23] and their references display. These “multi”-approaches can make use of both
quantitative and qualitative indicators and methods.
Within the risk dialogue, the consequences of an extreme event can normally be represented by ’Loss and
damage’ which, “is an emerging concept in the field of climate change adaptation and disaster risk-reduction.” [28]
This is substantiated by Kok et al. (2017) [50] as composite risk-approaches emerge such as the Dutch water-safety
standards for dikes. The adaptation objective even goes beyond pure risk-reduction, acknowledges that damage
and loss are unavoidable and that social values like comfort and environmental value have to be taken into
account. This creates more challenges that are not incorporated in present methods or policy and which ask for
creative combination of the already available tools.
The literature research tries to answer the first research question displayed above. The first subchapter will
display the methodology used for acquiring these answers. The subsequent subchapters 3.2, 3.3 and 3.4 will
elaborate on the individual components of risk assessment and –evaluation by addressing a) existing risk
approaches and –types, b) indicators for the hazards, consequences and/or risk and c) norms for these indicators
and risk types.
Method 3.1The literary research consists of two components. The first component consists of an online international literature
research supplemented by a check for useful references found in the desk-review literature, used as input for the
introduction chapter. Both components are combined in the literary framework. The second component consists
of a report11 research from major Dutch knowledge parties12.
The main database source for the online literature research will be ScienceDirect.com with the digital TU Delft
library access. The literature is assessed on their relevance for the topic. After this initial search personal judgment
of the references of this literature is done. The following search strategy is used;
1) From the initial desk review, concept groups, terms and their synonyms are identified. These are shown in
appendix 13.5, divided in three main topics; Societal, Economic and Individual.
2) A search term with Boolean operators (see appendix 13.11), based on the concept, their synonyms, and
terms, is created to be used in the search engine. The relevant terms and synonyms have to be in the title,
11 No new literature is assessed when already found in the literature research or desk review. 12 STOWA, Deltares, Alterra, KNMI, Rioned, CAS

25
abstract or keywords of the article/journal TITLE-ABS-KEY() and the literature has to be published after
2011.
3) A personal scan if the title has a connection to the researched topic and an availability check reduces the
amount of useful literature to 15 for risk approach, 26 for indicator literature and # 26 for norm literature.
4) The literature is judged by reading their abstract which leaves a total of 10 results for risk approach
literature, 21 results for indicator literature and 20 results for norm literature.
The relevant literature on indicators and norms can be categorized on hazard type. A lot of international
literature was found on the heat stress hazard and multi-hazards and less on the other three hazards. This is
however not strange as table 1 of another literature review on this subject [96] shows the same literature division.
Dutch literature however, has more focus on flooding and drought hazards.
Risk approaches 3.2The introduction and research context already defined risk as a function [47] of hazard and its consequences,
which is a uniform definition throughout practice and literature. However, a couple of varieties on labeling,
calculation methods and assumptions are imaginable as Equation 1 [16] and Equation 2 [63] display. Thereby,
there is no mathematical sign defined in the general risk definition, which allows for different calculation
(quantitative) or assessment (semi-quantitative) methods.
Equation 1: Risk equation [16].
∫ ( ) ( )
Equation 2: Risk equation [63].
∑
Where r = risk, P or p = climate/failure event probability and d or S = quantified consequences for a set of
input conditions (x) or scenarios (i).
From 1993, Risk = Probability x Consequence was introduced in the Netherlands as the primary safety
concept of the total risk for floods [63], but is also generally accepted in international literature. A general
approach towards risk is visible throughout literature [63] where 1) hazard probabilities are calculated, 2) risks are
assessed and 3) evaluation of risks is performed. This is in line with the vulnerability assessment approach from the
introduction (paragraph 1.1.3 and Figure 3) resulting in a 1) hazard map, 2) risk map and 3) hotspot map. This
general approach frames the structure of the next three subchapters.
3.2.1 Probability analysis for a hazard map
Hazard identification is done by mapping hazards, which consists of determining the “extent or severity of hazards
for a range of exceedance levels” [110]. Thereby hazard mapping consists of hazard severity identification, often
performed by physical-based models, in combination with probability analysis. In climate hazard identification the
only certainty is uncertainty and therefore a range of scenarios and/or a statistical analysis of past events are used
to identify a “fitting” hazard severity, but this is, due to the nature of scenarios, never a fixed value. Event
probability (P), with a certain severity can be calculated with Equation 3.

26
Equation 3: Basic probability equation.
Where P = probability13 and T = return period. A graphical way of presenting the probabilities for a series
of event impact- or consequence values is a probability density function (pdf) [47], [110]. This is applicable on any
probability function and many forms op statistical distributions for a pdf exist, with the normal distribution as the
most famous.
There exist two “different views as to the meaning of probability. Two of the most important are the
frequentist and the Bayesian interpretations. In both, probability is a figure between 0 and 1. A value close to 0
corresponds with a small likelihood, and a value close to 1 with a large likelihood. There are however important
differences between frequentist and Bayesian interpretations” [50]. A frequentist interpretation determines
probabilities based on a long series of identical independent experiments. A Bayesian interpretation states that
the probability of an event is a measurement, determined by the knowledge at our disposal (objective or
subjective). The uncertainty in the determination of the probability as a measurement is thereby assumed to be
irrelevant [50]. The Bayesian interpretation is generally used in risk assessment of socio-environmental systems
due to a limited series of events, as is the case in the climate adaptation process [50], [47], [63].
Another process phase where to deal with high uncertainty, instead of probability analysis, is within
decision making. S. Hallegatte, one of the lead authors of the 5th
IPCC report [42], stated that “uncertainty in future
climate makes it impossible to directly use the output of a single climate model as an input for … design, and there
are good reasons to think that the needed climate information will not be available soon” [36] or ever. The reasons
are not defined, but it can be argued that uncertainty for future climate scenarios will stay as we cannot
completely predict the future. Detailed models will not reduce this uncertainty, but can give more accurate
predictions of the different possible scenarios. Therefore it is advocated in this paper [36] to deal with climate
uncertainties in the decision making process, by applying for example ‘no regret’ measures or use robustness
indicators, instead of waiting for more detailed climate models.
Lastly, hazard maps are time-dependent [118] and influenced by external (outside the study area)
parameter input [114]. “Given that both the extreme external loading and the urban drainage routing vary with
time, the hazard map also varies with time” [118]. Thereby specifying the point in time of the maximum hazard
impact is preferred.
3.2.2 Risk assessment techniques and 3 risk types
Techniques
After hazard probabilities are mapped in the subsequent chapter, risk assessment, including consequence
identification is addressed. A multitude of risk assessment techniques exist of which the ISO/IEC 31010 guideline
[122] gives an extensive overview of internationally accepted risk techniques. Most of these techniques arose in
industrial safety engineering and appendix 13.9 gives an extensive table of risk techniques and their applicability
for assessing consequences, probabilities, risk level and risk evaluation. Risk assessment methods can be
qualitative, semi-quantitative or quantitative.
13 “Probability (P) differs from frequency (f) as: 0 ≤ P ≤ 1 and 0 ≤ f ≤∞. For values of P and f that are much smaller than 1, close to 0, probability
and frequency can be used interchangeably.”[47]

27
“Qualitative assessment defines consequence, probability and level of risk by significance levels such as
“high”, “medium” and “low”, may combine consequence and probability, and evaluates the resultant
level of risk against qualitative criteria” [122].
“Semi-quantitative methods use numerical rating scales for consequence and probability and combine
them to produce a level of risk using a formula” [122].
“Quantitative analysis estimates practical values for consequences and their probabilities, and produces
values of the level of risk in specific units defined when developing the context” [122]. This method is
hard to correctly perform in socio-environmental risk assessments and is therefore often used as an input
for semi-quantitative or qualitative assessment.
The risk assessment techniques from the ISO/IEC 31010 guideline [122] are substantiated or reduced by
other literature, based on the applicability to climate risk assessment. Several techniques are not applicable.
Failure Mode Effect & Criticality Analysis (FMECA), Event Tree Analysis (ETA) and Fault Tree Analysis (FTA)
assessments are for example used to identify the sequences in which components or systems can fail their design
intent. These are not applicable, because in climate risk adaptation, it is given that a system fails its design intent.
The process hazard analysis (PHA) technique focuses solely on the hazard, which is not sufficient in a risk function
consisting of hazard and consequence. Cause-Consequence Analysis, Cause-Effect Analysis, Risk Control
Assessment (RCA) and Layer of Protection Analysis (LOPA) are focused on identifying causes of failure, while these
are generally already given in the climate adaptation process. The well-known Hazard and Operability Analysis
(HAZOP), studies how hazards arise where unexpected outcomes are traced back to first unknown threats or
failures. When the hazards are already clearly defined, it is not useful.
From the collection of techniques a few are however generally accepted and, often in combination,
applicable for identifying climate risks [47], [89], [91]. A general Quantitative Risk Assessment (QRA) is systematic
risk quantification for people and the environment. A globally popular quantitative risk approach, applicable for
climate risk assessment, is ALARP (As Low as Reasonably Practicable). The key to ALARP is its holistic approach.
ALARP is useful when no absolute thresholds or criteria to risks can be set and wherein different tools and
quantification methods can be used. Figure 7 displays the acceptance level of residual risk and the implementation
of a resistance (broadly accepted risk) and resilience (maximum tolerable risk) norm. The figure and holistic ALARP
approach [91] are very similar to the risk graph in the introduction that indicates the normative and above-
normative situations and the questions that arose from it; “How far do we want to reduce risk?”
Figure 7: ALARP triangle [89] that indicates the amount of negligible-/acceptable- or residual risk.

28
Next to quantitative-, two popular descriptive assessment techniques, applicable for climate risk
assessments are highlighted:
Brainstorming by focus groups of experts. The DELPHI method is one version of this technique
and consists of anonymous, but simultaneous, brainstorming of experts.
Scenario Analysis (SA) identifies possible future scenarios, based on the present state of affairs
and different future developments that might occur. The result is often a set of scenarios ranging
from best case to worst case and is produced by considering larger time periods (e.g. 25 years).
A Bayesian Decision Network (BDN), or Bayesian Network (BN), is a statistical, graphical, modeling
approach with Bayesian principles integrating probability theory and decision theory by expressing conditional
dependence between variables [10]. A BN’s most valuable ability is dealing with limited factor information and
their uncertainty by using the interactions in the network to enhance understanding of the limited information.
Next to the Bayesian interpretation, an accurate expression of risk in socio-environmental systems should
include a time dimension. However, many studies like [63] neglect time out of practicality, by using a deterministic
approach with flood scenarios (descriptive) and –damage quantities (quantitative). This is however justified,
because “in a calculation where the goal is to compare risks, the time aspect is, intuitively, not of great
importance. Taking into account future years enlarges the calculated risk, but this will happen in the same way for
all alternatives. The results of the comparison will remain the same” [63].
Integrated approaches of the techniques exist. This integration can be seen in multiple case studies
throughout the literature study (e.g. [58], [63], [118]). Probability calculation is always present, but can be
differently combined with for example the use of scenarios as PDF’s show [47]. Herewith not all possible outcomes
have to be studied, which is not practical, or even doable. Another integrated approach as performed by [10] is the
use of brainstorming to create a conceptual model map. This was transformed into a BDN model, where
probability calculation quantified the model links and -nodes with the help of experts.
The next subchapters will identify three different risk types, as part of the general risk definition, and the
monetizing of risks as the main method of quantitative risk representation. Kok et al. (2017) [50] identified three
types of risk: societal risks, economic risks and individual risks. These three risk types could also be called
consequence types as they differ in consequence assessment. A consequence however can only be defined in the
context of a hazard, thereby calling it a risk type.
Several clear distinctions exist between the three types of risk. Societal- and individual risk focus on the
risks to human life, while economic risk generally refers to the value of physical objects and systems. Societal- and
economic risk focus on population-wide risks, while individual risk, as the name says, refers to risks individuals
face. They can all be represented by some sort of probability- or dose-response curve.
Economic risk
Economic risks focuses on the cost of risk-bearing [50]. These costs are expressed in monetary values of expected
damages [63]. The objects or systems that experience damage are often called utilities. The quantification of utility
variables makes creating ‘simple’ mathematical risk functions possible [118]. Q. Zhou et al. (2012) [118] show an
overview of various damage contribution categories to the total cost function. The maximization of utility is a core
principle in most economic studies, methods and risk [48] [73], [74]. Economic risk calculations often result in cost-
benefit analysis (further explained in chapter 3.2.3) where “economic risk is often equated with the annual
expected value of the damage, the product of probability and damage” [50].

29
Individual risk
The local individual risk (LIR), or individual risk (IR) is the probability of mortality at a certain location [16], [47],
[50], [63],[15], [62].Taking account for evacuation and refuge is recommended [63] and is nowadays often done
[50]. “Setting a limit for local individual risk provides everyone *…+ with a basic level of protection” [50] as is done
in the Netherlands (see paragraph 3.4.1). The general formula for individual risk is given by Equation 4.
Equation 4: General individual risk equation [47].
( ) ( )
Where IR = individual risk (as probability), PE = probability of exposure in one year and Fd = probability of death
given exposure at location x.
Societal risk
“Societal risk is a measure of risk that provides an insight into the likelihood that there will be large numbers of
casualties.” [50] The risk is thereby defined as a certain number of deaths (N) resulting from an event probability
(P) [47], [63]. The general formula for societal risk is given by Equation 5.
Equation 5: General societal risk equation [47].
( ) ( ) ( )
Where N = societal risk (probability of death count), NE = number of people exposed and Fd =probability of death
given exposure at location x. The conversion of individual- to societal risk can be expressed by substituting PE for
NE. Rewriting conversion functions found elsewhere such as [91] gives the same result. The unit of societal risk can
thereby be given in pa/N, where pa = acceptance probability (IR) over N = number of fatalities [89].
Societal risk is often displayed by means of an FN-curve (Figure 8). It shows the probability per year of a
multi-fatality event. The FN-curve is a tool in quantitative risk analysis and a more advanced method then absolute
thresholds of mortality-probability tolerability, as it shows a function and not just a value of mortality-probability
[89].
Figure 8: FN-curve [47] that shows the probability of exceedance of a certain fatality count.
Absolute criteria for societal risk do exist, as they are practical. They are however not static and often
originate from industrial risk assessments. Figure 9 shows the evolution of some threshold values through time in
the UK. It demonstrates why ALARP dynamics, a holistic approach, are valuable in cases where risk tolerability is
not static [91].

30
Figure 9: Evolution over time of Maximum Tolerable Risk in the UK with a FN-curve [91].
Monetizing individual- and societal risks
Monetizing social costs and benefits is done in numerous studies as a way to quantify social values or life and is
also done through numerous methods. Monetizing costs and benefits is an often used method as Dutch and UK
literature shows (e.g. [40]). Three themes with key methods can be identified; risk perception / aversion, human
life valuation and environmental loss.
A often addressed, but difficult to quantify, component of societal risk is risk perception or -aversion.
Experiencing one event with 100 deaths can be more horrific than a 100 events with one individual death each
[47]. Risk perception is “*…+ typically represented using a utility function (i.e., a quantitative measure of well-
being). These utility functions can be complex and are generally based on economic consumption rates, influenced
by aversion, elasticity of substitution and rate of time preference [48]. Through these utility functions economic-
and societal risks merge. Risk perception- and aversion are studied through psychometric14 studies, such as
questionnaires [74]. A statistical utility analysis [30], at odds with previous analyses reviewed, show that high
levels of risk aversion weigh more than the risk of over-mitigation. Assuming low levels of risk aversion or
underestimating disaster probabilities are thereby recommended developments in risk analysis. In conclusion, risk
aversion is often included in risk determination, in the form of a factor [47], [91].
The quantification of the value of a human life can be done by several functions [7], [47], [73]. Appendix
13.5 gives a small summary of possible functions and values for Value of a Statistical Life (VSL), Value of Life Years
(VSLY or CSXY), Value of Injury (VOI) and Value of Evacuation (VOE).
3.2.3 Risk evaluation: Comparison, prioritizing and optimization
The evaluation phase is where the decision is made whether the risks are acceptable or not and how to adapt to
the hazard. Risk evaluation “involves a societal trade-off between risk costs and benefits, or pros and cons” [47].
Evaluation of risk can be done in an absolute sense or in comparison to initial conditions (i.e. relative). A sensitivity
analysis on a case study in the Netherlands [63] concluded that risk in an absolute sense is not (yet) very
meaningful. Relative risk evaluation however, is more accurate. Two main rational risk evaluation (or decision
making) approaches for comparison and/or prioritizing of risks exist (also described in [122]); Multi-Criteria
Decision Analysis (MCDA) and (Social) Cost-Benefit Analysis (CBA) [9].
14 Psychometric studies are concerned with psychological measurements.

31
“Social cost–benefit analysis is a socio-economic evaluation method, based on welfare economics, *…+
expressed in monetary terms” [9]. Closely related alternatives for CBA are cost-effectiveness, cost-utility, risk-
benefit or social return on investment, which are all quantitative analyses. MCDA (or other versions like MAUT,
AHP, etc.) is often a semi-qualitative based way of structuring and scoring multiple criteria or utilities for decision
making and can thereby be used for prioritizing risks.
In all risk evaluation methods a optimization problem exists [73] due to the trade-off between costs and
risks. Economic optimization consists of finding the lowest total costs, consisting of investment- and risk costs [50].
But often risks cannot correctly be monetized or no clear budget constraint for the costs exists. This problem
corresponds to one of the main questions in this research ‘How much risk-reduction do we want?’ when boundary
conditions (constraints) are missing. However, when a budget restraint exists and both costs and risks are
quantitative the mathematical optimum can be calculated as Figure 10 shows.
Figure 10: Cost-benefit trade-off graph indicating the optimization task.
Lastly, risk evaluation by comparison and prioritizing contains some form of normalization and/or
aggregation. Classification for example “offers a simple approach to compare risk and semi-quantitative index
based approaches that have been developed by Dilleyetal, Greiving and Greivingetal. These compute hazard and
vulnerability separately and weight the hazard with the vulnerability index to calculate risk” [45].
Climate hazard- and consequence indicators 3.3The introduction already stated the function of indicators. In literature plenty of indicators are found and
categorized by a whole diverse range of characteristics. The main categorizations are made by hazard type (heat,
drought, pluvial flood, fluvial- & coastal flood), risk-component (hazard or consequence), data type (categorical or
quantitative [56]) and exposure category. An overview of the indicators and indices found in literature is given in
the next sub-paragraphs. Exposure and sensitivity are commonly grouped as consequence indicators. Consequence
indicators are always linked to a hazard in an impact chain [96]; cause-effect relationship of a specific hazard- and
consequence combination. There exist ‘general’ indicators which are subject to all hazard types and ‘particular’
indicators whom are subject to a specific hazard. A ‘heat performance indicator’ or the ‘distance to a flooding
event indicator’ are particular indicators as they respectively are subject to heat stress and flooding. A general
demographic indicator can be combined in an impact chain with every hazard. “Risk factors can also be categorized
as intrinsic (age, disability) and extrinsic (housing, behaviors)” [52]. The indicators are however mainly divided in
hazard and consequence indicators.

32
Multiple literature sources (e.g. [28], [61], [115] [55], [54]) identify the practicality of composite indices
for one or more risk components. These multi-dimensional consequence, hazard and risk indices are abundant and
each consists of a different set of indicators, dependent on the case study characteristics. Not the composite
indices, but the individual indicators, will be dominantly in this chapter. A concise, non-exhaustive overview of
often presented impact chains is given in paragraph 3.3.3.
3.3.1 Hazard indicator summary
Hazard indicators include a frequency (recurrence), duration, intensity and extent (scale) component [15], [61],
[96], [103], [115], [118]. An example of such a hazard indicator for pluvial flooding is; amount of 100 mm /2 hour
[intensity] precipitation events in a year [frequency] over the city center [extent] that lasts more than half an hour
[duration]. In the Netherlands, the KNMI translates meteorological measurements into climate scenarios which
forecast the frequency, duration, intensity and extend of the hazard indicator for the future. The tables in this
paragraph display the diversity of indicators. The tables are divided in input and output indicators as defined by
the IPO method. The output indicators are the result of a combination of primary (input) indicators. They are
produced by a model or function of some sort.
The frequency, duration and scale of the hazard are highly diverse in all literature case studies with little
consensus. These mostly depend on the conditions and chosen norms of the specific case study and are therefore
not specified for the summarized indicators. The KNMI scenarios are often referred to in Dutch climate literature
and can therefore be an important indicator to discuss. However, in paragraph 3.2 was found that when spatially
comparing and evaluating risks is the goal, an overall increase of an indicator due to climate change will increase
the risk [63], but not the relative spatial change.
Heat stress indicators
The KNMI has a general definition for a heat wave; the daily maximum air temperature exceeds 25 ℃ for at least 5
consecutive days, where the temperature exceeds 30 ℃ for 3 of these days. The most widely used indicator of a
heat stress event is temperature [52]. Temperature can be measured on different places and on different times.
Next to the differentiation within the temperature metric in frequency (number of events), duration (daily,
consecutive days, hourly) and intensity (mean, maximum and minimum) common differentiations are indoor or
outdoor and day or night temperatures [58], [61]. The Land Surface Temperature (LST) gives a better
representation of the temperature than Near Surface Temperature (Tair)15 “to emphasize the direct thermal
response of rising leaf temperatures and plant moisture stress associated with drought and increasing
temperatures” [66]. Also a correlation study [77] concluded that indoor and outdoor temperatures are strongly
positive correlated.
“For over a century attempts have been made to construct an index, which will describe heat stress
satisfactorily. The many indices that have been suggested can be categorized into one of three groups: “rational
indices”, “empirical indices”, or “direct indices”. The first 2 groups are sophisticated indices, which integrate
environmental and physiological variables.” [26]. Two main physiological indicators are the Physiological
Equivalent Temperature (PET) [41] and Apparent Temperature (AP). “Combined indices of temperature and
humidity, such as apparent temperature (AT), are *…+ a construct that characterizes the physiological experience
better than just temperature alone. However, in a recent assessment, AT was not a better predictor of mortality
than was mean temperature in two of three European cities” [52].
15 Near Surface Temperature (Tair) is measured by ground stations, generally 1.5 meters above the ground, and Land Surface Temperature (LST) results from thermal satellite data such as MODIS [66].

33
“The latter group comprises of simple indices, which are based on the measurement of basic
environmental variables. In this group two indices are in use for over four decades: the “wet-bulb globe
temperature” (WBGT) index and the “discomfort index” (DI)” [26]. These are elaborated in appendix 13.6. Table 3
of Epstein and Moran (2006) [26] displays a non-complete list of 40 heat indices from before 2006. This is used as
the basis for Table 5, but Table 5 only includes indices shared by other assessed literature.
Table 5: Heat hazard input- and output indicators. The parameters and units are defined and a column with literature referencing the indicator is attached.
Indicator Parameters Unit References Input
(LST or near) surface temperature Temperature ℃
Minimum
Mean
Maximum
[52], [58], [59], [61], [78], [66]
Humidity ratio - [52], [78]
Albedo (short wave reflectivity) ratio - [39]
Shading ratio - [39]
Natural ventilation Wind velocity T/L [39]
Output
(Maximum) Apparent temperature Temperature, humidity, wind velocity
℃ [52], [78]
(PET) Physiological Equivalent Temperature Temperature, humidity, wind velocity, water vapour pressure & human body heat-balance
℃ [41], [55], [79]
(UTCI) Universal Thermal Climate Index Temperature, humidity, wind, radiation
normalized [58], [79]
(SHS) The number of hours per day spent in strong heat stress (depends on used index)
Count, count, categorical T [58]
(WBGT) Wet-Bulb Globe Temperature: measurement technique index
Dry bulb Ta, wet bulb Tw, black globe Tg
℃ [117], [26], NEN-ISO 7243
Thermal work limit Temperature ℃ [117]
(SHSI) Settlement Heat Sensitivity Index PET & normalized sensitivity indicators
L/T [55]
(DI) Discomfort index with vulnerable population conditions (case study)
Dry bulb Ta, wet bulb Tw ℃ [26]
(UHI) Urban Heat Island: Difference between city center and surrounding countryside
Temperature ℃ [58], [45], [61]
Drought indicators
A couple drought indicators, from the drought indicator overview in Table 6, are identical to heat stress indicators
as they both depend on temperature. Heat waves are however mostly identified as short-term (days), irregular
events, where droughts are mostly identified as long-term (weeks / months), and more regular, events. Next to
temperature, precipitation is however the most important indicator as almost every indicator depends on it. The
more advanced drought indices (NEDI, SPEI, FSI, SDDI, SDMI, PDSI) elaborated in appendix 13.6, are dependent on
the basic water balance between precipitation (P) and potential evapotranspiration (ETp): W = P - ETP [11], [97].
They differ as one takes more parameters or derivatives into account then another, has different factors, signs or

34
uses different normalization processes. A less used indicator is the groundwater level, as can be difficult to
determine. It can however be directly linked to certain consequence indicators as paragraph 3.3.3 shows.
Table 6: Drought hazard input- and output indicators. The parameters and units are defined and a column with literature referencing the indicator is attached.
Indicator Parameters Unit Ref. Input Water temperature Temperature ℃ [68], [104]
(LST or near) surface temperature Temperature ℃ [68], [66]
Precipitation P L/T [11], [97], [64], [66]
Potential evapotranspiration ETp16 L/T [11], [97], [66]
Output
Soil moisture content Porosity ratio [104]
Surface water level Water level L [104]
Groundwater level GLG, GVG, GHG17 L [108], [104]
(EC) Eddy covariance Energy balance W/L2 [11]
(SPI) Standardized Precipitation Index P L/T [11], [97]
(SRI) Standardized Runoff Index P L/T [97]
(SDDI) Supply-Demand Drought Index P, ETp L/T [97]
(PDSI) Palmer Drought Severity Index P, LST, S normalized [11], [66]
(SPEI) Standardized precipitation Evaporation Index as combination of SPI and PDSI.
P, ETp L/T [11], [97]
(SMDI) Soil Moisture Deficit Index P, ETp, S normalized [11]
(NEDI) Normalized Ecosystem Drought Index
P, ETp normalized [11]
(NDVI) Normalized Difference Vegetation Index
Satellite wave lengths normalized [22]
(FSI) Forest stress index P, ETp, LST normalized [66]
Pluvial-, fluvial & coastal flood indicators
Pluvial-, fluvial- & coastal flooding have a common output hazard indicator, inundation depth. They differ in the
input hazard indicator which is a water surge for fluvial- & coastal flooding and for pluvial flooding, precipitation
intensity. The second difference is that fluvial- & coastal flooding has to take flood defense performance into
account and pluvial flooding the drainage- and storage capacity of the drainage systems (surface and subsurface).
Indicators for both hazards are shown in Table 7 and Table 8. The modeling of pluvial flooding (from input to
output) and often applied design events is summarized in appendix 13.7.
16 In international literature often calculated by using Thornthwaite method, as a less complex method, instead of Penman-Monteith. The choice of ETp calculation method does not critically influence the drought index results [11], [97]. 17 These are the Dutch abbreviations for ‘mean lowest groundwater level’ (GLG), ‘mean spring groundwater level’ (GVG), ‘mean highest groundwater level’ (GHG).

35
Table 7: Pluvial flood input- and output indicators. The parameters and units are defined and a column with literature referencing the indicator is attached.
Indicator Parameters Unit References Input Precipitation18 Depth, time L/T [76], [15], [114], [45], [61], [106]
Height map (DEM) Elevation L [114],
Drainage- / storage capacity Discharge, volume L3/T, L
3 [15], [114]
Surface roughness Runoff coefficient E.g. L1/2
/T [114], [106]
Surface water level / -discharge Depth, discharge
L / L3 [15], [114]
Output
Water depth of flooded area Depth, area L [15], [114], [118], [106]
Flooded area Area L2 [61], [45], [15], [106]
Flooding/runoff path19 Directional - [76], [15], [114], [106]
Flow speed Speed L/T [15], [106]
Table 8: Fluvial- & coastal flood input- and output indicators. The parameters and units are defined and a column with literature referencing the indicator is attached.
Indicator Parameters Unit References Input
Water surge rise rate Depth, time L [118], [16], [47], [106]
Height map (DEM) Depth L [16], [63]
Flood defense performance Ratio - [16], [63]
Surface roughness Runoff coefficient E.g. L1/2
/T [63], [114]
Surface water level / -discharge Depth, discharge
L, L3 [15], [114]
Output
Water depth of flooded area Water depth L [61], [16], [15], [114], [118], [63], [47], [111]
Flooded area Area L2 [61], [45], [15], [106]
Flooding path Direction vector - [16], [15], [114], [63], [106]
Flow speed Speed, surface roughness L/T [16], [15], [47], [106], [111]
3.3.2 Consequence indicator summary
“Vulnerability relates to potential consequences in case of an event” [47]. This can be direct and indirect
consequences. Indirect consequences are consequences that occur by indirect exposure to the hazard, which are
consequences often outside the directly affected area. Within this research no specific distinction will be made,
but most consequences will be direct, as they often have the most impact [47]. Vulnerability is, as already stated in
the research context, often an interchangeable term for consequences of a hazard and are used interchangeably in
literature. In this research the term ‘consequence’ indicators will be used when used as synonyms in literature. A
review [96] of 176 peer-reviewed papers used three impact chains to review climate consequence indicators; 1)
heat waves (HW) on human health, 2) drought (DR) on water planning and 3) pluvial- and fluvial/coastal flooding
(FLP, FLF) on socio-economic systems. This resulted in an extensive list of consequence indicators, categorized in
five broad categories:
18 “A precipitation normal is a 30 year average precipitation of a given region. Note that a climate normal is different from a yearly weather variable.” (IPCC, 2014) 19 Figure 3 in [16] displays the theoretical modeling of floodplain flow over grid cells. In the case of pluvial flooding it can be described by the rainfall-runoff relationship [118].

36
1. Human capital (Demographics & Health, Human behavior)
2. Socio-economic conditions
3. Built environment (Infrastructure & Building characteristics)
4. Natural capital and ecosystem services (Environmental status)
5. Governance and institutions
The categories used in this paper [96] manifest, in more or less the same categorization, in other climate risk
literature such as [23], [52], [56], [64], [76], [117]. A European indicator review [61] for example used the
categories, 1) financial- (GDP, income equality), 2) human- (education level, health services) and 3) technological
capital (R&D, internet use). The main categorization of [96] is thereby used to categorize the consequence
indicators gathered through the literature research, Table 9. All consequence indicators in Table 9 are exposed to
certain hazards, are in some way sensitive to it through damage, mortality, harm or reduced livability and can
have or have no adaptive capacity to it. Indicators are grouped under sensitivity where damage includes reduced
value, as this can be seen as economic damage and health entails mortality or harm.
Consequence indicators are always linked, in an impact chain, to a hazard type. The unit of consequence
indicators is not given in the table. This is because all indicators, originally an absolute- or relative value, can be
defined by a relative ‘fraction, %, of a total population/area/etcetera’. This is a common indicator unit, dominantly
used for socio-economic and demographic indicators.
Table 9: A compact summary of most referenced and important consequence indicators found in literature, categorized by exposure category, sensitivity type and hazard type. Hazard types; Fluvial- & Coastal flood (FLF), Pluvial flood (PLF), Drought (DR) and Heat stress (HW). Appendix 13.1 includes the extensive consequence indicator list with all references.
Category Indicators Hazard type Infrastructure Damage Critical Infrastructure FLF, FLP, DR Health Infrastructure capacity / accessibility FLF, FLP, DR Communication availability HW, FLF, FLP Internet / media / telephone
Public warning systems Building characteristics
General
Building age HW, FLF, FLP, DR Building density HW Building type (Care home / private / public service / etc.) FLF, FLP, DR20 Damage Building value (Insurance / market / replacement)21 FLF, FLP, DR Basement depth FLF, FLP Depth ground floor level22 FLF, FLP Foundation type (Wood / concrete)23 DR Health Performance indicator (nr. of overheating hours a year) HW Thermal capacity / resistance
20 Mainly houseboats [104], [40]. 21 E.g. WOZ-value [40]. The building value also often represents the livability value of an area [40]. 22 Translation into Dutch “drempelhoogte”. 23 Foundation type is an indicator for damage to foundations during drought (low groundwater levels). Damage to wooden foundations is commonly known as “paalrot” in the Netherlands.

37
Albedo
Shading
Ventilation
Air conditioning
Human behavior Health / reduced livability Perception / Panic HW, FLF Communication use (Internet / media / telephone) HW, FLF Distance to event FLF Socio-economic conditions
Health / reduced livability
Occupation (Unemployment rate) HW, FLF Education type HW, FLF, FLP Income (GDP / equality classes) HW, FLF Health services (No. services / physicians) HW, FLF, FLP, DR Dependency ratio (1-person households) HW, FLF Environmental status General Water dependent objects DR Water quality24 (Algae, DO, faecal colonies, sewer overflow) HW, FLF, FLP, DR Damage Vegetation type HW, FLF, FLP, DR Mortality or growth-reduction
Cold- or warmth-loving types
Drought- or moisture-loving types
Rooting depth
Vegetation combustibility Land cover type Commercial / housing / industrial / agriculture / nature
(green) / water (blue)
HW, FLF, FLP, DR
Surface roughness coefficient FLF, FLP
Subsidence (Oxidation and compression) DR Elevation height
Soil type25 Water supply DR Health Imperviousness HW, FLF, FLP, DR Demographics & Health
Health
Population density HW, FLF Age HW, FLF, FLP, DR Health Short term (illness) HW, FLF, FLP, DR26
Long term (physical- & mental disabilities) HW, FLF, FLP
Governance & Institutions
Health
Emergency response time FLF, FLP
24 Bad water quality can have a value reductive effect on the environment (livability) [40], but is also a health hazard [62]. 25 With special attention to peat and clay soils [6], [106]. 26 Pluvial floods (FLP) and drought (DR) are mainly linked to health through water quality [104].

38
Some of the indicators in Table 9 are often briefly and sometimes extensively explained in literature.
General indicators can often act as substitute indicators if data is not available for other indicators. For example
building age often substitutes foundation type, because several periods can be identified where a certain
foundation type was generally used. Before the 1960’s in the Netherlands, mostly wooden foundations were used
and after 1990 mostly concrete [106]. Another example is the dependency ratio (1-person households) [28] that
tries to identify high age cohorts, social-aversive populations or just the socio-economic ratio. The last example is
that the low income indicator, used in many studies, is often a composite indicator for individuals who have other
low values on other socio-economic indicators, such as minorities, non-healthy people or low property value
without insolation or AC [53].
Moreover, a London case study [115], influenced by National UK guidance [64], indicates that “systems
for life support (energy, drinking water and sanitation, food distribution), social development (health, education,
community development and social support), innovation (cultural and intellectual services including the media),
communication (transport, telephone and IT networks), social control (policing and regulatory functions) and the
economy (private markets and financial services)”, all play a role in determining the severity of the impact of a
heat wave.” Also a case study in York, UK, [15] concluded that emergency response times exceed the 8 min.
threshold by floodings with a water depth over 0.25 meter during a hazard, when they are most needed. Most
literature “differentiate vulnerability to heat-related mortality along the lines of gender, age, and economic access,
but in neither case are key data on the behavior of the vulnerable and their care providers, their use of internal
space, and the performance of organizations and institutions that regulate their access to information and support
considered in the assessment” [115].
Further, monetizing damages in the Netherlands is currently often done by defining building environment
and environmental (land use) indicators [9]. But also Q. Zhou et al. (2012) [118] describes vulnerable components
to flooding based on the costs. The overall availability of damage data from pluvial flooding in the Netherlands was
found to be limited [40], however different damage calculators exist.
Lastly, several brief conclusions can be summarized. Literature identifying infrastructure in relationship to
heat is less dominant, probably because “the majority of heat wave studies have considered impacts on mortality
because daily deaths data are generally readily available in high-income countries” [52]. A Dutch study [103]
concluded that differentiation between ground floor floods and basement floods based on the hazard indicator
flood depth is recommended. And Alterra [109] concluded that warmth-loving vegetation will increase and cold-
loving vegetation will decrease due to increasing overall temperature. A case study in Utrecht identified that wet
conditions can pose more threat to recreation and green areas then dry conditions.
3.3.3 Impact chains and dose response
Certain indices are composite indicators which indicate a risk level for an explicit impact chain (specific relationship
between a hazard and consequence). In literature a couple of these impact chains stand out by their general and
logical characteristics:
Heat-mortality relationship ([39], [52], [53], [79])27
Heat-labour productivity ([116], [117])
Flood Depth-damage relationship ([16], [63], [103], [118], [106])
Drought-subsidence/-foundation damage ([104], [40], [106], [6])
Flood-victim relationship ([63], [103])
27 These are non-exhaustive selections of references. There can be more correct references throughout the literature.

39
Drought-vegetation-stress28 relationship ([66], [108])
Drought-water quality/salinity relationship ([104], [40], [62])
Mortality has a smooth linear relation with colder temperatures [35], but the urgency will probably decrease
as the IPCC [42] and KNMI project higher winter temperatures. Warm temperatures have a significant, but more
rigid linear relation with mortality [52]. The mortality (i.e. the number of fatalities divided by the number of people
exposed) is usually determined with a so-called dose response curve (see Figure 11) or mortality function. This
gives the relationship between the intensity of physical effects and the mortality in the exposed population [47].
Dose-response curves are very diverse and can be made for every quantitative cause-effect relationship.
Figure 11: Dose response curve [47].
A depth-damage (or stage-damage) function or curve is often required to correctly asses the economic
damage by a combination of hazard indicators, e.g. flood extent, water depth and flow speed, and monetized
consequences [118]. The flood-victim relationship is an important mortality relationship, but has a large
uncertainty. A sensitivity analysis [63] showed that a small difference in the water depth (or rise) can have a big
increase in victims when a certain minimum water level is exceeded.
Air pollution can be a combined hazard with heat stress in urban environments as they emerge often
simultaneously. Few studies however show an actual negative effect on population mortality of pollution during
heat waves [53]. The two most important air quality parameters are the PM10- and ozone concentration [52].The
most important parameters for the drought-water quality relationship are salinity by chloride concentration [104]
and bacteria (faecal colonies) & pollutants discussed in [62].
Norms and principles 3.4Any norms (or principles) that exist for the use of previous stated indicators are not given yet. In this chapter, any
existing norms and/or often used conditional assumptions29 for these indicators will be elaborated. Norms or
conditional assumptions can be boundary conditions, thresholds or ranges for indicators. These norms always
apply to an impact chain, a specific combination of hazard and consequence. It is for example possible to specify
threshold values for the components of heat-mortality; hazard (e.g. temperature, 30 degrees) and consequence
(e.g. mortality of elderly, 65 years and older). Thresholds can be design points, averages or other substantiated
estimates [63]. When no threshold values for the cause-effect relationships can be specified on proven research, a
statistical method can be used (more on this in appendix 13.8). The next paragraphs will address the norms and
conditional assumptions found in literature for the four climate hazards.
28 A.k.a. forest stress index (FSI) combined with vulnerable vegetation plots. 29 General used conditions which are (still) not completely accepted scientific or practical rules and thereby not mandatory.

40
3.4.1 Fluvial- & coastal flooding: The Dutch mortality acceptance-probability and NBW-norms
In the Netherlands a general risk norm is active. An individual mortality acceptance-probability (pa) of 10-5
is used
for flooding by a dike breach, functioning as a basic individual safety level. Another basic individual safety level
used in the Netherlands is the external safety level of 10-6
, based on risk contours of external hazardous locations
with for example chance of explosion. These differ within European countries, but with 10-8
pa as a general lowest
boundary, what is assumed as a negligible risk value [74], [91].
Secondly the NBW-norm exists, regulated by the provincial governments [80]. The norm is expressed as
the chance surface water will inundate surrounding areas. The economic value of land use and damage is included
as a criterion. Thereby the norm expresses the highest allowable chance of inundation for the specific land uses,
displayed in Table 10. The inundation criterion expresses the area % that does not have to suffice the norm.
Table 10: NBW-norms in the Netherlands [80].
Land use Inundation criterion Basic norm (1/yr)
Meadow 5% 1/10
Agriculture 1% 1/25
High value agriculture & horticulture 1% 1/50
Greenhouses 1% 1/50
Urban area 0% 1/100
Mandatory norms for the hazard indicators do not exist. Only conditional assumptions for water depth
and flow velocity, with regard to lost control of a vehicle and human life risks, are presented by publications based
on ([15], [16]) or from the UK government [111]. Water depths > 0.25 meter in combination with a flow velocity >
2.5 m/s are hazardous conditions.
3.4.2 Pluvial flooding: Threshold assumptions on flow velocity, water- and drainage depth
No mandatory norms for precipitation events exist in the Netherlands. There is however a standard precipitation
series for the Netherlands in the sewer guidance document “Leidraad riolering: Module C2100” [123] from Rioned.
This series consists of 10 standard precipitation events used as design loads for dimensioning and testing sewer-
and drainage systems. Next, several conditional or threshold assumptions for some hazard indicators however
have arisen in the UK and the Netherlands. Firstly the same water depth and flow velocity conditions, mentioned
in fluvial flooding, are present. Lastly a guideline for infrastructure- and building groundwater depth design
thresholds is composed by [106], based on a Dutch building research institute (SBR) and the Rioned guidance
document [123]. During long precipitation events these can criteria can be problematic as basements will flood.
Table 11: Criteria for building- and infrastructure groundwater depth ([106] adapted from SBR) at a drainage design load of 5 mm/day.
Urban function Required Minimal Groundwater Depth (m below surface)
Main roads 1.00
Secondary roads 0.70
Gardens, parks and sports areas 0.50
Buildings (with crawl space) 0.70
Buildings (without crawl space) 0.50*

41
3.4.3 Heat stress: Conditional temperature assumptions and vulnerable people
“The World Meteorological Society describes heat waves as periods of warm weather lasting for more than five
consecutive days, with temperatures that are five degrees in excess of the average maximum temperature for that
region” [115]. This is not a fixed standard as there are no worldwide [79] or Dutch standards for maximum- (Tmax),
minimum- (Tmin) or mean (Tmean) temperatures that define a heat wave. A wide range of assumptions on
thresholds and boundary conditions for heat indicators, such as temperature, with respect to a certain exposed
population group, such as the elderly (> 50, > 60, > 65 or > 74 years) age cohort or infants, are present in literature.
Next to generally used assumptions however, a range of studies found value thresholds and ranges for the heat
indicator and the exposed groups, based on case studies and statistical reviews of historical events. The results
differ slightly, but a general consensus is visible and will be elaborated here.
The heat-mortality impact chain is the most researched relationship, consisting of temperature (T)30
indicators and human mortality. Significant and clear heat-mortality relationship were found by [52], [59], [78],
[79]. Evaluation of several case studies shows that “the thermal stress–mortality relationship is not time invariant”
[79] and thereby is not primarily dependent on the time someone is exposed to heat, but the height of the
temperature. “Temperature or thermal indices-based definitions are built on relative or absolute thresholds, or
even a combination of both”[79]. Relative temperature levels however were found more important than absolute
values of heat/cold-mortality [35], [53]. Surprisingly so, Tmean did not explain heat stress from an Australian survey
case study [117]. Also not all temperature indicators (Tmax, Tmin, Tmean) were found to be representative for a heat
wave. Generally the temperature has to exceed a certain threshold for several days (not < 2 or 3 days) [115]. This is
not without reason as nightly indoor temperatures, only correctly captured by a series of consecutive day
measurements and reflecting outdoor Tmin, have been found to be the most crucial for heat-mortality [22], [79].
However, this nightly temperature is a substitute definition for the actual crucial indicator, Tmin [22], [78], often
high at the beginning of summer. Even so, relative temperatures are more important, most studies indicate
absolute temperature thresholds. Results of a heat-mortality statistical correlation study in China [59] state that
general population temperature thresholds for Tmax/Tmean/Tmin are respectively 32/28/24 ℃ and every 1 ℃ increase
above these thresholds increases the mortality rate on average by 4.3%. As Tmin was found to be the most crucial
indicator, the temperature threshold values for several death causes, cardiovascular/respiratory/diabetes, are
respectively 24/26/28 ℃. Four other studies identify a Tmax threshold value of 35 ℃ [77], 39 ℃ [52], 32 ℃ [58] and
30 ℃ [55]. Concluding a Tmin threshold value between 20 ℃ and 24 ℃ is generally accepted by [55], [59], [61] with
Tmax > 30 ℃. A general, comfortable human indoor temperature range31 is 17 - 30℃ [52], but only for a limited
amount of time in hot periods as the Tmin has to decrease below 20 ℃ - 24 ℃.
Age is the most important indicator for heat-mortality. Elderly are the most affected by heat waves [79].
The vulnerable elderly age cohorts differ however between studies. The age cohort > 65 years is however the
most quoted and present result from case studies as vulnerable population group [23], [53], [59], [69], [115].
Children are also vulnerable, but mainly because they have reckless exposure like playing outside in extreme heat.
The age cohort of < 2 years [55] has been defined, but there is little literature supporting with hard data and
thresholds.
The second population group whom are vulnerable are the chronically (long term) ill [59], [79]. Nursing-
and health care homes, as a substitute indicator for population age and health, also have a positive correlation for
heat-mortality as concluded by studies in the UK [52], [115]. Some studies identify the female gender as more
vulnerable to heat stress [52]. The evidence for women-heat mortality relationship in high income countries is
30 Here T = Temperature and not a time unit. The difference is visible as the T for temperature generally has a subscript. 31 Differing for culture and climatic environment due to acclimatization [52].

42
however weak and probably not existent [53]. Furthermore, people in thermally stressful occupations are
vulnerable [79] as the large amount of worldwide thermal indices focused on the working environment and
especially Australian studies indicate. The global labour productivity can possibly “be reduced by up to 20% in hot
months in 2050” [116].
All stated population groups vulnerable to heat-stress are generally also vulnerable to cold-stress [35].
Surprisingly a low income level is often addressed as an indicator condition for higher heat-mortality, for example
by [35], [117], but this can be proxy variable for other more direct indicators, such as availability of insolation and
air conditioning and is not dominantly significant in western Europe as case studies of the 2003 heat waves show
[52].
Infrastructure heat stress norms or conditions were not found in the researched literature. But next to the
heat-mortality relationship, some other thresholds and ranges can be identified in relation to water temperature
increases. The maximum penetration of surface temperature into water bodies is approximately < 5 meters [112].
The water temperature range for peak algae growth lies between 20 ℃ and 40 ℃ [112]. A water temperature of >
20 ℃ is thereby not desirable for the water quality and therewithal for recreational use. Also many types of
northern hemisphere fishes are aversive for water temperatures > 35 ℃ [112].
3.4.4 Drought: Index ranges, water quality regulations and priority series
For general drought indicators “absolute thresholds of the evaluation indicators for the regional ecosystem health
do not exist” [85]. Next to general index ranges, regulations and general assumed value ranges exist for specific
drought impact chains. Drought often means high water temperatures and a water deficit, resulting in low water
volumes in water bodies. As stated in the previous paragraph and by two Dutch drought reports [62], [40], water
quality reduces and salinity intrusion increases [68] during droughts. A generally assumed salinity sensitivity
turning point used by Alterra [108] is 4 mg/L where damage to vegetation can be expected. For surface water
quality decline, multiple norms exist such as the swimming water norms and the Water Framework Directive
(WFD) of the European Union. The swimming water regulation norms are the most closely related regulation
norms for water quality in public spaces (i.e. water on the streets) and are thereby used as indicator norms [62].
These are guidance norms for when water bodies are used for recreation. They exist of threshold concentration
values of biological pollutants such as E. coli and other polluting substances. The decline of water quality was
found to increase at point sources and increasing water temperatures [68].
The only conditional combustibility assumption of vegetation in literature was given by Alterra [108],
stating that coniferous trees are less susceptible to forest fire then coniferous trees. Deltares did research on
drought-vegetation stress and published in two reports rooting depth assumptions. The shallowest maximum
rooting depths, and therefore lowest tolerable GLG, are -2 meter below the surface for Dutch coniferous and
deciduous tree species in [106].
Also drought-foundation damage is commonly referred to in Dutch literature [106]. There exist no
groundwater level thresholds or ranges for this impact-chain, but indirect construction- and drainage depth ranges
like Table 11 give an idea on minimum groundwater levels to prevention of foundation damage.
Lastly a priority series exist in the Netherlands [81] where, if necessary in periods of drought, water
required objects and functions are shut down. Four main categories exist where category 1 has priority over the
next category and so forth. Category 1, the most important, exists of irreversible damage to safety works like dikes,
nature area and subsidence/oxidation of the soil. The 2nd
category is utility functions (water and electricity), the 3rd
category is small scale, and high value land use (e.g. greenhouses) and the 4th
category are other economic
interests. These categories give a priority indication which could be applied in climate adaptation prioritizing.

43
Conclusions on theory 3.5As stated in the introduction, risk is a combination of hazard probability and consequences (vulnerabilities). The 1)
identification of hazards, 2) risk identification- and 3) risk evaluation consist of a diverse array of risk approaches,
indicators and norms. These have several important characteristics where some have achieved consensus and
others none.
Hazard identification is often performed by a probability analysis of a certain hazard combined with
scenario analysis, using a Bayesian-, instead of a frequentist interpretation to reduce uncertainty in the analysis.
Results are often graphically presented by a probability density function (pdf) and geographically on a hazard map.
From the wide range of risk assessment techniques and tools a few are globally accepted and usable for
climate risk assessment. A well-known method for Quantitative Risk Assessment (QRA) is ALARP (As Low as
Reasonably Practicable) due to its holistic approach, not making use of absolute thresholds or norms. Secondly two
descriptive assessment techniques often used in climate risk assessment are stakeholder brainstorming and
scenario analysis. This represents that in the climate adaptation risk dialogue always a combination of techniques
is used, resulting often in a semi-quantitive approach. These techniques are interchangeably used throughout risk
identification, -assessment and –evaluation.
Within the general risk definition, risk can currently be divided in three risk types; societal-, individual-
and economic risk. The risk types have their own different norms and tools. Economic risk looks at material
damages, where both individual risk and societal risk primarily look at the probability of human mortality, but also
into reduced- comfort and livability. Individual risk defines the fatality probability of a single person, where societal
risk defines the fatality probability of multiple persons. Cost-benefit analysis is the main tool for economic risks.
For societal risk representation an FN-curve is used, sometimes including a utility function for well-being or risk
perception. To create a quantitative integrated risk value, monetizing non-monetary values is very often used.
Monetizing of individual- and societal risk is done through calculating the Willingness to Pay (WTP) for life and
injury, resulting in; Value of Statistical Life (VSL), Value of Statistical Life Years (VSLY), Value of Injury (VOI) and
Value of Evacuation (VOE). From these four, VOE is the most cost-effective to reduce loss of life or injuries as the
costs for inconveniency of evacuation are much lower VSL and VOI costs.
It was found that relative risk evaluation is more accurate than absolute risk evaluation. For this risk
evaluation two main methods are used; Multi-Criteria Decision Analysis (MCDA) for (semi-)qualitative evaluation
and (Social) Cost-Benefit Analysis (CBA) for quantitative analysis. The qualitative method only makes it possible to
prioritize the assessed risks, which suffices for relative evaluation. However, minimizing total social costs, by
finding a quantitative risk-investment optimum is an often pursued goal. Here, however the problem of monetizing
non-monetary values emerges. A decision tree or Bayesian Decision Network tool can however help with these
problems by investigating several risk-reduction investment scenarios based on SCBA’s, which can be prioritized.
To make risk assessment possible all indicators of the separate components have to be identified and
valued. From the extensive list of hazard-, consequence- and composite risk indicators, also known as impact
chains, a few characteristics stand out.
Climate hazard indicators always include a frequency, duration, intensity and extent and are thereby
always of a quantitative nature. Which indicators or indices to use in climate risk assessment is much debated and
these indicators are not fixed as it depends on the affected people/objects/environments. However several
indicators and indices are generally accepted or much used. The primary variable for heat stress is surface
temperature, often combined with humidity. Widely used composite indices exist; the sophisticated indices (PET &

44
AT) including physiological variables and simple indices (WGBT & DI) including only meteorological variables.
Another widely used index is the Urban Heat Index (UHI) indicating the urban heat island effect, urban influences
on temperature increase, by identifying the urban temperature relative to the rural temperature. For drought,
precipitation is often used as the primary indicator. The more advanced indices are all based on the water balance
of precipitation (P) and potential evapotranspiration (ETp). The Standardized Precipitation Index (SPI) is the most
widely used index, but does not account for evaporation, which is changing due to climate change. The
Standardized Precipitation-Evapotranspiration Index (SPEI), as an advanced SPI, does however account for this and
is thereby a recommended index. When drought is linked to actual local impact it seems that groundwater depth
and soil moisture content are the most important, but indirect, indicators for vegetation-stress and object damage,
instead of precipitation. Pluvial-, fluvial- & coastal flooding indicators are mostly identical. They mainly differ in the
origin of the hazard as the primary indicator for pluvial flooding is precipitation and for fluvial- & coastal flooding,
the water surge rise rate. Also pluvial flooding is mainly dependent on storage capacity, where fluvial- & coastal
flooding is dependent on water defense performance. The most important output indicators are however the
same; area, water depth, flow path and flow velocity of the flood.
The consequence indicators, or vulnerability indicators as labeled by many papers, can be categorized in 5
themes; 1) Human capital (Demographics, Health, Human behavior), 2) Socio-economic conditions, 3) Built
environment (Infrastructure & Buildings), 4) Natural capital (Environmental status) and 5) Governance and
institutions. These 5 themes can also act as composite vulnerability indicators when aggregation into one
vulnerability score is pursued. Socio-economic conditions and human capital often, but non-exclusive, indicate
reduced livability/comfort and danger to life (as in societal- and individual risk) whereas the built environment and
natural capital often indicate economic damages (as in economic risk). There is no right choice for consequence
indicators for vulnerable groups, but some are better than others, depending on the hazard type, exposure and
data type.
A few impact chains, a particular hazard and consequence relationship, are highly noticeable. These can
all be graphically represented by a dose-response curve. The heat-mortality relationship is a rigid, but linear
relation where higher temperatures increase mortality, with a steep relationship for elderly people. The flood-
victim relationship is a corresponding relationship for the fluvial- & coastal flood hazard. A depth-damage curve is
mainly used to assess flooding damages, which is especially primarily important for pluvial flooding as mortality is a
marginal consequence. For drought a couple distinctive relationships exist, dependent on the area type, urban or
rural. In the Netherlands the drought-subsidence relationship is an important urban impact chain as it can cause
high economic damages. The drought-vegetation stress relationship is the most important rural impact chain and
the drought-water quality relationship occurs in both area types, where in rural areas economic damages are
mainly influences and in urban areas mainly human health.
Very view norms exist which apply for climate extremes and their impacts on the environment. In the
Netherlands the only mandatory norm on loss of life is a basic level of protection for individual risk (including
evacuation) of 1/10-5
per year. This is however only for point source hazards like floodings and explosions and not
for hazards without a particular source, like heat waves. For economic damages the mandatory NBW-norms exists
for inundation from surface water of different land uses.
Guidelines and general assumptions exist, but there are few and focus mainly on certain impact chains.
Guidelines or generally accepted assumptions exist for extreme precipitation events, floodings, water use / -levels
during drought and temperature threshold ranges. The norms on pluvial flooding indicators, such as the
groundwater level- and standard precipitation series guidance norms are given for “normal situations” a system
should be able to handle. Designs based on the norms for “normative situations” determine the severity of the

45
hazard impact. The extreme events in a climate stresstest exceed, by default, these “normative situations”,
revealing the weak links in the design. When setting standards on adaptation in this above-normative situation,
these normative design norms are thereby directional, but are by default not useful for adaptation design.
The extreme climatic events for which climate adaptation has to be implemented are events that a system
by default cannot handle, making these standards not particularly useful. The groundwater levels can however
function as an indirect indicator for basement flooding.
From multiple case studies can be concluded that relative temperature rise is most important for heat-
mortality and -perception. Absolute temperature ranges are however easy to use in vulnerability studies and often
used in heat indexes, ranging from no stress to high heat stress for certain exposed and vulnerable groups. These
groups consist of people over 65, infants, ill and disabled people and people with thermally stressful occupations.
The most important harmful absolute temperature ranges for humans are minimum temperatures that do not
drop below 20 to 24 ℃ for a couple of days, making cooling down difficult. A second important threshold range is
maximum temperatures exceeding 30 - 39 ℃. This matches studies stating a general thermally comfortable
temperature range between 17 and 30 ℃. Infrastructure heat stress is named in literature, but no general
guidelines exist. A rough estimate on a water temperature threshold for water quality can be deduced as the
temperature should not exceed 20 ℃ in Northern Europe, as this can be harmful for aquatic life and algae growth
increases rapidly. Shallow water is more susceptible to these water temperature increases as the maximum
penetration of temperature into water is around 5 meters. For surface water quality itself European swimming
water regulations are active which are especially important in periods of drought and heat stress. The priority
series shows only the relative importance of functions during drought, where for tree stress a general absolute
groundwater level threshold can be concluded of -2 meter from the surface. However, for vegetation stress, water
deficits and foundation damage from drought only indirect assumptions and construction ranges, mostly based on
case studies exist.
A couple of conclusions can be highlighted when reflecting on the main research question “How and where can
standardization in the Dutch climate-adaptation risk approach, focused on heat stress, drought, pluvial-, fluvial- &
coastal flooding be implemented?”
A general risk approach throughout literature exists, consisting of 1) hazard identification, 2) risk
identification and 3) risk evaluation in which ALARP with resilience thresholds can be productive.
A risk approach including social- and technical indicators consists of both quantitative- and qualitative
tools and –methods, creating a semi-quantitative risk approach.
Assessed risks can be one or a combination of the three risk types; damage, health and livability.
Impact chains define risk by combining hazard and consequence through a cause-effect relationship.
Inclusion of the whole range of indicators and impact chains has to be possible. Thereby formulating a
limitative standard list of usable indicators is not feasible. An assessment of “essential” and “additional”
indicators can however prove useful. Several hazard indicators exist whom are essential for assessing the
four climate risks; inundation depth, temperature and groundwater levels.
The most influential vulnerability categories are demographics and human health, socio-economic
conditions, environmental status and infrastructure- and buildings characteristics. The prominence and
usability of human behavior and governance influence -indicators increases, but these categories are still
less researched and acknowledged.
A small amount of norms and guidelines for indicators exist in varying reliability and scientific consensus.

46
4 Qualitative Research
2) Which standards are implemented in practice by expert stakeholders and
what part of the climate adaptation process should be standardized?
This thesis makes primarily use of (semi)-qualitative research methods to answer the research question above. The
methods are described in subchapter 4.1. The results from interviews, document analysis and process analysis are
elaborated and discussed in subchapter 4.2 and 4.3. All parties agreed on the theoretical division between risk
identification and –evaluation and the fact that risk identification (stresstest) would ideally produce input for the
risk evaluation. Therefore subchapter 4.2 describes objectively what indicators, norms and methods ‘are’
implemented in the stresstests at the moment. Subchapter 4.3 describes what methods ‘are’ existent in risk
evaluation at the moment. This is for a big part based on interviewee statements and less on process analysis,
which makes this chapter more subjective. Lastly subchapter 4.4 discusses the interviewee views on what “should”
be standardized; where and how should be standardized? Chapter 5 will compare these results with the
theoretical framework.
Methods 4.1A range of indicators, norms and methods
are applied in practice by stresstest providers [120]
to perform risk analysis and assist stakeholders in
risk evaluation. The three research methods applied
to investigate this practice are displayed in Figure
12. Firstly, document analysis of the interviewed
engineering companies achieved a first objective
overview of existing indicators, norms and methods.
Then, a process diagram for every interviewed
company32 was created from this document analysis,
by using the systematic Input-Process-Output (IPO)
approach from Figure 6 in the research context.
These process diagrams revealed the components
(input- and output indicators, norms/principles and
processes/methods/models) and their connections
for a wide range of currently applied stresstests33.
Lastly, in the interviews these process diagrams are
validated and revised when required and produced
their results in the form of indicator tables and
hypothesis statements.
32 There is no process diagram created for Arcadis, because there was not enough information from document analysis available to create a correct process diagram with the applied method. 33 These “stresstests” are often not performed as one in a single, simultaneous exercise, but are often performed partially or in sub-stresstests depending on the stakeholder’s demands/requirements.
Figure 12: This flow diagram schematizes how the three qualitative research methods and their results are applied and supplement each other in this research.

47
4.1.1 Document Analysis
Documents applied or describing the practice of stresstest providers were analyzed through document analysis. It
resulted in a summary for every provider indicating their main indicators, norms/principles and methods/models.
The summaries are divided into four hazard theme chapters (heat stress, drought, pluvial flooding and fluvial- &
coastal flooding), in the same manner as the results are displayed in subchapter 4.2. Two more chapters were
included in the document analysis summaries which describe the interdependencies between the hazard themes
and methods/models and a risk evaluation chapter describing different evaluation methods.
4.1.2 Process Analysis
Diagram 1 (on the next page) displays a process diagram for explanatory purposes. All final process diagrams are
included in appendix 13.1. The process diagrams are divided (by dotted boxes) into the four climate hazards (from
top to bottom; heat stress, drought, pluvial flooding, fluvial- & coastal flooding) and linearly arranged according to
the conceptual adaption process steps of this research in Figure 3. The hazard map is a result from the hazard
assessment, often performed through a model. These models use hazard indicators (climate- and system
indicators) as input and produce output/secondary hazard indicators such as inundation depth. Risk maps are the
result of the risk identification, combining the hazard indicator with consequence indicators through various
methods such as overlay or dose-response functions (e.g. depth-damage curves). These risk maps are diverse in
data type (quantitative/qualitative) and –range (exact/categorical). They could however often be defined as one of
the risk three risk types identified in the theoretical framework; damage-, health- or livability risk. For some
process diagrams these risk maps could not always be
defined, because the products are not always
identifiable for some companies and sometimes
completely depend on the stakeholders demands for
that particular project. This “problem” is especially
present in the evaluation phase of the process, where a
minimal amount of documentation is present.
The risk maps are essentially the input for the
evaluation phase when a linear process is assumed. The
most commonly used methods of the company are
incorporated in the process diagrams. In most
documents, these methods were often suggestions on
how the risks can be evaluated, based on stakeholder
requirements, and not statements of a standard
approach on risk evaluation. This phase is mostly
displayed as a chain of steps without defining the
intermediate products. When interdependencies
between components are identified they are displayed
as is done in Figure 13 between the drought and pluvial
flood section. Lastly norms, in the form of standard
applied ranges, assumptions or threshold values, are
indicated when identified in documents or interviews.
These were found to be more diverse for heat stress
and drought, and more standardized for the flooding
hazards.
Drought
Pluvial
Flooding
Figure 13: This altered (non-essential components removed) snapshot from Diagram 1 (next page) displays the way interdependencies (arrows) between indicators and different hazard stresstests are indicated in the process diagrams.

48
Diagram 1: This is the process diagram of Sweco’s climate adaptation process, produced through process analysis based on the IPO approach. This process diagram is an example representing the layout of all process diagrams displayed in appendix 13.1. It is used for explaining the method of
process analysis applied in this research. It mainly identifies the applied indicators, norms and methods in the stresstests Sweco provides.
Heat stress
Drought
Pluvial Flooding
Fluvial- & Coastal
Flooding

49
4.1.3 Interviews
The interviews (see appendix 13.13 for the question list)
consist of the 2 subjects broached in the research
question; 1) the standards (indicators, norms and
methods) applied in practice and 2) the respondents view
on where and how to standardize. The first subject
consists mainly of objective and descriptive questions
which indicate what ‘is’ present at the moment. The
second subject will contain mainly subjective questions as
it investigates what ‘should’ be done based on expert
opinions.
In the interviews indicators, impact chains and norms
were mentioned which complement the document- and
process analysis. It is assumed that the amount of times an indicator is mentioned in the interviews shows a
degree of importance. Figure 14 displays a word cloud with the same concept; the terms mentioned most in the
interviews are featured bigger than others.
The indicators are identified by their type (hazard, consequence or risk) and can be assigned (conscious or
unconscious) by the interviewees to one (or multiple) of the three risk types34 (i.e. damage, health and livability) for
each theme. This resulted in a distinction between 12 specific impact chains (4 hazard themes x 3 three risk types)
and for each hazard (heat, drought, pluvial flood and fluvial- & coastal flood) general indicators which could not be
assigned to a specific impact chain. The 12 impact chains are indicated as “hazard”-“risk type”, such as “heat-
livability” or “drought-damage”. The indicators which are mentioned in at least 2 interviews are evaluated by
priority and consensus and result in the summary tables of next subchapter:
Consensus: Is there consensus among market parties on the use of this indicator?
o The number of interviews that indicate that the indicator is useful for that specific impact chain.
Priority: Does the impact chain have a priority status by parties?
o Interviewees that indicated a priority on certain impact chains within a hazard type are
translated into scores. Highest priority = 2, medium priority = 1, low priority = 0. All scores are
summarized for the impact chain, culminating into a total priority score.
Next to the indicator summaries a hypothesis list (appendix 13.2) is produced from the interview
transcriptions. Several hypotheses and statements were extensively discussed in the interviews. These are mostly
subjective, but agreement or disagreement on several of these could be identified. In appendix 13.2 these
hypotheses are summarized and rated on agreement; the amount of interviewees that a) agreed, b) disagreed or
c) had no opinion / did not discuss the hypothesis. The hypotheses that were discussed 4 times or more are
summarized in appendix 13.3 substantiated by the most representable interview quotes discussing the hypothesis.
34 6 out 7 interviewees agreed that the three risk types are useable for categorization and a priority could be made in these three risk types (appendix 13.3Appendix C: Elaborated hypotheses from interviews).
Figure 14: Word cloud produced by Atlas TI 8 based on the interview transcriptions. Only words present in sentences containing codes from appendix 13.12 are used for this word cloud, excluding articles and general verbs.

50
The stresstest in practice 4.2The currently applied stresstest indicators, methods and norms found in interviews, document analysis and
process analysis are discussed in this chapter. All four hazards are discussed separately. Every subchapter will first
give a concise overview of the applied indicators and methods for that hazard type. Then the tables represent the
identified indicators in interviews, rated by consensus and priority (a total score) as explained in the previous
methods chapter. Lastly, a more detailed elaboration will be given on the most important indicators, methods and
norms. The last subchapter will elaborate on two identified interdependencies within the stresstest.
4.2.1 Heat stress
All process diagrams (visible in appendix 13.1) identify temperature based on secondary (model output) hazard
indicators for heat stress. In combination with human capital (i.e. demographic) indicators (mostly % of elderly
people, elderly homes or just defined as % of vulnerable people), health- and livability risk impact chains are
primarily identified. A clear damage risk is not indicated. Only Climate Adaptation Services and Nelen &
Schuurmans indicate that movable bridges are taken into account into risk maps which could be applied for
damage risk. Other sporadic indicated consequence indicators are vulnerable utilities, infrastructure and event
locations.
The acknowledgment of the health- and livability risk impact chains and not the damage risk can also be
seen in Table 12 by the given priority in interviews. Consensus on applicable hazard indicators is highest on UHI
and PET with a distinction between daily maximum temperature for heat-livability risk and minimum night
temperature for heat-health risk. An elderly population indicator and the presence of (shopping) public during the
day are stated as most important consequence indicators. A more detailed elaboration is given below Table 12.
Table 12: Summary of heat indicators mentioned in interviews, evaluated by priority and consensus. All are categorized by impact chain (risk) type. () indicates that the indicator is a component of the stated composite indicator between the brackets. [] indicates that the indicator is an indirect indicator of the indicator between brackets. The indicator types are [H]azard-, [C]onsequence- or a combined [R]isk indicator. [H]azard indicators can be climatic- or system indicators. [C]onsequence indicators are classified as [HC] Human Capital, [NC] Natural Capital, [BE] Built Environment, [SE] Socio-economic or [GI] Governance & institutions.
Indicators
Indicator category
Indicator type C / H / R
Consensus interview
count
Risk priority 0 / 1 / 2
Heat-general Distance to cool areas Climatic / System H 2
Heat-livability
6
Daily UHI Climatic / System H 3 Daily max. PET Climatic / System H 2 Daily max. temperature Climatic H 3 Air quality Climatic H 1 Radiation (PET) Climatic H 2 Air moisture (PET) Climatic H 2 Shade [Radiation] Climatic H 2 Land use (UHI & PET) System H 4 Grey areas System H 2 Green areas [air moisture] System H 2 Blue areas [air moisture] System H 2

51
Tree characteristics [Shade] System H 1 Building characteristics [Shade] System H 1 Shopping public Human Capital C 2 Elderly population Human Capital C 2 Perception Human Capital R 1 Heat-health
6
UHI Climatic / System H 2 PET Climatic / System H 3 Min. night temperatures Climatic H 3 Indoor temperature [night T] Climatic H 1 Land use (UHI) System H 1 Green areas System H 2 Blue areas System H 2 Neighborhood typology (UHI & PET) System H 2 Building characteristics (UHI) System H 1 Elderly population Human Capital C 4 Heat-damage
0
Movable bridges Built Environment C 2 Productivity reduction - R 1 Energy consumption - R 1
For heat-livability the daily temperatures are crucial, but for heat-health the nightly temperatures. “The
night temperature represents the temperature indoors and is an indicator for health risks” [102]. The daily
maximum UHI and PET temperatures, calculated primarily by radiation, temperature and air moisture influenced
by land use types and building characteristics are preferably combined with a human capital (i.e. demographic)
indicator to express livability risks. The wind parameter is excluded by most parties because “…, we assume that
wind is negligible on heat stress days” [102].
Heat stress models resulting in a secondary heat hazard
indicator are applied by all providers with a process diagram. Only
Arcadis applies a historic surface temperature map. The models
result in urban heat island (UHI) and physiological temperature
(PET) indicators, which are dominantly GIS based, such as the
UCAM method [34] used by Witteveen + Bos. Aveco uses a heat
stress map from the Tygron model [124].
Land use types and building characteristics are often
combined in neighborhood typologies such as defined by Stewart
and Oke [94], mentioned in documents of at least 2 companies. In
the interviews neighborhood typologies are also mentioned for the
pluvial flooding topic. The UHI effect can also be calculated by a
common method created by Unesco-IHE [124] which makes use of temperature changes due to land use types
(Figure 15) where a grid cell is influenced by surrounding grid cells and is calculated through a weighted sum
function. Heat risk indexes
Figure 15: ΔT of a land use by the Unesco-IHE [4] method.

52
The Urban Climate, Assessment & Management method (UCAM) [34]
combines the UHI- with physiological indicators into a heat risk index for human
health due to heat stress and air contamination: UC-index = (Heat-index + Air
Quality-index)). Threshold values for the applied indicators from figure 16 on
acceptable/unacceptable risk levels, such as 21.5 °C for the actual measured
temperature, are derived from literature study and the air quality index guidelines
from the RIVM and the EU.
A notable exception on the mentioned indicators is the “distance to cool
areas” indicator “…, because it focuses on cool areas and not on hot areas. It is an
indirect indicator directly linked to an action perspective and solution” [102].
Heat damage has the lowest priority which corresponds with the amount
of applicable indicators shown in Table 12. Only movable bridges were mentioned
twice for the heat-damage impact chain “…, but I think bridge damage is an
overestimated problem. Signal it and then go on with more important aspects” [102]. This is probably caused by
expert recognition where “…, sometimes a great deal of knowledge is pretended”
[102]. This is however mentioned multiple times throughout the whole heat theme
where statements were introduced like “heat-mortality deaths can also be caused
by other characteristics of the person such as their health itself” [102] and "the
causality of the cause-effect relationship is visible, but it is not quantifiable and the indicators are difficult to
determine" [102]. The causality between hazard, consequence and risk indicators is not evident, but as stated in
the previous paragraph, certain explicit hazard and consequence indicators are identified through this exercise.
Only one norm used for heat stress was mentioned in three interviews. They use a threshold level for
minimum nightly temperatures of 20 °C where health risks can occur.
4.2.2 Drought
For drought, damage- and health risk impact chains can be identified in practice, which is not the case for livability.
This is presented in Table 13, where the priority score of livability is zero, for the others respectively 4 and 5 and
the lack of indicators for livability. Drought-damage risks are mainly identified by investigating subsidence and its
effects on the built environment and drought-health risks by investigating water quality degradation and its effects
on human health.
Drought stresstests are often performed superficially by simple indicators
when combined in a climate adaptation stresstests or extensively as a
separate project [102]. The interviews (of which the indicators are
summarized in Table 13) and process diagrams indicate that the
groundwater level, often the mean lowest groundwater level (GLG), is the
most general and accessible drought hazard indicator. For more in-depth
analysis, geohydrological models (e.g. WenR/Deltares models) are applied
to calculate subsidence or more detailed groundwater levels. Figure 17
displays required primary hazard indicators for a general subsidence
model. Of 3 companies is known that water quality is investigated. This
can be done by investigating key quality factors with for example PC-Lake,
but these are detailed projects not often applied.
Figure 16: Snapshot from Process Diagram 20 in appendix 13.1 indicating primary hazard indicators applied in the UCAM method.
Figure 17: Altered snapshot from the process diagrams of SWECO, CAS, Aveco de Bondt and Tauw in appendix 13.1 displaying indicators for a general subsidence model.

53
Combination of the subsidence-, groundwater level- or water quality hazard indicator with consequences is
primarily done by overlaying the maps. Only Climate Adaptation Services indicates that the “Waterwijzer” tool
from STOWA [125] can be applied for calculating drought effects on agriculture and nature.
Table 13: Summary of drought indicators mentioned in interviews, evaluated by priority and consensus. All are categorized by impact chain (risk) type. () indicates that the indicator is a component of the stated composite indicator between the brackets. [] indicates that the indicator is an indirect indicator of the indicator between brackets. The indicator types are [H]azard-, [C]onsequence- or a combined [R]isk indicator. [H]azard indicators can be climatic- or system indicators. [C]onsequence indicators are classified as [HC] Human Capital, [NC] Natural Capital, [BE] Built Environment, [SE] Socio-economic or [GI] Governance & institutions.
Indicators
Indicator category
Indicator type C / H / R
Consensus interview
count
Risk priority 0 / 1 / 2
Drought-general
Groundwater levels (GWL) Climatic / System H 5
Surface water level (SWL) Climatic / System H 1
Precipitation Climatic H 1
Evaporation Climatic / System H 1
Infiltration capacity System H 1
Precipitation shortage [Precip. – Evap.] Climatic H 1
Drought-livability 0
-
Drought-health
4
Water quality (WQ) Climatic / System H 3
Phosphate load (WQ) System H 1
Nitrate load (WQ) System H 1
Water depth (WQ) System H 2
Temperature (WQ) Climatic H 2
Ecology Natural Capital C 2
Swimming water locations Human Capital C 2
Drought-damage
5
Agricultural production Natural Capital C 2
Cooling water supply utilities (SWL) Built Environment C 1
Subsidence (Subs.) Climate / System H 4
Utility infrastructure (Subs.) Built Environment V 1
Transport infrastructure (Subs.) Built Environment C 1
Water infrastructure (Subs.) Built Environment C 1
Building year [Wooden foundations] Built Environment C 4
Nature (Precip. – Evap.) Natural Capital C 2
The most important indicators identified above will be given some elaboration. The projected change (in
meters) of the GLG for 2050 is done by a National Water Model [126], for the Deltaplan Fresh Water 2016 and
KNMI Delta scenario’s. The other general indicators mentioned in Table 13 influence the groundwater levels. The
groundwater level is thereby an indirect and broadly used indicator for several reasons;

54
Drought is a long periodical process, but the stresstest mostly looks at extreme short periods. Indices such
as “precipitation shortage” are not common in practice, because they require a long period of data and
often not providing action perspective as precipitation itself cannot be influenced. This action perspective
is present for water availability control indicated by groundwater levels.
Due to a lack of long term and detailed open source data for easy in-depth modeling of drought (e.g.
precipitation, evaporation, infiltration, etc.), one indicator with available data such as groundwater levels
are used.
The land use nature of the study area has an effect on the use of a general climate drought indicator as “…
drought indices are not used, because we focus on urban areas. The drought indices can be useful for
rural areas” [102].
When there is referred to drought-health, water quality is prominently mentioned. “We approach water
quality from the perspective of a nutrient balance. Including phosphate-and nitrate load, water depth, and
temperature, called key factors" [102]. During droughts, temperatures rise and water depth decreases, increasing
nutrient loads and thereby decreasing water quality. The identification of nutrient loads was however only done by
Witteveen + Bos. In contrast, Nelen & Schuurmans and CAS displayed chloride- and oxygen concentrations as
water quality indicators in their online climate effect atlas. A conclusive consensus on water quality “key factors”,
except water depth, is therefore not present. In the interviews was stated that ecology and people are vulnerable,
but no specific indicators were mentioned for these groups.
Water quality is an important topic in the interviews, but regional modeling35 with Geo data is still difficult. It
can also act as a hazard indicator in drought “due to surface water level decline and rising temperature” [102] or in
pluvial flooding as “degraded water quality can result in a health risk by sewer overflows” [102].
Drought-damage is primarily identified by subsidence consequences for the built environment and secondly
by vegetation stress for the natural environment. Subsidence is modeled or derived by combining groundwater
levels with soil types as demonstrated in Figure 17. Subsidence can be calculated by oxidation with compaction of
peat- and clay soils and compaction in urban areas by soil heightening. Deltares, WEnR and TNO created a
subsidence map in the Climate Effect Atlas [13]. Also historical data can be used to measure historical subsidence
(mm/year) with InSar36, which is used to create a new DEM input indicator map.
Mainly wooden building foundations are indicated as vulnerable to lower groundwater levels. The building
period (BAG)37 is almost always used as a proxy indicator for wooden foundation locations. Only 1 interview
mentioned (subterranean- [127]) transport- and utility infrastructure damage indicators, but these indicators are
more common in analyzed documents.
Secondly damages occur due to low groundwater levels combined with nature- and agriculture consequence
indicators that cause vegetation stress. These nature- and agriculture indicators are on a large scale and are used
for rural areas. Urban nature was not discussed in literature. For agriculture, a quantitative economic loss (%)
indicator is sometimes used. The “Waterwijzer Agriculture” [125], based on the PROBE model, making use of soil
type (Alterra), climatological data (KNMI) and groundwater levels (National Water Model [126]), calculates the
effects of drought on agriculture. Nature areas are mapped by using the Information Model Nature38 (IMNa)
guideline [128].
35 Within Tygron, a water quality module is in production [102], [124]. 36 InSar is a radar technique. 37 Buildings from before 1960 [106]. 38 This information model uses Top10NL and IMLG as source data.

55
A clear consensus on a nature stress/damage indicator does not exist. However, documents indicate that cold-
and warmth-loving vegetation types are sometimes used as indicators for vegetation stress and a “Waterwijzer
Nature” [125] is in production. Forest fire risks are displayed by maps from the National Risk maps [27] which is
also based on a vegetation type classification, but not discussed in the interviews. This topic is however highly
dependent on expert judgment of the risk maps.
Lastly, only soft boundary principles and a guideline was mentioned for drought-health (water quality) and
none for drought-damage. Witteveen + Bos and Tauw mentioned “a threshold norm of 20 °C, extracted from
literature. This is however not confirmed with the RIVM” [102]. From this temperature, algae growth increases
rapidly of which some types can impose a health risk for people and ecology alike. Secondly the swimming water
guidelines are mentioned by almost all parties, in interviews and/or documentation.
4.2.3 Pluvial Flooding
A wide range of pluvial flood risks are visible in the process diagrams (appendix 13.1); damage risk, accessibility
reduction risk, water nuisance risk, erosion risk, oxygen stress and health risks. Health-, damage- and accessibility
reduction risks are the most common and extensively elaborated. Table 14 displays this by the priority given to
health- and damage risk, respectively a priority score of 4 and 5. No indicators were specifically identified for the
term livability, but accessibility reduction was often mentioned as a pluvial flooding risk, which could be
categorized under livability. Damages are mostly monetized through water damage estimators of which the
‘Waterschadeschatter’ [129] is probably the most known. Health risks are often qualitatively displayed.
The secondary hazard indicator always consists of an inundation depth map and often a flow path map to
investigate the origin of the flooding. These maps are produced by different models, such as 3DI [93], Tygron,
[124], GIS applications, SOBEK and/or Infoworks. Which model is applied is dependent on the companies and
stakeholder’s expertise and preferences. Performing a stresstest for a stakeholder with the tools they have
available is often preference [102]. Consequence indicators are related to land use and mostly built environment
(BE) indicators, such as building- or infrastructure type/area/characteristics/density due to their action
perspective. Table 14 gives a more detailed view of the indicators mentioned in the interviews.
Table 14: Summary of pluvial flooding indicators mentioned in interviews, evaluated by priority and consensus. All are categorized by impact chain (risk) type. () indicates that the indicator is a component of the stated composite indicator between the brackets. [] indicates that the indicator is an indirect indicator of the indicator between brackets. The indicator types are [H]azard-, [C]onsequence- or a combined [R]isk indicator. [H]azard indicators can be climatic- or system indicators. [C]onsequence indicators are classified as [HC] Human Capital, [NC] Natural Capital, [BE] Built Environment, [SE] Socio-economic or [GI] Governance & institutions.
Indicators
Indicator category
Indicator type C / H / R
Consensus interview
count
Risk priority 0 / 1 / 2
Pluvial Flood-general
Precipitation event Climatic H 3
Inundation depth Climatic / System H 5
Flow path Climatic / System H 4
Sewer system storage System H 2
Sewer system discharge System H 2
Surface water storage System H 2
Surface water discharge System H 2
Land surface storage System H 2

56
Land surface discharge System H 2
Critical infrastructure Built Environment C 2
Event frequency acceptance Human Capital C 3
Pluvial Flood-livability 4
-
Pluvial Flood-health 0
Swimming water locations Natural Capital C 1
Sewer overflow locations Built Environment C 1
Pluvial Flood - damage 5
Building type Built Environment C 3
Flooded area versus total area (%) Climatic / System H 1
Land use function (economic value) Built Environment C 1
Flooding acceptance Human Capital C 1
Neighborhood typologies Built Environment C 2
The inundation depth and flow path39 are the model outputs that
indicate the effect of a precipitation event. Flow path does not indicate
the severity of a hazard, but is applied as an indicator on where to
implement measures. These precipitation events are combined with “...
sewer-, surface-, and overland flow characteristics in a model” [102].
Most interviewees believe “… that the inclusion of sewage and surface
water in a model is more important than the discussion on precipitation
events” [102]. These characteristics are divided in storage and discharge
parameters where a wide range of system specifications (e.g. sewer
diameter) or indirect indicators (e.g. street storage by DEM differences)
are applied, visible in Figure 18. Some interviewees do find the intensity
of precipitation events less important, but still indicate certain common
events, such as a T = 100 year event or a 50/60 mm/couple of hours
event because we “… must not focus on a continuously larger event. We
think an event with a medium intensity gives the best idea of regularly
flooding nuisances” [102]. Also, instead of single events, often sets of
events are used to perform a sensitivity analysis.
39 The flow path only shows the route water takes during an event. It can help determine if a water nuisance problem is caused locally or elsewhere.
Figure 18: A process diagram snapshot from Aveco de Bondt, Sweco and Tauw (in appendix 13.1) with primary hazard indicators applied for inundation modeling.

57
A wide range of models is used for pluvial flood modeling.
A study by STOWA [38] concluded that the hydrological results
between the most used models in stresstests; 3DI [93],
Infoworks and Tygron [124] among other models did not differ
significantly. They all provide, including the geo-based WOLK
and WAAK method, the same output indicators; inundation
depth and flow path. Figure 19 shows which sub-systems can
be included in all models, but with different reliabilities based
on applied functions, detail and data. Within Tygron, for
example, every building type or infrastructure type has a
threshold value and an importance value, directly valuing the
risk from flooding.
Pluvial flood-damage risk is prioritized highest and one
specific consequence indicator is primarily mentioned in
interviews and documentation; building type. But also neighborhood typologies, as elaborate by a publication of
the Amsterdam University of Applied Sciences (AUAS) [102] and Tygron, based on another publication of AUAS
[130], are used. The first publication created “4 neighborhood typologies … designs for a climate adaptive and –
resilient street. … Every neighborhood typology has a certain land use and other characteristics which were
translated into a typical street profile with storage, height differences and flow paths. The damage risk is
approximated by the inundation depth on the street … The total result is a risk profile for each neighborhood
typology. ... All neighborhoods are generalized to fit within these 4 typologies” [102]. The second publication
identified 14 typologies based on characteristics like building age, build height, building density, green area and
building function. The building age and height are classified in quantitative categories. A categorical indicative
consequence score is added to the typology.
The pluvial flood damages can be monetized when built environment indicators are used, which is often the
case. The existence of basements or subterranean infrastructure like tunnels are such built environment indicators
not mentioned in interviews, but identified in documentation. The groundwater maps can be used as hazard maps
to identify these flooding risks. This is implemented by CAS [13] and quantitatively categorical displayed (Table 15).
Table 15: Probability on groundwater nuisance in 2050 (translated from the Climate Effect Atlas [13])
Classes Groundwater level increase rural (m)
Groundwater level increase urban (m)
Groundwater depth (m)
Very high increase probability >0,5 >0,3 <1,1
High increase probability 0,2-0,5 0,1-0,3 <1,1
Medium increase probability 0,05-0,2 0,03-0,1 <1,1
Low increase probability <0,05 <0,03 <1,1
As stated in the drought-health paragraph, water quality is also a concern in the pluvial flood-health impact
chain, but not often mentioned in practice. Sewer overflow locations are activated during flood events and
thereby decrease surface water quality. It is affirmed however that the cause-effect relationship between people’s
health and surface water quality during or shortly after events is weak.
Figure 19: Tygron inundation model process diagram [117].

58
No indicators were specifically identified for livability, but accessibility reduction was often mentioned as a
pluvial flooding risk. The inundation depth indicator combined with a built environment indicator (e.g. national
road map (NWB)) is mentioned frequently in interviews [102]. Only for this risk combination common norms are
defined by almost all parties [102]. These are generally classes of inundation depth such as:
1. Passable (< 0.05 m), passable for emergency services (0.05 – 0.3 m), not passable (> 0.3 m).
2. Passable (< 0.1 m), passable for emergency services (0.1 – 0.25 m), not passable (> 0.25 m).
Aveco [102] defined inundation depth threshold principles for a combined built environment indicator;
Negligible risk (< 0.05 m), small risk (0.05 – 0.15 m), medium risk (0.15 – 0.3 m), high risk (0.3 – 0.5 m),
unacceptable risk (> 0.5 m). Tauw defined one threshold level of > 0.25 m above street level for built environment
risk.
Lastly an event characteristic, frequency of hazard occurrence, can be a consequence indicator on itself which
indicates livability risks as is thrice mentioned. Often a return period of T = 2 years is used as minimum threshold
principle for inundation.
4.2.4 Fluvial- & Coastal Flooding
The fluvial- & coastal flooding topic is least discussed in interviews and has a limited presence in the process
diagram in appendix 13.1. Interviewees indicated that this is probably due to the lack of action perspective;
“pluvial flooding is more interesting, because those inundation depths balance on the tipping point of your action
perspective” [102] and it is “…mainly linked to mitigation and the Deltaplan: Flood Risk Management” [102].
Therefore there was no priority given by interviewees or any indicators specifically identified for the damage-,
health- or livability risk impact chains as is visible in Table 16.
The hazard maps consist dominantly of flood depths from the national LIWO system [131], which were created
for the water safety assignment in the Netherlands and the source for all interviewed parties. The process
diagrams show that these are mostly combined with these consequence indicators; building- or infrastructure
(utility) type and emergency service routes. The evacuation fraction maps are not applied often, but mentioned as
useful in the interviews [102]. They indicate vulnerable locations based on vertical- and horizontal evacuation
possibilities. The resulting risk maps are primarily produced by overlaying the hazard- and consequence map as
qualitative products and not quantitative.
Table 16: Summary of fluvial- & coastal flooding indicators mentioned in interviews, evaluated by priority and consensus. All are categorized by impact chain (risk) type. () indicates that the indicator is a component of the stated composite indicator between the brackets. [] indicates that the indicator is an indirect indicator of the indicator between brackets. The indicator types are [H]azard-, [C]onsequence- or a combined [R]isk indicator. [H]azard indicators can be climatic- or system indicators. [C]onsequence indicators are classified as [HC] Human Capital, [NC] Natural Capital, [BE] Built Environment, [SE] Socio-economic or [GI] Governance & institutions.
Indicators
Indicator category
Indicator type C / H / R
Consensus interview
count
Risk priority 0 / 1 / 2
Fluvial- & Coastal Flood-General
Inundation depth Climate / System H 3
Protection work performance System H 2
Evacuation time Governance C 2
Awareness Human Capital C 1
Building height (number of dry levels) Built Environment C 1

59
Vital functions (VF) Built Environment C 3
Hospitals Built Environment C 2
Utilities Built Environment C 2
etc. Built Environment C 2
Critical infrastructure Built Environment C 2
Witteveen + Bos stated that “mainly damage- and accessibility (health) risks” [102] can be important for this
topic. This is in consensus with Table 16 where inundation depth and vital functions the main indicators. All
indicators (except evacuation time and awareness) are inundation-built environment risk impact chains.
CAS [13] displays a success probability effect reduction map which indicates the chance of success for
reduction of flood consequences and is thereby not a “normal” hazard or consequence indicator like earlier
mentioned distance to cool areas and hazard frequency indicators. The success classification (qualitative) is based
on categorization of flood magnitude (< 0.5 m, 0.5 – 1 m, > 1 m) and return period (< 102, 10
2 – 10
3, 10
3 – 10
4, 10
4 –
105, 10
5 – 10
6, > 10
6).
Lastly, several documents and one interviewee identified that the # number of dry building levels is a useful
indicator for vertical evacuation possibilities and calculation of damages calculation. The floor height is
standardized on 2.65 meter [13], [131]. Besides the number of dry building levels there are no standardized water
depth thresholds. There are however threshold values which indicate the accessibility of infrastructure during
floods. National guidelines [131] indicate if roads are still accessible (yes/no) for military emergency services during
evacuation, but not for general (medical, police or fire) emergency services.
4.2.5 Interdependencies
The four hazards are separately analyzed, which is in line with the interviewees. 6 interviews agreed on hypothesis
1 in appendix 13.3; “The stresstest should be evaluated in an integrated context, but the specific theme's should
individually be analyzed” [102]. However, “you cannot perform a stresstest, risk dialogue and implement measures
separately. They are intertwined with feedback loops, wherein the risk dialogue is present in every step of the
process” [102]. This is the case for all stresstest providers. The interdependencies which encountered are;
Indicator interdependencies, which are visible in the process diagrams. Process Diagram 1 from SWECO
and its snapshot in Figure 13 gives an example of indicator influence between hazard types. The process
diagram from Sweco in Diagram 1, shows that the subsidence indicator is dependent on the groundwater
levels. Therefore the groundwater level indicator influences both the subsidence risk indicator and the
drought damage risk indicator. The groundwater levels are also connected to the pluvial flooding
indicators as it influences the available storage capacity in the subsurface. Even “the groundwater level is
… dependent on your surface water level management” [102].
Feedback loops, already displayed in the conceptual framework of this research in Figure 3. These
feedback loops identify influence of output (e.g. adaptive measures) on the input (e.g. stresstest input).
For example the detail of indicator is dependent on the nature of the adaptation decisions, because “…
the nature of the investment decision is leading for the detail of the cause-effect (risk) assessment and its
data” [102]. This is substantiated by the statement that indicators are chosen, based on “… whether data
available for these indicators” [102].

60
Risk evaluation in practice 4.3After risk identification through a stresstest, evaluation will follow. Risk evaluation methods are diverse (as
displayed in Figure 20) and are in practice never performed linearly and more simultaneously. However, next
paragraphs will follow and discuss the components of a generally identified linear approach applied in practice
which consists of 1) process stresstest output data (i.e. risks), 2) prioritize risks (possibly supplemented by a risk
matrix), 3) create an adaptation plan (possibly supplemented by measure prioritization and/or cost-benefit
analysis) and 4) monitoring of effects [102].
Figure 20: This process diagram snapshot (from different diagrams in appendix 13.1) displays risk evaluation steps from Witteveen + Bos, Sweco and Tauw (from left to right) in a linear order.
4.3.1 Stresstest output
Firstly, the stresstest output (i.e. risk) is processed such that it can be evaluated. Different views exist on how to
achieve this of which normalization and monetizing are most often described. 4 out of 7 interviews agreed that
normalization could be helpful in displaying stresstest results and the same amount agreed that monetization
could be helpful. Almost every company has its own method for normalization and monetization:
Normalization by creating indexes is widely used, such as a “… normalized index in ‘Staat van je Straat’”
[102], the UCAM method for heat stress [34] and “… a yearly sustainable city index. This index helped to
convince cities to act on their weaknesses. The political administrative discussion can be strengthened
with these indexes” [102]. “An example of a widely spatial normalized index is the national traffic-jam-

61
top10, which varies due to infrastructure interventions. … It may be useful for realization of measures and
prioritizing risks …” [102].
Monetizing can quantitatively strengthen the administrative discussion and damage calculators are
therefore widely used. However not all risks or measure effects can be monetized as “… from a total of 20
measures, 12 can be monetized at the moment in one of our projects” [102]. When costs and benefits can
both be monetized, cost-benefit analyses can be used, which in practice is almost always only the case
with pluvial flood risk assessment [102]. The most used freely accessible damage calculator
(“waterschadeschatter”) [129] from STOWA which includes several damage functions. The inundation
depth and a composite land-use map are the input indicators. The composite land-use map consists of a
combination of land use-, building- and infrastructure types. CAS mentions the use of a comparable
damage estimator, the Clico-tool [14].
4.3.2 Prioritizing
Second, prioritization of identified risks is a widely used method to increase decision making effectiveness and
primarily to identify hotspots. Prioritizing is based on (political) ambition which can deem a hotspot as an
unacceptable-, undesirable- or acceptable risk [102]. “Local judgment, political ambition, has to be incorporated in
the value of a hotspot through a weighting factor in any form” [102]. Setting the level of ambition for prioritizing
can be done through stakeholder sessions and a risk-matrix can be used as a tool. However, “the result of this
dialogue can almost never be displayed as one list that can be prioritized as it is often scattered over different
departments” [102]. The methods applied for prioritization is very diverse, as it can for example “… be done via
opportunism. Maintenance, construction and/or renovation can be leading in prioritization of the measures and
tackling of risks” [102].
4.3.3 Stakeholder dialogue
In addition, the whole evaluation phase is linked with constant stakeholder dialogues which makes this “… not an
abstract, objective, but very subjective process phase. The dialogue determines the results” [102]. From hypothesis
(2) and (3) in appendix 13.3 can be deducted that the evaluation of risks is mainly dependent on stakeholder
judgment and ambition. Hypothesis 2 states that the stresstest goal is producing data, activating the risk dialogue,
quantifying/identifying risk or identifying cause-effect relationships. Hypothesis 3 states that guiding principles are
a combination of stakeholder and expert/scientific judgment. The stakeholder discussion/dialogue therefore
depends on risk evaluation.
Within the decision making process one principal stands out, which is ‘decision by consensus’ (in Dutch
‘poldermodel’). The ‘serious gaming interface’ of the Tygron model [124] represents this principal. Stakeholders
can act in the model environment at the same time. It can be used for direct evaluation and discussion of measure-
and action effects. Evaluation is done through this interactive serious gaming by multiple stakeholders. Every
stakeholder has a budget and can implement measures which affect the model indicators, affecting the output
indicators and thereby the resulting risks. Most other stakeholder discussions try to achieve the same result,
consensus, but by other methods. This can result in different outcomes, of which “we do nothing” [102] can be a
result.
4.3.4 Adaptation plan
Third, an adaptation plan or plans are created. Practical experience of the interviewees also identified that often
not all measures can be merged into one executable program. Therefore some interviewees identified that “1) the
biggest identified risks (hotspots) can be executed in one climate program and 2) a budget is made available to
achieve awareness or stimulate other (e.g. pilot) projects and –studies” [102].

62
The main goal of the adaptation plan is the selection of measures. Sometimes a cost-benefit or multi-criteria
analysis was applied, but interviewed companies did not specify any general approach. The selection of measures
is for example sometimes substantiated by the Climate App [132], or the more advanced Adaptation Support Tool
(AST) from Deltares [105] which produce inspiration and support co-creation of adaptation plans in multi-
stakeholder dialogues. These tools display the effect of a measure through a selection of indicators, which can act
as stresstest input indicators (such as storage- or infiltration capacity). This cyclical feedback can also be seen in
Tygron where the measures are connected to a hazard input indicator for heat stress (hazard- or consequence
indicator) like the livability or water nuisance indicator [124]. Some tools like the financial and socio-economic
valuation in Tygron [124], AST [105] or the TEEB-city tool [13] directly calculate the costs of measures.
4.3.5 Monitoring
Lastly, monitoring, which is evaluation over time, was addressed in the interviews, but not in the process diagram.
It is a partially separate process from the actual risk evaluation as it is a long term process spanning a continuous
or multiple (dependent on actual implementation in reality) climate adaptation processes. The interviewees stated
that monitoring would be preferable and useful on a) the effects- and b) the implementation of the measures.
There should be monitored on the execution of the measures as intended, but even more on the intended effect
[102].
Where and how to standardize? 4.4Subsequent to the objective questions identifying the indicators, methods and norms applied in risk identification
and –evaluation, some interview time was spent discussing ‘how and where to standardize?’ This subchapter will
discuss the interviewees view on this question by mainly using the hypotheses in appendix 13.3 and is of a
subjective nature. First, three characteristics of the Dutch climate adaptation process broached by the
interviewees will be presented. Then several views on where to standardize will be given.
4.4.1 Nature of the Dutch climate adaptation process
It is mentioned multiple times in the interview that the defined nature of Dutch climate adaptation, through a risk
approach, influences the available stresstest approaches. One of the interviewees described “… climate adaptation
as we treat it in the Netherlands is a problem in which 1) several parties are interested in taking action, 2) have a
task and 3) problems are above-normative. These 3 elements make sure that a climate effect atlas approach is the
most obvious approach” [102]. The extensive use of the Climate Effect Atlas and/or comparable atlas methods
(such as Nelen & Schuurmans personal Climate Atlas) substantiates this conclusion. “It is an easy method to
explain the tasks at hand” [102].
Secondly it is evident that “local political choices are crucial… as there are no clear responsibilities” [102]. The
stakeholder discussion on priorities and the ‘maximum acceptable risk’ as discussed in previous subchapter is
therefore crucial. From practice experience the interviewees state that this positively influences awareness of the
residual risk and improves the level of local climate expertise [102].
Lastly, national stimulation on defining and identifying risks, ambitions and goals instead of achieving a certain
broadly acceptable norm (i.e. legal/resistance norm) was found to be beneficial [102].
4.4.2 Where to standardize?
Within the interviews some views on ‘where’ to standardize are given. Two different approaches where discussed;
1) standardize specific components (norms/principles, indicator data or process) or 2) standardize on input, output
or process (i.e. IPO). The views on the first approach are;

63
On norms/principles: "If you would talk about standardization, you would talk about the standardization
of the principles used for every process step." "A model provides objective facts. However, you need to
insert guiding principles to be able to evaluate the results" [102]. “The weighing of the risk is locally
defined. Defining the boundary conditions can be uniform” [102]. But 7 out of 7 interviews agreed
(hypothesis 5 in appendix 13.3) that standardization through legalized norms should not be pursued, but
general principles are useful.
On indicator data: “Standardization of a basic level, choice and -quality of input data/-indicator should be
the main priority” [102], because “… you will need a basic quality and a standard release frequency of
open source data …, so comparison is possible” [102]. Thereby some mention that you have to “…
increase the availability of knowledge. A report has more value when it focuses on the content and says
"the public health services think this", instead of a guide on the process” [102].
On process: “I think you should perform small stresstests to achieve a successful stresstest without a clear
programmed process setup” [102].
The second approach was suggested different in contrast to the three options presented above; discuss if to
standardize the stresstest input, indicators and data, or the result of the stresstest, by standardizing risk indicators.
Another remark closely related states; “When you start reasoning from the data-side, you follow the Rioned and
STOWA reasoning …, and you always need the most detailed information (data/models) to make a decision …
while a simple principal as 'no regret' is more successful” [102]. 5 out of 7 interviews agreed and 2 had no opinion
on hypothesis 11 (in appendix 13.3) stating essential impact chains are key to standardization. One interviewee
formulates that "firstly it is important to know which determining (primary) indicators are affected. If you have
clarified that, I think you can standardize” [102].
The dominating view on where to standardize is that general guiding principles (i.e. practical standards) are always
useful, but should not be legalized and be treated as resistance norms, such as the flooding standards [102].
Instead it would be useful, before goals are formulated and data is analyzed, to define a minimum set of
requirements (e.g. risk types, cause-effect relationships, etc.).

64
5 Discussion of literature and practice
3) What are the similarities and differences between theory and practice?
The previous chapter identified which indicators, norms and methods are applied in practice and where/how
standardization should take place. These results are compared with the conclusion of the theoretical framework to
achieve a practical and scientifically acknowledged idea on where and how to standardize. The first subchapter will
discuss ‘where’ (or which components) to standardize in a narrative structure. The second subchapter will discuss
‘how’ to standardize these components. The conclusions of these discussions act as the basis for chapter 6 where a
design for a standardized process framework is presented.
Where to standardize 5.1The interviewees view on ‘where’ to standardize was presented in the last paragraphs of previous chapter. This
concluded in standardization by defining a minimum set of impact chains, its cause-effect relationship and
corresponding indicators before standard principles and data are defined. In terms of the input-process-output
(IPO) approach this translates into; define stresstest output (i.e. risk impact chains and required indicators), before
proposing standards for the input or system characteristics (such as models or methods). In short this can be
described as; don’t standardize the input when the desired output is not defined yet. This subchapter will discuss
arguments given by practice and compared with literature to substantiate this conclusion in a narrative structure.
The last paragraph will conclude with a process framework identifying the components which should be
standardized.
5.1.1 Action perspective
Firstly a crucial component of the climate adaptation process is cyclical feedback between implemented
adaptation measures and the stresstests input; primary hazard (climatological or system) indicators. Stresstest
guidelines [18], [107] broached the importance of cyclical processes within climate adaptation, which is affirmed
by the interviews [102] in paragraph ‘4.2.5 Interdependencies’. These guidelines mentioned this in general terms
and figures (such as Figure 1 and Figure 3 in the introduction), whereas the interviews and process analysis
strongly indicated the cyclical connection between the final adaptation process result (i.e. adaptive measures), and
input data (i.e. hazard- and consequence indicators) for the stresstest. This is visible in Process Diagram 1 on page
48, where the ‘measures’ are connected with primary input indicators by feedback arrows. Several tools and
models, such as Tygron [124] and the AST, incorporate this where indicators (e.g. building types, land use types,
groundwater levels, sewer storage) in these tools are directly influenced by the resulting adaptation measures.
This concludes that if a measure does not affect one of the stresstest input indicators (hazard and consequence),
and thereby the stresstest output (the risk), the indicator is not properly representing the climate hazard, system
or vulnerable systems/people/objects.
This feedback relation represents action perspective. Action perspective in climate adaptation can be
seen as the capacity of a stakeholder to reduce climate risks by adaptation measures. Action perspective was
found to be crucial [102] for identifying risk with the goal of reducing that risk. The identification of risks is
therefore only effective when actions (i.e. adaptation measures) can be taken to reduce that risk. A correct cyclical
feedback, where measures affect indicators of the stresstest, secures this action perspective. An option to
implement a correct cyclical feedback, investigated in this research, is defining the risk impact chain through
scientific- and practical acknowledged cause-effect relationships. This way, a) stresstest indicators supporting
these impact chains and b) adaptation measures affecting these impact chains can be defined.

65
5.1.2 Applicability of risk assessment techniques
Secondly, substantiating the idea of defining risk impact chains is the applicability of risk assessment techniques,
for both risk-identification and –evaluation, described in the theoretical framework. The ISO/IEC 31010 guideline
contains an overview on the applicability of risk assessment techniques, displayed in appendix 13.9. The risk
assessment techniques found (strongly) applicable throughout the complete risk assessment (identification and
evaluation) and also applied in Dutch practice at the moment are; scenario analysis, cause-effect analysis, FN-
curves, risk indices, cost-benefit analysis and multi-criteria analysis. All these techniques have in common that they
require indicators which identify the cause and effect, which is in accordance with the interviewee statements that
“firstly it is the important to know the determining indicators” and correct relationships before you can
standardize the resulting risk [102]. Therefore it is argued that standardization of risk assessment should focus on
the cause-effect relationship, and its indicators (i.e. hazard and consequence indicators). This way all main risk
assessment techniques, applied in Dutch practice and featured as “applicable” from ISO/IEC 31010 [109] can be
applied within a standardized risk framework.
5.1.3 Diversity in the evaluation process
Thirdly, subchapter 4.3 concluded that standardization within the evaluation process, instead of the stresstest, is
not possible due to its enormous diversity in tools and dependence on a stakeholder dialogue. All evaluation
methods try to evaluate/prioritize unacceptable risks and identify corresponding measures to cope with them.
Subchapter ‘4.3 Risk evaluation in practice’ defined a general linear evaluation approach to achieve this, consisting
of 1) processing risks, 2) prioritizing risks, 3) create adaptation plan and 4) monitoring [102]. With theory such a
linear process could not be defined, but it stated that standardization should strengthen this described process to
be a way towards risk reduction and improve comparability, evaluation and monitoring [16], [60], [77], [83], [99].
However, both literature and practice identified the stakeholder dialogue required in this process as crucial and
not possible to standardize as it tries to solve the optimization problem [73], trade-off between costs and benefits,
based on local, subjective and expert judgment and ambition. Some tools, such as Multi-Criteria Decision Analysis
(MCDA) and (Social) Cost-Benefit Analysis (CBA) [9] are often applied to assist this process as the process diagrams
in appendix 13.1 showed, but do not define the results.
5.1.4 Process stresstest output with normalization and aggregation
Lastly, the diverse and stakeholder driven characteristics described in previous paragraph make standardization in
the evaluation process not practical. Therefore it was found to be useful to standardize stresstest (risk-
identification) output which functions as input for risk evaluation to improve comparability, monitoring and
evaluation. Paragraph ‘4.3.1 Stresstest output’ stated that normalization and monetizing are the most applied
methods in processing the stresstest output (i.e. risk) for use in the evaluation phase. From the literature study and
from interviews [102] was concluded that monetizing is a popular method, but that it is often not possible due to
lack of information, especially for less tangible (often qualitative) indicators. Normalization (creating indexes) and
aggregation (e.g. combining hazard and consequence into risk) can however be used for every data type and used
as a semi-quantitative solution, visible in case studies in literature [25], [46], [57] and practice (such as UCAM [34],
Sustainable City Index [102], ‘Staat van je straat’ [102]). Normalization could therefore be a useful tool in
translating stresstest risks into risks which can be uniform evaluated, monitored and compared.

66
5.1.5 Standardized process framework
Based on the narrative of previous paragraphs can be concluded that the stresstest output should be
standardized to improve comparability, evaluation and monitoring in the risk evaluation phase. This narrative leads
to a general risk assessment process summarized below, which contains similarities to the ISO vulnerability
assessment guideline [88]. The steps which can be considered part of the stresstest and are preferably
standardized, based on the previous arguments, are highlighted in bold characters (point 1 till 6). The last step is
also part of the risk assessment process, but should not be standardized as this is the evaluation of the residual risk
by local stakeholders.
1. Identify risk types 2. Identify assumed impact chain, including cause-effect relationships; 3. Define indicators of these impact chains; 4. Define stakeholder/expert criteria and standards; 5. Normalize indicators (include quantitative information/references on data sources); 6. Define aggregation level; 7. Prioritize (weigh the different components, stakeholder process);
How to standardize 5.2Directly subsequent to the answer on ‘where’ to standardize, is ‘how’ to standardize. Previous subchapter
concluded with 6 steps of the stresstest which would ideally be standardized in order to improve comparability,
evaluation and monitoring of the risks. The next paragraphs will discuss ‘how’ to standardize these steps by
discussing identifiable 1) risk types and corresponding 2) impact chains, its 3) hazard- and consequence indicators
and 4) norms/practical standards from literature and practice. How to standardize steps 5 and 6 from the process
framework in previous chapter (i.e. normalization and aggregation) is investigated with a case study in chapter 7.
5.2.1 Three risk types
The distinction between societal-, economic- and individual risks from the Dutch water safety standards, as
described by Kok et al. [50], is used as the most up to date theory on how risk is approached in the Netherlands at
the moment. Throughout the literature research could be concluded that all consequence indicators in Table 9
(paragraph 3.3) are connected to certain hazards and are in some way sensitive through damage, mortality and
harm or reduced livability. These sensitivities could be categorized as damage, which includes reduced value;
danger to life which entails mortality or harm; and reduced livability which includes reduced comfort and
perception/awareness of risk.
Although many synonyms were found in the interviews and document analysis, all could be categorized under
these three risk types on which consensus was found among the interviewees (hypothesis 6 in appendix 13.3);
damage-, health- and livability risk. All of which are consistent with the water safety risk types [50]. Damage risk
entails all damage (a.k.a. reduced value) of objects that can be (semi-) quantified. It is an analogy with economic
risk [50]. Health risk contains all harm to human40 health, including mortality. This risk type is an analogy on
mortality in individual- and societal risk. The reduced livability definition is mentioned in the previous paragraph
and is a component of societal risk. For example, it can be formulated through a utility function [30] based on
psychometric research [74] for awareness, a factor [47], [91], or through indirect indicators, such as demographic
or built environment indicators. These last indirect indicators are applied in stresstests, because they contain
action perspective. The preference for a distinction between risk types could be used for standardization in the risk
assessment where assessed risks can be one of the three risk types; damage, health and livability.
40 … or animal health. That is however an ethical question that won’t be broached in this thesis.

67
5.2.2 Impact chains
Previous subchapter 5.1 introduced the importance of action perspective.
It concluded that defining the risk impact chains by acknowledged
scientific- and practical cause-effect relationships creates action
perspective wherein stresstest indicators are identified which are affected
by the eventual adaptation measures. An impact chain is a representation
of a cause-effect relationship, combination of hazard and consequence
that have a certain effect (risk). In literature several combined risk indices
(cause-effect) were defined.
The cause-effect relationships identified in literature and agreed on in practice are summarized below (first 6
bullets). The highest priority (indicated by bold fonts) impact chain for each hazard theme was given by
interviewees. This corresponds with the amount of references (priority) used in the literature research. These
cause-effect relationships can be displayed by dose response curves as displayed in Figure 21, a copy of Figure 11
in the theoretical framework. Practical implementation of the dose-response method can be applied, like the
UCAM (heat-mortality) method [34] for heat-mortality or the depth-damage curves in the Dutch flood standards.
Heat-mortality
Depth-damage
Drought-subsidence/-foundation damage
Flood-victim
Drought-vegetation stress
Drought-water quality
Depth-accessibility
Heat-livability
Depth-accessibility and heat-livability are important relationships identified by practice, but not specifically by
the theoretical framework. Literature however defined comfort reduction as consequence of heat stress, which
can be seen as a heat-livability risk. Also the accessibility of normal traffic and emergency services during flood is
highly discussed in literature for which general water depth-accessibility principles are defined.
For fluvial- & coastal flooding no priorities were stated in practice (hypothesis 12 in appendix 13.3). The Dutch
water safety approach however prominently includes the flood-victim relationship and many flooding papers
mention flood-accessibility. Probably due to the legalized water safety standards the whole theme of fluvial- &
coastal flooding is marginal in stresstest conversation and execution.
A problem in defining impact chains for risks are knowledge gaps. Certain topics are still less researched at the
moment and thereby have less conclusive impact chains which are generally acknowledged, such as drought and
heat stress. Further research for clarification in Dutch practice on these impact chains is thereby preferred; “With
more money for research I would prefer more insight in the correct cause-effect relationships” [102].
Figure 21: An example of a dose response curve [43].

68
5.2.3 Hazard Indicators
Hazard indicators are categorized as input- (primary) or output (secondary) indicators, and climate- or system
indicators. For risk identification, output hazard indicators of models, as mentioned in the first discussion chapter,
are important. The discussion on which indicators to use for the risk assessment are thereby focused on these
output hazard indicators.
Literature stated that hazard indicators include a frequency (recurrence), duration, intensity and extent
(scale) component [15], [61], [96], [103], [115], [118]. Defining these characteristics for a primary hazard indicator
is crucial when performing a hazard assessment through scenario- and probability analysis. When these are
implemented in a model with system indicators, it was found through interviews that the output hazard indicator
does not explicitly need these characteristics as the intensity and extent often serve the goal; spatially compare
vulnerable locations between each other (not compare through time). - For example; a precipitation event (50
mm/hour for 5 hours over 10 hectare with a T=100) is modeled which creates inundation depth as output. The
most important aspect of this output indicator is the intensity/magnitude (e.g. inundation depth) of the hazard on
a certain location and time which can be combined with a consequence indicator. The dose-response curve (Figure
21) substantiates this by only displaying intensity versus the consequence. The frequency is a characteristic
constructed for explaining probability of hazard occurrence and is not important once the event actually happens.
In literature common heat stress indicators such as PET, AT and UHI were identified. Secondly pure
meteorological indices, such as the WGBT or DI and the ‘normal’ air temperature were identified as common. In
practice however only the UHI and PET were identified as common composite indicators representable for the
heat stress hazard. This is probably because the UHI and PET indices contain action perspective, by changing the
(built-) environment, and are thereby more useful for spatial climate adaptation purposes.
Drought can best be described by a water balance as literature showed through the wide range of indexes
(SPI, PDSI, NEDI, etc.) based on the water balance (precipitation-evaporation). This is also mentioned in the
interviews and documents, but is not applied in practice for the stresstest. Mean Lowest Groundwater level (GLG)
is the output hazard indicator from the National Water Model [126] which is mainly combined with consequence
indicators to display drought risks. From literate could also be concluded that drought impact chains were mainly
described by groundwater levels or soil moisture content. The practicality of using groundwater levels as indicator
comes forth from action perspective. Groundwater levels can often directly be combined with consequence
indicators as literature and practice impact chains show. The use of water balance indices are therefore an indirect
approach for formulating drought risk.
A highly discussed topic in literature and practice is subsidence due to drought. Subsidence is an effect of
drought, but still a hazard on itself as it has to be combined with vulnerable locations to create risk. Therefore, in
practice subsidence is described as an indirect drought output hazard indicator, modeled by combining soil
characteristics with groundwater levels.
Little discussion on the output hazard indicator for flooding exists in literature and practice. The interviews
and documents mainly discuss input indicators for models and the models themselves. The incorporation of sewer,
land surface and surface water characteristics with the input indicator precipitation in models creates inundation
depth as the sole output hazard indicator for pluvial flooding risks. Flooding models also have inundation depth as
output or fluvial- & coastal flooding risks. Literature also mentions flow velocity of the flooding. However, in
practice these flow velocities never reach thresholds which have serious consequences during pluvial flooding. For
sloping areas, it can however be important to include this hazard indicator. Lastly, for hazard

69
From literature was concluded that a limitative standard list of usable indicators is not feasible. An assessment
of “essential” and “additional” indicators could however prove useful. This is substantiated by hypothesis 11, 13
and 14 in appendix 13.3, however not a full consensus was achieved. Several possible essential (inundation depth,
PET/UHI, groundwater levels) and additional (e.g. flow velocity, soil moisture content) hazard indicators where
indicated above by discussion of literature and practice.
A last remark by interviewees is that heat maps have to be displayed “In relative terms, not absolute degrees”
[102]. “We have had a graduate specifically for heat stress methods, which resulted in similar images for the
different methods. The relative image, warm spots compared to cool places remains the same. The spatial
variation remains the same” [102]. In addition, Aveco de Bondt [102] investigated different heat stress method
images in which they concluded that the spatial variation is more or less the same over all images, indicating that
heat stress hazard indicator is not crucial. The importance of the consequence indicators could be [102], which is
discussed in the next paragraphs.
5.2.4 Consequence indicators
A review paper [96] categorized the climate vulnerabilities/consequences, which was found useful throughout this
research for consequence indicator categorization; 1) Human capital (a.k.a. Demographics & Health, Human
behavior), 2) Socio-economic conditions, 3) Built environment (Infrastructure & Building characteristics), 4) Natural
capital (ecosystem services and environmental status), and 5) Governance and institutions. From the qualitative
practice research can be concluded that human capital (demographic) and built environment indicators are mainly
used, probably because they possess action perspective in spatial climate adaptation, data is available and they are
ideal for spatial intervention. When for example “social” climate adaptation is pursued, as is studied in several
papers such as [57], non-spatial indicators such as human behavior, political power, mental capacities, etc. could
be more useful.
This same paper defined three primary climate consequence impact chains where the above categories were
used to define the consequence component; heat-health, drought-environment and flooding-socio-economic.
Within this research a couple more and other important impact chains (see sub-chapter 5.2.1) were identified. For
most of these impact chains a dominant category for the consequence component can be defined. Human capital
consequence indicators, specifically demographic (population group) indicators, are commonly used for livability-
and health risks. In literature, socio-economic (such as income level) indicators are often mentioned for health-
and livability risks. It is researched that this causality is present in low-income countries, but not in Western
Europe. Literature stated that damage risk is predominantly described by built environment- and environmental-
indicators. This matches the practice results which define dominant indicators as natural capital (land use types) or
built environment (land use- and building types).
There has to be noticed that all indicators defined for …-livability, -health and -damage are indirect- or
substitute indicators for the actual risk. This is due to limited geographical data used for a spatial assessment.
Mortality values (heat-health) are for example not used as an indicator, because mortality data specifically due to
heat risk was not a geo-indicator. The causality of mortality and age is however used to define elderly people as
consequence indicator because geo-data is available.
The units of consequence indicators differ highly. Both in literature and practice, display by fraction (%) is
commonly used. Conclusive preference for absolute or relative units is not given, but it is evident that all absolute
can be transferred into relative values, which is commonly done. Thereby is assumed that it has a low effectiveness
and need for standardization of the indicator units.

70
The practice and literature results both showed a wide range and summation of consequence indicators with a
diverse array of pro’s and con’s. Another table with consequence indicators is thought to be not useful. Therefore
the indicators which are 1) identified with priority and consensus in practice, 2) substantiated by literature
research and 3) found to be applicable for the climate adaptation process are defined for each of the 12 impact
chains (4 themes with each 3 risk types). They are displayed in the impact chain designs (subchapter 6.2). For most
impact chains, one main consequence indicator was found to be useful which often defines the sensitivity. Some
impact chains contain extra consequence indicators which often define the extent of exposure to the hazard (e.g.
public or private; infrastructure or not).
5.2.5 Norms as practical standards
A range of norms is discussed in literature and practical standards are given in the qualitative research. They
mostly complement each other, but the reliability differs. This depends on the amount of knowledge available on
the indicators produced by scientific research with for example sensitivity analysis, correlation studies, fieldwork or
laboratory studies. In practice, it is often less obvious where principles originate. In contrast to fluvial- & coastal
flooding, the other hazards have no direct legalized norms. General assumptions based on semi-scientific or values
deduced from practice are used as guiding principles within the stresstest. All interviewees agreed that general
principles are dependent on scientific- and stakeholder judgment [102] and that legalized norms are restricting.
Boundary values are often prescribed by experts, whereas the stakeholder defines the (not-) acceptable ranges. It
is generally accepted that the amount of residual risk (a.k.a. acceptable risk range) is dependent on the political
choices of the stakeholder. All above characteristics on how principles are to be used are comparable to the ALARP
principle. ALARP is useful when no absolute thresholds for risks can be set, which is still the case within climate
adaptation due to the stakeholder influence. The application of the holistic approach of ALARP on the Dutch
climate adaptation process shows that we cannot quantify boundary values for the overall resulting (acceptable-)
risk as we can never fully identify all the separate components of risk. We can however produce several practical
standards, based on scientific research or general practice, for the indicators defined for the risk impact chains
which give mainly minimum threshold values for the acceptable level of residual risk.
The general principles for separate indicators found in literature and practice show that knowledge gaps, such
as identified by the interviewees, exist. The statement based on literature that only a small amount of guiding
principles exist is substantiated by Dutch practice. This is mainly due to the above-normative situation which is
researched. Existing norms and principles mainly account for defining the normative situation. As we already
discussed the importance of secondary- over primary hazard indicators, below the principles on secondary
(output) hazard indicators and consequence are discussed. Therefore discussion on the correct precipitation event
or heat data is not included. Most interviewees stated that the present development by Rioned and KNMI suffice
this need.
Heat stress norms
Both literature and practice state that relative temperature levels are important, but indicate certain uniform
minimum boundary values. A Tmin threshold value between 20 ℃ and 24 ℃ is generally accepted through scientific
research [55], [59], [61]. The minimum threshold value of 20 ℃ is generally acknowledged in the Netherlands as
three interviews show [102]. A minimum nightly temperature of 20 ℃ can therefore be assumed as a general
boundary principle for human health. A boundary value for maximum daily temperature is less uniform in research
but starts from 30 ℃ [55] and a general, comfortable human indoor temperature range of 17 - 30℃ [52]. A
maximum daily temperature range was not stated in the interviews or in documentation; however the above
stated research gives argument to assume 30 ℃ as minimum boundary condition for maximum daily

71
temperatures. The age boundary > 65 years is identified in research [23], [53], [59], [69], [115] and practice for
being the most vulnerable to heat.
Drought norms
Principles defining threshold values for drought hazards are sometimes available. Two interviewees
formulated that a water temperature threshold value of 20 ℃ can be used for aquatic ecology and water quality
use. In literature was found that this water temperature threshold value lies between 20 – 40 ℃ [112] depending
on the aquatic ecology. A water temperature threshold is thereby not very conclusive. The determination of water
temperature is modeled as the Cool Water Tool [44] shows. As water temperature would be the best indicator
next to actual concentration data, an indirect indicator, water depth can also prove useful as the same research
shows. The surface temperature does not influence the water temperature below 5 meters under surface water
level. The water temperature map from Alterra and Tauw in the Climate Effect Atlas [13] uses a threshold of 3
meters, but this assumption is not mentioned in the report of the Cool Water Tool [44] by Tauw. The statements in
documentation that shallow waters are susceptible to drought-water quality risks can quantitatively substantiated
with a water depth threshold of < 5 meter for water quality. Besides temperature, algae and substance
concentrations influence water quality for which guidelines such as the swimming water guideline exist. However,
the stresstest is mostly dependent on geo-data. Water quality concentration data is often not (yet) available as
geo-data or in the required detail which makes an indirect indicator more practical.
For heat-damage and drought-damage few principles are quantified. This can be explained for heat-damage as
it is a low priority impact chain, but heat-damage is not. The only principle stated in Dutch literature and interview
documentation for drought-damage is the boundary value for the indirect indicator building age. Buildings built
before 1960 [106] are susceptible to foundation damage by low groundwater levels as they are assumed to have
wooden foundations. Critical values for the groundwater levels are however thereby not mentioned. Values for
tree rooting depth and groundwater levels [133] are researched by Alterra and Deltares. However these are highly
dependent on vegetation type. Interviews thereby stated that they did not use quantitative data for this impact
chain, partly because no principles were generally accepted. A national tool for quantification of drought-
vegetation (nature and agriculture) damage is however in production [125] and inherently contains a diverse array
of threshold values hazard (water levels/-content) and consequence (vegetation types) indicators.
Flooding norms
The best known flooding norms for the Netherlands are the national water safety norms for fluvial- & coastal
flooding and the NBW inundation norm [80]. These are however not used in the climate adaptation process,
because they indicate the normative- and not the above-normative situation. The principle of the NBW norm
however is sometimes used, at least mentioned by 1 interviewee, as it indicates the area that is flooded. However
water depth principles are more common for all three flood risk types. Mainly British research into water depth
with regard to accessibility, accidents and human life risks, led to a water depth threshold of > 0.25 meter in
combination with a flow velocity > 2.5 m/s [111]. The combination of water depth and the velocity is herein
crucial, because low flow velocities have an inverse relationship with higher water depths and vice versa [111]. It is
assumed by most interviewees that during pluvial floods this flow velocity threshold will never be exceeded. The
water depth threshold values are however very familiar in at least two interviews [102] where > 0.25 meter is
assumed to be not passable for normal vehicles, causes economic damage by flooding buildings and can cause
accidents. Water depths < 0.05 m are sometimes defined as negligible as this can be model uncertainty or have no
effects. The same or the > 0.1 m threshold value is sometimes used as a minimum from where pluvial flood-
damage starts. This is however an indirect threshold as data on individual building threshold levels is not available

72
yet. Principles for fluvial- & coastal flooding are already incorporated in the LIWO maps that are used in practice.
The same water depth principles as used in pluvial flooding can be used. In addition, a floor height assumption of
2.65 meter [13], [131] is used to estimate vertical evaluation as done for the water safety standards, but
sometimes also for estimating damage to buildings by dry building levels.
No norms
When no standards based on research, are given or can be derived, two options are available; 1) through
stakeholder discussion agreement based on arguments other than scientific research or 2) through statistics with a
percentile distribution function. The first option is mainly used in Dutch practice and can be highly beneficial in
eventual risk evaluation, decisions on acceptable residual risk, as it already incorporates political ambition in the
risk identification process. The latter creates percentile values (e.g. 5%, 90%, 95%) based on the available dataset
and is a pure statistical tool. This is a process only requiring the dataset. It has the consequence that stakeholder
influence is not incorporated in the risk assessment steps as it objectively asses risks.

73
6 Designs for standardization
4) How and where in the climate adaptation process can be standardized?
The comparison of results from practice and literature in the previous chapter results in a practical and
scientifically acknowledged view on where and how to standardize the stresstest to improve comparability,
evaluation and monitoring of climate risks. This chapter delivers designs which present the conclusions of previous
discussion. Subchapter 5.1 resulted in a process framework describing the components which should be
standardized. Subchapter 5.2 subsequently showed possibilities on how to this. This chapter will present
recommended designs for standardization. Subchapter 6.1 will present a standard stresstest process design
structured around the impact chain. Subchapter 6.2 will give designs for the hazard specific impact chains with
recommended indicators, norms and models.
A standard process design 6.1Based on the discussion in the previous chapter, a design is produced in Diagram 2 (next page) for a standardized
stresstest framework, based on defining uniform risk impact chains. This design represents a recommended
climate adaptation (and stresstest) process framework, based on both scientific research and best practices,
wherein standardization of the risk impact chain is crucial. The standardization of the impact chain components
can be described in 3 steps derived from Subchapter 5.1 on ‘where’ to standardize and the process subchapter 5.2
on ‘how’ to standardize:
1. Damage-, health- and livability risks have to be identified …
2. … through impact chains, wherein a hazard and consequence indicator have to be identified based on
scientifically reliable cause-effect relationships …
3. … and should include “acceptable/practical” (minimum) norms based on 1) scientific basis or 2) practical
standards with stakeholder consensus.
Several other features are included in Diagram 2 and discussed in previous chapter41:
a) There are three risk types (paragraph 5.2.1).
b) Risk is a combination of a hazard- and consequence indicator… (paragraph 5.2.2)
c) … for which practical standards can be derived (paragraph 5.2.5).
d) Hazard analysis provides one component of risk; the hazard indicator. This is combined with a
consequence indicator which creates an impact chain (paragraph 5.2.3).
e) Consequence indicators can be categorized as human capital, natural capital, built environment, socio-
economic and governance & institutions (paragraph 5.2.4).
f) Cyclical feedback between results and inputs is required as they represent action perspective (paragraph
5.1.1).
g) Apply normalization to make aggregation of quantitative- and qualitative data possible (paragraph 5.1.4).
41 References to the specific paragraph discussing that feature are given.

74
Diagram 2: This flow diagram displays the recommended process design for the climate adaptation process, aimed at standardizing the impact chain. Standardization is focused on defining the impact chains. The grey components in the flow diagram are methods/models or conditions such as risk types. The cyclical feedback on the primary hazard- and/or vulnerability indicator is displayed by the two striped lines at the bottom of the diagram. The system hazard indicator can be influenced by measures, which is not possible with primary climatic indicators.

75
Impact Chain Designs 6.2Previous subchapter displayed a standard process design (Diagram 2) in which
impact chains should be standardized. This subchapter will produce specific
designs for the different impact chains which present a structured overview of
conclusions (recommended indicators, norms and methods) derived from
subchapter 5.2 How to standardize. These would ideally be defined for each of
the three risk types (damage, health, livability) in all four hazard themes (heat
stress, drought, pluvial flooding and coastal- & fluvial flooding).
The design diagrams consist of 5 intrinsic components (system hazard
indicators, climatic hazard indicators, secondary hazard indicators,
consequence 42 indicators and norms) defining the impact chain, indicated by
Figure 22. The essential components define the specific selection of secondary
hazard- and consequence indicators defining the risk. All other components,
outside the essential boundary line, such as primary hazard indicators and
models, are not the objective of standardization, but are recommended by
this research.
Next pages will display the specific impact chain diagrams43; livability-, damage- and health risk for every
hazard. Every impact chain will have the priority score from the interviews included where applicable44. For heat-
damage and drought-livability no priority and (almost) no indicators were identified in practice resulting in no
relationships that were identified as plausible or important by interviewees. For heat-damage, damage to movable
bridges (Table 12 on page 50) was twice identified by interviewees, but it is not clear if this is due to common
representation in climate adaptation policy documents or actual scientific research on the relationship. In the
interviews was always stated that the indicator should be identified, but never was identified as a risk and actions
were taken. This does not represent an action perspective. In the literature no scientific research was found that
substantiated the inclusion of heat-bridge damage in climate risk assessment or any reference to threshold levels
or other principles concerning the technical functioning of a bridge. However, in some papers [79], [116], [117]
heat-labour productivity was researched and found to be a cause-effect relationship, but only 1 interviewee
mentioned the indicator. Therefore the heat-labour productivity diagram could be included as a possible future
design, but due to the low priority in Dutch practice it is not incorporated in this research. The drought-livability
diagram is also not defined and included as it is not explicitly defined in literature or practice.
42 In the diagrams abbreviated as [HC] Human Capital, [NC] Natural Capital, [BE] Built Environment, [SE] Socio-economic and [GI] Governance & institutions. 43 When using these diagrams, the limitations of available research and knowledge gaps of the different hazards have to be taken into account. 44 The fluvial- & coastal flooding hazard was for example not prioritized in the interviews.
Figure 22: Legend of the impact chain design diagrams.

76
45 46 47
45 1 Recommended: use a dataset of a heat wave as defined by the KNMI. 46 2 Public areas is a widely used indicator for daytime high density locations, which is not directly measurable.
47 3 The temperature change due to a range of indicators can be defined through several (quantitative & qualitative) methods, described in the practice results.
Diagram 3: The heat-livability impact chain diagram for the general outside public is displayed. The score *…/…+ behind the impact chain title displays a cumulative priority score given by interviewees for the impact chain within the hazard type (more in paragraph 4.1.3). The footnotes give additional information and/or recommendations. The indicators contain a consequence type indication; [HC] Human Capital, [NC] Natural Capital, [BE] Built Environment, [SE] Socio-economic and [GI] Governance & institutions.

77
48
48 1 Recommended: use a dataset of a heat wave as defined by the KNMI.
Diagram 4: The heat-health impact chain diagram for elderly people is displayed. The score *…/…+ behind the impact chain title displays a cumulative priority score given by interviewees for the impact chain within the hazard type (more in paragraph 4.1.3). The footnotes give additional information and/or recommendations. The indicators contain a consequence type indication; [HC] Human Capital, [NC] Natural Capital, [BE] Built Environment, [SE] Socio-economic and [GI] Governance & institutions.

78
49 50 51
For drought damage two impact chains are defined, because both
groundwater level change due to drought and subsidence have
effects which are both included in the drought theme. The
interconnectedness between groundwater levels and subsidence
is important; a changing groundwater level influences the
magnitude of subsidence. Subsidence however causes
watermanagers to lower groundwater levels to keep drainage
levels according to the norms.
49 1 Recommended: use a historical dataset from the KNMI covering a year. 50 2 ‘Waterwijzer’ Nature [125] is in development and is expected to give conditions for the agriculture-drought impact chain.
51 3 Building age is commonly used as an indirect indicator for wooden foundations, as these are generally not known.
Diagram 5: The drought-damage impact chain diagram through groundwater effects is displayed. The score *…/…+ behind the impact chain title displays a cumulative priority score given by interviewees for the impact chain within the hazard type (more in paragraph 4.1.3). The footnotes give additional information and/or recommendations. The indicators contain a consequence type indication; [HC] Human Capital, [NC] Natural Capital, [BE] Built Environment, [SE] Socio-economic and [GI] Governance & institutions.

79
52 53
52 1 These are areas under construction as an indicator for areas where soil is heightened with extra soil, causing subsidence. 53 2 Data availability and infrastructure existence in a region is leading in the interpretation of this indicator. Recommendation: Primary infrastructure objects are often defined as primary roads, railways, water safety- & navigation works and gas/electricity/communication/water networks. In annex 3 of the 2014 spatial adaptation guide [107] a long list overview of these infrastructure objects is given.
Diagram 6: The drought damage impact chain diagram through subsidence is displayed. The score *…/…+ behind the impact chain title displays a cumulative priority score given by interviewees for the impact chain within the hazard type (more in paragraph 4.1.3). The footnotes give additional information and/or recommendations. The indicators contain a consequence type indication; [HC] Human Capital, [NC] Natural Capital, [BE] Built Environment, [SE] Socio-economic and [GI] Governance & institutions.

80
54
54 1 Water depth is an indirect indicator for water temperature, which is on itself an indirect indicator for water quality.
Diagram 7: The drought-health impact chain diagram through water quality is displayed. The score *…/…+ behind the impact chain title displays a cumulative priority score given by interviewees for the impact chain within the hazard type (more in paragraph 4.1.3). The footnotes give additional information and/or recommendations. The indicators contain a consequence type indication; [HC] Human Capital, [NC] Natural Capital, [BE] Built Environment, [SE] Socio-economic and [GI] Governance & institutions.

81
55 56 57 58
55 1 General principles for precipitation events are currently made by Rioned [82]. General precipitation events were found to be a T=100 event, a 50/60 mm event or the historical Achterhoek and Herwijnen events. However, when following this studies guidelines these do not have to be generalized. 56 2 Recommendation: Use the STOWA damage calculator (“waterschadeschatter” [129]) for damage calculation on land. Subterranean structures are not included and are therefore a separate indicator.
57 3 The most mentioned subterranean structures, vulnerable to pluvial flooding, throughout this study are basements and tunnels. 58 4 This value is used as a general indication of façade threshold levels for flooding, as the individual façade threshold levels are yet not known.
Diagram 8: The pluvial flood damage impact chain diagram for the built environment (buildings and infrastructure) is displayed. The score *…/…+ behind the impact chain title displays a cumulative priority score given by interviewees for the impact chain within the hazard type (more in paragraph 4.1.3). The footnotes give additional information and/or recommendations. The indicators contain a consequence type indication; [HC] Human Capital, [NC] Natural Capital, [BE] Built Environment, [SE] Socio-economic and [GI] Governance & institutions.

82
59 60
59 1 Recommendation: Road typology by primary, secondary and tertiary roads. 60 2 “Leidraad riolering: Module C2100” [123] from Rioned with T = 2 years as the most common principle for highly urbanized areas.
Diagram 9: The pluvial flood-livability impact chain diagram for neighborhood livability is displayed. The score *…/…+ behind the impact chain title displays a cumulative priority score given by interviewees for the impact chain within the hazard type (more in paragraph 4.1.3). The footnotes give additional information and/or recommendations. The indicators contain a consequence type indication; [HC] Human Capital, [NC] Natural Capital, [BE] Built Environment, [SE] Socio-economic and [GI] Governance & institutions.

83
61
61 3 Recommendation: Main infrastructure which is used by emergency services and a high traffic volume. Recommendation: Use critical infrastructure from local safety regions or the annex 3 long list in [107].
Diagram 10: The pluvial flood-health impact chain diagram through accidents and delayed emergency services is displayed. The score *…/…+ behind the impact chain title displays a cumulative priority score given by interviewees for the impact chain within the hazard type (more in paragraph 4.1.3). The footnotes give additional information and/or recommendations. The indicators contain a consequence type indication; [HC] Human Capital, [NC] Natural Capital, [BE] Built Environment, [SE] Socio-economic and [GI] Governance & institutions.

84
62 63
62 1 Recommendation: Use critical infrastructure from local safety regions or the annex 3 long list in [107]. National water safety guidelines give inundation threshold values [131] for accesability of emergency services during a flooding. This could be formed into a emergency services-inundation depth displacement series, such as exists for drought. 63 2 Recommendation: Use critical infrastructure from local safety regions or the annex 3 long list in [107].
Diagram 11: The fluvial- & coastal flood-health impact chain diagram through indirect fatalities by failure of emergency services and utilities is displayed. The score *…/…+ behind the impact chain title displays a cumulative priority score given by interviewees for the impact chain within the hazard type (more in paragraph 4.1.3). The footnotes give additional information and/or recommendations. The indicators contain a consequence type indication; [HC] Human Capital, [NC] Natural Capital, [BE] Built Environment, [SE] Socio-economic and [GI] Governance & institutions.

85
64
64 1,2 Recommendation: Use the STOWA damage calculator (“waterschadeschatter” [129]) for damage calculation on land. Subterranean structures are not included and are therefore a separate indicator.
Diagram 12: The fluvial- & coastal flood-damage impact chain diagram through property and infrastructure damage is displayed. The score *…/…+ behind the impact chain title displays a cumulative priority score given by interviewees for the impact chain within the hazard type (more in paragraph 4.1.3). The footnotes give additional information and/or recommendations. The indicators contain a consequence type indication; [HC] Human Capital, [NC] Natural Capital, [BE] Built Environment, [SE] Socio-economic and [GI] Governance & institutions.

86
65 66
65 1 Warning time, population density, infrastructure capacity, distance to safe area, building height. 66 2 The vulnerability indicators are all attributed certain threshold assumptions, such as a general building level height of 1.65 m.
Diagram 13: The fluvial- & coastal flood-livability impact chain diagram is displayed by combining the evacuation possibilities and thereby influencing safety comfort levels. The score *…/…+ behind the impact chain title displays a cumulative priority score given by interviewees for the impact chain within the hazard type (more in paragraph 4.1.3). The footnotes give additional information and/or recommendations. The indicators contain a consequence type indication; [HC] Human Capital, [NC] Natural Capital, [BE] Built Environment, [SE] Socio-economic and [GI] Governance & institutions.

87
7 Case study: Normalization and Aggregation The essential indicators from the previous designs are stresstest output. Discussion and prioritization of the risks
requires this output in the form of indicator maps. For processing the stresstest output in a standardized form two
methods were mentioned in paragraph 5.1.4; normalization and monetization. The NEN [70] and ISO [88] are
creating standardization guidelines for the climate adaptation process and both advocate normalization as it
provides a uniform way of information exchange, reducing the need for ‘re-inventing the wheel’ [71]. Three
reasons why normalization is performed instead of monetization are that 1) correct monetization is dependent on
data that is not always available, 2) subjectivity and wide varieties in cost determination and 3) interviews
acknowledged that it would be sensible to test normalization for evaluation and benchmarking the stresstest
results [102]. Normalization is a relative assessment method, which makes it applicable as relative spatial risk
assessment was found to be more applicable than absolute risk assessment [63]. For normalization there has to be
kept in mind that “single indicators and aggregated indices represent a synthesis of a complex reality and
represent phenomena that, as for instance consequences, are difficult or impossible to measure” [45].
For comparison and evaluation by prioritization of risks, which are main standardization goals, normalization
and aggregation are also widely used in literature. Several case studies [25], [46], [57] from the literature study
performed normalized classification as it offers a simple approach to compare risks resulting from semi-
quantitative analysis. These studies compute the hazard- and consequence, with aspects of exposure and
sensitivity and coping capacity, index separately and weigh the hazard- with the consequence index to calculate a
risk index” [45].
Normalization products are categorical index maps, which are found to be useful for decision making, but also
(still) deemed an unavoidable result from the stresstest as not all impact chain indicators can be fully quantified. “I
expect that we ultimately result in qualitative categorical maps with a quantitative basis” [102] and “the resulting
risk maps … are qualitative, because they are a summation of indicators that do not have a clear quantitative
relationship” [102]. Quantitative substantiation and reference is therefore crucial as stated by the interviewees.
1. Normalization creates an index based on the dataset.
2. Quantitative references should be visible in the map, with preference of a minimum threshold principle
found in research, because “… no one wanted to acknowledge the normalized maps, because people see
them as a black box where the guiding principles and indicators that created the map were not visible
anymore” [102].
3. Political weighing for the trade-off between resulting risks is possible [102].
4. Aggregation is possible with normalized maps, but the specific resulting products for each risk (e.g. heat-
livability or flood-damage) should be identifiable. An overall hazard-risk map for each theme was found
dubious in the interviews [102], as relationships between impact chains (and their indicators) are created
which are actually not present.
To investigate the applicability of normalization as a standardized tool to process stresstest output, the
designed impact chains from previous chapter will be normalized and aggregated into risks for the case: Groningen
City. The resulting maps are discussed in a stakeholder focus group (chapter 8).

88
Method 7.1Different theories exist on how to apply normalization and aggregation. Therefore this section could be
incorporated in the theoretical framework, but also in the methodology as it is a direct method applied for the
case study. It was chosen to elaborate on the application of normalization in this case study chapter as it directly
describes the application of normalization and aggregation for this specific case study research.
7.1.1 Normalization
A widely used method within literature case studies for normalization is the zero-mean method ̅
or Z-score
method [69], [96]. This results in standardized values based on the dataset. When combining normalized data from
this method, different weights have effect and thereby a weighing factor is already organically introduced based
on the data when they do not have the same statistical distribution, which is maybe not politically desired. For
example, two datasets with different statistical distributions; a temperature dataset with a standard deviation of
10 degrees is combined with a population age indicator with a standard deviation of 20 years. When these are
standardized and numerically aggregated (by for example multiplying) the values of the population age indicator
will have more impact on the final standardized value than the temperature.
The use of the “min-max scaling” method is simple and also widely used for normalization, wherein the
previous stated problem does not exist. This normalization method creates an index for all datasets67 on a
dimensionless scale between 0 – 1. When these index values are numerically combined, no special weight for one
or the other is given. The lowest value of the dataset will return as 0 and the highest value as 1 with linear
interpolated values in between. Categorical indicator values are numerically rated based on expert judgment of
these categories. When numerically ranked, the min-max method can be applied. The function for the min-max
method (Equation 6), when performed on a raster file, results in index values (XI) for every raster cell.
Equation 6: Min-max function for normalization.
( )
( ) ( )
By implementing justified minimum threshold
principles from the design impact chains, the bottom (0)
threshold can be altered in the datasets. For example, a
minimum threshold principle value of 25 degrees will be
returned as 0 in the index, resulting in maps where all
values below this threshold value result in 0 and are
thereby not at risk. This is clearly displayed in the
conceptual Figure 23 from the UCAM method report from
Witteveen + Bos.
67 All calculations are done on a spatial raster dataset. The mean of the dataset is thereby the mean of all raster cells. The calculated index value (x) is the value of a specific raster cell, based on the specific indicator value of that raster cell and the mean, maximum and minimum of the whole raster dataset.
Figure 23: Indexing with threshold values. Source: UCAM method [5], but textually adjusted.

89
7.1.2 Aggregation
In almost all case studies in literature, composite risk indices are created. In this case study these are grouped
based on the impact chains health, damage and livability. This is done throughout literature, such as for example
the creation of economic-, social- and infrastructure- consequence indicators [23].
Superimposing hazard- and consequence indicators on overlay maps is a simple and often used method (e.g.
[106], [56]) in assessing risk. This superimposing can easily be done with indexes through multiplying, also
returning an index that describes the risk magnitude based on the underlying indicators. Multiplication of indexes
is geometric- and not linear (additive) aggregation and can therefore especially be useful for benchmarking [88].
Equation 7 displays the aggregation of indicator indexes into a risk index by multiplication. Often one hazard index
is created and multiplied by a consequence index. When more consequence indexes exist, they first have to be
summed and then multiplied with the hazard index as Equation 7 showed. When sure the consequence indexes do
not overlap they can be summed and multiplied directly. When they do overlap, the result of summation has to be
normalized again into 1 consequence index before aggregation as the values can achieve a value bigger then 1.
Equation 7: Indicator aggregation (level 0) into risk indexes (level 1). When more consequences indicators exist (such as index A, B and C in this example) they are summed and normalized into 1 consequence index map before multiplied with the hazard.
( ( ))
For level 2 and level 3 aggregations, Equation 7 is not applied as these aggregation levels do not create risk
indexes. These aggregation levels identify risk areas and multiplication makes it possible to reduce a risk in a
certain area to zero which in fact is not zero (Figure 24). An area at risk should not be converted to ‘no risk’
because another risk index does not identify the area as ‘no risk’. Therefore they should be summed and then
normalized, the same as when multiple consequence indicators are applied as discussed above. Normalization of
the summed index should be applied as displayed in Equation 8.
Figure 24: Concept illustration of wrong aggregation (i.e. multiplication) for level 2 and level 3 risk indexes. Both circles represent a risk index A and B. The red circle represents an area at risk (i.e. index value = 1) and the green circle represents an area not at risk (i.e. index value = 0). When multiplied, the overlapping area (highlighted by dotted red line), will become zero
(i.e. no risk) while this is not true.
Equation 8: Level 2 and 3 risk index aggregation function by summation.
* +
Wrong method
Good method

90
Because this study focuses on risks which can be solely defined as a one-sided range of values, either positive
or negative values can be used for the index. In this case, positive values between 0 and 1. When benefits are
included in the analysis, the zero-mean standardization method (two-sided) would be more fitting [23], [54], [56],
[61], [85].
Different levels of aggregation can be identified as is shown in Diagram 14. All 4 hazards have ideally 1 hazard
and one consequence indicator for each risk type, which totals to 24 indicator index maps. These are
chronologically aggregated to 12 risk type index maps, 4 hazard risk index maps and 1 totally aggregated climate
risk index map. There is no standard definition until which level of aggregation is required or preferred. This
depends which action perspectives are required and which stakeholders need to work with the maps. The
discussion chapter will discuss this dilemma with input from the feedback focus group.
Diagram 14: This flow diagram displays the possible levels of indicator aggregation. The “#” stands for one of the four climate hazards: heat stress, drought, pluvial flooding or coastal- & fluvial flooding.

91
In geometric aggregation, like this method, the product of weighed indicators is possible [61]. In every
step weighing can be incorporated, but in this approach it is chosen to not incorporate weighing for a neutral
perspective on the applicability of this method. Weighing can be done during aggregation by multiplying and index
with a weight factor (1x, 2x, 3x, etc.), dependent on for example the stakeholder. This is displayed in Equation 9
(on the next page).
Equation 9: An example of an aggregated index with unequal weight for the partial indexes A and B. Index B will weigh more in the resulting aggregated index by normalizing the sum of index A with index B which is multiplied by a weight factor of 2.
* +
7.1.3 Study Area
The case study area encompasses the
municipalities of Groningen and Ten Boer,
because 1) the area and institutions are known
to the researcher and 2) currently a stresstest
is ongoing by SWECO for these municipalities.
The latter ensures that basic data for
consequence and hazard are available for
normalization. Groningen, a mostly urban
municipality, and Ten Boer, a mostly rural
municipality, execute the stresstest together
because they will merge in 2018/2019 into one
municipality. The most recent addition to the
municipality is the region southeast of
Groningen, Meerstad and Harkstede, which are
not yet included within the spatial boundaries
of this research. The municipality boundary
and topographic details of the study area are
given by Figure 25.
7.1.4 Functions
The first steps (1 to 6) describe the data preparation. Details on the data itself are given in the next paragraph.
Step 7 describes the normalization function executed in ArcMap and step 8 for aggregation. Step 9 describes how
data is prepared for display. Next subchapter 7.2 displays the resulting index maps.
1. Import all data into the QGIS/ArcMap.
2. Clip all data by the geographical case study boundaries (municipality region).
3. Categorize textual categorical layers into a numerical categorical layer (… by for example prioritizing).
4. Rasterize68 all vector layers by the attribute that is used as indicator.
5. Change the datasets minimum or maximum values by principle values when needed (… for example all
values < 30 degrees to 30 degrees for heat stress, such that 30 degrees will become an index of 0).
6. It is common that model output data has faulty values. All data is checked for these abnormal outliers.
The inundation rasters from Tygron and the groundwater level raster contain such outliers. The datasets
are lognormal distributed where very high outliers (≈ 40 x the mean) exist in the right tail. To mitigate the
68 Nominal datasets such as land use are already prioritized before rasterization in numerical values OR are all given a value 1 if the data is used in a presence rule (Present; YES/NO).
Figure 25: Topographic map of the Case study area Groningen / Ten Boer.

92
effect of these faulty outliers on the normalization the 99th
percentile value is used as the maximum value
for the dataset (see Figure 26), because the new maximum values were found to be plausible values
instead of the original. The 99th
percentile value (x(0.99) is calculated with Equation 10 and the dataset is
limited to these maximum values in ArcMap, with IF(x > x(0.99)), THEN (x = x(0.99)).
Equation 10: The function applied for calculation of the 99th
percentile value with a z-score of 2.326, the mean (μ) and standard deviation (σ) of the dataset.
( ) ( )
Figure 26: Conceptual display for lognormal distributed dataset with the 99th
percentile value (x).
7. The min-max function is implemented on all indicator raster layers by using the iterate function in ArcMap
model builder (Diagram 15). All indicators are thereby transformed into an index raster map with values 0
to 1. The model builder environment mask is set on the municipality boundary layer, thereby containing
all calculations within the studied area.
Diagram 15: This flow diagram represents the applied ArcMap model in ‘model builder’ to perform normalization. Indicator rasters (already altered for outliers) are input. Then NoData cells are converted to zeros creating adapted indicator rasters. These new rasters are input for the raster calculator performing min-max normalization creating index rasters.
8. Aggregation is done by the method described in paragraph 7.1.2.
9. The same symbology is applied on all index maps with five categories (Zero, Low, Medium, High, and Very
High) which represent a 0% and equal intervals of 25% (0-25%, 25-50%, etc). [61] states two limitations of
this display; “(a) it shows relative severities of impact between regions but conceals the absolute
magnitude of change, and (b) once the worst or best category is reached, any deterioration or
improvement of the indicator cannot be shown.” Therefore, to overcome these limitations, a)
quantitative reference to the absolute magnitude of the displayed indicator is given and b) the categories
shift with the dataset itself by min-max normalization ensuring deterioration or improvement to be
always within the range of the index. The quantitative reference is shown when applicable, to be able to
notice shifting categories between multiple index maps of the same indicator.

93
7.1.5 Indicator Data
The usability of the normalization method, feedback on the choice of indicators & principles and making
comparison and prioritization possible are the objectives of this operationalization. Therefore, open source geo-
data and free available model outputs are used as data for the indicators in this case study. In this thesis, no
models are run to achieve indicator data. Open source geo-data (Table 17) is collected from the PDOK-viewer [75],
Central Bureau of Statistics (CBS) [134], public data from the water authorities and municipalities and model
output from the currently ongoing stresstest in Groningen City by SWECO. The fluvial & coastal flooding inundation
maps are collected from LIWO, Rijkswaterstaat (2017). Climate scenarios from the KNMI are not incorporated in
this case study as they change primary climate indicators over the complete studied area by an absolute value and
therefore do not influence the spatial variety [102], which is the observed characteristic for hotspot identification.
A possible approach to climate scenarios in the context of the stresstest is mentioned in discussion chapter 10.
Table 17: Basic topographic and demographic data sources for the consequence indicators applied in this case study.
Name Content Publish date
Publisher Data source
Geographical boundaries
Municipality, district, neighborhood 2016 CBS PDOK [75]
BAG Basic registration building addresses 2018 Kadaster PDOK [75]
Soil map Shallow (till -1.20 m) soil typology 2006 Alterra PDOK [75]
TOP10NL Basic registration topography 2017 BRT PDOK [75]
BRP agricultural plots Basic registration agriculture 2017 BRP PDOK [75]
Demographic data Population statistics 2017 CBS Statline [134]
Emergency and utility datasets
Routes and objects Recent - Groningen Municipality
The next four paragraphs display the applied indicators for each hazard theme in their own specific table, preceded
by an elaboration on the indicators and their data souce.
Heat stress
The actual and physiological daytime heat stress indicator, modeled by SWECO, is dependent on the spatial
environment and building typology. The hazard map displays the physiological temperature on the 1st of july 2017,
15.00hr. The air temperature and radiation are used to model the physiological temperature. Shadow (by solar
radiation direction and a DEM) and green/blue areas are incorporated with factors to reduce the physiological
temperature.
The nightly heat map is available at the Climate Effect Atlas and is thereby differently modeled 69 then daily
temperature. It shows the amount of nights where the actual temperature does not decline below 20 degrees.
Thereby already incorporating the 20 degree threshold principle and displaying an output in amount of nights per
year.
69 The model behind this indicator is explained in the Climate Effect Atlas viewer [13].

94
Table 18: This table displays the applied hazard- and consequence indicators for the heat impact chains. The exact definition/function of the indicator is given. The ‘rule’ column defines if the indicator is quantitative data, qualitative data, indicates nominal data which is defined by its presence (Yes/No) or ordinal data which can be defined by a priority score (0, 1, 2, 3, etc.). The last column displays the data source with reference.
Heat-Livability Type Definition Rule Data source
Daily Temperature
Hazard Maximum temperature at 15:00 on a hot 1
st of July
Quantitative Sweco model
People Density Consequence Total Population / km2
for every neighborhood
Quantitative CBS [134]
Public Area Consequence Combination of BAG and Top10NL public land use functions70
Presence (Yes=1/No=0)
PDOK [75]
Heat-Health
Nightly Temperature
Hazard Amount of nights above 20 degrees for the current climate71 (# in weeks)
Quantitative CAS [13]
65+ People Density
Consequence Age cohort 65+ population / km2
for every neighborhood
Quantitative CBS [134], PDOK [75]
Drought
The groundwater map (GLG) is the result of the MIPWA model72 for the northern provinces of the Netherlands. The
building age, agriculture plots, build area and surface swimming water locations are all converted to binary maps,
indicating presence of the characteristic or not. Natural areas are categorized by their drought resistance which
resulted from an analysis for the Climate Effect Atlas [13]. Urban green is not included in this case study, but is
recommended to include as indicator.
The water temperature map is modeled by Alterra and Tauw for the Climate Effect Atlas and displays the
largest series of days where water temperatures exceed 20°C, hereby already including a temperature threshold
principle. Water bodies, deeper than 3 meter are excluded.
Table 19: This table displays the applied hazard- and consequence indicators for the drought impact chains. The exact definition/function of the indicator is given. The ‘rule’ column defines if the indicator is quantitative data, qualitative data, indicates nominal data which is defined by its presence (Yes/No) or ordinal data which can be defined by a priority score (0, 1, 2, 3, etc.). The last column displays the data source with reference.
Drought-Damage (GW)
Type Definition Rule Data source
Mean lowest groundwater level
Hazard Lowest groundwater level from historic data model.
Quantitative MIPWA model
Building age Consequence BAG Building year older than 1960 Presence (Yes=1/No=0)
PDOK [75]
Agricultural type
Consequence Agricultural production area from BRP, excluding grass, fallow and nature
Presence (Yes=1/No=0)
PDOK [75]
70 The selection consists of recreational-, shopping-, health care-, educational and nature areas. Offices, special infrastructure, cemeteries, industry and utilities are excluded. 71 The WH+ KNMI climate scenario dataset version indicates the same spatial differentiation and only higher absolute values which does not matter for min-max normalization. 72 The results of this model can be questionable for urban areas. Due to lack of proper area-covering groundwater data this models product is applied as ‘best available’.

95
Nature type Consequence Drought resistant Priority73 (Determined by KWR)
CAS [13]
Drought-Damage (Subs)
Subsidence74 Hazard Subsidence (cm) till 2050 by consolidation, oxidation and compaction.
Quantitative (model)
CAS [13]
Vulnerable infrastructure
Consequence Vulnerable to subsidence Priority75 PDOK [75], Groningen Municipality
Building area Consequence Buildings present Presence (Yes=1/No=0)
PDOK [75]
Drought-Health
Water temperature
Hazard Series of days with water temperature exceeding 20°C
Quantitative (model)
CAS [13]
Swimming water locations
Consequence Water area Presence (Yes=1/No=0)
PDOK [75]
Pluvial Flood
The inundation map is created by SWECO with Tygron76. The inundation map displays the estimated/modeled
maximum water depth on the surface (AHN2, BAG, Top10NL) due to a rainfall event. Three events are modeled
and will all be normalized to discuss the differences after normalization in a sensitivity analysis:
58mm in 1 hour. T=100 in the current climate.
73mm in 1 hour. T=100 in the 2050 climate.
111mm in 1 hour. T=1000 in the current climate.
It is assumed that the sewer system can handle 20 mm in a 1 hour event. The event is uniform over 1 hour, but the
simulation runs for 3 hours and identifies the maximum water depth, which was endorsed by the literature review
on the inundation depth indicator. The resolution of grid calculation is 2 m X 2 m.
The water damage calculator (“Waterschadeschatter”) [129] combines the land use typology with inundation
depth maps. The land use typology is not elaborated here and will also not be shown in the results chapter as the
map is described on their website, but not downloadable. The typology map is a combined map from different
sources as was done for some of the indicators explained here as well. The inundation maps are used as input for
the calculator the setup is set to default; inundation duration = 1 hour, repair time road = 6 hours, repair time
buildings = 1 day, month of event = September, intermediate damage factors.
73 Categorized as drought resistant (0), Medium resistant (1), Not resistant (2) and no indication possible (NULL). 74 Subsidence between 2016-2050 from the Climate Effect Atlas in the 2050 WH KNMI scenario. 75 All infrastructures are selected from the Top10NL data and utility companies. Primary transportation infrastructure and utilities (gas, electrical) are given a value of 3, secondary transportation infrastructure of 2 and tertiary a value of 1. 76 The model functions are described in the Tygron wiki [124].

96
Table 20: This table displays the applied hazard- and consequence indicators for the pluvial flood impact chains. The exact definition/function of the indicator is given. The ‘rule’ column defines if the indicator is quantitative data, qualitative data, indicates nominal data which is defined by its presence (Yes/No) or ordinal data which can be defined by a priority score (0, 1, 2, 3, etc.). The last column displays the data source with reference.
Pluvial Flood-Damage
Type Definition Rule Data source
Inundation map Hazard Both inundation and land use typology are combined in the “waterschadeschatter”, directly creating a risk indicator.
Quantitative Sweco model (Tygron)
Land use typology
Consequence Waterschadeschatter [129]
Subterranean structures
Consequence Municipality dataset defines tunnels and subterranean parking garages.
Presence (Yes=1/No=0)
Groningen Municipality
Pluvial Flood-Livability77
Inundation map Consequence Inundated depth due to rainfall Quantitative Sweco model (Tygron)
Road type Consequence Top10NL road typology Priority78 PDOK [75]
Pluvial Flood-Health79
Inundation map Hazard Inundated depth due to rainfall Quantitative (Tygron model)
Sweco model (Tygron)
Critical emergency infrastructure
Consequence Defined by emergency routes and road typology
Priority (inverse of road type priority above)
PDOK [75]
Fluvial- & Coastal Flood
The hazard map displays the maximum flood depth, accounting for all possible Dutch coastal and fluvial VNK
flooding scenarios [131]. Vital functions & utilities and critical infrastructure are categorically based on a given
priority. They can be defined independently or combined in 1 vulnerability indicator with priority weights. There is
yet no national guideline for vital functions and utilities, but there exist several checklists. The European ROR
Guideline, the long list from the Spatial Adaptation Guideline (2014) [107] and data availability are consulted for a
selection. The selection consists of:
Highways and railway(-s) (-stations) (from Top10NL)
Main gas and electricity stations (from local datasets)
Healthcare, utilities and special main infrastructure (from TOP10NL & BAG)
For this case study they are combined in one vital function indicator, where vital functions & utilities are given the
highest priority (4) as defined in the critical infrastructure indicator.
As earlier stated in the design chapter, livability is an unnatural terminology for fluvial- & coastal flooding with
the indicators presented here. However, it should be considered as a risk-aversion index, which is included in the
design in the livability risk. The number of dry building levels (1 level is 2.65 meter high) and potential evacuation
77 Inundation frequency is not applied in this case study, as the data was not easily available at the moment of the study. 78 Prioritization: Streets are the most vulnerable (4) for livability reduction, then local roads (3), then regional roads (2) and lastly highways and ring roads (1). 79 Inundation frequency is not applied in this case study, as the data was not easily available at the moment of the study.

97
percentage are already risk maps as they are products of a combined hazard and vulnerability for flooding-
livability. Both maps originate from LIWO.
Table 21: This table displays the applied hazard- and consequence indicators for the fluvial- & coastal flood impact chains. The exact definition/function of the indicator is given. The ‘rule’ column defines if the indicator is quantitative data, qualitative data, indicates nominal data which is defined by its presence (Yes/No) or ordinal data which can be defined by a priority score (0, 1, 2, 3, etc.). The last column displays the data source with reference.
Fluvial- & Coastal Flood-Health
Type Definition Rule Data source
Inundation Depth
Hazard Water depth due to flooding Quantitative LIWO [131]
Vital functions & utilities
Consequence Cause societal disruption on short term
Presence (Yes=1/No=0)
PDOK [75], Groningen Municipality
Critical infrastructure
Consequence Infrastructure disruption for the long term
Priority80 PDOK [75]
Fluvial- & Coastal Flood-Damage
Inundation depth
Hazard Both inundation and land use typology are combined in the “waterschadeschatter”, directly creating a risk indicator.
Quantitative (model)
LIWO [131]
Land use typology
Consequence Waterschadeschatter [129]
Fluvial- & Coastal Flood-Livability
Dry building levels
Risk Building height minus inundation depth
Presence (Yes=1/No=0)
LIWO [131]
Horizontal evacuation
Risk Percentage of population which can be evacuated
Quantitative (model)
LIWO [131]
80 Prioritization: This priority is the inverse of the pluvial flood-livability infrastructure indicator. The most critical infrastructure are highways and ring roads (4), secondly regional roads (3), then local roads (2) and lastly streets (1).

98
Results 7.2Normalization of the indicators creates index maps. These are displayed as exemplary case study results in this
chapter. Hazard-, combined with consequence maps are converted into risk maps. The first paragraph will
compare and discuss the difference in affected area between a hazard and risk map by using the Tygron
inundation maps from SWECO. This is an example exercise which indicates the difference in sensitivity between a
hazard and risk map. The subsequent paragraphs will display the products for each aggregation level from Diagram
14 and shortly discuss what is shown and noticeable.
7.2.1 Sensitivity comparison of pluvial flood hazard- and risk map
In the Dutch standardization discussion much debate is present on which precipitation events have to be used for
modeling. Therefore a basic comparison is made between the resulting risk index maps, formed by the 3
precipitation events used in the modeling by SWECO. It investigates the sensitivity of risk by its hazard indicator.
Figure 27 displays a hazard and risk map. The hazard map (left) is represented by the inundated area. The risk
map (right) is represented by damaged area through inundation. The hazard indicator map is the result of the
Tygron model, where surface water is afterwards excluded. The damage risk map is the result of the a water
damage calculator [129] where the inundation map functions as hazard input. The growth of inundated/damaged
area81 with larger events is displayed by the increasing orange and blue color on the maps and Table 22. The total
areal change (%) for every event and map type in comparison to another (58mm in 1 hour < 73mm in 1 hour <
111mm in 1 hour) is presented in
Table 23.
81 All inundation maps in this comparison start at 0.1 m water depth as minimum threshold, including the input for the damage calculator.
Figure 27: The left map, a hazard map, displays the inundated area due to three precipitation events (58 mm in 1 hour, 73 mm in 1 hour and 111 mm in 1 hour). The inundated area is the result of the Tygron model, applied by Sweco for Groningen, for the three precipitation events. The right map displays the area damaged by these three events. This is the damage risk, as a combination of a hazard indicator (i.e. inundated area) and consequence indicators (e.g. land use typology) executed by a damage calculator (waterschadeschatter [127]). The affected area for the three precipitation events differs more for the hazard- (left) then the risk (right) map.

99
Table 22: The area affected by the inundation hazard and by the inundation damage risk. The area from the maps in Figure 27 is calculated in ArcGis.
Map type Event Area (km2)
Inundation Hazard map excluding surface water
58 mm 5.67
73 mm 7.72
111 mm 12.87
Inundation Damage Risk map
58 mm 2.51
73 mm 2.56
111 mm 2.66
Table 23: A cross-reference table comparing the affected area by the three precipitation events from the hazard- and risk map in Figure 27 and Table 22.
Inundation Depth excluding surface water (Area)
58 mm 73 mm 111 mm
58 mm 1.00 1.27 1.56 73 mm 1.00 1.40 111 mm 1.00
Inundation Damage Risk (Area)
58 mm 1.00 1.02 1.05
73 mm 1.00 1.04
111 mm 1.00
These results show a clear distinction between the hazard inundation map and the risk-damage map. The change
in affected area between a 58 mm and 111 mm event in the inundation map is 56%. When combined with
consequence indicators into a damage risk map the change in affected area is 5%. The deviation of 56% shown in
the Tygron model output is not translated directly in the risk indicator as this is only 5%. The conversion from
hazard to risk by combining hazard and consequences reduces the affected area greatly. A wide range of
assumptions have an effect on these percentages and can be subject to discussion as in every model. Threshold
values are applied by the researcher and the damage calculator and influence the minimum and maximum amount
of damage. The 0.1 meter threshold82 for inundation depth applied by the researcher based on the designed fluvial
flood-damage impact chain for example excludes all inundated areas with a water depth lower than 10 cm. The
damage calculator is a partial black box of which not all steps are transparent, but the manual shows for example
the application of a maximum inundation depth threshold value for buildings of 0.3 m. All inundation depths
exceeding this value are treated as 0.3 meter inundation depth. However, the significant difference of the affected
areas between the hazard- and risk map (respectively 56% and 5%) cannot be directly contributed to coincidence
or the choice of the assumptions in the model. When discussing the risks of a certain hazard event or which event
to apply in a model it therefore matters if the resulting hazard- or risk map is discussed.
The qualitative research concluded that risk is an equation / combination of both hazard and consequence in
an impact chain. This comparison displays that a difference in hazard magnitude is not the same as the difference
in final risk. Therefore when risk is the desired result, both parts of the equation are equally important and have to
be discussed. Concluding this comparison, the risk discussion should maybe require more focus than a sole hazard83
discussion. In the recommendations this is further elaborated.
82 The inundation map from Sweco is altered by introducing a minimum threshold value of 0.1 meter as Diagram 8: Design Diagram for Pluvial Flood Risk recommended. 83 Which is the design storm and resulting inundated area in this case study.

100
7.2.2 Indicator and risk type maps (level 0 & 1)
The first results from a stresstest are the indicator datasets displaying hazard impact and vulnerable locations.
These are normalized in the subsequent pages and displayed together with the normalized combination of these
maps, risk index maps (level 1). The indicator index maps are ‘independent’ from each other and are situated in
level 0 of aggregation. The results are shown for every hazard risk type (e.g. heat-health). For every risk type
combination a short explanation is given on noticeable hotspots of the areas and characteristics of the indicators.
Due to the use of the most detailed available data to the researcher, the resolutions of the maps are different with
a minimum resolution of 1 x 1 meter. The demographic resolution is for example for every neighborhood, but the
inundation depth or vulnerable infrastructure for 1 x 1 meter. Higher resolutions give more detailed maps, but give
a less clear overview for large areas. As the previous paragraph already stated the risk maps for pluvial flooding
only differ slightly, which is also checked for the health and livability risk. Therefore only the 111 mm event maps
are shown in this chapter.
The night temperature map displays a clear centralized image on the most urbanized areas, even in areas where water is present, such as the Noorderplantsoen. The 65+ population age cohort lives however more or less in the northwestern neighborhoods and the complete south. The aggregated risk map therefore shows a less centralized image then the hazard map as the neighborhoods with a high elderly density population stand out.
Heat hazard index – Night temperature Heat consequence index – Elderly population
Heat-health risk index
Figure 28: These maps display the heat-health impact chain as designed in subchapter 6.2. The specific hazard- (left) and consequence (right) index are aggregated into the heat-health risk index (bottom) as described by Equation 7 on page 89.

101
Due to the small raster cell size of the consequence map, the visibility of the resulting risk map is reduced. However, it contains detailed information on a very local scale, which is visible when there is zoomed in on the maps. Especially in the center of the city. Differentiation between streets in the center is possible due to these detailed rasters.
Heat consequence index – Population density Heat consequence index – Public Area
Heat-livability risk index
Heat hazard index – Day temperature
Figure 29: These maps display the heat-livability impact chain as designed in subchapter 6.2. The specific hazard- (top-right) and consequence (middle-left and middle-right) indexes are aggregated into the heat-livability risk index (bottom) as described by Equation 7 on page 89.

102
The groundwater map is limited to -4.1 m below the surface and normalized on it as this is the 99
th percentile value. The values below
this threshold are mostly very deep groundwater levels on the visible hill. In the building year map the area with high sandy soils entering Groningen from the South are indicated as vulnerable to foundation damage. However, no wooden piles are present in this soil type. This indicates that the building year indicator should be combined with a soil indicator to mitigate this effect. The risk map is diverse as it is a combination of different consequence indicators. It indicates the possibility of displaying risk for multiple vulnerable sectors (build area, nature and agriculture) to be displayed in a single risk map.
Drought consequence index – Agriculture Drought consequence index – Vulnerable buildings
Drought-damage (due to low groundwater) risk index
Drought consequence index – Vulnerable nature Drought hazard index – Groundwater Level (GLG)
Figure 30: These maps display the drought-damage (due to low groundwater) impact chain as designed in subchapter 6.2. The specific hazard- (top-left) and consequence (top-right, middle-left and middle-right) indexes are aggregated into a drought-damage risk index (bottom) as described by Equation 7 on page 89.

103
The risk map clearly shows that the southwestern neighborhoods have high risks on subsidence till 2050. This map thereby already includes a scenario. Multiple scenarios as discussed in chapter 10 give an overview of the possible future risks.
Figure 31: These maps display the drought-damage (due to subsidence) impact chain as designed in subchapter 6.2. The specific hazard- (top-left) and consequence (top-right) indexes are aggregated into a drought-damage risk index (bottom) as described by Equation 7 on page 89.
Drought hazard index – Subsidence Drought consequence index – Build area
Drought-damage (due to subsidence) risk index

104
The risk map only displays swimming water locations as those are identified as a risk for human health. When the health of ecology is included, this map would differ significantly as the hazard map shows a lot of surface water with water temperature exceeding the threshold of 20 degrees for long periods.
Drought hazard index – Water temperature Drought consequence index – Swimming water
Drought-health risk index
Figure 32: These maps display the drought-health impact chain as designed in subchapter 6.2. The specific hazard- (top-left) and consequence (top-right) indexes are aggregated into a drought-health risk index (bottom) as described by Equation 7 on page 89.

105
The damage map does not show the damaged infrastructure, but this is included in the cost calculations of the damage calculator. The influenced infrastructure can however be seen in the hazard indicator (top-left). The consequence map is defined by the damage calculator, but includes objects from the TOP10NL, BAG, etc. (top-right).
Figure 33: These maps display the Fluvial- & Coastal Flood-damage impact chain as designed in subchapter 6.2. The hazard- (top-left) and consequence (top-right) indexes are aggregated into a Fluvial- & Coastal Flood-damage risk index (bottom) in the “waterschadeschatter” [129] which is then normalized. The consequence map is already included in the damage calculator and is not manually inserted, which is done with the flood depth. Because the consequence map is not publicly available to be displayed, the general topographic is displayed for examplatory purposes. More elaboration is given in paragraph 7.1.5.
Fluvial- & Coastal Flood hazard index – Flood depth Fluvial- & Coastal Flood consequence index – Land use typology
Fluvial- & Coastal Flood-damage risk index

106
Most part of the area is affected by a fluvial- or coastal flood, but vital infrastructure and utilities are mostly at risk on the eastern side of the city and several hotspot locations in the Ten Boer municipality. The hotspots in the city are mostly due to infrastructure unavailability on the eastern highway/ring road and the hospital (UMCG). In Ten Boer due to low lying gas and power stations.
Fluvial- & Coastal Flood hazard index – Flood depth Fluvial- & Coastal Flood consequence index – Vital infra and utilities
water
Fluvial- & Coastal Flood-health risk index
Figure 34: These maps display the Fluvial- & Coastal Flood-health impact chain as designed in subchapter 6.2. The specific hazard- (top-left) and consequence (top-right) indexes are aggregated into a Fluvial- & Coastal Flood-health risk index (bottom) as described by Equation 7 on page 89.

107
The top indicator maps are risk maps by themselves as they combine inundation depth with evacuation and a building property (level height) in the VNK water safety norm method. They can however be combined to create a Fluvial Flooding livability index, indicating the priority on awareness and adaptation to flooding where no horizontal- or vertical evacuation is possible. The northeastern neighborhoods have a priority to be risk aware and to adapt as they have small possibilities to vertical evacuation and only about half of the population can be evacuated horizontally.
Figure 35: These maps display the Fluvial- & Coastal Flood-livability impact chain as designed in subchapter 6.2. In this case is aggregation of two already pre-made risk indexes performed into a Fluvial- & Coastal Flood-livability risk index (bottom).
Fluvial- & Coastal Flood risk index – vertical evacuation Fluvial- & Coastal Flood risk index – horizontal evacuation
Fluvial- & Coastal Flood-livability risk index

108
The damage map does not show the damaged infrastructure, but this is included in the cost calculations of the damage calculator. The influenced infrastructure can however be seen in the hazard indicator (top-left). The consequence map is defined by the damage calculator, but includes objects from the TOP10NL, BAG, etc. (top-right). Due to the small raster cell size, the visibility of the hazard map is not ideal for an overview. It however contains information on a very local scale, which is visible when there is zoomed in on the maps.
Pluvial Flood hazard index – Inundation depth Pluvial Flood consequence index – Land use typology
Pluvial Flood-damage risk index
Figure 36: These maps display the Pluvial Flood-damage impact chain as designed in subchapter 6.2. The hazard- (top-left) and consequence (top-right) indexes are aggregated into a Pluvial Flood-damage risk index (bottom) in the “waterschadeschatter” [129] which is then normalized. The consequence map is already included in the damage calculator and is not manually inserted, which is done with the inundation depth. Because the consequence map is not publicly available to be displayed, the general topographic is displayed for examplatory purposes. More elaboration is given in paragraph 7.1.5.

109
Due to the small raster cell size, the visibility of these maps is not ideal for an overview. It however contains information on a very local scale, which is visible when there is zoomed in on the maps. The hazard map includes a 0.25 m threshold value because it is used for health-risk. All water depths smaller than 0.25 m will therefore be excluded, reducing the inundated area. In combination the detailed display level, the map is badly visible at this size. The risk map shows almost no locations, except two intersections on the northeastern highway/ring road where emergency service routes intersect with pluvial inundation depths > 0.25 m. The highest priority emergency service (red in top right map) routes are not influenced by pluvial flooding.
Figure 37: These maps display Pluvial Flood-health impact chain as designed in subchapter 6.2. The specific hazard- (top-left) and consequence (top-right) indexes are aggregated into a Pluvial Flood-health risk index (bottom) as described by Equation 7 on page 89.
Pluvial Flood hazard index – Inundation depth Pluvial Flood consequence index –Emergency service routes
Pluvial Flood-health risk index

110
Due to the small raster cell size, the visibility of these maps is not ideal for an overview. It however contains information very detailed information as can be seen by the zoomed snapshot in the risk index map. For a general overview, without zoom, these detailed maps are difficult to read. Several local streets can be highlighted in the center and surrounding northern and southern neighborhoods where pluvial flooding, higher than 0.1 meter, can cause problems for livability.
Pluvial Flood hazard index – Inundation depth Pluvial Flood consequence index – Local road priority
Pluvial Flood-livability risk index
Figure 38: These maps display Pluvial Flood-livability impact chain as designed in subchapter 6.2. The specific hazard- (top-left) and consequence (top-right) indexes are aggregated into a Pluvial Flood-livability risk index (bottom) as described by Equation 7 on page 89.

111
7.2.3 Climate Risk maps (level 2 & 3)
The 2nd
level of aggregation combines the different risk index maps for each hazard, creating hazard risk maps. As
stated in the aggregation method, when there are more than two indexes for aggregation and they overlap, they
are first summed and then normalized, which is the case for aggregation level 2 and 3.
Figure 39: These maps are the level 2 aggregated hazard risk maps (see Diagram 14 on page 90 for aggregation levels) for each hazard theme. The risk index maps displayed previously are aggregated by their hazard theme with the function described in Equation 8 on page 89 and normalized to the 0 to 1 range.

112
The 3rd
level of aggregation is the last step of aggregation in which all indicator maps are blended into one risk
map. The city center of Groningen is clearly visible as a climate risk hotspot, as are the southern densely build part
of the Helpman neighborhood, the northwestern neighborhood Paddepoel with a high density 65+ population and
the southwestern neighborhood with subsidence risks. Ten Boer’s climate risks are identified as low compared to
the city of Groningen, but are not zero as some of the hazard risk maps above show with vulnerable utilities during
flood- and drought risk areas.
Figure 40: This map is the level 3 aggregated climate risk map (see Diagram 14 on page 90 for aggregation levels). This total risk index map aggregated the hazard risk index maps from the previous page with the function described in Equation 8 on page 89 and again normalized to the 0 to 1 range.

113
8 Stakeholder Feedback Discussion
5) Are normalization and aggregation usable as a standardized data processing
method for the climate risks?
The case study operationalized normalization for all hazard risks, based on the design diagrams. The process of
normalization as a standardized data processing method for climate risks is herein studied. The last research
question above will primarily be answered in this chapter by discussing the normalization results from the case
study. A focus group [86], consisting of governmental stakeholders, discussed two main questions; 1) is
standardization on the stresstest output, the risk types and impact chains, useful/practical/sufficient and 2) is
the normalization and aggregation method useful/practical/sufficient? This feedback [86], combined with the
researchers own observations during the case study are discussed here.
Standardization and normalization are processes to make things conform a certain state. It is however often
broached that local diversity within an area holds value and should not be reduced by generalized transformations.
The danger within standardization is losing view on this local diversity. The focus group concluded that
standardization does not necessarily have to benefit the adaptive planning results, but can provide boundary or
minimum guidelines that make the process of risk identification, –evaluation and -monitoring or communication
and decision making easier.
There exists skepticism on the possibility of consensus by stakeholders and scientific researches on a
standardized, limitative set of consequence indictors. The eventual possibility of a complete set of standardized
consequence indicators, adopted by all Dutch governmental stakeholders is not by all stakeholders seen as a
possible future. A minimum/essential selection of indicators, as this research proposed would however be
possible, but requires advanced scientific knowledge on cause-effect relationships, as was already concluded from
the interviews
Different types of stresstest data types were used in the case study which were all converted to uniform
indexes which can be compared; ‘infrastructure sensitivity’ as nominal qualitative data combined with quantitative
‘inundation depth’ by categorization, quantitative ‘inundation depth’ combined with nominal ‘land use’ through an
economic dose response function. Heat-mortality is a function not performed in the case study as the mortality
data due to heat, required for this function was not available for direct use as a geo-based indicator. This means
that, although it is a viable option to perform a loss of life function on ‘demographic’ and ‘temperature’ indicators,
mortality data should be prepared and available such that it represents deaths only due to heat with spatial
reference.
“In order to ensure full comparability among different impact indicators, a consistent approach is required for
constructing composites from various single input indicators” [61]. Normalization was found to be a consistent and
practical approach. In practice multiple indicators are often required to get an overview of the consequences. The
problem of assessing multiple indicators together is the human limit of this exercise. An argument was made in the
focus group that aggregation is useful in dealing with this human limit, but the inclusion of a story line, which
elaborates on the applied indicators, principles, quantitative references and dose response, is required. It was
however concluded in complete agreement that the 2nd
and 3rd
level of aggregation are not especially useful for
adaptive management or monitoring. They could maybe be useful for combining measures adapting to multiple
hazards at once, but this should be a local judgment.

114
Normalization is a relative assessment method. This type of method was found to be more applicable than
absolute risk assessment [63] for climate risks. In the focus group discussion different views existed on this
statement, because absolute values are still highly valued. The relative assessment was however seen as practical
to assess spatial differences and therefore a useful tool for allocation of adaptation resources (i.e. budget) over an
area. Absolute comparison of risks between areas which are assessed in different projects is not possible through
this method. However, monitoring on the implementation of measures is discussed in one of the interviews [102]
as a future possibility wherein action perspective is leading and can be more relevant depending on the goal of the
standardization exercise.
Lastly, the question arose on what is an acceptable (residual) risk? Can the normalized risk index help to
answer this question or does it hamper this debate? An index from 0 till 1 does not represent a real value, and
thereby gives no judgment on the acceptable risk. In the focus group was argued that, a priori assumptions and
acceptable risk principles are inserted which influences the risk. These choices are not linear and are defined by
the prioritization and (unconscious) goals set at the start of the assessment. The focus group concluded that the
question of acceptable risk can probably not be answered by one definitive answer. This substantiates the
principles of ALARP and its holistic which represents that we cannot quantify boundary values for the overall
resulting (maximum acceptable-) risk as we can never fully identify all the separate components of risk. Therefore
the best option available at the moment is being able to implement local weighing and prioritization in the risk
assessment, aggregation of hazard and consequence. When taking the discussed limitations and characteristics
into account, a ‘minimum’, baseline framework as designed in chapter 6, consisting of standard risk definitions and
cause-effect relationships with given indicators, guided by a consistent normalization and aggregation method
looks like a viable standardization approach.

115
9 Conclusion
How and where can standardization be implemented in the Dutch climate-
adaptation risk approach, focused on heat stress, drought, pluvial-, fluvial- &
coastal flooding?
The goal of the climate adaptation process as interpreted in this research is to adapt our environment to the
climate extremes. This is done by assessing the risks climate hazards pose and evaluate these to be able to act on
them. The key distinction within this process is identifying and evaluating these risks. From this research can be
concluded that it is recommended to focus standardization on the output of risk identification (called stresstest in
Figure 3, page 11) which is defining the resulting risk. This is substantiated by the sensitivity analysis done in the
case study (paragraph 7.2.1) which compared an inundation map (hazard indicator) with a damage map (combined
hazard and consequence into risk) for different precipitation events. This analysis displays that the hazard map
gives a more diverse image of the affected area then the damage risk map for different precipitation events. This
concluded that solely a discussion on the resulting hazard will produce a different result then defining and
discussing risk (combination of hazard and consequence).
In terms of the input-process-output (IPO) approach the main conclusion is; start defining and standardizing
stresstest output, defining the desired result, before proposing standards for the input or system characteristics
(such as models) when your desired result (i.e. risks) is not defined yet. It was found crucial that climate risks are
identified by impact chains consisting of both a hazard- (model outputs) and consequence indicator that possess a
legitimate cause-effect relationship. Thereby a conclusion can be made on where to standardize; the primary
component of the adaptation process, for standardization and follow-up research, is the stresstest output defined
by impact chains identifying the risks. This is displayed by the proposed stresstest process, given in Diagram 2 on
page 74, and in the chronological summary below with standardizable steps which has an analogy to the
methodology proposed by the ISO vulnerability assessment guideline [88]. The risk assessment includes more
steps such as the hazard analysis or prioritizing the eventual risks, but these are not identified as the focus of
standardization.
1. Identify risk, its impacts chains and underlying cause-effect relationships;
2. Define main hazard- and consequence indicators;
3. Define stakeholder/expert norms;
4. Normalize and aggregate indicators (include quantitative information/references on data sources).
Uncertainties are often mentioned in climate hazard- and risk assessment. Adaptation strategies, such as
implementing ‘no regret’ measures, show that uncertainties do not explicitly have to be addressed in hazard
analysis as they can be addressed in the decision making process [36]. However, if ‘no regret’ strategies are
adopted, the understanding of the essential cause-effect relationships is important because measures rely on the
action perspective defined by this relationship. Reliable cause-effect relationships defined by impact chains are
therefore priority to make such strategies viable.
This research also identified ‘how’ to standardize these steps; 1) essential impact chains were designed, based
on practice and literature research with the most common 2) corresponding indicators and 3) practical standards,
which can be 4) normalized and to a certain extent aggregated.
First, standardization of impact chains starts with defining risk. The recommended risk types to identify are
damage-, health- and livability risks, which are an analogy to societal-, economic- and individual risk in the Dutch

116
flooding standards and are acknowledged by 6 out of 7 interviewees (1 had no opinion). The design tried to define
essential impact chains for each of these risk types and each hazard. The essential impact chains84 recommended
defining in a standardized climate stresstest are:
Heat-livability (for the general outside public);
Heat-health (for the elderly population);
Drought-damage due to low groundwater levels (affecting nature and causing wooden-foundation
damages) and due to subsidence (affecting infrastructure and buildings85);
Drought-health (for humans) through degrading water quality;
Pluvial flood-damage (for the built environment);
Pluvial flood-livability (for neighborhood livability);
Pluvial flood-health (for humans) through accidents and delayed emergency services;
Fluvial- & coastal flood-health (for humans) through indirect fatalities due to failure of
infrastructure/utilities and emergency services;
Fluvial- & coastal flood-damage (for the built environment);
Fluvial- & coastal flood-livability through evacuation possibilities.
For heat-damage and drought-livability no priority and (almost) no indicators were identified in practice
resulting in no relationships that were identified as plausible and conclusive.
These impact chains were designed based on 1) general acknowledgment in Dutch practice (through priority
scoring and consensus by interviewees) and scientific literature (through multiple references), 2) contain action
perspective and 3) they can be applied by using already existing indicators (and data). However, this means that
they are recommended based on the currently available research and practical applications in this specific point in
time. This is substantiated by the interviews which concluded that at the moment there is still a certain lack of
scientific knowledge and data on certain cause-effect relationships of especially heat stress and drought.
Nevertheless, these design impact chains are highly recommended for Dutch practice at this moment as they
present the most recent scientific, practical and policy views. When climate hazard cause-effect relationships are
reliably established, its indicators can be standardized and subsequently practical standards, models and data can
be defined.
Next, the application of a holistic approach, like ALARP, on the Dutch climate adaptation process represents
that we cannot quantify standardized boundary values for the overall resulting (acceptable-) risk as we can never
fully identify all the separate components of risk. We can however produce several (but still not for all) practical
standards that indicate minimum boundary values for the main hazard- and consequence indicators of previous
defined risk impact chains:
Maximum daily temperature higher then > 30 ℃ (heat-livability);
Minimum nightly temperature higher then > 20 ℃ (heat-health);
People density older then > 65 years (heat-health);
Building age lower then < 1960 (drought-damage-groundwater);
Damage factors86 for agriculture (drought-damage-groundwater);
Water temperature higher then > 20 ℃ or water depth shallower then < 5 meters (drought-health);
Inundation depth bigger then > 0.1 meter (pluvial flood-livability & pluvial flood-damage);
85 I.e. built environment. 86 Expected to be delivered by Waterwijzer [125] in the near future.

117
Inundation depth bigger then > 0.25 meter (pluvial flood-health);
Flood depth bigger then > 0.3 meter (fluvial- and coastal flood-health);
Flood depth bigger then > 0.1 meter (fluvial- and coastal flood-damage);
Normalization was found to be a common and practical method for standardizing climate risks (stresstest
output). It makes prioritizing and weighing of the different risk types possible. A general positive consensus by
scientific case studies [25], [46], [57], ISO/NEN [71], [88], interviewed parties [86], [102] and the performed Case
study was found on the applicability of normalization as a standardized data processing tool
(indexing/benchmarking tool). In this research the min-max method was performed, with a fixed index range from
0 to 1. This characteristic makes display of the indexes uniform and easy-to-use in aggregation.
From the focus group discussion could be concluded that aggregation into first level risks (i.e. aggregate
hazard- and consequence indexes of a specific risk impact chain) is most optimal. Higher aggregation levels would
lose information and thereby action perspective. Aggregation into risk is thereby suggested, but further
aggregation of these risks is not. From the case study could also be concluded that the high level of detail of some
index maps, combined with the applied color scheme did not give a clear overview of the areas at risk. Display of
these maps, without having to use a zoom-function could be improved. The level of detail however provides higher
applicability of the maps on smaller spatial scales. Also a proper check of the indicator data, especially when a
product of a model, is required as faulty extreme outliers can cause a real problem for indexing.
Lastly, the relative nature of the min-max index (0 to 1) applied in this research, gives no intrinsic judgment
on the “maximum acceptable risk” (as identified in ALARP). However, it was already concluded that there will
probably be not one definitive answer on the “maximum acceptable risk” [36], [86]. Therefore a normalization tool
which produces relative indices provides room for local definition of this “maximum acceptable risk”. It’s
practicality for comparison, monitoring and evaluation was found to be promising for Dutch practice, as long as a
story line, which elaborates on the applied impact chain, with its indicators, practical standard/norms and
quantitative references is displayed in combination with the index.

118
10 General Discussion Several topics can be discussed, when looking back on the applied research methods and results. The first four
paragraphs discuss topics reflecting the methodological approach applied in this research; 1) scope of the research,
2) inclusion of climate scenario analysis, 3) adaptive capacity indicators and 4) explicit display of consequences as
part of the conceptual framework. The last two paragraphs discuss how the results are 1) similar with the ISO
guideline and 2) contrasting with current practice.
Scope of this research 10.1The scope of this research can be described as big. It encompasses four different hazard themes, a process
consisting of both risk identification and –evaluation and many pages describing the results from three qualitative
research methods. It defined indicators, methods and norms, applied all of these on a case study and made use of
135 references to policy documents, scientific research and company documents. As stated in the preface, this is
inherent to my own character, which likes to investigate the whole context of a topic. Looking back, a more
compact scope on for example one hazard theme, could have made incorporation of the next two paragraph
topics possible. However, the scope of this research ultimately led to a complete picture on standardization of the
stresstest as a whole applied in the Netherlands.
Climate scenarios 10.2In the theoretical framework is mentioned that “uncertainty in future climate makes it impossible to directly use
the output of a single climate model as an input for … design, and there are good reasons to think that the needed
climate information will not be available soon” [36]. Future climate change does however have to be taken into
account in stresstests, but the ‘correct’ future climate scenario cannot be defined. How to do this could have been
incorporated in this research. It can however also be a recommendation for future research which results in
propositions for incorporation of climate change scenarios in a standardized stresstest. Executing multiple
stresstests for different (climate) scenarios and applying a scenario-analysis on the results is for example a
methodological option.
An adaptive capacity indicator 10.3Adaptability of exposed people/systems/environments is not specifically highlighted in this research as was
endorsed by an earlier master thesis at the TU Delft by T. Deurloo [20]. Action perspective plays a major role in the
cause-effect relationships defining the stresstest risks of which the definition closely resembles that of adaptive
capacity. At first these were identified as the same thing, under a different term, but actually they differ. Action
perspective is the capacity of a stakeholder to reduce risk by adaptation measures. Adaptive capacity is however a
characteristic, the ability of a system, environment or actor to change in order to reduce a risk [43]. Introducing
and incorporating adaptive capacity indicators, which were identified by T. Deurloo [20] or other
literature/research, into the defined impact chains could be recommended.
A combination of hazard and consequence 10.4The conceptual framework of this research in Figure 3, built on existing and applied risk-/vulnerability approaches,
lacks the crucial ‘consequence’ component. The risk analysis step has a hazard map as input and risk as output.
However, from this research is concluded that the ‘consequence indicator (map)’ component is as important. Both
components, hazard and consequence, should therefore be explicitly displayed in existing approaches as input for
the risk analysis.
The focus on the hazard component is partially beneficial for practice as it helps preventing discussion and
brings relieve for lower governments in this technical area of the stresstest by delivering detailed hazard stresstest

119
input, which helps increasing the quality of defining the hazard. However it is not the only component required for
defining the final risk as it only studies the hazard component of the equation and not the consequence.
Similarity with the ISO guideline 10.5The proposed standardization process has an analogy to the methodology from the ISO vulnerability assessment
guideline [88]:
1. Identify assumed cause-effect relationships underlying the assessment, including the impact chains;
2. Select indicators and method for data quantification;
3. Select stakeholder/expert criteria and norms;
4. Weigh the different components (e.g. stakeholder process) and normalize/monetize;
5. Select aggregation level;
6. Include quantitative information/references on data sources and functions for M&E.
This similarity in process is possibly due to the fact that this approach is a general approach for a semi-quantitative
problem. This makes the approach applicable to all semi-quantitative problems and not just climate vulnerability-
or risk assessments. This approach is thereby valid for these types of assessments, but a general approach. It does
not answer “how to standardize” the climate risk assessment. This thesis however tried to formulate a more solid
answer on how to standardize the components (cause-effect relationships, indicators, methods, norms) of a
climate risk assessment as performed in Dutch practice.
Contrast with current national practice 10.6The conclusions on where and how to standardize are partially contradicting with how the standardization exercise
is performed at the moment in Dutch policy. Dutch policy is mostly trying to standardize input hazard indicators
(e.g. rainfall events) and its data [86] based on the assumption phrased by Rioned; that a stresstest has to be
schematized as detailed as possible to approach reality [82]. This hazard analysis focus was also noticed while
doing this research, by the highly present and many references to the single hazard component in literature, Dutch
practice and policy. A lot of information was gathered about the applied hazard indicators and models, and less on
the consequence component, as was visible in the results chapter of 4.2 and as discussed in previous paragraph
10.4.

120
11 Recommendations Multiple, but also common, views on risk assessment and how to cope with climate change advocate further
research. The recommended design in this research will greatly benefit from further research as it should evolve
before it can become a standard. Ideas for evolving research are listed here:
Investigate impact chains; the relationship between the secondary hazard indicators (output from hazard
models) and the correct consequence indicators…
1) … to achieve this, research the correct dose-response relationships for these relationships, like
heat-mortality or depth-mortality …
2) … preferably for all three risk types that can be identified for the hazards …
3) … as this will beneficially improve the knowledge on general principles for these relationships
and increase their trustworthiness as standards.
The inundation comparison gave the first clues that increases in hazard magnitude do not have to result in
the same magnitude of risk. Sensitivity analysis into the conversion from hazard to risk is recommended
as it provides more arguments to debate whether it is recommended to research the hazard indicators
extensively or start with research on the eventual risk and corresponding impact chains.
This research has a regional spatial extent including urban ‘and’ rural areas. The Dutch practice, and
therefore the interviewees and corresponding results, is however still highly focused on the urban area.
The rural area can thereby be less incorporated and present throughout the research. Advances in rural
climate impact and adaptation are therefore encouraged by the interviewed parties and myself.
Spatial adaptation, which was researched in this thesis, is not the only way to adapt to climate change.
Social adaptation, as sometimes mentioned by interviewed parties, is a domain equally important.
Research into the incorporation and/or standardization of social adaptation with spatial adaptation would
be recommended.
Lastly, the Climate Effect Atlas [13] is highly referenced in this research and the developer was interviewed. In
this research it was found to be an extremely useful tool and platform for receiving climate data and information.
It is recommended for national standardization policies to incorporate any kind of climate adaptation
standardization through this tool. The story maps, data and viewer of this platform around standardized risk
impact chains are already present. The recommended standardization approach of this research can be
incorporated in this structure as it focuses on impact chains and story lines. The Climate Effect Atlas [13] tool is
endorsed as the main viewer and data source for implementing any standardizations.
121
12 Bibliography [1] W. N. Adger et al., “Are there social limits to adaptation to climate change?,” Climatic Change, vol. 93, no.
3–4, pp. 335–354, Apr. 2009. [2] P. Baan and F. Klijn, “Veiligheidsbenadering bij overstromingen: naar meer zelfredzaamheid,” H2O, vol. 18,
2003. [3] I. Baker, A. Peterson, G. Brown, and C. McAlpine, “Local government response to the impacts of climate
change: An evaluation of local climate adaptation plans,” Landscape and Urban Planning, vol. 107, no. 2, pp. 127–136, Aug. 2012.
[4] J. Bessembinder, K. Peerdeman, H. Hakvoort, and B. van Weeren, “Nieuwe neerslagstatistieken voor het waterbeheer,” STOWA, 10A, 2015.
[5] G. R. Biesbroek et al., “Europe adapts to climate change: Comparing National Adaptation Strategies,” Global Environmental Change, vol. 20, no. 3, pp. 440–450, Aug. 2010.
[6] G. Blom, M. Paulissen, C. Vos, and H. Agricola, “Effecten van Klimaatverandering op Landbouw en Natuur,” Alterra, 182, 2008.
[7] M. Bockarjova, P. Rietveld, and E. Verhoef, “First results immaterial damage valuation: value of statistical life (VOSL), value of evacuation (VOE) and value of injury (VOI) in flood risk context, a stated preference study (III),” Department of Spatial Economics, VU Amsterdam, 2009.
[8] C. Brown and R. L. Wilby, “An alternate approach to assessing climate risks,” Eos, Transactions American Geophysical Union, vol. 93, no. 41, pp. 401–402, 2012.
[9] K. de Bruin, H. Goosen, E. C. van Ierland, and R. A. Groeneveld, “Costs and benefits of adapting spatial planning to climate change: lessons learned from a large-scale urban development project in the Netherlands,” Regional Environmental Change, Apr. 2013.
[10] M. Catenacci and C. Giupponi, “Integrated assessment of sea-level rise adaptation strategies using a Bayesian decision network approach,” Environmental Modelling & Software, vol. 44, pp. 87–100, Jun. 2013.
[11] K.-Y. Chang, L. Xu, G. Starr, and K. T. Paw U, “A drought indicator reflecting ecosystem responses to water availability: The Normalized Ecosystem Drought Index,” Agricultural and Forest Meteorology, vol. 250–251, pp. 102–117, Mar. 2018.
[12] N. Clifford, M. Cope, T. Gillespie, and S. French, Key Methods in Geography. SAGE, 2016. [13] Climate Adaptation Services, “Klimaat Effect Atlas,” Klimaateffectatlas. [Online]. Available:
http://www.klimaateffectatlas.nl/. [Accessed: 20-Mar-2018]. [14] Climate Adaptation Services, “Niets doen kost amersfoort 60 tot 145 miljoen’’,” Stad in het nieuwe klimaat. [15] D. Coles, D. Yu, R. L. Wilby, D. Green, and Z. Herring, “Beyond ‘flood hotspots’: Modelling emergency
service accessibility during flooding in York, UK,” Journal of Hydrology, vol. 546, pp. 419–436, Mar. 2017. [16] R. J. Dawson, R. Peppe, and M. Wang, “An agent-based model for risk-based flood incident management,”
Natural Hazards, vol. 59, no. 1, pp. 167–189, Oct. 2011. [17] Deltacommissaris, “Deltaprogramma 2018,” Rijksoverheid, Den Haag, 2017. [18] Deltacommissaris, “Deltaplan: Ruimtelijke Adaptatie,” Rijksoverheid, Den Haag, 2017. [19] Deltacommissaris, “Deltabeslissing Ruimtelijke Adaptatie,” Rijksoverheid, 2014. [20] T. J. C. Deurloo, “To adapt or not to adapt: a study into adaptability of the urban environment,” Master
Thesis, TU Delft, 2016. [22] P.-A. Dugord, S. Lauf, C. Schuster, and B. Kleinschmit, “Land use patterns, temperature distribution, and
potential heat stress risk – The case study Berlin, Germany,” Computers, Environment and Urban Systems, vol. 48, pp. 86–98, Nov. 2014.
[23] M. Dumitraşcu, I. Mocanu, B. Mitrică, C. Dragotă, I. Grigorescu, and C. Dumitrică, “The assessment of socio-economic vulnerability to drought in Southern Romania (Oltenia Plain),” International Journal of Disaster Risk Reduction, vol. 27, pp. 142–154, Mar. 2018.
[24] M. Egging, H. Bos, T. van Veelen, and J. Grutters, “Guideline Standardized Stresstest Light,” Ministry of Infrastructure and Water, Feb. 2018.
[25] A. El-Zein and F. N. Tonmoy, “Assessment of vulnerability to climate change using a multi-criteria outranking approach with application to heat stress in Sydney,” Ecological Indicators, vol. 48, pp. 207–217, Jan. 2015.

122
[26] Y. Epstein and D. S. Moran, “Thermal comfort and the heat stress indices,” Industrial health, vol. 44, no. 3, pp. 388–398, 2006.
[27] GBO provincies, “Risicokaart,” Risicokaart. [Online]. Available: /welke-risicos-zijn-er/overstroming. [Accessed: 20-Mar-2018].
[28] K. van der Geest and K. Warner, “Vulnerability, Coping and Loss and Damage from Climate Events,” in Hazards, Risks and Disasters in Society, Elsevier, 2015, pp. 121–144.
[29] G. D. Geldof and J. Kluck, “The Three Points Approach,” presented at the 11th International Conference on Urban Drainage, Edinburgh, 2008.
[30] M. D. Gerst, R. B. Howarth, and M. E. Borsuk, “The interplay between risk attitudes and low probability, high cost outcomes in climate policy analysis,” Environmental Modelling & Software, vol. 41, pp. 176–184, Mar. 2013.
[31] E. Gloudemans, C. van Bladeren, and M. van Kruining, “Klimaat, normering, risico’s, schade en verzekerbaarheid,” Unie van Waterschappen, Concept Notice IP 93404, 2018.
[33] K. Grant, J. Kreyling, L. F. H. Dienstbach, C. Beierkuhnlein, and A. Jentsch, “Water stress due to increased intra-annual precipitation variability reduced forage yield but raised forage quality of a temperate grassland,” Agriculture, Ecosystems & Environment, vol. 186, pp. 11–22, Mar. 2014.
[34] R. Groen, J. Zoete, J. Klompmaker, and M. Schilt, “UCAM: Urban Climate Assessment and Management,” Witteveen+Bos, 2014.
[35] S. Hajat and L. T. Barnard, “Cold-Related Mortality and Morbidity,” in Climate Vulnerability, Elsevier, 2013, pp. 157–164.
[36] S. Hallegatte, “Strategies to adapt to an uncertain climate change,” Global Environmental Change, vol. 19, no. 2, pp. 240–247, May 2009.
[37] HarmoniCOP, Learning together to manage together: Improving participation in water management. University of Osnabruck, 2005.
[38] G. Henckens and W. Engel, “Benchmark Studie Inundatiemodellen,” STOWA, 34, 2017. [39] T. van Hooff, B. Blocken, J. L. M. Hensen, and H. J. P. Timmermans, “On the predicted effectiveness of
climate adaptation measures for residential buildings,” Building and Environment, vol. 82, pp. 300–316, Dec. 2014.
[40] M. Hoogvliet et al., “Schades door watertekorten en -overschotten in stedelijk gebied,” Deltares, 1205463–000, 2012.
[41] P. Höppe, “The physiological equivalent temperature–a universal index for the biometeorological assessment of the thermal environment,” International journal of Biometeorology, vol. 43, no. 2, pp. 71–75, 1999.
[42] Intergovernmental Panel on Climate Change, Climate change 2013: the physical science basis: Working Group I contribution to the Fifth assessment report of the Intergovernmental Panel on Climate Change. New York: Cambridge University Press, 2014.
[43] Intergovernmental Panel on Climate Change, Ed., Climate change 2014: synthesis report. Geneva, Switzerland: Intergovernmental Panel on Climate Change, 2015.
[44] C. M. J. Jacobs, I. J. La Rivière, and H. Goosen, “Cool Water Tool,” Landschap: tijdschrift voor Landschapsecologie en Milieukunde, vol. 31, no. 3, pp. 132–138, 2014.
[45] K. Johnson, Y. Depietri, and M. Breil, “Multi-hazard risk assessment of two Hong Kong districts,” International Journal of Disaster Risk Reduction, vol. 19, pp. 311–323, Oct. 2016.
[46] K. Johnson, Y. Depietri, and M. Breil, “Multi-hazard risk assessment of two Hong Kong districts,” International Journal of Disaster Risk Reduction, vol. 19, pp. 311–323, Oct. 2016.
[47] S. N. Jonkman, “Loss of life estimation in flood risk assessment,” PhD-report, TU Delft, 2007. [48] W. Kip Viscusi, “The Value of Individual and Societal Risks to Life and Health,” in Handbook of the
Economics of Risk and Uncertainty, vol. 1, Elsevier, 2014, pp. 385–452. [50] M. Kok, R. Jongejan, M. Nieuwjaar, and I. Tanczos, Fundamentals of Flood Protection, English.
Expertisenetwerk Waterveiligheid, 2017. [51] M. van B. Z. en Koninkrijksrelaties, “Waterstaatswet 1900.” *Online+. Available:
http://wetten.overheid.nl/BWBR0001867/2017-09-01. [Accessed: 29-Jun-2018]. [52] R. S. Kovats and S. Hajat, “Heat Stress and Public Health: A Critical Review,” Annual Review of Public Health,
vol. 29, no. 1, pp. 41–55, Apr. 2008.

123
[53] S. Kovats, “Heat-Related Mortality,” in Climate Vulnerability, Elsevier, 2013, pp. 95–103. [54] N. Krstic, W. Yuchi, H. C. Ho, B. B. Walker, A. J. Knudby, and S. B. Henderson, “The Heat Exposure Integrated
Deprivation Index (HEIDI): A data-driven approach to quantifying neighborhood risk during extreme hot weather,” Environment International, vol. 109, pp. 42–52, Dec. 2017.
[55] T. Krüger, F. Held, S. Hoechstetter, V. Goldberg, T. Geyer, and C. Kurbjuhn, “A new heat sensitivity index for settlement areas,” Urban Climate, vol. 6, pp. 63–81, Dec. 2013.
[56] Y.-J. Lee, “Social vulnerability indicators as a sustainable planning tool,” Environmental Impact Assessment Review, vol. 44, pp. 31–42, Jan. 2014.
[57] Y.-J. Lee, “Social vulnerability indicators as a sustainable planning tool,” Environmental Impact Assessment Review, vol. 44, pp. 31–42, Jan. 2014.
[58] A. Lemonsu, V. Viguié, M. Daniel, and V. Masson, “Vulnerability to heat waves: Impact of urban expansion scenarios on urban heat island and heat stress in Paris (France),” Urban Climate, vol. 14, pp. 586–605, Dec. 2015.
[59] J. Li et al., “Ambient high temperature and mortality in Jinan, China: A study of heat thresholds and vulnerable populations,” Environmental Research, vol. 156, pp. 657–664, Jul. 2017.
[60] I. Linkov, E. Anklam, Z. A. Collier, D. DiMase, and O. Renn, “Risk-based standards: integrating top–down and bottom–up approaches,” Environment Systems and Decisions, vol. 34, no. 1, pp. 134–137, Mar. 2014.
[61] T. Lung, C. Lavalle, R. Hiederer, A. Dosio, and L. M. Bouwer, “A multi-hazard regional level impact assessment for Europe combining indicators of climatic and non-climatic change,” Global Environmental Change, vol. 23, no. 2, pp. 522–536, Apr. 2013.
[62] H. de Man and I. Leenen, “Water in de openbare ruimte heeft risico’s voor de gezondheid,” RIONED, Summary of PhD, 2014.
[63] S. E. van Manen and M. Brinkhuis, “Quantitative flood risk assessment for Polders,” Reliability Engineering & System Safety, vol. 90, no. 2–3, pp. 229–237, Nov. 2005.
[64] G. R. McGregor, Great Britain, and Environment Agency, Using science to create a better place: the social impacts of heat waves. Bristol: Environment Agency, 2007.
[65] S. van der Meulen, R. Brolsma, and S. Moinier, “Ecosystem services provision; dependence of water quality and quantity,” Deltares, 2016.
[66] D. Mildrexler, Z. Yang, W. B. Cohen, and D. M. Bell, “A forest vulnerability index based on drought and high temperatures,” Remote Sensing of Environment, vol. 173, pp. 314–325, Feb. 2016.
[68] L. M. Mosley, “Drought impacts on the water quality of freshwater systems; review and integration,” Earth-Science Reviews, vol. 140, pp. 203–214, Jan. 2015.
[69] S. G. Nayak et al., “Development of a heat vulnerability index for New York State,” Public Health, Dec. 2017. [70] NEN, “RESIN-project ‘Climate Resilient Cities and Infrastructures,’” NEN. [Online]. Available:
https://www.nen.nl/Normontwikkeling/Klimaatadaptatie-2/RESINproject.htm. [Accessed: 09-Apr-2018]. [71] NEN, “What is normalization?,” NEN. [Online]. Available: https://www.nen.nl/Normontwikkeling/Wat-is-
normalisatie.htm. [Accessed: 07-May-2018]. [72] M. J. Noru, IBM SPSS Statistics 19 Guide to Data Analysis. Prentice Hall, 2012. [73] H. Pasman, “Costs of Accidents, Costs of Safety, Risk-Based Economic Decision Making,” in Risk Analysis
and Control for Industrial Processes - Gas, Oil and Chemicals, Elsevier, 2015, pp. 383–406. [74] H. Pasman, “Risk, Risk Perception, Risk Communication, Risk Acceptance,” in Risk Analysis and Control for
Industrial Processes - Gas, Oil and Chemicals, Elsevier, 2015, pp. 431–454. [75] PDOK, “PDOK | Public Geo-data service.” *Online+. Available:
https://www.pdok.nl/nl/producten/downloaden-van-data-pdok. [Accessed: 15-May-2018]. [76] S. J. Priest, D. J. Parker, A. P. Hurford, J. Walker, and K. Evans, “Assessing options for the development of
surface water flood warning in England and Wales,” Journal of Environmental Management, vol. 92, no. 12, pp. 3038–3048, Dec. 2011.
[77] A. Quinn et al., “Predicting indoor heat exposure risk during extreme heat events,” Science of The Total Environment, vol. 490, pp. 686–693, Aug. 2014.
[78] M. S. Ragettli, A. M. Vicedo-Cabrera, C. Schindler, and M. Röösli, “Exploring the association between heat and mortality in Switzerland between 1995 and 2013,” Environmental Research, vol. 158, pp. 703–709, Oct. 2017.

124
[79] C. Ramis and A. Amengual, “Climate Change Effects on European Heat Waves and Human Health,” in Encyclopedia of the Anthropocene, Elsevier, 2018, pp. 209–216.
[80] Rijkswaterstaat, Ministry of Infrastructure and Environment, “Water nuisance norms - NBW,” Kenniscentrum InfoMil. [Online]. Available: https://www.infomil.nl/onderwerpen/lucht-water/handboek-water/thema’s/wateroverlast-0/normen-wateroverlast/. [Accessed: 26-Feb-2018].
[81] Rijkswaterstaat, Ministry of Infrastructure and Environment, “Priority series for water shortage,” Kenniscentrum InfoMil. [Online]. Available: https://www.infomil.nl/onderwerpen/lucht-water/handboek-water/thema’s/watertekort/verdringingsreeks/. *Accessed: 26-Feb-2018].
[82] Rioned, “Stresstest DPRA,” Oct. 2017. [83] M. Roobavannan et al., “Norms and values in socio-hydrological models,” Hydrology and Earth System
Sciences Discussions, pp. 1–27, Jul. 2017. [84] J. Rotmans, Societal Innovation: between dream and reality lies complexity. Rotterdam]: Erasmus Research
Institute of Management (ERIM), Erasmus University Rotterdam; Rotterdam: Erasmus University Rotterdam [Host, 2005.
[85] S. H. Sadeghi and Z. Hazbavi, “Spatiotemporal variation of watershed health propensity through reliability-resilience-vulnerability based drought index (case study: Shazand Watershed in Iran),” Science of The Total Environment, vol. 587–588, pp. 168–176, Jun. 2017.
[86] M. Schuit, M. Blaas, C. Bouwense, K. Veeneman, W. Heijnen, and M. Haan, Focus Group meeting Governmental Stakeholders. Groningen, 2018.
[87] N. R. Sikula, J. W. Mancillas, I. Linkov, and J. A. McDonagh, “Risk management is not enough: a conceptual model for resilience and adaptation-based vulnerability assessments,” Environment Systems and Decisions, vol. 35, no. 2, pp. 219–228, Jun. 2015.
[88] D. Singer, W. Belknap, and G. Franceschini, “International Organisation for Standardisation ISO/IEC JTC1/SC29/WG11,” 2002.
[89] D. J. Smith and K. G. Simpson, Safety Critical Systems Handbook: A Straight forward Guide to Functional Safety, IEC 61508 (2010 EDITION) and Related Standards, Including Process IEC 61511 and Machinery IEC 62061 and ISO 13849. Elsevier, 2010.
[90] M. D. Smith, “Extreme Climatic Events,” in Climate Vulnerability, Elsevier, 2013, pp. 71–80. [91] C. Soares, Ed., Safety and Reliability of Industrial Products, Systems and Structures. CRC Press, 2010. [93] G. S. Stelling and V. Casulli, “3Di 0.7 documentation.” *Online+. Available:
https://docs.3di.lizard.net/en/stable/a_introduction.html. [Accessed: 20-Mar-2018]. [94] I. D. Stewart and T. R. Oke, “Local Climate Zones for Urban Temperature Studies,” Bull. Amer. Meteor. Soc.,
vol. 93, no. 12, pp. 1879–1900, May 2012. [95] T. Sybrand, P. Baan, M. Rijsberman, F. van de Ven, and P. van Eijk, Water in drievoud. Delft: Eburon, 2005. [96] C. Tapia et al., “Profiling urban vulnerabilities to climate change: An indicator-based vulnerability
assessment for European cities,” Ecological Indicators, vol. 78, pp. 142–155, Jul. 2017. [97] D. Touma, M. Ashfaq, M. A. Nayak, S.-C. Kao, and N. S. Diffenbaugh, “A multi-model and multi-index
evaluation of drought characteristics in the 21st century,” Journal of Hydrology, vol. 526, pp. 196–207, Jul. 2015.
[99] J. van Tuijn, “Doe de stresstest!,” Waterforum, Dec-2017. [102] L. Valkenburg et al., “Transcriptions of Research Interviews,” 28-Mar-2018. [103] L. Van Ootegem, E. Verhofstadt, K. Van Herck, and T. Creten, “Multivariate pluvial flood damage models,”
Environmental Impact Assessment Review, vol. 54, pp. 91–100, Sep. 2015. [104] M. van der Vat et al., “Risicobenadering voor de Nederlandse zoetwatervoorziening: methode ontwikkeling
en toepassing op drie casestudies in Nederland,” Deltares, 2016. [105] F. H. M. van de Ven et al., “Adaptation Planning Support Toolbox: Measurable performance information
based tools for co-creation of resilient, ecosystem-based urban plans with urban designers, decision-makers and stakeholders,” Environmental Science & Policy, vol. 66, pp. 427–436, Dec. 2016.
[106] F. van de Ven et al., “Building the Netherlands Climate Proof: Urban Areas,” Deltares, UNESCO-IHE, ISBN 978-94-9007-047-2, 2010.
[107] F. van de Ven, J. Buma, and T. Vos, “Guideline for Stress Testing the Climate Resilience of Urban Areas,” Rijksoverheid, 2014.

125
[108] E. Verkaik, L. G. Moraal, and G. J. M. M. Nabuurs, “Potential impacts of climate change on Dutch forests,” Alterra, ISSN 1566-7197, 2009.
[109] C. C. Vos, B. S. J. Nijhof, M. van der Veen, P. F. M. Opdam, and J. Verboom, “Risicoanalyse kwetsbaarheid natuur voor klimaatverandering,” Alterra, ISSN 1566-7197, 2007.
[110] D. J. Wainwright et al., “Moving from deterministic towards probabilistic coastal hazard and risk assessment: Development of a modelling framework and application to Narrabeen Beach, New South Wales, Australia,” Coastal Engineering, vol. 96, pp. 92–99, Feb. 2015.
[111] H. R. Wallingford, “Flood Risks to People: Phase 2,” Defra/Environment Agency UK, Flood hazard Research Centre, Middlesex University, Guidance Document FD2321/TR2, Mar. 2006.
[112] S. Weber, N. Sadoff, E. Zell, and A. de Sherbinin, “Policy-relevant indicators for mapping the vulnerability of urban populations to extreme heat events: A case study of Philadelphia,” Applied Geography, vol. 63, pp. 231–243, Sep. 2015.
[113] Working Group DPHN, “Manifest Climate Resilient City,” 2013. [114] D. Yu and T. J. Coulthard, “Evaluating the importance of catchment hydrological parameters for urban
surface water flood modelling using a simple hydro-inundation model,” Journal of Hydrology, vol. 524, pp. 385–400, May 2015.
[115] Z. Zaidi and M. Pelling, “Vulnerability to Drought and Heatwave in London,” in Assessment of Vulnerability to Natural Hazards, Elsevier, 2014, pp. 125–148.
[116] K. Zander, W. J. W. Botzen, E. Oppermann, T. Kjellstrom, and S. Garnett, “Heat stress causes substantial labour productivity loss in Australia,” Nature Climate Change, vol. 5, pp. 647–651, May 2015.
[117] K. K. Zander, S. A. Moss, and S. T. Garnett, “Drivers of self-reported heat stress in the Australian labour force,” Environmental Research, vol. 152, pp. 272–279, Jan. 2017.
[118] Q. Zhou, P. S. Mikkelsen, K. Halsnæs, and K. Arnbjerg-Nielsen, “Framework for economic pluvial flood risk assessment considering climate change effects and adaptation benefits,” Journal of Hydrology, vol. 414–415, pp. 539–549, Jan. 2012.
[119] “Cambridge Dictionary.” Cambridge University Press, 2018. [120] “Knowledge Portal Spatial Adaptation.” *Online+. Available:
https://ruimtelijkeadaptatie.nl/handreiking/handreiking/weten/kwetsbaarheid/stresstest/. [121] “ScienceDirect.com | Science journals, full text articles and books.,” Science Direct. [Online]. Available:
https://www.sciencedirect.com/. [Accessed: 01-Feb-2018]. [122] “NEN-ISO/IEC 31010: Riskmanagement - Risk assessment techniques,” NEN-ISO/IEC, Standard ISO/IEC
31010:2009,IDT, 2012. [123] “Module C2100 Leidraad Riolering,” Rioned, Guidance Document, Aug. 2004. [124] “Tygron Support Wiki.” *Online+. Available: http://support.tygron.com/wiki/Main_Page. [Accessed: 02-Apr-
2018]. [125] “Stowa - Thema’s - Waterwijzer - Achtergronden - Waterwijzer Landbouw, algemeen.” *Online+. Available:
http://waterwijzer.stowa.nl/Achtergronden/Waterwijzer_Landbouw__algemeen.aspx. [Accessed: 04-May-2018].
[126] “Nationaal Water Model,” Helpdesk water. [Online]. Available: https://www.helpdeskwater.nl/onderwerpen/applicaties-modellen/applicaties-per/watermanagement/watermanagement/nationaal-water/. [Accessed: 23-Mar-2018].
[127] “Nelen & Schuurmans.” *Online+. Available: https://www.nelen-schuurmans.nl/. [Accessed: 20-Mar-2018]. [128] “Informatiemodel Natuur (IMNa),” Geonovum, Oct. 2017. [129] “Manual Water Damage Calculator (‘WaterSchadeSchatter’),” Nelen & Schuurmans, Jun. 2017. [130] “Klimaatadaptatie op basis van wijktypen,” ROmagazine, 23-Nov-2017. [Online]. Available:
http://romagazine.nl/18102-2/18102. [Accessed: 20-Mar-2018]. [131] “LIWO – Landelijk Informatiesysteem Water en Overstromingen.” [Online]. Available:
https://basisinformatie-overstromingen.nl/liwo/. [Accessed: 26-Mar-2018]. [132] “Adaptive Solutions,” ClimateApp. [Online]. Available: http://www.climateapp.nl/. [Accessed: 05-Apr-
2018]. [133] “Ecosystem services provision; dependence of water quality and quantity,” Deltares, 2017. [134] “CBS StatLine.” *Online+. Available: http://statline.cbs.nl/Statweb/. [Accessed: 15-May-2018]. [135] “Stresstest Regenwater.” RIONED, Oct-2017.

126
13 Appendices
Appendix A: Interviewee Company Process Diagrams 13.1These process diagrams are products of the author of this report to represent the actual processes as truthfully as
possible. They are however spin-off informative products and can only be used for that purpose alone. The
diagrams are based on available public and actively shared information, mainly referenced in chapter 4 and
presented in the bibliography. An explanation of the process diagrams is given in subchapter 4.1.

127
Diagram 16: This process diagram represents the stresstest processes and indicators applied by Aveco de Bondt.

128
Diagram 17: This process diagram represents the stresstest processes and indicators applied by Nelen & Schuurmans. Not much information on the drought processes could be acquired

129
Diagram 18: This process diagram represents the stresstest processes and indicators applied by Sweco. Diagram 1 is a copy of this diagram for explanatory purposes due to the completeness of this process diagram.

130
Diagram 19: This process diagram represents the stresstest processes and indicators applied by Tauw.

131
Diagram 20: This process diagram represents the stresstest processes and indicators applied by Witteveen + Bos.

132
Diagram 21: This process diagram represents the processes and indicators applied for creating the risk maps available in the climate adaptation viewer [13] from Climate Adaptation Services. The diagram continues on the next page.

133

134
Appendix B: Interview hypotheses 13.2Topic Statement Agr
ee Disagree
No opinion / Not discussed
Holistic approach
I agree with a holistic process approach 2 0 5
Integral approach
The stresstest should be evaluated in an integrated context, but the theme's should individually be analyzed
6 0 1
Stresstest Goal Goal of the stresstest is:
- Producing data for the stakeholder discussion 5 0 2
- Activating the risk dialogue 7 0 0
- Quantifying/identifying risks 4 0 3
- Localizing vulnerable hotspots 2 0 5
- Identifying cause-effect relationships 4 0 3
Principles Principles are a combination of stakeholder and expert/scientific judgment
7 0 0
Standardization
Standardization is preferred on the principles of indicators in the process steps
4 0 3
Standardization should be done on the input and output instead of the models
2 0 5
Standardization can be done with legalized norms 0 7 0
Risk types Three risk types can be distinguished; damage, health and livability
6 0 1
A priority/focus in/on risk types can be made 6 0 1
Categorize Prefer quantitative maps above qualitative maps 4 1 2
Heat For heat a knowledge gap exists 4 0 3
Heat cause-effect relationships are difficult to define 4 0 3
Take heat stress into account, but don't try to quantify it 1 1 5
Drought For drought a knowledge gap exists 1 1 5
Drought cause-effect relationships are difficult to define 2 0 5
Take drought into account, but don't try to quantify it 0 0 7
Pluvial flood For pluvial flooding a knowledge gap exists 0 3 4
Pluvial Flooding cause-effect relationships are difficult to define
0 3 4
Take pluvial flooding into account, but don't try to quantify it
0 3 4
Fluvial flood For fluvial flooding a knowledge gap exists 0 2 5
Fluvial Flooding cause-effect relationships are difficult to define
1 1 5
Take fluvial flooding into account, but don't try to quantify it
3 0 4
Water quality Water quality should be identified as a separate theme 2 0 5
Impact chains Defining essential impact chains (cause-effect relationships) are key to standardization
5 0 2
Action perspective
Action perspective is crucial when defining impact chains 6 0 1
Essential An assessment of “essential” and “additional” indicators can prove useful
4 0 3
Non-essential Are there signal indicators, but non-essential? 3 1 3

135
Cost-effectiveness
Cost-effectiveness is a purpose to pursue 3 0 3
Normalization Normalization could be a helpful tool for risk evaluation 4 0 3
Monetizing Monetizing could be a helpful tool for risk evaluation 4 0 3
Action evaluation
Evaluation of action implementation should be done 4 0 3
Measure feedback
Measures should affect your input indicators 5 0 2
Advancing knowledge
Advancing knowledge should be able to be implemented in any form of standardization
6 0 1

136
Appendix C: Elaborated hypotheses from interviews 13.3These hypotheses are discussed in 4 (of 7) or more interviews [102] and are therefore an elaboration of a selection
from Appendix 13.3. Interviewees could agree, disagree or have no opinion / not discussed.
Statement Agree Disagree
1) The stresstest should be evaluated in an integrated context, but the specific theme's should individually be analyzed 6 0
“I see the stresstest as a means for climate adaptation which maps how urban- and rural areas adapt to climate change. Secondly it displays the locations at risk.” This is achieved by “… producing hazard maps specifically for each theme. With the overlay method we try to create an integrated view to identify risks”, “… focused on spatial planning.”
2) The stresstest goal is:
producing data for the stakeholder discussion 5 0
activating the risk dialogue 7 0
quantifying/identifying risks 5 0
identifying cause-effect relationships 4 0 Creating “awareness of impact on the environment is very important.” Therefore data and risk identification is needed as a basis for “defining the ambitions and standards of stakeholders.”
3) Guiding principles are a combination of stakeholder and expert/scientific judgment 7 0 "The contrast between risks and hotspots can be identified by principles, partly dependent on stakeholders and partly on scientific- and expert judgment. Stakeholders define by ambition the level of acceptance and thereby the thresholds levels".
4) Standardization is preferred on principles of indicators in the process steps 4 0
5) Standardization can be done with legalized norms 0 7 "No, definitely not!" “Knowledge input is needed, but stakeholders have to decide on how they address it and what role they have” and “legalizing has a negative influence on the flexibility of advancing knowledge and –insights.” “Threshold values for heat-health effects are usable, but there may be more principles or benchmarks available. I would certainly not standardize this legally, but in general principles.” Legalized norms “… shift the focus to achieving the minimum requirement norm or adjusting the norm to a lower achievable objective. Soft guiding principles for the themes serve the goal better.”
6) Three risk types can be distinguished; damage, health and livability 6 0 "I think it is a good analogy to the national water safety standardization method to distinct the resulting risks.” However some people use different terminology like “…the distinction between health (including health & emergency services), street (public space) and building, because that already includes action perspective from our stakeholder perspectives” and remarks are made concerning that “damage should include damage to nature, agriculture, buildings, etc.” and that sometimes “individual risk is not included in the stresstest (only societal) …" Almost all (6 out of 7) conclude that it can “… be preferable that all hazard themes are assessed for the three risk types with their specific impact chains (cause-effect).”
7) A priority in risk types can be made 6 0 “It is good to have … the separation between health and damage” because "certain exposures, like humans, sometime have more priority, then objects." “That has to do with 2 things; 1) the cause-effect relationship (causality) is highest for certain risk types … and 2) the stakeholder responsibilities differ.”
8) Prefer quantitative maps above qualitative maps 4 1 The interviewee opinions differed, but all agreed that the stakeholder opinions were leading. “We prefer quantitative maps which can be monetized” and “quantitative maps help enormously …”, but "the absolute values are a lot less important when you define good indicators" and “… it is very much to the stakeholders.” Administrators prefer monetized maps I think.”
9) For heat a knowledge gap exists 4 0

137
10) Heat cause-effect relationships are difficult to define 4 0 11) Defining essential cause-effect relationships (impact chains) are key to
standardization 5 0 CAS, as one of the leading national data and scientific source collection for climate adaptation agrees, because they already “weigh and include the newest scientific continuously in the climate effect atlas and story maps. In these story maps the most interesting cause-effect relationships and guidelines are summarized. … With more money for research I would prefer more insight in the correct cause-effect relationships.” The other parties which specifically mention cause-effect agree that "firstly it is important to know which determining (primary) indicators are affected. If you have clarified that, I think you can standardize.”
12) Action perspective is crucial when defining impact chains 6 0 As a stakeholder “I need a specific problem on which I can act, have an action perspective" [102], because for example "in urban areas you can do little with fluvial flooding, as the measures are mainly mitigative and thereby have no action perspective in the adaptive theme.” “It is never solely the analysis of risk, but always partly about the action perspective. Our flood output, flow paths, is an example based on action perspective. Our heat map is also created based on indicators with action perspective. Places where you can add greenery or shadow.”
13) An assessment of “essential” and “additional” indicators can prove useful 4 0
14) Are there signal indicators which are non-essential? 3 1 The disagreement is best described as; “… you have to identify and observe these less obvious cause-effect relationships, which work more like a signaling function”, but “I would not use a ranking.”
15) Evaluation of measure implementation should be done 4 0 Evaluation of measure effect and execution can be done. “Firstly … you can evaluate if the projects/measures are executed. Secondly, you can evaluate the effect of the measures by re-executing the stresstest.” “On a national level you would to like to know in a binary way if the stresstest is performed and resulting measures are implemented.”
16) Measures should have feedback on your input indicators 5 0 It is common in current stresstest that “… all indicators are spatially defined while some results of measures are not by definition spatially defined.” To measure effectiveness through stresstests it’s “… a target, but for some measures and indicators this connection is difficult to quantify.”
17) Advancing knowledge should be able to be implemented in any form of standardization 6 0
New knowledge and data will become available and thereby, “for a future stresstest, incorporating advancing knowledge is desirable.”

138
Appendix D: Extensive consequence indicator table with references 13.4The table displays consequence indicators found in literature, categorized by exposure category, sensitivity type
and hazard type. Literature references onwards from [58] are from Dutch practice reports, which are not classified
as scientific articles. Table 9 is the compact summary of this appendix.
Category Indicators Hazard type References Infrastructure General Infrastructure density FLF, FLP, DR [22], [23], [118] Damage Infrastructure type FLF, FLP, DR [9], [15], [16], [22],
[23] Public / private
Communication (internet / media / etc.)
Utility (energy / water / gas / etc.)
Transport (road / railroad / shipping / etc.)
Civil structures (bridges / pumps / etc.)
Failure & danger to life Infrastructure capacity / accessibility FLF, FLP, DR [15], [16], [23], [111] Communication availability HW, FLF, FLP [16], [61], [64], [76],
[111] Internet / media / telephone
Public address / warning systems
Building characteristics
General
Building age HW, FLF, FLP, DR [56], [69], [106] Building density HW [55], [69] Damage Replacement value FLF, FLP [9], [103], [118], Insurance value FLF, FLP [103], [118] Building market value FLF, FLP, DR [56], [118], [40] Building type FLF, FLP, DR [9], [16], [55], [103],
[104], [111], [118] Size FLF, FLP [103] Depth basement FLF, FLP [103], [118] Depth ground floor level FLF, FLP [9], [103] Foundation type DR [104], [40] Danger to life Performance indicator (nr. of overheating hours a
year) HW [39], [58]
Thermal capacity / resistance
Albedo
Shading
Ventilation
Air conditioning
Vulnerable housing (elderly / care homes) HW, FLF, FLP [15], [58], [115] Human behavior Danger to life / reduced livability Risk perception / awareness / aversion HW, FLF [16], [103], [115],
[117] Communication use (Internet / media / telephone) HW, FLF [61], [64], [115] Travel patterns FLF [16] Distance to event FLF [16], [111], [106]

139
Water use HW, DR [23], [115], Socio-economic conditions
Danger to life / reduced livability
Occupation / unemployment rate HW, FLF [16], [23], [103], [56], [45], [64], [79], [69], [111]
Education type HW, FLF, FLP [28], [45], [61], [103], [56], [64]
Income (GDP / equality classes) HW, FLF [28], [45], [56], [64], [69], [103], [111], [115], [117]
Health services (no. services / physicians) HW, FLF, FLP, DR [15], [23], [61], [64] Sanitation HW, FLF, FLP [28], [64] Recreation FLF, FLP, DR [40], [133] Food security HW, FLF, FLP, DR [28], [64] Land ownership HW, FLF, FLP [28] Livelihood ownership HW, FLF, FLP [28] Resource accessibility HW, FLF [56], [64] Political power FLF [56] Community development FLF [56], [64] Strength social network
Seasonal house percentage
1-person households HW, FLF [16], [45], [56], [61], [69], [111]
R&D HW, FLF [61] Environmental status
General
Combustibility by vegetation DR [61], [40] Water dependent objects DR [23], [133] Water sources type (Groundwater, surface water,
reservoirs, point source, etc.) DR [68]
Damage Crop yield FLF, FLP, DR [33] Vegetation type HW, FLF, FLP, DR [11], [90], [66],
[109], [6], [133], [106]
Mortality or growth-reduction
Cold- or warmth-loving types
Rooting depth
Land cover type HW, FLF, FLP, DR [22], [61], [23], [55], [69], [106], [111]
Commercial / housing / industrial / agriculture / nature (green) / water (blue)
Surface roughness coefficient
Subsidence (oxidation and compression) DR [104], [106], [6] Low (wet) areas
Soil type
Saline water intrusion DR [109] Water supply DR [23] Danger to life Animal diversity HW, FLF, FLP, DR [90] Sealed surface / imperviousness / floor area ratio HW, FLF, FLP, DR [45], [22], [61], [55],

140
(FAR) / City surface fraction [69], [133] Distance to city center HW [22] Water quality HW, FLF, FLP, DR [68], [118], [104],
[40], [62] Algae
Dissolved oxygen (DO)
Faecal contamination
Sewer overflow
Demographics & Health
Danger to life
Population density HW, FLF [4], [56], [61] Age HW, FLF, FLP, DR [56], [45], [22],
[117], [61], [28], [115], [23], [59], [79], [69], [16], [111], [115], [58]
Gender HW [56], [22], [59] Health Short term (illness) HW, FLF, FLP, DR [64], [59], [16],
[104], Long term (Physical- & mental disabilities) HW, FLF, FLP [56], [59], [79], [69],
[16], [111] Birth rate FLF [56] Population growth HW, FLF [45] Nationality / minorities HW [22], [23], [69], [111] Governance & Institutions
General
Policing / regulatory functions HW [64] Emergency response time FLF, FLP [16], [15], [111]

141
Appendix E: Value of Human Life functions and values 13.5The value of human life can be calculated through several methods which will be explained here. They
are all based on economic valuation and can be used as input for cost-benefit analysis and economic optimization
[47], [7], [73]. The first is Cost of Saving an extra life (CSX) where “the value of loss of life is added to other damage
types such as direct economic damage. Neglecting the economic value of loss of human life in the economic
optimization will lead to lower expected damages and thus to a lower optimal safety level” [47]. Equation 11
results in economic valuation of life.
Equation 11: A value of human life function [47].
( )
Where I = investments in measures, P0 = initial hazard probability, Popt = optimal economic hazard probability, N =
number of deaths and PV = present value factor.
The second method is the Value of a Statistical Life is (VoSL or VSL) acquired by surveys in a specific region
and time [9], which compares willingness to pay (WTP in €/yr) of survey respondents (R) and the reduction of
number of fatalities ∆E(N) in Equation 12.
Equation 12: Value of a statistical life [47].
∑
( )
Next to willingness to pay (WTP) is willingness to accept (WTA). It depends on the risk conditions which one is the
most appropriate. “VoSL is one of the essential components entering cost-benefit analyses as a (best available)
approximation of value of benefit of an avoided fatality in a particular risk context. It is essentially a trade-off
between the welfare and the mortality risk. In fact, VoSL is not a monetary value of a human live; it is a
representation of aggregate WTP of a group of people for a reduction in average mortality risk *…+ Thus, VoSL can
be expressed as an amount of money per avoided ‘statistical’ death” [7]. VSL can be adjusted by age, resulting
from the assumption that valuation of life depends on age [48].
Besides total value of life, Value of Life Years (VSLY or CSXY), Value of Injury (VOI) and Value of
Evacuation (VOE) can be valued. For example, the costs of extra life years (CXSY) can be determined by integrating
the VSL equation [47]. The Disability Adjusted Life Years (DALY) method, developed by Harvard University [73], as a
form of VOI, accounts for loss of income, compensation for suffering and costs of injury can be used.
A survey study [7] on VSL, VOE and VOI in the Netherlands was done concerning floodings, including
model calculation similar to Equation 12. The VSL results of € 6.8 mln - € 11.7 mln are in line (within normal
deviation ranges) with other researches on VSL in the UK [48]. A Dutch estimation of VSLY, from Metronomica,
2006b paraphrased by [40] and in line with UK guidance values resulted in € 18,000, but other European studies
resulted in € 40,000 – 52,000 [40]. The latter values by other European studies are more in line with the € 6.8 mln -
€ 11.7 mln from the Dutch survey study [7].
Environmental loss is less researched and more subjective. However, recent projects for freshwater
supply risks by major Dutch knowledge parties [104], [40] were performed where results were expressed as a
summation of the expected values of yearly wealth effect of the different indicators (including environment). This
is a quantifiable method of non-quantitative parameters where monetized value is calculated.

142
Appendix F: WGBT, DI, UHI, SPI, SPEI and SDDI elaboration 13.6
“The wet-bulb globe temperature (WBGT) is the most widely used heat stress index throughout the
world” [26]. The Discomfort Index (DI) is also a widely used direct index, and easier than WGBT, that correlates
highly with WGBT.
Equation 13: Wet-bulb globe temperature function [26].
Equation 14: Discomfort index function [26].
It is generally known that the % of green and % of building density has an effect on the UHI effect [58]. The
demographic indicators, population density and degree of soil sealing, are highly correlated and implicitly account
for the UHI effect as UHI differentiates between urban and rural temperatures based on soil sealing [61]. When
population density and soil sealing are used as consequence indicators with temperature as the hazard indicator,
the UHI index is created with a quantitative method.
The World Meteorological Organization (WMO) uses the Standardized Precipitation Index (SPI) as main
index [85] as it only used precipitation values, but thereby only accounts for supply and does not account for
depletion and the effect of increased temperatures (associated with climate change). Assessment of 4 drought
indices (SPI, SRI, SPEI, SDDI) [97] concluded that they all show the same direction of change. The Standardized
precipitation Evaporation Index (SPEI) and SDDI however show stronger changes, as they are greater influenced by
temperature.

143
Appendix G: Pluvial flood modeling of precipitation events 13.7
A precipitation event is often expressed as the return period, which is the inverse the probability. Much
research has been done into the duration, intensity and return period of extreme precipitation events. In the
Netherlands several extreme events are generally acknowledged as example events for precipitation modeling;
Copenhagen (150 mm/2 hour), Munster (220 mm/90 min.), Herwijnen 2011 (90 mm/80 min.), Achterhoek 2010
(130 mm/24 hour) and future projections of the last two, Herwijnen 2080 (117 mm/80 min) and Achterhoek 2080
(180 mm/24 hour) [135]. In the UK a probable high intensity rainfall event leading to pluvial flooding is defined as >
30 mm/hour, “during which urban storm sewer drainage systems and surface watercourses may be overwhelmed,
preventing drainage through artificial (e.g. pumping) or natural means (e.g. gravity)” [114]. This indicates that an
extreme flooding event is not only defined by precipitation, but also drainage capacity and run-off processes. That
is the reason why some hydro-inundation models take run-off processes into account as it becomes advantageous
to know surface flow routing on floodplains [114], [118]. Integration of surface runoff and surface water
inundation interaction and improvement of drainage and storage capacities is by these studies recommended. To
correctly model surface runoff processes, surface roughness was found to be a key parameter [63], [114]. The
pluvial runoff volume can be described by three indicators, namely initial volume loss through storage, size of the
contributing area and a surface run-off coefficient. Another research [16] also concluded that controlling flood
pathways can greatly reduce damage and loss of life in case of flooding Hereby, having information on the flooding
paths of the flood hazard is important.

144
Appendix H: statistical percentile distribution function 13.8
A statistical percentile distribution function is often used in the literature, in absence of absolute thermal
thresholds, to create relative thresholds. This method calculates thresholds relative to an available dataset and is
always applicable when a series of parameter measurements is available. For example, temperatures exceeding
the 90th
, 95th
or 99th
percentile of a temperature dataset can be considered (by a substantiated estimate) heat
stress thresholds for an environment with the same characteristics. This method can be used for all indicators
where no specific thresholds exist, creating statistical based thresholds. A case study example of these relative
thresholds are given by table 3 in [22].

145
Appendix I: Applicability of risk assessment tools [122] 13.9

146
Appendix J: Literature Research Method, Concept Groups/Terms 13.10
Concept Risk
Terms
Method
Theory Model
Measure
Concepts Societal Economic Individual
Synonyms Social Monetary Prioritarianism
Concept Indicator
Synonyms Driver
Concepts Heat Flood Drought
Concepts Hazard Consequence
Synonyms
Event Exposure
Vulnerable
Effect
Impact
Terms
Stress Wave Water Deficit
Objects Infrastructure
Systems Environments
Population
Concept Norm
Synonyms
Threshold Boundary Standard
Indices / Index
Concepts Heat stress (wave) Flooding Drought
Terms Temperature / Thermal Inundation Subsidence
Cold Pluvial / Fluvial / Coastal Shortage
Concepts Exposure Vulnerability Sensitivity Consequence
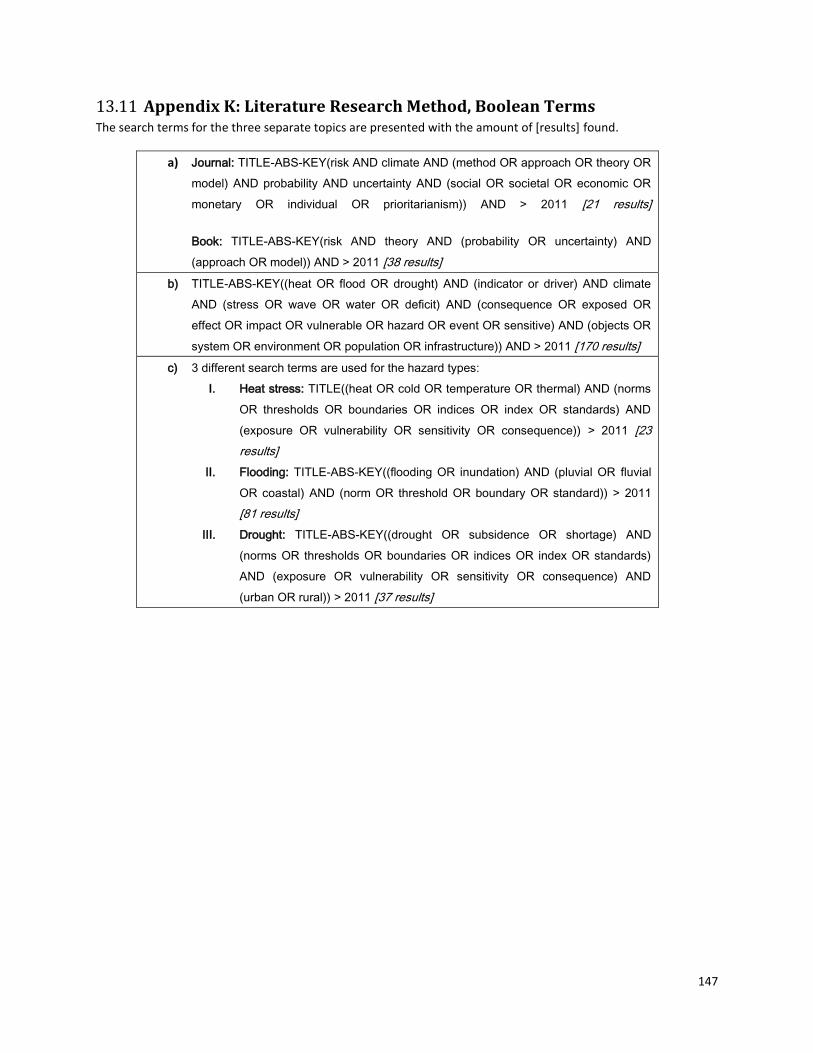
147
Appendix K: Literature Research Method, Boolean Terms 13.11The search terms for the three separate topics are presented with the amount of [results] found.
a) Journal: TITLE-ABS-KEY(risk AND climate AND (method OR approach OR theory OR
model) AND probability AND uncertainty AND (social OR societal OR economic OR
monetary OR individual OR prioritarianism)) AND > 2011 [21 results]
Book: TITLE-ABS-KEY(risk AND theory AND (probability OR uncertainty) AND
(approach OR model)) AND > 2011 [38 results]
b) TITLE-ABS-KEY((heat OR flood OR drought) AND (indicator or driver) AND climate
AND (stress OR wave OR water OR deficit) AND (consequence OR exposed OR
effect OR impact OR vulnerable OR hazard OR event OR sensitive) AND (objects OR
system OR environment OR population OR infrastructure)) AND > 2011 [170 results]
c) 3 different search terms are used for the hazard types:
I. Heat stress: TITLE((heat OR cold OR temperature OR thermal) AND (norms
OR thresholds OR boundaries OR indices OR index OR standards) AND
(exposure OR vulnerability OR sensitivity OR consequence)) > 2011 [23
results]
II. Flooding: TITLE-ABS-KEY((flooding OR inundation) AND (pluvial OR fluvial
OR coastal) AND (norm OR threshold OR boundary OR standard)) > 2011
[81 results]
III. Drought: TITLE-ABS-KEY((drought OR subsidence OR shortage) AND
(norms OR thresholds OR boundaries OR indices OR index OR standards)
AND (exposure OR vulnerability OR sensitivity OR consequence) AND
(urban OR rural)) > 2011 [37 results]

148
Appendix L: Interview Codes Atlas TI 8 13.12Codes applied for coding in Atlas TI 8.
Key terms Components & synonyms
Norm(s) Assumptions (Guiding) principles
Criteria Boundary Thresholds Values Standard
Indicator(s) Parameter Input Output
Method(s) Model(ling) Cost-benefit Function
Hotspot Bottleneck
Vulnerability Consequence Sensitivity Adaptive capacity
Exposure
Hazard System Climate Impact Stimuli
Priority Mainly Primary Secondary (Secondly)
Tertiary Essential
Risk Cause-effect Impact chain Effect Action perspective
Process Evaluation (Evaluate)
Analysis (Analyze)
Dialogue Monetize Prioritize (Prioritizing)
Normaliz(s)e (Normalizing)
Cost-Benefit
Data type Relative Absolute Qualitative Quantitative (Quantify)
Objective Subjective

149
Appendix M: Interview question list 13.13This Interview question list is translated into Dutch, such that a proper conversation with the Dutch interviewees
could be done.
Introductie [max 20 min.]
Taak: Geef een uitleg over de onderzoeksomvang en –focus.
Zijn er vragen over het introductiedocument of het onderzoek? Stresstest (Hazard identification & risk analysis) [max 40 min.]
Wat is het doel van de stresstest? (Enkel de fysieke impact identificeren of ook het risico?)87
Wat is de kern van uw stresstestmethoden? (Alternatieven overwogen?)
Worden de 4 thema’s apart of integraal onderzocht?
Welke klimaatindicatoren worden er voor de stresstest gebruikt? (Alternatieven overwogen?)
Wat zijn de outputindicatoren van uw modellen? (Alternatieven overwogen?)
Welke gevolg-/kwetsbaarheidsindicatoren worden er gebruikt? (Alternatieven overwogen?, Welke objecten/mensen worden blootgesteld? Kwantitatief of kwalitatief?)
Welke output indicatoren, effecten of risico’s, zijn het resultaat van de stresstest? (Wordt er onderscheid gemaakt in sociaal, individueel en economisch risico?, Wordt er onderscheid gemaakt tussen schade, overlijden, leefbaarheid?, Absolute of relatieve waarden? Kwantitatief of kwalitatief?)
Welke normen (randvoorwaarden, grenswaarden en aannames) worden er door u geimplementeerd? (Alternatieven overwogen?)
Welke methode, norm of indicator van de stresstest zou standaard moeten zijn om de stresstest resultaten te produceren, vergelijken, monitoren, evalueren, extrapoleren?
Adaptatieplan (Risk evaluation) [max 40 min.]
Welke methodes worden er gebruikt bij het evalueren van risicokaarten? (Kwantitatief of kwalitatief?, Bv. Kosten-batenanalyse in geld of een kwalitatieve multi-criteria analayse?, Wordt er gezocht naar een optimum of voornamelijk overeenstemming? Bv. Score prioriteren of stakeholder groepen?)
Worden de risico’s van de 4 thema’s apart geevalueerd of integraal? (Het alternatief overwogen?)
Welke output indicatoren van de stresstest worden gebruikt als input van de risicoevaluatie? (Welke alternatieven overwogen?, Kunnen samengestelde kwetsbaarheidsindicatoren, zoals een socio-economische-, demographische-, gezondsheids-indicator, hierbij helpen?)
Welke normen (randvoorwaarden, grenswaarden en aannames) worden er door u geimplementeerd? (Alternatieven overwogen?)
Welke methode, norm of indicator in de evaluatie zou standaard moeten zijn om de resultaten van de risicoevaluatie te s produceren, vergelijken, monitoren, evalueren, extrapoleren?
Concluderen [max 20 min.]
Taak: Overzicht geven van het bediscussieerde. (Belangrijkste methoden, indicatoren en normen? Welke moet wel/niet gestandaardiseerd worden?)
87 Questions between () brackets are possible follow-up questions.

150