quantitative 4d transcatheter intraarterial perfusion mri for standardizing angiographic...
TRANSCRIPT
Quantitative 4D Transcatheter Intraarterial Perfusion MR Imagingas a Method to Standardize Angiographic ChemoembolizationEndpoints
Brian Jin, B.A.1, Dingxin Wang, Ph.D.1, Robert J. Lewandowski, M.D.2, Robert K. Ryu, M.D.2, Kent T. Sato, M.D.2, Andrew C. Larson, Ph.D.1, Riad Salem, M.D., M.B.A.2, and Reed A.Omary, M.D., M.S.11 Department of Radiology, at 737 N Michigan Ave, Suite 1600, Chicago, Illinois, 606112 676 N St. Clair St, Suite 800, Chicago, Illinois, 60611
AbstractPURPOSE—We aimed to test the hypothesis that subjective angiographic endpoints duringtransarterial chemoembolization (TACE) of hepatocellular carcinoma (HCC) exhibit consistencyand correlate with objective intraprocedural reductions in tumor perfusion as determined byquantitative four dimensional (4D) transcatheter intraarterial perfusion (TRIP) magnetic resonance(MR) imaging.
MATERIALS AND METHODS—This prospective study was approved by the institutionalreview board. Eighteen consecutive patients underwent TACE in a combined MR/interventionalradiology (MR-IR) suite. Three board-certified interventional radiologists independently gradedthe angiographic endpoint of each procedure based on a previously described subjectiveangiographic chemoembolization endpoint (SACE) scale. A consensus SACE rating wasestablished for each patient. Patients underwent quantitative 4D TRIP-MR imaging immediatelybefore and after TACE, from which mean whole tumor perfusion (Fρ) was calculated. Consistencyof SACE ratings between observers was evaluated using the intraclass correlation coefficient(ICC). The relationship between SACE ratings and intraprocedural TRIP-MR imaging perfusionchanges was evaluated using Spearman’s rank correlation coefficient.
RESULTS—The SACE rating scale demonstrated very good consistency among all observers(ICC = 0.80). The consensus SACE rating was significantly correlated with both absolute (r =0.54, P = 0.022) and percent (r = 0.85, P < 0.001) intraprocedural perfusion reduction.
CONCLUSION—The SACE rating scale demonstrates very good consistency between raters,and significantly correlates with objectively measured intraprocedural perfusion reductions duringTACE. These results support the use of the SACE scale as a standardized alternative method toquantitative 4D TRIP-MR imaging to classify patients based on embolic endpoints of TACE.
INTRODUCTIONHepatocellular carcinoma (HCC) is the 3rd leading cause of cancer death in the world, andits incidence in the United States continues to increase [1]. Although surgical resection andliver transplantation represent potentially curative treatments, only 10–15% of patients arecandidates [2]. Transarterial chemoembolization (TACE) is the most common locoregionalintervention for patients with unresectable HCC, and produces survival benefits [3, 4]. There
CORRESPONDING AUTHOR: Reed A. Omary, M.D., M.S., Department of Radiology, Northwestern University, 737 N MichiganAve, Suite 1600, Chicago, IL, 60611, Tel: (312) 926-5113, Fax: (312) 926-5991, [email protected].
NIH Public AccessAuthor ManuscriptAJR Am J Roentgenol. Author manuscript; available in PMC 2012 November 1.
Published in final edited form as:AJR Am J Roentgenol. 2011 November ; 197(5): 1237–1243. doi:10.2214/AJR.10.5821.
NIH
-PA Author Manuscript
NIH
-PA Author Manuscript
NIH
-PA Author Manuscript

is no consensus, however, regarding the optimal procedural endpoint [5]. Under-embolization may lead to inadequate treatment [6], while over-embolization may induceliver failure or potentially tumor angiogenesis [7–10].
A similar dilemma, determining the optimal level of coronary artery reperfusion followingan acute myocardial infarction, was addressed with the Thrombolysis In MyocardialInfarction (TIMI) flow grading scale [11]. Modeled after TIMI, a subjective angiographicchemoembolization endpoint (SACE) scale has been established to describe angiographicendpoints of TACE [12]. Although the SACE scale has demonstrated clinical utility bypredicting survival following TACE [13], the lack of validation by an objective perfusionmethod remains a limitation and requires further investigation.
The availability of an integrated magnetic resonance/interventional radiology (MR-IR) suiteaffords a unique opportunity to conduct this by evaluating the SACE scale’s relationshipwith simultaneously measured objective MR perfusion changes. Intraproceduraltranscatheter intraarterial perfusion (TRIP) MR imaging collects continuous dynamiccontrast enhanced (DCE) MR images immediately following arterial injection of contrastagent [14, 15]. Because TRIP-MR imaging uses small amounts of gadolinium injecteddirectly into a branch of the hepatic artery, serial injections can be performed duringchemoembolization, allowing for quantitative calculation of intraprocedural changes inphysiologic tumor perfusion (Fρ) [16]. However, the relationship between SACE-monitoredTACE endpoints and fully quantitative TRIP-MR imaging measurements remain untestedand was the motivation behind the present study. We hypothesize that this angiographicrating scale correlates with quantitative intraprocedural reductions in tumor perfusion duringTACE. If so, then angiographic SACE ratings could potentially offer a simplified approachto assess physiologic embolic endpoints, and be used as a standardized intraproceduralendpoint to guide TACE.
SUBJECTS AND METHODSClinical Setting and Patients
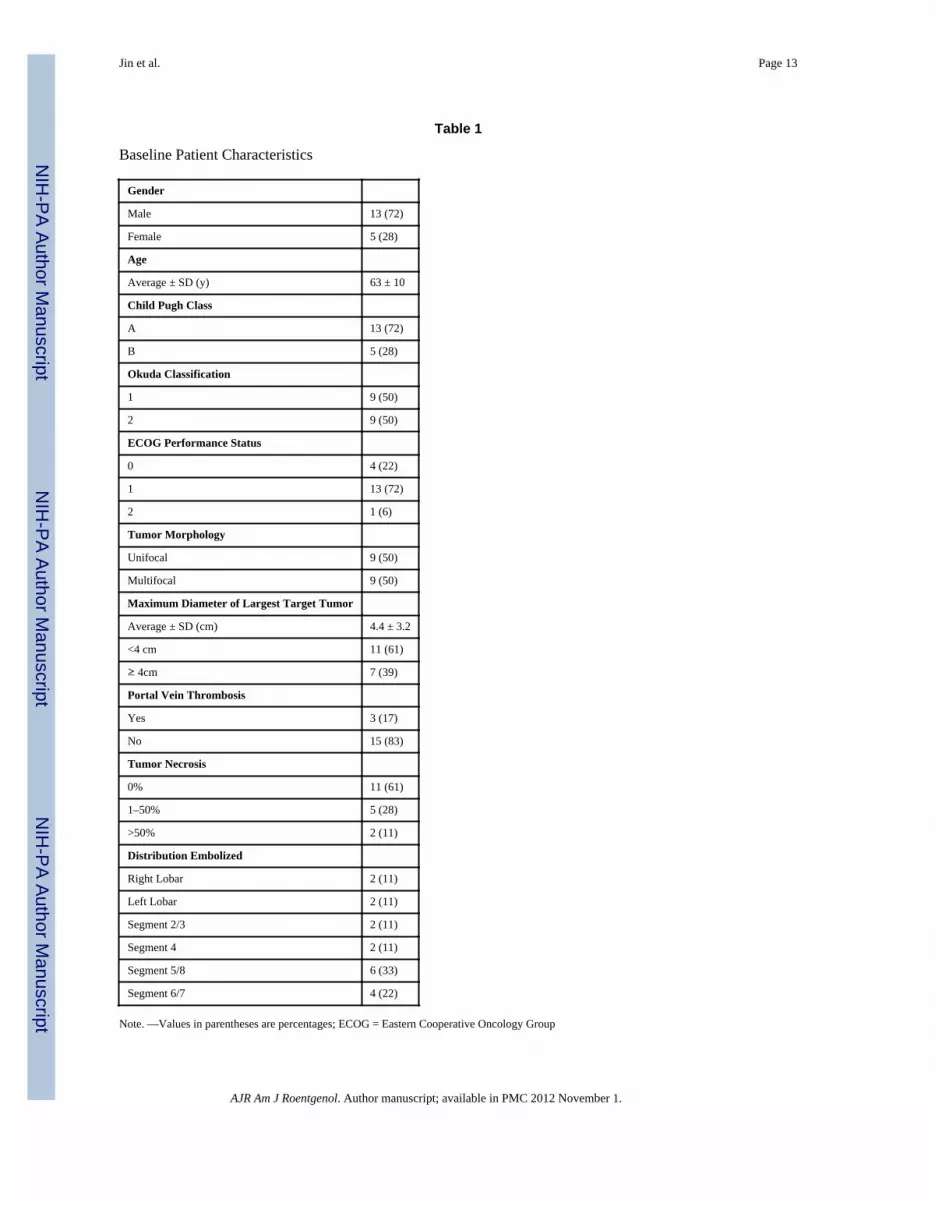
This study was approved by the institutional review board and complied with the HealthInsurance Portability and Accountability Act. Between September 2008 to December 2009,19 consecutive patients with surgically unresectable HCC who underwent TACE in anintegrated MR-IR suite were enrolled. During this time, approximately 80 total patientsunderwent TACE at our institution. Of these, approximately 25% were excluded from thestudy because the target tumor was not well-defined by cross-sectional imaging. Theremaining patients were ultimately excluded because of logistical limitations associated withscheduling the integrated MR-IR suite, which is used to accommodate multiple researchstudies at our institution. Of the 19 patients ultimately enrolled in our study, one patient wasexcluded from analysis because catheter position was altered following pre-TACE TRIP-MR imaging but before injection of chemoembolic material. Characteristics of theremaining 18 patients are presented in Table 1. Of the 18 patients included in the study,three had received prior locoregional treatment. Two patients each received one round oftreatment with radiofrequency ablation (RFA). A third patient had previously received twotreatments with TACE. Patients were non-invasively diagnosed with HCC based oncharacteristic imaging findings in the setting of cirrhosis [17]. Treatment was chosen at aweekly institutional multi-disciplinary tumor conference. All patients met a modified set ofinclusion and exclusion criteria established by Brown et al [18], including age > 18 years,Eastern Cooperative Oncology Group (ECOG) performance status ≤ 2, Child-Pugh class Aor B disease, focal or multifocal HCC with measurable disease, no contraindications to MRimaging, and informed consent. Exclusion criterion were life expectancy < 6 months, ECOGperformance status > 2, Child-Pugh class C, uncorrectable coagulopathy with International
Jin et al. Page 2
AJR Am J Roentgenol. Author manuscript; available in PMC 2012 November 1.
NIH
-PA Author Manuscript
NIH
-PA Author Manuscript
NIH
-PA Author Manuscript

Normalized Ratio > 1.5, total bilirubin level > 4.0 mg/dL, serum creatinine > 2.0 mg/dL,uncorrectable platelet count < 50,000/μL, or contraindications to MR imaging. Patients withportal vein thrombosis were enrolled if superselective segmental chemoembolization wastechnically feasible [19].
MR-IR UnitA dedicated MR-IR suite (Miyabi; Siemens, Erlangen, Germany) containing an Artis-dTAflat-panel digital subtraction angiography (DSA) system integrated with a 1.5-T Espree MRscanner via a moving table was used for all chemoembolization procedures.
TACEFive board-certified attending interventional radiologists specializing in interventionaloncology (average experience > 10 years) performed TACE using the same technique.Arterial access was gained via the common femoral artery. Selective catheterization of thelobar or segmental hepatic artery supplying the targeted tumor was performed with a 2.8-Fmicrocatheter (Renegade Hi-Flo; Boston Scientific, Natick, Massachusetts), which wascoaxially inserted over a 0.016-inch-diameter guide wire (Headliner; Terumo, Tokyo,Japan). DSA was performed with injection of iohexol (Omnipaque 300; Amersham Health,Princeton, New Jersey) using a power injector. Injection rates were typically 1–3 mL/s, witha total amount of 6–10 mL injected. These values were adjusted to best depict blood flow tothe targeted tumor while minimizing reflux into non-target liver segments.
After selective catheter placement, patients were transferred to the MR scanner on thesliding table. With the catheter position unchanged, baseline pre-TACE TRIP-MR imagingwas performed. Patients were then transferred back to the IR angiography table for TACE.A 1:1 mixture of emulsifying contrast agent (Ethiodol; Savage Laboratories, Melville, NewYork) and a three-drug chemotherapy regimen consisting of cisplatin 100 mg, doxorubicin30 mg, and mitomycin-C 30 mg was injected in 1–3 mL aliquots under direct fluoroscopicobservation. Chemotherapy infusion was continued until antegrade blood flow slowed. Inother words, when the TACE operator subjectively observed that either the intensity orvelocity of the radio-opaque chemotherapy-Ethiodol emulsion decreased relative to thebeginning baseline, he stopped injecting. TACE was then completed by injection of 300 –500-μm or 500 –700-μm-diameter Embospheres (Biosphere Medical, Rockland, Mass)mixed with iohexol until a stasis or sub-stasis endpoint of antegrade blood flow wasachieved per the discretion of the treating physician. Stasis was considered to be achievedwhen no iohexol from the injection could be visualized in the arteriole directly feeding thetumor. Sub-stasis was considered to be achieved when some residual iohexol could still bevisualized in the arteriole directly feeding the tumor. Typically, a sub-stasis endpoint waschosen for lobar treatments or when the patient was likely to undergo a follow-up treatmentsession. After chemoembolization, completion arteriography was conducted via manualinjection, rather than power injection, to minimize reflux of iohexol and injectedchemoembolic material into non-target areas. To accomplish this, the operator injectediohexol by hand until he noted angiographic evidence of retrograde reflux, at which point heceased injection. Aliquots of less than 5 mL were typically used before reflux was noted.Patients were then transferred back to the MR scanner for post-TACE TRIP-MR imaging.After scanning, patients were transferred back to the DSA unit where all vascular accessdevices were removed, and hemostasis was achieved.
MR ImagingFollowing patient transfer to the MR scanner, we performed two dimensional multisliceaxial and coronal T2-weighted turbo spine-echo (TSE) and axial T1-weighted gradient recallecho (GRE) sequence localization studies at expiration position. This protocol was repeated
Jin et al. Page 3
AJR Am J Roentgenol. Author manuscript; available in PMC 2012 November 1.
NIH
-PA Author Manuscript
NIH
-PA Author Manuscript
NIH
-PA Author Manuscript

after each between-unit transfer to ensure consistent selection of optimal slice positions forsubsequent TRIP-MR imaging. Quantitative TRIP-MR imaging was performed including[16]: (a) three dimensional (3D) baseline longitudinal relaxation rate (R1) mapping usingTR/TE = 4.0/1.72 msec, variable flip angle (VFA) GRE = 2°, 9°, 15°, 19°, three averages,192 × 108 × 24 to 192 × 132 × 24 matrix, 400–450 mm field of view, 5 mm interpolatedpartition thickness, and 670 Hz/pixel bandwidth, (b) 3D targeted radiofrequency field (B1)mapping using TSE reduced field of view catalyzed double-angle method using TR/TE =400/12 msec, excitation/compensation FA = 60°/120° and 120°/60°, refocusing FA = 180°,catalyzation chain pulse FA = 90°, 660 Hz/pixel bandwidth, 128 × 28 × 16 matrix, and (c)4D TRIP dynamic R1 mapping using the same parameters as the VFA method, at a singleangle (15°) dynamic GRE method co-registered to the baseline R1 maps with the targeted3D imaging volume consecutively acquired at a 2.1 second sampling rate.
Five seconds after 4D dynamic R1 image acquisition, the interventional radiologist manuallyinjected 5–10 mL of 20% gadopentetate dimeglumine solution (Gd-DTPA) (Magnevist;Berlex, Montvill, NJ) evenly over 5 seconds directly into the catheter placed in the selectedbranch of the hepatic artery. 5 mL of Gd-DTPA was used when catheters were placed in asegmental hepatic artery branch, and 10mL was used when catheters were placed in a lobarhepatic artery branch. These volumes were empirically chosen because they minimized Gd-DTPA reflux during our institution’s previous TRIP-MR imaging experiences. Before andafter TACE, each patient underwent the same TRIP-MR imaging scan and contrast agentinjection protocol.
Data AnalysisSACE—Fluoroscopic angiographic series images before and after TACE were recorded andstored in a picture archiving and communications system (PACS). In batch fashion, theseimages were independently presented to three board certified interventional radiologists withover 20 combined years of experience in interventional oncology. These raters, blinded tothe results of the TRIP-MR imaging measurements, were asked to rate the TACEangiographic endpoint according to the previously established SACE scale (Table 2). Incases of multiple tumors, only the largest targeted tumor was considered when assigning aSACE rating. Additionally, a consensus SACE rating was assigned to each patient based onthat patient’s majority SACE rating (i.e. the rating assigned most frequently to the patient).
TRIP-MR imaging—TRIP-MR imaging series were exported first to a Siemens Arguscomputer workstation, and then to a separate desktop workstation with MatLab imagingprocessing software (Mathworks, Natick, Massachusetts). Using MatLab, a time-contrastagent concentration curve was measured at all voxel positions, from which we calculated Fρat all voxel positions [16] and constructed perfusion maps for each tumor (Figure 1). Thequantitative perfusion analysis was based on first-pass distributed parameter (DP) modeling[16]. With targeted intrahepatic arterial injection of the contrast agent, this first-pass tracerkinetic modeling of TRIP-MR imaging considers only single arterial input rather thancomplex arterial and portal dual-input within the liver. Despite the DP model-basedquantification being more computationally intensive than semi-quantitative model-freemethods, it may give a better reflection of the microcirculation than semi-quantitativemethods and conventional compartment models [20]. Based on localization scans, weselected all slices in which the targeted tumor was well visualized. In patients with multipletumors, only the largest targeted tumor, corresponding to the tumor used for SACE rating,was used for TRIP-MR imaging analysis. An attending interventional radiologist with over15 years of experience in abdominal MR imaging drew a region of interest (ROI)encompassing the entire tumor within each selected slice. For each slice, we calculated themean tumor Fρ. A weighted average of the mean tumor Fρ values over the selected slices
Jin et al. Page 4
AJR Am J Roentgenol. Author manuscript; available in PMC 2012 November 1.
NIH
-PA Author Manuscript
NIH
-PA Author Manuscript
NIH
-PA Author Manuscript

was used to reflect the Fρ for the entire targeted tumor before TACE. After TACE, anidentical method was used to calculate Fρ for the targeted tumor. This allowed calculation ofboth the absolute and percent intraprocedural reduction of Fρ during TACE.
Statistical AnalysisChanges in intraprocedural tumor perfusion during TACE were assessed with a paired t-test.Intraclass correlation coefficient (ICC) was used to evaluate the consistency of SACEratings across the three raters. Spearman’s rank correlation coefficient was used to assess therelationship between SACE ratings and quantitative TRIP-MR imaging perfusionreductions. Finally, analysis of variance (ANOVA) was used to determine whether groupsdefined on the basis of SACE ratings differed in the measured quantitative perfusionreductions. A P-value less than 0.05 was considered to be significant.
RESULTSTRIP- MR Imaging Perfusion Reductions
TACE was technically successful in all 19 patients. However the catheter position wasadjusted between pre-TACE TRIP-MR imaging and injection of chemoembolic material inone patient. This patient was therefore excluded from further analysis. There were nocomplications (such as vasospasm, bleeding, or infection) incurred. Intraproceduralquantitative TRIP-MR imaging was successfully completed in all patients and demonstratedintraprocedural tumor perfusion reductions during TACE. Perfusion maps indicated clearreduction in blood flow to the tumor within the targeted vascular territory: mean absoluteintraprocedural perfusion reduction (± SD) of 10.62 mL/min/100mL ± 7.71 (P < 0.001) anda mean percent intraprocedural perfusion reduction (± SD) of 66.5% ± 25.4 (P < 0.001).
SACE RatingsICC values indicated good to very good consistency between each pair of raters (0.73, 0.81,0.84), as well as very good consistency over all three raters (0.80). Overall, 11 of the 18patients received unanimous SACE ratings. None of the patients received completelydisparate SACE ratings.
CorrelationTable 3 presents the Spearmen correlation coefficients between individual reader andconsensus SACE ratings and both the absolute and percentage perfusion reduction.Consensus SACE ratings produced a Spearman correlation coefficient of 0.54 (P = 0.022)for absolute perfusion reduction, and 0.85 (P < 0.001) for percent perfusion reduction. Asimilar pattern was seen for individual raters, as each rater exhibited a higher correlationcoefficient with percent intraprocedural perfusion reduction (Rater 1: 0.69, P = 0.001; Rater2: 0.83, P < 0.001; Rater 3: 0.81, P < 0.001) than absolute intraprocedural perfusionreduction (Rater 1: 0.43, P = 0.076; Rater 2: 0.62, P = 0.006; Rater 3: 0.41, P = 0.095). Theconsensus SACE ratings are displayed with both absolute perfusion reduction and percentperfusion reduction (Figure 2). SACE level 4 associated with the highest meanintraprocedural perfusion reduction, while SACE levels 1 and 2 were associated with thelowest mean intraprocedural perfusion reduction. SACE level 3 had the largest range ofquantitative intraprocedural perfusion reductions, and exhibited some overlap with SACElevel 4 with regard to absolute intraprocedural perfusion reduction. When consideringpercent intraprocedural perfusion reduction, however, only one SACE level 3 patientoverlapped with the range of SACE level 4 patients (Figure 3). Due to the small number ofpatients with SACE 1 or 2 ratings, these patients were grouped together for ANOVAanalysis. When patients were classified by SACE ratings and compared for intraprocedural
Jin et al. Page 5
AJR Am J Roentgenol. Author manuscript; available in PMC 2012 November 1.
NIH
-PA Author Manuscript
NIH
-PA Author Manuscript
NIH
-PA Author Manuscript

perfusion reductions, significant or nearly significant group differences were identified(percent reduction: P < 0.001; absolute reduction: P = 0.117) (Table 4).
DISCUSSIONOur results demonstrate a correlation between the angiographic classifications of the SACEscale and quantitative physiologic reductions in intraprocedural tumor perfusion duringTACE as measured by quantitative TRIP-MR imaging. Our study also shows thatinterventional radiologists have very good inter-rater consistency in classifying angiographicendpoints using SACE criteria.
Correlations between SACE ratings and percent intraprocedural perfusion reductions weregenerally higher than those for absolute reduction. This may be due to the wide range ofbaseline tumor vascularity and perfusion [21]. Analyzing percent intraprocedural perfusionreductions, rather than absolute, effectively normalizes for variable baseline tumorvascularity. Another factor to consider is that the SACE scale itself represents a relative,rather than absolute angiographic assessment of perfusion change during TACE.
There remains no consensus regarding the ideal embolization endpoint of TACE. Inadequateembolization may incompletely treat targeted tumors [6]. Alternatively, over-embolizationmay accelerate the onset of liver failure [7] or promote disease progression by increasingexpression of angiogenic proteins [8–10]. A previous study has suggested using the SACEscale in targeting an intermediate level embolic endpoint during TACE [13]. However, theSACE scale is, by definition, completely subjectively based, and therefore lacks anyobjective measurable component. This lack of objective validation of the SACE scaleconstitutes a significant limitation, and represents a barrier to using the SACE scale as aprocedural guide during TACE. Our study aimed to address this limitation by examiningwhether embolic endpoints classified by the SACE scale correlate with objectively measuredperfusion reductions.
TRIP-MR imaging is a clinically applied method of measuring intraprocedural perfusionduring TACE [14, 15, 22, 23], and is able to intraprocedurally quantify the physiologictumor perfusion [16]. Quantitative TRIP-MR imaging, therefore, provides us with a valuablequantitative modality to measure reductions in intraprocedural tumor perfusion. Therelationship between this quantitative technique, and the subjective SACE rating scale,however, remains unknown and was the focus of this study. Our results support thehypothesis that angiographic embolic endpoints and quantitative intraprocedural perfusionchanges are correlated. This result suggests that categorical SACE ratings may serve as areasonable surrogate for objectively measured tumor perfusion reductions.
A previous study attempting to correlate subjective angiographic endpoints with TRIP-MRimaging did not detect a correlation between the SACE scale and perfusion reductionsmeasured by TRIP-MR imaging [12]. However, that study measured perfusion using a semi-quantitative, non physiologic, arbitrary unit [14]. Since then, refinements in TRIP-MRimaging post-processing have allowed the calculation of a fully quantitative and physiologicmeasurement of perfusion [16]. This improvement in the protocol and accuracy of TRIP-MRimaging may explain the improvement in correlation between the SACE scale and objectivemeasurements of the current study.
There are, however, limitations to using the SACE scale which objective methods such asTRIP-MR imaging can overcome. First, although the SACE scale is able to separate lowlevel embolization, from intermediate level embolization, from high level embolizationendpoints, it exhibits poor resolution. For example, SACE 3 embolic endpoints in our studyranged from 35%–81% perfusion reductions. Second, the SACE scale is limited in its
Jin et al. Page 6
AJR Am J Roentgenol. Author manuscript; available in PMC 2012 November 1.
NIH
-PA Author Manuscript
NIH
-PA Author Manuscript
NIH
-PA Author Manuscript
correlation with absolute perfusion reductions for many of the reasons mentioned above.Therefore the SACE scale cannot replace objective measurements when greater precision isrequired to describe embolic endpoints, or when absolute, and not percent, perfusionreductions are required.
There are several limitations to this study. Quantitative TRIP-MR imaging has yet to bevalidated against a reference standard in humans. However, its evaluation in an animal studyand its successful ongoing clinical application support its use to investigate the potentialutility of the SACE rating scale. Nevertheless, correlative studies with pathologic data arenecessary in order to validate TRIP-MR imaging as an accurate tool to measure arterialtumor perfusion. Our analysis required the manual placement of ROIs around each tumor,which was subject to potential operator variability. To minimize this variability, the sameattending radiologist drew the ROIs for all patients in our study. Additionally, in order toprevent this potential bias from affecting the results of our study, this radiologist wascompletely blinded to, and isolated from, the SACE classification process. This type ofoperator variability may be further reduced through the use of automated approaches todetermine lesion edges [24]. Future quantitative studies should look to incorporate thisautomated technique, thereby eliminating the reliance on subjective manual ROI placement.Our study did not stratify patients according to tumor grade. It has been reported that tumorgrade correlates with tumor blood flow [25]. However, tumor grade should likely not affectthe correlative value between angiographic endpoints and quantitative perfusion reductions.Nevertheless, future studies quantifying tumor perfusion should take tumor grade intoaccount. Requiring the patient to hold his/her breath, resulting in motion, during MR dataacquisition could also represent a potential limitation. We tried to minimize this effect byacquiring B1, baseline R1, and dynamic R1 maps for TRIP-MR imaging in multiple, shorterbreath holds. In addition, acquiring images at exhalation position has also minimized motionartifact relative to acquiring images at inhalation position. Future advances in motioncorrection and image co-registration algorithms will be needed to fully alleviate thislimitation. The current study does not incorporate any follow up imaging or histopathologicdata. However, the purpose of the study was to investigate the correlation betweenquantitative perfusion reductions (TRIP-MR imaging) and subjectively observed embolicendpoints (SACE scale). Therefore follow up tumor data (imaging or histopathologic) wasnot recorded. However the progression of this perfusion measurement technology willcertainly require future studies investigating its correlation with tumor response/progressionby utilizing follow up imaging or histopathologic data. Another potential limitation is thatabsolute tumor perfusion as measured by intraarterial TRIP-MR imaging is noticeably lowerthan previously reported tumor perfusion data as measured by CT perfusion studies withintravenous contrast. A number of potential explanations include the positioning of anintraarterial catheter, assessment of only a single blood vessel supply distal to the cathetertip, and averaging perfusion over the whole tumor which may often times contain regions ofnecrosis or relative hypoperfusion [16]. Nevertheless, slight differences in absoluteperfusion measurement as compared to CT perfusion studies would not affect percentperfusion reductions, which the current study finds to be highly correlated with subjectiveembolic endpoints. Finally, it is important to appreciate that quantitative TRIP-MR imagingand the SACE scale can only assess perfusion in the distribution of blood vessels distal tothe position of the catheter. Detection of perfusion to the tumor from collateral supplyrequires repositioning of the catheters within these collateral vessels.
In conclusion, we found that the SACE rating scale exhibited very good consistencybetween raters and highly correlated with quantitative perfusion reductions as measured byusing intraprocedural TRIP-MR imaging. These results support the use of the SACE ratingscale as an angiographic rating scale to classify embolization endpoints during TACE.Future investigations should validate the SACE rating scale against a perfusion reference
Jin et al. Page 7
AJR Am J Roentgenol. Author manuscript; available in PMC 2012 November 1.
NIH
-PA Author Manuscript
NIH
-PA Author Manuscript
NIH
-PA Author Manuscript
standard, as well as continue to investigate its relationship with long term clinical outcomesfollowing TACE.
AcknowledgmentsFUNDING:
-NIH R01 CA 126809
References1. El-Serag HB, Rudolph KL. Hepatocellular carcinoma: epidemiology and molecular carcinogenesis.
Gastroenterology. 2007; 132:2557–2576. [PubMed: 17570226]2. Marcos-Alvarez A, Jenkins RL, Washburn WK, et al. Multimodality treatment of hepatocellular
carcinoma in a hepatobiliary specialty center. Arch Surg. 1996; 131:292–298. [PubMed: 8611095]3. Llovet JM, Real MI, Montana X, et al. Arterial embolisation or chemoembolisation versus
symptomatic treatment in patients with unresectable hepatocellular carcinoma: a randomisedcontrolled trial. Lancet. 2002; 359:1734–1739. [PubMed: 12049862]
4. Lo CM, Ngan H, Tso WK, et al. Randomized controlled trial of transarterial lipiodolchemoembolization for unresectable hepatocellular carcinoma. Hepatology. 2002; 35:1164–1171.[PubMed: 11981766]
5. Brown DB, Geschwind JF, Soulen MC, Millward SF, Sacks D. Society of Interventional Radiologyposition statement on chemoembolization of hepatic malignancies. J Vasc Interv Radiol. 2009;20:S317–323. [PubMed: 19560017]
6. Ikeda M, Maeda S, Shibata J, et al. Transcatheter arterial chemotherapy with and withoutembolization in patients with hepatocellular carcinoma. Oncology. 2004; 66:24–31. [PubMed:15031595]
7. Geschwind JF, Ramsey DE, Cleffken B, et al. Transcatheter arterial chemoembolization of livertumors: effects of embolization protocol on injectable volume of chemotherapy and subsequentarterial patency. Cardiovasc Intervent Radiol. 2003; 26:111–117. [PubMed: 12616414]
8. Kobayashi N, Ishii M, Ueno Y, et al. Co-expression of Bcl-2 protein and vascular endothelialgrowth factor in hepatocellular carcinomas treated by chemoembolization. Liver. 1999; 19:25–31.[PubMed: 9928762]
9. Xiong ZP, Yang SR, Liang ZY, et al. Association between vascular endothelial growth factor andmetastasis after transcatheter arterial chemoembolization in patients with hepatocellular carcinoma.Hepatobiliary Pancreat Dis Int. 2004; 3:386–390. [PubMed: 15313674]
10. Rhee TK, Young JY, Larson AC, et al. Effect of transcatheter arterial embolization on levels ofhypoxia-inducible factor-1alpha in rabbit VX2 liver tumors. J Vasc Interv Radiol. 2007; 18:639–645. [PubMed: 17494846]
11. TIMI Study Group. The Thrombolysis in Myocardial Infarction (TIMI) trial. Phase I findings. NEngl J Med. 1985; 312:932–936. [PubMed: 4038784]
12. Lewandowski RJ, Wang D, Gehl J, et al. A comparison of chemoembolization endpoints usingangiographic versus transcatheter intraarterial perfusion/MR imaging monitoring. J Vasc IntervRadiol. 2007; 18:1249–1257. [PubMed: 17911515]
13. Jin B, Wang D, Lewandowski RJ, et al. The impact of chemoembolization endpoints on survival inhepatocellular carcinoma patients. Am J Roentgenol. 2010 In press.
14. Larson AC, Wang D, Atassi B, et al. Transcatheter intraarterial perfusion: MR monitoring ofchemoembolization for hepatocellular carcinoma--feasibility of initial clinical translation.Radiology. 2008; 246:964–971. [PubMed: 18309018]
15. Gaba RC, Wang D, Lewandowski RJ, et al. Four-dimensional transcatheter intraarterial perfusionMR imaging for monitoring chemoembolizationof hepatocellular carcinoma: preliminary results. JVasc Interv Radiol. 2008; 19:1589–1595. [PubMed: 18818097]
Jin et al. Page 8
AJR Am J Roentgenol. Author manuscript; available in PMC 2012 November 1.
NIH
-PA Author Manuscript
NIH
-PA Author Manuscript
NIH
-PA Author Manuscript

16. Wang D, Jin B, Lewandowski RJ, et al. Quantitative 4D transcatheter intraarterial perfusion MRIfor monitoring chemoembolization of hepatocellular carcinoma. J Magn Reson Imaging. 2010;31:1106–1116. [PubMed: 20432345]
17. Bruix J, Sherman M, Llovet JM, et al. Clinical management of hepatocellular carcinoma.Conclusions of the Barcelona-2000 EASL conference. European Association for the Study of theLiver. J Hepatol. 2001; 35:421–430. [PubMed: 11592607]
18. Brown DB, Cardella JF, Sacks D, et al. Quality improvement guidelines for transhepatic arterialchemoembolization, embolization, and chemotherapeutic infusion for hepatic malignancy. J VascInterv Radiol. 2006; 17:225–232. [PubMed: 16517768]
19. Georgiades CS, Hong K, D’Angelo M, Geschwind JF. Safety and efficacy of transarterialchemoembolization in patients with unresectable hepatocellular carcinoma and portal veinthrombosis. J Vasc Interv Radiol. 2005; 16:1653–1659. [PubMed: 16371532]
20. Thng CH, Koh TS, Collins DJ, Koh DM. Perfusion magnetic resonance imaging of the liver.World J Gastroenterol. 16:1598–1609. [PubMed: 20355238]
21. Yoshimatsu S, Inoue Y, Ibukuro K, Suzuki S. Hypovascular hepatocellular carcinoma undetectedat angiography and CT with iodized oil. Radiology. 1989; 171:343–347. [PubMed: 2539607]
22. Wang D, Bangash AK, Rhee TK, et al. Liver tumors: monitoring embolization in rabbits with VX2tumors--transcatheter intraarterial first-pass perfusion MR imaging. Radiology. 2007; 245:130–139. [PubMed: 17885186]
23. Lewandowski RJ, Tepper J, Wang D, et al. MR imaging perfusion mismatch: a technique to verifysuccessful targeting of liver tumors during transcatheter arterial chemoembolization. J Vasc IntervRadiol. 2008; 19:698–705. [PubMed: 18440458]
24. Monsky WL, Raptopoulos V, Keogan MT, et al. Reproducibility of linear tumor measurementsusing PACS: comparison of caliper method with edge-tracing method. Eur Radiol. 2004; 14:519–525. [PubMed: 14658000]
25. Asayama Y, Yoshimitsu K, Nishihara Y, et al. Arterial blood supply of hepatocellular carcinomaand histologic grading: radiologic-pathologic correlation. AJR Am J Roentgenol. 2008; 190:W28–34. [PubMed: 18094269]
Jin et al. Page 9
AJR Am J Roentgenol. Author manuscript; available in PMC 2012 November 1.
NIH
-PA Author Manuscript
NIH
-PA Author Manuscript
NIH
-PA Author Manuscript

Fig. 1.Representative images of a 75 year old man with hepatitis C virus complicated by right lobe(segment VI) HCC. On the basis of angiographic images before (a) and after (b)chemoembolization, each of the three operators categorized this procedure as SACE 3,indicating reduced antegrade blood flow and eliminated tumor blush (black arrow). Intra-procedural TRIP-MR images from the same patient before (c) and after (d)chemoembolization demonstrate reduced arterial enhancement to the tumor. Dynamicgadolinium enhancement data was used to construct color perfusion maps for each tumorimmediately before and after TACE. These pre-TACE (e) and post-TACE (f) perfusionmaps were then cropped around each tumor, and then superimposed over their respectiveTRIP-MR image. The color bar to the right of each superimposed perfusion map depictsperfusion (Fρ) in units of mL/min/100mL. Weighted average calculations over all slicepositions demonstrate a 6.43 mL/min/100mL perfusion reduction over the whole tumor,which corresponds to 63% perfusion reduction from pre-chemoembolization levels.
Jin et al. Page 10
AJR Am J Roentgenol. Author manuscript; available in PMC 2012 November 1.
NIH
-PA Author Manuscript
NIH
-PA Author Manuscript
NIH
-PA Author Manuscript

Fig. 2.Box and whisker plot displaying the distribution of absolute (a) and percent (b)intraprocedural perfusion reductions grouped according to each patient’s consensus SACErating. Patients with SACE ratings 1 or 2 were merged together and treated as a singlegroup. Groups defined by SACE levels failed to show significant differences in absoluteintraprocedural perfusion reduction (P = 0.117), but differed significantly in percentintraprocedural perfusion reduction (P < 0.001).
Jin et al. Page 11
AJR Am J Roentgenol. Author manuscript; available in PMC 2012 November 1.
NIH
-PA Author Manuscript
NIH
-PA Author Manuscript
NIH
-PA Author Manuscript

Fig. 3.Patients were ranked from least to greatest according to their tumor’s absolute (a) andpercent (b) intraprocedural perfusion reduction. Intraprocedural perfusion reduction valuesfor each individual patient are plotted in the color corresponding to their consensus SACErating. Patients with SACE ratings 1 or 2 were merged together and treated as a singlegroup. Consensus SACE ratings were significantly correlated with both absoluteintraprocedural perfusion reduction (r = 0.54, P = 0.022) and percent intraproceduralperfusion reduction (r = 0.85, P < 0.001).
Jin et al. Page 12
AJR Am J Roentgenol. Author manuscript; available in PMC 2012 November 1.
NIH
-PA Author Manuscript
NIH
-PA Author Manuscript
NIH
-PA Author Manuscript
NIH
-PA Author Manuscript
NIH
-PA Author Manuscript
NIH
-PA Author Manuscript
Jin et al. Page 13
Table 1
Baseline Patient Characteristics
Gender
Male 13 (72)
Female 5 (28)
Age
Average ± SD (y) 63 ± 10
Child Pugh Class
A 13 (72)
B 5 (28)
Okuda Classification
1 9 (50)
2 9 (50)
ECOG Performance Status
0 4 (22)
1 13 (72)
2 1 (6)
Tumor Morphology
Unifocal 9 (50)
Multifocal 9 (50)
Maximum Diameter of Largest Target Tumor
Average ± SD (cm) 4.4 ± 3.2
<4 cm 11 (61)
≥ 4cm 7 (39)
Portal Vein Thrombosis
Yes 3 (17)
No 15 (83)
Tumor Necrosis
0% 11 (61)
1–50% 5 (28)
>50% 2 (11)
Distribution Embolized
Right Lobar 2 (11)
Left Lobar 2 (11)
Segment 2/3 2 (11)
Segment 4 2 (11)
Segment 5/8 6 (33)
Segment 6/7 4 (22)
Note. —Values in parentheses are percentages; ECOG = Eastern Cooperative Oncology Group
AJR Am J Roentgenol. Author manuscript; available in PMC 2012 November 1.

NIH
-PA Author Manuscript
NIH
-PA Author Manuscript
NIH
-PA Author Manuscript
Jin et al. Page 14
Table 2
Subjective Angiographic Chemoembolization Endpoint (SACE) Rating Scale
Level Antegrade Arterial Flow Tumor Blush
I Normal Normal/reduced
II Reduced Reduced
III Reduced Eliminated
IV Eliminated Eliminated
AJR Am J Roentgenol. Author manuscript; available in PMC 2012 November 1.

NIH
-PA Author Manuscript
NIH
-PA Author Manuscript
NIH
-PA Author Manuscript
Jin et al. Page 15
Table 3
Spearman Correlation Coefficients for Each Interventional Radiologist
Rater 1 Rater 2 Rater 3 Consensus SACE Rating
Absolute Perfusion Reduction 0.43 (P = 0.076) 0.62 (P = 0.006) 0.41 (P = 0.095) 0.54 (P = 0.022)
Percent Perfusion Reduction 0.69 (P = 0.001) 0.83 (P < 0.001) 0.81 (P < 0.001) 0.85 (P < 0.001)
AJR Am J Roentgenol. Author manuscript; available in PMC 2012 November 1.

NIH
-PA Author Manuscript
NIH
-PA Author Manuscript
NIH
-PA Author Manuscript
Jin et al. Page 16
Table 4
Comparison of Quantitative TRIP-MR imaging Measurements Across SACE Levels
SACE Level ≤ 2 SACE Level 3 SACE Level 4 P*
Absolute Reduction (mL/min/100mL ± SD) 0.56 ± 0.19 11.06 ± 7.88 13.69 ± 5.89 0.117
Percent Reduction (% ± SD) 12.50 ± 6.36 66.09 ± 15.15 88.60 ± 8.79 < 0.001
*P values determined by one way analysis of variance (ANOVA)
AJR Am J Roentgenol. Author manuscript; available in PMC 2012 November 1.