standardized strategic assessment framework for small and
TRANSCRIPT
Standardized Strategic Assessment Framework for Small and
Medium Enterprises in High-Tech Manufacturing Industry
by
Mustafa Demir
A Thesis Presented in Partial Fulfillment
Of the Requirements for the Degree
Master of Science in Technology
Approved November 2012 by the
Graduate Supervisory Committee:
Gary Waissi, Chair
Jane Humble
Gerald Polesky
ARIZONA STATE UNIVERSITY
December 2012
i
ABSTRACT
A fundamental question in the field of strategic management is how
companies achieve sustainable competitive advantage. The Market-Oriented
Theory (MOT), the Resource-Based Model and their complementary perspective
try to answer this fundamental question. The primary goal of this study is to lay
the groundwork for Standardized Strategic Assessment Framework (SSAF). The
SSAF, which consists of a set of six models, aids in the evaluation and assessment
of current and future strategic positioning of Small and Medium Enterprises
(SMEs). The SSAF was visualized by IDEF0, a systems engineering tool. In
addition, a secondary goal is the development of models to explain relationships
between a company’s resources, capabilities, and competitive strategy within the
SSAF.
Six models are considered within the SSAF, including R&D activities
model, product innovation model, process innovation model, operational
excellence model, and export performance model. Only one of them, R&D
activities model was explained in-debt and developed a model by transformational
system.
In the R&D activities model, the following question drives the
investigation.
Do company R&D inputs (tangible, intangible and human resources)
affect R&D activities (basic research, applied research, and experimental
development)?
ii
Based on this research question, eight hypotheses were extrapolated
regarding R&D activities model. In order to analyze these hypotheses, survey
questions were developed for the R&D model. A survey was sent to academic
staff and industry experts for a survey instrument validation. Based on the survey
instrument validation, content validity has been established and questions, format,
and scales have been improved for future research application.
iii
ACKNOWLEDGEMENTS
I would like to thank my mentor, Professor Gary Waissi, for masterfully
guiding me through the various phases of this thesis program. His support,
guidance, encouragement, detail-oriented critique, and expertise sustained me
through the completion of my thesis. I would also like to express my sincere
gratitude to Professor Jane Humble and Professor Gerald Polesky, for their
constructive evaluation and encouragement throughout this process. To all
professors and teachers I have encountered along the way, I appreciate your
unique insights and belief in my abilities.
I would also like to thank my family and friends for their encouragement -
without their patience, understanding, support, and, most of all, love, the
completion of this study would not have been possible.
iv
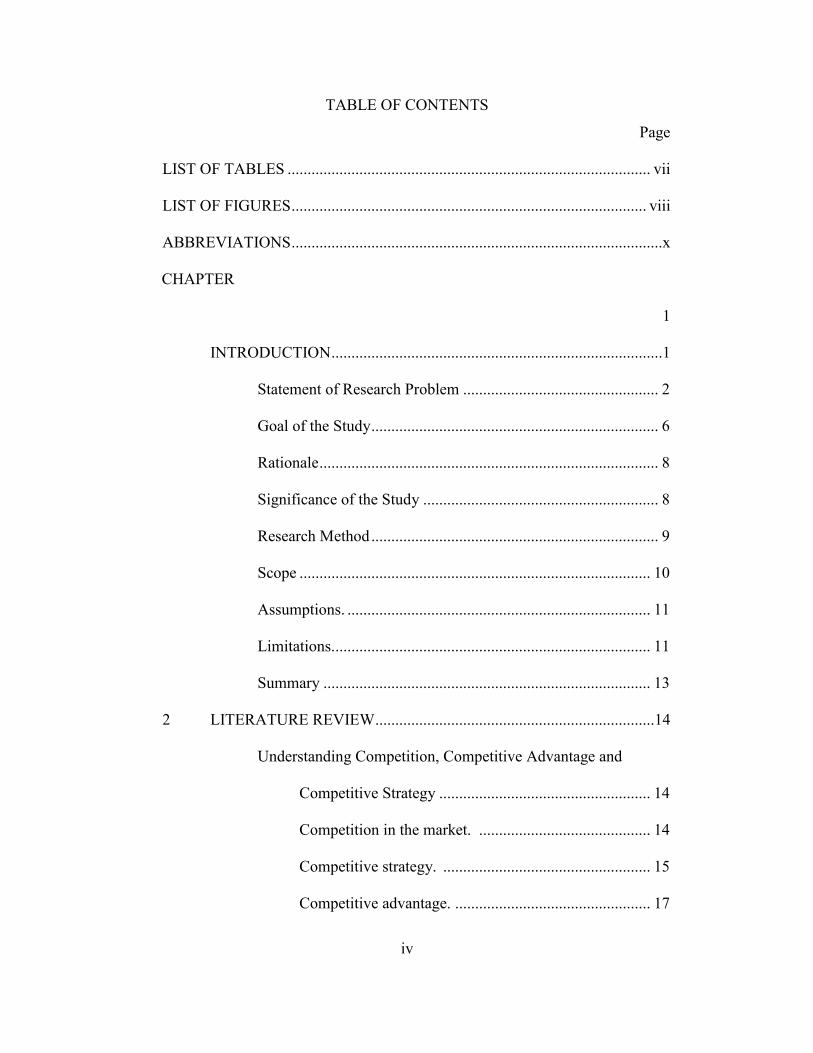
TABLE OF CONTENTS
Page
LIST OF TABLES ........................................................................................... vii
LIST OF FIGURES ......................................................................................... viii
ABBREVIATIONS .............................................................................................x
CHAPTER
1
INTRODUCTION ...................................................................................1
Statement of Research Problem ................................................. 2
Goal of the Study ........................................................................ 6
Rationale ..................................................................................... 8
Significance of the Study ........................................................... 8
Research Method ........................................................................ 9
Scope ........................................................................................ 10
Assumptions. ............................................................................ 11
Limitations. ............................................................................... 11
Summary .................................................................................. 13
2 LITERATURE REVIEW ......................................................................14
Understanding Competition, Competitive Advantage and
Competitive Strategy ..................................................... 14
Competition in the market. ........................................... 14
Competitive strategy. .................................................... 15
Competitive advantage. ................................................. 17
v
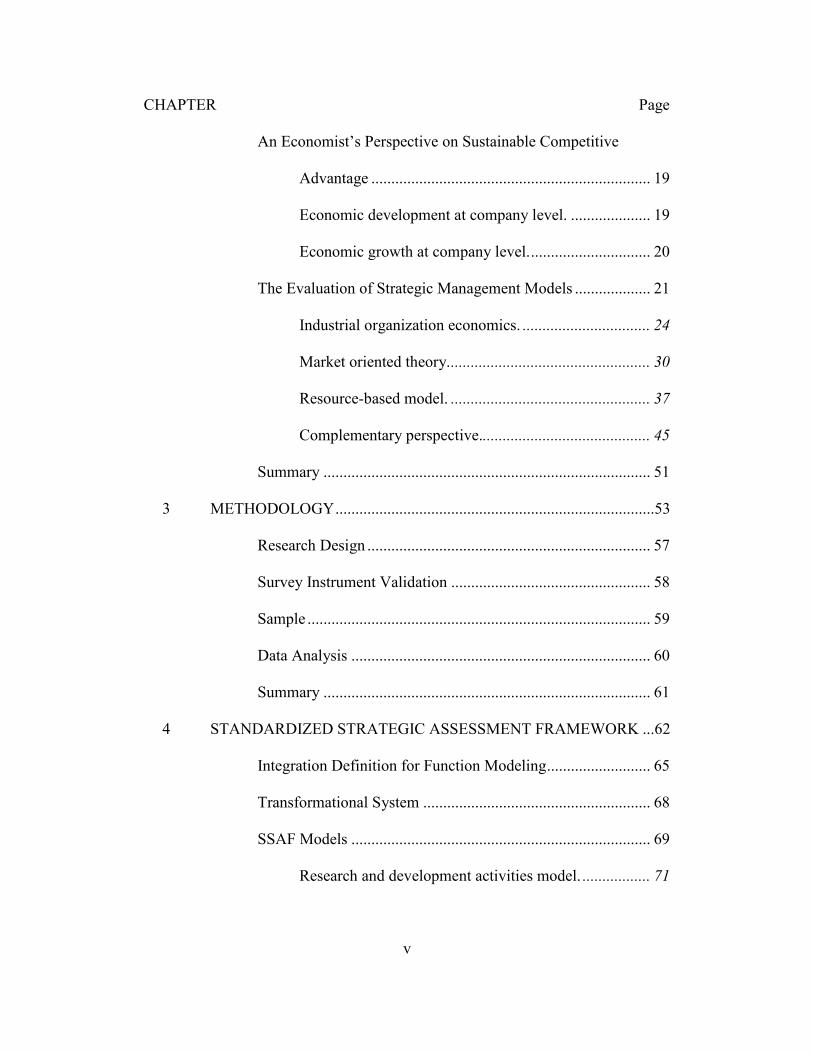
CHAPTER ......................................................................................................... Page
An Economist’s Perspective on Sustainable Competitive
Advantage ...................................................................... 19
Economic development at company level. .................... 19
Economic growth at company level. .............................. 20
The Evaluation of Strategic Management Models ................... 21
Industrial organization economics. ................................ 24
Market oriented theory. .................................................. 30
Resource-based model. .................................................. 37
Complementary perspective........................................... 45
Summary .................................................................................. 51
3 METHODOLOGY ................................................................................53
Research Design ....................................................................... 57
Survey Instrument Validation .................................................. 58
Sample ...................................................................................... 59
Data Analysis ........................................................................... 60
Summary .................................................................................. 61
4 STANDARDIZED STRATEGIC ASSESSMENT FRAMEWORK ...62
Integration Definition for Function Modeling .......................... 65
Transformational System ......................................................... 68
SSAF Models ........................................................................... 69
Research and development activities model. ................. 71
vi
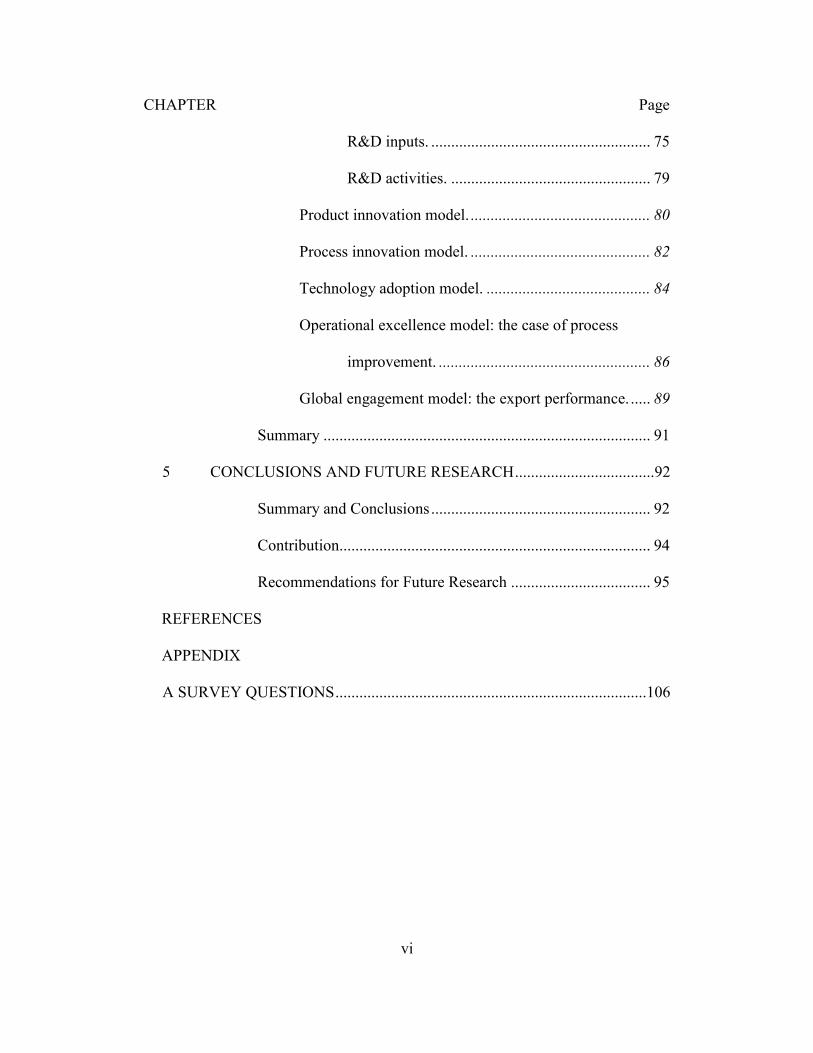
CHAPTER ......................................................................................................... Page
R&D inputs. ....................................................... 75
R&D activities. .................................................. 79
Product innovation model. ............................................. 80
Process innovation model. ............................................. 82
Technology adoption model. ......................................... 84
Operational excellence model: the case of process
improvement. ..................................................... 86
Global engagement model: the export performance. ..... 89
Summary .................................................................................. 91
5 CONCLUSIONS AND FUTURE RESEARCH ...................................92
Summary and Conclusions ....................................................... 92
Contribution .............................................................................. 94
Recommendations for Future Research ................................... 95
REFERENCES
APPENDIX
A SURVEY QUESTIONS ..............................................................................106
vii
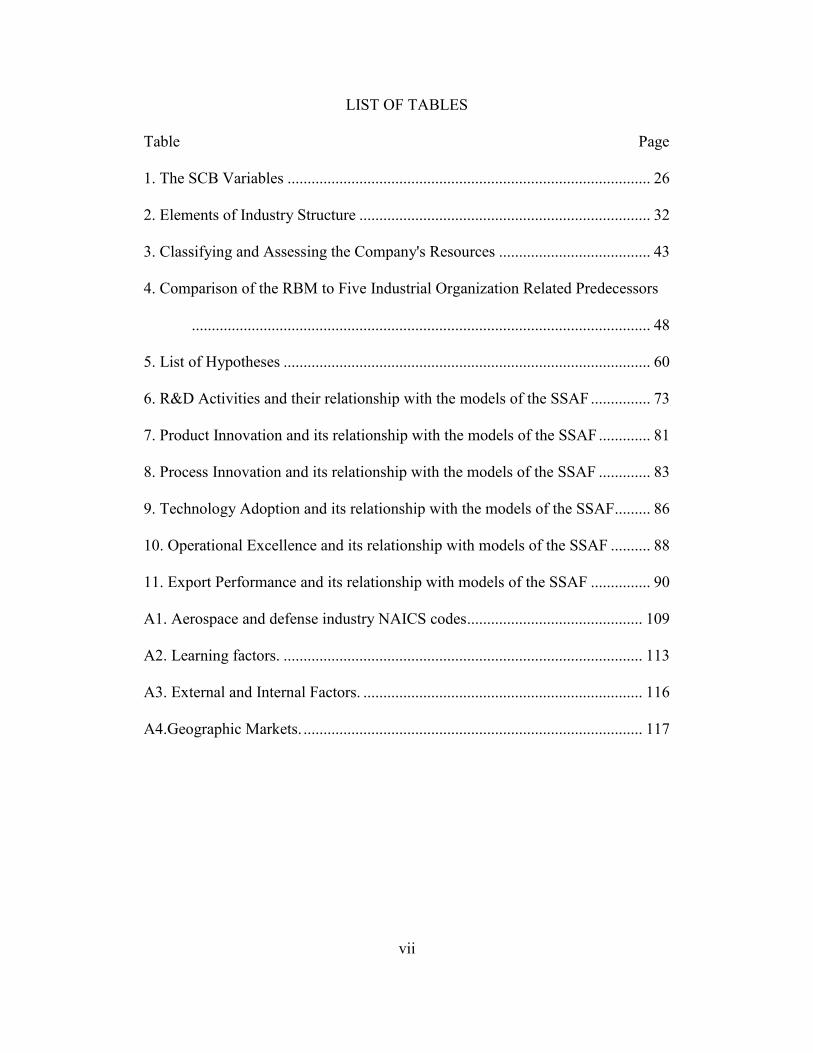
LIST OF TABLES
Table Page
1. The SCB Variables ........................................................................................... 26
2. Elements of Industry Structure ......................................................................... 32
3. Classifying and Assessing the Company's Resources ...................................... 43
4. Comparison of the RBM to Five Industrial Organization Related Predecessors
................................................................................................................... 48
5. List of Hypotheses ............................................................................................ 60
6. R&D Activities and their relationship with the models of the SSAF ............... 73
7. Product Innovation and its relationship with the models of the SSAF ............. 81
8. Process Innovation and its relationship with the models of the SSAF ............. 83
9. Technology Adoption and its relationship with the models of the SSAF......... 86
10. Operational Excellence and its relationship with models of the SSAF .......... 88
11. Export Performance and its relationship with models of the SSAF ............... 90
A1. Aerospace and defense industry NAICS codes............................................ 109
A2. Learning factors. .......................................................................................... 113
A3. External and Internal Factors. ...................................................................... 116
A4.Geographic Markets. ..................................................................................... 117
viii
LIST OF FIGURES
Figure Page
1. The role of company and industry environment in strategy formulation. ........ 17
2. The evaluation and integration of the concepts. ............................................... 23
3. The SCB approach. .......................................................................................... 24
4. Detail of relationship between structure, conduct and performance. ................ 27
5. The updated version of the SCB. ...................................................................... 29
6. The five competitive forces framework. ........................................................... 31
7. The relationship between company resources and competitive advantage. ..... 39
8. Company resources. .......................................................................................... 42
9. A framework of industrial model and RBM in terms of sustainable competitive
advantage. ................................................................................................. 45
10. Strengths, weaknesses, opportunities, threats analysis. .................................. 47
11. Integrated model of the RBM and the OMT. .................................................. 49
12. Interaction of models between each other within the SSAF. .......................... 62
13. Integration Definition for Function Modeling (IDEF0) box format. .............. 65
14. An IDEF0 – type model for the SSAF. ........................................................... 67
15. Transformational system. ................................................................................ 68
16. R&D activities and their relationship with the models within the SSAF. ...... 72
17. Company R&D process. ................................................................................. 73
18. Company R&D activities model. .................................................................... 74
19. Product innovation and its relationship with the models within the SSAF. ... 81
20. Process innovation and its relationship with the models within the SSAF. ... 83
ix
Figure Page
21. Technology adoption and its relationship with the models within the SSAF. 85
22. Operational excellence and its relationship with the models within the SSAF.
................................................................................................................... 87
23. Global engagement and its relationship with the models of the SSAF........... 90
x
ABBREVIATIONS
A&D: Aerospace and Defense
AMT: Advanced Manufacturing Technology
IDEF: Integration Definition Function
IDEF0: Integration Definition for Function Modeling
IOE: Industrial Organization Economics
MOT: Market-Oriented Theory
NAICS: North American Industry Classification System
R&D: Research and Development
RBM: Resource-Based Model
SCP: Structure Conduct Performance
SMEs: Small and Medium Enterprises
SSAF: Standardized Strategic Assessment Framework
1
CHAPTER 1
INTRODUCTION
The most fundamental question in the field of strategic management is
how a company is able to achieve a sustainable competitive advantage. Strategic
management is a highly complex field because it involves analyzing an entire
organization and its largely uncontrollable environment (Herrmann, 2005). Thus,
strategic management can be defined as:
The process of identifying, choosing and implementing activities that
will enhance the long-term performance of an organization by setting
direction and by creating ongoing compatibility between the internal
skills and resources of the organization, and the changing external
environment within which it operates (Smith, Jackson, & Wyatt, 1998,
p. 6).
Accordingly, strategic management focuses on the compatibility between
a company’s resources, capabilities and its external environment.
In the strategic management field there are two major influential
contributions, including Market-Oriented Theory (MOT), which was postulated
by Michael Porter (1980), and Resource-Based Model (RBM), which was first
introduced by Penrose (1959). Michael Porter (1980) built a framework of generic
strategies and industry analysis (Herrmann, 2005). According to his model,
company performance is determined by industry attractiveness, which depends on
five competitive forces, including: threat of entry, intensity of rivalry among
existing competitors, pressure from substitute products, bargaining power of
2
buyers, and bargaining power of suppliers. The interaction of these forces relates
to a company’s profit potential.
Another influential framework for understanding strategic management is
the Resource-Based Model (RBM) of the company. The basic idea of the RBM is
that a company will achieve a sustainable competitive advantage by developing
and applying distinctive company resources. When company-specific resources
are costly, rare and non-replicable by other companies, these resources become
the basis of sustainable competitive advantage; unique company resources (e.g.
company knowledge: know-how) are valuable because social complexity cannot
be imitated (Herrmann, 2005). In order to understand sustainable competitive
advantage, a combination of both the Market-Oriented Theory (MOT) and the
Resource-Based Model (RBM) has been considered by recent strategic
management studies (Conner, 1991; Mahoney & Pandian, 1992; Amit &
Schoemaker, 1993; Peteraf, 1993; Henderson & Mitchell, 1997; Spanos &
Lioukas, 2001; Rivard, Raymond, & Verreault, 2006).
Statement of Research Problem
This study examines the performance implications of strategic models in
the high-tech manufacturing industry. High-tech manufacturing industries can be
defined as those “engaged in the design, development, and introduction of new
products and/or innovative manufacturing processes through the systematic
application of scientific and technical chance” (Hecker, 2005, p.57). The high-
tech manufacturing industries (e.g. electronics, aerospace and defense, etc.) are
highly dynamic industries in respect to their continual technological advances.
3
These continuous changes in technology induce company managers to update
their technology in order to increase their company’s competitive strength.
Therefore, a complete understanding of company technology is necessary to be
able to determine its optimal structure (Caves, 1980). In order to properly identify
high-tech manufacturing industries, several requirements were confirmed by the
Census Bureau in 2004, including “high proportion of scientists, engineers, and
technicians”, “high proportion of R&D employment”, “production of high-tech
products”, and “use of high-tech production methods” (use of high tech capital
goods and services in the production process) (Hecker, 2005, p. 58).
This study investigates the parallelism of competitive environment,
resources, and capability for any company endeavoring to achieve sustainable
competitive advantage. For this purpose, a Strategic Assessment Framework
(SSAF) and, within it, related models were developed. The SSAF and its
developed models attempt to close the gap between the Market-Oriented Theory
(MOT) and the Resource-Based Models (RBM). The SSAF and its related models
build on, and extend from, the underlying theories and concepts of the Market-
Oriented Theory (MOT), the Resource-Based Model (RBM) and their respective
extensions.
Here, it is important to note that there are some differences between a
framework and a model:
A framework (Porter, 1991)
“Encompasses many variables and seeks to capture much of the
complexity of actual competition” (Porter, 1991, p. 98).
4
“Identifies relevant variables and questions which the user must
consider in order to develop conclusions tailored to a particular
company or industry” (Porter, 1991, p. 98).
“Seeks to help the analyst think through a problem by understanding
the company and its environment and then identifying and selecting
an available strategic alternative” (Porter, 1991, p. 98).
A model (Porter, 1991):
Depends on the fit between assumptions and reality.
“[Is almost inevitably applicable] to small subgroups of companies or
industries whose characteristics fit the model’s assumptions” (p. 98).
Due to their complementary goals, a framework and a model are not
mutually exclusive, and when used in conjunction with each other, they can form
a theory, which is more all-encompassing. While models are very useful in
ensuring logical contingency and exploring the subtle interactions involving a
limited number of variables, frameworks balance models by highlighting omitted
variables (Porter, 1991, p. 98).
The Standardized Strategic Assessment Framework (SSAF) approach has
been identified as a possible method in capturing as much of the actual
complexity of competition as possible. The SSAF can aid with assessment of
current strengths and needs, as well as help with future strategic competitive
positioning. The SSAF is composed of six interconnected strategic theoretical
models, including a model for each of the following: R&D activities, process
innovation, product innovation, technology adoption, operational excellence, and
5
global engagement, and two support models - including qualified workforce, and
machines & equipment. The SSAF and its theoretical models are, in part, based
on a systematic literature review.
In the context of an organization, knowledge of industry forces and
company resources are necessary to achieve sustainable competitive advantage. A
company has a sustainable competitive advantage when “it is implementing value
creating strategy not simultaneously being implemented by any current or
potential competitors and when these other companies are unable to duplicate the
benefits of the strategy” (Barney, 1991, p. 103).
Strong environmental uncertainty within the high-tech manufacturing
industry, ever-changing technology, and increasing complexity of company
resources all combine to force companies to constantly analyze the industry in
which they operate. These variables urge companies to change their strategies to
be the leading competitors in their markets. By structuring a company’s portfolio,
bundling resources, and leveraging capabilities, enterprises can maintain value for
customers (Sirmon, Hitt, & Ireland, 2007). Therefore, industrial forces (external
factors) and company resources (internal factors) significantly affect a company’s
sustained competitive advantage. However, in very few studies do researchers
explain the complementary link between external and internal factors to the
sustained competitive advantage. Even if such literature exists, there has been
little investigation into a strategic framework development using the Integration
Definition for Functional Modeling (IDEF0) approach of systems engineering.
Essentially understood:
6
Systems engineering is an interdisciplinary field of engineering focusing
on how complex engineering projects should be designed and managed
over their life cycles. Issues such as logistics, the coordination of different
teams, and automatic control of machinery become more difficult when
dealing with large, complex projects. Systems engineering deals with
work-processes and tools to manage risks on such projects, and it overlaps
with both technical and human-centered disciplines such as control
engineering, industrial engineering, organizational studies, and project
management (Hribik, 2012, p. 252).
Integration Definition (IDEF), which is like a systems engineering
toolbox, can be used to describe operations in an organization. IDEF0 is a
common modeling technique for analysis, development, re-engineering, and
integration of business processes (DOD, 2001).
Due to its recent introduction into the business world, the theoretical
perspective of strategic management (e.g. organizational knowledge creation: a
link between knowledge and company capabilities, and a link between knowledge
and competitive advantage) is not yet mature enough to allow for empirical
testing (Spanos & Lioukas, 2001). Therefore, a specific framework for how to
achieve and sustain a competitive advantage needs to be identified.
Goal of the Study
The primary goal of this study is to lay the groundwork for Standardized
Strategic Assessment Framework (SSAF). The SSAF, which consists of a set of
six models, aids in the evaluation and assessment of current and future strategic
7
positioning of Small and Medium Enterprises (SMEs). The second goal is the
development of models to explain relationships between a company’s resources,
capabilities, and competitive strategy.
The contribution of this study is therefore focused on the development of
the SSAF, which will enable SMEs to improve their strategic focus. Causality of
the relationships is claimed only within the models and not between the models
within the SSAF. Six theoretical models were developed as follows:
(1) Research Development (R&D) Activities Model: R&D activities
model will attempt to explain the relationship between inputs (tangible
resources, intangible resources and human resources) and outputs (e.g.
product and process innovation, and process improvement);
(2) Product Innovation Model: the product innovation model will attempt
to explain the relationship between inputs (e.g. R&D activities,
qualified workforce, etc.) and outputs (e.g. export performance) with a
focus on what is produced;
(3) Process Innovation Model: the process innovation model will attempt
to explain the relationship between inputs (e.g. R&D activities,
qualified workforce, etc.) and outputs (e.g. export performance) with a
focus on how things are produced;
(4) Technology Adoption Model: the technology adoption model will
attempt to explain the relationship between inputs (environmental
influences, tangible, intangible and human resources) and outputs
(company performance);
8
(5) Operational Excellence Model (process improvement): the operational
excellence model will attempt to explain the relationship between
inputs (e.g. qualified workforce, technical information, etc.) and
outputs (critical success factors) with a focus on operational systems;
(6) Global Engagement Model: the global engagement model will attempt
to explain the relationship between inputs (e.g. product and process
innovation, process improvement, etc.) and outputs (company
performance) with a focus on connection to other global enterprises.
Rationale
This study is based on a theoretical context of the MOT, the RBM and
their extensions. Its purpose is to reveal a link between specific activities and a
sustained competitive advantage. The resulting SSAF and its models could assist
companies in evaluating their competitiveness in the market. The goal is that the
SSAF and its models will help SMEs improve their strategic focus through the six
model dimensions.
Significance of the Study
Companies are still searching for new and better ways to achieve and
sustain a competitive advantage. The solution is not easy to find due to the
uniqueness of companies and their environments. Further, the complexity of
company resources adds even more factors that can affect a strategy (Teece,
Pisano, & Shuen, 1997). “Rapidly shifting environmental contingencies provide a
premium for companies capable of quickly identifying and understanding the
9
contingencies and then making decisions about how to leverage their capabilities
without undue delay” (Sirmon, Hitt, & Ireland, 2007, p. 287). Therefore, in order
to achieve and sustain competitive advantage, a company requires continual
change and engagement in developing their methods. Understanding the
relationship between a company’s environment, resources, and effectiveness of its
capabilities would provide necessary opportunities for analyzing the empirical
implications.
Research Method
The following research techniques were used in this study:
Review of fundamental competitive advantage models, including the
MOT, the RBM, and complementary perspectives that comprise both the
MOT and the RBM.
Identify theoretical models related to the proposed SSAF derived from
fundamental competitive advantage models.
Develop the SSAF in a systematic way to demonstrate a relationship
between various theoretical models discussed in literature, which relate to
competitive advantage.
Identify R&D activities model’s inputs, based on literature reviews.
Develop hypotheses regarding each input of R&D activities models.
Validate survey instrument of SMEs in the A&D industry in the Arizona
area.
Analyze the data with appropriate statistical analysis tools.
10
This investigation seeks also to aggregate results from studies which
investigate different focus areas in the manufacturing industry. It will develop a
method by which companies can evaluate themselves with respect to competitive
advantage in a given industry.
Scope
In this study, two fundamental competitive advantage models, the MOT
and the RBM, were considered in the development of the SSAF:
The MOT can be achieved by offering low priced products or
differentiated products for which customers are willing to pay a price
(Porter, 1980; Barney, 1991; O'Shannassy, 2008).
The RBM is inspired by neo-classical microeconomics. Essentially, neo-
classical microeconomics shows that sustainable competitive advantage
occurs when a company implements a value creating strategy that is not
already being implemented simultaneously by rivals - and the benefits of
which other companies are unable to duplicate (Porter, 1980; Barney,
1991; O'Shannassy, 2008).
After reviewing these two fundamental advantage models (the RBM and
the MOT), six models within the SSAF were developed, including: R&D
activities, Product Innovation, Process Innovation, Technology Adoption,
Operational Excellence, and Global Engagement. Additionally, one model, R&D
activities, shed new light on the SSAF models in this study. Finally, hypotheses
11
were developed for each input of only one model (R&D activities) in order to test
their relationships in future studies.
Assumptions. The following assumptions are considered in this study:
1. There are two supporting factors in the SSAF, including: qualified
workforce, and machines & equipment.
Qualified workforce is necessary for sustainable competitive
advantage. Therefore, development and management of a
workforce is vital. (Dahms, 2001).
Machines & equipment are classified as physical capital resources
(other physical capital resources can include: a company
factory/plant, geographic location, and access to raw materials),
which are used by companies in their operations (Barney, 1991).
2. Through literature reviews, positive and negative relationships between
each model’s inputs and outputs were determined within the SSAF and its
variables. The effects of these relationships on a company’s competitive
advantage are different for each industry.
3. There are positive and negative areas which affect a company’s
sustainable competitive advantage.
4. To ensure validity, all stated hypothesis should be tested.
Limitations. The study has the following limitations:
1. This study is limited to the development of only six models: R&D
activities, product innovation, process innovation, technology adoption,
12
operational excellence and global engagement. Only one of them is
expounded upon in detail: R&D activities model will attempt to explain
the relationship between inputs (tangible resources, intangible resources
and human resources) and outputs (product and process innovation, and
process improvement). R&D activities, which carry out internal company
innovative activities, are a precursor to new products or new processes for
a company.
2. This study is limited to only two supporting factors, including: qualified
workforce and machine & equipment. Qualified workforce and machine &
equipment are expounded upon within each model.
3. In the technology adoption model, the study is limited to only Advanced
Manufacturing Technology (AMT) adoption. AMT can be defined as “a
family of manufacturing process technologies whose common element is
the use of computers to store and manipulate data” (Sohal, Sarros,
Schroder, & O'neill, 2007, p.5226).
4. In the global engagement model, the study is limited to only export
performance for global engagement model. Export performance can be
defined as the “outcome of a company’s activities in export markets”
(p.497).
5. This study is limited to only a survey instrument validation, because of
time constraints.
13
Summary
As indicated, the purpose of this study is to develop the SSAF and identify
its theoretical models. The study focuses on investigating the relationships
between a company’s environment in which it competes, a company’s distinctive
resources, and a company’s capability for achieving sustainable competitive
advantage. The SSAF builds on the underlying theories and concepts of the MOT,
and the RBM and its dynamic extensions. These theories and concepts are
discussed further in Chapter 2.
Relevant literature relating to the problem statement will be reviewed in
Chapter 2. Key topics in Chapter 2 include the Market-Oriented Theory (MOT),
the Resource-Based Model (RBM), and the complementary perspective of the
MOT and the RBM. In Chapter 3, the design and methodology of the study, as
well as the choice of tools, are identified. Chapter 4 includes discussion of the
concept of the SSAF and the development of the hypotheses. In Chapter 5, the
SSAF concept is summarized, including implications for current theory and
practice, the limitations of the study, and recommendations for future study.
14
CHAPTER 2
LITERATURE REVIEW
In order to achieve and sustain competitive advantage within industry, a
company should identify its competitive strategy based on its internal factors (e.g.
company resources, company capabilities, etc.) and analysis of externalities (e.g.
customers, suppliers, e.g.). Many recent contributions place emphasis on company
level competitive advantage under the banner of a resource-based view of the
company (Hart, 1995; Dhanaraj & Beamish, 2003). The Resource-Based Model
(RBM) focuses on “how sustained competitive advantage is generated by the
unique bundle of resources at the core of the company” (Dhanaraj & Beamish,
2003, p.244). In this chapter, review of relevant literature is assessed in the
following order: first, some basic terms in the literature, including competition,
competitive advantage, competitive strategy, and economic development and
company growth at company level, are defined; and second, some of the core
concepts of competitive advantage at the company level are described in detail.
The discussion of the core concepts sets precedence for the specific concepts and
techniques in this study.
Understanding Competition, Competitive Advantage and Competitive
Strategy
Competition in the market. In a company, finance and ability are crucial
for competition. In a continual effort to affirm progressive financial status and
technological capabilities, companies introduce new products and processes
15
which can alleviate people’s sensitivity to price changes. New product and
process development results in a greater emphasis by companies to satisfy
customers’ reduced economic needs (Burke, Genn-Bash, & Haines, 1991).
Armstrong (1982) stresses several elements of real-world competition, including:
innovation and imitation; offering the best choice in a market; adopting a stance
of independent assertiveness by managers; acquiring and using power as essential
ingredients of competition; acquisition of expertise; involving the acceptance of
fair and equitable rules in the competitive environment; and competing with a
large society in which members produce modern complex products and services
(p. 24-25).1 Porter (1985) explains that competition is the source of success or
failure of companies, and he emphasizes that a company’s characteristics (e.g.
innovations, a cohesive culture, or product implementation, etc.) can be
determined by competition (p.1).
In a nutshell, company strategy comprises internal and external data and,
based on this data, it determines the position of the company in the market by
performing R&D activities and innovation, investing in new technology, process
improvement, and marketing.
Competitive strategy. In order to identify the right competitive position
in an industry, a company defines its competitive strategy, which “aims to
establish a profitable and sustainable position against the forces that determine
industry competition” (Porter, 1985, p.1). In this case, the company pursues a
1 For more detail about nature of competition based on real-world company perspective see
Armstrong (1982).
16
strategy that is not being executed by rival companies. Implementation of a
strategy provides opportunity for reduction in costs and dominance in the
marketplace. To help managers analyze industry, with respect to competition level
and profit potential, Porter (1980) lists five competitive forces: threat of new
entrants, bargaining power of suppliers, bargaining power of buyers, threat of
substitute products or services and rivalry among existing competitors (Porter,
1991; Nilsson & Rapp, 2005).
Company strategy makes a company unique; it gives a distinct competitive
advantage, provides direction, builds brand reputation, sets the right goals, adds
superior performance, defines a market position, and creates unique value
proposition (Porter, 2005). Company strategy seeks to answer questions such as
what a company should do or not do, what customers to serve, what is the
technology level of the industry, how to develop new product and processes, how
to create a unique value proposition, and how to expand in the market. (Porter,
2005).
The focus area of company strategy is “matching a company’s resources
and capabilities to the opportunities that arise in the external environment” (Grant,
1995, p.114). Based on this, the roles of company and industry environment are
depicted in Figure 1. As is detailed in the figure, both company resource analysis
and industry analysis are vital in proper utilization of company competitive
strategy. In order to analyze resources, the interface between strategy (company
goals and values), and resources and capabilities must be included. At industry-
level analysis, company focus is on the interface between strategy and the
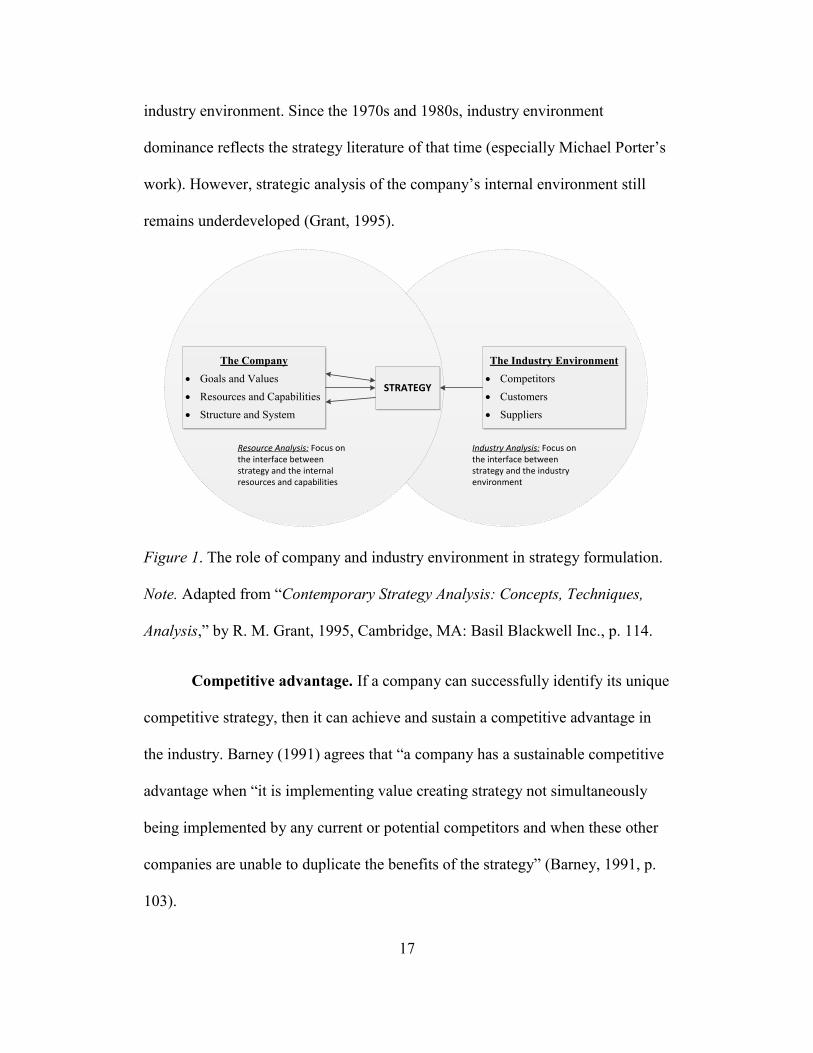
17
industry environment. Since the 1970s and 1980s, industry environment
dominance reflects the strategy literature of that time (especially Michael Porter’s
work). However, strategic analysis of the company’s internal environment still
remains underdeveloped (Grant, 1995).
Figure 1. The role of company and industry environment in strategy formulation.
Note. Adapted from “Contemporary Strategy Analysis: Concepts, Techniques,
Analysis,” by R. M. Grant, 1995, Cambridge, MA: Basil Blackwell Inc., p. 114.
Competitive advantage. If a company can successfully identify its unique
competitive strategy, then it can achieve and sustain a competitive advantage in
the industry. Barney (1991) agrees that “a company has a sustainable competitive
advantage when “it is implementing value creating strategy not simultaneously
being implemented by any current or potential competitors and when these other
companies are unable to duplicate the benefits of the strategy” (Barney, 1991, p.
103).
The Company
Goals and Values
Resources and Capabilities
Structure and System
The Industry Environment
Competitors
Customers
Suppliers
STRATEGY
Resource Analysis: Focus on the interface between strategy and the internal resources and capabilities
Industry Analysis: Focus on the interface between strategy and the industry environment
18
According to Porter (1985), “competitive advantage grows fundamentally
out of [the] value [that] a firm is able to create for its buyers that exceeds the
firm’s cost of creating it” (p. 3). Thus, a company “experiences competitive
advantages when its actions in an industry or market create economic value and
when competing companies are engaging in similar actions” (Barney, 2002, p.9).
Based on the RBM perspective, competitive advantage is created when a
company applies a value created strategy which is not being applied at the same
time by current or potential competitors, and the competitors are unable to
duplicate the benefits of this strategy (Barney, 1991; Sirmon, Hitt, & Ireland,
2007; O'Shannassy, 2008).
Porter (1985) highlights that there are two basic types of competitive
advantage, including cost leadership and differentiation (p. 3).2 While cost
leadership can be viewed as “a firm that sets out to become the low-cost producer
in its industry”, differentiation is explained as “a firm that seeks to be unique in its
industry along some dimensions that are widely valued by buyers” (Porter, 1985,
p. 12, 14). In these two types of competitive advantage, technological change is
one of the most important resources for competitive advantage (Porter, 1985;
Nilsson & Rapp, 2005). Also, Porter’s (1985) study elaborates on the strong
alliance among companies in order to enhance competitive advantage in one
industry (p. 3). Basically, “interrelationships among business units are the
2 According to types of competitive advantage, Porter (1985) defines four generic strategies,
including cost leadership, differentiation, and focus which is divided into cost focus and
differentiation focus (p.11-16).
19
principal means by which a diversified firm creates value, and thus provides
underpinning for corporate strategy” (Porter, 1985, p.3).
An Economist’s Perspective on Sustainable Competitive Advantage
To further understand sustainable competitive advantage, a differentiation
between economic growth and economic development has been examined in
many studies (e.g. Schumpeter, 1975; Porter, 1980; Porter, 1985; Solow 1956;
Romer, 1986). While “economic growth refers to the increasing production of
goods and services”, economic development “combines the meaning of economic
growth with a number of desired criteria associated with the goals of the
development” (Sudaryanto, 2003, pp.24-25). Therefore, economic growth is an
important component of economic development (Sudaryanto, 2003).
Economic development at company level. Economic development
“requires sustainable and shared increases in per capita income accompanied by
changes in the structural composition of an economy towards higher value added
goods and more efficient production methods” (Szirmai, Naude, & Goedhuys,
2011, p. 3). Even early in these studies, Schumpeter (1934) asserts cooperation
between economic development and company internal factors, especially in terms
of technological progress (Moran & Ghoshal, 1999). According to his evaluation,
competitive markets and multiple companies are indications of organizational
economics. Within this changing environment, there is anticipated creative
tension. In fact, this economic structure of competition between multiple
companies was declared to be the process of creative destruction by Schumpeter
20
(1942) (Moran & Ghoshal, 1999). Creative destruction, which is an evolutionary
process, requires continued interaction between companies; on the one hand
“creating and realizing new value, and markets, while, on the other hand, forcing
these same firms to surrender, over time, most of [their] value to others” (Moran
& Ghoshal, 1999, p.390). In the Schumpeterian model (creative destruction),
“entrepreneurship was the key motive force in the capitalist process, generating
innovations, often radical in nature, that may alter the rules by which an industry
or economy operates” (Galunic & Rodan, 1998, p. 1193). Therefore, economic
development achieved through innovative entrepreneurship challenges incumbent
companies by new product innovation or process innovation which then makes
current technologies and products obsolete (Carree, Stel, Thurik, & Wennekers,
2002). Companies that are not able to measure up to these innovations thus
become obsolete. Rivalry to develop new products or processes - or to improve
existing ones - is critical to the Schumpeterian model. New product and new
process developments (technological innovation) are relatively transitory. This
means that teams are continuously working to develop the next new product or
process. Also, in the Schumpeterian model, a technological change, in terms of
product and process development, impacts company productivity and economic
growth.
Economic growth at company level. Economic growth at a company
level refers to the increasing volume of products or services produced or provided
by a company. Since the industrial revolution, companies have employed many
21
methods to increase their production volume in order to meet with ever-increasing
market demand. In the context of an organization, technological innovation is the
engine of economic growth and thus, productivity. From a basic economic
perspective, technology is considered a means of transforming available resource
inputs into marketable, value-added products.3 Productivity is the measurable
worth of those value-added products. In order to increase productivity, companies
attempt to minimize the cost of resources and maximize customer perceived value
of outputs. This type of productivity improvement is a foundational pillar of
sustainable competitive advantage (Smith & Sharif, 2007).
Consequently, many economists have focused solely on economic
development and economic growth at a company level in order to understand
overall sustainable competitive advantage. They have observed that internal (e.g.
human capital, technological capital, management, etc.) and external (e.g. export
performance, industrial movement, competition, etc.) factors are driving forces of
companies’ economic development and economic growth as well as their
sustainable competitive advantage (Sudaryanto, 2003).4
The Evaluation of Strategic Management Models
Since the Schumpeterian model (also called creative destruction) was
applied, many models utilize both internal (Andrews, 1971; Ansoff, 1988) and
3 A more detailed definition of technology is “the process that any company uses to convert inputs
of labor, materials, capital, energy, and information into outputs of greater value” (Smith & Sharif,
2007).
4 Economic development (new product or new process = productivity), economic growth
(increasing value of value added products = productivity) and competitive advantage (Productivity
= Yi/EMi, Yi refers to production level and EMi represents the number of people employed in the
respective sector) are related to each other in terms of productivity (Sudaryanto, 2003).
22
external (Hannan & Freeman, 1977; Pfeffer & Salancik, 2003; Porter, 1980)
factors to show how a company can achieve sustainable competitive advantage
(Barney, 1991; Hart, 1995). Recently, many contributions (e.g. Barney, 1991;
Hart, 1995) have attempted an integration of the internal and external factors
under the banner of the Resource-Based Model (RBM) (Barney, 1991;
Wernerfelt, 1984; Hart, 1995). There are three extensions of the strategic
management models, including: the competitive strategy perspective (Industrial-
Organization Economics – IOE), the RBM perspective (microeconomics) and the
complementary perspective (includes both MOT and RBM) (Spanos & Lioukas,
2001). On the one hand, the IOE originates from traditional economic analysis,
and it considers industry structure as the primary motivator of strategy and
performance. On the other hand, the RBM is derived more directly from strategy
research, and underlines the importance of company capabilities and
competencies (Rivard, Raymond, & Verreault, 2006). “While the roots of the IOE
go back to Harvard School Industrial-Organization, roots of the RBM introduce
Penrose’s (1959) famous study ‘The Theory of the Growth of the Firm’” (Bogner,
Mahoney, & Thomas, 1998, p. 66). The IOE focuses on industry level concepts,
and Penrose’s (1959) study focuses on the company level (Bogner, Mahoney, &
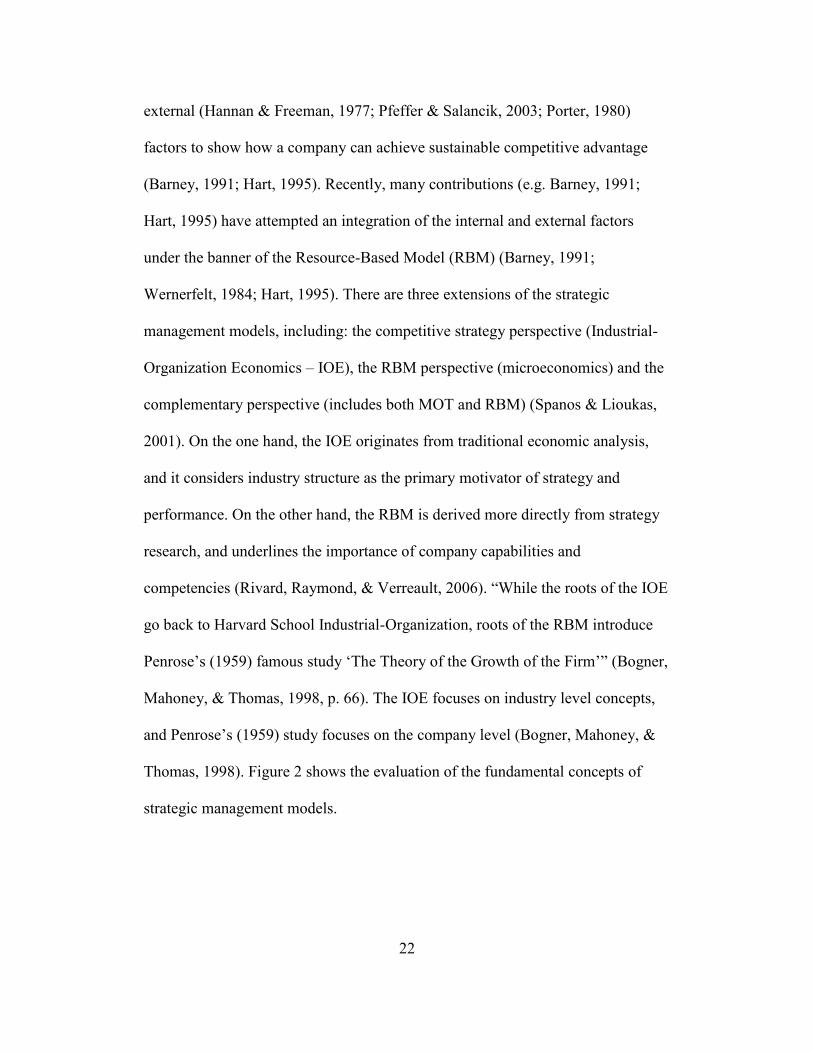
Thomas, 1998). Figure 2 shows the evaluation of the fundamental concepts of
strategic management models.
23
Figure 2. The evaluation and integration of the concepts.
Note. Adapted from “Paradigm Shift: The Parallel Origin, Evolution, and
Function of Strategic Group Analysis with the Resource-Based Theory of the
Firm,” by W.C. Bogner, J. T. Mahoney, and H. Thomas, 1998, Advances in
Strategic Management, 15, p. 67.
The industrial organization model focuses externally on the industry and
product markets, and the RBM focuses internally on the company and its
resources (Mahoney & Pandian, 1992). In an evaluation of the concepts, the
Chicago school response was that Porter’s (1980) Market Oriented Theory (MOT)
and game theory are considered to be at an industrial level, while Penrose’s
(1959) study and RBM ought to be used at a company level. Wernerfelt (1984)
speculates that these two models are like “two sides of the same coin” ( p.171),
because IOE’s “constrained maximization problem of maximizing production
given resource constraints and the constrained minimization problem of
24
minimizing resource costs given a desired production level” (Mahoney &
Pandian, 1992).
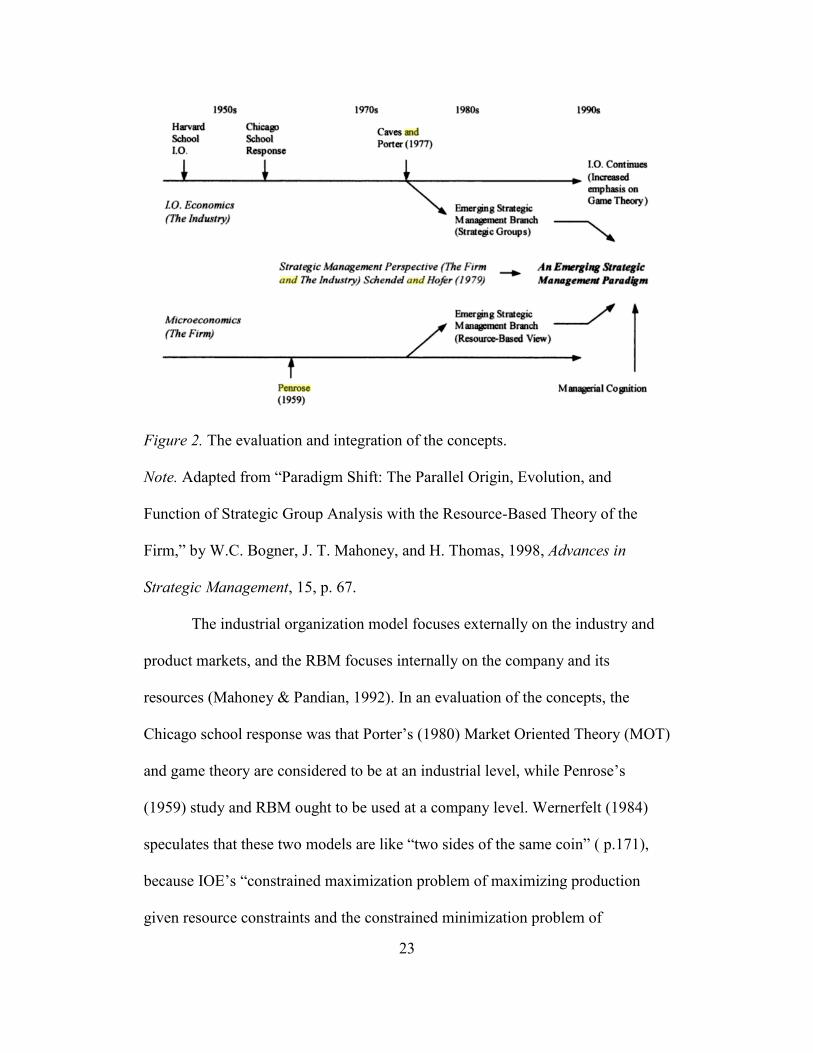
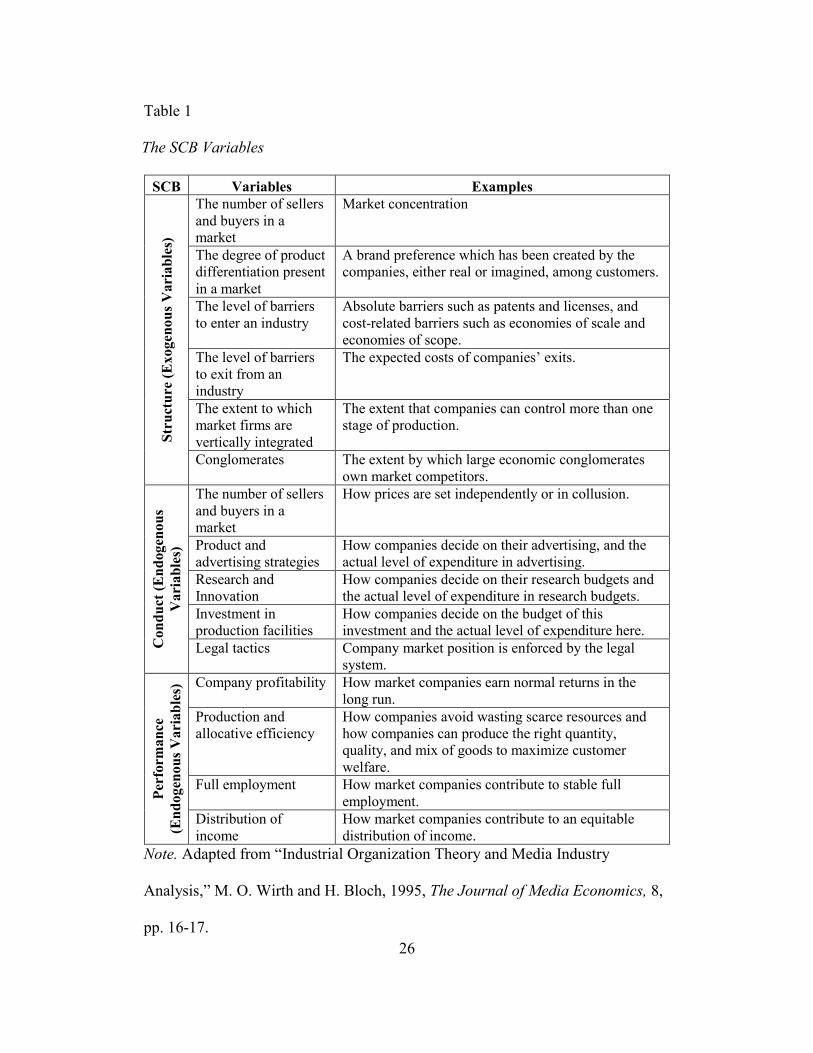
Industrial organization economics. The origin of IOE is: industry
-structure, -conduct, -performance (SCP), which originated in the Harvard School
of Industrial Economics. Wirth & Bloch (1995) define ‘structure’ as market
structure, ‘conduct’ as the behavior of the companies in a market, and
‘performance’ as market performance (p. 17). Figure 3 shows the basic approach
of the SCB approach.
Figure 3. The SCB approach.
Note. Adapted from “The Contributions of Industrial Organization to Strategic
Management,” by M. E. Porter, 1981, The Academy of Management Review, 6, p.
611.
The SCB approach was first formulated by Mason (1939), and then
applied to a large sample of cross-sectional studies by Bain (1951) (Mason, 1939;
Bain, 1951; Wirth & Bloch, 1995).5 The basic idea of the SCP was to analyze the
relationship between industry structure and industry performance. According to
the SCB, “a company’s performance in the marketplace depends critically on the
5 Mason (1939)’s study analysis price and production policies, and responses of market structure
as well as large scale companies. Bain (1951)’s study considers American manufacturing
industries from 1936 through 1940, and it is a statistical application of the SCP which emphasizes
relationships between seller concentration, buyer concentration, condition of entry, and degree of
product differentiation to profits, selling costs, and relative efficiency of scale an capacity (Mason,
1939; Bain, 1951).
Industry
Structure
Conduct
(Strategy) Performance
25
characteristics of the industry environment in which it competes” (Porter, 1981, p.
610).
In the context of industrial organization analysis, industry (or market)
performance is determined by the conduct of the companies within it, which is
determined by various market structure variables (Wirth & Bloch, 1995). In the
SCB, while structure variables are considered as exogenous to the market,
conduct and performance variables are considered as endogenous (Wirth &
Bloch, 1995).6 Exogenous and endogenous variables, and their examples, are
shown in Table 1.
6 The reason of exogenous to the market is that “most SCB analysis is static, and basic conditions
such as technology, which affect market structure, are assumed to remain constant” (Wirth &
Bloch, 1995, p.16).
26
Table 1
1. The SCB Variables
SCB Variables Examples
Str
uct
ure
(E
xo
gen
ou
s V
ari
ab
les)
The number of sellers
and buyers in a
market
Market concentration
The degree of product
differentiation present
in a market
A brand preference which has been created by the
companies, either real or imagined, among customers.
The level of barriers
to enter an industry
Absolute barriers such as patents and licenses, and
cost-related barriers such as economies of scale and
economies of scope.
The level of barriers
to exit from an
industry
The expected costs of companies’ exits.
The extent to which
market firms are
vertically integrated
The extent that companies can control more than one
stage of production.
Conglomerates The extent by which large economic conglomerates
own market competitors.
Con
du
ct (
En
dogen
ou
s
Vari
ab
les)
The number of sellers
and buyers in a
market
How prices are set independently or in collusion.
Product and
advertising strategies
How companies decide on their advertising, and the
actual level of expenditure in advertising.
Research and
Innovation
How companies decide on their research budgets and
the actual level of expenditure in research budgets.
Investment in
production facilities
How companies decide on the budget of this
investment and the actual level of expenditure here.
Legal tactics Company market position is enforced by the legal
system.
Per
form
an
ce
(En
do
gen
ou
s V
ari
ab
les)
Company profitability How market companies earn normal returns in the
long run.
Production and
allocative efficiency
How companies avoid wasting scarce resources and
how companies can produce the right quantity,
quality, and mix of goods to maximize customer
welfare.
Full employment How market companies contribute to stable full
employment.
Distribution of
income
How market companies contribute to an equitable
distribution of income.
Note. Adapted from “Industrial Organization Theory and Media Industry
Analysis,” M. O. Wirth and H. Bloch, 1995, The Journal of Media Economics, 8,
pp. 16-17.
27
New industrial organization economists have criticized the SCP approach.
Some of the major criticisms include (Wirth & Bloch, 1995):
Market structure is not exogenous, because conduct and performance
affect market structure. For example, innovation and advertising may
increase entry barriers, and predatory pricing could pressure competitors
out of the market, etc. (Ferguson & Ferguson, 1994).
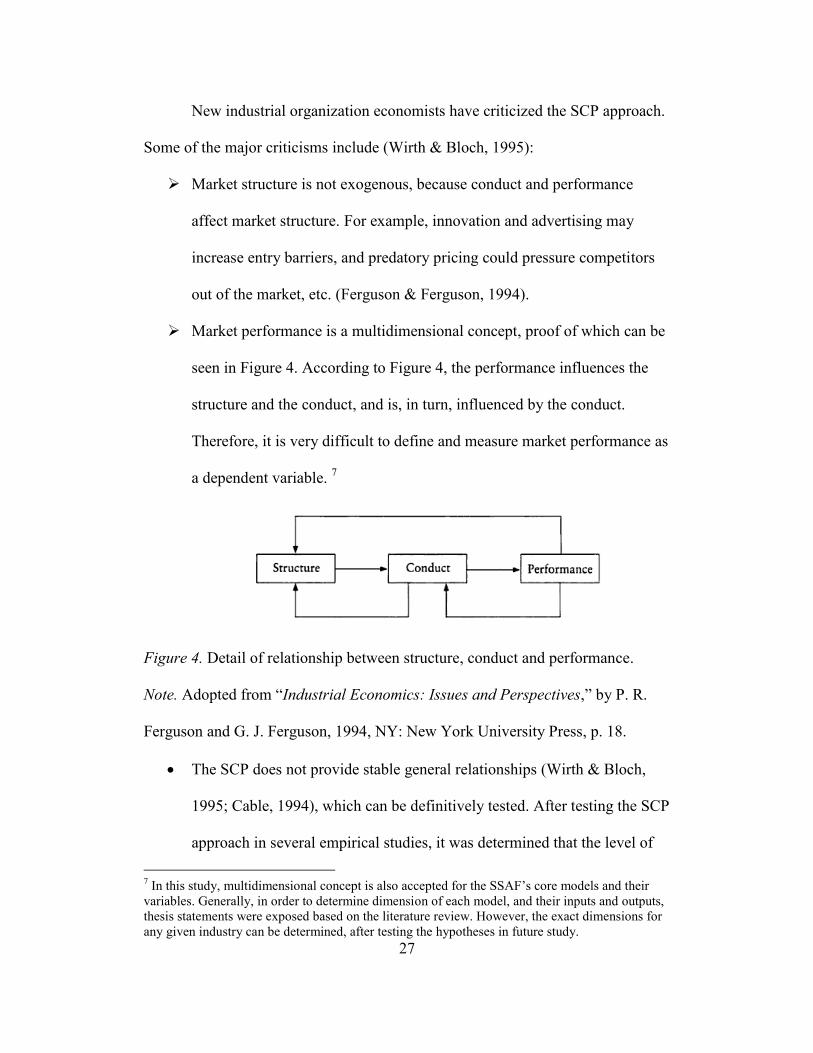
Market performance is a multidimensional concept, proof of which can be
seen in Figure 4. According to Figure 4, the performance influences the
structure and the conduct, and is, in turn, influenced by the conduct.
Therefore, it is very difficult to define and measure market performance as
a dependent variable. 7
Figure 4. Detail of relationship between structure, conduct and performance.
Note. Adopted from “Industrial Economics: Issues and Perspectives,” by P. R.
Ferguson and G. J. Ferguson, 1994, NY: New York University Press, p. 18.
The SCP does not provide stable general relationships (Wirth & Bloch,
1995; Cable, 1994), which can be definitively tested. After testing the SCP
approach in several empirical studies, it was determined that the level of
7 In this study, multidimensional concept is also accepted for the SSAF’s core models and their
variables. Generally, in order to determine dimension of each model, and their inputs and outputs,
thesis statements were exposed based on the literature review. However, the exact dimensions for
any given industry can be determined, after testing the hypotheses in future study.
28
theoretical abstraction of the SCP is not sufficiently informative in order
to make empirical analysis useful. Additionally, the testing stated that
particular aspects of market structure may provide results which are not
robust (Bothwell, Cooley, & Hall, 1984; Donsimoni, Geroski, &
Jacquemin, 1984).
Porter (1981) brings further constructive criticisms to previous IOE works
under ‘The New Promise of Industrial Organization’ (Porter, 1981, p.614-617):
Translation: At this point, the IOE paradigm is not limited to simply a
theoretical understanding, but the “extensions of the IOE paradigm to the
perspective of strategy formulation are now in the literature” (p.614).
Unit of analysis: Empirical researchers started to analyze not only the
industry as a whole, but also a company as a unit.
Free-standing entity: Some studies research “the interrelationship
between business units and their corporate siblings in modeling industry
outcomes” (p. 615). Previous work done on the IOE assumed it to be a
free-standing entity, but new studies rejected this assumption in order to
better reflect reality.
Static tradition: New IOE models focus on a changing model of industry
evaluation.
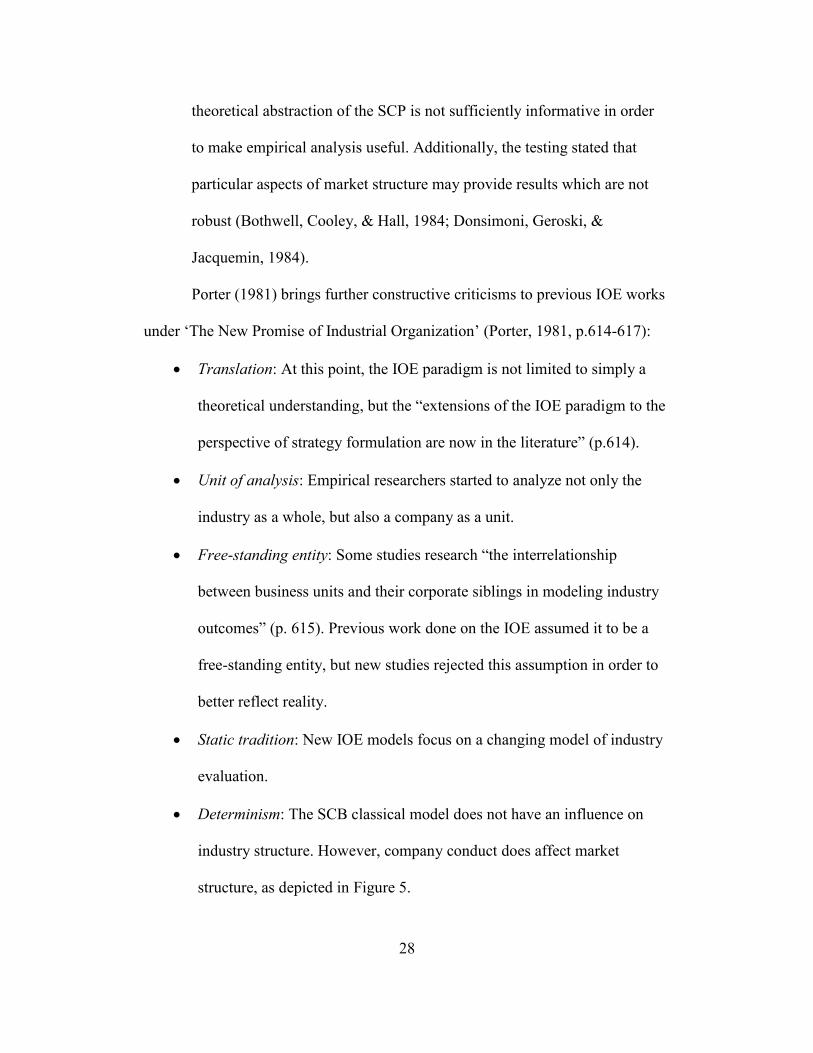
Determinism: The SCB classical model does not have an influence on
industry structure. However, company conduct does affect market
structure, as depicted in Figure 5.
29
Figure 5. The updated version of the SCB.
Note. Adapted from “The Contributions of Industrial Organization to Strategic
Management,” by M. E. Porter, 1981, The Academy of Management Review, 6, p.
616.
Completeness: IOE researchers are introducing an increasingly vast set of
elements within industry structure, which are important for achieving
competitive advantage.
Loss function: Researchers are working to develop new models which
recognize inter-firm and inter-industry differences.
Oligopoly theory: In order to catch the real market condition, some strides
are being made in applying oligopoly and game theory.
Even though Porter (1981) suggested some constructive critiques, he still
acknowledged the SCP framework as the origin of market oriented theory. The
SCP framework under IOE ideas was used by Porter in order to analyze industry
competition and to remedy problems through a strategic methodology including
mobility and entry barrier extensions. 8
8 Mobility barriers can be defined as “a structural attribute of a strategic group that makes it
difficult for firms not already in the group to move in” (Enders, 2004, p.9). According to Porter’s
(1981) definition, “the strategic group concept is that firms within industries can be clustered
according to their strategies, and that their reactions to disturbances and the model of rivalry will
Industry
Structure
Conduct
(Strategy) Performance
30
Market oriented theory. In the late 1970s, the world gained an interest in
Market-Oriented Theory (MOT). In MOT, Porter (1981) equally integrated both
company level ideas and the IOE ideas (industry level ideas). According to his
approach, there can be a theory which simultaneously deals with both an
individual company (as well as its industry) and the broader environment in which
it operates (Porter, 1981). Basically, Porter’s MOT takes into consideration two
factors (Porter, 1985):
The attractiveness of industries that companies seek to enter.
Improvement of the relative competitive position.
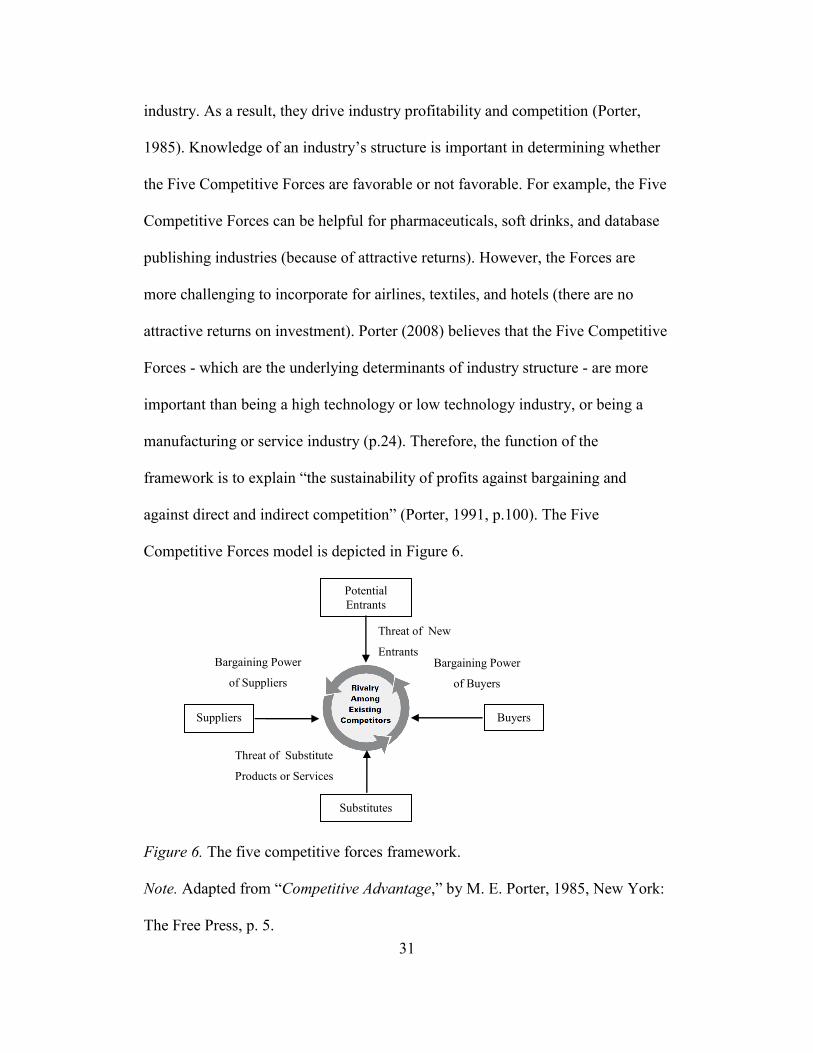
In order to explain these two factors, Porter (1985) developed a well-
known Five Competitive Forces model, which includes: the entry of new
competitors, the threat of substitutes, the bargaining power of buyers, the
bargaining power of suppliers, and the rivalry among existing competitors (p.5).
However, in this model, he did not include internal resources and capabilities. He
assumes that “the relevance of capabilities and resources is reduced by stating that
they are generally homogeneous (due to resource mobility) across companies”
(Enders, 2004, p.10). In essence, the Five Competitive Forces model is a list of
competition rules. In order to achieve a competitive advantage, a company’s
competitive strategy is to change the competition rules. The Five Competitive
Forces affect the prices, costs and required investment of companies in an
be determined by the configuration of groups” (p. 615). Caves and Porter (1977)’s illustrative list
of group-defining traits includes bases of entry barriers: some companies differentiate their
products through advertising and sales promotion, while others do not (p. 252). (Caves & Porter,
From entery barriers to mobility barriers: conjectural decisions and contrived deterrence to new
competition, 1977)
31
industry. As a result, they drive industry profitability and competition (Porter,
1985). Knowledge of an industry’s structure is important in determining whether
the Five Competitive Forces are favorable or not favorable. For example, the Five
Competitive Forces can be helpful for pharmaceuticals, soft drinks, and database
publishing industries (because of attractive returns). However, the Forces are
more challenging to incorporate for airlines, textiles, and hotels (there are no
attractive returns on investment). Porter (2008) believes that the Five Competitive
Forces - which are the underlying determinants of industry structure - are more
important than being a high technology or low technology industry, or being a
manufacturing or service industry (p.24). Therefore, the function of the
framework is to explain “the sustainability of profits against bargaining and
against direct and indirect competition” (Porter, 1991, p.100). The Five
Competitive Forces model is depicted in Figure 6.
Figure 6. The five competitive forces framework.
Note. Adapted from “Competitive Advantage,” by M. E. Porter, 1985, New York:
The Free Press, p. 5.
Threat of New
Entrants
Potential
Entrants
Buyers Suppliers
Substitutes
Bargaining Power
of Buyers
Bargaining Power
of Suppliers
Threat of Substitute
Products or Services
32
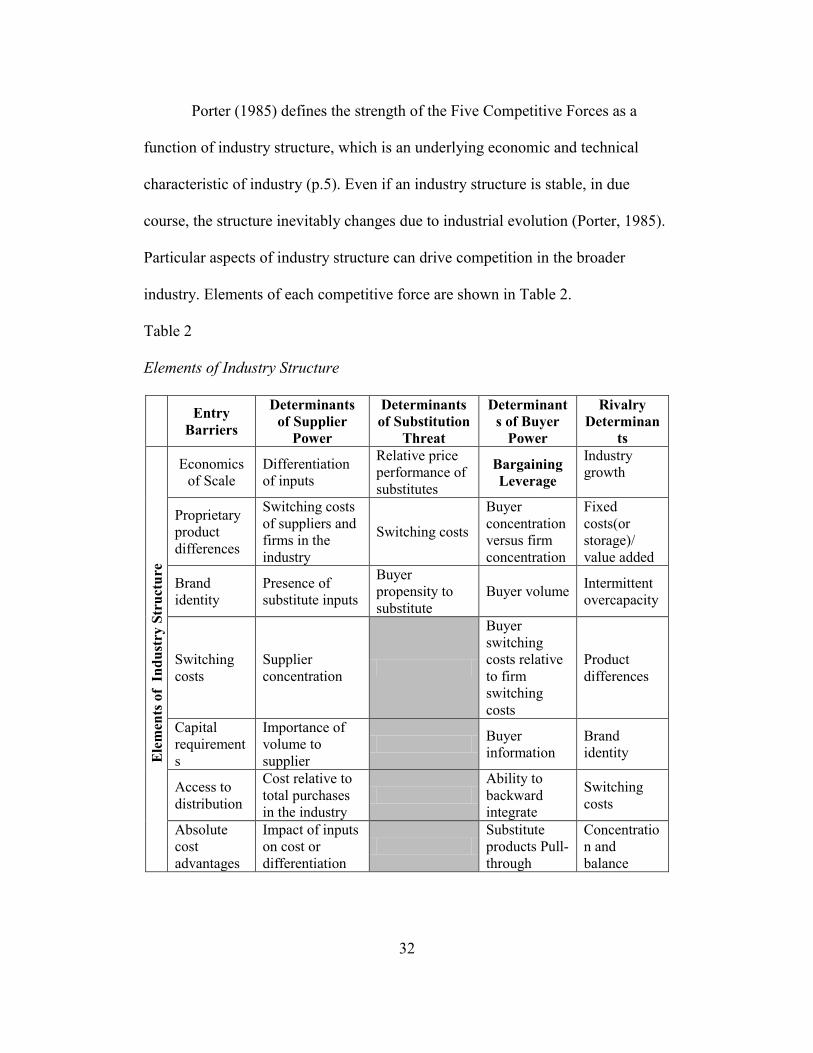
Porter (1985) defines the strength of the Five Competitive Forces as a
function of industry structure, which is an underlying economic and technical
characteristic of industry (p.5). Even if an industry structure is stable, in due
course, the structure inevitably changes due to industrial evolution (Porter, 1985).
Particular aspects of industry structure can drive competition in the broader
industry. Elements of each competitive force are shown in Table 2.
Table 2
2. Elements of Industry Structure
Entry
Barriers
Determinants
of Supplier
Power
Determinants
of Substitution
Threat
Determinant
s of Buyer
Power
Rivalry
Determinan
ts
Ele
men
ts o
f I
nd
ust
ry S
tru
ctu
re
Economics
of Scale
Differentiation
of inputs
Relative price
performance of
substitutes
Bargaining
Leverage
Industry
growth
Proprietary
product
differences
Switching costs
of suppliers and
firms in the
industry
Switching costs
Buyer
concentration
versus firm
concentration
Fixed
costs(or
storage)/
value added
Brand
identity
Presence of
substitute inputs
Buyer
propensity to
substitute
Buyer volume Intermittent
overcapacity
Switching
costs
Supplier
concentration
Buyer
switching
costs relative
to firm
switching
costs
Product
differences
Capital
requirement
s
Importance of
volume to
supplier
Buyer
information
Brand
identity
Access to
distribution
Cost relative to
total purchases
in the industry
Ability to
backward
integrate
Switching
costs
Absolute
cost
advantages
Impact of inputs
on cost or
differentiation
Substitute
products Pull-
through
Concentratio
n and
balance
33
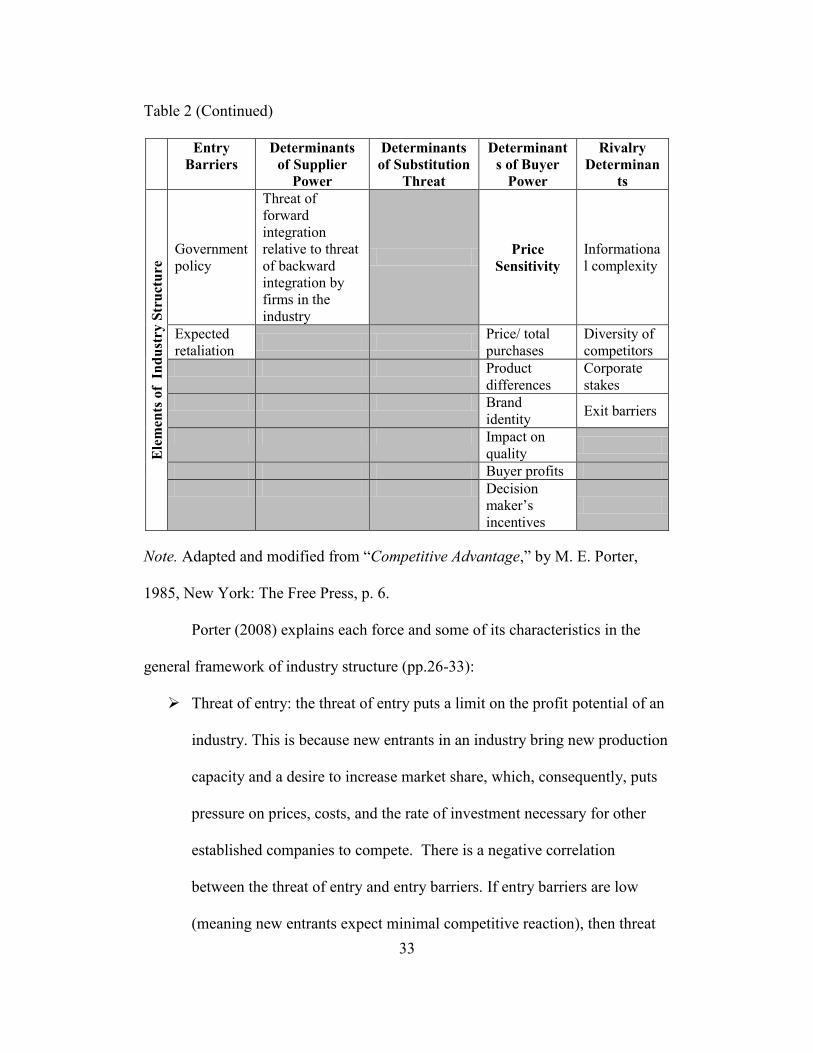
Table 2 (Continued)
Entry
Barriers
Determinants
of Supplier
Power
Determinants
of Substitution
Threat
Determinant
s of Buyer
Power
Rivalry
Determinan
ts
Ele
men
ts o
f I
nd
ust
ry S
tru
ctu
re
Government
policy
Threat of
forward
integration
relative to threat
of backward
integration by
firms in the
industry
Price
Sensitivity
Informationa
l complexity
Expected
retaliation
Price/ total
purchases
Diversity of
competitors
Product
differences
Corporate
stakes
Brand
identity Exit barriers
Impact on
quality
Buyer profits
Decision
maker’s
incentives
Note. Adapted and modified from “Competitive Advantage,” by M. E. Porter,
1985, New York: The Free Press, p. 6.
Porter (2008) explains each force and some of its characteristics in the
general framework of industry structure (pp.26-33):
Threat of entry: the threat of entry puts a limit on the profit potential of an
industry. This is because new entrants in an industry bring new production
capacity and a desire to increase market share, which, consequently, puts
pressure on prices, costs, and the rate of investment necessary for other
established companies to compete. There is a negative correlation
between the threat of entry and entry barriers. If entry barriers are low
(meaning new entrants expect minimal competitive reaction), then threat
34
of entry is high and industry profitability is moderated. For instance, when
the threat is high, then current companies in the industry decrease their
prices or increase their investment costs to deter new entrants (e.g. low
entry barriers resulted in Starbucks needing to invest aggressively in
modernization of stores and menus – which means high threat of entry).
Entry barriers are an advantage for current companies in the industry.
There are seven major sources of entry barriers (Porter, 2008, p. 26-28):
(1) Supply-side economies of scale: “[D]eter entry by forcing the aspiring
entrant either to come into the industry on a large scale, which requires
dislodging entrenched competitors, or to accept a cost disadvantage”
(p.26).
(2) Demand-side benefits of scale (also known as network effects):
“[D]iscourage entry by limiting the willingness of customers to buy
from a newcomer and by reducing the price the newcomer can
command until it builds up a large base of customers” (p.27).
(3) Customer switching costs (also known as fixed costs): Put a cap on the
number of customers that new entrants can gain.
(4) Capital investments: Deter new entrants by requiring investments of
large financial resources in order to compete.
(5) Incumbency advantages independent of size: “[I]ncumbents have
quality or cost advantages not available to potential rivals” (p.27). The
sources of these advantages are “proprietary technology, preferential
access to the best raw material sources, preemption of the most
35
favorable geographic locations, established brand identities, or
cumulative experience that has allowed incumbents to learn how to
produce more efficiently” (p.27).
(6) Unequal access to distribution channels: Deter new entrants by
limiting wholesale or retail channels, which already have pre-
established collaboration with incumbents.
(7) Restrictive government policy: Limits or even forecloses entry into
industries through licensing requirements or restrictions on foreign
investment.
Monopoly of suppliers: Powerful suppliers capture more value for
themselves by increasing prices, limiting quality or services, or shifting
costs to industry participants. They can also generate profitability out of an
industry that increases cost in its own prices. Companies depend on
different supplier groups for inputs. The following factors show that a
supplier group is very powerful, because (Porter, 2008, p.29-30):
A supplier group is more concentrated than an industry. This
means it can have monopoly power, e.g. Microsoft is considered to
have a monopoly in providing operating systems.
In terms of revenue, a supplier group does not depend solely on an
industry.
There are switching costs in changing suppliers. If switching costs
are high, then companies (incumbents) find it hard to play
suppliers off against one another.
36
There is no substitute for a supplier group’s product(s) or
service(s).
If an industry is gaining profitability relative to suppliers,
companies in the industry unintentionally cause a supplier group to
increase its competitive strategy, at the expense of the industry.
The power of buyers: Powerful buyers - which are the flip side of
powerful suppliers - can capture more value by forcing down prices and
demanding better quality. If customers are price sensitive and can demand
price reduction, then buyers are more powerful. In the following
conditions, a customer group can have negotiating leverage (Porter, 2008,
p.30):
“Large-volume buyers are powerful in industries with high fixed
costs” (p.30).
“If buyers can always find another equivalent product, they can
play one vendor against another” (p.30).
“Buyers face few switching costs in charging vendors” (p.30).
“Buyers can credibly threaten to integrate backward and produce
the industry’s product themselves, if vendors are too profitable”
(p.30).
The threat of substitutes: “A substitute performs the same or a similar
function as an industry’s product by a different means” (e.g. video
conferencing instead of travel, plastic instead of aluminum, email instead
of express mail) (Porter, 2008, p.31). When the threat of substitute is high,
37
industry profitability suffers, because substitute products bring limitations
to industry profitability by placing a ceiling on prices. The threat of a
substitute depends on the attractive price performance trade-off as well as
low switching cost to the substitute (Porter, 2008).
Rivalry among existing competitors: Price discounting, new product
introductions, advertising campaigns, and service improvements all
constitute opportunities for rivalry between competitors. A high level of
rivalry puts a cap on overall industrial profitability. The intensity of rivalry
is primarily based on: numerous competitors, slow industrial growth
(which creates fights for more market share), high exit barriers, strategic
goals, and invisibility of company strategy (Porter, 2008).
The five competitive forces framework can be applied at the level of
industry, a strategic group, or an individual company (Porter, 1991).
Resource-based model. A resource-based model is a parallel structure of
the IOE. Mahoney and Pandian (1992) emphasize that the RBM is
complementary to the SCP (Bain, 1968) and the MOT (Porter, 1985, p.371). The
origin of the RBM is neoclassical microeconomics (Penrose, 1959; Mahoney &
Pandian, 1992; Bogner, Mahoney, & Thomas, 1998; Barney, 2001).9 However,
there is controversy between some studies in terms of the reasons of the
development of the RBM. In one opinion, the RBM was developed from
dissatisfaction with neoclassical economics (Mahoney & Pandian, 1992; Bogner,
9 Neo-classical economics (micro economics – neo-classical price theory) “focuses on how market
forces determine the quantity, quality, and price of goods and service sold in a market” (Barney,
2001,p. 644).
38
Mahoney, & Thomas, 1998). Further explained, Mahoney and Pandian (1992)
claim that the paradox of neoclassical microeconomic theory is that “[a] company
need not exist” (p.369). Neoclassical economics disregards transaction costs,
limits on rationality, technological uncertainty, consumer or producer learning,
and prices as signals of quality. Pricing alone is not sufficient material to generate
accurate statistics, and the static equilibrium approach does not address the
competitive advantage process (Mahoney & Pandian, 1992). In an opposing
opinion, Barney (2001) asserts that “the advantages of positioning the RBM
relative to neo-classical microeconomics are so significant” (p.645). In the context
of his perspective, neo-classical theory and the RBM have many of the same
assumptions, such as: economic factors are limited rational utility maximizers;
markets can vary in their competitiveness; information can vary in how it is
diffused across a market, etc. (Barney, 2001). In other words, while one
interpretation argues that the RBM was developed because of dissatisfaction of
neoclassical microeconomics, the other side alleges that the RBM and
neoclassical microeconomics have similar components. No doubt, the controversy
between these two theories will continue with new insights and arguments.
However, despite the controversy, it is universally agreed upon that – at least the
origin - of the RBM depends on neo-classical microeconomics.
The RBM demonstrates how competitive advantage can occur if a
company applies a value creating strategy which is not being used by current or
potential competitors; and, furthermore, competitors are unable to duplicate the
benefits of the strategy (O'Shannassy, 2008, Barney, 1991). Companies are
39
fundamentally diversified in terms of their resources and internal capabilities
(Barney, 1991). According to Barney (1991), company resources must have at
least four common attributes, which were previously shown in Figure 5 (Barney,
1991). Resources:
must be valuable – meaning that they illuminate opportunities in a
company’s environment;
must be rare - among a firm’s current and potential competition;
must be imperfectly imitable; and
must not have strategically equivalent substitutes for this resource.
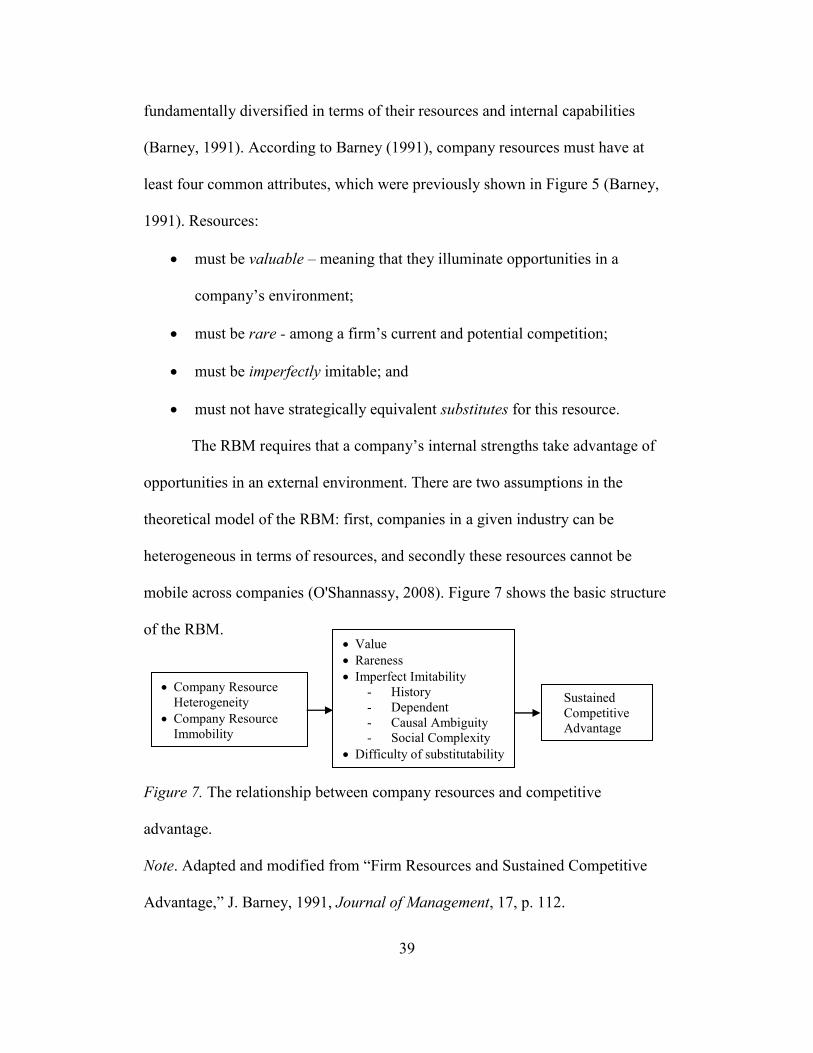
The RBM requires that a company’s internal strengths take advantage of
opportunities in an external environment. There are two assumptions in the
theoretical model of the RBM: first, companies in a given industry can be
heterogeneous in terms of resources, and secondly these resources cannot be
mobile across companies (O'Shannassy, 2008). Figure 7 shows the basic structure
of the RBM.
Figure 7. The relationship between company resources and competitive
advantage.
Note. Adapted and modified from “Firm Resources and Sustained Competitive
Advantage,” J. Barney, 1991, Journal of Management, 17, p. 112.
Value
Rareness
Imperfect Imitability
- History
- Dependent
- Causal Ambiguity
- Social Complexity
Difficulty of substitutability
Company Resource
Heterogeneity
Company Resource
Immobility
Sustained
Competitive
Advantage
40
According to the RBM, a company is a collection of resources and
capabilities, which facilitate product/market competition (Amit & Schoemaker,
1993). Company capabilities “refer to a company’s capacity to deploy resources,
usually in combination, using organizational process, to affect a desired end”
(Amit & Schoemaker, 1993, p.35). Company resources are “a stock of available
factors that are owned or controlled by the company” (Amit & Schoemaker,
1993). Also, “company resources at a given time could be defined as tangible and
intangible assets which are tied semi-permanently to the company” (Wernerfelt,
1984). In this regard, a company’s resources include brand names, in-house
knowledge of technology, employment of skilled personnel, trade contracts,
machinery, efficient procedures, capital, etc. (Wernerfelt, 1984). According to
Barney (1991), company resources can be classified into three categories:
(1) Physical capital resources - include the physical technology used in a
company, the company’s plant and equipment, its geographic location, and
its access to raw materials.
(2) Human capital resources - include the training, experience, judgment,
knowledge, intelligence, relationships, and insight of individual managers
and workers in a company.
(3) Organizational capital resources - include a company’s formal reporting
structure, its formal and informal planning, controlling, and coordinating
systems, as well as informal relations among groups within a company and
between a company and those in its environment.
41
Another company resource classification method was outlined by Grant
(1995). According to Grant (1995), there are three types of company resources in
a company environment (which are illustrated in Figure 8):
(1) Tangible resources - the resources which are easiest to identify and valued
in the company’s financial statements. These include both financial and
physical resources (Grant, 1995).
(2) Intangible resources - defined as “a company’s image or its scientific and
technological knowledge” (Del Canto & Gonzales, 1999). These are
difficult resources to detect and evaluate for competitors because they are
invisible assets, and not on printed reports (Barney, 1991). Intangible
resources determine two capacities, including the absorptive capacity,
which is “the ability to recognize and exploit technological opportunities
from outside,” as well as the transformative capacity, which is “the ability
to continually redefine a product portfolio based on technological
opportunities created within a company” (Del Canto & Gonzales, 1999).
Intangible resources include technology and commercial resources (Del
Canto & Gonzales, 1999).
(3) Human resources - classified as resources which “offer to the company
their skills, knowledge, and reasoning and decision-making abilities”
(Grant, 1995, p.125). A talented, quality workforce is a more important
source of competitive advantage for companies. The importance of quality
employees as a key to a company’s competitive advantage, because the
key to company success is now associated with a company’s ability to
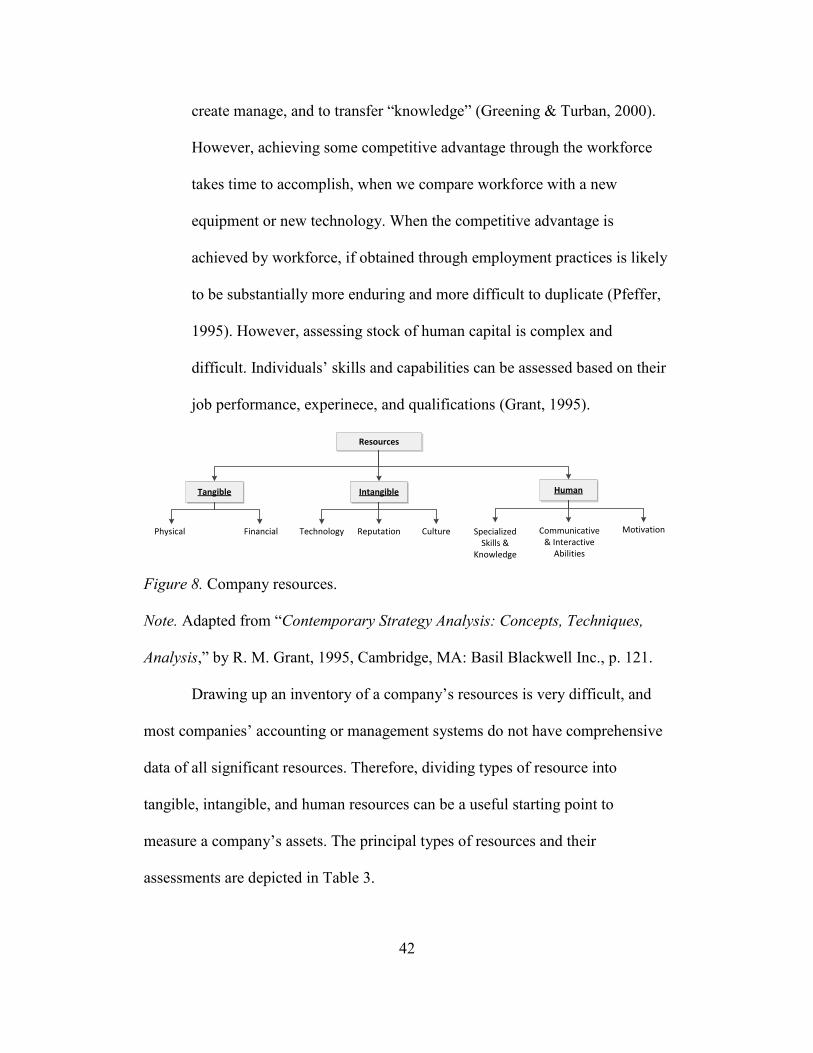
42
create manage, and to transfer “knowledge” (Greening & Turban, 2000).
However, achieving some competitive advantage through the workforce
takes time to accomplish, when we compare workforce with a new
equipment or new technology. When the competitive advantage is
achieved by workforce, if obtained through employment practices is likely
to be substantially more enduring and more difficult to duplicate (Pfeffer,
1995). However, assessing stock of human capital is complex and
difficult. Individuals’ skills and capabilities can be assessed based on their
job performance, experinece, and qualifications (Grant, 1995).
Figure 8. Company resources.
Note. Adapted from “Contemporary Strategy Analysis: Concepts, Techniques,
Analysis,” by R. M. Grant, 1995, Cambridge, MA: Basil Blackwell Inc., p. 121.
Drawing up an inventory of a company’s resources is very difficult, and
most companies’ accounting or management systems do not have comprehensive
data of all significant resources. Therefore, dividing types of resource into
tangible, intangible, and human resources can be a useful starting point to
measure a company’s assets. The principal types of resources and their
assessments are depicted in Table 3.
Resources
Tangible
Physical Financial
Intangible
CultureTechnology Reputation
Human
MotivationSpecialized Skills &
Knowledge
Communicative & Interactive
Abilities
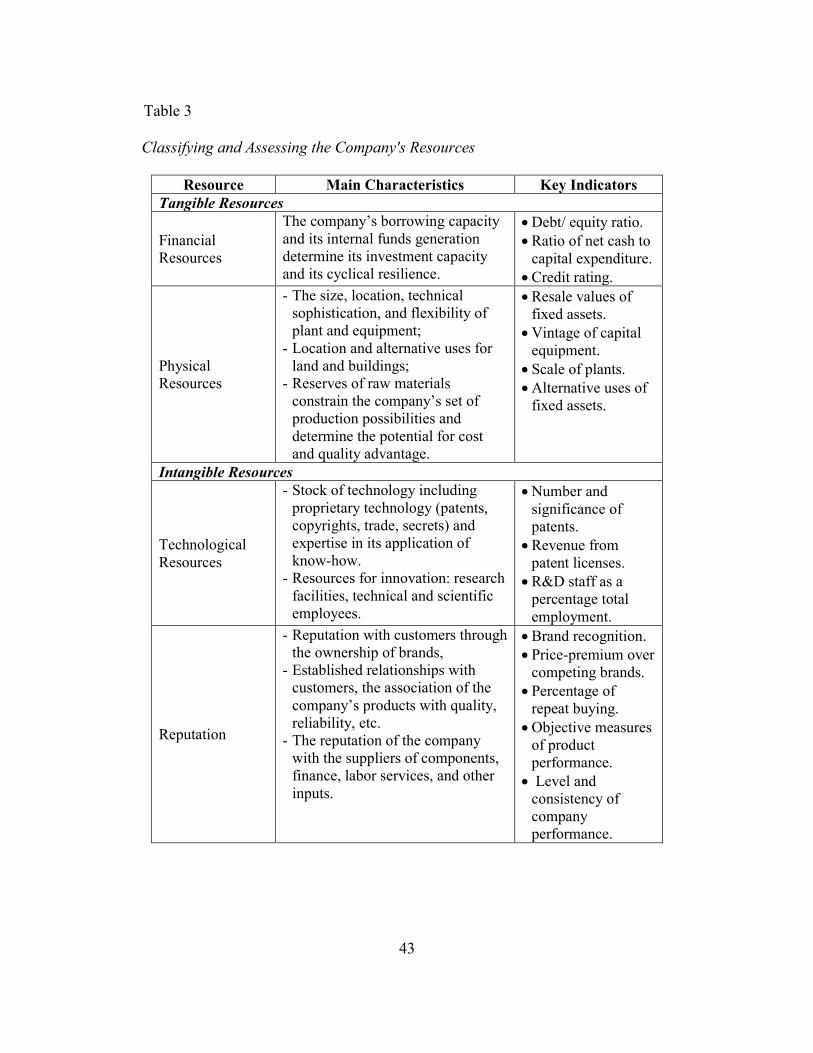
43
Table 3
3. Classifying and Assessing the Company's Resources
Resource Main Characteristics Key Indicators
Tangible Resources
Financial
Resources
The company’s borrowing capacity
and its internal funds generation
determine its investment capacity
and its cyclical resilience.
Debt/ equity ratio.
Ratio of net cash to
capital expenditure.
Credit rating.
Physical
Resources
- The size, location, technical
sophistication, and flexibility of
plant and equipment;
- Location and alternative uses for
land and buildings;
- Reserves of raw materials
constrain the company’s set of
production possibilities and
determine the potential for cost
and quality advantage.
Resale values of
fixed assets.
Vintage of capital
equipment.
Scale of plants.
Alternative uses of
fixed assets.
Intangible Resources
Technological
Resources
- Stock of technology including
proprietary technology (patents,
copyrights, trade, secrets) and
expertise in its application of
know-how.
- Resources for innovation: research
facilities, technical and scientific
employees.
Number and
significance of
patents.
Revenue from
patent licenses.
R&D staff as a
percentage total
employment.
Reputation
- Reputation with customers through
the ownership of brands,
- Established relationships with
customers, the association of the
company’s products with quality,
reliability, etc.
- The reputation of the company
with the suppliers of components,
finance, labor services, and other
inputs.
Brand recognition.
Price-premium over
competing brands.
Percentage of
repeat buying.
Objective measures
of product
performance.
Level and
consistency of
company
performance.
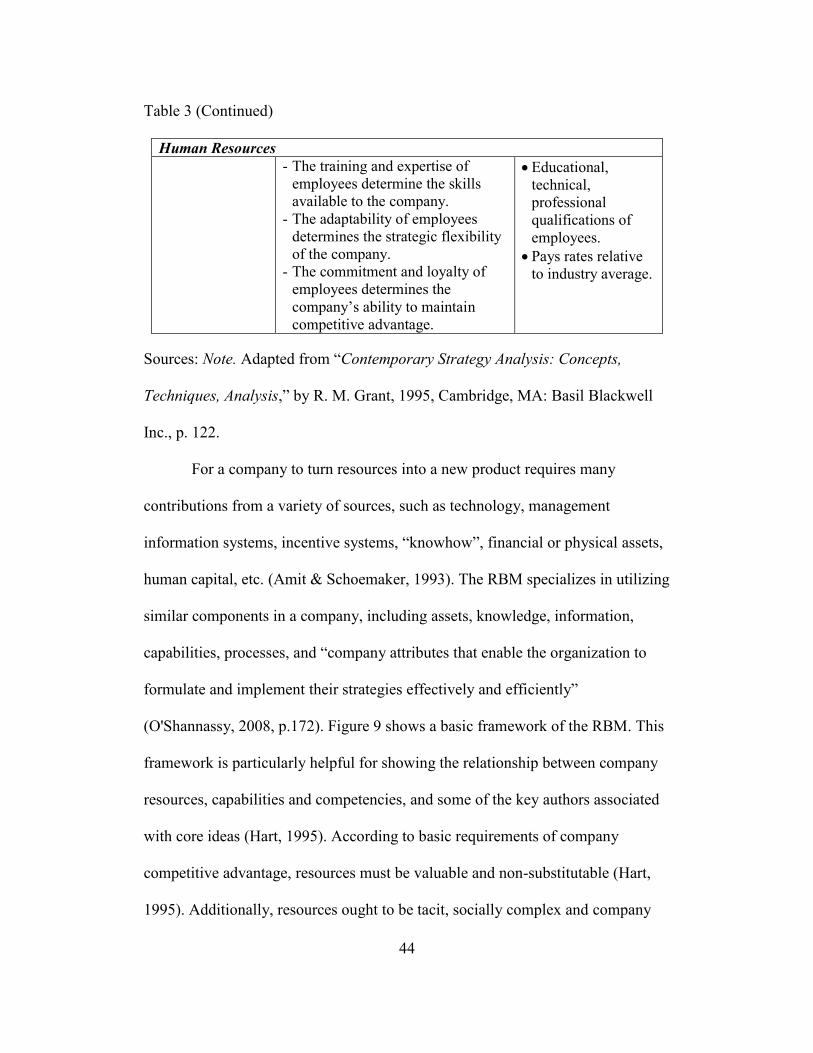
44
Table 3 (Continued)
Human Resources
- The training and expertise of
employees determine the skills
available to the company.
- The adaptability of employees
determines the strategic flexibility
of the company.
- The commitment and loyalty of
employees determines the
company’s ability to maintain
competitive advantage.
Educational,
technical,
professional
qualifications of
employees.
Pays rates relative
to industry average.
Sources: Note. Adapted from “Contemporary Strategy Analysis: Concepts,
Techniques, Analysis,” by R. M. Grant, 1995, Cambridge, MA: Basil Blackwell
Inc., p. 122.
For a company to turn resources into a new product requires many
contributions from a variety of sources, such as technology, management
information systems, incentive systems, “knowhow”, financial or physical assets,
human capital, etc. (Amit & Schoemaker, 1993). The RBM specializes in utilizing
similar components in a company, including assets, knowledge, information,
capabilities, processes, and “company attributes that enable the organization to
formulate and implement their strategies effectively and efficiently”
(O'Shannassy, 2008, p.172). Figure 9 shows a basic framework of the RBM. This
framework is particularly helpful for showing the relationship between company
resources, capabilities and competencies, and some of the key authors associated
with core ideas (Hart, 1995). According to basic requirements of company
competitive advantage, resources must be valuable and non-substitutable (Hart,
1995). Additionally, resources ought to be tacit, socially complex and company
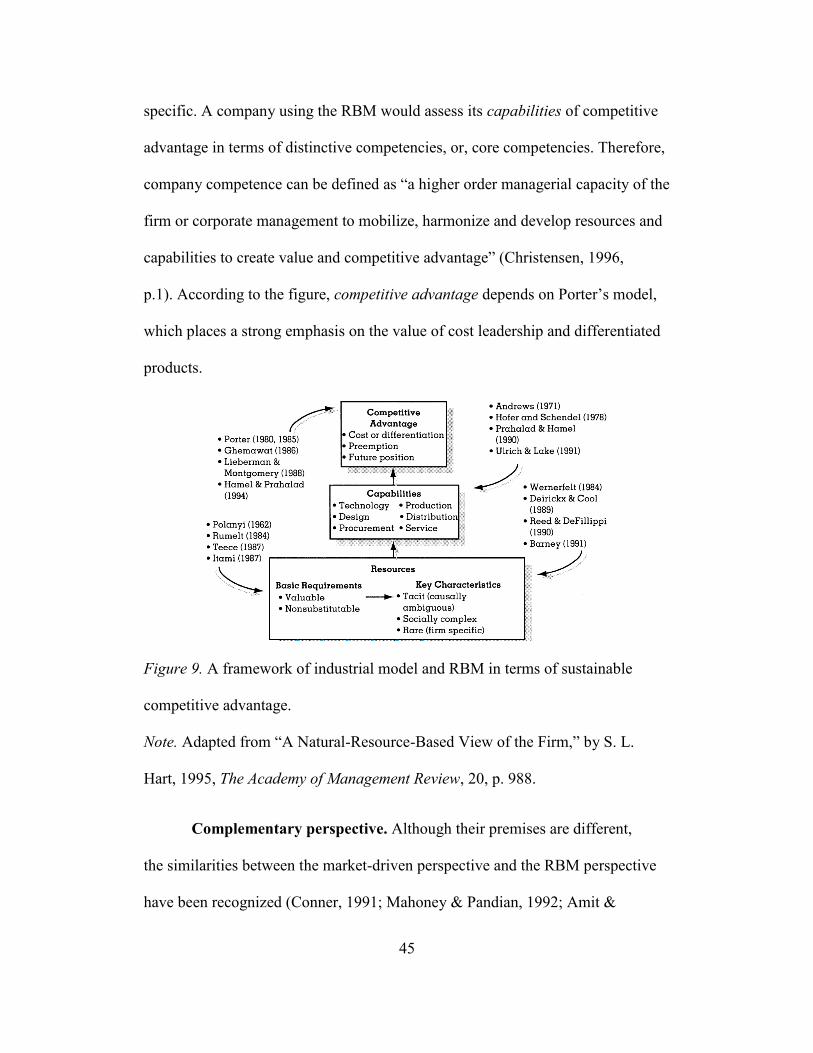
45
specific. A company using the RBM would assess its capabilities of competitive
advantage in terms of distinctive competencies, or, core competencies. Therefore,
company competence can be defined as “a higher order managerial capacity of the
firm or corporate management to mobilize, harmonize and develop resources and
capabilities to create value and competitive advantage” (Christensen, 1996,
p.1). According to the figure, competitive advantage depends on Porter’s model,
which places a strong emphasis on the value of cost leadership and differentiated
products.
Figure 9. A framework of industrial model and RBM in terms of sustainable
competitive advantage.
Note. Adapted from “A Natural-Resource-Based View of the Firm,” by S. L.
Hart, 1995, The Academy of Management Review, 20, p. 988.
Complementary perspective. Although their premises are different,
the similarities between the market-driven perspective and the RBM perspective
have been recognized (Conner, 1991; Mahoney & Pandian, 1992; Amit &
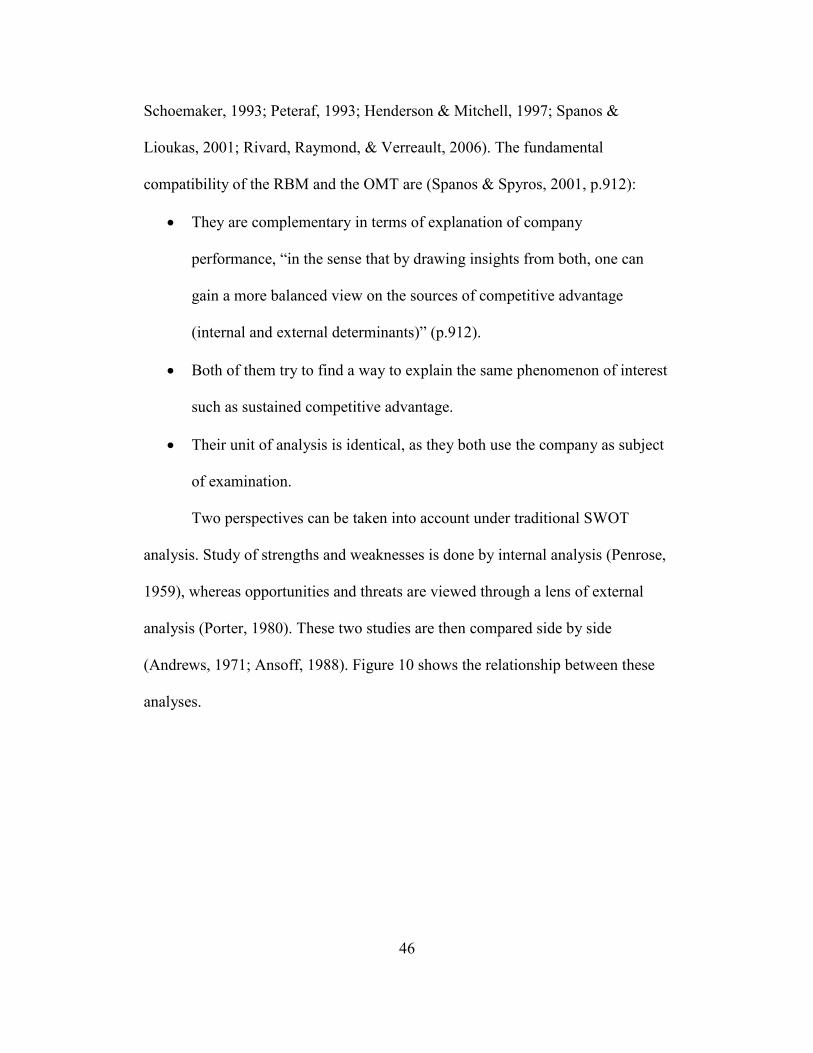
46
Schoemaker, 1993; Peteraf, 1993; Henderson & Mitchell, 1997; Spanos &
Lioukas, 2001; Rivard, Raymond, & Verreault, 2006). The fundamental
compatibility of the RBM and the OMT are (Spanos & Spyros, 2001, p.912):
They are complementary in terms of explanation of company
performance, “in the sense that by drawing insights from both, one can
gain a more balanced view on the sources of competitive advantage
(internal and external determinants)” (p.912).
Both of them try to find a way to explain the same phenomenon of interest
such as sustained competitive advantage.
Their unit of analysis is identical, as they both use the company as subject
of examination.
Two perspectives can be taken into account under traditional SWOT
analysis. Study of strengths and weaknesses is done by internal analysis (Penrose,
1959), whereas opportunities and threats are viewed through a lens of external
analysis (Porter, 1980). These two studies are then compared side by side
(Andrews, 1971; Ansoff, 1988). Figure 10 shows the relationship between these
analyses.
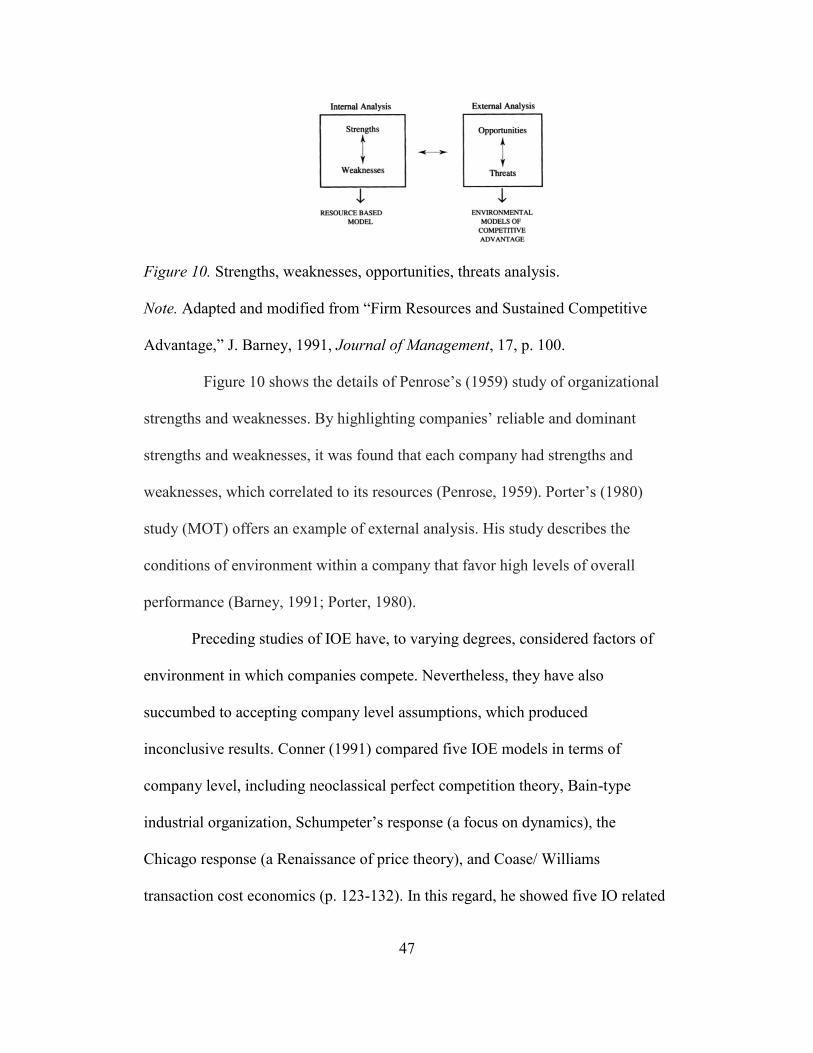
47
Figure 10. Strengths, weaknesses, opportunities, threats analysis.
Note. Adapted and modified from “Firm Resources and Sustained Competitive
Advantage,” J. Barney, 1991, Journal of Management, 17, p. 100.
Figure 10 shows the details of Penrose’s (1959) study of organizational
strengths and weaknesses. By highlighting companies’ reliable and dominant
strengths and weaknesses, it was found that each company had strengths and
weaknesses, which correlated to its resources (Penrose, 1959). Porter’s (1980)
study (MOT) offers an example of external analysis. His study describes the
conditions of environment within a company that favor high levels of overall
performance (Barney, 1991; Porter, 1980).
Preceding studies of IOE have, to varying degrees, considered factors of
environment in which companies compete. Nevertheless, they have also
succumbed to accepting company level assumptions, which produced
inconclusive results. Conner (1991) compared five IOE models in terms of
company level, including neoclassical perfect competition theory, Bain-type
industrial organization, Schumpeter’s response (a focus on dynamics), the
Chicago response (a Renaissance of price theory), and Coase/ Williams
transaction cost economics (p. 123-132). In this regard, he showed five IO related
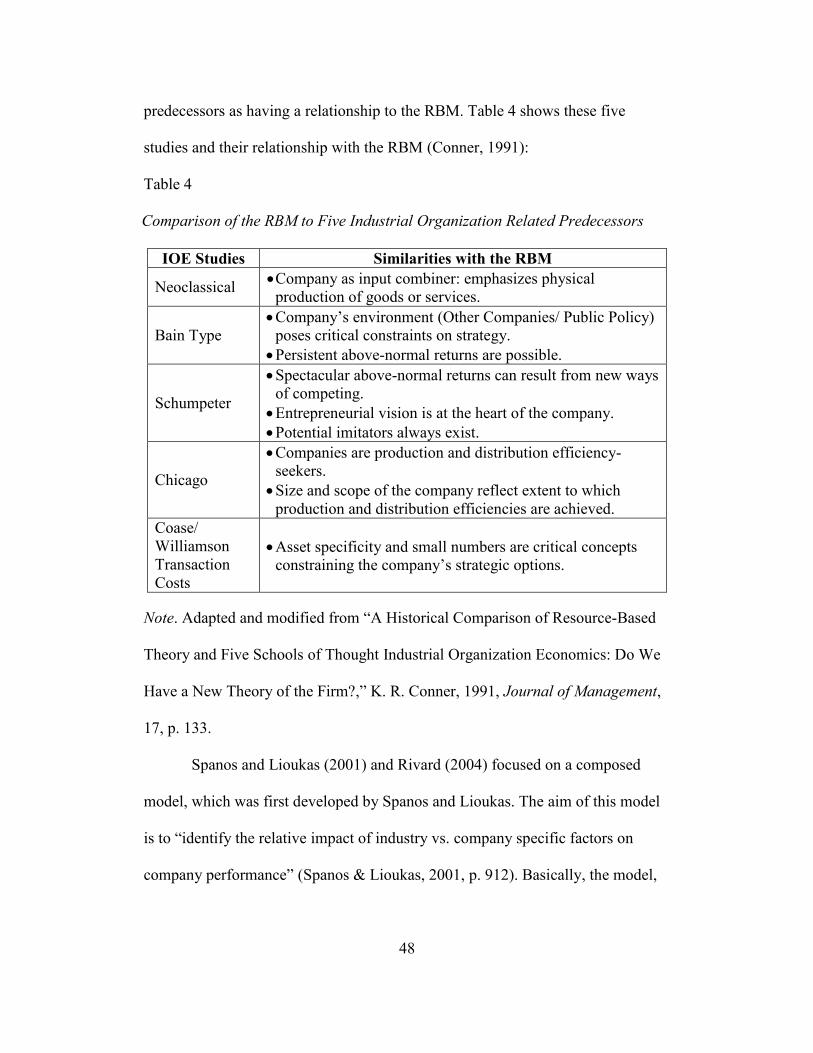
48
predecessors as having a relationship to the RBM. Table 4 shows these five
studies and their relationship with the RBM (Conner, 1991):
Table 4
4. Comparison of the RBM to Five Industrial Organization Related Predecessors
IOE Studies Similarities with the RBM
Neoclassical Company as input combiner: emphasizes physical
production of goods or services.
Bain Type
Company’s environment (Other Companies/ Public Policy)
poses critical constraints on strategy.
Persistent above-normal returns are possible.
Schumpeter
Spectacular above-normal returns can result from new ways
of competing.
Entrepreneurial vision is at the heart of the company.
Potential imitators always exist.
Chicago
Companies are production and distribution efficiency-
seekers.
Size and scope of the company reflect extent to which
production and distribution efficiencies are achieved.
Coase/
Williamson
Transaction
Costs
Asset specificity and small numbers are critical concepts
constraining the company’s strategic options.
Note. Adapted and modified from “A Historical Comparison of Resource-Based
Theory and Five Schools of Thought Industrial Organization Economics: Do We
Have a New Theory of the Firm?,” K. R. Conner, 1991, Journal of Management,
17, p. 133.
Spanos and Lioukas (2001) and Rivard (2004) focused on a composed
model, which was first developed by Spanos and Lioukas. The aim of this model
is to “identify the relative impact of industry vs. company specific factors on
company performance” (Spanos & Lioukas, 2001, p. 912). Basically, the model,
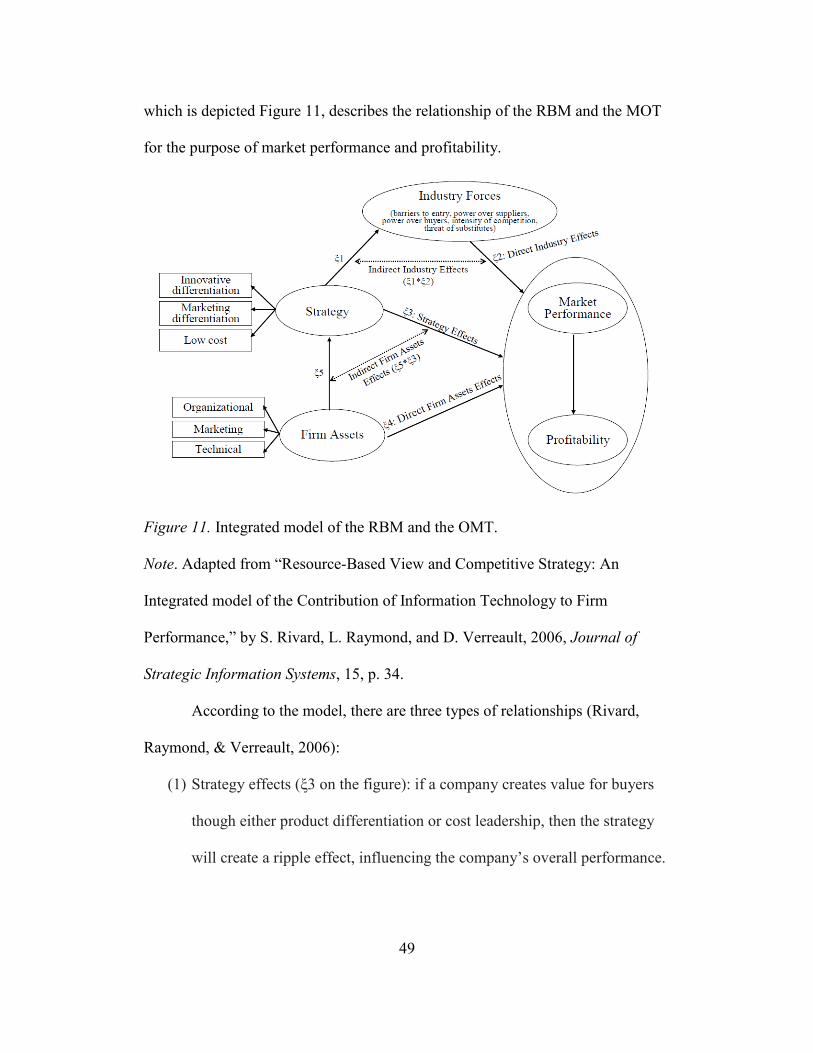
49
which is depicted Figure 11, describes the relationship of the RBM and the MOT
for the purpose of market performance and profitability.
Figure 11. Integrated model of the RBM and the OMT.
Note. Adapted from “Resource-Based View and Competitive Strategy: An
Integrated model of the Contribution of Information Technology to Firm
Performance,” by S. Rivard, L. Raymond, and D. Verreault, 2006, Journal of
Strategic Information Systems, 15, p. 34.
According to the model, there are three types of relationships (Rivard,
Raymond, & Verreault, 2006):
(1) Strategy effects (ξ3 on the figure): if a company creates value for buyers
though either product differentiation or cost leadership, then the strategy
will create a ripple effect, influencing the company’s overall performance.
50
(2) Industry effects (ξ1 and ξ2 on the figure): Industry effects encompass the
competitive strategy perspective components of the model. It includes
direct (ξ1) and indirect (ξ2) effects on market performance and
profitability. ξ2 is the result of strategic positioning in the industry in
order to protect the company against competitive forces. The company’s
offensive strategy (ξ1) “influences the relative balance of the competitive
forces that the company confronts” (Spanos & Lioukas, 2001, p.913).
(3) Assets effects (ξ4 and ξ5): assets effects have two extensions, which
include first, an efficiency effect (ξ4), which is “ the impact on
performance that results from the possession of a superior stock of
available resources” (Rivard, Raymond, & Verreault, 2006, p.34). A
second effect (ξ5) of company assets pertains to the impact of assets on a
strategy. Company assets enhance a company’s ability to have competitive
strategy in terms of product differentiation and cost leadership (Rivard,
Raymond, & Verreault, 2006).
Also in this model, is a combined effect (ξ3 ξ5) resulting in modification
and/or development of available resources (Rivard, Raymond, & Verreault,
2006).
Although the RBM and the MOT strategies can be complementary, they
are distinct in their motive goals: the MOT’s principal aim is to identify relative
impact on industry, while the RBM's is to identify relative impact on a company
(Spanos & Lioukas, 2001).
51
Summary
In considering the strategic management concept, the most fundamental
question asks how can companies achieve and sustain competitive advantage.
Until now, the answers have been vague in methodology and lacking in practical
applications. Generally speaking, competitive advantage is achieved when a
company applies a value created strategy which is not already being applied at the
same time by current or potential competitors, and the competitors are unable to
duplicate the benefits of this exact strategy (Barney, 1991; Sirmon, Hitt, &
Ireland, 2007; O'Shannassy, 2008). In order to gain a better understanding of how
to achieve a sustainable competitive advantage based on empirical investigation,
researchers take internal company resources and external competitive
environment into consideration.
The external environment in which companies compete is continuously
changing, due to factors such as the actions of its customers, partnerships with
suppliers, and marketing of competitors. In order to determine how companies
successfully achieve sustainable competitive advantage, company internal and
external components are isolated and studied by a strategic management field.
Accordingly, two major frameworks are taken into account, the MOT, which
focuses on a company's external environment and the RBM, which focuses on
company internal resources and capabilities. Although these two perspectives
originated from different perspectives and focus on different factors, they are
coordinating ideas and they share the same ultimate goal. Hence, some of the
studies recognize that these two perspectives are complementary, and each of the
52
components of these perspectives affects each other. In this study, the SSAF
focuses on company environment, internal resources, and capabilities in order to
identify how these factors, along with their related models (RBM and OMT)
influence competitive advantage.
53
CHAPTER 3
METHODOLOGY
As noted in Chapter 1 and Chapter 2, strategic management has been
studied since its inception. Strategic management seeks to answer the
fundamental question of how a company can achieve sustainable competitive
advantage (Herrmann, 2005). There are two main applications that have been
drawn from strategic management, both of which lead to a competitive advantage:
The Market-Oriented Theory (MOT) highlights the importance of competitive
strategy, and internalizes the industry structure and attractiveness of a company’s
competitive position, and the Resource-Based Model (RBM) emphasizes that
company resources drive value creation. These two approaches are like two sides
of the same medallion. However, even a complementary perspective of these two
approaches still leaves a void in terms of explaining how a company uses
resources and capabilities, and how it can determine the best competitive strategy
in order to create a competitive advantage. There has been little research done on
the complementary perspective of the MOT and the RBM in the form of a
cooperative modeling framework.
The primary purpose of this study is to lay the groundwork for the SSAF.
The SSAF, which consists of a set of six models, aids in the evaluation and
assessment of current and future strategic positioning of Small and Medium
Enterprises (SMEs). The study investigates the relationships among a company’s
resources, capabilities, and performance. In correlation, a secondary purpose of
this study includes a refined focus on the models. To this end, of the six
54
theoretical models that are considered, only one is investigated in depth (R&D
activities model). Causality of the relationships is claimed only within the models
and not between the models within the SSAF. The models are:
(1) R&D activities model: attempts to explain the relationships between (1)
company inputs and company capabilities, and (2) company capabilities
and company outputs. For the purposes of this study, the inputs consist of
company tangible resources (company equity, debt, size, and capital
intensity), company intangible resources (R&D collaboration, process
improvement, marketing orientation, and commercial), and human
resources (R&D workforce and learning orientation). The capabilities
consist of basic research, applied research, and experimental research. The
outputs consist of product innovation, process innovation, process
improvement and technology adoption. R&D activities, which carry out
internal company innovative activities, are precursors to new product or
new process development for a company.
(2) Product innovation model: attempts to explain the relationship between
inputs and outputs. For the purposes of this study, inputs include tangible
resources (e.g. R&D expenses -company equity and/or debt, company
equipment, and company size); intangible resources (e.g. R&D activities,
company/brand reputation, communication channel(s), distribution and
sales channel(s), knowledge of customer needs, and process
improvement); human resources (e.g. qualified workforce). The outputs
include anything related to company export sales. This model is included
55
for consideration in this study, but its effects should be further evaluated
in future research. Product innovation is the adoption of technologically
new or significantly improved “product whose technological
characteristics or intended uses differ significantly from those of
previously produced products” (OECD, 2005, p. 32).
(3) Process innovation model: attempts to explain the relationship between
inputs and outputs. For the purposes of this study, the inputs include
tangible resources (e.g. R&D expenses – company equity/or debt, and
company size); intangible resources (e.g. R&D activities and process
improvement); and human resources (e.g. qualified workforce). The
outputs include company export sales. Process innovation “is the adoption
of technologically new or significantly improved production methods,
including methods of product delivery” (OECD, 2005, p. 32).
(4) Technology adoption model: attempts to explain the relationship between
(1) company inputs and technology adoption, (2) environmental influences
and technology adoption, and (3) technology adoption and the outputs. For
the purposes of this study, the inputs include tangible resources (e.g.
company equity, cost of capital, debt, size, age, and manufacturing
technology uncertainty); intangible resources (e.g. R&D intensity, process
improvement, product innovation, and process innovation); and human
resources (e.g. top management commitments, soft integration, technical
skills, and worker empowerment). The environmental influences include
demand uncertainty, supplier uncertainty, cost competitive, export
56
orientation, other organizations’ information, and supply chain
information. The outputs include company performance (e.g. reduction of
cost of reworks, reduction cost of direct man power, R&D intensity, and
export). Technology adoption is a process to establish a new or different
production process. Technology adoption affects a company’s production
and knowledge absorptive capacity. Small and medium companies,
especially, tend to adopt new technology, rather than pursue new
development by themselves, due to a high risk and high cost (Farzin,
Huisman, & Kort, 1998).
(5) Operational excellence model (process improvement): attempts to explain
the relationship between inputs and outputs. For the purposes of this study,
the inputs include tangible resources (e.g. company size); intangible
resources (e.g. technical information and communication); and human
resources (e.g. qualified workforce). The outputs include critical success
factors (e.g. reduction of cycle time and reduction of cost). “Operational
excellence is the goal of conducting business in a manner that improves
quality obtains higher yields, faster through put, and less waste” (Adkins,
2007, p.52).
(6) Global engagement model: attempts to explain the relationship between
inputs and outputs. For the purposes of this study, the inputs include
tangible resources (e.g. company size and original equipment
manufacturer(s) or supplier(s)); intangible resources (e.g. competition and
export experience); and human resources (e.g. dedicated export staff). The
57
outputs include export sales. The global engagement “involves creating a
business advantage through people, partnership and systems that can open
doors to global markets, talent and resources” (Urbain, 2011, p. 28).
Should conclusions of the study show that some strategic actions are
highly related to competitive performance, the chasm between academic research
and practice will be narrowed due to their cooperative effect. This chapter
describes the methodology, design, and procedures used in answering the
following key research question for the R&D activities model development within
the SSAF:
Do company R&D inputs (tangible, intangible and human resources)
affect R&D activities (basic research, applied research, and experimental
development)?
Research Design
This study uses quantitative research instead of qualitative research
(because this study does not need to investigate in what way something occurs) in
order to identify the source of relationship between certain variables and the
strength of their relationship. In this study, the basic research strategy is as
follows:
Formal theory (literature review): In order to conceptualize models in the
SSAF for empirical testing, related research literature is summarized.
58
Framework development: Based on literature review and a systems
engineering approach, a basic framework of standardized strategic
assessment is developed.
Model development: Founded on literature review, one model (R&D
activities model) out of six models is further developed.
Sample surveys: Survey methods are used in order to maximize the
representative sampling of the population units studied.
Survey instrument validation: After collecting survey results, appropriate
statistical analysis is used.
Conclusion: In this study, a conclusion is drawn based on statistical
evidence.
Due to time constraints, a survey (non-experimental design) was designed
for only R&D activities model within the SSAF. Surveys are most appropriate
when participants are uniquely qualified to provide the required information
(Creswell, 2009). In this study, to collect the most accurate data possible,
individual companies are interviewed.
Survey Instrument Validation
The purpose of the survey instrument validation in this study is to test the
survey questions and their formulation. For the survey instrument validation,
experts from academia and four local key executives from Small and Medium
Enterprises (SMEs) in the Aerospace and Defense (A&D) industry are
59
interviewed. The survey has been evaluated in terms of phrasing, clarity,
adequacy of construction, and instructions about the survey instrument given.
One executive from each company will be chosen to respond to the
survey, followed by a detailed interview with the respondents to shed further light
on the relevance of the survey questions. Based on academic staff, the survey sent
to several departments in Arizona State University, including department of
Technological Entrepreneurship and Innovation Management, Department of
Engineering Technology, Department of Economics, and Learning Sciences
Institute. Only three members of academic staff of these departments,
Technological Entrepreneurship and Innovation Management, Department of
Engineering Technology, and Learning Sciences Institute responded. Also, the
survey was sent to Kinetx Inc., Nichols Precision Inc., Spirit Electronics and
Airborne Systems Group. Only get response from Kinetx Inc. and Nichols
Precision Inc. Therefore, this survey instrument validation has, in total, five
responses. Based on the survey instrument validation, content validity is
established and questions, format, and scales are improved.
Sample
This study focuses on how a company can achieve a sustainable
competitive advantage based on company resources, capabilities and competitive
strategy. The population for this study will consist of all known Arizona based
SMEs in the Aerospace and Defense (A&D) industry. A sample of the population
will be used to draw conclusions about the entire population, because surveying a
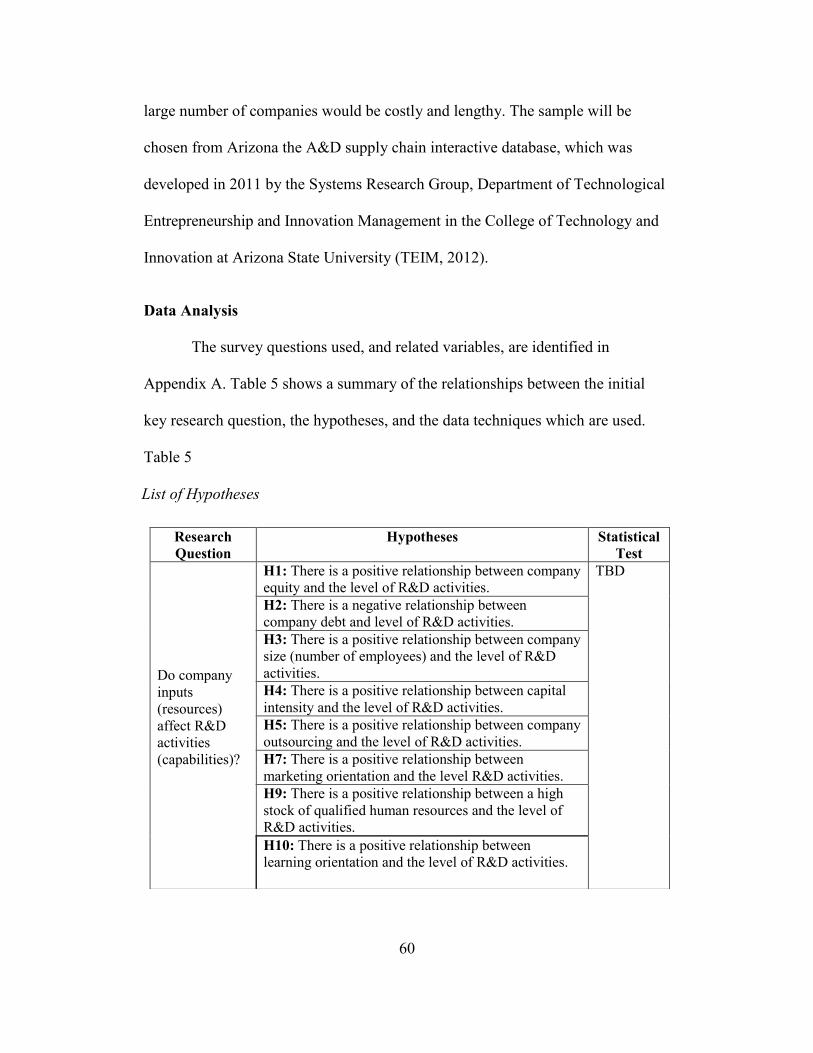
60
large number of companies would be costly and lengthy. The sample will be
chosen from Arizona the A&D supply chain interactive database, which was
developed in 2011 by the Systems Research Group, Department of Technological
Entrepreneurship and Innovation Management in the College of Technology and
Innovation at Arizona State University (TEIM, 2012).
Data Analysis
The survey questions used, and related variables, are identified in
Appendix A. Table 5 shows a summary of the relationships between the initial
key research question, the hypotheses, and the data techniques which are used.
Table 5
5. List of Hypotheses
Research
Question
Hypotheses Statistical
Test
Do company
inputs
(resources)
affect R&D
activities
(capabilities)?
H1: There is a positive relationship between company
equity and the level of R&D activities.
TBD
H2: There is a negative relationship between
company debt and level of R&D activities.
H3: There is a positive relationship between company
size (number of employees) and the level of R&D
activities.
H4: There is a positive relationship between capital
intensity and the level of R&D activities.
H5: There is a positive relationship between company
outsourcing and the level of R&D activities.
H7: There is a positive relationship between
marketing orientation and the level R&D activities.
H9: There is a positive relationship between a high
stock of qualified human resources and the level of
R&D activities.
H10: There is a positive relationship between
learning orientation and the level of R&D activities.
61
Summary
This chapter describes the methodology, design, and procedures used in
answering initial key research question for the development of SSAF.
This study involves literature review conducted to further understand the
sustainable competitive advantage at a company level, how it occurs, what the
internal and external sources of sustainable competitive advantage are, and how
they affect each other. This study uses quantitative research in order to identify
whether there is a correlation between certain variables and, if so, create a way to
measure the strength of their relationship. However, because of lack of the
responses only content validity is established and questions, format, and scales are
improved in this study. Companies that fulfill the necessary requirements of
resources needs, size, etc. are interviewed as a way to collect the data for a survey
instrument validation.
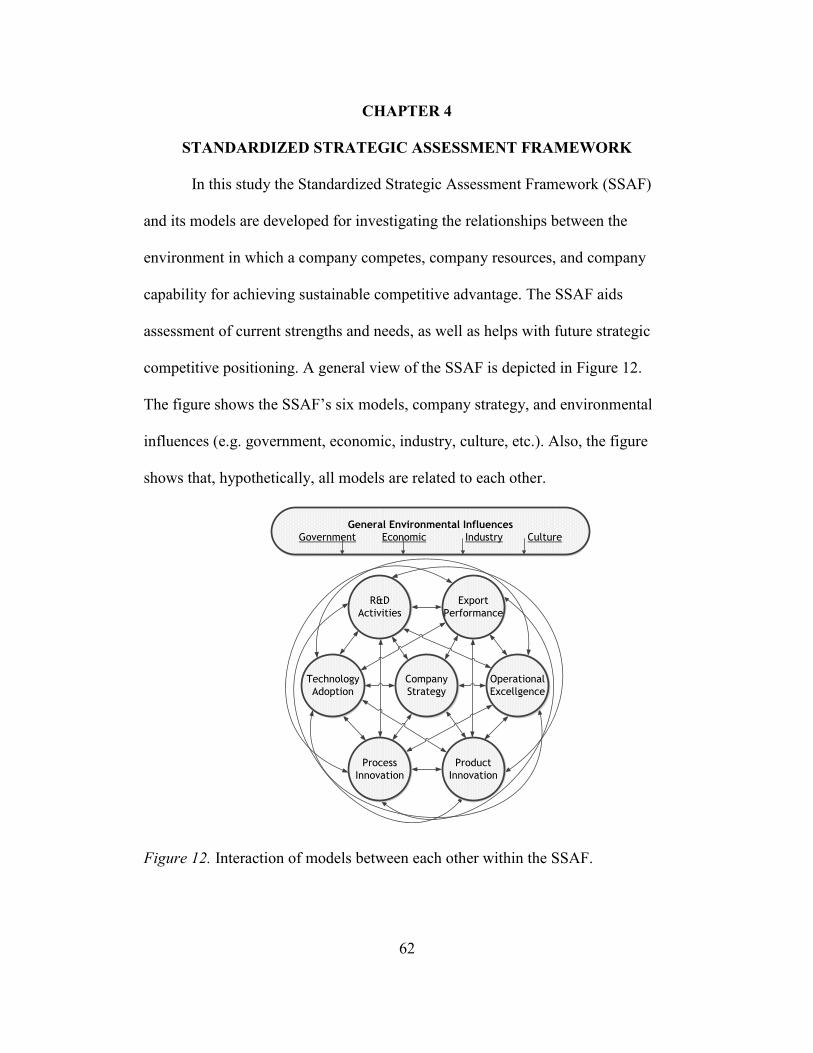
62
CHAPTER 4
STANDARDIZED STRATEGIC ASSESSMENT FRAMEWORK
In this study the Standardized Strategic Assessment Framework (SSAF)
and its models are developed for investigating the relationships between the
environment in which a company competes, company resources, and company
capability for achieving sustainable competitive advantage. The SSAF aids
assessment of current strengths and needs, as well as helps with future strategic
competitive positioning. A general view of the SSAF is depicted in Figure 12.
The figure shows the SSAF’s six models, company strategy, and environmental
influences (e.g. government, economic, industry, culture, etc.). Also, the figure
shows that, hypothetically, all models are related to each other.
General Environmental Influences
Government Economic Industry Culture
R&D
Activities
Export
Performance
Technology
Adoption
Operational
Excellgence
Product
Innovation
Process
Innovation
Company
Strategy
Figure 12. Interaction of models between each other within the SSAF.
63
The SSAF was designed using a systems engineering approach. There are
many definitions for a system. One of the most applicable meanings for this case
defines a system as “an integrated composite of people, products, and processes
that provide a capability to satisfy a stated need or objective” (DOD, 2001, p. 3).
A system can also be defined as a set or group of interacting, interrelated or
interdependent elements or parts that are organized and integrated to form a
collective unity or a unified whole to achieve a common objective (Kossiakoff,
Sweet, Seymour, & Biemer, 2003; Wasson, 2006).
From these detailed definitions, it can be deduced that a system includes
every essential part of a company. Systems engineering can be viewed through
several different lenses. According to DOD (2001), systems engineering is “an
interdiciplinary engineering management process that evolves and verifies an
integrated, life-cycle balanced set of system solutions that satisfy customer needs”
(p. 3). Sage (1992) defines systems engineering based on two perspectives (Sage,
1992):
(1) Based on functional perspective (Sage, 1992):
Systems engineering is a combination of theories and tools, carried
out through use of suitable methodology and set of systems
management procedures, in a useful setting approprate for the
resolution of real-world problems that are often of large scale and
scope (p.10).
(2) Based on purposeful perspective (Sage, 1992):
64
The purpose of systems engineering is information and knowledge
organization that will assist clients who desire to develop policies
for management, direction, control and regulation activities
relative to forecasting planning, development, production and
operation of total systems to maintain overall integrity and
integration as related to performance and reliability (p.10).
Also systems engineering can be defined as (Hribik, 2012):
An interdisciplinary field of engineering focusing on how complex
engineering projects should be designed and managed over
their life cycles. Issues such as logistics, the coordination of
different teams, and automatic control of machinery become more
difficult when dealing with large, complex projects. Systems
engineering deals with work-processes and tools to
manage risks on such projects, and it overlaps with both technical
and human-centered disciplines such as control
engineering, industrial engineering, organizational studies, and
project management (p. 252).
In order to develop a general framework for the standardized strategic
assessment, two major fundamental concepts are used. These include Integration
Definition for Function Modeling (IDEF0) and transformational (or functional)
system.
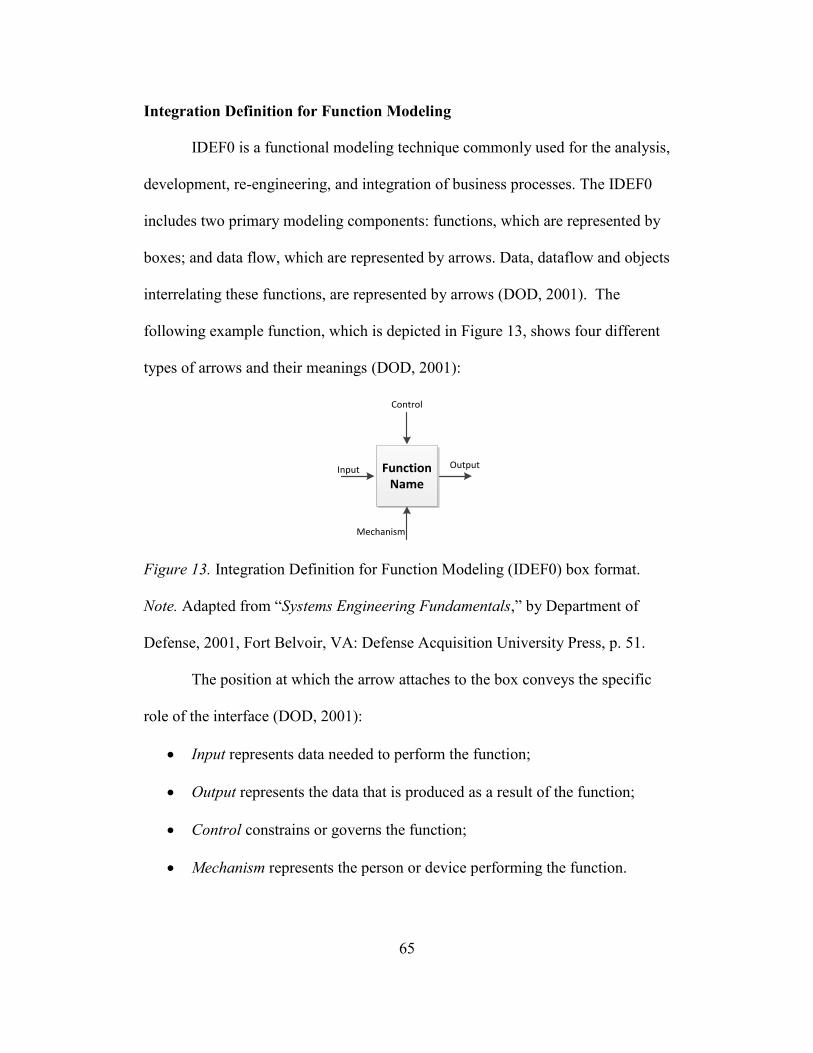
65
Integration Definition for Function Modeling
IDEF0 is a functional modeling technique commonly used for the analysis,
development, re-engineering, and integration of business processes. The IDEF0
includes two primary modeling components: functions, which are represented by
boxes; and data flow, which are represented by arrows. Data, dataflow and objects
interrelating these functions, are represented by arrows (DOD, 2001). The
following example function, which is depicted in Figure 13, shows four different
types of arrows and their meanings (DOD, 2001):
Control
Input Output
Mechanism
Function Name
Figure 13. Integration Definition for Function Modeling (IDEF0) box format.
Note. Adapted from “Systems Engineering Fundamentals,” by Department of
Defense, 2001, Fort Belvoir, VA: Defense Acquisition University Press, p. 51.
The position at which the arrow attaches to the box conveys the specific
role of the interface (DOD, 2001):
Input represents data needed to perform the function;
Output represents the data that is produced as a result of the function;
Control constrains or governs the function;
Mechanism represents the person or device performing the function.
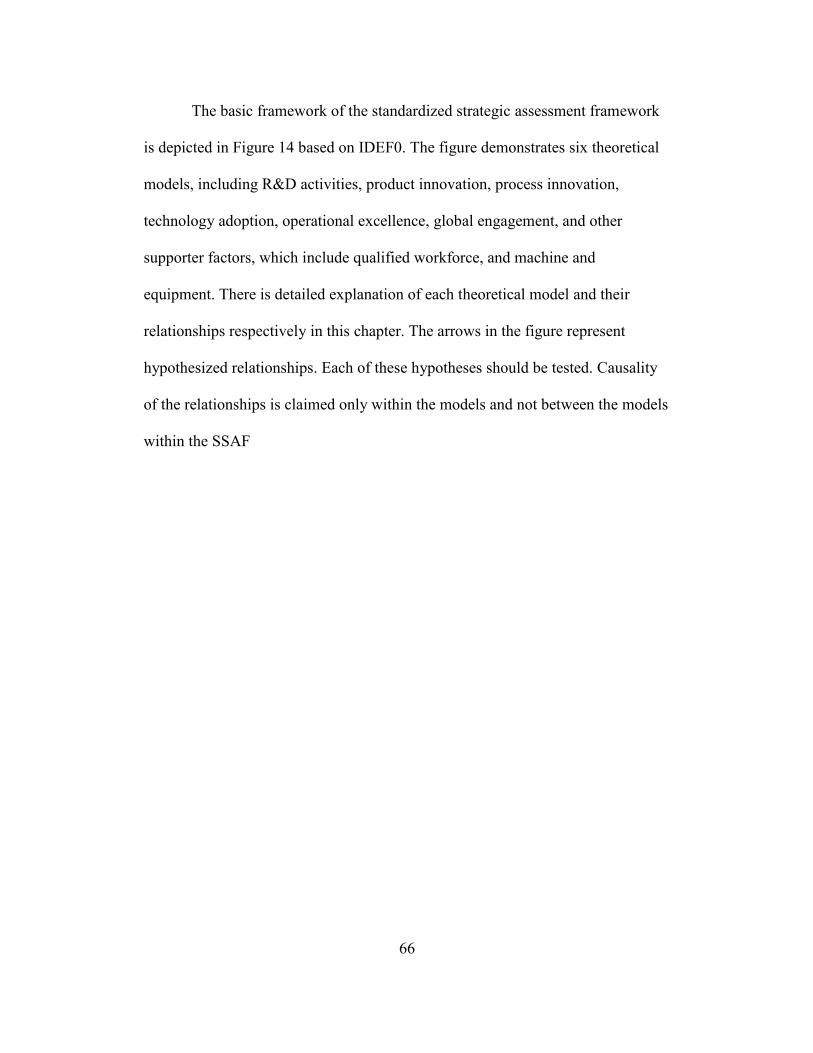
66
The basic framework of the standardized strategic assessment framework
is depicted in Figure 14 based on IDEF0. The figure demonstrates six theoretical
models, including R&D activities, product innovation, process innovation,
technology adoption, operational excellence, global engagement, and other
supporter factors, which include qualified workforce, and machine and
equipment. There is detailed explanation of each theoretical model and their
relationships respectively in this chapter. The arrows in the figure represent
hypothesized relationships. Each of these hypotheses should be tested. Causality
of the relationships is claimed only within the models and not between the models
within the SSAF
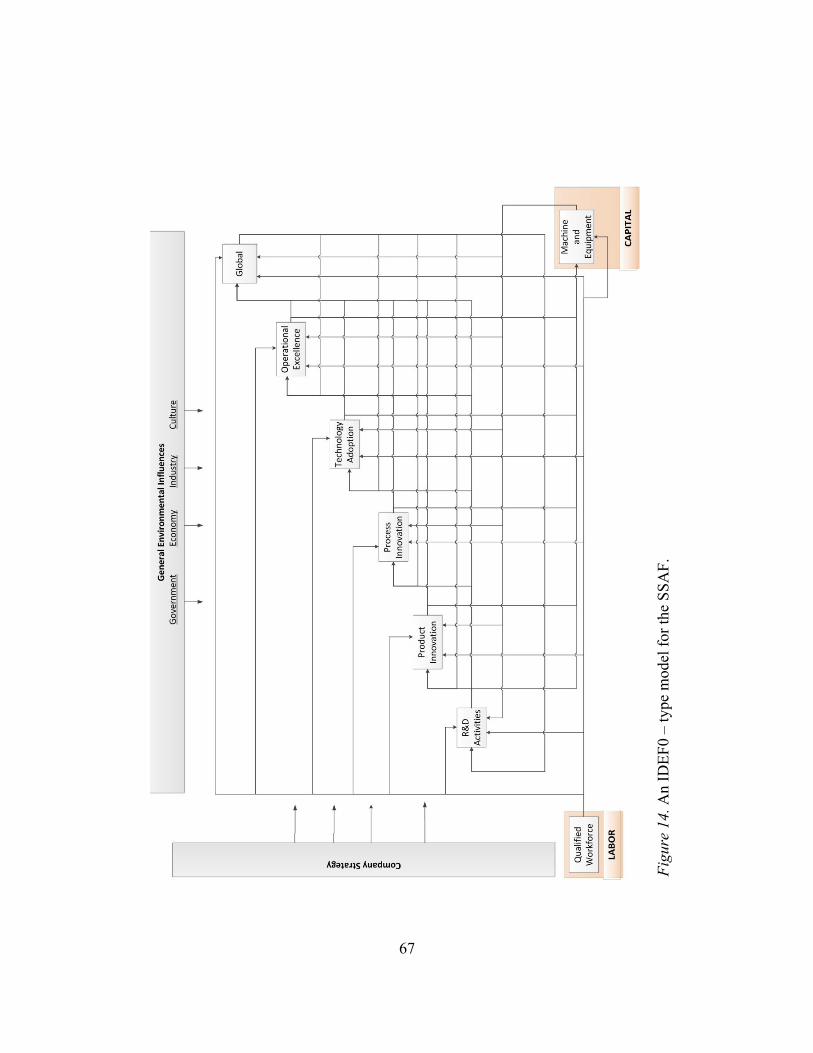
67
Fig
ure
14. A
n I
DE
F0 –
type
model
for
the
SS
AF
.
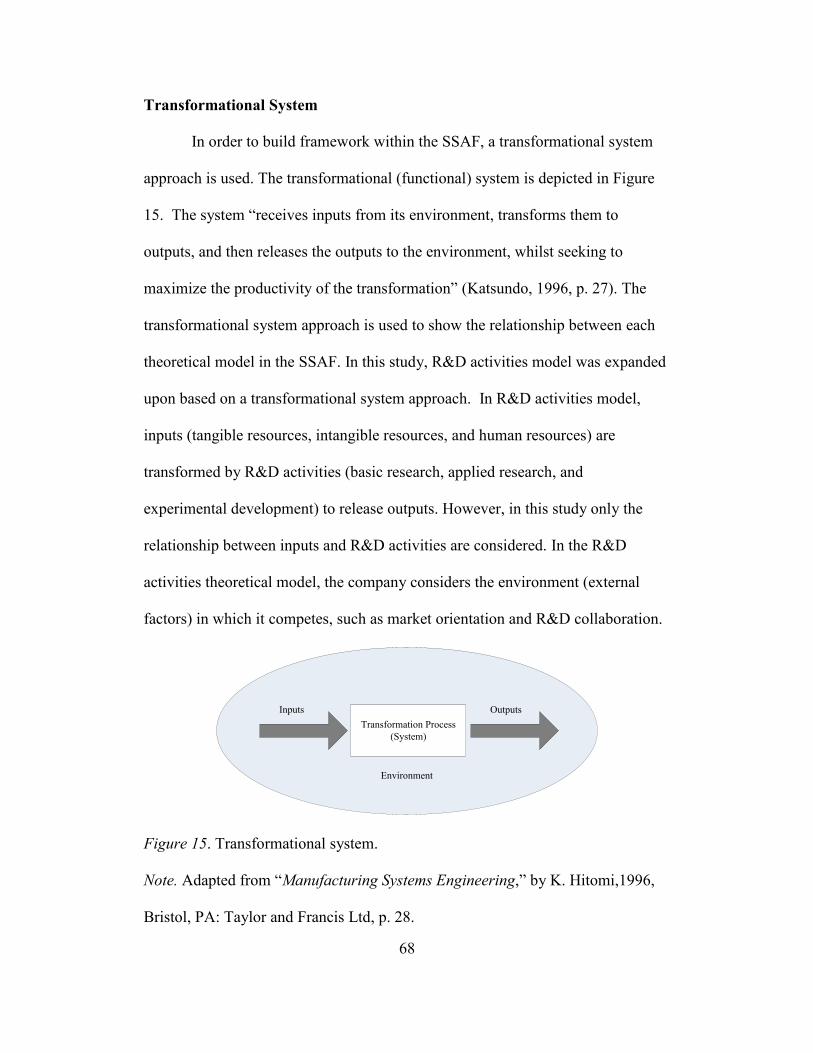
68
Transformational System
In order to build framework within the SSAF, a transformational system
approach is used. The transformational (functional) system is depicted in Figure
15. The system “receives inputs from its environment, transforms them to
outputs, and then releases the outputs to the environment, whilst seeking to
maximize the productivity of the transformation” (Katsundo, 1996, p. 27). The
transformational system approach is used to show the relationship between each
theoretical model in the SSAF. In this study, R&D activities model was expanded
upon based on a transformational system approach. In R&D activities model,
inputs (tangible resources, intangible resources, and human resources) are
transformed by R&D activities (basic research, applied research, and
experimental development) to release outputs. However, in this study only the
relationship between inputs and R&D activities are considered. In the R&D
activities theoretical model, the company considers the environment (external
factors) in which it competes, such as market orientation and R&D collaboration.
Transformation Process
(System)
Inputs Outputs
Environment
Figure 15. Transformational system.
Note. Adapted from “Manufacturing Systems Engineering,” by K. Hitomi,1996,
Bristol, PA: Taylor and Francis Ltd, p. 28.
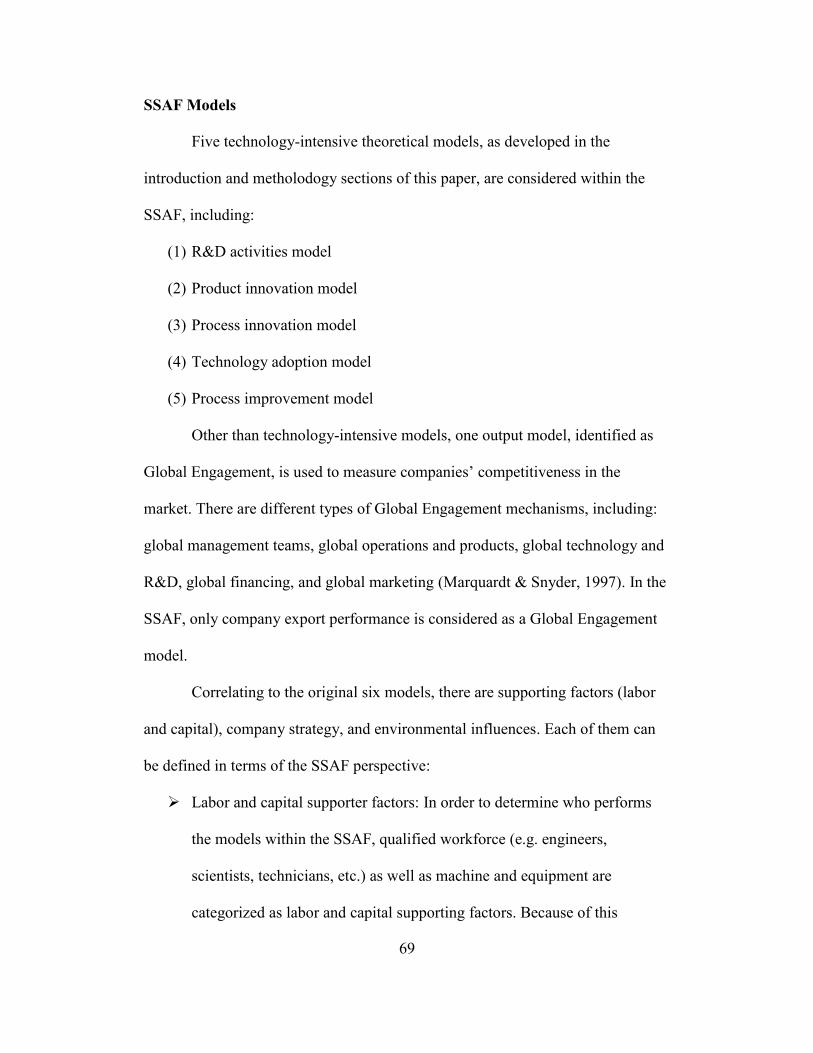
69
SSAF Models
Five technology-intensive theoretical models, as developed in the
introduction and metholodogy sections of this paper, are considered within the
SSAF, including:
(1) R&D activities model
(2) Product innovation model
(3) Process innovation model
(4) Technology adoption model
(5) Process improvement model
Other than technology-intensive models, one output model, identified as
Global Engagement, is used to measure companies’ competitiveness in the
market. There are different types of Global Engagement mechanisms, including:
global management teams, global operations and products, global technology and
R&D, global financing, and global marketing (Marquardt & Snyder, 1997). In the
SSAF, only company export performance is considered as a Global Engagement
model.
Correlating to the original six models, there are supporting factors (labor
and capital), company strategy, and environmental influences. Each of them can
be defined in terms of the SSAF perspective:
Labor and capital supporter factors: In order to determine who performs
the models within the SSAF, qualified workforce (e.g. engineers,
scientists, technicians, etc.) as well as machine and equipment are
categorized as labor and capital supporting factors. Because of this
70
distinction, qualified workforce, and machine and equipment are
developed separately in each technology-intensive model, because of their
unique effects on the different models. Nevertheless, in this study, labor
and capital are considered only within the realm of an R&D activities
model. Therefore, labor was categorized as R&D workforce under human
resources inputs. Capital, which includes machines & equipment, and
company plants, is categorized as capital intensity and company size under
tangible resources.
Company strategy: All models within the SSAF have relationships with
company strategy. Company strategy is not a model within the SSAF, but
it drives all models, because strategy comprises both internal and external
factors and it determines the position of a company in the market. In terms
of R&D activities model, company strategy determines the position of the
company in the market by performing R&D activities and, through such,
innovation, investment of new technology, process improvement, and
marketing.
Environmental influences: In the SSAF, environmental influences are
explained as any external effect on a company, including government,
economy, industry, and culture. Each SSAF model has a different pattern
in terms of each of these influences. For R&D activities model, marketing
orientation is regarded as an environmental influence. Based on marketing
orientation, the model identifies a company’s situation by gathering
information from a company’s customers, and then providing information
71
related to the competitor’s strategy in the market in which the company
competes.
In this section, only the R&D activities model and its related hypotheses
are explored. Other models are supplementary in this section, but their effects
should be further evaluated in future research.
Research and development activities model. Company R&D is one of
the critical theoretical models in the SSAF. “R&D comprises creative work
undertaken on a systematic basis to increase the stock of knowledge, including
knowledge of man, culture and society, and the use of this stock of knowledge to
devise new applications” (OECD, 2002, p.30). Based on general literature review
and this explanation of R&D, the following functional model, which is depicted in
Figure 16, was designed via systems engineering approach for the SSAF.
According to Figure 16, R&D activities model is an impact and response function
and, in order to simplify the figure, only R&D activities and their relationships
with other patterns are illustrated. The relationships within the model are
hypothesized.
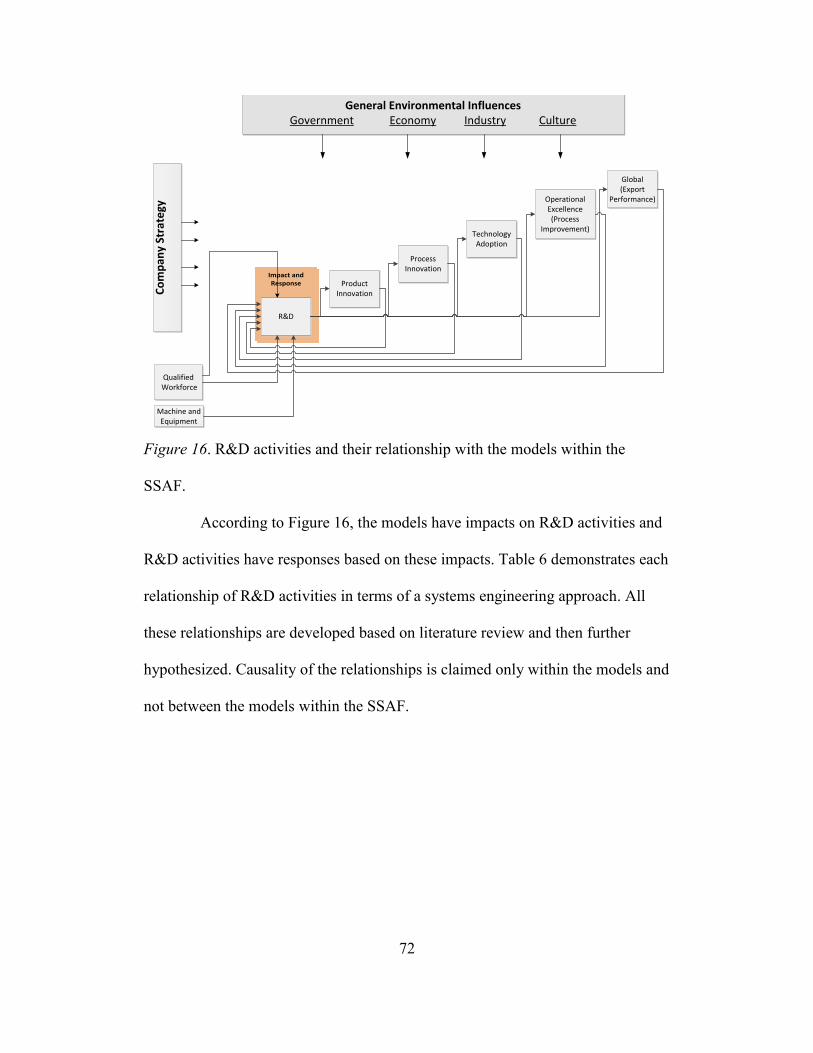
72
Figure 16. R&D activities and their relationship with the models within the
SSAF.
According to Figure 16, the models have impacts on R&D activities and
R&D activities have responses based on these impacts. Table 6 demonstrates each
relationship of R&D activities in terms of a systems engineering approach. All
these relationships are developed based on literature review and then further
hypothesized. Causality of the relationships is claimed only within the models and
not between the models within the SSAF.
Impact and Response Product
Innovation
Process Innovation
Operational Excellence(Process
Improvement)Technology Adoption
Global(Export
Performance)
R&D
Qualified Workforce
Machine and Equipment
General Environmental InfluencesGovernment Economy Industry Culture
Co
mp
any
Stra
tegy
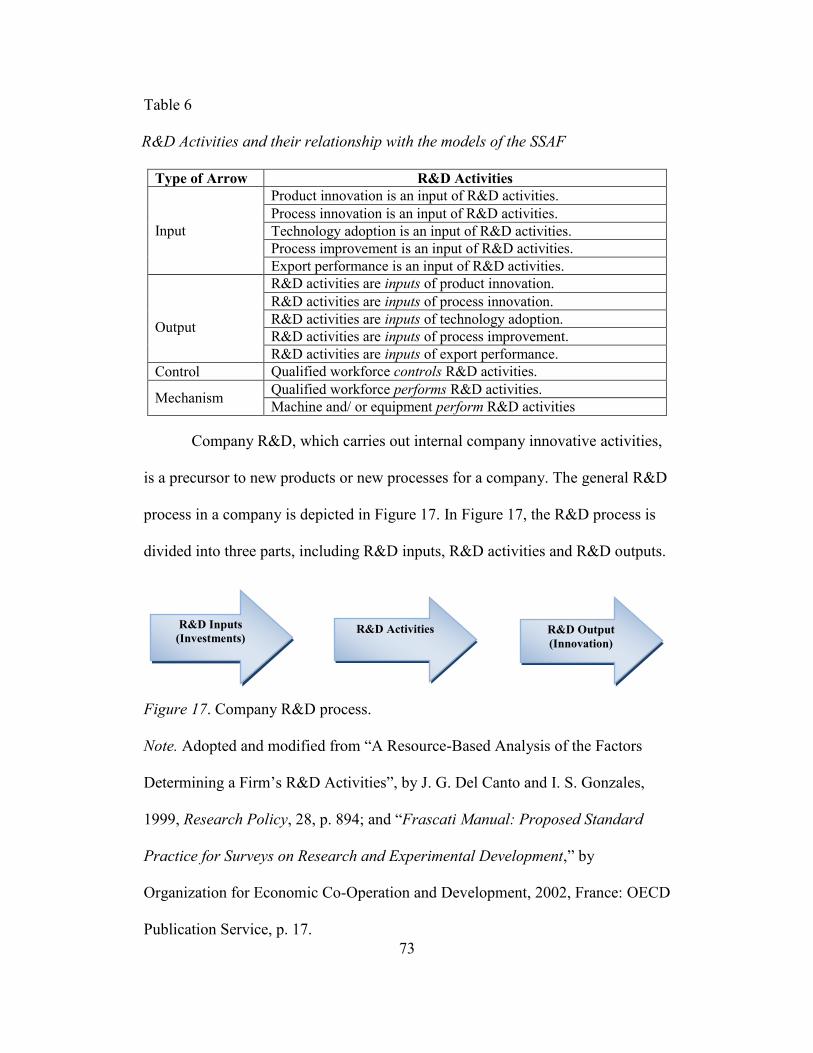
73
Table 6
6. R&D Activities and their relationship with the models of the SSAF
Type of Arrow R&D Activities
Input
Product innovation is an input of R&D activities.
Process innovation is an input of R&D activities.
Technology adoption is an input of R&D activities.
Process improvement is an input of R&D activities.
Export performance is an input of R&D activities.
Output
R&D activities are inputs of product innovation.
R&D activities are inputs of process innovation.
R&D activities are inputs of technology adoption.
R&D activities are inputs of process improvement.
R&D activities are inputs of export performance.
Control Qualified workforce controls R&D activities.
Mechanism Qualified workforce performs R&D activities.
Machine and/ or equipment perform R&D activities
Company R&D, which carries out internal company innovative activities,
is a precursor to new products or new processes for a company. The general R&D
process in a company is depicted in Figure 17. In Figure 17, the R&D process is
divided into three parts, including R&D inputs, R&D activities and R&D outputs.
Figure 17. Company R&D process.
Note. Adopted and modified from “A Resource-Based Analysis of the Factors
Determining a Firm’s R&D Activities”, by J. G. Del Canto and I. S. Gonzales,
1999, Research Policy, 28, p. 894; and “Frascati Manual: Proposed Standard
Practice for Surveys on Research and Experimental Development,” by
Organization for Economic Co-Operation and Development, 2002, France: OECD
Publication Service, p. 17.
R&D Activities R&D Output
(Innovation)
R&D Inputs
(Investments)
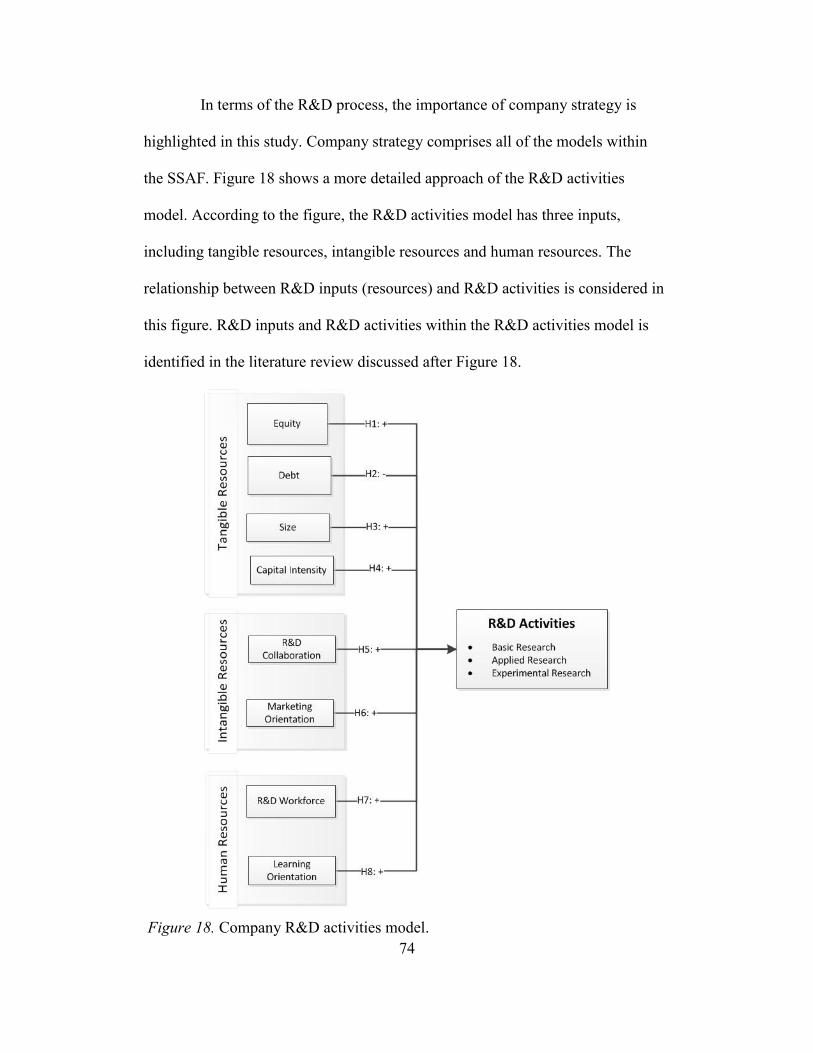
74
In terms of the R&D process, the importance of company strategy is
highlighted in this study. Company strategy comprises all of the models within
the SSAF. Figure 18 shows a more detailed approach of the R&D activities
model. According to the figure, the R&D activities model has three inputs,
including tangible resources, intangible resources and human resources. The
relationship between R&D inputs (resources) and R&D activities is considered in
this figure. R&D inputs and R&D activities within the R&D activities model is
identified in the literature review discussed after Figure 18.
Figure 18. Company R&D activities model.
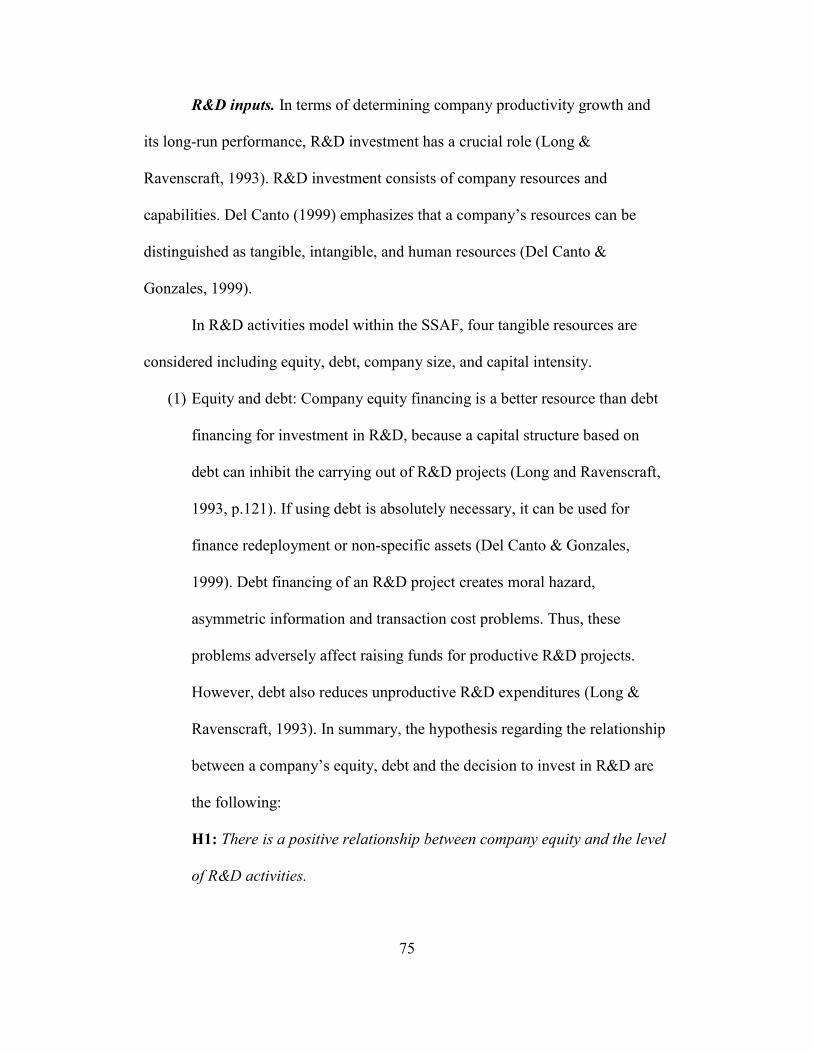
75
R&D inputs. In terms of determining company productivity growth and
its long-run performance, R&D investment has a crucial role (Long &
Ravenscraft, 1993). R&D investment consists of company resources and
capabilities. Del Canto (1999) emphasizes that a company’s resources can be
distinguished as tangible, intangible, and human resources (Del Canto &
Gonzales, 1999).
In R&D activities model within the SSAF, four tangible resources are
considered including equity, debt, company size, and capital intensity.
(1) Equity and debt: Company equity financing is a better resource than debt
financing for investment in R&D, because a capital structure based on
debt can inhibit the carrying out of R&D projects (Long and Ravenscraft,
1993, p.121). If using debt is absolutely necessary, it can be used for
finance redeployment or non-specific assets (Del Canto & Gonzales,
1999). Debt financing of an R&D project creates moral hazard,
asymmetric information and transaction cost problems. Thus, these
problems adversely affect raising funds for productive R&D projects.
However, debt also reduces unproductive R&D expenditures (Long &
Ravenscraft, 1993). In summary, the hypothesis regarding the relationship
between a company’s equity, debt and the decision to invest in R&D are
the following:
H1: There is a positive relationship between company equity and the level
of R&D activities.
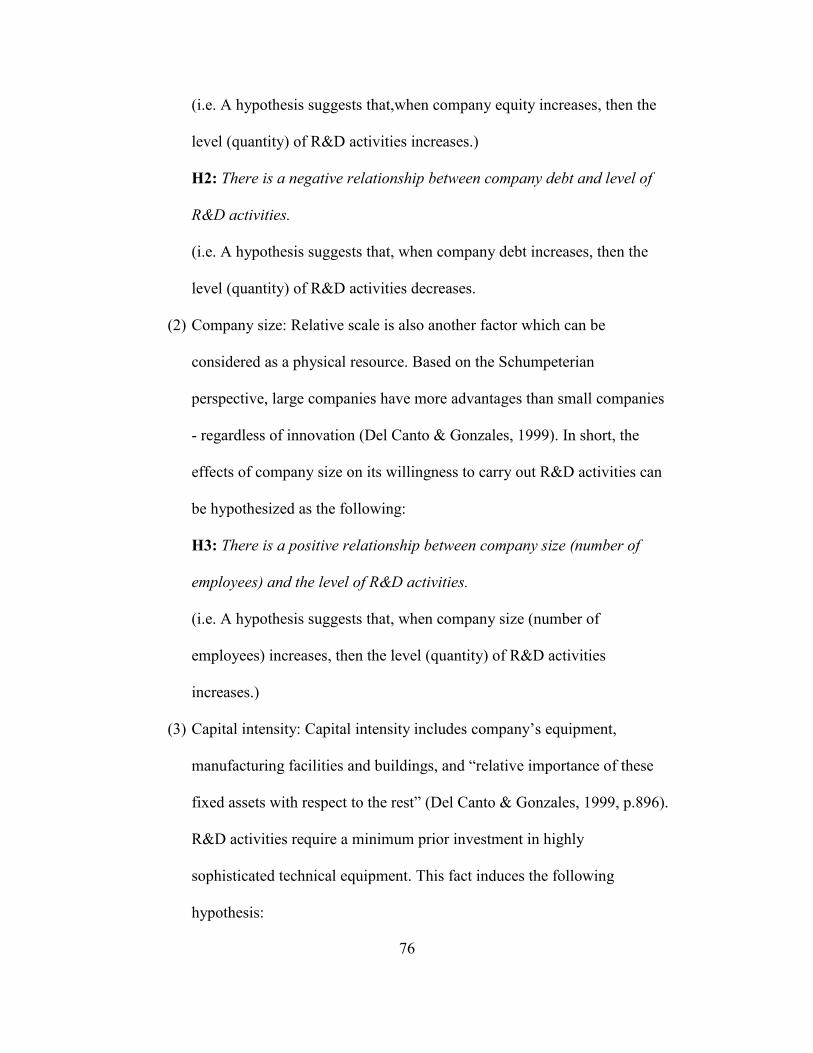
76
(i.e. A hypothesis suggests that,when company equity increases, then the
level (quantity) of R&D activities increases.)
H2: There is a negative relationship between company debt and level of
R&D activities.
(i.e. A hypothesis suggests that, when company debt increases, then the
level (quantity) of R&D activities decreases.
(2) Company size: Relative scale is also another factor which can be
considered as a physical resource. Based on the Schumpeterian
perspective, large companies have more advantages than small companies
- regardless of innovation (Del Canto & Gonzales, 1999). In short, the
effects of company size on its willingness to carry out R&D activities can
be hypothesized as the following:
H3: There is a positive relationship between company size (number of
employees) and the level of R&D activities.
(i.e. A hypothesis suggests that, when company size (number of
employees) increases, then the level (quantity) of R&D activities
increases.)
(3) Capital intensity: Capital intensity includes company’s equipment,
manufacturing facilities and buildings, and “relative importance of these
fixed assets with respect to the rest” (Del Canto & Gonzales, 1999, p.896).
R&D activities require a minimum prior investment in highly
sophisticated technical equipment. This fact induces the following
hypothesis:
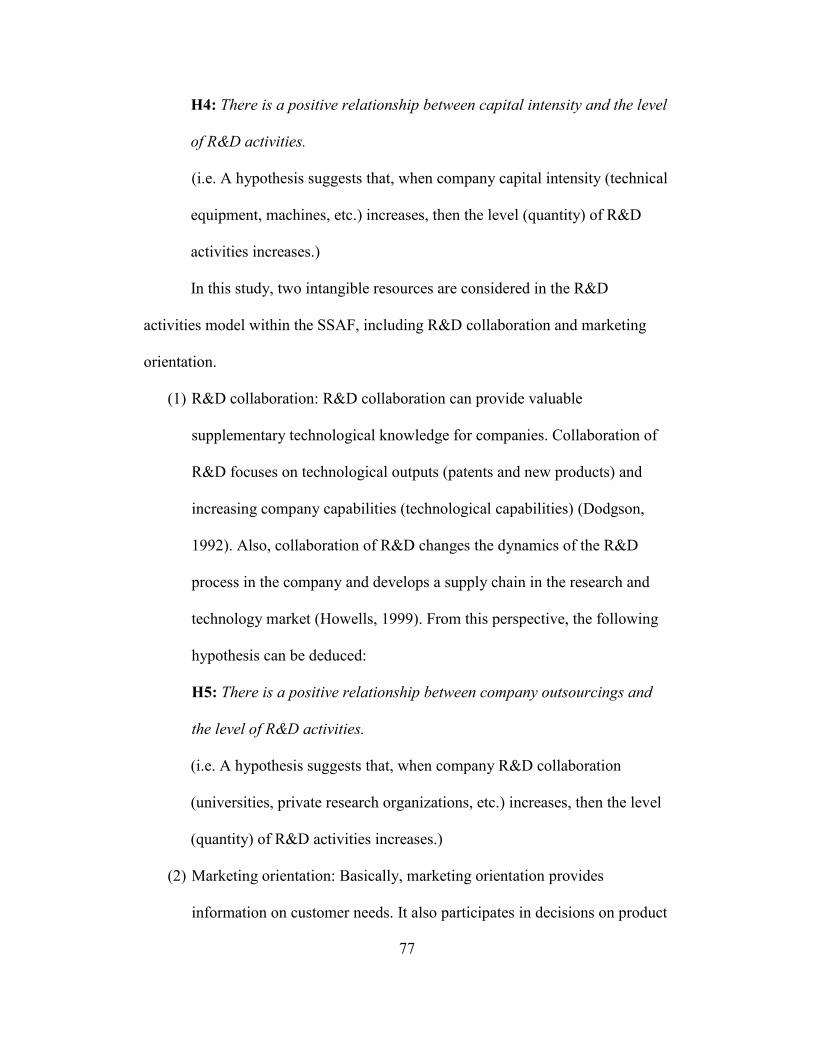
77
H4: There is a positive relationship between capital intensity and the level
of R&D activities.
(i.e. A hypothesis suggests that, when company capital intensity (technical
equipment, machines, etc.) increases, then the level (quantity) of R&D
activities increases.)
In this study, two intangible resources are considered in the R&D
activities model within the SSAF, including R&D collaboration and marketing
orientation.
(1) R&D collaboration: R&D collaboration can provide valuable
supplementary technological knowledge for companies. Collaboration of
R&D focuses on technological outputs (patents and new products) and
increasing company capabilities (technological capabilities) (Dodgson,
1992). Also, collaboration of R&D changes the dynamics of the R&D
process in the company and develops a supply chain in the research and
technology market (Howells, 1999). From this perspective, the following
hypothesis can be deduced:
H5: There is a positive relationship between company outsourcings and
the level of R&D activities.
(i.e. A hypothesis suggests that, when company R&D collaboration
(universities, private research organizations, etc.) increases, then the level
(quantity) of R&D activities increases.)
(2) Marketing orientation: Basically, marketing orientation provides
information on customer needs. It also participates in decisions on product
78
positioning and feature delivery (Griffin & Hauser, 1996). Based on this
perspective, the following hypothesis can be deduced:
H6: There is a positive relationship between marketing orientation and
the level R&D activities.
(i.e. A hypothesis suggests that, when a company applies process
improvement in R&D activities, then the level (quantity) of R&D
activities increases.)
SMEs are especially more human-oriented than system oriented
(McAdam, Moffett, Hazlett, & Shevlin, 2010). There are two types of human
resources that are considered in the R&D activities model, including R&D
workforce and learning orientation
(1) R&D workforce: R&D workforce consists of all the experience,
knowledge, judgment, abilities, skills, risk taking prosperity, and wisdom
of individuals regarding the company. Within these, human capital, a team
of scientists and technicians, possesses higher skills and knowledge within
the company (Del Canto & Gonzales, 1999). Therefore, the following
hypothesis is exposed:
H7: There is a positive relationship between a high stock of qualified
human resources and the level of R&D activities.
(i.e. A hypothesis suggests that, when company qualified human resources
(e.g. engineers, scientists, etc.) increase, then the level (quantity) of R&D
activities increases.)
79
(2) Learning orientation: learning orientation “refers to organization-wide
activity of creating and using knowledge to enhance competitive
advantage” (Calanton, Cavusgil, & Zhao, 2002, p.516). It consists of
obtaining and sharing information about development of new products and
processes, competitor actions, customer needs, and market changes
(Calanton, Cavusgil, & Zhao, 2002). The effects of learning orientation,
adopted by company human resources, have a positive impact on company
R&D and innovativeness, and, therefore, competitive advantage. In
summary, the following hypothesis is exposed:
H8: There is a positive relationship between learning orientation and the
level of R&D activities.
(i.e. A hypothesis suggests that, when company learning orientation
increases, then the level (quantity) of R&D activities increases.)
R&D activities. There are many ways by which companies can carry out
R&D activities, including continuous internal investments, outside the structured
area of R&D investments, and informal mechanisms of developing innovative
capabilities (embodied in people and organizations) (Del Canto & Gonzales,
1999). R&D activities are divided into three parts (OECD, 2002):
(1) Basic research: In the SSAF, basic research can be defined as
“experimental or theoretical work undertaken primarily to acquire new
knowledge of the underlying foundation of phenomena and observable
facts, without any particular application or use in view” (OECD, 2002,
p.30).
80
(2) Applied research: In the SSAF, applied research which can be defined as
“original investigation undertaken in order to acquire new knowledge”
(OECD, 2002, p.30).
(3) Experimental development: In the SSAF, experimental development,
which can be defined as “systematic work, drawing on existing knowledge
gained from research and/or practical experience. It is directed toward
producing new materials, products or devices, installing new processes,
systems and services, or substantially improving those already produced or
installed” (OECD, 2002, p.30).
Product innovation model. Product innovation is a vital model in the
SSAF, because new products are central to the growth and prosperity of a
company. In order to be more competitive in the market in which a company
competes, it needs to “quickly and accurately identify customer needs and
develop more complex products to satisfy those needs” (Shepherd & Ahmed,
2000, p.101). Figure 19 shows the relationship between the product innovation
model and other models within the SSAF. The relationships within the model are
hypothesized. However, the product innovation model’s effects should be further
evaluated in future research.
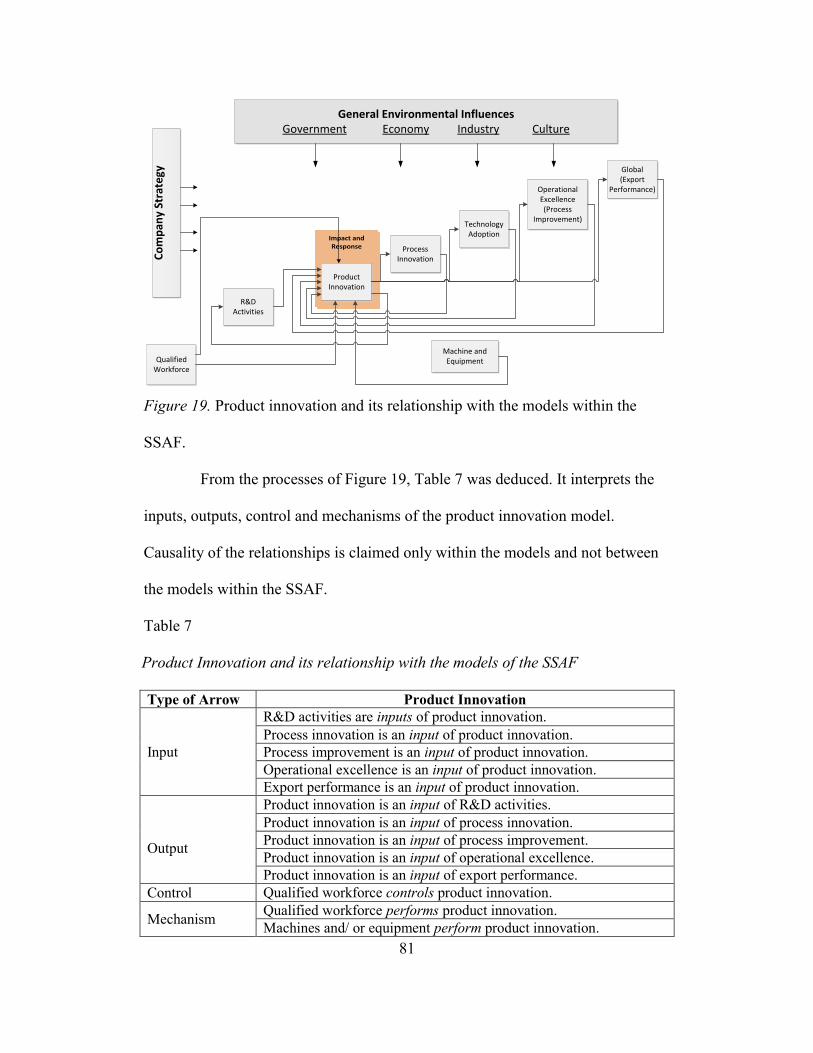
81
Figure 19. Product innovation and its relationship with the models within the
SSAF.
From the processes of Figure 19, Table 7 was deduced. It interprets the
inputs, outputs, control and mechanisms of the product innovation model.
Causality of the relationships is claimed only within the models and not between
the models within the SSAF.
Table 7
7. Product Innovation and its relationship with the models of the SSAF
Type of Arrow Product Innovation
Input
R&D activities are inputs of product innovation.
Process innovation is an input of product innovation.
Process improvement is an input of product innovation.
Operational excellence is an input of product innovation.
Export performance is an input of product innovation.
Output
Product innovation is an input of R&D activities.
Product innovation is an input of process innovation.
Product innovation is an input of process improvement.
Product innovation is an input of operational excellence.
Product innovation is an input of export performance.
Control Qualified workforce controls product innovation.
Mechanism Qualified workforce performs product innovation.
Machines and/ or equipment perform product innovation.
Impact and Response
Product Innovation
Process Innovation
Operational Excellence(Process
Improvement)Technology Adoption
Global(Export
Performance)
R&D Activities
Qualified Workforce
Machine and Equipment
General Environmental InfluencesGovernment Economy Industry Culture
Co
mp
any
Stra
tegy
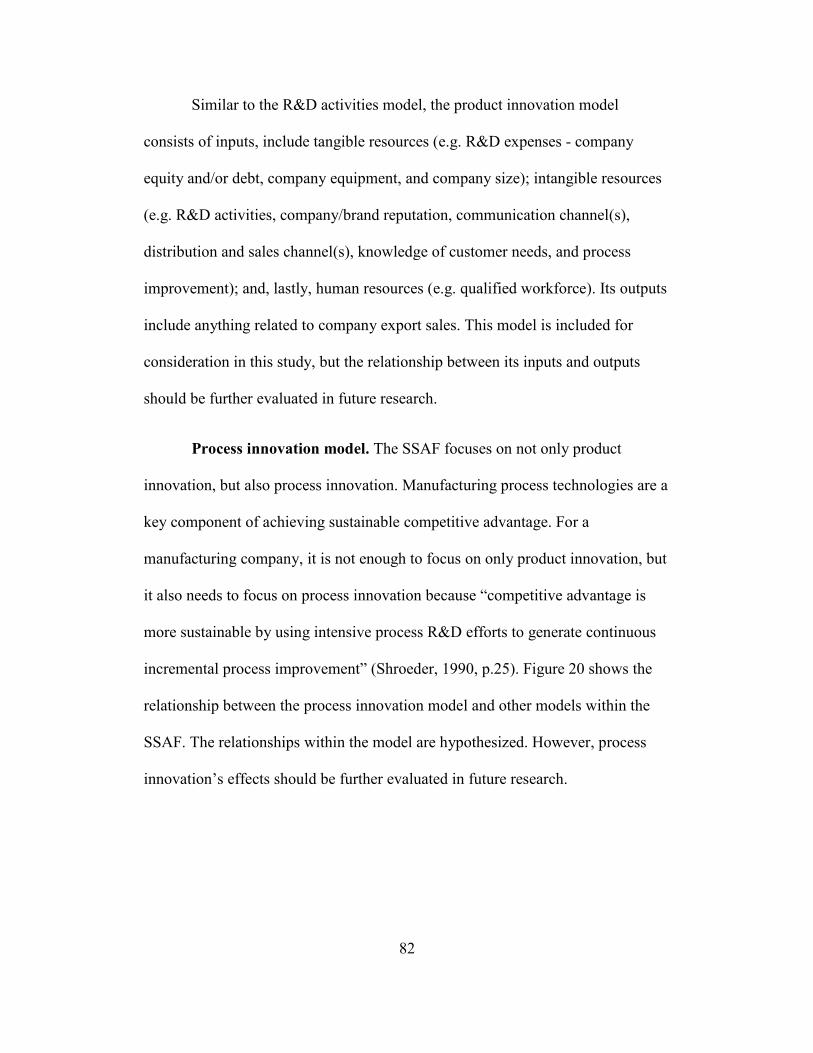
82
Similar to the R&D activities model, the product innovation model
consists of inputs, include tangible resources (e.g. R&D expenses - company
equity and/or debt, company equipment, and company size); intangible resources
(e.g. R&D activities, company/brand reputation, communication channel(s),
distribution and sales channel(s), knowledge of customer needs, and process
improvement); and, lastly, human resources (e.g. qualified workforce). Its outputs
include anything related to company export sales. This model is included for
consideration in this study, but the relationship between its inputs and outputs
should be further evaluated in future research.
Process innovation model. The SSAF focuses on not only product
innovation, but also process innovation. Manufacturing process technologies are a
key component of achieving sustainable competitive advantage. For a
manufacturing company, it is not enough to focus on only product innovation, but
it also needs to focus on process innovation because “competitive advantage is
more sustainable by using intensive process R&D efforts to generate continuous
incremental process improvement” (Shroeder, 1990, p.25). Figure 20 shows the
relationship between the process innovation model and other models within the
SSAF. The relationships within the model are hypothesized. However, process
innovation’s effects should be further evaluated in future research.
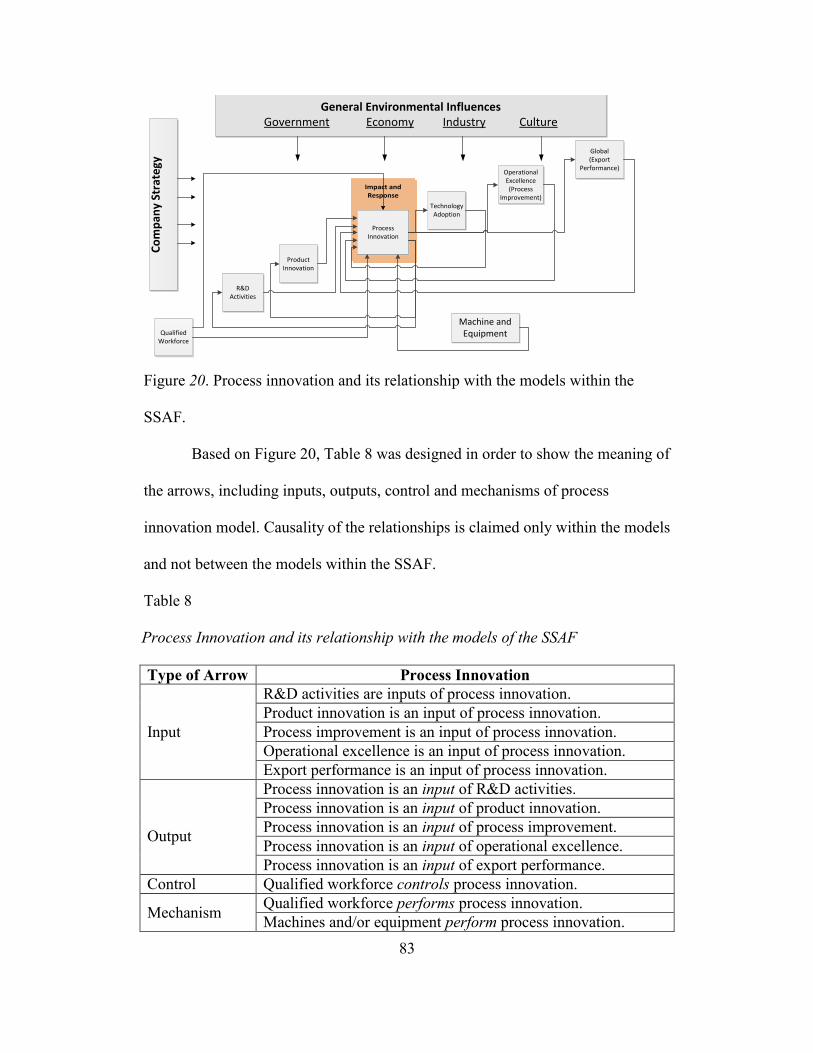
83
Figure 20. Process innovation and its relationship with the models within the
SSAF.
Based on Figure 20, Table 8 was designed in order to show the meaning of
the arrows, including inputs, outputs, control and mechanisms of process
innovation model. Causality of the relationships is claimed only within the models
and not between the models within the SSAF.
Table 8
8. Process Innovation and its relationship with the models of the SSAF
Type of Arrow Process Innovation
Input
R&D activities are inputs of process innovation.
Product innovation is an input of process innovation.
Process improvement is an input of process innovation.
Operational excellence is an input of process innovation.
Export performance is an input of process innovation.
Output
Process innovation is an input of R&D activities.
Process innovation is an input of product innovation.
Process innovation is an input of process improvement.
Process innovation is an input of operational excellence.
Process innovation is an input of export performance.
Control Qualified workforce controls process innovation.
Mechanism Qualified workforce performs process innovation.
Machines and/or equipment perform process innovation.
Impact and Response
Product Innovation
Process Innovation
Operational Excellence(Process
Improvement)Technology Adoption
Global(Export
Performance)
R&D Activities
Qualified Workforce
Machine and Equipment
General Environmental InfluencesGovernment Economy Industry Culture
Co
mp
any
Stra
tegy
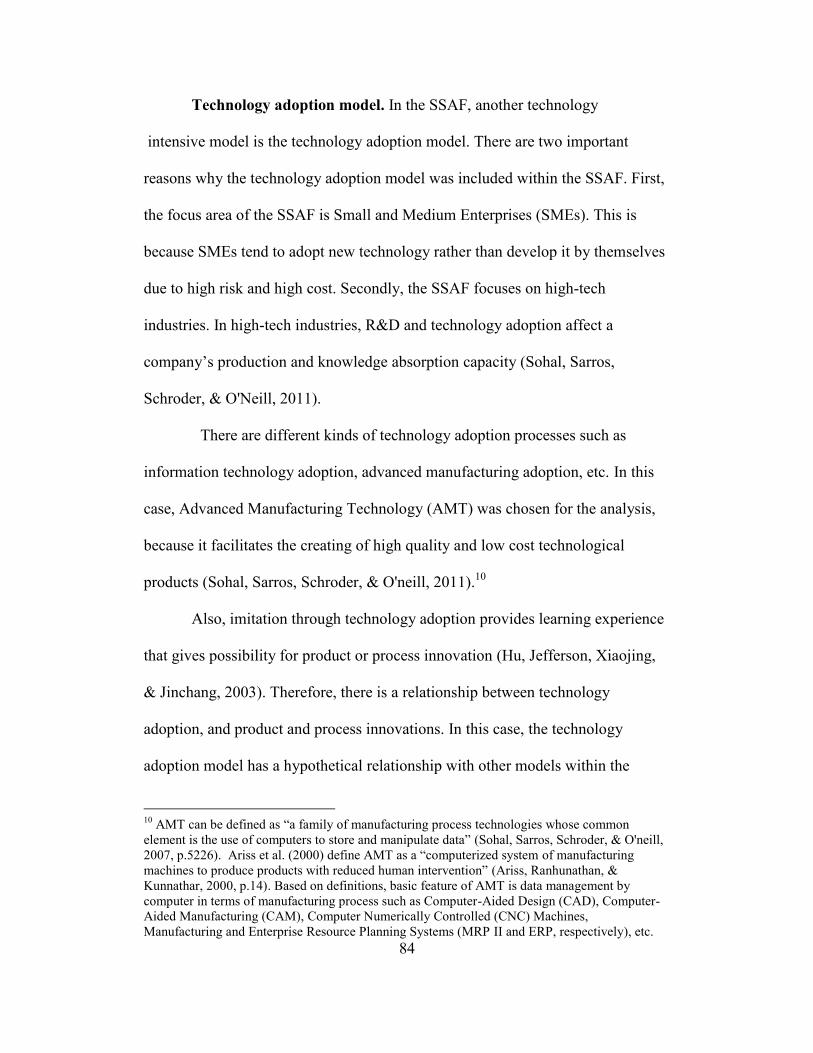
84
Technology adoption model. In the SSAF, another technology
intensive model is the technology adoption model. There are two important
reasons why the technology adoption model was included within the SSAF. First,
the focus area of the SSAF is Small and Medium Enterprises (SMEs). This is
because SMEs tend to adopt new technology rather than develop it by themselves
due to high risk and high cost. Secondly, the SSAF focuses on high-tech
industries. In high-tech industries, R&D and technology adoption affect a
company’s production and knowledge absorption capacity (Sohal, Sarros,
Schroder, & O'Neill, 2011).
There are different kinds of technology adoption processes such as
information technology adoption, advanced manufacturing adoption, etc. In this
case, Advanced Manufacturing Technology (AMT) was chosen for the analysis,
because it facilitates the creating of high quality and low cost technological
products (Sohal, Sarros, Schroder, & O'neill, 2011).10
Also, imitation through technology adoption provides learning experience
that gives possibility for product or process innovation (Hu, Jefferson, Xiaojing,
& Jinchang, 2003). Therefore, there is a relationship between technology
adoption, and product and process innovations. In this case, the technology
adoption model has a hypothetical relationship with other models within the
10
AMT can be defined as “a family of manufacturing process technologies whose common
element is the use of computers to store and manipulate data” (Sohal, Sarros, Schroder, & O'neill,
2007, p.5226). Ariss et al. (2000) define AMT as a “computerized system of manufacturing
machines to produce products with reduced human intervention” (Ariss, Ranhunathan, &
Kunnathar, 2000, p.14). Based on definitions, basic feature of AMT is data management by
computer in terms of manufacturing process such as Computer-Aided Design (CAD), Computer-
Aided Manufacturing (CAM), Computer Numerically Controlled (CNC) Machines,
Manufacturing and Enterprise Resource Planning Systems (MRP II and ERP, respectively), etc.
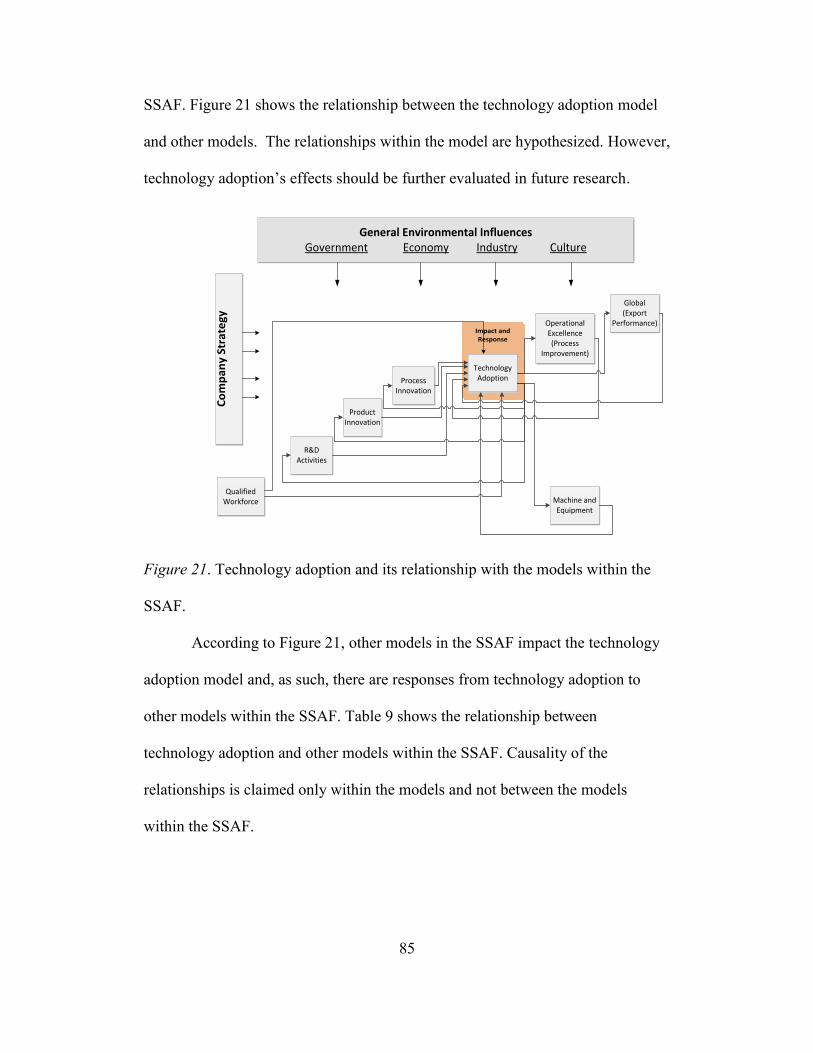
85
SSAF. Figure 21 shows the relationship between the technology adoption model
and other models. The relationships within the model are hypothesized. However,
technology adoption’s effects should be further evaluated in future research.
Figure 21. Technology adoption and its relationship with the models within the
SSAF.
According to Figure 21, other models in the SSAF impact the technology
adoption model and, as such, there are responses from technology adoption to
other models within the SSAF. Table 9 shows the relationship between
technology adoption and other models within the SSAF. Causality of the
relationships is claimed only within the models and not between the models
within the SSAF.
Impact and Response
Process Innovation
Operational Excellence(Process
Improvement)
Technology Adoption
Global(Export
Performance)
R&D Activities
Qualified Workforce Machine and
Equipment
Product Innovation
General Environmental InfluencesGovernment Economy Industry Culture
Co
mp
an
y St
rate
gy
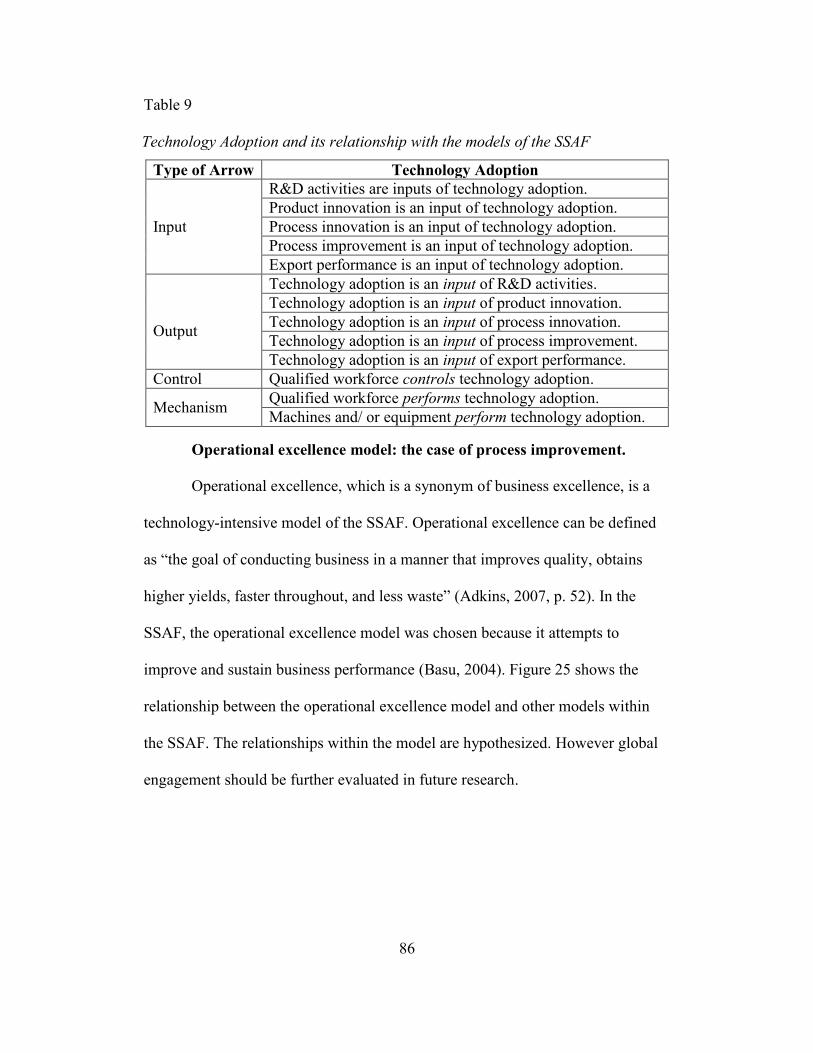
86
Table 9
9. Technology Adoption and its relationship with the models of the SSAF
Type of Arrow Technology Adoption
Input
R&D activities are inputs of technology adoption.
Product innovation is an input of technology adoption.
Process innovation is an input of technology adoption.
Process improvement is an input of technology adoption.
Export performance is an input of technology adoption.
Output
Technology adoption is an input of R&D activities.
Technology adoption is an input of product innovation.
Technology adoption is an input of process innovation.
Technology adoption is an input of process improvement.
Technology adoption is an input of export performance.
Control Qualified workforce controls technology adoption.
Mechanism Qualified workforce performs technology adoption.
Machines and/ or equipment perform technology adoption.
Operational excellence model: the case of process improvement.
Operational excellence, which is a synonym of business excellence, is a
technology-intensive model of the SSAF. Operational excellence can be defined
as “the goal of conducting business in a manner that improves quality, obtains
higher yields, faster throughout, and less waste” (Adkins, 2007, p. 52). In the
SSAF, the operational excellence model was chosen because it attempts to
improve and sustain business performance (Basu, 2004). Figure 25 shows the
relationship between the operational excellence model and other models within
the SSAF. The relationships within the model are hypothesized. However global
engagement should be further evaluated in future research.
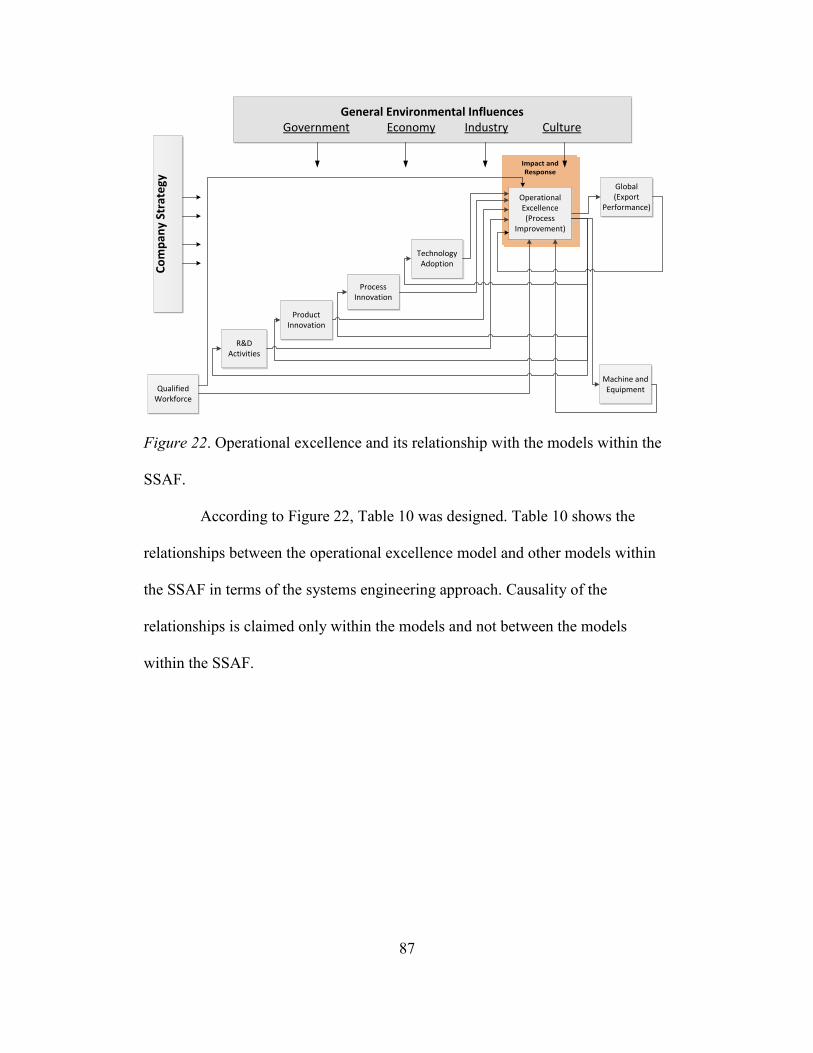
87
Figure 22. Operational excellence and its relationship with the models within the
SSAF.
According to Figure 22, Table 10 was designed. Table 10 shows the
relationships between the operational excellence model and other models within
the SSAF in terms of the systems engineering approach. Causality of the
relationships is claimed only within the models and not between the models
within the SSAF.
Impact and Response
Process Innovation
Operational Excellence(Process
Improvement)
Technology Adoption
Global(Export
Performance)
R&D Activities
Qualified Workforce
Machine and Equipment
Product Innovation
General Environmental InfluencesGovernment Economy Industry Culture
Co
mp
any
Stra
tegy
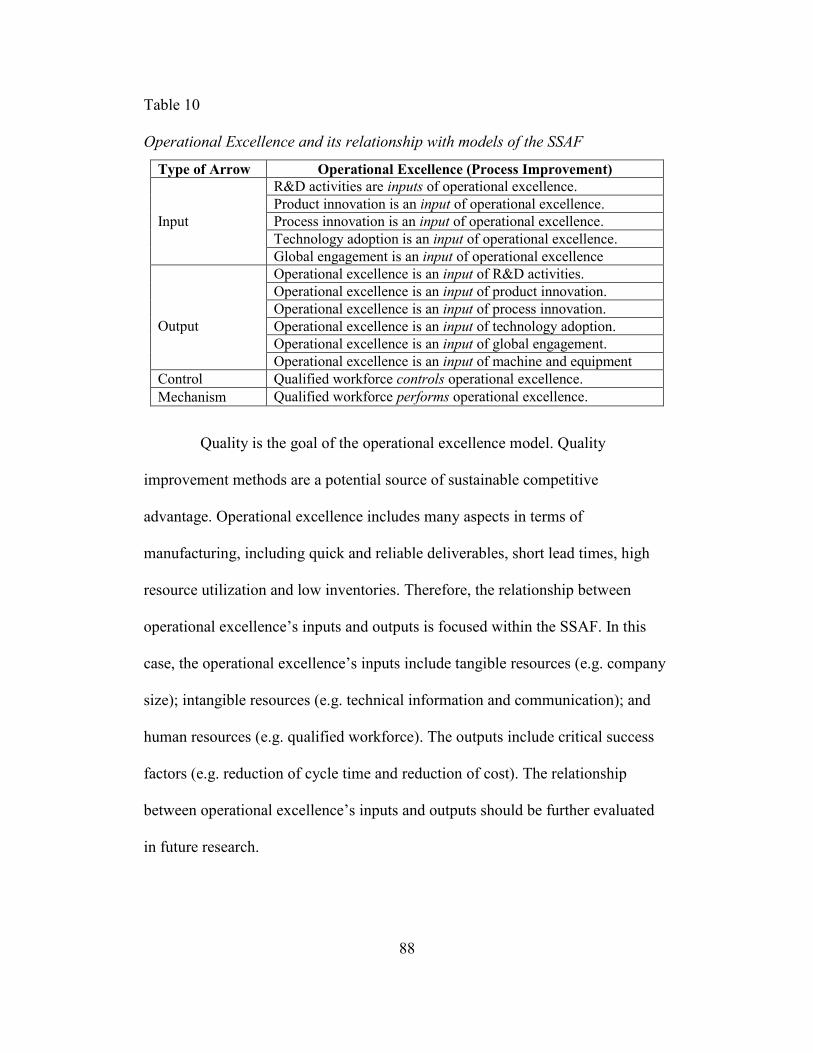
88
Table 10
10. Operational Excellence and its relationship with models of the SSAF
Type of Arrow Operational Excellence (Process Improvement)
Input
R&D activities are inputs of operational excellence.
Product innovation is an input of operational excellence.
Process innovation is an input of operational excellence.
Technology adoption is an input of operational excellence.
Global engagement is an input of operational excellence
Output
Operational excellence is an input of R&D activities.
Operational excellence is an input of product innovation.
Operational excellence is an input of process innovation.
Operational excellence is an input of technology adoption.
Operational excellence is an input of global engagement.
Operational excellence is an input of machine and equipment
Control Qualified workforce controls operational excellence.
Mechanism Qualified workforce performs operational excellence.
Quality is the goal of the operational excellence model. Quality
improvement methods are a potential source of sustainable competitive
advantage. Operational excellence includes many aspects in terms of
manufacturing, including quick and reliable deliverables, short lead times, high
resource utilization and low inventories. Therefore, the relationship between
operational excellence’s inputs and outputs is focused within the SSAF. In this
case, the operational excellence’s inputs include tangible resources (e.g. company
size); intangible resources (e.g. technical information and communication); and
human resources (e.g. qualified workforce). The outputs include critical success
factors (e.g. reduction of cycle time and reduction of cost). The relationship
between operational excellence’s inputs and outputs should be further evaluated
in future research.
89
Global engagement model: the export performance. The global
engagement model is not a high-tech intense model. The global engagement,
“involves creating a business advantage through people, partnership and systems
that can open doors to global markets, talent and resources” (Urbain, 2011, p. 28).
Globally engaged companies are more productive and more innovative, because
“they learn more from their intra-company worldwide pool of information and
from their suppliers, customers and universities” (Criscuolo, Haskel, & Slaughter,
2010, p.191). Therefore, the SSAF focuses on this model because of company
performance perspective.
In the SSAF, companies’ export performance is focused on global activity.
Especially, company export activities provide companies competitive advantage
by “playing in a big market; standardizing core products; concentrating on value-
added activity in a few countries; adopting a uniform market position; [and]
integrating competitive strategy across countries” (Marquardt & Snyder, 1997, p.
107).11
Figure 23 shows the global engagement model and its relationship with
other models within the SSAF based on a systems engineering approach. The
relationships within the model are hypothesized. However global engagement’s
effects should be further evaluated in future research.
11
There are several ways to become a global company, including (Marquardt & Snyder, 1997): (1)
Global integrating mechanism used to develop collaboration efforts among subunits, including
direct contract between managers, liaison roles between departments, temporary or permanent task
forces, global management teams, global strategy, global operations or products, global
technology and R&D, global financing, global marketing (Marquardt & Snyder, 1997).
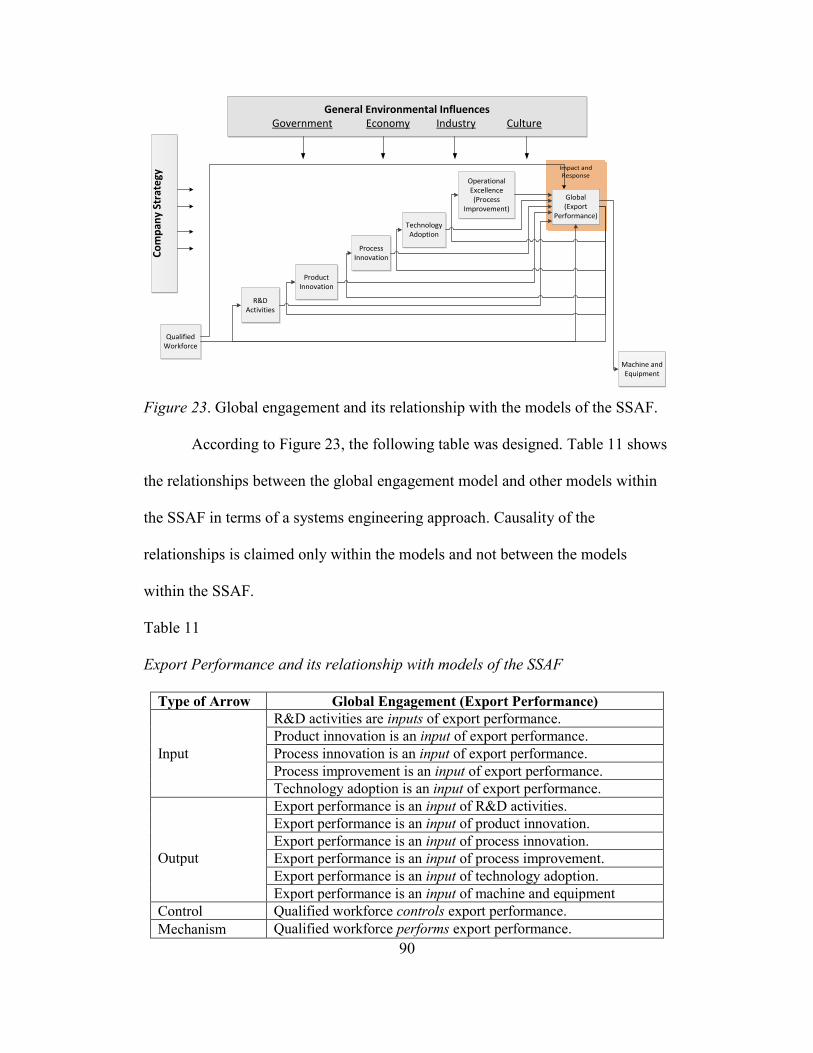
90
Figure 23. Global engagement and its relationship with the models of the SSAF.
According to Figure 23, the following table was designed. Table 11 shows
the relationships between the global engagement model and other models within
the SSAF in terms of a systems engineering approach. Causality of the
relationships is claimed only within the models and not between the models
within the SSAF.
Table 11
11. Export Performance and its relationship with models of the SSAF
Type of Arrow Global Engagement (Export Performance)
Input
R&D activities are inputs of export performance.
Product innovation is an input of export performance.
Process innovation is an input of export performance.
Process improvement is an input of export performance.
Technology adoption is an input of export performance.
Output
Export performance is an input of R&D activities.
Export performance is an input of product innovation.
Export performance is an input of process innovation.
Export performance is an input of process improvement.
Export performance is an input of technology adoption.
Export performance is an input of machine and equipment
Control Qualified workforce controls export performance.
Mechanism Qualified workforce performs export performance.
Impact and Response
Process Innovation
Operational Excellence(Process
Improvement)
Technology Adoption
Global(Export
Performance)
R&D Activities
Qualified Workforce
Machine and Equipment
Product Innovation
General Environmental InfluencesGovernment Economy Industry Culture
Co
mp
any
Stra
tegy
91
Other than a general relationship between global engagement models and
other SSAF models, the relationship between the global engagement model’s
inputs and outputs are considered within the SSAF. The global engagement model
inputs include tangible resources (e.g. company size and original equipment
manufacturer(s) or supplier(s)); intangible resources (e.g. competition and export
experience); and human resources (e.g. dedicated export staff). The outputs
include export sales. Also, the relationship between global engagement’s inputs
and outputs should be further evaluated in future research.
Summary
The first three chapters of this study discussed the theoretical background
of the research topic and methodology. This chapter discussed the framework of
standardized strategic assessment framework based on IDEF0 and its six models
based on transformational systems approach, including R&D activities model,
product innovation, process innovation, operational excellence, technology
adoption and export performance. However, only one of them, R&D activities
model, was elaborated and eight hypotheses were exposed in order to analyze for
future study.
In order to test eight hypotheses for R&D activities model, survey
questions were prepared and sent to academicians and four industry experts.
Based on the survey instrument validation, content validity is established and
questions, format, and scales are improved for future study. Survey questions can
be found under Appendix A.
92
CHAPTER 5
CONCLUSIONS AND FUTURE RESEARCH
This chapter provides final comments regarding the relevance of the thesis
and its applicability. In it, the conclusions are derived from the studies and
research done throughout the development of this thesis. First, the study is
reviewed by summary and conclusion. Lastly, future recommendations for this
study are offered to further the understanding of the theories thus far proposed.
Summary and Conclusions
Research of strategic management has attempted, from its inception, to
answer the fundamental question of how companies achieve sustainable
competitive advantage. In this study, two fundamental theories are taken into
consideration, including Market-Oriented Theory (MOT) in terms of company
resources and Resource-Based Model (RBM) in terms of companies within their
market.
The research focused on ways in which a company can achieve
sustainable competitive advantage in terms of company resources and company
strategy within the market in which companies compete. After reviewing
available literature for market competitiveness, it was concluded that there is
inconclusive research on the complementary perspective of the RBM and the
MOT. Therefore, the primary goal of this study is to lay the groundwork for
Standardized Strategic Assessment Framework (SSAF), and the second goal is the
development of its related models to explain relationships between a company’s
resources, capabilities, and competitive strategy. The SSAF, which consists of a
93
set of six models, aids in the evaluation and assessment of current and future
strategic positioning of Small and Medium Enterprises (SMEs). These six models
are: R&D activities model, product innovation model, process innovation model,
operational excellence model, technology adoption model and export performance
model. Only one of these models, R&D activities model, was investigated in
depth, and led to a new model via transformational system analysis. Causality of
the relationships is claimed only within the models and not between the models
within the SSAF.
In this study, the SSAF was visualized through a lens of Integration
Definition for Function Modeling (IDEF0). Methodologically, it describes
manufacturing functions for analysis, development, reengineering, and
integration. It is applied to information systems, business processes, or software
engineering analysis. Shortly, IDEF0 focuses on an interdisciplinary field, and the
SSAF is, thus, an interdisciplinary research study. The relationships which are
visualized by IDEF0 are hypothesized.
In this study, the models within the SSAF are visualized by using a
transformational system tool. Basically, this tool clarifies operational process,
which consists of inputs, capabilities and outputs. A transformational system tool
simplifies the model in terms of demonstration of the models because each model
within the SSAF includes inputs (company resources) and capabilities (company
capabilities).
In this research, only R&D activities model was elaborated, due to time
constraints. Each factor in the model was examined through in-depth literature
94
review and conceptualized by a transformational system tool. Therefore, for R&D
activities model, the following research question was developed in order to guide
the analysis:
Do company R&D inputs affect R&D activities?
(3) R&D inputs: tangible, intangible and human resources.
(4) R&D activities: basic research, applied research and experimental
development.
Based on the research question, eight hypotheses were exposed for testing
the relationships between resources and capabilities, and capabilities and outputs.
Based on these hypotheses, survey questions were prepared, and sent to academic
staff and industry experts. The survey was sent to several departments in Arizona
State University, including the department of Technological Entrepreneurship and
Innovation Management, Department of Engineering Technology, Department of
Economics, and Learning Sciences Institute. Only three members of academic
staff in these departments responded: Technological Entrepreneurship and
Innovation Management, Department of Engineering Technology, and Learning
Sciences Institute. The survey was also sent to Kinetx, Inc., Nichols Precision,
Inc., Spirit Electronics and Airborne Systems Group. Only two responses were
received from Kinetx, Inc. and Nichols Precision, Inc. The total number of
responses to this survey was five. Based on this survey instrument validation,
content validity was established and questions, format, and scales were improved.
Contribution
The contribution and benefits of this study can be segmented as follows:
95
First, a standardized strategic assessment framework evaluates companies,
especially SMEs, in the high-tech manufacturing industry. From this evaluation,
current and future competitiveness was developed. This means that the SSAF can
help companies determine their competitive status in their industry, and - drawing
from their results - they can improve their status.
Second, this study shows that there are a variety of resources and
capabilities within a company. If these resources and capabilities are taken into
consideration to help distinguish between various models, based on different
effects, company evaluation will become simpler. In terms of R&D perspective,
company resources are sorted as tangible, intangible and human resources.
Other contributions are related to the application and visualization of the
SSAF and its models. The SSAF was developed based on a systems engineering
approach. Literature analysis establishes that this is a relatively new method to
use for evaluation of companies’ competitive strength. Another visualization tool
is transformational system approach, which is used to ideally visualize a model.
Thanks to this approach, it is possible to gain a better understanding of inputs,
capabilities, outputs and their processes within the model.
Recommendations for Future Research
At the beginning of this study, some of the assumptions were emphasized
in the first chapter. Other concepts and ideas were also mentioned during the
study which needs more in-depth analysis. These are considered opportune areas
for future research.
96
Determining the exact number of models within the SSAF is one of the
biggest obstacles. There is no exact number of models. In this case, new models
can be added within the SSAF in order to get more accurate and precise results for
companies. Therefore, dynamically, improvement of the SSAF can be shown for
future research.
Also each model within the SSAF can be developed and changed more
based on industry and market structure. Therefore, improvement of the SSAF
models must be considered as another future research, dynamically.
The SSAF was developed and visualized based on literature review.
Overall the SSAF research comprises software implementation. Therefore, after
development of the models, the software application can be implemented on the
SSAF by related software tool. Hence, software application of the SSAF is a
future research area.
In this study, only R&D activities model was developed based on
literature review, and only survey instrument validation was done, because of
time constraint. Based on the survey instrument validation, content validity was
established and questions, format, and scales were improved. However, the
questions still need to be sent to companies in the industry in order to gather an
appropriate sample size for statistical analysis. This is also future research within
the SSAF concept.
Other models within the SSAF, product innovation model, process
innovation model, operational excellence model, technology adoption model and
export performance model can be developed and hypothesized based on literature
97
review is the same way as R&D activities model. Therefore, each of these models
development and statistical analyses can be considered for future research area.
Thus, there is much work to be done examining the relationships among
the inputs, activities and outputs within the six SSAF models, and also the
relationships among the models within the SSAF. In this case, the SSAF opens a
whole new area of inquiry and suggests many productive avenues for research in
the future.
98
REFERENCES
Adkins, M. (2007, March). Operational excellence begins here. Chemical
Engineering, pp. 52-55. Retrieved from http://www2.emersonprocess
.com/siteadmincenter/PM%20PSS%20Services%20Documents/Consultin
g%20Services/Life%20Sciences%20OpX%20Consulting_OpX%20Begin
s%20Here%20Article%20ChemEng0307.pdf
Amit, R., & Schoemaker, P. (1993). Strategic assets and organizational rent.
Strategic Management Journal, 14(1), 33-46. doi:0143-2095/93/010033-
14
Andrews, K. (1971). The concept of corporate strategy. Homewood, IL: Dow
Jones Irwin.
Ansoff, H. (1988). New corporate strategy. New York: Wiley.
Ariss, S., Ranhunathan, T., & Kunnathar, A. (2000, Spring). Factors affecting the
adoption of advanced manufacturing technology in small firms. S.A.M.
Advanced Management Journal, 65(2), 14-29. Retrieved from
http://www.freepatentsonline.com/article/SAM-Advanced-Management-
Journal/62205442.html
Armstrong, D. (1982). Competition versus monopoly: combines policy in
perspective. Vancouver: The Fraser Institute.
Bain, J. (1951). Relation profit rate to industry concentration: American
manufacturing, 1936-1940. The Quarterly Journal of Economics, 65(3),
293-324.
Barney, J. (1991). Firm resources and sustained competitive advantage. Journal of
Management, 17(1), 99-120. doi:10.1177/014920639101700108
Barney, J. (2001). Resource-based theories of competitive advantage: a ten year
retrospective on the resource-based view. Journal of Management, 27,
643-650. doi:10.1177/014920630102700602
Barney, J. (2002). Gaining and sustaining competitive advantage (2 ed.). NJ:
Prentice Hall.
Basu, R. (2004). Implementing quality: a practical guide to tools and techniques.
Great Britain: Thomson Learning.
Bogner, W., Mahoney, J., & Thomas, H. (1998). Paradigm shift: the parallel
origin, evaluation, and function of strategic group analysis with the
resource-based theory of the firm. Advances in Strategic Management, 15,
63-102. Retrieved from http://business.illinois.edu/josephm/Publications/
99
Bogner_Mahoney%20and%20Thomas.pdf
Bothwell, J., Cooley, T., & Hall, T. (1984). A new view of the market structure-
performance debate. The Journal of Industrieal Economics, 32(4), 397-
417. Retrieved from http://pages.stern.nyu.edu/~tcooley/papers
/a_new_vie_of_the_mar_str_per_deb.pdf
Burke, T., Genn-Bash, A., & Haines, B. (1991). Competition in theory and
practice. New York: Routledge.
Cable, J. (1994). Introduction and overview: recent developments in industrial
economics. In J. Cable, Current Issues in Industrial Economics (pp. 1-10).
New York: St. Martin's Press.
Calanton, R., Cavusgil, S., & Zhao, Y. (2002). Learning orientation, firm
innovation capability, and firm performance. Industrial Marketing
Management, 31, 515-524.
Carree, M., Stel, A., Thurik, R., & Wennekers, S. (2002). Economic development
and business ownership: an analysis using data of 23 OECD countries.
Small Business Economics, 19, 271-290. doi:10.1023/A:1019604426387
Caves, R. (1980). Industrial organization, corporate strategy and structure.
Journal of Economic Literature, 18(1), 64-92.
Caves, R., & Porter, M. (1977). From entery barriers to mobility barriers:
conjectural decisions and contrived deterrence to new competition. The
Quarterly Journal of Economics, 91(2), 241-262.
Christensen, J. (1996). Analysing the technology base of the firm: a multi-
dimensional resource and competence perspective. In Towards a
Competence Theory of the Firm (pp. 111-132). London: Routledge.
Conner, K. (1991). A historical comparison of resource-based theory and five
schools of thought within industrial organization economics: do we have a
new theory of the firm? Journal of Management, 17(1), 121-154.
Creswell, J. W. (2009). Research design: qualitative, quantiative, and mixed
methods approaches. Thousand Oaks, California, USA: Sage.
Criscuolo, C., Haskel, J., & Slaughter, M. (2010). Global engagement and the
innovation activities of firms. International Journal of Industrial
Organization, 28, 191-202. doi:10.1016/j.ijindorg.2009.07.012
Dahms, A. (2001). The US biotechnology industry: the importance of workforce
quality in the maintenance of corporate competitive advantage.
100
Biochemistry and Molecular Biology Education, 29, 206-208.
doi:10.1111/j.1539-3429.2001.tb00123.x
Del Canto, J., & Gonzales, I. (1999). A resource-based analysis of the factors
determining a firm's R&D activities. Research Policy, 28, 891-905.
Dhanaraj, C., & Beamish, P. (2003). A resource-based approach to the study of
export performance. Journal of Small Business Management, 41(3), 242-
261. doi:10.1111/1540-627X.00080
DOD. (2001). Systems engineering fundamentals. Fort Belvoir, Virginia: Defense
Acquisition University Press. Retrieved from
http://www.dau.mil/pubs/pdf/SEFGuide%2001-01.pdf
Dodgson, M. (1992). The strategic management of R&D collaboration.
Technology Analysis & Strategic Management, 4(3), 227-244.
doi:10.1080/09537329208524096
Donsimoni, M., Geroski, P., & Jacquemin, A. (1984). Concentration indices and
market power: two views. The Journal of Industrial Economics, 32(4),
419-434.
Enders, A. (2004). Management competence - resource-based management and
plant performance. Germany: Physica-Verlag Heidelberg.
Farzin, Y., Huisman, K., & Kort, P. (1998). Optimal timing of technology
adoption. Journal of Economic Dynamics and Control, 22, 779-799.
Ferguson, P., & Ferguson, G. (1994). Industrial economics: issues and
perspectives (2nd ed.). New York: New York University Press.
Galunic, D., & Rodan, S. (1998). Research notes and communications: resource
recombinations in the firm: knowledge structures and the potential for
Schumpeterian innovation. Strategic Management Journal, 19, 1193-
1201. doi:10.1002/(SICI)1097-0266(1998120)19:12<1193::AID-
SMJ5>3.0.CO;2-F
Grant, R. M. (1995). Contemporary strategy analysis: concepts, techniques,
applications (2nd ed.). Cambridge, Massachusetts, USA: Basil Blackwell
Ltd.
Greening, D., & Turban, D. (2000). Corporate social performance as a
competitive advantage in attracting a quality workforce. Business and
Society, 39(3), 254-280. doi:10.1177/000765030003900302
101
Griffin, A., & Hauser, J. (1996). Integrating R&D and marketing: a review and
analysis of the literature. Journal of Product Innovation Management, 13,
1991-215. doi:10.1111/1540-5885.1330191
Hannan, M., & Freeman, J. (1977). The population ecology of organizations.
American Journal of Sociology, 82(5), 929-964.
Hart, S. (1995, October). A natural-resource-based view of the firm. The Academy
of Management Review, 20(4), 986-1014.
Hecker, D. (2005, July). High-technology employment: a NAICS-based update.
Monthly Labor Review, pp. 57-72.
Henderson, R., & Mitchell, W. (1997). The interactions of organizational and
competitive influences on strategy and performance. Special Issue:
Organizational and Competitive Interactions, 5-14.
Herrmann, P. (2005). Evolution of strategic management: the need for new
dominant designs. International Journal of Management Reviews, 7(2),
111-130. doi:10.1111/j.1468-2370.2005.00108.x
Hitomi, K. (1996). Manufacturing systems engineering: a unified approach to
manufacturing technology, production management, and industrial
economics. Bristol, PA, USA: Taylor & Francis Ltd.
Howells, J. (1999). Research and technology outsourcing. Technology Analysis &
Strategic Management, 11(1), 17-19. doi:10.1080/095373299107555
Hribik, J. (2012). Relationship between clusters of advanced technologies and
systems engineering. In D. Pavelkova, J. Strouhal, M. Paselkova, & L.
Svobodova (Ed.), Advances in Finance and Accounting (pp. 251-256).
Zlin: WSEAS Press. Retrieved from http://www.wseas.us/e-
library/conferences/2012/Zlin/FAA/FAA-41.pdf
Hu, A., Jefferson, G., Xiaojing, G., & Jinchang, Q. (2003, June). R&D and
technology transfer: firm-Level evidence from Chinese industry. William
Davidson Institute Working Paper. Michigan. Retrieved June 25, 2012,
from http://deepblue.lib.umich.edu/bitstream/2027.42/39968/3/wp582.pdf
Kossiakoff, A., Sweet, W., Seymour, S., & Biemer, S. (2003). Systems
engineering principles and practice. (A. P. Sage, Ed.) Hoboken, NJ, USA:
John Wiley & Sons, Inc.
Long, W., & Ravenscraft, D. (1993, Summer). LBOs, debt and R&D intensity.
Strategic Management Journal, 14(Special Issue: Corporate
Restructuring), 119-135. doi:10.1002/smj.4250140910
102
Mahoney, J., & Pandian, J. (1992, Jun). The resource-based view within the
conversation of strategic management. Strategic Management Journal,
13(5), 363-380. doi:0143-2095/92/050363-18
Marquardt, M., & Snyder, N. (1997). How companies go global - the role of
global integrators and global mindset. International Journal of Training
and Development, 1-2, 104-117. doi:10.1111/1468-2419.00011
Mason, E. (1939). Price and production policies of large-scale enterprise. The
American Economic Review, 29(1), 61-74.
McAdam, R., Moffett, S., Hazlett, S., & Shevlin, M. (2010). Developing a model
of innovation implementation for UK SMEs: a path analysis and
explanatory case analysis. International Small Business Journal, 28(3),
195-214. doi:10.1177/0266242609360610
Moran, P., & Ghoshal, S. (1999). Markets, firms, and the process of economic
development. Academy of Management Review, 24(3), 390-412.
Nilsson, F., & Rapp, B. (2005). Understanding competitive advantage - the
importance of strategic congruence and integrated control. Berlin,
Germany: Springer.
OECD. (2002). Frascati manual: proposed standard practice for surveys on
research and experimental development. Paris: OECD Publication
Service. Retrieved from http://www.oecd-ilibrary.org/science-and-
technology/frascati-manual-2002_9789264199040-en
OECD. (2005). Oslo manual: guidelines for collecting and interpreting
innovation data (3rd ed.). Paris, France: A Joint Publication of
Organization for Economic Co-Operation and Development Statistical
Office of the European Communities. Retrieved from http://www.oecd-
ilibrary.org/science-and-technology/oslo-manual_9789264013100-en
O'Shannassy, T. (2008). Sustainable competitive advantage or temporary
competitive advantage: improving understanding of an important starategy
construct. Journal of Strategy and Management, 1(2), 168-180.
doi:10.1108/17554250810926357
Penrose, E. (1959). The theory of the growth of the firm (4th ed.). New York:
Oxford Press.
Peteraf, M. (1993). The cornerstones of competitive advantage: a resource-based
view. Strategic Management Journal, 14(3), 179-191. doi:0143-
2095/93/030179-13
103
Pfeffer, J. (1995, February). Producing sustainable competitive advantage through
the effective management of people. The Academy of Management
Executive, 9(1), 55-72.
Pfeffer, J., & Salancik, G. (2003). External control of organizations: a resource
dependence perspective. California: Stanford University Press.
Porter, M. (1980). Competitive strategy. New York: Free Press.
Porter, M. (1981). The contributions of industrial organization to strategic
management. The Academy of Management Review, 6(1), 609-620.
Porter, M. (1985). Competitive advantage. New York: The Free Press.
Porter, M. (1990). The Competitive advantage of nations. New York: Free Press.
Porter, M. (1991). Towards a dynamic theory of strategy. Strategic Management
Journal, 12, 95-117. doi:0143-2095/91/100095/23
Porter, M. (2005, June). Michael Porter on Strategy. Leadership Excellence, 22, 6,
14. ABI/INFORM.
Porter, M. (2008). The five competitive forces that shape strategy. Harvard
Business Review, 23-40. Retrieved from http://www.asec-
sldi.org/dotAsset/292822.pdf
Rivard, S., Raymond, L., & Verreault, D. (2006). Resource-based view and
competitive strategy: an integrated model of the contribution of
information technology to firm performance. Journal of Strategic
Information Systems, 15, 29-50. doi:10.1016/j.jsis.2005.06.003
Romer, P. (1986). Increasing returns and long-run growth. Journal of Political
Economy, 94(5), 1002-1037. doi:0022-3808/86/9405-0009
Sage, A. (1992). Systems engineering. NY: John Wiley & Sons, Inc.
Schumpeter, J. (1975). Capitalism, socialism, and democracy (3rd ed.). New
York: Harper & Row.
Shepherd, C., & Ahmed, P. (2000). From product innovation to solutions
innovation: a new paradigm for competitive advantage. European Journal
of Innovation Management, 3(2), 100-106.
Shroeder, D. (1990). A dynamic perspective on the impact of process innovation
upon competitive strategies. Strategic Management Journal, 11, 25-41.
104
Sirmon, D., Hitt, M., & Ireland, R. (2007). Managing firm resources in dynamic
environments to create value: looking inside the black box. Academy of
Management Review, 32, 2793-292. Retrieved from
http://www.google.com/url?sa=t&rct=j&q=&esrc=s&source=web&cd=1
&ved=0CDUQFjAA&url=http%3A%2F%2Fwww.researchgate.net%2Fp
ublication%2F228171417_Managing_Firm_Resources_in_Dynamic_Envi
ronments_to_Create_Value_Looking_Inside_the_Black_Box%2Ffile%2F
79e41507dc8a
Smith, J., Jackson, N., & Wyatt, R. (1998). Strategic needs analysis: searching for
viable solutions. Cobra 1998 Conference. Melbourne: The Royal
Melbourne Institute of Technology. Retrieved September 07, 2012, from
http://www.rics.org/site/download_feed.aspx?fileID=2670&fileExtension
Smith, R., & Sharif, N. (2007). Understanding and acquiring technology assets for
global competition. Technovation, 27, 643-649.
Sohal, A., Sarros, J., Schroder, R., & O'Neill, P. (2006). Adoption framework for
advanced manufacturing technologies. International Journal of
Production Research, 44(24), 5225-5246.
doi:10.1080/00207540600558320
Solow, R. (1956). A contribution to the theory of economic growth. The
Quarterly Journal of Economics, 70(1), 65-94.
Spanos, Y., & Lioukas, S. (2001). An examination into the causal logic of rent
generation: contrasting Porter's competitive strategy framework and the
resource-based perspective. Strategic Management Journal, 22(10), 907-
934. doi:10.1002/smj.174
Sudaryanto. (2003, June 4). A fuzzy multi-Attribute decision making approach for
the identification of the key sectors of an economy: the key of Indonesia.
Unpublished Doctoral Dissertation. Germany: Aachen University of
Technology.
Szirmai, A., Naude, W., & Goedhuys, M. (2011). Entrepreneurship, innovation,
and economic development: an overview. USA: Oxford University Press.
Teece, D., Pisano, G., & Shuen, A. (1997). Dynamic capabilities and strategic
management. Strategic Management Journal, 18(7), 509-533.
TEIM. (2012, May 30). Arizona A&D supply chain database. Retrieved
September 15, 2012, from Aerospace and Defense System Research
Group: http://129.219.40.44/adsr/Default.aspx
105
Urbain, C. (2011). Think globally, act locally. Corporate Report, The Wisconsin
Manufacturing Extension Partnership (WMEP), Wisconsin. Retrieved
from http://crwmag.com/issue/may-2011/article/think-globally-act-locally
Wasson, C. S. (2006). System analysis, design, and development. Hoboken: John
Wiley & Sons, Inc.
Wernerfelt, B. (1984). A resource-based view of the firm. Strategic Management
Journal, 5, 171-180. doi:0143-2095/84/020171-10
Wirth, M., & Bloch, H. (1995). Industrial organization theory and media industry
analysis. The Journal of Media Economics, 8(2), 15-26.
doi:10.1207/s15327736me0802_3

106
APPENDIX A
SURVEY QUESTIONS
107
Greetings
We are requesting your participation in an important study of the
Standardized Strategic Assessment Framework (SSAF). The SSAF aids the
evaluation and assessment of current and future strategic positioning of SMEs.
The purpose of this study is to lay the groundwork for the SSAF.
Thank you! Your participation is greatly appreciated. Email any questions to
[email protected] or [email protected] .
Gary Waissi, PhD, Professor, College of Technology and Innovation, Arizona
State University
Mustafa Demir, Faculty Associate and Graduate Student, College of Technology
and Innovation, Arizona State University
Survey Participant:
First Name : ……………………………………………
Last Name : …………………………………………..
Phone : ……………………………………………
E-mail : ……………………………………………
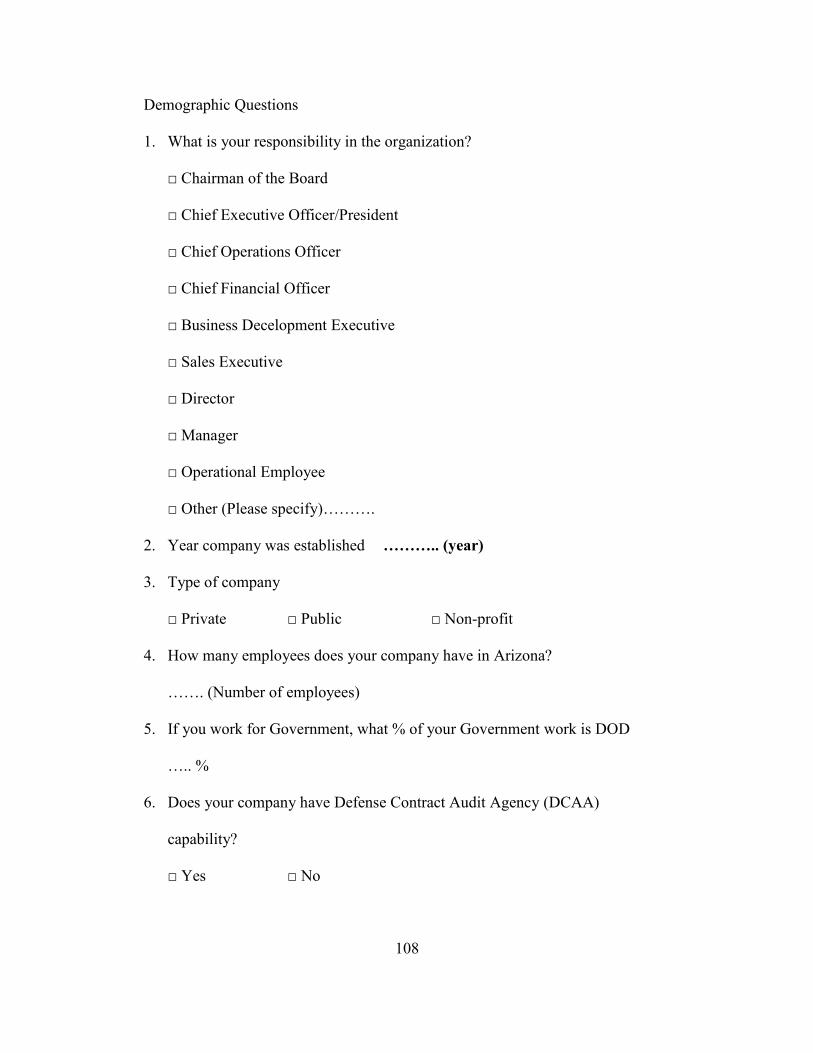
108
Demographic Questions
1. What is your responsibility in the organization?
□ Chairman of the Board
□ Chief Executive Officer/President
□ Chief Operations Officer
□ Chief Financial Officer
□ Business Decelopment Executive
□ Sales Executive
□ Director
□ Manager
□ Operational Employee
□ Other (Please specify)……….
2. Year company was established ……….. (year)
3. Type of company
□ Private □ Public □ Non-profit
4. How many employees does your company have in Arizona?
……. (Number of employees)
5. If you work for Government, what % of your Government work is DOD
….. %
6. Does your company have Defense Contract Audit Agency (DCAA)
capability?
□ Yes □ No
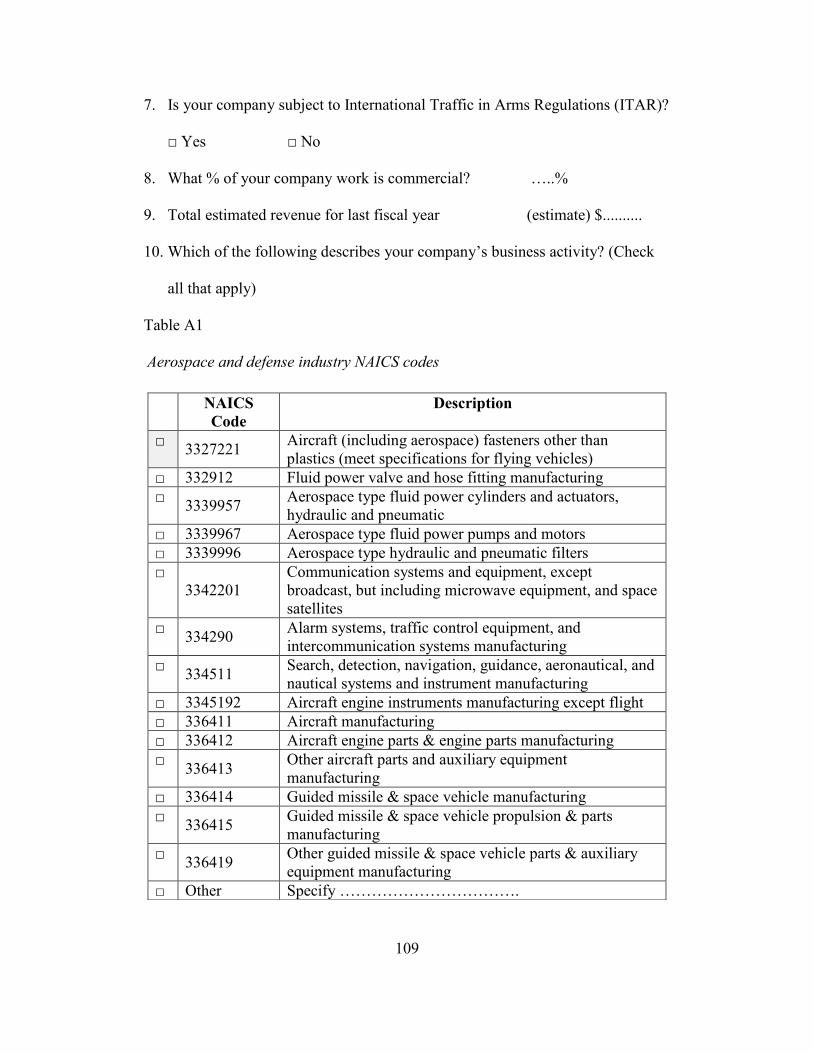
109
7. Is your company subject to International Traffic in Arms Regulations (ITAR)?
□ Yes □ No
8. What % of your company work is commercial? …..%
9. Total estimated revenue for last fiscal year (estimate) $..........
10. Which of the following describes your company’s business activity? (Check
all that apply)
Table A1
A1. Aerospace and defense industry NAICS codes
NAICS
Code
Description
□ 3327221
Aircraft (including aerospace) fasteners other than
plastics (meet specifications for flying vehicles)
□ 332912 Fluid power valve and hose fitting manufacturing
□ 3339957
Aerospace type fluid power cylinders and actuators,
hydraulic and pneumatic
□ 3339967 Aerospace type fluid power pumps and motors
□ 3339996 Aerospace type hydraulic and pneumatic filters
□ 3342201
Communication systems and equipment, except
broadcast, but including microwave equipment, and space
satellites
□ 334290
Alarm systems, traffic control equipment, and
intercommunication systems manufacturing
□ 334511
Search, detection, navigation, guidance, aeronautical, and
nautical systems and instrument manufacturing
□ 3345192 Aircraft engine instruments manufacturing except flight
□ 336411 Aircraft manufacturing
□ 336412 Aircraft engine parts & engine parts manufacturing
□ 336413
Other aircraft parts and auxiliary equipment
manufacturing
□ 336414 Guided missile & space vehicle manufacturing
□ 336415
Guided missile & space vehicle propulsion & parts
manufacturing
□ 336419
Other guided missile & space vehicle parts & auxiliary
equipment manufacturing
□ Other Specify …………………………….
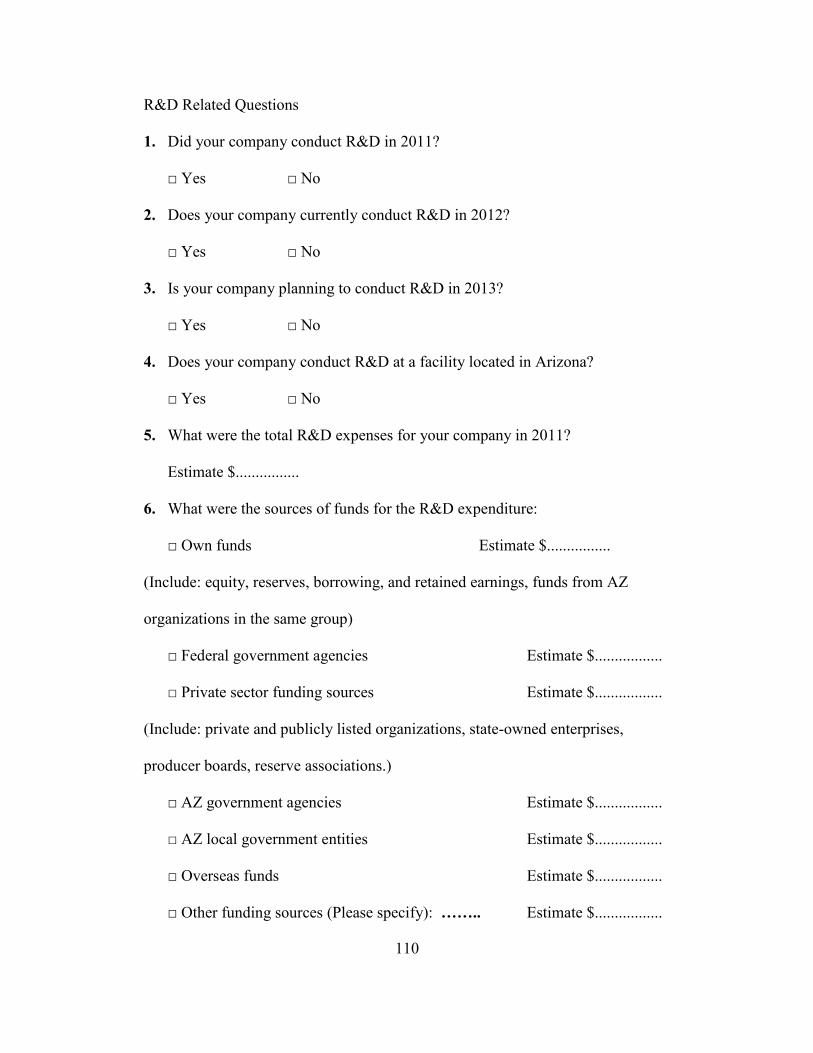
110
R&D Related Questions
1. Did your company conduct R&D in 2011?
□ Yes □ No
2. Does your company currently conduct R&D in 2012?
□ Yes □ No
3. Is your company planning to conduct R&D in 2013?
□ Yes □ No
4. Does your company conduct R&D at a facility located in Arizona?
□ Yes □ No
5. What were the total R&D expenses for your company in 2011?
Estimate $................
6. What were the sources of funds for the R&D expenditure:
□ Own funds Estimate $................
(Include: equity, reserves, borrowing, and retained earnings, funds from AZ
organizations in the same group)
□ Federal government agencies Estimate $.................
□ Private sector funding sources Estimate $.................
(Include: private and publicly listed organizations, state-owned enterprises,
producer boards, reserve associations.)
□ AZ government agencies Estimate $.................
□ AZ local government entities Estimate $.................
□ Overseas funds Estimate $.................
□ Other funding sources (Please specify): …….. Estimate $.................
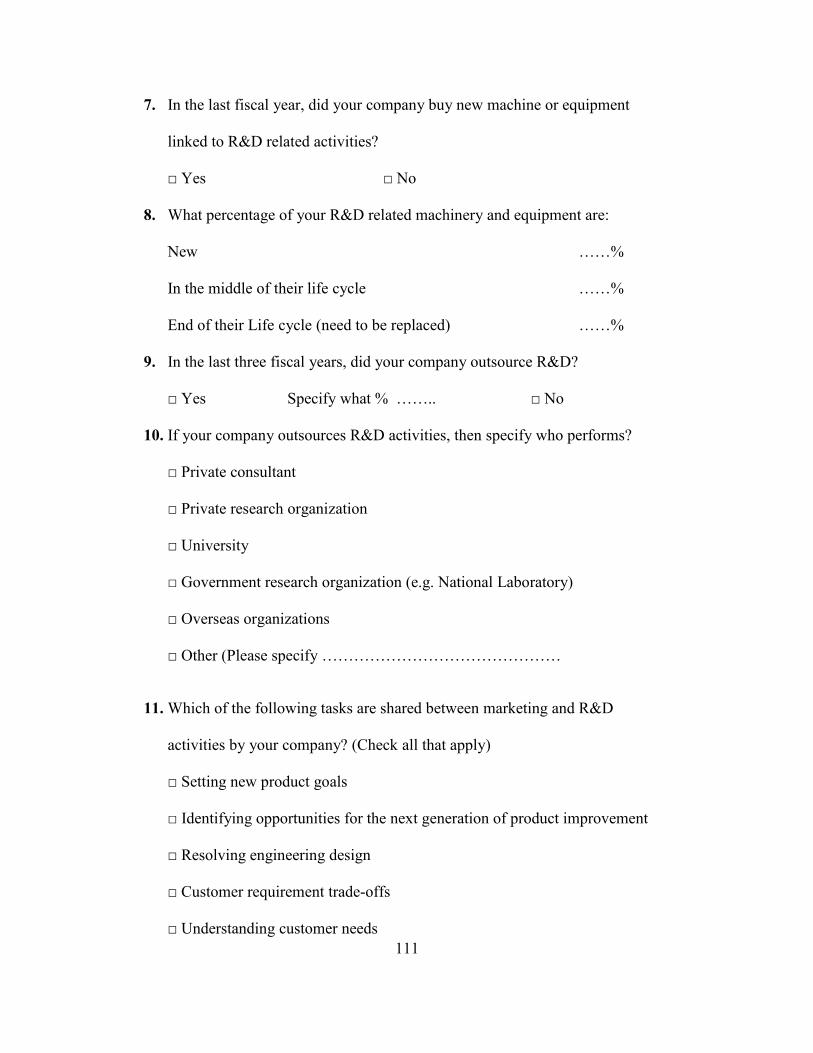
111
7. In the last fiscal year, did your company buy new machine or equipment
linked to R&D related activities?
□ Yes □ No
8. What percentage of your R&D related machinery and equipment are:
New ……%
In the middle of their life cycle ……%
End of their Life cycle (need to be replaced) ……%
9. In the last three fiscal years, did your company outsource R&D?
□ Yes Specify what % …….. □ No
10. If your company outsources R&D activities, then specify who performs?
□ Private consultant
□ Private research organization
□ University
□ Government research organization (e.g. National Laboratory)
□ Overseas organizations
□ Other (Please specify ………………………………………
11. Which of the following tasks are shared between marketing and R&D
activities by your company? (Check all that apply)
□ Setting new product goals
□ Identifying opportunities for the next generation of product improvement
□ Resolving engineering design
□ Customer requirement trade-offs
□ Understanding customer needs
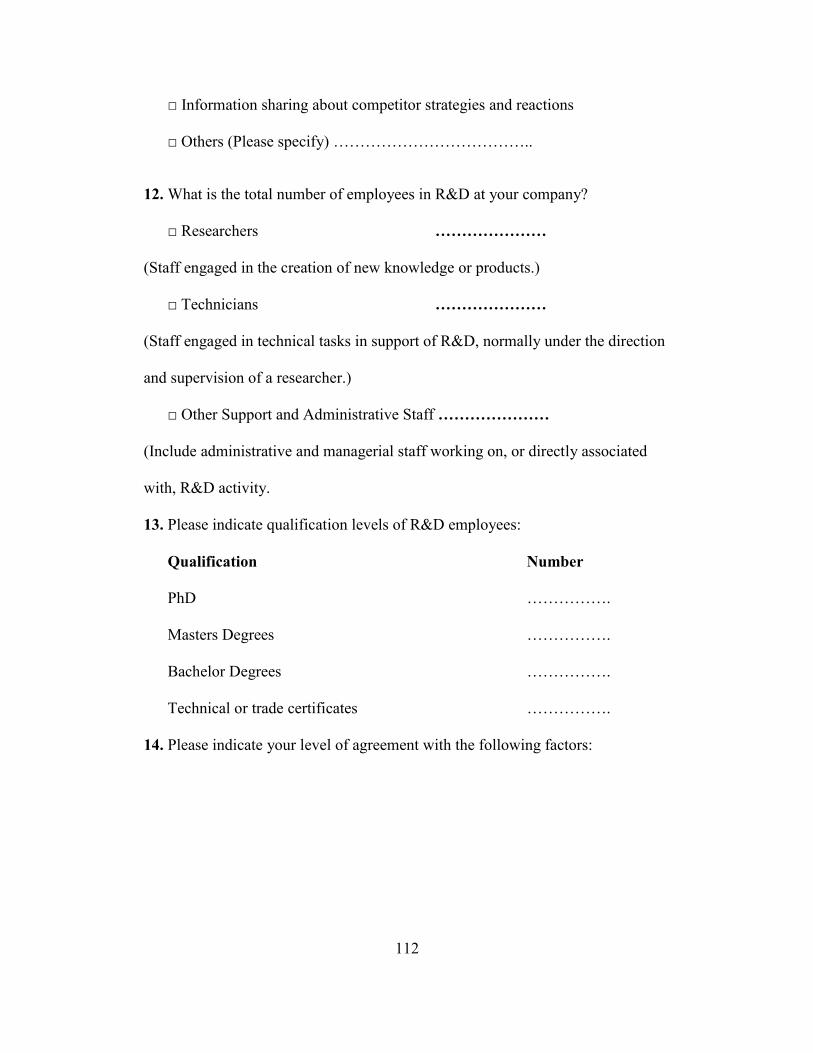
112
□ Information sharing about competitor strategies and reactions
□ Others (Please specify) ………………………………..
12. What is the total number of employees in R&D at your company?
□ Researchers …………………
(Staff engaged in the creation of new knowledge or products.)
□ Technicians …………………
(Staff engaged in technical tasks in support of R&D, normally under the direction
and supervision of a researcher.)
□ Other Support and Administrative Staff …………………
(Include administrative and managerial staff working on, or directly associated
with, R&D activity.
13. Please indicate qualification levels of R&D employees:
Qualification Number
PhD …………….
Masters Degrees …………….
Bachelor Degrees …………….
Technical or trade certificates …………….
14. Please indicate your level of agreement with the following factors:
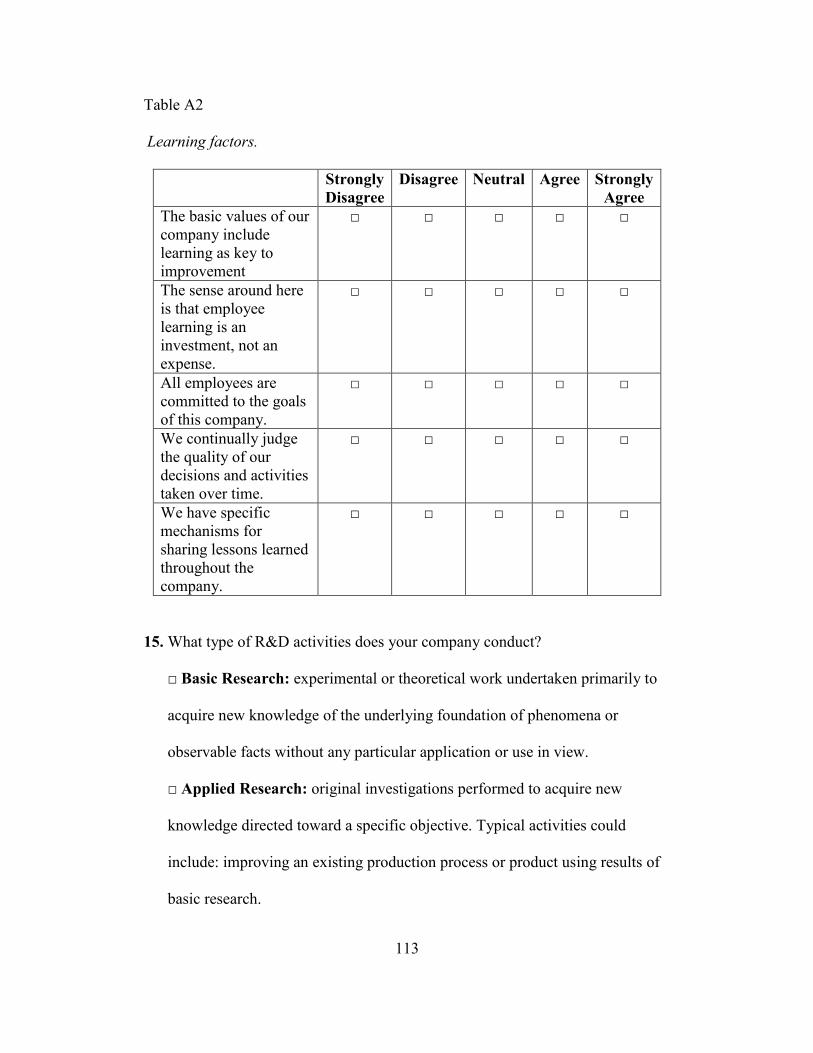
113
Table A2
A2. Learning factors.
Strongly
Disagree
Disagree Neutral Agree Strongly
Agree
The basic values of our
company include
learning as key to
improvement
□ □ □ □ □
The sense around here
is that employee
learning is an
investment, not an
expense.
□ □ □ □ □
All employees are
committed to the goals
of this company.
□ □ □ □ □
We continually judge
the quality of our
decisions and activities
taken over time.
□ □ □ □ □
We have specific
mechanisms for
sharing lessons learned
throughout the
company.
□ □ □ □ □
15. What type of R&D activities does your company conduct?
□ Basic Research: experimental or theoretical work undertaken primarily to
acquire new knowledge of the underlying foundation of phenomena or
observable facts without any particular application or use in view.
□ Applied Research: original investigations performed to acquire new
knowledge directed toward a specific objective. Typical activities could
include: improving an existing production process or product using results of
basic research.
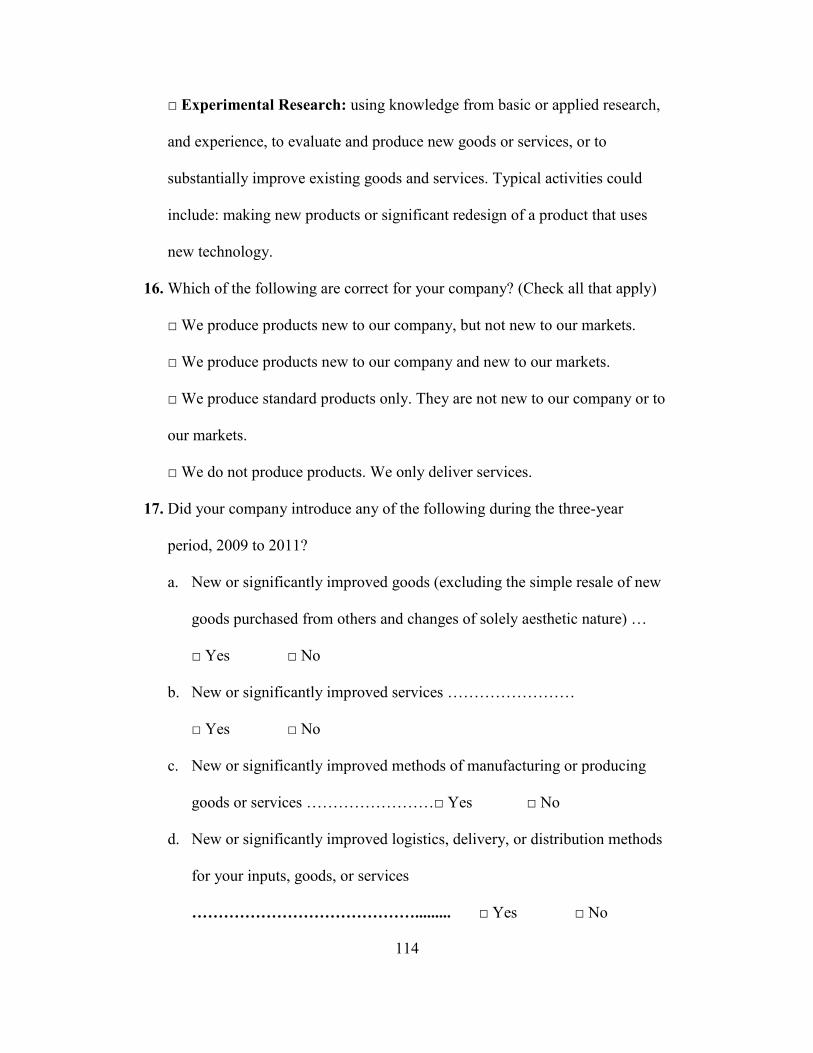
114
□ Experimental Research: using knowledge from basic or applied research,
and experience, to evaluate and produce new goods or services, or to
substantially improve existing goods and services. Typical activities could
include: making new products or significant redesign of a product that uses
new technology.
16. Which of the following are correct for your company? (Check all that apply)
□ We produce products new to our company, but not new to our markets.
□ We produce products new to our company and new to our markets.
□ We produce standard products only. They are not new to our company or to
our markets.
□ We do not produce products. We only deliver services.
17. Did your company introduce any of the following during the three-year
period, 2009 to 2011?
a. New or significantly improved goods (excluding the simple resale of new
goods purchased from others and changes of solely aesthetic nature) …
□ Yes □ No
b. New or significantly improved services ……………………
□ Yes □ No
c. New or significantly improved methods of manufacturing or producing
goods or services ……………………□ Yes □ No
d. New or significantly improved logistics, delivery, or distribution methods
for your inputs, goods, or services
……………………………………......... □ Yes □ No
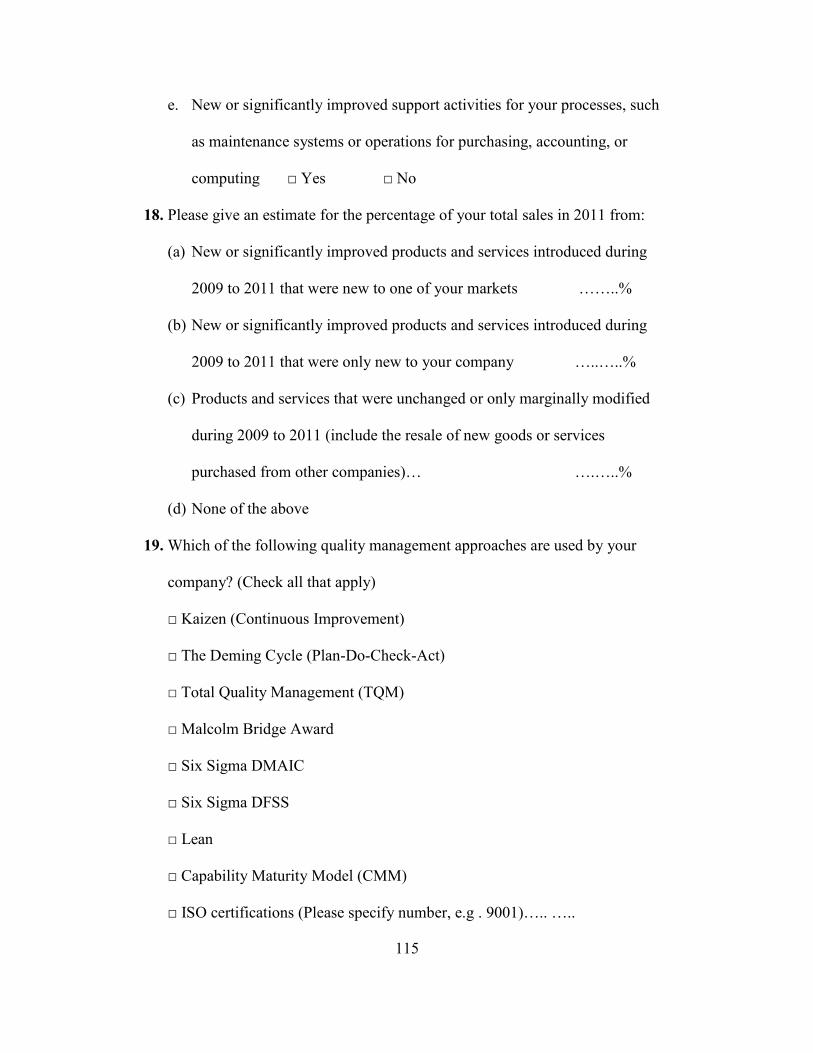
115
e. New or significantly improved support activities for your processes, such
as maintenance systems or operations for purchasing, accounting, or
computing □ Yes □ No
18. Please give an estimate for the percentage of your total sales in 2011 from:
(a) New or significantly improved products and services introduced during
2009 to 2011 that were new to one of your markets ……..%
(b) New or significantly improved products and services introduced during
2009 to 2011 that were only new to your company …..…..%
(c) Products and services that were unchanged or only marginally modified
during 2009 to 2011 (include the resale of new goods or services
purchased from other companies)… ….…..%
(d) None of the above
19. Which of the following quality management approaches are used by your
company? (Check all that apply)
□ Kaizen (Continuous Improvement)
□ The Deming Cycle (Plan-Do-Check-Act)
□ Total Quality Management (TQM)
□ Malcolm Bridge Award
□ Six Sigma DMAIC
□ Six Sigma DFSS
□ Lean
□ Capability Maturity Model (CMM)
□ ISO certifications (Please specify number, e.g . 9001)….. …..
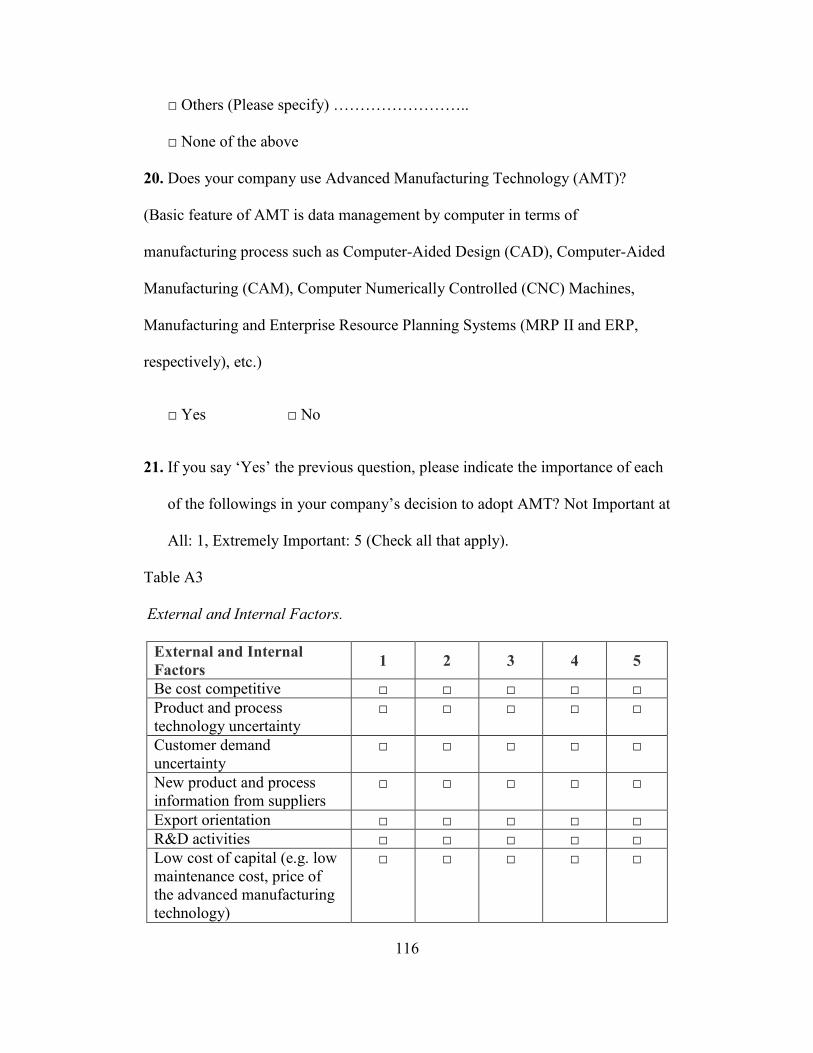
116
□ Others (Please specify) ……………………..
□ None of the above
20. Does your company use Advanced Manufacturing Technology (AMT)?
(Basic feature of AMT is data management by computer in terms of
manufacturing process such as Computer-Aided Design (CAD), Computer-Aided
Manufacturing (CAM), Computer Numerically Controlled (CNC) Machines,
Manufacturing and Enterprise Resource Planning Systems (MRP II and ERP,
respectively), etc.)
□ Yes □ No
21. If you say ‘Yes’ the previous question, please indicate the importance of each
of the followings in your company’s decision to adopt AMT? Not Important at
All: 1, Extremely Important: 5 (Check all that apply).
Table A3
A3. External and Internal Factors.
External and Internal
Factors 1 2 3 4 5
Be cost competitive □ □ □ □ □
Product and process
technology uncertainty □ □ □ □ □
Customer demand
uncertainty □ □ □ □ □
New product and process
information from suppliers □ □ □ □ □
Export orientation □ □ □ □ □
R&D activities □ □ □ □ □
Low cost of capital (e.g. low
maintenance cost, price of
the advanced manufacturing
technology)
□ □ □ □ □

117
22. Did your company export in the last fiscal year?
□ Yes □ No
23. What % of your business is exporting? ….%
24. In which geographic markets did your enterprise sell goods or services during
the past three years (2009, 2010 and 2011)?
Table 4A
A4.Geographic Markets.
Geographic Markets Yes No
Arizona □ □
The rest of the U.S. (outside of Arizona) □ □
Canada □ □
Mexico □ □
The European Union □ □
Other European Countries (e.g. Norway, Switzerland,
Turkey) □ □
Russia □ □
Central Asia (e.g. Kazakhstan, Uzbekistan, Kyrgyzstan) □ □
China □ □
Japan □ □
Other countries in East Asia, South East Asia and Australia
(e.g. the Philippines, Australia) □ □
South Asia (e.g. India, Pakistan, …) □ □
Central America, South America, the Caribbean □ □
Africa and the Middle East □ □
118
BIOGRAPHICAL SKETCH
Mustafa Demir was born in Kayseri, Turkey, on June 18, 1982. After he
graduated from Hurriyet Industrial and Technical High School, he attended the
Faculty of Simav Technical Education in Dumlupinar University, Kutahya,
Turkey, majoring in Mechanical Education in 2000. Upon graduation in 2004, he
entered the Graduate College at Erciyes University to pursue a Master of Science
(MS) in Economics. During his MS degree, he also started working at Turkish
Airlines, Inc. The development of econometric models was part of his MS thesis:
“The Importance of Innovation from the Perspective of Export Performance: The
Case of Turkish Manufacturing Industry”. The research resulted into an academic
journal article, which has been accepted for publication and appeared in Dogus
University Journal in 2012. In 2010, he entered the Graduate College at Arizona
State University to pursue his Master of Technology degree in Technological
Entrepreneurship and Innovation Management (TEIM). He worked as a research
assistant during his graduate studies. Currently, he is working as a Faculty
Associate in the department of TEIM at Arizona State University.