stability and change in new zealanders' political party support
TRANSCRIPT
NZJP, 50(2), 9-21 Stability and Change in New Zealanders’ Political Party Support
9
Stability and change in New Zealanders’ political party support
Nicole Satherley, Danny Osborne, and Chris G. Sibley School of Psychology, University of Auckland
Like in many multiparty contexts, questions remain about the nature of stability and change in New Zealanders’ partisanship. Here, we add to the literature by systematically analysing the stability and change in party support and voting using a large longitudinal national probability sample of New Zealand adults (Ns = 5,449–9,845). Support (measured from strongly oppose to strongly support) for two major and two minor parties was generally stable over two-year (.58-.84) and five-year (.51-.77) test-retest periods. Political identity centrality moderated this association such that party support was more stable among those whose political beliefs were central to their sense of self. Markov models identified relatively stable voting patterns for major parties (National and Labour), with low probabilities of switching between these parties at elections in 2014 (.04-.07) and 2017 (.04 -.12). These results suggest support for political parties (measured via behaviour and attitudes) is generally stable in New Zealand.
Keywords: Partisanship, Political Identity, Party Support, Voting Stability, Multiparty Systems
Introduction
Political parties have long received attention for their
role in shaping voters’ political attitudes and voting
behaviour. In their seminal work on the topic, Campbell,
Converse, Miller, and Stokes (1960) documented that
political partisanship was an enduring and rigid
psychological attachment to a political party that shapes
political behaviour. Such a conception has led many to
characterise party identification as an “unmoved mover”
(e.g., see Green & Palmquist, 1990)—and for good
reason. Party identification in the United States (U.S.) is
highly stable over time (Green & Palmquist, 1994; Green,
Palmquist, & Schickler, 2002). This feature of
partisanship helps to explain its capacity to shape both
policy preferences (Carsey & Layman, 2006) and political
values (Goren, Federico, & Kittilson, 2009).
Despite the important outcomes of stable political
partisanship, there has been only limited focus on its
stability in New Zealand. Indeed, questions over the
stability of party attitudes within multiparty systems have
persisted over the years (e.g., see Green et al. 2002;
Johnston 2006; Thomassen & Rosema, 2009). Whereas
identification with one party in two-party systems like the
U.S. is generally associated with low or no identification
with the other party (Schickler & Green, 1997), citizens
of multiparty systems may identify with more than one
party (Green et al., 2002; Schickler & Green, 1997).
Multiple parties may also adopt similar ideological
stances (Johnston 2006), thereby obscuring differences
between political platforms. For example, support for one
party may be readily relinquished in favour of another
when ideological disagreements arise in multiparty
systems because there are viable, ideologically similar,
substitutes. Alternatively, citizens may express greater
stability in their party preferences if more nuanced
ideological differences between parties make it easier for
voters to find the ‘best fitting’ party.
In this study, we aim to provide insights into the
stability of New Zealanders’ political party support across
the adult lifespan. Using a large longitudinal national
probability sample, we examine the stability of party
support (i.e., an attitudinal indicator of partisanship)
across two- and five-year periods, and also investigate the
hypothesis that political identity centrality (i.e., how
important one’s political beliefs are to their sense of self)
moderates these stability estimates. To complement these
analyses, we then examine stability and change in party
votes (i.e., behavioural indicators of partisanship) across
three successive national elections (2011, 2014, and 2017)
over the same period. In doing so, our analyses increase
understanding of the stability and centrality of party
attitudes of New Zealanders, as well as voters in other
multiparty systems.
Partisan stability in New Zealand and other multiparty systems
Partisanship in the United States is often assessed via
party identification—that is, how strongly one identifies
with a given political party (see Campbell et al., 1960).
Yet limitations and issues with using party identification
as a measure of partisanship have long been noted (e.g.
Thomassen & Rosema, 2009). For example, difficulties in
translating the concept of identity, and adapting the
question wording for different parties has resulted in what
Johnston (2006) refers to as a “measurement swamp” in
the cross-national literature. The original measure also
does not account for identification with multiple parties,
which is more common in multiparty systems (see Green
et al., 2002; Schickler & Green, 1997; Weisberg, 1980),
or ‘negative partisanship’ based on dislike of parties (e.g.,
Caruana, McGregor, & Stephenson, 2015; Mayer, 2017;
Rose & Misher, 1998).
Research on the stability of party attitudes in
multiparty systems has consequently utilized inconsistent
measures and produced disparate results. For example,
Kuhn (2009) found low levels of stability in voting
intentions using Swiss Household Panel data from 1999-
2007, as only 18% of respondents reported voting for the
same party in each wave (although a further 27% stated
NZJP, 50(2), 9-21 Stability and Change in New Zealanders’ Political Party Support
10
either the same party preference or no preference across
waves). Schmitt-Beck, Weick, and Christoph (2006) also
assessed party identification over an extended period
(1984-2001) in a German panel study. They found that
only around 24% of respondents remained committed to
the same party in every wave, casting doubt on the long-
term stability of partisanship in multiparty systems.
However, Schmitt-Beck et al. also noted that most of the
instability in party identification occurred due to
movement to-and-from the same party and identification
as an “independent” voter. In other words, respondents
were unlikely to switch between different parties, but
rather, varied in the constancy in which they identified
with a single party over time.
Using a unique scale assessing social identification
with political parties, Huddy, Bankert, and Davies (2018)
found evidence of stability in the strength of people’s
partisan identity in a multiparty system using data from
the British Election Study. Their standardized estimates of
stability ranged from .24 (over a period of 18 months) to
.79 (over a period of 6 months), and were somewhat
higher among Conservative (vs. Labour) Party identifiers.
Others have found even stronger evidence of the stability
of party attitudes in multiparty systems. For example,
Richardson (1991) found the stability of party
identification in Britain, the Netherlands, and West
Germany to range between r = .66 – .79 over one to three
years. Similarly, Schickler and Green (1997) found that
party identification was highly stable in Britain, Germany,
and Canada, reaching stability estimates comparable to
the U.S. Using dummy-coded variables indicating
whether or not a respondent most strongly identified with
a given party, they found R2 values generally greater than
.83 over periods ranging from 5 months to 4 years. Thus,
some studies suggest that partisanship can indeed be
highly stable in multiparty contexts.
In New Zealand, extant research on partisan stability
is scarce, and mostly predates the 1996 shift to mixed-
member proportional (MMP) representation, which
ushered in a viable multiparty political era (see Vowles,
2005). Dalton and Weldon (2007) identified similar rates
of feeling close to a party in New Zealand (56.3%)
compared to the U.S. (57%) between 1996 – 2000,
suggesting similar rates of partisanship. Lamare (1984)
also found that party identification nullifies the impact
evaluations of policies, political issues, and party
candidates have on vote choice. Yet, other studies suggest
party identification may not translate to stable partisan
behaviours over time. Aimer (1989) adapted the party
identification scale for the New Zealand context and
found high rates (86%) of identification during the 1987
election. Identification also corresponded closely to vote
choice (79% rate of matching), yet only 54% - 66% of
Labour and National Party identifiers repeatedly voted for
their party across three successive elections. Leithner
(1997) also found generally low rates (roughly 60%) of
loyal voting for the National and Labour parties from
1935 – 1987. More recently, Vowles (2016) identified a
decline in the percentage of New Zealanders reporting
strong or close party identification since 2005, which was
just below 40% in 2014. Vowles’ data also showed a
general increase in voter volatility from 1972-2014, with
around 40% of NZES participants switching their vote
(between parties or to-and-from abstention) in 2014.
Although multiparty systems possess unique qualities
that may influence stability (i.e., more parties and
potentially greater ideological diversity), these factors can
vary across contexts. Indeed, this may help to explain the
variability in stability estimates found across studies.
Analysing data from the Comparative Study of Electoral
Systems, Dassonneville, Blais, and Dejaeghere (2015)
showed that the effective number of parties in a system
moderates the volatility in party votes. Switching votes
between parties occurred more often in systems with a
greater number of parties regardless of how much
participants liked the party for which they had previously
voted (although the number of parties made no difference
when participants expressed strong dislike for the party
for which they previously voted). Given the effective
number of parties in New Zealand has been relatively
lower and more stable in recent years (i.e., 3.3 – 2.9 in
2014 and 2017 respectively, Vowles, 2018), this may
suggest relatively high levels of stability in party support
and voting behaviour during the period examined here.
Other factors may also hint at higher levels of stability.
For example, partisanship tends to be more prevalent in
older systems and is fostered through parental
socialization (Dalton & Weldon, 2007). New Zealand’s
two main political parties (National and Labour) are
longstanding in the political landscape (having been
established over 85 years ago), which may increase the
odds of inter-generational transferal of party preferences.
New Zealand’s parties are also reasonably well
ideologically polarized (Dalton, 2008), which may make
it easier for New Zealanders to perceive differences
between parties and, therefore, maintain support and
voting for a given party. Thus, several factors in
multiparty contexts may shape partisanship and the
stability of party attitudes and behaviour, and these factors
may point toward relatively high stability in New Zealand.
Overview of the present study We contribute to the literature by examining the
stability of political party support across the adult lifespan
for four main political parties in New Zealand: The
National Party, the Labour Party, the Greens, and New
Zealand (NZ) First. The centre-right National Party (in
government from 2008 – 2017) and the centre-left Labour
Party are the two major parties in New Zealand that
traditionally receive the most support during general
elections (e.g., the parties received 44.45% and 36.89% of
the vote in 2017, respectively). The Greens (6.27% of the
2017 vote), in contrast, are an environmentally focused
minor party who also advocate for greater societal
equality, and often work closely with the Labour Party.
Finally, NZ First (7.20% of the 2017 vote) tends to
combine populist sentiment with nationalism (e.g.,
promoting restrictions to immigration), yet progressively
advocate for senior citizens. In this sense, NZ First
inconsistently aligns with the left and the right, and has
formed governments with both National and Labour (see
Vowles, 2018).
Although party identification is most commonly used
to assess partisanship, notions of party support are widely
used in its description. For example, Bartle and Belluci
(2009) define partisanship as “a long-term tendency to
NZJP, 50(2), 9-21 Stability and Change in New Zealanders’ Political Party Support
11
support one party rather than another” (p. 1), whereas
Petrocik (2009) asserts that “it represents an expression of
support that influences behavior and other party-related
attitudes and assessments.” (p. 564). As such, we use
ratings of support for each party (ranging from strongly
support to strongly oppose) as an attitudinal indicator of
partisanship. Indeed, measures of party support are useful
in that they allow for both negative partisanship (i.e.,
partisanship defined by opposition toward parties;
Caruana et al., 2015) and the presence of simultaneous
support for multiple parties. We then assess the stability
of party vote as a behavioural indicator of partisanship
(see Bartels, 2000, for the strong association between
partisanship and voting in the U.S.) and, crucially,
whether party support predicts future party vote while
adjusting for the effect of prior party vote.
Research has demonstrated the utility of party support
measures to examine partisanship in New Zealand.
Highlighting the presence of multiple party commitments,
Greaves et al. (2015) conducted a latent profile analysis of
party support ratings and found that, whereas 14% of the
sample exclusively supported the Labour Party, a further
16.4% supported both the Labour Party and the Greens.
Moreover, Satherley, Yogeeswaran, Osborne, and Sibley
(2018) showed that party support was predictive of party-
consistent attitude change at the 2016 flag change
referendums, suggesting partisanship is highly central to
New Zealanders. Thus, by examining the stability of
explicit measures of party support for the first time, our
analyses provide further insight into their utility in
assessing partisanship in multiparty contexts. Whereas
most past research in New Zealand has examined
aggregated indices of partisan stability (for example,
examining overall net volatility in voting; see, e.g.,
Leithner, 1997; Vowles, 2016), our analyses also provide
a more systematic party-by-party examination of stability
including specific patterns of party vote change (i.e., the
probabilities of shifting between specific parties, or to-
and-from abstention), as well as moderators of these
effects, over time.
Although we generally expected people’s party
support to be stable over time, the amount of stability
should vary depending on the party examined. Indeed,
past research has found that preferences for minor (versus
major) parties are more susceptible to change (Kuhn 2009;
Richardson 1991; Schmitt-Beck et al. 2006). Kuhn (2009)
argues that the decline in stability for minor parties results
from their relatively low power and that support for minor
parties tends to fluctuate in relation to particularly salient
topics. Greater hostility between ideologically adjacent
parties may also promote more out-party negativity
among supporters of those parties (Richardson, 1991).
Preliminary analyses in New Zealand seem to support this
notion. Greaves, Osborne, Sengupta, Milojev, and Sibley
(2014) showed that support for the two major parties
(namely, the National Party and the Labour Party) was
more stable than support for the minor parties (including
the Greens), albeit over only a one-year period (i.e., 2009-
2010). As such, we expected support for NZ First and the
Greens to be less stable than support for the National Party
and the Labour Party. In terms of voting behaviour, New
Zealand voters may cast strategic votes between their
favoured parties based on their anticipated electoral
outcome (Bowler, Karp, & Donovan, 2010). This may
lead to lower impressions of stability when assessing party
votes over time, particularly for concurrent Labour and
Green party supporters who may switch their party vote
between these parties more often.
We also consider nuances in the stability of party
support. The instrumental approach to partisanship (i.e.,
partisanship as reflecting a ‘running tally’ of party
evaluations; Fiorina, 1981) generally explains stability in
terms of enduring expectations about political parties
(e.g., Franklin & Jackson, 1983). Yet high stability of
partisanship is specifically hypothesised by expressive
approaches to partisanship (i.e., partisanship as a deep
psychological attachment to a party; Campbell et al.,
1960), which argue that the motivated defence of partisan
identities foster party-congruent perceptions and attitudes
(rather than vice versa; see Bolsen, Druckman, & Cook,
2014). As such, we examined political identity centrality
as a moderator of party support and hypothesized that,
although party support should generally be stable, those
who report higher identity centrality (i.e., those who
consider their political beliefs to be more important to
their sense of self) should have more stable levels of
support. Finally, we also account for age differences in the
stability of support in our models, given that the stability
of partisanship increases with age (e.g., Green et al., 2002;
Sears & Funk, 1999; Stoker & Jennings, 2008). Thus, we
generally expected higher levels of stability in older age.
METHODS Sampling Procedure
We used data from Time 4 (2012), Time 6 (2014) and
Time 9 (2017) of the NZAVS, a national probability
longitudinal panel study of New Zealand adults sampled
from the New Zealand electoral roll. The Time 4 NZAVS
consisted of 12,179 participants, 5,107 of whom were
obtained through booster sampling and were completing
the survey for the first time. The Time 6 NZAVS
consisted of 15,820 participants, 9,075 of whom had
completed Time 4 (a retention rate of 74.5% of the Time
4 sample). Finally, the Time 9 (2017) NZAVS consisted
of 17,072 participants, with 6,776 participants retained
from the Time 4 sample (a 3-year retention rate of 55.6%).
For each wave, participants received a postal copy of the
questionnaire and also had the opportunity to complete the
questionnaire online. Participants could also enter a prize
draw for grocery vouchers for participation. Non-
respondents received multiple reminders to complete the
study through phone and email.
Data collection for each wave spanned approximately
one year, with Time 4 collection running from 19.09.2012
– 16.09.2013, Time 6 from 21.10.2014 – 19.08.2015, and
Time 9 from 13.08.2017 – 17.06.2018. Thus, we refer to
each wave according to when data collection began (2012,
2014, and 2017 respectively). Note that the Time 4 (2012)
wave assesses participants’ party support in 2012/13, as
well as their retrospective party vote from the 2011
election (we opted to use the Time 4/2012 wave, rather
than the Time 3/2011 wave, as NZ First support was not
assessed in the Time 3 questionnaire).
NZJP, 50(2), 9-21 Stability and Change in New Zealanders’ Political Party Support
12
Participants Participants who completed the 2012 and 2014 waves
of the NZAVS had a mean age of 50.71 years (SD = 14.56,
range = 18 – 93) in 2012, and 63% of the sample were
women. Participants were able to report more than one
ethnicity, with 89% of the sample reporting New Zealand
European, 14% Maori, 4% Asian, and 4% Pacific. Finally,
41% of the sample were religious, 72% were employed,
and 80% were born in New Zealand.
Participants who completed the 2012 and 2017 waves
of the NZAVS had a mean age of 51.24 years (SD = 14.35,
range = 18 – 93) in 2012, and 63% of the sample were
women. Participants were able to report more than one
ethnicity, with 91% of the sample reporting New Zealand
European, 12% Maori, 4% Asian, and 3% Pacific. Finally,
40% of the sample were religious, 73% were employed,
and 80% were born in New Zealand.
Measures To assess support for the National Party, Labour Party,
Green Party, and NZ First, participants were asked to
“Please rate how strongly you oppose or support each of
the following political parties”, on a scale from 1 (strongly
oppose) to 7 (strongly support). These items were asked
in 2012, 2014, and 2017. Voting behaviour was assessed
with the item “Did you vote in the New Zealand election
in 2014 (2017)” (yes/no) for the Time 6 and Time 9
NZAVS, and “Did you vote in the last (2011) New
Zealand general election?” (yes/no) in the Time 4
NZAVS, followed by, “If yes, to which party did you give
your party vote?” (open-ended). Political identity
centrality was measured with the item, “How important
are your political beliefs to how you see yourself?” (1 =
not important, 7 = very important) in both 2014 and 2017.
Model Estimation To estimate the rank-order stability of party support,
we ran a series of models regressing party support in 2014
(for the 2-year estimates) and 2017 (for the 5-year
estimates) on the same attitude measured in 2012. These
analyses adjusted for the main effect of age (including
quadratic and cubic components) and gender measured in
2012, as well as the main effect of identity centrality as
measured in either 2014 or 2017 (as this variable was not
included in the 2012 wave of the NZAVS). For these
analyses, age was scaled by a factor of 10, and age, party
support, and political identity centrality were mean-
1 We took this approach to adjust for the positive
association between age and partisan stability identified in
prior research. Because we were not testing for specific
hypotheses relating to age (except that stability would
generally be higher in older age), we tested for cubic and
quadratic terms in an exploratory manner to account for
potential non-linear trends. Gender interactions were also
included, as the NZAVS tends to over-represent women in
particular. 2 As with any analysis of this nature, it is worth noting that
our samples may contain bias that influence our stability
estimates (such as, for example, overestimating stability
among a sample that is more interested in their political
attitudes, and committed to completing surveys over time).
Analyses by Sibley et al. (2017) indicate, relative to another
major election polling source, the NZAVS does well at
centred. We further included gender by party support and
political identity centrality by party support interaction
terms, and interaction terms between party support and
linear, quadratic, and cubic terms for age. Non-significant
higher-order interactions for age were dropped from the
model until either a higher-order interaction was
significant, or only the linear age interaction term
remained (regardless of whether or not it was significant;
for similar analytical approaches examining human values
and personality traits, see Milfont, Milojev, & Sibley 2016
and Milojev & Sibley, 2014, respectively).1
The resulting models allowed us to estimate the simple
slope for party support (i.e., the stability coefficient) at
each age from 18 – 80 based on the standardized
regression terms, as well as at high and low levels of
political identity centrality. Although participants’ ages
ranged to 93 in our analyses, we calculated point estimates
for ages up to 80 years because sample sizes were
increasingly small at the tail end of the distribution (i.e.,
less than 1% of the sample was over the age of 80). As
such, estimates beyond 80 years of age would have
increasingly large standard errors.
RESULTS Rank-order stability estimates
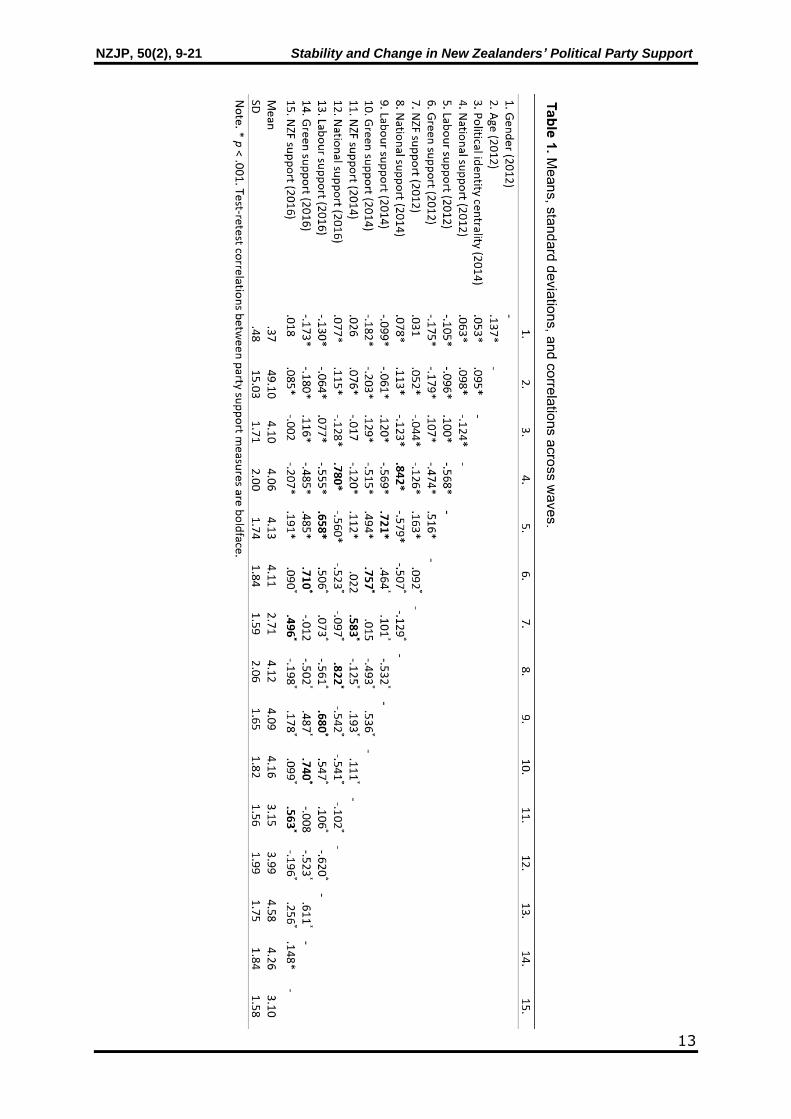
Table 1 displays correlations between measures across
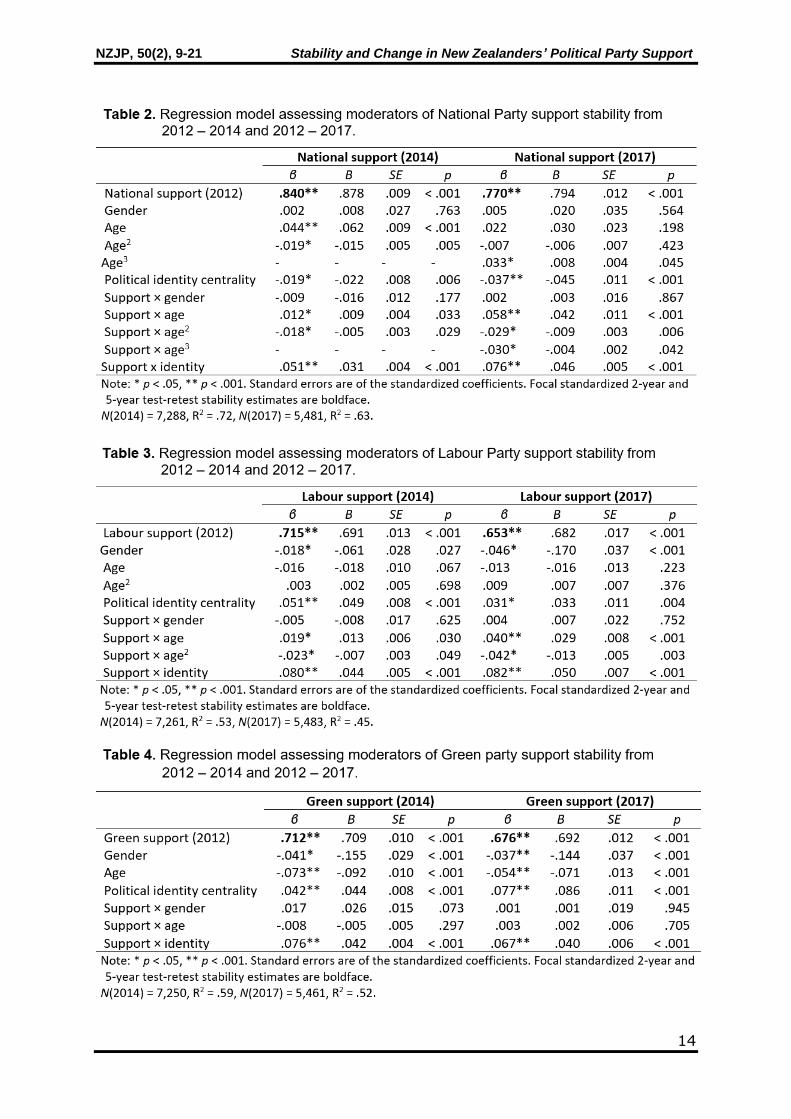
each wave examined. The standardized parameters for the
formal regression models assessing the stability of party
support are displayed in Tables 2-5. National Party
support exhibited the highest stability over both the 2-year
and 5-year test-retest periods (.84 and .77, respectively),
which reflects the party’s status as the most electorally
successful party over the period examined. Labour and
Green party support displayed comparable levels of
stability over the 2-year test-retest period (.71 and .72,
respectively), and the 5-year period (.65 and .68,
respectively). Although Labour support could be expected
to be more stable given its major party status, these
findings capture the relatively lower levels of electoral
success for the Labour Party over the 5-year period
compared to National. Consistent with our hypothesis, NZ
First support was the least stable over time. In short,
support for political parties tended to be highly stable over
time, with some variation depending on major vs. minor
party status.2
tracking party support over time. Yet the study does tend to
over-estimate Green party support, and slightly
underestimate Labour Party support. However, around 7%
of the sample for our 5-year stability estimates provided the
minimum rating of political identity centrality, with a mean
at about the mid-point of the scale, suggesting our sample is
not notably biased towards those with an interest in politics.
In this sense, because the NZAVS is an omnibus study that
assesses a range of psychological variables, it may be less
prone to over-sampling the politically engaged than a survey
with explicit ties to political beliefs. Application of sample
weighting based on gender, ethnicity, and region also had
minimal effects on our standardized stability estimates (with
some slightly decreasing, and others slightly increasing).
NZJP, 50(2), 9-21 Stability and Change in New Zealanders’ Political Party Support
13
NZJP, 50(2), 9-21 Stability and Change in New Zealanders’ Political Party Support
14
NZJP, 50(2), 9-21 Stability and Change in New Zealanders’ Political Party Support
15
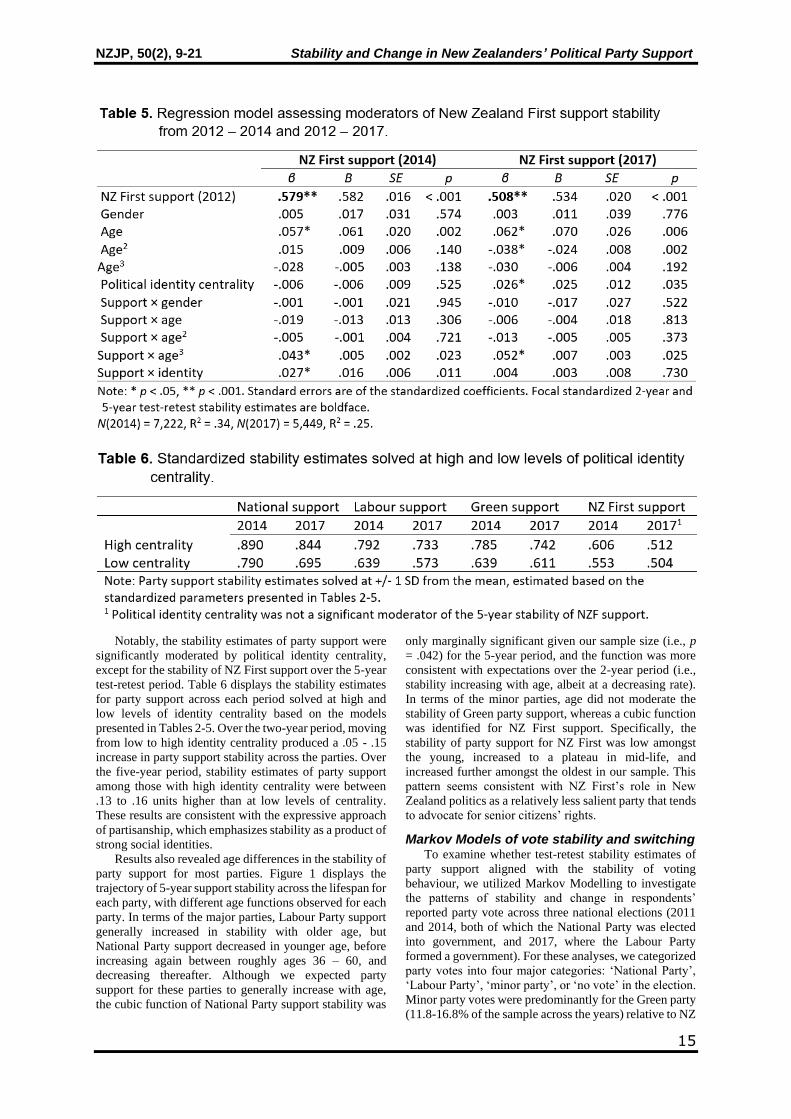
Notably, the stability estimates of party support were
significantly moderated by political identity centrality,
except for the stability of NZ First support over the 5-year
test-retest period. Table 6 displays the stability estimates
for party support across each period solved at high and
low levels of identity centrality based on the models
presented in Tables 2-5. Over the two-year period, moving
from low to high identity centrality produced a .05 - .15
increase in party support stability across the parties. Over
the five-year period, stability estimates of party support
among those with high identity centrality were between
.13 to .16 units higher than at low levels of centrality.
These results are consistent with the expressive approach
of partisanship, which emphasizes stability as a product of
strong social identities.
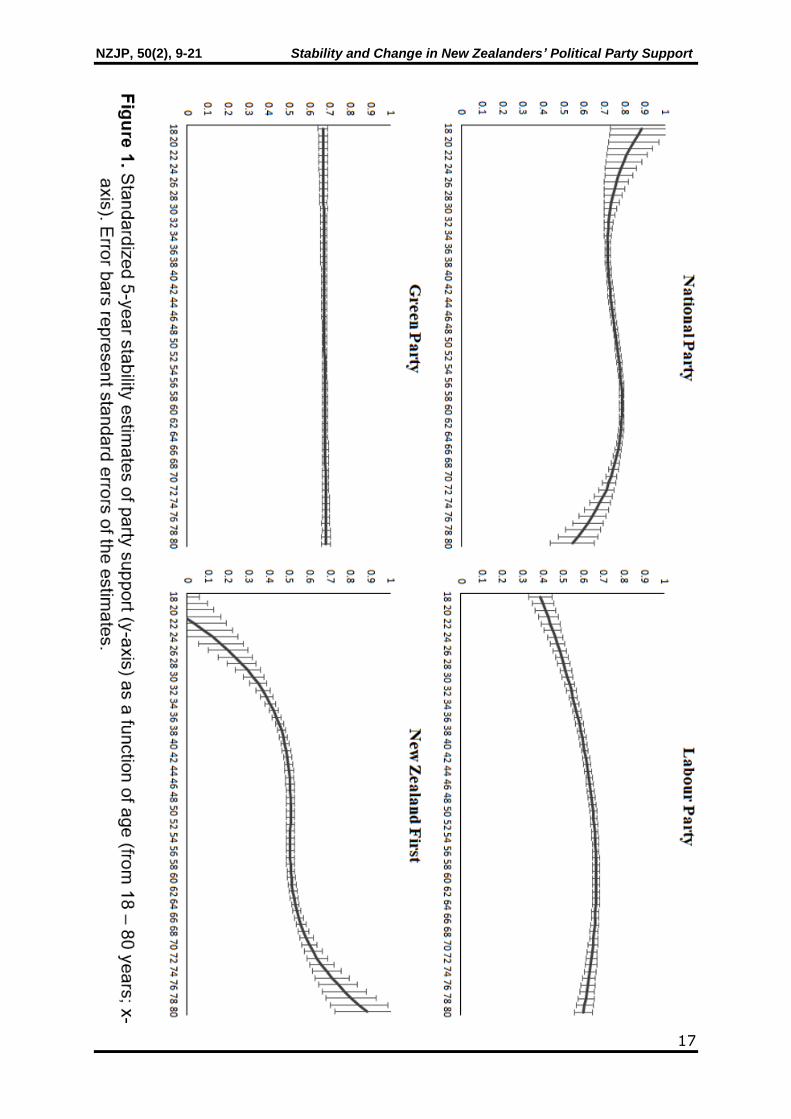
Results also revealed age differences in the stability of
party support for most parties. Figure 1 displays the
trajectory of 5-year support stability across the lifespan for
each party, with different age functions observed for each
party. In terms of the major parties, Labour Party support
generally increased in stability with older age, but
National Party support decreased in younger age, before
increasing again between roughly ages 36 – 60, and
decreasing thereafter. Although we expected party
support for these parties to generally increase with age,
the cubic function of National Party support stability was
only marginally significant given our sample size (i.e., p
= .042) for the 5-year period, and the function was more
consistent with expectations over the 2-year period (i.e.,
stability increasing with age, albeit at a decreasing rate).
In terms of the minor parties, age did not moderate the
stability of Green party support, whereas a cubic function
was identified for NZ First support. Specifically, the
stability of party support for NZ First was low amongst
the young, increased to a plateau in mid-life, and
increased further amongst the oldest in our sample. This
pattern seems consistent with NZ First’s role in New
Zealand politics as a relatively less salient party that tends
to advocate for senior citizens’ rights.
Markov Models of vote stability and switching To examine whether test-retest stability estimates of
party support aligned with the stability of voting
behaviour, we utilized Markov Modelling to investigate
the patterns of stability and change in respondents’
reported party vote across three national elections (2011
and 2014, both of which the National Party was elected
into government, and 2017, where the Labour Party
formed a government). For these analyses, we categorized
party votes into four major categories: ‘National Party’,
‘Labour Party’, ‘minor party’, or ‘no vote’ in the election.
Minor party votes were predominantly for the Green party
(11.8-16.8% of the sample across the years) relative to NZ
NZJP, 50(2), 9-21 Stability and Change in New Zealanders’ Political Party Support
16
First (3.3-5.1%) or other party (5.1-6.3%) votes. National
and Labour Party voters comprised 35-40.5% and 20.8-
33.9% of the sample across the years, respectively. Those
explicitly indicating that they did not vote made up 5.2-
7.9% of valid responses across the years, while people
who indicated that they were unsure or did not report who
they voted for (3.9-6.1% of valid responses) were
excluded from these analyses.
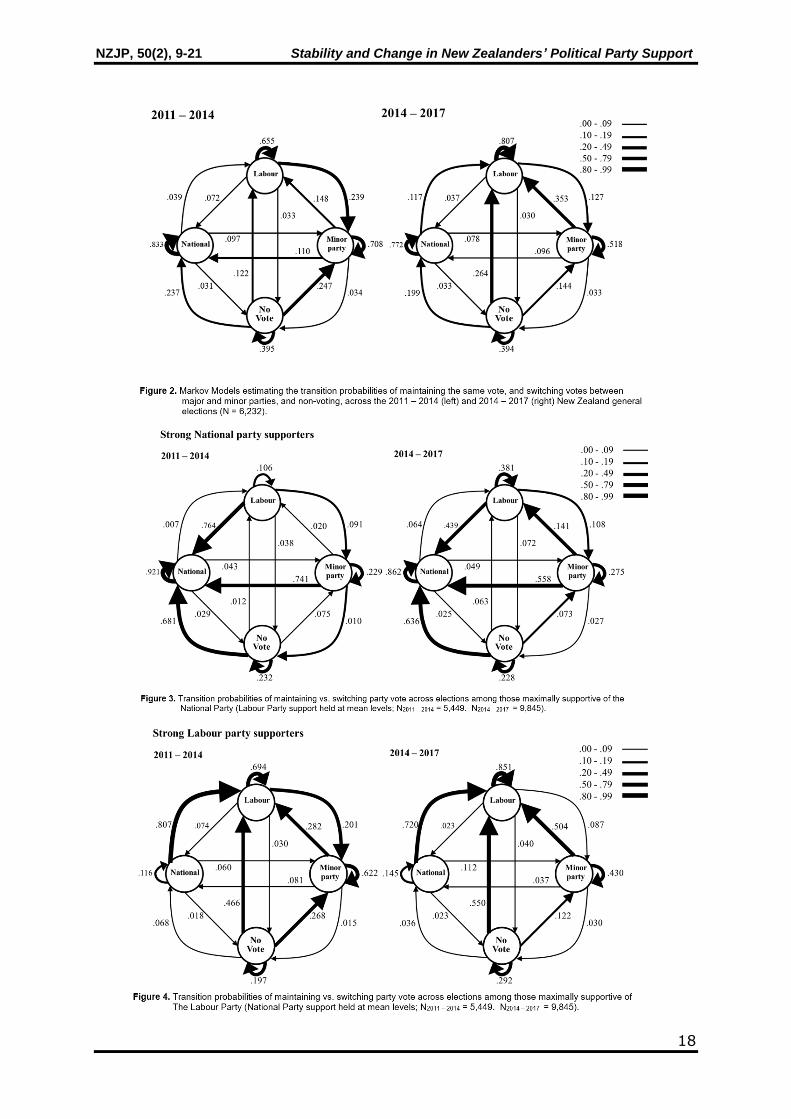
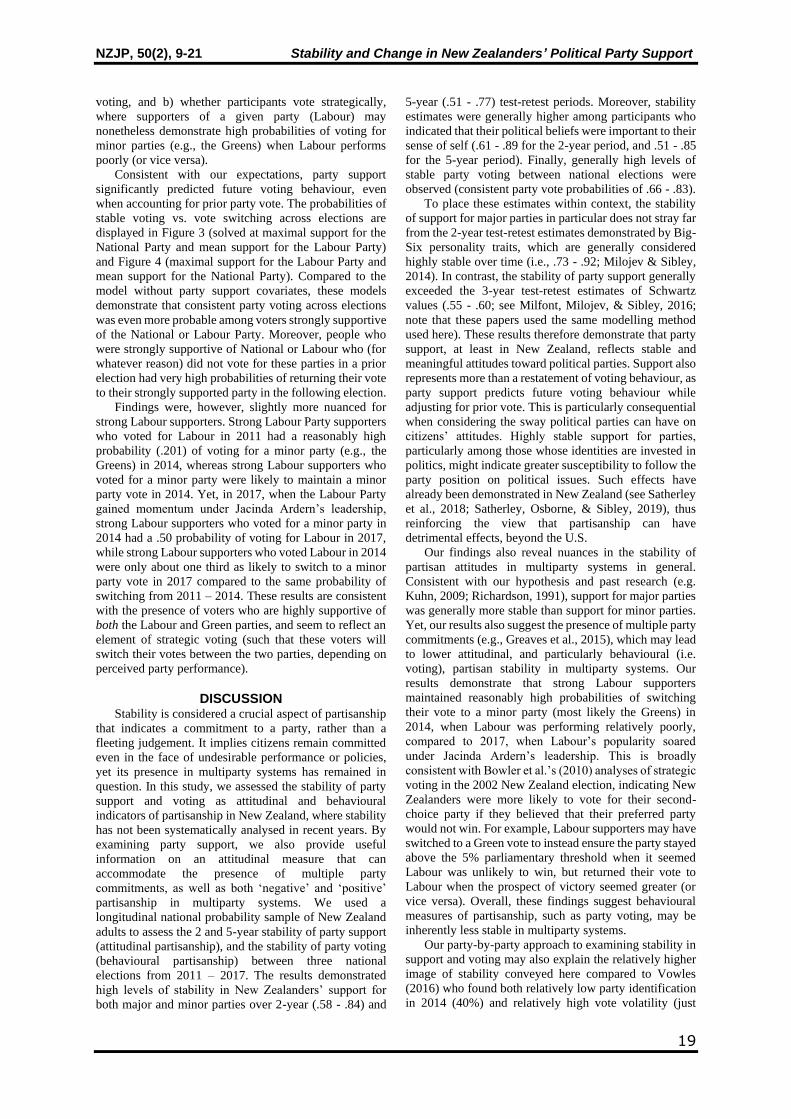
Figure 2 displays the results of a Markov Model
estimating vote transitions across the 2011, 2014, and
2017 elections without covariates. Consistent with the
results for the stability of party support, voting for the
National Party tended to be most stable over time. The
stability of voting for the Labour Party tended to be
somewhat lower across the 2011 – 2014 elections, but was
highly stable from 2014 – 2017. Across both election
cycles, the probability of switching votes between these
two major parties was very low, ranging from .04 (Labour
voters becoming National voters in 2017) and .12
(National voters becoming Labour voters in 2017).
Consistent with past research showing that some New
Zealanders solely support Labour, whereas others support
both Labour and the Green Party (Greaves et al, 2014), the
highest probabilities for vote switching occurred to-and-
from the Labour Party and minor parties (predominantly
Green Party voters).
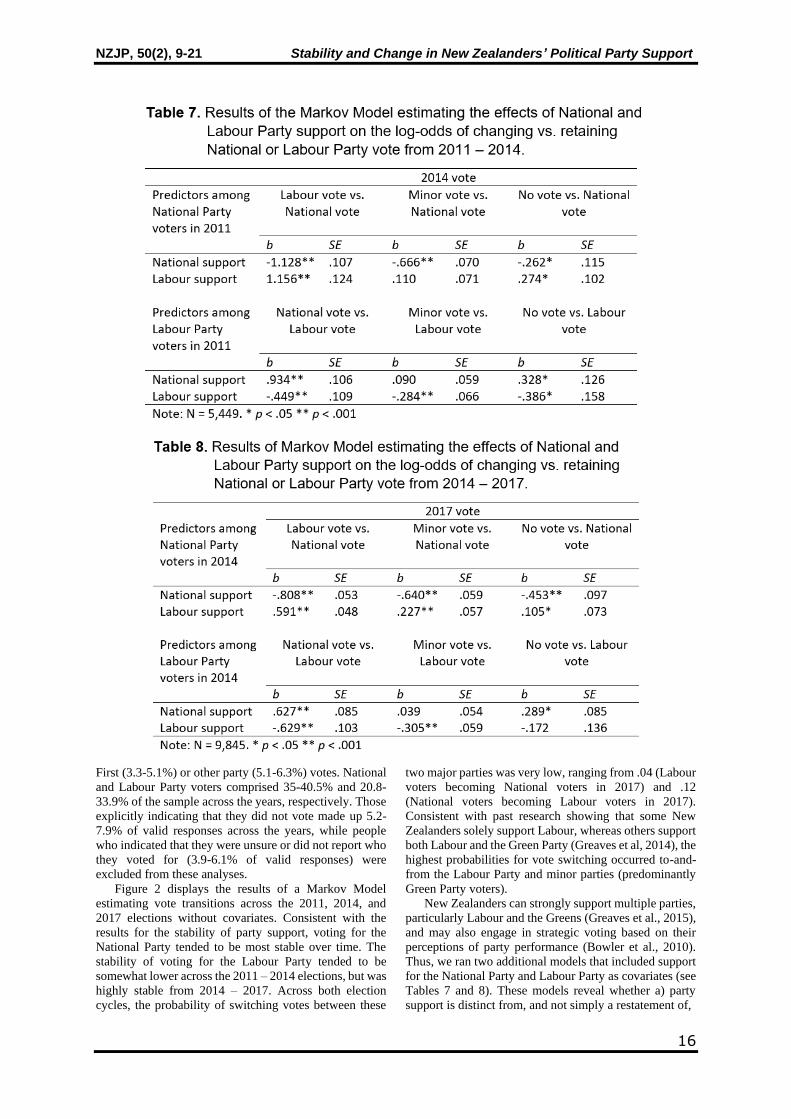
New Zealanders can strongly support multiple parties,
particularly Labour and the Greens (Greaves et al., 2015),
and may also engage in strategic voting based on their
perceptions of party performance (Bowler et al., 2010).
Thus, we ran two additional models that included support
for the National Party and Labour Party as covariates (see
Tables 7 and 8). These models reveal whether a) party
support is distinct from, and not simply a restatement of,
NZJP, 50(2), 9-21 Stability and Change in New Zealanders’ Political Party Support
17
NZJP, 50(2), 9-21 Stability and Change in New Zealanders’ Political Party Support
18
party voting, and b) whether participants vote party
NZJP, 50(2), 9-21 Stability and Change in New Zealanders’ Political Party Support
19
voting, and b) whether participants vote strategically,
where supporters of a given party (Labour) may
nonetheless demonstrate high probabilities of voting for
minor parties (e.g., the Greens) when Labour performs
poorly (or vice versa).
Consistent with our expectations, party support
significantly predicted future voting behaviour, even
when accounting for prior party vote. The probabilities of
stable voting vs. vote switching across elections are
displayed in Figure 3 (solved at maximal support for the
National Party and mean support for the Labour Party)
and Figure 4 (maximal support for the Labour Party and
mean support for the National Party). Compared to the
model without party support covariates, these models
demonstrate that consistent party voting across elections
was even more probable among voters strongly supportive
of the National or Labour Party. Moreover, people who
were strongly supportive of National or Labour who (for
whatever reason) did not vote for these parties in a prior
election had very high probabilities of returning their vote
to their strongly supported party in the following election.
Findings were, however, slightly more nuanced for
strong Labour supporters. Strong Labour Party supporters
who voted for Labour in 2011 had a reasonably high
probability (.201) of voting for a minor party (e.g., the
Greens) in 2014, whereas strong Labour supporters who
voted for a minor party were likely to maintain a minor
party vote in 2014. Yet, in 2017, when the Labour Party
gained momentum under Jacinda Ardern’s leadership,
strong Labour supporters who voted for a minor party in
2014 had a .50 probability of voting for Labour in 2017,
while strong Labour supporters who voted Labour in 2014
were only about one third as likely to switch to a minor
party vote in 2017 compared to the same probability of
switching from 2011 – 2014. These results are consistent
with the presence of voters who are highly supportive of
both the Labour and Green parties, and seem to reflect an
element of strategic voting (such that these voters will
switch their votes between the two parties, depending on
perceived party performance).
DISCUSSION
Stability is considered a crucial aspect of partisanship
that indicates a commitment to a party, rather than a
fleeting judgement. It implies citizens remain committed
even in the face of undesirable performance or policies,
yet its presence in multiparty systems has remained in
question. In this study, we assessed the stability of party
support and voting as attitudinal and behavioural
indicators of partisanship in New Zealand, where stability
has not been systematically analysed in recent years. By
examining party support, we also provide useful
information on an attitudinal measure that can
accommodate the presence of multiple party
commitments, as well as both ‘negative’ and ‘positive’
partisanship in multiparty systems. We used a
longitudinal national probability sample of New Zealand
adults to assess the 2 and 5-year stability of party support
(attitudinal partisanship), and the stability of party voting
(behavioural partisanship) between three national
elections from 2011 – 2017. The results demonstrated
high levels of stability in New Zealanders’ support for
both major and minor parties over 2-year (.58 - .84) and
5-year (.51 - .77) test-retest periods. Moreover, stability
estimates were generally higher among participants who
indicated that their political beliefs were important to their
sense of self (.61 - .89 for the 2-year period, and .51 - .85
for the 5-year period). Finally, generally high levels of
stable party voting between national elections were
observed (consistent party vote probabilities of .66 - .83).
To place these estimates within context, the stability
of support for major parties in particular does not stray far
from the 2-year test-retest estimates demonstrated by Big-
Six personality traits, which are generally considered
highly stable over time (i.e., .73 - .92; Milojev & Sibley,
2014). In contrast, the stability of party support generally
exceeded the 3-year test-retest estimates of Schwartz
values (.55 - .60; see Milfont, Milojev, & Sibley, 2016;
note that these papers used the same modelling method
used here). These results therefore demonstrate that party
support, at least in New Zealand, reflects stable and
meaningful attitudes toward political parties. Support also
represents more than a restatement of voting behaviour, as
party support predicts future voting behaviour while
adjusting for prior vote. This is particularly consequential
when considering the sway political parties can have on
citizens’ attitudes. Highly stable support for parties,
particularly among those whose identities are invested in
politics, might indicate greater susceptibility to follow the
party position on political issues. Such effects have
already been demonstrated in New Zealand (see Satherley
et al., 2018; Satherley, Osborne, & Sibley, 2019), thus
reinforcing the view that partisanship can have
detrimental effects, beyond the U.S.
Our findings also reveal nuances in the stability of
partisan attitudes in multiparty systems in general.
Consistent with our hypothesis and past research (e.g.
Kuhn, 2009; Richardson, 1991), support for major parties
was generally more stable than support for minor parties.
Yet, our results also suggest the presence of multiple party
commitments (e.g., Greaves et al., 2015), which may lead
to lower attitudinal, and particularly behavioural (i.e.
voting), partisan stability in multiparty systems. Our
results demonstrate that strong Labour supporters
maintained reasonably high probabilities of switching
their vote to a minor party (most likely the Greens) in
2014, when Labour was performing relatively poorly,
compared to 2017, when Labour’s popularity soared
under Jacinda Ardern’s leadership. This is broadly
consistent with Bowler et al.’s (2010) analyses of strategic
voting in the 2002 New Zealand election, indicating New
Zealanders were more likely to vote for their second-
choice party if they believed that their preferred party
would not win. For example, Labour supporters may have
switched to a Green vote to instead ensure the party stayed
above the 5% parliamentary threshold when it seemed
Labour was unlikely to win, but returned their vote to
Labour when the prospect of victory seemed greater (or
vice versa). Overall, these findings suggest behavioural
measures of partisanship, such as party voting, may be
inherently less stable in multiparty systems.
Our party-by-party approach to examining stability in
support and voting may also explain the relatively higher
image of stability conveyed here compared to Vowles
(2016) who found both relatively low party identification
in 2014 (40%) and relatively high vote volatility (just
NZJP, 50(2), 9-21 Stability and Change in New Zealanders’ Political Party Support
20
under 40% of New Zealand Election Study participants
switched their vote across the 2008 – 2014 elections). Our
results show that stability in voting is much higher for
major parties to compared to minor parties and non-
voting. Thus, composite measures of volatility across
parties (like those presented by Vowles, 2016) will
produce an average estimate. Moreover, data from
Vowles (2018) shows that the effective number of parties
in New Zealand has been relatively stable since 2005, and
much lower than the period between 1996-2002. For
example, the effective number of parties was at 2.9 and
3.3 in 2017 and 2014, respectively, compared to a peak of
4.4 in 1996. Thus, a smaller and more stable number of
represented parties may have given way over time to more
stable support for those parties in recent years. Finally, the
low probability for people to switch votes between the
Labour and National parties appears consistent with the
ideological polarization of parties in New Zealand
(Dalton, 2008). Despite the two major parties being
centre-left and centre-right, New Zealanders still appear
to perceive large enough differences between the parties
to consider them quite distinct.
Finally, it should be noted that our analyses are
impacted by the political context at the time. Although our
analyses are longitudinal, they remain limited to a
relatively small, stable timeframe (2011 – 2017) in New
Zealand politics. As such, indices of stability may change
depending on the political context of the time. This is
hinted at in our analyses, as the stability of support and
voting for Labour, a major party who underwent a number
of leadership changes and tended to poll poorly, was lower
than for National, a successful party that maintained
reasonably steady electoral support over the period. Data
from the 2020 election would provide a strong test of the
impact of political conditions on the stability of support
and voting for National, as their vote share dropped by
18.9 percentage points from the previous election,
whereas the Labour Party’s vote share soared as a result
of their internationally-praised response to the COVID-19
pandemic. Future analyses could examine specifically
where the votes of prior National Party voters shifted (e.g.,
to Labour, the ACT party, or to abstention), and whether
the sharp drop in votes for the National Party also
corresponded with a drop in ratings of support for the
party.
References Aimer, P. (1989). Travelling together: Party identification
and voting in the New Zealand general election of 1987.
Electoral Studies, 8(2), 131–142.
https://doi.org/10.1016/0261-3794(89)90030-9
Bartels, L. M. (2000). Partisanship and voting behavior,
1952-1996. American Journal of Political Science, 35-50.
doi: 10.2307/2669291
Bartle, J., & Bellucci, P. (2009). Introduction: Partisanship,
social identity and individual attitudes. In J. Bartle and P.
Belluci (Eds.). Political Parties and Partisanship (pp. 1-
25). New York: Routledge.
Bolsen, T., Druckman, J. N., & Cook, F. L. (2014). The
influence of partisan motivated reasoning on public
opinion. Political Behavior, 36(2), 235-262. doi:
10.1007/s11109-013-9238-0
Bowler, S., Karp, J. A., & Donovan, T. (2010). Strategic
coalition voting: evidence from New Zealand. Electoral
Studies, 29(3), 350-357. doi:
10.1016/j.electstud.2010.03.001
Campbell, A., Converse, P. E., Miller, W., & Stokes, D.
(1960). The American voter. Chicago, IL: John Wiley &
Sons.
Carsey, T. M., & Layman, G. C. (2006). Changing sides or
changing minds? Party identification and policy
preferences in the American electorate. American Journal
of Political Science, 50, 464-477. doi: 10.1111/j.1540-
5907.2006.00196.x
Caruana, N. J., McGregor, R. M., & Stephenson, L. B.
(2015). The power of the dark side: Negative partisanship
and political behaviour in Canada. Canadian Journal of
Political Science/Revue canadienne de science politique,
48, 771-789. doi: 10.1017/S0008423914000882
Dalton, R. J. (2008). The quantity and the quality of party
systems: Party system polarization, its measurement, and
its consequences. Comparative Political Studies, 41(7),
899-920. https://doi.org/10.1177/0010414008315860
Dalton, R. J., & Weldon, S. (2007). Partisanship and Party
System Institutionalization. Party Politics, 13(2), 179–
196. https://doi.org/10.1177/1354068807073856
Dassonneville, R., Blais, A., & Dejaeghere, Y. (2015).
Staying with the party, switching or exiting? A
comparative analysis of determinants of party switching
and abstaining. Journal of Elections, Public Opinion and
Parties, 25(3), 387-405.
https://doi.org/10.1080/17457289.2015.1016528
Fiorina, M. P. (1981). Retrospective voting in American
national elections. New Haven: Yale University Press.
Franklin, C. H., & Jackson, J. E. (1983). The dynamics of
party identification. American political science
review, 77(4), 957-973. doi: 10.2307/1957569
Goren, P., Federico, C. M., & Kittilson, M. C. (2009).
Source cues, partisan identities, and political value
expression. American Journal of Political Science, 53,
805-820. doi: 10.1111/j.1540-5907.2009.00402.x
Greaves, L. M., Osborne, D., Sengupta, N. K., Milojev, P.,
& Sibley, C. G. (2014). Politics and post-colonial
ideology: Historical negation and symbolic exclusion
predict political party preference. New Zealand Journal of
Psychology, 43(3), 39-54.
Greaves, L. M., Osborne, D., & Sibley, C. G. (2015).
Profiling the Fence-Sitters in New Zealand Elections: A
Latent Profile Model of Political Voting Blocs. New
Zealand Journal of Psychology, 44(2), 43-56.
Green, D. P., & Palmquist, B. (1994). How stable is party
identification? Political behavior, 16, 437-466. doi:
10.1007/BF01498826
Green, D. P., Palmquist, B., & Schickler, E. (2002).
Partisan hearts and minds: Political parties and the
social identity of voters. New Haven, CT: Yale University
Press.
Huddy, L., Bankert, A., & Davies, C. (2018). Expressive
Versus Instrumental Partisanship in Multiparty European
Systems. Political Psychology, 39, S1, 173-199. doi:
10.1111/pops.12482
Johnston, R. (2006). Party identification: Unmoved mover
or sum of preferences? Annual Review of Political
Science, 9, 329-351. doi:
10.1146/annurev.polisci.9.062404.170523
Kuhn, U. (2009). Stability and change in party preference.
Swiss Political Science Review, 15, 463-494. doi:
10.1002/j.1662-6370.2009.tb00142.x
Lamare, J. W. (1984). Party Identification and Voting
Behaviour in New Zealand. Political Science, 36(1), 1–9.
https://doi.org/10.1177/003231878403600101
NZJP, 50(2), 9-21 Stability and Change in New Zealanders’ Political Party Support
21
Leithner, C. (1997). Of Time and Partisan Stability
Revisited: Australia and New Zealand 1905-90. American
Journal of Political Science, 41(4), 1104–1127.
https://doi.org/10.2307/2960483
Mayer, S. J. (2017). How negative partisanship affects
voting behavior in Europe: Evidence from an analysis of
17 European multi-party systems with proportional
voting. Research & Politics, 4(1). doi:
10.1177/2053168016686636
Milfont, T. L., Milojev, P., & Sibley, C. G. (2016). Values
stability and change in adulthood: A 3-year longitudinal
study of rank-order stability and mean-level differences.
Personality and Social Psychology Bulletin, 42, 572-588.
doi: 10.1177/0146167216639245
Milojev, P., & Sibley, C. G. (2014). The stability of adult
personality varies across age: Evidence from a two-year
longitudinal sample of adult New Zealanders. Journal of
Research in Personality, 51, 29-37. doi:
10.1016/j.jrp.2014.04.005
Petrocik, J. R. (2009). Measuring party support: Leaners are
not independents. Electoral Studies, 28(4), 562-572. doi:
10.1016/j.electstud.2009.05.022
Reijlan, A. (2020). Fear and loathing across party lines’
(also) in Europe: Affective polarisation in European party
systems. European Journal of Political Research, 59.
https://doi.org/10.1111/1475-6765.12351
Richardson, B. M. (1991). European party loyalties
revisited. American Political Science Review, 85, 751-
775. doi: 10.2307/1963849
Rose, R., & Mishler, W. (1998). Negative and positive party
identification in post-communist countries. Electoral
Studies, 17(2), 217-234. doi: 10.1016/S0261-
3794(98)00016-X
Satherley, N., Osborne, D., & Sibley, C. G. (2019). Who Is
for (or Against) the National Flag? Ideological and
Identity‐Based Motivators of Attitudes. Analyses of Social
Issues and Public Policy, 49. 407-428.
https://doi.org/10.1111/asap.12169
Satherley, N., Yogeeswaran, K., Osborne, D., & Sibley, C.
G. (2018). If they say 'yes', we say 'no': partisan cues
increase polarisation over national symbols.
Psychological Science, 29, 1996-2009. doi:
10.1177/0956797618805420.
Schickler, E., & Green, D. P. (1997). The stability of party
identification in western democracies: results from eight
panel surveys. Comparative Political Studies, 30, 450-
483. doi: 10.1177/0010414097030004003
Schmitt-Beck, R., Weick, S., & Christoph, B. (2006). Shaky
attachments: Individual‐level stability and change of
partisanship among West German voters, 1984–2001.
European Journal of Political Research, 45, 581-608. doi:
10.1111/j.1475-6765.2006.00310.x
Sears, D. O., & Funk, C. L. (1999). Evidence of the long-
term persistence of adults' political predispositions. The
Journal of Politics, 61, 1-28. doi: 10.2307/2647773
Sibley, C. G., Robertson, A., Osborne, D., Huang, Y.,
Milojev, P., Greaves, L. M., ... & Barlow, F. K. (2017).
Bias and tracking accuracy in voting projections using the
New Zealand attitudes and values study. Political
Science, 69(1), 16-34.
Stoker, L., & Jennings, M. K. (2008). Of time and the
development of partisan polarization. American Journal of
Political Science, 52, 619-635. doi: 10.1111/j.1540-
5907.2008.00333.x
Thomassen, J., & Rosema, M. (2009). Party identification
revisited. In J. Bartle and P. Belluci (Eds.). Political
Parties and Partisanship (pp. 42-59). New York:
Routledge.
Vowles (2005). New Zealand: The Consolidation of
Reform? In M. Gallagher & P. Mitchell (Eds.) The
politics of electoral systems (pp. 295–312). New York:
Oxford University Press.
Vowles, J. (2016). Two Cheers for MMP: A Twenty-Year
Review. Plenary Address to the New Zealand Political
Studies Association Annual Conference, University of
Waikato.
Vowles, J. (2018). Surprise, surprise: the New Zealand
general election of 2017. Kōtuitui: New Zealand Journal
of Social Sciences Online, 13(2), 147-160. doi:
10.1080/1177083X.2018.1443472
Weisberg, H. F. (1980). A multidimensional
conceptualization of party identification. Political
Behavior, 2(1), 33-60. doi: 10.1007/BF00989755
Corresponding Author
Nicole Satherley
School of Psychology,
University of Auckland,
Private Bag 92019,
Auckland 1142,
New Zealand
Email: [email protected]
Acknowledgements
This research forms part of the PhD thesis of Nicole
Satherley. Collection of the NZAVS data analysed in this
paper was supported by a grant from the Templeton
Religion Trust (TRT0196) awarded to Chris Sibley.
Nicole Satherley was supported by a University of
Auckland Doctoral Scholarship. Syntax for the analyses
are available on the NZAVS website:
www.psych.auckland.ac.nz/uoa/NZAVS. A copy of the
data is available from Chris Sibley upon request for the
purpose of replicating the analyses reported here