spectral mismatch correlated with air mass under varying
TRANSCRIPT
1 Copyright © 2014 by ASME
SPECTRAL MISMATCH CORRELATED WITH AIR MASS UNDER VARYING CLEAR SKY CONDITIONS FOR PHOTOVOLTAIC FACILITIES WITH CRYSTALLINE-SILICON MODULES
SOLAR SPECTRAL EFFECTS - AN EPC CONTRACTOR’S PERSPECTIVE
Paul Johnston Fluor Enterprises, Inc.
Aliso Viejo, California, USA
ABSTRACT Photovoltaic utility-scale grid-connected power generation facilities have performance guarantee bases that often include a reference solar spectrum. EPC contractors are obligated to correct tested performance for solar spectrum, as is done for irradiance and cell temperature, to judge whether contractual performance guarantees have been satisfied. Air mass correlated with solar spectral irradiance offers a convenient way of accomplishing this. This paper offers an improvement in the versatility and accuracy of accounting for spectral effects in this manner. The effects on the spectral composition by atmospheric constituents, like aerosols and water vapor, are investigated. Spectral mismatch curves are derived that characterize the responses of the PV modules and the irradiance measurement device to both the estimated test and the reference solar spectra. Comparison of several supplier performance curves and spectral mismatch curves reveals significant discrepancies. An improvement in accuracy is proposed by the use of supplier spectral response data and estimated solar spectral profiles. Correcting for spectral effects has minimal impact at air mass values near the 1.5 reference value, but grows in significance with increasing air mass. Greater precision in accounting for solar spectral effects on PV plant performance is expected as this segment of the power generation industry matures. This paper proposes a methodology that addresses this expectation. TERMINOLOGY - GLOSSARY Absolute Air Mass (AMa) – air mass corrected for barometric pressure, applicable for sites above sea level where sunlight traverses less dense air
Aerosol – a dispersion of fine solid particles or liquid droplets, such as, haze, dust, particulates and smoke, in the atmosphere [Wikipedia] Aerosol Optical Depth (AOD) - the wavelength dependent (400 nm to 2000 nm) scattering and absorption by aerosols in the atmosphere, defined here for an optical depth at 500 nm [9,12] Air Mass (AM) – the distance sunlight traverses the atmosphere, accounting for the earth’s curvature, relative to the shortest vertical path for a site at sea level Angle of Incidence (AOI) – the angle between a PV module and the direction of the sun, which is zero for a dual-axis solar tracker Clear Sky Condition – no visible cloud coverage within 30° of the sun and the diffuse irradiance component is less than 30% of the total irradiance [20] Crystalline-Silicon (c-Si) – the most commonly used semiconductor material in the electronics industry, forming the basis for integrated circuit chips and PV solar cells [pveducation.org/pvcdrom/pn-junction/semiconductor-materials] Diffuse Horizontal Irradiance (DHI) – incident irradiance from the sky excluding that from the sun’s disk Direct Normal Irradiance (DNI) – incident irradiance within 5.7° view angle centered on the sun’s disk [19] Electromagnetic Radiation – radiation consisting of self-sustaining energy with oscillating electric and magnetic field components that travel through empty space at the speed of light Global Horizontal Irradiance (GHI) – the sum of direct, diffuse and ground reflected irradiance components on a horizontal plane, the ground reflected component is typically negligible
Proceedings of the ASME 2014 Power Conference POWER2014
July 28-31, 2014, Baltimore, Maryland, USA
POWER2014-32200
Downloaded From: http://proceedings.asmedigitalcollection.asme.org/ on 11/25/2014 Terms of Use: http://asme.org/terms
2 Copyright © 2014 by ASME
Global Tilted Irradiance (GTI) – the sum of direct, diffuse and ground reflected irradiance components on a tilted plane [29] Irradiance – the power of electromagnetic radiation per unit area [Wikipedia] Optical Depth – a measure of how opaque the atmosphere is to solar radiation passing through it [Scienceworld.Wolfram] Photovoltaic Effect – a process in which the interface between two different types of semiconductor, when struck by sunlight of sufficient energy, excites an electron producing an electrical voltage and a current when part of an electrical circuit [www.viridiansolar.co.uk/Solar_Energy_Guide_5_2.htm] Precipitable Water Vapor (PWV) – centimeters of water condensed from a column of air extending from the ground to the top of the atmosphere, an altitude of 120 kM [9] Semiconductor – a material that acts as a conductor under some conditions and as an insulator under others Short Circuit Current (Isc) – the maximum current from a solar cell occurring when the voltage across the solar cell is zero, which is essentially the same as light-generated current [pveducation.org] Solar Cell – a device with semiconductor materials, that when absorbing sunlight, an electron is raised to a higher energy state and the movement of this electron into an external circuit [pveducation.org] Solar Spectral Irradiance (E) – solar energy per unit area for a given wavelength Spectroradiometer – an instrument, a combination of a spectroscope and a radiometer, to measure electromagnetic radiation in narrow bands of wavelength [Wikipedia] Spectral Mismatch (M) – a parameter that accounts for the different PV module and irradiance measurement device spectral responsivities in the actual and the reference spectra Spectral Responsivity (SR) – ratio of the current generated in a solar cell to the incident solar energy [pveducaton.org] Zenith Angle (Z) – the angle the sun makes with the vertical, angle is zero when the sun is directly overhead INTRODUCTION
By virtue of the fact that photovoltaic (PV) power plant guarantees are typically based on the ASTM G173-03 [9] or other standard solar spectra, a method of correction is necessary. The idea of using a single air mass correction curve to represent the solar spectral effect is a simplification of a more complex problem. Supplier PV module air mass performance curves and software generated performance curves are presented. While this paper focuses on crystalline-silicon PV modules, the same analysis is valid for all PV module technologies [3,4].
This paper addresses the need for the EPC contractor to correct measured performance to contractual guarantee conditions. NREL research papers by Osterwald et al [3] and Marion [4] explore the accuracy and complexities of developing reliable air mass performance curves, incorporating results from research testing activities. Much of the material
for this paper is derived from their work. Noteworthy is that many of the references do not distinguish between mono-crystalline-silicon and multi (or poly)-crystalline-silicon PV modules.
ELECTROMAGNETIC RADIATION AND SOLAR ENERGY SPECTRA
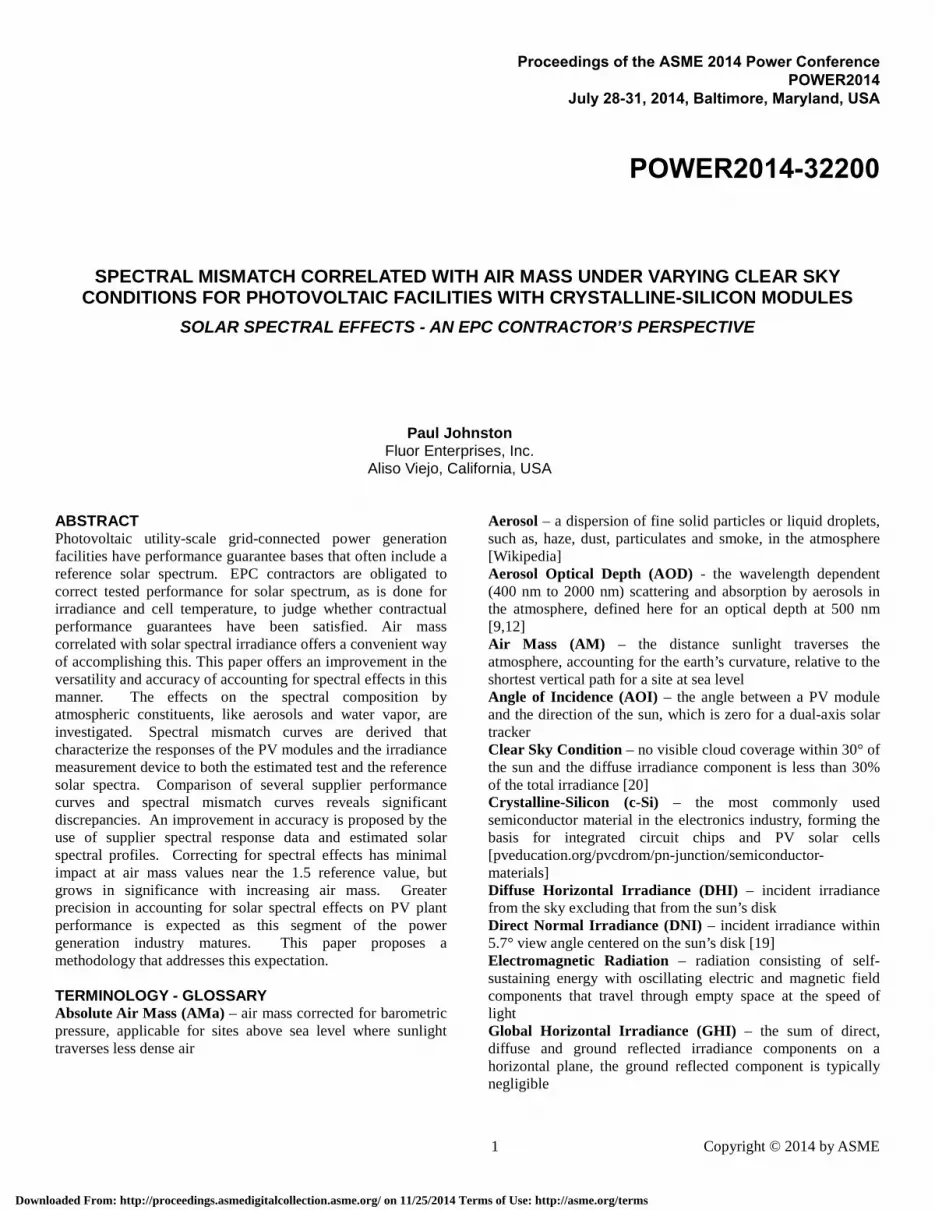
The electromagnetic radiation spectrum, Figure 1, extends from short wavelength (high-frequency, high energy) gamma rays to long wavelength (low-frequency, low-energy) radio waves. This energy reaches the earth mostly from the Sun, with small contributions from other more distant astronomical sources. Much of the highest energy portion of the spectrum is screened out by the atmosphere.
Solar energy, useful for generating electricity in a PV module, is composed of a range of wavelengths that span the ultraviolet, visible and infrared segments of the electromagnetic spectrum, known as the solar energy spectrum. This energy produces an electrical current in a semiconductor material like silicon, known as the photovoltaic effect.
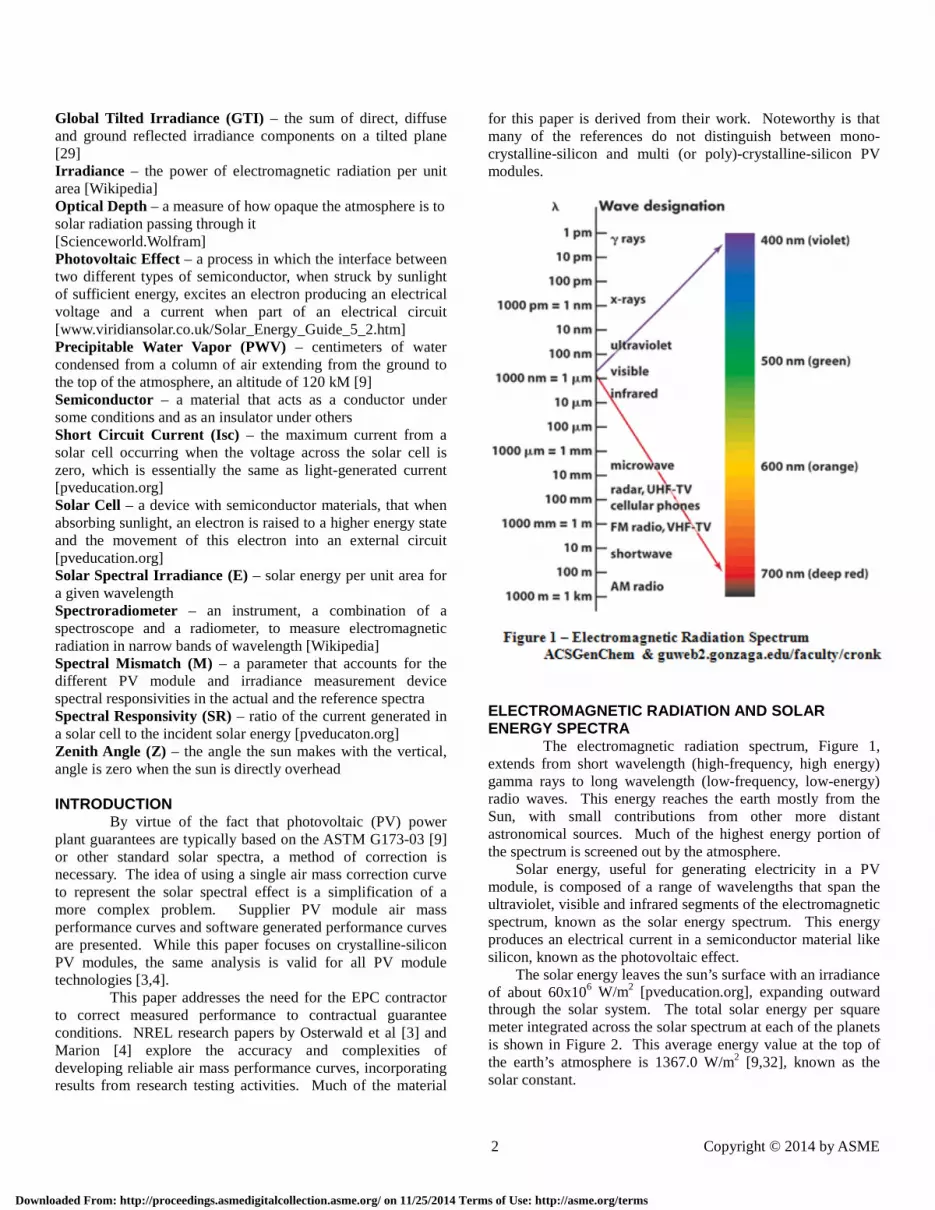
The solar energy leaves the sun’s surface with an irradiance of about 60x106 W/m2 [pveducation.org], expanding outward through the solar system. The total solar energy per square meter integrated across the solar spectrum at each of the planets is shown in Figure 2. This average energy value at the top of the earth’s atmosphere is 1367.0 W/m2 [9,32], known as the solar constant.
Downloaded From: http://proceedings.asmedigitalcollection.asme.org/ on 11/25/2014 Terms of Use: http://asme.org/terms
3 Copyright © 2014 by ASME
An expanded look at the solar energy spectrum is shown in Figure 3 as solar spectral irradiance (sunlight intensity) versus wavelength. The extraterrestrial (at the top of the atmosphere) and sea level spectra are displayed. Noteworthy is the attenuation of the spectral irradiance by the atmosphere. This attenuation (extinction and absorption) of the spectral irradiance is sensitive to wavelength, where O3, O2, CO2 and H2O play a part in this process, as do aerosols and other constituents. At certain wavelengths, these atmospheric effects reduce the spectral irradiance to zero.
The solar energy spectrum is generally composed of 5% ultraviolent (300 nm – 400 nm), 43% visible (400 nm-700 nm) and 52% near-infrared (700 nm – 2500 nm) light. PV modules across all technologies respond to wavelengths generally in the range of 200 nm to 1400 nm [5,10,16], see Figure 4, with multi-junction modules extending up to 1900 nm [11]. Specifically, crystalline-silicon modules are sensitive to wavelengths between approximately 280 nm to 1200 nm. Noteworthy is that thermopile pyranometers are insensitive to wavelength, they respond to energy across the solar spectrum with no preference to wavelength.
SMARTS - SPECTRAL MODEL FOR PHOTOVOLTAIC APPLICATIONS
The Simple Model for the Atmospheric Radiative Transfer of Sunshine (SMARTS) atmospheric transmission code, version 2.9.5, developed by Dr. Christian Gueymard [1,2,32] was used throughout this study to define the solar spectral irradiance profiles. Version 2.9.2 of this code is the basis of the ASTM G173-03 [9] standard US solar spectrum at sea level for an air mass of 1.5, see Figure 5. This standard spectrum is based on
Downloaded From: http://proceedings.asmedigitalcollection.asme.org/ on 11/25/2014 Terms of Use: http://asme.org/terms

4 Copyright © 2014 by ASME
the US standard atmosphere (USSA), defined in Nann and Emery [6] and refined for ASTM G173-03 [9] to contain 1.4164 cm of precipitable water vapor (PWV), 0.3438 atm-cm of ozone and 370 ppm of carbon dioxide, all in a vertical column from the ground to the top of the atmosphere and a rural aerosol model with an aerosol optical depth (AOD) of 0.084 at 500 nm. This set of units is standard in the literature and atm-cm is a measure of the height of a gas collected at the bottom of a column at one atmosphere.
The SMARTS code has the flexibility to not only show the effect of absolute air mass on the transmitted solar spectral irradiance, but capture the effects associated with varying atmospheric constituents, such as, aerosols, water vapor, ozone, carbon dioxide and other gases. This capability is fundamental to producing spectral irradiance curves under varying conditions and the development of representative PV module spectral performance curves, as will be illustrated. The influences of ozone, carbon dioxide and other gases are more subtle and not considered here.
ABSOLUTE AIR MASS AND ATMOSPHERIC CONSTITUENTS
Air mass has an effect similar to atmospheric constituents on the broadband solar spectrum. Absolute air mass (AMa) accounts for the reduced atmospheric attenuation above sea level, where sunlight traverses less dense air, and has been widely used to account for solar spectral effects [18]. The exponential variation of barometric pressure with altitude is used along with air mass to calculate AMa, as King [19] shows in Equations (1-3), taking into account the earth’s curvature. The solar zenith angle is Z, P and P0 are site and sea level barometric pressures and altitude is represented by h, in meters.
AM =1
[cos(Z) + 0.5057(96.080 − Z)−1.634] (1)
PP0
= e−0.0001184h (2)
AMa =PP0
(AM) (3)
The transmittance and absorption by atmospheric
constituents like AOD and PWV strongly depend on the path length of light through the atmosphere and their optical depths. These phenomena and air mass dominate in modifying the extraterrestrial spectrum to produce the transmitted spectral profile [11]. Ignoring these complex constituent processes may
introduce errors greater than would result in disregarding spectral effects [3,4,10]. Combining the effects of air mass and atmospheric constituents improves the accuracy of predicted spectral performance trends [4].
SOLAR SPECTRAL IRRADIANCE CURVES Solar spectral irradiance is attenuated as it travels
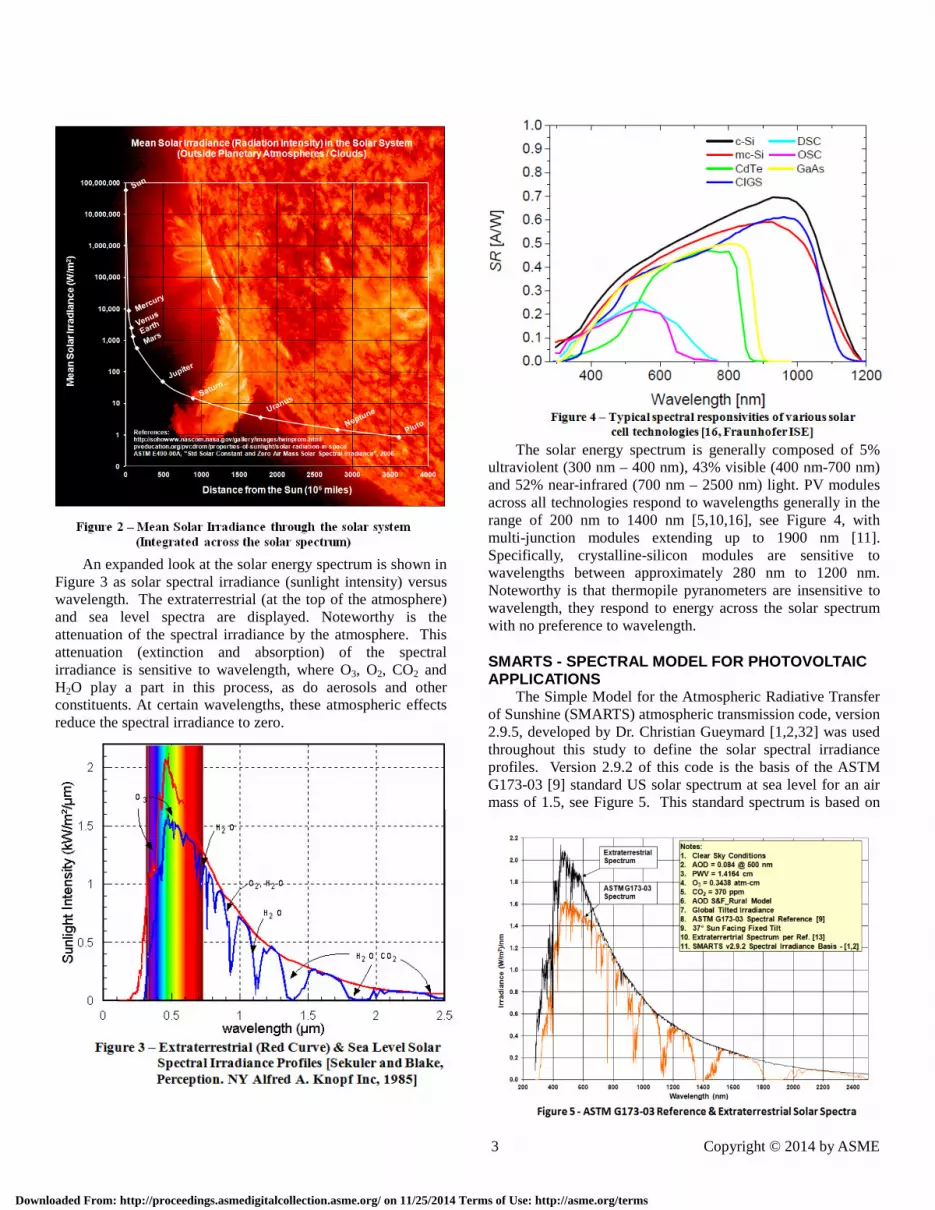
through the atmosphere by a variety of mechanisms, as previously described. Figure 6 shows a family of spectral irradiance curves for select AMa values and PV reference cell spectral responsivity curves. The AMa curves imply the USSA for zero angle of incidence (AOI).
The total irradiance on an inclined PV module is the global tilted irradiance (GTI), with direct, diffuse and reflected irradiance components, as shown in Equations (4-6) [29,30], and is the basis of the ASTM G173-03 and the Figure 6 spectra curves. Equation 5, from Gueymard [29], shows the transposition and albedo parameters that describe these components, the details of which are beyond the scope of this paper. Variables are; diffuse and reflection transposition parameters (Rd and Rr), albedo (ρ) and AOI (θ).
GTI = Direct + Diffuse + Re�lected (4)
GTI = (DNI) cos(θ) + (DHI)(Rd) + (ρ)(GHI)(Rr) (5)
Where,
GHI = (DNI) cos(Z) + DHI (6)
SPECTRAL MISMATCH Spectral effects have traditionally been accounted for
by using the air mass function. An air mass function curve for the SunPower SPR-230-WHT-U PV module and empirically based calibration data for the same, normalized to AMa of 1.5, are shown in Figure 7 [3]. The curve represents the air mass function trend based on perhaps limited data and an inaccurate extrapolation. The empirical data points are for clear sky conditions, revealing a more realistic trend. The scatter in the data may be due to variations in other atmospheric constituents, such as, AOD and PWV. The potential for incurring errors when using certain supplier provided air mass functions to correct for solar spectral effects can be significant, especially for AMa values above 2.5. To address this, the spectral mismatch parameter is introduced [17], which can account for atmospheric effects by the use of standard, estimated or measured values for AOD and PWV, a representative aerosol model [32] and PV module spectral response data.
Downloaded From: http://proceedings.asmedigitalcollection.asme.org/ on 11/25/2014 Terms of Use: http://asme.org/terms
5 Copyright © 2014 by ASME
The spectral mismatch parameter (M) represents the expected variation in PV module performance as a function of the solar spectrum, which is dependent on AMa, AOD, PVW and other atmospheric constituents. It is defined in Equation (7) as the ratio of the short-circuit currents of the PV module and irradiance measurement device for the test spectrum over
the ratio of the short-circuit currents of the PV module and irradiance measurement device for the reference spectrum. Alternatively, it can be defined as the ratio of the short circuit currents of the irradiance measurement device for the reference and test spectra over the ratio of the short-circuit currents of the PV module for the reference and test spectra [8,11].
𝑀 =
𝐼𝑠𝑐|𝐸𝑡, 𝑆𝑅𝑚𝐼𝑠𝑐|𝐸𝑡, 𝑆𝑅𝑖𝐼𝑠𝑐|𝐸𝑟, 𝑆𝑅𝑚𝐼𝑠𝑐|𝐸𝑟, 𝑆𝑅𝑖
𝑜𝑟
𝐼𝑠𝑐|𝐸𝑟, 𝑆𝑅𝑖𝐼𝑠𝑐|𝐸𝑡, 𝑆𝑅𝑖𝐼𝑠𝑐|𝐸𝑟, 𝑆𝑅𝑚𝐼𝑠𝑐|𝐸𝑡, 𝑆𝑅𝑚
(7)
Where: Isc|Et,SRm is the short-circuit current of the PV
module under the test spectrum Isc|Et,SRi is the short-circuit current of the measurement device under the test spectrum Isc|Er,SRm is the short-circuit current of the PV module under the reference spectrum Isc|Er,SRi is the short-circuit current of the measurement device under the reference spectrum E is the reference (r) or test (t) spectral irradiance and is a function of the wavelength of light (λ), (W/m2)/nm SR is the spectral responsivity of the PV module (m) or measurement device (i), also a function of λ, (A/W)
Downloaded From: http://proceedings.asmedigitalcollection.asme.org/ on 11/25/2014 Terms of Use: http://asme.org/terms
6 Copyright © 2014 by ASME
Short-circuit current in a solar cell as shown by Osterwald [3]:
𝐼𝑠𝑐 = 𝐴� 𝐸(𝜆)𝑆𝑅(𝜆)𝑑𝜆𝜆2
𝜆1 (8)
Where A is the PV module or irradiance measurement device surface area and λ is wavelength. Remembering that thermopile pyranometers are insensitive to the wavelength of light:
𝐼𝑠𝑐|𝑖 = (𝐴)(𝑆𝑅𝑖)� 𝐸(𝜆)𝑑𝜆𝜆4
𝜆3 (9)
For the case where the irradiance measurement device is a pyranometer:
M =
∫ Et(λ)SRm(λ)dλλ2λ1
∫ Et(λ)dλλ4λ3
∫ Er(λ)SRm(λ)dλλ2λ1
∫ Er(λ)λ4λ3 dλ
(10)
The limits of integration are set by the sensitivities of the PV module and the irradiance measurement device. For the PV module, the limits are approximately 280 nm to 1200 nm, for a pyranometer, 310 nm to 2800 nm [4,11].
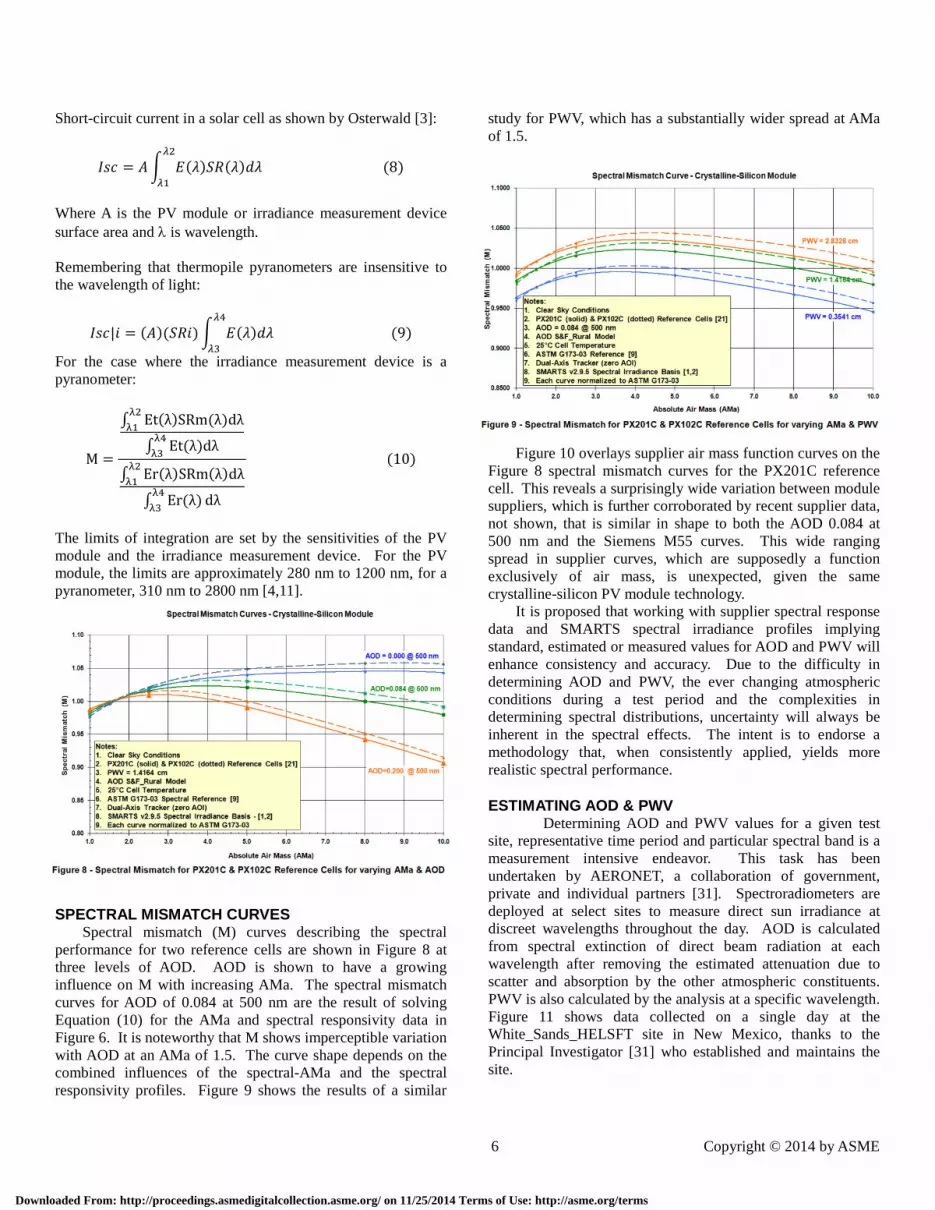
SPECTRAL MISMATCH CURVES Spectral mismatch (M) curves describing the spectral
performance for two reference cells are shown in Figure 8 at three levels of AOD. AOD is shown to have a growing influence on M with increasing AMa. The spectral mismatch curves for AOD of 0.084 at 500 nm are the result of solving Equation (10) for the AMa and spectral responsivity data in Figure 6. It is noteworthy that M shows imperceptible variation with AOD at an AMa of 1.5. The curve shape depends on the combined influences of the spectral-AMa and the spectral responsivity profiles. Figure 9 shows the results of a similar
study for PWV, which has a substantially wider spread at AMa of 1.5.
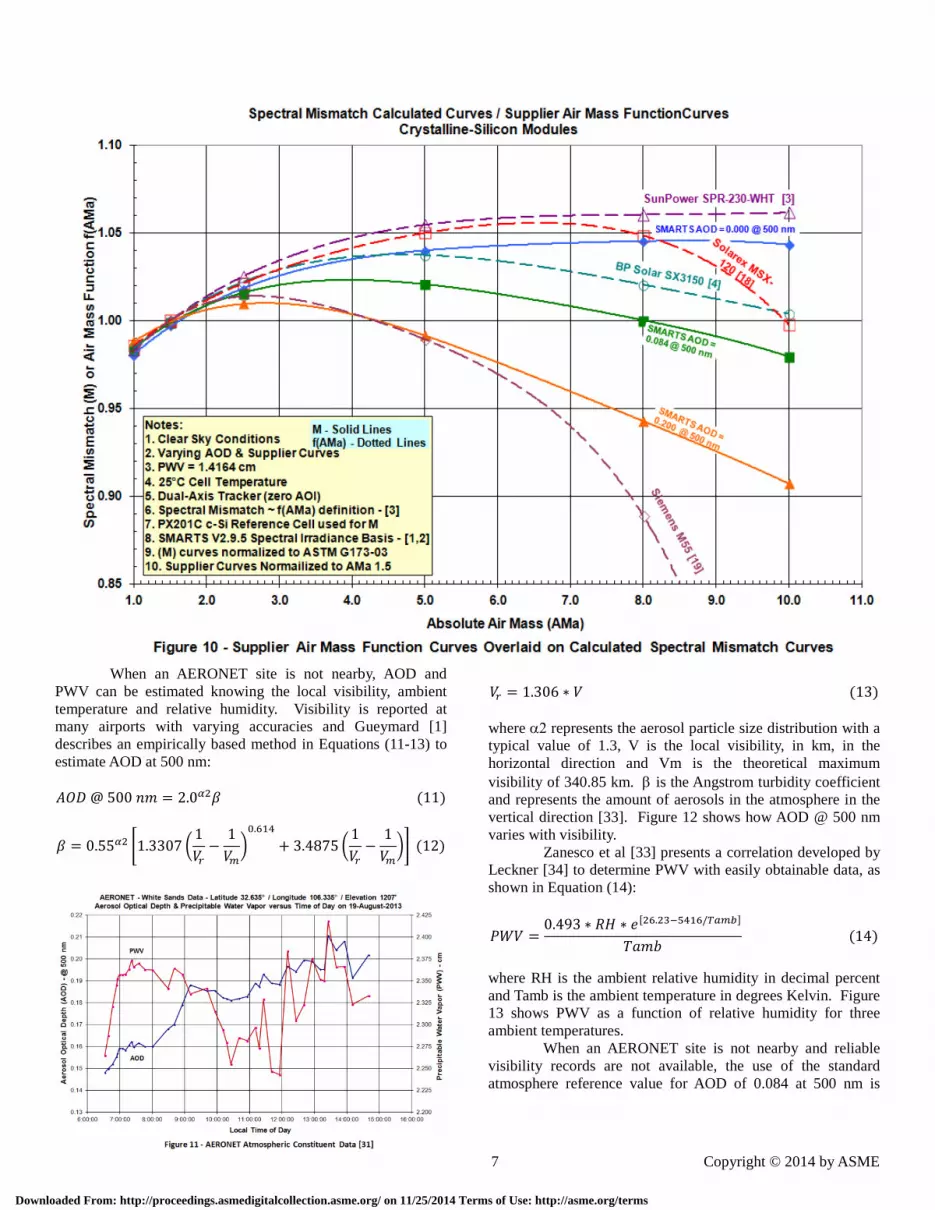
Figure 10 overlays supplier air mass function curves on the Figure 8 spectral mismatch curves for the PX201C reference cell. This reveals a surprisingly wide variation between module suppliers, which is further corroborated by recent supplier data, not shown, that is similar in shape to both the AOD 0.084 at 500 nm and the Siemens M55 curves. This wide ranging spread in supplier curves, which are supposedly a function exclusively of air mass, is unexpected, given the same crystalline-silicon PV module technology.
It is proposed that working with supplier spectral response data and SMARTS spectral irradiance profiles implying standard, estimated or measured values for AOD and PWV will enhance consistency and accuracy. Due to the difficulty in determining AOD and PWV, the ever changing atmospheric conditions during a test period and the complexities in determining spectral distributions, uncertainty will always be inherent in the spectral effects. The intent is to endorse a methodology that, when consistently applied, yields more realistic spectral performance.
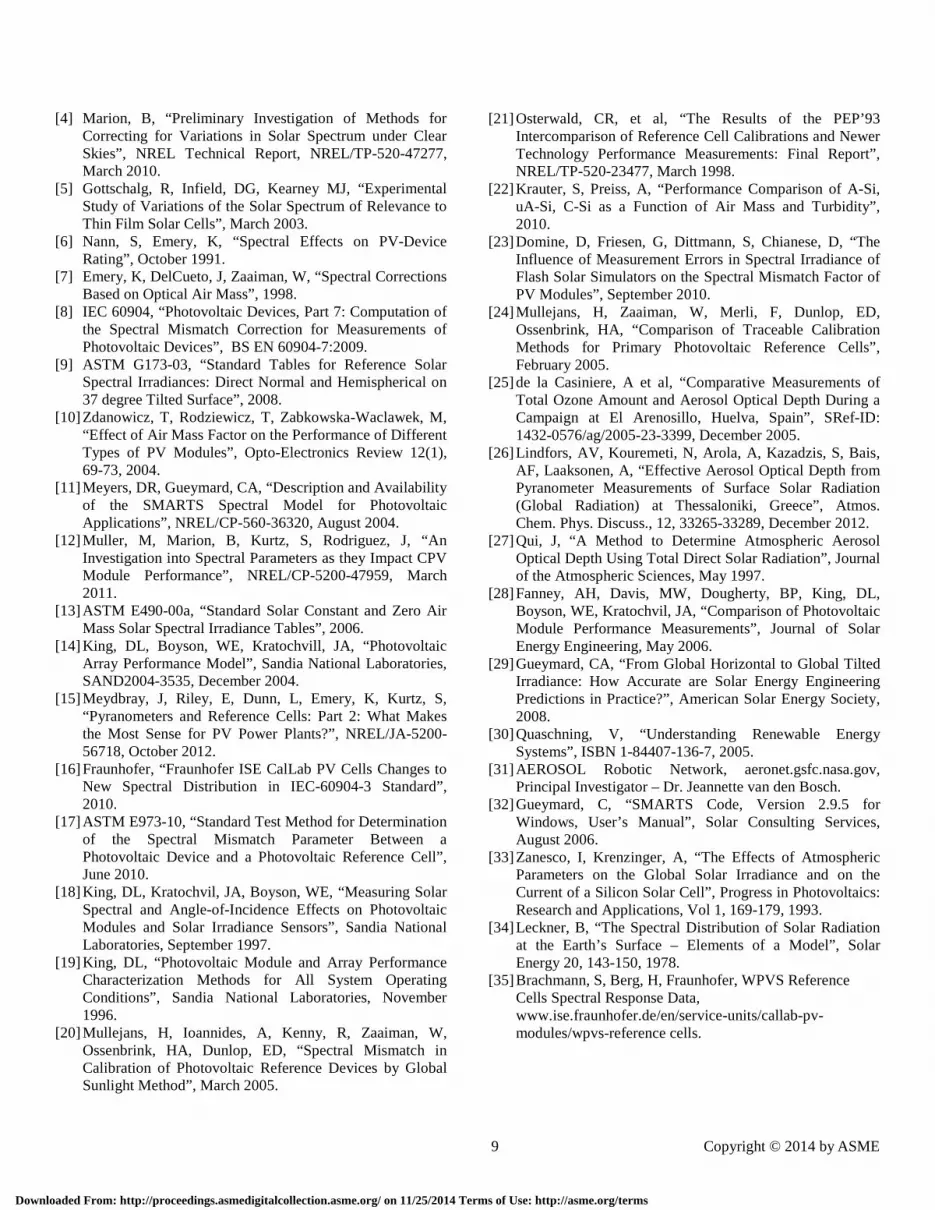
ESTIMATING AOD & PWV Determining AOD and PWV values for a given test
site, representative time period and particular spectral band is a measurement intensive endeavor. This task has been undertaken by AERONET, a collaboration of government, private and individual partners [31]. Spectroradiometers are deployed at select sites to measure direct sun irradiance at discreet wavelengths throughout the day. AOD is calculated from spectral extinction of direct beam radiation at each wavelength after removing the estimated attenuation due to scatter and absorption by the other atmospheric constituents. PWV is also calculated by the analysis at a specific wavelength. Figure 11 shows data collected on a single day at the White_Sands_HELSFT site in New Mexico, thanks to the Principal Investigator [31] who established and maintains the site.
Downloaded From: http://proceedings.asmedigitalcollection.asme.org/ on 11/25/2014 Terms of Use: http://asme.org/terms
7 Copyright © 2014 by ASME
When an AERONET site is not nearby, AOD and PWV can be estimated knowing the local visibility, ambient temperature and relative humidity. Visibility is reported at many airports with varying accuracies and Gueymard [1] describes an empirically based method in Equations (11-13) to estimate AOD at 500 nm:
𝐴𝑂𝐷 @ 500 𝑛𝑚 = 2.0𝛼2𝛽 (11)
𝛽 = 0.55𝛼2 �1.3307 �1𝑉𝑟−
1𝑉𝑚�0.614
+ 3.4875 �1𝑉𝑟−
1𝑉𝑚�� (12)
𝑉𝑟 = 1.306 ∗ 𝑉 (13)
where α2 represents the aerosol particle size distribution with a typical value of 1.3, V is the local visibility, in km, in the horizontal direction and Vm is the theoretical maximum visibility of 340.85 km. β is the Angstrom turbidity coefficient and represents the amount of aerosols in the atmosphere in the vertical direction [33]. Figure 12 shows how AOD @ 500 nm varies with visibility. Zanesco et al [33] presents a correlation developed by Leckner [34] to determine PWV with easily obtainable data, as shown in Equation (14):
𝑃𝑊𝑉 =0.493 ∗ 𝑅𝐻 ∗ 𝑒[26.23−5416/𝑇𝑎𝑚𝑏]
𝑇𝑎𝑚𝑏 (14)
where RH is the ambient relative humidity in decimal percent and Tamb is the ambient temperature in degrees Kelvin. Figure 13 shows PWV as a function of relative humidity for three ambient temperatures.
When an AERONET site is not nearby and reliable visibility records are not available, the use of the standard atmosphere reference value for AOD of 0.084 at 500 nm is
Downloaded From: http://proceedings.asmedigitalcollection.asme.org/ on 11/25/2014 Terms of Use: http://asme.org/terms

8 Copyright © 2014 by ASME
proposed. Figures 12 and 13 indicate the standard atmosphere values, which are recommended when the estimated values appear unrealistic.
FIELD TEST EXPERIENCE Recently reviewed field data from a confidential
source revealed the potential for supplier provided air mass function curves to lead to significant error in spectral mismatch values. For test ambient conditions of 14.5°C, 53% relative humidity and 16 km airport reported visibility, Figures 12 and 13 give AOD of 0.4 @ 500 nm and PWV of 1.4801 cm. The value for AOD appears quite high and was reset to the USSA value of 0.084 @ 500 nm. Using SMARTS to develop spectral irradiance curves and integrating this data with four sets of spectral response data resulted in the spectral mismatch curves in Figure 14. Although, the spectral response data for the installed PV modules was unavailable, the representative air mass function curve shows deviations in spectral mismatch values ranging from about 0.5% to 3.0% at the 3.8 test AMa relative to typical PV module spectral performance. This illustrates the magnitude of the discrepancy that can result from using air mass function data to predict spectral performance.
CLOSING REMARKS Utility-scale PV power plants typically have
performance guarantee bases that include a reference solar spectrum, such as ASTM G173-03 [9]. To correct tested performance back to this reference, spectral mismatch curves can be generated by the EPC contractor using PV module spectral response data and a solar spectral irradiance model that implies AMa and estimated atmospheric constituent quantities. This is an improvement over using empirical air mass methods [4], and the inherent uncertainty associated with the underlying data.
It should be noted that these corrections pertain to facilities that utilize pyranometers or reference cells not matched to the installed PV modules to measure solar irradiance. When measuring solar irradiance with a PV reference cell matched to the installed PV modules, corrections for spectral irradiance effects are unnecessary, as can be inferred from Equation (7). The reference cell and the PV modules identically respond to spectral irradiance effects in this case [15].
In conclusion, the proposed method of correction for spectral effects will lead to enhanced consistency and accuracy and has the versatility to adapt to local atmospheric conditions. With NREL investigating ways to improve AOD and PWV estimates [4], established estimating methods, access to the AERONET database and other methods [27], the precision in accounting for solar spectral effects will continue to improve.
REFERENCES [1] Gueymard, C, “Parameterized Transmittance Model for
Direct Beam and Circumsolar Spectral Irradiance”, Solar Energy (71:5), pp. 325-346, 2001.
[2] Gueymard, C, “SMARTS, A Simple Model of the Atmospheric Radiative Transfer of Sunshine: Algorithm and Performance Assessments”, Professional Paper FSEC-PF-270-95, Florida Energy Center, 1679 Clearlake Rd, Cocoa, FL 32922, 1995.
[3] Osterwald, CR, Emery, KA, Muller M, “Photovoltaic Module Calibration Value Versus Optical Air Mass: The Air Mass Function”, NREL Research Article, September 2012.
Downloaded From: http://proceedings.asmedigitalcollection.asme.org/ on 11/25/2014 Terms of Use: http://asme.org/terms
9 Copyright © 2014 by ASME
[4] Marion, B, “Preliminary Investigation of Methods for Correcting for Variations in Solar Spectrum under Clear Skies”, NREL Technical Report, NREL/TP-520-47277, March 2010.
[5] Gottschalg, R, Infield, DG, Kearney MJ, “Experimental Study of Variations of the Solar Spectrum of Relevance to Thin Film Solar Cells”, March 2003.
[6] Nann, S, Emery, K, “Spectral Effects on PV-Device Rating”, October 1991.
[7] Emery, K, DelCueto, J, Zaaiman, W, “Spectral Corrections Based on Optical Air Mass”, 1998.
[8] IEC 60904, “Photovoltaic Devices, Part 7: Computation of the Spectral Mismatch Correction for Measurements of Photovoltaic Devices”, BS EN 60904-7:2009.
[9] ASTM G173-03, “Standard Tables for Reference Solar Spectral Irradiances: Direct Normal and Hemispherical on 37 degree Tilted Surface”, 2008.
[10] Zdanowicz, T, Rodziewicz, T, Zabkowska-Waclawek, M, “Effect of Air Mass Factor on the Performance of Different Types of PV Modules”, Opto-Electronics Review 12(1), 69-73, 2004.
[11] Meyers, DR, Gueymard, CA, “Description and Availability of the SMARTS Spectral Model for Photovoltaic Applications”, NREL/CP-560-36320, August 2004.
[12] Muller, M, Marion, B, Kurtz, S, Rodriguez, J, “An Investigation into Spectral Parameters as they Impact CPV Module Performance”, NREL/CP-5200-47959, March 2011.
[13] ASTM E490-00a, “Standard Solar Constant and Zero Air Mass Solar Spectral Irradiance Tables”, 2006.
[14] King, DL, Boyson, WE, Kratochvill, JA, “Photovoltaic Array Performance Model”, Sandia National Laboratories, SAND2004-3535, December 2004.
[15] Meydbray, J, Riley, E, Dunn, L, Emery, K, Kurtz, S, “Pyranometers and Reference Cells: Part 2: What Makes the Most Sense for PV Power Plants?”, NREL/JA-5200-56718, October 2012.
[16] Fraunhofer, “Fraunhofer ISE CalLab PV Cells Changes to New Spectral Distribution in IEC-60904-3 Standard”, 2010.
[17] ASTM E973-10, “Standard Test Method for Determination of the Spectral Mismatch Parameter Between a Photovoltaic Device and a Photovoltaic Reference Cell”, June 2010.
[18] King, DL, Kratochvil, JA, Boyson, WE, “Measuring Solar Spectral and Angle-of-Incidence Effects on Photovoltaic Modules and Solar Irradiance Sensors”, Sandia National Laboratories, September 1997.
[19] King, DL, “Photovoltaic Module and Array Performance Characterization Methods for All System Operating Conditions”, Sandia National Laboratories, November 1996.
[20] Mullejans, H, Ioannides, A, Kenny, R, Zaaiman, W, Ossenbrink, HA, Dunlop, ED, “Spectral Mismatch in Calibration of Photovoltaic Reference Devices by Global Sunlight Method”, March 2005.
[21] Osterwald, CR, et al, “The Results of the PEP’93 Intercomparison of Reference Cell Calibrations and Newer Technology Performance Measurements: Final Report”, NREL/TP-520-23477, March 1998.
[22] Krauter, S, Preiss, A, “Performance Comparison of A-Si, uA-Si, C-Si as a Function of Air Mass and Turbidity”, 2010.
[23] Domine, D, Friesen, G, Dittmann, S, Chianese, D, “The Influence of Measurement Errors in Spectral Irradiance of Flash Solar Simulators on the Spectral Mismatch Factor of PV Modules”, September 2010.
[24] Mullejans, H, Zaaiman, W, Merli, F, Dunlop, ED, Ossenbrink, HA, “Comparison of Traceable Calibration Methods for Primary Photovoltaic Reference Cells”, February 2005.
[25] de la Casiniere, A et al, “Comparative Measurements of Total Ozone Amount and Aerosol Optical Depth During a Campaign at El Arenosillo, Huelva, Spain”, SRef-ID: 1432-0576/ag/2005-23-3399, December 2005.
[26] Lindfors, AV, Kouremeti, N, Arola, A, Kazadzis, S, Bais, AF, Laaksonen, A, “Effective Aerosol Optical Depth from Pyranometer Measurements of Surface Solar Radiation (Global Radiation) at Thessaloniki, Greece”, Atmos. Chem. Phys. Discuss., 12, 33265-33289, December 2012.
[27] Qui, J, “A Method to Determine Atmospheric Aerosol Optical Depth Using Total Direct Solar Radiation”, Journal of the Atmospheric Sciences, May 1997.
[28] Fanney, AH, Davis, MW, Dougherty, BP, King, DL, Boyson, WE, Kratochvil, JA, “Comparison of Photovoltaic Module Performance Measurements”, Journal of Solar Energy Engineering, May 2006.
[29] Gueymard, CA, “From Global Horizontal to Global Tilted Irradiance: How Accurate are Solar Energy Engineering Predictions in Practice?”, American Solar Energy Society, 2008.
[30] Quaschning, V, “Understanding Renewable Energy Systems”, ISBN 1-84407-136-7, 2005.
[31] AEROSOL Robotic Network, aeronet.gsfc.nasa.gov, Principal Investigator – Dr. Jeannette van den Bosch.
[32] Gueymard, C, “SMARTS Code, Version 2.9.5 for Windows, User’s Manual”, Solar Consulting Services, August 2006.
[33] Zanesco, I, Krenzinger, A, “The Effects of Atmospheric Parameters on the Global Solar Irradiance and on the Current of a Silicon Solar Cell”, Progress in Photovoltaics: Research and Applications, Vol 1, 169-179, 1993.
[34] Leckner, B, “The Spectral Distribution of Solar Radiation at the Earth’s Surface – Elements of a Model”, Solar Energy 20, 143-150, 1978.
[35] Brachmann, S, Berg, H, Fraunhofer, WPVS Reference Cells Spectral Response Data, www.ise.fraunhofer.de/en/service-units/callab-pv-modules/wpvs-reference cells.
Downloaded From: http://proceedings.asmedigitalcollection.asme.org/ on 11/25/2014 Terms of Use: http://asme.org/terms