specific entrainment of mitral cells during gamma oscillation in the rat olfactory bulb
TRANSCRIPT

Specific Entrainment of Mitral Cells during GammaOscillation in the Rat Olfactory BulbFrancois O. David1.¤*, Etienne Hugues2., Tristan Cenier1,3, Nicolas Fourcaud-Trocme1,3, Nathalie
Buonviso1,3
1 Neurosciences Sensorielles, Comportement, Cognition, CNRS–Universite Claude Bernard, Lyon, France, 2 Department of Information and Communication Technologies,
Universitat Pompeu Fabra, Barcelona, Spain, 3 IFR 19, Institut Federatif des Neurosciences de Lyon, Lyon, France
Abstract
Local field potential (LFP) oscillations are often accompanied by synchronization of activity within a widespread cerebralarea. Thus, the LFP and neuronal coherence appear to be the result of a common mechanism that underlies neuronalassembly formation. We used the olfactory bulb as a model to investigate: (1) the extent to which unitary dynamics and LFPoscillations can be correlated and (2) the precision with which a model of the hypothesized underlying mechanisms canaccurately explain the experimental data. For this purpose, we analyzed simultaneous recordings of mitral cell (MC) activityand LFPs in anesthetized and freely breathing rats in response to odorant stimulation. Spike trains were found to be phase-locked to the gamma oscillation at specific firing rates and to form odor-specific temporal patterns. The use of aconductance-based MC model driven by an approximately balanced excitatory-inhibitory input conductance and arelatively small inhibitory conductance that oscillated at the gamma frequency allowed us to provide one explanation of theexperimental data via a mode-locking mechanism. This work sheds light on the way network and intrinsic MC propertiesparticipate in the locking of MCs to the gamma oscillation in a realistic physiological context and may result in a particulartime-locked assembly. Finally, we discuss how a self-synchronization process with such entrainment properties can explain,under experimental conditions: (1) why the gamma bursts emerge transiently with a maximal amplitude position relative tothe stimulus time course; (2) why the oscillations are prominent at a specific gamma frequency; and (3) why the oscillationamplitude depends on specific stimulus properties. We also discuss information processing and functional consequencesderived from this mechanism.
Citation: David FO, Hugues E, Cenier T, Fourcaud-Trocme N, Buonviso N (2009) Specific Entrainment of Mitral Cells during Gamma Oscillation in the Rat OlfactoryBulb. PLoS Comput Biol 5(10): e1000551. doi:10.1371/journal.pcbi.1000551
Editor: Abigail Morrison, RIKEN Brain Science Institute, Japan
Received December 1, 2008; Accepted September 30, 2009; Published October 30, 2009
Copyright: � 2009 David et al. This is an open-access article distributed under the terms of the Creative Commons Attribution License, which permitsunrestricted use, distribution, and reproduction in any medium, provided the original author and source are credited.
Funding: This work was funded by the CNRS and the Universite Claude Bernard-Lyon 1. The funders had no role in study design, data collection and analysis,decision to publish, or preparation of the manuscript.
Competing Interests: The authors have declared that no competing interests exist.
* E-mail: [email protected]
¤ Current address: Neurobiologie des Processus Adaptatifs, Universite P&M Curie Paris 6-CNRS, Paris, France
. These authors contributed equally to this work.
Introduction
Recent experiments under awake conditions indicate that there is
little effective spatial contrast in the firing rate of neurons in
olfactory structures [1] and even in auditory primary sensory
structures [2], which suggests a limited role for the mean firing rate
in sensory function. In addition, it has recently been shown in the
retina that the sole firing rate is not sufficient to code for behavioral
performance [3]. Furthermore, the role of spike timing for plasticity
[4] and coding [5] suggests that the temporal structure of neuronal
activity may be crucial for perception. In particular, various
functional studies have reported that fast local field potential (LFP)
oscillations, particularly those in the gamma band (40–80 Hz) that
correlate with perception [6] and attention [7], simultaneously
induce a greater synchrony in the firing of cells, thereby having a
greater impact on downstream structures [7].
In the mammalian olfactory bulb (OB), odorant stimulation
induces LFP oscillations both in the gamma (40–80 Hz) and beta
(15–35 Hz) ranges. There is, however, significant disparity in the
reports regarding the conditions in which these oscillations are
expressed. In anesthetized animals, gamma and beta LFP
oscillations are odor-induced and appear alternately along the
respiratory cycle, with gamma bursts specifically occurring during
the inspiration/expiration (I/E) transition [8,9]. In the awake rat,
gamma and beta LFP oscillations exist spontaneously, and odors
evoke increases [10] or decreases [11] of amplitude in the gamma
frequency range. In insects [5,12] and to a lesser extent in fish
[13], spiking activity has been shown to be strongly linked to the
oscillation which plays therefore a crucial role in coding. In
rodents the role of these oscillation has been primarily described to
reflect the experience of the animal [14,15]. Despite the findings of
phase/time relationships between mitral (MC) spiking activity and
the oscillation or between MC pairs [16–18], a better description
of these relationships across the MC population is needed before
demonstrating that such temporal activity can support an odor
code.
Our approach focused on gamma oscillations in anesthetized
rats, which are not very different from oscillations recorded under
behaving conditions [19]. The aim of the current study was two-
fold: (1) to analyze the fine temporal relationships between the
PLoS Computational Biology | www.ploscompbiol.org 1 October 2009 | Volume 5 | Issue 10 | e1000551

spiking of an MC population and gamma oscillations in
anesthetized, freely-breathing rats in response to odorant stimu-
lation and (2) to build a biophysical model of MC activity under
the same in vivo conditions to explain the data. Our data showed
that during the transient periods of gamma oscillation, a specific
subset of MCs exhibited specific periodic firing phase patterns that
could be grouped in a small number of types. Furthermore, the
pattern types exhibited by a particular MC are qualitatively
related to the nature of the odorant stimulus. These different types
of patterns constitute the signature of an entrainment of these cells
by an input oscillation [20,21], whose origin can be attributed to
the inhibitory granular input [17]. In the model, we verify that this
scenario of entrainment effectively reproduces the experimental
observations. We further explored the model’s dependence on MC
input activity and intrinsic properties, showing that our model
robustly exhibited an optimum of entrainment when the
oscillation frequency was within the gamma range. Overall, these
results provide a detailed quantitative description of the complex
MC firing activity at the population level and, at the same time, a
theoretical explanation of the links between MC spike trains and
gamma LFP oscillations evoked under freely breathing conditions
in the OB. Furthermore, these results constitute an important
underlying mechanism if future research shows that such a firing
activity can support odor coding in behaving conditions.
Results
Part I: experimental data analysisGamma LFP oscillations are recurrent and stable, and
the firing rate is highly variable. Under our anesthetized
conditions, odorant stimulation elicited LFP oscillations in the
whole OB and spiking activity in the MC layer. Respiratory
modulation appeared as a slow, large-amplitude oscillation
(,2 Hz) that was visible on the raw trace (Fig. 1A). Although
slower than under waking conditions, this respiratory modulation
could be associated with theta range frequencies (4–10 Hz). The
time-frequency representation (TFR) (Fig. 1B) led to the
observation of two other oscillatory frequencies, namely beta
oscillations in the 15–35 Hz range and gamma oscillations in the
40–80 Hz range. Gamma bursts recurred at each respiratory cycle
around the inspiration/expiration (I/E) transition [8] (Fig. 1B) and
were nearly independent of the odorant stimulus. In contrast, the
characteristics of the beta bursts depended on the molecular
features of the odor [9]. The gamma oscillation positions during
the respiratory cycles were remarkably stable between odors,
always starting at the I/E transition. The distribution of gamma
Author Summary
Olfactory function relies on a chain of neural relays thatextends from the periphery to the central nervous systemand implies neural activity with various timescales. Acentral question in neuroscience is how information isencoded by the neural activity. In the mammalian olfactorybulb, local neural activity oscillations in the 40–80 Hzrange (gamma) may influence the timing of individualneuron activities such that olfactory information may beencoded in this way. In this study, we first characterize invivo the detailed activity of individual neurons relative tothe oscillation and find that, depending on their state,neurons can exhibit periodic activity patterns. We also find,at least qualitatively, a relation between this activity and aparticular odor. This is reminiscent of general physicalphenomena—the entrainment by an oscillation—and toverify this hypothesis, in a second phase, we build abiologically realistic model mimicking these in vivoconditions. Our model confirms quantitatively this hypoth-esis and reveals that entrainment is maximal in the gammarange. Taken together, our results suggest that theneuronal activity may be specifically formatted in timeduring the gamma oscillation in such a way that it could, atthis stage, encode the odor.
Figure 1. Unit activities and LFP gamma oscillation frequencieshad the same mean but very different variability. A) Raw signalrecorded in the MC layer during odorant stimulation. Verticalcontinuous lines: I/E transitions; vertical dashed lines: E/I transitions.B) Time frequency representation extracted from the raw signal andbased upon a wavelet transformation. The signal energy at each time-frequency point is in a colorscale. C) Top) Distribution of LFP gamma-burst mean frequencies with a normal function fit, which is shown as ablack trace. Bottom) Distribution of LFP cycle instantaneous frequency,which is defined as the inverse of the period between two max of theoscillation, and which is normalized to the average frequency of thegamma burst to which the cycle belongs. D) Instantaneous frequenciesalong one respiratory cycle (six colors for six cells). + are spike positionsfor which gamma LFP oscillations are present. E) Interspike intervaldistribution (ISI) for spike trains occurring during gamma oscillations(bin 0.05 cycle, black line, gamma function distribution with the samemean ISI as the experimentally found (see methods)). Contourhistogram is the distribution of the mean ISIs that was calculated foreach spike train. All units are given in ‘‘cycle’’.doi:10.1371/journal.pcbi.1000551.g001
Mitral Cell Entrainment during Gamma Bursts
PLoS Computational Biology | www.ploscompbiol.org 2 October 2009 | Volume 5 | Issue 10 | e1000551

burst mean frequencies was fitted with a narrow Gaussian
distribution with a mean of 60.7 Hz (standard deviation: 8.8 Hz,
see Fig. 1C, top). Inside each gamma burst, the cycle to cycle
frequency was even more stable. Indeed when the frequency of
each cycle (the inverse of its length) was normalized relative to the
mean frequency of its gamma bursts, the resulting distribution
could be fitted with a Gaussian distribution with a standard
deviation that was lower than 0.1, which indicated low variability
(Fig. 1C, bottom).
In contrast, the MC instantaneous frequencies were highly
variable (i) within the same cell, between different epochs of the
respiratory cycle, (ii) within the same cell, between odors, and (iii)
between simultaneously recorded units. An example is given in
Fig. 1D, which shows the course of instantaneous frequencies over
the period of a respiratory cycle for six cells that responded to the
same odor. These examples show that the MC activities are highly
modulated and variable during the respiratory cycles, as previously
described [22–24].
Due to the bulbar-specific origins of gamma oscillations and to
the regular occurrence of these oscillations across the bulbar
surface, we focused our measurements on neuron discharges
during LFP gamma bursts. To simplify the comparison between
bursts of different frequencies, the interspike intervals (ISI) will
always be expressed in fractions of their gamma burst average
period (the Cycle unit), and similarly, the MC spike rates will be
expressed in spikes per cycle (SpC). The ISI distribution that was
observed during these gamma bursts was plotted in Fig. 1E (grey
bars). We compared these distributions with a gamma distribution
(black line) that reflected the usual random discharge of a neuron
with a similar refractory period (0.18 cycles ( = 3 ms)) and the same
mean ISI (1.18 cycles) as the experimental distribution. We
observed two major deviations of the experimental ISI distribution
from the gamma distribution. One appears around 0.1–0.2 cycles
and corresponds to the numerous spike doublets (or high
frequency bursts) that can be observed in MC discharges [23].
The second deviation is an excess of the experimental ISI around
0.9–1 cycles. About 25% of the ISIs are between 0.8 and 1.2
cycles, compared to 18% for the gamma distribution. The latter
result suggests that during gamma bursts, a large fraction of the
MCs tend to fire at a rate close to the oscillation frequency.
The contrast between the regularity of oscillation frequency and
the variability of spike discharge led us to the idea that the
coupling between both activities could be dependent on neuronal
frequency. This hypothesis was investigated further in the
following analyses.
Spike phase distribution during LFP gamma oscillations
depends on the MC firing rate. When an LFP gamma
oscillation was evoked in OB slices, the distribution of GABAA
(Gamma Amino Butyric Acid) event times relative to the
oscillation phase was phased [17] (see Fig. 4G in ref. 21).
According to these observations, the MCs should receive, on
average, an oscillating conductance locked to the LFP gamma
oscillation. Therefore, we expected the MC firing activity to
correlate with the phase of the LFP gamma oscillation. For the
whole population of MCs, the spike phase distribution was peaked
(Fig. 2A), with a maximum around phase 0.5 (circular deviation of
sigma = 1.67 and a significantly phased distribution, P%0.001,
Rayleigh non-uniformity test). However, when the cells are
segregated by their average firing rates, we observe that cells
with firing rates below 1.2 SpC were better phased (Fig. 2B). We
thus wondered what the difference was in the relationship between
LFP fast oscillations and cells spiking at low and high firing rates.
Looking at individual spike trains on the raw signal (Fig. 2C), we
noticed some particular configurations of spike-LFP phase
coupling. Spike trains with #1 SpC (Fig. 2C, upper panel) were
often stable in phase and occurred preferentially during the trough
of the oscillation. On the other hand, we observed that some spike
trains with .1 SpC exhibited multiple but similar phases across
several oscillation cycles (Fig. 2C, lower panel). This relationship
between spike phase-locking and MC firing rate raised the
possibility that MC populations might be segregated according
to their firing rate. We thus decided to examine systematically the
relationship between phase trains and LFP oscillations while taking
this observation into account.
Specific phase-locking and spike rate control by gamma
LFP oscillation. An inspection of the spike phases (represented
by grey sticks in Fig. 3A and 3B) revealed that a large number of
spike trains contained spikes that had phases that were
reproducible across cycles. Therefore, we automatically detected
and classified the phase-locked patterns according to six q:p types,
Figure 2. Rate dependence of spike phase distribution duringgamma oscillation. A) Spike phase distribution (phase bin = 0.02cycle) for all spikes during gamma oscillation (black line). The couplingstrength was weak and statistically significant [mean = 0.472, averagelength, r = 0.25, circular deviation = 1.67; p,0.01, Rayleigh test)]. B)Spike phase distribution according to the mean spike rate (measured inSpike per Cycle (SpC)), (see y-label). (* indicate p,0.01 for a non-homogeneous distribution). The phase means were 0.480, 0.471, 0.486,0.409, phase average lengths were 0.29, 0.31, 0.28, 0.11 for therespective phase distributions. C) Examples of spike trains showingregularity of spike phases at a low (upper panel) or high (lower panel)firing rate; Black trace, raw signal; black circles, spikes during gamma LFPoscillation; grey sinusoid, extracted LFP oscillation; grey lines, LFP phasesfrom 0 to 1; black ticks, spike time and phase positions.doi:10.1371/journal.pcbi.1000551.g002
Mitral Cell Entrainment during Gamma Bursts
PLoS Computational Biology | www.ploscompbiol.org 3 October 2009 | Volume 5 | Issue 10 | e1000551
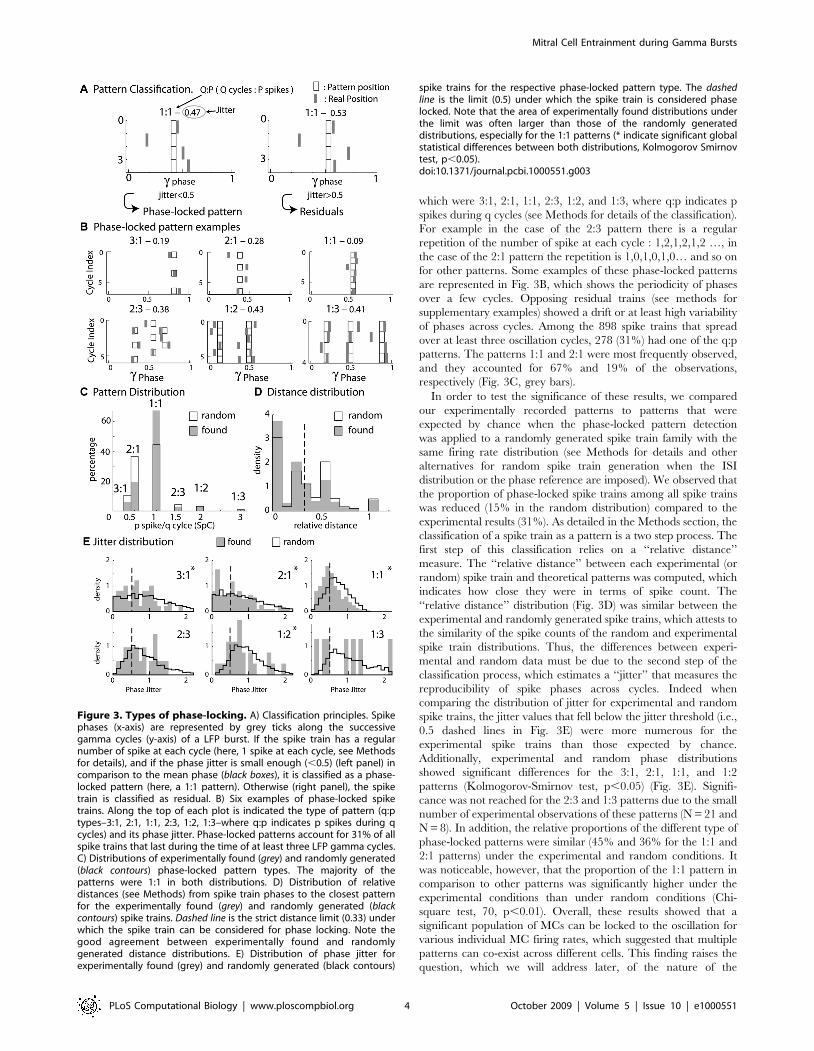
which were 3:1, 2:1, 1:1, 2:3, 1:2, and 1:3, where q:p indicates p
spikes during q cycles (see Methods for details of the classification).
For example in the case of the 2:3 pattern there is a regular
repetition of the number of spike at each cycle : 1,2,1,2,1,2 …, in
the case of the 2:1 pattern the repetition is 1,0,1,0,1,0… and so on
for other patterns. Some examples of these phase-locked patterns
are represented in Fig. 3B, which shows the periodicity of phases
over a few cycles. Opposing residual trains (see methods for
supplementary examples) showed a drift or at least high variability
of phases across cycles. Among the 898 spike trains that spread
over at least three oscillation cycles, 278 (31%) had one of the q:p
patterns. The patterns 1:1 and 2:1 were most frequently observed,
and they accounted for 67% and 19% of the observations,
respectively (Fig. 3C, grey bars).
In order to test the significance of these results, we compared
our experimentally recorded patterns to patterns that were
expected by chance when the phase-locked pattern detection
was applied to a randomly generated spike train family with the
same firing rate distribution (see Methods for details and other
alternatives for random spike train generation when the ISI
distribution or the phase reference are imposed). We observed that
the proportion of phase-locked spike trains among all spike trains
was reduced (15% in the random distribution) compared to the
experimental results (31%). As detailed in the Methods section, the
classification of a spike train as a pattern is a two step process. The
first step of this classification relies on a ‘‘relative distance’’
measure. The ‘‘relative distance’’ between each experimental (or
random) spike train and theoretical patterns was computed, which
indicates how close they were in terms of spike count. The
‘‘relative distance’’ distribution (Fig. 3D) was similar between the
experimental and randomly generated spike trains, which attests to
the similarity of the spike counts of the random and experimental
spike train distributions. Thus, the differences between experi-
mental and random data must be due to the second step of the
classification process, which estimates a ‘‘jitter’’ that measures the
reproducibility of spike phases across cycles. Indeed when
comparing the distribution of jitter for experimental and random
spike trains, the jitter values that fell below the jitter threshold (i.e.,
0.5 dashed lines in Fig. 3E) were more numerous for the
experimental spike trains than those expected by chance.
Additionally, experimental and random phase distributions
showed significant differences for the 3:1, 2:1, 1:1, and 1:2
patterns (Kolmogorov-Smirnov test, p,0.05) (Fig. 3E). Signifi-
cance was not reached for the 2:3 and 1:3 patterns due to the small
number of experimental observations of these patterns (N = 21 and
N = 8). In addition, the relative proportions of the different type of
phase-locked patterns were similar (45% and 36% for the 1:1 and
2:1 patterns) under the experimental and random conditions. It
was noticeable, however, that the proportion of the 1:1 pattern in
comparison to other patterns was significantly higher under the
experimental conditions than under random conditions (Chi-
square test, 70, p,0.01). Overall, these results showed that a
significant population of MCs can be locked to the oscillation for
various individual MC firing rates, which suggested that multiple
patterns can co-exist across different cells. This finding raises the
question, which we will address later, of the nature of the
Figure 3. Types of phase-locking. A) Classification principles. Spikephases (x-axis) are represented by grey ticks along the successivegamma cycles (y-axis) of a LFP burst. If the spike train has a regularnumber of spike at each cycle (here, 1 spike at each cycle, see Methodsfor details), and if the phase jitter is small enough (,0.5) (left panel) incomparison to the mean phase (black boxes), it is classified as a phase-locked pattern (here, a 1:1 pattern). Otherwise (right panel), the spiketrain is classified as residual. B) Six examples of phase-locked spiketrains. Along the top of each plot is indicated the type of pattern (q:ptypes–3:1, 2:1, 1:1, 2:3, 1:2, 1:3–where q:p indicates p spikes during qcycles) and its phase jitter. Phase-locked patterns account for 31% of allspike trains that last during the time of at least three LFP gamma cycles.C) Distributions of experimentally found (grey) and randomly generated(black contours) phase-locked pattern types. The majority of thepatterns were 1:1 in both distributions. D) Distribution of relativedistances (see Methods) from spike train phases to the closest patternfor the experimentally found (grey) and randomly generated (blackcontours) spike trains. Dashed line is the strict distance limit (0.33) underwhich the spike train can be considered for phase locking. Note thegood agreement between experimentally found and randomlygenerated distance distributions. E) Distribution of phase jitter forexperimentally found (grey) and randomly generated (black contours)
spike trains for the respective phase-locked pattern type. The dashedline is the limit (0.5) under which the spike train is considered phaselocked. Note that the area of experimentally found distributions underthe limit was often larger than those of the randomly generateddistributions, especially for the 1:1 patterns (* indicate significant globalstatistical differences between both distributions, Kolmogorov Smirnovtest, p,0.05).doi:10.1371/journal.pcbi.1000551.g003
Mitral Cell Entrainment during Gamma Bursts
PLoS Computational Biology | www.ploscompbiol.org 4 October 2009 | Volume 5 | Issue 10 | e1000551

underlying mechanism that controls train structure in relation to
the LFP.
To further characterize the relationship between cell discharge
and LFP oscillation, we observed how the discharge of cells that
exhibited a phase-locked pattern during a gamma oscillation
evolved before, during, and after the oscillation. First, for all cells
exhibiting the same type of pattern, the cell instantaneous
frequency was plotted at each spike time (see Fig. 4 Ai to 4Avi
for the different types of patterns, where time 0, in all cases,
denotes the onset of gamma oscillations). The instantaneous
frequency was measured at each spike time and was defined as the
inverse of the ISI preceding the spike. The ISI unit was a cycle of
LFP gamma oscillation. When the ISI fell out of the LFP gamma
burst, the time reference was the mean cycle of the LFP gamma
burst. This representation showed that the 3:1, 2:1, and 1:1
experimental patterns (Fig. 4Ai–Aiii) were characterized by stable
instantaneous frequencies during gamma episodes, whereas highly
variable discharges could be observed before and after the gamma
episodes. Hence, the regular discharges observed for these patterns
seemed to be due to a specific process that occurred during gamma
oscillations and not due to previous stability. On the other hand,
the instantaneous frequency of the 2:3, 1:2, and 1:3 experimental
patterns (Fig. 4Aiv–Avi) exhibited a smaller decrease in variability
between the ‘‘before’’ and ‘‘during’’ gamma oscillations, which
suggested that the regularity detected there was more intrinsic to
MC discharge and less due to the oscillation. Finally, these results
were compared across the different q:p patterns the mean
(Fig. 4Bi), and the standard deviation (Fig. 4Bii) of the firing rate
was estimated using a 50-ms time bin. Interestingly, phase-locked
cells adopted a pattern with an average firing rate that was close to
their own average firing rate before the oscillation (except for a
small mismatch between the 2:3 and 1:2 patterns). For all types of
patterns, the standard deviation of the instantaneous frequency
decreased immediately after the onset of the gamma oscillation.
Overall, this suggests that gamma oscillations could regularize the
discharge of MCs while segregating them according to their
intrinsic firing rates (i.e., cell firing rates if oscillatory input is
absent). However this result does not unequivocally imply the
dominance of the network oscillation on the mitral discharge, since
both appeared to be intricately connected.
Figure 4. Firing rate control during gamma episodes. A) Instantaneous frequencies (1/ISI) were plotted from 200 ms before the gamma burstto 300 ms after. t = 0 at the beginning of the gamma burst, which is shown as a grey zone and by the symbolic oscillation atop of each graph. Foreach pattern type (Ai-vi), black dots are instantaneous frequencies (y-axes) as a function of their time position (x-axes) relative to the beginning of theLFP gamma burst. The mean instantaneous frequency (bold line) 6 its standard deviation (thin lines) is estimated by averaging instantaneousfrequencies over time bins of 50 ms. B) Mean firing rate averaged over 50-ms time bins (Bi) and its standard deviation (Bii) for spike trains expressingone type of phase-locked pattern (see legend for symbol-pattern correspondence). Compared to A, cells that do not fire during a bin are also takeninto account in the average. Bi shows that the firing rate before and after the gamma burst was correlated with the firing rate during the gammaburst for each pattern. Bii clearly shows that the firing rate standard deviation decreases for all patterns immediately after the gamma oscillationbegins.doi:10.1371/journal.pcbi.1000551.g004
Mitral Cell Entrainment during Gamma Bursts
PLoS Computational Biology | www.ploscompbiol.org 5 October 2009 | Volume 5 | Issue 10 | e1000551

Relation between pattern types and odors. Given that
pattern formation is observed during gamma bursts, we aimed to
evaluate the correlation of pattern presence with odor specificity
and physiological relevance. We compared the reproducibility of
the pattern formation of the neuronal response during stimulation
with the same odor and a different odor.
The probability of finding the same pattern in an MC response
was significantly higher for responses to the same odor than for
responses to different odors (probability of finding the same
pattern in response to the same odor: 0.049, to different odors:
0.015, p-value,0.05, paired t-test, n = 98, see the distribution of
these probability differences computed for each cell in methods).
This test was performed on 98 cells among 143 cells. We selected
the cells for which there were at least two recorded responses for at
least two different odors. If only phase-locked patterns were
considered (that is we did not take into account non-pattern spike
train in opposition to the preceding analysis), then probabilities of
finding the same pattern were enhanced to 0.60 and 0.49 for
responses to the same odor and to different odors respectively
(Kolmogorov-Smirnov test, p-value = 0.07, n = 48). Further inves-
tigations of our data at this point do not fully determine the role of
locking. Nonetheless, this result reinforces the possible significance
of patterns for encoding information about the nature of the odor
and could help with the decoding of other structures. Although
further analysis with additional data would be necessary to obtain
a more quantitative understanding of the patterns’ physiological
function, these patterns were found to be qualitatively related to
odors. The reliability (60%) of getting one pattern in response to
one odor remains relative.
Part II: modeling studyThe relationships between unit activity and gamma LFP
oscillations during phase-locking raise the question of whether
reciprocal entrainment mechanisms exist between MC and LFP
oscillations. We addressed one part of this question using a
biophysical model 1) to investigate the modalities of entrainment
of MC activities by granule cell activities and 2) to explain the
spike train structures measured experimentally. The use of a
model allowed us to perform studies that are not currently feasible
with animal studies.
Model MCs can be differentially phase locked by an
oscillation of their inhibitory input. Before presenting our
results, we must characterize the physiological conditions of
locking. The existence of a correlation between LFP oscillations
and spiking patterns presupposes neither the cause-effect
relationship between the two activities nor the biophysical
mechanisms of interactions in the bulbar network to explain the
phase-locked patterns. In vitro experimental results by Lagier et al.
(2004) [17] (see their Fig. 4G) showed that, during LFP gamma
oscillation, MCs can receive an average level of inhibition due to
tonic activation of GABAA receptors, along with a superimposed
phasic inhibition that occurs at gamma frequency. From the
synaptic connectivity and the individual synaptic strength, we were
able to estimate the average level of tonic inhibitory conductance
(called gI) to be on the order of 20 S/m2 and the amplitude of the
oscillation (i.e., the phasic inhibitory conductance, called gIo) to be
up to 30% of the average level (see Methods for details about the
MC model and all of the parameter estimations). We tested how
the response to sensory inputs, which was mimicked by a constant
and tonic excitatory conductance (called gE), and was influenced
by the inhibitory sinusoidal conductance (gI+gIo) oscillating at a
frequency (fosc) in the gamma range (Fig. 5A). This inhibitory
conductance oscillating at 60 Hz was set to 0%, 10%, or 30% of
the average inhibitory conductance gI (i.e., gIo = 0, 2, or 6 S/m2,
respectively). As shown by the different plateaus on the curves of
the cell response (Fig. 5Ai), the occurrence of such an inhibitory
conductance stabilized the firing rate. The frequencies at which the
firing rate was stabilized corresponded to the q:p patterns that
occurred around frequencies given by p/q multiplied by the
frequency of the imposed oscillation (60 Hz). Throughout this
analysis, q and p are distinct integers chosen among {1,2,3}. These
frequencies corresponded to frequencies in the experimental phase-
locked patterns. The larger the oscillation amplitude, the wider the
stabilized plateau (see the curves from blue to green in Fig. 5Ai).
Interestingly, the inhibitory oscillation was able to increase the firing
rate (the plateau for 1:1 lies above the curve with gIo = 0) and could
evoke firing in a silent cell (Fig. 5Ai). Under noisy conditions
(Fig. 5Aii), the conductance-frequency response was partially
preserved, but the smallest plateaus (for 2:1, 2:3, and 1:3)
disappeared. Figure 5Bi shows, in the noiseless case, phase
diagrams of trains that were extracted from each of the plateaus
mentioned in Fig. 5Ai (referred as ‘‘a’’–‘‘e’’). The relatively good
agreement with experimental observations [e.g., compare the
experimental spike trains in Fig. 3B with the simulated trains in
Fig. 5B] suggests that MCs can be driven effectively by an oscillatory
input during gamma oscillations. Additional spike trains that were
extracted from the non-plateau portions of the firing rate response
curve (referred as ‘‘f’’–‘‘j’’ in Fig. 5Ai) are shown in f through j of
Fig. 5B. These results indicate that MCs are entrained by an
oscillatory inhibitory conductance mainly when the neuron fires at
the same frequency as the imposed 60 Hz oscillation, and that this
entrainment can also explain the patterns that are observed in our
experiments. This result is partly specific to the model, since other
intrinsic properties for other neurons would not lead to a 1:1
entrainment. Indeed, all cochlear neurons have dissimilar entrainment
properties with regard to the frequency of entrainment [25].
We next analyzed the influence of the oscillation amplitude on
spike phase-locking. For this purpose, a color map was used to plot
the phase jitter, which was defined in the same way as it is used to
classify spike trains as a phase-locked pattern or not, as a function
of the amplitude of the oscillating inhibitory conductance, from 0
to 30% of the average of the inhibitory conductance (y-axis) and
the amplitude of the MC excitatory input conductance (Fig. 5Ci).
The so-called ‘‘Arnold tongue’’ for 1:1 [20] (zero jitter, which
would occur in perfectly locked spikes, in black and noted directly
on graph) was the widest, while the tongue for 1:2 was the second
widest. The higher the oscillation amplitude, the wider the tongues
for 1:1 and 1:2. These tongues were partly preserved under noisy
conditions (Fig. 5Cii), but tended to shrink and disappear at low
levels of oscillatory inhibition. As a consequence, as the oscillation
amplitude tends to increase, a higher proportion of cells may be
entrained by the oscillation, even if the cells’ intrinsic firing rate is
far from the frequency that is imposed by the entrainment (see the
doubled x-axis, below). Therefore, a larger MC population can be
recruited when the oscillation amplitude increases.
The next step was to understand the origins of the inter- and
intra-pattern phase variability. For this purpose, we represented
the spike phase variations according to the driving excitatory
conductance gE for two levels of inhibitory conductance, namely
10% (Fig. 6Ai) and 30% (Fig. 6Aii). Under these noiseless
conditions, the 1:1 tongue (arrows) had phases that varied
continuously from 0.5 to 0.2, as the excitatory conductance
increased. We noticed that the range of possible phases for each
tongue was not greatly affected by the oscillation amplitude,
whereas the conductance range (the gE band indicated) over which
the MC was entrained increased with the oscillation amplitude
(compare Fig. 6Aii to 6Ai). Phase-locking was robust to noise, and
the phase distribution persisted, although less sharply, for high
Mitral Cell Entrainment during Gamma Bursts
PLoS Computational Biology | www.ploscompbiol.org 6 October 2009 | Volume 5 | Issue 10 | e1000551

levels of noise (Fig. 6Aiii). The model supported the experimental
observation that MCs can be phase-locked at various frequencies
and under noisy conditions. Finally, comparing the model
prediction to our experimental results at the population level is
impossible because of the lack of data on the distribution of the
input excitatory conductance gE in the MC population. Thus, in
Fig. 6B we present only side-by-side comparisons of those spike
phases that can be predicted by the model (left column) for each
Figure 5. Oscillatory inhibition at 60 Hz controls MC model firing rate and phase jitter. Ai) The firing rate (y-axis) of the MC model isplotted (red) in spikes per cycle (SpC) for a 60 Hz oscillation as a function of the excitatory conductance gE (x-axis), while the cell is submitted to aconstant inhibitory conductance gI = 20 S/m2. The firing rate was measured for two inhibitory oscillatory conductances (gIo): 10% (blue) and 30%(green). Plateaus appear around 0.5 SpC (a), 1 SpC (b), 1.5 SpC (c), 2 SpC (d) and 3 SpC (e) (see arrows). Aii): Same as in Ai, but under noisy conditions.The main plateaus remained after the addition of noise. B) Examples of spike patterns along four oscillation cycles plotted using the sameconventions as in Fig. 3. They correspond to different gE positions along the curves drawn in Ai, i.e., without noise (see small capital letters forcorrespondence). C) Phase jitter map according to gE (x-axis) and gIo (y-axis). Like in A) gI = 20 S/m2. Ci) Without noise, null-jitter zones (black zones)correspond to tongues 2:1, 1:1, 2:3, 1:2, and 1:3 (indicated on the map). Colored zones represent the regime of non-locked spike trains with jitter.0.05 (see colored bar). Tongue width increases with gIo. Tongues start at gIo = 0 when the unforced neuron firing rate is 1, 1.5, 2, and 3 SpC (see thefiring rate-x-axis below, which corresponds to the unforced frequency at a given excitatory input). Cii) Noisy conditions. Noise tended to degrade thephase-locking, but the tongue structures persisted.doi:10.1371/journal.pcbi.1000551.g005
Mitral Cell Entrainment during Gamma Bursts
PLoS Computational Biology | www.ploscompbiol.org 7 October 2009 | Volume 5 | Issue 10 | e1000551

type of pattern and their experimental counterparts (right column).
The phases of the spikes of the model come from the patterns that
are detected under quiet conditions (contour) (corresponding to
Fig. 5Ci) and noisy conditions (grey) (corresponding to Fig. 5Cii).
For a better fit, we used only the patterns evoked when gIo,4 S/
m2). We observed agreement between theoretical and experimen-
tal data especially under noisy conditions. Indeed, whereas without
noise in the model, some differences are observed between the
mean phase predicted by the model for the 3:1, 2:1 and 1:1
patterns and those observed in the data, introducing some noise
tends to decrease these differences in the mean phase between the
model and the experiments. The spike phases of patterns with high
Figure 6. Model phase distribution and comparison with experimental phases in phase locked patterns. Ai) Model spike phase (y-axis)distribution is plotted like a phase map (see grey scale bar) as a function of gE (x-axis). For a 10% oscillatory inhibition (gIo = 2 S/m2, gI = 20 S/m2), theMC model exhibited clear preferential phases (dark spots; arrows indicate tongue q:p). Aii) Increasing the inhibitory amplitude to 30% (gIo = 6 S/m2)value for gIo led to an increased gE band (see the horizontal double arrow), for which the phases were locked. Aiii) Noisy conditions, which were thesame levels of inhibition as in (Aii), caused the phases to scatter around the tongue phases. B) Comparison of model (left panels) and experimental(right panels) phase distribution for spike trains classified as phase locked patterns (one row for each type of pattern). The pattern spike phases areextracted from Fig. 5Ci for the noise free conditions (black contour) and from Fig. 5Cii for the noisy conditions (grey bars) under the synapticconditions gIo,4 S/m2, gE,15 S/m2 and gI = 20 S/m2.doi:10.1371/journal.pcbi.1000551.g006
Mitral Cell Entrainment during Gamma Bursts
PLoS Computational Biology | www.ploscompbiol.org 8 October 2009 | Volume 5 | Issue 10 | e1000551

firing rates, that is, 2:3, 1:2 and 1:3, seem less sensitive to noise. In
addition, the difference of the phase distribution width between
the model and experiments could be explained by the measure
variability of the gamma phase that was recorded from different
depths and that will be further discussed later.
Synaptic input parameters governing the entrainment.
Having shown that our model can reproduce our experimental
results well, we further used it to explore how MC entrainment
should depend on network parameters or MC intrinsic
parameters.
First, we studied the influence of the excitatory-inhibitory
balance. The level of inhibition received by an MC is not known,
and it is difficult to infer using standard experimental approaches
(see estimation in Methods). It may vary within a range depending
on the level of recurrent, lateral, and centrifugal inhibition that are
present in the OB network, and these networks are highly variable
and modulated in their nature and function. To explore the
consequences of the average inhibition for the entrainment, under
noiseless conditions, we set the level of background inhibition to
different values (gI = 6, 20, 100 S/m2). This range of values
corresponds to the range of influence, ranging from a small effect
to a complete shunting effect on the spiking activity. We then
measured the entrainment for the 1:1 tongue by representing the
entrainment diagrams as a function of MC excitatory input and
the inhibitory oscillation amplitude (see Fig. 7A). The 1:1 tongue
grew wider as the average level of inhibition increased. The tongue
width was measured by the gE band (Fig. 7A), and computed with
an oscillation amplitude of 2 S/m2 that increased with the average
inhibition level (Fig. 7B, full black line, left y-axis). Alternatively, a
given set of conductances (gE,gI) corresponds to a given MC firing
rate, and thus the gE band can be converted into a f-band that
describes the range of firing rates (in the absence of oscillation) at
which the MC are entrained by the inhibitory oscillation in a 1:1
pattern. Again, the width of this f-band increases with the average
inhibition level (Fig. 7B, full grey line, right y-axis). These results
were robust under noisy conditions (see dashed lines in Fig. 7B).
Taken together, these findings reveal that a higher level of
background inhibition of MCs makes them more capable of being
entrained.
Second, we showed that an oscillation frequency in the gamma
range is optimal for entrainment. Experimental data showed
frequency stability in the LFP oscillation around 60.7 Hz (Fig. 1D).
Since the frequency of gamma oscillations varied little under our
experimental conditions, as well as under other conditions [10,18],
we wondered why the frequencies had these particular values. We
tested how the model reacted to other imposed frequencies (fosc) of
the inhibitory conductance ranging from 5 to 120 Hz and then
analyzed the zones for which the MC model was entrained,
according to both its intrinsic firing rate and the frequency of the
oscillation. Such zones are represented for the 2:1, 1:1, and 1:2
tongues in Fig. 7C. These results demonstrate that the MC models
can be entrained by any frequency oscillation in a 1:1 pattern, as
long as the oscillation frequency is close to the intrinsic firing rate
of the MC. This relationship is reflected by the fact that the 1:1
tongue covers the diagonal fosc = fintrinsic in the graph in Fig. 7C.
More noticeably in the case of the 1:1 tongue, the bandwidth (f-
band) was largest when fosc was in the 40–60 Hz range. In
contrast, for the 2:1 and 1:2 tongues, the maximal entrainment
was observed for oscillation frequencies around 120 Hz and
30 Hz, respectively, which correspond to an MC intrinsic firing
rate of about 60 Hz in both cases.
We further explored the broader range of entrainment that was
observed when the MC intrinsic activity was close to 60 Hz. Due
to the importance of the 1:1 pattern in both the experimental and
simulated results, we focused on the frequency band (f-band) of the
1:1 tongue. The bandwidth is represented as a function of the
oscillation frequency in Fig. 7 (D, black thin line). When the
amplitude of the oscillation was varied from 5% to 10% of the
global inhibition level, the peak at around 60 Hz persisted.
Varying the average inhibition level (gI) or adding some noise to
the system did not change the position of the peak around 60 Hz.
These results indicate that MCs may be preferentially entrained by
oscillations at 60 Hz, and that they are robust to variations in the
parameters for synaptic stimulation of MCs.
The last step was to explore how the intrinsic properties of the
MC model were potentially responsible for the 60 Hz preference.
For that purpose, we varied the time constant of the slow
potassium channel, which was responsible of the MC model
Figure 7. Influence of synaptic input parameters on MC modellocking. A) Tongue 1:1 limits. The edges of tongue 1:1 are shown forvarious levels of global inhibition gI (6, 20, 100 S/m2) in the absence ofnoise. Values of gE corresponding to tongue edges are shown relativeto gE,threshold 1:1, which corresponds to the level of excitatoryconductance gE necessary to induce a neuronal intrinsic firing rateequal to the oscillation frequency (that is when gIo = 0). This level varieswith gI that is why the reference is needed to study the effect of variouslevels of gI. B) Tonic inhibition effect. Representation of tongue 1:1width for gIo = 2 S/m2. The gE-band (full black line in conductance units,left y-axis) and the f-band (full grey line in frequency units, right y-axis)are shown as a function of the global inhibition level gI. The f-band isthe range of unforced frequency that can be locked by the oscillation.Dashed lines correspond to noisy conditions and gIo = 1 S/m2. C)Tongue map. Phase-locked zones are shown for the tongues 2:1 (darkgrey), 1:1 (black), and 1:2 (light grey) in the plane that is represented bythe intrinsic MC frequency, which is determined when gIo = 0 (x-axis)and the frequency of the oscillation (fosc) (y-axis). For these results,gI = 20 S/m2, and gIo = 1 S/m2. The dashed line is y = x. D) Oscillationfrequency preference for locking. The 1:1 tongue f-band width[indicated by arrows in (C)] is plotted as a function of fosc using abold black-line with the parameters in (C). Various conditions are tested,such as the amplitude of gIo, gI and gIs (see details in the figure). MCentrainment was always maximal between 50 and 70 Hz for any valueof gI, gIo, and noise.doi:10.1371/journal.pcbi.1000551.g007
Mitral Cell Entrainment during Gamma Bursts
PLoS Computational Biology | www.ploscompbiol.org 9 October 2009 | Volume 5 | Issue 10 | e1000551
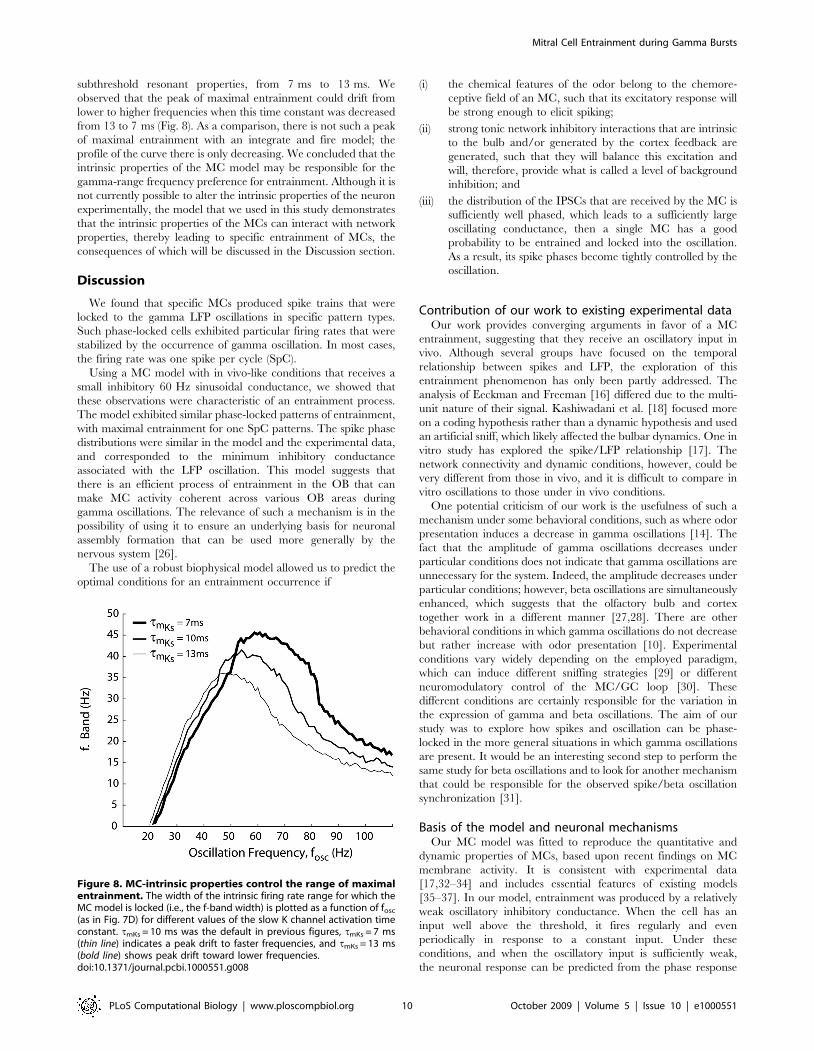
subthreshold resonant properties, from 7 ms to 13 ms. We
observed that the peak of maximal entrainment could drift from
lower to higher frequencies when this time constant was decreased
from 13 to 7 ms (Fig. 8). As a comparison, there is not such a peak
of maximal entrainment with an integrate and fire model; the
profile of the curve there is only decreasing. We concluded that the
intrinsic properties of the MC model may be responsible for the
gamma-range frequency preference for entrainment. Although it is
not currently possible to alter the intrinsic properties of the neuron
experimentally, the model that we used in this study demonstrates
that the intrinsic properties of the MCs can interact with network
properties, thereby leading to specific entrainment of MCs, the
consequences of which will be discussed in the Discussion section.
Discussion
We found that specific MCs produced spike trains that were
locked to the gamma LFP oscillations in specific pattern types.
Such phase-locked cells exhibited particular firing rates that were
stabilized by the occurrence of gamma oscillation. In most cases,
the firing rate was one spike per cycle (SpC).
Using a MC model with in vivo-like conditions that receives a
small inhibitory 60 Hz sinusoidal conductance, we showed that
these observations were characteristic of an entrainment process.
The model exhibited similar phase-locked patterns of entrainment,
with maximal entrainment for one SpC patterns. The spike phase
distributions were similar in the model and the experimental data,
and corresponded to the minimum inhibitory conductance
associated with the LFP oscillation. This model suggests that
there is an efficient process of entrainment in the OB that can
make MC activity coherent across various OB areas during
gamma oscillations. The relevance of such a mechanism is in the
possibility of using it to ensure an underlying basis for neuronal
assembly formation that can be used more generally by the
nervous system [26].
The use of a robust biophysical model allowed us to predict the
optimal conditions for an entrainment occurrence if
(i) the chemical features of the odor belong to the chemore-
ceptive field of an MC, such that its excitatory response will
be strong enough to elicit spiking;
(ii) strong tonic network inhibitory interactions that are intrinsic
to the bulb and/or generated by the cortex feedback are
generated, such that they will balance this excitation and
will, therefore, provide what is called a level of background
inhibition; and
(iii) the distribution of the IPSCs that are received by the MC is
sufficiently well phased, which leads to a sufficiently large
oscillating conductance, then a single MC has a good
probability to be entrained and locked into the oscillation.
As a result, its spike phases become tightly controlled by the
oscillation.
Contribution of our work to existing experimental dataOur work provides converging arguments in favor of a MC
entrainment, suggesting that they receive an oscillatory input in
vivo. Although several groups have focused on the temporal
relationship between spikes and LFP, the exploration of this
entrainment phenomenon has only been partly addressed. The
analysis of Eeckman and Freeman [16] differed due to the multi-
unit nature of their signal. Kashiwadani et al. [18] focused more
on a coding hypothesis rather than a dynamic hypothesis and used
an artificial sniff, which likely affected the bulbar dynamics. One in
vitro study has explored the spike/LFP relationship [17]. The
network connectivity and dynamic conditions, however, could be
very different from those in vivo, and it is difficult to compare in
vitro oscillations to those under in vivo conditions.
One potential criticism of our work is the usefulness of such a
mechanism under some behavioral conditions, such as where odor
presentation induces a decrease in gamma oscillations [14]. The
fact that the amplitude of gamma oscillations decreases under
particular conditions does not indicate that gamma oscillations are
unnecessary for the system. Indeed, the amplitude decreases under
particular conditions; however, beta oscillations are simultaneously
enhanced, which suggests that the olfactory bulb and cortex
together work in a different manner [27,28]. There are other
behavioral conditions in which gamma oscillations do not decrease
but rather increase with odor presentation [10]. Experimental
conditions vary widely depending on the employed paradigm,
which can induce different sniffing strategies [29] or different
neuromodulatory control of the MC/GC loop [30]. These
different conditions are certainly responsible for the variation in
the expression of gamma and beta oscillations. The aim of our
study was to explore how spikes and oscillation can be phase-
locked in the more general situations in which gamma oscillations
are present. It would be an interesting second step to perform the
same study for beta oscillations and to look for another mechanism
that could be responsible for the observed spike/beta oscillation
synchronization [31].
Basis of the model and neuronal mechanismsOur MC model was fitted to reproduce the quantitative and
dynamic properties of MCs, based upon recent findings on MC
membrane activity. It is consistent with experimental data
[17,32–34] and includes essential features of existing models
[35–37]. In our model, entrainment was produced by a relatively
weak oscillatory inhibitory conductance. When the cell has an
input well above the threshold, it fires regularly and even
periodically in response to a constant input. Under these
conditions, and when the oscillatory input is sufficiently weak,
the neuronal response can be predicted from the phase response
Figure 8. MC-intrinsic properties control the range of maximalentrainment. The width of the intrinsic firing rate range for which theMC model is locked (i.e., the f-band width) is plotted as a function of fosc
(as in Fig. 7D) for different values of the slow K channel activation timeconstant. tmKs = 10 ms was the default in previous figures, tmKs = 7 ms(thin line) indicates a peak drift to faster frequencies, and tmKs = 13 ms(bold line) shows peak drift toward lower frequencies.doi:10.1371/journal.pcbi.1000551.g008
Mitral Cell Entrainment during Gamma Bursts
PLoS Computational Biology | www.ploscompbiol.org 10 October 2009 | Volume 5 | Issue 10 | e1000551

curve (PRC) [38,39], which can also predict some characteristics
of the tongues [40]. Since the PRC of our MC model agrees with
the experimental one [41], it is likely that our model can
accurately predict the MC response to such synaptic inputs. The
synaptic mechanisms hypothesized in our model are based on
observations made by Lagier et al. (2004) [17], who reported that a
fraction of the IPSPs received by the MCs were phase-locked
relative to gamma oscillations. Other possible mechanisms that
could affect the MC membrane potential during gamma
oscillations have been proposed: (1) a synchronous inhibition
resulting from GABA release from astrocytes [42], (2) a
synchronous excitation of the MCs by glutamate spillover onto
lateral dendrites [43,44], and (3) a direct influence of the LFP on
membrane voltage [45,46]. Of these possible explanations, the
functional and dynamic relevance of the interactions between
MCs and GCs [47] are the most likely processes to occur during
gamma oscillations.
Aside from this observation, an important characteristic of our
model is that the time constant of the single inhibitory inputs does
not play a role because it is the frequency of the oscillatory
modulation of the whole inhibitory input that imposes the locking
frequency.
It is important to insert this mechanism into a more realistic
model in order to take into consideration the spatial distribution of
the physiological mechanism in dendrites. The presence of high
frequency bursts of spikes in MCs is probably not due solely to the
excitatory drive from the sensory input, but also to additional
conductance levels beyond those present in the model. For
example, the activation of an intrinsic conductance, such as T
channels, would facilitate the emergence of high frequency bursts
like those in our recordings.
Explanation of model predictions and experimentalrecordings
Neuronal phase-locking and pattern formation have already
been described both theoretically [20,21,48] and experimentally
[26,49]. Our study, performed in the context of the OB with a
resonant neuron, however, sheds light on important aspects that
are specific to this system.
First, the simulation results provide some precise explanations
regarding electrophysiological properties that are not directly
accessible by experimentation. The phase of the MC spikes
relative to LFP oscillations is precisely distributed in the J to Kpart of the LFP cycle due to their level of synaptic drive. The phase
distributions extracted from simulated data (Fig. 6A) are more
precise and go beyond the data that was obtained in the OB
[14,17,18], as well as our own experimental results. We wish to
point out, however, that our experimental measurement of gamma
phase was not totally reliable from one particular depth to another,
and could have up to J of a cycle of phase shift. Indeed, gamma
oscillations are generated by membrane currents flowing on either
side of the MC layer, and the simultaneous recording of a gamma
oscillation constantly shows a J cycle phase shift when it is
recorded up to 100 mm from the MC layer (Fourcaud-Trocme and
Buonviso, personal communication). In our recordings, we could
not control the exact position of each electrode relative to the MC
layer. As a consequence, these recording constraints, as well as the
noise level, are likely to be the source of the larger spread of phases
during the phase-locked experimental pattern when compared to
the model prediction (see Fig. 6B). This can also explain the small
discrepancies with recordings from other studies in which the LFP
recording position relative to the mitral cell layer was different or
more precisely controlled [16–18]. In all cases, however, our
results are still qualitatively comparable.
Second, lower levels of excitatory conductance in the model
were predicted to induce a slight phase lag (corresponding to
,5 ms) between the neurons, as shown in Fig. 6A. This phase
difference is observed in the cross-correlograms that were
presented by Kashiwadani et al. (1999) [18] (their Fig. 5A), and
it may be achieved by differential activation of the glomerulus
[18,50,51]. Our predictions are able to explain the result of this
previous study.
The model predicts that phase-locked or residual spike trains
may depend on the degree of detuning (i.e., the difference between
the neuronal intrinsic firing rate and the external network
frequency), the strength of coupling, and the level of noise. The
continuity between the locked and residual spike trains suggests
that entrainment of MCs may be fine-tuned during the gamma
oscillation, and may corroborate the locking that was observed in
the fish OB [13]. However, only simple phase-locking has been
found in these species.
Finally, in our model, increasing the global level of excitatory-
inhibitory conductance favors entrainment (see Fig. 7A–B). Under
anesthetized conditions, the maximal conductance should be
directly related to the maximal activity of the peripheral excitation
[51,52] and to the maximum of synaptic inhibition [53], which
corresponds to the inspiration/expiration transition. Taken
together, these data imply that entrainment should be the
strongest at this transition, which is what was observed with the
gamma wave appearing around this point (Fig. 1). Interestingly,
odors that elicit low theta activity (respiratory modulation), which
potentially reflects weak OB activation (e.g., low-concentration
odors), generally failed to elicit gamma oscillation [9], suggesting
that the theta oscillation could gate gamma activity.
Implications on the origin of the gamma oscillationIn the OB, MCs are directly interconnected only within
glomerulus [54–57] and not across bulbar areas. Instead, MC
spikes induce a depolarization of some GC spines, which
propagates through parts of the cell to other spines and triggers
both synchronous [58–62] and asynchronous [36,55,63–65]
GABA release from granule dendrodendritic synapses onto other
MCs. This peak of GABA release is about L of the gamma cycle
(, = 12 ms) after the peak of spiking (according to the spike
(Fig. 4E) and IPSP (Fig. 4G) phase distributions in [17]). The slow
component of inhibition [55,64–66] may contribute to the global
tonic inhibition level that is present in the OB. This synaptic
activity suggests that the effective interaction between MCs is
inhibition, and that the OB could be approximately modeled as a
network of inhibitory coupled MCs.
Our results raise the question of the origin of gamma oscillatory
activity in the OB. Do entrained MCs participate in the creation of
this rhythm? If so, how? Two models have been recently proposed
[35,36]. In [35], a network of inhibitory coupled MCs is applied to
in vitro recordings, in which the gamma oscillation is continuous
and evoked by single stimulation. In [36], the particular tendency
of MCs to synchronize their firing when their stochastic inputs
become correlated was studied. Neither of these models, however,
has been shown to induce the spiking activity that we report here.
This is also the case for the general mechanisms that have been
proposed for oscillation generation in inhibitory [67–69] and
excitatory-inhibitory networks [69–71]. It has to be noted that, in
these studies, a large heterogeneity in the population intrinsic
firing rates usually prevents the formation of an oscillation, and
that the case of a resonant neuron is not considered.
Our results, however, suggest the following two hypotheses.
First, if MCs behave like oscillators, a possible mechanism for the
emergence of the oscillation may be provided by the transition
Mitral Cell Entrainment during Gamma Bursts
PLoS Computational Biology | www.ploscompbiol.org 11 October 2009 | Volume 5 | Issue 10 | e1000551

towards synchrony, a phenomenon that is generally observed in a
network of coupled heterogeneous oscillators [20,72]. Second, the
model predicts that intrinsic MC properties (according to Fig. 7D
and 8) lead to a maximal entrainment in the gamma frequency
range. Indeed, a non resonant neuron (i.e. an integrate-and-fire
model) does not exhibit this behavior (data not shown). From this
property, it can be seen that among the MC population that
exhibits quite heterogeneous frequencies (see Fig. 4), MCs firing
with intrinsic firing rate in the range of 40–70 Hz are better
entrained than MCs firing at lower or higher frequencies. The
rhythm could be created when this entrained MC population
becomes sufficiently large.
Coding implicationsOther studies in anesthetized rats have shown that MCs can be
segregated into two populations according to whether they phase-
lock to gamma oscillations or to beta oscillations, which is likely
due to their position relative to the receptive field of the odor [31].
Here, we show that, among MCs that lock to the gamma
oscillation, locking is finely tuned depending on the various
conditions that control MC entrainment, one of them being the
nature of the odor. A subset of the MC population can therefore
be entrained and phase-locked at gamma frequencies with patterns
depending on the intrinsic firing rate of the MC, which is similar to
the previously described rate-specific synchrony [26]. The
resulting phase-locked activity map may overlap with the
glomerular activity map. This is suggested by our results, which
show that pattern types are partially reproducible for the same cell
and the same odor. The glomerular map is likely forwarded to
MCs as a ‘‘rate code’’ map that is readable by downstream
structures. The phase-locked activity map, however, appears to be
more elaborate than the simple glomerular map. In particular, the
main characteristic of the phased-locked activity map is that it can
be modulated by various parameters: such as the conductance
level (Fig. 7), the MC intrinsic firing rate (Figs. 4 and 5), and/or
the degree of GC-MC coupling (Fig. 5C). It is therefore likely that
this phase-locked activity map is modifiable by plasticity
mechanisms and central control [10]. Based on the adjustment
of the spike phases, the mechanisms described here would result in
population activity that is readable by decoding structures which
function as coincidence detectors. Pyramidal cells of the piriform
cortex have such detection properties [73]. In addition, synaptic
integration by pyramidal dendrites is more sensitive to pattern-like
inputs, as shown in other sensory systems [74,75]. Thus, our model
of a phase-locked map of MC activity across the OB supports the
idea developed by Zou and Buck [76] that pyramidal cells could
integrate odorant features using a combination of coincident MC
inputs (as argued also in [77]) in a way similar to the mushroom
bodies of insects [78,79].
Methods
Ethics StatementAll experiments were performed in accordance with the
guidelines of the European Communities Council.
Preparation and recordingMale Wistar rats (150–350 g) obtained from Charles River Labs
(L’Arbresle) were anesthetized with urethane (i.p. 1.5 mg/kg, with
additional supplements as needed) and placed in a stereotaxic
apparatus. The dorsal region of the OB was exposed. Bulbar
activity was recorded as a broadband signal (0.1–5 kHz) using 16-
channel silicon probes (NeuroNexus Technologies, Ann Arbor,
MI) with a homemade, 16-channel DC amplifier. The data were
digitally sampled at 10 kHz and acquired on a PC using the
IOtech acquisition system (Wavebook, IOtech, Cleveland, OH).
Probes were placed in the lateral or medial part of the OB at a
depth that maximized the number of channels located in the
mitral cell layer (MCL). The respiration signal was recorded using
a homemade flowmeter based on a fast response time thermodi-
lution airflow sensor. Odors were delivered through a dilution
olfactometer (440 ml/min). The recording protocol was as follows:
5 s of spontaneous activity, 5 s of odor-evoked activity, and 5 s of
post-stimulus activity. Each sampling included stimulation by
simple linear aliphatic compounds. The varying features of
odorants were either the number of carbons in the main chain
(chain length: 5, 6, 7 and 10 C) or the functional group associated
with the chain (alcohol, ester, aldehyde or ketone). Additional
odors have been used, including isoamyl acetate, p-cymene, and
eugenol. All odors were delivered in front of the animal’s nose at a
fraction of 18.1022 of the saturated vapor pressure. The time delay
between each odor presentation was at least one minute.
Data processingRespiratory signal. The signal was processed as previously
described [80]. Briefly, respiratory cycles were extracted, and, for
each one, the time was converted into a phase that had a value
that varied as [2p, 0] for inspiration and as [0, p] for expiration.
The transition point between inspiration and expiration (I/E)
corresponded to the 0 phase, which was detected as the point
where the signal crossed the 0 value and which corresponded to
the point where there was no variation in pressure.
LFPs. LFPs were obtained by band-passing the recorded
signal at 5–200 Hz. To preserve both time and frequency
information, we used a time-frequency representation (TFR) that
was based upon continuous wavelet transformations, as previously
described [81]. Briefly, the LFP signal was convoluted by complex
Morlet’s wavelets [82] with a time resolution of 5 ms and a
frequency resolution of 1 Hz. Using a wavelet ridge extraction
method coupled with a high time-resolution TFR, each gamma
oscillatory epoch of the LFP was extracted using an energy
threshold to detect its beginning and end. This procedure allowed
a reasonable estimation of the phasic, temporal, and frequency
features of these oscillations. The TFRs were normalized to the
energy measured during the spontaneous activity in the 5 s before
odor presentation.
Spikes. Signals from individual electrodes were amplified
(gain 1,0006) and filtered from 300 to 5000 Hz. Multiunit activity
consisted of a few neurons on each electrode. Spikes were clustered
off-line using a semi-manual routine. We chose to use only the
units that showed a signal/noise ratio $5 and to sort cells
according to their spike amplitude. Consequently, the number of
units that were retained for analysis was restricted to 1–3 per
electrode. This conservative procedure resulted in the analysis of a
relatively limited number of units but provided high quality data.
Additional details of the method are given in Cenier et al. [31].
Moreover, autocorrelograms of spike trains that belonged to
presumed single units confirmed that a refractory period exists and
precluded the possibility to have multiunit recordings included in
our single unit ones. The ISI histogram in Fig. 1E shows this
refractory period at the population level.
Spike phases. To study relationships between spike and LFP,
(these were always recorded from the same electrode), we
converted spike times into phases that were computed in cycle
units (i.e., the phase increased by one at each cycle) during each
LFP gamma oscillation epoch. This change in the time axis
allowed the interspike interval (ISI) (respective firing rate) to be
measured in cycle units (respective spike per cycle (SpC)). Using
Mitral Cell Entrainment during Gamma Bursts
PLoS Computational Biology | www.ploscompbiol.org 12 October 2009 | Volume 5 | Issue 10 | e1000551
phases instead of time allowed us to discard temporal or frequency
irregularities across oscillatory epochs.
StatisticsPhases. For a given ensemble of spikes (N) with relative
phases fQnf ggn~1,:::,N , the phase distribution was represented as a
histogram (bin size: 0.02 cycle). To analyze this distribution, we
used circular statistics [83]. The mean phase Q is defined by:
rei2pQ~1
N
XN
n~1
ei2pwn : ð1Þ
The circular standard deviation uses the modulus (r) of this sum
and is given by s~ffiffiffiffiffiffiffiffiffiffiffiffiffiffiffiffi{2logr
p. The value of r increases from 0 to 1
as the phase distribution changes from being uniform to sharply
peaked.
A Rayleigh uniformity test was used to calculate the probability
that the data were uniformly distributed (null hypothesis).
Using, p~e{Z 1z( 2Z{Z2)=4N{( 24Z{132Z2z76Z3{9Z4)�
=288N2�, with Z~N3r2, the level of significance for non-uniformity
was set at a p-value,0.001 [83].
Interspike Intervals. The interspike interval (ISI) distribu-
tion was compared to the density function of a random variable
process following a gamma distribution that was reconstructed in
order to have the same mean and a random refractory period
(with a Gaussian distribution that had a mean of 3 ms and the
standard deviation at 1 ms), such that the refractory period is
sorted each time the sorted ISI falls below the refractory period
[84].
In addition, we considered both the instantaneous frequency,
which was defined for each spike time as the inverse of the
preceding ISI, and the mean firing rate, which was given by the
average number of spikes that fell within a time bin of 50 ms. The
ISI unit was a cycle of LFP gamma oscillation. When the ISI fell
out of the LFP gamma burst, the time reference was the mean
cycle of the LFP gamma burst.
Detection and classification of phase patternsSummary of pattern definition. In this study, our aim was
to quantify the different proportions of ‘‘phase-locked spike trains’’
in our experimental data. Therefore, we quantified each category
of q:p patterns, where q = number of oscillation cycles and
p = number of spikes. For this purpose, we used an automatic
detection method to determine the limits that defined a q:p
pattern. A scheme of this method is presented in Fig. 9. Briefly, the
method consisted of measuring the closeness between
experimental spike trains and perfectly phase-locked theoretical
q:p patterns. In measuring this closeness, the method took into
account two parameters:
(1) the relative distance, which was based only on the
difference in the number of spikes between the experimental
and theoretical spike trains during each oscillation cycle;
(2) the phase jitter, which measured how well the experimental
spikes were phase-locked (based on their position in the q:p
pattern).
An experimental spike train had to fall within strict limits for
these two parameters to qualify it as a ‘‘q:p phase-locked’’ pattern
(see the next section for additional details about those measures).
This method of detection was also used for trains produced by
the simulations in Fig. 5. In this case, to optimize pattern detection
and minimize random noise in the jitter, we used phase trains
lasting 50 cycles (cases without noise) or 100 cycles (cases with
noise) in Figs. 7 A–B, while 10-second spike trains were used in
Fig. 7C–D and in Fig. 8A simplified and stricter constraint on the
distance was set by measuring the firing rate, if this did not exceed
2% of the firing rate of the pattern, and a simplified constraint for
jitters was set if the standard deviation of phases of all first spikes of
each cycle did not exceed 0.05 cycle, which allowed us to more
rapidly detect the edges between locked and unlocked zones.
Details of the method for pattern detection. Each spike
train [observed both in the experimental results and model
(described later)] was represented as a sequence of spike phases
(step1, Fig. 9). From experimental observations, six types of
patterns were described for the q:p categories, which were the p
spikes per q cycles (q and p are prime numbers between each other
and are chosen among [1 2 3]): 3:1, 2:1, 1:1, 2:3, 1:2, and 1:3. In
these patterns, the phases were stable from one period to the next.
Each spike train was compared with all the different types of q:p
patterns to find the closest one. This comparison occurred in two
steps:
First, the distance between the spike train and a theoretical
pattern was measured (step 2 Fig. 9). The absolute distance is
the number of cycles that differ in the number of spikes. For
theoretical patterns with multiple spikes per cycle, the first and last
cycles could be cut to best match the experimental spike train.
This absolute distance was then normalized by the number of
cycles over which the spike train spread to obtain the relativedistance, which was comparable across spike trains. Mathemat-
ically, this relative distance can be written as:
d~
PPPCc~1
(1{dnPAexp(c),nPApat(c))
Cð3Þ
where C is the total number of oscillation cycles, nPAexp(c) and
nPApat(c) are the number of spikes during the cycle c in the
experimental and theoretical patterns respectively, and d is the
dirac function that equals 1 when both indices are equal.
The relative distance was computed for all types of theoretical
patterns, and only the patterns that had a distance dvdmax were
further considered in the classification process. For all patterns,
dmax was set to 0.33, which corresponded to an allowance of up to
less than one-third of the cycles where there could be excess or
missing spikes relative to the theoretical pattern.
The selected set of patterns was then submitted to a second
round of selection (step 3 and 4 Fig. 9) based on a criterion of
phase jitter between the experimental train and each pattern. The
estimator of the jitter s is given in Eqn (4):
ssjitter~
ffiffiffiffiffiffiffiffiffiffiffiffiffiffiffiffiffiffiffiffiffiffiffiffiffiffiffiffiffiffiffiffiffiffiffiffiffiffiffiffiffiffiffiffiffiffiffiffiffiffiffiffiffiffiffi1
( N{K ) pow
XXXN
i~1
(Qi{HJ
sK
) 2
vuut
J ~1, 2 or 3 is the index of phase position for apattern
, ð4Þ
where N is the total number of spikes in the train, Qi is the phase of
each spike, HJ is the mean phase of the spikes that correspond to
position J in the theoretical pattern cycle (thus it is different for
spikes that corresponds to different positions), and sK is a
normalization factor to compensate for patterns with multiple
spikes in a single cycle, with sK equal to the standard deviation of a
uniform distribution of a single spike in a 1/K cycle fraction,
where K is the maximal number of spikes in the pattern cycle. The
formula is slightly adapted for 2:3 patterns: the denominator N-K
Mitral Cell Entrainment during Gamma Bursts
PLoS Computational Biology | www.ploscompbiol.org 13 October 2009 | Volume 5 | Issue 10 | e1000551

Figure 9. Method for detection of phase-locked patterns. Step by step description using an example: (1) A spike train taken fromexperimental recordings is represented with its phases (x-axis, top left) along the successive gamma cycles (y-axis). This train was characterized by thenumber of spikes in each cycle (left matrix), and we allocated different indexes for spikes in the same cycle in the order in which they appeared in thecycle (right matrix). (2) Independently, a pattern sequence generator created all phase trains that have the same cycle length as the experimental one.In this case, the length was four. Three examples of all these generated pattern sequences are shown as column vectors (theoretical pattern column),each of which is affiliated with a particular pattern (e.g. 1:1, 1:2, 1:3). The absolute distance between experimental spike train and theoreticalpattern was measured by summing the result of the equality test over all of the cycles of the train. In terms of spike number, if the spike numbers areidentical, then the test result is 0, otherwise it is 1. The relative distance was obtained by dividing the absolute distance by the number of cyclesthat were covered by the train. At this step, we eliminated the pattern sequences with a relative distance . = 0.33 (e.g. the last line pattern 1:3example). (3) All of the position possibilities were then considered for the spike (index) position of the experimental train in the selected patterns(grid). Single or multiple correspondences are shown for each selected pattern. (4) Based on these positions in the hypothesized pattern, weempirically estimated the mean phase of the pattern from spike positions. For example, in the first plot (top right), the black boxes are the meanphase of spike index 1. A jitter was calculated based on the distance of each spike to the mean phase (distances to the mean phase are marked witharrows in the second plot). This jitter is indicated in the last column. We kept only the pattern with the smallest jitter and considered the original spiketrain as phase-locked only if this jitter fulfilled the stringent condition (s,0.5). In this example, the spike train is considered to be a phase-locked 1:1pattern. (5) We show here some examples of spike trains that were not classified as phase-locked patterns because of their too large distance or toolarge jitter.doi:10.1371/journal.pcbi.1000551.g009
Mitral Cell Entrainment during Gamma Bursts
PLoS Computational Biology | www.ploscompbiol.org 14 October 2009 | Volume 5 | Issue 10 | e1000551

takes the value N-3 in order to take into account the degree of
liberty that is when phase can vary on 3 different positions and sK
changes according to the number of spike in each cycle. The
parameter pow is equal to 1.5 and serves to adjust the formula so
that it favors the detection of long trains. The theoretical pattern to
be associated with the experimental train was the one with the
smallest jitter among those that satisfied the distance constraints
given in Eqn (1). If two theoretical patterns showed the same jitter,
the one with the smallest distance was selected. The jitter limit was
set to 0.5 for the phase-locked patterns. In the presented data, the
spike trains that spread over at least three gamma cycles are
shown, and the results were similar when spike trains spreading
over at least two cycles were also examined. Some examples of
residual spike trains are given in the bottom of Fig. 9.
In short, our database consists of 2189 simultaneous recordings
of LFP-gamma bursts that are associated with spike trains of
various lengths. Other recordings where there were neither spikes
nor gamma oscillations were discarded. Among the spike trains,
1210 had strictly more than 1 spike, and 898 spread over at least 3
LFP gamma oscillation cycles. These spike trains were recorded in
143 different mitral cells. Spike train distribution per cell and per
odor is provided in Fig. 10A and B, respectively. The pattern study
is performed on spike trains that cover at least 3 LFP gamma
cycles. Detected pattern distribution over the recorded cell
population and tested odor is given in Fig. 10C and D,
respectively. Finally, the individual cell contribution to the
detected patterns is given in Fig. 10E. The probability of finding
the same pattern in an MC response was higher for responses to
the same odor than for responses to different odors (see the
distribution of these probability differences computed for each cell
in Fig. 10F).
Random spike trains. To assess the significance of the
phase-locked patterns, we compared our experimentally recorded
spike trains to a set of computationally controlled random spike
trains. Various methods can be used to draw random spike trains
comparable to experimental spike trains. Since we wanted to
check the influence of the oscillation on relative spike timings, it
was important not to constrain neither the interspike intervals nor
the spike phase relative to the oscillation, which are some measures
that can be influenced by the oscillation. Therefore, we first
decided to constrain our model by what appeared to be the
measure that was the least contaminated by the oscillation, that is,
the mean firing rate of the spike train. For each experimentally
observed spike train, we drew and sorted a family of 100 spike
trains using a Poisson process with the same mean firing rate but
with an imposed minimal interspike interval of 1/4 of an
oscillation gamma period, which corresponded to a refractory
period of about 4 ms (similar to what is observed experimentally).
This refractory period was reset to 0 in the few cases where firing
rate of the observed spike train could not allow a refractory period
as large as 4 ms. We verified that experimental and random ISI
distributions were in good agreement. Each random spike train
had the same number of spikes as the experimental one. Finally,
the sorting of random spike trains used the same procedure as
described for the experimental pattern detection. The number of
spike trains generated (100 times the number of experimentally
observed spike trains) was sufficient to obtain smooth distributions
when compared to experimental ones.
Second, in order to see how the ISI distributions could account
for the pattern proportions, instead of sorting random spike trains
by the mean firing rate of their equivalent experimental spike
trains, we sorted them by their global ISI distribution (see Fig. 1E).
This resulted in a pattern proportion of 19%. This suggests that
the ISI distribution is part of the formation of patterns. Lastly, we
wanted to know whether the phase reference that is imposed by
the oscillation could account for the pattern detection. We
rephased each random spike train in order to make the mean
phase of the spike fall in the trough of the oscillation, as this would
happen under experimental conditions. When using the set of
spike trains with the same ISI distribution as the experimental
spike trains, we detected 25% of patterns instead of the 19%
obtained without rephasing. In all cases, the proportion of phase-
locked random pattern is below the proportion of experimental
ones (31%), which shows that oscillations impose strong constraints
on the cell discharges: the ISI distribution, phase preference in the
cycle and the order of ISI occurrence.
MC modelThe MC model was derived from a previous study [35], which
was derived in turn from [85]. The model uses parameters from
[86,87]. Its essential features are (1) spiking activity through
sodium spikes, (2) bursting activity (Fig. 11A), (3) its current-
frequency response (Fig. 11B), (4) resonant properties as revealed
Figure 10. Data set information relative to cell and odors. A)Distribution of the number of spike trains per cell. B) Distribution of thenumber of spike trains per odor. C) Distribution of the number ofdetected patterns per cell. D) Distribution of the number of detectedpatterns per odor. In panels A–D, all of the indexes are based on adecreasing number of trains or patterns per cell or odor. E) Cellcontribution to pattern variety. The majority of cells does not firepatterns, and a minority is able to evoke more than one type of pattern.F) Correlation between odor and pattern formation. The distribution ofa difference of probability is plotted. The difference is estimated foreach cell as (1) the probability of finding the same pattern evoked bythe same odor, minus, (2) the probability of finding the same patternevoked by different odors.doi:10.1371/journal.pcbi.1000551.g010
Mitral Cell Entrainment during Gamma Bursts
PLoS Computational Biology | www.ploscompbiol.org 15 October 2009 | Volume 5 | Issue 10 | e1000551
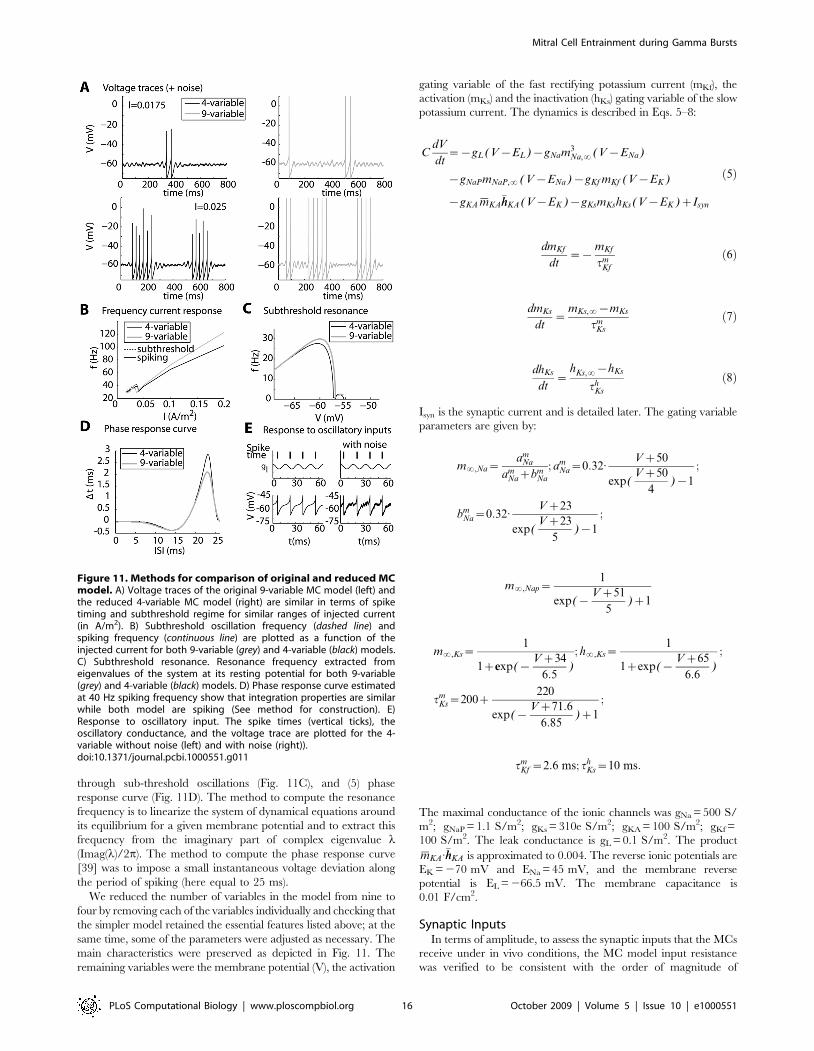
through sub-threshold oscillations (Fig. 11C), and (5) phase
response curve (Fig. 11D). The method to compute the resonance
frequency is to linearize the system of dynamical equations around
its equilibrium for a given membrane potential and to extract this
frequency from the imaginary part of complex eigenvalue l(Imag(l)/2p). The method to compute the phase response curve
[39] was to impose a small instantaneous voltage deviation along
the period of spiking (here equal to 25 ms).
We reduced the number of variables in the model from nine to
four by removing each of the variables individually and checking that
the simpler model retained the essential features listed above; at the
same time, some of the parameters were adjusted as necessary. The
main characteristics were preserved as depicted in Fig. 11. The
remaining variables were the membrane potential (V), the activation
gating variable of the fast rectifying potassium current (mKf), the
activation (mKs) and the inactivation (hKs) gating variable of the slow
potassium current. The dynamics is described in Eqs. 5–8:
CdV
dt~{gL ( V{EL){gNam3
Na,?( V{ENa)
{gNaPmNaP,? ( V{ENa) {gKf mKf ( V{EK )
{gKA{mKA
�hhKA( V{EK ){gKsmKshKs( V{EK )zIsyn
ð5Þ
dmKf
dt~{
mKf
tmKf
ð6Þ
dmKs
dt~
mKs,?{mKs
tmKs
ð7Þ
dhKs
dt~
hKs,?{hKs
thKs
ð8Þ
Isyn is the synaptic current and is detailed later. The gating variable
parameters are given by:
m?,Na~am
Na
amNazbm
Na
; amNa~0:32:
Vz50
exp(Vz50
4){1
;
bmNa~0:32:
Vz23
exp(Vz23
5){1
;
m?,Nap~1
exp({Vz51
5)z1
m?,Ks~1
1zexp({Vz34
6:5)
; h?,Ks~1
1zexp({Vz65
6:6)
;
tmKs~200z
220
exp({Vz71:6
6:85)z1
;
tmKf ~2:6 ms; th
Ks~10 ms:
The maximal conductance of the ionic channels was gNa = 500 S/
m2; gNaP = 1.1 S/m2; gKs = 310e S/m2; gKA = 100 S/m2; gKf =
100 S/m2. The leak conductance is gL = 0.1 S/m2. The product{mKA
:�hhKA is approximated to 0.004. The reverse ionic potentials are
EK = 270 mV and ENa = 45 mV, and the membrane reverse
potential is EL = 266.5 mV. The membrane capacitance is
0.01 F/cm2.
Synaptic InputsIn terms of amplitude, to assess the synaptic inputs that the MCs
receive under in vivo conditions, the MC model input resistance
was verified to be consistent with the order of magnitude of
Figure 11. Methods for comparison of original and reduced MCmodel. A) Voltage traces of the original 9-variable MC model (left) andthe reduced 4-variable MC model (right) are similar in terms of spiketiming and subthreshold regime for similar ranges of injected current(in A/m2). B) Subthreshold oscillation frequency (dashed line) andspiking frequency (continuous line) are plotted as a function of theinjected current for both 9-variable (grey) and 4-variable (black) models.C) Subthreshold resonance. Resonance frequency extracted fromeigenvalues of the system at its resting potential for both 9-variable(grey) and 4-variable (black) models. D) Phase response curve estimatedat 40 Hz spiking frequency show that integration properties are similarwhile both model are spiking (See method for construction). E)Response to oscillatory input. The spike times (vertical ticks), theoscillatory conductance, and the voltage trace are plotted for the 4-variable without noise (left) and with noise (right)).doi:10.1371/journal.pcbi.1000551.g011
Mitral Cell Entrainment during Gamma Bursts
PLoS Computational Biology | www.ploscompbiol.org 16 October 2009 | Volume 5 | Issue 10 | e1000551
synaptic inputs that an MC actually receives. Experimentally, the
input resistance of an MC was found to be 115 MV [88]. We
assumed that a limited part of the total membrane area was
responsible for the input resistance and that axial resistance (or
intracellular resistivity) was negligible for this neuronal small
portion. This portion included the soma and proximal dendrites
and corresponded to 10% of the total area or ,15.103 mm2
[89,90] given that, beyond a distance of about 100 mm from the
soma on either the primary or secondary dendrite, synaptic inputs
are not conveyed to the soma [91]. This experimental ‘‘effective’’
input resistance becomes 1.72 V.m2 when related to the
membrane unit area. Our model is consistent with experiments
since its input resistance measured at hyperpolarized membrane
potential is 1.5 V.m2.
Previous studies have examined the kinetics of signaling to MCs
and have found that MCs receive slow [64], fast, and
asynchronous or simply fast inhibition from GCs [60]. In [17], it
was reported that MCs receive weakly phased inhibition during
gamma oscillation. From Fig. 4G of their report, we visually
estimated that the amplitude of this phasic inhibition was up to
30%. The preferential phase of this oscillatory inhibition was
estimated to be 35969u of the LFP oscillation, and it showed
strong statistical significance (p,1028 by the Rayleigh test).
Therefore, based on these experimental observations, our model
assumes that on average, MCs receive an input current of the form
(Eq.9):
Isyn~( gEzgEs( t) :g( t) ) :( V{EE )z( gIzgIs( t) :g( t)
{gIo:cos( 2pft) ) :( V{EI )
ð9Þ
which is composed of a baseline conductance, including constant
excitatory (gE) and inhibitory (gI) conductances, as well as a
sinusoidal part, i.e., the oscillating conductance whose amplitude is
gIo and whose frequency is fosc. A white noise component was
added to each excitatory and inhibitory component with
amplitudes gEs and gIs, respectively, that were chosen to induce
noise comparable to what is observed with in vivo intracellular
voltage recording [88]. No other source of noise was added. gEs
and gIs vary proportionally with gE and gI in Figs. 5 and 6. gEs is
set to zero in Figs. 7 and 8. gIs is set to 0.282 S.m22.ms1/2 in
Fig. 7B and 0.141 S.m22.ms1/2 in Fig. 7D.
The reversal potentials of the excitatory and inhibitory synapses
are EE = 0 mV and EI = 270 mV, corresponding to the reversal
potentials of AMPA/NMDA receptors and GABAA receptors,
respectively.
Inhibitory synaptic inputs can completely stop MC firing
activity [50] and reshape the temporal organization of spike trains
[60]. It was therefore appropriate for our model to take into
account the levels of inhibitory conductance that could have such
effects on MC activity. The maximum conductance of a single
synaptic input has been estimated to be on the order of 1 nS
[92,93]. A single MC has around 10,000 connections with GCs.
As mentioned above, only about 10% of these inputs are conveyed
to the soma [91], which corresponds to ,1,000 synapses. Such a
limited integration of the total synaptic input is consistent with
other studies [94,95]. Assuming that an MC receives inhibitory
inputs from 1,000 synapses during every gamma cycle (period of
,16 ms) and assuming an exponential time decay of 5 ms for
GABAa [53,60], it can be shown that, during the gamma
oscillation, the MC average inhibitory input conductance is given
by 1000*1nS*5 ms/16 ms = 312 nS. For the membrane area
mentioned above, this represents gI = 20 S/m2. gE was adapted
to reach a frequency up to 200 Hz, as observed in vivo. For
example, Fig. 11E shows a voltage trace of the MC model that is
forced by the oscillation and that receives tonic excitatory and
inhibitory conductances. The amplitude of the oscillatory
component gIo is discussed in the Results.
SimulationsFor a given input, MC activities were measured after at least one
second of simulation to avoid transient effects. Euler integration was
used with a time step of 0.02 ms. Simulations were performed using
Matlab 7.0 (The Mathworks, www.mathworks.com).
Author Contributions
Conceived and designed the experiments: FOD EH NB. Performed the
experiments: FOD TC NB. Analyzed the data: FOD EH TC NFT.
Contributed reagents/materials/analysis tools: FOD EH TC NFT. Wrote
the paper: FOD EH NFT NB.
References
1. Rinberg D, Koulakov A, Gelperin A (2006) Sparse odor coding in awake
behaving mice. J Neurosci 26: 8857–8865.
2. Hromadka T, Deweese MR, Zador AM (2008) Sparse representation of sounds
in the unanesthetized auditory cortex. PLoS Biol 6: e16.
3. Jacobs AL, Fridman G, Douglas RM, Alam NM, Latham PE, et al. (2009) Ruling
out and ruling in neural codes. Proc Natl Acad Sci U S A 106: 5936–5941.
4. Bi GQ, Poo MM (1998) Synaptic modifications in cultured hippocampal
neurons: dependence on spike timing, synaptic strength, and postsynaptic cell
type. J Neurosci 18: 10464–10472.
5. Cassenaer S, Laurent G (2007) Hebbian STDP in mushroom bodies facilitates
the synchronous flow of olfactory information in locusts. Nature 448: 709–713.
6. Rodriguez E, George N, Lachaux JP, Martinerie J, Renault B, et al. (1999)
Perception’s shadow: long-distance synchronization of human brain activity.Nature 397: 430–433.
7. Fries P, Reynolds JH, Rorie AE, Desimone R (2001) Modulation of oscillatoryneuronal synchronization by selective visual attention. Science 291: 1560–1563.
8. Buonviso N, Amat C, Litaudon P, Roux S, Royet JP, et al. (2003) Rhythmsequence through the olfactory bulb layers during the time window of a
respiratory cycle. Eur J Neurosci 17: 1811–1819.
9. Cenier T, Amat C, Litaudon P, Garcia S, Lafaye de Micheaux P, et al. (2008)
Odor vapor pressure and quality modulate local field potential oscillatorypatterns in the olfactory bulb of the anesthetized rat. Eur J Neurosci 27: 1432–
1440.
10. Kay LM (2003) Two species of gamma oscillations in the olfactory bulb:
dependence on behavioral state and synaptic interactions. J Integr Neurosci 2:31–44.
11. Ravel N, Chabaud P, Martin C, Gaveau V, Hugues E, et al. (2003) Olfactorylearning modifies the expression of odour-induced oscillatory responses in the
gamma (60–90 Hz) and beta (15–40 Hz) bands in the rat olfactory bulb.
Eur J Neurosci 17: 350–358.
12. Wehr M, Laurent G (1996) Odour encoding by temporal sequences of firing in
oscillating neural assemblies. Nature 384: 162–166.
13. Friedrich RW, Habermann CJ, Laurent G (2004) Multiplexing using synchrony
in the zebrafish olfactory bulb. Nat Neurosci 7: 862–871.
14. Martin C, Gervais R, Hugues E, Messaoudi B, Ravel N (2004) Learning
modulation of odor-induced oscillatory responses in the rat olfactory bulb: acorrelate of odor recognition? J Neurosci 24: 389–397.
15. Beshel J, Kopell N, Kay LM (2007) Olfactory bulb gamma oscillations areenhanced with task demands. J Neurosci 27: 8358–8365.
16. Eeckman FH, Freeman WJ (1990) Correlations between unit firing and EEG inthe rat olfactory system. Brain Res 528: 238–244.
17. Lagier S, Carleton A, Lledo PM (2004) Interplay between local GABAergicinterneurons and relay neurons generates gamma oscillations in the rat olfactory
bulb. J Neurosci 24: 4382–4392.
18. Kashiwadani H, Sasaki YF, Uchida N, Mori K (1999) Synchronized oscillatory
discharges of mitral/tufted cells with different molecular receptive ranges in therabbit olfactory bulb. J Neurophysiol 82: 1786–1792.
19. Kay LM, Beshel J, Brea J, Martin C, Rojas-Libano D, et al. (2009) Olfactoryoscillations: the what, how and what for. Trends Neurosci 32: 207–214.
20. Pikovsky A, Rosenblum M, Kurths J (2001) Synchronization: A Universal
Concept in Nonlinear Sciences. CambridgeMA: Cambridge University Press.
21. Izhikevich E (2007) Dynamical Systems in Neuroscience: the Geometry of
Excitability and Bursting; Cambridge, Mass: MIT Press TM, editor.
22. Chaput MA, Buonviso N, Berthommier F (1992) Temporal Patterns in
Spontaneous and Odour-evoked Mitral Cell Discharges Recorded in Anaes-
thetized Freely Breathing Animals. Eur J Neurosci 4: 813–822.
Mitral Cell Entrainment during Gamma Bursts
PLoS Computational Biology | www.ploscompbiol.org 17 October 2009 | Volume 5 | Issue 10 | e1000551

23. Lestienne R, Tuckwell HC, Chalansonnet M, Chaput M (1999) Repeatingtriplets of spikes and oscillations in the mitral cell discharges of freely breathing
rats. Eur J Neurosci 11: 3185–3193.
24. Buonviso N, Chaput MA, Berthommier F (1992) Temporal pattern analyses in
pairs of neighboring mitral cells. J Neurophysiol 68: 417–424.
25. Rhode WS, Greenberg S (1994) Encoding of amplitude modulation in the
cochlear nucleus of the cat. J Neurophysiol 71: 1797–1825.
26. Markowitz DA, Collman F, Brody CD, Hopfield JJ, Tank DW (2008) Rate-
specific synchrony: using noisy oscillations to detect equally active neurons. Proc
Natl Acad Sci U S A 105: 8422–8427.
27. Neville KR, Haberly LB (2003) Beta and gamma oscillations in the olfactorysystem of the urethane-anesthetized rat. J Neurophysiol 90: 3921–3930.
28. Martin C, Gervais R, Messaoudi B, Ravel N (2006) Learning-induced oscillatory
activities correlated to odour recognition: a network activity. Eur J Neurosci 23:1801–1810.
29. Wesson DW, Donahou TN, Johnson MO, Wachowiak M (2008) Sniffing
behavior of mice during performance in odor-guided tasks. Chem Senses 33:581–596.
30. Gire DH, Schoppa NE (2008) Long-term enhancement of synchronized
oscillations by adrenergic receptor activation in the olfactory bulb.J Neurophysiol 99: 2021–2025.
31. Cenier T, David F, Litaudon P, Garcia S, Amat C, et al. (2009) Respiration-
gated formation of gamma and beta neural assemblies in the mammalianolfactory bulb. Eur J Neurosci 29: 921–930.
32. Fourcaud-Trocme N, Galan RF, Urban NN. Ionic current basis of the typeII
dynamics in olfactory bulb mitral cells; Neurocomp, 2006 October; Pont-a-
Mousson.
33. Desmaisons D, Vincent JD, Lledo PM (1999) Control of action potential timing
by intrinsic subthreshold oscillations in olfactory bulb output neurons. J Neurosci
19: 10727–10737.
34. Balu R, Larimer P, Strowbridge BW (2004) Phasic stimuli evoke precisely timed
spikes in intermittently discharging mitral cells. J Neurophysiol 92: 743–753.
35. Bathellier B, Lagier S, Faure P, Lledo PM (2006) Circuit properties generatinggamma oscillations in a network model of the olfactory bulb. J Neurophysiol 95:
2678–2691.
36. Galan RF, Fourcaud-Trocme N, Ermentrout GB, Urban NN (2006)Correlation-induced synchronization of oscillations in olfactory bulb neurons.
J Neurosci 26: 3646–3655.
37. Rubin DB, Cleland TA (2006) Dynamical mechanisms of odor processing inolfactory bulb mitral cells. J Neurophysiol 96: 555–568.
38. Brown E, Moehlis J, Holmes P (2004) On the phase reduction and response
dynamics of neural oscillator populations. Neural Comput 16: 673–715.
39. Gutkin BS, Ermentrout GB, Reyes AD (2005) Phase-response curves give the
responses of neurons to transient inputs. J Neurophysiol 94: 1623–1635.
40. Schaus MJ, Moehlis J. On the Response of Neurons to Sinusoidal CurrentStimuli: Phase Response Curves and Phase-Locking; Proceedings of the IEEE
45th Conf. on Decision and Control. Dec. 13–15th 2006; San Diego, 2376–
2381.
41. Galan RF, Ermentrout GB, Urban NN (2005) Efficient estimation of phase-
resetting curves in real neurons and its significance for neural-network modeling.
Phys Rev Lett 94: 158101.
42. Kozlov AS, Angulo MC, Audinat E, Charpak S (2006) Target cell-specific
modulation of neuronal activity by astrocytes. Proc Natl Acad Sci U S A 103:
10058–10063.
43. Isaacson JS (1999) Glutamate spillover mediates excitatory transmission in therat olfactory bulb. Neuron 23: 377–384.
44. Salin PA, Lledo PM, Vincent JD, Charpak S (2001) Dendritic glutamate
autoreceptors modulate signal processing in rat mitral cells. J Neurophysiol 85:1275–1282.
45. Parra L, Bikson M (2004) Model of the effect of extracellular fields on spike time
coherence. Conf Proc IEEE Eng Med Biol Soc 6: 4584–4587.
46. Radman T, Su Y, An JH, Parra LC, Bikson M (2007) Spike timing amplifies the
effect of electric fields on neurons: implications for endogenous field effects.
J Neurosci 27: 3030–3036.
47. Lledo PM, Lagier S (2006) Adjusting neurophysiological computations in the
adult olfactory bulb. Semin Cell Dev Biol 17: 443–453.
48. Shimokawa T, Pakdaman K, Sato S (1999) Mean discharge frequency locking inthe response of a noisy neuron model to subthreshold periodic stimulation. Phys
Rev E Stat Phys Plasmas Fluids Relat Interdiscip Topics 60: R33–36.
49. Brumberg JC, Gutkin BS (2007) Cortical pyramidal cells as non-linearoscillators: experiment and spike-generation theory. Brain Res 1171: 122–137.
50. Yokoi M, Mori K, Nakanishi S (1995) Refinement of odor molecule tuning by
dendrodendritic synaptic inhibition in the olfactory bulb. Proc Natl AcadSci U S A 92: 3371–3375.
51. Spors H, Wachowiak M, Cohen LB, Friedrich RW (2006) Temporal dynamics
and latency patterns of receptor neuron input to the olfactory bulb. J Neurosci
26: 1247–1259.
52. Chaput MA (2000) EOG responses in anesthetized freely breathing rats. Chem
Senses 25: 695–701.
53. Margrie TW, Schaefer AT (2003) Theta oscillation coupled spike latencies yield
computational vigour in a mammalian sensory system. J Physiol 546: 363–374.
54. Schoppa NE, Westbrook GL (2001) Glomerulus-specific synchronization of
mitral cells in the olfactory bulb. Neuron 31: 639–651.
55. Urban NN, Sakmann B (2002) Reciprocal intraglomerular excitation and intra-and interglomerular lateral inhibition between mouse olfactory bulb mitral cells.
J Physiol 542: 355–367.
56. Friedman D, Strowbridge BW (2003) Both electrical and chemical synapses
mediate fast network oscillations in the olfactory bulb. J Neurophysiol 89:2601–2610.
57. Christie JM, Bark C, Hormuzdi SG, Helbig I, Monyer H, et al. (2005)Connexin36 mediates spike synchrony in olfactory bulb glomeruli. Neuron 46:
761–772.
58. Egger V, Svoboda K, Mainen ZF (2003) Mechanisms of lateral inhibition in the
olfactory bulb: efficiency and modulation of spike-evoked calcium influx into
granule cells. J Neurosci 23: 7551–7558.
59. Egger V, Svoboda K, Mainen ZF (2005) Dendrodendritic synaptic signals inolfactory bulb granule cells: local spine boost and global low-threshold spike.
J Neurosci 25: 3521–3530.
60. Schoppa NE (2006) Synchronization of olfactory bulb mitral cells by precisely
timed inhibitory inputs. Neuron 49: 271–283.
61. Schoppa NE (2006) AMPA/kainate receptors drive rapid output and precise
synchrony in olfactory bulb granule cells. J Neurosci 26: 12996–13006.
62. Zelles T, Boyd JD, Hardy AB, Delaney KR (2006) Branch-specific Ca2+ influx
from Na+-dependent dendritic spikes in olfactory granule cells. J Neurosci 26:
30–40.
63. Kapoor V, Urban NN (2006) Glomerulus-specific, long-latency activity in the
olfactory bulb granule cell network. J Neurosci 26: 11709–11719.
64. Schoppa NE, Kinzie JM, Sahara Y, Segerson TP, Westbrook GL (1998)
Dendrodendritic inhibition in the olfactory bulb is driven by NMDA receptors.J Neurosci 18: 6790–6802.
65. Isaacson JS, Strowbridge BW (1998) Olfactory reciprocal synapses: dendriticsignaling in the CNS. Neuron 20: 749–761.
66. Schoppa NE, Westbrook GL (1999) Regulation of synaptic timing in theolfactory bulb by an A-type potassium current. Nat Neurosci 2: 1106–1113.
67. Wang XJ, Buzsaki G (1996) Gamma oscillation by synaptic inhibition in ahippocampal interneuronal network model. J Neurosci 16: 6402–6413.
68. Brunel N, Hakim V (1999) Fast global oscillations in networks of integrate-and-
fire neurons with low firing rates. Neural Comput 11: 1621–1671.
69. Brunel N, Wang XJ (2003) What determines the frequency of fast network
oscillations with irregular neural discharges? I. Synaptic dynamics and
excitation-inhibition balance. J Neurophysiol 90: 415–430.
70. Brunel N (2000) Dynamics of sparsely connected networks of excitatory and
inhibitory spiking neurons. J Comput Neurosci 8: 183–208.
71. Borgers C, Kopell N (2003) Synchronization in networks of excitatory and
inhibitory neurons with sparse, random connectivity. Neural Comput 15: 509–538.
72. Kuramoto Y (1975) Self-entrainment of a population of coupled non-linearoscillators. . In: (Springer B, ed; Berlin. Ed. H. Araki. pp 420–422.
73. Zou Z, Li F, Buck LB (2005) Odor maps in the olfactory cortex. Proc Natl AcadSci U S A 102: 7724–7729.
74. Bruno RM, Sakmann B (2006) Cortex is driven by weak but synchronouslyactive thalamocortical synapses. Science 312: 1622–1627.
75. Tiesinga PH, Jose JV (2000) Robust gamma oscillations in networks of inhibitoryhippocampal interneurons. Network 11: 1–23.
76. Zou Z, Buck LB (2006) Combinatorial effects of odorant mixes in olfactory
cortex. Science 311: 1477–1481.
77. Franks KM, Isaacson JS (2006) Strong single-fiber sensory inputs to olfactory
cortex: implications for olfactory coding. Neuron 49: 357–363.
78. Perez-Orive J, Mazor O, Turner GC, Cassenaer S, Wilson RI, et al. (2002)
Oscillations and sparsening of odor representations in the mushroom body.
Science 297: 359–365.
79. Perez-Orive J, Bazhenov M, Laurent G (2004) Intrinsic and circuit properties
favor coincidence detection for decoding oscillatory input. J Neurosci 24: 6037–6047.
80. Roux SG, Garcia S, Bertrand B, Cenier T, Vigouroux M, et al. (2006)Respiratory cycle as time basis: an improved method for averaging olfactory
neural events. J Neurosci Methods 152: 173–178.
81. Roux SG, Cenier T, Garcia S, Litaudon P, Buonviso N (2007) A wavelet-based
method for local phase extraction from a multi-frequency oscillatory signal.J Neurosci Methods 160: 135–143.
82. Kronland-Martinet R, Morlet J, Grossmann A (1987) Analysis of sound patternsthrough wavelet transforms. International Journal of Pattern Recognition and
Artificial Intelligence 11(2): 97–126.
83. Fisher NI (1993) Statistical Analysis of Circular Data. Cambridge, editor. New
York: Cambridge University Press.
84. Dayan P, Abbott LF (2001) Theoretical Neurocience. CambridgeMA: MIT
Press.
85. Wang XJ (1993) Ionic basis for intrinsic 40 Hz neuronal oscillations.
Neuroreport 5: 221–224.
86. Wang XY, McKenzie JS, Kemm RE (1996) Whole-cell K+ currents in identified
olfactory bulb output neurones of rats. J Physiol 490(Pt 1): 63–77.
87. Bhalla US, Bower JM (1993) Exploring parameter space in detailed single
neuron models: simulations of the mitral and granule cells of the olfactory bulb.J Neurophysiol 69: 1948–1965.
88. Cang J, Isaacson JS (2003) In vivo whole-cell recording of odor-evoked synaptictransmission in the rat olfactory bulb. J Neurosci 23: 4108–4116.
Mitral Cell Entrainment during Gamma Bursts
PLoS Computational Biology | www.ploscompbiol.org 18 October 2009 | Volume 5 | Issue 10 | e1000551

89. Davison AP, Feng J, Brown D (2000) A reduced compartmental model of the
mitral cell for use in network models of the olfactory bulb. Brain Res Bull 51:
393–399.
90. Migliore M, Hines ML, Shepherd GM (2005) The role of distal dendritic gap
junctions in synchronization of mitral cell axonal output. J Comput Neurosci 18:
151–161.
91. Lowe G (2002) Inhibition of backpropagating action potentials in mitral cell
secondary dendrites. J Neurophysiol 88: 64–85.
92. Isaacson JS (2001) Mechanisms governing dendritic gamma-aminobutyric acid
(GABA) release in the rat olfactory bulb. Proc Natl Acad Sci U S A 98: 337–342.93. Davison AP, Feng J, Brown D (2003) Dendrodendritic inhibition and simulated
odor responses in a detailed olfactory bulb network model. J Neurophysiol 90:
1921–1935.94. Xiong W, Chen WR (2002) Dynamic gating of spike propagation in the mitral
cell lateral dendrites. Neuron 34: 115–126.95. Migliore M, Shepherd GM (2008) Dendritic action potentials connect
distributed dendrodendritic microcircuits. J Comput Neurosci 24: 207–221.
Mitral Cell Entrainment during Gamma Bursts
PLoS Computational Biology | www.ploscompbiol.org 19 October 2009 | Volume 5 | Issue 10 | e1000551