species distribution of spiders in barpeta district of assam: a diversity measure
TRANSCRIPT
E-International Scientific Research Journal, VOLUME – IV, ISSUE- 1, 2012, ISSN 2094-1749
47
SPECIES DISTRIBUTION OF SPIDERS IN BARPETA
DISTRICT OF ASSAM: A DIVERSITY MEASURE.
Suruchi Singh 1, A. Borkotoki
2 and C. K. Sarmah
3
1. Assistant Professor, Dept. of Zoology, B.H. College, Howly, Barpeta, Assam.
2. Retd. Professor, Dept of Zoology, Gauhati University, Assam.
3. Assistant Professor, Dept. of Statistics, B. H. College, Howly, Barpeta, Assam.
Author for Correspondence: [email protected]
ABSTRACT:
The study of spider fauna of state Assam has not been comprehensively carried out. Our present
work has been an attempt to provide relevant information regarding spiders, which would be the
baseline documentation for the future studies in the state Assam or for Northeastern part of the
nation. The study area, Barpeta district of the state Assam, lies between Latitudes 2605’ N to
26049’ N and Longitudes 90
039’E to 91
017’E covering an area of 3245 sq Km. A survey was
carried out during June 2008 to May 2011 in different ecosystem of this area to assess the spider
diversity. Many specimens were collected by visual search methods and preserved in 70% ethyl
alcohol .The specimens were identified in Zoological Survey of India, Kolkata. This paper has
been started with the spider distribution in the district and concluded with the alpha, beta and
gamma diversity estimation. It is documented that 69 spider species from different habitats of the
different blocks of Barpeta District.
Keywords: Barpeta, spider distribution, diversity estimation, web.
INTRODUCTION:
Northeastern region of India is one of the richest hotspots of the world, has remained poorly
explored, and much of its diversity is being lost without any record. Spiders, of class Arachnida,
order Araneae under Phylum Arthropoda, vary considerably in size, shape and behavior. The
basic characteristics shared by them are- body divided into cephalothorax and the abdomen,
presence of eight legs (made up of seven segments each) and pedipalps, capacity to produce silk
and possess no antenna. They are identified for their webs and web silk with future prospects. All
spiders can make silk but many don’t spin web, they may use the silk to wrap the prey, to hang
from and to make egg sacs and nests. They are ubiquitous in terrestrial ecosystems and abundant
in both natural and agricultural habitats (Turnbull, 1973; Nyfeller & Benz, 1987). They play a
significant role in the regulation of insect and other invertebrate populations in most ecosystems
(Wise, 1993; Russell-Smith, 1999; Raghavendra, 2001).Spider surveys may provide an effective
means for measuring the impact of habitat degradation or land use change on biodiversity.
Baseline studies involving spiders as biological indicators have been conducted elsewhere; e.g.
Allred (1969) and Allred & Gertsch (1976) documented spider diversity in Arizona and Utah
after new power plant installations and in Nevada at the Nevada Nuclear Test Site. In spite of
E-International Scientific Research Journal, VOLUME – IV, ISSUE- 1, 2012, ISSN 2094-1749
48
several applied values, spiders have received cursory attention. In conservation efforts, often
“charismatic” species like birds and mammals draw most attention and ecological significant
groups like spiders are often neglected. Ironically, the spider diversity in Assam is still not fully
explored or understood. Manoranjan Barman (Barman, 1975, 1979) has done a work on spider of
Khasi and Jantia hills of Meghalaya, N.E. region in seventies of last century. B.K.Tikader
(Tikader,1970) and B.K.Biswas (Biswas,2000a,b,2003,2004,2006,2007) also collected some
information on diversity of spiders of Northeastern states like Tripura, Meghalaya, Sikkim ,
Manipur, Arunachal Pradesh and Mizoram except Assam. As spiders species of Assam are
poorly documented & no research has been done so far for the applied use of spider & its related
product in this region. The proposed study was carried out with the objectives to document the
spider diversity of Barpeta District of Assam.
Objective:
The present study has been carried out with the objective of documentation of the spider fauna of
Barpeta District of the state Assam through quantification of spider density and diversity
estimation.
Study Time:
The study was carried out during the year June 2008 to May 2010. The year was divided into
four seasons - June to September, October to November, December to February and March to
May. Most collection were made between the hours of 9 A.M. to 6 P.M. Sampling occurred
under suitable weather conditions for spider collection, temperatures between 15–38 °C.
Sampling:
Visual search sampling methods used by Sebastian et al. (2005) was adopted in this study to
sample the spider fauna from selected study sites. Random sampling was done from the same
selected study sites in all the seasons. A total of 36 hours was spent in each site across the four
seasons. We have taken all 10 political blocks of the district and in each block’s 3 plots were
selected. As a whole, we have divided whole district in 30 different plots. Each plot is again
divided into 4 different types of habitat i.e. Grassland cum bushy, Marshy, Residential and
agricultural area.
COLLECTION METHODS:
The following collection methods carried out according to Coddington et al. (1991); Toti et al.
(2000) -
1) Aerial hand collection i.e. collecting spiders found above knee level for that a sweep net was
used to capture spiders seen high in the vegetation.
2) Ground hand collection i.e. collecting spiders found below knee level in the vegetation or leaf
litter.
E-International Scientific Research Journal, VOLUME – IV, ISSUE- 1, 2012, ISSN 2094-1749
49
3) The beat-sheet method of collection performed by stretching out a light-colored cloth under
the tree branch or other low vegetation and grabbing the branch and shaking it vigorously.
Spiders resting or nesting in this vegetation fall onto the cloth.
Preservation technique:
The spiders collected from each site was preserved together in 70% ethyl alcohol with proper
labeling of locality, date of collection and other notes of importance.
Identification:
The preserved specimens were observed under a stereo-zoom microscope for some of its minute
characteristics. The spiders were identified to the species level except the immature ones, which
could be identified only to the generic level. All specimens were identified in Zoological Survey
of India, Kolkata and with the help of available literature like Handbook of spiders’ by
B.K.Tikadar(1987) and ‘Spiders of India’ by P.A.Sebastian and K.V.Peter(2009).
RESULTS AND DISCUSSION:
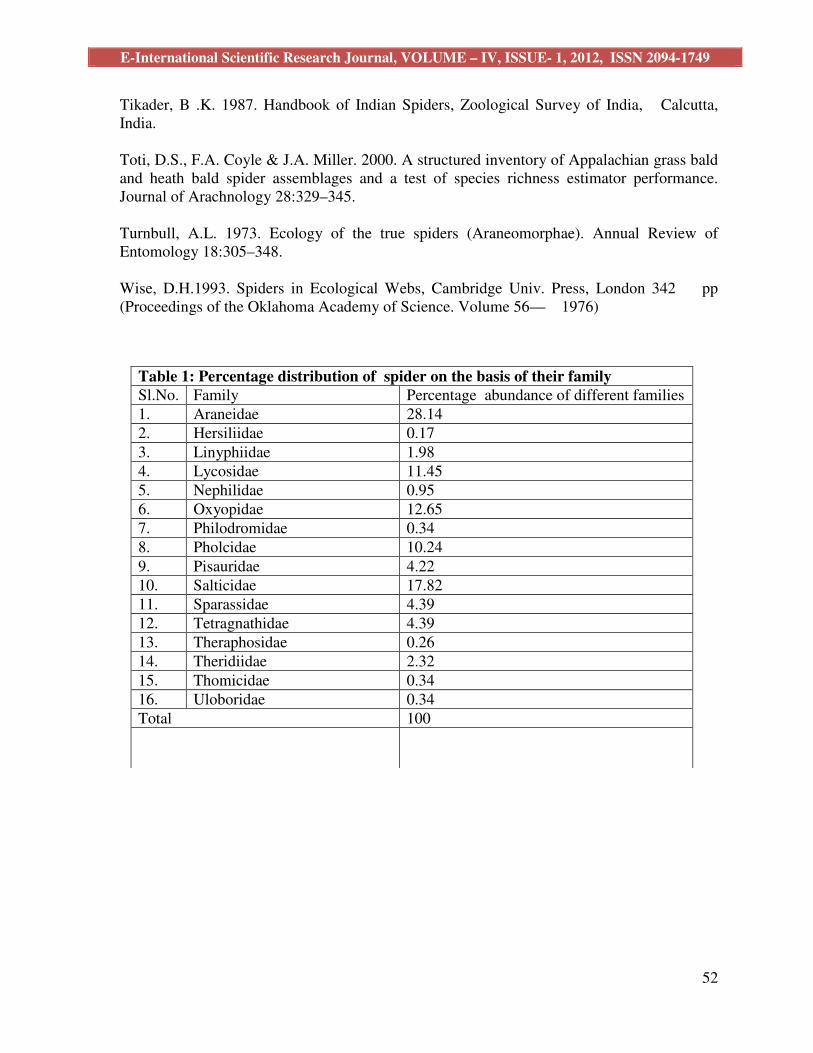
The percentage distribution of spider family in the Table 1 tells us that the Araneidae spider
family is found significantly in Barpeta district contributing 28.14% of the total spider family
found in the district, whereas the spider family Hersilidae being almost rare in the district. From
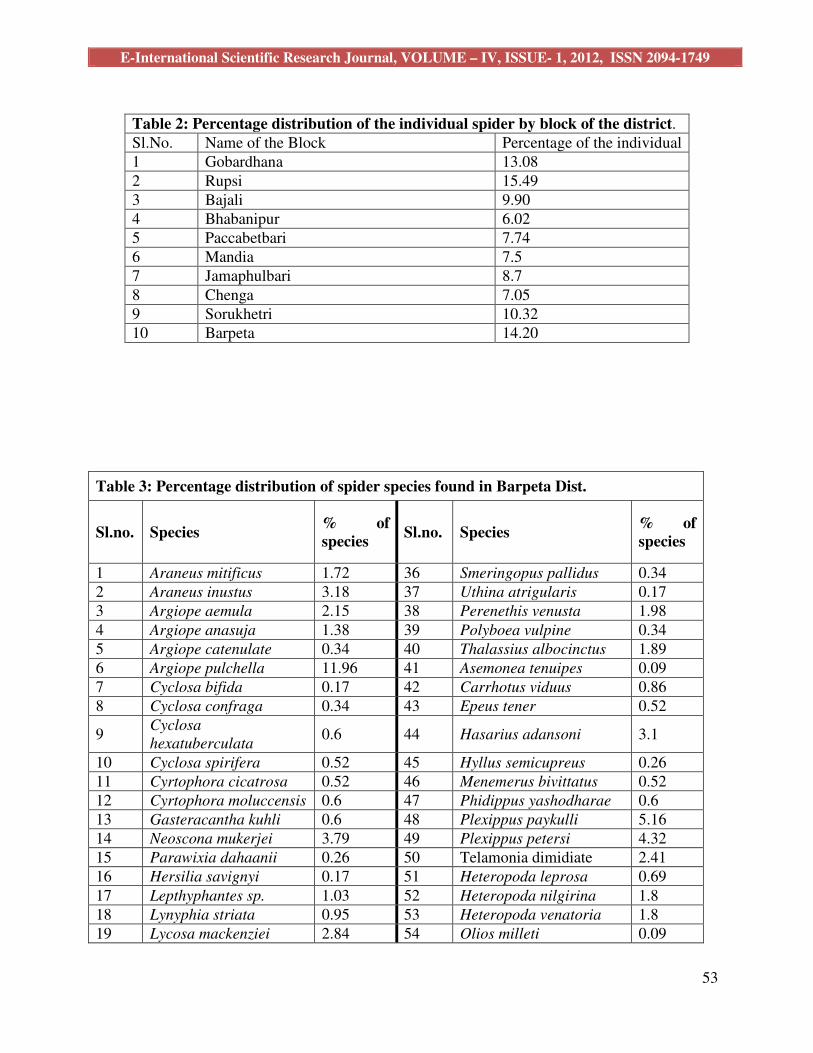
the Table 2 we observed that Barpeta Block of the district consist of large number of individuals
of spider i.e.14.20% and Bhabanipur showing only 6.02% of individual 0f observed spider.
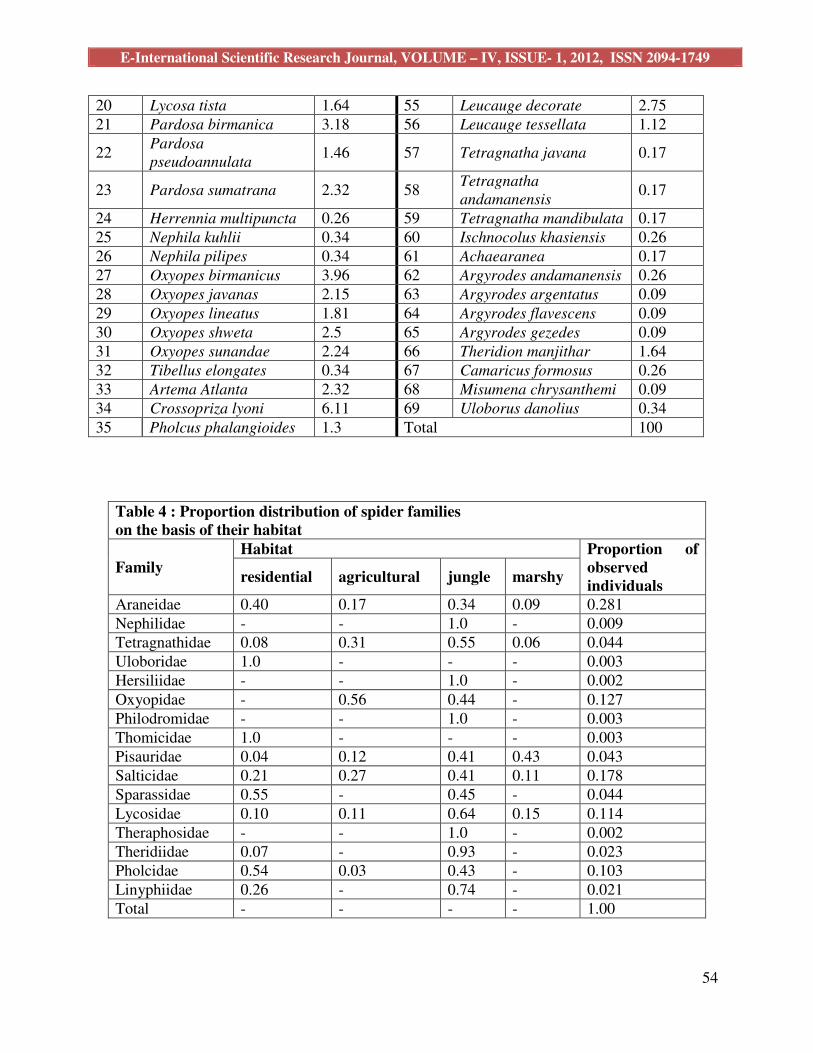
From the Table 3 of percentage distribution of spider species found in Barpeta district, we have
observed that Argiope pulchella, the spider species are significantly available covering 11.96%
of the total spider population in the entire district. On the other hand the spider species like
Asemonea tenuipes, Olios milleti, Argyrodes argentatus, Argyrodes gezedes and Misumena
chrysanthemi are found to be almost rare in the district just covering 0.09% contribution to the
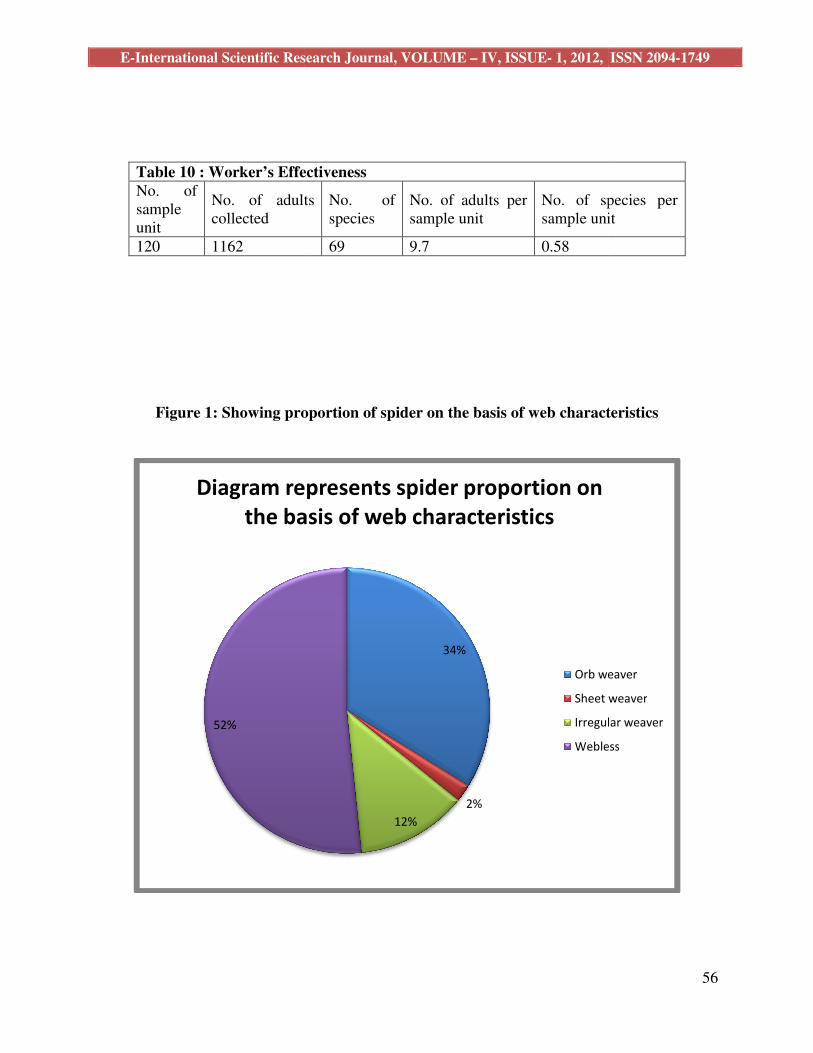
spider families. The Pie diagram (refer to Figure 1) given below shows that more than half of the
total species observed in the Barpeta district are web less spider. Almost one/3rd
of the observed
spiders is Orb weaver.
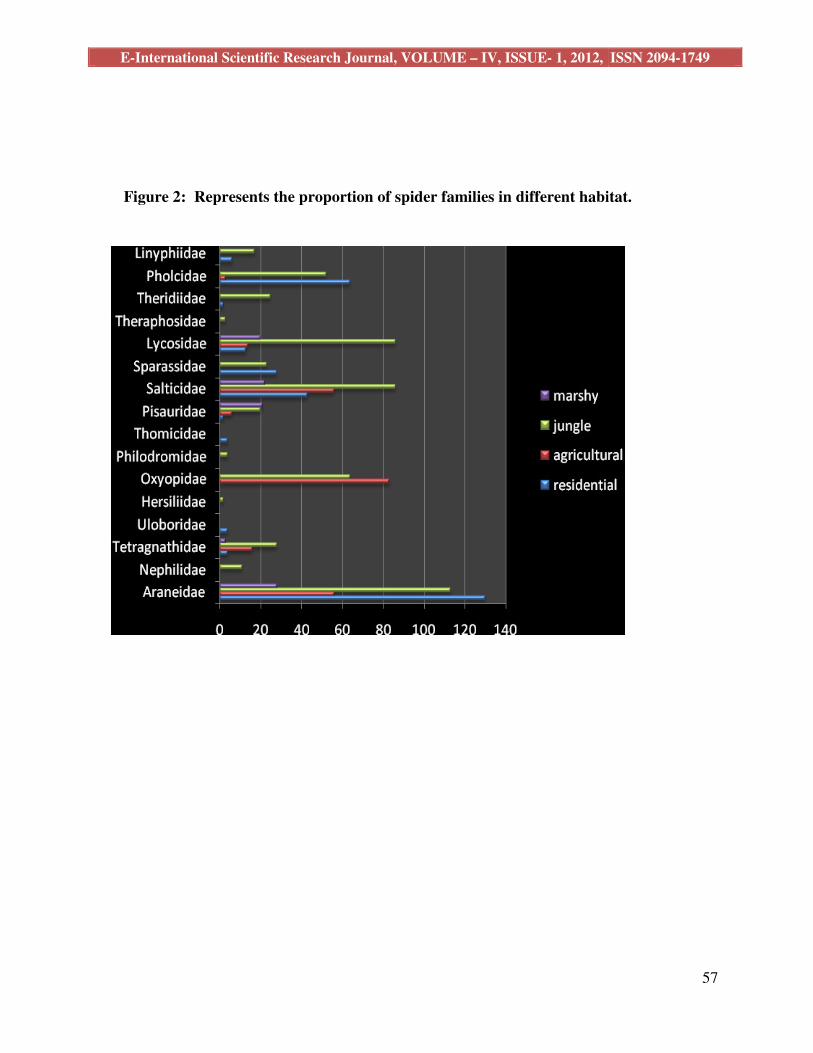
Table 4 reveals that spider of Araneidae family are found in large number as residential habitat.
Whereas the families Tetragnathidae, Lycosidae etc are found widely as wild spider in the
district Barpeta. More over a few numbers of marshy spiders are also found in the district. From
the Figure 2 (bar diagram) shown below we have observed that wild spiders are found in large
scale than domestic spiders and a few no. of marshy spiders are found in the district.
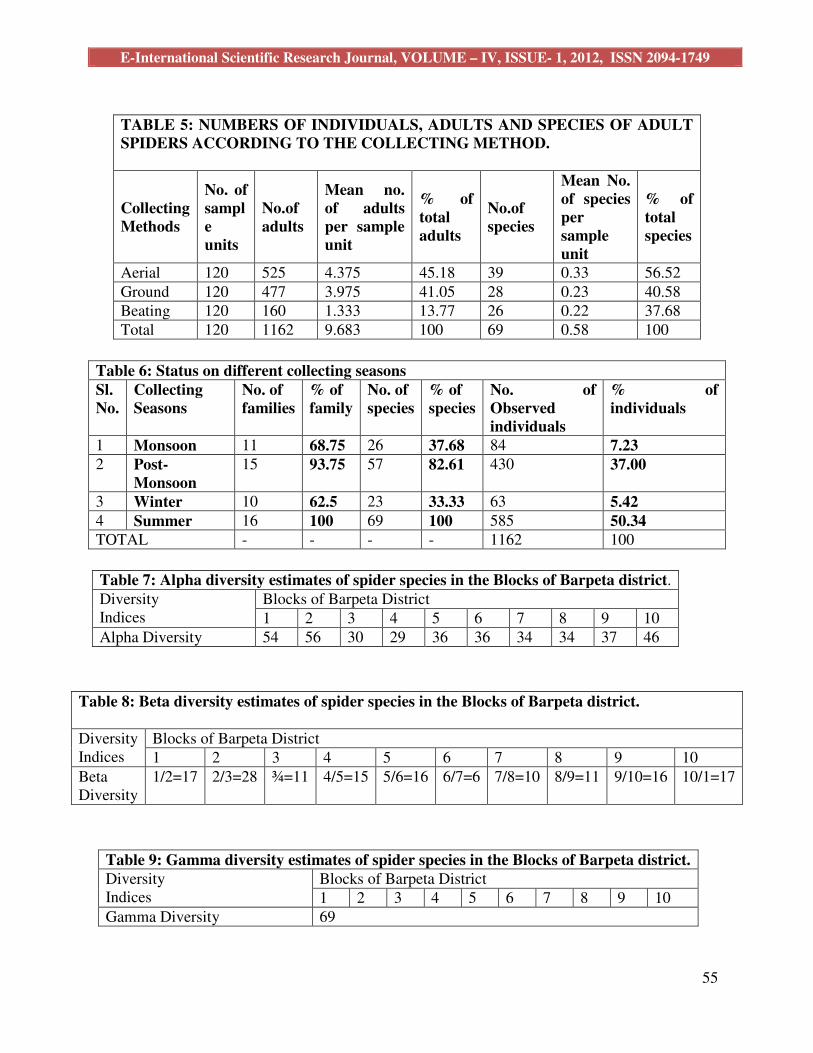
From the table 5 we have found that Aerial collecting method of spider is more significant than
all other trapping techniques. By Aerial method, we have collected more than half of the sample
spiders in our study.
E-International Scientific Research Journal, VOLUME – IV, ISSUE- 1, 2012, ISSN 2094-1749
50
From the table 6, we found that maximum families and species were abundant during the
summer season and least during monsoon and winter. Thus, clarifies that they are more active
during summer.
Alpha diversity usually expressed as species diversity or number of species (diversity) of a
particular area or ecosystem. The table 7 shows that Block 2 (Rupsi) is rich in spider species with
alpha diversity as 56 whereas the Block 3(Bajali) and Block 4 (Bhabanipur) consist of least
spider species with alpha diversity calculated as30 and 29 respectively. Beta diversity is the total
number of species unique to each area or ecosystem, when compared with between them. The
table 8 shows that the beta diversity is more when comparison is done between Block 2/3
(Rupsi/bajali) i.e. 28 and least in Block 6/7(Mandia and Jamaphulbari) with 6. Table 9 below
shows that Gamma diversity is the measure of overall diversity of the region i.e. the total number
of spider species in the Barpeta District of Assam is 69.
Table 10 shows that the number of species found per sample unit are 0.58, which shows workers
effectiveness.
CONCLUSION:
From the results and data, a preliminary status of spiders in Barpeta district of Assam is much
clear. The study documented 69 species of spiders and highest of Araneidae family with Argiope
pulchella as the dominant species. The largest individuals collected were in summer season. The
spider weaving orb webs are in majority among web weavers. Rupsi block recorded highest
number of species. There is an urgent need for updating the database. Exploration of species
diversity understanding the habitat ecology, behaviour, etc. culminating into a database for the
Assam is an imperative.
Acknowledgement:
Our sincere thanks to the Director, Zoological Survey of India, Kolkata for granting permission
to do the taxonomic works with Dr. A. K. Sanyal, S. Talukdar and Dr. B. K. Biswas, utilizing the
facilities there.
REFERENCES:
Allred, D.M. 1969. Spiders of the National Reactor Testing Station. Great Basin Naturalist
29:105-108.
Allred, D.M. and W.J. Gertsch. 1976. Spiders and Scorpions from northern Arizona and
northern Utah.Journal of Arachnology 3: 87-99.
Barman, M. (1975).Studies on Spider fauna of Khasi and Jantia Hills.(Aranea:Arachnida),
PhD Thesis, Department of Zoology, Gauhati University.
E-International Scientific Research Journal, VOLUME – IV, ISSUE- 1, 2012, ISSN 2094-1749
51
Barman, M. (1979). Studies on some spiders of the genera Tegenaria and Agelena from
Khasi and Jaintia hills,India (Araneae: Agelenidae).Journal of the Bombay Natural History
Society. 75:454-457.
Biswas, B. & S.C.Majumder 2000a. Arachnida: Araneae. Fauna of Tripura (Part-2), State
Fauna Series7, Zoological Survey of India. 113-122.
Biswas, B. & S.C.Majumder 2000b. Araneae: Spider. Fauna of Meghalaya, (Part-2), State
Fauna Series 4, Zoological Survey of India. 93-128.
Biswas, B. & K. Biswas 2003. Araneae: Spiders. Fauna of Sikkim (Part-2), State Fauna
Series 9, Zoological Survey of India. 67-100.
Biswas, B. & K. Biswas 2004. Araneae: Spiders. Fauna of Manipur, State Fauna Series 10,
Zoological Survey of India. 25-46.
Biswas, B. & K. Biswas 2006. Araneae: Spiders. Fauna of Arunachal Pradesh, State Fauna
Series 13(Part-2), Zoological Survey of India. 491-518.
Biswas, B. & K. Biswas 2007. Araneae: Spiders. Fauna of Mizoram, State Fauna Series 14,
Zoological Survey of India. 455-475.
Coddington, J.A., C.E. Griswold, D. Silva, D. Penaranda & S. Larcher. 1991. Designing and
testing sampling protocols to estimate biodiversity in tropical ecosystems. Pp. 44–60. In The
unity of evolutionary biology: Proceedings of the Fourth International Congress of
Systematic and Evolutionary Biology. (E.C. Dudley, ed.). Dioscorides Press, Portland,
Oregon.
Nyffeler, M. & G. Benz. 1987. Spiders in natural pest control: a review. Journal of Applied
Entomology 103:321–329.
Raghavendra, N. 2001. ‘Diversity of arboreal spiders in cashew orchards’ M.Sc.
dissertation, Department of Applied Zoology, Mangalore University.
Russell-Smith, A. 1999. The spiders of Mkomazi Game reserve. In: Coe, M. et al. (eds).
Mkomazi: The ecology, biodiversity and conservation of a Tanzanian savanna. Royal
Geographical Society, London.
Sebastian, P.A., M.J. Mathew and S. Pathummal Beevi. 2005. The spider fauna of the
irrigated rice ecosystem in central Kerala, India across different elevational ranges. The
Journal of Arachnology 33:247–255.
Sebastian P.A. and Peter K.V.(2009). Spiders of India, Universities press, India.
Tikader, B.K. (1970). Spider fauna of Sikkim. Records of the Zoological Survey of India.
64:1-83
E-International Scientific Research Journal, VOLUME – IV, ISSUE- 1, 2012, ISSN 2094-1749
52
Tikader, B .K. 1987. Handbook of Indian Spiders, Zoological Survey of India, Calcutta,
India.
Toti, D.S., F.A. Coyle & J.A. Miller. 2000. A structured inventory of Appalachian grass bald
and heath bald spider assemblages and a test of species richness estimator performance.
Journal of Arachnology 28:329–345.
Turnbull, A.L. 1973. Ecology of the true spiders (Araneomorphae). Annual Review of
Entomology 18:305–348.
Wise, D.H.1993. Spiders in Ecological Webs, Cambridge Univ. Press, London 342 pp
(Proceedings of the Oklahoma Academy of Science. Volume 56— 1976)
Table 1: Percentage distribution of spider on the basis of their family
Sl.No. Family Percentage abundance of different families
1. Araneidae 28.14
2. Hersiliidae 0.17
3. Linyphiidae 1.98
4. Lycosidae 11.45
5. Nephilidae 0.95
6. Oxyopidae 12.65
7. Philodromidae 0.34
8. Pholcidae 10.24
9. Pisauridae 4.22
10. Salticidae 17.82
11. Sparassidae 4.39
12. Tetragnathidae 4.39
13. Theraphosidae 0.26
14. Theridiidae 2.32
15. Thomicidae 0.34
16. Uloboridae 0.34
Total 100
E-International Scientific Research Journal, VOLUME – IV, ISSUE- 1, 2012, ISSN 2094-1749
53
Table 2: Percentage distribution of the individual spider by block of the district.
Sl.No. Name of the Block Percentage of the individual
1 Gobardhana 13.08
2 Rupsi 15.49
3 Bajali 9.90
4 Bhabanipur 6.02
5 Paccabetbari 7.74
6 Mandia 7.5
7 Jamaphulbari 8.7
8 Chenga 7.05
9 Sorukhetri 10.32
10 Barpeta 14.20
Table 3: Percentage distribution of spider species found in Barpeta Dist.
Sl.no. Species % of
species Sl.no. Species
% of
species
1 Araneus mitificus 1.72 36 Smeringopus pallidus 0.34
2 Araneus inustus 3.18 37 Uthina atrigularis 0.17
3 Argiope aemula 2.15 38 Perenethis venusta 1.98
4 Argiope anasuja 1.38 39 Polyboea vulpine 0.34
5 Argiope catenulate 0.34 40 Thalassius albocinctus 1.89
6 Argiope pulchella 11.96 41 Asemonea tenuipes 0.09
7 Cyclosa bifida 0.17 42 Carrhotus viduus 0.86
8 Cyclosa confraga 0.34 43 Epeus tener 0.52
9 Cyclosa
hexatuberculata 0.6 44 Hasarius adansoni 3.1
10 Cyclosa spirifera 0.52 45 Hyllus semicupreus 0.26
11 Cyrtophora cicatrosa 0.52 46 Menemerus bivittatus 0.52
12 Cyrtophora moluccensis 0.6 47 Phidippus yashodharae 0.6
13 Gasteracantha kuhli 0.6 48 Plexippus paykulli 5.16
14 Neoscona mukerjei 3.79 49 Plexippus petersi 4.32
15 Parawixia dahaanii 0.26 50 Telamonia dimidiate 2.41
16 Hersilia savignyi 0.17 51 Heteropoda leprosa 0.69
17 Lepthyphantes sp. 1.03 52 Heteropoda nilgirina 1.8
18 Lynyphia striata 0.95 53 Heteropoda venatoria 1.8
19 Lycosa mackenziei 2.84 54 Olios milleti 0.09
E-International Scientific Research Journal, VOLUME – IV, ISSUE- 1, 2012, ISSN 2094-1749
54
20 Lycosa tista 1.64 55 Leucauge decorate 2.75
21 Pardosa birmanica 3.18 56 Leucauge tessellata 1.12
22 Pardosa
pseudoannulata 1.46 57 Tetragnatha javana 0.17
23 Pardosa sumatrana 2.32 58 Tetragnatha
andamanensis 0.17
24 Herrennia multipuncta 0.26 59 Tetragnatha mandibulata 0.17
25 Nephila kuhlii 0.34 60 Ischnocolus khasiensis 0.26
26 Nephila pilipes 0.34 61 Achaearanea 0.17
27 Oxyopes birmanicus 3.96 62 Argyrodes andamanensis 0.26
28 Oxyopes javanas 2.15 63 Argyrodes argentatus 0.09
29 Oxyopes lineatus 1.81 64 Argyrodes flavescens 0.09
30 Oxyopes shweta 2.5 65 Argyrodes gezedes 0.09
31 Oxyopes sunandae 2.24 66 Theridion manjithar 1.64
32 Tibellus elongates 0.34 67 Camaricus formosus 0.26
33 Artema Atlanta 2.32 68 Misumena chrysanthemi 0.09
34 Crossopriza lyoni 6.11 69 Uloborus danolius 0.34
35 Pholcus phalangioides 1.3 Total 100
Table 4 : Proportion distribution of spider families
on the basis of their habitat
Family
Habitat Proportion of
observed
individuals residential agricultural jungle marshy
Araneidae 0.40 0.17 0.34 0.09 0.281
Nephilidae - - 1.0 - 0.009
Tetragnathidae 0.08 0.31 0.55 0.06 0.044
Uloboridae 1.0 - - - 0.003
Hersiliidae - - 1.0 - 0.002
Oxyopidae - 0.56 0.44 - 0.127
Philodromidae - - 1.0 - 0.003
Thomicidae 1.0 - - - 0.003
Pisauridae 0.04 0.12 0.41 0.43 0.043
Salticidae 0.21 0.27 0.41 0.11 0.178
Sparassidae 0.55 - 0.45 - 0.044
Lycosidae 0.10 0.11 0.64 0.15 0.114
Theraphosidae - - 1.0 - 0.002
Theridiidae 0.07 - 0.93 - 0.023
Pholcidae 0.54 0.03 0.43 - 0.103
Linyphiidae 0.26 - 0.74 - 0.021
Total - - - - 1.00
E-International Scientific Research Journal, VOLUME – IV, ISSUE- 1, 2012, ISSN 2094-1749
55
TABLE 5: NUMBERS OF INDIVIDUALS, ADULTS AND SPECIES OF ADULT
SPIDERS ACCORDING TO THE COLLECTING METHOD.
Collecting
Methods
No. of
sampl
e
units
No.of
adults
Mean no.
of adults
per sample
unit
% of
total
adults
No.of
species
Mean No.
of species
per
sample
unit
% of
total
species
Aerial 120 525 4.375 45.18 39 0.33 56.52
Ground 120 477 3.975 41.05 28 0.23 40.58
Beating 120 160 1.333 13.77 26 0.22 37.68
Total 120 1162 9.683 100 69 0.58 100
Table 6: Status on different collecting seasons
Sl.
No.
Collecting
Seasons
No. of
families
% of
family
No. of
species
% of
species
No. of
Observed
individuals
% of
individuals
1 Monsoon 11 68.75 26 37.68 84 7.23
2 Post-
Monsoon
15 93.75 57 82.61 430 37.00
3 Winter 10 62.5 23 33.33 63 5.42
4 Summer 16 100 69 100 585 50.34
TOTAL - - - - 1162 100
Table 8: Beta diversity estimates of spider species in the Blocks of Barpeta district.
Diversity
Indices
Blocks of Barpeta District
1 2 3 4 5 6 7 8 9 10
Beta
Diversity
1/2=17 2/3=28 ¾=11 4/5=15 5/6=16 6/7=6 7/8=10 8/9=11 9/10=16 10/1=17
Table 9: Gamma diversity estimates of spider species in the Blocks of Barpeta district.
Diversity
Indices
Blocks of Barpeta District
1 2 3 4 5 6 7 8 9 10
Gamma Diversity 69
Table 7: Alpha diversity estimates of spider species in the Blocks of Barpeta district.
Diversity
Indices
Blocks of Barpeta District
1 2 3 4 5 6 7 8 9 10
Alpha Diversity 54 56 30 29 36 36 34 34 37 46
E-International Scientific Research Journal, VOLUME
Figure 1: Showing proportion of spider on the basis of web characteristics
52%
Diagram represents spider proportion on
the basis of web characteristics
Table 10 : Worker’s Effectiveness
No. of
sample
unit
No. of adults
collected
120 1162
Scientific Research Journal, VOLUME – IV, ISSUE- 1, 2012, ISSN 2094
proportion of spider on the basis of web characteristics
34%
2%
12%
Diagram represents spider proportion on
the basis of web characteristics
Orb weaver
Sheet weaver
Irregular weaver
Webless
Table 10 : Worker’s Effectiveness
No. of adults No. of
species
No. of adults per
sample unit
No. of species per
sample unit
69 9.7 0.58
1, 2012, ISSN 2094-1749
56
proportion of spider on the basis of web characteristics
Orb weaver
Sheet weaver
Irregular weaver
Webless
No. of species per
sample unit
E-International Scientific Research Journal, VOLUME
Figure 2: Represents the proportion of spider families in different habitat.
Scientific Research Journal, VOLUME – IV, ISSUE- 1, 2012, ISSN 2094
Figure 2: Represents the proportion of spider families in different habitat.
1, 2012, ISSN 2094-1749
57
Figure 2: Represents the proportion of spider families in different habitat.