speciation and localization of arsenic in white and brown rice grains
TRANSCRIPT
Speciation and Localization ofArsenic in White and Brown RiceGrainsA N D R E W A . M E H A R G , * , † E N Z O L O M B I , ‡
P A U L N . W I L L I A M S , †
K I R K G . S C H E C K E L , § J O E R G F E L D M A N N , 4
A N D R E A R A A B , 4 Y O N G G U A N Z H U , ⊥ A N DR A F I Q L I S L A M #
School of Biological Sciences, University of Aberdeen,Cruickshank Boulevard, St Machar Drive,Aberdeen, AB24 3UU, U.K., Plant and Soil Science Laboratory,Department of Agricultural Science, Faculty of Life Science,University of Copenhagen, Thorvaldsensvej 40,1871 Frederiksberg C, Denmark, National Risk ManagementResearch Laboratory, U.S. Environmental Protection Agency,5995 Centre Hill Avenue, Cincinnati, Ohio 45224, School ofPhysical Sciences, University of Aberdeen, Meston Building,Meston Walk, Aberdeen, AB24 3UE, U.K., Research Centre forEco-environmental Sciences, Chinese Academy of Sciences,Beijing 100085, China, and Department of Soil Science,Bangladesh Agricultural University,Mymensingh 2202, Bangladesh
Received September 3, 2007. Revised manuscript receivedNovember 30, 2007. Accepted December 03, 2007.
Synchrotron-based X-ray fluorescence (S-XRF) was utilizedto locate arsenic (As) in polished (white) and unpolished (brown)rice grains from the United States, China, and Bangladesh.In white rice As was generally dispersed throughout the grain,the bulk of which constitutes the endosperm. In brown riceAs was found to be preferentially localized at the surface, in theregion corresponding to the pericarp and aleurone layer.Copper, iron, manganese, and zinc localization followed thatof arsenic in brown rice, while the location for cadmium andnickel was distinctly different, showing relatively even distributionthroughout the endosperm. The localization of As in theouter grain of brown rice was confirmed by laser ablationICP-MS. Arsenic speciation of all grains using spatially resolvedX-ray absorption near edge structure (µ-XANES) and bulkextraction followed by anion exchange HPLC-ICP-MS revealedthe presence of mainly inorganic As and dimethylarsinicacid (DMA). However, the two techniques indicated differentproportions of inorganic:organic As species. A wider survey ofwhole grain speciation of white (n ) 39) and brown (n ) 45)ricesamples fromnumeroussources(fieldcollected,supermarketsurvey, and pot trials) showed that brown rice had a higherproportion of inorganic arsenic present than white rice.Furthermore, the percentage of DMA present in the grainincreased along with total grain arsenic.
IntroductionConcerns have been raised regarding the levels of As, a humancarcinogen, in rice, with studies showing elevated grain Asconcentrations in regions where rice paddy fields are irrigatedwith As contaminated groundwater (1–5), where paddies havebecome contaminated through base and precious metalmining and industrial activity (6), and through the use ofarsenical pesticides (4, 7). Variation in natural paddy soil Asconcentrations may also lead to variation in grain As, thoughthis has not been explored to date. Regardless of how therice becomes elevated in As, modeling shows that levels ofAs in rice contribute considerably to dietary intake, especiallyin regions with subsistence rice diets or for ethnic groupswith high dietary rice intake (2, 4, 7).
Crucial to understanding the risk posed by As in rice isits speciation and location in grain. Ren et al. (8) have shownthat As levels in bran from a range of Chinese rice sampleswere considerably higher compared to those in polished rice,resulting in elevated concentrations in brown rice comparedto the white rice counterparts.
Studies where powdered rice grain has been solventextracted have shown significant differences between SEAsian rice where inorganic As is the dominate species, toU.S./European produced rice which has a much higherproportion of the methylated species dimethylarsinic acid(DMA) (4), with the inorganic species thought to be the mosttoxic (9). Extraction and chromatography interconvert in-organic species arsenate and arsenite meaning that HPLC-ICP-MS approaches used to speciate rice cannot accuratelydetermine these species’ in vivo concentrations, and thus atotal inorganic arsenic figure is given (10). Also, extractionof As from grains is incomplete and consequently a significantpart of the total As cannot be speciated using this technique.Furthermore, As(III) species are known to have a high affinityfor-SH groups, such as those in proteins and phytochelatins(11, 12), and in planta arsenite may be bound to thesemoieties, and released into solution on extraction and sampleoxidation. Harsh chemical extraction may alter mobilizationof As(III) from sulfyhydryl coordination in a manner differentfrom what happens naturally in the gut, giving an overes-timation of bioavailability.
Here we present the first study using in situ synchrotronX-ray fluorescence (S-XRF) to map element location and µ-X-ray absorption near edge spectroscopy (µ-XANES) to assessAs speciation in rice grain. The suitability of XANES toinvestigate As speciation in biological samples has beenpreviously demonstrated (13). The present work is, to ourknowledge, the first to investigate low levels of As using thistechnique in plant material. In addition to in situ As speciationby µ-XANES, the S-XRF mapping also included the elementsiron (Fe), zinc (Zn), cadmium (Cd), manganese (Mn), copper(Cu), and nickel (Ni) to provide the geochemical frameworkin which the As was deposited in the grain. This informationis also important in terms of nutritional value (i.e., Fe andZn content) of the grains. S-XRF imaging was complementedby laser ablation ICP-MS. Bulk speciation of a wider surveyof white and brown rice expanded the context of thesefindings to explore the relationship between total As con-centration in the grain and arsenic speciation.
Materials and MethodsOrigin of Specimens Used for the Synchrotron Investiga-tion. Four rice samples were obtained from Bangladesh,United States (2 samples), and China. Samples of brown ricewith high As were generated in pot experiments conducted
* Corresponding author e-mail: [email protected].† School of Biological Sciences, University of Aberdeen.‡ University of Copenhagen.§ U.S. Environmental Protection Agency.4 School of Physical Sciences, University of Aberdeen.⊥ Chinese Academy of Sciences.# Bangladesh Agricultural University.
Environ. Sci. Technol. 2008, 42, 1051–1057
10.1021/es702212p CCC: $40.75 2008 American Chemical Society VOL. 42, NO. 4, 2008 / ENVIRONMENTAL SCIENCE & TECHNOLOGY 9 1051
Published on Web 01/15/2008
with the long grained cultivar BR29, the most widely utilizedin Bangladesh. Rice plants were grown on paddy soil fromthe nongroundwater irrigated affected area of Myemsingh,Bangladesh, which was irrigated with water containing 2 mg/LAs as sodium arsenate. Two-liter pots were utilized and theplants were grown to maturity outside at Myemsingh duringthe dry season. Brown rice was also obtained from U.S. andChinese paddy fields, both of which were long grained. Whitemarket rice was obtained, in the UK, from U.S.-importedwhite long grain rice. The Chinese rice sample was obtainedfrom a mining-contaminated paddy soil from Dabaoshanarea in Guangdong province in Southern China. The Da-baoshan mixture metal mine has been in operation more 30years. Wastewater from the mining operation has beencontaminating the nearby paddy soils, where rice grains forthis study were taken.
Data and Specimens Used to Assess Correlations be-tween Total As and As Speciation. To assess possiblecorrelations between total As and As speciation in white andbrown rice a wider survey was compiled from our existingstudies and additional new data. A total of 55 data pointswere collated from the studies of Williams et al. (1, 4) andLiu et al. (15). New samples (26) were obtained from aBangladesh field survey, and a Japanese supermarket surveywas also included in the data set.
Synchrotron-Based Elemental Mapping and Spectros-copy. The rice was bisected along its latitudinal axis, and thehalf without the germ was analyzed to simplify imageinterpretation. Microsectioning of rice grains (not embeddedin resin) was attempted but was not successful due to thenature of the grains which resulted in pulverization of thesliced sections. Embedding of the grains was not consideredsince this could have resulted in changes in As speciation.Since determining speciation was one of the main aims ofthe synchrotron investigation, we decided to use bisectedsamples. This choice is not ideal in terms of elementalmapping, due to X-ray penetration (see below), but representsthe best option to conduct As speciation in situ using XANESbecause it minimizes the risk of artifacts during samplepreparation. Synchrotron-based elemental and image analy-sis was conducted at Sector 20-ID (PNC/XOR) at the AdvancedPhoton Source, Argonne National Laboratory. Specific detailsof the data collection and analysis are given in the SupportingInformation (SI).
Total Arsenic Determinations by ICP-MS and ArsenicSpeciation by HPLC-ICP-MS. Total As concentrations weredetermined on ball-milled samples of the grain, subjectedto nitric acid/hydrogen peroxide digestion and microwavedigestion, including rice flour CRM (NIST Certified ReferenceMaterial 1568a Arkansas long grain rice flour) in the samplebatch, followed by ICP-MS As quantification, according toprocedures detailed in Williams et al. (1). Quality controlresults were as presented in our previous publications (4, 7).Arsenic speciation, using a 2 M trifluoroacetic acid extraction(TFA) followed by TFAHPLC-ICP-MS, and quality controlprocedures were identical to those presented previously (4).
Laser Ablation ICP-MS (LA-ICP-MS). The Bangladeshrice sample had the highest total As concentration (Table 1)and, therefore, it was selected for analysis with LA-ICP-MS
to complement the S-XRF data. Because in this case Asspeciation was not the object of the investigation, grainswere embedded in resin used for preparation of pathologicalsamples and then the block was sectioned and polished.Specific details of the data collection and analysis are givenin the SI.
Results and DiscussionBulk Arsenic Concentration and Speciation in Rice Usedfor XAS Study. Total As concentrations in all 4 samples,ranging from 0.28 to 0.61 mg/kg As (Table 1), were high withrespect to typical rice grain background levels of 0.05-0.15mg/kg (1, 4, 7). The inorganic As content of the rice variedfrom 39 to 57% of the total and the nonextractable As rangedfrom 14 to 27% (Table 1). The Bangladesh specimen wasspecifically experimentally contaminated, while all othersamples were meant for human consumption.
Arsenic Localization in Grain. Interpretation of theelemental distribution maps has to take into account thefact that the images are projections of all of the elementpresent in the sample in the specific path of the beam. Areaswithin the grain which are of higher density or thickness willprovide a stronger XRF signal (14, 15). In other words, S-XRFimaging compresses 3D information into 2D and this mustbeen born in mind when viewing the data. As explained above,thin sections could not be prepared without embedding thesamples in resin and we opted against this option to preserveAs speciation for µ-XANES analysis. However, if theselimitations are considered during data interpretation it isstill possible to ascertain important information regardingelemental distribution.
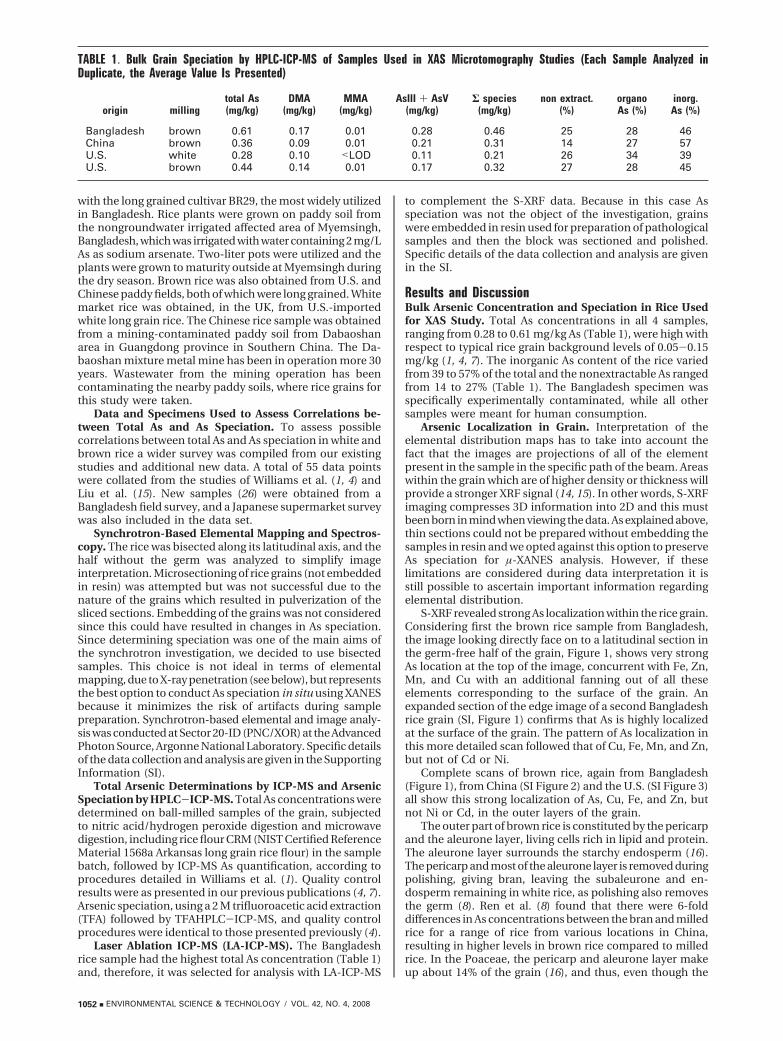
S-XRF revealed strong As localization within the rice grain.Considering first the brown rice sample from Bangladesh,the image looking directly face on to a latitudinal section inthe germ-free half of the grain, Figure 1, shows very strongAs location at the top of the image, concurrent with Fe, Zn,Mn, and Cu with an additional fanning out of all theseelements corresponding to the surface of the grain. Anexpanded section of the edge image of a second Bangladeshrice grain (SI, Figure 1) confirms that As is highly localizedat the surface of the grain. The pattern of As localization inthis more detailed scan followed that of Cu, Fe, Mn, and Zn,but not of Cd or Ni.
Complete scans of brown rice, again from Bangladesh(Figure 1), from China (SI Figure 2) and the U.S. (SI Figure 3)all show this strong localization of As, Cu, Fe, and Zn, butnot Ni or Cd, in the outer layers of the grain.
The outer part of brown rice is constituted by the pericarpand the aleurone layer, living cells rich in lipid and protein.The aleurone layer surrounds the starchy endosperm (16).The pericarp and most of the aleurone layer is removed duringpolishing, giving bran, leaving the subaleurone and en-dosperm remaining in white rice, as polishing also removesthe germ (8). Ren et al. (8) found that there were 6-folddifferences in As concentrations between the bran and milledrice for a range of rice from various locations in China,resulting in higher levels in brown rice compared to milledrice. In the Poaceae, the pericarp and aleurone layer makeup about 14% of the grain (16), and thus, even though the
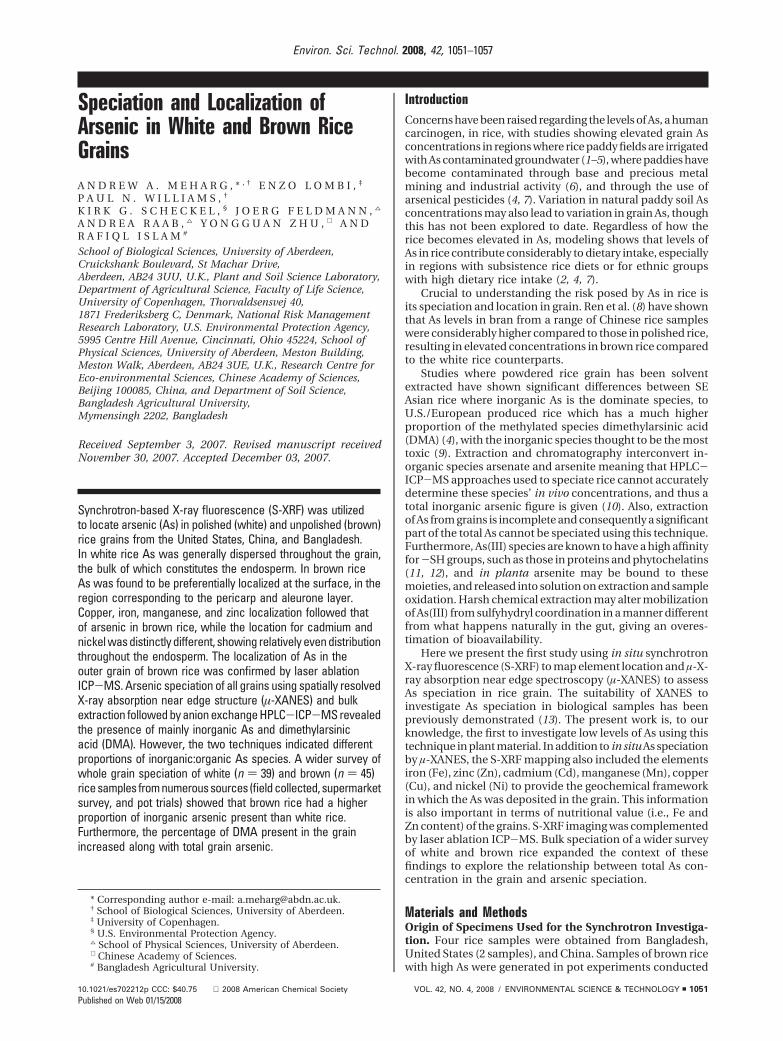
TABLE 1. Bulk Grain Speciation by HPLC-ICP-MS of Samples Used in XAS Microtomography Studies (Each Sample Analyzed inDuplicate, the Average Value Is Presented)
origin millingtotal As(mg/kg)
DMA(mg/kg)
MMA(mg/kg)
AsIII + AsV(mg/kg)
Σ species(mg/kg)
non extract.(%)
organoAs (%)
inorg.As (%)
Bangladesh brown 0.61 0.17 0.01 0.28 0.46 25 28 46China brown 0.36 0.09 0.01 0.21 0.31 14 27 57U.S. white 0.28 0.10 <LOD 0.11 0.21 26 34 39U.S. brown 0.44 0.14 0.01 0.17 0.32 27 28 45
1052 9 ENVIRONMENTAL SCIENCE & TECHNOLOGY / VOL. 42, NO. 4, 2008
bran is considerably higher in As than the endosperm, therelative differences between brown and white rice range from15 to 100% greater As in brown, compared to 200–600%differences between bran and white rice (8).
The colocation of Fe, Cu, Mn, and Zn with As in thealeurone layer is consistent with similar comparison in thelevels of these metals between bran and white rice (8). Also,a number of microprobe studies on element location in grain,including rice (17, 18), and other members of the Poaceaegrain utilized for food (19–21) have shown strong localizationof cations in the aleurone, with most studies focusing on Zn.These studies also observed similar localization in the germof Zn and other cations. We did not concentrate on the germin this study, but the findings presented here suggest thatthe germ should also be included in the focus of future studies.
From all the scans of brown rice (Figure 1; SI Figures 1and 4) it is observed that As and the other codepositingelements Cu, Fe, Mn, and Zn, are not uniformly coated aroundthe grain, but are centered along the surface longitudinalgroove. This is clearer in the off-center aligned grains (Figure1; SI Figures 2 and 3). To our knowledge, this elementallocation along longitudinal grooves has not been previouslyillustrated.
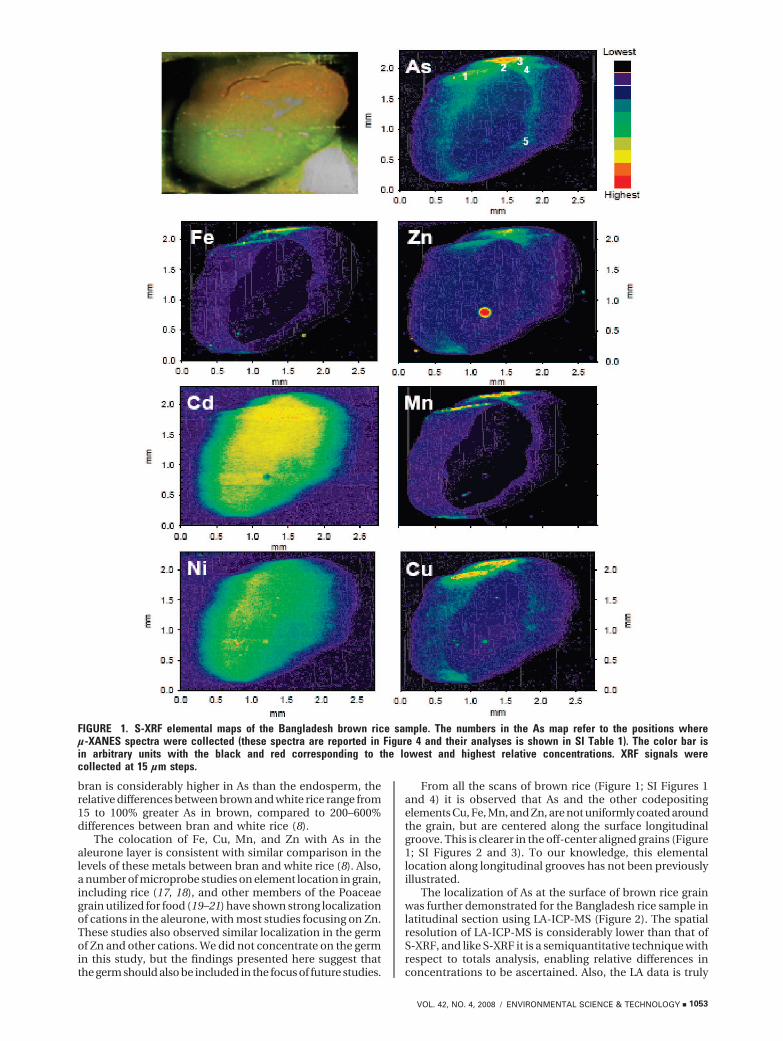
The localization of As at the surface of brown rice grainwas further demonstrated for the Bangladesh rice sample inlatitudinal section using LA-ICP-MS (Figure 2). The spatialresolution of LA-ICP-MS is considerably lower than that ofS-XRF, and like S-XRF it is a semiquantitative technique withrespect to totals analysis, enabling relative differences inconcentrations to be ascertained. Also, the LA data is truly
FIGURE 1. S-XRF elemental maps of the Bangladesh brown rice sample. The numbers in the As map refer to the positions whereµ-XANES spectra were collected (these spectra are reported in Figure 4 and their analyses is shown in SI Table 1). The color bar isin arbitrary units with the black and red corresponding to the lowest and highest relative concentrations. XRF signals werecollected at 15 µm steps.
VOL. 42, NO. 4, 2008 / ENVIRONMENTAL SCIENCE & TECHNOLOGY 9 1053
2D, and confirms that interpretation that As is moreconcentrated in epidermal layers for the S-XRF scans, where3D data are compressed into 2D, is correct.
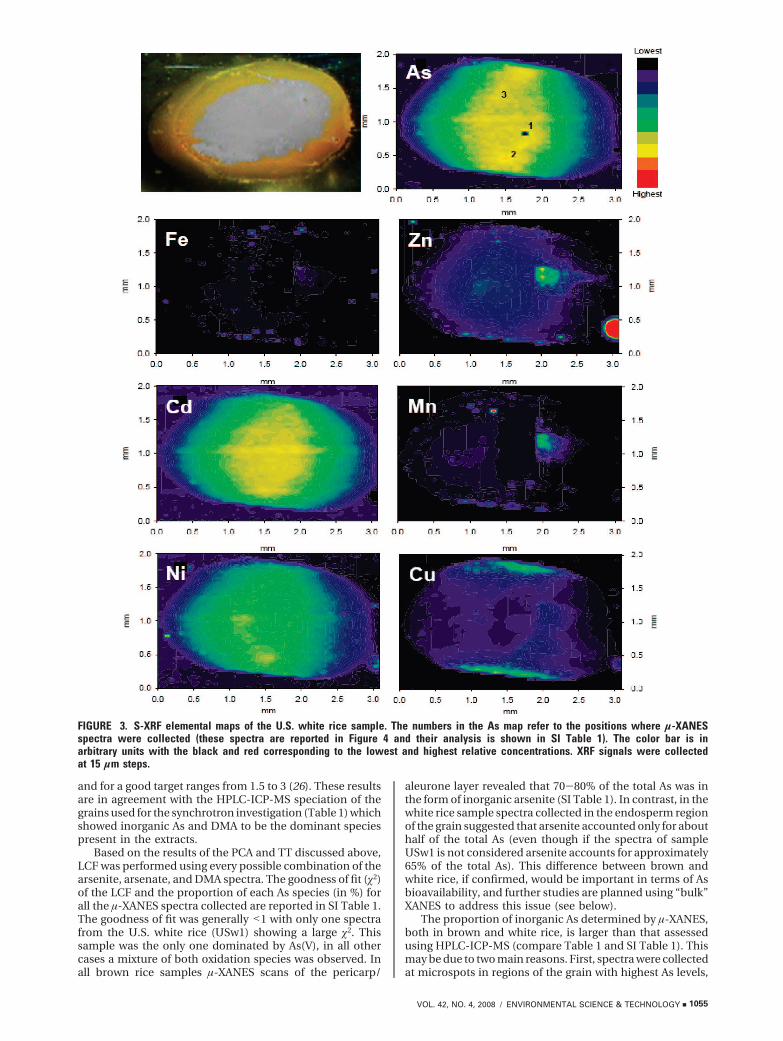
For the white rice sample (Figure 3) the localization patternof As is entirely different from that of brown rice. Since theAs-rich external parts of the grain (pericarp and most of thealeurone) are removed during polishing, the As distributionin white rice appears relatively even throughout the grain.This indicates that As is evenly distributed across theendosperm. The apparent sharp gradient in the relative Asconcentration from the edge to the center of the grain is dueto the depth of grain scanned at each pixel. Copper, Mn, Fe,and Zn distributions are patchy as a result of a weak XRFsignal once the metal-rich external part of the grain isremoved by polishing. These findings also indicate that theremoval of the pericarp and aleurone layer during polishingreduce the nutritional value of rice in terms of Fe and Zncontent.
Cadmium and Ni show uniform distribution in both white(Figure 4) and brown rice (Figure 1; SI Figures 1 and 4).Moriyama et al. (22) showed that when rice was polished, Cdconcentrations only fell by 3%, suggesting that this elementis mainly localized in the endosperm. The pattern ofdistribution for arsenic in white rice was similar to that forCd and Ni indicating that, once the As-rich pericarp andaleurone layer are removed, the remaining As is distributedhomogeneously in the white rice grain.
The preferential localization of As in the aleurone layerprovides clues as to why As is deposited in the grain. Thealeurone is composed of phytic acid (inositol hexaphosphate)rich granules, also rich in Ca, Mg, K, and Zn, and is thoughtto be a storage reservoir for these metals and P (from thephytic acid) for when the seed germinates and grows (17–22).The aleurone layer forms about 7–9 days after flowering inrice, differentiating from the starchy endosperm and outerpericarp (17). Microprobe studies have shown at this stagethat Mg, P, and K were evenly distributed throughout thegrain at this time period, but by day 12 Mg and P started tostratify, concentrating in the aleurone (17). By 28 days afterflowering, all three elements were highly concentrated inthe aleurone. A time course of total concentrations of thesenutrients in rice for the same study showed 2 orders ofmagnitude increase in concentrations over this time period,indicating active export to the grain over this time period.This suggests that these elements are being directly depositedin the aleurone during filling, rather than redistribution fromthe endosperm. While the equivalent experiments have tobe conducted for As and, indeed, this must be a priority forfuture research, the pattern of codeposition in the aleuronemay suggest that most As is exported to the grain during
days 10–20 from flowering (17). This information could beessential for regulating As off-take into rice grain. Since Asis mobilized under aerobic conditions (23, 24), timing ofpaddy soil draining could potentially greatly alter As grainexport, though this would depend on rapid translocation ofrecently root-assimilated As to the grain. In contrast, if grainAs is mobilized from shoot reserves, altering As assimilationat or around flowering may have negligible impact. Thus,understanding the dynamics of As uptake into shoot is alsoa research priority.
Speciation of As Using µ-XANES. The As K-edge spectraof the standard compounds are reported in Figure 4. Thepeaks of the absorption edge (white line) energies increasedin the order As(Glu)3 < arsenite < DMA < MMA < arsenate.The position of the primary XANES peak for the differentstandard compunds, as well as the energy shift between thewhite lines of arsenite and arsenate (4 eV), are consistentwith the findings of Smith et al. (13).
Selected µ-XANES spectra performed on the grain samplesare reported in Figure 4 and show that good quality spectracould be collected despite the low average concentration ofAs in the grains. Generally a mixture of As(III) and As(V) canbe inferred by the presence of two main peaks in the spectra.A few µ-XANES spectra collected from brown rice samples(B5, C1, and USb1, Figure 4) were characterized by anadsorption edge occurring at a slightly lower energy thanarsenite. This may be due to the presence of S-As compounds(13) but, in general, the µ-XANES spectra do not indicate thepresence of significant amounts of these complexes. This issomehow surprising since the aleurone layer, unlike thestarchy endosperm, is protein rich (15) and As(III) has highaffinity for protein and nonprotein (i.e., phytochelatin andglutathione) -SH functional group.
PCA analyses were conducted on the whole spectra dataset. The indicator value (IND) was used to assess the numberof principal components that could accurately describe thesystem (25). This value is at its minimum when the optimalnumber of components is reached. In this case IND wasminimal with 4 components. However, plotting of theindividual components indicated that the fourth component(explaining less that 1% of the variance) contained essentiallynoise. The first 3 components could explain 97% of thevariance. Consequently, further analyses were conductedconsidering the system as a 3-component system.
The choice of standards to be considered for LCF wasbased on target transformation (TT) of the spectra and theSPOIL value as described by Manceau et al. (26). TT showedthat arsenite, arsenate, and DMA had a SPOIL value<3 whilethe SPOIL values for MMA and As(Glu)3 were >5. The SPOILvalue for an excellent target typically ranges from 0 to 1.5
FIGURE 2. Laser ablation ICP-MS of the Bangladesh rice sample used in Figure 1, and SI Figure 1 and 4. Counts per second (CPS)recorded for each ablation are color graded. Total carbon was also checked and this was uniform across the grain, showing thatthe amount of sample ablated at each location was equivalent.
1054 9 ENVIRONMENTAL SCIENCE & TECHNOLOGY / VOL. 42, NO. 4, 2008
and for a good target ranges from 1.5 to 3 (26). These resultsare in agreement with the HPLC-ICP-MS speciation of thegrains used for the synchrotron investigation (Table 1) whichshowed inorganic As and DMA to be the dominant speciespresent in the extracts.
Based on the results of the PCA and TT discussed above,LCF was performed using every possible combination of thearsenite, arsenate, and DMA spectra. The goodness of fit (�2)of the LCF and the proportion of each As species (in %) forall the µ-XANES spectra collected are reported in SI Table 1.The goodness of fit was generally <1 with only one spectrafrom the U.S. white rice (USw1) showing a large �2. Thissample was the only one dominated by As(V), in all othercases a mixture of both oxidation species was observed. Inall brown rice samples µ-XANES scans of the pericarp/
aleurone layer revealed that 70-80% of the total As was inthe form of inorganic arsenite (SI Table 1). In contrast, in thewhite rice sample spectra collected in the endosperm regionof the grain suggested that arsenite accounted only for abouthalf of the total As (even though if the spectra of sampleUSw1 is not considered arsenite accounts for approximately65% of the total As). This difference between brown andwhite rice, if confirmed, would be important in terms of Asbioavailability, and further studies are planned using “bulk”XANES to address this issue (see below).
The proportion of inorganic As determined by µ-XANES,both in brown and white rice, is larger than that assessedusing HPLC-ICP-MS (compare Table 1 and SI Table 1). Thismay be due to two main reasons. First, spectra were collectedat microspots in regions of the grain with highest As levels,
FIGURE 3. S-XRF elemental maps of the U.S. white rice sample. The numbers in the As map refer to the positions where µ-XANESspectra were collected (these spectra are reported in Figure 4 and their analysis is shown in SI Table 1). The color bar is inarbitrary units with the black and red corresponding to the lowest and highest relative concentrations. XRF signals were collectedat 15 µm steps.
VOL. 42, NO. 4, 2008 / ENVIRONMENTAL SCIENCE & TECHNOLOGY 9 1055

that is the aleurone layer in the case of brown rice, so as tomaximize resolution given that arsenic levels were low.However, this may not represent the overall As speciation ofthe grain. The second reason may be related to the incompleteextraction of As by the 2 M TFA extraction used in this study.In fact, 14-27% of the total As was not extracted by TFA.Comparison of the µ-XANES and HPLC-ICP-MS results couldindicate that the non-TFA-extractable As is in the form ofinorganic As. This is supported by the findings of Mir et al.(27) who reported that the As species in plant residual, aftera methanol and HCl extraction, were substantially differentfrom those extracted. Even thought Mir et al. (27) did notidentify the As species in the plant residuals, it is likely thatthey were in the form of oxidized inorganic species sincetheir absorption spectra were shifted to energies higher thanthat of arsenate. We plan to further investigate both these
aspects using “bulk” XANES of brown rice and paired samplesof the same rice after polishing.
Relationship between Total Grain Arsenic and Specia-tion between White and Brown Rice. Bulk speciation (i.e.,TFA extraction of ball-milled grain), representing the mostcomprehensive data set, to our knowledge, published to date,showed differences in the pattern of arsenic speciationbetween brown and white rice (Figure 5). For “normal” levelsof As found in rice surveys (0–0.3 mg/kg d.wt.) (1, 4, 7) brownrice had 10% higher levels of inorganic As than white rice,with the percentages being ∼65 and 55%, respectively. Thisconfirms the S-XRF data that enhanced inorganic levelsshould be present in brown rice. For brown rice, total Aslevels rise above this normal range, but still relevant to highlyAs contaminated soils (1, 4, 7), the percentage of inorganicarsenic decreases (Figure 5). For DMA, its content increasessystematically from 0.05 to 0.25 mg/kg total arsenic for bothbrown and white rice, with white rice having higher levelsof DMA. As brown rice concentration increases above 0.25mg/kg, DMA content plateaus at ∼30% DMA. General LinearModeling (GLM) ANOVA showed for the relationship betweentotal arsenic and percentage inorganic arsenic that both ricetype (brown or white) and total arsenic concentration(entered as a covariate) were significant with p ) 0.03 andp < 0.001 respectively, with the interaction term beingnonsignificant. For the corresponding test for percentageorganic (DMA) arsenic, the interaction term was significant,showing that white and brown rice behaved differently.
With respect to the threat that arsenic in rice poses to thehuman diet, assuming that inorganic arsenic is moreproblematic than organic (DMA) (7), then polishing ricereduces the total arsenic burden of the grain and its inorganiccontent. Brown rice is unpopular in subsistence rice diets,
FIGURE 4. Arsenic XANES spectra for selected arsenic speciesand As µ-XANES spectra from white and brown rice samples.The nomenclature of the spectra of the rice samples is thesame as in SI Table 1: B, Bangladesh rice (brown); C, Chineserice (brown); USw and USb rice from the United States (whiteand brown, respectively). The numbers after B, C, USw, andUSb refer to the position where the spectra were collected(see Figures 1 and 3 and SI Figures 2 and 3). The energy scaleis normalized to the white line of arsenite.
FIGURE 5. Bulk speciation in brown (filled bars) and white(open bars) rice by HPLC-ICP-MS for inorganic arsenic andDMA. Numbers above the bars denote N.
1056 9 ENVIRONMENTAL SCIENCE & TECHNOLOGY / VOL. 42, NO. 4, 2008
and tends to be more popular in developed countries as awholegrain alternative to rice. While this raises concernsabout brown rice per se, it is clear that products made fromrice bran and germ, such as rice milk and direct consumptionof bran and germ as dietary fiber supplements, are ofparticular concern and need further attention.
AcknowledgmentsThe U.S. EPA has not subjected this manuscript to internalpolicy review. Therefore, the research results presented hereindo not necessarily reflect Agency policy. Mention of tradenames of commercial products and companies does notconstitute endorsement or recommendation for use. Thiswork was performed at XOR (Sector 20), Advanced PhotonSource (APS), Argonne National Laboratory. Use of the APSwas supported by the U.S. Department of Energy, Office ofScience, Office of Basic Energy Sciences, under ContractW-31-109-ENG-38. E.L. was supported by the CSIRO Emerg-ing Science Initiative on Synchrotron Science: ExtremeChemistry and Environmental Science.
Supporting Information AvailableExperimental details, 3 figures, and 1 table. This informationis available free of charge via the Internet at http://pubs.acs.org.
Literature Cited(1) Williams, P. N.; Islam, M. R.; Adomako, E. E.; Raab, A.; Hossain,
S. A.; Zhu, Y. G.; Feldmann, J.; Meharg, A. A. Increase in ricegrain arsenic for regions of Bangladesh irrigating paddies withelevated arsenic in groundwaters. Environ. Sci. Technol. 2006,40, 4903–4908.
(2) Meharg, A. A.; Rahman, M. Arsenic contamination of Bangladeshpaddy field soils: Implications for rice contribution to arsenicconsumption. Environ. Sci. Technol. 2003, 37, 229–234.
(3) Duxbury, J. M.; Mayer, A. B.; Lauren, J. G.; Hassan, N. Foodchain aspects of arsenic contamination in Bangladesh: Effectson quality and productivity of rice. J. Environ. Sci. Health, A2003, 38, 61–69.
(4) Williams, P. N.; Price, A. H.; Raab, A.; Hossain, S. A.; Feldmann,J.; Meharg, A. A. Variation in arsenic speciation and concentra-tion in paddy rice related to dietary exposure. Environ. Sci.Technol. 2005, 39, 5531–5540.
(5) Islam, M. R.; Islam, S.; Jahiruddin, M.; Islam, M. A. Effects ofirrigation water arsenic in the rice cropping system. J. Bio. Sci.2004, 4, 542–546.
(6) Liao, X. Y.; Chen, T. B.; Xie, H.; Liu, Y. R. Soil As contaminationand its risk assessment in areas near the industrial districts ofChenzhou City, Southern China. Environ. Int. 2005, 31, 791–798.
(7) Williams, P. N.; Raab, A.; Feldmann, J.; Meharg, A. A. Marketbasket survey shows elevated levels of As in South Central U.S.processed rice compared to California: Consequences for humandietary exposure. Environ. Sci. Technol. 2007, 41 (7), 2178–2183.
(8) Ren, X-L.; Liu, Q-L.; Wu, D-X.; Shu, Q-Y. Variations in con-centration and distribution of health-related elements affectedby environmental and genotypic differences in rice grains. RiceSci. 2006, 13, 170–178.
(9) Petrick, J. S.; Ayala-Fierro, F.; Cullen, W. R.; Carter, D. E.;Aposhian, H. V. Monomethylarsonous acid (MMAIII) is more
toxic than arsenite in changing human hepatocytes. Toxicol.Appl. Pharmacol. 2000, 163, 203–207.
(10) Abedin, M. J.; Cresser, M. S.; Meharg, A. A.; Feldmann, J.; Cotter-Howells, J. Arsenic accumulation and metabolism in rice (Oryzasativa L.). Environ. Sci. Technol. 2002, 36, 962–968.
(11) Raab, A.; Feldmann, J.; Meharg, A. A. The nature of arsenic -phytochelatins complexes in Holcus lanatus and Pteris cretica.Plant Physiol. 2004, 134, 1113–1122.
(12) Raab, A.; Feldmann, J.; Schat, H.; Meharg, A. A. Uptake,translocation and transformation of arsenate and arsenite insunflower (Helianthus annuus) - Part I: Formation of arsenic-phytochelatin complexes during exposure to high arsenicconcentrations. New Phytol. 2005, 168, 551–558.
(13) Smith, P. G.; Koch, I.; Gordon, R. A.; Mandoli, D. F.; Chapman,B. D.; Reimer, K. J. X-ray absorption near-edge structure analysisof arsenic species for application to biological environmentalsamples. Environ. Sci. Technol. 2005, 39, 248–254.
(14) Scheckel, K. G.; Hamon, R. E.; Jassogne, L.; Rivers, M.; Lombi,E. Synchrotron X-ray Absorption-Edge Computed Microto-mography Imaging of Thallium Compartmentalization in Iberisintermedia. Plant Soil 2007, 290, 51–60.
(15) McNear, D. H.; Peltier, E.; Everhart, J.; Chaney, R. L.; Sutton, S.;Newville, M.; Rivers, M.; Sparks, D. L. Application of quantitativefluorescence and absorption-edge computed microtomographyto image metal compartmentalization in Alyssum murale.Environ. Sci. Technol. 2005, 39, 2210–2218.
(16) Esau, K. Anatomy of Seed Plants, 2nd ed.; Wiley: New York,1977.
(17) Ogawa, M.; Tanaka, K.; Kasai, Z. Accumulation of phosphorus,magnesium and potassium in developing rice grains: followedby electron microprobe X-ray analysis focussing on the aleuronelayer. Plant Cell Physiol. 1979, 20, 19–27.
(18) Ogawa, M.; Tanaka, K.; Kasai, Z. Energy-dispersive X-ray analysisof phytin glonoids in aleurone particles of developing rice grains.Soil Sci. Plant Nutr. 1979, 25, 437–448.
(19) Orturk, L.; Yazici, M. A.; Yucei, C.; Torun, A.; Cekic, C.; Bagci,A.; Ozkan, H.; Braun, H-J.; Sayers, Z.; Cakmak, I. Concentrationand localization of zinc during seed development and germina-tion in wheat. Physiol. Plant. 2006, 128, 144–152.
(20) Lott, J. N. A.; Spitzer, E. X-ray analysis studies of elements storedin protein body globoid crystals of Triticum grains. Plant Physiol.1980, 66, 494–499.
(21) Mazzolin, A. P.; Pallaghy, C. K.; Legge, G. J. F. Quantitativemicroanalysis of Mn, Zn, and other elements in mature wheatseed. New Phytol. 1985, 100, 483–509.
(22) Moriyama, T.; Shindoh, K.; Taguchi, Y.; Watanabe, H.; Yasui, A.;Joh, T. Changes in the cadmium content of rice during the millingprocess. J. Food Hygien. Soc. Jap. 2003, 44, 145–149.
(23) Meharg, A. A. Arsenic in rice - understanding a new disaster forSouth-East Asia. Trends Plant Sci 2004, 9, 415–417.
(24) Marin, A. R.; Masscheleyn, P. H.; Patrick, W. H. Soil redox-pHstability of arsenic species and its influence on arsenic uptakeby rice. Plant Soil 1993, 152, 1993.
(25) Malinowski, E. R. Factor Analysis in Chemistry; Wiley: New York,1991.
(26) Manceau, A.; Marcus, M. A.; Tamura, N. Quantitative speciationof heavy metals in soils and sediments by synchrotron X-raytechniques. In Applications of Synchrotron Radiation in Low-Temperature Geochemistry and Environmental Science; Fenter,P. A., Rivers, M. L., Sturchio, N. C., Sutton, S. R., Eds.;Mineralogical Society of America: Washington, DC, 2002; Vol.49, pp 341–428.
(27) Mir, K. A.; Rutter, A.; Koch, I.; Smith, M. P.; Reimer, K. J.; Poland,J. S. Extraction and speciation of arsenic in plants grown onarsenic contaminated soils. Talanta 2007, 72, 1507–1518.
ES702212P
VOL. 42, NO. 4, 2008 / ENVIRONMENTAL SCIENCE & TECHNOLOGY 9 1057