spatial light modulators for information processing: applications and overview
TRANSCRIPT
Invited paper presented at the Sixth Euro American Workshop on Information Optics, Reykjavik, Iceland 25 - 30 June 2007. 6th International Workshop on Information Optics (WIO'07), Jón Atli Benediktsson, B. Javidi, Karl S. Gudmundsson, eds.; American Institute of Physics, AIP Conference Proceedings 949 (ISBN 978-0-7354-0463-2), p 226-233 (2007)
Spatial Light Modulators For Information Processing: Applications And Overview
Pierre Ambs1, Joaquín Otón2, María S. Millán2 , Albéric Jaulin1, Laurent Bigué1
1 Université de Haute Alsace, ENSISA, MIPS, 12 rue des Frères Lumière, 68093 Mulhouse Cedex France
2 Dep. Optics and Optometry, Technical University of Catalonia, C/ Violinista Vellsolà, 37, 08222 Terrassa (Barcelona), Spain
Abstract. We present the characterization of a ferro-electric liquid crystal spatial light modulator and of a nematic liquid crystal spatial light modulator. It is shown that the nematic device can be compensated for its phase distortions and a method is proposed for increasing its frame rate while maintaining a maximum phase modulation of 2π. Several applications in information processing are presented with experimental results.
Keywords: Spatial Light Modulators, Liquid Crystal, Optical Information Processing. PACS: 42.30.–d, 42.40.Jv, 42.79.Kr
INTRODUCTION
One of the biggest advantages of electronic based processing systems is their flexibility due to their programmability. Spatial Light Modulators (SLMs) can bring the same flexibility to optical systems, however, they have been among the weakest components of the optical systems. Since the late nineties, the SLMs development is driven by the very rapid expansion of the consumer electronics for video projectors, digital cameras and displays. Commercially available SLMs are based on two different technologies: mirrors and liquid crystals. There is a large choice of liquid crystal SLMs, they can be optically or electrically addressed, transmissive or reflective, filled with twisted nematic liquid crystals (TN-LC), or nematic liquid crystals (N-LC) or ferro-electric liquid crystals (FLC). It is now possible to find one SLM that will satisfy most of the requirements of a specific information processing application.
The SLM characterization and calibration are absolutely mandatory if the SLM has to be used for scientific applications. Moreover, each specimen of SLM is different due to the fabrication process and must be characterized individually.
After a short presentation of an analog FLC SLM, we will show the characterization and the calibration of a N-LC SLM, and demonstrate that it is possible to increase the frame rate while maintaining the maximum phase modulation. Then several applications such as dynamic diffractive optical elements (DOEs), wavefront control and polarimetric imaging are briefly presented to show the potential applications of the SLMs.
CHARACTERIZATION OF LIQUID CRYSTAL SLMS
Analog Ferroelectric Liquid Crystal SLM
Ferroelectric liquid crystals (FLC) can be operated at several tens of kHz. Classic
ferroelectric smectic C* SLMs only exhibit a binary modulation. However, Boulder
Nonlinear Systems Inc. (BNS)[1] proposes reflective (LCoS, Liquid Crystal on
Silicon) FLC SLMs in which the smectic C* LC produces a continuous tunable
polarization modulation, acting as a continuous tunable half-wave plate for a given
wavelength. The applied electric field results in a rotation of the half-wave retarder’s
slow-axis about the optic axis. Our device has a resolution of 512x512 with a pixel
pitch of 15 m and a contrast ratio of 200:1. The SLM driver can load 1020 frames
with 256 levels at 1015 Hz. We have characterized this SLM in pure amplitude
modulation mode. The response is not linear, but this can be corrected with a look-up
table (LUT) [2].
Nematic Liquid Crystal SLM
The main advantage of N-LC SLMs for information processing is their pure phase
modulation capability. The N-LC molecules usually lie parallel to the surface of the
device giving the maximum retardance due to the birefringence of the LC. When an
electric field is applied, the molecules tilt parallel to the electric field. As the voltage is
increased, the birefringence is effectively decreased.
Different pure phase LC SLMs are commercially available. Hammatsu[3]
manufactures a Parallel Aligned or PAL SLM, that is optically addressed, and
coupling it to an electrically addressed TN-LC SLM makes the electrical addressing.
Several applications of this SLM were published [4-6]. Pure phase SLMs are also
proposed by HoloEye[7] and BNS. The BNS SLMs are proposed with the choice of
the liquid crystal either analog FLC for pure amplitude modulation or N-LC for pure
phase modulation.
We will present here the characterization of a N-LC SLM from BNS. This
reflective SLM (LCoS), features a resolution of 256x256, a pixel pitch of 18 m, a
maximum usable frame rate of 25 to 150 Hz and an electrical addressing on 8-bit per
pixel. It appears clearly from previous works[8,9] that LCoS SLM are particularly
subject to distortions due to the backplane curvature and to the variation of the LC
thickness across the aperture.
Phase Modulation Measurement Using a Ronchi Grating
All the experimental data presented in this paper were obtained using a He-Ne laser
at 633 nm wavelength.
The use of a Ronchi grating for measuring the phase modulation of the SLM was
proposed by Zhang [10]. This simple method gives the average phase modulation of
the whole SLM. Ronchi gratings are displayed on the SLM and the intensity of the
first diffraction order of the grating is measured when the gray level of the grating is
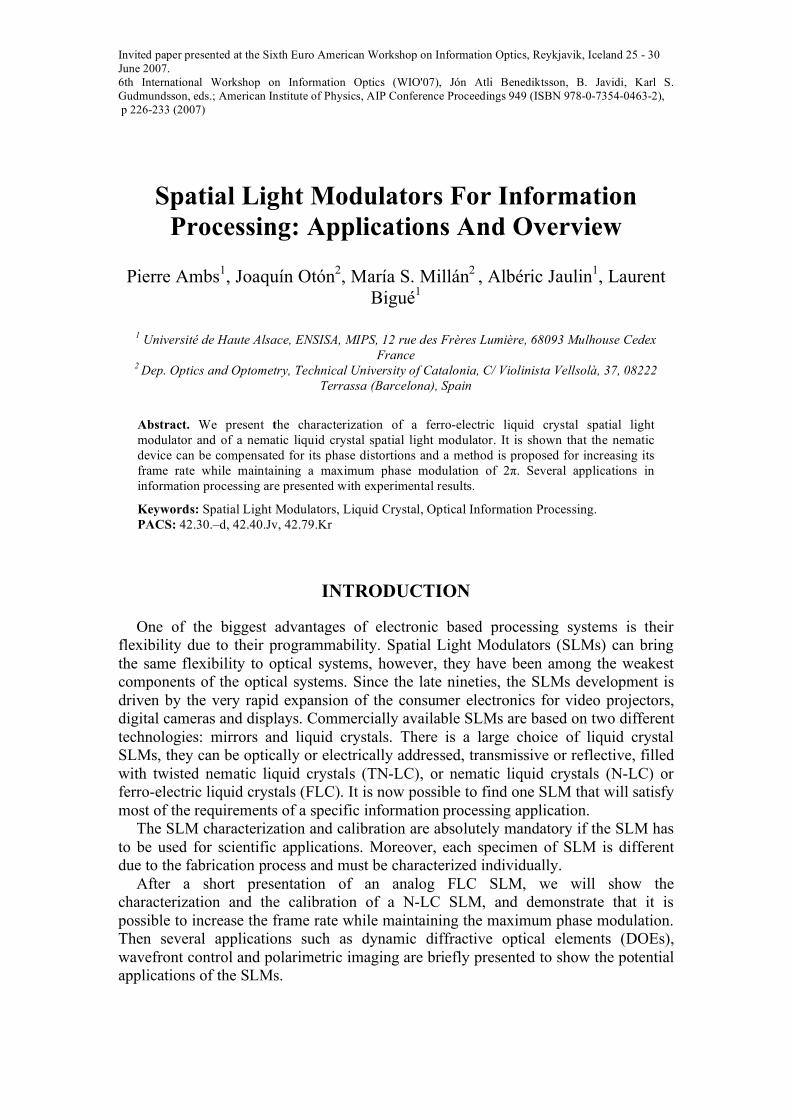
varying between 0 and 255. This intensity will reach a maximum or a minimum when
dephasing is a multiple of (Fig. 1a). Since the N-LC does not respond to the polarity
of the electric field, complementary pixel values n and 255-n result in the same phase
shift. The maximum phase shift is approximately 2.3 (Fig. 1b). In many applications,
the phase is computed modulo 2 and a LUT must be implemented using the data of
Fig. 1b. With this LUT a phase shift of exactly 2 when the input pixel value varies
between 0 and 255 is achieved (Fig. 1d).
FIGURE 1. (a-b) Experimental measurements of the phase shift for different gray levels when no LUT
is applied: a) Intensity of the first diffraction order due to the grating when a Ronchi grating with
variable gray levels from 0 to 255 is displayed on the SLM. b) Phase shift computed with the data of
curve a); c) used LUT, the 0 and 255 pixel value of the computed phase will respectively correspond to
the pixel value 21 and 102 displayed on the SLM. d) phase measurement with the LUT.[11]
Multi LUT
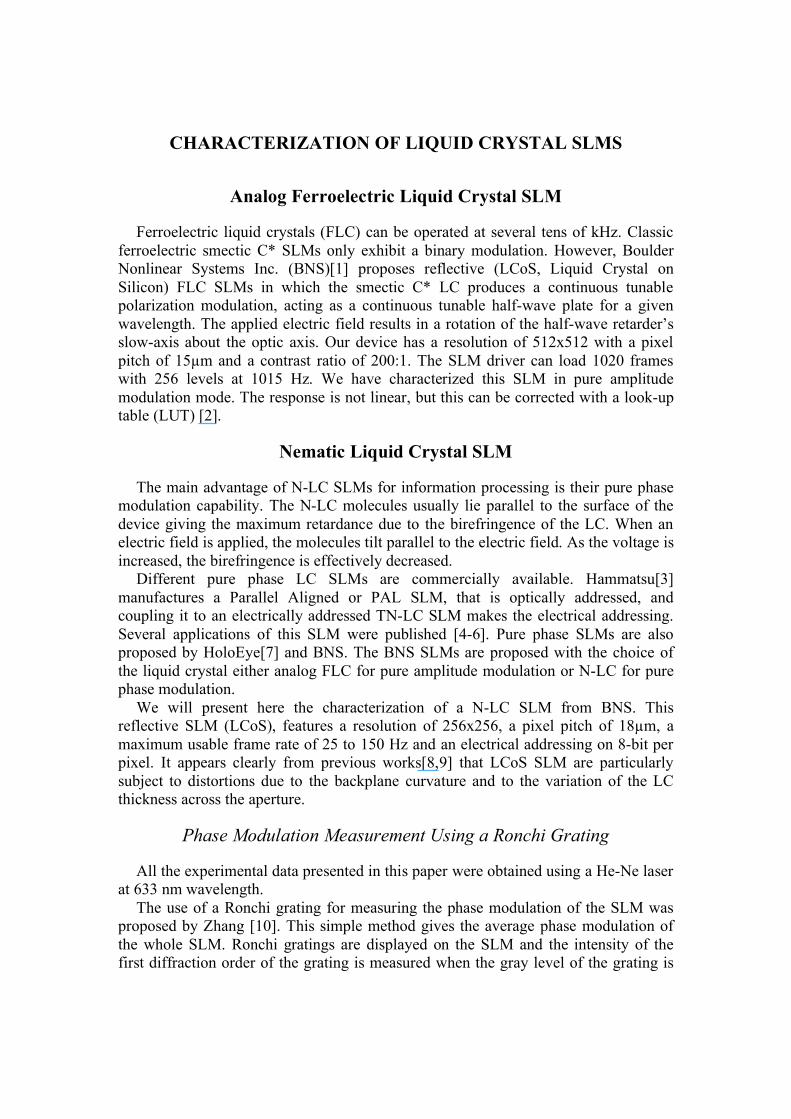
The phase modulation measurement using a Ronchi grating provides an average
phase modulation of all the surface of the SLM. However, the phase modulation varies
depending on the region of the SLM. Using a Michelson interferometer, we measured
the phase shift for different regions. For the same gray level displayed on the SLM, the
phase shift is higher on the edges of the SLM than in its center (Fig. 2a).
Nmax
1 2 3 4 5 6 7 8
1
2
3
4
5
6
7
8
75
80
85
90
95
a) b) c)
FIGURE 2. a) Phase shift vs. gray level for the edges and the center of the SLM compared with the
data obtained using the Ronchi gratings. b) Definition of the 8 by 8 regions of the SLM, c) Value of the
gray level giving a 2 phase shift for the different regions of the SLM.[11]
We have divided the SLM in 8 by 8 regions (Fig. 2b) and in each region we have
measured the value of gray level giving a 2 phase shift (Fig. 2c). Using the values of
Fig. 2a and 2c, we have computed its specific LUT for each region. This multi-LUT
minimizes the phase discontinuities in the phase pattern generated by the SLM.
Phase distortion and compensation
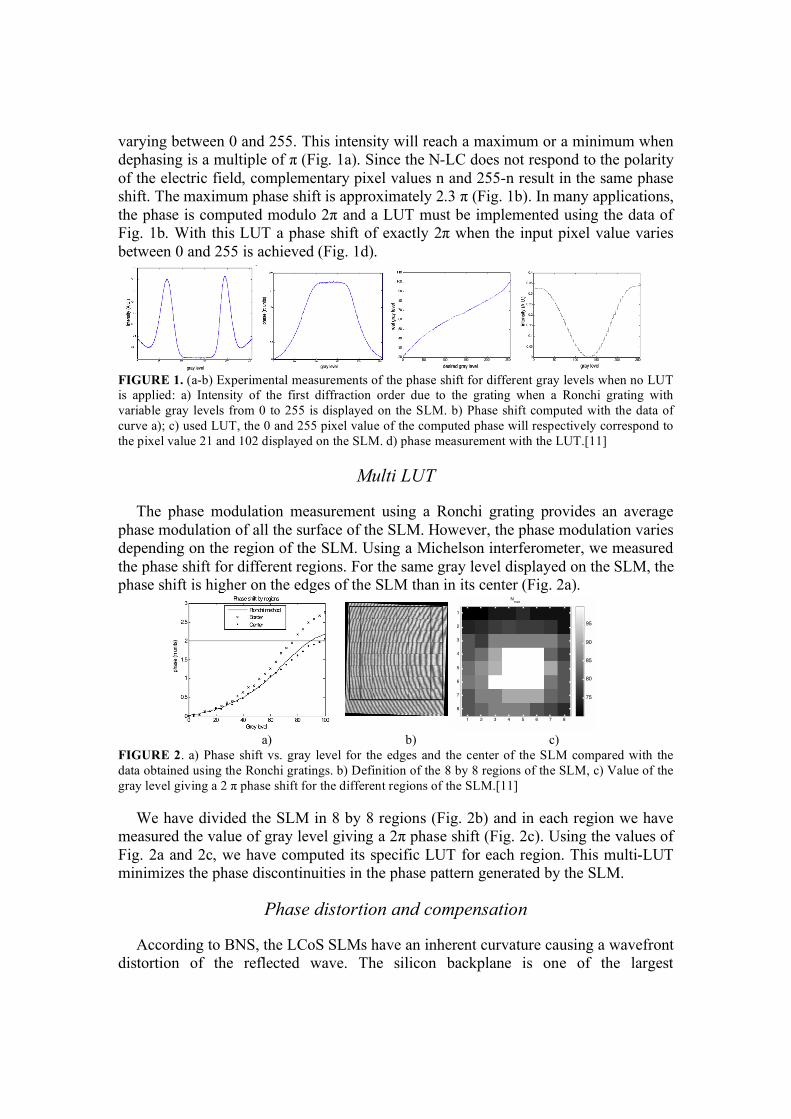
According to BNS, the LCoS SLMs have an inherent curvature causing a wavefront
distortion of the reflected wave. The silicon backplane is one of the largest
contributors to the curvature of an SLM but the liquid crystal also contributes to the
reflected wavefront distortion. We used a Michelson interferometer for measuring the
reflected wavefront distortion of the SLM. Knowing the Zernike coefficients of the
distorted wavefront, the wavefront that must be added to the SLM to compensate the
distortions can be computed (Fig. 3a). The compensation reduces the wavefront
distortion from approximately 3.8 to only /4 (Fig. 3 b-e).
a) b) c) d) e)
FIGURE 3. a) Wavefront used to compensate the distortions of the SLM (phase in units); (b-c)
Wavefront with no distortion compensation: b) with no tilt, c) with the mirror tilted; (d-e) Wavefront
with the distortion compensation d) with no tilt e) with the mirror tilted in the X direction [11].
Speed characterization
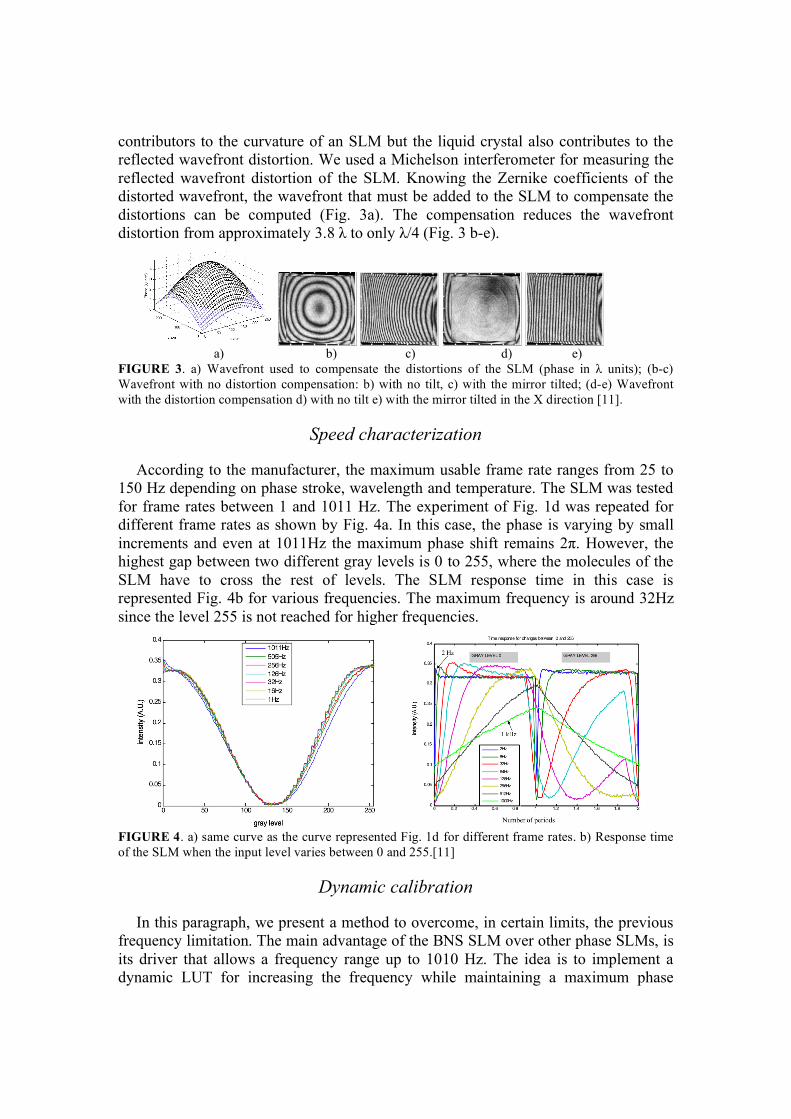
According to the manufacturer, the maximum usable frame rate ranges from 25 to
150 Hz depending on phase stroke, wavelength and temperature. The SLM was tested
for frame rates between 1 and 1011 Hz. The experiment of Fig. 1d was repeated for
different frame rates as shown by Fig. 4a. In this case, the phase is varying by small
increments and even at 1011Hz the maximum phase shift remains 2 . However, the
highest gap between two different gray levels is 0 to 255, where the molecules of the
SLM have to cross the rest of levels. The SLM response time in this case is
represented Fig. 4b for various frequencies. The maximum frequency is around 32Hz
since the level 255 is not reached for higher frequencies.
FIGURE 4. a) same curve as the curve represented Fig. 1d for different frame rates. b) Response time
of the SLM when the input level varies between 0 and 255.[11]
Dynamic calibration
In this paragraph, we present a method to overcome, in certain limits, the previous
frequency limitation. The main advantage of the BNS SLM over other phase SLMs, is
its driver that allows a frequency range up to 1010 Hz. The idea is to implement a
dynamic LUT for increasing the frequency while maintaining a maximum phase
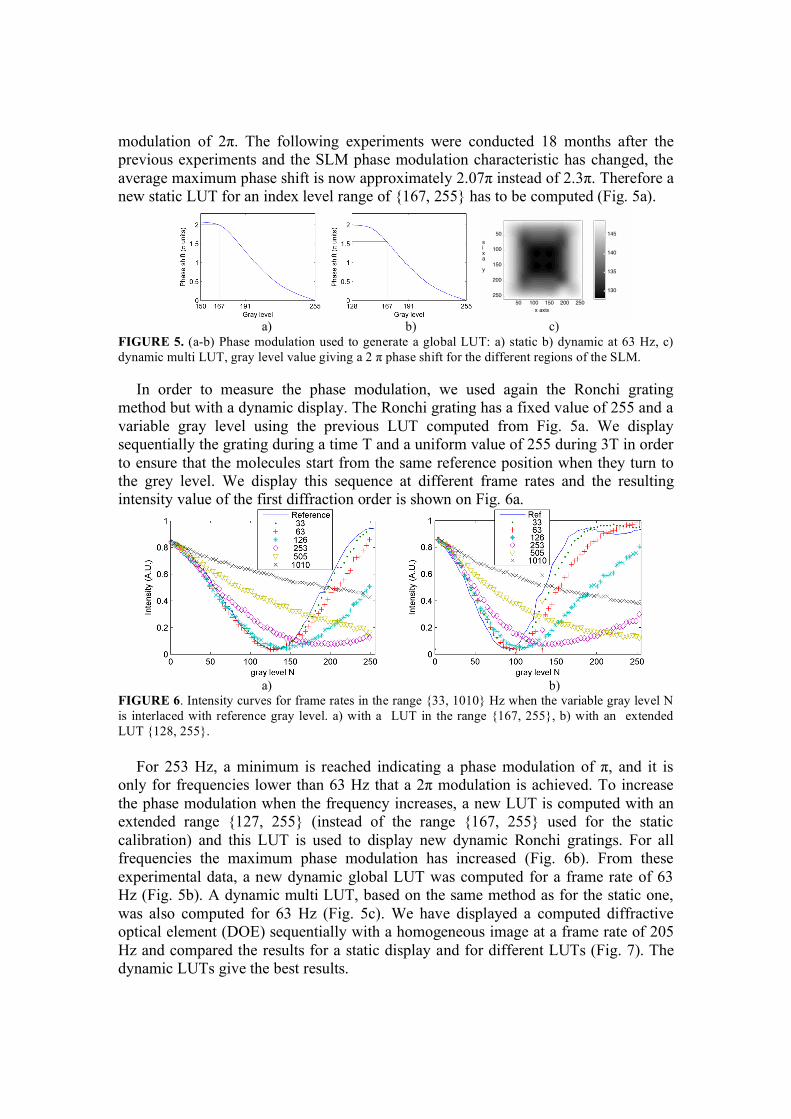
modulation of 2 . The following experiments were conducted 18 months after the
previous experiments and the SLM phase modulation characteristic has changed, the
average maximum phase shift is now approximately 2.07 instead of 2.3 . Therefore a
new static LUT for an index level range of {167, 255} has to be computed (Fig. 5a).
x axis
y axis
50 100 150 200 250
50
100
150
200
250130
135
140
145
a) b) c)
FIGURE 5. (a-b) Phase modulation used to generate a global LUT: a) static b) dynamic at 63 Hz, c)
dynamic multi LUT, gray level value giving a 2 phase shift for the different regions of the SLM.
In order to measure the phase modulation, we used again the Ronchi grating
method but with a dynamic display. The Ronchi grating has a fixed value of 255 and a
variable gray level using the previous LUT computed from Fig. 5a. We display
sequentially the grating during a time T and a uniform value of 255 during 3T in order
to ensure that the molecules start from the same reference position when they turn to
the grey level. We display this sequence at different frame rates and the resulting
intensity value of the first diffraction order is shown on Fig. 6a.
a) b)
FIGURE 6. Intensity curves for frame rates in the range {33, 1010} Hz when the variable gray level N
is interlaced with reference gray level. a) with a LUT in the range {167, 255}, b) with an extended
LUT {128, 255}.
For 253 Hz, a minimum is reached indicating a phase modulation of , and it is
only for frequencies lower than 63 Hz that a 2 modulation is achieved. To increase
the phase modulation when the frequency increases, a new LUT is computed with an
extended range {127, 255} (instead of the range {167, 255} used for the static
calibration) and this LUT is used to display new dynamic Ronchi gratings. For all
frequencies the maximum phase modulation has increased (Fig. 6b). From these
experimental data, a new dynamic global LUT was computed for a frame rate of 63
Hz (Fig. 5b). A dynamic multi LUT, based on the same method as for the static one,
was also computed for 63 Hz (Fig. 5c). We have displayed a computed diffractive
optical element (DOE) sequentially with a homogeneous image at a frame rate of 205
Hz and compared the results for a static display and for different LUTs (Fig. 7). The
dynamic LUTs give the best results.
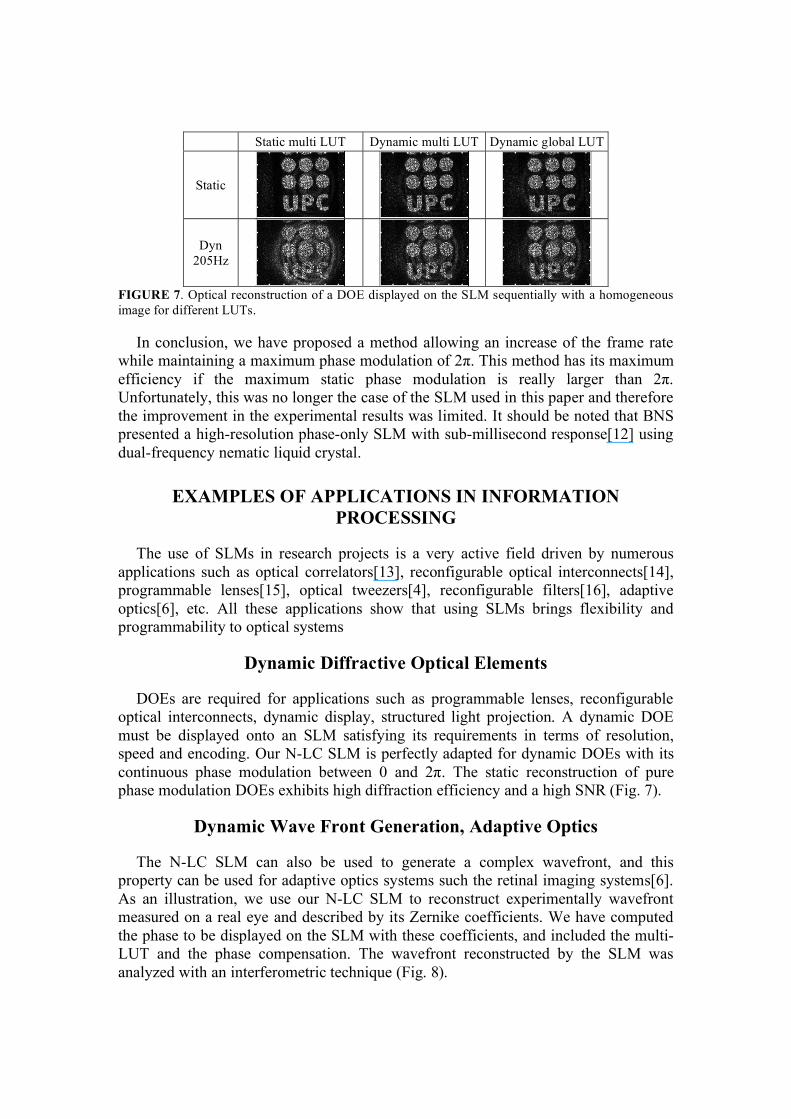
Static multi LUT Dynamic multi LUT Dynamic global LUT
Static
Dyn
205Hz
FIGURE 7. Optical reconstruction of a DOE displayed on the SLM sequentially with a homogeneous
image for different LUTs.
In conclusion, we have proposed a method allowing an increase of the frame rate
while maintaining a maximum phase modulation of 2 . This method has its maximum
efficiency if the maximum static phase modulation is really larger than 2 .
Unfortunately, this was no longer the case of the SLM used in this paper and therefore
the improvement in the experimental results was limited. It should be noted that BNS
presented a high-resolution phase-only SLM with sub-millisecond response[12] using
dual-frequency nematic liquid crystal.
EXAMPLES OF APPLICATIONS IN INFORMATION
PROCESSING
The use of SLMs in research projects is a very active field driven by numerous
applications such as optical correlators[13], reconfigurable optical interconnects[14],
programmable lenses[15], optical tweezers[4], reconfigurable filters[16], adaptive
optics[6], etc. All these applications show that using SLMs brings flexibility and
programmability to optical systems
Dynamic Diffractive Optical Elements
DOEs are required for applications such as programmable lenses, reconfigurable
optical interconnects, dynamic display, structured light projection. A dynamic DOE
must be displayed onto an SLM satisfying its requirements in terms of resolution,
speed and encoding. Our N-LC SLM is perfectly adapted for dynamic DOEs with its
continuous phase modulation between 0 and 2 . The static reconstruction of pure
phase modulation DOEs exhibits high diffraction efficiency and a high SNR (Fig. 7).
Dynamic Wave Front Generation, Adaptive Optics
The N-LC SLM can also be used to generate a complex wavefront, and this
property can be used for adaptive optics systems such the retinal imaging systems[6].
As an illustration, we use our N-LC SLM to reconstruct experimentally wavefront
measured on a real eye and described by its Zernike coefficients. We have computed
the phase to be displayed on the SLM with these coefficients, and included the multi-
LUT and the phase compensation. The wavefront reconstructed by the SLM was
analyzed with an interferometric technique (Fig. 8).
a) b)
FIGURE 8. a) The simulated wavefront represented as sin( (x, y)), b) the captured image.[11]
Polarimetric Imaging
Imaging polarimetry through evaluation of the degree of polarization of light can
give much information about complex scenes. A classic optical set-up usually consists
in using a rotating polarizer or a tunable phase modulator as a polarization state
analyzer, however the frame rate of these systems reaches a maximum of 50 Hz. To
overcome this limit, we have implemented an imaging polarimeter using the analog
FLC SLM, described earlier, that can operate at 1kHz[17]. The polarimeter will be
mainly limited by the speed of the camera. This system will determine the degree of
polarization (DOP). Polarization of a light wave can be fully described by four
parameters known as the Stokes polarization parameters or Stokes vector. S0 is the
total intensity of the optical field and S1, S2 and S3 describe the polarization state. In
order to quantify partial polarization, the DOP is used[18]. It can be defined as:
DOP =IPolITot
=S12
+ S22
+ S32
S0 (1)
For a linearly polarized beam under normal incidence, when the materials in the
scene do not exhibit birefringence or dichroism, estimating the DOP consists in
calculating a simplified degree of linear polarization. This operation only requires an
intensity measurement in two crossed polarization directions[19] because in this
particular case, Stokes parameters S2 and S3 are zero. Therefore the expression of the
DOP can be simplified into:
DOP =S1S0
=I // I
I // + I (2)
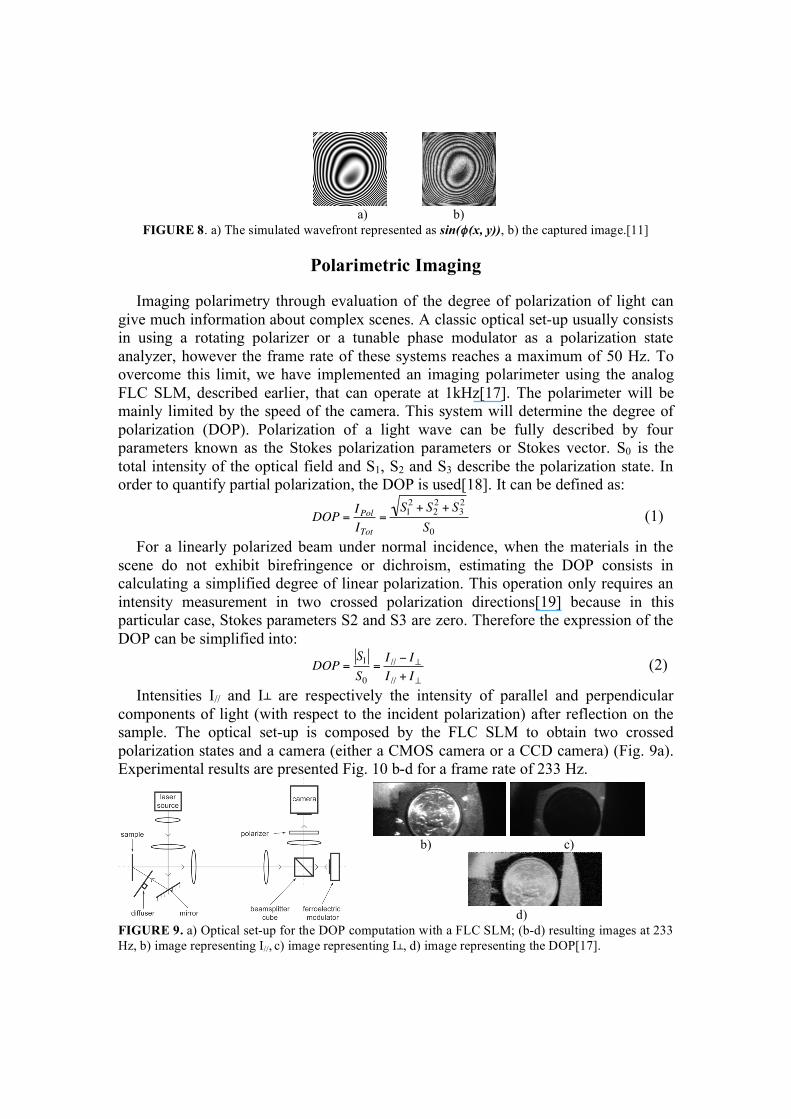
Intensities I// and I are respectively the intensity of parallel and perpendicular
components of light (with respect to the incident polarization) after reflection on the
sample. The optical set-up is composed by the FLC SLM to obtain two crossed
polarization states and a camera (either a CMOS camera or a CCD camera) (Fig. 9a).
Experimental results are presented Fig. 10 b-d for a frame rate of 233 Hz.
FIGURE 9. a) Optical set-up for the DOP computation with a FLC SLM; (b-d) resulting images at 233
Hz, b) image representing I//, c) image representing I , d) image representing the DOP[17].
b) c)
d)
CONCLUSION
An analog FLC SLM with a pure amplitude modulation and a N-LC SLM with a
pure phase modulation were characterized and calibrated. It is possible to compensate
the N-LC SLM for the phase distortions and a new method for increasing the frame
rate of this SLM while maintaining a maximum phase modulation of 2 was
demonstrated. Some practical applications in information processing have illustrated
the large potential of these SLMs.
ACKNOWLEDGMENTS
This research was partly supported by CNRS, Dépt. STIC (EPML 8) and by the
European project INTERREG III Rhenaphotonics. María S. Millán and Joaquín Otón
acknowledge the financial suport of the the Spanish Ministerio de Educación y
Ciencia and FEDER funds (project Ref. No. DPI2006-05479)
REFERENCES
1. BNS, "Boulder Nonlinear Systems, Inc; Products", http://www.bnonlinear.com (2004).
2. L. Bigué, L. Jourdainne, and P. Ambs, "High speed ferroelectric gray-scale spatial light modulator
for implementing diffractive optical elements", in Diffractive Optics and Micro-Optics, edited by R.
Magnusson, OSA Vol. TOPS 75, pp. 58-62, 2002.
3. Hamamatsu, "Hamamatsu PAL-SLM Product", http://www.hamamatsu.com (2003).
4. R.L. Eriksen, V.R. Daria, and J. Glückstad, Opt. Express 10, 597-603 (2002).
5. V. Bagnoud and J. Zuegel, Opt. Lett. 29, 295-297 (2004).
6. P.M. Prieto, E.J. Fernández, S. Manzanera et al., Opt. Express 12, 4059-4071 (2004).
7. Holoeye, "HOLOEYE Photonics AG & HOLOEYE Corporation", http://www.holoeye.com/ (2007).
8. J.L. Harriman, A. Linnenberger, and S.A. Serati, "Improving spatial light modulator performance
through phase compensation", in Advanced Wavefront Control: Methods, Devices, and Applications
II, edited by J. D. Gonglewski et al., SPIE Vol. 5553, pp. 58-67, 2004.
9. X. Xun and R.W. Cohn, Appl. Opt. 43, 6400-6406 (2004).
10. Z. Zhang, G. Lu, and F.T.S. Yu, Opt. Eng. 33, 3018-3022 (1994).
11. J. Oton Pérez and P. Ambs, "Characterization and applications of a pure phase reflective liquid
crystal spatial light modulator", in Seventh International Conference on Correlation Optics, edited
by O. V. Angelsky, SPIE Vol. 6254, pp. 10.1117/1112.679921, 2005.
12. S. Serati, X. Xia, O. Mughal et al., "High-resolution phase-only spatial light modulators with
submillisecond response", in Optical Pattern Recognition XIV, edited by D. P. Casasent et al., SPIE
Vol. 5103, pp. 138-145, 2003.
13. T. Ewing, S.A. Serati, and K. Bauchert, "Optical correlator using four kilohertz analog spatial light
modulators", in Optical Pattern Recognition XV, edited by D. P. Casasent et al., SPIE Vol. 5437, pp.
123-133, 2004.
14. D.C. O'Brien, G.E. Faulkner, T.D. Wilkinson et al., Appl. Opt. 43, 3297-3305 (2004).
15. M. Yzuel, J. Campos, A. Marquez et al., Appl. Opt. 39, 6034-6039 (2000).
16. J. Campos, A. Marquez, M. Yzuel et al., Appl. Opt. 39, 5965-5970 (2000).
17. A. Jaulin, L. Bigué, and P. Ambs, "Implementation of a high-speed imaging polarimeter using a
liquid crystal ferroelectric modulator", in Optical Sensing II, edited by B. Culshaw et al., SPIE Vol.
6189, pp. 618912, 2006.
18. D. Goldstein, Polarized light, Second edition ed. New-York Basel, Marcel Dekker, 2003.
19. M. Alouini, F. Goudail, P. Refregier et al., "Multispectral polarimetric imaging with coherent
illumination: towards higher image contrast", in Polarization: Measurement, Analysis, and Remote
Sensing VI, edited by D. H. Goldstein et al., SPIE Vol. 5432, pp. 133-144, 2004.