spanning trees and bootstrap reliability estimation in correlation-based networks
TRANSCRIPT

arX
iv:p
hysi
cs/0
6051
16v1
[ph
ysic
s.so
c-ph
] 1
5 M
ay 2
006
Spanning Trees and bootstrap reliability estimation in correlation
based networks
Michele Tumminello,1 Claudia Coronnello,1 Fabrizio
Lillo,1, 2, 3 Salvatore Micciche,1, 3 and Rosario N. Mantegna1, 3
1Dipartimento di Fisica e Tecnologie Relative,
Universita di Palermo, Viale delle Scienze, I-90128 Palermo, Italy
2Santa Fe Institute, 1399 Hyde Park Road, Santa Fe, NM 87501, U.S.A.
3Istituto Nazionale di Fisica Nucleare, Sezione di Catania, Catania, Italy
(Dated: February 2, 2008)
Abstract
We introduce a new technique to associate a spanning tree to the average linkage cluster analysis.
We term this tree as the Average Linkage Minimum Spanning Tree. We also introduce a technique
to associate a value of reliability to links of correlation based graphs by using bootstrap replicas
of data. Both techniques are applied to the portfolio of the 300 most capitalized stocks traded at
New York Stock Exchange during the time period 2001-2003. We show that the Average Linkage
Minimum Spanning Tree recognizes economic sectors and sub-sectors as communities in the network
slightly better than the Minimum Spanning Tree does. We also show that the average reliability
of links in the Minimum Spanning Tree is slightly greater than the average reliability of links in
the Average Linkage Minimum Spanning Tree.
1
I. INTRODUCTION
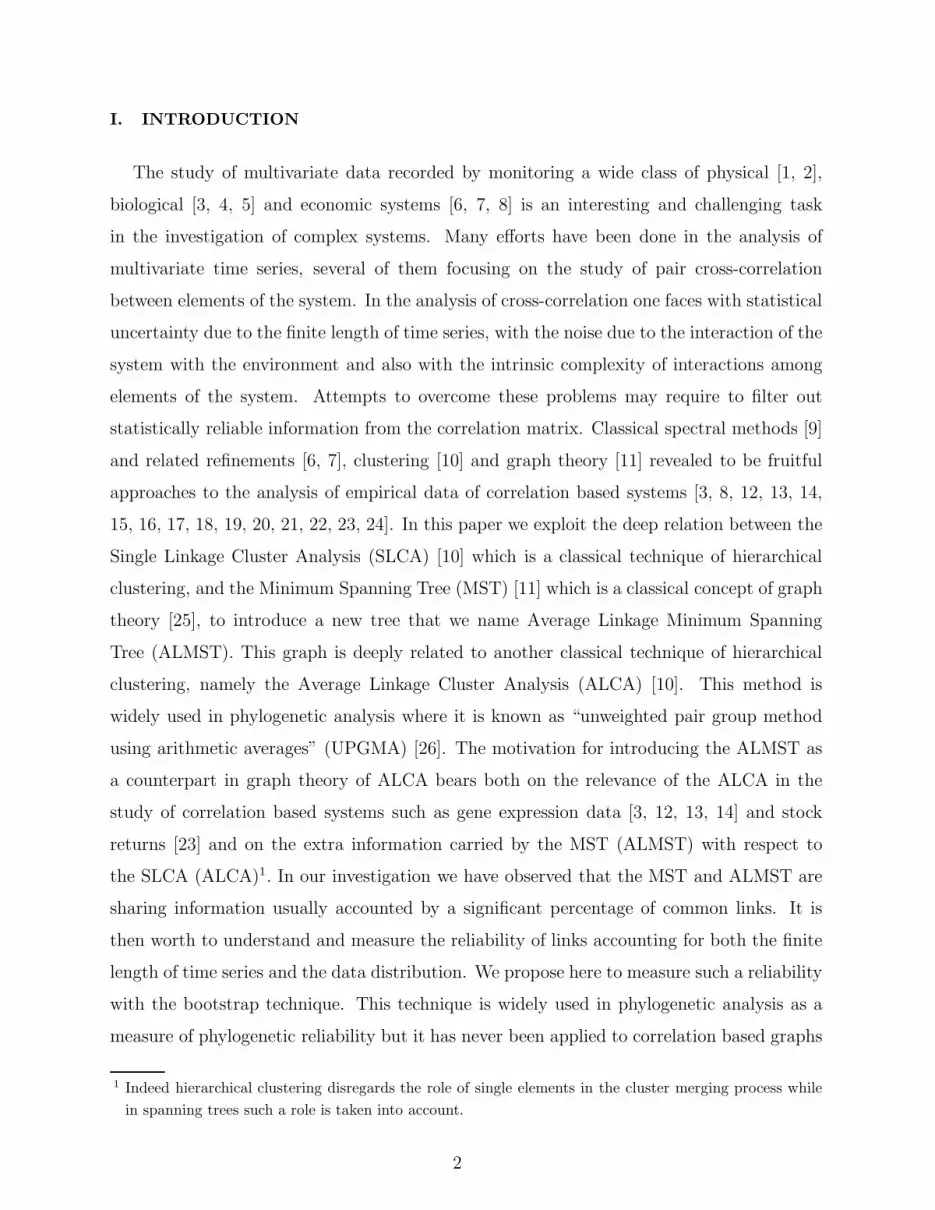
The study of multivariate data recorded by monitoring a wide class of physical [1, 2],
biological [3, 4, 5] and economic systems [6, 7, 8] is an interesting and challenging task
in the investigation of complex systems. Many efforts have been done in the analysis of
multivariate time series, several of them focusing on the study of pair cross-correlation
between elements of the system. In the analysis of cross-correlation one faces with statistical
uncertainty due to the finite length of time series, with the noise due to the interaction of the
system with the environment and also with the intrinsic complexity of interactions among
elements of the system. Attempts to overcome these problems may require to filter out
statistically reliable information from the correlation matrix. Classical spectral methods [9]
and related refinements [6, 7], clustering [10] and graph theory [11] revealed to be fruitful
approaches to the analysis of empirical data of correlation based systems [3, 8, 12, 13, 14,
15, 16, 17, 18, 19, 20, 21, 22, 23, 24]. In this paper we exploit the deep relation between the
Single Linkage Cluster Analysis (SLCA) [10] which is a classical technique of hierarchical
clustering, and the Minimum Spanning Tree (MST) [11] which is a classical concept of graph
theory [25], to introduce a new tree that we name Average Linkage Minimum Spanning
Tree (ALMST). This graph is deeply related to another classical technique of hierarchical
clustering, namely the Average Linkage Cluster Analysis (ALCA) [10]. This method is
widely used in phylogenetic analysis where it is known as “unweighted pair group method
using arithmetic averages” (UPGMA) [26]. The motivation for introducing the ALMST as
a counterpart in graph theory of ALCA bears both on the relevance of the ALCA in the
study of correlation based systems such as gene expression data [3, 12, 13, 14] and stock
returns [23] and on the extra information carried by the MST (ALMST) with respect to
the SLCA (ALCA)1. In our investigation we have observed that the MST and ALMST are
sharing information usually accounted by a significant percentage of common links. It is
then worth to understand and measure the reliability of links accounting for both the finite
length of time series and the data distribution. We propose here to measure such a reliability
with the bootstrap technique. This technique is widely used in phylogenetic analysis as a
measure of phylogenetic reliability but it has never been applied to correlation based graphs
1 Indeed hierarchical clustering disregards the role of single elements in the cluster merging process while
in spanning trees such a role is taken into account.
2

to our knowledge. Striking advantages of the bootstrap approach to test the link reliability
are (i) that it does not need to introduce assumptions about the data distribution and (ii)
that it naturally takes into account the length of time series. The only disadvantage that
we can recognize is that the procedure is rather computationally time consuming for large
networks.
The paper is organized as follows. In section II we review some of the most popular tools
used to filter out information in correlation based systems. In section III we discuss both
the construction of ALMST and the bootstrap approach we introduce to measure the link
reliability. In section IV we apply the tools introduced in section III to daily price returns
of the 300 most capitalized stocks traded at New York Stock Exchange (NYSE) during the
time period 2001-2003. Finally in section V we draw our conclusions.
II. FILTERING INFORMATION FROM CORRELATION MATRICES
In the introduction we have briefly discussed the necessity of filtering robust information
in correlation based systems. The tools used to extract such an information can be
divided essentially in three branches, specifically spectral methods, clustering methods and
correlation based graphs.
Spectral methods are used to deal with multivariate systems since the beginning of 20th
century. The most famous technique is the Principal Component Analysis (PCA) [9]. The
idea behind PCA is to evaluate eigenvalues of the correlation matrix of the system, retain
the k greatest eigenvalues and project the empirical multivariate signal onto the sub-space
generated by the corresponding k eigenvectors. This approach allows one to reduce the com-
plexity of the system. Indeed by indicating with n the dimensionality of the system, usually
k ≪ n. At the same time, taking the first k eigenvalues guarantees that the percentage of
variance explained by the k eigenvectors is the maximum value allowed by a k mode projec-
tion of the data set [9]. Finally, a factor model [9] explaining the filtered correlation matrix
can be constructed. The factor model allows one to simulate multivariate time series of ar-
bitrary length T such that, when T approaches infinity, the correlation matrix of simulated
time series approaches exactly the correlation matrix filtered by PCA. A problematic aspect
of PCA is that the number k of retained eigenvalues is a free parameter of the method. The
3

Random Matrix Theory gives the spectral distribution of the correlation matrix obtained
from n time series of length T of independent Gaussian variables asymptotically over T and
n with fixed ratio T/n > 1 [27, 28, 29]. The Random Matrix Theory indicates the maximum
eigenvalue λmax consistent with the hypothesis of independent random variables. This result
can be applied to empirical correlation matrices to select the number k of retained eigenval-
ues. All the eigenvalues greater than λmax should be retained [6, 7, 30]. Such an approach
has been fruitfully applied to the analysis of financial markets [6, 7]. The main findings
relate to the interpretation of retained eigenvalues and corresponding eigenvectors. Usually
the eigenvector associated to the greatest eigenvalue has components roughly degenerate,
meaning that all stocks participate almost in the same way to the first eigenvalue. This fact
suggested to interpret the first eigenvector as the so called “market mode” [6, 7, 30]. Other
eigenvalues beside the greatest one resulted to be incompatible with the hypothesis of inde-
pendent variables. Usually the corresponding eigenvectors have many near-zero components
and then they should reveal communities of stocks in the market. Such communities involve
stocks belonging to one or a few economic sectors [31].
Clustering techniques are used to reveal communities of elements in correlation based
systems. The idea is that elements belonging to the same community share more informa-
tion than elements belonging to different communities. The shared information is evaluated
in terms of a similarity measure such as, for example, the correlation coefficient. The aim of
clustering is to group together similar elements to get a significant partition of the system
into communities (clusters). For a review of the most used techniques see for instance
ref. [10]. Newer techniques are for instance the superparamegnetic clustering of data
[32], which has been applied to financial data in Ref. [33], the maximum likelihood data
clustering [34], the sorting points into neighborhoods [35]. Clustering procedures can also
be used to identify a skeleton of interactions in the system. This is provided for instance by
hierarchical clustering procedures in which communities are overlapping. Specifically, they
are organized in a nested hierarchical structure [10, 36]. The idea of hierarchical clustering
is that elements are sharing information according to the communities they belong to and
communities are organized in a nested structure. We shall clarify this point with a simple
example of nested communities. Consider two very important corporations like Microsoft
Corp. and Intel Corp.. According to a standard economic classification both stocks belong
to the economic sector of Technology, i.e. they belong to the same community at the level
4

of economic sector. Further specification of the activity of stocks is possible. Microsoft
Corp. is belonging to the economic sub-sector of “Software & Programming” whereas Intel
Corp. is belonging to the economic sub-sector of “Semiconductors”. This means that at
the hierarchical level of sub-sectors Microsoft Corp. and Intel Corp. belong to different
communities.
In this paper we shall concentrate on two hierarchical clustering techniques, i.e. the SLCA
and the ALCA. The SLCA has been widely used to analyze the correlation between stocks
in financial markets since the study of ref. [8]. Such an approach revealed that stocks
belonging to specific economic sectors (e.g. the sector of Energy) cluster together at a high
correlation level whereas stocks belonging to sectors such as Conglomerates never identify
a community. Intermediate behavior has also been observed [8, 23]. The ALCA is widely
used in the analysis of microarray data [12]. In the study of multivariate biological systems
this clustering procedure is usually preferred to other classical techniques of hierarchical
clustering because of its property of averaging interactions. It has also been shown in ref.
[23] that a comparative usage of SLCA, ALCA and Random Matrix Theory is suitable for
the investigation of financial markets.
Graph theory is now widely used in the analysis of complex systems. Many physical,
biological and social systems are suitably described by networks. Examples are Internet
[37, 38, 39, 40, 41], social networks [42, 43], food webs [44], scientific citations [45] and
sexual contacts among individuals [46].
Graph theory is also useful to extract information in correlation based systems. Consider a
system of n elements. The pair correlation coefficient between elements can be interpreted
as the strength of the link connecting pairs of elements. In other words the system can
be described by a complete network, i.e. a network of elements all connected one with
each other, with weights associated to links according to the correlation coefficients. The
topological structure of such a network is so simple (complete graph) that no information
can be directly extracted from the topology. The idea is then to extract a subgraph from the
complete network accounting for the weights of links. This procedure aims to translate the
information contained in the correlation matrix of the system into the topological structure
of the subgraph and then exploiting techniques of graph theory [11, 47, 48] to analyze such
an information.
5

A widely used subgraph of the complete network is the MST which is the spanning tree
of shortest length [11]. A discussion about the properties of the MST and an illustrative
algorithm for its construction is given in section III. It is known [25] that the MST is
deeply related to the SLCA (see next section). The number of links retained in the MST
is n − 1 for a system of n elements and the tree is a connected graph. It has been shown
that the MST is a powerful method to investigate financial systems [8]. In ref. [15] the
MST has been used to analyze the system of the 100 most capitalized stocks traded in
US equity markets. The aim of such a study was to understand how the structure of the
correlation matrix changes when stock returns are evaluated at different time horizons. The
result is that at short time horizons (5 min) the MST has a star like shape, the center of
the star being the most capitalized stock of the system, i.e General Electric. When the
time horizon is increased the star-like shape progressively disappears and branches of stocks
mostly corresponding to specific economic sectors appear. These results suggest that at
short time horizons the system is dominated by the “market mode”, whereas at longer time
horizons the information about economic sectors becomes relevant. Another interesting
result obtained by investigating the MST properties is related to the behavior of the market
in proximity of a crash, such as the Black Monday, where a topological change of the tree is
observed [18, 20].
A generalization of the MST construction procedure relaxing the topological constraint that
the resulting graph is a tree has been proposed in ref. [24]. The first level of generalization
requires that the resulting graph is topologically planar, i.e. the graph can be drawn on a
plane without crossing of links. Such a graph, named Planar Maximally Filtered Graph,
allows topological structures forbidden in the MST such as loops and cliques [11] that can
be relevant for the analysis of correlation based systems. Specifically, the introduction of the
“connection strength” [24, 49] allows one to estimate the strength of connections of elements
belonging to the same community and to investigate the structure of connections between
communities such as, for example, stocks belonging to the same economic sector [23, 24].
Another way to construct a subgraph from the complete network is to introduce a
correlation threshold and then to remove those links with a correlation coefficient smaller
than the threshold. Despite of its simplicity this method has shown to be useful in
the study of economic [22] and biological [50] systems. In ref. [22] authors study how
graph changes when one reduces the value of the correlation threshold. The results
6
of such an analysis are compared with those obtained for random graphs. One of the
main results is that the formation of connected components in the empirical graph is
incompatible with the corresponding formation in random graphs. A characteristic of
this approach is that it is highly improbable to obtain a filtered network connecting all
elements via some path by retaining a number of links of the same order of the number n
of elements. Then with a number of links of order n it is rather difficult to describe interac-
tions between any pair of elements of the system because the resulting graph is disconnected.
III. NEW METHODS IN CORRELATION BASED NETWORKS
In subsection IIIA we outline the algorithm producing the ALMST whereas in subsection
IIIB we describe the measure of link reliability obtained by exploiting bootstrap replicas of
data.
A. Average Linkage Minimum Spanning Tree
In order to show how it is possible to associate a spanning tree to the ALCA it is useful
to consider first an algorithm that generates the MST and performs at the same time the
SLCA of the system. Consider a system of n elements with estimated correlation matrix C
of elements ρij . To describe the algorithm it is necessary to recall the concept of connected
component of a graph g containing a given vertex i. The connected component of g con-
taining the vertex i is the maximal set of vertices Si (with i included) such that there exists
a path in g between all pairs of vertices belonging to Si. When the element i has no links
to other vertices then Si reduces just to the element i. The starting point of the procedure
is an empty graph g with n vertices. The algorithm can be summarized in 6 steps:
(i) Set Q as the matrix of elements qij such that Q = C.
(ii) Select the maximum correlation qhk between elements belonging to different connected
components Sh and Sk in g 2.
(iii) Find elements u, p such that ρup = Max {ρij , ∀i ∈ Sh and ∀j ∈ Sk}
2 At the first step of the algorithm connected components in g are coinciding with single vertices.
7

(iv) Add to g the link between elements u and p with weight ρup. Once the link is added
to g, u and p will belong to the same connected component S = Sh
⋃
Sk.
(v) Redefine the matrix Q:
qij = qhk, if i ∈ Sh and j ∈ Sk
qij = Max {qpt, p ∈ S and t ∈ Sj , with Sj 6= S} , if i ∈ S and j ∈ Sj
qij = qij , otherwise;
(1)
(vi) If g is still a disconnected graph then go to step (ii) else stop.
The resulting graph g is the MST of the system and the matrix Q results to be the correlation
matrix associated to the SLCA. Specifically the matrix D< of elements d<ij =
√
2 (1 − qij)
is the subdominant ultrametric distance matrix of the system [51, 52]. The presented
algorithm is not the most popular or the simplest algorithm for the construction of the MST
but it clearly reveals the relation between SLCA and MST. Indeed connected components
progressively merging together during the construction of g are nothing else but clusters
progressively merging together in the SLCA.
By replacing eq. (1) with
qij = qhk, if i ∈ Sh and j ∈ Sk
qij = Mean {qpt, p ∈ S and t ∈ Sj , with Sj 6= S} , if i ∈ S and j ∈ Sj
qij = qij , otherwise;
(2)
in the step (v) of the above procedure one obtains an algorithm performing the ALCA, being
Q the correspondent correlation matrix. The resulting tree g that we call ALMST is the
tree associated to such a clustering procedure.
The choice of the link at step (iii) of the ALMST construction algorithm does not affect the
clustering procedure. More precisely by selecting any link between nodes u ∈ Sh and p ∈ Sk
the matrix Q representing the result of ALCA remains the same. This degeneracy allows
one to consider different rules to select the link between elements u and p at the step (iii)
of the construction protocol. Different rules at step (iii) give rise to different correlation
based trees. The same observation holds true for the algorithm that generates the MST.
This fact implies that in principle one can consider spanning trees which are different from
8
the MST and are still associated with the SLCA. However, it is worth recalling that the
MST is unique in the sense that it is the spanning tree of shortest length [11].
B. The bootstrap value as a measure of link reliability
The bootstrap technique invented by Efron (1979) [53] is widely used in phylogenetic
analysis since the paper by Felsestein (1985) [54] as a phylogenetic hierarchical tree evalua-
tion method (see for instance [55]). The basic idea behind the technique is simple. Consider
a system of n elements and suppose to collect data in a matrix X with n columns and T
rows. T is the number of collected samples, e.g. the length of time series. The process is
assumed to be stationary. The correlation matrix C of the system is estimated from the ma-
trix X by evaluating the pair correlation coefficient. By applying the procedures described
in the previous subsection to C one can construct the MST and ALMST of the system. The
bootstrap technique requires to construct a number r of replicas X∗
i , i ∈ 1, ..., r of the data
matrix X. Usually in phylogenetic analysis r = 1000 is considered a sufficient number of
replicas. Each replica X∗
i is constructed by randomly selecting T rows from the matrix X
allowing repetitions. This procedure implies that some rows of the original data matrix are
included in the replica more then once whereas other rows are missed in the replica. For each
replica X∗
i the correlation matrix is evaluated and the MST and ALMST are extracted. The
result is a collection of MSTs {MST ∗
1 , ..., MST ∗
r } and ALMSTs {ALMST ∗
1 , ..., ALMST ∗
r }.To associate the so called bootstrap value to a link of the original MST (ALMST) one eval-
uates the number of MST ∗
i (ALMST ∗
i ) in which the link is appearing and normalizes such
a number with the total number of replicas, e.g. r = 1000. The bootstrap value gives
information about the reliability of each link of a graph.
It is to note first that the bootstrap approach does not require the knowledge of the data
distribution and then it is particularly useful to deal with high dimensional systems where
it is difficult to infer the joint probability distribution from data. Second, the average of
bootstrap values in a graph can be considered as a global measure of the reliability of the
graph itself and then can be used to compare different filtered graphs. In case of normally
distributed random variables the error associated to the correlation coefficient ρ roughly
scales like (1 − ρ2)/√
T . One might then be tempted to expect that the higher is the cor-
relation associated to a link in a correlation based network the higher is the reliability of
9

the link. We shall show in the following section that such a conjecture cannot explain em-
pirical results for the system of stock returns we consider. Finally the graph weighted with
bootstrap values can be helpful in the search for significant communities in the system.
IV. EMPIRICAL ANALYSIS
We perform an empirical investigation by considering the 300 most capitalized stocks
traded at NYSE during the time period 2001-2003. We consider the capitalization of stocks
at December 2003. The return time series are sampled at daily time horizon by computing
the logarithm of the ratio of closure to open price and the series length is T = 748. Stocks are
classified in terms of the economic sector and sub-sector they belong to, according to the clas-
sification scheme used in the website http://finance.yahoo.com. Economic sub-sectors
are giving a further specification of the activity of firms belonging to the same economic sec-
tor. For instance, stocks belonging to the sector of Transportation are partitioned in stocks
belonging to the Railways sub-sector and in stocks belonging to the economic sub-sector of
Airlines. The total number of economic sectors involved in our set of stocks is 12 whereas
the number of sub-sectors is 78. The list of the 300 stocks considered with their economic
sector and sub-sector is available at http://lagash.dft.unipa.it/IJBC.html.
In Figs. 1 and 2 the MST and ALMST of the system are shown respectively. Links
are drawn using a grey scale with 10 levels selected according to the bootstrap value.
The bootstrap value is evaluated over r = 1000 replicas. The higher is the bootstrap
value associated to a link the darker is the line representing the link. Vertices are drawn
with different colors to highlight the economic sector each stock belongs to. Specifically
these sectors are Basic Materials (violet, 24 stocks), Consumer Cyclical (tan, 22 stocks),
Consumer Non Cyclical (yellow, 25 stocks), Energy (blue, 17 stocks), Services (cyan, 69
stocks), Financial (green, 53 stocks), Healthcare (gray, 19 stocks), Technology (red, 34
stocks), Utilities (magenta, 12 stocks), Transportation (brown, 5 stocks), Conglomerates
(orange, 8 stocks) and Capital Goods (light green, 12 stocks). For the sake of readability
of the pictures, the tick symbol is reported only for stocks with degree greater than 5 in at
least one of the graphs.
A comparison of the graphs shows a number of similarities. Indeed the 85% of links are
common to both the MST and ALMST. In fact the intra-sector structures are similar in the
10

MST and ALMST. Moreover the degree of highly connected stocks (degree greater than 5)
is similar in both graphs. There are also differences between the graphs. These differences
are mostly observed in the connections between groups of stocks of different economic
sectors. For instance the Consumer Non Cyclical economic sector shows a star like shape
with WWY as hub in both graphs but the path connecting this sector to others is different.
In the MST the sector of Consumer Non Cyclical is connected via a high reliable link to
the sector of Energy and then, following a path traversing the sectors of Services, Financial
and Conglomerates, it is connected to the Healthcare sector. Differently, in the ALMST
the sector of Consumer Non Cyclical is directly connected to the Healthcare sector and far
from the Energy sector. Also the position of the sector of Basic Materials is different in the
two graphs. Specifically in the MST this sector is two steps far from the Financial sector
whereas in the ALMST a path as long as 9 steps is necessary to connect stocks of Basic
Materials to the Financial sector.
In Fig. 3 we report the scatter plot of the bootstrap value against the correlation coeffi-
cient associated to links of both the ALMST and MST. Black circles refer to the ALMST
and open triangles refer to the MST. The figure clearly shows that the reliability of links
cannot be straightforwardly explained in terms of the correlation coefficient value associated
to links. In fact a large dispersion of points is evident, although we observe a significant pos-
itive correlation between the link bootstrap reliability and the correlation coefficient value.
Indeed we observe links associated with a quite small correlation, e.g. 0.4, having a very
high reliability in terms of the bootstrap value, e.g. 1. On the contrary some links with
correlation as high as 0.7 show a small reliability of only 0.3 in terms of the bootstrap
value. This result suggests that the strength of a link and its reliability in correlation based
networks are carrying partially different information.
In order to assess the ability of MST and ALMST in detecting communities defined in
terms of economic sectors and sub-sectors, we have counted the number of intra-sector links
and intra-subsector links in both the graphs. In the MST 223 links connect stocks of the
same economic sector and 139 links are intra-sub-sector links. In the ALMST we have
counted 227 intra-sector links and 144 intra-sub-sector links. These results suggest that
11
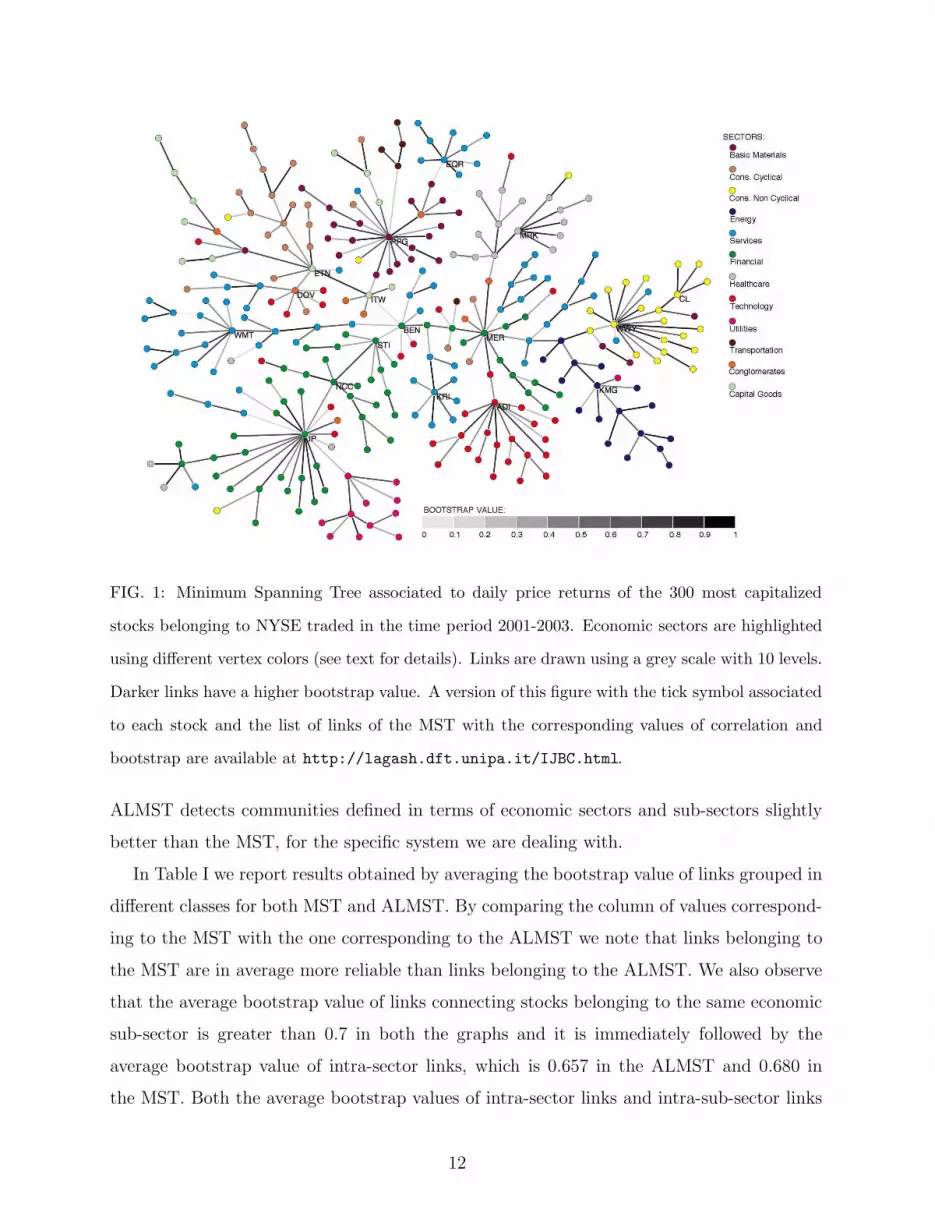
FIG. 1: Minimum Spanning Tree associated to daily price returns of the 300 most capitalized
stocks belonging to NYSE traded in the time period 2001-2003. Economic sectors are highlighted
using different vertex colors (see text for details). Links are drawn using a grey scale with 10 levels.
Darker links have a higher bootstrap value. A version of this figure with the tick symbol associated
to each stock and the list of links of the MST with the corresponding values of correlation and
bootstrap are available at http://lagash.dft.unipa.it/IJBC.html.
ALMST detects communities defined in terms of economic sectors and sub-sectors slightly
better than the MST, for the specific system we are dealing with.
In Table I we report results obtained by averaging the bootstrap value of links grouped in
different classes for both MST and ALMST. By comparing the column of values correspond-
ing to the MST with the one corresponding to the ALMST we note that links belonging to
the MST are in average more reliable than links belonging to the ALMST. We also observe
that the average bootstrap value of links connecting stocks belonging to the same economic
sub-sector is greater than 0.7 in both the graphs and it is immediately followed by the
average bootstrap value of intra-sector links, which is 0.657 in the ALMST and 0.680 in
the MST. Both the average bootstrap values of intra-sector links and intra-sub-sector links
12

FIG. 2: Average Linkage Minimum Spanning Tree associated to daily price returns of the
300 most capitalized stocks belonging to NYSE. Transactions occurred in 2001-2003 are con-
sidered. Economic sectors are highlighted using different vertex colors (see text for details).
Links are drawn using a grey scale with 10 levels. Darker links have a higher bootstrap
value. A version of this figure with the tick symbol associated to each stock and the list of
links of the ALMST with the corresponding values of correlation and bootstrap are available at
http://lagash.dft.unipa.it/IJBC.html.
TABLE I: bootstrap value averages (< bv > ±σ<bv>)
considered links ALMST MST
all links 0.602 ± 0.016 0.627 ± 0.015
intra-sector 0.657 ± 0.017 0.680 ± 0.016
inter-sector 0.426 ± 0.035 0.469 ± 0.030
intra-sub-sector 0.725 ± 0.020 0.740 ± 0.019
inter-sub-sector 0.488 ± 0.022 0.529 ± 0.020
inter-sub-sec. & intra-sec. 0.540 ± 0.026 0.582 ± 0.026
13
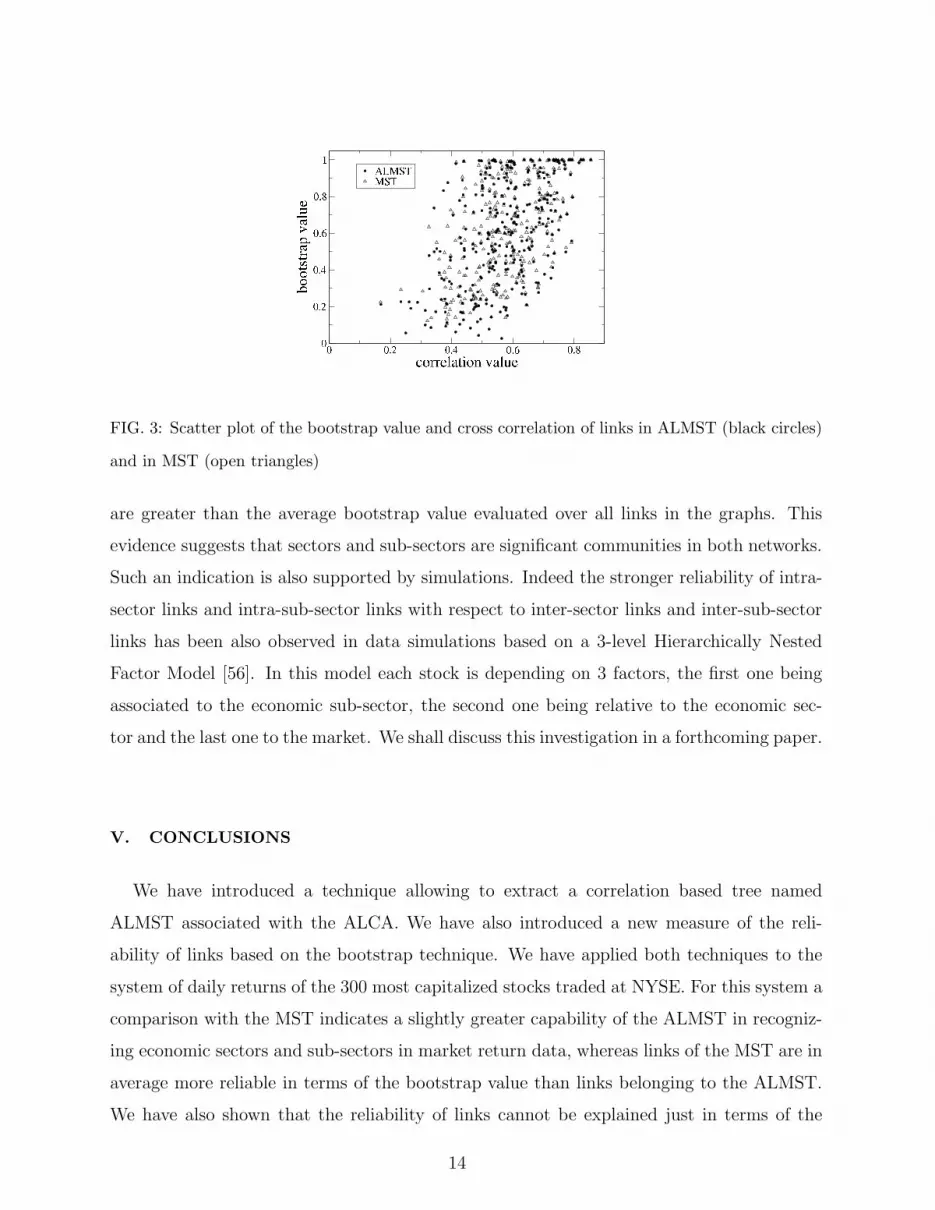
FIG. 3: Scatter plot of the bootstrap value and cross correlation of links in ALMST (black circles)
and in MST (open triangles)
are greater than the average bootstrap value evaluated over all links in the graphs. This
evidence suggests that sectors and sub-sectors are significant communities in both networks.
Such an indication is also supported by simulations. Indeed the stronger reliability of intra-
sector links and intra-sub-sector links with respect to inter-sector links and inter-sub-sector
links has been also observed in data simulations based on a 3-level Hierarchically Nested
Factor Model [56]. In this model each stock is depending on 3 factors, the first one being
associated to the economic sub-sector, the second one being relative to the economic sec-
tor and the last one to the market. We shall discuss this investigation in a forthcoming paper.
V. CONCLUSIONS
We have introduced a technique allowing to extract a correlation based tree named
ALMST associated with the ALCA. We have also introduced a new measure of the reli-
ability of links based on the bootstrap technique. We have applied both techniques to the
system of daily returns of the 300 most capitalized stocks traded at NYSE. For this system a
comparison with the MST indicates a slightly greater capability of the ALMST in recogniz-
ing economic sectors and sub-sectors in market return data, whereas links of the MST are in
average more reliable in terms of the bootstrap value than links belonging to the ALMST.
We have also shown that the reliability of links cannot be explained just in terms of the
14

strength of connections and that intra-sector and intra-sub-sector connections are in average
more reliable, with respect to the bootstrap technique, than inter-sector and inter-sub-sector
links in both MST and ALMST. Such a result suggests to interpret economic sectors and
sub-sectors as significant communities in the market.
VI. ACKNOWLEDGMENTS
Authors acknowledge support from the research project MIUR 449/97 “High frequency
dynamics in financial markets”, the research project MIUR-FIRB RBNE01CW3M “Cellular
Self-Organizing nets and chaotic nonlinear dynamics to model and control complex systems”
and from the European Union STREP project n. 012911 “Human behavior through dynam-
ics of complex social networks: an interdisciplinary approach”.
[1] Forrester, P.J., Hughes, T.D. [1994] J. Math. Phys. 35, 6736
[2] Demasure, Y., Janik, R.A. [2003] Phys. Lett. B 553, 105
[3] Holter, N.S., et al. [2000] Proc. Nat. Acad. Sci. USA 97, 8409
[4] Alter, O., Brown, P.O., Botstein, D. [2000] Proc. Nat. Acad. Sci. USA 97, 10101
[5] Holter, N.S., et al. [2001] Proc. Nat. Acad. Sci. USA 98, 1693
[6] Laloux, L., Cizeau, P., Bouchaud, J.-P., & Potters, M. [1999] Phys. Rev. Lett. 83, 1468
[7] Plerou, V., Gopikrishnan, P., Rosenow, B., Amaral, L. A. N., & Stanley, H. E. [1999] Phys.
Rev. Lett. 83, 1471
[8] Mantegna, R. N. [1999] Eur. Phys. J. B 11, 193
[9] Mardia, K. V., Kent, J. T., & Bibby, J. M. [1979] Multivariate Analysis, (Academic Press,
San Diego, CA).
[10] Anderberg, M. R. [1973] Cluster Analysis for Applications, (Academic Press, New York).
[11] West, D.B. [2001] An Introduction to Graph Theory (Prentice-Hall, Englewood Cliffs, NJ).
[12] Eisen, M.B., Spellman, P.T., Brown, P.O. & Botstein, D. [1998] Proc. Nat. Acad. Sci. USA
95, 14863-14868
[13] Alizadeh, A.A. et al. [2000] Nature 403, 503-511
[14] Ross, D.T. et al. [2000] Nat. Genet. 24, 227-235
15

[15] Bonanno, G., Lillo F. & Mantegna, R.N. [2001] Quantitative Finance 1, 96
[16] Giada, L. & Marsili, M. [2001] Phys. Rev. E 63, 061101
[17] Marsili, M. [2002] Quantitative Finance 2, 297
[18] Onnela, J.-P., Chakraborti, A., Kaski, K., & Kertesz, J. [2002] Eur. Phys. J. B 30, 285-288.
[19] Bonanno, G., Caldarelli, G., Lillo, F. & Mantegna, R.N. [2003] Phys. Rev. E 68, 046130
[20] Onnela, J.-P., Chakraborti, A., Kaski, K., Kertesz, J., & Kanto, A. [2003] Phys. Rev. E 68,
056110.
Onnela, J.-P., Chakraborti, A., Kaski, K., & Kertesz, J. [2003] Physica A 324, 247-252.
[21] Bonanno, G., Caldarelli, G., Lillo, F., Micciche, S., Vandewalle, N., & Mantegna, R.N. [2004]
Eur. Phys. J. B 38, 363-371.
[22] Onnela, J.-P., Kaski, K., & Kertesz, J. [2004] Eur. Phys. J. B 38, 353-362.
[23] Coronnello, C., Tumminello, M., Lillo, F., Micciche, S., & Mantegna, R.N. [2005] Acta Physica
Polonica B 36, no. 9, 2653-2679
[24] Tumminello, M., Aste, T., Di Matteo, T., & Mantegna R.N. [2005] Proc. Natl. Acad. Sci.
USA 102, no. 30, 10421-10426.
[25] Gower, J., C., & Ross, G., J., S. [1969] Applied Statistics 18, 54-64
[26] Sokal, R.R. & Michener, C. D. [1958] University of Kansas Scientific Bulletin 28, 1409-1438
[27] Marcenko, V. A., Pastur L.A. [1967] Math. USSR-Sb 1, 457.
[28] Silverstein J.W., Bai, Z. D. [1995] Journal of Multivariate Analysis 54, 175.
[29] Sengupta, A. N., Mitra, P. [1999] Phys. Rev. E 80, 3389
[30] Lillo, F., & Mantegna, R.N. [2005] Phys. Rev. E 72, 016219.
[31] Plerou, V., Gopikrishnan, P., Rosenow, B., Amaral, L. A. N., Guhr, T. & Stanley, H. E. [2002]
Phys. Rev. E 65, 066126.
[32] Blatt, M., Wiseman, S. & Domany E. [1996] Phys. Rev. Lett. 76, 3251-3254
[33] Kullmann, L., Kertesz, J. & Mantegna R. N. [2000] Physica A 287, 412-419.
[34] Giada, L. & Marsili, M. [2002] Physica A 315, 650-664
[35] Tsafrir, D. et. al. [2005] Bioinformatics 21, 2301-2038
[36] Simon, H.A. [1996] in The Sciences of Artificial (MIT Press, Cambridge, Massachusetts) Chap.
8, 183-216.
[37] Faloutsos, M., Faloutsos, P. & Faloutsos, C. [1999] ACM SIGCOMM ’99, Comput. Commun.
Rev. 29, 251
16

[38] Albert, R., Jeong, H. & Barabasi, A.-L. [1999] Nature 401 (6749), 130-131
[39] Yook, S. H., Jeong, H. W. & Barabasi, A.-L. [2002] Proc. Natl. Acad. Sci. USA 99, no. 21,
13382-13386
[40] Caldarelli, G., Marchetti R. & Pietronero, L. [2000] Europhysics Letters 52, 386.
[41] Pastor-Satorras, R., Vazquez A. & Vespignani, A. [2001] Phys. Rev. Lett. 87, 258701.
[42] Wassermann, S., & Faust, K. [1994] in Social Networks Analysis, Cambridge University Press,
Cambridge UK.
[43] Newman, M. E. J., Watts, D. J. & Strogatz, S. H. [2002] Proc. Natl. Acad. Sci. USA 99, 2566.
[44] Garlaschelli, D., Caldarelli, G., & Pietronero, L. [2003] Nature 423, 165-168.
[45] Redner, S. [1998] Eur. Phys. J. B 4, 131-134.
[46] Liljeros, F., Edling, C., R., Amaral, L., A., N., Stanley, H., E., & Aberg, Y. [2001] Nature
411, 907-908.
[47] Albert, R. & Barabasi, A.-L. [2002] Rev. Mod. Phys. 74, 47-97
[48] Newman, M., E., J. [2003] SIAM Review 45, 167-256.
[49] Barrat, A., Barthelemy, M., Pastor-Satorras, R., & Vespignani, A. [2004] Proc. Natl. Acad.
Sci. USA 101, no. 11, 3747-3752.
[50] Eguiluz, V. M., Chialvo, D. R., Cecchi, G. A., Baliki, M. & Apkarian, A. V. [2005] Phys. Rev.
Lett. 94, 018102
[51] Rammal, R., Toulouse G. & Virasoro, M. A. [1986] Rev. Mod. Phys. 58. 765
[52] Mantegna, R. N. & Stanley, H. E. [2000] in An Introduction to Econophysics: Correlations
and Complexity in Finance, Cambridge University Press, Cambridge UK.
[53] Efron, B. [1979] Ann. Stat. 7, 1-26.
[54] Felsenstein, J. [1985] Evolution 39, 783-791.
[55] Efron, B., Halloran, E. & Holmes, S. [1996] Proc. Nat. Acad. Sci. USA 93, 13429-13434
[56] Tumminello, M., Lillo, F. & Mantegna, R.N. [2005], Hierarchically nested time series models
from dendrograms, cond-mat/0511726
17