sorbent impregnated by nano manganese dioxide and its applications for uranium separation
TRANSCRIPT

This article was downloaded by: [King Faisal University]On: 15 January 2014, At: 01:04Publisher: Taylor & FrancisInforma Ltd Registered in England and Wales Registered Number: 1072954 Registered office: Mortimer House,37-41 Mortimer Street, London W1T 3JH, UK
Spectroscopy Letters: An International Journal forRapid CommunicationPublication details, including instructions for authors and subscription information:http://www.tandfonline.com/loi/lstl20
Synthesis of a New Amberlite 7HP Sorbent Impregnatedby Nano Manganese Dioxide and Its Applications forUranium SeparationO. A. Elhefnawy a , W. I. Zidan a , M. M. Abo-Aly b , E. M. Bakier b & G. A. Al-Magid ba Egyptian Nuclear and Radiological Regulatory Authority (ENRRA) , Cairo , Egyptb Chemistry Department, Faculty of Science , Ain Shams University , Cairo , EgyptAccepted author version posted online: 27 Feb 2013.Published online: 03 Dec 2013.
To cite this article: O. A. Elhefnawy , W. I. Zidan , M. M. Abo-Aly , E. M. Bakier & G. A. Al-Magid (2014) Synthesis of a NewAmberlite 7HP Sorbent Impregnated by Nano Manganese Dioxide and Its Applications for Uranium Separation, SpectroscopyLetters: An International Journal for Rapid Communication, 47:2, 131-146, DOI: 10.1080/00387010.2013.773519
To link to this article: http://dx.doi.org/10.1080/00387010.2013.773519
PLEASE SCROLL DOWN FOR ARTICLE
Taylor & Francis makes every effort to ensure the accuracy of all the information (the “Content”) containedin the publications on our platform. However, Taylor & Francis, our agents, and our licensors make norepresentations or warranties whatsoever as to the accuracy, completeness, or suitability for any purpose of theContent. Any opinions and views expressed in this publication are the opinions and views of the authors, andare not the views of or endorsed by Taylor & Francis. The accuracy of the Content should not be relied upon andshould be independently verified with primary sources of information. Taylor and Francis shall not be liable forany losses, actions, claims, proceedings, demands, costs, expenses, damages, and other liabilities whatsoeveror howsoever caused arising directly or indirectly in connection with, in relation to or arising out of the use ofthe Content.
This article may be used for research, teaching, and private study purposes. Any substantial or systematicreproduction, redistribution, reselling, loan, sub-licensing, systematic supply, or distribution in anyform to anyone is expressly forbidden. Terms & Conditions of access and use can be found at http://www.tandfonline.com/page/terms-and-conditions
Synthesis of a New Amberlite 7HPSorbent Impregnated by Nano Manganese
Dioxide and Its Applications forUranium Separation
O. A. Elhefnawy1,
W. I. Zidan1,
M. M. Abo-Aly2,
E. M. Bakier2,
and G. A. Al-Magid2
1Egyptian Nuclear and
Radiological Regulatory
Authority (ENRRA), Cairo, Egypt2Chemistry Department, Faculty
of Science, Ain Shams University,
Cairo, Egypt
ABSTRACT In this work, a commercially available Amberlite 7HP has been
modified using nano-flakes MnO2 prepared by a simple reduction method.
The characterization of the new sorbent impregnated by nano manganese
dioxide was performed by scanning electron microscope, transmission elec-
tron microscope, energy-dispersive X-ray, X-ray diffraction, and Fourier
transformation infrared spectrometric analyses. The performance of the
new sorbent for UO2þ2 ion separation in aqueous medium was studied in
detail by varying the pH, contact time, initial concentration, bed height,
and flow rate. The maximum sorption has been achieved at a solution of
pH 3.1. Sorbed UO2þ2 ions were desorbed with 10mL of 1.5M HCl solution.
The kinetics and isothermal parameters of the sorption of UO2þ2 ions
onto the new sorbent have been studied. The kinetic experimental data
properly correlate with the second-order kinetic model and the time
required to reach sorption equilibrium is 240min. The sorption data
could be well interpreted by the Langmuir sorption isotherm and the mono-
layer sorption capacity was found to be 56.3mg � g�1. The sorption data
were fitted to two well-established fixed-bed sorption models, namely, Tho-
mas and Yoon–Nelson models, with a correlation coefficient, R2, �0.993.
The separation performance of the new sorbent was demonstrated by
using different real samples. Consequently, the developed sorbent resin
was successfully utilized for the separation of uranyl ions in safeguard
applications.
KEYWORDS characterization, fixed-bed sorption models, nano-flakes manganese
dioxide, nuclear safeguard applications, sorption
INTRODUCTION
Quantitative determination of uranium in nuclear materials, those from
uranium mining and processing, and through site evaluation of radioactive
waste disposal repository has received much attention.[1] Different methods
Received 14 December 2012;accepted 3 February 2013.
Address correspondence toM. M. Abo-Aly, ChemistryDepartment, Faculty of Science, AinShams University, Cairo, Egypt.E-mail: [email protected]
Spectroscopy Letters, 47:131–146, 2014Copyright # Taylor & Francis Group, LLCISSN: 0038-7010 print=1532-2289 onlineDOI: 10.1080/00387010.2013.773519
131
Dow
nloa
ded
by [
Kin
g Fa
isal
Uni
vers
ity]
at 0
1:04
15
Janu
ary
2014
such as solid-phase extraction, precipitation,
electrolysis, column chromatography, and ion
exchangers were used for the assessment of uranium
by extraction from interfering elements followed by
determination.[2–7] A number of analytical methods
are also reported for uranium determination,
including spectrophotometry, spectrofluorometry,
gravimetry, colorimetry, or inductively coupled
plasma–atomic emission spectrometry.[8]
Uranium uptake has also been investigated by
adsorption on a variety of economically priced sorbents
such as calcined phosphate, bone char, Bentonite,
natural scolecite, and magnetic nano-sorbents.[9–13]
Themaindefects of thesematerials are their lowadsorp-
tion capacity compared to the resins, the complexity in
removing the adsorbed uranium, the impurity of these
adsorbents, and their low selectivity.
Nanostructure materials have attracted great atten-
tion in both fundamental and applied research areas
because of their specific functionality and large specific
surface areas leading to exceptional properties and
high sorption capacities.[14] In addition, nano-sorbents
are highly mobile in porous media since they are much
smaller than the relevant pore spaces.[15]
The choice of the sorbent is a key point because it
can control the analytical parameters such as
selectivity, affinity, and capacity. In order to increase
the sorption capacity, to enhance the removal
efficiency, and to add selectivity to the solid phases,
modification and impregnation techniques have been
engaged. Therefore, new adsorbents based on mol-
ecular-imprinted polymers, activated carbon, carbon
nano-tubes, metal oxide nano-particles, and modified
silica[16–21] have been recently found as alternatives
to conventional solid-phase extraction materials.
Although previous research has focused on the
ability of metal oxide nano-sorbents for metal ion
sorption, few metal ions were really tested.[22–24] For
example, manganese oxide, which plays a major role
in controlling trace metal concentration via sorption
and co-precipitation processes were reported.[25]
In the present study, the new composite Amberlite
7HP impregnated by manganese dioxide
(7HPNMnO) has been prepared and characterized
as a nano-sorbent for UO2þ2 ion separation in safe-
guard applications. Separation process modeling in
both batch and dynamic modes is presented. In
addition, applications of the synthesized resin for
separation of uranyl ions of collected real samples
from Egyptian nuclear facilities and other locations
for safeguard verification purposes are examined.
EXPERIMENTAL
Instrumentation
Inductively coupled plasma optical emission spec-
trometer ICP-OES (Thermo Fisher Scientific iCAP
6500, Manchester, UK) with ITEVA operating software
for control of all instrument functions and data (maxi-
mum concentration of samples was 50mg � L�1) and
a UV-visible spectrophotometer (Thermo-Evolution
300, Thermo Scientific, Manchester, UK) were used for
determination of uranium at a wavelength of 650nm
and at a maximum concentration of 4mg � L�1. Trans-
mission electron microscope (TEM) images were
obtained using a JEOL JEM-2100 instrument (JEOL,
Tokyo, Japan) using an accelerating voltage of 200kV.
Samples were ultra-sonicated in ethanol for 15min
and then dispersed on copper grids. Structure and
purity of the modified resin was verified by means
of X-ray powder diffraction technique on a PANalyti-
cal apparatus with X’pert PRO software (PANalytical,
Almelo, The Netherlands). Surface morphology and
distribution of MnO2 on the resin was analyzed using
scanning electron microscopy (SEM), with an energy-
dispersive X-ray (EDX) detector from JEOL, 6510 LA
(JEOL, Tokyo, Japan). Fourier transform infrared
(FTIR) spectra were measured at room temperature
in the wavenumber range (400–4000 cm�1), on a Jasco
FT=IR-6100 (JASCO, Easton, Maryland, USA). The
pH values were measured on a Metrohm Herison
digital pH meter (780, Metrohm Herison, Herisau,
Switzerland). All experiments were carried out in
a safeguarded destructive analysis laboratory (ETZ-,
KMP-I) at the Egyptian Nuclear and Radiological
Regulatory Authority (ENRRA).
Reagents and Chemicals
All solutions were prepared in deionized water.
Amberlite 7HP, having 450m2 � g�1 average surface
area, was obtained from Sigma (Miami, Florida,
USA); uranyl nitrate UO2(NO3)2 � 6H2O (Mallinck-
rodt, Dublin, Ireland) was procured from local
market (U235 wt. percent, 0.07%); potassium
permanganate KMnO4, 65% nitric acid, 68%
ammonia solution, and the buffer solutions were
purchased from Merck (Darmstadt, Germany); 0.2%
O. A. Elhefnawy et al. 132
Dow
nloa
ded
by [
Kin
g Fa
isal
Uni
vers
ity]
at 0
1:04
15
Janu
ary
2014
Arsenazo (III) and ethanol were provided by Aldrich
(Taufkirchen, Germany); 36% hydrochloric acid
(Fisher Chemicals, Waltham, Massachusetts, USA)
and EDTA disodium salt (Acros, Thermo Fisher
Scientific, Geel, Belgium) were also used.
Methods
Preparation of Nano-MnO2
Nano-MnO2 was prepared by a simple reduction
method, which was previously used in preparing
manganese dioxide, as follows:[26]
2KMnO4 þ 8HCl ! 2MnO2 þ 2KClþ 3Cl2 þ 4H2O
ð1Þ
3.16 g of potassium permanganate were dissolved in
50mL deionized water in a beaker. Then, 8mL of
36% hydrochloric acid were added dropwise to this
solution with continuous stirring and heating on a
hot plate at 90�C. A suspension was then obtained
after stirring for 1 hr without heating. The formed
suspension was then washed several times using
deionized water and was air dried overnight at
90�C instead of 100�C as normally done[26] in a trial
to prepare nano-flakes of MnO2.
Preparation of 7HPNMnO
4 g of Amberlite -7HP resin were mixed in a beaker
with a heated KMnO4 solution (3.16 g in 50mL deio-
nized water) at 90�C. The mixture was then stirred
with dropwise addition of 8mL of 36% hydrochloric
acid. The formed suspension after 1 hr stirring with-
out heating was washed several times using deio-
nized water (to remove free potassium and chloride
ions), then air dried in an oven at 90�C for 24 hr
and finally stored in a polypropylene bottle for use.
pHPZC Determination of the Solid 7HPNMnO
The pHPZC value (the pH at which the surface
charge density is zero) was obtained as previously
described,[27] by dissolving 1 g of 7HPNMnO in
100mL of 0.1M KNO3 as a background electrolyte,
with initial pH range 1–12.
pHPZC was found to be 5.8; below this value, the
7HPNMnO surface is positive, and above it, the
surface becomes negative. So at a pH< 5.8, UO2þ2
ions become sorbed through a chemisorption mech-
anism, and above it, the sorption occurs through
electrostatic interactions. This suggests the possibility
of involvement of a chemisorption mechanism in this
sorption process.[28]
Static Method
0.05 g of 7HPNMnO was equilibrated with 20mL
of sample solution with initial concentration of
500 mg �mL�1 in a 100-mL well-stopped reagent bot-
tle at 100 rpm on a magnetic stirrer. Because of the
higher sorption capacity of 7HPNMnO, a small bed
height was chosen to examine its behavior against
the effect of pH, contact time, and initial metal ion
concentration. The adsorbed ions on the modified
resin were then desorbed by using HCl and
were determined spectrophotometrically using the
Arsenazo (III) method for uranium ion assay.[29]
The obtained data in batch model studies were used
to calculate the equilibrium capacities via Eq. (2):[30]
qe ¼VðC0 � CÞ1000m
ð2Þ
where qe is the equilibrium capacity (mg � g�1); V is
the sample volume (liters); C0 and C (mg � L�1) are
the initial and the effluent metal ion concentrations,
respectively; and m is the dry weight of the sorbent (g).
Kinetic Modeling
The pseudo-first-order,[31] pseudo-second-
order,[32,33] Elovich,[34] and intraparticle diffusion
models[35–37] were applied to interpret the experi-
mental data of the investigated sorption process.
Pseudo-First-Order Model
The pseudo-first-order equation describes the
sorption in solid–liquid systems and is based on
the sorption capacity of solids.[31] It was assumed that
one UO2þ2 ion is adsorbed by one sorption site on the
modified resin surface:
Aþ UO2þ2aq �!
k1AUO2þ
2solid phase ð3Þ
where A represents an unoccupied sorption site and
k1 is the pseudo-first-order rate constant. The linear
form of the pseudo-first-order model can be
expressed via Eq. (4):
lnðqe � qÞ ¼ ln qe � k1t ð4Þ
133 Synthesis of New Amberlite 7HP Sorbent
Dow
nloa
ded
by [
Kin
g Fa
isal
Uni
vers
ity]
at 0
1:04
15
Janu
ary
2014
where qe and q (mg � g�1) are the sorption capacities
at equilibrium and at time t (min), respectively, and
k1 is the rate constant of the first-order sorption
process (min�1).
Pseudo-Second-Order
The pseudo-second-order rate expression has
been applied for analyzing chemisorption
kinetics.[32,33] This model assumes that one UO2þ2
ion is adsorbed by two sorption sites on the modified
resin surface:
2Aþ UO2þ2aq �!
k2A2UO
2þ2solid phase ð5Þ
where A represents an unoccupied sorption site
and k2 is the pseudo-second-order rate constant
(g �mg�1 �min�1). The pseudo-second-order rate
model is linearly expressed via Eq. (6):
t
q¼ 1
k2 q2eþ t
qeð6Þ
The batch kinetic data were fitted to both of the
above models. The initial sorption rate, h (mg � g�1 �min�1), when t! 0, is expressed by Eq. (7):[38]
h ¼ k2 q2e ð7Þ
where k2q2e, h, and mg � g�1 �h�1 is defined as the
initial sorption rate.
Elovich Model
The Elovich equation[34] is applicable to the
chemisorption kinetics in solutions, involving
valence forces through sharing or exchange of
electrons between sorbent and sorbed materials.[39]
The linear form of the Elovich equation is given by
Eq. (8):[34]
q ¼ 1
b
� �lnðabÞ þ 1
b
� �lnðtÞ: ð8Þ
Intraparticle Diffusion Model
The sorption of metal ions from the aqueous
solution onto the solid phase is a multistep process
including transport of metal ions from the aqueous
phase to the surface of solid particles as a first step
(bulk diffusion), and a second step occurs by
diffusion of metal ions into the boundary layer of
the solid particles (film diffusion), followed by a
third step where transport of metal ions from the
surface to the interior pores (pore diffusion or intra-
particle diffusion) occurs. The later step is likely to
be a slow process. In addition, sorption of metal ions
by an active site on the solid-phase surface could
also occur through chemical processes. The metal
ion sorption is usually controlled by either the
intraparticle or the liquid-phase mass transport
rates.[35] The intraparticle diffusion model pro-
posed by Weber and Morris can be applied using
Eq. (9):[36]
qt ¼ Kidt0:5 þ I ð9Þ
where qt is the adsorbed amount at time t, and Kid is
the intraparticle diffusion rate constant. Values of
I give an idea about the thickness of the boundary
layer.[37]
Isothermal Modeling
Langmuir Equation Model
UO2þ2 ion isothermal sorption data using different
initial concentrations were investigated by the Lang-
muir model via Eq. (10):[40]
C
qe¼ 1
kLqmþ C
qmð10Þ
where qe is the equilibrium metal ion concentration
on the sorbent (mg � g�1), qm is the monolayer
capacity of the sorbent (mg � g�1), C is the
equilibrium metal ion concentration in solution
(mg � L�1), and KL is the Langmuir sorption constant
(L �mg�1). A plot of C=qe vs. C gives a straight line
of slope 1=qm and intercept 1=(KL qm). The Langmuir
equation is applicable to homogeneous sorption,
where the sorption of each sorbed molecule
onto the surface has equal sorption activation
energy.
Freundlich Equation Model
The logarithmic expression of the Freundlich
equation is given in Eq. (11):[41]
Log qe ¼ Log kf þ1
n
� �LogC ð11Þ
O. A. Elhefnawy et al. 134
Dow
nloa
ded
by [
Kin
g Fa
isal
Uni
vers
ity]
at 0
1:04
15
Janu
ary
2014
where C is the equilibrium metal ion concentration in
solution (mg � L�1), and Kf (mg � g�1) and n are the
Freundlich constants for sorption capacity and sorp-
tion intensity, respectively. The Freundlich equation
is employed to describe heterogeneous systems
and reversible sorption and is not restricted to the
formation of monolayer.
To evaluate the nature of the adsorption reaction,
the data were analyzed with the nonlinear fitting
using Eqs. (12) and (13):[42]
Langmuir model:
qe ¼qm KLCe
1þ KLCeð12Þ
Freundlich model:
qe ¼ KFCð1=nÞ: ð13Þ
Column ‘‘Dynamic’’ Method
7HPNMnO was uniformly packed in a glass
column within the mass range (0.2–0.5 g) with
30 cm length and an internal diameter of 10mm.
Special rubber tubes of 2mm internal diameter and
a calibrated peristaltic pump was used for feeding
the sample through the column using different flow
rates. The column washed several times by deio-
nized water. A stock solution of UO2þ2 ions was
prepared by dissolving an appropriate amount of
UO2(NO3)2 � 6H2O in deionized water and the initial
pH of the working solutions was adjusted by
addition of HNO3 or NH3 solution. A sample solution
containing UO2þ2 ions was passed down through the
column and desorbed with 1.5M HCl. UO2þ2 ion
concentration was determined in the aqueous phase
spectrophotometrically using the Arsenazo (III)
method at 650 nm.[29]
The loading behavior of UO2þ2 ions adsorbed from
aqueous solution onto a fixed bed is usually
expressed in terms of C=C0 as a function of time or
the volume of the sample at a constant amount of
resin, thus allowing the corresponding breakthrough
curve to be constructed. The maximum column
capacity, qtotal (mg), for a given feed concentration
and flow rate, Q, is equal to the area under the curve
of adsorbed UO2þ2 ions and obtained by plotting the
adsorbed amount, Cad (mg � L�1), versus time t (min)
as given in Eq. (14):[43]
qtotal ¼QA
1000¼ Q
1000
Z t¼t
t¼0
Ctotalad dt ð14Þ
The equilibrium capacity (qe) is the amount of
UO2þ2 ions adsorbed per unit mass of dry sorbent
(mg � g�1) in the column and is expressed via
Eq. (15):[43]
qe ¼qtotal
mð15Þ
where m is the total mass of dry sorbent in the
column.
Thomas Model
The Thomas model was used to predict the sorp-
tion performance. The nonlinear form of the model
is expressed via Eq. (16):[44]
C
C0¼ 1
1þ exp KTh
Q ðqThm� C0VÞh i ð16Þ
where kTh is the Thomas rate constant in mL �min�1 �mg�1, qTh is the uptake of UO2þ
2 ions per g of
sorbent at equilibrium (mg � g�1), and the quantities
m, C0, C, and Q are as previously defined. The
expression for the linear Thomas model is expressed
via Eq. (17):[45]
lnC0
C� 1
� �¼ KThqThm
Q� KThC0V
Qð17Þ
Thomas model parameters were obtained from the
plot of ln[(C0=C)� 1] vs. V at a given flow rate.
Yoon–Nelson Model
Yoon and Nelson were theoretically applied to
describe the sorbate diffusion inside the sorbent,
from which developed a relatively simple model
addressing the sorption and breakthrough of the
sorbate. It is expressed via Eq. (18):[46]
C
C0¼ expðKYNt�sKYNÞ
1þ expðKYNt�sKYNÞð18Þ
135 Synthesis of New Amberlite 7HP Sorbent
Dow
nloa
ded
by [
Kin
g Fa
isal
Uni
vers
ity]
at 0
1:04
15
Janu
ary
2014
The linearized Yoon–Nelson model for a
single-component system is expressed via Eq. (19):[46]
lnC
C0 � C¼ KYNt�sKYN ð19Þ
where KYN (min�1) is the rate velocity constant, and t
(min) is the time required for 50% adsorbate break-
through. From a linear plot of ln[C=(Co�C)] against
sampling time t, the sorption capacity qYN was
expressed relative to Co and Q via Eq. (20):[47]
qYN ¼ QC0 sm
: ð20Þ
Error Analysis
A nonlinear regressive method of error analysis
was employed in the present study. This method
gives the average mean square error (MSE) value,
which is the sum of the squares of the differences
between the experimental data and those calculated
from the models. MSE values were calculated using
Eq. (21):[45]
MSE ¼ 1
N
XN1
½ðCexp=C0Þ � ðCcal=C0Þ�2 ð21Þ
where (Ccal=C0) is the ratio of UO2þ2 ions effluent to
the initial concentration and was obtained by calcu-
lation from the model, and (Cexp=C0) is the same
experimentally obtained ratio.[44] If the data from
the model are similar to the experimental data,
(MSE) will have small values; in contrast, if the data
are different, then (MSE) will acquire higher values.
In order to confirm the best model for the column
sorption system, it is necessary to analyze the data
using the values of (MSE) combined with those of
the correlation coefficient (R2).
RESULTS AND DISCUSSION
Characterization Studies
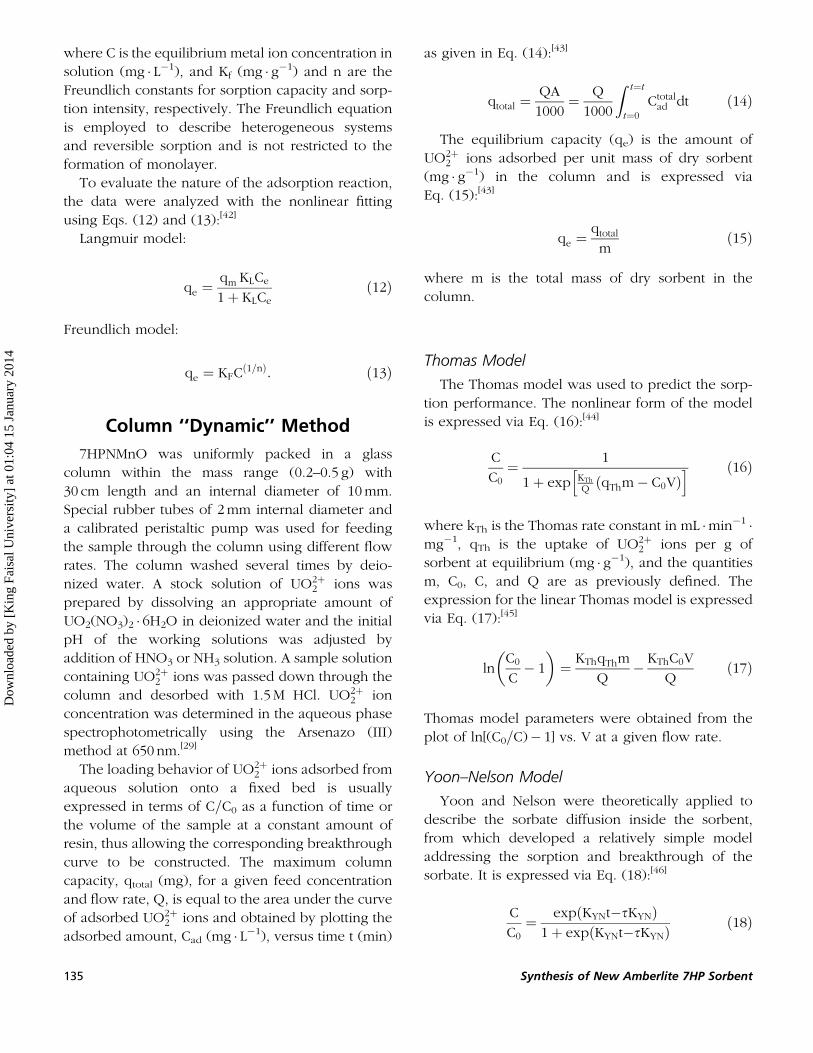
Figures 1(A) and (B) show the TEM images of the
nano-MnO2, which give the morphology of the
nano-MnO2. TEM images of the nano-MnO2 show a
network-like structure and the formation of a loosely
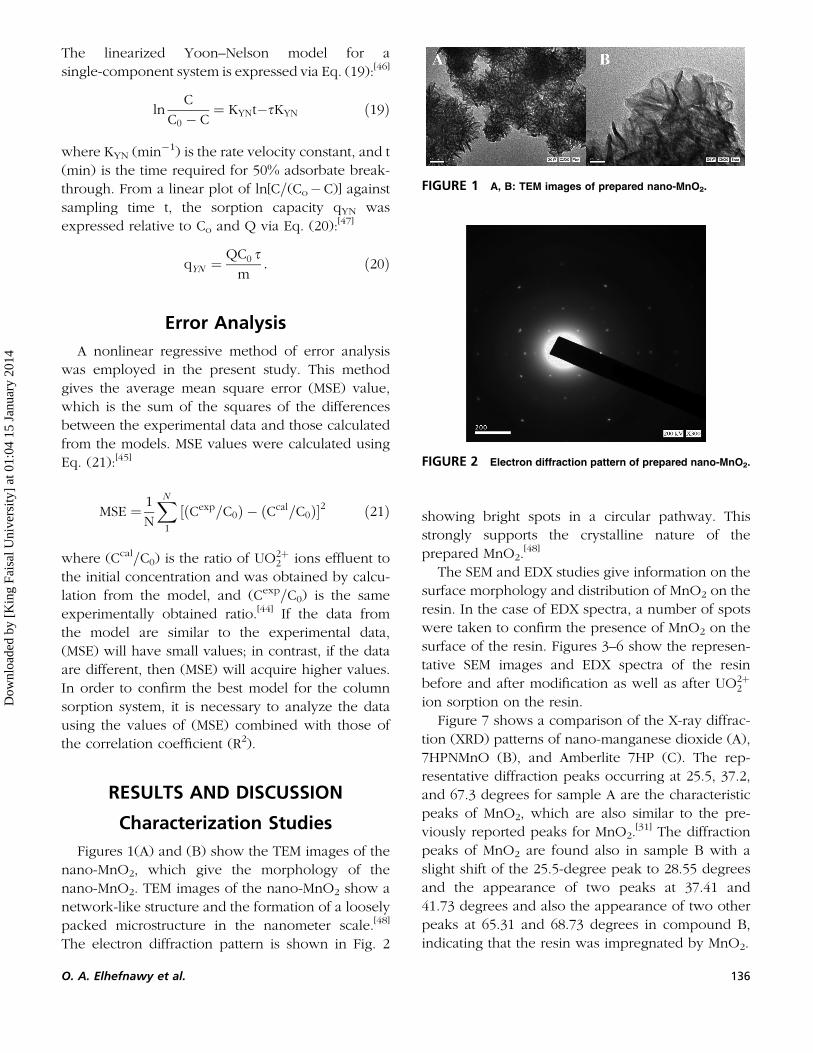
packed microstructure in the nanometer scale.[48]
The electron diffraction pattern is shown in Fig. 2
showing bright spots in a circular pathway. This
strongly supports the crystalline nature of the
prepared MnO2.[48]
The SEM and EDX studies give information on the
surface morphology and distribution of MnO2 on the
resin. In the case of EDX spectra, a number of spots
were taken to confirm the presence of MnO2 on the
surface of the resin. Figures 3–6 show the represen-
tative SEM images and EDX spectra of the resin
before and after modification as well as after UO2þ2
ion sorption on the resin.
Figure 7 shows a comparison of the X-ray diffrac-
tion (XRD) patterns of nano-manganese dioxide (A),
7HPNMnO (B), and Amberlite 7HP (C). The rep-
resentative diffraction peaks occurring at 25.5, 37.2,
and 67.3 degrees for sample A are the characteristic
peaks of MnO2, which are also similar to the pre-
viously reported peaks for MnO2.[31] The diffraction
peaks of MnO2 are found also in sample B with a
slight shift of the 25.5-degree peak to 28.55 degrees
and the appearance of two peaks at 37.41 and
41.73 degrees and also the appearance of two other
peaks at 65.31 and 68.73 degrees in compound B,
indicating that the resin was impregnated by MnO2.
FIGURE 1 A, B: TEM images of prepared nano-MnO2.
FIGURE 2 Electron diffraction pattern of prepared nano-MnO2.
O. A. Elhefnawy et al. 136
Dow
nloa
ded
by [
Kin
g Fa
isal
Uni
vers
ity]
at 0
1:04
15
Janu
ary
2014
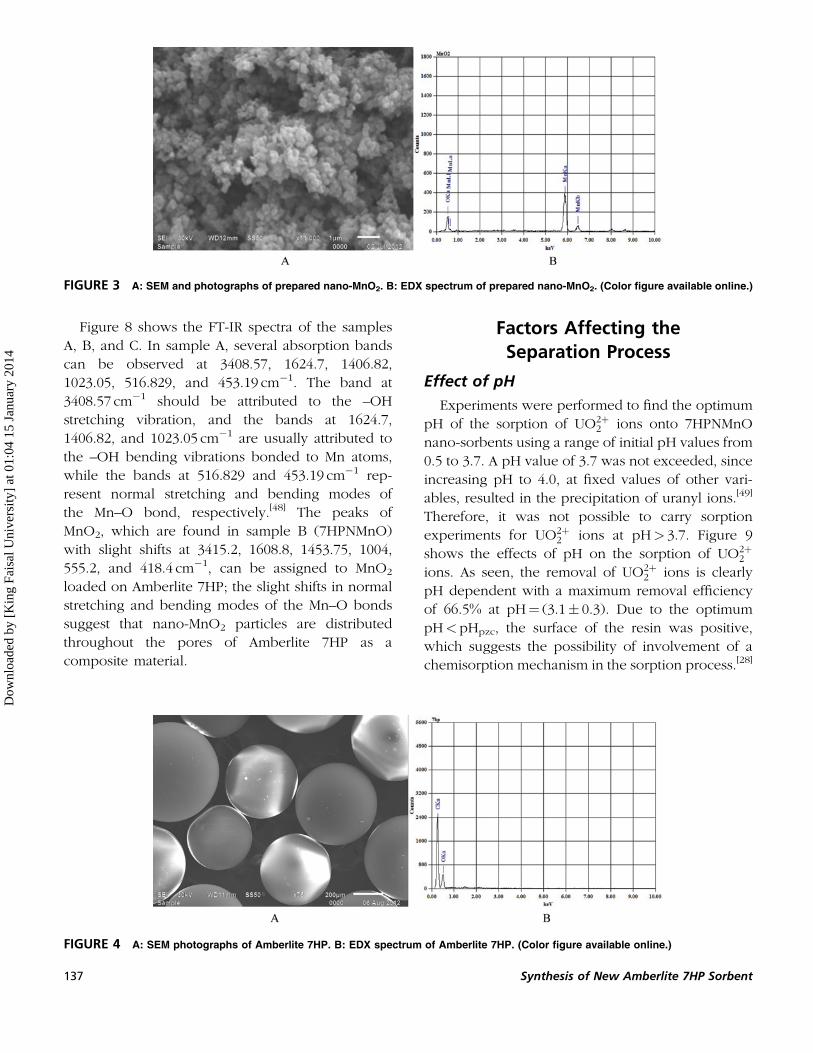
Figure 8 shows the FT-IR spectra of the samples
A, B, and C. In sample A, several absorption bands
can be observed at 3408.57, 1624.7, 1406.82,
1023.05, 516.829, and 453.19 cm�1. The band at
3408.57 cm�1 should be attributed to the –OH
stretching vibration, and the bands at 1624.7,
1406.82, and 1023.05 cm�1 are usually attributed to
the –OH bending vibrations bonded to Mn atoms,
while the bands at 516.829 and 453.19 cm�1 rep-
resent normal stretching and bending modes of
the Mn–O bond, respectively.[48] The peaks of
MnO2, which are found in sample B (7HPNMnO)
with slight shifts at 3415.2, 1608.8, 1453.75, 1004,
555.2, and 418.4 cm�1, can be assigned to MnO2
loaded on Amberlite 7HP; the slight shifts in normal
stretching and bending modes of the Mn–O bonds
suggest that nano-MnO2 particles are distributed
throughout the pores of Amberlite 7HP as a
composite material.
Factors Affecting theSeparation Process
Effect of pH
Experiments were performed to find the optimum
pH of the sorption of UO2þ2 ions onto 7HPNMnO
nano-sorbents using a range of initial pH values from
0.5 to 3.7. A pH value of 3.7 was not exceeded, since
increasing pH to 4.0, at fixed values of other vari-
ables, resulted in the precipitation of uranyl ions.[49]
Therefore, it was not possible to carry sorption
experiments for UO2þ2 ions at pH> 3.7. Figure 9
shows the effects of pH on the sorption of UO2þ2
ions. As seen, the removal of UO2þ2 ions is clearly
pH dependent with a maximum removal efficiency
of 66.5% at pH¼ (3.1� 0.3). Due to the optimum
pH<pHpzc, the surface of the resin was positive,
which suggests the possibility of involvement of a
chemisorption mechanism in the sorption process.[28]
FIGURE 3 A: SEM and photographs of prepared nano-MnO2. B: EDX spectrum of prepared nano-MnO2. (Color figure available online.)
FIGURE 4 A: SEM photographs of Amberlite 7HP. B: EDX spectrum of Amberlite 7HP. (Color figure available online.)
137 Synthesis of New Amberlite 7HP Sorbent
Dow
nloa
ded
by [
Kin
g Fa
isal
Uni
vers
ity]
at 0
1:04
15
Janu
ary
2014
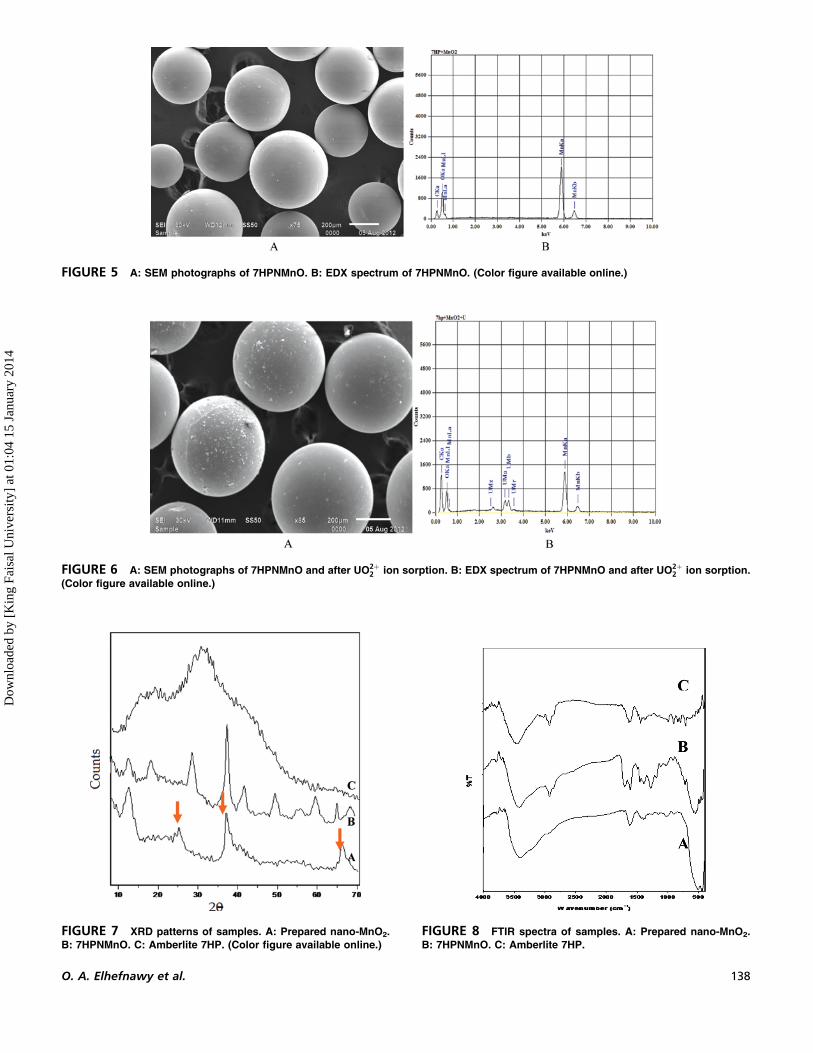
FIGURE 6 A: SEM photographs of 7HPNMnO and after UO2þ2 ion sorption. B: EDX spectrum of 7HPNMnO and after UO2þ
2 ion sorption.
(Color figure available online.)
FIGURE 7 XRD patterns of samples. A: Prepared nano-MnO2.
B: 7HPNMnO. C: Amberlite 7HP. (Color figure available online.)
FIGURE 8 FTIR spectra of samples. A: Prepared nano-MnO2.
B: 7HPNMnO. C: Amberlite 7HP.
FIGURE 5 A: SEM photographs of 7HPNMnO. B: EDX spectrum of 7HPNMnO. (Color figure available online.)
O. A. Elhefnawy et al. 138
Dow
nloa
ded
by [
Kin
g Fa
isal
Uni
vers
ity]
at 0
1:04
15
Janu
ary
2014
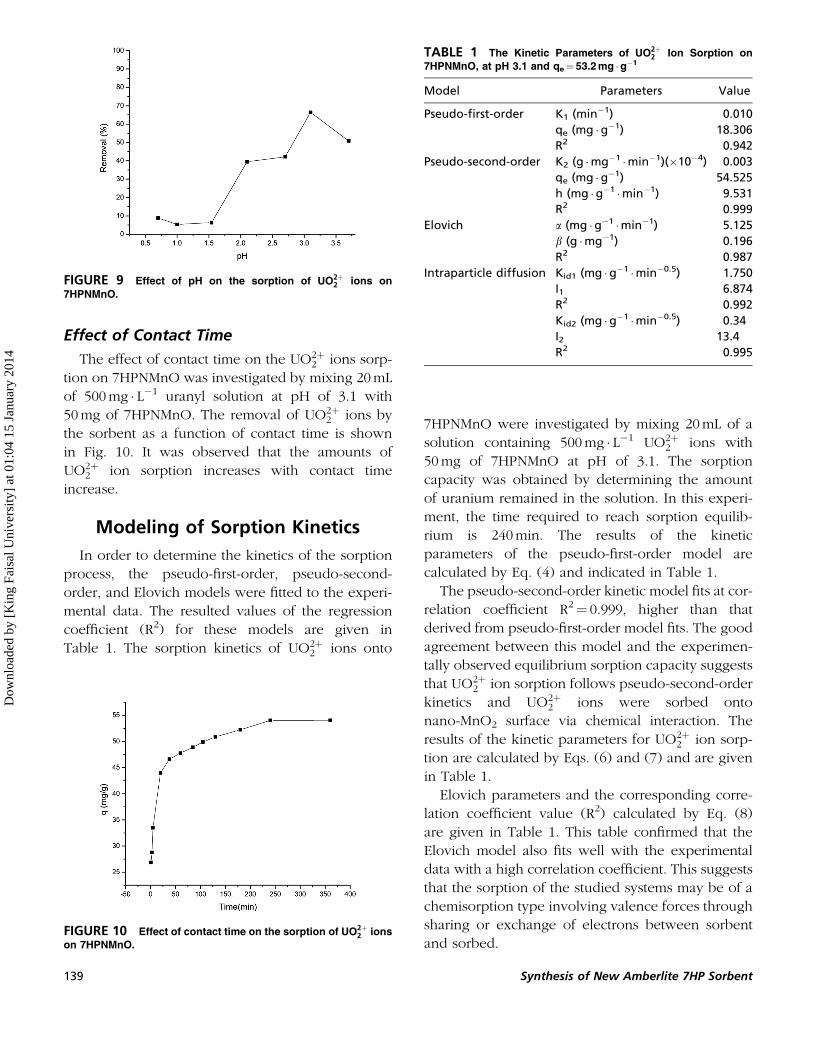
Effect of Contact Time
The effect of contact time on the UO2þ2 ions sorp-
tion on 7HPNMnO was investigated by mixing 20mL
of 500mg � L�1 uranyl solution at pH of 3.1 with
50mg of 7HPNMnO. The removal of UO2þ2 ions by
the sorbent as a function of contact time is shown
in Fig. 10. It was observed that the amounts of
UO2þ2 ion sorption increases with contact time
increase.
Modeling of Sorption Kinetics
In order to determine the kinetics of the sorption
process, the pseudo-first-order, pseudo-second-
order, and Elovich models were fitted to the experi-
mental data. The resulted values of the regression
coefficient (R2) for these models are given in
Table 1. The sorption kinetics of UO2þ2 ions onto
7HPNMnO were investigated by mixing 20mL of a
solution containing 500mg � L�1 UO2þ2 ions with
50mg of 7HPNMnO at pH of 3.1. The sorption
capacity was obtained by determining the amount
of uranium remained in the solution. In this experi-
ment, the time required to reach sorption equilib-
rium is 240min. The results of the kinetic
parameters of the pseudo-first-order model are
calculated by Eq. (4) and indicated in Table 1.
The pseudo-second-order kinetic model fits at cor-
relation coefficient R2¼ 0.999, higher than that
derived from pseudo-first-order model fits. The good
agreement between this model and the experimen-
tally observed equilibrium sorption capacity suggests
that UO2þ2 ion sorption follows pseudo-second-order
kinetics and UO2þ2 ions were sorbed onto
nano-MnO2 surface via chemical interaction. The
results of the kinetic parameters for UO2þ2 ion sorp-
tion are calculated by Eqs. (6) and (7) and are given
in Table 1.
Elovich parameters and the corresponding corre-
lation coefficient value (R2) calculated by Eq. (8)
are given in Table 1. This table confirmed that the
Elovich model also fits well with the experimental
data with a high correlation coefficient. This suggests
that the sorption of the studied systems may be of a
chemisorption type involving valence forces through
sharing or exchange of electrons between sorbent
and sorbed.FIGURE 10 Effect of contact time on the sorption of UO2þ
2 ions
on 7HPNMnO.
TABLE 1 The Kinetic Parameters of UO2þ2 Ion Sorption on
7HPNMnO, at pH 3.1 and qe¼ 53.2mg �g�1
Model Parameters Value
Pseudo-first-order K1 (min�1) 0.010
qe (mg �g�1) 18.306
R2 0.942
Pseudo-second-order K2 (g �mg�1 �min�1)(�10�4) 0.003
qe (mg �g�1) 54.525
h (mg �g�1 �min�1) 9.531
R2 0.999
Elovich a (mg �g�1 �min�1) 5.125
b (g �mg�1) 0.196
R2 0.987
Intraparticle diffusion Kid1 (mg �g�1 �min�0.5) 1.750
I1 6.874
R2 0.992
Kid2 (mg �g�1 �min�0.5) 0.34
I2 13.4
R2 0.995
FIGURE 9 Effect of pH on the sorption of UO2þ2 ions on
7HPNMnO.
139 Synthesis of New Amberlite 7HP Sorbent
Dow
nloa
ded
by [
Kin
g Fa
isal
Uni
vers
ity]
at 0
1:04
15
Janu
ary
2014
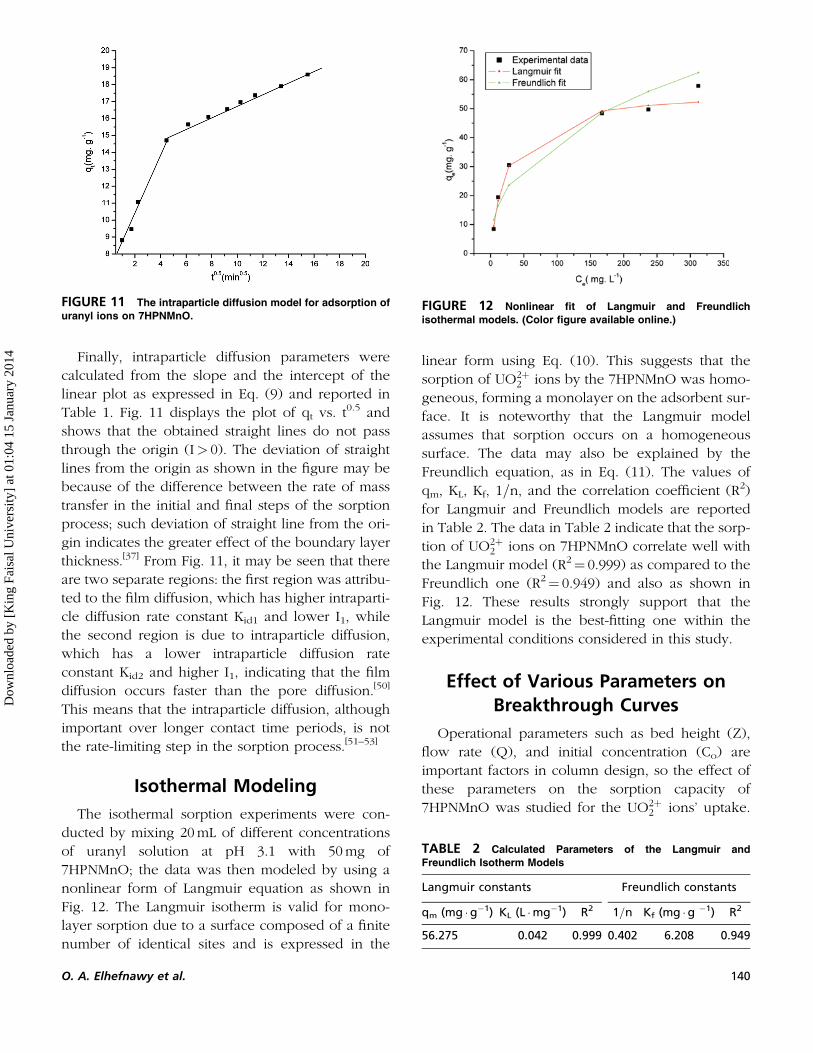
Finally, intraparticle diffusion parameters were
calculated from the slope and the intercept of the
linear plot as expressed in Eq. (9) and reported in
Table 1. Fig. 11 displays the plot of qt vs. t0.5 and
shows that the obtained straight lines do not pass
through the origin (I> 0). The deviation of straight
lines from the origin as shown in the figure may be
because of the difference between the rate of mass
transfer in the initial and final steps of the sorption
process; such deviation of straight line from the ori-
gin indicates the greater effect of the boundary layer
thickness.[37] From Fig. 11, it may be seen that there
are two separate regions: the first region was attribu-
ted to the film diffusion, which has higher intraparti-
cle diffusion rate constant Kid1 and lower I1, while
the second region is due to intraparticle diffusion,
which has a lower intraparticle diffusion rate
constant Kid2 and higher I1, indicating that the film
diffusion occurs faster than the pore diffusion.[50]
This means that the intraparticle diffusion, although
important over longer contact time periods, is not
the rate-limiting step in the sorption process.[51–53]
Isothermal Modeling
The isothermal sorption experiments were con-
ducted by mixing 20mL of different concentrations
of uranyl solution at pH 3.1 with 50mg of
7HPNMnO; the data was then modeled by using a
nonlinear form of Langmuir equation as shown in
Fig. 12. The Langmuir isotherm is valid for mono-
layer sorption due to a surface composed of a finite
number of identical sites and is expressed in the
linear form using Eq. (10). This suggests that the
sorption of UO2þ2 ions by the 7HPNMnO was homo-
geneous, forming a monolayer on the adsorbent sur-
face. It is noteworthy that the Langmuir model
assumes that sorption occurs on a homogeneous
surface. The data may also be explained by the
Freundlich equation, as in Eq. (11). The values of
qm, KL, Kf, 1=n, and the correlation coefficient (R2)
for Langmuir and Freundlich models are reported
in Table 2. The data in Table 2 indicate that the sorp-
tion of UO2þ2 ions on 7HPNMnO correlate well with
the Langmuir model (R2¼ 0.999) as compared to the
Freundlich one (R2¼ 0.949) and also as shown in
Fig. 12. These results strongly support that the
Langmuir model is the best-fitting one within the
experimental conditions considered in this study.
Effect of Various Parameters on
Breakthrough Curves
Operational parameters such as bed height (Z),
flow rate (Q), and initial concentration (Co) are
important factors in column design, so the effect of
these parameters on the sorption capacity of
7HPNMnO was studied for the UO2þ2 ions’ uptake.
FIGURE 11 The intraparticle diffusion model for adsorption of
uranyl ions on 7HPNMnO.FIGURE 12 Nonlinear fit of Langmuir and Freundlich
isothermal models. (Color figure available online.)
TABLE 2 Calculated Parameters of the Langmuir and
Freundlich Isotherm Models
Langmuir constants Freundlich constants
qm (mg �g�1) KL (L �mg�1) R2 1=n Kf (mg �g �1) R2
56.275 0.042 0.999 0.402 6.208 0.949
O. A. Elhefnawy et al. 140
Dow
nloa
ded
by [
Kin
g Fa
isal
Uni
vers
ity]
at 0
1:04
15
Janu
ary
2014
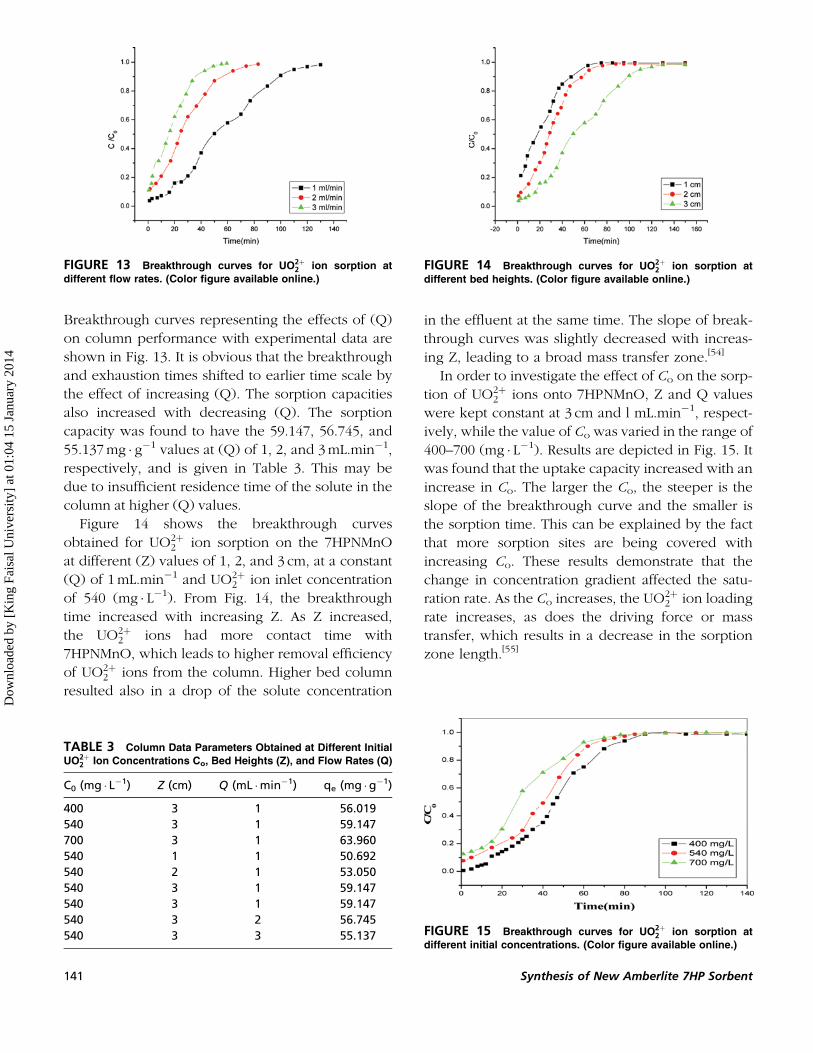
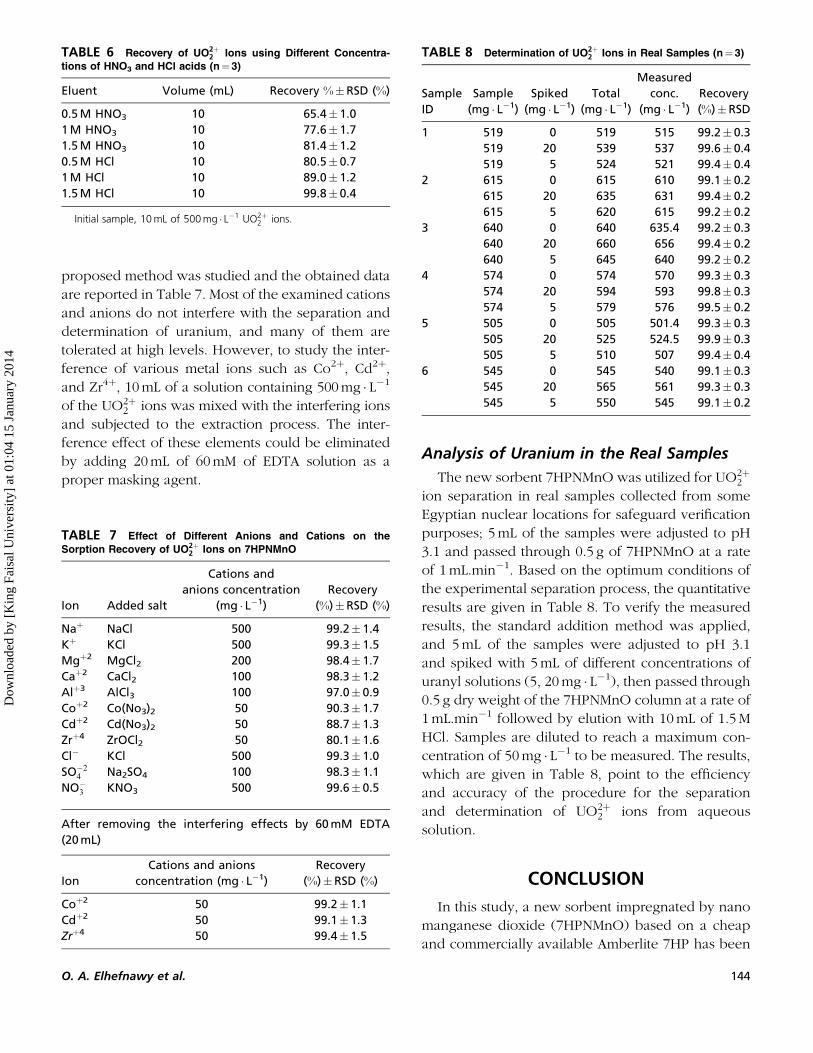
Breakthrough curves representing the effects of (Q)
on column performance with experimental data are
shown in Fig. 13. It is obvious that the breakthrough
and exhaustion times shifted to earlier time scale by
the effect of increasing (Q). The sorption capacities
also increased with decreasing (Q). The sorption
capacity was found to have the 59.147, 56.745, and
55.137mg � g�1 values at (Q) of 1, 2, and 3mL.min�1,
respectively, and is given in Table 3. This may be
due to insufficient residence time of the solute in the
column at higher (Q) values.
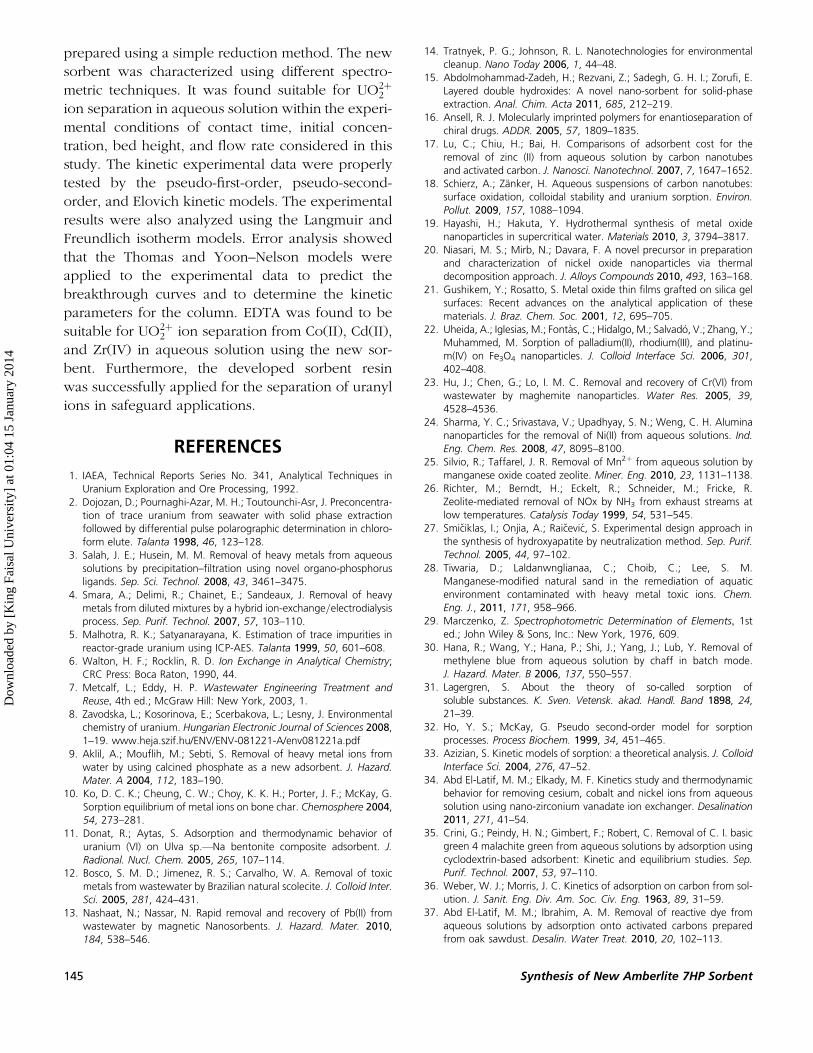
Figure 14 shows the breakthrough curves
obtained for UO2þ2 ion sorption on the 7HPNMnO
at different (Z) values of 1, 2, and 3 cm, at a constant
(Q) of 1mL.min�1 and UO2þ2 ion inlet concentration
of 540 (mg � L�1). From Fig. 14, the breakthrough
time increased with increasing Z. As Z increased,
the UO2þ2 ions had more contact time with
7HPNMnO, which leads to higher removal efficiency
of UO2þ2 ions from the column. Higher bed column
resulted also in a drop of the solute concentration
in the effluent at the same time. The slope of break-
through curves was slightly decreased with increas-
ing Z, leading to a broad mass transfer zone.[54]
In order to investigate the effect of Co on the sorp-
tion of UO2þ2 ions onto 7HPNMnO, Z and Q values
were kept constant at 3 cm and l mL.min�1, respect-
ively, while the value of Co was varied in the range of
400–700 (mg � L�1). Results are depicted in Fig. 15. It
was found that the uptake capacity increased with an
increase in Co. The larger the Co, the steeper is the
slope of the breakthrough curve and the smaller is
the sorption time. This can be explained by the fact
that more sorption sites are being covered with
increasing Co. These results demonstrate that the
change in concentration gradient affected the satu-
ration rate. As the Co increases, the UO2þ2 ion loading
rate increases, as does the driving force or mass
transfer, which results in a decrease in the sorption
zone length.[55]
FIGURE 13 Breakthrough curves for UO2þ2 ion sorption at
different flow rates. (Color figure available online.)
TABLE 3 Column Data Parameters Obtained at Different Initial
UO2þ2 Ion Concentrations Co, Bed Heights (Z), and Flow Rates (Q)
C0 (mg � L�1) Z (cm) Q (mL �min�1) qe (mg �g�1)
400 3 1 56.019
540 3 1 59.147
700 3 1 63.960
540 1 1 50.692
540 2 1 53.050
540 3 1 59.147
540 3 1 59.147
540 3 2 56.745
540 3 3 55.137
FIGURE 14 Breakthrough curves for UO2þ2 ion sorption at
different bed heights. (Color figure available online.)
FIGURE 15 Breakthrough curves for UO2þ2 ion sorption at
different initial concentrations. (Color figure available online.)
141 Synthesis of New Amberlite 7HP Sorbent
Dow
nloa
ded
by [
Kin
g Fa
isal
Uni
vers
ity]
at 0
1:04
15
Janu
ary
2014
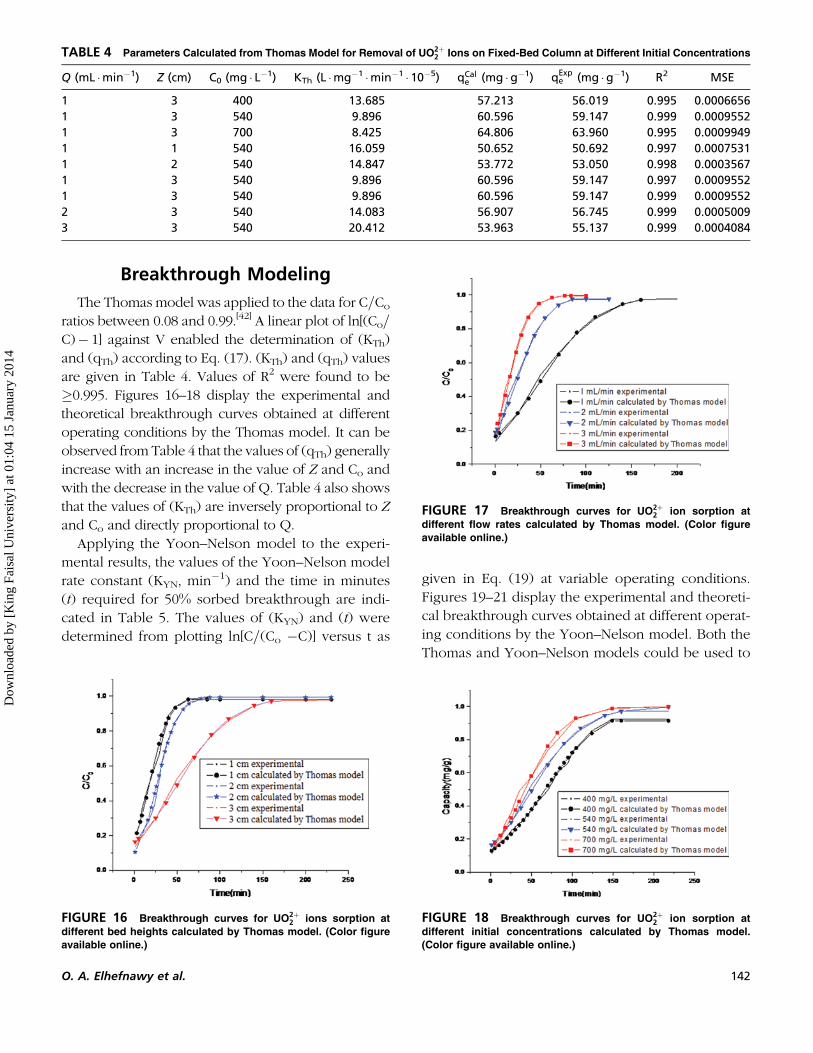
Breakthrough Modeling
The Thomas model was applied to the data for C=Co
ratios between 0.08 and 0.99.[42] A linear plot of ln[(Co=
C)� 1] against V enabled the determination of (KTh)
and (qTh) according to Eq. (17). (KTh) and (qTh) values
are given in Table 4. Values of R2 were found to be
�0.995. Figures 16–18 display the experimental and
theoretical breakthrough curves obtained at different
operating conditions by the Thomas model. It can be
observed from Table 4 that the values of (qTh) generally
increase with an increase in the value of Z and Co and
with the decrease in the value of Q. Table 4 also shows
that the values of (KTh) are inversely proportional to Z
and Co and directly proportional to Q.
Applying the Yoon–Nelson model to the experi-
mental results, the values of the Yoon–Nelson model
rate constant (KYN, min�1) and the time in minutes
(t) required for 50% sorbed breakthrough are indi-
cated in Table 5. The values of (KYN) and (t) were
determined from plotting ln[C=(Co �C)] versus t as
given in Eq. (19) at variable operating conditions.
Figures 19–21 display the experimental and theoreti-
cal breakthrough curves obtained at different operat-
ing conditions by the Yoon–Nelson model. Both the
Thomas and Yoon–Nelson models could be used to
TABLE 4 Parameters Calculated from Thomas Model for Removal of UO2þ2 Ions on Fixed-Bed Column at Different Initial Concentrations
Q (mL �min�1) Z (cm) C0 (mg � L�1) KTh (L �mg�1 �min�1 � 10�5) qCale (mg �g�1) qExp
e (mg �g�1) R2 MSE
1 3 400 13.685 57.213 56.019 0.995 0.0006656
1 3 540 9.896 60.596 59.147 0.999 0.0009552
1 3 700 8.425 64.806 63.960 0.995 0.0009949
1 1 540 16.059 50.652 50.692 0.997 0.0007531
1 2 540 14.847 53.772 53.050 0.998 0.0003567
1 3 540 9.896 60.596 59.147 0.997 0.0009552
1 3 540 9.896 60.596 59.147 0.999 0.0009552
2 3 540 14.083 56.907 56.745 0.999 0.0005009
3 3 540 20.412 53.963 55.137 0.999 0.0004084
FIGURE 16 Breakthrough curves for UO2þ2 ions sorption at
different bed heights calculated by Thomas model. (Color figure
available online.)
FIGURE 17 Breakthrough curves for UO2þ2 ion sorption at
different flow rates calculated by Thomas model. (Color figure
available online.)
FIGURE 18 Breakthrough curves for UO2þ2 ion sorption at
different initial concentrations calculated by Thomas model.
(Color figure available online.)
O. A. Elhefnawy et al. 142
Dow
nloa
ded
by [
Kin
g Fa
isal
Uni
vers
ity]
at 0
1:04
15
Janu
ary
2014
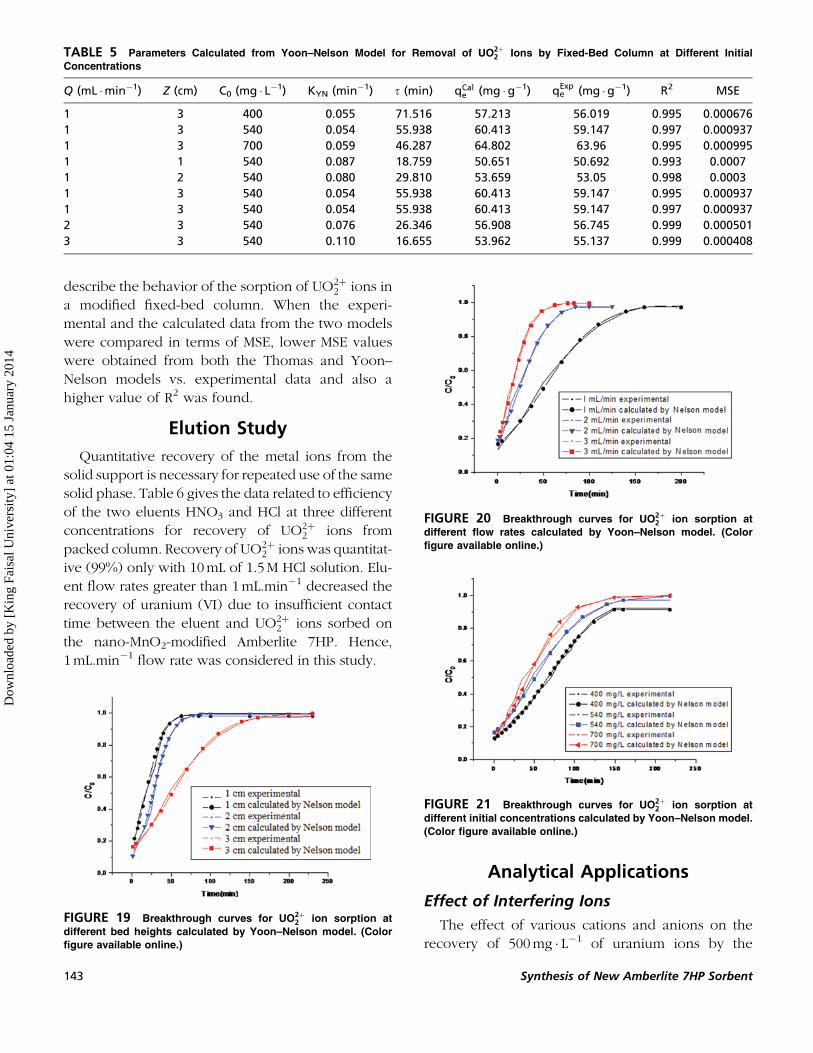
describe the behavior of the sorption of UO2þ2 ions in
a modified fixed-bed column. When the experi-
mental and the calculated data from the two models
were compared in terms of MSE, lower MSE values
were obtained from both the Thomas and Yoon–
Nelson models vs. experimental data and also a
higher value of R2 was found.
Elution Study
Quantitative recovery of the metal ions from the
solid support is necessary for repeated use of the same
solid phase. Table 6 gives the data related to efficiency
of the two eluents HNO3 and HCl at three different
concentrations for recovery of UO2þ2 ions from
packed column. Recovery of UO2þ2 ions was quantitat-
ive (99%) only with 10mL of 1.5M HCl solution. Elu-
ent flow rates greater than 1mL.min�1 decreased the
recovery of uranium (VI) due to insufficient contact
time between the eluent and UO2þ2 ions sorbed on
the nano-MnO2-modified Amberlite 7HP. Hence,
1mL.min�1 flow rate was considered in this study.
Analytical Applications
Effect of Interfering Ions
The effect of various cations and anions on the
recovery of 500mg � L�1 of uranium ions by the
TABLE 5 Parameters Calculated from Yoon–Nelson Model for Removal of UO2þ2 Ions by Fixed-Bed Column at Different Initial
Concentrations
Q (mL �min�1) Z (cm) C0 (mg � L�1) KYN (min�1) s (min) qCale (mg �g�1) qExp
e (mg �g�1) R2 MSE
1 3 400 0.055 71.516 57.213 56.019 0.995 0.000676
1 3 540 0.054 55.938 60.413 59.147 0.997 0.000937
1 3 700 0.059 46.287 64.802 63.96 0.995 0.000995
1 1 540 0.087 18.759 50.651 50.692 0.993 0.0007
1 2 540 0.080 29.810 53.659 53.05 0.998 0.0003
1 3 540 0.054 55.938 60.413 59.147 0.995 0.000937
1 3 540 0.054 55.938 60.413 59.147 0.997 0.000937
2 3 540 0.076 26.346 56.908 56.745 0.999 0.000501
3 3 540 0.110 16.655 53.962 55.137 0.999 0.000408
FIGURE 19 Breakthrough curves for UO2þ2 ion sorption at
different bed heights calculated by Yoon–Nelson model. (Color
figure available online.)
FIGURE 20 Breakthrough curves for UO2þ2 ion sorption at
different flow rates calculated by Yoon–Nelson model. (Color
figure available online.)
FIGURE 21 Breakthrough curves for UO2þ2 ion sorption at
different initial concentrations calculated by Yoon–Nelson model.
(Color figure available online.)
143 Synthesis of New Amberlite 7HP Sorbent
Dow
nloa
ded
by [
Kin
g Fa
isal
Uni
vers
ity]
at 0
1:04
15
Janu
ary
2014
proposed method was studied and the obtained data
are reported in Table 7. Most of the examined cations
and anions do not interfere with the separation and
determination of uranium, and many of them are
tolerated at high levels. However, to study the inter-
ference of various metal ions such as Co2þ, Cd2þ,
and Zr4þ, 10mL of a solution containing 500mg � L�1
of the UO2þ2 ions was mixed with the interfering ions
and subjected to the extraction process. The inter-
ference effect of these elements could be eliminated
by adding 20mL of 60mM of EDTA solution as a
proper masking agent.
Analysis of Uranium in the Real Samples
The new sorbent 7HPNMnO was utilized for UO2þ2
ion separation in real samples collected from some
Egyptian nuclear locations for safeguard verification
purposes; 5mL of the samples were adjusted to pH
3.1 and passed through 0.5 g of 7HPNMnO at a rate
of 1mL.min�1. Based on the optimum conditions of
the experimental separation process, the quantitative
results are given in Table 8. To verify the measured
results, the standard addition method was applied,
and 5mL of the samples were adjusted to pH 3.1
and spiked with 5mL of different concentrations of
uranyl solutions (5, 20mg � L�1), then passed through
0.5 g dry weight of the 7HPNMnO column at a rate of
1mL.min�1 followed by elution with 10mL of 1.5M
HCl. Samples are diluted to reach a maximum con-
centration of 50mg � L�1 to be measured. The results,
which are given in Table 8, point to the efficiency
and accuracy of the procedure for the separation
and determination of UO2þ2 ions from aqueous
solution.
CONCLUSION
In this study, a new sorbent impregnated by nano
manganese dioxide (7HPNMnO) based on a cheap
and commercially available Amberlite 7HP has been
TABLE 6 Recovery of UO2þ2 Ions using Different Concentra-
tions of HNO3 and HCl acids (n¼ 3)
Eluent Volume (mL) Recovery %�RSD (%)
0.5M HNO3 10 65.4� 1.0
1M HNO3 10 77.6� 1.7
1.5M HNO3 10 81.4� 1.2
0.5M HCl 10 80.5� 0.7
1M HCl 10 89.0� 1.2
1.5M HCl 10 99.8� 0.4
Initial sample, 10mL of 500mg � L�1 UO2þ2 ions.
TABLE 7 Effect of Different Anions and Cations on the
Sorption Recovery of UO2þ2 Ions on 7HPNMnO
Ion Added salt
Cations and
anions concentration
(mg � L�1)
Recovery
(%)�RSD (%)
Naþ NaCl 500 99.2� 1.4
Kþ KCl 500 99.3� 1.5
Mgþ2 MgCl2 200 98.4� 1.7
Caþ2 CaCl2 100 98.3� 1.2
Alþ3 AlCl3 100 97.0� 0.9
Coþ2 Co(No3)2 50 90.3� 1.7
Cdþ2 Cd(No3)2 50 88.7� 1.3
Zrþ4 ZrOCl2 50 80.1� 1.6
Cl� KCl 500 99.3� 1.0
SO�24 Na2SO4 100 98.3� 1.1
NO�3 KNO3 500 99.6� 0.5
After removing the interfering effects by 60mM EDTA
(20mL)
Ion
Cations and anions
concentration (mg � L�1)
Recovery
(%)�RSD (%)
Coþ2 50 99.2� 1.1
Cdþ2 50 99.1� 1.3
Zrþ4 50 99.4� 1.5
TABLE 8 Determination of UO2þ2 Ions in Real Samples (n¼ 3)
Sample
ID
Sample
(mg � L�1)
Spiked
(mg � L�1)
Total
(mg � L�1)
Measured
conc.
(mg � L�1)
Recovery
(%)�RSD
1 519 0 519 515 99.2� 0.3
519 20 539 537 99.6� 0.4
519 5 524 521 99.4� 0.4
2 615 0 615 610 99.1� 0.2
615 20 635 631 99.4� 0.2
615 5 620 615 99.2� 0.2
3 640 0 640 635.4 99.2� 0.3
640 20 660 656 99.4� 0.2
640 5 645 640 99.2� 0.2
4 574 0 574 570 99.3� 0.3
574 20 594 593 99.8� 0.3
574 5 579 576 99.5� 0.2
5 505 0 505 501.4 99.3� 0.3
505 20 525 524.5 99.9� 0.3
505 5 510 507 99.4� 0.4
6 545 0 545 540 99.1� 0.3
545 20 565 561 99.3� 0.3
545 5 550 545 99.1� 0.2
O. A. Elhefnawy et al. 144
Dow
nloa
ded
by [
Kin
g Fa
isal
Uni
vers
ity]
at 0
1:04
15
Janu
ary
2014
prepared using a simple reduction method. The new
sorbent was characterized using different spectro-
metric techniques. It was found suitable for UO2þ2
ion separation in aqueous solution within the experi-
mental conditions of contact time, initial concen-
tration, bed height, and flow rate considered in this
study. The kinetic experimental data were properly
tested by the pseudo-first-order, pseudo-second-
order, and Elovich kinetic models. The experimental
results were also analyzed using the Langmuir and
Freundlich isotherm models. Error analysis showed
that the Thomas and Yoon–Nelson models were
applied to the experimental data to predict the
breakthrough curves and to determine the kinetic
parameters for the column. EDTA was found to be
suitable for UO2þ2 ion separation from Co(II), Cd(II),
and Zr(IV) in aqueous solution using the new sor-
bent. Furthermore, the developed sorbent resin
was successfully applied for the separation of uranyl
ions in safeguard applications.
REFERENCES
1. IAEA, Technical Reports Series No. 341, Analytical Techniques inUranium Exploration and Ore Processing, 1992.
2. Dojozan, D.; Pournaghi-Azar, M. H.; Toutounchi-Asr, J. Preconcentra-tion of trace uranium from seawater with solid phase extractionfollowed by differential pulse polarographic determination in chloro-form elute. Talanta 1998, 46, 123–128.
3. Salah, J. E.; Husein, M. M. Removal of heavy metals from aqueoussolutions by precipitation–filtration using novel organo-phosphorusligands. Sep. Sci. Technol. 2008, 43, 3461–3475.
4. Smara, A.; Delimi, R.; Chainet, E.; Sandeaux, J. Removal of heavymetals from diluted mixtures by a hybrid ion-exchange=electrodialysisprocess. Sep. Purif. Technol. 2007, 57, 103–110.
5. Malhotra, R. K.; Satyanarayana, K. Estimation of trace impurities inreactor-grade uranium using ICP-AES. Talanta 1999, 50, 601–608.
6. Walton, H. F.; Rocklin, R. D. Ion Exchange in Analytical Chemistry;CRC Press: Boca Raton, 1990, 44.
7. Metcalf, L.; Eddy, H. P. Wastewater Engineering Treatment andReuse, 4th ed.; McGraw Hill: New York, 2003, 1.
8. Zavodska, L.; Kosorinova, E.; Scerbakova, L.; Lesny, J. Environmentalchemistry of uranium. Hungarian Electronic Journal of Sciences 2008,1–19. www.heja.szif.hu/ENV/ENV-081221-A/env081221a.pdf
9. Aklil, A.; Mouflih, M.; Sebti, S. Removal of heavy metal ions fromwater by using calcined phosphate as a new adsorbent. J. Hazard.Mater. A 2004, 112, 183–190.
10. Ko, D. C. K.; Cheung, C. W.; Choy, K. K. H.; Porter, J. F.; McKay, G.Sorption equilibrium of metal ions on bone char. Chemosphere 2004,54, 273–281.
11. Donat, R.; Aytas, S. Adsorption and thermodynamic behavior ofuranium (VI) on Ulva sp.—Na bentonite composite adsorbent. J.Radional. Nucl. Chem. 2005, 265, 107–114.
12. Bosco, S. M. D.; Jimenez, R. S.; Carvalho, W. A. Removal of toxicmetals from wastewater by Brazilian natural scolecite. J. Colloid Inter.Sci. 2005, 281, 424–431.
13. Nashaat, N.; Nassar, N. Rapid removal and recovery of Pb(II) fromwastewater by magnetic Nanosorbents. J. Hazard. Mater. 2010,184, 538–546.
14. Tratnyek, P. G.; Johnson, R. L. Nanotechnologies for environmentalcleanup. Nano Today 2006, 1, 44–48.
15. Abdolmohammad-Zadeh, H.; Rezvani, Z.; Sadegh, G. H. I.; Zorufi, E.Layered double hydroxides: A novel nano-sorbent for solid-phaseextraction. Anal. Chim. Acta 2011, 685, 212–219.
16. Ansell, R. J. Molecularly imprinted polymers for enantioseparation ofchiral drugs. ADDR. 2005, 57, 1809–1835.
17. Lu, C.; Chiu, H.; Bai, H. Comparisons of adsorbent cost for theremoval of zinc (II) from aqueous solution by carbon nanotubesand activated carbon. J. Nanosci. Nanotechnol. 2007, 7, 1647–1652.
18. Schierz, A.; Zanker, H. Aqueous suspensions of carbon nanotubes:surface oxidation, colloidal stability and uranium sorption. Environ.Pollut. 2009, 157, 1088–1094.
19. Hayashi, H.; Hakuta, Y. Hydrothermal synthesis of metal oxidenanoparticles in supercritical water. Materials 2010, 3, 3794–3817.
20. Niasari, M. S.; Mirb, N.; Davara, F. A novel precursor in preparationand characterization of nickel oxide nanoparticles via thermaldecomposition approach. J. Alloys Compounds 2010, 493, 163–168.
21. Gushikem, Y.; Rosatto, S. Metal oxide thin films grafted on silica gelsurfaces: Recent advances on the analytical application of thesematerials. J. Braz. Chem. Soc. 2001, 12, 695–705.
22. Uheida, A.; Iglesias, M.; Fontas, C.; Hidalgo,M.; Salvado, V.; Zhang, Y.;Muhammed, M. Sorption of palladium(II), rhodium(III), and platinu-m(IV) on Fe3O4 nanoparticles. J. Colloid Interface Sci. 2006, 301,402–408.
23. Hu, J.; Chen, G.; Lo, I. M. C. Removal and recovery of Cr(VI) fromwastewater by maghemite nanoparticles. Water Res. 2005, 39,4528–4536.
24. Sharma, Y. C.; Srivastava, V.; Upadhyay, S. N.; Weng, C. H. Aluminananoparticles for the removal of Ni(II) from aqueous solutions. Ind.Eng. Chem. Res. 2008, 47, 8095–8100.
25. Silvio, R.; Taffarel, J. R. Removal of Mn2þ from aqueous solution bymanganese oxide coated zeolite. Miner. Eng. 2010, 23, 1131–1138.
26. Richter, M.; Berndt, H.; Eckelt, R.; Schneider, M.; Fricke, R.Zeolite-mediated removal of NOx by NH3 from exhaust streams atlow temperatures. Catalysis Today 1999, 54, 531–545.
27. Smiciklas, I.; Onjia, A.; Raicevic, S. Experimental design approach inthe synthesis of hydroxyapatite by neutralization method. Sep. Purif.Technol. 2005, 44, 97–102.
28. Tiwaria, D.; Laldanwnglianaa, C.; Choib, C.; Lee, S. M.Manganese-modified natural sand in the remediation of aquaticenvironment contaminated with heavy metal toxic ions. Chem.Eng. J., 2011, 171, 958–966.
29. Marczenko, Z. Spectrophotometric Determination of Elements, 1sted.; John Wiley & Sons, Inc.: New York, 1976, 609.
30. Hana, R.; Wang, Y.; Hana, P.; Shi, J.; Yang, J.; Lub, Y. Removal ofmethylene blue from aqueous solution by chaff in batch mode.J. Hazard. Mater. B 2006, 137, 550–557.
31. Lagergren, S. About the theory of so-called sorption ofsoluble substances. K. Sven. Vetensk. akad. Handl. Band 1898, 24,21–39.
32. Ho, Y. S.; McKay, G. Pseudo second-order model for sorptionprocesses. Process Biochem. 1999, 34, 451–465.
33. Azizian, S. Kinetic models of sorption: a theoretical analysis. J. ColloidInterface Sci. 2004, 276, 47–52.
34. Abd El-Latif, M. M.; Elkady, M. F. Kinetics study and thermodynamicbehavior for removing cesium, cobalt and nickel ions from aqueoussolution using nano-zirconium vanadate ion exchanger. Desalination2011, 271, 41–54.
35. Crini, G.; Peindy, H. N.; Gimbert, F.; Robert, C. Removal of C. I. basicgreen 4 malachite green from aqueous solutions by adsorption usingcyclodextrin-based adsorbent: Kinetic and equilibrium studies. Sep.Purif. Technol. 2007, 53, 97–110.
36. Weber, W. J.; Morris, J. C. Kinetics of adsorption on carbon from sol-ution. J. Sanit. Eng. Div. Am. Soc. Civ. Eng. 1963, 89, 31–59.
37. Abd El-Latif, M. M.; Ibrahim, A. M. Removal of reactive dye fromaqueous solutions by adsorption onto activated carbons preparedfrom oak sawdust. Desalin. Water Treat. 2010, 20, 102–113.
145 Synthesis of New Amberlite 7HP Sorbent
Dow
nloa
ded
by [
Kin
g Fa
isal
Uni
vers
ity]
at 0
1:04
15
Janu
ary
2014
38. Ho, Y. S. Review of second-order models for sorption systems. J.Hazard. Mater. 2006, 136, 681–689.
39. Debnath, S.; Ghosh, U. C. Nanostructured hydrous titanium(IV)oxide: Synthesis, characterization and Ni(II) adsorption behavior.Chem. Eng. J. 2009, 152, 480–491.
40. Langmuir, I. The adsorption of gases on plane surfaces of glass, micaand platinum. J. Am. Chem. Soc. 1918, 40, 1361–1403.
41. Freundlich, H. M. F. Uber die adsorption in losungen. Zeitschrift furPhysikalische Chemie 1906, 57, 385–470.
42. Debnath, S.; Ghosh, U. C. Nanostructured hydrous titanium(IV)oxide: Synthesis, characterization and Ni(II) adsorption behavior.Chem. Eng. J. 2009, 152, 480–491.
43. Cavasa, L.; Karabaya, Z.; Alyuruka, H.; Ganc, H.; Demirc, G. K. Tho-mas and artificial neural network models for the fixed-bed sorption ofmethylene blue by a beach waste Posidonia oceanica (L.) dead leaves.Chem. Eng. J. 2011, 171, 557–562.
44. Thomas, H. C. Heterogeneous ion exchange in flowing system. J. Am.Chem. Soc. 1944, 66, 1664–1666.
45. Han, R. P.; Wang, Y.; Zou, W. H.; Wang, Y. F.; Shi, J. Comparison oflinear and nonlinear analysis in estimating the Thomas model para-meters for methylene blue sorption onto natural zeolite in fixed-bedcolumn. J. Hazard. Mater. 2007, 145, 331–335.
46. Yoon, Y. H.; Nelson, J. H. Application of gas adsorption kinetics,Part 1: A theoretical model for respirator. Am. Ind. Hyg. Assoc. J.1984, 45, 509.
47. Trgo, M.; Medvidovic, N. V.; Peric, J. Application of mathematicalempirical models to dynamic removal of lead on natural zeolite clinopti-lolite in a fixed bed column. Ind. J. Chem. Technol. 2011, 18, 123–133.
48. Yuan, A.; Wang, X.; Wang, Y.; Hu, J. Comparison of nano-MnO2
derived from different manganese sources and influence of activematerial weight ratio on performance of nano-MnO2=activated car-bon super capacitor. Energy Conversion Manage. 2010, 51,2588–2594.
49. Nibou, D.; Khemaissia, S.; Amokrane, S.; Barkat, M.; Chegrouche, S.;Mella, A. Removal of UO2þ
2 onto synthetic NaA zeolite. Charac-terization, equilibrium and kinetic studies. J. Chem. Eng. 2011,172, 296–305.
50. Allen, S. J.; Mckay, G. K.; Khader, Y. H. Intraparticle diffusion ofa basic dye during adsorption onto sphagnum peat. Environ. Pollut.1989, 56, 39–50.
51. Ho, Y. S.; Ng, J. C.; McKay, Y. G. Kinetics of pollutant sorption bybiosorbents: Review. Sep. Purif. Methods. 2000, 29, 189–232.
52. Sari, A.; Tuzen, M.; Citak, D.; Soylak, M. Equilibrium, kinetic andthermodynamic studies of adsorption of Pb(II) from aqueoussolution onto Turkish kaolinite clay. J. Hazard. Mater. 2007, 149,283–291.
53. Aravindhan, R.; Raghava Rao, J.; Unni Nair, B. Preparation and char-acterization of activated carbon from marine macro-algal biomass. J.Hazard. Mater. 2009, 162, 688–694.
54. Vijayaraghavan, K.; Jegan, J.; Palanivelu, K.; Velan, M. Removal ofnickel (II) ions from aqueous solution using crab shell particles ina packed bed up flow column. J. Hazard. Mater. 2004, 113,223–230.
55. Goel, J.; Kadirvelu, K.; Rajagopal, C.; Garg, V. K. Removal of lead (II)by sorption using treated granular activated carbon: Batch and col-umn studies. J. Hazard. Mater. 2005, 125, 211–220.
O. A. Elhefnawy et al. 146
Dow
nloa
ded
by [
Kin
g Fa
isal
Uni
vers
ity]
at 0
1:04
15
Janu
ary
2014