soot volume fraction fields in unsteady axis-symmetric flames by continuous laser extinction...
TRANSCRIPT
Soot volume fraction fields in unsteadyaxis-symmetric flames by continuous
laser extinction technique.
Muhammad Kashif,1 Jerome Bonnety,1 Philippe Guibert,1 CelineMorin,2 and Guillaume Legros1,∗
1 UPMC Univ Paris 06, CNRS UMR 7190, Institut Jean le Rond d’Alembert, Paris, France2 UVHC, TEMPO, F-59313 Valenciennes, France
Abstract: A Laser Extinction Method has been set up to provide two-dimensional soot volume fraction field time history at a tunable frequencyup to 70 Hz inside an axis-symmetric diffusion flame experiencing slowunsteady phenomena preserving the symmetry. The use of a continuouswave laser as the light source enables this repetition rate, which is an incre-mental advance in the laser extinction technique. The technique is shownto allow a fine description of the soot volume fraction field in a flickeringflame exhibiting a 12.6 Hz flickering phenomenon. Within this range ofrepetition rate, the technique and its subsequent post-processing requireneither any method for time-domain reconstruction nor any correction forenergy intrusion. Possibly complemented by such a reconstruction method,the technique should support further soot volume fraction database inoscillating flames that exhibit characteristic times relevant to the currentefforts in the validation of soot processes modeling.
© 2012 Optical Society of America
OCIS codes: (120.1740) Combustion diagnostics; (290.2200) Extinction; (100.1830) Decon-volution; (290.1090) Aerosol and cloud effects.
References and links1. M. D. Smooke, C. S. Mcenally, L. D. Pfefferle, R. J. Hall, and M. B. Colket, “Computational and experimental
study of soot formation in a coflow, laminar diffusion flame,” Comb. Flame 117, 117–139 (1999).2. P. Greenberg and J. Ku, “Soot volume fraction imaging,” Appl. Opt. 36, 5514–5522 (1997).3. A. Fuentes, G. Legros, A. Claverie, P. Joulain, J. P. Vantelon, and J. L. Torero, “Interactions between soot and
CH* in a laminar boundary layer type diffusion flame in microgravity,” Proc. Combust. Inst. 31, 2685–2692(2007).
4. F. Liu, K. A. Thomson, and G. J. Smallwood, “Effects of soot absorption and scattering on LII intensities inlaminar coflow diffusion flames,” J. Quant. Spectrosc. Radiat. Trans. 109, 337–348 (2008).
5. G. Legros, A. Fuentes, P. Ben-Abdallah, J. Baillargeat, P. Joulain, J. P. Vantelon, and J. L. Torero, “Three-dimensional recomposition of the absorption field inside a non-buoyant sooting diffusion flame,” Opt. Lett. 30,3311–3313 (2005).
6. I. M. Kennedy, “Modeling and measurements of soot and species in a laminar diffusion flame,” Prog. EnergyCombust. Sci. 23, 95–132 (1997).
7. G. Blanquart and H. Pitsch, “Analyzing the effects of temperature on soot formation with a joint volume-surface-hydrogen model,” Comb. Flame 156, 1614–1626 (2009).
8. G. M. Faeth and G. S. Samuelsen, “Fast reaction non-premixed combustion,” Prog. Energy Combust. Sci. 12,305–372 (1986).
9. L. D. Chen, J. P. Seaba, W. M. Roquemore, and L. P. Gore, “Buoyant diffusion flames,” Proc. Combust. Inst. 22,677–684 (1988).
#175440 - $15.00 USD Received 31 Aug 2012; revised 24 Oct 2012; accepted 27 Nov 2012; published 11 Dec 2012(C) 2012 OSA 17 December 2012 / Vol. 20, No. 27 / OPTICS EXPRESS 28742
10. K. C. Smyth, C. R. Shaddix, and D. A. Everest, “Aspects of soot dynamics as revealed by measurements ofbroadband fluorescence and flame luminosity in flickering diffusion flames,” Comb. Flame 111, 185–207 (1997).
11. J. Hentschel, R. Suntz, and H. Bockhorn, “Soot formation and oxidation in oscillating methane-air diffusionflames at elevated pressure,” Appl. Opt. 44, 6673–6681 (2005).
12. G. Legros, T. Gomez, M. Fessard, T. Gouache, T. Ader, P. Guibert, P. Sagaut, and J. L. Torero, “Magneticallyinduced flame flickering,” Proc. Combust. Inst. 33, 1095–1103 (2011).
13. S. Mahalingam, B. J. Cantwell, and J. H. Ferziger, “Stability of low-speed reacting flows,” Phys. Fluids A 33,1533–1543 (1991).
14. V. Katta, W. M. Roquemore, A. Menon, S. Y. Lee, R. J. Santoro, and T. A. Lintzinger, “Impact of soot on flameflicker,” Proc. Combust. Inst. 32, 1343–1350 (2009).
15. R. J. Santoro, H. G. Semerjian, and R. A. Dobbins, “Soot particle measurements in diffusion flames,” Combust.Flame 51, 203–218 (1983).
16. K. J. Daun, K. A. Thomson, F. Liu, and G. J. Smallwood, “Deconvolution of axisymmetric flame properties usingTikhonov regularization,” Appl. Opt. 45, 4638–4646 (2006).
17. E. O. Akesson and K. J. Daun, “Parameter selection methods for axisymmetric flame tomography throughTikhonov regularization,” Appl. Opt. 47, 407–416 (2008).
18. C. P. Arana, M. Pontoni, S. Sen, and I. K. Puri, “Field measurements of soot volume fractions in laminar partiallypremixed coflow ethylene/air flames,” Comb. Flame 138, 362–372 (2004).
19. K. C. Smyth and C. R. Shaddix, “The elusive history of m =1.57-0.56i for the refractive index of soot,” Comb.Flame 107, 314–320 (1996).
1. Introduction
Comprehensive insights into the physical and chemical processes that drive soot productionare necessary to define strategies aiming at the reduction of soot emissions from combustiondevices. Understanding formation, transport and oxidation of soot in flames will provide therequired fundamental knowledge, leading to relevant modeling, therefore to acute assessmentof the aforementioned strategies.
Especially due to the late development of sophisticated optical sensors, the non-intrusiveoptical techniques exhibit now both high spatial and high time resolution. The most popularexperimental techniques that enable soot tracking infer soot volume fraction from light extinc-tion [1, 2] or induced incandescence [3, 4] by soot particles. Although sophisticated strategiescan complement these diagnostics to map soot inside practical, therefore three-dimensionalflames [5], academic configurations such as axis-symmetric flames [1,2,4], exhibit the straightforward advantage that for symmetry reason both the flow pattern and the optical pathway arefairly simple.
Steady laminar axis-symmetric diffusion flames have then been extensively investigated tovalidate soot formation and oxidation models [1,6,7], providing relatively tractable models forthe simulation of more practical but relatively intractable turbulent diffusion flames [8]. How-ever, the most advanced models are governed by a range of characteristic times that cannot becovered within steady laminar flames. As an illustration, Blanquart and Pitsch [7] lately incor-porated a model of soot particle surface reactivity in their steady laminar flame simulations.These authors clearly showed that this reactivity is found to highly depend on the particle resi-dence time in the flame. Therefore, extending the validation of these advanced models requiresexperimental data extracted from still academic but unsteady flames.
Among unsteady regimes, flame flickering has been largely documented experimentally[9–12], theoretically [13], and numerically [14]. This oscillating phenomenon, whose frequencyis about 12 Hz, indeed characterizes transitional flames from laminar to turbulent regimes andtherefore creates a wider range of characteristic times than steady flames. Moreover, flickeringis identified as an axis-symmetric mode of a convective instability, which preserves the axis-symmetric feature of the flame. Nevertheless, few experimental studies [10,11,14] tracked sootin such flames. While Katta et al. [14] qualitatively used flame luminous intensity attributedto soot and captured by an ICCD camera, Smyth et al. [10] and Hentschel et al. [11] extractedinstantaneous two-dimensional soot volume fraction fields from the Laser Induced Incandes-
#175440 - $15.00 USD Received 31 Aug 2012; revised 24 Oct 2012; accepted 27 Nov 2012; published 11 Dec 2012(C) 2012 OSA 17 December 2012 / Vol. 20, No. 27 / OPTICS EXPRESS 28743
cence (LII) technique. In these latter studies, the soot volume fraction field time history hadto be reconstructed from fields sampled at the Nd:YAG laser fundamental frequency (10 Hz).Although LII setups with high repetition rate are currently developed, there is still no evidencethat such a technique is non-intrusive due to its high excitation energy.
In the present study, a Laser Extinction Method (2D-LEM) is carried out to provide time his-tory of soot volume fraction at a tunable frequency inside a flickering axis-symmetric diffusionflame. The original contribution here consists in providing a technique with a fine repetitionrate, that does not need any methodology for time-domain reconstruction. The experimentalprocedure is first described. At a rate of 70 fields per second, the relevance of the procedureis assessed on a steady flame, then on a flickering one. Thus, the technique is shown to enablesoot volume fraction mapping in unsteady axis-symmetric flames. The flexible triggering of thetechnique also allows the reconstruction of soot volume fraction time history such as the oneexhibited in the movie attached as a supplementary material (see Media 1).
2. Experimental procedure
2.1. Burner configuration
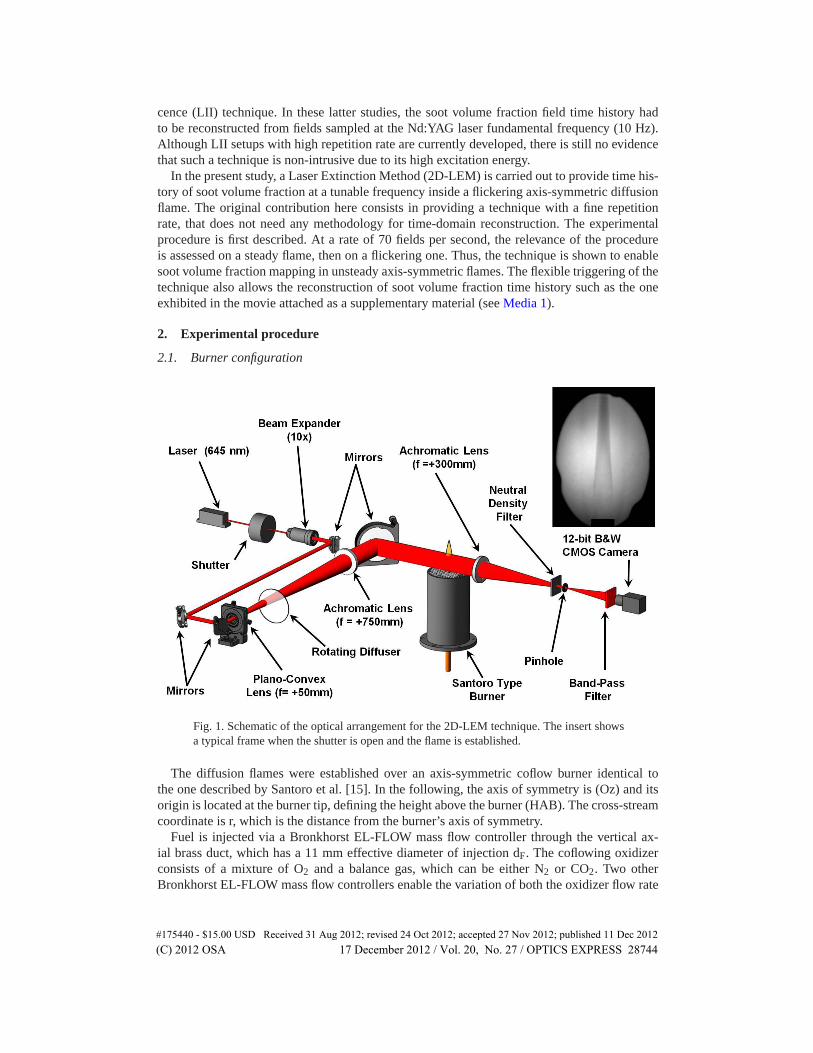
Fig. 1. Schematic of the optical arrangement for the 2D-LEM technique. The insert showsa typical frame when the shutter is open and the flame is established.
The diffusion flames were established over an axis-symmetric coflow burner identical tothe one described by Santoro et al. [15]. In the following, the axis of symmetry is (Oz) and itsorigin is located at the burner tip, defining the height above the burner (HAB). The cross-streamcoordinate is r, which is the distance from the burner’s axis of symmetry.
Fuel is injected via a Bronkhorst EL-FLOW mass flow controller through the vertical ax-ial brass duct, which has a 11 mm effective diameter of injection dF. The coflowing oxidizerconsists of a mixture of O2 and a balance gas, which can be either N2 or CO2. Two otherBronkhorst EL-FLOW mass flow controllers enable the variation of both the oxidizer flow rate
#175440 - $15.00 USD Received 31 Aug 2012; revised 24 Oct 2012; accepted 27 Nov 2012; published 11 Dec 2012(C) 2012 OSA 17 December 2012 / Vol. 20, No. 27 / OPTICS EXPRESS 28744
and the oxygen molar content, XO2 , in the oxidizer stream. The oxidizer mixture flow is thenintroduced into a concentric 102 mm inner diameter brass cylinder. Further details about theburner can be found in Ref.12.
2.2. Soot volume fraction measurement
Figure 1 exhibits the schematic of the 2D-LEM optical arrangement surrounding the burner.Its design mainly follows the recommendations by Greenberg and Ku [2]. A 100 mW (± 0.5mW) Spectra-Physics Excelsior CW Laser operating at 645 nm (-5/+7 nm) was used as thecontinuous light source. The selection of the wavelength is driven by the required trade-offbetween detection sensitivity and small contribution of scattering into the laser extinction. Theoutcoming 1 mm diameter beam passes through a Newport Oriel Electronic shutter that chopsthe source at a tunable frequency up to 150 Hz. The beam expander is composed of a setof lenses and mirrors that provide within a decent setup spatial extension a collimated beamoutcoming with a diameter of 70 mm. A rapidly rotating glass diffuser plate is inserted into thebeam expander system to avoid the coherent effects of speckle and diffraction, which in turnenhances the spatial uniformity of the beam intensity. Once the flame passed through, the beamis decollimated. A pinhole with an aperture diameter of 800 μm ± 5 μm is located at the focalpoint to provide a telecentric configuration possessing depth invariant magnification and to filterthe beam steering due to the temperature gradient that would bias the deconvolution process.The resulting virtual image formed is re-imaged by a Photon Focus MV1 12-bit progressivescan monochrome camera mounted with a conventional lens and equipped with a narrow bandfilter centered at 645 nm (±2 nm) and with a band width at one half the transmissivity maximumof 20 nm. The camera CMOS array is composed of 1312x1082 pixels and allows frame ratesup to 108 Hz at full resolution and can be as high as 500 Hz at reduced resolution and exposuretime. The maximum frame rate was about 160 Hz with the exposure time (6ms) and resolution(1250x500) used for the current study. The full resolution provides a spatial resolution of 50μm for the projected data. The camera pixel response was found to be fairly linear over therange of exposure time and laser light power employed in current study.
A digital pulse generator (DG) controls the occurrence and the duration of the CMOS ex-posure, together with the shutter opening. A frame grabber records the frames captured by thecamera. The insert shown in Fig. 1 is a typical frame obtained when the flame is establishedand the shutter is open. The shadow of burner tip can be seen at the bottom of the picture.
As a reference signal, the output voltage from a photomultiplier tube (PMT) was used tophase lock the first frame triggering by the DG with the flame oscillation [14]. The delay timebetween the trigger signal from the PMT and the DG output was adjusted to modify the phaselocation with respect to the oscillation.
To compute the extinction measurement on every pixel, a sequence of 4 frames is requested,i.e. 1 frame with laser on and flame established (attenuated laser light intensity I′λ ), 1 frame
with laser off and flame established (background and flame emission intensity I f ,bλ ), 1 frame
with laser on and without flame (unattenuated laser light intensity Ioλ ), and 1 frame with laser
off and without flame (background intensity, Ibλ ). The latter two are recorded before every test.
At a given HAB z j, according to the Beer-Lambert law, the monochromatic transmittance ofa given ray, as measured by the impinged pixel (see the LHS term in Eq. (1)), is related tothe local extinction coefficient κext
λ (r,z j) along the ray pathway of length L inside the flame asfollows:
log
(I′λ − I f ,b
λIoλ − Ib
λ
)=−
∫ L
0κext
λ (r,z j)ds (1)
As a line-of-sight technique, LEM needs to be combined with a subsequent deconvolution
#175440 - $15.00 USD Received 31 Aug 2012; revised 24 Oct 2012; accepted 27 Nov 2012; published 11 Dec 2012(C) 2012 OSA 17 December 2012 / Vol. 20, No. 27 / OPTICS EXPRESS 28745
method to compute κextλ (r,z j) from Eq. (1). Numerous numerical methods were developed to
this end. As prescribed by Daun et al. [16], an onion-peeling method is performed here as itnaturally takes advantage of the grid that a digital camera provides. At any z j, the r-axis isdiscretized and a system of linear equations Ax = b is derived from Eq. (1). x is the unknownvector of discretized κext
λ (ri,z j), the vector b contains the discretized LHS term of Eq. (1),and A is a matrix composed of chord lengths that can be readily calculated using simple geo-metrical considerations. Typically, with the optical arrangement specified above, A is a 70x70matrix. A is also an upper triangular matrix, therefore x might be solved for using simple back-substitution. However, the aforementioned set of equations can be shown to be ill-conditioned.As recommended by Akesson and Daun [17], a Tikhonov regularization stabilized here the de-convolution process. Following their procedure, the value of the regularization parameter Λ isselected so that it is located in the corner of the L-curve, obtained by plotting log10 (‖AxΛ −b‖2)versus log10 (‖LxΛ‖2). xΛ is the regularized solution and L is a discrete approximation of the∇-operator. After a set of manual inspections, Λ was set to 0.005, which was shown to be a fairtrade-off between accuracy and stability for the post-processing of most of the profiles, exceptthose located close to the burner lip. The post-processing within this latter region is discussedbelow.
Once all the j lines have been processed, the Mie theory allows the field distribution ofκext
λ (ri,z j) to be transformed into the soot volume fraction one, assuming that particles are inthe Rayleigh limit:
fv (ri,z j) =λ κext
λ (ri,z j)
6π E(m)(2)
where E(m) is a function of the complex refractive index m of soot. To overcome the contro-versial issue of this parameter evaluation together with the relative magnitude of scattering intothe extinction phenomenon, we proceeded as Arana et al. (see Fig. 4 in Ref. [18]), adjustingE(m) to reproduce the peak soot volume fraction measured by Santoro et al. [15] at HAB=40mm. The adjusted E(m) (0.42) is close to the one found by Arana et al. (0.38) who performed a2D-LEM at a slightly lower wavelength (632.8 nm). The procedure then induces a discrepancylower than 8% in magnitude and 5% in location over the remaining peaks.
3. Results and discussion
3.1. Constants and parameters
The following investigations are restricted to diffusion flames established at atmospheric pres-sure and constant room temperature of 295 K. Ethylene is chosen as fuel for its extensivelydocumented sooting behavior, especially on the Santoro’s configuration. A single ethylene flowrate of 6 ± 0.12 cm3/s was established, corresponding to a mean fuel injection velocity of 6.31± 0.13 cm/s, i.e. to a fuel exit Reynolds number of ReF=80. A single oxidizer flow rate was setat 1250 ± 33.33 cm3/s. The oxidizer is composed of 55% of oxygen in volume. In these condi-tions, the flame is steady when nitrogen is used as the balance gas into the oxidizer. Conversely,flickering occurs with a fundamental frequency of 12.6 Hz when the balance gas is carbon diox-ide. Although this behavior deserves further investigations, this trend can be attributed mainlyto the increase of the oxidizer density when it contains CO2 instead of N2. Indeed, the densitydisparity between the combustion products and the oxidizer flow drives the instability, whencoupled with the influence of gravity.
The shutter was triggered so that periodically the laser beam passed through the flame during1/140 s, then was blocked during the same duration. 0.5 ms after the shutter opened, the cameraexposure was requested for 6 ms. 0.5 ms after the shutter closed, the camera exposure wasalso requested for 6 ms. In that way, I f ,b
λ , recorded on the second frame, can be shown to be
#175440 - $15.00 USD Received 31 Aug 2012; revised 24 Oct 2012; accepted 27 Nov 2012; published 11 Dec 2012(C) 2012 OSA 17 December 2012 / Vol. 20, No. 27 / OPTICS EXPRESS 28746
also the background and flame emission intensity at the time of the first frame with a maximumdiscrepancy lower than 3%. Following this procedure, 70 soot volume fraction maps per secondcan be provided.
3.2. Steady flame
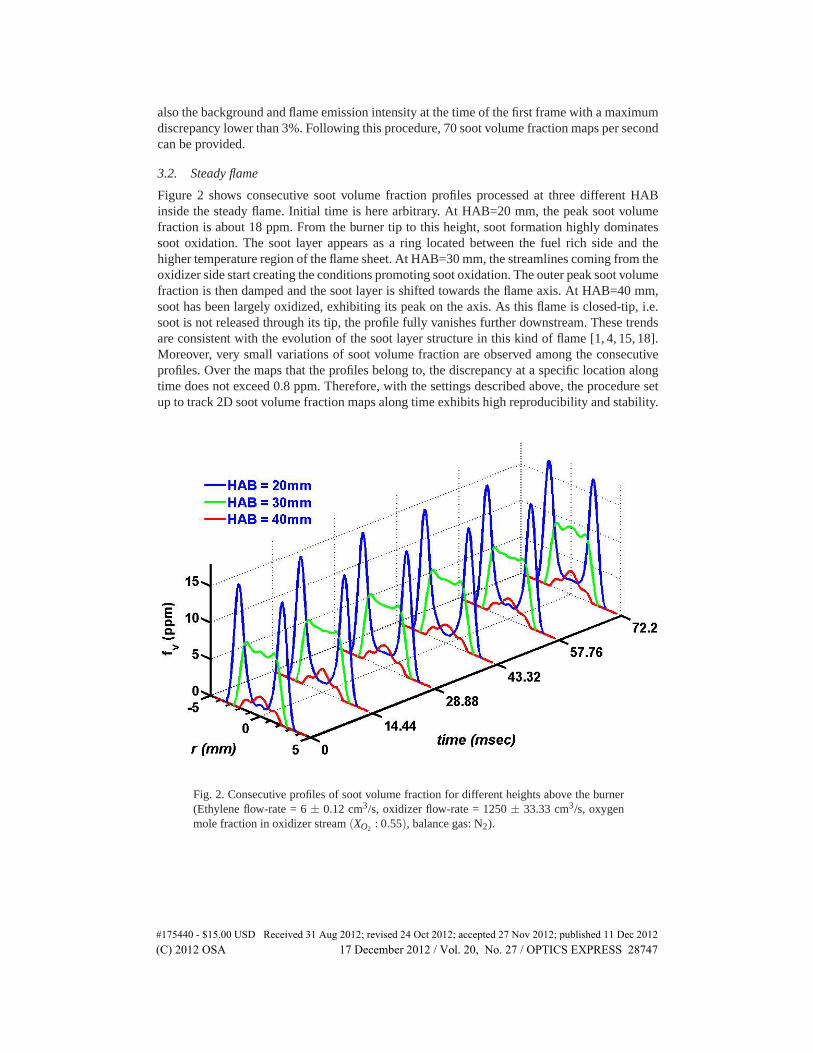
Figure 2 shows consecutive soot volume fraction profiles processed at three different HABinside the steady flame. Initial time is here arbitrary. At HAB=20 mm, the peak soot volumefraction is about 18 ppm. From the burner tip to this height, soot formation highly dominatessoot oxidation. The soot layer appears as a ring located between the fuel rich side and thehigher temperature region of the flame sheet. At HAB=30 mm, the streamlines coming from theoxidizer side start creating the conditions promoting soot oxidation. The outer peak soot volumefraction is then damped and the soot layer is shifted towards the flame axis. At HAB=40 mm,soot has been largely oxidized, exhibiting its peak on the axis. As this flame is closed-tip, i.e.soot is not released through its tip, the profile fully vanishes further downstream. These trendsare consistent with the evolution of the soot layer structure in this kind of flame [1, 4, 15, 18].Moreover, very small variations of soot volume fraction are observed among the consecutiveprofiles. Over the maps that the profiles belong to, the discrepancy at a specific location alongtime does not exceed 0.8 ppm. Therefore, with the settings described above, the procedure setup to track 2D soot volume fraction maps along time exhibits high reproducibility and stability.
Fig. 2. Consecutive profiles of soot volume fraction for different heights above the burner(Ethylene flow-rate = 6 ± 0.12 cm3/s, oxidizer flow-rate = 1250 ± 33.33 cm3/s, oxygenmole fraction in oxidizer stream (XO2 : 0.55), balance gas: N2).
#175440 - $15.00 USD Received 31 Aug 2012; revised 24 Oct 2012; accepted 27 Nov 2012; published 11 Dec 2012(C) 2012 OSA 17 December 2012 / Vol. 20, No. 27 / OPTICS EXPRESS 28747
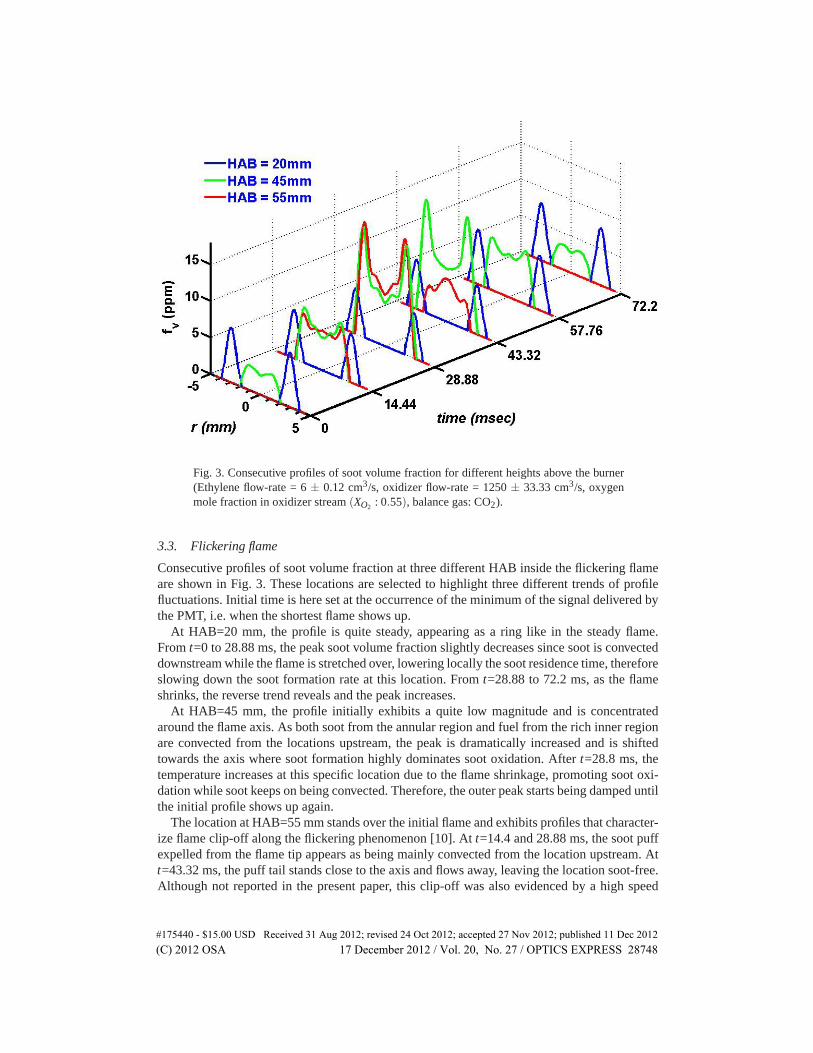
Fig. 3. Consecutive profiles of soot volume fraction for different heights above the burner(Ethylene flow-rate = 6 ± 0.12 cm3/s, oxidizer flow-rate = 1250 ± 33.33 cm3/s, oxygenmole fraction in oxidizer stream (XO2 : 0.55), balance gas: CO2).
3.3. Flickering flame
Consecutive profiles of soot volume fraction at three different HAB inside the flickering flameare shown in Fig. 3. These locations are selected to highlight three different trends of profilefluctuations. Initial time is here set at the occurrence of the minimum of the signal delivered bythe PMT, i.e. when the shortest flame shows up.
At HAB=20 mm, the profile is quite steady, appearing as a ring like in the steady flame.From t=0 to 28.88 ms, the peak soot volume fraction slightly decreases since soot is convecteddownstream while the flame is stretched over, lowering locally the soot residence time, thereforeslowing down the soot formation rate at this location. From t=28.88 to 72.2 ms, as the flameshrinks, the reverse trend reveals and the peak increases.
At HAB=45 mm, the profile initially exhibits a quite low magnitude and is concentratedaround the flame axis. As both soot from the annular region and fuel from the rich inner regionare convected from the locations upstream, the peak is dramatically increased and is shiftedtowards the axis where soot formation highly dominates soot oxidation. After t=28.8 ms, thetemperature increases at this specific location due to the flame shrinkage, promoting soot oxi-dation while soot keeps on being convected. Therefore, the outer peak starts being damped untilthe initial profile shows up again.
The location at HAB=55 mm stands over the initial flame and exhibits profiles that character-ize flame clip-off along the flickering phenomenon [10]. At t=14.4 and 28.88 ms, the soot puffexpelled from the flame tip appears as being mainly convected from the location upstream. Att=43.32 ms, the puff tail stands close to the axis and flows away, leaving the location soot-free.Although not reported in the present paper, this clip-off was also evidenced by a high speed
#175440 - $15.00 USD Received 31 Aug 2012; revised 24 Oct 2012; accepted 27 Nov 2012; published 11 Dec 2012(C) 2012 OSA 17 December 2012 / Vol. 20, No. 27 / OPTICS EXPRESS 28748
camera operating at a frame rate of 500 fps.The above description of the soot volume fraction field evolution along flickering is consis-
tent with the one by Smyth et al. [10]. The original contribution here consists in providing atechnique with a fine repetition rate, that does not need any methodology for time-domain re-construction, as opposed to the setup by Smyth et al. that required phased-locking of every LIIpulse.
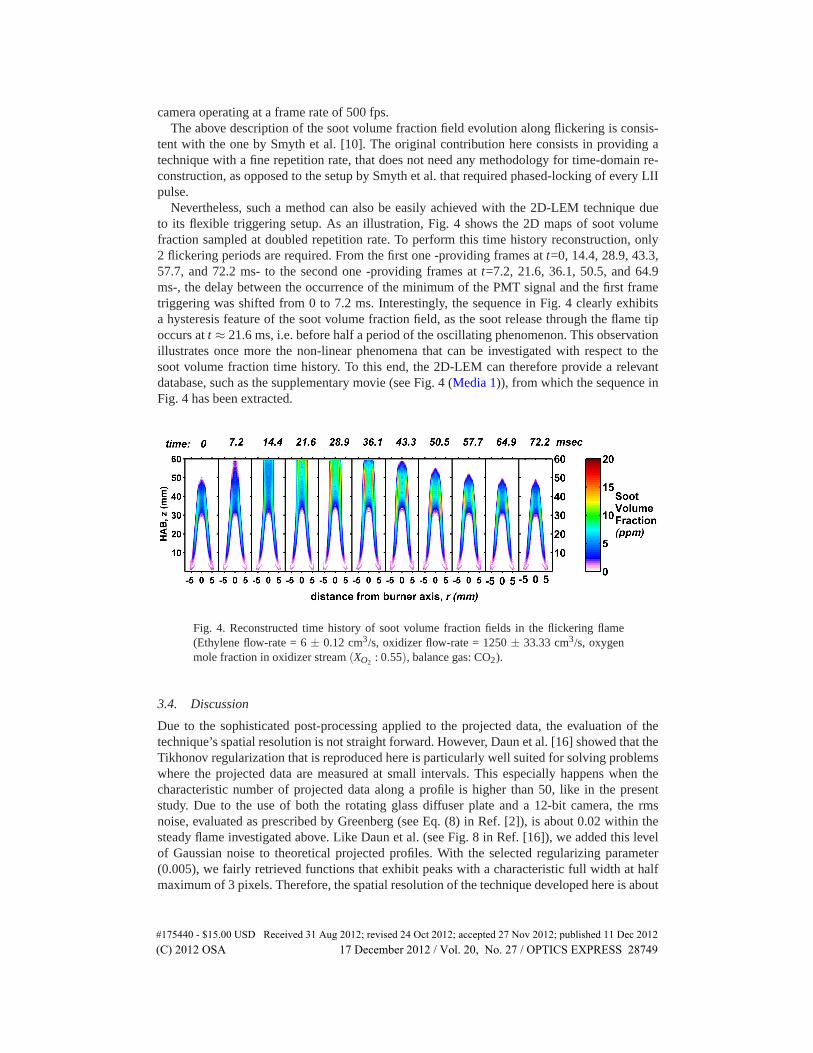
Nevertheless, such a method can also be easily achieved with the 2D-LEM technique dueto its flexible triggering setup. As an illustration, Fig. 4 shows the 2D maps of soot volumefraction sampled at doubled repetition rate. To perform this time history reconstruction, only2 flickering periods are required. From the first one -providing frames at t=0, 14.4, 28.9, 43.3,57.7, and 72.2 ms- to the second one -providing frames at t=7.2, 21.6, 36.1, 50.5, and 64.9ms-, the delay between the occurrence of the minimum of the PMT signal and the first frametriggering was shifted from 0 to 7.2 ms. Interestingly, the sequence in Fig. 4 clearly exhibitsa hysteresis feature of the soot volume fraction field, as the soot release through the flame tipoccurs at t ≈ 21.6 ms, i.e. before half a period of the oscillating phenomenon. This observationillustrates once more the non-linear phenomena that can be investigated with respect to thesoot volume fraction time history. To this end, the 2D-LEM can therefore provide a relevantdatabase, such as the supplementary movie (see Fig. 4 (Media 1)), from which the sequence inFig. 4 has been extracted.
Fig. 4. Reconstructed time history of soot volume fraction fields in the flickering flame(Ethylene flow-rate = 6 ± 0.12 cm3/s, oxidizer flow-rate = 1250 ± 33.33 cm3/s, oxygenmole fraction in oxidizer stream (XO2 : 0.55), balance gas: CO2).
3.4. Discussion
Due to the sophisticated post-processing applied to the projected data, the evaluation of thetechnique’s spatial resolution is not straight forward. However, Daun et al. [16] showed that theTikhonov regularization that is reproduced here is particularly well suited for solving problemswhere the projected data are measured at small intervals. This especially happens when thecharacteristic number of projected data along a profile is higher than 50, like in the presentstudy. Due to the use of both the rotating glass diffuser plate and a 12-bit camera, the rmsnoise, evaluated as prescribed by Greenberg (see Eq. (8) in Ref. [2]), is about 0.02 within thesteady flame investigated above. Like Daun et al. (see Fig. 8 in Ref. [16]), we added this levelof Gaussian noise to theoretical projected profiles. With the selected regularizing parameter(0.005), we fairly retrieved functions that exhibit peaks with a characteristic full width at halfmaximum of 3 pixels. Therefore, the spatial resolution of the technique developed here is about
#175440 - $15.00 USD Received 31 Aug 2012; revised 24 Oct 2012; accepted 27 Nov 2012; published 11 Dec 2012(C) 2012 OSA 17 December 2012 / Vol. 20, No. 27 / OPTICS EXPRESS 28749
150 μm.According to Eq. (1) together with the discretized form of Eq. (2), the evaluation of the
overall relative uncertainty in these soot volume fraction measurements needs to incorporatefive possible sources of error. First, the fluctuations with time of the flow rates, which arespecified above, can lead to slight errors. Second, the transmission measurement can be affectedby both the discrepancy among the pixels’ sensitivities, which can be up to ± 2% according tothe camera’s specifications, and the computation of the chord lengths in the matrix A mentionedabove. Third, the analogue to digital conversion induces an absolute uncertainty equal to 2−12 =2.4414×10⁻⁴ due to 12-bit digitization performed. The fourth source of error results from thedeconvolution process, which depends mainly on the evaluation of the regularization parameterand the number of data points. According to the thorough analysis by Akesson and Daun [17],the deconvolution process performed here can involve an error slightly lower than 1% for thisstudy. The level of cumulated uncertainty attributed to these first four sources of error canbe evaluated from the shot to shot variations of the measurements inside the steady flame, asillustrated by the discrepancy observed on the axis at HAB=30 mm between t=57.76 and 72.2ms in Fig. 2. Computed over 100 instantaneous maps, the mean relative uncertainty withina region where the soot volume fraction exceeds 10 % of its peak was found to be slightlylower than 5 %. The fifth and major source of error comes from the controversial value ofthe soot refractive index n, therefore of the soot absorption coefficient E(m). Following theprocedure mentioned above to adjust E(m) and match the original measurements by Santoroet al. [15] leads to a relative uncertainty up to 10% according to Arana et al. [18]. Accordingto this procedure, the overall uncertainty in soot volume fraction here is about ±15% within aregion of significant soot volume fraction level, provided that the measurements by Santoro areacknowledged as the reference for the uncertainty quantification. However, given the disparityin refractive index among nascent soot particles and soot aggregates, the relative uncertaintyattributed to E(m) can at least be doubled [19]. This would lead to an overall uncertainty higherthan ±15%.
Eventually, it is worth noticing that erroneous evaluations of soot volume fraction appear atthe burner lip (see at z=0 and x=±5mm in Fig. 4) where the conditions cannot lead to such asoot production. These values are in the order of 10% of the peak soot volume fraction withinthe flame. Due to the temperature gradients that especially exhibit in the vicinity of the thermalflame sheet, beam steering effects of the laser light indeed result in Schlieren-like darker regionsin the collected images. This parabolic darker sheet is slightly evidenced on the frame shown inFig. 1. However, downstream the burner lip, the darker sheet moves apart from the central sootregion. Therefore, the parts of the transmittance profiles that are biased by the beam steeringcan be readily removed from the remaining part of the profiles to be post-processed. Thus,beam steering does not contribute to any further significant uncertainty within the regions ofsignificant soot volume fraction level.
4. Conclusion
An experimental technique enabling the measurement of a continuous laser beam extinctionhas been set up to provide time history of two-dimensional soot volume fraction field in axis-symmetric flames that experience slow unsteady phenomena preserving the symmetry. At arepetition rate up to 70 Hz, the technique has been shown to deliver a fine description of the sootvolume fraction field in a flickering flame. Within this range of repetition rate, the techniqueand its subsequent post-processing require neither any method for time-domain reconstructionnor any correction for energy intrusion, in contrast with laser induced incandescence performedat high repetition rate.
The repetition rate of the technique is here especially limited by the shutter technology, as
#175440 - $15.00 USD Received 31 Aug 2012; revised 24 Oct 2012; accepted 27 Nov 2012; published 11 Dec 2012(C) 2012 OSA 17 December 2012 / Vol. 20, No. 27 / OPTICS EXPRESS 28750
both the laser light power and the camera frame rate can be increased twofold. Implement-ing a technology such as acousto-optic modulator could significantly improve the repetitionrate. However, for the investigations of oscillating phenomena, the flexible triggering of themeasurement also enables the technique to be complemented by a method for time-domain re-construction. All together, the technique should support further soot volume fraction databasein oscillating flames exhibiting a wider range of soot processes characteristic times than steadyflames.
Acknowledgments
A part of the funding for this study was provided by the Office National d’Etudes et deRecherches Aerospatiales (contract C11275). The authors feel grateful to Prof. Sagaut for hiscomplementing funding.
#175440 - $15.00 USD Received 31 Aug 2012; revised 24 Oct 2012; accepted 27 Nov 2012; published 11 Dec 2012(C) 2012 OSA 17 December 2012 / Vol. 20, No. 27 / OPTICS EXPRESS 28751