soot combustion dynamics in a planar diesel particulate filter
TRANSCRIPT
Soot Combustion Dynamics in a Planar Diesel Particulate Filter
K. Chen,* K. S. Martirosyan, and D. Luss
Department of Chemical and Biomolecular Engineering, UniVersity of Houston, Houston, Texas 77204
The dynamic features of soot combustion on a single layer, planar diesel particulate filter (DPF) were studiedusing IR imaging. At a feed temperature of 635 °C, the soot combustion rate was uniform all over the surfaceat low oxygen concentrations. At higher oxygen concentrations, local ignition occurred at either one or severallocations. The maximum temperature rise of the moving fronts (>100 °C) was much higher than those attainedduring uniform combustion. The temperature fronts bounding an ignited zone propagated on the surface.Their peak temperature and velocity changed as they moved on the surface. The maximum temperature of adownstream moving front exceeded that of the corresponding one moving upstream. At a soot loading of 10g/L, a hot zone formed close to the end of the DPF and the bounding temperature front propagated upstreamuntil it conquered the whole surface. At a soot loading of 20 g/L, the position and number of the hot zonesstrongly depended on the oxygen concentration. In general, increasing either the oxygen concentration or thesoot load increased the moving front temperature and velocity. The flow rate affected the location of theignition point for soot loading of 10 g/L but not for 20 g/L.
Introduction
Automobile diesel engines have several important advantagesover gasoline engines. These include better mileage, lessfrequent fill-ups, more robust with an average life of 300,000miles and produce less carbon monoxide (CO). One of the maindisadvantages of diesel engines is the emission of particulatematter (PM), which is a health hazard that must be removed.Currently, the most efficient device for PM removal from theengine effluents is a Diesel Particulate Filter (DPF).1 It consistsof thousands of square parallel channels, with the opposite endsof adjacent channels being plugged. The exhaust gas passesthrough the filter porous walls into the adjacent channels, whilemore than 95% of the PM accumulates on the filter.2-4 Thepressure drop across the filter increases with the mass of theaccumulated PM, affecting the engine performance and fuelefficiency.5 Thus, the DPF is regenerated periodically to removethe accumulated PM by combustion. The exothermic combustionleads in some cases to excessive local temperature rise, whichmay melt the ceramic filter and destroy the DPF.6-8 Tocircumvent this DPF failure, it is essential to be able to predictthe impact of the operating conditions and regeneration proce-dure on the formation of excessively high local temperatures.
The PM combustion temperature rise during the DPFregeneration has been investigated both experimentally andtheoretically. It is well-known that the regeneration by a movingreaction front is faster than via uniform combustion.9 Followingthe pioneering studies of Bissett,10,11 many follow-up simula-tions were published.12-22 The simulations predict that theignition location shifts upon a change in feed temperature.
Measurements of the local temperature rise by thermocouplesinserted into the DPF channels were reported.23-27 The experi-ments revealed a sharp temperature rise during the PMregeneration. Dynamic visualization of the DPF surface enablesdetermination of the spatiotemporal features of the combustionfronts. Herz and Sinkevitch28 used a video camera to study thecombustion of soot deposits on a 3 cm diameter, single DPFlayer, and on a DPF that has been cut to expose a flat surfacefor viewing. They reported that the presence of adsorbedhydrocarbons affected the ignition and temperature rise during
PM regeneration. Hanamura and Tanaka29,30 followed the soottrapping and combustion in a half-cylindrical wall-flow DPFusing microscopic visualization. They noted that the PMcombustion could proceed along the DDF channels either by apropagating or uniform combustion. Decreasing the inlet gastemperature shifted the ignition location from the re-entranceto the exit of the DPF. Gallant et al.31 developed a novelexperimental system in which an IR and optical video camerasfollowed the oxidation of soot on a single channel filterassembly.
Most previous experiments were carried out using a dieselengine exhaust during the regeneration. Unfortunately, underthe dynamic operation of a diesel engine, some of the keyoperating conditions, such as the exhaust temperature, oxygenconcentration, soot loading, and flow rate are not constant.Martirosyan et al.32 reported some preliminary IR imaging ofthe spatiotemporal temperature on a single channel planar DPFunder controlled feed conditions. They observed a dependenceof the combustion mode and number and locations of theignition points on the controlled operating conditions.
We report here the results of an extensive set of experimentsaimed at determining the impact of fixed operating conditions,such as oxygen concentration, soot loading, and flow rate onthe spatiotemporal temperature during the catalytic soot com-bustion in a single channel planar DPF. The experimental resultsrevealed some rather surprising novel features about theevolution and dynamics of the moving temperature fronts.
Experimental System and Procedure
Infrared (IR) imaging was used to measure the spatio-temporal temperature during the soot combustion in a mixtureof air and nitrogen on a planar catalytic single layer DPF (60mm long, 20 mm wide), cut from a commercial DPF (NKGInsulator). Both exterior sides and bottom of the single layerDPF were sealed by ceramic glue to force all the flow throughthe soot layer deposited uniformly on the top of the DPF. Theplanar DPF was held in a stainless steel (316 L) insulated reactor(120 × 40 × 40 mm) having an IR transparent quartz windowon its top. It enabled visual and infrared imaging of the* E-mail address: [email protected].
Ind. Eng. Chem. Res. 2009, 48, 3323–3330 3323
10.1021/ie8015544 CCC: $40.75 2009 American Chemical SocietyPublished on Web 02/25/2009
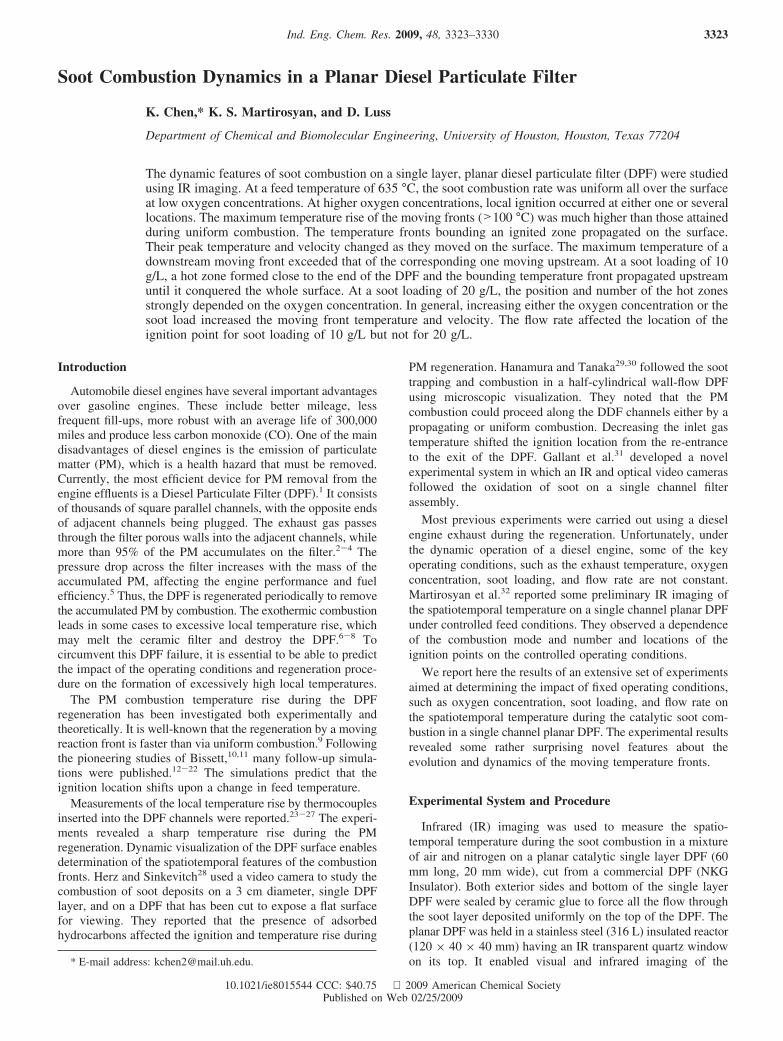
temperature field on the planar DPF, located at about 3 mmfrom the window. Figure 1a is a schematic of the reactor holdingthe filter.
Experiments revealed that in our system it was impossibleto obtain uniform reproducible PM deposition by the exhaustfrom a diesel engine. The PM regeneration in a DPF is rathersensitive to the PM deposition conditions and structure.33,34
Thus, in order to have a reproducible regeneration, we usedcarbon black nanoparticles to simulate the PM deposit in all ofthe experiments reported herein. The carbon black was depositedon the top of the planar DPF using the spray of a well-mixedsolution of alcohol containing carbon black nanoparticles (40nm, Sigma Aldridge). We later used a stream of nitrogen toremove the alcohol. To check the uniformity of the deposition,each experiment was repeated at least five times.
The experiments reported here were conducted using sootloadings of either 10 or 20 g/L. Preliminary experiments showedthat heat loss from the reactor wall affected the temperatureprofiles and the location at which the ignition occurred. Tominimize the impact of these heat losses, the sides and bottomof the reactor were heated by an electrical ceramic fiber heater(Watlow Instruments Co, Inc.). The wall temperature was setby a power controller (Staco energy product Co, 2PF1010). FourK-type thermocouples (diameter ≈ 0.5 mm) in the reactormonitored the temperature around the DPF. The first one, placednear the entrance, measured the inlet gas temperature. Thesecond was located 10 mm downstream from the inlet, the thirdin the reactor middle, and the fourth 10 mm ahead of the outlet.
The thermocouples were placed at the bottom of the singlelayer DPF as placing them on the top would have obscured theIR image. The thermocouples signals were recorded andprocessed by an Omega data acquisition board connected to aPC. A 5-mm thick mineral wool insulation was placed betweenthe planar DPF and the reactor walls to minimize the conduction,convection, and radiative heat exchange with the reactor walls.
A schematic of the experimental system is shown in Figure1b. The spatiotemporal temperature was measured by a highspeed (up to 60 frame/s) infrared camera (Merlin, MW18, IndigoSystems) held 50 cm above the quartz window. It has a 256 ×256 indium antimonide detector array sensitive to 3-5 µmradiations. The IR signals were recorded on a PC using theImageDesk II software. The magnitude, shape, and motion ofthe thermal front on the DPF were determined by image analysissoftware (ThermaGRAM). The IR signals were calibrated usingthe K-type thermocouples readings before each experiment.Typical soot combustion lasted a few minutes. The IR imagesof the soot combustion were recorded at the rate of 10 persecond.
Mixtures of pressurized nitrogen and air containing 5-15 v.%oxygen were fed to the reactor during soot regeneration. Gasflow rates were measured by rotameters (Fisher & Porter,10A6100), which were calibrated periodically to ensure accurateflow measurements. The feed pressure was controlled bydownstream pressure regulators.
Compressed nitrogen was used to purge the air in the reactorbefore each experiment. After that, the reactor wall’s temperaturewas stepwise increased from room temperature to the presettemperature. The reactor was preheated to the desired experi-mental temperature by an electric heater (Hoskins furnace,FD303), while the reactor was fed by pure nitrogen. After thedesired temperature was reached, the feed was switched to theair-nitrogen mixture. Each experiment was repeated at least fivetimes to check for reproducibility.
Experimental Results
The impact of oxygen concentration (range of 5 to 15 v.%.)was studied at two different soot loadings, at a fixed gas flowrate of 12 cm3/(s · cm2) through the filter and a feed temperatureof 635 °C. Thermal imaging revealed that three different modesof combustion were obtained depending on the oxygen con-
Figure 1. (a) A schematic of the reactor. (b) A schematic of the experimental system.
3324 Ind. Eng. Chem. Res., Vol. 48, No. 7, 2009
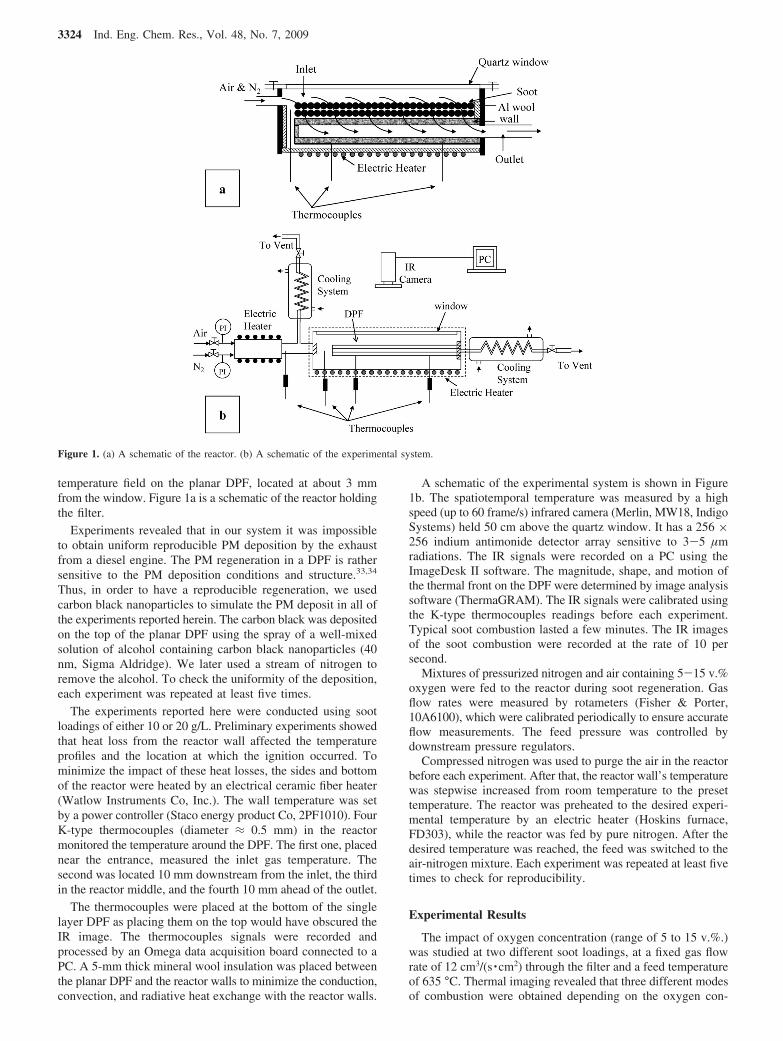
centration. Figure 2 shows IR images obtained for a soot loadingof 10 g/L. For reactants mixtures containing no more than7.5 v.% oxygen, the temperature rise during soot regenerationwas essentially uniform all over the DPF surface and no movingtemperature fronts formed. A typical case for a feed containing5 v.% oxygen is shown in Figure 2a. The variation oftemperature among different surface points was very small(∼5 °C). The deposited soot was uniformly consumed all overthe DPF surface 22 min after the start of the experiment. Theuniformity of the surface temperature during the low oxygenconcentration experiments indicates that pattern formation wasnot due to nonuniform cordierite permeability. The reproduc-ibility of at least five repeated experiments indicates that thecarbon black was deposited uniformly.
For reactant feeds containing more than 7.5 v.% oxygen thecombustion was initiated at one or more ignited locations,bounded by sharp temperature fronts. The fronts propagated onthe surface, igniting the soot on the surrounding colder regions.The motion of the temperature fronts became more complex as
the oxygen concentration increased. Using a feed with 10 v.%of oxygen the combustion was initiated at a single ignitedlocation next to the end of the DPF. The hot zone was separatedfrom the surrounding colder region by a sharp temperature front.It moved from the downstream to the upstream of the DPF,eventually conquering the whole surface (Figure 2b). The highfront temperature increased the local reaction rate, leading to acomplete combustion of the soot. The peak front temperaturewas not constant during the propagation of the front on thesurface and varied in the range of 745 to 770 °C and its velocityvaried from 0.18 to 0.24 cm/s. After the local soot layer wasconsumed, the surface temperature decreased. The cooledregenerated locations appear as green regions in Figure 2b. Anupstream moving temperature front was observed by Montierth35
in experiments using fuel with regeneration assisted additives.It was also found in numerical simulations.16
A more intricate combustion mode was observed when thefeed contained 15 v. % oxygen (Figure 2c). Initially, a singlepoint ignited close to the end of the DPF. The temperature frontbounding that hot zone propagated upstream, i.e., in a directionopposite to the feed flow rate. However, after some time (44 sin the case shown here) ignition occurred at a location 20 mmdownstream from the inlet. One of the two temperature frontsbounding this ignited zone propagated upstream and the seconddownstream. The downstream moving front, with a temperatureof 720 °C and velocity of 0.27 cm/s, eventually collided withone originating from the end of the PDF. The coalescence ofthe two temperature fronts generated one moving upstream frontwith a temperature of 770 °C and a velocity of 0.35 cm/s.
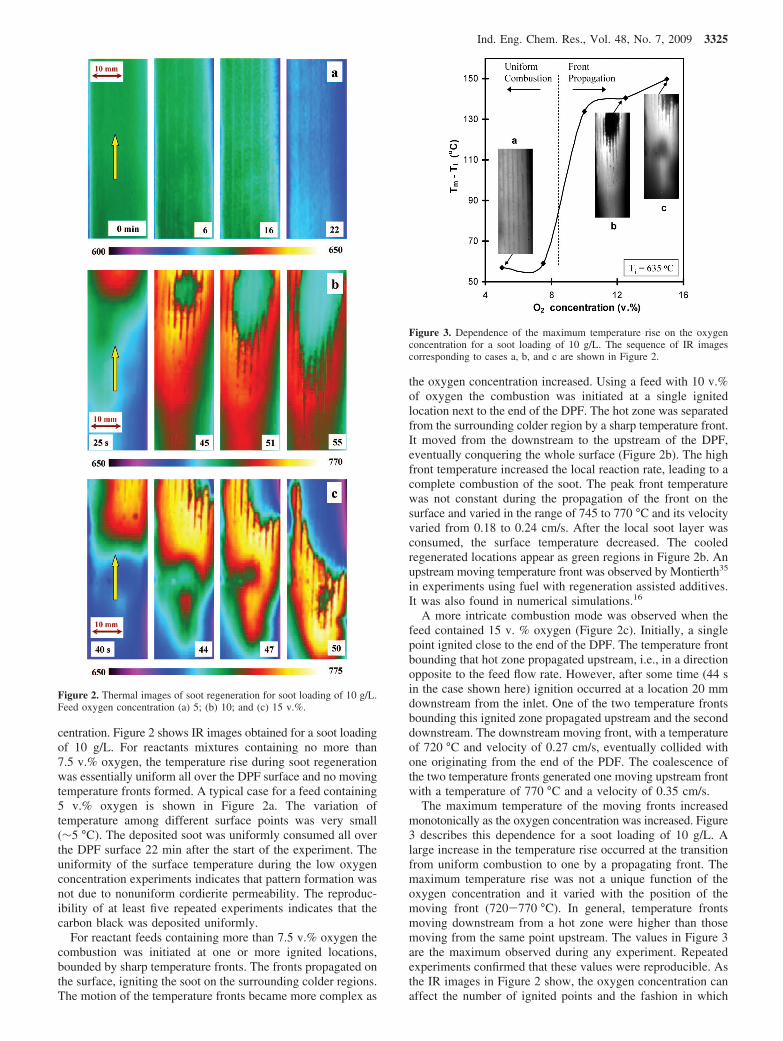
The maximum temperature of the moving fronts increasedmonotonically as the oxygen concentration was increased. Figure3 describes this dependence for a soot loading of 10 g/L. Alarge increase in the temperature rise occurred at the transitionfrom uniform combustion to one by a propagating front. Themaximum temperature rise was not a unique function of theoxygen concentration and it varied with the position of themoving front (720-770 °C). In general, temperature frontsmoving downstream from a hot zone were higher than thosemoving from the same point upstream. The values in Figure 3are the maximum observed during any experiment. Repeatedexperiments confirmed that these values were reproducible. Asthe IR images in Figure 2 show, the oxygen concentration canaffect the number of ignited points and the fashion in which
Figure 2. Thermal images of soot regeneration for soot loading of 10 g/L.Feed oxygen concentration (a) 5; (b) 10; and (c) 15 v.%.
Figure 3. Dependence of the maximum temperature rise on the oxygenconcentration for a soot loading of 10 g/L. The sequence of IR imagescorresponding to cases a, b, and c are shown in Figure 2.
Ind. Eng. Chem. Res., Vol. 48, No. 7, 2009 3325
the propagating reaction fronts move. For example, while incase b ignition occurred at one point, two ignited regions formedin case c.
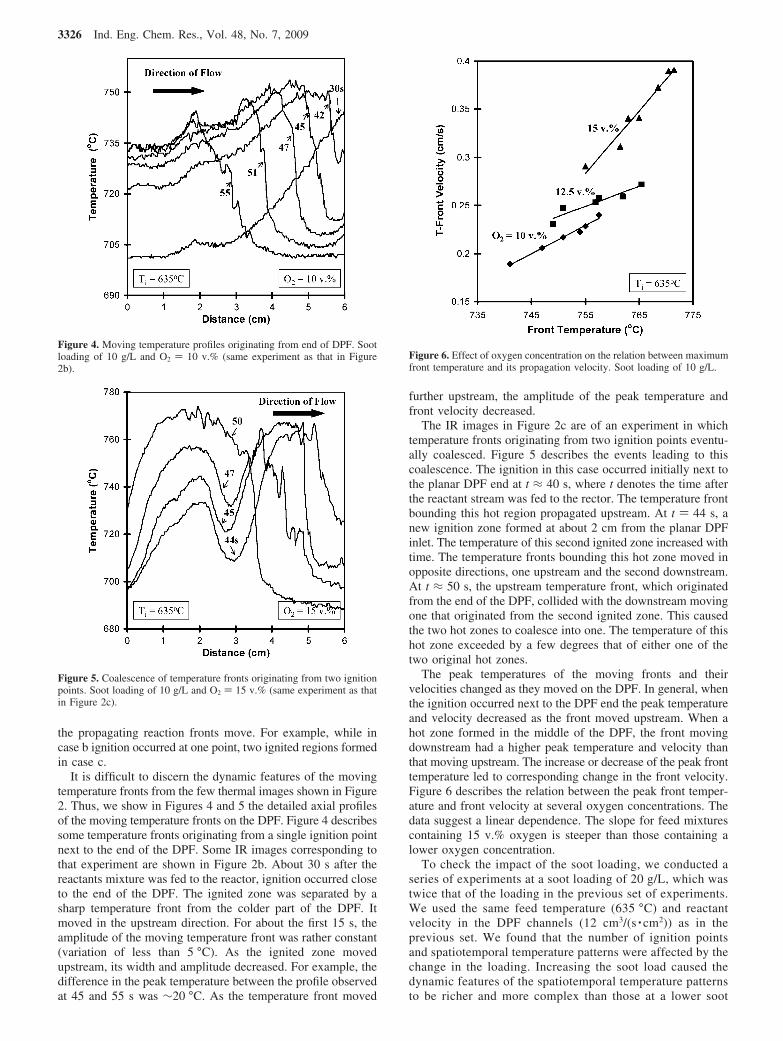
It is difficult to discern the dynamic features of the movingtemperature fronts from the few thermal images shown in Figure2. Thus, we show in Figures 4 and 5 the detailed axial profilesof the moving temperature fronts on the DPF. Figure 4 describessome temperature fronts originating from a single ignition pointnext to the end of the DPF. Some IR images corresponding tothat experiment are shown in Figure 2b. About 30 s after thereactants mixture was fed to the reactor, ignition occurred closeto the end of the DPF. The ignited zone was separated by asharp temperature front from the colder part of the DPF. Itmoved in the upstream direction. For about the first 15 s, theamplitude of the moving temperature front was rather constant(variation of less than 5 °C). As the ignited zone movedupstream, its width and amplitude decreased. For example, thedifference in the peak temperature between the profile observedat 45 and 55 s was ∼20 °C. As the temperature front moved
further upstream, the amplitude of the peak temperature andfront velocity decreased.
The IR images in Figure 2c are of an experiment in whichtemperature fronts originating from two ignition points eventu-ally coalesced. Figure 5 describes the events leading to thiscoalescence. The ignition in this case occurred initially next tothe planar DPF end at t ≈ 40 s, where t denotes the time afterthe reactant stream was fed to the rector. The temperature frontbounding this hot region propagated upstream. At t ) 44 s, anew ignition zone formed at about 2 cm from the planar DPFinlet. The temperature of this second ignited zone increased withtime. The temperature fronts bounding this hot zone moved inopposite directions, one upstream and the second downstream.At t ≈ 50 s, the upstream temperature front, which originatedfrom the end of the DPF, collided with the downstream movingone that originated from the second ignited zone. This causedthe two hot zones to coalesce into one. The temperature of thishot zone exceeded by a few degrees that of either one of thetwo original hot zones.
The peak temperatures of the moving fronts and theirvelocities changed as they moved on the DPF. In general, whenthe ignition occurred next to the DPF end the peak temperatureand velocity decreased as the front moved upstream. When ahot zone formed in the middle of the DPF, the front movingdownstream had a higher peak temperature and velocity thanthat moving upstream. The increase or decrease of the peak fronttemperature led to corresponding change in the front velocity.Figure 6 describes the relation between the peak front temper-ature and front velocity at several oxygen concentrations. Thedata suggest a linear dependence. The slope for feed mixturescontaining 15 v.% oxygen is steeper than those containing alower oxygen concentration.
To check the impact of the soot loading, we conducted aseries of experiments at a soot loading of 20 g/L, which wastwice that of the loading in the previous set of experiments.We used the same feed temperature (635 °C) and reactantvelocity in the DPF channels (12 cm3/(s · cm2)) as in theprevious set. We found that the number of ignition pointsand spatiotemporal temperature patterns were affected by thechange in the loading. Increasing the soot load caused thedynamic features of the spatiotemporal temperature patternsto be richer and more complex than those at a lower soot
Figure 4. Moving temperature profiles originating from end of DPF. Sootloading of 10 g/L and O2 ) 10 v.% (same experiment as that in Figure2b).
Figure 5. Coalescence of temperature fronts originating from two ignitionpoints. Soot loading of 10 g/L and O2 ) 15 v.% (same experiment as thatin Figure 2c).
Figure 6. Effect of oxygen concentration on the relation between maximumfront temperature and its propagation velocity. Soot loading of 10 g/L.
3326 Ind. Eng. Chem. Res., Vol. 48, No. 7, 2009
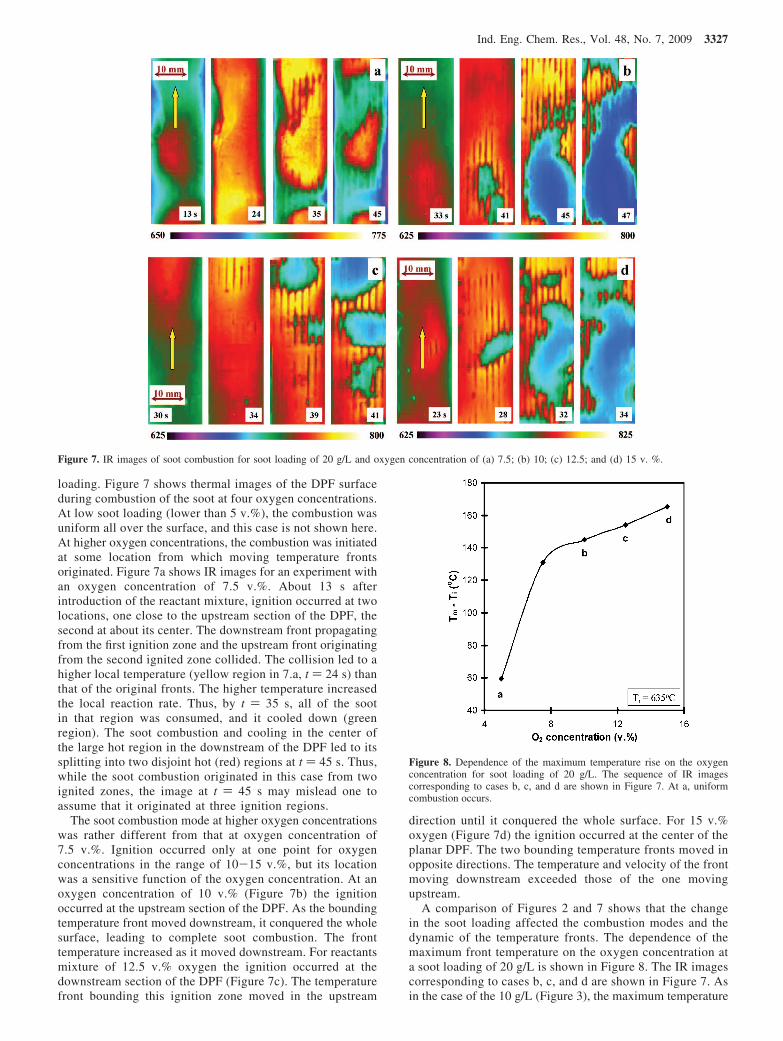
loading. Figure 7 shows thermal images of the DPF surfaceduring combustion of the soot at four oxygen concentrations.At low soot loading (lower than 5 v.%), the combustion wasuniform all over the surface, and this case is not shown here.At higher oxygen concentrations, the combustion was initiatedat some location from which moving temperature frontsoriginated. Figure 7a shows IR images for an experiment withan oxygen concentration of 7.5 v.%. About 13 s afterintroduction of the reactant mixture, ignition occurred at twolocations, one close to the upstream section of the DPF, thesecond at about its center. The downstream front propagatingfrom the first ignition zone and the upstream front originatingfrom the second ignited zone collided. The collision led to ahigher local temperature (yellow region in 7.a, t ) 24 s) thanthat of the original fronts. The higher temperature increasedthe local reaction rate. Thus, by t ) 35 s, all of the sootin that region was consumed, and it cooled down (greenregion). The soot combustion and cooling in the center ofthe large hot region in the downstream of the DPF led to itssplitting into two disjoint hot (red) regions at t ) 45 s. Thus,while the soot combustion originated in this case from twoignited zones, the image at t ) 45 s may mislead one toassume that it originated at three ignition regions.
The soot combustion mode at higher oxygen concentrationswas rather different from that at oxygen concentration of7.5 v.%. Ignition occurred only at one point for oxygenconcentrations in the range of 10-15 v.%, but its locationwas a sensitive function of the oxygen concentration. At anoxygen concentration of 10 v.% (Figure 7b) the ignitionoccurred at the upstream section of the DPF. As the boundingtemperature front moved downstream, it conquered the wholesurface, leading to complete soot combustion. The fronttemperature increased as it moved downstream. For reactantsmixture of 12.5 v.% oxygen the ignition occurred at thedownstream section of the DPF (Figure 7c). The temperaturefront bounding this ignition zone moved in the upstream
direction until it conquered the whole surface. For 15 v.%oxygen (Figure 7d) the ignition occurred at the center of theplanar DPF. The two bounding temperature fronts moved inopposite directions. The temperature and velocity of the frontmoving downstream exceeded those of the one movingupstream.
A comparison of Figures 2 and 7 shows that the changein the soot loading affected the combustion modes and thedynamic of the temperature fronts. The dependence of themaximum front temperature on the oxygen concentration ata soot loading of 20 g/L is shown in Figure 8. The IR imagescorresponding to cases b, c, and d are shown in Figure 7. Asin the case of the 10 g/L (Figure 3), the maximum temperature
Figure 7. IR images of soot combustion for soot loading of 20 g/L and oxygen concentration of (a) 7.5; (b) 10; (c) 12.5; and (d) 15 v. %.
Figure 8. Dependence of the maximum temperature rise on the oxygenconcentration for soot loading of 20 g/L. The sequence of IR imagescorresponding to cases b, c, and d are shown in Figure 7. At a, uniformcombustion occurs.
Ind. Eng. Chem. Res., Vol. 48, No. 7, 2009 3327
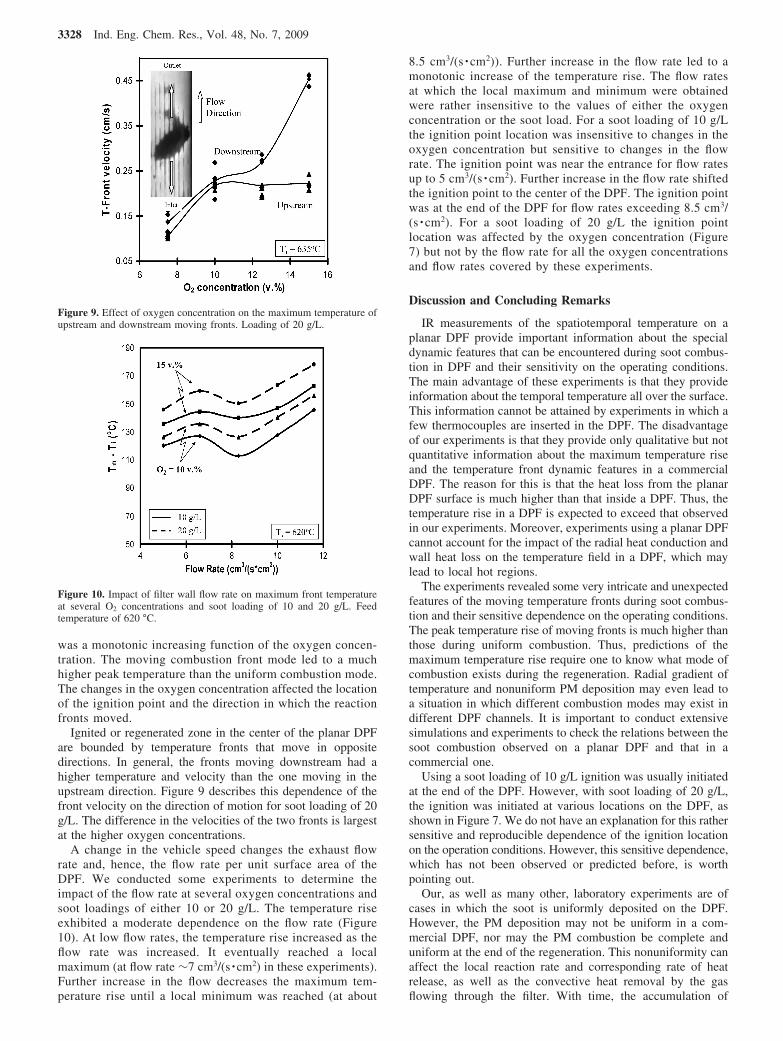
was a monotonic increasing function of the oxygen concen-tration. The moving combustion front mode led to a muchhigher peak temperature than the uniform combustion mode.The changes in the oxygen concentration affected the locationof the ignition point and the direction in which the reactionfronts moved.
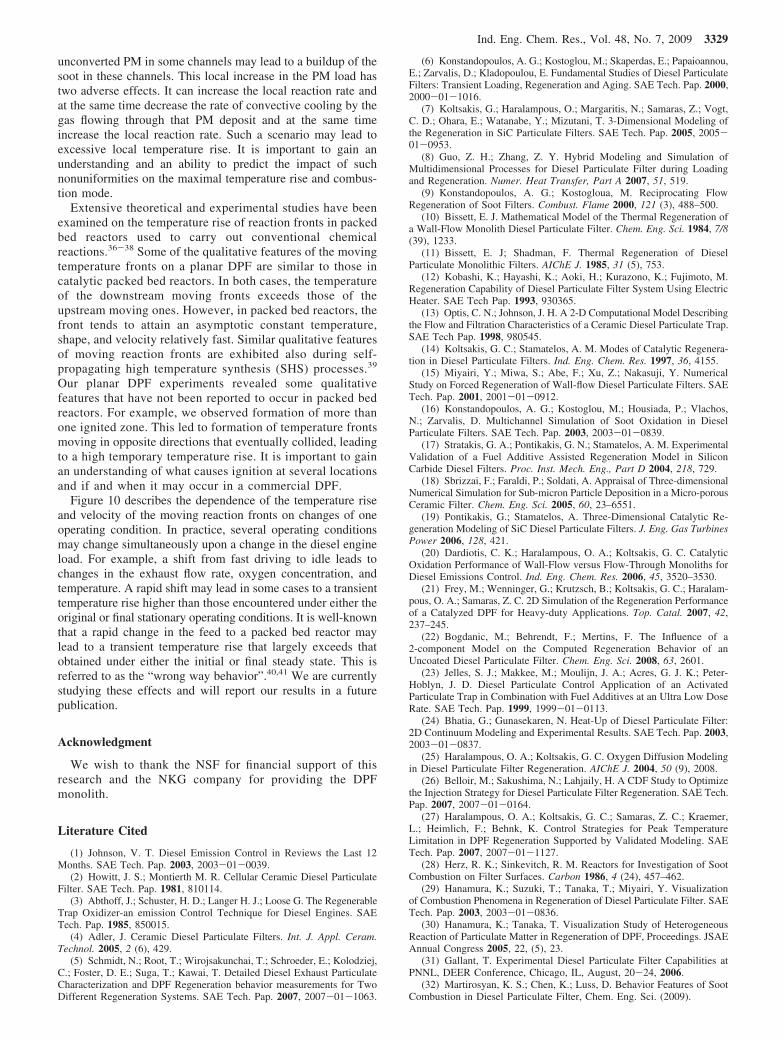
Ignited or regenerated zone in the center of the planar DPFare bounded by temperature fronts that move in oppositedirections. In general, the fronts moving downstream had ahigher temperature and velocity than the one moving in theupstream direction. Figure 9 describes this dependence of thefront velocity on the direction of motion for soot loading of 20g/L. The difference in the velocities of the two fronts is largestat the higher oxygen concentrations.
A change in the vehicle speed changes the exhaust flowrate and, hence, the flow rate per unit surface area of theDPF. We conducted some experiments to determine theimpact of the flow rate at several oxygen concentrations andsoot loadings of either 10 or 20 g/L. The temperature riseexhibited a moderate dependence on the flow rate (Figure10). At low flow rates, the temperature rise increased as theflow rate was increased. It eventually reached a localmaximum (at flow rate ∼7 cm3/(s · cm2) in these experiments).Further increase in the flow decreases the maximum tem-perature rise until a local minimum was reached (at about
8.5 cm3/(s · cm2)). Further increase in the flow rate led to amonotonic increase of the temperature rise. The flow ratesat which the local maximum and minimum were obtainedwere rather insensitive to the values of either the oxygenconcentration or the soot load. For a soot loading of 10 g/Lthe ignition point location was insensitive to changes in theoxygen concentration but sensitive to changes in the flowrate. The ignition point was near the entrance for flow ratesup to 5 cm3/(s · cm2). Further increase in the flow rate shiftedthe ignition point to the center of the DPF. The ignition pointwas at the end of the DPF for flow rates exceeding 8.5 cm3/(s · cm2). For a soot loading of 20 g/L the ignition pointlocation was affected by the oxygen concentration (Figure7) but not by the flow rate for all the oxygen concentrationsand flow rates covered by these experiments.
Discussion and Concluding Remarks
IR measurements of the spatiotemporal temperature on aplanar DPF provide important information about the specialdynamic features that can be encountered during soot combus-tion in DPF and their sensitivity on the operating conditions.The main advantage of these experiments is that they provideinformation about the temporal temperature all over the surface.This information cannot be attained by experiments in which afew thermocouples are inserted in the DPF. The disadvantageof our experiments is that they provide only qualitative but notquantitative information about the maximum temperature riseand the temperature front dynamic features in a commercialDPF. The reason for this is that the heat loss from the planarDPF surface is much higher than that inside a DPF. Thus, thetemperature rise in a DPF is expected to exceed that observedin our experiments. Moreover, experiments using a planar DPFcannot account for the impact of the radial heat conduction andwall heat loss on the temperature field in a DPF, which maylead to local hot regions.
The experiments revealed some very intricate and unexpectedfeatures of the moving temperature fronts during soot combus-tion and their sensitive dependence on the operating conditions.The peak temperature rise of moving fronts is much higher thanthose during uniform combustion. Thus, predictions of themaximum temperature rise require one to know what mode ofcombustion exists during the regeneration. Radial gradient oftemperature and nonuniform PM deposition may even lead toa situation in which different combustion modes may exist indifferent DPF channels. It is important to conduct extensivesimulations and experiments to check the relations between thesoot combustion observed on a planar DPF and that in acommercial one.
Using a soot loading of 10 g/L ignition was usually initiatedat the end of the DPF. However, with soot loading of 20 g/L,the ignition was initiated at various locations on the DPF, asshown in Figure 7. We do not have an explanation for this rathersensitive and reproducible dependence of the ignition locationon the operation conditions. However, this sensitive dependence,which has not been observed or predicted before, is worthpointing out.
Our, as well as many other, laboratory experiments are ofcases in which the soot is uniformly deposited on the DPF.However, the PM deposition may not be uniform in a com-mercial DPF, nor may the PM combustion be complete anduniform at the end of the regeneration. This nonuniformity canaffect the local reaction rate and corresponding rate of heatrelease, as well as the convective heat removal by the gasflowing through the filter. With time, the accumulation of
Figure 9. Effect of oxygen concentration on the maximum temperature ofupstream and downstream moving fronts. Loading of 20 g/L.
Figure 10. Impact of filter wall flow rate on maximum front temperatureat several O2 concentrations and soot loading of 10 and 20 g/L. Feedtemperature of 620 °C.
3328 Ind. Eng. Chem. Res., Vol. 48, No. 7, 2009
unconverted PM in some channels may lead to a buildup of thesoot in these channels. This local increase in the PM load hastwo adverse effects. It can increase the local reaction rate andat the same time decrease the rate of convective cooling by thegas flowing through that PM deposit and at the same timeincrease the local reaction rate. Such a scenario may lead toexcessive local temperature rise. It is important to gain anunderstanding and an ability to predict the impact of suchnonuniformities on the maximal temperature rise and combus-tion mode.
Extensive theoretical and experimental studies have beenexamined on the temperature rise of reaction fronts in packedbed reactors used to carry out conventional chemicalreactions.36-38 Some of the qualitative features of the movingtemperature fronts on a planar DPF are similar to those incatalytic packed bed reactors. In both cases, the temperatureof the downstream moving fronts exceeds those of theupstream moving ones. However, in packed bed reactors, thefront tends to attain an asymptotic constant temperature,shape, and velocity relatively fast. Similar qualitative featuresof moving reaction fronts are exhibited also during self-propagating high temperature synthesis (SHS) processes.39
Our planar DPF experiments revealed some qualitativefeatures that have not been reported to occur in packed bedreactors. For example, we observed formation of more thanone ignited zone. This led to formation of temperature frontsmoving in opposite directions that eventually collided, leadingto a high temporary temperature rise. It is important to gainan understanding of what causes ignition at several locationsand if and when it may occur in a commercial DPF.
Figure 10 describes the dependence of the temperature riseand velocity of the moving reaction fronts on changes of oneoperating condition. In practice, several operating conditionsmay change simultaneously upon a change in the diesel engineload. For example, a shift from fast driving to idle leads tochanges in the exhaust flow rate, oxygen concentration, andtemperature. A rapid shift may lead in some cases to a transienttemperature rise higher than those encountered under either theoriginal or final stationary operating conditions. It is well-knownthat a rapid change in the feed to a packed bed reactor maylead to a transient temperature rise that largely exceeds thatobtained under either the initial or final steady state. This isreferred to as the “wrong way behavior”.40,41 We are currentlystudying these effects and will report our results in a futurepublication.
Acknowledgment
We wish to thank the NSF for financial support of thisresearch and the NKG company for providing the DPFmonolith.
Literature Cited
(1) Johnson, V. T. Diesel Emission Control in Reviews the Last 12Months. SAE Tech. Pap. 2003, 2003-01-0039.
(2) Howitt, J. S.; Montierth M. R. Cellular Ceramic Diesel ParticulateFilter. SAE Tech. Pap. 1981, 810114.
(3) Abthoff, J.; Schuster, H. D.; Langer H. J.; Loose G. The RegenerableTrap Oxidizer-an emission Control Technique for Diesel Engines. SAETech. Pap. 1985, 850015.
(4) Adler, J. Ceramic Diesel Particulate Filters. Int. J. Appl. Ceram.Technol. 2005, 2 (6), 429.
(5) Schmidt, N.; Root, T.; Wirojsakunchai, T.; Schroeder, E.; Kolodziej,C.; Foster, D. E.; Suga, T.; Kawai, T. Detailed Diesel Exhaust ParticulateCharacterization and DPF Regeneration behavior measurements for TwoDifferent Regeneration Systems. SAE Tech. Pap. 2007, 2007-01-1063.
(6) Konstandopoulos, A. G.; Kostoglou, M.; Skaperdas, E.; Papaioannou,E.; Zarvalis, D.; Kladopoulou, E. Fundamental Studies of Diesel ParticulateFilters: Transient Loading, Regeneration and Aging. SAE Tech. Pap. 2000,2000-01-1016.
(7) Koltsakis, G.; Haralampous, O.; Margaritis, N.; Samaras, Z.; Vogt,C. D.; Ohara, E.; Watanabe, Y.; Mizutani, T. 3-Dimensional Modeling ofthe Regeneration in SiC Particulate Filters. SAE Tech. Pap. 2005, 2005-01-0953.
(8) Guo, Z. H.; Zhang, Z. Y. Hybrid Modeling and Simulation ofMultidimensional Processes for Diesel Particulate Filter during Loadingand Regeneration. Numer. Heat Transfer, Part A 2007, 51, 519.
(9) Konstandopoulos, A. G.; Kostogloua, M. Reciprocating FlowRegeneration of Soot Filters. Combust. Flame 2000, 121 (3), 488–500.
(10) Bissett, E. J. Mathematical Model of the Thermal Regeneration ofa Wall-Flow Monolith Diesel Particulate Filter. Chem. Eng. Sci. 1984, 7/8(39), 1233.
(11) Bissett, E. J; Shadman, F. Thermal Regeneration of DieselParticulate Monolithic Filters. AIChE J. 1985, 31 (5), 753.
(12) Kobashi, K.; Hayashi, K.; Aoki, H.; Kurazono, K.; Fujimoto, M.Regeneration Capability of Diesel Particulate Filter System Using ElectricHeater. SAE Tech Pap. 1993, 930365.
(13) Optis, C. N.; Johnson, J. H. A 2-D Computational Model Describingthe Flow and Filtration Characteristics of a Ceramic Diesel Particulate Trap.SAE Tech Pap. 1998, 980545.
(14) Koltsakis, G. C.; Stamatelos, A. M. Modes of Catalytic Regenera-tion in Diesel Particulate Filters. Ind. Eng. Chem. Res. 1997, 36, 4155.
(15) Miyairi, Y.; Miwa, S.; Abe, F.; Xu, Z.; Nakasuji, Y. NumericalStudy on Forced Regeneration of Wall-flow Diesel Particulate Filters. SAETech. Pap. 2001, 2001-01-0912.
(16) Konstandopoulos, A. G.; Kostoglou, M.; Housiada, P.; Vlachos,N.; Zarvalis, D. Multichannel Simulation of Soot Oxidation in DieselParticulate Filters. SAE Tech. Pap. 2003, 2003-01-0839.
(17) Stratakis, G. A.; Pontikakis, G. N.; Stamatelos, A. M. ExperimentalValidation of a Fuel Additive Assisted Regeneration Model in SiliconCarbide Diesel Filters. Proc. Inst. Mech. Eng., Part D 2004, 218, 729.
(18) Sbrizzai, F.; Faraldi, P.; Soldati, A. Appraisal of Three-dimensionalNumerical Simulation for Sub-micron Particle Deposition in a Micro-porousCeramic Filter. Chem. Eng. Sci. 2005, 60, 23–6551.
(19) Pontikakis, G.; Stamatelos, A. Three-Dimensional Catalytic Re-generation Modeling of SiC Diesel Particulate Filters. J. Eng. Gas TurbinesPower 2006, 128, 421.
(20) Dardiotis, C. K.; Haralampous, O. A.; Koltsakis, G. C. CatalyticOxidation Performance of Wall-Flow versus Flow-Through Monoliths forDiesel Emissions Control. Ind. Eng. Chem. Res. 2006, 45, 3520–3530.
(21) Frey, M.; Wenninger, G.; Krutzsch, B.; Koltsakis, G. C.; Haralam-pous, O. A.; Samaras, Z. C. 2D Simulation of the Regeneration Performanceof a Catalyzed DPF for Heavy-duty Applications. Top. Catal. 2007, 42,237–245.
(22) Bogdanic, M.; Behrendt, F.; Mertins, F. The Influence of a2-component Model on the Computed Regeneration Behavior of anUncoated Diesel Particulate Filter. Chem. Eng. Sci. 2008, 63, 2601.
(23) Jelles, S. J.; Makkee, M.; Moulijn, J. A.; Acres, G. J. K.; Peter-Hoblyn, J. D. Diesel Particulate Control Application of an ActivatedParticulate Trap in Combination with Fuel Additives at an Ultra Low DoseRate. SAE Tech. Pap. 1999, 1999-01-0113.
(24) Bhatia, G.; Gunasekaren, N. Heat-Up of Diesel Particulate Filter:2D Continuum Modeling and Experimental Results. SAE Tech. Pap. 2003,2003-01-0837.
(25) Haralampous, O. A.; Koltsakis, G. C. Oxygen Diffusion Modelingin Diesel Particulate Filter Regeneration. AIChE J. 2004, 50 (9), 2008.
(26) Belloir, M.; Sakushima, N.; Lahjaily, H. A CDF Study to Optimizethe Injection Strategy for Diesel Particulate Filter Regeneration. SAE Tech.Pap. 2007, 2007-01-0164.
(27) Haralampous, O. A.; Koltsakis, G. C.; Samaras, Z. C.; Kraemer,L.; Heimlich, F.; Behnk, K. Control Strategies for Peak TemperatureLimitation in DPF Regeneration Supported by Validated Modeling. SAETech. Pap. 2007, 2007-01-1127.
(28) Herz, R. K.; Sinkevitch, R. M. Reactors for Investigation of SootCombustion on Filter Surfaces. Carbon 1986, 4 (24), 457–462.
(29) Hanamura, K.; Suzuki, T.; Tanaka, T.; Miyairi, Y. Visualizationof Combustion Phenomena in Regeneration of Diesel Particulate Filter. SAETech. Pap. 2003, 2003-01-0836.
(30) Hanamura, K.; Tanaka, T. Visualization Study of HeterogeneousReaction of Particulate Matter in Regeneration of DPF, Proceedings. JSAEAnnual Congress 2005, 22, (5), 23.
(31) Gallant, T. Experimental Diesel Particulate Filter Capabilities atPNNL, DEER Conference, Chicago, IL, August, 20-24, 2006.
(32) Martirosyan, K. S.; Chen, K.; Luss, D. Behavior Features of SootCombustion in Diesel Particulate Filter, Chem. Eng. Sci. (2009).
Ind. Eng. Chem. Res., Vol. 48, No. 7, 2009 3329

(33) Konstandopoulos A. G.; Skaperdas E.; Masoudi M.; MicrostructuralProperties of Soot Deposits in Diesel Particulate Traps, SAE Tech. PaperNo. 2002-01-1015, 2002.
(34) Konstandopoulos, A. G.; Kostoglou, M.; Vlachos, N; Kladopoulou,E. Advances in the science and technology of diesel particulate filtersimulation. AdV. Chem. Eng. 2007, 33, 213–275.
(35) Montierth M. R. Fuel Additive Effect Upon Diesel ParticulateFilters, SAE, paper 840072, 1984.
(36) Wicke, E.; Vortmeyer, D. Zundozonen heterogener reactionen ingas-durchstormten kornerschichten. Ber. Bunsen-Ges. Phys. Chem. 1959,63, 145.
(37) Rhee, H. K.; Foley, D.; Amundson, N. R. Creeping reaction zonein a catalytic fixed bedreactor: a cell model approach. Chem. Eng. Sci. 1974,28, 607.
(38) Kiselev, O. V.; Matros, Yu. Sh. Propagation of the combustionfront of a gas mixture in granular bed of catalyst. Combust., Explos., ShockWaVes 1980, 16, 152.
(39) Merzhanov, A. G.; Rumanov, E. N. Physics of reaction waves. ReV.Mod. Phys. 1999, 71, 1173.
(40) Crider, J. E.; Foss, A. S. Computational studies of transients inpacked bed reactors. AIChE J. 1966, 12, 514.
(41) Chen, Y.-C.; Luss, D. Wrong-way behavior of packed-bed reactors:Influence of interphase transport. AIChE J. 1989, 35, 1148.
ReceiVed for reView October 15, 2008ReVised manuscript receiVed December 24, 2008
Accepted January 14, 2009
IE8015544
3330 Ind. Eng. Chem. Res., Vol. 48, No. 7, 2009