monitoring of particulate matter outdoors
TRANSCRIPT
Monitoring of particulate matter outdoors
W.E. Wilson a,*, Judith C. Chow b, Candis Claiborn c, Wei Fusheng d,Johann Engelbrecht b, John G. Watson b
a National Center for Environmental Assessment, US Environmental Protection Agency, MD-B243-01,
Research Triangle Park, NC 27711, USAb Desert Research Institute, 2215 Raggio Parkway, Reno, NV 89512, USA
c Washington State University, Pullman, WA 99164, USAd National Environmental Monitoring Centre, Huizhongan, Beijing 100029, China
Received 15 April 2001; accepted 6 February 2002
Abstract
Recent studies of the size and composition of atmospheric particulate matter (PM) have demonstrated the usefulness
of separating atmospheric PM into its fine and coarse components. The need to measure the mass and composition of
fine and coarse PM separately has been emphasized by research in exposure, epidemiology, and toxicology of atmo-
spheric PM. This paper provides a background on the size distribution and properties of PM relevant to the differences
between fine and coarse particles. Various decisions that must be made when deciding how to separate, collect, and
measure PM are discussed. Techniques for monitoring fine and coarse particles, including the US Federal Reference
Method for PM2:5 and several techniques for PM10–2:5, are presented. Problems encountered in collecting semivolatile
PM and in weighing atmospheric PM collected on a filter are described. Continuous monitoring methods for PM mass
and for PM components (carbon, nitrate, and sulfate) are described and brief descriptions are given of analytical
techniques for the chemical characterization of collected PM. This information should be especially useful for envi-
ronmental workers familiar with monitoring methods for total suspended particles or PM10 but who will need to
measure PM2:5 and PM10–2:5 in the future.
Published by Elsevier Science Ltd.
Keywords: Particulate matter; Fine particles; Coarse particles; Monitoring methods; Chemical analysis; Semivolatile PM
Contents
1. Introduction . . . . . . . . . . . . . . . . . . . . . . . . . . . . . . . . . . . . . . . . . . . . . . . . . . . . . . . . . 1010
1.1. Definitions of particle size fractions . . . . . . . . . . . . . . . . . . . . . . . . . . . . . . . . . . . . 1011
1.1.1. Modal . . . . . . . . . . . . . . . . . . . . . . . . . . . . . . . . . . . . . . . . . . . . . . . . . . . 1011
1.1.2. Sampler cutpoint . . . . . . . . . . . . . . . . . . . . . . . . . . . . . . . . . . . . . . . . . . . 1012
1.1.3. Occupational health size cuts. . . . . . . . . . . . . . . . . . . . . . . . . . . . . . . . . . . 1012
1.1.4. Regulatory size cuts . . . . . . . . . . . . . . . . . . . . . . . . . . . . . . . . . . . . . . . . . 1013
1.2. Issues in the measurement of particulate matter . . . . . . . . . . . . . . . . . . . . . . . . . . . . 1013
1.2.1. Upper cutpoint . . . . . . . . . . . . . . . . . . . . . . . . . . . . . . . . . . . . . . . . . . . . 1013
1.2.2. Separation of fine-mode and coarse-mode PM . . . . . . . . . . . . . . . . . . . . . . 1014
1.2.3. Semivolatile particulate matter . . . . . . . . . . . . . . . . . . . . . . . . . . . . . . . . . 1015
Chemosphere 49 (2002) 1009–1043
www.elsevier.com/locate/chemosphere
*Corresponding author. Tel.: +1-919-541-2551; fax: +1-919-929-2985.
E-mail address: [email protected] (W.E. Wilson).
0045-6535/02/$ - see front matter Published by Elsevier Science Ltd.
PII: S0045-6535 (02 )00270-9

1.2.3.1. Treatment of semivolatile components of PM . . . . . . . . . . . . . . . 1015
1.2.3.2. Problems associated with semivolatile PM . . . . . . . . . . . . . . . . . . 1015
1.2.4. Treatment of pressure, temperature, and relative humidity . . . . . . . . . . . . . . 1018
1.2.5. Time resolution . . . . . . . . . . . . . . . . . . . . . . . . . . . . . . . . . . . . . . . . . . . . 1018
1.2.6. No way to determine accuracy . . . . . . . . . . . . . . . . . . . . . . . . . . . . . . . . . 1018
1.3. PM components/parameters that need to be measured . . . . . . . . . . . . . . . . . . . . . . . 1019
1.4. The federal reference methods for measurement of equilibrated mass for PM10, PM2.5,
and PM10–2.5 . . . . . . . . . . . . . . . . . . . . . . . . . . . . . . . . . . . . . . . . . . . . . . . . . . . . . 1020
1.4.1. PM10. . . . . . . . . . . . . . . . . . . . . . . . . . . . . . . . . . . . . . . . . . . . . . . . . . . . 1020
1.4.2. PM2.5 . . . . . . . . . . . . . . . . . . . . . . . . . . . . . . . . . . . . . . . . . . . . . . . . . . . 1020
1.4.3. PM10–2.5 . . . . . . . . . . . . . . . . . . . . . . . . . . . . . . . . . . . . . . . . . . . . . . . . . 1022
1.4.3.1. The difference method . . . . . . . . . . . . . . . . . . . . . . . . . . . . . . . . 1022
1.4.3.2. Multi-stage impaction . . . . . . . . . . . . . . . . . . . . . . . . . . . . . . . . 1023
1.4.3.3. Virtual impaction . . . . . . . . . . . . . . . . . . . . . . . . . . . . . . . . . . . 1023
1.5. Speciation monitoring . . . . . . . . . . . . . . . . . . . . . . . . . . . . . . . . . . . . . . . . . . . . . . 1024
1.5.1. Inorganic elemental analyses . . . . . . . . . . . . . . . . . . . . . . . . . . . . . . . . . . . 1024
1.5.1.1. Energy dispersive X-ray fluorescence . . . . . . . . . . . . . . . . . . . . . . 1024
1.5.1.2. Synchrotron induced X-ray fluorescence . . . . . . . . . . . . . . . . . . . 1025
1.5.1.3. Proton induced X-ray emission . . . . . . . . . . . . . . . . . . . . . . . . . . 1025
1.5.1.4. Proton elastic scattering analysis . . . . . . . . . . . . . . . . . . . . . . . . . 1025
1.5.1.5. Total reflection X-ray fluorescence . . . . . . . . . . . . . . . . . . . . . . . 1025
1.5.1.6. Instrumental neutron activation analysis . . . . . . . . . . . . . . . . . . . 1026
1.5.1.7. Atomic absorption spectrophotometry. . . . . . . . . . . . . . . . . . . . . 1026
1.5.1.8. Inductively coupled plasma with atomic emission spectroscopy . . . 1026
1.5.1.9. Inductively coupled plasma with mass spectroscopy . . . . . . . . . . . 1026
1.5.2. Water-soluble ions analysis methods . . . . . . . . . . . . . . . . . . . . . . . . . . . . . 1026
1.5.3. Carbon analysis methods . . . . . . . . . . . . . . . . . . . . . . . . . . . . . . . . . . . . . 1027
1.5.4. Organic speciation . . . . . . . . . . . . . . . . . . . . . . . . . . . . . . . . . . . . . . . . . . 1029
1.6. Continuous mass monitoring . . . . . . . . . . . . . . . . . . . . . . . . . . . . . . . . . . . . . . . . . 1030
1.6.1. Tapered element oscillating microbalance . . . . . . . . . . . . . . . . . . . . . . . . . . 1030
1.6.2. Real-time total ambient mass sampler . . . . . . . . . . . . . . . . . . . . . . . . . . . . 1030
1.6.3. Continuous ambient mass monitor. . . . . . . . . . . . . . . . . . . . . . . . . . . . . . . 1030
1.6.4. Piezoelectric microbalance. . . . . . . . . . . . . . . . . . . . . . . . . . . . . . . . . . . . . 1031
1.6.5. Light scattering . . . . . . . . . . . . . . . . . . . . . . . . . . . . . . . . . . . . . . . . . . . . 1031
1.6.6. Beta-gauge techniques. . . . . . . . . . . . . . . . . . . . . . . . . . . . . . . . . . . . . . . . 1031
1.7. Continuous monitoring of specific components . . . . . . . . . . . . . . . . . . . . . . . . . . . . 1032
1.7.1. Carbon . . . . . . . . . . . . . . . . . . . . . . . . . . . . . . . . . . . . . . . . . . . . . . . . . . 1032
1.7.2. Sulfur/sulfate . . . . . . . . . . . . . . . . . . . . . . . . . . . . . . . . . . . . . . . . . . . . . . 1032
1.7.3. Nitrate . . . . . . . . . . . . . . . . . . . . . . . . . . . . . . . . . . . . . . . . . . . . . . . . . . 1032
1.7.4. Continuous ion chromatography . . . . . . . . . . . . . . . . . . . . . . . . . . . . . . . . 1033
1.8. Low flow filter samples for multi-day collection of PM. . . . . . . . . . . . . . . . . . . . . . . 1033
1.9. Conclusions . . . . . . . . . . . . . . . . . . . . . . . . . . . . . . . . . . . . . . . . . . . . . . . . . . . . . 1033
Disclaimer . . . . . . . . . . . . . . . . . . . . . . . . . . . . . . . . . . . . . . . . . . . . . . . . . . . . . . . . . . . . . . 1034
References . . . . . . . . . . . . . . . . . . . . . . . . . . . . . . . . . . . . . . . . . . . . . . . . . . . . . . . . . . . . . . 1034
1. Introduction
Atmospheric particles originate from a variety of
sources and possess a range of morphological, chemical,
physical, and thermodynamic properties. Examples in-
clude combustion-generated particles such as diesel soot
or fly ash, photochemically produced particles such as
those found in urban haze, salt particles formed from
sea spray, and soil-like particles from resuspended dust.
Some particles are liquid; some are solid; others contain
a solid core surrounded by liquid. Atmospheric particles
contain inorganic ions, metallic compounds, elemental
carbon (EC), organic compounds, and crustal com-
pounds. Some atmospheric particles are hygroscopic
and contain particle-bound water. The organic fraction
is especially complex, containing hundreds of organic
compounds. Primary particles are emitted directly from
sources. Secondary particles are formed from gases
1010 W.E. Wilson et al. / Chemosphere 49 (2002) 1009–1043
through chemical reactions in the atmosphere involving
atmospheric oxygen (O2) and water vapor (H2O); reac-
tive species such as ozone (O3); radicals such as the
hydroxyl (�OH) and nitrate (�NO3) radicals; and pollu-
tants such as sulfur dioxide (SO2), nitrogen oxides
(NOx), and organic gases from natural and anthropo-
genic sources. The particle formation process includes
nucleation of particles from low-vapor pressure gases
emitted from sources or formed in the atmosphere,
condensation of low-vapor pressure gases on existing
particles, and coagulation of particles. Thus, any given
particle may contain particulate matter (PM) from many
sources.
Atmospheric particles often are not spherical and
have a range of densities. Therefore, their diameters
are often described by an ‘‘equivalent’’ diameter (i.e., the
diameter of a unit density sphere that would have the
same physical behavior as the particle in question).
The aerodynamic diameter, important for particle trans-
port, removal, collection, and respiratory tract deposi-
tion, is defined as the diameter of a spherical particle
with a density of 1 g/cm3 but with a settling velocity
equal to that of the particle in question. Particles with
the same physical size and shape but different densities
will have different aerodynamic diameters. Detailed
definitions of the various sizes and their relationships
are given in standard aerosol textbooks, e.g., Friedlander
(1977); Reist (1984), and Seinfeld and Pandis (1998).
Older particle counting studies used optical particle
counters to cover the range of 0.3–30 lm diameter. Di-
ameters of particles below 0.5 lm were measured as
mobility diameters. The particle diameters used in size
distribution graphs from these studies are usually given
as physical diameters rather than aerodynamic diame-
ters. Size distribution studies using impactors give direct
measurements of the aerodynamic diameter. In recent
years, aerodynamic particle sizers have been used to
give a direct measurement of the aerodynamic diameter
in the range of approximately 0.7–10 lm. A variety of
electrical mobility analyzers are used to measure the
mobility diameter of particles from 2–5 nm to approxi-
mately 0.5 lm (McMurry, 1999). In this paper, Dp will
be used for physical diameter and Da for aerodynamic
diameter.
1.1. Definitions of particle size fractions
The distribution of particles with respect to size is an
important physical parameter governing their behavior.
Because atmospheric particles cover several orders of
magnitude in particle size, size distributions often are
expressed in terms of the logarithm of the particle
diameter on the X-axis and the measured differential
concentration on the Y-axis: DV =DðlogDpÞ ¼ the vol-
ume of particles per cm3 of air having diameters in
the size range from logDp to logðDp þ DDpÞ. If DV =DðlogDpÞ is plotted on a linear scale, the volume of
particles between Dp and Dp þ DDp is proportional to
the area under the curve of DV =DðlogDpÞ versus logDp.
Similar considerations apply to distributions of num-
ber, surface area, and mass. It has been found that
atmospheric aerosol size distributions frequently may
be approximated by a sum of log–normal distribu-
tions corresponding to the various modes or fractions.
When approximated by a function, the distributions
are usually given as dV =dðlogDpÞ rather than DV =DðlogDpÞ.
The aerosol community uses four different ap-
proaches or conventions in the classification of particles
by size: (1) modes, based on the observed size distribu-
tions and formation mechanisms; (2) cutpoint, usually
based on the 50% cutpoint of the specific sampling de-
vice; (3) occupational sizes, based on the entrance into
various compartments of the respiratory system; and (4)
legally specified, regulatory sizes for air quality stan-
dards. These terms will be defined in the subsequent
discussions.
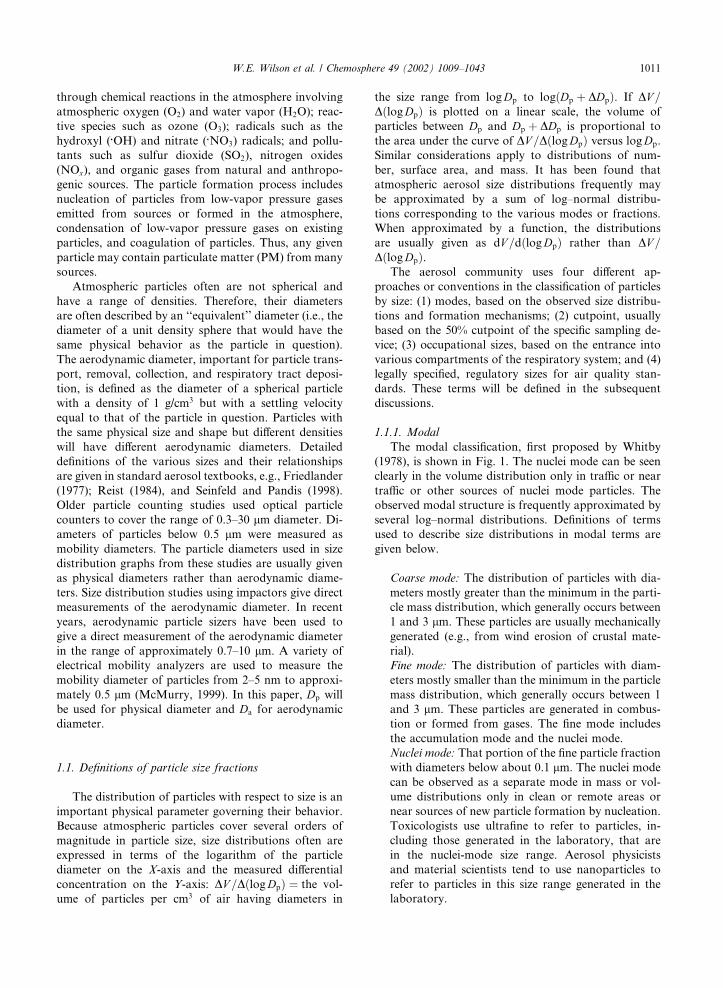
1.1.1. Modal
The modal classification, first proposed by Whitby
(1978), is shown in Fig. 1. The nuclei mode can be seen
clearly in the volume distribution only in traffic or near
traffic or other sources of nuclei mode particles. The
observed modal structure is frequently approximated by
several log–normal distributions. Definitions of terms
used to describe size distributions in modal terms are
given below.
Coarse mode: The distribution of particles with dia-
meters mostly greater than the minimum in the parti-
cle mass distribution, which generally occurs between
1 and 3 lm. These particles are usually mechanically
generated (e.g., from wind erosion of crustal mate-
rial).
Fine mode: The distribution of particles with diam-
eters mostly smaller than the minimum in the particle
mass distribution, which generally occurs between 1
and 3 lm. These particles are generated in combus-
tion or formed from gases. The fine mode includes
the accumulation mode and the nuclei mode.
Nuclei mode: That portion of the fine particle fraction
with diameters below about 0.1 lm. The nuclei mode
can be observed as a separate mode in mass or vol-
ume distributions only in clean or remote areas or
near sources of new particle formation by nucleation.
Toxicologists use ultrafine to refer to particles, in-
cluding those generated in the laboratory, that are
in the nuclei-mode size range. Aerosol physicists
and material scientists tend to use nanoparticles to
refer to particles in this size range generated in the
laboratory.
W.E. Wilson et al. / Chemosphere 49 (2002) 1009–1043 1011
Accumulation mode: That portion of the fine particle
fraction with diameters above about 0.1 lm. Accu-
mulation-mode particles normally do not grow into
the coarse mode. Nuclei-mode particles grow by
coagulation (two particles combining to form one)
or by condensation (low-equilibrium vapor pressure
gas molecules condensing on a particle) and ‘‘accu-
mulate’’ in this size range.
Over the years, the terms fine and coarse, as applied
to particle sizes, have lost the precise meaning given in
Whitby�s (1978) definition. In any given article, there-
fore, the meaning of fine and coarse, unless defined,
must be inferred from the author�s usage. In particular,
PM2:5 and fine-mode particles are not equivalent. In this
document, the term mode is used with fine and coarse
when it is desired to specify the distribution of fine-mode
particles or coarse-mode particles as shown in Figs. 1
and 2.
1.1.2. Sampler cutpoint
Another set of definitions of particle size fractions
arises from considerations of size-selective sampling.
Size-selective sampling refers to the collection of parti-
cles below or within a specified aerodynamic size range,
usually defined by the upper 50% cutpoint size, and has
arisen in an effort to measure particle size fractions with
some special significance (e.g., health, visibility, source
apportionment, etc.). Dichotomous samplers split the
particles into smaller and larger fractions that may be
collected on separate filters. Cascade impactors use
multiple size cuts to obtain a distribution of size cuts for
mass or chemical composition measurements. One-filter
samplers with a variety of upper size cuts have also been
used.
1.1.3. Occupational health size cuts
The occupational health community has defined size
fractions for use in the protection of human health. This
convention classifies particles into inhalable, thoracic,
and respirable particles according to their upper size
cuts. However, these size fractions may also be charac-
terized in terms of their entrance into various com-
partments of the respiratory system. Thus, inhalable
particles enter the respiratory tract, including the head
airways. Thoracic particles travel past the larynx and
reach the lung airways and the gas-exchange regions of
the lung. Respirable particles are a subset of thoracic
particles that are more likely to reach the gas-exchange
region of the lung. In the past, exact definitions of
these terms have varied among organizations. As of
1993 a unified set of definitions was adopted by the
American Conference of Governmental Industrial Hy-
gienists ACGIH (1994), the International Standards
Organization (ISO), and the European Standardization
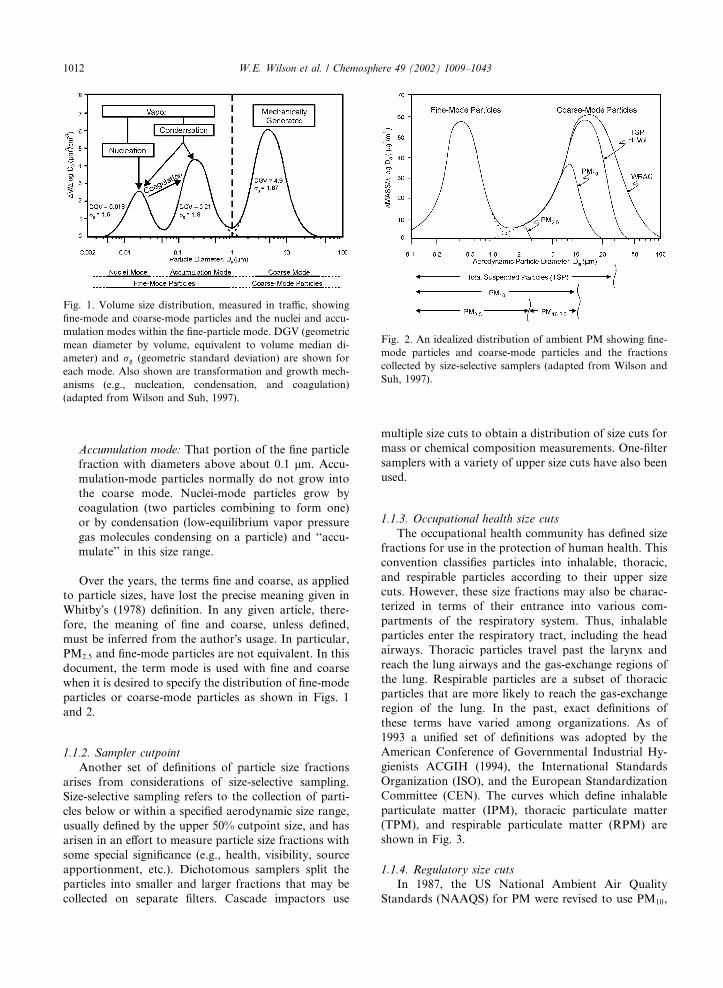
Committee (CEN). The curves which define inhalable
particulate matter (IPM), thoracic particulate matter
(TPM), and respirable particulate matter (RPM) are
shown in Fig. 3.
1.1.4. Regulatory size cuts
In 1987, the US National Ambient Air Quality
Standards (NAAQS) for PM were revised to use PM10,
Fig. 1. Volume size distribution, measured in traffic, showing
fine-mode and coarse-mode particles and the nuclei and accu-
mulation modes within the fine-particle mode. DGV (geometric
mean diameter by volume, equivalent to volume median di-
ameter) and rg (geometric standard deviation) are shown for
each mode. Also shown are transformation and growth mech-
anisms (e.g., nucleation, condensation, and coagulation)
(adapted from Wilson and Suh, 1997).
Fig. 2. An idealized distribution of ambient PM showing fine-
mode particles and coarse-mode particles and the fractions
collected by size-selective samplers (adapted from Wilson and
Suh, 1997).
1012 W.E. Wilson et al. / Chemosphere 49 (2002) 1009–1043
rather than total suspended particulate (TSP) matter, as
the indicator for the NAAQS for PM (Federal Register,
1987). The use of PM10 as an indicator is an example
of size-selective sampling based on a regulatory size cut
(Federal Register, 1987). The selection of PM10 as an
indicator was based on health considerations and was
intended to focus regulatory concern on those particles
small enough to enter the thoracic region. The PM2:5
standard, set in 1997, is also an example of size-selective
sampling based on a regulatory size cut (Federal Reg-
ister, 1997). The PM2:5 standard was based primarily on
epidemiological studies using concentrations measured
with PM2:5 samplers as an exposure index. However, the
PM2:5 sampler was not designed to collect respirable
particles. It was designed to collect fine-mode particles
because of their different sources (Whitby et al., 1974).
Thus, the need to attain a PM2:5 standard will increase
regulatory concern with the sources of fine-mode parti-
cles.
Prior to 1997, the indicator for the NAAQS for PM
was TSP matter. TSP is defined by the design of the
High Volume Sampler (hivol) which collects all of the
fine particles but only part of the coarse particles.
The upper cut off size of the hivol depends on the wind
speed and direction, and may vary from 25 to 40 lm.
The Wide Range Aerosol Classifier (WRAC) was de-
signed specifically to collect the entire coarse mode
(Lundgren and Burton, 1995).
1.2. Issues in the measurement of particulate matter
The decision by the US EPA to revise the standards
by adding daily and yearly standards for PM2:5 has led
to a renewed interest in the measurement of atmo-
spheric particles and also to a better understanding of
the problems in developing precise and accurate mea-
surements of particles. The 1996 Air Quality Criteria
for Particulate Matter (PM AQCD) (US EPA, US
Environmental Protection Agency, 1996) summarized
measurement techniques for PM. Two other excellent
reviews have been published in recent years by Chow
(1995) and McMurry (1999). Unfortunately, it is very
difficult to measure and characterize particles suspended
in the atmosphere.
The US Federal Reference Methods (FRM) for
PM2:5 and PM10 provide relatively precise (�10%)
methods for determining the mass of material remaining
on a Teflon filter after equilibration. However, numer-
ous uncertainties remain as to the relationship between
the mass and composition of material remaining on the
filter, as measured by the FRMs, and the mass and
composition of material that exists in the atmosphere as
suspended PM. The goal of a PM indicator might be to
accurately measure what exists as a particle in the
atmosphere. However, this is not currently possible, in
part because of the difficulty of creating a reference
standard for particles suspended in the atmosphere. As a
result, EPA defines accuracy for PM measurements in
terms of agreement of a candidate sampler with a ref-
erence sampler. Therefore, intercomparisons of samplers
become very important in determining how well various
samplers agree and how various design choices influence
what is actually measured.
There are six general areas where choices must be
made in designing an aerosol indicator. These include
selection of an upper cutpoint; separation of fine-mode
and coarse-mode PM; treatment of semivolatile com-
ponents; treatment of pressure, temperature, and rela-
tive humidity (RH); time resolution; and how to assess
the reliability of the measurement technique. In many
cases choices have been made by default and with an
inadequate understanding of the consequences. As a
result, measurement methods developed by different
organizations may give different results when sampling
the same atmosphere, even though the techniques ap-
pear to be similar.
1.2.1. Upper cutpoint
The measurement technique should provide an upper
cutpoint and its standard deviation that is independent
of wind speed and direction (the classical high volume
sampler head was unsatisfactory because of radial
asymmetry). PM10 and thoracic PM, as shown in Fig. 3,
have the same 50% cutpoint. However, the PM10 cut
(Code of Federal Regulations, 2001a,b,c) is sharper than
Fig. 3. Specified particle penetration (size-cut curves) through
an ideal (no-particle-loss) inlet for five different size-selective
sampling criteria. Regulatory size cuts are defined in the Code
of Federal Regulations: PM2:5 Code of Federal Regulations
(2001a), PM10 Code of Federal Regulations (2001b). PM2:5 is
also defined in the Federal Register (1997, 1998). Size-cut curves
for IPM, TPM and RPM size cuts are computed from defini-
tions given by American Conference of Governmental and In-
dustrial Hygienists, ACGIH (1994).
W.E. Wilson et al. / Chemosphere 49 (2002) 1009–1043 1013
the thoracic cut, so thoracic PM contains some particles
between 10 and 30 lm diameter that are excluded from
PM10. The US PM10 separation curve, while sharper
than the thoracic curve, is probably satisfactory both for
regulatory and health risk monitoring. It has the ad-
vantage of reducing the problem of maintaining the
finite collection efficiency specified by the thoracic pen-
etration curve for particles larger than 10 lm Da (see
Fig. 3). In Fig. 2, an idealized distribution is used to
show the normally observed division of ambient PM
into fine-mode particles and coarse-mode particles and
the size fractions collected by the WRAC, TSP, PM10,
PM2:5, and PM10–2:5 samplers.
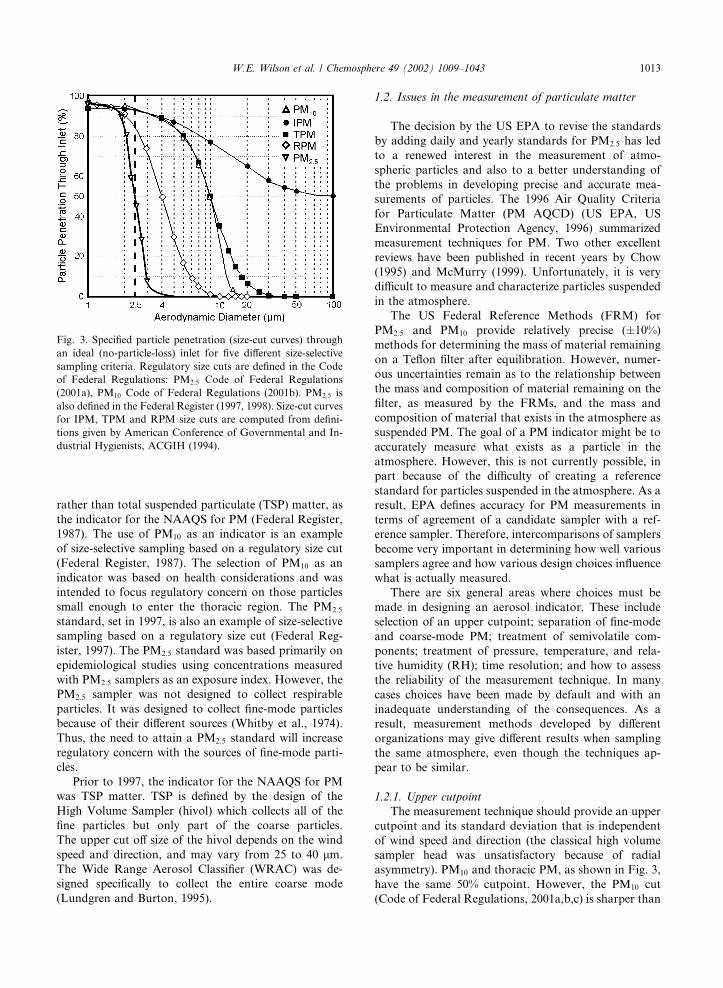
The PM10 upper cutpoint is defined as having a 50%
collection efficiency at 10� 0:5 lm aerodynamic dia-
meter. The slope of the collection efficiency curve is
defined in amendments to 40 CFR, Part 53, the Code of
Federal Regulations (2001c). Papers discussing PM10 or
PM2:5 frequently insert an explanation such as PMx
(particles less than x lm diameter) or PMx (nominally,
particles with aerodynamic diameter 6 x lm). While
these explanations may seen easier than the more nearly
correct, PMx, (particles collected with an upper 50%
cutpoint of x lm aerodynamic diameter), they are not
entirely correct and may be misleading because they
suggest an upper 100% cutpoint of x lm. Some coun-
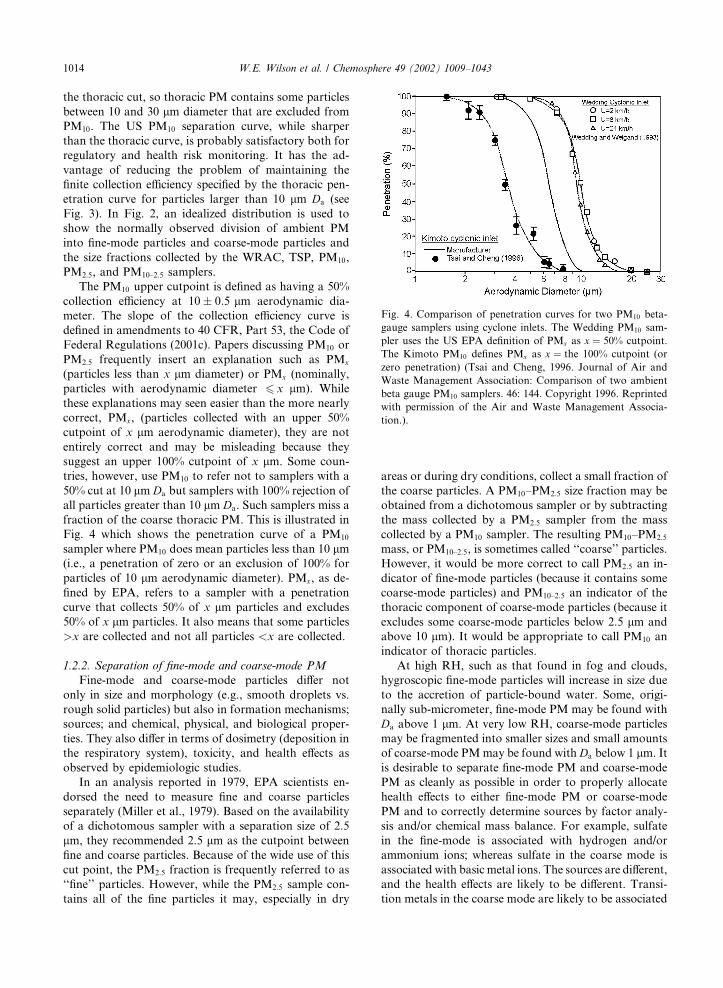
tries, however, use PM10 to refer not to samplers with a
50% cut at 10 lm Da but samplers with 100% rejection of
all particles greater than 10 lm Da. Such samplers miss a
fraction of the coarse thoracic PM. This is illustrated in
Fig. 4 which shows the penetration curve of a PM10
sampler where PM10 does mean particles less than 10 lm(i.e., a penetration of zero or an exclusion of 100% for
particles of 10 lm aerodynamic diameter). PMx, as de-
fined by EPA, refers to a sampler with a penetration
curve that collects 50% of x lm particles and excludes
50% of x lm particles. It also means that some particles
>x are collected and not all particles <x are collected.
1.2.2. Separation of fine-mode and coarse-mode PM
Fine-mode and coarse-mode particles differ not
only in size and morphology (e.g., smooth droplets vs.
rough solid particles) but also in formation mechanisms;
sources; and chemical, physical, and biological proper-
ties. They also differ in terms of dosimetry (deposition in
the respiratory system), toxicity, and health effects as
observed by epidemiologic studies.
In an analysis reported in 1979, EPA scientists en-
dorsed the need to measure fine and coarse particles
separately (Miller et al., 1979). Based on the availability
of a dichotomous sampler with a separation size of 2.5
lm, they recommended 2.5 lm as the cutpoint between
fine and coarse particles. Because of the wide use of this
cut point, the PM2:5 fraction is frequently referred to as
‘‘fine’’ particles. However, while the PM2:5 sample con-
tains all of the fine particles it may, especially in dry
areas or during dry conditions, collect a small fraction of
the coarse particles. A PM10–PM2:5 size fraction may be
obtained from a dichotomous sampler or by subtracting
the mass collected by a PM2:5 sampler from the mass
collected by a PM10 sampler. The resulting PM10–PM2:5
mass, or PM10–2:5, is sometimes called ‘‘coarse’’ particles.
However, it would be more correct to call PM2:5 an in-
dicator of fine-mode particles (because it contains some
coarse-mode particles) and PM10–2:5 an indicator of the
thoracic component of coarse-mode particles (because it
excludes some coarse-mode particles below 2.5 lm and
above 10 lm). It would be appropriate to call PM10 an
indicator of thoracic particles.
At high RH, such as that found in fog and clouds,
hygroscopic fine-mode particles will increase in size due
to the accretion of particle-bound water. Some, origi-
nally sub-micrometer, fine-mode PM may be found with
Da above 1 lm. At very low RH, coarse-mode particles
may be fragmented into smaller sizes and small amounts
of coarse-mode PMmay be found with Da below 1 lm. It
is desirable to separate fine-mode PM and coarse-mode
PM as cleanly as possible in order to properly allocate
health effects to either fine-mode PM or coarse-mode
PM and to correctly determine sources by factor analy-
sis and/or chemical mass balance. For example, sulfate
in the fine-mode is associated with hydrogen and/or
ammonium ions; whereas sulfate in the coarse mode is
associated with basic metal ions. The sources are different,
and the health effects are likely to be different. Transi-
tion metals in the coarse mode are likely to be associated
Fig. 4. Comparison of penetration curves for two PM10 beta-
gauge samplers using cyclone inlets. The Wedding PM10 sam-
pler uses the US EPA definition of PMx as x ¼ 50% cutpoint.
The Kimoto PM10 defines PMx as x ¼ the 100% cutpoint (or
zero penetration) (Tsai and Cheng, 1996. Journal of Air and
Waste Management Association: Comparison of two ambient
beta gauge PM10 samplers. 46: 144. Copyright 1996. Reprinted
with permission of the Air and Waste Management Associa-
tion.).
1014 W.E. Wilson et al. / Chemosphere 49 (2002) 1009–1043
with soil and tend to be less soluble than transition
metals in fresh combustion particles in the fine mode.
The current practice of separating fine-mode and
coarse-mode particles at 2.5 lm Da is satisfactory for a
health-based standard. However, it may not provide an
adequate separation for epidemiologic studies in areas
where winds cause high concentrations of wind blown
soil. A possible approach that would provide a better
separation of fine-mode PM and coarse-mode PM
would be to dehumidify the air stream to some fixed
humidity that would remove all or most particle-bound
water without evaporating semivolatile components and
make the cut near 1 lm Da.
1.2.3. Semivolatile particulate matter
1.2.3.1. Treatment of semivolatile components of partic-
ulate matter. Current filtration-based mass measure-
ments lead to significant evaporative losses, during and
possibly after collection, of a variety of semivolatile
components, i.e., species that exist in the atmosphere in
dynamic equilibrium between the condensed phase and
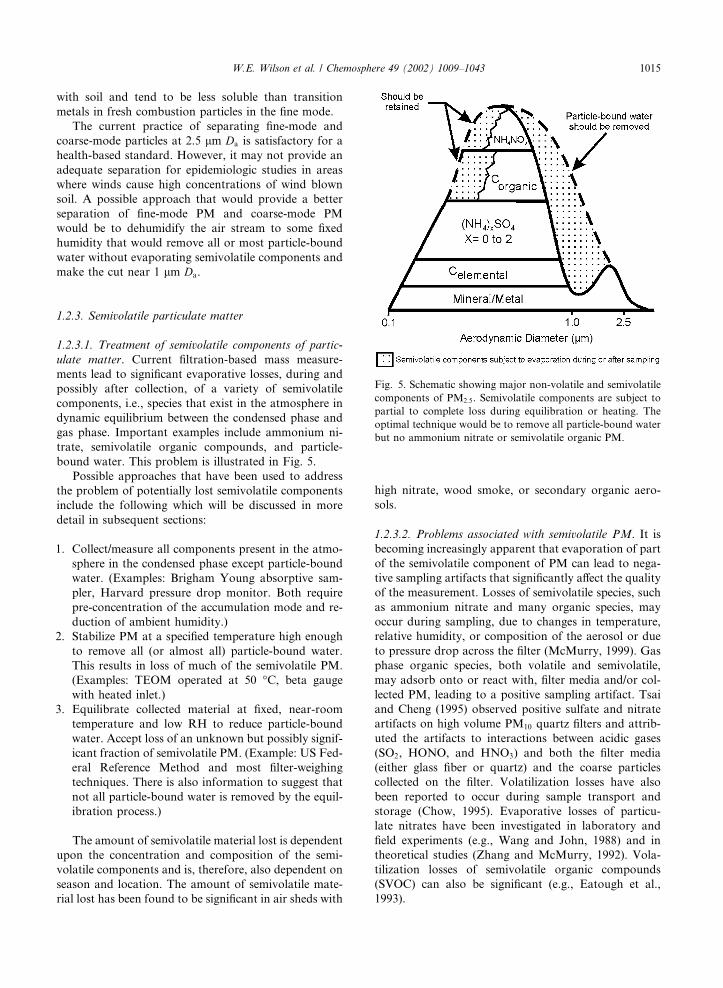
gas phase. Important examples include ammonium ni-
trate, semivolatile organic compounds, and particle-
bound water. This problem is illustrated in Fig. 5.
Possible approaches that have been used to address
the problem of potentially lost semivolatile components
include the following which will be discussed in more
detail in subsequent sections:
1. Collect/measure all components present in the atmo-
sphere in the condensed phase except particle-bound
water. (Examples: Brigham Young absorptive sam-
pler, Harvard pressure drop monitor. Both require
pre-concentration of the accumulation mode and re-
duction of ambient humidity.)
2. Stabilize PM at a specified temperature high enough
to remove all (or almost all) particle-bound water.
This results in loss of much of the semivolatile PM.
(Examples: TEOM operated at 50 �C, beta gauge
with heated inlet.)
3. Equilibrate collected material at fixed, near-room
temperature and low RH to reduce particle-bound
water. Accept loss of an unknown but possibly signif-
icant fraction of semivolatile PM. (Example: US Fed-
eral Reference Method and most filter-weighing
techniques. There is also information to suggest that
not all particle-bound water is removed by the equil-
ibration process.)
The amount of semivolatile material lost is dependent
upon the concentration and composition of the semi-
volatile components and is, therefore, also dependent on
season and location. The amount of semivolatile mate-
rial lost has been found to be significant in air sheds with
high nitrate, wood smoke, or secondary organic aero-
sols.
1.2.3.2. Problems associated with semivolatile PM. It is
becoming increasingly apparent that evaporation of part
of the semivolatile component of PM can lead to nega-
tive sampling artifacts that significantly affect the quality
of the measurement. Losses of semivolatile species, such
as ammonium nitrate and many organic species, may
occur during sampling, due to changes in temperature,
relative humidity, or composition of the aerosol or due
to pressure drop across the filter (McMurry, 1999). Gas
phase organic species, both volatile and semivolatile,
may adsorb onto or react with, filter media and/or col-
lected PM, leading to a positive sampling artifact. Tsai
and Cheng (1995) observed positive sulfate and nitrate
artifacts on high volume PM10 quartz filters and attrib-
uted the artifacts to interactions between acidic gases
(SO2, HONO, and HNO3) and both the filter media
(either glass fiber or quartz) and the coarse particles
collected on the filter. Volatilization losses have also
been reported to occur during sample transport and
storage (Chow, 1995). Evaporative losses of particu-
late nitrates have been investigated in laboratory and
field experiments (e.g., Wang and John, 1988) and in
theoretical studies (Zhang and McMurry, 1992). Vola-
tilization losses of semivolatile organic compounds
(SVOC) can also be significant (e.g., Eatough et al.,
1993).
Fig. 5. Schematic showing major non-volatile and semivolatile
components of PM2:5. Semivolatile components are subject to
partial to complete loss during equilibration or heating. The
optimal technique would be to remove all particle-bound water
but no ammonium nitrate or semivolatile organic PM.
W.E. Wilson et al. / Chemosphere 49 (2002) 1009–1043 1015
Adsorption of organic vapors onto quartz filters has
also been recognized as a source of positive sampling
error. Although original experiments investigating this
sampling artifact were typically carried out utilizing two
quartz fiber filters deployed in series, the second quartz
filter can indicate both gaseous VOC adsorbed on both
filters (positive) artifact and SVOC evaporated from
particles on the first filter and subsequently adsorbed on
the second filter (negative artifact). Unless the individual
compounds are identified, the investigator does not
know what to do with the loading value on the second
filter (i.e., to add or subtract it from the first filter
loading value).
Much progress has been made to date in the design
of diffusion denuder systems for the measurement and
characterization of both the particulate and gaseous
phases of semivolatile compounds. Some of the recent
research has focused upon reduction in the size of the
denuder, optimization of the residence time in the de-
nuder, understanding the effect of diffusion denuders on
the positive quartz filter artifact, identifying changes in
chemical composition that occur during sampling, de-
termining the effects of changes in temperature and RH,
and identifying possible loses by absorption in impactor
coatings. The developing state of the art in which dif-
fusion denuder technology is being applied to SVOC
sampling (e.g., Eatough et al., 1993; Gundel et al., 1995),
as well as for sampling of gas and particulate phase
organic acids (Lawrence and Koutrakis, 1996a,b), holds
promise for improving our understanding of SVOC
sampling artifacts.
Particulate nitrates: It is well known that volatiliza-
tion losses of particulate nitrates (e.g., Zhang and
McMurry, 1992; Hering and Cass, 1999) will occur
during sampling on Teflon filters. The effect on the ac-
curacy of atmospheric particulate measurements from
these volatilization losses will be even more significant
for PM2:5 than they are for PM10. The FRM for PM2:5
will suffer loss of nitrates similar to the losses experi-
enced with other simple filter collection systems. Sam-
pling artifacts due to the loss of particulate nitrates will
represent a significant problem in areas such as southern
California that experience high amounts of nitrogen
species.
Hering and Cass (1999) examined the errors in
PM2:5 mass measurements due to the volatilization of
particulate nitrate by looking at data from two field
measurement campaigns conducted in southern Cali-
fornia–the Southern California Air Quality Study,
SCAQS (Lawson, 1990), and the 1986 CalTech study
(Solomon et al., 1992). In both these studies, side-by-
side sampling of PM2:5 was conducted. One sampler
collected particles directly onto a Teflon filter; the sec-
ond sampler consisted of a denuder to remove gaseous
nitric acid followed by a nylon filter that absorbs the
HNO3 that evaporates from ammonium nitrate. In both
studies, the denuder consisted of MgO-coated glass tubes
(Appel et al., 1981). Fine particulate nitrate collected on
the Teflon filter was compared to fine particulate nitrate
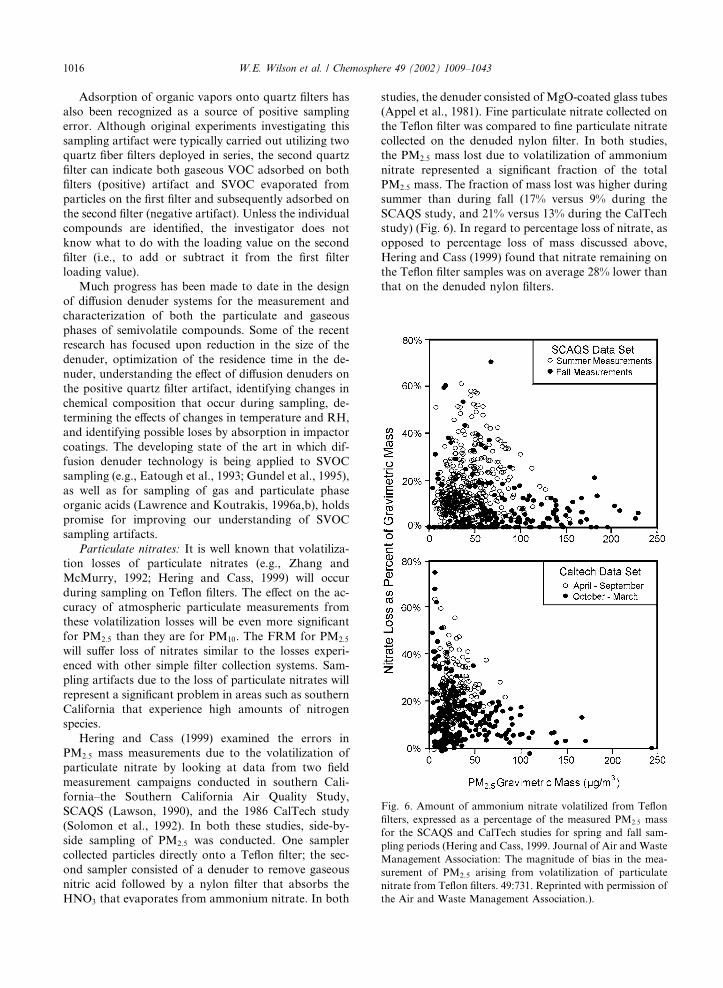
collected on the denuded nylon filter. In both studies,
the PM2:5 mass lost due to volatilization of ammonium
nitrate represented a significant fraction of the total
PM2:5 mass. The fraction of mass lost was higher during
summer than during fall (17% versus 9% during the
SCAQS study, and 21% versus 13% during the CalTech
study) (Fig. 6). In regard to percentage loss of nitrate, as
opposed to percentage loss of mass discussed above,
Hering and Cass (1999) found that nitrate remaining on
the Teflon filter samples was on average 28% lower than
that on the denuded nylon filters.
Fig. 6. Amount of ammonium nitrate volatilized from Teflon
filters, expressed as a percentage of the measured PM2:5 mass
for the SCAQS and CalTech studies for spring and fall sam-
pling periods (Hering and Cass, 1999. Journal of Air and Waste
Management Association: The magnitude of bias in the mea-
surement of PM2.5 arising from volatilization of particulate
nitrate from Teflon filters. 49:731. Reprinted with permission of
the Air and Waste Management Association.).
1016 W.E. Wilson et al. / Chemosphere 49 (2002) 1009–1043

Hering and Cass (1999) also analyzed these data by
extending the evaporative model developed by Zhang
and McMurry (1987). The extended model utilized by
Hering and Cass (1999) takes into account dissociation
of collected particulate ammonium nitrate on Teflon
filters into nitric acid and ammonia via three mecha-
nisms: scrubbing of nitric acid and ammonia in the
sampler inlet [(John et al., 1988) showed that clean PM10
inlet surfaces serve as an effective denuder for nitric
acid]; heating of the filter substrate above ambient tem-
perature by sampling; and pressure drop across the
Teflon filter. For the sampling systems modeled, the
flow-induced pressure drop was measured to be less than
0.02 atmospheres, and the corresponding change in
vapor pressure was 2% so losses driven by pressure drop
were not considered to be significant in this work. Losses
from Teflon filters were found to be higher during the
summer compared to the winter, and higher during the
day compared to night, and were reasonably consistent
with modeled predictions.
In atmospheres with high sulfate and low ammonia,
the PM tends to be acidic (NH4HSO4 or H2SO4) and
nitric acid remains as a gas. In atmospheres with lower
sulfate and higher ammonia, there may be sufficient
ammonia to fully neutralize the H2SO4 and also react
with HNO3 to form NH4NO3 particles. Therefore,
loss of nitrate will be a bigger problem in the areas
where SO2 emissions are low and ammonia emissions
are high.
Semivolatile organic compounds: Although there is
less information on losses of SVOC, it is known that
these species can similarly be lost from Teflon filters due
to volatilization and can also cause the PM2:5 mass to be
significantly underestimated. Like particulate nitrates,
the FRM for PM2:5 will suffer loss of SVOC similar to
the losses experienced with other simple filter collection
systems. It has been shown that attempting to correct
for the losses of SVOC during sampling by deploying
a second quartz filter directly behind either a quartz
or Teflon filter can significantly underestimate the vol-
atilization losses (e.g., Eatough et al., 1993). Using
their multi-channel diffusion denuder sampling system
(BOSS), Eatough et al. (1995) reported that, for samples
collected at the South Coast Air Quality Management
District sampling site at Azusa, CA, changes in the
phase distribution of SVOC could result in a loss on
average of 35% of the particulate organic material; the
fraction of the total fine PM that this loss represents was
not given. At present, there are limited data available
specifically on the fraction of PM2:5 mass lost during
sampling onto Teflon filters due to volatilization of or-
ganic species and even less on the regional differences in
the effects of volatilization losses of SVOC. Cui et al.
(1998) found that losses of SVOC from particles in the
Los Angeles Basin during the summer were greater
during the day than at night. Cui et al. (1998) deter-
mined that, on average, 42% and 62% of the particulate
organic material was semivolatile organic compounds
lost from particles during sampling for daytime and
nighttime samples, respectively.
Particle-bound water: It is generally desirable to col-
lect and measure ammonium nitrate and semivolatile
organic compounds. However, for many measurements
of suspended particle mass, it is desirable to remove the
particle-bound water before determining the mass. In
other situations it may be important to know how much
of the suspended particle�s mass or volume is due to
particle-bound water. The water content of PM is sig-
nificant and highly variable. Moreover, there is signifi-
cant hysteresis in the water adsorption–desorption
pathways (Seinfeld and Pandis, 1998), further compli-
cating the mass measurement. Figs. 7 and 8 show the
change in diameter of sulfate particles as a function of
RH. Fig. 7 shows the difference between deliquescence
and crystallization points.
Pilinis et al. (1989) calculated the water content of
atmospheric PM above and below the deliquescent
point. They predicted that aerosol water content is
strongly dependent upon composition and concluded
from their calculations that liquid water could represent
Fig. 7. Particle growth curves showing fully reversible hygro-
scopic growth of sulfuric acid (H2SO4) particles, deliquescent
growth of ammonium sulfate ((NH4)2SO4) particles at the
deliquescent point (A, about 80% RH), reversible hygroscopic
growth of ammonium sulfate solution droplets at RH greater
than 80%, and hysteresis (the droplet remains supersaturated as
the RH decreases below 80%) until the crystallization point (B,
about 38% RH) is reached (adapted from National Research
Council, 1993 and Tang, 1980).
W.E. Wilson et al. / Chemosphere 49 (2002) 1009–1043 1017
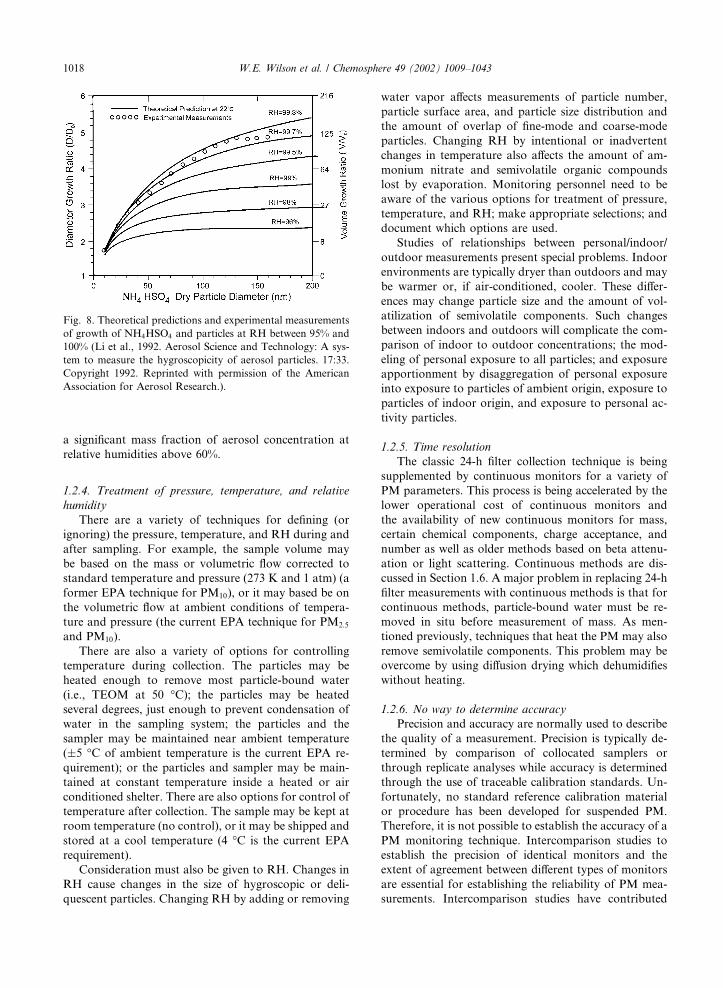
a significant mass fraction of aerosol concentration at
relative humidities above 60%.
1.2.4. Treatment of pressure, temperature, and relative
humidity
There are a variety of techniques for defining (or
ignoring) the pressure, temperature, and RH during and
after sampling. For example, the sample volume may
be based on the mass or volumetric flow corrected to
standard temperature and pressure (273 K and 1 atm) (a
former EPA technique for PM10), or it may based be on
the volumetric flow at ambient conditions of tempera-
ture and pressure (the current EPA technique for PM2:5
and PM10).
There are also a variety of options for controlling
temperature during collection. The particles may be
heated enough to remove most particle-bound water
(i.e., TEOM at 50 �C); the particles may be heated
several degrees, just enough to prevent condensation of
water in the sampling system; the particles and the
sampler may be maintained near ambient temperature
(�5 �C of ambient temperature is the current EPA re-
quirement); or the particles and sampler may be main-
tained at constant temperature inside a heated or air
conditioned shelter. There are also options for control of
temperature after collection. The sample may be kept at
room temperature (no control), or it may be shipped and
stored at a cool temperature (4 �C is the current EPA
requirement).
Consideration must also be given to RH. Changes in
RH cause changes in the size of hygroscopic or deli-
quescent particles. Changing RH by adding or removing
water vapor affects measurements of particle number,
particle surface area, and particle size distribution and
the amount of overlap of fine-mode and coarse-mode
particles. Changing RH by intentional or inadvertent
changes in temperature also affects the amount of am-
monium nitrate and semivolatile organic compounds
lost by evaporation. Monitoring personnel need to be
aware of the various options for treatment of pressure,
temperature, and RH; make appropriate selections; and
document which options are used.
Studies of relationships between personal/indoor/
outdoor measurements present special problems. Indoor
environments are typically dryer than outdoors and may
be warmer or, if air-conditioned, cooler. These differ-
ences may change particle size and the amount of vol-
atilization of semivolatile components. Such changes
between indoors and outdoors will complicate the com-
parison of indoor to outdoor concentrations; the mod-
eling of personal exposure to all particles; and exposure
apportionment by disaggregation of personal exposure
into exposure to particles of ambient origin, exposure to
particles of indoor origin, and exposure to personal ac-
tivity particles.
1.2.5. Time resolution
The classic 24-h filter collection technique is being
supplemented by continuous monitors for a variety of
PM parameters. This process is being accelerated by the
lower operational cost of continuous monitors and
the availability of new continuous monitors for mass,
certain chemical components, charge acceptance, and
number as well as older methods based on beta attenu-
ation or light scattering. Continuous methods are dis-
cussed in Section 1.6. A major problem in replacing 24-h
filter measurements with continuous methods is that for
continuous methods, particle-bound water must be re-
moved in situ before measurement of mass. As men-
tioned previously, techniques that heat the PM may also
remove semivolatile components. This problem may be
overcome by using diffusion drying which dehumidifies
without heating.
1.2.6. No way to determine accuracy
Precision and accuracy are normally used to describe
the quality of a measurement. Precision is typically de-
termined by comparison of collocated samplers or
through replicate analyses while accuracy is determined
through the use of traceable calibration standards. Un-
fortunately, no standard reference calibration material
or procedure has been developed for suspended PM.
Therefore, it is not possible to establish the accuracy of a
PM monitoring technique. Intercomparison studies to
establish the precision of identical monitors and the
extent of agreement between different types of monitors
are essential for establishing the reliability of PM mea-
surements. Intercomparison studies have contributed
Fig. 8. Theoretical predictions and experimental measurements
of growth of NH4HSO4 and particles at RH between 95% and
100% (Li et al., 1992. Aerosol Science and Technology: A sys-
tem to measure the hygroscopicity of aerosol particles. 17:33.
Copyright 1992. Reprinted with permission of the American
Association for Aerosol Research.).
1018 W.E. Wilson et al. / Chemosphere 49 (2002) 1009–1043
greatly to our understanding of the problems in PM
measurement. Such studies will be discussed as they
apply to specific measurement problems, monitoring
instruments, or analytical techniques. Measurement
errors of concern in PM10 sampling that arise due to
uncertainty tolerances in cutpoint, particle bounce and
reentrainment, impactor surface overloading, and losses
to sampler internal surfaces were discussed in detail in
the 1996 PM AQCD (US Environmental Protection
Agency, 1996). Measurement errors of concern in PM2:5
sampling arise because of our inability to assess accu-
racy in an absolute sense due to a lack of primary cali-
bration standards or procedures, because of the use
of an operational definition of PM2:5 as a surrogate for
fine particles, and because of problems associated with
trying to measure the mass of particles as they exist in
the air rather than what remains after collection on a
filter.
In response to the difficulties associated with deter-
mining the accuracy of PM measurements, the US En-
vironmental Protection Agency has sought to make
FRM measurements equivalent by specifying operating
conditions and, in the case of PM2:5 samplers, by spec-
ifying details of the sampler design. Thus, both the PM10
and PM2:5 standards are defined with consistency of
measurement technique rather than with the accuracy
of the true mass concentration measurement in mind
(McMurry, 1999). It is acknowledged in the Federal
Register (1997) that ‘‘because the size and volatility of
the particles making up ambient particulate matter
vary over a wide range and the mass concentration of
particles varies with particle size, it is difficult to define
the accuracy of PM2:5 measurements in an absolute
sense. . .’’ Thus, accuracy is defined as the degree of
agreement between a subject field PM2:5 sampler and
a collocated PM2:5 reference method audit sampler
(McMurry, 1999). The accurate measurement of the
mass of PM suspended in the atmosphere was of con-
cern in PM10 sampling and is of even greater concern for
PM2:5. As mentioned earlier, volatilization losses, during
sampling or post-sampling handling, of some organics
as well as ammonium nitrate can lead to a significant
underestimation of the fine particulate mass concentra-
tion in some locations. Sources of error in the mea-
surement of PM2:5 mass suspended in the atmosphere
also arise due to the adsorption of organic vapors onto
collected PM, filter media, or other sampler surfaces; the
neutralization of acid or basic vapors by reaction with
either filter media or collected PM; and the role of
particle-bound water in PM sampling.
The lack of a standard reference material or a pri-
mary calibration procedure for PM suspended in the
atmosphere has prevented any evaluation of accuracy.
In the last 25 years there have been advancements in the
generation and classification of monodisperse aerosols,
as well as in the development of electron microscopy and
imaging analysis, that have contributed to the ad-
vancement in aerosol calibration (Chen, 1993). Still, one
of the limitations in PM sampling and analysis remains
the lack of primary calibration standards for evaluating
analytical methods and for intercomparing laborato-
ries. Klouda et al. (1996) examined the possibility of
resuspending the National Institute of Standards and
Technology (NIST) Standard Reference Material 1649
(Urban Dust) in air for collection on up to 320 filters
simultaneously using the dust generation and collection
system developed by Stanford Research International.
However, the fine component cannot be resuspended
with the same size distribution as existed in the atmo-
sphere and the semivolatile component will have evap-
orated. Therefore, while this material is useful as a
standard for composition of collected PM, it is not a
suitable standard for suspended PM. Little additional
work has been reported on efforts to develop an alter-
native standardization material.
Methods validation was discussed in the 1996 PM
AQCD (US Environmental Protection Agency, 1996),
and the usefulness of intercomparisons and ‘‘internal
redundancy’’ was emphasized. For example, a number
of internal consistency checks are applied to the IM-
PROVE network (Malm et al., 1994). These include
mass balances; sulfur measurements by both proton in-
duced X-ray emission (PIXE) and ion chromatography
(IC); and comparison of organic matter by combus-
tion (thermal/optical reflectance (TOR)) and by proton
elastic scattering analysis (PESA) analysis of hydrogen.
Mass balances compare the gravimetrically determined
mass with the mass calculated from the sum of the major
chemical components; i.e., crustal elements plus associ-
ated oxygen, organic carbon (OC), elemental carbon,
sulfate, nitrate, ammonium, and hydrogen ions. Mass
balances are useful validation techniques; however, they
do not check for, or account for, artifacts associated
with the absorption of gases during sampling or the loss
of semivolatile material during sampling. The mass
balance check may appear reasonable even if such arti-
facts are present because only the material collected on
the filter is included in the balance.
1.3. PM components/parameters that need to be measured
The concentration and composition of particles need
to be measured in order to determine attainment of a
standard; to follow implementation of a standard; and
to estimate the effects of particles on health, ecology,
and radiative balance. The large variety of components
of PM or PM parameters that need to be measured for
various purposes are summarized in Table 1. With the
exception of bioaerosol, all of these components or pa-
rameters are also of interest in studies of exposure to
combustion products.
W.E. Wilson et al. / Chemosphere 49 (2002) 1009–1043 1019
1.4. The federal reference methods for measurement of
equilibrated mass for PM10, PM2:5, and PM10–2:5
In 1997, EPA promulgated new standards for
PM2:5 to address fine-fraction thoracic particles and re-
tained with minor revisions the 1987 PM10 standards to
continue to address coarse-fraction thoracic particles
(Federal Register, 1997, 1998). In partial response to
numerous challenges to these standards, the US Court
of Appeals for the District of Columbia Circuit in
American Trucking Association vs. EPA, 175 F. 3d 1027
(US Court of Appeals, D.C. Cir., 1999) found ‘‘ample
support’’ for regulating coarse-fraction particles but re-
voked the revised PM10 standards (leaving in effect the
1987 PM10 standards) on the basis of PM10 being a
‘‘poorly matched indicator for coarse particulate pollu-
tion’’ because PM10 includes fine particles. Consistent
with this specific aspect of the Court�s ruling, which EPA
did not appeal, EPA is now considering use of PM10–2:5
as the indicator for coarse-fraction thoracic particles
in conjunction with PM2:5 standards that address fine-
fraction thoracic particles. Thus, EPA is now developing
a Federal Reference Method (FRM) for the measure-
ment of PM10–2:5.
1.4.1. PM10
A FRM has been specified for measuring PM10
(Code of Federal Regulations, 2001b,c). The PM10
FRM defines performance specifications for samplers
in which particles are inertially separated with a pene-
tration efficiency of 50% at an aerodynamic diameter
of 10� 0:5 lm. The collection efficiency increases to
�100% for smaller particles and drops to �0% for larger
particles. Particles are collected on filters and mass
concentrations are determined gravimetrically. Instru-
ment manufacturers are required to demonstrate through
field tests a measurement precision for 24-h samples of
�5 lg/m3 for PM10 concentrations below 80 lg/m3 and
within 7% for concentrations above 80 lg/m3.
1.4.2. PM2:5
As opposed to the performance-based FRM stan-
dard for PM10, the new FRM for PM2:5 (Code of Fed-
eral Regulations, 2001a,c) specifies certain details of the
sampler design, as well as of sample handling and
analysis; other aspects have performance specifications
(Noble et al., 2001). The PM2:5 FRM sampler consists
of a PM10 inlet/impactor, a PM2:5 impactor with an oil-
soaked impaction substrate to remove particles larger
than 2.5 lm Da, and a 47-mm polytetrafluoroethylene
(PTFE) filter with a particle collection efficiency greater
than 99.7%. The sample duration is 24 h, during which
time the sample temperature is not to exceed ambient
temperatures by more than 5 �C. A schematic diagram
of the PM2:5 FRM sample collection system is shown in
Fig. 9. After collection, samples are equilibrated for 24 h
at temperatures in the range of 20–23 �C (�2 �C) andat relative humidities in the range of 30–40% (�5%).
The equilibration tends to reduce particle-bound water
and stabilizes the filter plus sample weight. Filters are
weighed before and after sampling under the same
temperature and RH conditions. For sampling con-
ducted at ambient RH less than 30%, mass measure-
ments at relative humidities down to 20% are permissible
(Code of Federal Regulations, 2001a).
The PM10 inlet specified for the PM2:5 FRM is
modified from a previous low flow-rate PM10 inlet that
was acceptable in both EPA-designated reference and
Table 1
PM components/parameters of interest for health, ecological or radiative effects; for source category apportionment studies; or for air
quality validation studies
Particle number
Particle surface area
Particle size distribution
PMmass (fine-mode {PM1:0} and coarse-mode {PM10–1} mass as well as PM2:5 and PM10; non-volatile mass, Federal Reference mass,
and mass including semivolatile components such as ammonium nitrate and semivolatile organic compounds but not particle-bound
water)
Ions (sulfate, nitrate and ammonium)
Strong acidity (Hþ)
EC
OC (total, non-volatile and semivolatile; functional groups and individual species)
Transition metals (water soluble, bioavailable, valence state)
Specific toxic elements/specific toxic organic compounds
Crustal elements
Bioaerosols
Particle refractive index (real and imaginary)
Particle density
Particle size change with changes in RH
1020 W.E. Wilson et al. / Chemosphere 49 (2002) 1009–1043
equivalent PM10 methods. The modification corrects a
flaw that was reported for the previous sampler, in that
under some meteorological conditions, the inlet may
allow precipitation to penetrate the inlet. The modifi-
cation includes a larger drain hole, a one-piece top plate,
and louvers. Tolocka et al. (2001) evaluated the per-
formance of this modified inlet in a series of wind tunnel
experiments for both PM2:5 and PM10 sampling. The
modified inlet was found to compare very well with the
original inlet, both for PM2:5 and for PM10 sampling.
Their results further suggest that the modified inlet can
be substituted for the original inlet when it is part of a
reference or equivalent method for PM10 (Tolocka et al.,
2001). This study addressed the concern, expressed by
Allen et al. (1999), that the ‘‘pie-plate’’ inlet required by
the final version of the PM2:5 FRM might have a dif-
ferent cut point than the ‘‘flat-top’’ inlet of the PM10
FRM.
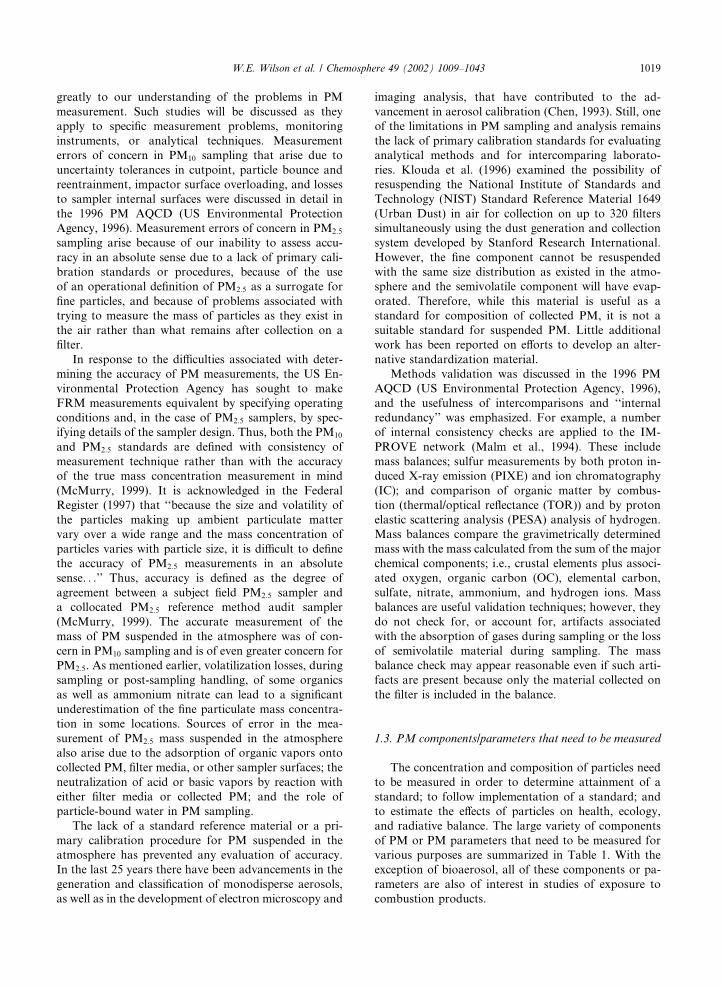
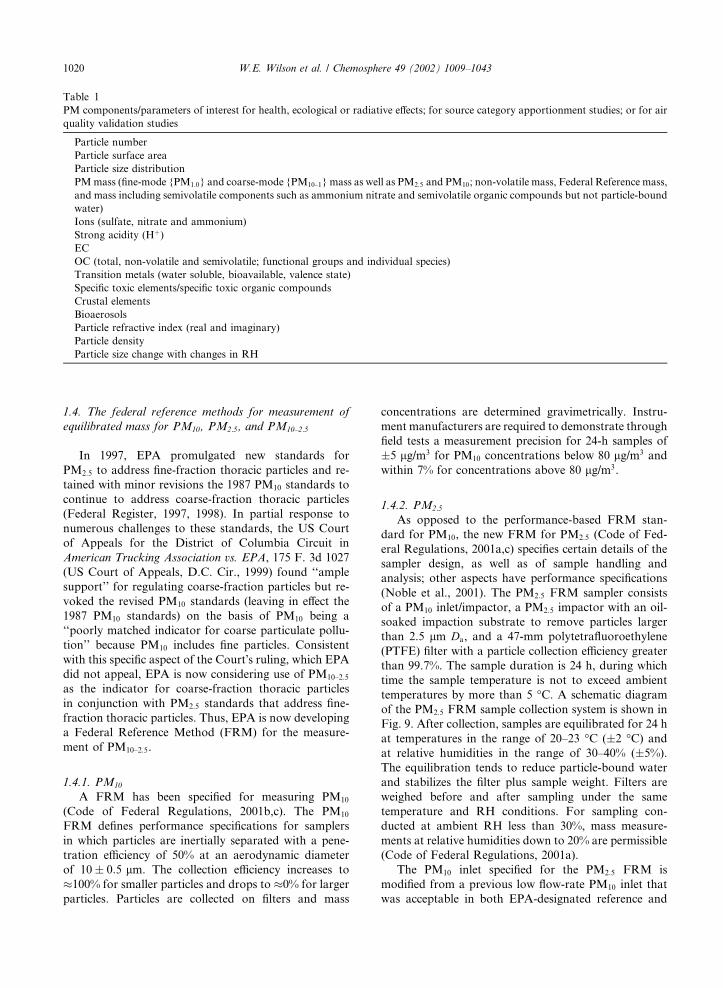
WINS impactor: Design and calibration of the EPA
PM2:5 Well Impactor Ninety-Six (WINS) is given by
Peters et al. (2001a). The WINS impactor was designed
to be deployed downstream of the Graseby-Andersen
246B PM10 inlet, operating at 16.7 actual l/min. The
WINS is pictured in Fig. 10. The PM2:5 inlet consists of a
single jet, round hole, with the jet exit directed toward
an impaction surface that is comprised of a 37 mm di-
ameter glass fiber filter immersed in 1 ml of low volatility
diffusion pump oil (i.e., the well). Particles not having
enough inertia to be removed by the impactor are cap-
tured downstream on the sample collection filter. This
design was selected to minimize impactor overloading
that would otherwise result in particle bounce. The oil
wicks through the particulate deposit on the impactor to
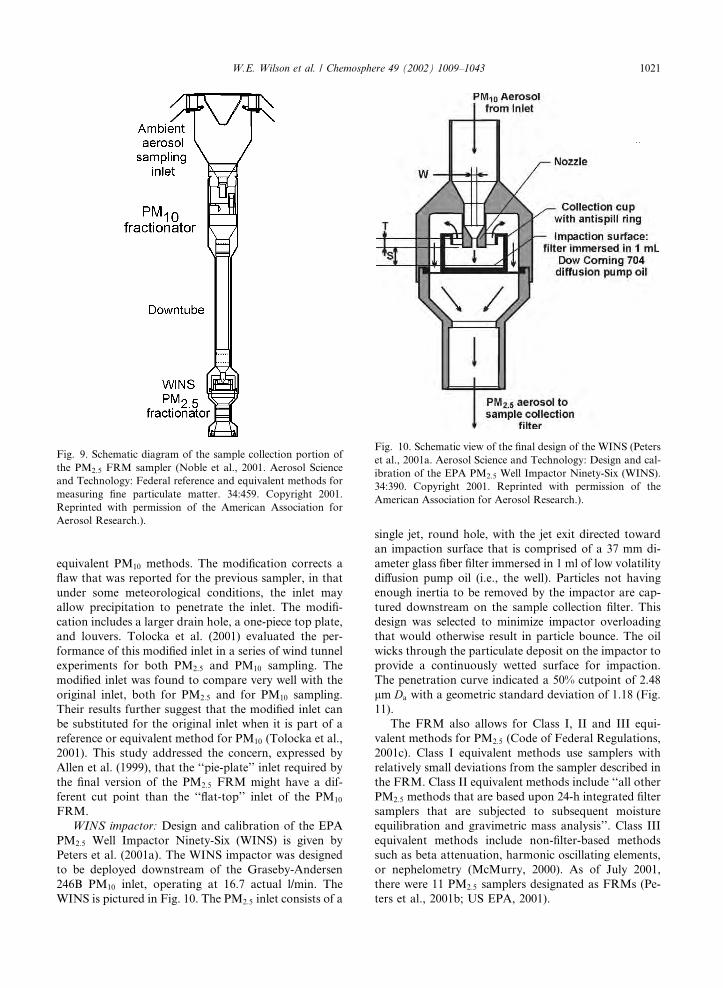
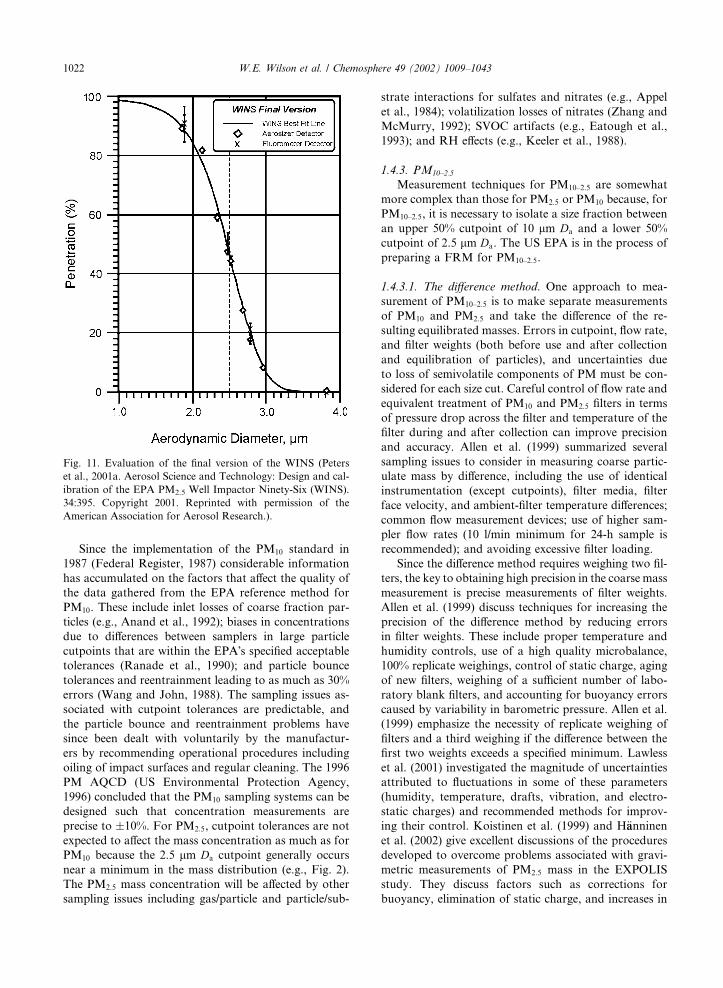
provide a continuously wetted surface for impaction.
The penetration curve indicated a 50% cutpoint of 2.48
lm Da with a geometric standard deviation of 1.18 (Fig.
11).
The FRM also allows for Class I, II and III equi-
valent methods for PM2:5 (Code of Federal Regulations,
2001c). Class I equivalent methods use samplers with
relatively small deviations from the sampler described in
the FRM. Class II equivalent methods include ‘‘all other
PM2:5 methods that are based upon 24-h integrated filter
samplers that are subjected to subsequent moisture
equilibration and gravimetric mass analysis’’. Class III
equivalent methods include non-filter-based methods
such as beta attenuation, harmonic oscillating elements,
or nephelometry (McMurry, 2000). As of July 2001,
there were 11 PM2:5 samplers designated as FRMs (Pe-
ters et al., 2001b; US EPA, 2001).
Fig. 9. Schematic diagram of the sample collection portion of
the PM2.5 FRM sampler (Noble et al., 2001. Aerosol Science
and Technology: Federal reference and equivalent methods for
measuring fine particulate matter. 34:459. Copyright 2001.
Reprinted with permission of the American Association for
Aerosol Research.).
Fig. 10. Schematic view of the final design of the WINS (Peters
et al., 2001a. Aerosol Science and Technology: Design and cal-
ibration of the EPA PM2.5 Well Impactor Ninety-Six (WINS).
34:390. Copyright 2001. Reprinted with permission of the
American Association for Aerosol Research.).
W.E. Wilson et al. / Chemosphere 49 (2002) 1009–1043 1021
Since the implementation of the PM10 standard in
1987 (Federal Register, 1987) considerable information
has accumulated on the factors that affect the quality of
the data gathered from the EPA reference method for
PM10. These include inlet losses of coarse fraction par-
ticles (e.g., Anand et al., 1992); biases in concentrations
due to differences between samplers in large particle
cutpoints that are within the EPA�s specified acceptable
tolerances (Ranade et al., 1990); and particle bounce
tolerances and reentrainment leading to as much as 30%
errors (Wang and John, 1988). The sampling issues as-
sociated with cutpoint tolerances are predictable, and
the particle bounce and reentrainment problems have
since been dealt with voluntarily by the manufactur-
ers by recommending operational procedures including
oiling of impact surfaces and regular cleaning. The 1996
PM AQCD (US Environmental Protection Agency,
1996) concluded that the PM10 sampling systems can be
designed such that concentration measurements are
precise to �10%. For PM2:5, cutpoint tolerances are not
expected to affect the mass concentration as much as for
PM10 because the 2.5 lm Da cutpoint generally occurs
near a minimum in the mass distribution (e.g., Fig. 2).
The PM2:5 mass concentration will be affected by other
sampling issues including gas/particle and particle/sub-
strate interactions for sulfates and nitrates (e.g., Appel
et al., 1984); volatilization losses of nitrates (Zhang and
McMurry, 1992); SVOC artifacts (e.g., Eatough et al.,
1993); and RH effects (e.g., Keeler et al., 1988).
1.4.3. PM10–2:5
Measurement techniques for PM10–2:5 are somewhat
more complex than those for PM2:5 or PM10 because, for
PM10–2:5, it is necessary to isolate a size fraction between
an upper 50% cutpoint of 10 lm Da and a lower 50%
cutpoint of 2.5 lm Da. The US EPA is in the process of
preparing a FRM for PM10–2:5.
1.4.3.1. The difference method. One approach to mea-
surement of PM10–2:5 is to make separate measurements
of PM10 and PM2:5 and take the difference of the re-
sulting equilibrated masses. Errors in cutpoint, flow rate,
and filter weights (both before use and after collection
and equilibration of particles), and uncertainties due
to loss of semivolatile components of PM must be con-
sidered for each size cut. Careful control of flow rate and
equivalent treatment of PM10 and PM2:5 filters in terms
of pressure drop across the filter and temperature of the
filter during and after collection can improve precision
and accuracy. Allen et al. (1999) summarized several
sampling issues to consider in measuring coarse partic-
ulate mass by difference, including the use of identical
instrumentation (except cutpoints), filter media, filter
face velocity, and ambient-filter temperature differences;
common flow measurement devices; use of higher sam-
pler flow rates (10 l/min minimum for 24-h sample is
recommended); and avoiding excessive filter loading.
Since the difference method requires weighing two fil-
ters, the key to obtaining high precision in the coarse mass
measurement is precise measurements of filter weights.
Allen et al. (1999) discuss techniques for increasing the
precision of the difference method by reducing errors
in filter weights. These include proper temperature and
humidity controls, use of a high quality microbalance,
100% replicate weighings, control of static charge, aging
of new filters, weighing of a sufficient number of labo-
ratory blank filters, and accounting for buoyancy errors
caused by variability in barometric pressure. Allen et al.
(1999) emphasize the necessity of replicate weighing of
filters and a third weighing if the difference between the
first two weights exceeds a specified minimum. Lawless
et al. (2001) investigated the magnitude of uncertainties
attributed to fluctuations in some of these parameters
(humidity, temperature, drafts, vibration, and electro-
static charges) and recommended methods for improv-
ing their control. Koistinen et al. (1999) and H€aanninenet al. (2002) give excellent discussions of the procedures
developed to overcome problems associated with gravi-
metric measurements of PM2:5 mass in the EXPOLIS
study. They discuss factors such as corrections for
buoyancy, elimination of static charge, and increases in
Fig. 11. Evaluation of the final version of the WINS (Peters
et al., 2001a. Aerosol Science and Technology: Design and cal-
ibration of the EPA PM2.5 Well Impactor Ninety-Six (WINS).
34:395. Copyright 2001. Reprinted with permission of the
American Association for Aerosol Research.).
1022 W.E. Wilson et al. / Chemosphere 49 (2002) 1009–1043
the mass of blank filters with time. The establishment of
a temperature- and humidity-controlled room required
for the equilibration and weighing of filters for the FRM
is expensive. Allen et al. (2001) describe a more cost-
effective technique using a chamber with RH controlled
at 34% RH by a saturated aqueous solution of MgCl2.
Allen et al. (1999) recommend that both the coeffi-
cient of variation (CV) and the square of the correlation
coefficient be included in reports of precision from col-
located samplers. For a study in Boston with 27 pairs of
mass data from collocated PM10 and PM2:5 using stan-
dard weighing methods, they obtained a CV of 4.7%
and an r2 of 0.991 for PM2:5, a CV of 4.4% and an r2 of0.994 for PM10, and a CV of 15% and an r2 of 0.88 for
PM10–2:5. By using duplicate weighings and other tech-
niques suggested for improving precision, they obtained
a CV of 1.3% and an r2 of 0.998 for PM2:5 in a study in
Chicago with 38 collocated measurements. On the basis
of the improvement in the CV for PM2:5, they estimate
that use of the recommended techniques for PM10–2:5 by
difference would yield a CV of 3.8% and an r2 of 0.98.
This ‘‘difference’’ technique has been used to measure
PM10–2:5 in a number of studies. It is currently used to
obtain PM10–2:5 data in the US national monitoring
program. However, EPA has not yet promulgated a
FRM for PM10–2:5.
1.4.3.2. Multi-stage impaction. A second technique in-
volves the use of impaction to isolate the size fraction
between 2.5 and 10 lm Da. In the impaction process,
the air stream is first accelerated through a small hole
(nozzle) or slit. The air stream is directed so that it
‘‘impacts’’ on a surface. Depending on the velocity and
pressure of the air stream, particles smaller than a cer-
tain size will follow the air stream around the impactor
surface. Larger particles will impact on the surface. In
practice, impactors have 50% cutpoints similar to those
for the rejection of larger particles in PM2:5 and PM10
samplers (Figs. 2 and 3).
Multi-stage impactors are used to separate particles
into several size fractions for the determination of mass
and chemical composition as a function of size (Wang
and John, 1988; Marple et al., 1991). The major problem
with the use of impactors to separate the 10–2.5 lm Da
fraction of coarse particles (thoracic coarse PM) is
bounce. Coarse particles tend to be dry, solid particles.
When they hit a hard surface they can bounce and be
carried away with the air stream (e.g., Dzubay et al.,
1976; Wesolowski et al., 1977; Rao and Whitby, 1978;
Cheng and Yeh, 1979; Wang and John, 1987; John and
Sethi, 1993). Various techniques have been used to
reduce bounce. One technique is to use a porous sub-
stance such as a glass or quartz fiber filter (Chang et al.,
1999) material or a polyurethane foam (Breum, 2000;
Kavouras and Koutrakis, 2001). These techniques may
result in a less precise separation and yield a sample that
must be extracted before chemical analyses can be per-
formed. Another technique is to coat the impactor with
a soft wax or grease (Rao and Whitby, 1977; Turner and
Hering, 1987; Pak et al., 1992). This can cause problems
with weighing and chemical analyses. In addition, as the
deposit of particles builds up, incoming particles may
not hit the soft surface but, instead, hit a previously
collected hard particle and bounce off of it. The WINS
impactor discussed earlier uses a filter in a well of low
volatility oil to ensure a wetted surface at all times.
However, such a technique, while appropriate for re-
moving unwanted particles, would not yield a particle
sample suitable for weighing or for chemical analyses.
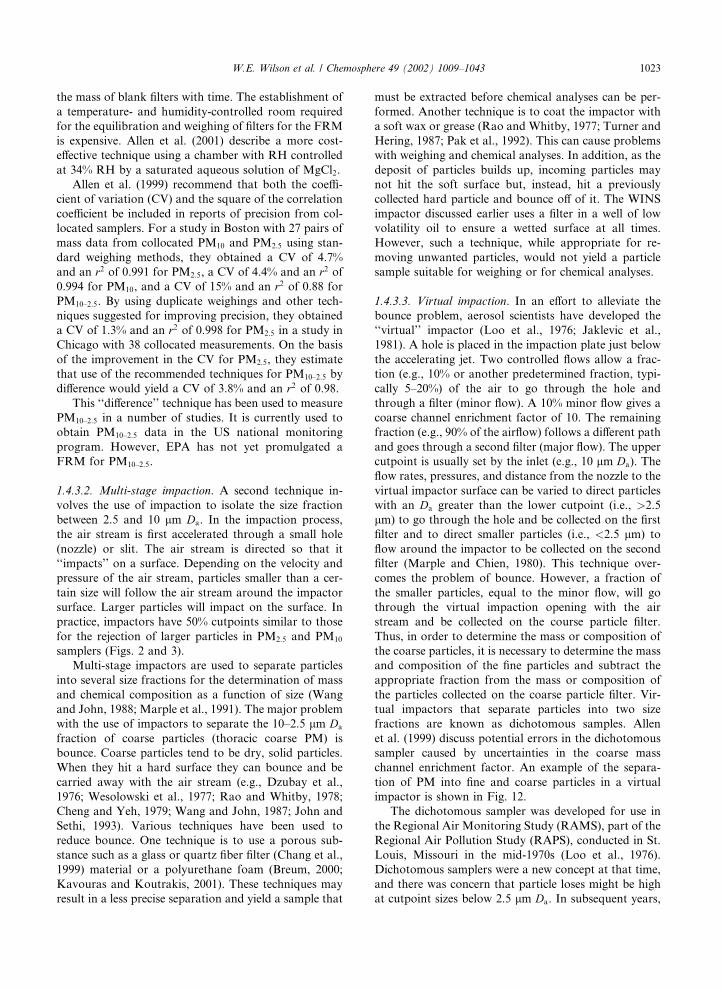
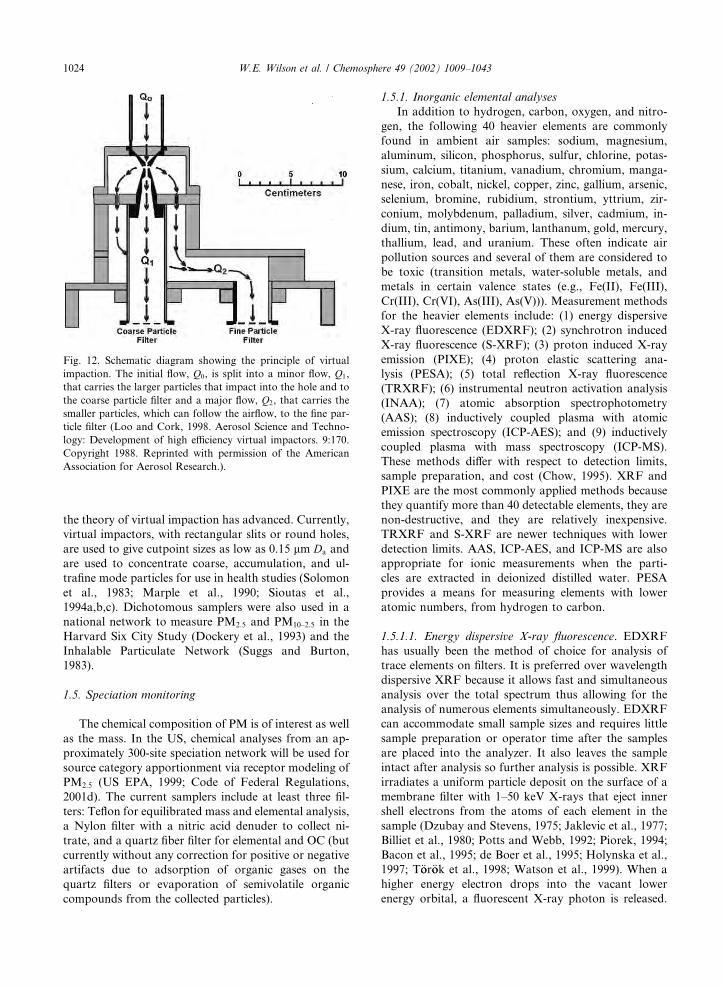
1.4.3.3. Virtual impaction. In an effort to alleviate the
bounce problem, aerosol scientists have developed the
‘‘virtual’’ impactor (Loo et al., 1976; Jaklevic et al.,
1981). A hole is placed in the impaction plate just below
the accelerating jet. Two controlled flows allow a frac-
tion (e.g., 10% or another predetermined fraction, typi-
cally 5–20%) of the air to go through the hole and
through a filter (minor flow). A 10% minor flow gives a
coarse channel enrichment factor of 10. The remaining
fraction (e.g., 90% of the airflow) follows a different path
and goes through a second filter (major flow). The upper
cutpoint is usually set by the inlet (e.g., 10 lm Da). The
flow rates, pressures, and distance from the nozzle to the
virtual impactor surface can be varied to direct particles
with an Da greater than the lower cutpoint (i.e., >2.5
lm) to go through the hole and be collected on the first
filter and to direct smaller particles (i.e., <2.5 lm) to
flow around the impactor to be collected on the second
filter (Marple and Chien, 1980). This technique over-
comes the problem of bounce. However, a fraction of
the smaller particles, equal to the minor flow, will go
through the virtual impaction opening with the air
stream and be collected on the course particle filter.
Thus, in order to determine the mass or composition of
the coarse particles, it is necessary to determine the mass
and composition of the fine particles and subtract the
appropriate fraction from the mass or composition of
the particles collected on the coarse particle filter. Vir-
tual impactors that separate particles into two size
fractions are known as dichotomous samples. Allen
et al. (1999) discuss potential errors in the dichotomous
sampler caused by uncertainties in the coarse mass
channel enrichment factor. An example of the separa-
tion of PM into fine and coarse particles in a virtual
impactor is shown in Fig. 12.
The dichotomous sampler was developed for use in
the Regional Air Monitoring Study (RAMS), part of the
Regional Air Pollution Study (RAPS), conducted in St.
Louis, Missouri in the mid-1970s (Loo et al., 1976).
Dichotomous samplers were a new concept at that time,
and there was concern that particle loses might be high
at cutpoint sizes below 2.5 lm Da. In subsequent years,
W.E. Wilson et al. / Chemosphere 49 (2002) 1009–1043 1023
the theory of virtual impaction has advanced. Currently,
virtual impactors, with rectangular slits or round holes,
are used to give cutpoint sizes as low as 0.15 lm Da and
are used to concentrate coarse, accumulation, and ul-
trafine mode particles for use in health studies (Solomon
et al., 1983; Marple et al., 1990; Sioutas et al.,
1994a,b,c). Dichotomous samplers were also used in a
national network to measure PM2:5 and PM10–2:5 in the
Harvard Six City Study (Dockery et al., 1993) and the
Inhalable Particulate Network (Suggs and Burton,
1983).
1.5. Speciation monitoring
The chemical composition of PM is of interest as well
as the mass. In the US, chemical analyses from an ap-
proximately 300-site speciation network will be used for
source category apportionment via receptor modeling of
PM2:5 (US EPA, 1999; Code of Federal Regulations,
2001d). The current samplers include at least three fil-
ters: Teflon for equilibrated mass and elemental analysis,
a Nylon filter with a nitric acid denuder to collect ni-
trate, and a quartz fiber filter for elemental and OC (but
currently without any correction for positive or negative
artifacts due to adsorption of organic gases on the
quartz filters or evaporation of semivolatile organic
compounds from the collected particles).
1.5.1. Inorganic elemental analyses
In addition to hydrogen, carbon, oxygen, and nitro-
gen, the following 40 heavier elements are commonly
found in ambient air samples: sodium, magnesium,
aluminum, silicon, phosphorus, sulfur, chlorine, potas-
sium, calcium, titanium, vanadium, chromium, manga-
nese, iron, cobalt, nickel, copper, zinc, gallium, arsenic,
selenium, bromine, rubidium, strontium, yttrium, zir-
conium, molybdenum, palladium, silver, cadmium, in-
dium, tin, antimony, barium, lanthanum, gold, mercury,
thallium, lead, and uranium. These often indicate air
pollution sources and several of them are considered to
be toxic (transition metals, water-soluble metals, and
metals in certain valence states (e.g., Fe(II), Fe(III),
Cr(III), Cr(VI), As(III), As(V))). Measurement methods
for the heavier elements include: (1) energy dispersive
X-ray fluorescence (EDXRF); (2) synchrotron induced
X-ray fluorescence (S-XRF); (3) proton induced X-ray
emission (PIXE); (4) proton elastic scattering ana-
lysis (PESA); (5) total reflection X-ray fluorescence
(TRXRF); (6) instrumental neutron activation analysis
(INAA); (7) atomic absorption spectrophotometry
(AAS); (8) inductively coupled plasma with atomic
emission spectroscopy (ICP-AES); and (9) inductively
coupled plasma with mass spectroscopy (ICP-MS).
These methods differ with respect to detection limits,
sample preparation, and cost (Chow, 1995). XRF and
PIXE are the most commonly applied methods because
they quantify more than 40 detectable elements, they are
non-destructive, and they are relatively inexpensive.
TRXRF and S-XRF are newer techniques with lower
detection limits. AAS, ICP-AES, and ICP-MS are also
appropriate for ionic measurements when the parti-
cles are extracted in deionized distilled water. PESA
provides a means for measuring elements with lower
atomic numbers, from hydrogen to carbon.
1.5.1.1. Energy dispersive X-ray fluorescence. EDXRF
has usually been the method of choice for analysis of
trace elements on filters. It is preferred over wavelength
dispersive XRF because it allows fast and simultaneous
analysis over the total spectrum thus allowing for the
analysis of numerous elements simultaneously. EDXRF
can accommodate small sample sizes and requires little
sample preparation or operator time after the samples
are placed into the analyzer. It also leaves the sample
intact after analysis so further analysis is possible. XRF
irradiates a uniform particle deposit on the surface of a
membrane filter with 1–50 keV X-rays that eject inner
shell electrons from the atoms of each element in the
sample (Dzubay and Stevens, 1975; Jaklevic et al., 1977;
Billiet et al., 1980; Potts and Webb, 1992; Piorek, 1994;
Bacon et al., 1995; de Boer et al., 1995; Holynska et al.,
1997; T€oor€ook et al., 1998; Watson et al., 1999). When a
higher energy electron drops into the vacant lower
energy orbital, a fluorescent X-ray photon is released.
Fig. 12. Schematic diagram showing the principle of virtual
impaction. The initial flow, Q0, is split into a minor flow, Q1,
that carries the larger particles that impact into the hole and to
the coarse particle filter and a major flow, Q2, that carries the
smaller particles, which can follow the airflow, to the fine par-
ticle filter (Loo and Cork, 1998. Aerosol Science and Techno-
logy: Development of high efficiency virtual impactors. 9:170.
Copyright 1988. Reprinted with permission of the American
Association for Aerosol Research.).
1024 W.E. Wilson et al. / Chemosphere 49 (2002) 1009–1043
The energy of this photon is unique to each element, and
the number of photons is proportional to the concen-
tration of the element. Concentrations are quantified by
comparing photon counts for a sample with those ob-
tained from thin-film standards of known concentration
(Dane et al., 1996).
Emitted X-rays with energies less than �4 keV (af-
fecting the elements sodium, magnesium, aluminum,
silicon, phosphorus, sulfur, chlorine, and potassium) are
absorbed in the filter in a thick particle deposit or even
by large particles in which these elements are contained.
Very thick filters also scatter much of the excitation
radiation or protons, thereby lowering the signal-to-
noise ratio for XRF and PIXE. For this reason, thin
membrane filters with deposits in the range of 10–50 lg/cm2 provide the best accuracy and precision for XRF
and PIXE analysis (Davis et al., 1977; Dzubay and
Nelson, 1975; Haupt et al., 1995).
1.5.1.2. Synchrotron induced X-ray fluorescence. S-XRF
is a form of EDXRF in which the exciting X-rays are
derived from a synchrotron. Bremmstrahlung X-rays are
generated when energetic electrons (generally several
GeV in energy) are forced by a magnetic field to make a
bend in their path. The advantages of the technique are
that an extremely high flux of X-rays may be obtained
and that the X-rays are 100% polarized in the plane of the
electron beam. The former allows for X-ray beams gen-
erally of 50–500 lm in diameter. However, the beams can
be focused into X-ray microprobes with spot sizes on the
order of 1 lm diameter. The X-ray polarization allows
for removal of most of the background normally found
under the characteristic X-ray peaks, greatly improv-
ing sensitivity compared to other XRF techniques. The
primary disadvantages are the limited number of syn-
chrotrons and that few synchrotrons have S-XRF ca-
pabilities. Thus, the technique has been relatively little
used for PM and then generally for special problems such
as the smoke from the Kuwaiti oil fires (Cahill et al.,
1992; Reid et al., 1994). However, with the increasing
availability of S-XRF facilities dedicated to PM analysis,
the first of which was the Advanced Light Source at
Lawrence Berkeley National Laboratory last year, the
utilization of S-XRF for PM analysis is increasing.
1.5.1.3. Proton induced X-ray emission. PIXE differs
from XRF analysis in the excitation source for pro-
ducing fluorescence. The filter deposit is bombarded
with high-energy protons to remove inner shell elec-
trons, and the resulting characteristic X-rays are ana-
lyzed as in XRF (Johansson et al., 1970; Cahill, 1981,
1985; Zeng et al., 1993). Small accelerators, generally
Van de Graaffs, generate intense beams of low energy
protons, generally of a few MeV in energy. These have
the ability to remove electrons from the inner shells of
atoms of any element. Thus, PIXE can see a very wide
range of elements in a single analysis. The cross-section
for producing X-rays using protons of a few MeV in
energy tends to favor lighter elements, Na through Ca,
but sensitivities for equivalent PIXE and multi-wave-
length XRF analysis are roughly comparable. The tech-
nique has been widely used in the US (Flocchini et al.,
1976; Malm et al., 1994) and around the world as many
universities have the small accelerators needed for the
method. Like S-XRF, the proton beams can be focused
into lm size beams, but these have been relatively little
used for PM. However, the mm size beams used in both
S-XRF and PIXE are well suited to analyzing the lim-
ited mass and small deposits that result from detailed
PM size measurements by impactors (Perry et al., 1999).
1.5.1.4. Proton elastic scattering analysis. With the rou-
tine availability of elemental analyses for all elements
sodium and heavier, organic compounds remain the
major unmeasured species needed for mass balance. For
programs like IMPROVE, (Malm et al., 1994) parallel
filters are collected for separate OC and EC determina-
tions. Aerosol programs that use PIXE can use PESA to
directly measure hydrogen simultaneously with PIXE by
scattering protons from Teflon filters that lack hydrogen
(Cahill et al., 1989; Cahill et al., 1992). Generally, esti-
mates of organic matter by carbon combustion from
quartz filters and estimates of organic matter by hydro-
gen in PM on Teflon filters are in agreement, assuming
certain assumptions about the chemical states of sul-
fates and nitrates are met (Malm et al., 1994; Cahill et al.,
1996).
1.5.1.5. Total reflection X-ray fluorescence. One of the
limitations of the EDXRF method is the minimum de-
tection limit which may be high due to high background
values (Streit et al., 2000). By implementation of X-ray
optical geometries that use the total reflection of the
primary radiation on flat surfaces, scattering on the
substrate is reduced so that detection limits can be re-
duced. This is the basis for the total reflection X-ray
fluorescence (TRXRF) method (Aiginger and Streli,
1997). This modification to the EDXRF technique im-
proves detection limits and avoids the need to correct for
matrix effects. Despite its apparent advantages, TRXRF
has not yet become widely in use for atmospheric PM
analysis but has been used in the analysis of marine PM
(Stahlschmidt et al., 1997) and at a high elevation site
(Streit et al., 2000). Streit et al. sampled ambient air at
the High Alpine Research Station (3580 m asl) in the
Bernese Alps, Switzerland, using a nine-stage, single-jet,
low-pressure, cascade impactor equipped with quartz
impactor plates coated with silicon oil diluted in 2-pro-
panol. The typical sample volume for a weekly sample
was 10 m3. The quartz plates were analyzed directly by
TRXRF. Streit et al. reported that the minimum de-
tection limits, defined by the 3r values of the blanks,
W.E. Wilson et al. / Chemosphere 49 (2002) 1009–1043 1025

ranged from 25 ng for S, decreased monotonically with
increasing atomic number down to 5 pg for Rb, and
decreased further after that. The use of TRXRF is ex-
pected to increase as EDXRF users become aware of the
method. A relatively low-cost, add-on unit has been
developed that would allow EDXRF users to test the
TRXRF technique (Aiginger, 1991).
1.5.1.6. Instrumental neutron activation analysis. INAA
irradiates a sample in the core of a nuclear reactor for a
few minutes to several hours, depending on the elements
being quantified (Dams et al., 1970; Zoller and Gordon,
1970; Nadkarni, 1975; Landsberger, 1988; Olmez, 1989;
Ondov and Divita, 1993). The neutron bombardment
chemically transforms many elements into radioactive
isotopes. The energies of the gamma rays emitted by
these isotopes identify them, and therefore their parent
elements. The intensity of these gamma rays is propor-
tional to the amount of the parent element present in the
sample. Different irradiation times and cooling periods
are used before counting with a germanium detector.
In source apportionment studies, it is possible to use a
combination of XRF and INAA to develop a relatively
complete set of elemental measurements. Between these
two analytical techniques, good sensitivity is possible for
many elements, including most of the toxic metals of
interest. In general, XRF provides better sensitivity for
some metals (e.g., Ni, Pb, Cu, and Fe); whereas INAA
provides better sensitivity for others (Sb, As, Cr, Co, Se,
and Cd). Both methods provide similar detection limits
for still other elements (V, Zn, and Mn). INAA does not
quantify some of the abundant species in ambient PM
such as silicon, nickel, tin, and lead. While INAA is
technically non-destructive, sample preparation involves
folding the sample tightly and sealing it in plastic, and
the irradiation process makes the filter membrane brittle
and radioactive. These factors limit the use of the sample
for subsequent analyses.
1.5.1.7. Atomic absorption spectrophotometry. AAS is
applied to the residue of a filter extracted in a strong
solvent to dissolve the solid material; the filter or a
portion of it is also dissolved during this process (Ran-
weiler and Moyers, 1974; Fernandez, 1989; Jackson and
Mahmood, 1994; Chow et al., 2000). A few milliliters of
this extract are injected into a flame where the elements
are vaporized. Elements absorb light at certain wave-
lengths in the visible spectrum, and a light beam with
wavelengths specific to the elements being measured is
directed through the flame to be detected by a mono-
chromater. The light absorbed by the flame containing
the extract is compared with the absorption from known
standards to quantify the elemental concentrations.
AAS requires an individual analysis for each element,
and a large filter or several filters are needed to obtain
concentrations for a large variety of elements. AAS is a
useful complement to other methods, such as XRF and
PIXE, for species such as beryllium, sodium, and mag-
nesium which are not well-quantified by these methods.
Airborne particles are chemically complex and do not
dissolve easily into complete solution, regardless of the
strength of the solvent. There is always a possibility that
insoluble residues are left behind and soluble species
may co-precipitate on them or on container walls.
1.5.1.8. Inductively coupled plasma with atomic emission
spectroscopy. ICP-AES introduces an extracted sample
into an atmosphere of argon gas seeded with free elec-
trons induced by high voltage from a surrounding Tesla
coil (Fassel and Kinseley, 1974; McQuaker et al., 1979;
Lynch et al., 1980; Harman, 1989; Tyler, 1992; Baldwin
et al., 1994). The high temperatures in the induced
plasma raise valence electrons above their normally
stable states. When these electrons return to their stable
states, a photon of light is emitted that is unique to the
element that was excited. This light is detected at spec-
ified wavelengths to identify the elements in the sample.
ICP-AES acquires a large number of elemental con-
centrations using small sample volumes with acceptable
detection limits for atmospheric samples. As with AAS,
this method requires complete extraction and destruc-
tion of the sample.
1.5.1.9. Inductively coupled plasma with mass spectro-
scopy. ICP-MS has been applied in the analysis of per-
sonal exposure samples (Tan and Horlick, 1986; Gray
and Williams, 1987a,b; Nam et al., 1993; Munksgaard
and Parry, 1998; Campbell and Humayun, 1999). Ion
species generated from ICP and from the sample matrix
can produce a significant background at certain masses,
resulting in formation of polyatomic ions that can limit
the ability of ICP-MS to determine some elements of
interest. Cool plasma techniques have shown potential
to detect elements at the ultra-trace level (Nham, 1996)
and to minimize common molecular ion interferences
(Sakata and Kawabata, 1994; Turner, 1994; Plantz,
1996). Detection limits of ICP-MS using a one-second
scan are typically in the range of 10�3 ng/m3, which is an
order of magnitude lower than other elemental analysis
methods. The instrument can also be set up to analyze a
wide dynamic range of aerosol concentrations. Isotope
analysis can also be performed with ICP-MS. Inter-
comparison studies need to be conducted to establish the
comparability of ICP-MS with other non-destructive
filter analysis methods.
1.5.2. Water-soluble ions analysis methods
The most common ions of atmospheric interest are
sulfate, nitrate, ammonium, and chloride. Under certain
conditions, sodium, calcium, magnesium, potassium, flu-
oride, and phosphate are quantifiable in ambient aerosol
samples. The soluble fractions of metals such as iron,
1026 W.E. Wilson et al. / Chemosphere 49 (2002) 1009–1043

nickel, chromium, vanadium, mercury, and arsenic have
been implicated as being detrimental to health.
Several simple ions, such as sodium, magnesium,
potassium, and calcium can be quantified by AAS as
described above. Polyatomic ions must be quantified by
other methods such as IC and automated colorimetry
(AC). When the aerosol deposit is suspected of being
acidic, its hydrogen ion content can be determined by
a pH electrode or by microtitration (Koutrakis et al.,
1992). It is important to keep filters away from ammonia
sources, such as human breath, to minimize neutraliza-
tion of the acidic compounds.
Most ion analysis methods require that a fraction of
the filter be extracted in deionized distilled water and the
extract be filtered to remove insoluble residues prior to
analysis. The extraction volume needs to be as small as
possible, lest the solution become too dilute to detect
the desired constituents at levels typical of those found
in PM2:5 or PM10. The major sampling requirement for
analysis of water-soluble species is that the filter material
be hydrophilic, allowing the water to penetrate the filter
and fully extract the desired chemical compounds. Small
amounts of ethanol or other wetting agents are some-
times added to the filter surface to aid the wetting of
hydrophobic filter materials, such as Teflon membranes.
When other analyses are to be performed on the same
filter, the filter is sectioned using a precision positioning
jig attached to a paper cutter.
In IC, the sample extract passes through an ion-
exchange column that separates the ions in time for in-
dividual quantification, usually by a electroconductivity
detector (Small et al., 1975; Mulik et al., 1976, 1977;
Butler et al., 1978; Mueller et al., 1978; Rich et al., 1978;
Small, 1978; Wetzel et al., 1985; Fritz, 1987; Tarter,
1987; Dasgupta, 1992; Thienpont et al., 1994; Chow and
Watson, 1999). Prior to detection, the column effluent
enters a suppressor column where the chemical compo-
sition of one element is altered, resulting in a matrix of
low conductivity. The ions are identified by their elution/
retention times and are quantified by the conductivity
peak area or peak height. IC is especially desirable for
particle samples because it provides results for several
ions with a single analysis and because it uses a small
portion of the filter extract with low detection limits. IC
analyses can be automated by interfacing to an auto-
matic sampler that can conduct unattended analysis of
as many as 400 samples (Tejada et al., 1978).
Though automated data processing is usually applied
to the IC output, the chromatograms are too complex
for such software to detect deviations from measure-
ment assumptions. Each chromatogram should be ex-
amined individually to verify: (1) proper operational
settings, (2) correct peak shapes and integration win-
dows, (3) peak separation, (4) correct background sub-
traction, and (5) quality control sample comparisons.
When values for replicates differ by more than �10% or
when values for standards differ by more than �5%, all
samples before and after these quality control checks
should be reanalyzed. Individual samples with unusual
peak shapes, background subtractions, or operating para-
meters should also be reanalyzed.
Automated colorimetry (AC) applies different col-
orimetric analyses to small samples volumes with auto-
matic sample throughput. The most common ions
measured are ammonium, chloride, nitrate, and sulfate
(Butler et al., 1978; Mueller et al., 1978; Fung et al.,
1979; Pyen and Fishman, 1979). Because IC provides
multi-species analysis for the anions, ammonium is most
commonly measured by AC. The standard AC tech-
nique can analyze �50 samples per hour per channel
with minimal operator attention and relatively low
maintenance and material costs. Several channels can be
set up to simultaneously analyze several ions.
Intercomparison studies between AC and ion chro-
matography have been conducted by Butler et al. (1978);
Mueller et al. (1978); Fung et al. (1979); and Pyen and
Fishman (1979). Butler et al. (1978) found excellent
agreement between sulfate and nitrate measurements by
AC and IC. The accuracy of both methods is within the
experimental errors, with higher blank values observed
from automated colorimetric techniques. Comparable
results were also obtained between the two methods by
Fung et al. (1979). The choice between the two methods
for sample analysis is dictated by sensitivity, scheduling,
and cost constraints.
1.5.3. Carbon analysis methods
Three classes of carbon are commonly measured in
ambient aerosol samples collected on quartz-fiber filters:
(1) organic, volatilized, or non-light absorbing carbon;
(2) elemental or light-absorbing carbon; and (3) car-
bonate carbon. Carbonate carbon (i.e., K2CO3, Na2CO3,
MgCO3, CaCO3) can be determined on a separate filter
section by measurement of the carbon dioxide (CO2)
evolved upon acidification (Johnson et al., 1981). Though
progress has been made in the quantification of specific
organic chemical compounds in suspended particles (e.g.,
Rogge et al., 1991), sampling and analysis methods for
specific compounds have not yet evolved for use in
practical monitoring situations.
Several analytical methods for the separation of
organic and elemental carbon in ambient and source
particulate samples have been evaluated (Cadle and
Groblicki, 1982; Stevens et al., 1982). These methods
include: (1) solvent extraction of the organics followed
by total carbon analysis (Gordon, 1974; Grosjean, 1975;
Appel et al., 1976, 1979; Daisey et al., 1981; Muhlbaier
and Williams, 1982; Japar et al., 1984); (2) nitric acid
digestion of the organics followed by total carbon
analysis (McCarthy and Moore, 1952; Kukreja and
Bove, 1976; Pimenta and Wood, 1980); (3) absorption of
radiation using an integrating plate to determine EC
W.E. Wilson et al. / Chemosphere 49 (2002) 1009–1043 1027
(variations of this method include infrared absorbance
(Smith et al., 1975), Raman spectroscopy (Rosen et al.,
1978), and visible absorbance (Lin et al., 1973; Weiss
et al., 1979; Gerber, 1982; Heintzenberg, 1982)); (4) ther-
mal combustion including both temperature-programmed
(Muhlbaier and Williams, 1982) and step-wise pyrolysis
followed by oxidation using either CO2 or methane
detection (Mueller et al., 1971, 1981; Patterson, 1973;
Merz, 1978; Johnson and Huntzicker, 1979; Johnson
et al., 1980; Malissa, 1979; Cadle et al., 1980a,b; Heisler
et al., 1980a,b; Novakov, 1981; Tanner et al., 1982;
Wolff et al., 1982); and (5) a combination of thermal and
optical methods (Appel et al., 1976; Dod et al., 1979;
Macias et al., 1979; Cadle et al., 1980a,b; Johnson et al.,
1981; Novakov, 1982; Huntzicker et al., 1982; Chow
et al., 1993).
Chow and Watson (1998) summarize different carbon
analysis methods along with their measurement princi-
ples. The definitions of organic and EC are opera-
tional (i.e., method dependent) and reflect the method
and purpose of measurement. EC is sometimes termed
‘‘soot’’, ‘‘graphitic carbon’’, or ‘‘black carbon’’. For
studying visibility reduction, light-absorbing carbon is a
more useful concept than EC. For source apportion-
ment by receptor models, several consistent but distinct
fractions of carbon in both source and receptor sam-
ples are desired, regardless of their light-absorbing or
chemical properties. Differences in ratios of the carbon
concentrations in these fractions form part of the source
profile that distinguishes the contribution of one source
from the contributions of other sources (Watson et al.,
1994a).
Light-absorbing carbon is not entirely graphitic car-
bon because there are many organic materials which
absorb light (e.g., tar, motor oil, asphalt, coffee). Even
the ‘‘graphitic’’ black carbon in the atmosphere has only
a poorly developed graphitic structure with abundant
surface chemical groups. ‘‘Elemental carbon’’ is a poor
but common description of what is measured. For ex-
ample, a substance of three-bond carbon molecules (e.g.,
pencil lead) is black and completely absorbs light, but
four-bond carbon in a diamond is completely transpar-
ent and absorbs very little light. Both are pure, EC.
Chow et al. (1993) document several variations of the
thermal method for OC and EC. The thermal/optical
reflectance (TOR), thermal/optical transmission (TOT),
and thermal manganese oxidation (TMO) methods are
most commonly used for the analysis of OC and EC in
atmospheric PM. Filter transmission analysis is often
performed to estimate particle light absorption which is
proportional to the level of EC in the atmosphere. These
methods are discussed in detail in the following sub-
sections.
TMO method (Mueller et al., 1982; Fung, 1990) uses
manganese dioxide present and in contact with the
sample throughout the analysis as the oxidizing agent.
Temperature is relied upon to distinguish between or-
ganic and EC. Carbon evolving at 525 �C is classified as
OC, and carbon evolving at 850 �C is classified as EC.
This method has been used in the SCENES (Subregional
Cooperative Electric Utility, Department of Defense,
National Park Services, and Environmental Protection
Agency Study); (Mueller and McDade, 1986; Mueller
et al., 1986; Sutherland and Bhardwaja, 1987; Watson
et al., 1987) visibility network, as well as in the SCAQS
(Southern California Air Quality Study) (Chow et al.,
1994a,b; Watson et al., 1993, 1994a,b).
TOR method of carbon analysis developed by
Huntzicker et al. (1982) has been adapted by several
laboratories for the quantification of organic and EC in
PM collected on quartz-fiber filters. Although the prin-
ciple used by these laboratories is identical to that of
Huntzicker et al. (1982), the details differ with respect to
calibration standards, analysis time, temperature ramp-
ing, and volatilization/combustion temperatures.
In the most commonly applied version of the TOR
method (Chow et al., 1993), a filter is submitted to
volatilization at temperatures ranging from ambient to
550 �C in a pure helium atmosphere, then to combustion
at temperatures between 550 and 800 �C in a 2% oxygen
and 98% helium atmosphere with several temperature
ramping steps. The carbon that evolves at each tem-
perature is converted to methane and quantified with a
flame ionization detector. The reflectance from the de-
posit side of the filter punch is monitored throughout the
analysis. This reflectance usually decreases during vola-
tilization in the helium atmosphere owing to the pyro-
lysis of organic material. When oxygen is added, the
reflectance increases as the light absorbing carbon is
combusted and removed. OC is defined as that which
evolves prior to reattainment of the original reflectance,
and elemental carbon is defined as that which evolves
after the original reflectance has been attained. By this
definition, ‘‘organic carbon’’ is actually OC that does
not absorb light at the wavelength (632.8 nm) used and
‘‘elemental carbon’’ is light-absorbing carbon (Chow
et al., 1993).
TOT method applies to the same thermal/optical
carbon analysis method except that transmission in-
stead of reflectance of the filter punch is measured. The
National Institute for Occupational Safety and Health
(NIOSH) Method 5040 for monitoring EC as a marker
for particulate diesel exhaust is based upon the TOT
method (Birch and Cary, 1996). The TOT OC/EC
method consists of a two-stage process with the first
stage being conducted in a pure helium atmosphere at
temperatures of 250, 500, 650, and 850 �C for a total of
4.5 min and the second stage conducted in a 2% oxygen/
98% helium mix at temperatures of 650, 750, 850, and
940 �C for 4 min. A pyrolysis base correction is made
based on the transmission measurement. An example of
a TOT thermogram is shown in Fig. 13.
1028 W.E. Wilson et al. / Chemosphere 49 (2002) 1009–1043
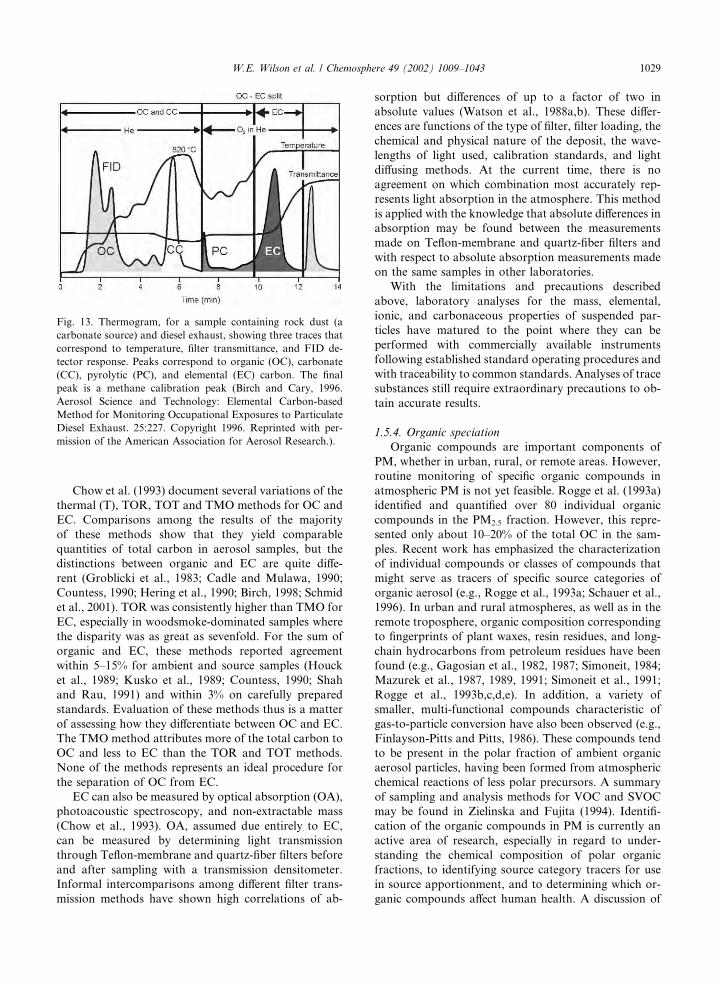
Chow et al. (1993) document several variations of the
thermal (T), TOR, TOT and TMO methods for OC and
EC. Comparisons among the results of the majority
of these methods show that they yield comparable
quantities of total carbon in aerosol samples, but the
distinctions between organic and EC are quite diffe-
rent (Groblicki et al., 1983; Cadle and Mulawa, 1990;
Countess, 1990; Hering et al., 1990; Birch, 1998; Schmid
et al., 2001). TOR was consistently higher than TMO for
EC, especially in woodsmoke-dominated samples where
the disparity was as great as sevenfold. For the sum of
organic and EC, these methods reported agreement
within 5–15% for ambient and source samples (Houck
et al., 1989; Kusko et al., 1989; Countess, 1990; Shah
and Rau, 1991) and within 3% on carefully prepared
standards. Evaluation of these methods thus is a matter
of assessing how they differentiate between OC and EC.
The TMO method attributes more of the total carbon to
OC and less to EC than the TOR and TOT methods.
None of the methods represents an ideal procedure for
the separation of OC from EC.
EC can also be measured by optical absorption (OA),
photoacoustic spectroscopy, and non-extractable mass
(Chow et al., 1993). OA, assumed due entirely to EC,
can be measured by determining light transmission
through Teflon-membrane and quartz-fiber filters before
and after sampling with a transmission densitometer.
Informal intercomparisons among different filter trans-
mission methods have shown high correlations of ab-
sorption but differences of up to a factor of two in
absolute values (Watson et al., 1988a,b). These differ-
ences are functions of the type of filter, filter loading, the
chemical and physical nature of the deposit, the wave-
lengths of light used, calibration standards, and light
diffusing methods. At the current time, there is no
agreement on which combination most accurately rep-
resents light absorption in the atmosphere. This method
is applied with the knowledge that absolute differences in
absorption may be found between the measurements
made on Teflon-membrane and quartz-fiber filters and
with respect to absolute absorption measurements made
on the same samples in other laboratories.
With the limitations and precautions described
above, laboratory analyses for the mass, elemental,
ionic, and carbonaceous properties of suspended par-
ticles have matured to the point where they can be
performed with commercially available instruments
following established standard operating procedures and
with traceability to common standards. Analyses of trace
substances still require extraordinary precautions to ob-
tain accurate results.
1.5.4. Organic speciation
Organic compounds are important components of
PM, whether in urban, rural, or remote areas. However,
routine monitoring of specific organic compounds in
atmospheric PM is not yet feasible. Rogge et al. (1993a)
identified and quantified over 80 individual organic
compounds in the PM2:5 fraction. However, this repre-
sented only about 10–20% of the total OC in the sam-
ples. Recent work has emphasized the characterization
of individual compounds or classes of compounds that
might serve as tracers of specific source categories of
organic aerosol (e.g., Rogge et al., 1993a; Schauer et al.,
1996). In urban and rural atmospheres, as well as in the
remote troposphere, organic composition corresponding
to fingerprints of plant waxes, resin residues, and long-
chain hydrocarbons from petroleum residues have been
found (e.g., Gagosian et al., 1982, 1987; Simoneit, 1984;
Mazurek et al., 1987, 1989, 1991; Simoneit et al., 1991;
Rogge et al., 1993b,c,d,e). In addition, a variety of
smaller, multi-functional compounds characteristic of
gas-to-particle conversion have also been observed (e.g.,
Finlayson-Pitts and Pitts, 1986). These compounds tend
to be present in the polar fraction of ambient organic
aerosol particles, having been formed from atmospheric
chemical reactions of less polar precursors. A summary
of sampling and analysis methods for VOC and SVOC
may be found in Zielinska and Fujita (1994). Identifi-
cation of the organic compounds in PM is currently an
active area of research, especially in regard to under-
standing the chemical composition of polar organic
fractions, to identifying source category tracers for use
in source apportionment, and to determining which or-
ganic compounds affect human health. A discussion of
Fig. 13. Thermogram, for a sample containing rock dust (a
carbonate source) and diesel exhaust, showing three traces that
correspond to temperature, filter transmittance, and FID de-
tector response. Peaks correspond to organic (OC), carbonate
(CC), pyrolytic (PC), and elemental (EC) carbon. The final
peak is a methane calibration peak (Birch and Cary, 1996.
Aerosol Science and Technology: Elemental Carbon-based
Method for Monitoring Occupational Exposures to Particulate
Diesel Exhaust. 25:227. Copyright 1996. Reprinted with per-
mission of the American Association for Aerosol Research.).
W.E. Wilson et al. / Chemosphere 49 (2002) 1009–1043 1029
current knowledge of organic speciation of PM is be-
yond the scope of this paper.
1.6. Continuous mass monitoring
The US EPA expects that many local environmental
agencies will operate continuous PM monitors in the
next few years. However, EPA has not yet provided any
guidance regarding what continuous monitoring tech-
nique to use. All currently available continuous mea-
surements of suspended particle mass share the problem
of dealing with semivolatile PM components. In order
not to include particle-bound water as part of the mass,
the particle-bound water must be removed by heating or
dehumidification. However, heating also causes loss of
ammonium nitrate and semivolatile organic compo-
nents. A variety of potential candidates for continuous
measurement of mass or chemical components will be
discussed in this section. Detailed guidance can be found
in Watson et al. (1998a).
1.6.1. Tapered element oscillating microbalance
The advantages of continuous PM monitoring and
the designation of the tapered element oscillating mi-
crobalance (TEOM) as an equivalent method for PM10
has led to the deployment of the TEOM at a number of
air monitoring sites. The TEOM is also being used to
measure PM2:5. The TEOM differs from the federal
reference methods for particulate mass in that it does
not require equilibration of the samples at a specified
temperature and RH. Moreover, the TEOM samples at
a constant temperature, typically heated to some tem-
perature higher than the ambient temperature (Meyer
et al., 1995; Meyer and Rupprecht, 1996); whereas the
FRM requires sampling at the ambient temperature.
Thus, the TEOMmay not provide data equivalent to the
FRM due to losses of volatile species. Volatilization
losses in the TEOM sampler can be reduced during the
cooler times of the year by operating the instrument
heated to 30 �C rather than the typical 50 �C and by
using Nafion dryers on the inlet.
This difference in operation and the implications for
fine particle measurements were examined by research-
ers at CSIRO Atmospheric Research in Australia (Ayers
et al., 1999). That group compared 24-h mean PM2:5
mass concentrations as determined by a TEOM and by
two manual, gravimetric samplers (a low-volume filter
sampler and a MOUDI sampler) in four Australian
cities on 15 days in the winter half-year. The TEOM was
operated at 50 �C at one location and at 35 �C at
the other three locations. A systematically low TEOM
response in comparison to the integrated gravimetric
methods was observed. In a comprehensive study, Allen
et al. (1997) reported results in which TEOM data col-
lected at 10 urban sites in the US and Mexico were
compared with 24-h integrated mass concentrations for
both PM10 and PM2:5. They collected a large data set
that included both winter and summer seasons. Allen
et al. (1997) concluded that a significant portion of PM10
in urban areas could be semivolatile compounds that
could be lost from the heated filter in the TEOM thus
leading to a systematic difference between the TEOM
and the EPA FRM for PM10. Moreover, they suggested
that this difference is likely to be larger for PM2:5 than it
is for PM10 (Allen et al., 1997).
New techniques designed to minimize or eliminate
loss of semivolatile components of PM are under de-
velopment based on the TEOM technique (Meyer et al.,
2000; Patashnick et al., 2001).
1.6.2. Real-time total ambient mass sampler
A real-time total ambient mass sampler (RAMS) for
the real-time determination of total fine particulate mass,
including semivolatile species, based on diffusion denu-
der and TEOMmonitor technology, has been developed,
validated, and field tested (Eatough et al., 1999; Pang
et al., 2001; Pang et al., 2002a,b). The RAMS measures
total mass of collected particles, including semivolatile
species with a TEOM monitor using a ‘‘sandwich filter.’’
The sandwich contains a Teflon coated particle collection
filter followed by a charcoal impregnated filter (CIF) to
collect any semivolatile species lost from the particles
during sampling. Because the instrument measures total
mass collected by the sandwich filter, all gas phase
compounds that can be adsorbed by a CIF must be re-
moved from the sampling stream prior to the TEOM
monitor. Laboratory and field validation data indicate
that the precision of fine PMmass determination is better
than 10%. The RAMS uses a Nafion dryer to remove
particle-bound water from the suspended particles and a
particle concentrator to reduce the amount of gas phase
organics that must be removed by the denuder. An ex-
ample of data from the RAMS, the TEOM, and the PC-
BOSS is shown in Fig. 14.
1.6.3. Continuous ambient mass monitor
Koutrakis and colleagues (Koutrakis et al., 1996;
Wang, 1997) have developed the continuous ambient
mass monitor (CAMM), a technique for the continuous
measurement of ambient PM mass concentration based
upon the measurement of pressure drop increase with
particle loading across a membrane filter. Recently,
Sioutas et al. (1999) examined the increase in pressure
drop with increasing particle loading on Nuclepore fil-
ters. They tested filters with two pore diameters (2 and 5
lm) and filter face velocities ranging from 4 to 52 cm/s
and examined the effects of RH in the range of 10–50%.
They found that, for hygroscopic ammonium sulfate
particles, the change in pressure drop per unit time and
concentration was a strong function of RH, decreasing
with increasing relative humidity. These results suggest
that particulate concentration measurements like the
1030 W.E. Wilson et al. / Chemosphere 49 (2002) 1009–1043

method of Koutrakis et al. (1996) that uses the pressure
drop method may be subject to additional uncertainties
if used in an environment where the ambient RH cannot
be accurately controlled. The current version of the
CAMM (Wang, 1997) uses a particle concentrator and a
Nafion dryer and frequently moves the filter tape to
avoid artifacts due to evaporation of semivolatile com-
ponents if their atmospheric concentration decreased.
1.6.4. Piezoelectric microbalance
Piezoelectric crystals have mechanical resonances
that can be excited by applying an alternating electrical
voltage to the crystal. As the resonance frequencies are
well defined, such crystals (quartz in particular) have
found applications as secondary time and frequency
standards in clocks and watches. As for all mechanical
resonators, the resonance frequency is a function of
mass. Therefore, by monitoring the resonance frequency
in comparison with a second crystal, one can continu-
ously measure the mass deposited on the crystal (Sem
et al., 1977; Bowers and Chuan, 1989; Ward and Buttry,
1990; Noel and Topart, 1994). Comparison with a sec-
ond crystal largely compensates for the effect of tem-
perature changes on the resonance frequency.
The piezoelectric principle has been used to measure
particle mass by depositing the particles on the crystal
surface either by electrostatic precipitation or by im-
paction (Olin and Sem, 1971). The collection efficiency
of either mechanism has to be determined as a function
of particle size to achieve quantitative measurements. In
addition, the mechanical coupling of large particles to
the crystal is uncertain. Both single and multi-stage
impactors have been used (Olin and Sem, 1971; Fair-
child and Wheat, 1984). Quartz crystals have sensi-
tivities of several hundred hertz per microgram. This
sensitivity results in the ability to measure the mass
concentration of a typical, 100 lg/m3, aerosol to within a
few percent in less than 1 min (Olin and Sem, 1971).
1.6.5. Light scattering
A variety of types of nephelometers, that integrate
aerosol light scattering over various solid angles, are
available. When used to measure visibility, e.g., to pro-
vide pilots with real-time data on visual range, it is
desirable to include the light scattering due to particle-
bound water. However, when used as an indicator of
fine particle mass, it is desirable to exclude particle-
bound water. This is frequently done by heating the
ambient aerosol to a low reference RH of 40%. How-
ever, this heating has the potential of also causing the
loss of semivolatile components of the aerosol. The
evaporation of ammonium nitrate aerosol in a heated
nephelometer has been examined. Bergin et al. (1997)
conducted laboratory experiments at low RH (�10%)
and as a function of temperature (27–47 �C), mean
residence time in the nephelometer, and initial particle
size distribution. The evaporation of ammonium nitrate
aerosol was also modeled for comparison and was found
to accurately describe the decrease in aerosol scattering
coefficient as a function of aerosol physical properties
and nephelometer operating conditions. Bergin et al.
(1997) determined an upper limit estimate of the de-
crease in the aerosol light scattering coefficient at 450 nm
due to evaporation for typical field conditions. The
model estimates for their worst-case scenario suggest
that the decrease in the aerosol scattering coefficient
could be roughly 40%. They estimate that the decrease in
aerosol scattering coefficient under most conditions is
generally expected to be less than 20%.
1.6.6. Beta-gauge techniques
The use of absorption of beta radiation as a indicator
of particle mass has been used effectively to measure the
mass of equilibrated PM collected on Teflon filters (Ja-
klevic et al., 1981; Courtney et al., 1982). The technique
has also been used to provide near real-time measure-
ments with time intervals on the order of an hour
(Wedding and Weigand, 1993). However, real-time beta-
gauge monitors experience the same problems as other
continuous or near real-time particular matter mass
monitoring techniques. Particle-bound water must be
removed to reduce the sensitivity of the indicated mass
to relative humidity. However, the simplest technique,
mild heating, will remove a portion of the ammonium
Fig. 14. Comparison of mass measurements with collocated
RAMS (real-time data), PC-BOSS (1-h data), FRM PM2:5
sampler (average of 24-h data), and a conventional TEOM
monitor (real-time data). The semivolatile fine PM is sampled
with the RAMS and PC-BOSS, but not with the TEOM
monitor or the FRM PM2:5 single filter sampler. The PC-BOSS
provides information on both the non-volatile component (NV)
and the SVOC (Reprinted from Atmospheric Environment, 33,
Eatough et al., Integrated and real-time diffusion denuder
sampler for PM2:5, 2835–2844. Copyright 1996, with permission
from Elsevier Science.).
W.E. Wilson et al. / Chemosphere 49 (2002) 1009–1043 1031

nitrate and the semivolatile organic compounds as well
as the particle-bound water.
An intercomparison study of two beta gauges at three
sites indicated that the Wedding beta gauge and the
Sierra Anderson SA 1200 PM10 samplers were highly
correlated (r > 0:97) (Tsai and Cheng, 1996). The Wed-
ding beta gauge was not sensitive to RH but was ap-
proximately 7% lower. This suggests that the mild
heating in the beta gauge causes losses comparable to
those due to equilibration although the differences could
be due to slight differences in the upper cutpoints. The
Kimoto beta gauge, however, which was operated at
ambient temperature, was sensitive to RH, yielding
significantly higher mass concentrations relative to the
Sierra Anderson SA 1200 for RH > 80% than for
RH < 80%, even though the correlation with the SA
1200 was reasonable: r ¼ 0:94 for RH > 80% and 0.83
for RH < 80%.
1.7. Continuous monitoring of specific components
1.7.1. Carbon
The differentiation of OC and EC based on their
thermal properties followed by their detection as carbon
dioxide (CO2) or methane (CH4) after combustion is
commonly applied to filter deposits (e.g., Chow et al.,
1993). Turpin et al. (1990a,b) pioneered the continuous
thermal/optical carbon analyzer which provides in situ
time resolved OC and EC measurements. Another ver-
sion of the thermal method, the Ambient Carbon Par-
ticulate Monitor (ACPM, R&P Series 5400) (Rupprecht
et al., 1995), consists of two aerosol collectors: one
collector operates in the collection mode while the other
one operates in the analysis mode. In the collection
mode, particles are drawn through a size-selective inlet
and deposited onto an impactor. The temperature of the
collector in collection mode can be set either at or above
ambient temperature. Once the pre-specified sampling
period is achieved (typically one or more hours), the
collector is switched into the analysis mode while the
second collector is switched from analysis to collection
mode. The ACPM provides a continuous measure of
OC and EC concentrations. However, its operational
definitions of OC and EC and the selected combustion
temperatures differ from those of commonly applied
laboratory filter analysis protocols (e.g., Chow et al.,
1993).
1.7.2. Sulfur/sulfate
Continuous methods for the quantification of aerosol
sulfur compounds first remove gaseous sulfur (e.g., SO2,
H2S) from the sample stream by a diffusion tube de-
nuder followed by the analysis of particulate sulfur
(Cobourn et al., 1978; Durham et al., 1978; Huntzicker
et al., 1978; Mueller and Collins, 1980; Tanner et al.,
1980). Another approach is to measure total sulfur and
gaseous sulfur separately by alternately removing par-
ticles from the sample stream. Particulate sulfur is ob-
tained as the difference between the total and gaseous
sulfur (Kittelson et al., 1978). The total sulfur content is
measured by a flame photometric detector (FPD) by
introducing the sampling stream into a fuel-rich hydro-
gen-air flame (e.g., Stevens et al., 1969; Farwell and
Rasmussen, 1976) that reduces sulfur compounds and
measures the intensity of the chemiluminescence from
the electronically excited sulfur molecules (S2).
Because the formation of S2 requires two sulfur
atoms, the intensity of the chemiluminescence is theo-
retically proportional to the square of the concentration
of molecules that contain a single sulfur atom. In prac-
tice, the exponent is between one and two and depends
on the sulfur compound being analyzed (Dagnall et al.,
1967; Stevens et al., 1971). Calibrations are performed
using both particles and gases as standards. The FPD
can also be replaced by a chemiluminescent reaction
with ozone that minimizes the potential for interference
and provides a faster response time (Benner and Sted-
man, 1989, 1990).
Capabilities added to the basic system include in situ
thermal analysis (Cobourn et al., 1978; Huntzicker et al.,
1978) and sulfuric acid (H2SO4) speciation (Tanner
et al., 1980). Sensitivities for sulfur aerosols as low as 0.1
lg/m3 with time resolution ranging from 1 to 30 min
have been reported. Continuous measurements of par-
ticulate sulfur have also been obtained by on-line X-ray
fluorescence analysis with a time resolution of 30 min or
less (Jaklevic et al., 1980). During a field-intercompari-
son study of five different sulfur instruments, Camp et al.
(1982) reported four out of five FPD systems agreed to
within �5% during a one-week sampling period.
1.7.3. Nitrate
The Automated Particle Nitrate Monitor (APNM) is
a new method being developed to provide high-time-
resolution measurements of particle nitrate concentra-
tion (Hering, 1997; Chow et al., 1998; Hering and
Stolzenburg, 1998). It uses an integrated collection and
vaporization cell whereby particles are collected by a
humidified impaction process and analyzed in place by
flash vaporization. The approach is similar to the man-
ual method for measuring the size distribution of sulfate
aerosols (Roberts and Friedlander, 1976; Hering and
Friedlander, 1982). The difference is that the particle
collection and analysis has been combined into a single
cell, allowing the system to be automated. Although the
automated method that has been recently tested is spe-
cific to nitrate, the same technology could be applied for
continuous sulfate measurements by using a sulfur de-
tector instead of a nitric oxide detector.
Particles are humidified and collected onto a metal
strip by means of impaction. The humidification elimi-
nates particle bounce from the collection surface without
1032 W.E. Wilson et al. / Chemosphere 49 (2002) 1009–1043
the use of grease (Winkler, 1974; Stein et al., 1994). In-
terference from vapors such as nitric acid is minimized
with a denuder upstream of the humidifier. At the end of
the 10-min particle sampling period, a valve is switched
to stop particle collection and to pass a carrier gas
through the cell and into a gas analyzer. For nitrate, the
deposited particles are analyzed by flash-vaporization in
a nitrogen carrier gas, with quantification of the evolved
gases by a chemiluminescent analyzer operated in NOx
mode (Yamamoto and Kosaka, 1994). The flow system
is configured such that there are no valves on the aerosol
sampling line. Time resolution of the instrument is on
the order of 12 min, corresponding to a 10-min collec-
tion followed by an analysis step of less than 2 min.
Field calibration and validation procedures include
on-line checks of particle collection efficiency, calibra-
tion of aqueous standards, and determination of blanks
by measurements of filtered ambient air. Particle col-
lection efficiencies have been checked against an optical
particle counter that operated between the collection cell
and the pump. The analysis step of the monitor has been
calibrated by application of aqueous standards (i.e.,
sodium nitrate and ammonium nitrate) directly onto the
metal collection substrate. To ensure the absence of re-
sponse to ammonium ion, standards of ammonium
sulfate have also been applied. Field blanks are deter-
mined by placing a Teflon filter at the inlet of the system,
collecting for the 10-min sampling period, and then
analyzing the strip exactly as done for a normal sample.
During the Northern Front Range Air Quality Study
in Colorado (Watson et al., 1998b), the automated ni-
trate monitor captured 12-min time variability in fine
particle nitrate concentrations with a precision of ap-
proximately �0.5 lg/m3 (Chow et al., 1998). A com-
parison with denuded filter measurements followed by
ion chromatographic analysis (Chow and Watson, 1999)
showed agreement within �0.6 lg/m3 for most of the
measurements but exhibited a discrepancy of a factor of
two for the elevated nitrate periods.
More recent intercomparisons took place during the
1997 Southern California Ozone Study (SCOS97) in
Riverside, CA. Comparisons with 14 days of 24-h de-
nuder-filter sampling gave a correlation coefficient of
R2 ¼ 0:87 and showed no significant bias (i.e., the re-
gression slope is not significantly different from 1). As
currently configured, the system has a detection limit of
0.7 lg/m3 and a precision of 0.2 lg/m3. Field operations
with the system in Riverside showed that it was robust,
providing nearly uninterrupted data over the six-week
study period (Hering, personal communication).
1.7.4. Continuous ion chromatography
Dasgupta and Slanina have independently developed
particle collection systems that grow particles by in-
creasing the RH and collect the particles in an aqueous
solution suitable for injection into an ion chromato-
graph (Khlystov et al., 1995; Simon and Dasgupta,
1995). Automation of these systems yield semi-continu-
ous monitors for those ions that can be determined by
IC. A similar system using a particle size magnifier has
been reported by Weber et al. (2001).
1.8. Low flow filter samples for multi-day collection of
PM
For some purposes, such as demonstrating attain-
ment of an annual standard or as an exposure indicator
for epidemiologic studies of chronic health effects, 24-h
measurements are not needed. Annual or seasonal av-
erages are adequate. Multi-day sampling techniques can
result in lower costs for weighing, chemical analysis,
and travel time to change filters. The multi-day sampler
serves a second purpose. Most commercially available
samplers are optimized for collecting 24-h samples of the
PM concentrations found in the US, Europe, or Japan.
Many cities in other parts of the world have significantly
higher PM concentrations. Under these conditions, the
16.7 l/min flow through 37 or 47 mm diameter filters
may lead to overloading of the filter and failure of the
sampler to maintain the prescribed flow rate in less than
24 h. A low flow sampler with a 0.4 l/min flow rate and a
47 mm diameter filter has been designed by Aerosol
Dynamics, Inc. With this sampler, the sample collection
time can be chosen to suit the ambient concentration
level. This sampler, with a one-week collection period,
has been used to characterize PM2:5 in Beijing, PRC (He
et al., 2001). With a two-week collection period, it is
being used in a chronic epidemiologic study in southern
CA, USA (Gauderman et al., 2000).
The sampler, as described by He et al. (2001), has
three PM2:5 channels. One channel collects PM on a
Teflon filter for gravimetric mass measurement and ele-
mental analysis by XRF. A second channel collects PM
on a quartz filter for OC and EC analysis. A denuder
to remove organic gases and a backup filter to collect
semivolatile organic compounds may be added. The
third channel uses a carbonate denuder to remove acidic
gases (HNO3 and SO2), a Teflon filter to collect PM for
analysis of ions by ion chromatography, and a nylon
filter to collect volatilized nitrate. The Teflon filter can
also be weighed prior to extraction. Thus, the multi-day
sampler can provide the information needed for source
apportionment by Chemical Mass Balance techniques
(Watson et al., 1990).
1.9. Conclusions
Much progress has been made over the past five years
in understanding the problems in measuring parti-
cles from combustion sources and their semivolatile
components. Satisfactory measurement techniques are
available to measure important ionic species (Hþ, SO¼4 ,
W.E. Wilson et al. / Chemosphere 49 (2002) 1009–1043 1033
NO�3 , and NHþ
4 ), elements (Na and higher atomic
number elements), and EC. However, difficulties remain
in measuring organic carbon, especially the semivolatile
organic compounds. Measurements of mass, either by
filter or continuous techniques, suffer from the difficulty
of eliminating particle-bound water without removing
ammonium nitrate and semivolatile organic compounds.
Measurement of mass of PM according to the US FRM
is expensive, requiring establishment of a temperature-
and humidity-controlled balance room with a micro-
balance and extensive quality control. Therefore, con-
tinuous measurement of mass or mass surrogates and
measurement of chemical components of PM is an at-
tractive alternative approach. The possibility of dehu-
midification prior to continuous measurement of mass
or mass surrogates is being investigated and may prove
to be a satisfactory approach.
Most combustion particles, and especially those from
controlled combustion sources and secondary combus-
tion products formed from SO2 or NOx gases, will be in
the fine-mode size range. Therefore, the use of size se-
lective sampling to separate combustion products from
soil particles and other coarse particles is essential. A
50% cutpoint of 2.5 lm aerodynamic diameter has been
used extensively in the US to separate PM10 into a fine
PM (PM2:5) and a thoracic coarse (PM10–2:5) fraction.
However, a 50% cutpoint at 1 lm aerodynamic diameter
might give a better separation, especially if the air
stream is dehumidified prior to separation of fine-mode
and coarse-mode particles.
A variety of sampling time intervals may be required,
from hourly to annually. It may be cost effective to use a
combination of continuous monitors and samplers that
integrate particles on filters for a week to a month in
addition to 24-h sampling.
Many new techniques for measurements of individual
species and mass, including semivolatile components,
are currently in the development stage. It is hoped that
organizations beginning or expanding monitoring pro-
grams in the near future will be able to take advantage
of these techniques.
Disclaimer
This abstract has undergone technical review by
EPA. However, the views expressed are those of the
authors and do not represent EPA policy. Mention of
trade names or commercial products does not constitute
EPA endorsement or recommendation for use.
References
Aiginger, H., 1991. Historical development and principles of
total reflection X-ray fluorescence analysis (TXRF). Spect-
rochimica Acta Part B 46, 1313–1321.
Aiginger, H., Streli, C., 1997. Total reflection X-ray fluores-
cence spectrometry (TXRF) for trace element analysis.
Spectroscopy Europe XX, 16–21.
Allen, G.A., Sioutas, C., Koutrakis, P., Reiss, R., Lurmann,
F.W., Roberts, P.T., 1997. Evaluation of the TEOM
method for measurement of ambient particulate mass in
urban areas. Journal of the Air Waste Management
Association 47, 682–689.
Allen, G.A., Oh, J.A., Koutrakis, P., Sioutas, C., 1999.
Techniques for high-quality ambient coarse particulate
mass measurements. Journal of the Air & Waste Manage-
ment Association 49, PM133–PM141, special issue.
Allen, R., Box, M., Larson, T.V., Liu, L.J., 2001. A cost-
effective weighing chamber for particulate matter filters.
Journal of the Air & Waste Management Association 51,
1650–1653.
American Conference of Governmental Industrial Hygienists,
1994. Appendix D: Particle size-selective sampling criteria
for airborne particulate matter. In: 1994–1995 Threshold
Limit Values for Chemical Substances and Physical Agents
and Biological Exposure Indices. American Conference of
Governmental Industrial Hygienists, Cincinnati, Ohio,
pp. 43–46.
Anand, N.K., McFarland, A.R., Kihm, K.D., Wong, F.S.,
1992. Optimization of aerosol penetration through trans-
port lines. Aerosol Science and Technology 16, 105–112.
Appel, B.R., Colodny, P., Wesolowski, J.J., 1976. Analysis of
carbonaceous materials in southern California atmospheric
aerosols. Environmental Science and Technology 10, 359–
363.
Appel, B.R., Hoffer, E.M., Kothny, E.L., Wall, S.M., Halik,
M., Knights, R.L., 1979. Analysis of carbonaceous material
in southern California atmospheric aerosols. 2. Environ-
mental Science and Technology 13, 98–104.
Appel, B.R., Tokiwa, Y., Haik, M., 1981. Sampling of nitrates
in ambient air. Atmospheric Environment 15, 283–289.
Appel, B.R., Tokiwa, Y., Haik, M., Kothny, E.L., 1984.
Artifact particulate sulfate and nitrate formation on filter
media. Atmospheric Environment 18, 409–416.
Ayers, G.P., Keywood, M.D., Gras, J.L., 1999. TEOM vs.
manual gravimetric methods for determination of PM2:5
aerosol mass concentrations. Atmospheric Environment 33,
3717–3722.
Bacon, J.R., Chenery, S.R.N., Ellis, A.T., Fisher, A., McMa-
hon, A.W., Potts, P.J., Williams, J.G., 1995. Atomic spec-
trometry update––Atomic mass spectrometry and X-ray
fluorescence spectrometry. Journal of Analytical Atomic
Spectrometry 10, 253R–310.
Baldwin, D.P., Zamzow, D.S., D�Silva, A.P., 1994. Aerosol
mass measurement and solution standard additions for
quantitation in laser ablation-inductively coupled plasma
atomic emission spectrometry. Analytical Chemistry 66,
1911–1917.
Benner, R.L., Stedman, D.H., 1989. Universal sulfur detec-
tion by chemiluminescence. Analytical Chemistry 61, 1268–
1271.
Benner, R.L., Stedman, D.H., 1990. Field evaluation of the
sulfur chemiluminescence detector. Environmental Science
and Technology 24, 1592–1596.
Bergin, M.H., Ogren, J.A., Schwartz, S.E., McInnes, L.M.,
1997. Evaporation of ammonium nitrate aerosol in a heated
1034 W.E. Wilson et al. / Chemosphere 49 (2002) 1009–1043
nephelometer: implications for field measurements. Envi-
ronmental Science and Technology 31, 2878–2883.
Billiet, J., Dams, R., Hoste, J., 1980. Multielement thin film
standards for X-ray fluorescence analysis. X-ray Spectrom-
etry 9, 206.
Birch, M.E., Cary, R.A., 1996. Elemental carbon-based
method for monitoring occupational exposures to particu-
late diesel exhaust. Aerosol Science and Technology 25,
221–241.
Birch, M.E., 1998. Analysis of carbonaceous aerosols: Inter-
laboratory comparison. Analyst 123, 851–857.
Bowers, W.D., Chuan, R.L., 1989. Surface acoustic-wave
piezoelectric crystal aerosol mass monitor. Review of
Scientific Instruments 60, 1297–1302.
Breum, N.O., 2000. The dust holding capacity of porous plastic
foam used in particle size-selective sampling. Journal of
Aerosol Science 31, 379–385.
Butler, F.E., Jungers, R.H., Porter, L.F., Riley, A.E., Toth,
F.J., 1978. Analysis of air particulates by ion chromato-
graphy: comparison with accepted methods. In: Sawicki, E.,
Mulik, J.E., Wittgenstein, E. (Eds.), Ion Chromatographic
Analysis of Environmental Pollutants. Ann Arbor Science,
Ann Arbor, MI, pp. 65–76.
Cadle, S.H., Groblicki, P.J., Stroup, D.P., 1980a. An auto-
mated carbon analyzer for particulate samples. Analytical
Chemistry 52, 2201–2206.
Cadle, S.H., Nebel, G.J., Williams, R.L., 1980b. Measurements
of unregulated emissions from General Motors� light-dutyvehicles. Society of Automotive Engineers Transactions 88,
2381–2401.
Cadle, S.H., Groblicki, P.J., 1982. An evaluation of methods
for the determination of organic and elemental carbon in
particulate samples. In: Wolff, G.T., Klimisch, R.L. (Eds.),
Particulate Carbon: Atmospheric Life Cycles. Plenum Press,
New York, NY, pp. 89–109.
Cadle, S.H., Mulawa, P.A., 1990. Atmospheric carbonaceous
species measurement methods comparison study: General
Motors results. Aerosol Science and Technology 12, 128–
131.
Cahill, T.A., 1981. Innovative aerosol sampling devices based
upon PIXE capabilities. In: Johansson, S.A.E., (Ed.),
Particle induced X-ray emission and its analytical applica-
tions: Proceedings of the 2nd international conference on
PIXE and its analytical applications; June, 1980; Lund,
Sweden. Amsterdam, The Netherlands, North-Holland
Publishing Co. Nuclear Instruments and Methods in Phys-
ics Research, vol. 181, pp. 473–480.
Cahill, T.A., 1985. Proton-induced X-ray emission (PIXE). In:
Res, J.P. (Ed.), Metals Handbook: Materials Characteriza-
tion. American Society for Metals, Cleveland, OH.
Cahill, T.A., Eldred, R.A., Motallebi, N., Malm, W.C., 1989.
Indirect measurement of hydrocarbon aerosols across the
United States by non-sulfate hydrogen-remaining gravimet-
ric mass correlations. Aerosol Science and Technology 10,
421–429.
Cahill, T.A., Wilkinson, K., Schnell, R., 1992. Composition
analyses of size-resolved aerosol samples taken from aircraft
downwind of Kuwait, spring 1991. Journal of Geophysical
Research (Atmospheres) 97, 14513–14520.
Cahill, T.A., Wakabayashi, P., James, T., 1996. Chemical state
of sulfate at Shenandoah national Park during summer
1991. Nuclear Instruments and Methods of Physics Re-
search B 109/110, 542–547.
Camp, D.C., Stevens, R.K., Cobourn, W.G., Husar, R.B.,
Collins, J.F., Huntzicker, J.J., Husar, J.D., Jaklevic, J.M.,
McKenzie, R.L., Tanner, R.L., Tesch, J.W., 1982. Inter-
comparison of concentration results from fine particle sulfur
monitors. Atmospheric Environment 16, 911–916.
Campbell, A.J., Humayun, M., 1999. Trace element microanal-
ysis in iron meteorites by laser ablation ICPMS. Analytical
Chemistry 71, 939–946.
Chang, M., Kim, S., Sioutas, C., 1999. Experimental studies
on particle impaction and bounce: effects of substrate
design and material. Atmospheric Environment 33, 2313–
2322.
Chen, B.T., 1993. Instrument calibration. In: Willeke, K.,
Baron, P.A. (Eds.), Aerosol Measurement: Principles,
Techniques and Applications. Van Nostrand Reinhold,
New York, NY, pp. 493–520.
Cheng, Y.-S., Yeh, H.-C., 1979. Particle bounce in cascade
impactors. Environmental Science and Technology 13,
1392–1396.
Chow, J.C., Watson, J.G., Pritchett, L.C., Pierson, W.R.,
Frazier, C.A., Purcell, R.G., 1993. The DRI thermal/optical
reflectance carbon analysis system: description, evaluation
and applications in US air quality studies. Atmospheric
Environment 27A, 1185–1201.
Chow, J.C., Fujita, E.M., Watson, J.G., Lu, Z., Lawson, D.R.,
Ashbaugh, L.L., 1994a. Evaluation of filter-based aerosol
measurements during the 1987 Southern California Air
Quality Study. Environmental Monitoring and Assessment
30, 49–80.
Chow, J.C., Watson, J.G., Fujita, E.M., Lu, Z., Lawson, D.R.,
Ashbaugh, L.L., 1994b. Temporal and spatial variations of
PM2:5 and PM10 aerosol in the Southern California Air
Quality Study. Atmospheric Environment 28, 2061–2080.
Chow, J.C., 1995. Critical review: Measurement methods to
determine compliance with ambient air quality standards
for suspended particles. Journal of Air and Waste Manage-
ment Association 45, 320–382.
Chow, J.C., Watson, J.G., 1998. Guideline on speciated
particulate monitoring. US Environmental Protection
Agency, Research Triangle Park, NC.
Chow, J.C., Zielinska, B., Watson, J.G., Fujita, E.M., Rich-
ards, H.W., Neff, W.D., Dietrich, D., Hering, S.V., 1998.
Northern front range air quality study. Ambient measure-
ments, vol. A. Cooperative Institute for Research in the
Atmosphere, Colorado State University, Fort Collins, CO.
Chow, J.C., Watson, J.G., 1999. Ion chromatography. In:
Landsberger, S., Creatchman, M. (Eds.), Elemental Anal-
ysis of Airborne Particles. Gordon and Breach, Newark,
NJ, pp. 97–137.
Chow, J.C., Watson, J.G., Hackett, E.I., Stone, R.H., Hins-
vark, B.A., 2000. General atomic absorption procedure for
trace metals in airborne material collected on filters. In:
Lodge, J.P. (Ed.), Methods of Air Sampling and Analysis,
4th ed. Air and Waste Management Association, Pitts-
burgh, PA.
Cobourn, W.G., Husar, R.B., Husar, J.D., 1978. Continuous
in situ monitoring of ambient particulate sulfur using flame
photometry and thermal analysis. Atmospheric Environ-
ment 12, 89–98.
W.E. Wilson et al. / Chemosphere 49 (2002) 1009–1043 1035

Code of Federal Regulations, 2001a. Appendix L––Reference
method for the determination of fine particulate matter as
PM2:5 in the atmosphere. CFR 40: p. 50.
Code of Federal Regulations, 2001b. Appendix J––Reference
method for the determination of particulate matter as PM10
in the atmosphere. CFR 40: p. 50.
Code of Federal Regulations, 2001c. Ambient air monitoring
reference and equivalent methods. CFR 40: p. 53.
Code of Federal Regulations, 2001d. Ambient air quality
surveillance for particulate matter. CFR 40: p. 58.
Countess, R.J., 1990. Interlaboratory analyses of carbonaceous
aerosol samples. Aerosol Science and Technology 12, 114–
121.
Courtney, W.J., Shaw, R.W., Dzubay, T.G., 1982. Precision
and accuracy of a beta-gauge for aerosol mass determina-
tion. Environmental Science and Technology 16, 236–238.
Cui, W., Eatough, D.J., Eatough, N.L., 1998. Fine particulate
organic material in the Los Angeles Basin. I. Assessment of
the high-volume Brigham Young University Organic Sam-
pling System, BIG BOSS. Journal of the Air and Waste
Management Association 48, 1024–1037.
Dagnall, R.M., Thompson, K.C., West, T.S., 1967. Molecular
emission in cool flames I. Analyst 92, 506–512.
Daisey, J.M., McCaffrey, R.J., Gallagher, R.A., 1981. Polycy-
clic aromatic hydrocarbons and total extractable particulate
organic matter in the Arctic aerosol. Atmospheric Environ-
ment 15, 1353–1363.
Dams, R., Robbins, J.A., Rahn, K.A., Winchester, J.W., 1970.
Non-destructive neutron activation analysis of air pollution
particulates. Analytical Chemistry 42, 861–867.
Dane, A.D., Timmermans, P.A.M., van Sprang, H.A., Buy-
dens, L.M.C., 1996. A genetic algorithm for model-free
X-ray fluorescence analysis of thin film. Analytical Chem-
istry 68, 2419–2425.
Dasgupta, P.K., 1992. Ion chromatography: the state of the art.
Analytical Chemistry 64, 775–783.
Davis, D.W., Reynolds, R.L., Tsou, G.C., Zafonte, L., 1977.
Filter attenuation corrections for X-ray fluorescence anal-
ysis of atmospheric aerosols. Analytical Chemistry 49, 1990.
de Boer, D.K.G., Leenaers, A.J.G., van den Hoogenhof, W.W.,
1995. Glancing-incidence X-ray analysis of thin-layered
materials: A review. X-Ray Spectrometry 24, 91–102.
Dockery, D.W., Pope III, C.A., Xu, X., Spengler, J.D., Ware,
J.H., Fay, M.E., Ferris Jr., B.G., Speizer, F.E., 1993. An
association between air pollution and mortality in six US
cities. New England Journal of Medicine 329, 1753–1759.
Dod, R.L., Rosen, H., Novakov, T., 1979. Atmospheric aerosol
research annual report for 1977–1978; report no. 8696.
Berkeley, CA: Lawrence Berkeley Laboratories.
Durham, J.L., Wilson, W.E., Bailey, E.B., 1978. Application of
an SO2 denuder for continuous measurement of sulfur in
submicrometric aerosols. Atmospheric Environment 12,
883–886.
Dzubay, T.G., Nelson, R.O., 1975. Self absorption corrections
for X-ray fluorescence analysis of aerosols. In: Pickles,
W.L., Barrett, C.S., Newkirk, J.B., Rund, C.O. (Eds.),
Advances in X-ray analysis. Plenum Publishing Corpora-
tion, New York, NY, p. 619.
Dzubay, T.G., Stevens, R.K., 1975. Ambient air analysis with
dichotomous sampler and X-ray fluorescence spectrometer.
Environmental Science and Technology 9, 663–668.
Dzubay, T.G., Hines, L.E., Stevens, R.K., 1976. Particle
bounce errors in cascade impactors. Atmospheric Environ-
ment 10, 229–234.
Eatough, D.J., Wadsworth, A., Eatough, D.A., Crawford,
J.W., Hansen, L.D., Lewis, E.A., 1993. A multiple-system,
multi-channel diffusion denuder sampler for the determina-
tion of fine-particulate organic material in the atmosphere.
Atmospheric Environment 27A, 1213–1219.
Eatough, D.J., Tang, H., Cui, W., Machir, J., 1995. Determi-
nation of the size distribution and chemical composition of
fine particulate semi-volatile organic material in urban
environments using diffusion denuder technology. Inhala-
tion Toxicology 7, 691–710.
Eatough, D.J., Obeidi, F., Pang, Y., Ding, Y., Eatough, N.L.,
Wilson, W.E., 1999. Integrated and real-time diffusion
denuder sampler for PM2:5. Atmospheric Environment 33,
2835–2844.
Fairchild, C.I., Wheat, L.D., 1984. Calibration and evaluation
of a real-time cascade impactor. American Industrial
Hygiene Association Journal 45, 205–211.
Farwell, S.O., Rasmussen, R.A., 1976. Limitations of the FPD
and ECD in atmospheric analysis: a review. Journal of
Chromatographic Science 14, 224–234.
Fassel, V.A., Kinseley, R.N., 1974. Inductively coupled plasma-
optical emission spectroscopy. Analytical Chemistry 46,
1110A–1120A.
Federal Register, 1987. Revisions to the National ambient air
quality standards for particulate matter: 40 CFR Parts 51
and 52. Federal Register 52, pp. 24634–24669.
Federal Register, 1997. National ambient air quality standards
for particulate matter––final rule. Federal Register 62,
pp. 38652–38752.
Federal Register, 1998. National ambient air quality standards
for particulate matter and revised requirements for desig-
nation of reference and equivalent methods for PM2:5 and
ambient air quality surveillance for particulate matter––cor-
rection. Federal Register 63, pp. 7710–7718.
Fernandez, F.J., 1989. Atomic absorption spectroscopy. In:
Lodge Jr., J.P. (Ed.), Methods of Air Sampling and
Analysis. Lewis Publishers, Chelsea, MI, pp. 83–89.
Finlayson-Pitts, B.J., Pitts Jr., J.N., 1986. Atmospheric Chem-
istry: Fundamentals and Experimental Techniques. John
Wiley & Sons, New York, NY.
Flocchini, R.G., Cahill, T.A., Shadoan, D.J., Lange, S.J.,
Eldred, R.A., Feeney, P.J., Wolfe, G.W., Simmeroth, D.C.,
Suder, J.K., 1976. Monitoring California�s aerosols by size
and elemental composition. Environmental Science and
Technology 10, 76–82.
Friedlander, S.K., 1977. Smoke, dust and haze: fundamentals
of aerosol behavior. John Wiley & Sons, New York, NY.
Fritz, J.S., 1987. Ion chromatography. Analytical Chemistry
59, 335A.
Fung, K.K., Heisler, S.L., Price, A., Nuesca, B.V., Mueller,
P.K., 1979. Comparison of ion chromatography and auto-
mated wet chemical methods for analysis of sulfate and
nitrate in ambient particulate filter samples. In: Sawicki, E.,
Mulik, J.D. (Eds.), Ion Chromatographic Analysis of
Environmental Pollutants. Ann Arbor Science Publishers
Inc, Ann Arbor, MI, pp. 203–209.
Fung, K.K., 1990. Particulate carbon speciation by MnO2
oxidation. Aerosol Science Technology 12, 122–127.
1036 W.E. Wilson et al. / Chemosphere 49 (2002) 1009–1043

Gagosian, R.B., Zafiriou, O.C., Peltzer, E.T., Alford, J.B.,
1982. Lipids in aerosols from the tropical North Pacific:
temporal variability. Journal of Geophysical Research 87,
11133–11144.
Gagosian, R.B., Peltzer, E.T., Merrill, J.T., 1987. Long range
transport of terrestrially derived lipids in aerosols from
South Pacific. Nature 325, 800–803.
Gauderman, W.J., McConnell, R., Gilliland, F., London, S.,
Thomas, D., Avol, E., Vora, H., Berhane, K., Rappaport,
E.B., Lurmann, F., Margolis, H.G., Peters, J., 2000.
Association between air pollution and lung function growth
in southern California children. American Journal of
Respiratory and Critical Care Medicine 162, 1383–1390.
Gerber, H.E., 1982. Optical techniques for the measurement of
light absorption by particulates. In: Wolff, G.T., Klimisch,
B.L. (Eds.), Particulate Carbon: Atmospheric Life Cycles.
Plenum Publishing Corporation, New York, NY, pp. 1–411.
Gordon, R.J., 1974. Solvent selection in entrance of particulate
matter. Atmospheric Environment 8, 189.
Gray, A.L., Williams, J.G., 1987a. Oxide and doubly charged
ion response of a commercial ICP-MS instrument. Journal
of Analytical Atomic Spectrometry 2, 81–82.
Gray, A.L., Williams, J.G., 1987b. System optimization and the
effect on polyatomic, oxide and doubly charged ion response
of a commercial ICP-MS instrument. Journal of Analytical
Atomic Spectrometry 2, 599–606.
Groblicki, P.J., Cadle, S.H., Ang, C.C., Mulawa, P.A., 1983.
Inter-laboratory comparison of methods for the analysis of
organic and elemental carbon in atmospheric particulate
matter. Atmospheric Environment 17, 593–593.
Grosjean, D., 1975. Solvent extraction and organic carbon
determination in atmospheric particulate matter: the or-
ganic extraction–organic carbon analyzer (OE–OCA) tech-
nique. Analytical Chemistry 47, 797–805.
Gundel, L.A., Stevens, R.K., Daisey, J.M., Lee, V.C., Mahan-
ama, K.R.R., Cancel-Velez, H.G., 1995. Direct determina-
tion of the phase distributions of semi-volatile polycyclic
aromatic hydrocarbons using annular denuders. Atmo-
spheric Environment 29, 1719–1733.
H€aanninen, O.O., Koistinen, K.J., Kousa, A., Keski-Karhu, J.,
Jantunen, M.J., 2002. Quantitative analysis of environmen-
tal factors in differential weighing of blank teflon filters.
Journal of the Air & Waste Management Association 52,
134–139.
Harman, J.N., 1989. Inductively coupled plasma emission
spectroscopy. In: Lodge, J.P. (Ed.), Methods of Air
Sampling and Analysis. Lewis Publishers, Chelsea, MI,
pp. 88–92.
Haupt, O., Klane, B., Schaefer, C., Dannecker, W., 1995.
Preparation of quartz fibre filter standards for X-ray
fluorescence analysis of aerosol samples. X-ray Spectro-
metry 24, 267–275.
He, K., Yang, F., Ma, Y., Zhang, Q., Yao, X., Chan, C.K.,
Cadle, S., Chan, T., Mulawa, P., 2001. The characteristics of
PM2:5 in Beijing, China. Atmospheric Environment 35,
4959–4970.
Heintzenberg, J., 1982. Measurement of light absorption and
elemental carbon in atmospheric aerosol samples from
remote locations. In: Wolff, G.T., Klimisch, R.L. (Eds.),
Particulate Carbon: Atmospheric Life Cycle. Plenum Press,
New York, NY, pp. 371–377.
Heisler, S.L., Henry, R.C., Collins, J., 1980a. The nature of the
Denver haze in November and December of 1978. 73rd
annual meeting of the Air Pollution Control Association;
June; Montreal, PQ, Canada. Air Pollution Control Asso-
ciation, Pittsburgh, PA, paper no. 80-58.3.
Heisler, S.L., Henry, R.C., Watson, J.G., Hidy, G.M., 1980b.
The 1978 Denver winter haze study. Westlake Village, CA:
Environmental Research & Technology, Inc.; document no.
P-5417-1.
Hering, S., Personal communication.
Hering, S.V., Friedlander, S.K., 1982. Origins of aerosol sulfur
size distributions in the Los Angeles basin. Atmospheric
Environment 16, 2647–2656.
Hering, S.V., Appel, B.R., Cheng, W., Salaymeh, F., Cadle,
S.H., Malawa, P.A., Cahill, T.A., Eldred, R.A., Surovik,
M., Fitz, D.R., Howes, J.E., Knapp, K.T., Stockburger, L.,
Turpin, B.J., Huntzicker, J.J., Zhang, X., McMurry, P.H.,
1990. Comparison of sampling methods for carbonaceous
aerosols in ambient air. Aerosol Science and Technology 12,
200–213.
Hering, S.V., 1997. Automated, high-time resolution measure-
ment of fine particle nitrate concentrations for the northern
front range air quality study (final report). Prepared for
Electric Power Research Institute, Palo Alto, CA, by
Aerosol Dynamics Inc., Berkeley, CA.
Hering, S.V., Stolzenburg, M.R., 1998. A new method for the
automated, high-time resolution measurement of PM2:5
nitrate. In: Chow, J.C., Koutrakis, P. (Eds.), Proceedings of
PM2:5: A Fine Particle Standard; January; Long Beach, CA.
Air and Waste Management Association (AWMA) Publi-
cations, Pittsburgh, PA, pp. 312–317, VIP-81.
Hering, S.V., Cass, G.R., 1999. The magnitude of bias in the
measurement of PM2:5 arising from volatilization of partic-
ulate nitrate from Teflon filters. Journal of Air and Waste
Management Association 49, 725–733.
Holynska, B., Ptasinski, J., Maenhaut, W., Annegarn, H.J.,
1997. Energy-dispersive X-ray fluorescence spectrometer
with capillary optics for the chemical analysis of atmo-
spheric aerosols with high time resolution. Journal of
Aerosol Science 28, 1455–1464.
Houck, J.E., Chow, J.C., Watson, J.G., Simons, C.A., Pritch-
ett, L.C., Goulet, J.M., Frazier, C.A., 1989. Determination
of particle size distribution and chemical composition of
particulate matter from selected sources in California:
volume I and executive summary (final report). California
Air Resources Board, Sacramento, CA.
Huntzicker, J.J., Hoffman, R.S., Ling, C.S., 1978. Continuous
measurement and speciation of sulfur containing aerosols
by flame photometry. Atmospheric Environment 12, 83–88.
Huntzicker, J.J., Johnson, R.L., Shah, J.J., Cary, R.A., 1982.
Analysis of organic and elemental carbon in ambient
aerosol by a thermal-optical method. In: Wolff, G.T.,
Klimisch, R.L. (Eds.), Particulate Carbon: Atmospheric
Life Cycle. Plenum Press, New York, NY, pp. 79–88.
Jackson, K.W., Mahmood, T.M., 1994. Atomic absorption,
atomic emission, and flame emission spectrometry. Analyt-
ical Chemistry 66, 252R–279R.
Jaklevic, J.M., Loo, B.W., Goulding, F.S., 1977. Photon-
induced X-ray fluorescence analysis using energy- dispersive
detection and dichotomous sampler. In: Dzubay, T.G.
(Ed.), X-ray fluorescence analysis of environmental samples.
W.E. Wilson et al. / Chemosphere 49 (2002) 1009–1043 1037

Ann Arbor Science Publishers Inc, Ann Arbor, MI, pp. 3–
18.
Jaklevic, J.M., Loo, B.W., Fujita, T.Y., 1980. Automatic
particulate sulfur measurements with a dichotomous sam-
pler and on-line X-ray fluorescence analysis. Report No.
LBL-10882. Lawrence Berkeley National Laboratory,
Berkeley, CA.
Jaklevic, J.M., Gatti, R.C., Goulding, F.S., Loo, B.W., 1981. A
beta-gauge method applied to aerosol samples. Environ-
mental Science and Technology 15, 680–686.
Japar, S.M., Szkarlat, A.C., Gorse Jr., R.A., Heyerdahl, E.K.,
Johnson, R.L., Rau, J.A., Huntzicker, J.J., 1984. Compar-
ison of solvent extraction and thermal-optical carbon
analysis methods: application to diesel vehicle exhaust
aerosol. Environmental Science and Technology 18, 231–
234.
Johansson, T.B., Askelsson, R., Johansson, S.A.E., 1970. X-ray
analysis: elemental trace analysis at the 10–(12) g level.
Nuclear Instrument Methods 84, 141–143.
John, W., Wall, S.M., Ondo, J.L., 1988. A new method for
nitric acid and nitrate aerosol measurement using the
dichotomous sampler. Atmospheric Environment 22, 1627–
1636.
John, W., Sethi, V., 1993. Threshold for resuspension by
particle impaction. Aerosol Science and Technology 19, 69–
79.
Johnson, R.L., Huntzicker, J.J., 1979. Analysis of volatilizable
and elemental carbon in ambient aerosols. In: Novakov, T.
(Ed.), Proceedings of Carbonaceous Particles in the Atmo-
sphere Conference. Lawrence Berkeley Laboratory, Berke-
ley, CA, pp. 10–13.
Johnson, R.L., Shah, J.J., Huntzicker, J.J., 1980. Analysis of
organic, elemental, and carbonate carbon in ambient
aerosols. In: Verner, S.S. (Ed.), Sampling and Analysis of
Toxic Organics in the Atmosphere. American Society for
Testing and Materials, Philadelphia, PA, p. 111.
Johnson, D.L., McIntyre, B.L., Fortmann, R.C., Stevens, R.K.,
Hanna, R.B., 1981. A chemical element comparison of
individual particle analysis and bulk analysis methods.
Scanning Electron Microscopy 1, 469.
Keeler, G.J., Brachaczek, W.W., Gorse Jr., R.A., Japar, S.M.,
Pierson, W.R., 1988. Effect of ambient humidity on dichot-
omous sampler coarse/fine ratios. Atmospheric Environ-
ment 22, 1715–1720.
Khlystov, A., Wyers, G.P., Slanina, J., 1995. The steam-jet
aerosol collector. Atmospheric Environment 29, 2229–2234.
Kittelson, D.B., McKenzie, R.L., Vermeersch, M., Dorman, F.,
Pui, D.Y.H., Linne, M., Liu, B.Y.H., Whitby, K.T., 1978.
Total sulfur aerosol concentration with an electrostatically
pulsed flame photometric detector system. Atmospheric
Environment 12, 105–111.
Klouda, G.A., Klinedinst, D.B., Steel, E.B., Benner, B.A.,
Parish, H.J., 1996. Exploring a method to produce an urban
dust particle filter standard. Journal of Aerosol Science 27,
s351–s352.
Koistinen, K.J., Kousa, A., Tenhola, V., Hanninen, O.,
Jantunen, M.J., Oglesby, L., Kuenzli, N., Georgoulis, L.,
1999. Fine particle (PM2:5) measurement methodology,
quality assurance procedures and pilot results of the
EXPOLIS study. Journal of the Air & Waste Management
Association 49, 1212–1220.
Koutrakis, P., Thompson, K.M., Wolfson, J.M., Spengler,
J.D., Keeler, G.J., Slater, J.L., 1992. Determination of
aerosol strong acidity losses due to interactions of collected
particles: Results from laboratory and field studies. Atmo-
spheric Environment 26A, 987–995.
Koutrakis, P., Wang, P.Y., Wolfson, J.M., Sioutas, C., 1996.
Method and apparatus to measure particulate matter in gas.
US Patent no. 5,571,945 filed Nov. 5, 1996. Available from
<www.patents.ibm.com>.
Kukreja, V.P., Bove, J.L., 1976. Determination of free carbon
collected on high-volume glass fiber filter. Environmental
Science and Technology 10, 187–189.
Kusko, B.H., Cahill, T.A., Eldred, R.A., Matsuda, Y., Miyake,
H., 1989. Nondestructive analysis of total nonvolatile
carbon by Forward Alpha Scattering Technique (FAST).
Aerosol Science and Technology 10, 390–396.
Landsberger, S., 1988. Improved methodology for the deter-
mination of the seven elemental tracer long-distance pollu-
tion signatures using thermal and epithermal neutron
activation analysis. Analytical Chemistry 60, 1842–1845.
Lawless, P.A., Rodes, C.E., Evans, G., Sheldon, L., Creason, J.,
2001. Aerosol concentrations during the 1999 Fresno
Exposure Studies as functions of size, season and meteo-
rology. Aerosol Science and Technology 34, 66–74.
Lawrence, J., Koutrakis, P., 1996a. Measurement and specia-
tion of gas and particulate phase organic acidity in an urban
environment: 1. analytical. Journal of Geophysical Research
101, 9159–9169.
Lawrence, J., Koutrakis, P., 1996b. Measurement and specia-
tion of gas and particulate phase organic acidity in an urban
environment: 2. speciation. Journal of Geophysical Re-
search 101, 9171–9184.
Lawson, D.R., 1990. The Southern California Air Quality
Study. Journal of the Air Pollution Control Association 40,
156–165.
Li, W., Montassier, N., Hopke, P.K., 1992. A system to
measure the hygroscopicity of aerosol particles. Aerosol
Science and Technology 17, 25–35.
Lin, C.I., Baker, M.B., Charlson, R.J., 1973. Absorption
coefficient of atmospheric aerosol: a method for measure-
ment. Applied Optics 12, 1356–1363.
Loo, B.W., Jaklevic, J.M., Goulding, F.S., 1976. Dichotomous
virtual impactors for large scale monitoring of airborne
particulate matter. In: Liu, B.Y.H. (Ed.), Fine particles:
aerosol generation, measurement, sampling, and analysis.
Academic Press, New York, NY, pp. 311–350.
Loo, B.W., Cork, C.P., 1998. Development of high efficiency
virtual impactors. Aerosol Science and Technology 9, 167–176.
Lundgren, D.A., Burton, R.M., 1995. Effect of particle size
distribution on the cut point between fine and coarse
ambient mass fractions. Inhalation Toxicology 7, 131–148.
Lynch, A.J., McQuaker, N.R., Bicun, D.I., 1980. ICP/AES
analysis and the composition of airborne and soil materials
in the vicinity of a lead/zinc smelter complex. Journal of the
Air Pollution Control Association 30, 257–259.
Macias, E.S., Delumyea, R.G., Chu, L.C., Appleman, H.R.,
Radcliffe, C.D., Staley, L., 1979. The determination, speci-
ation, and behavior of particulate carbon. In: Novakov, T.
(Ed.), Proceedings: Conference on Carbonaceous Particles
in the Atmosphere. Lawrence Berkeley Laboratory, Berke-
ley, CA, p. 70.
1038 W.E. Wilson et al. / Chemosphere 49 (2002) 1009–1043
Malissa, H., 1979. Some analytical approaches to the chemical
characterization of carbonaceous particulates. In: Novakov,
T. (Ed.), Proceedings: Conference on Carbonaceous Parti-
cles in the Atmosphere. Lawrence Berkeley Laboratory,
Berkeley, CA, p. 3.
Malm, W.C., Sisler, J.F., Huffman, D., Eldred, R.A., Cahill,
T.A., 1994. Spatial and seasonal trends in particle concen-
tration and optical extinction in the United States. Journal
of Geophysical Research 99, 1347–1370.
Marple, V.A., Chien, C.M., 1980. Virtual impactors: a theo-
retical study. Environmental Science and Technology 14,
977–985.
Marple, V.A., Liu, B.Y.H., Burton, R.M., 1990. High-
volume impactor for sampling fine and coarse particles.
Journal of the Air & Waste Management Association 40,
762–767.
Marple, V.A., Rubow, K.L., Behm, S.M., 1991. A microorifice
uniform deposit impactor (MOUDI): description, calibra-
tion, and use. Aerosol Science and Technology 14, 434–446.
Mazurek, M.A., Simoneit, B.R.T., Cass, G.R., Gray, H.A.,
1987. Quantitative high-resolution gas chromatography and
high-resolution gas chromatography/mass spectrometry an-
alyses of carbonaceous fine aerosol particles. International
Journal of Environmental and Analytical Chemistry 29,
119–139.
Mazurek, M.A., Cass, G.R., Simoneit, B.R.T., 1989. Interpre-
tation of high-resolution gas chromatography and high-
resolution gas chromatography/mass spectrometry data
acquired from atmospheric organic aerosol samples. Aero-
sol Science and Technology 10, 408–420.
Mazurek, M.A., Cass, G.R., Simoneit, B.R.T., 1991. Biological
input to visibility-reducing aerosol particles in the remote
arid southwestern United States. Environmental Science
and Technology 25, 684–694.
McCarthy, R., Moore, C.E., 1952. Determination of free
carbon in atmospheric dust. Analytical Chemistry 24, 411–
412.
McMurry, P.H., 1999. A review of atmospheric aerosol
measurements. Prepared for the NARSTO assessment.
McMurry, P.H., 2000. A review of atmospheric aerosol
measurements. Atmospheric Environment 34, 1959–1999.
McQuaker, N.R., Kluckner, P.D., Chang, G.N., 1979. Cali-
bration of an inductively coupled plasma-atomic emission
spectrometer for the analysis of environmental materials.
Analytical Chemistry 51, 888–895.
Merz, W., 1978. Automated rapid methods in organic elemental
analysis. Mikrochimica Acta, 519–534.
Meyer, M.B., Rupprecht, E.G., Patashnick, H., 1995. Consid-
erations for the sampling and measurement of ambient
particulate matter. In: Proceedings of an International
Specialty Conference on Particulate Matter: Health and
Regulatory Issues; April; Pittsburgh, PA. Air & Waste
Management Association (AWMA Publications), Pitts-
burgh, PA, pp. 204–210 (VIP-49).
Meyer, M.B., Rupprecht, E.G., 1996. Particulate matter
sampling methods: the importance of standardization.
Journal of Aerosol Science 27, s349–s350.
Meyer, M.B., Patashnick, H., Ambs, J.L., Rupprecht, E., 2000.
Development of a sample equilibration system for the
TEOM continuous PM monitor. Journal of the Air &
Waste Management Association 50, 1345–1349.
Miller, F.J., Gardner, D.E., Graham, J.A., Lee Jr., R.E.,
Wilson, W.E., Bachmann, J.D., 1979. Size considerations
for establishing a standard for inhalable particulates.
Journal of Air Pollution Control Association 29, 610–614.
Mueller, P.K., Mosely, R.W., Pierce, L.B., 1971. Carbonate
and non-carbonate carbon in atmospheric particulates. In:
Englund, H.M., Beery, W.T. (Eds.), Proceedings of the
Second International Clean Air Congress. Academic Press,
New York, NY, pp. 532–539.
Mueller, P.K., Mendoza, B.V., Collins, J.C., Wilgus, E.S., 1978.
Application of ion chromatography to the analysis of
anions extracted from airborne particulate matter. In:
Sawicki, E., Mulik, J.D., Wittgenstein, E. (Eds.), Ion
Chromatographic Analysis of Environmental Pollutants.
Ann Arbor Science Publishers Inc, Ann Arbor, MI, pp. 77–
86.
Mueller, P.K., Collins, J.F., 1980. Development of a particulate
sulfate analyzer. Electric Power Research Institute, Palo
Alto, CA, report no. P-1382F.
Mueller, P.K., Hilst, G.R., Hidy, G.M., Lavery, T.F., Watson,
J.G., 1981. EPRI sulfate regional experiment: results and
implications. Electric Power Research Institute, Palo Alto,
CA, report no. EA-2077-SY-LD.
Mueller, P.K., Fung, K.K., Heisler, S.L., Grosjean, D., Hidy,
G.M., 1982. Atmospheric particulate carbon observations
in urban and rural areas of the United States. In: Wolff,
G.T., Klimisch, R.L. (Eds.), Particulate Carbon: Atmo-
spheric Life Cycle. Plenum Publishing Corporation, New
York, NY, pp. 343–370.
Mueller, P.K., McDade, C., 1986. The SCENES measurement
of aerosol properties and visual air quality in the south-
western US Presented at: 79th Annual Meeting of the Air
Pollution and Control Association; June; Minneapolis, MN.
Air Pollution and Control Association, Pittsburgh, PA.
Muhlbaier, J.L., Williams, R.L., 1982. Fireplaces, furnaces and
vehicles as emission sources of particulate carbon. In: Wolff,
G.T., Klimisch, R.L. (Eds.), Particulate Carbon, Atmo-
spheric Life Cycles. Plenum Press, New York, NY, pp. 185–
205.
Mulik, J.D., Puckett, R., Williams, D., Sawicki, E., 1976. Ion
chromatographic analysis of sulfate and nitrate in ambient
aerosols. Analytical Letters 9, 653–663.
Mulik, J.D., Puckett, R., Sawicki, E., Williams, D., 1977. Ion
chromatography––a new analytical technique for the assay
of sulfate and nitrate in ambient aerosols. In: Kirchoff,
W.H. (Ed.), Methods and Standards for Environmental
measurement: Proceedings of the 8th Materials Research
Symposium held at the National Bureau of Standards;
September, 1976; Gaithersburg, MD. National Bureau of
Standards, Washington DC, pp. 603–607.
Munksgaard, N.C., Parry, D.L., 1998. Lead isotope ratios
determined by ICP-MS: Monitoring of mining-derived
metal particulates in atmospheric fallout, Northern Terri-
tory, Australia. Science of the Total Environment 217, 113–
126.
Nadkarni, R.A., 1975. Multielement analysis of coal and coal
fly ash standards by instrumental neutron activation anal-
ysis. Radiochemical and Radioanalytical Letters 21, 161–
161.
Nam, S., Masamba, W.R.L., Montaser, A., 1993. Investigation
of helium inductively coupled plasma-mass spectrometry for
W.E. Wilson et al. / Chemosphere 49 (2002) 1009–1043 1039
the detection of metals and nonmetals in aqueous solutions.
Analytical Chemistry 65, 2784–2790.
National Research Council, 1993. Protecting visibility in
national parks and wilderness areas. National Academy
Press, Washington, DC, 3v.
Nham,T.T., 1996.Cool plasma technique for the ultra-trace level
determination of 56Fe, 40Ca, 39K, 7Li, 24Mg and 23Na for
semi-conductor applications. Mulgrave, Victoria, Australia:
Varian Australia Pty Ltd; ICP-MS instruments at work no.
ICP-MS-7. Available from <http://www.varianinc.com/cgi-
bin/nav?varinc/docs/osi/icpms/atwork/icpms7&cid¼ 680052
[18 January, 2002]>.
Noble, C.A., Vanderpool, R.W., Peters, T.M., McElroy,
F.F., Gemmill, D.B., Wiener, R.W., 2001. Federal reference
and equivalent methods for measuring fine particulate
matter. Aerosol Science and Technology 34, 457–464.
Noel, M.A., Topart, P.A., 1994. High-frequency impedance
analysis of quartz crystal microbalances. 1. General consid-
erations. Analytical Chemistry 66, 484–491.
Novakov, T., 1981. Microchemical characterization of aerosols.
In: Malissa, H., Grasserbauer, M., Belcher, R. (Eds.),
Nature, Air and Methods of Microchemistry. Springer-
Verlag, Wein, Graz, Austria, pp. 141–165.
Novakov, T., 1982. Soot in the atmosphere. In: Wolff,
G.T., Klimisch, R.L. (Eds.), Particulate Carbon: Atmo-
spheric Life Cycle. Plenum Press, New York, NY, pp. 19–
41.
Olin, J.G., Sem, G.J., 1971. Piezoelectric microbalance for
monitoring the mass concentration of suspended particles.
Atmospheric Environment 5, 653–668.
Olmez, I., 1989. Instrumental neutron activation analysis of
atmospheric particulate matter. In: Lodge, J.P. (Ed.),
Methods of Air Sampling and Analysis. Lewis Publishers,
Chelsea, MI, pp. 143–150.
Ondov, J.M., Divita Jr., F., 1993. Size spectra for trace
elements in urban aerosol particles by instrumental neutron
activation analysis. Journal of Radioanalytical and Nuclear
Chemistry 167, 247–258.
Pak, S.S., Liu, B.Y.H., Rubow, K.L., 1992. Effect of coating
thickness on particle bounce in inertial impactors. Aerosol
Science and Technology 16, 141–150.
Pang, Y., Ren, Y., Obeidi, F., Hastings, R., Eatough, D.J.,
Wilson, W.E., 2001. Semi-volatile species in PM2:5: com-
parison of integrated and continuous samplers for PM2:5
research or monitoring. Journal of the Air & Waste
Management Association 51, 25–36.
Pang, Y., Eatough, N.L., Eatough, D.J. PM2:5 semi-volatile
materials effects on PM2:5 measurement by federal reference
method samplers at Bakersfield, CA. Aerosol Science and
Technology 36, 289–299.
Pang, Y., Eatough, N.L., Eatough, D.J. PM2:5 semi-volatile
organic material at Riverside CA: implications for PM2:5
federal reference method samplers. Aerosol Science and
Technology 36, 277–288.
Patashnick, H., Rupprecht, G., Ambs, J.L., Meyer, M.B., 2001.
Development of a reference standard for particulate matter
mass in ambient air. Aerosol Science and Technology 34,
42–45.
Patterson, R.K., 1973. Automated Pregl-Dumas technique for
determining total carbon, hydrogen and nitrogen in atmo-
spheric aerosols. Analytical Chemistry 45, 605–609.
Perry, K.D., Cahill, T.A., Schnell, R.C., Harris, J.M., 1999.
Long-range transport of anthropogenic aerosols to the
NOAA baseline station at Mauna Loa Observatory,
Hawaii. Journal of Geophysical Research (Atmospheres)
104 (D15), 18521–18533.
Peters, T.M., Vanderpool, R.W., Wiener, R.W., 2001a. Design
and calibration of the EPA PM2:5 well impactor ninety-six
WINS. Aerosol Science and Technology 34, 389–397.
Peters, T.M., Norris, G.A., Vanderpool, R.W., Gemmill, D.B.,
Wiener, R.W., Murdoch, R.W., McElroy, F.F., Pitchford,
M., 2001b. Field performance of PM2:5 federal reference
method samplers. Aerosol Science and Technology 34, 433–
443.
Pilinis, C., Seinfeld, J.H., Grosjean, D., 1989. Water content of
atmospheric aerosols. Atmospheric Environment 23, 1601–
1606.
Pimenta, J.A., Wood, G.R., 1980. Determination of free and
total carbon in suspended air particulate matter collected on
glass fiber filters. Environmental Science and Technology
14, 556–561.
Piorek, S., 1994. Modern, PC based, high resolution portable
EDXRF analyzer offers laboratory performance for field,
in-situ analysis of environmental contaminants. Nuclear
Instruments and Methods in Physics Research A 353, 528–
533.
Plantz, M., 1996. Common molecular ion interferences in ICP-
MS. Mulgrave, Victoria, Australia: Varian Australia Pty
Ltd; ICP-MS instruments at work no. ICP-MS-6. Available
from <http://www.varianinc.com/cgi-bin/nav?varinc/docs/
osi/icpms/atwork/index&cid¼ 680052 [18 January, 2002]>.
Potts, P.J., Webb, P.C., 1992. X-ray fluorescence spectrometry.
Journal of Geochemical Exploration 44, 251–296.
Pyen, G.S., Fishman, M.J., 1979. Determination of anions in
pore waters from cores. In: Mulik, J.D., Sawicki, E. (Eds.),
Ion Chromatography Analysis of Environmental Pollu-
tants. Ann Arbor Science Publishers Inc, Ann Arbor, MI,
pp. 235–244.
Ranade, M.B., Woods, M.C., Chen, F.L., Purdue, L.J., Rehme,
K.A., 1990. Wind tunnel evaluation of PM10 samplers.
Aerosol Science and Technology 13, 54–71.
Ranweiler, L.E., Moyers, J.L., 1974. Atomic absorption
procedure for analysis of metals in atmospheric particu-
late matter. Environmental Science and Technology 8, 152–
156.
Rao, A.K., Whitby, K.T., 1977. Non-ideal collection charac-
teristics of single stage and cascade impactors. American
Industrial Hygiene Association Journal, 174–177.
Rao, A.K., Whitby, K.T., 1978. Non-ideal collection charac-
teristics of inertial impactors––I. Single-stage impactors and
solid particles. Journal of Aerosol Science 9, 77–86.
Reid, J.S., Cahill, T.A., Wakabayashi, P.H., Dunlap, M.R.,
1994. Geometric/aerodynamic equivalent diameter ratios of
ash aggregate aerosols collected in burning Kuwaiti well
fields. Atmospheric Environment 28, 2227–2234.
Reist, P.C., 1984. Introduction to Aerosol Science. Macmillan
Publishing Company, New York, NY.
Rich, W.E., Tillotson, J.A., Chang, R.C., 1978. Ion chroma-
tography: an analytical perspective. In: Sawicki, E., Mulik,
J.D., Wittgenstein, E. (Eds.), Ion Chromatographic Anal-
ysis of Environmental Pollutants. Ann Arbor Science
Publishers Inc, Ann Arbor, MI, pp. 17–29.
1040 W.E. Wilson et al. / Chemosphere 49 (2002) 1009–1043
Roberts, P.T., Friedlander, S.K., 1976. Analysis of sulfur in
deposited aerosol particles by vaporization and flame
photometric detection. Atmospheric Environment 10, 403–
408.
Rogge, W.F., Hildemann, L.M., Mazurek, M.A., Cass, G.R.,
1991. Sources of fine organic aerosol. 1. Charbroilers and
meat cooking operations. Environmental Science and
Technology 25, 1112–1125.
Rogge, W.F., Mazurek, M.A., Hildemann, L.M., Cass, G.R.,
Simoneit, B.R.T., 1993a. Quantification of urban organic
aerosols at a molecular level: identification, abundance and
seasonal variation. Atmospheric Environment 27A, 1309–
1330.
Rogge, W.F., Hildemann, L.M., Mazurek, M.A., Cass, G.R.,
Simoneit, B.R.T., 1993b. Sources of fine organic aerosol. 2.
Noncatalyst and catalyst-equipped automobiles and heavy-
duty diesel trucks. Environmental Science and Technology
27, 636–651.
Rogge, W.F., Hildemann, L.M., Mazurek, M.A., Cass, G.R.,
Simoneit, B.R.T., 1993c. Sources of fine organic aerosol. 3.
Road dust, tire debris, and organometallic brake lining dust:
Roads as sources and sinks. Environmental Science and
Technology 27, 1892–1904.
Rogge, W.F., Hildemann, L.M., Mazurek, M.A., Cass, G.R.,
Simoneit, B.R.T., 1993d. Sources of fine organic aerosol. 4.
Particulate abrasion products from leaf surfaces of urban
plants. Environmental Science and Technology 27, 2700–
2711.
Rogge, W.F., Hildemann, L.M., Mazurek, M.A., Cass, G.R.,
Simoneit, B.R.T., 1993e. Sources of fine organic aerosol. 5.
Natural gas home appliances. Environmental Science and
Technology 27, 2736–2744.
Rosen, H., Hansen, A.D.A., Gundel, L.A., Novakov, T., 1978.
Identification of the optically absorbing component in
urban aerosols. Applied Optics 17, 3859–3861.
Rupprecht, G., Patashnick, H., Beeson, D.E., Green, R.N.,
Meyer, M.B., 1995. A new automated monitor for the
measurement of particulate carbon in the atmosphere. In:
Particulate Matter: Health and Regulatory Issues: Proceed-
ings of an International Specialty Conference; April; Pitts-
burgh, PA. Air and Waste Management Association
(AWMA) Publications, Pittsburgh, PA, pp. 309–319, VIP-
49.
Sakata, K., Kawabata, K., 1994. Reduction of fundamental
polyatomic ions in inductively coupled plasma mass spect-
rometry. Spectrochimica Acta 49B, 1027–1038.
Schauer, J.J., Rogge, W.F., Mazurek, M.A., Hildemann, L.M.,
Cass, G.R., Simoneit, B.R.T., 1996. Source apportionment
of airborne particulate matter using organic compounds as
tracers. Atmospheric Environment 30, 3837–3855.
Schmid, H., Laskus, L., Abraham, J.H., Baltensperger, U.,
Lavanchy, V., Bizjak, M., Burba, P., Cachier, H., Crow, D.,
Chow, J., Gnauk, T., Even, A., ten Brink, H.M., Giesen,
K.-P., Hitzenberger, R., Hueglin, C., Maenhaut, W., Pio,
C., Carvalho, A., Putaud, J.-P., Toom-Sauntry, D., Pux-
baum, H., 2001. Results of the ‘‘carbon conference’’
international aerosol carbon round robin test stage I.
Atmospheric Environment 35, 2111–2121.
Seinfeld, J.H., Pandis, S.N., 1998. Atmospheric chemistry and
physics: from air pollution to climate change. John Wiley &
Sons Inc, New York, NY.
Sem, G.J., Tsurubayashi, K., Homma, K., 1977. Performance
of the piezoelectric microbalance respirable aerosol sensor.
Journal of American Industrial Hygiene Association 38,
580–588.
Shah, J.J., Rau, J.A., 1991. Carbonaceous Methods Compar-
ison Study: Interlaboratory Round Robin Interpretation
Results. California Air Resources Board, Sacramento, CA.
Simon, P.K., Dasgupta, P.K., 1995. Continuous automated
measurement of the soluble fraction of atmospheric partic-
ulate matter. Analytical Chemistry 67, 71–78.
Simoneit, B.R.T., 1984. Organic matter of the troposphere: III.
Characterization and sources of petroleum and pyrogenic
residues in aerosols over the western United States. Atmo-
spheric Environment 18, 51–67.
Simoneit, B.R.T., Sheng, G., Chen, X., Fu, J., Zhang, J., Xu,
Y., 1991. Molecular marker study of extractable organic
matter in aerosols from urban areas of China. Atmospheric
Environment 25A, 2111–2129.
Sioutas, C., Koutrakis, P., Burton, R.M., 1994a. Development
of a low cutpoint slit virtual impactor for sampling ambient
fine particles. Journal of Aerosol Science 25, 1321–1330.
Sioutas, C., Koutrakis, P., Burton, R.M., 1994b. A high-
volume small cutpoint virtual impactor for separation of
atmospheric particulate from gaseous pollutants. Particu-
late Science and Technology 12, 207–221.
Sioutas, C., Koutrakis, P., Olson, B.A., 1994c. Development
and evaluation of a low cutpoint virtual impactor. Aerosol
Science and Technology 21, 223–235.
Sioutas, C., Koutrakis, P., Wang, P.Y., Babich, P., Wolfson,
J.M., 1999. Experimental investigation of pressure drop
with particle loading in Nuclepore filters. Aerosol Science
and Technology 30, 71–83.
Small, H., Stevens, T.S., Bauman, W.C., 1975. Novel ion
exchange chromatographic method using conductimetric
detection. Analytical Chemistry 47, 1801–1809.
Small, H., 1978. An introduction to ion chromatography. In:
Sawicki, E., Mulik, J.D., Wittgenstein, E. (Eds.), Ion
Chromatographic Analysis of Environmental Pollutants.
Ann Arbor Science Publishers Inc, Ann Arbor, MI, pp. 11–
21.
Smith, T.B., White, W.H., Anderson, J.A., Marsh, S., 1975.
The chemistry, dispersion and transport of air pollutants
emitted from fossil fuel power plants in California. Report
No. ARB 3-929. California Air Resources Board, Sacra-
mento, CA.
Solomon, P.A., Moyers, J.L., Fletcher, R.A., 1983. High-
volume dichotomous virtual impactor for the fractioniza-
tion and collection of particles according to aerodynamic
size. Aerosol Science and Technology 2, 455–464.
Solomon, P.A., Salmon, L.G., Fall, T., Cass, G.R., 1992.
Spatial and temporal distribution of atmospheric nitric acid
and particulate nitrate concentrations in the Los Angeles
area. Environmental Science and Technology 26, 1594–
1601.
Stahlschmidt, T., Schulz, M., Dannecker, W., 1997. Applica-
tion of total-reflection X-ray fluorescence for the determi-
nation of lead, calcium and zinc in size-fractionated marine
aerosols. Spectrochimica Acta B 52, 995–1001.
Stein, S.W., Turpin, B.J., Cai, X., Huang, P.F., McMurry,
P.H., 1994. Measurements of relative humidity-dependent
bounce and density for atmospheric particles using the
W.E. Wilson et al. / Chemosphere 49 (2002) 1009–1043 1041
DMA-impactor technique. Atmospheric Environment 28,
1739–1746.
Stevens, R.K., O�Keefe, A.E., Ortman, G.C., 1969. Absolute
calibration of a flame photometric detector to volatile sulfur
compounds at sub-part-per-million levels. Environmental
Science and Technology 3, 652–655.
Stevens, R.K., Mulik, J.D., O�Keeffe, A.E., Krost, K.J., 1971.
Gas chromatography of reactive sulfur gases in air at the
parts-per-billon level. Analytical Chemistry 43, 827–831.
Stevens, R.K., McClenny, W.A., Dzubay, T.G., Mason, M.A.,
Courtney, W.J., 1982. Analytical methods to measure the
carbonaceous content of aerosols. In: Wolff, G.T., Klimisch,
R.L. (Eds.), Particulate carbon: atmospheric life cycle.
Plenum Publishing Corp, New York, NY, pp. 111–129.
Streit, N., Weingartner, E., Zellweger, C., Schwikowski, M.,
Gaggeler, H.W., Baltensperger, U., 2000. Characterization
of size-fractionated aerosol from the Jungfraujoch (3580 m
asl) using total reflection X-ray fluorescence (TXRF).
International Journal of Environmental and Analytical
Chemistry 76, 1–16.
Suggs, J.C., Burton, R.M., 1983. Spatial characteristics of
inhalable particles in the Philadelphia metropolitan area.
Journal of the Air Pollution Control Association 33, 688–
691.
Sutherland, J.L., Bhardwaja, P.S., 1987. Composition of the
aerosol in northern Arizona and southern Utah. In:
Bhardwaja, P.S. (Ed.), Transactions, Visibility Protection:
Research and Policy Aspects. Air Pollution Control Asso-
ciation, Pittsburgh, PA, pp. 373–385.
Tang, I.N., 1980. Deliquescence properties and particle size
change of hygroscopic aerosols. In: Willeke, K. (Ed.),
Generation of Aerosols and Facilities for Exposure Exper-
iments. Ann Arbor Science Publishers Inc, Ann Arbor, MI,
pp. 153–167.
Tan, S.H., Horlick, G., 1986. Background spectral features in
inductively coupled plasma mass spectrometry. Applied
Spectroscopy 40, 445–460.
Tanner, R.L., D�Ottavio, T., Garber, R.W., Newmann, L.,
1980. Determination of ambient aerosol sulfur using a
continuous flame photometric detection system. Part I,
Sampling system for aerosol sulfate and sulfuric acid.
Atmospheric Environment 14, 121–127.
Tanner, R.L., Gaffney, J.S., Phillips, M.F., 1982. Determina-
tion of organic and elemental carbon in atmospheric aerosol
samples by thermal evolution. Analytical Chemistry 54,
1627–1630.
Tarter, J.G. (Ed.), 1987. Ion Chromatography. Marcel Dekker,
New York, NY.
Thienpont, L.M., van Nuwenborg, J.E., St€oockl, D., 1994. Ion
chromatography as potential reference methodology for the
determination of total calcium and magnesium in human
serum. Analytical Chemistry 66, 2404–2408.
Tolocka, M.P., Peters, T.M., Vanderpool, R.W., Chen, F.L.,
Wiener, R.W., 2001. On the modification of the low flow-
rate PM10 dichotomous sampler inlet. Aerosol Science and
Technology 34, 407–415.
T€oor€ook, S.B., L�aab�aar, J., Schmeling, M., van Grieken, R.E., 1998.
X-ray spectrometry. Analytical Chemistry 70, 495R–518R.
Tsai, C.J., Cheng, Y.H., 1995. Atmospheric aerosol sampling
by an annular denuder system and a high-volume PM10
sampler. Environment International 21, 283–291.
Tsai, C.J., Cheng, Y.H., 1996. Comparison of two ambient beta
gauge PM10 samplers. Journal of Air and Waste Manage-
ment Association 46, 142–147.
Turner, J.R., Hering, S.V., 1987. Greased and oiled substrates
as bounce-free impaction surfaces. Journal of Aerosol
Science 18, 215–224.
Turner, D.B., 1994. Workbook of Atmospheric Dispersion
Estimates––An Introduction to Dispersion Modeling. CRC
Press Inc, Boca Raton, FL.
Turpin, B.J., Cary, R.A., Huntzicker, J.J., 1990a. An in situ,
time-resolved analyzer for aerosol organic and elemental
carbon. Aerosol Science and Technology 12, 161–171.
Turpin, B.J., Huntzicker, J.J., Adams, K.M., 1990b. Intercom-
parison of photoacoustic and thermal-optical methods for
the measurement of atmospheric elemental carbon. Atmo-
spheric Environment 24A, 1831–1835.
Tyler, G., 1992. ICP vs. AA: How do you choose. Environ-
mental Laboratory, 31–34.
US Court of Appeals, District of Columbia Circuit, 1999.
American Trucking Associations, Inc. vs. US Environmen-
tal Protection Agency. 175 F3d 1027 (CA DC, 97-1440).
US Environmental Protection Agency, 1996. Air quality criteria
for particulate matter, report no. EPA/600/P-95/001abcF.
National Center for Environmental Assessment, US Envi-
ronmental Protection Agency, Research Triangle Park, NC.
US Environmental Protection Agency, 1999. Particulate matter
(PM2:5) speciation guidance. Final draft. Edition 1. Office of
Air Quality Planning and Standards, Research Triangle
Park, NC. Available from <www.epa.gov/ttn/amtic/files/
ambient/pm25/spec/specfinl.pdf [2000, October 11]>.
US Environmental Protection Agency, 2001. List of desig-
nated reference and equivalent methods. Available from
<http://www.epa.gov/ttn/amtic/files/ambient/criteria/repmlist.
pdf [05 March 02]>.
Wang, H.-C., John, W., 1987. Comparative bounce properties
of particle materials. Aerosol Science and Technology 7,
285–299.
Wang, H.-C., John, W., 1988. Characteristics of the Berner
impactor for sampling inorganic ions. Aerosol Science and
Technology 8, 157–172.
Wang, P.Y., 1997. Continuous Aerosol Mass Measurement by
Flow Obstruction. Harvard University School of Public
Health, Boston, MA.
Ward, M.D., Buttry, D.A., 1990. In situ interfacial mass
detection with piezoelectric transducers. Science 249, 1000–
1007.
Watson, J.G., Chow, J.C., McDade, C., Farber, R.J., Barr, S.,
1987. Suggested program plan for a SCENES Summer
Intensive Study. Report No. DRI 8523-003.1D2. Prepared
for Southern California Edison Co., Rosemead, CA, by
Desert Research Institute, Reno, NV.
Watson, J.G., Chow, J.C., Richards, L.W., Andersen, S.R.,
Houck, J.E., Dietrich, D.L., 1988a. The 1987–88 Metro
Denver Brown Cloud Air Pollution Study, vol. II: Mea-
surements. Report no. 8810.1F2. Prepared for 1987–88
Metro Denver Brown Cloud Study, Inc.; Greater Denver
Chamber of Commerce, Denver, CO, by Desert Research
Institute, Reno, NV.
Watson, J.G., Chow, J.C., Richards, L.W., Andersen, S.R.,
Houck, J.E., Dietrich, D.L., 1988b. The 1987–88 Metro
Denver Brown Cloud Air Pollution Study, vol. III: Data
1042 W.E. Wilson et al. / Chemosphere 49 (2002) 1009–1043
interpretation. Report no. DRI 8810.1. Prepared for 1987–
88 Metro Denver Brown Cloud Study, Inc., Greater Denver
Chamber of Commerce, Denver, CO, by Desert Research
Institute, Reno, NV.
Watson, J.G., Robinson, N.F., Chow, J.C., Henry, R.C., Kim,
B., Nguyen, Q.T., Meyer, E.L., Pace, T.G., 1990. Receptor
model technical series, v. III (1989 revision): CMB7 user�smanual. Research Triangle Park, NC: US Environmental
Protection Agency, Office of Air Quality Planning and
Standards; report no. EPA-450/4-90-004. Available from
<http://www.epa.gov/scram001/[19 February 2002]>.
Watson, J.G., Chow, J.C., Lu, Z., Gertler, A.W., 1993.
Particulate and gaseous organic receptor modeling for the
Southern California Air Quality Study. Report no. 8733.1F.
Prepared for California Air Resource Board, Sacramento,
CA, by Desert Research Institute, Reno, NV.
Watson, J.G., Chow, J.C., Lowenthal, D.H., Pritchett, L.C.,
Frazier, C.A., Neuroth, G.R., Robbins, R., 1994a. Differ-
ences in the carbon composition of source profiles for diesel-
and gasoline-powered vehicles. Atmospheric Environment
28, 2493–2505.
Watson, J.G., Chow, J.C., Lu, Z., Fujita, E.M., Lowenthal,
D.H., Lawson, D.R., 1994b. Chemical mass balance source
apportionment of PM10 during the Southern California Air
Quality Study. Aerosol Science and Technology 21, 1–36.
Watson, J.G., Chow, J.C., Moosm€uuller, H., Green, M.C.,
Frank, N.H., Pitchford, M.L., 1998a. Guidance for using
continuous monitors in PM2:5 monitoring networks. Report
no. EPA-454/R-98-012. US Environmental Protection
Agency, Research Triangle Park, NC.
Watson, J.G., Fujita, E.M., Chow, J.C., Zielinska, B., Rich-
ards, L.W., Neff, W.D., Dietrich, D., 1998b. Northern
Front Range Air Quality Study. Final report. Colorado
State University, Fort Collins, CO.
Watson, J.G., Chow, J.C., Frazier, C.A., 1999. X-ray fluores-
cence analysis of ambient air samples. In: Landsberger, S.,
Creatchman, M. (Eds.), Elemental Analysis of Airborne
Particles. Gordon and Breach, Newark, NJ, pp. 67–96.
Weber, R.J., Orsini, D., Daun, Y., Lee, Y.-N., Kotz, P.J.,
Brechtel, F., 2001. A particle-into-liquid collector for rapid
measurement of aerosol bulk chemical composition. Aero-
sol Science and Technology 35, 718–727.
Wedding, J.B., Weigand, M.A., 1993. An automatic particle
sampler with beta gauging. Journal of the Air and Waste
Management Association 43, 475–479.
Weiss, R.E., Waggoner, A.P., Charlson, R.J., Thorsell, D.L.,
Hall, J.S., Riley, L.A., 1979. Studies of the optical, physical,
and chemical properties of light absorbing aerosols. In:
Novakov, T. (Ed.), Proceedings: Conference on Carbona-
ceous Particles in the Atmosphere. Lawrence Berkeley
Laboratory, Berkeley, CA, p. 257.
Wesolowski, J.J., John, W., Devor, W., Cahill, T.A., Feeney,
P.J., Wolfe, G., Flocchini, R., 1977. Collection surfaces of
cascade impactors. In: Dzubay, T.G. (Ed.), X-ray Fluores-
cence Analysis of Environmental Samples. Ann Arbor
Science Publishers Inc, Ann Arbor, MI, pp. 121–131.
Wetzel, R.A., Pohl, C.A., Riviello, J.M., MacDonald, J., 1985.
Ion chromatography. In: MacDonald, J. (Ed.), Inorganic
Chromatography. John Wiley and Sons Inc, New York,
NY.
Whitby, K.T., Charlson, R.E., Wilson, W.E., Stevens, R.K.,
1974. The size of suspended particle matter in air. Science
183, 1098–1099.
Whitby, K.T., 1978. The physical characteristics of sulfur
aerosols. Atmospheric Environment 12, 135–159.
Wilson, W.E., Suh, H.H., 1997. Fine particles and coarse
particles: concentration relationships relevant to epidemio-
logic studies. Journal of the Air and Waste Management
Association 47, 1238–1249.
Winkler, P., 1974. Relative humidity and the adhesion of
atmospheric particles to the plates of impactors. Journal of
Aerosol Science 5, 235–240.
Wolff, G.T., Groblicki, P.J., Cadle, S.H., Countess, R.J., 1982.
Particulate carbon at various locations in the United States.
In: Wolff, G.T., Klimisch, R.L. (Eds.), Particulate Carbon:
Atmospheric Life Cycle. Plenum Press, New York, NY,
pp. 297–315.
Yamamoto, M., Kosaka, H., 1994. Determination of nitrate in
deposited aerosol particles by thermal decomposition and
chemiluminescence. Analytical Chemistry 66, 362–367.
Zeng, X., Wu, X., Yao, H., Yang, F., Cahill, T.A., 1993. PIXE-
induced XRF with transmission geometry. Nuclear Instru-
ments and Methods in Physics Research B 75, 99–104.
Zhang, X., McMurry, P.H., 1987. Theoretical analysis of
evaporative losses from impactor and filter deposits.
Atmospheric Environment 21, 1779–1789.
Zhang, X.Q., McMurry, P.H., 1992. Evaporative losses of fine
particulate nitrates during sampling. Atmospheric Environ-
ment 26A, 3305–3312.
Zielinska, B., Fujita, E.M., 1994. Organic gas sampling.
In: Markert, B. (Ed.), Environmental Sampling for
Trace Analysis. VCH Publishers, New York, NY, pp. 163–
184.
Zoller, W.H., Gordon, G.E., 1970. Instrumental neutron
activation analysis of atmospheric pollutants utilizing
Ge(Li) c-ray detectors. Analytical Chemistry 42, 257–257.
W.E. Wilson et al. / Chemosphere 49 (2002) 1009–1043 1043