solution structure and tandem dna recognition of the c-terminal effector domain of pmra from...
TRANSCRIPT

Solution structure and tandem DNA recognitionof the C-terminal effector domain of PmrAfrom Klebsiella pneumoniaeYuan-Chao Lou1y Iren Wang2y M Rajasekaran1 Yi-Fen Kao1 Meng-Ru Ho2
Shang-Te Danny Hsu2 Shan-Ho Chou34 Shih-Hsiung Wu2 and Chinpan Chen14
1Institute of Biomedical Sciences 2Institute of Biological Chemistry Academia Sinica Taipei 115 3Institute ofBiochemistry and 4Agricultural Biotechnology Center National Chung Hsing University Taichung 40227 TaiwanRepublic of China
Received October 8 2013 Revised and Accepted December 3 2013
ABSTRACT
Klebsiella pneumoniae PmrA is a polymyxin-resist-ance-associated response regulator The C-terminaleffectorDNA-binding domain of PmrA (PmrAC) rec-ognizes tandem imperfect repeat sequences on thepromoters of genes to induce antimicrobial peptideresistance after phosphorylation and dimerization ofits N-terminal receiver domain (PmrAN) Howeverstructural information concerning how phosphoryl-ation of the response regulator enhances DNArecognition remains elusive To gain insights wedetermined the nuclear magnetic resonancesolution structure of PmrAC and characterized theinteractions between PmrAC or BeF3
-activatedfull-length PmrA (PmrAF) and two DNA sequencesfrom the pbgP promoter of K pneumoniae Weshowed that PmrAC binds to the PmrA box whichwas verified to contain two half-sites 50-CTTAAT-30
and 50-CCTAAG-30 in a head-to-tail fashion withmuch stronger affinity to the first than the secondsite without cooperativity The structural basis forthe PmrACndashDNA complex was investigated usingHADDOCK docking and confirmed by paramagneticrelaxation enhancement Unlike PmrAC PmrAF rec-ognizes the two sites simultaneously and specific-ally In the PmrAFndashDNA complex PmrAN maymaintain an activated homodimeric conformationanalogous to that in the free form and the inter-actions between two PmrAC molecules aid inbending and binding of the DNA duplex for tran-scription activation
INTRODUCTION
Bacteria are highly adaptive organisms whose genomesharbor many genes and pathways for sensing and re-sponding to environmental cues The two-componentsystem (TCS) is one of the major ways of coupling envir-onmental stimuli to adaptive responses (1) A classicalTCS typically consists of a transmembrane sensor histi-dine kinase (HK) and a cytoplasmic response regulator(RR) protein After perceiving external stimuli by thesensor domain of the HK a phosphoryl group on ahighly conserved His residue of the HK is auto-generatedand then transferred to the conserved Asp residue on itscognate RR protein to elicit adaptive responses In patho-gens a number of TCSs are integrated and required forpersistence in response to a wide range of stressors andenvironments and for providing virulence in host cells(2ndash4) TCSs are ubiquitous in bacteria but absent inmammals so bacterial TCSs are potent targets for drugdesign especially those that control virulence such as thePmrAPmrB TCS (5)
Gram-negative bacteria resist being killed by antimicro-bial peptides and avoid detection by host immune systemsoften by modifying lipopolysaccharide (LPS) in their outermembrane The PmrAPmrB TCS is the major regulatorof genes for LPS modification in bacteria (6) The RRPmrA is activated when its cognate HK PmrB sensesexcess Fe3+ Al3+ and mild acidic environments (7ndash9)Also at low Mg2+ concentration PhoPPhoQ anothervirulence TCS promotes the expression of a connectorprotein PmrD (10) which can prevent the intrinsicdephosphorylation of phospho-PmrA and enhance the ex-pression of PmrA-activated downstream genes (11) Thegenes activated by PmrA including pbgPE cptA and ugd
To whom correspondence should be addressed Tel +886 2 2785 5696 (ext 7101) Fax +886 2 2788 9759 Email shwugatesinicaedutwCorrespondence may also be addressed to Dr Chinpan Chen Tel +886 2 2652 3035 Fax +886 2 2788 7641 Email bmchinpibmssinicaedutw
yThese authors contributed equally to the paper as first authors
4080ndash4093 Nucleic Acids Research 2014 Vol 42 No 6 Published online 25 December 2013doi101093nargkt1345
The Author(s) 2013 Published by Oxford University PressThis is an Open Access article distributed under the terms of the Creative Commons Attribution License (httpcreativecommonsorglicensesby30) whichpermits unrestricted reuse distribution and reproduction in any medium provided the original work is properly cited
can encode enzymes to alter the composition of LPSwhich increases the bacterial resistance to polymyxin Band other host-derived antimicrobial peptides (712) orallows for bacterial survival within macrophages (13)However in addition to playing important roles in anti-microbial peptide resistance PmrA was also found to limitSalmonella virulence by repressing the type-3 secretionsystem SpiSsa (14) which translocates effector proteinsinto and across the phagosomal membrane (15) and isnecessary for bacterial survival within macrophages (16)Thus the PmrAPmrB TCS has two distinct contraryfunctions one to modify LPS to increase bacterial resist-ance to antimicrobial peptides and another as anantivirulence factor The antivirulence function of PmrAmay limit the acute phase of Salmonella infection therebyenhancing pathogen persistence in host tissues (14)
Klebsiella pneumoniae is a common cause of nosocomialbacterial infections causing pneumonia and urinary tractinfections especially in immuno-compromised patients(17) The increasing antibiotic resistance of K pneumoniaeemphasizes the importance of investigating how virulenceand drug resistance persists through the PmrAPmrBTCS Klebsiella pneumoniae PmrA which belongs to theOmpRPhoB subfamily and has about 76 sequenceidentity to Escherichia coli and Salmonella PmrA(Supplementary Figure S1) is composed of anN-terminal receiver domain (PmrAN) and a C-terminaleffectorDNA-binding domain (PmrAC) The activationof the RR in the OmpRPhoB subfamily is initiated byphosphorylation of the Asp residue in the N-terminalreceiver domain This phosphorylation induces the forma-tion of a head-to-head dimer in the N-terminal domain bya conserved a4 -b5-a5 interface accompanied by thebinding of a C-terminal effectorDNA-binding domainto the imperfect or perfect tandem repeat sequences onthe promoters of target genes
The structures of a large number of effector and receiverdomains have been determined (18) However the struc-tures of the activated full-length OmpRPhoB subfamilyRR in free conformation or in complex with DNA areunknown The structures of several inactive OmpRPhoB subfamily members are all in a monomeric statewith different domain arrangements (19ndash22) Some struc-tures have extensive interfaces between N-terminal andC-terminal domains and others do not The recognitionhelices of some inactive RRs are occluded whereas thosein other RRs are exposed Moreover the C-terminalDNA-binding domain of PhoB (PhoBC) binds to DNAas a head-to-tail dimer (23) whereas that of OmpR cancontact DNA in head-to-tail or head-to-head orientations(2425) These studies imply more divergent regulatorymechanisms in the OmpRPhoB subfamily Hence struc-tural studies of activated full-length RR and its DNAbinding are crucial
Previously we determined the solution structure ofK pneumoniae PmrD and the X-ray structure ofK pneumoniae PmrAN activated with the phosphorylanalog beryllofluoride (BeF3
-) and characterized theirinteractions by NMR and several other biophysicalmethods (2627) In this study we focused on theC-terminal DNA-binding domain We verified the
PmrAC binding sequences on the pbgP promoter ofK pneumoniae and analyzed their interactions withPmrAC or BeF3
-activated full-length PmrA (PmrAF)We determined the solution structure of PmrAC and theresidues involved in DNA recognition The structuralbasis of PmrACndashDNA interactions were modeled byHADDOCK and verified by nuclear magnetic resonance(NMR) paramagnetic resonance enhancement with spin-labeling of two thymines Finally we characterized theinteraction between PmrAF and box1 DNA by NMRand proposed the structural events for PmrA activationand DNA recognition
MATERIALS AND METHODS
Preparation of recombinant proteins and oligonucleotides
The DNA fragments encoding full-length PmrA andPmrAC the C-terminal fragment from residues Asn121 toGlu223 of PmrA were cloned into a vector pET-29b(+)(Novagen) in E coli strain BL21(DE3) with an extraMet residue at the N-terminus and an additionalLEHHHHHH tag at the C-terminus for purificationThe mutants were generated by the QuickChange site-directed mutagenesis protocol (Stratagene) and confirmedby DNA sequencing For full-length PmrA two residueswere mutated (Trp181 to Gly and Ile220 to Asp) to improvesolubility The DNA-binding abilities of the wild-type andmutated full-length PmrA were similar (data not shown)For 15N13C- or 15N13C2H-labeled protein samples cellswere grown in H2O or D2O containing M9 minimalmedium supplemented with 15NH4Cl and
13C-glucose at37C The cells were disrupted by use of an M-110 Smicrofluidizer (Microfluidics) Recombinant protein waspurified by use of nickel-nitrilotriacetic acid affinity resin(Qiagen Hilden Germany) The purity of samples waschecked with use of coomassie blue-stained sodiumdodecyl sulphate (SDS) polyacrylamide gel and wasgt95 Full-length PmrA was activated by BeF3
- asdescribed previously (27)The oligonucleotides used for NMR fluorescence po-
larization and isothermal titration calorimetry were fromMDBio Inc (Taiwan) The denominations and sequencesare box1 (50-ATTTCTTAATATTATCCTAAGCAAG-30) box1a (50-AATTTCTTAATATTAT-30) box1b (50-ATTATCCTAAGCAAGG-30) box2 (50-TCATTTTAATTTCGTTTAAGTCCG-30) box2a (50-TCATTTTAATTT-30) and box2b (50-CGTTTAAGTCCG-30) with thePmrA binding sites underlined Double-stranded DNAwas prepared by mixing an equal amount of two comple-mentary oligonucleotides in 20mM sodium phosphateand 30mM NaCl at pH 60 heating to 95C for 30minand cooling slowly to room temperature Double-strandedDNA for NMR was further purified on a Mono-Q 550GL column (Amersham Biosciences) with elution by NaClconcentration gradient from 01 to 1M The concentra-tions of DNA and proteins were calculated by ultraviolet(UV) absorbance at 260 and 280 nm respectively with anND-100 UV-Vis spectrophotometer (NanoDropTechnologies Inc)
Nucleic Acids Research 2014 Vol 42 No 6 4081
Fluorescence polarization measurements
For fluorescence polarization experiments the oligo-nucleotides were labeled with 6-carboxyfluorescein(6-FAM) at the 50 position Double-stranded DNA wastreated as previously described The indicated amount ofproteins was added to the well containing 12 nM of6-FAM-labeled DNA in 20mM sodium phosphate and30mM NaCl at pH 60 Reactions were measured sixtimes by use of a SpectraMax Paradigm plate reader(Molecular Devices CA USA) with excitation wavelength485 nm and emission wavelength 535 nm Data wereanalyzed and plotted by use of GraphPad Prism 5 (SanDiego CA USA)
Isothermal titration calorimetry experiments
The samples of PmrAC and box2-related DNAs weredialyzed overnight against the same reservoir of isother-mal titration calorimetry (ITC) buffer [20mM sodiumphosphate 30mM NaCl and 05mM Ethylenediaminete-traacetic acid (EDTA) at pH 60] Box2b (1000 mM) wastitrated into PmrAC (75 mM) and 420 mM box2 wastitrated into 100 mM PmrAC Titrations of DNAs intobuffer were used as control experiments All titrationswere performed on a MicroCal iTC200 microcalorimeterat 25C For each titration 2 ml titrant was injected 15ndash20times at 3-min intervals Data were analyzed by use ofOrigin ITC Analysis (MicroCal Software NorthamptonMA USA)
Circular dichroism analysis
The purified PmrAC protein (15 mM in 20mM phosphatebuffer) was analyzed at 25C in a 1-mm path-lengthcuvette on an Aviv 202 CD spectrometer (LakewoodNJ USA) calibrated with d-10-camphorsulfonic acidThe steady-state circular dichroism (CD) spectra wererecorded three times from 190 to 260 nm with wavelengthsteps of 05 nm and average time of 2 s or from 320 to240 nm with wavelength steps of 05 nm and averagetime of 10 s The equilibrium GdnHCl-denaturation ex-periment involved measuring the changes in CD signalsat 216 nm from 0 to 6M at 01 -M intervals and 2minfor equilibrium at 25C The denaturation curve wasfitted to the two-state equation (28) as F=(aN+bN[GdnHCl])+(aD+bD[GdnHCl]) exp[m([GdnHCl][D]50)RT] 1+ exp[m([GdnHCl][D]50)RT]where F is the CD signal aN is the CD signal at 0MGdnHCl bN=daNd[GdnHCl] aD and bD are the cor-responding quantities for the denaturation state [D]50 isthe GdnHCl concentration at which the protein is 50unfolded and m is the slope The free energy of unfoldingis given by G=m [D]50 The CD spectra were dis-played and analyzed by use of SigmaPlot 802 (SPSS IncChicago IL USA)
NMR and resonance assignment
All NMR spectra were acquired at 298K on BrukerAVANCE 600 800 or 850MHz spectrometers equippedwith a z-gradient TXI cryoprobe (Bruker KarlsruheGermany) The NMR sample of PmrAC consisted of
08mM protein in 20mM sodium phosphate and 30mMNaCl at pH 6 For PmrACndashDNA complex samples02ndash05mM PmrAC and 2-fold of DNA were incubatedin the same buffer of free PmrAC The heteronuclearNMR spectra for resonance assignment of PmrAC wereobtained as described (29) Assignments of the main-chain15N 1HN 13Ca 13Cb and 13C0 chemical shifts of PmrAC
and PmrACndashDNA complexes were based on NHCACBCBCA(CO)NH HNCO and HN(CA)CO spectraAssignment of PmrAC side-chain resonances was basedon 1H-15N TOCSY-HSQC 1H-13C HCCH-TOCSYCC(CO)NH and HBHA(CO)NH spectra Aromatic res-onances of PmrAC were assigned with use of 2D 1H-13CHSQC HBCBCGCDHD HBCBCGCDCEHE andNOESY spectra The weighted chemical shift perturb-ations for backbone 15N and 1HN resonances were cal-culated by the equation d=[(dHN)
2+(dN5)2]205
To measure residual dipolar couplings the filamentousbacteriophage Pf1 (8mgml Asla Biotech Ltd Latvia)was added into PmrAC as the orienting medium and 2D1H-coupled (F1) IPAP 1H-15N HSQC spectra wereacquired with 256 complex t1 (15N) points and 128 scansper t1 increment for both the isotropic and anisotropicconditions All NMR spectra were processed by use ofNMRPipe (30) and analyzed by use of NMRView (31)
PmrAC structure calculation and analysis
Nuclear Overhauser effect (NOE) distance restraints werederived from a 3D 15N-edited NOESY-HSQC spectrum(150ms mixing time) and 13C-edited NOESY-HSQCspectrum (150ms mixing time) Peak intensities were clas-sified as large medium small and very small correspond-ing to upper-bound interproton distance restraints of 2535 45 and 60 A respectively An additional correctionof 10 A was added for methylene and methyl groupsCalculation of backbone u c torsion angles involveduse of TALOS+ (32) and angles in good agreement withthe NOE correlations were used for structure calculationThe solution structures for PmrAC were determined with1071 distance restraints 82 hydrogen bonds restraints 130dihedral angle restraints 67 1DNH residual dipolarcoupling (RDC) constraints and the program XPLOR-NIH (33) The force constants and molecular parameterswere set to default values as in the original sa_newinpprotocol in XPLOR-NIH The backbone dihedral anglesof the final converged structures were evaluated by theRamachandran dihedral pattern of the PROCHECK-NMR program (34)
HADDOCK docking
The information drive docking program HADDOCK 20(35) was used to generate the PmrACndashbox1 complexmodel The starting structure for docking was a B-formmodel of the box1 DNA constructed with the InsightIIpackage (Accelrys Inc CA USA) and the lowest energystructure of PmrAC The residues with chemical shift per-turbations of amide resonances gt033 parts per million(ppm) and with high solvent accessibility (gt50) wereselected as active residues and the neighbors of theseactive residues were selected as passive residues For
4082 Nucleic Acids Research 2014 Vol 42 No 6
box1 DNA THY4 to ADE11 and CYT16 to CYT22which were all highly affected by titrating proteins(Figure 2C) were selected as active bases However theresulting models did not converge well due to the largerange of bases for protein binding To improve thedocking we need to lower the number of active basesBased on the experimentally verified PmrA boxes inSalmonella typhimurium (In Supplementary Figure S1 Kpneumoniae PmrA shares 91 sequence identity toSalmonella PmrA for the C-terminal region Leu151 toLeu216) only CYT5 to THY10 and CYT16 to GUA21were selected as active bases Four kinds of relative orien-tations of PmrAC molecules in complex with box1 DNAhead-to-head head-to-tail tail-to-head and tail-to-tailwere observed in the models The best clusters from fourorientations had similar HADDOCK scores and energiesand we could not tell which orientation is preferred Todetermine the protein orientation we carried out NMRparamagnetic relaxation enhancement (PRE) study whichsuggests the head-to-tail orientation The HADDOCKmodels with head-to-tail orientation were carefullychecked to find the possible bases that can interact withthe three Arg side-chains and with Gly211 (which per-turbed significantly in the presence of box1a) Finallythree sets of ambiguous interaction restraints (AIR) weredefined In the first set the selected active residues wereLys153 Thr187 Asn188 Thr189 Glu191 His193 and Ile194
and the neighbors of these residues were selected aspassive residues CYT5 to THY10 and CYT16 toGUA21 were selected as active bases In the second setthe AIR restraints were defined between the NeH ofArg171 Arg198 and Arg210 and box1 from ADE8 toTHY13 or ADE19 to ADE25 In the third set the AIRrestraints were defined as between the amide of Gly211 tothe phosphate backbone of THY40 to ADE41 for half1and THY28 to CYT30 for half2 Additional restraints tomaintain base planarity and WatsonndashCrick base pairingswere introduced for the DNA During the rigid bodyenergy minimization 10 000 structures were calculatedand the 200 best solutions based on the inter-molecularenergy were selected for the semiflexible simulated anneal-ing followed by explicit water refinement The best 200docked models were clustered by a cutoff of 35 A witha minimum of 10 structures in each cluster which yieldedsix clusters In terms of HADDOCK score and totalenergy the best 10 structures from the first cluster wereselected as the final models of the PmrACndashbox1 complex
NMR paramagnetic relaxation enhancement experiments
Spin labeling of DNA was achieved by introducing theEDTA-conjugated deoxythymidine (dT-EDTA) into aDNA sequence as described (36) The box1 DNA se-quences with dT-EDTA at THY4 or THY28 were fromMidland Certified Inc (TX USA) Purity and authority ofindividual DNA strands were verified by chromatographyand mass analysis Double-stranded DNA was annealedas mentioned previously For the paramagnetic stateDNA was mixed with an equal amount of MnCl2 andunderwent dialysis overnight to remove the free Mn2+For the diamagnetic state CaCl2 was added into the
DNA For the complex sample with dT-EDTA at T4the ratio of PmrAC to box1 DNA was 11 For thesample with dT-EDTA at T28 twice the amount ofPmrAC was mixed with the box1 DNA The 1H15N TROSY-HSQC spectra were acquired and the peakintensity of paramagnetic to diamagnetic state wascalculated
RESULTS
Confirmation of PmrA box on the pbgP promoter ofK pneumoniae
In S typhimurium the experimentally verified PmrAboxes the DNA sequences PmrA recognizes consist ofa half1 site lsquoCTTAAGrsquo and a half2 site lsquoXTTAATrsquo (Xcan be any nucleotide) separated by five base pairs (37)Also DNase footprinting experiments with the PmrAprotein from Salmonella enterica (In SupplementaryFigure S1 K pneumoniae PmrA shares 91 sequenceidentity to Salmonella PmrA for the C-terminal regionLeu151 to Leu216) demonstrated specific binding to thepbgP promoter at the predicted PmrA box (TCTTAATATTATCCTAAGC half1 and half2 sites underlined)(38) From these studies we analyzed the sequence ofthe K pneumoniae genome NTHU-K2044 (3940) andidentified a same PmrA box on the promoter of pbgPgene (at 170 position relative to the pbgP start codon)termed box1 (Figure 1A) At 90 position we alsoidentified another fragment termed box2 whichcontains two possible binding sites lsquoTTTAATrsquo and lsquoTTTAAGrsquo separated by four base pairs (Figure 1A) To de-termine which fragment was the PmrA box wesynthesized six oligonucleotides including box1 box2and the sequences covering the half1 and half2 sites ofbox1 and 2 and characterized their binding affinity toPmrACWe used ITC experiments to investigate the interactions
between PmrAC and the six oligonucleotides Howeverthe measurement was hindered by severe aggregatesduring the process of titrating high-concentrated box1-related DNAs into PmrAC We performed fluorescencepolarization experiments to monitor the binding betweenfluorescence-labeled box1-related DNA sequences andPmrAC The binding curves of PmrAC with box1a andbox1b were fitted by a single-site binding model PmrAC
bound strongly to box1a with Kd 013plusmn001mM andweakly to box1b with Kd 93plusmn15mM (Figure 1B) Thebinding between PmrAC and box1 (Figure 1C) showed adifferent binding curve which qualitatively appeared as atwo-site binding event An extra-sum-of-squares F-testwas performed to compare the goodness-of-fit of two-site and one-site binding models The test showed thatbox1 contained two distinct PmrAC binding sites(F=1467 Plt 00001) with Kd 019plusmn001 and151plusmn37 mM similar to those with box1a and box1bbinding respectively suggesting that PmrAC binds tothe two sites separately without cooperativityThe thermodynamics of the interactions between
PmrAC and box2-related DNAs were successfullyrevealed by ITC with the exception of box2a which is
Nucleic Acids Research 2014 Vol 42 No 6 4083
strongly endothermic when titrating into buffer (data notshown) PmrAC bound with 11 stoichiometry to box2b(Figure 1D) and with 21 stoichiometry to box2(Figure 1E) The formations of the two complexes wereboth enthalpically driven and were fitted to the one-sitebinding model The Kd values for PmrACndashbox2b were365plusmn94 mM and PmrACndashbox2 097plusmn013 mM Thebinding affinity was 37 times stronger to box2 than tobox2b which suggests positive cooperativity between thetwo PmrAC molecules in box2 bindingThe interactions between PmrAC and box2-related
DNA were all weaker than those between PmrAC andbox1-related sequences which agreed with foot-printingresults (38) The box1 sequence which contains two ca-nonical PmrAC binding sites separated by five base pairswas verified to be the PmrA box on the promoter of pbgPgene from K pneumoniae However the positivecooperativity in box2 binding implies that two PmrAC
molecules can have inter-molecular interactions toenhance DNA bindingWe investigated the interaction between PmrAF and
box1 by fluorescence polarization (Figure 1C) and founda one-site binding curve with Kd value 450plusmn23 nMwhich is about 3-fold stronger than PmrAC and box1abinding Therefore PmrAF recognizes the two half-sitessimultaneously and PmrA activation can increase theaffinity for target DNA which was suggested for severalregulators from the OmpRPhoB family (254142) andconfirmed here
PmrAC and PmrAF recognize tandem DNA withdifferent modes
To investigate the DNA recognition mode of PmrAC andPmrAF we examined the changes in DNA on proteinbinding by NMR 1D spectra Figure 2A shows the 1DNMR spectra for imino protons of box1 at differentratios of PmrAC to DNA With ratio of protein to DNA(PD) 05 the intensity of imino protons of DNA at the
half2 site (eg GUA21 GUA29 GUA34 and GUA35)were similar to those for free DNA but the intensity ofthose at the half1 site (eg THY6 THY7 and GUA46)was reduced significantly which indicates that PmrAC
binds to half1 first As the PD ratio increased to 1 theimino signals for THY6 and GUA46 decreased to aminimum but did not decrease substantially when theratio was increased to 2 However the imino signals forhalf2 (GUA35 GUA34 and GUA21) continued to shiftwith PD ratio from 1 to 2 which suggests that with thisratio PmrAC binds to the half2 site and this binding is in afast exchange regime
Differently with titrations of PmrAF into box1(Figure 2B) the signals of all imino protons decreasedwith increasing PD ratio from 0 to 2 and the resonancesof imino protons in the half2 site did not shift as severelyas they did with PmrAC titration So unlike PmrACPmrAF can form a stable contact with the half2 site Toclarify the differences between the two titrations weplotted the intensity ratio for each imino signal at PDratio 05 to 0 (Figure 2C) The reduction in half1 iminosignals was similar with both titrations but the reductionin signals for half2 bases was greater with PmrAF thanPmrAC titration Also the imino signals for THY3 andTHY27 decreased severely only with the PmrAF titrationwhich suggests that the binding of PmrAF may bend ordeform box1 DNA thus leading to instability of basepairing in the 50- and 30-ends and the reduced THY3and THY27 imino signals NMR titrations showed thatPmrAC binds to only half1 site specifically and PmrAF
recognizes the two half-sites specifically and simultan-eously which agrees with the binding behavior probedby fluorescence polarization
Structural changes to DNA on protein binding
CD is a well-established technique for analysis of struc-tural changes to DNA induced by protein binding (43)The CD spectra showed that PmrAC binding caused
Figure 1 DNA recognition by PmrAC or PmrAF (A) The DNA sequences of box1 and box2 on the promoter region of K pneumoniae pbgP geneTheir positions relative to the pbgP start codon are labeled The first and second hexanucleotides are shown in bold and the synthesized DNAfragments are indicated (B) Fluorescence polarization experiments of binding of PmrAC and box1a or box1b sequence and (C) binding of PmrAC orPmrAF and box1 sequence (D) and (E) Isothermal titration calorimetry of binding of PmrAC and box2b and box2 respectively
4084 Nucleic Acids Research 2014 Vol 42 No 6
almost no intensity change or wavelength shift in signalsfor box1 (Figure 2D) However the CD signal at 273 nmdecreases from 256 milli-degree (free box1) to 226 milli-degree (the errors are around 01 milli-degree) when 2-foldof PmrAF is titrated into box1 (Figure 2E) ThereforePmrAF but not PmrAC binding caused box1 DNA tobend or deform slightly which agrees with the observa-tions in NMR titration
Solution structure of PmrAC
CD spectra for PmrAC at different pH values revealed thatPmrAC is well structured from pH 45 to 90(Supplementary Figure S2A) The free energy of proteinunfolding at pH 60 determined by GdnHCl denaturationfollowed by CD at 216 nm was 62 kcalmol(Supplementary Figure S2B) which suggests that PmrAC
forms a stable conformation under this conditionTherefore we acquired all NMR spectra with PmrAC atpH 60 In total 98 of backbone (only Asn121 is missingand not assigned) and 81 of side-chain atoms wereassigned The NMR structure of PmrAC was calculatedon the basis of 1071 distance restraints 130 dihedral anglerestraints and 67 RDC constraints by the simulated an-nealing protocol with the program XPLOR-NIH In thefinal stage of refinement we chose 15 structures with noNOE restraint violation gt03 A and no dihedral angle re-straint gt3 on the basis of lower total energy The final 15structures with a root mean square deviation (RMSD)044plusmn008 A for the backbone atoms and 110plusmn009 Afor the heavy atoms in the secondary structure regions areshown in Figure 3B The structural statistics for these 15structures are in Table 1 The fold of PmrAC shows awinged helix motif consisting of a four-stranded antipar-allel b-sheet (b1 Glu126-Val129 b2 Leu132-Asn135 b3Leu140-Leu143 and b4 Thr146-Leu148) three a-helices (a1Pro152-Met163 a2 Arg171-Tyr179 and a3 Leu190-Ile201) ashort 310 helix (Lys203-Arg205) and a C-terminal b-hairpin(b6 Ile206-Val209 and b7 Gly213-Leu216) flanked by a b-strand (b5 Val169-His170) (Figure 3A and B) In this struc-ture two negatively charged residues (Glu191 and Glu199)and one positively charged residue (Arg198) are located onthe a3 helix the DNA recognition helix These chargedresidues are stabilized by the formation of salt bridges(Glu191-Arg171 and Glu199-Arg198) in the free state(Figure 3C) Surface charge presentation shows that thea3 helix is surrounded with several positively chargedresidues (Figure 3D)
Mapping the DNA interaction site of PmrAC
We detected the DNA-binding site of PmrAC bymeasuring the chemical shift perturbations of backboneamide resonances and NeH resonances of the Argresidues (Figure 4A) of PmrAC with box1a binding Theweighted chemical shift perturbations of backbone amideresonances (Figure 4B) were calculated and mapped ontothe PmrAC structure (Figure 4C) The backbone amideresonances with significant chemical shift perturbationson box1a binding (dgtdaverage+SD 033 ppm) weremostly located at the a3 helix and the transactivation loopbetween a2 and a3 Also the amide of the wing residueGly211 showed the most significant downfield shift In thePhoBCndashDNA crystal structure the amide proton of thecorresponding Gly residue forms an H-bond with theDNA phosphate backbone Accordingly the significantdownfield shift of amide resonances of Gly211 forPmrAC in the complex state may originate from the de-shielding effect of the H-bond formationIn addition to backbone amides the NeH resonances of
three Arg side-chains were extensively perturbed in the
Figure 2 PmrAC and PmrAF recognize box1 DNA with differentmodes (A) 1D proton NMR spectra of imino signals of box1 at dif-ferent ratios of DNA to PmrAC (black 10 red 105 green 11 and blue12) The imino signals from THY3 to ADE24 were completelyassigned (B) 1D spectra of the titration of PmrAF into box1 DNAThe color representation is the same as in (A) (C) The intensity ratioof each imino signal at ratio of protein to DNA of 05 to 0 Blue barsare for the PmrAC complex and red are for the PmrAF complex Theoverlapped imino signals were not plotted and the sequence for box1DNA is shown below (D) and (E) CD spectra for box1 DNA at dif-ferent ratios of DNA to PmrAC and PmrAF respectively
Nucleic Acids Research 2014 Vol 42 No 6 4085
Table 1 Structural statistics for the final 15 PmrAC structures
A Constraints usedNMR restraints
Intraresidue (ji-jj=0) 299sequential (ji-jj=1) 350medium range (ji-jj 5 4) 247long range (ji-jjgt 4) 175total NOE distance restraints 1071hydrogen bonds 41 2dihedral angles 130
1DHN RDC restraints 67
B Statistics for the Final X-PLOR StructuresNo of structures in the final set 15X-PLOR energy (kcalmol1)
ENOE 2162plusmn254Ecdih 195plusmn036Ebond+Eangle+Eimproper 10425plusmn642EVDW 6828plusmn531
Mean global root mean square deviation (A)
Backbone (N Ca Crsquo)
Residuesa-helix 152ndash163 171ndash179 190ndash201 044plusmn008b-strands 126ndash129 132ndash135 140ndash143 146ndash148 169ndash170 206ndash209 213-216
Heavy atoms
Residuesa-helix 152ndash164 171ndash178 190ndash201 110plusmn009b-strands 126ndash129 132ndash135 140ndash143 146ndash148 166ndash169 206ndash209 213-216
Ramachandran dataResidues in most favored regions () 769Residues in allowed regions () 185Residues in generously allowed regions () 45Residues in disallowed regions () 01
Figure 3 NMR solution structure of K pneumoniae PmrAC (A) Amino acid sequence of PmrAC colored according to the secondary structures Theresidues in b-strand are in green a-helix in magenta and others in deep blue (B) Backbone presentation of the 15 lowest energy structures withsuperimposition of the backbone atoms (HN N Ca and Crsquo) in secondary structure regions The residues are colored as in (A) (C) Secondarystructures of the lowest energy structure of PmrAC in rainbow color from the N-terminus (blue) to the C-terminus (red) Two salt bridges in a3 helixare shown as magenta sticks with nitrogen and oxygen atoms in blue and red respectively (D) Surface charge representations of PmrAC Positivelycharged surface is in blue and labeled and negatively charged surface is in red
4086 Nucleic Acids Research 2014 Vol 42 No 6
presence of box1a DNA (inset in Figure 4A) The NeHresonances of Arg171 and Arg198 which were stabilized bysalt bridges in the free state shifted upfield in the presenceof box1a DNA which implies that the salt bridges weredisturbed by the DNA The NeH resonances of Arg210missing in the free form were detected in the complexstate which suggests that the interaction between NeHand DNA decreases the exchange rate with water From
the perturbations of backbone amide resonances and ArgNeH resonances the DNA-binding site of PmrAC consistsof the a3 helix the transactivation loop the C-terminalb-hairpin and some residues adjacent to these regions(Figure 4C)We detected the interactions between PmrAC and box1b
or box1 DNA sequences by NMR For the PmrACndashbox1bcomplex several residues in the a3 helix disappeared and
A
C
G211
E191
R171
R198R210
ppm
033
014
0
DN
ABinding Site
B
Residue
120 130 140 150 160 170 180 190 200 210 22000
02
04
06
08
10
12
14G211
E191
β1 β2 α1 7β6β5β4β3β α3α2
Δδ (
pp
m)
75 70 65 8
6 8
4 8
2 60
1H (ppm)
R210
R171
R198
15N
(p
pm
)
707580859095100105110
105
110
115
120
125
130
E172
G213
I201
S204
G123
G166 T187I178
T189S159
T222 G202
A165
R160I173L174
K164
K200
E154H193
V192
L140
R205L157S180
E199N176
D177
R139
L150 L132
K153
W181Y179
D182
A186N188
E191I194
G211
R207
L216R210
A147 A217V209
H170L134 E223
N135
T208
W142
R133V169 E145
V129K203R171
N131
D221A156
L148I127
D149L143
L190V136
Q122 L197N196S128R198
G144G130
M215Y155
M162Y175
T151
S167
N218L158N125
E126
I220M163
N219 T146
R138
N183
T137
L161
Y214E184
F212V141
I206
15N
(p
pm
)
1H (ppm)
H195D124
W142ε1
W181ε1
Figure 4 NMR investigations of PmrACndashDNA complexes (A) The regions of amide resonances and NeH resonances of Arg side-chains (inset) ofoverlaid 2D 1H 15N TROSY-HSQC spectra for PmrAC in the absence (black) or presence (red) of box1a DNA The amide resonances in complexstate are indicated (B) Weighted chemical shift perturbations for backbone 15N and 1HN resonances as calculated by the equationd=[(dHN)
2+(dN5)2]205 The solid black bar represents the d values for the box1a complex green x for box1 and orange x for box1b
The black line indicates 033 ppm (the mean d value of box1a complex plus 1 SD) (C) Structural mapping of chemical shift perturbations of thebox1a complex The residues with chemical shift perturbation gt033 ppm are in red lt014 ppm (the mean d value of the box1a complex) green and014 to 033 ppm blue The proline residues and the residues without data are in white The top two most-perturbed residues Gly211 and Glu191 areindicated Side-chains of the three Arg residues are shown as magenta sticks with nitrogen atoms in blue The DNA-binding site of PmrAC consistsof the a3 helix the transactivation loop the C-terminal b-hairpin and adjacent residues
Nucleic Acids Research 2014 Vol 42 No 6 4087
the weighted chemical shift perturbations of most of theresidues were smaller than those for the PmrACndashbox1acomplex (Figure 4B) Interestingly the PmrACndashbox1complex with ratio of protein to box1 of 21 containedonly one set of protein amide resonances which were veryclose to those in the PmrACndashbox1a complex (Figure 4B)We did not detect resonances from PmrAC binding withthe half2 site which may due to the intermediate exchangebetween PmrAC and the half2 site DNAWe also investigated the binding between PmrAC and
box2-related DNA sequences by NMR titration Upontitration of box2b DNA into 15N-labeled PmrACbackbone amide resonances moved continuously(Supplementary Figure S3A) which suggests that thebinding was on a fast-exchange time scale We used thetitration curves for PmrAC residues with significantchemical shift perturbations to determine the Kd valuesof box2b binding (Supplementary Figure S3B) whichwere in the range of 287ndash355 mM resembling the valuesfrom ITC analysis For the PmrACndashbox2 complex theresidues in the transactivation loop and the a3 helixwere missing suggesting intermediate exchange Weplotted the weighted chemical shift perturbations forbackbone amide resonances between the free andcomplex states with box2b and box2 in the function ofresidue number (Supplementary Figure S3C) InPmrACndashbox2 complex the residues at the a2 helix a3helix and C-terminal b-hairpin changed significantly butthis pattern of shift is quite different with the shift of box1binding suggesting that PmrAC binds to box1 and box2with different orientations Also the changes in chemicalshift were much smaller than for the box1 complex(Figure 3A) and the amide resonance of Gly211 couldnot be identified in the complex with box2b and box2DNA which suggests that Gly211 could not form astable H-bond with the phosphate backbone of box2DNA PmrAC may bind non-specifically to box2 DNAwhich agrees with Kd findings
The model of the PmrACndashbox1 complex
To gain insights into the structural basis of DNA recog-nition by PmrAC we generated a model of the PmrACndashbox1 complex using HADDOCK (35) The process ofHADDOCK docking is described in lsquoMaterials andMethodsrsquo section Briefly the lowest energy NMR struc-ture of PmrAC and the B-form DNA model of the box1sequence were used as initial structures for modeling theproteinndashDNA complex We defined two half-sitehexanucleotides as active bases The active residues ofPmrAC were defined as those with weighted chemicalshift perturbation gt033 ppm (daverage+SD 033 ppm)and high solvent accessibility (gt50) In addition wedefined AIR restraints between the amide proton ofGly211 and the phosphate backbone of DNA andbetween the side-chains of Arg171 Arg198 and Arg210
and the phosphate backbone or base of DNAAfter the HADDOCK docking protocol the final 200
water-refined complex structures were clustered based onthe pair-wise RMSD matrix using a 35 A cutoff andresulted in six different clusters Supplementary Figure S4
shows the top 10 structures from each cluster and their struc-tural statistics Cluster 1 is the best in terms of HADDOCKscore and energy The 10 structures with the lowest energyfrom this cluster were selected to examine possible inter-actions between PmrAC and box1 Basically the recognitionhelix a3 is inserted into the major grooves of two half-sitehexanucleotides for specific recognition and the wingcontacts the DNA in the minor groove (Figure 5A) Weplotted the inter-molecular H-bonds and hydrophobic inter-actions observed in more than 5 of the final 10 structures(Figure 5B) Basically the side-chains of Lys153 Thr187Asn188 His193 and His195 were responsible for DNA-specific H-bond interactions and the side-chains of Arg171Arg198 and Arg210 formed H-bonds with the DNA phos-phate backbone Non-bonded contacts were foundbetween Glu191 Val192 and box1 The amide proton ofGly211 although not forming an H-bond is close to thebackbone phosphate Interestingly we observed an inter-molecular salt bridge between Arg210 (PmrAC at half1)and Asp149 (PmrAC at half2) in 6 of the final 10 modelsalthough we did not add any restraints The observation ofmany inter-molecular interactions between PmrAC and half1DNA agrees well with the low Kd value (019plusmn001mM) forthis complex Also the model showed that the two PmrAC
molecules are too far away to form stable contacts whenbinding to straight box1 DNA
To validate the HADDOCK model we recorded theNMR inter-molecular PRE effects for 15N 2H-labeledPmrAC in the presence of box1 DNA with spin-labelingWe purchased two box1 sequences with dT-EDTA atTHY4 or THY28 (Midland Certified Inc TX USA) Inpreparing the complex sample for spin-labeling at THY4the amount of PmrAC to box1 was set at 1 to 1 With spin-labeling at THY28 box1 was incubated with twice theamount of PmrAC The TROSY-HSQC spectra for twocomplex samples were acquired at the paramagnetic state(EDTA chelated with Mn2+) and diamagnetic state(EDTA chelated with Ca2+) (Figure 6A) and thesespectra superimposed well with the spectra fromcomplex sample without spin-labeling on DNA suggest-ing spin-labeling at THY4 or THY28 does not affect theproteinndashDNA interaction The proportion of peakintensities measured as paramagnetic state to diamagneticstate (IparIdia) were calculated (Figure 6B and C)and mapped on the HADDOCK complex structure(Figure 6D) With spin-labeling at THY4 the residueclosest to Mn2+ was Asn196 (20 A) with an IparIdiavalue around zero The amide intensities of residues nearAsn196 were also severely attenuated The PRE effectswere smaller with spin-labeling at THY28 than atTHY4 because with the former PmrAC bound to thehalf1 site was too far to be affected by the spin-labelingand the binding affinity of PmrAC to the half2 site wasweak In the complex with spin-labeling at THY28IparIdia values were significantly decreased for residuesTrp181 to Asn188 and Arg210 to Phe212 and the distancesbetween these residues to Mn2+ chelated by EDTA atTHY28 were all lt31 A In summary the PRE effectsfrom spin-labeling at two different bases agreed wellwith the complex structure generated by HADDOCKdocking
4088 Nucleic Acids Research 2014 Vol 42 No 6
Box1 DNA recognition by PmrAF
To understand how dimerization of the N-terminalreceiver domain of the response regulator can enhancethe recognition of the C-terminal effector domain to itstarget DNA a structure of the full-length response regu-lator in complex with DNA is needed The protein databank contains many structures of C-terminal effector
domains with and without DNA yet no structure offull-length response regulator bound to DNA has beenpublished Hence in addition to studying PmrAC wealso investigated the interaction between PmrAF andbox1 DNA by NMR We successfully prepared thesample of 2H- 13C- and 15N-labeled PmrAF bound tobox1 with PD ratio of 2 The 1H 15N TROSY-HSQC
Figure 6 Inter-molecular PRE for the PmrACndashbox1 DNA complex (A) A portion of 2D 1H 15N TROSY-HSQC acquiring in the paramagneticstate (in red EDTA is chelated with Mn2+) overlaid with that in the diamagnetic state (in black EDTA is chelated with Ca2+) for PmrACndashbox1complex with dT-EDTA at THY4 (B) and (C) The ratios of peak intensity from the paramagnetic to diamagnetic state with dT-EDTA at THY4 andTHY28 respectively The proline and the severely overlapped residues are shown with gray bars In (B) the residues with intensity ratio lt05 are inred In (C) the residues with intensity ratio lt075 are in orange (D) The best structural model from HADDOCK colored according to the PREresults For spin-labeling at THY4 the Mn2+ and residues with intensity ratio lt05 are in red For spin-labeling at THY28 the Mn2+ and theresidues with intensity ratio lt075 are in orange The EDTA is shown with green sticks
T187
K153
N188
H193R210 D149
V192
E191R171
R198
H195
T187
K153
H193V192 N188
E191R171
R210
R198
H195
5
P
C
6
P
T
7
P
T
8
P
A
9
P
A
10
P
T
11
P
A
12
P
T
P
39
P
A
40
P
T
41
P
A
42
P
T
43
P
T
44
P
A
45
P
A
461
P
G
P5 3
H195
K153
Y179
T187
N188
R171
H193
R198
R210
5 3
29
P
30
P
C
31
P
T
32
P
T
33
P
A
34
P
G
35
P
G
P
16
P
C
17
P
C
18
P
T
19
P
A
20
P
A
21
P
G
22
P
C
P
K153
T187
H195
N188
H193
R198
R171
V192 E191
V192 E191
G
A B
R210
Y179
Figure 5 Structural model of PmrACndashbox1 DNA complex (A) The best complex model from HADDOCK docking with yellow surface display ofDNA and ribbon presentation of PmrAC showing that the a3 helix and the C-terminal b-hairpin fit into the major and minor groove of the DNArespectively The residues showing H-bond and non-bonded interactions with DNA are in blue and red respectively The inter-molecular salt bridgeidentified between the two PmrAC molecules is shown (B) Schematic presentation of the detailed interactions between the two PmrAC molecules andbox1 DNA identified in more than five of the best 10 models The H-bonds and non-bonded contacts are indicated by blue and red dotted linesrespectively
Nucleic Acids Research 2014 Vol 42 No 6 4089
spectrum for this complex revealed one set of resonancepeaks from the N-terminal receiver domain whichsuperimposed well with the spectrum for BeF3
-activatedPmrAN (Figure 7A) which indicates that the N-terminaldomain of PmrAF maintains an activated homodimericconformation comparable with the structure ofBeF3
-activated PmrAN in the absence of PmrAC andDNA (27) As well the N-terminal and C-terminaldomains do not seem to interact extensively so DNAbinding does not significantly perturb the N-terminaldomainUnlike the PmrACndashbox1 complex which exhibits only
one set of resonances similar to those in the PmrACndashbox1acomplex the C-terminal effector domain of the PmrAFndashbox1 complex showed two sets of resonance peaks forplenty of residues We overlaid this complex spectrumwith those from PmrACndashbox1a or PmrACndashbox1b
complexes and found that they were similar (Figure 7B)For example one of the Gly211 resonances superimposedwell with the peak from the PmrACndashbox1a complex andanother peak deviated slightly from that for the PmrACndashbox1b complex which suggests that one C-terminaleffector domain binds to the half1 site and anotherdomain recognizes the half2 site Also Leu216 whichexhibits overlapped amide resonances in complex withbox1a and box1b showed two amide resonances in thepresence of box1 Similar spectra were also observed onTrp142 The two residues are distant from the DNA-binding site and two sets of resonances may be causedby asymmetrical interactions between two tandemC-terminal domains in a head-to-tail arrangement whenbinding to box1 Therefore in the PmrAF dimer theN-terminal domain keeps a free-form-like conformationand the inter-domain interactions between two tandem
135
1
30
125
1
20
115
1
10
15N
(p
pm
) 1
05 A
1H (ppm) 11 10 9 8 7
135
1
30
125
1
20
115
1
10
15N
(p
pm
) 1
05
G211
I201
E172 R160
L216
W142
G166
S159
G213 B
Figure 7 NMR study of the PmrAFndashbox1 DNA complex (A) 2D 1H 15N TROSY-HSQC spectra for the PmrAFndashbox1 complex with ratio ofprotein to DNA of 21 shown in black and that of BeF3-activated PmrAN in green The good superimposition of the two spectra indicates that theN-terminal domain of PmrAF in the complex state shows the free-state-like homodimeric conformation (B) 2D 1H 15N TROSY-HSQC spectra forthe PmrAFndashbox1 complex (black) overlaid with that of PmrACndashbox1a complex (red) and PmrACndashbox1b complex (blue) Two sets of resonance peakswere observed for a number of residues in the C-terminal domain of PmrAF in complex with box1 and some are labeled
4090 Nucleic Acids Research 2014 Vol 42 No 6
C-terminal domains may increase their binding affinity tothe two half-sites on the box1 promoter DNA
The backbone resonance assignment of PmrAF incomplex with box1 DNA is not completed yet becauseof the molecular weight of this complex (70 kDa) andthe severe overlapping of peaks However the two setsof resonances observed on the C-terminal domainresidues indicate that NMR can detect the differencebetween the half1- and half2-bound structures whichimplies the feasibility of NMR structure determinationalong with X-ray crystallography
DISCUSSION
Structural features of PmrAC and PmrACndashbox1 complex
Klebsiella pneumoniae PmrAC has the structural topologyof b1 -b2-b3-b4-a1-b5-a2-a3-b6-b7 which is typicallyobserved for proteins in the OmpRPhoB superfamilySearch of the DALI database (44) produced hundreds ofhits with z-scoresgt 20 the top three were for DrrD(z-score=107) (19) YycF (z-score=106) (45) andPhoP (z-score=105) (46) The z-scores for the twowell-studied effector domains PhoB (23) and OmpR(47) were 95 and 77 respectively The sequence align-ment and structural comparison of PmrAC with theseproteins are in Supplementary Figure S5A and B respect-ively These proteins share only 8 sequence identity buttheir structures are similar The superimposition of Caatoms of secondary structural regions gives RMSDvalues of 176 222 206 234 239 and 283 A betweenPmrAC and DrrD (1KGS) YycF (2D1V) PhoP (2PMU)PhoB (1GXQ) PhoBndashDNA complex (1GXP) and OmpR(1OPC) respectively Interestingly the small 310 helixafter a3 was observed only for PmrAC and PhoBC butnot other effector domains
In PhoB the loop connecting a2 and a3 also called thetransactivation loop was found to be important for inter-acting with the RNA polymerase holoenzyme (48) Fourmutants (W184R G185R V190M and D192G) in thisloop were found to abolish the activation of transcriptionand three of them were involved with charged residuesRecently the complex structure for s4 -b-flapPhoBCndashpho box DNA was determined revealing that an acidicpatch (Glu177 and Glu191) on the transactivation loop ofPhoBC faces a patch of basic residues from the s4 helix a4(49) From these studies the acidic patch at the transacti-vation loop was found to be important for transcriptionactivation by PhoB In the structure of K pneumoniaePmrAC the transactivation loop also formed an acidicpatch by Glu172 Asp182 and Glu184 (SupplementaryFigure S5A) so the mechanism of transcription activationby K pneumoniae PmrA may be similar to that for PhoB
The HADDOCK model of the PmrACndashbox1 DNAcomplex reveals a good complementary fit betweenPmrAC and the major groove of DNA and suggestsseveral residues for base-specific interactions(Figure 5A) The a3 recognition helix has a major rolein interacting with distinct DNA sequences amongwinged-helix effector domains Therefore the keyresidues for specific DNA binding may be derived by
sequence alignment (Supplementary Figure S5A) inwhich the PmrA residues His193 His195 Asn196 andGlu199 on a3 are not conserved suggesting that theymay contribute to base-specific recognition In thecrystal structure of the PhoBCndashDNA complex (23)Arg201 forms a specific H-bond with guanine and Thr194
and Val197 form van der Waals contacts with thymines inboth half-sites Another specific H-bond is identifiedbetween Arg219 and bases between two half-sites Otherresidues on PhoBC form salt bridges or H-bonds withDNA phosphate backbone (Supplementary Figure S5C)In PmrA similar van der Waals contacts are observed andArg210 (the corresponding residue of Arg219) recognizesDNA phosphate backbone (Figure 5) However wecannot identify any interaction between Asn196 (the cor-responding residue of Arg201) and the DNA in two half-sites Instead in our model the residues His193 and His195
form H-bond interactions with the bases ADE44 andTHY43 respectively From the sequence alignmentand the comparison with the PhoBCndashDNA complex theresidues His193 and His195 are highly likely to be the de-terminants of PmrA base specificityThe arrangement of effector domains bound with two
half-sites is divergent The PhoB effector domain binds toDNA as a head-to-tail dimer (23) and that of OmpR cancontact DNA in both head-to-tail or head-to-head orienta-tions (2425) In the PhoBCndashDNA complex structure (23)the DNA bends by protein binding with extensive proteinndashprotein contacts between the C-terminal b-hairpin andC-terminal tail of the upstream protein and theN-terminal b-sheet of the downstream protein (head-to-tail) For the PmrACndashbox1 complex with successful spin-labeling on box1 DNA we concluded that two PmrAC
molecules bound to the two half-sites in a head-to-tailfashion (Figure 6) Moreover in the HADDOCKcomplex model (Figure 5) we observed an inter-molecularsalt bridge between Arg210 (in the C-terminal b-hairpin ofPmrAC at half1) and Asp149 (in the end of the N-terminalb-sheet of PmrAC at half2) Therefore althoughK pneumoniae PmrA has different residues for DNA-specific binding the head-to-tail domain arrangement forDNA recognition and the property of a transactivationloop are similar to those for PhoB so the two proteinsmay have a similar mechanism of transcription activation
How activation of PmrA enhances DNA recognition
Despite the abundance of information regarding thefunction of OmpRPhoB RRs a detailed picture of howactivated RRs bind to DNA and activate transcription islacking In the common activation mechanism of OmpRPhoB RR the phosphorylation of the conserved Aspresidue triggers the formation of a head-to-head dimer ofthe N-terminal receiver domain which will enhance thebinding of the C-terminal effectorDNA-binding domainto the imperfect or perfect tandem repeat sequences on thepromoters of target genes to activate transcription In thisstudy we demonstrate enhancedDNA recognition with thefull-length PmrA activated by the phosphoryl analogBeF3- The binding between PmrAC and box1 was firstmeasured by fluorescence polarization showing a
Nucleic Acids Research 2014 Vol 42 No 6 4091
two-site binding curve with two Kd values similar to thosewith box1a and box1b binding (Figure 1C) thereforePmrAC binds to the two half-sites separately without anycooperation As well the binding was weaker to the half2than half1 site The 1D NMR titration experiments furtherdemonstrated that PmrAC binds first to the half1 then thehalf2 site (Figure 2A) However for the interactionbetween PmrAF and box1 we found a one-site bindingcurve (Figure 1C) with 3-fold stronger binding affinitythan between PmrAC and box1a The 1D NMR titrationexperiments also showed that PmrAF recognizes the twohalf-sites specifically and simultaneously Why PmrAC
binds weakly to box1b (Kd=93plusmn15mM) but the sameC-terminal domains of PmrAF bind to the two half-siteswith much stronger affinity (Kd=450plusmn23 nM) remainsunclear Do the two C-terminal domains cooperate inPmrAFndashDNA bindingIn the binding of PmrAC to box2 the binding affinity of
PmrAC was 37 times stronger to box2 than box2b (Figure1D and E) which demonstrates positive cooperativitybetween the two PmrAC molecules The absence ofcooperativity in box1 binding and the positive cooperativityin box2 binding suggests that the cooperativity arises fromthe shorter nucleotide spacing (5 base pairs in box1 DNAand 4 base pairs in box2 DNA) which allows for extensiveinter-molecular interactions between the two PmrAC mol-ecules For the PmrAFndashbox1 complex although the twohalf-sites are separated by 5 base pairs CD studies sug-gested that the DNA is slightly bent (Figure 2D) whichshortened the distance between the two tandem PmrAC
molecules bound with box1 Our HADDOCK modelrevealed one inter-molecular salt bridge between twoPmrAC molecules bound with un-bending DNA Alsothe 1H 15N TROSY-HSQC spectra for PmrAF incomplex with box1 showed that the DNA-recognitionresidues as well as those far away from DNA-binding siteexhibit two resonance peaks (Figure 7B) that may originatefrom the asymmetrical interactions between two tandemC-terminal domains in a head-to-tail orientation whenbinding to box1 All these results suggest that thecooperativity is from the inter-domain interactionsbetween two C-terminal domainsIn conclusion we propose the structural events of PmrA
activation and promoter DNA binding PmrAC prefers the50-CTTAAT-30 sequence to 50-CCTAAG-30 and 50-TTTAAG-30 sequences The phosphorylation of PmrA triggers theformation of a head-to-head dimer in the N-terminaldomain by use of a conserved a4 -b5-a5 interface andthis conformation is not disturbed by DNA bindingHowever the formation of a dimer brings the two C-terminal domains close to each other to recognize the twohalf-sites of box1 DNA simultaneously and specifically in ahead-to-tail fashion The residues Lys153 Thr187 Asn188His193 and His195 are involved in DNA-specific recognitionand Arg171 Arg198 and Arg210 are responsible for inter-actions with the DNA phosphate backbone Also the C-terminal b-hairpin and C-terminal tail of the upstreamPmrAC closely contact the N-terminal b-sheet of the down-stream PmrAC These interaction networks bend the DNAslightly and a stable PmrAFndashbox1 DNA complex is formedto activate transcription
ACCESSION NUMBERS
The chemical shifts of PmrAC at pH 60 and 298K weredeposited into BioMagResBank under accession numberBMRB-19231 The ensemble of 15 NMR structures andthe averaged structure along with the complete list of re-straints were deposited in the RCSB Protein Data Bankunder accession number 2m87
SUPPLEMENTARY DATA
Supplementary Data are available at NAR Online
ACKNOWLEDGEMENTS
We thank Laura Smales for copyediting the manuscriptWe also acknowledge the use of CD and ITC in theBiophysics Core Facility Scientific Instrument CenterAcademia Sinica The NMR spectra were obtained atthe High-field Biomacromolecular NMR Core FacilityAcademia Sinica supported by Core Facilities forProtein Structural Analysis from National ResearchProgram for Biopharmaceuticals (NRPB)
FUNDING
Academia Sinica the Ministry of Education under theATU plan and the National Science Council TaiwanROC [NSC 100-2311-B-001-025-MY3] Funding foropen access charge Academia Sinica and NationalScience Council [NSC 100-2311-B-001-025-MY3]Taiwan ROC
Conflict of interest statement None declared
REFERENCES
1 StockAM RobinsonVL and GoudreauPN (2000) Two-component signal transduction Annu Rev Biochem 69 183ndash215
2 StephensonK and HochJA (2002) Virulence- and antibioticresistance-associated two-component signal transduction systemsof Gram-positive pathogenic bacteria as targets for antimicrobialtherapy Pharmacol Ther 93 293ndash305
3 HyytiainenH SjoblomS PalomakiT TuikkalaA and TapioPalvaE (2003) The PmrA-PmrB two-component systemresponding to acidic pH and iron controls virulence in the plantpathogen Erwinia carotovora ssp carotovora Mol Microbiol 50795ndash807
4 DerzelleS TurlinE DuchaudE PagesS KunstFGivaudanA and DanchinA (2004) The PhoP-PhoQ two-component regulatory system of Photorhabdus luminescens isessential for virulence in insects J Bacteriol 186 1270ndash1279
5 GotohY EguchiY WatanabeT OkamotoS DoiA andUtsumiR (2010) Two-component signal transduction as potentialdrug targets in pathogenic bacteria Curr Opin Microbiol 13232ndash239
6 ChenHD and GroismanEA (2013) The biology of the PmrAPmrB two-component system the major regulator oflipopolysaccharide modifications Annu Rev Microbiol 6783ndash112
7 WostenMM KoxLF ChamnongpolS SonciniFC andGroismanEA (2000) A signal transduction system that respondsto extracellular iron Cell 103 113ndash125
8 NishinoK HsuFF TurkJ CromieMJ WostenMM andGroismanEA (2006) Identification of the lipopolysaccharidemodifications controlled by the Salmonella PmrAPmrB system
4092 Nucleic Acids Research 2014 Vol 42 No 6
mediating resistance to Fe(III) and Al(III) Mol Microbiol 61645ndash654
9 PerezJC and GroismanEA (2007) Acid pH activation of thePmrAPmrB two-component regulatory system of Salmonellaenterica Mol Microbiol 63 283ndash293
10 KoxLF WostenMM and GroismanEA (2000) A smallprotein that mediates the activation of a two-component systemby another two-component system EMBO J 19 1861ndash1872
11 KatoA and GroismanEA (2004) Connecting two-componentregulatory systems by a protein that protects a response regulatorfrom dephosphorylation by its cognate sensor Genes Dev 182302ndash2313
12 VaaraM (1992) Agents that increase the permeability of theouter-membrane Microbiol Rev 56 395ndash411
13 DelgadoMA MouslimC and GroismanEA (2006) The PmrAPmrB and RcsCYojNRcsB systems control expression of theSalmonella O-antigen chain length determinant Mol Microbiol60 39ndash50
14 ChoiJJ and GroismanEA (2013) The lipopolysaccharidemodification regulator PmrA limits Salmonella virulence byrepressing the type three- secretion system SpiSsa Proc NatlAcad Sci USA 110 9499ndash9504
15 KuhleV and HenselM (2002) SseF and SseG are translocatedeffectors of the type III secretion system of Salmonellapathogenicity island 2 that modulate aggregation of endosomalcompartments Cell Microbiol 4 813ndash824
16 HenselM (2000) Salmonella pathogenicity island 2 MolMicrobiol 36 1015ndash1023
17 AsensioA OliverA Gonzalez-DiegoP BaqueroF Perez-DiazJC RosP CoboJ PalaciosM LasherasD andCantonR (2000) Outbreak of a multiresistant Klebsiellapneumoniae strain in an intensive care unit antibiotic use as riskfactor for colonization and infection Clin Infect Dis 30 55ndash60
18 GaoR and StockAM (2009) Biological insights from structuresof two-component proteins Annu Rev Microbiol 63 133ndash154
19 BucklerDR ZhouY and StockAM (2002) Evidence ofintradomain and interdomain flexibility in an OmpRPhoBhomolog from Thermotoga maritima Structure 10 153ndash164
20 FriedlandN MackTR YuM HungLW TerwilligerTCWaldoGS and StockAM (2007) Domain orientation in theinactive response regulator Mycobacterium tuberculosis MtrAprovides a barrier to activation Biochemistry 46 6733ndash6743
21 NowakE PanjikarS KonarevP SvergunDI and TuckerPA(2006) The structural basis of signal transduction for the responseregulator PrrA from Mycobacterium tuberculosis J Biol Chem281 9659ndash9666
22 RobinsonVL WuT and StockAM (2003) Structural analysisof the domain interface in DrrB a response regulator of theOmpRPhoB subfamily J Bacteriol 185 4186ndash4194
23 BlancoAG SolaM Gomis-RuthFX and CollM (2002)Tandem DNA recognition by PhoB a two-component signaltransduction transcriptional activator Structure 10 701ndash713
24 RheeJE ShengW MorganLK NoletR LiaoX andKenneyLJ (2008) Amino acids important for DNA recognitionby the response regulator OmpR J Biol Chem 283 8664ndash8677
25 MarisAE WalthersD MattisonK ByersN and KenneyLJ(2005) The response regulator OmpR oligomerizes via beta-sheetsto form head-to-head dimers J Mol Biol 350 843ndash856
26 LuoSC LouYC ChengHY PanYR PengHL andChenC (2010) Solution structure and phospho-PmrA recognitionmode of PmrD from Klebsiella pneumoniae J Struct Biol 172319ndash330
27 LuoSC LouYC RajasekaranM ChangYW HsiaoCDand ChenC (2013) Structural basis of a physical blockagemechanism for the interaction of response regulator PmrA withconnector protein PmrD from Klebsiella pneumoniae J BiolChem 288 25551ndash25561
28 NeiraJL and FershtAR (1999) Exploring the folding funnel ofa polypeptide chain by biophysical studies on protein fragmentsJ Mol Biol 285 1309ndash1333
29 KayLE (1995) Pulsed field gradient multi-dimensional NMRmethods for the study of protein structure and dynamics insolution Prog Biophys Mol Biol 63 277ndash299
30 DelaglioF GrzesiekS VuisterGW ZhuG PfeiferJ andBaxA (1995) NMRPipe a multidimensional spectral processingsystem based on UNIX pipes J Biomol NMR 6 277ndash293
31 JohnsonBA and BlevinsRA (1994) NMRView A computerprogram for the visualization and analysis of NMR dataJ Biomol NMR 4 603ndash614
32 ShenY DelaglioF CornilescuG and BaxA (2009) TALOSplus a hybrid method for predicting protein backbone torsionangles from NMR chemical shifts J Biomol NMR 44 213ndash223
33 SchwietersCD KuszewskiJJ TjandraN and CloreGM(2003) The Xplor-NIH NMR molecular structure determinationpackage J Magn Reson 160 65ndash73
34 LaskowskiRA RullmannnJA MacArthurMW KapteinRand ThorntonJM (1996) AQUA and PROCHECK-NMRprograms for checking the quality of protein structures solved byNMR J Biomol NMR 8 477ndash486
35 DominguezC BoelensR and BonvinAM (2003) HADDOCKa protein-protein docking approach based on biochemical orbiophysical information J Am Chem Soc 125 1731ndash1737
36 IwaharaJ AndersonDE MurphyEC and CloreGM (2003)EDTA-derivatized deoxythymidine as a tool for rapiddetermination of protein binding polarity to DNA byintermolecular paramagnetic relaxation enhancement J AmChem Soc 125 6634ndash6635
37 MarchalK De KeersmaeckerS MonsieursP van BoxelNLemmensK ThijsG VanderleydenJ and De MoorB (2004) Insilico identification and experimental validation of PmrAB targetsin Salmonella typhimurium by regulatory motif detection GenomeBiol 5 R9
38 MitrophanovAY JewettMW HadleyTJ and GroismanEA(2008) Evolution and dynamics of regulatory architecturescontrolling polymyxin B resistance in enteric bacteria PLoSGenet 4 e1000233
39 WuKM LiLH YanJJ TsaoN LiaoTL TsaiHCFungCP ChenHJ LiuYM WangJT et al (2009) Genomesequencing and comparative analysis of Klebsiella pneumoniaeNTUH-K2044 a strain causing liver abscess and meningitisJ Bacteriol 191 4492ndash4501
40 ChengHY ChenYF and PengHL (2010) Molecularcharacterization of the PhoPQ-PmrD-PmrAB mediated pathwayregulating polymyxin B resistance in Klebsiella pneumoniaeCG43 J Biomed Sci 17 60
41 McClearyWR (1996) The activation of PhoB byacetylphosphate Mol Microbiol 20 1155ndash1163
42 LiuW and HulettFM (1997) Bacillus subtilis PhoP binds to thephoB tandem promoter exclusively within the phosphatestarvation-inducible promoter J Bacteriol 179 6302ndash6310
43 PapapanagiotouI StreeterSD CaryPD and KnealeGG(2007) DNA structural deformations in the interaction of thecontroller protein C AhdI with its operator sequence NucleicAcids Res 35 2643ndash2650
44 HolmL KaariainenS RosenstromP and SchenkelA (2008)Searching protein structure databases with DaliLite v3Bioinformatics 24 2780ndash2781
45 OkajimaT DoiA OkadaA GotohY TanizawaK andUtsumiR (2008) Response regulator YycF essential for bacterialgrowth X-ray crystal structure of the DNA-binding domainand its PhoB-like DNA recognition motif FEBS Lett 5823434ndash3438
46 WangS Engohang-NdongJ and SmithI (2007) Structure of theDNA-binding domain of the response regulator PhoP fromMycobacterium tuberculosis Biochemistry 46 14751ndash14761
47 Martinez-HackertE and StockAM (1997) The DNA-bindingdomain of OmpR crystal structures of a winged helixtranscription factor Structure 5 109ndash124
48 MakinoK AmemuraM KawamotoT KimuraS ShinagawaHNakataA and SuzukiM (1996) DNA binding of PhoB and itsinteraction with RNA polymerase J Mol Biol 259 15ndash26
49 BlancoAG CanalsA BernuesJ SolaM and CollM (2011)The structure of a transcription activation subcomplex revealshow sigma(70) is recruited to PhoB promoters EMBO J 303776ndash3785
Nucleic Acids Research 2014 Vol 42 No 6 4093
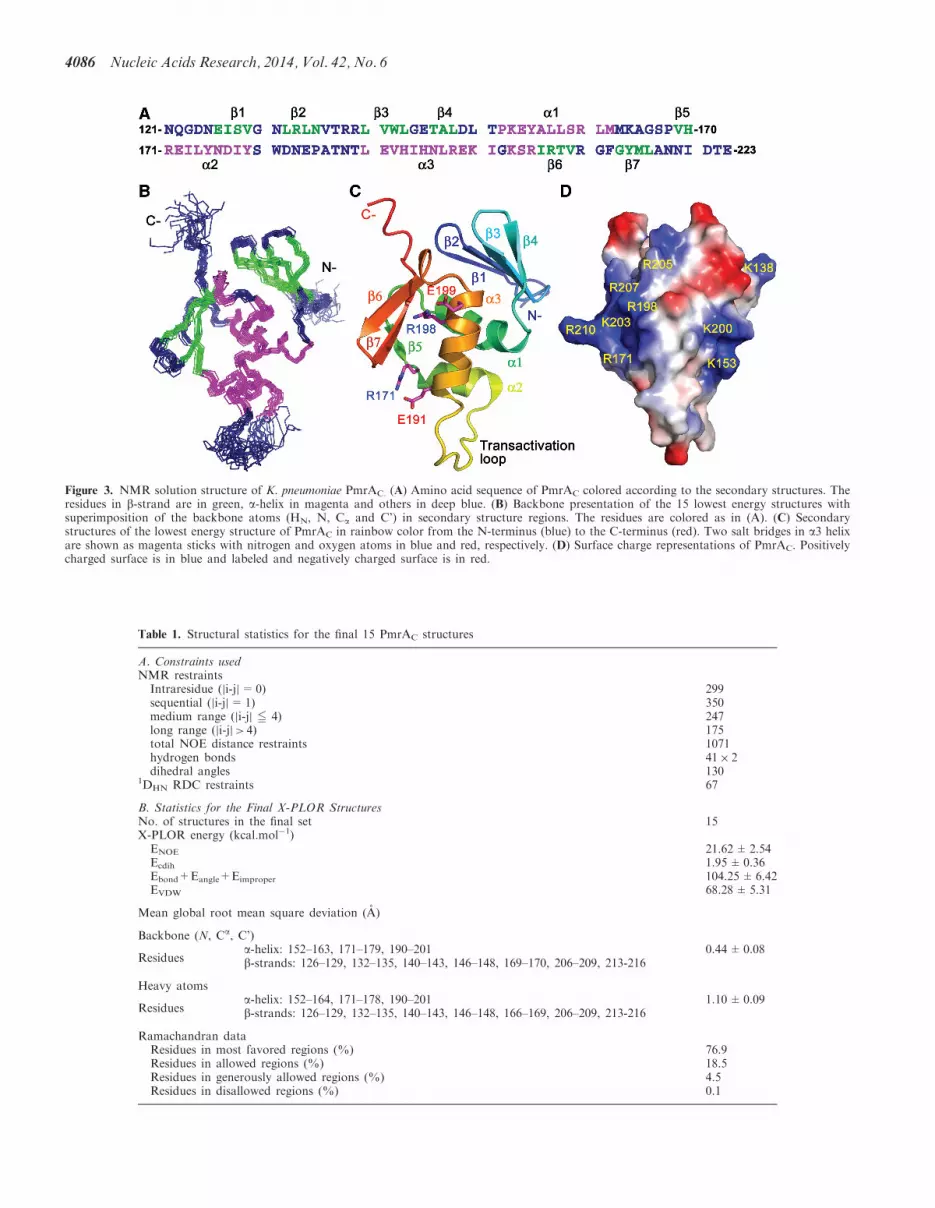
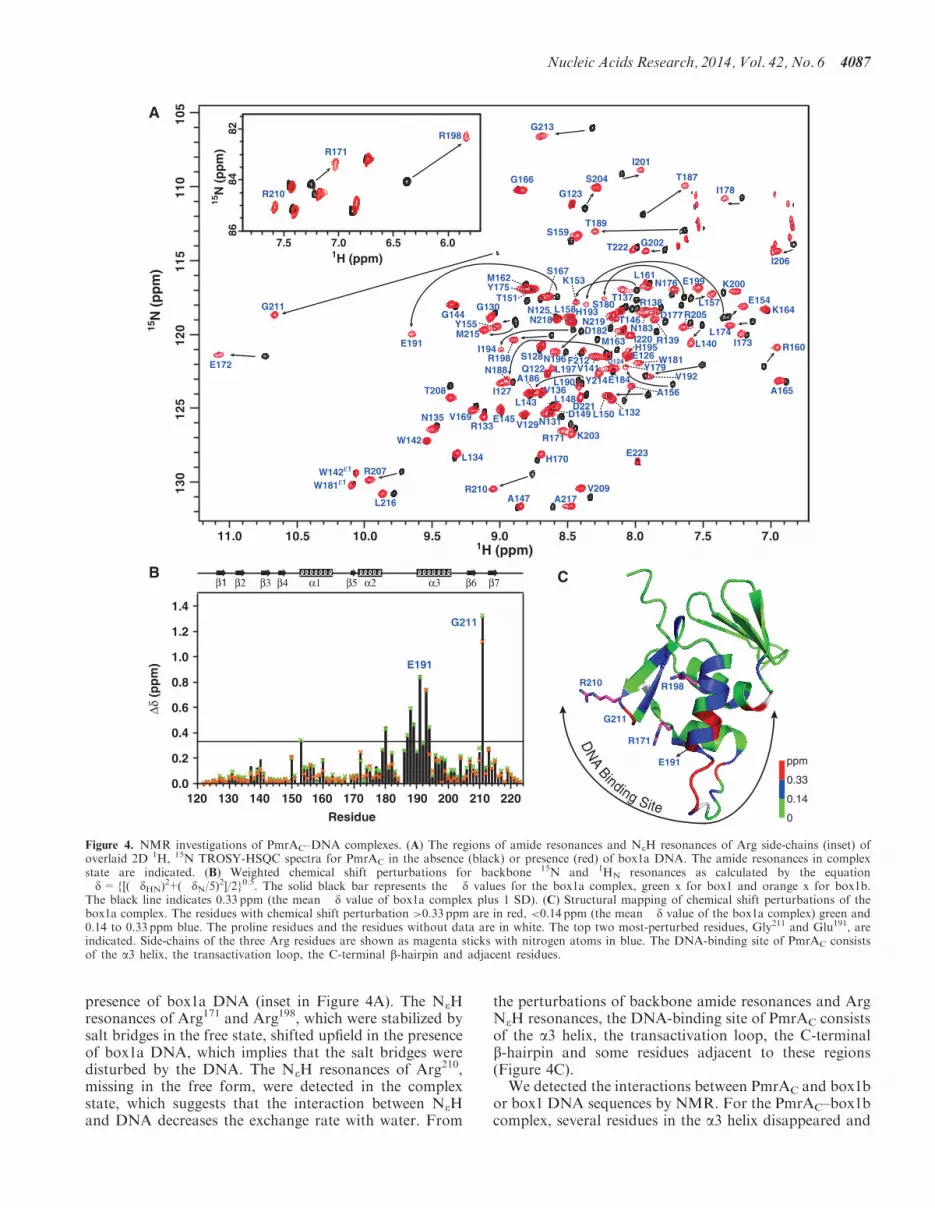