solitonic lattice and yukawa forces in the rare-earth orthoferrite tbfeo3
TRANSCRIPT
Solitonic lattice and Yukawa forces in the rare earth orthoferrite TbFeO3
Sergey Artyukhin,1 Maxim Mostovoy,1, ∗ Niels Paduraru Jensen,2 Duc Le,3 Karel Prokes,3 Vinıcus G.
Paula,3, 4 Heloisa N. Bordallo,3, 5, 6 Andrey Maljuk,3, 7 Sven Landsgesell,3 Hanjo Ryll,3 Bastian Klemke,3
Sebastian Paeckel,3 Klaus Kiefer,3 Kim Lefmann,5 Luise Theil Kuhn,2, 6 and Dimitri N. Argyriou3, 6, †
1Zernike Institute for Advanced Materials, University of Groningen,Nijenborgh 4, 9747 AG, Groningen, The Netherlands
2Risø National Laboratory for Sustainable Energy,Frederiksborgvej 399, DK-4000 Roskilde, Denmark
3Helmholtz-Zentrum Berlin fur Materialien und Energie,Hahn-Meitner Platz 1, D-14109, Berlin, Germany
4Instituto de Fısica, Universidade do Estado do Rio de Janeiro, Rio de Janeiro, RJ 20559-900, Brazil5Nanoscience Center, Niels Bohr Institute, University of Copenhagen, DK-2100 Copenhagen, Denmark
6European Spallation Source ESS AB, P.O Box 176, SE-221 00 Lund, Sweden7Leibniz Institute for Solid State and Materials Research Dresden, Helmholtzstrae 20, 01069 Dresden, Germany
(Dated: March 23, 2011)
The control of domains in ferroic devices lies at the heart of their potential for technologicalapplications. Multiferroic materials offer another level of complexity as domains can be either orboth of a ferroelectric and magnetic nature. Here we report the discovery of a novel magnetic statein the orthoferrite TbFeO3 using neutron diffraction under an applied magnetic field. This state hasa very long incommensurate period ranging from 340 A at 3K to 2700 A at the lowest temperaturesand exhibits an anomalously large number of higher-order harmonics, allowing us to identify it withthe periodic array of sharp domain walls of Tb spins separated by many lattice constants. The Tbdomain walls interact by exchanging spin waves propagating through the Fe magnetic sublattice.The resulting Yukawa-like force, familiar from particle physics, has a finite range that determinesthe period of the incommensurate state.
PACS numbers:
Materials with magnetic transition metal and rareearth ions show a variety of spectacular effects originat-ing from the coupling between the two spin subsystems.The transition metal spins interact stronger and orderat higher temperatures than the spins of rare earth ions,but they are also much less anisotropic. That is whytheir orientation can be controlled by the rare earth mag-netism. Such re-orientation transitions observed in manyrare earth ferrites, chromites and manganites have pro-found effects on their magnetic, optical and elastic prop-erties [1–3].
Recently it was realized that interactions between tran-sition metal and rare earth spins also play an importantrole in multiferroic and magnetoelectric materials [4–7] .Thus the coupling between the Mn spins forming a spi-ral state in the multiferroic TbMnO3 and the Ising-likeTb spins leads to a significant enhancement of the elec-tric polarization induced by the spiral [8, 9]. In GdFeO3
orthoferrite the polarization only appears when the in-dependent magnetic orders of Fe and Gd sublattices arepresent simultaneously [7], while in DyFeO3 the interplaybetween the spins of Fe and Dy ions gives rise to one ofthe strongest linear magnetoelectric responses observedin single-phase materials [10].
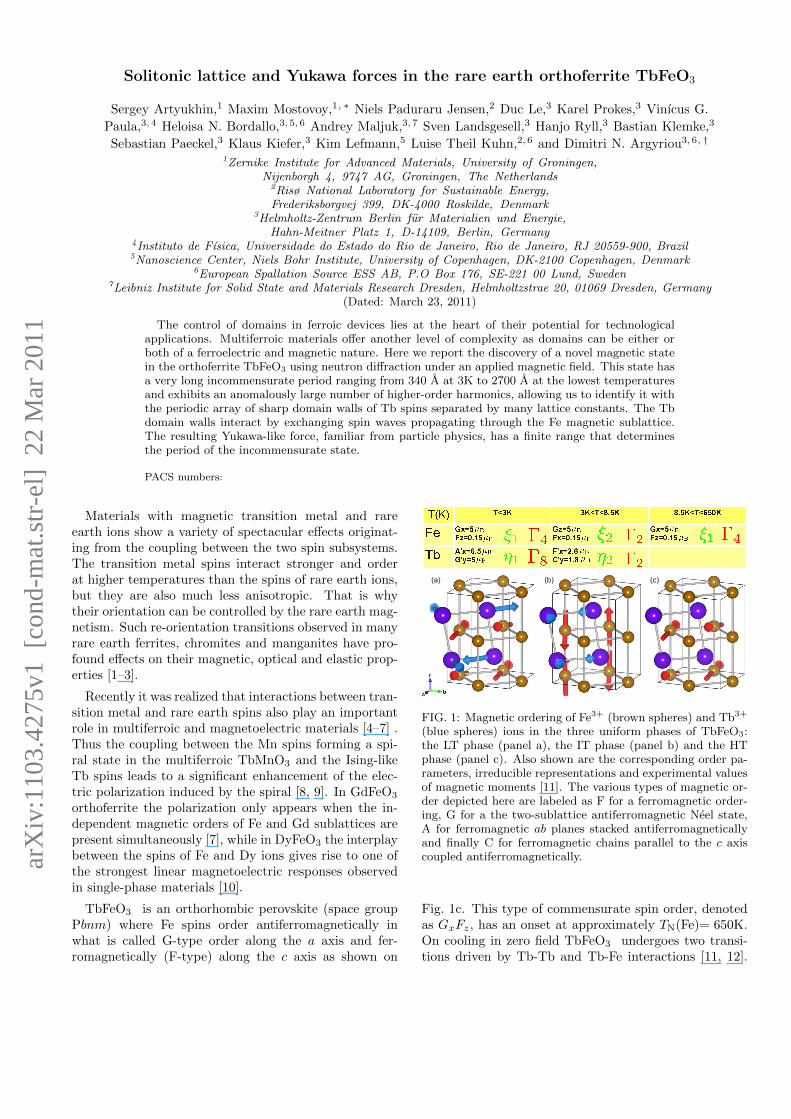
TbFeO3 is an orthorhombic perovskite (space groupPbnm) where Fe spins order antiferromagnetically inwhat is called G-type order along the a axis and fer-romagnetically (F-type) along the c axis as shown on
(a) (c)(b)
FIG. 1: Magnetic ordering of Fe3+ (brown spheres) and Tb3+
(blue spheres) ions in the three uniform phases of TbFeO3:the LT phase (panel a), the IT phase (panel b) and the HTphase (panel c). Also shown are the corresponding order pa-rameters, irreducible representations and experimental valuesof magnetic moments [11]. The various types of magnetic or-der depicted here are labeled as F for a ferromagnetic order-ing, G for a the two-sublattice antiferromagnetic Neel state,A for ferromagnetic ab planes stacked antiferromagneticallyand finally C for ferromagnetic chains parallel to the c axiscoupled antiferromagnetically.
Fig. 1c. This type of commensurate spin order, denotedas GxFz, has an onset at approximately TN(Fe)= 650K.On cooling in zero field TbFeO3 undergoes two transi-tions driven by Tb-Tb and Tb-Fe interactions [11, 12].
arX
iv:1
103.
4275
v1 [
cond
-mat
.str
-el]
22
Mar
201
1
2
The ordering of Tb spins at TN(Tb)∼8.5K occurs simul-taneously with a rotation of Fe spins in the ac plane, sothat below 8.5K ferromagnetic components of both Feand Tb spins align along the a axis, while their anti-ferromagnetic components are orthogonal to each other.The magnetic configuration of this intermediate temper-ature (IT) phase is FxGz for Fe, and F ′xC
′y for Tb (see
Fig. 1b). However, below∼ 3K there is an additional spinre-orientation transition to a low temperature (LT) phasewhich flips the Fe spins back to their higher temperatureGxFz order, while the Tb spins order antiferromagneti-cally in the A′xG
′y state (see Fig. 1a).
Single crystals of TbFeO3 were grown under 4 bar oxy-gen pressure using the crucible-free floating zone method.Their quality was checked by X-ray diffraction. Neutrondiffraction experiments were made on a large single crys-tal of TbFeO3, at the BER-II reactor of the HelmholtzZentrum Berlin using the FLEX cold triple-axis spec-trometer with collimation of 60′-60′-60′, ki=1.3A−1, anda cooled Be filter positioned in the scattered beam. Ad-ditional measurements were made also with the E4 two-axis diffractometer with λ=2.8A. In both cases a mag-netic field was applied along the c−axis of the sampleusing a superconducting horizontal field magnet. Di-electric measurements were performed at the Laboratoryfor Magnetic Measurements at the Helmholtz-ZentrumBerlin (LaMMB), with temperatures varying between0.3 K and 15 K and with magnetic fields up to 1.9 T.Magnetic Field and temperature control was providedby an Oxford Instruments 14.5 T cryomagnet equippedwith a Heliox 3He insert. An Andeen-Hagerling 2700ACapacitance Bridge was used to measure the capacitanceand loss of a disc shaped sample of TbFeO3, which wasmounted between the electrodes of a parallel-plate capac-itor.
Using single crystal neutron diffraction we have probedthe A,C,G and F-type orders in TbFeO3 by tracking theintensity of the corresponding magnetic Bragg reflectionsin zero field and in an applied field along the c axis (seeMethods for experimental details). In zero magnetic fieldour results are consistent with the previously observedsequence of the re-orientation and inverse re-orientationtransitions [11]. Above ∼8.5K we find only G-type re-flections, while the development of ferromagnetic orderis evident from the enhanced intensities of lattice Braggreflections. Below 8.5K we find G- and C-type reflec-tions, while below 3K only A- and G-type reflections canbe discerned.
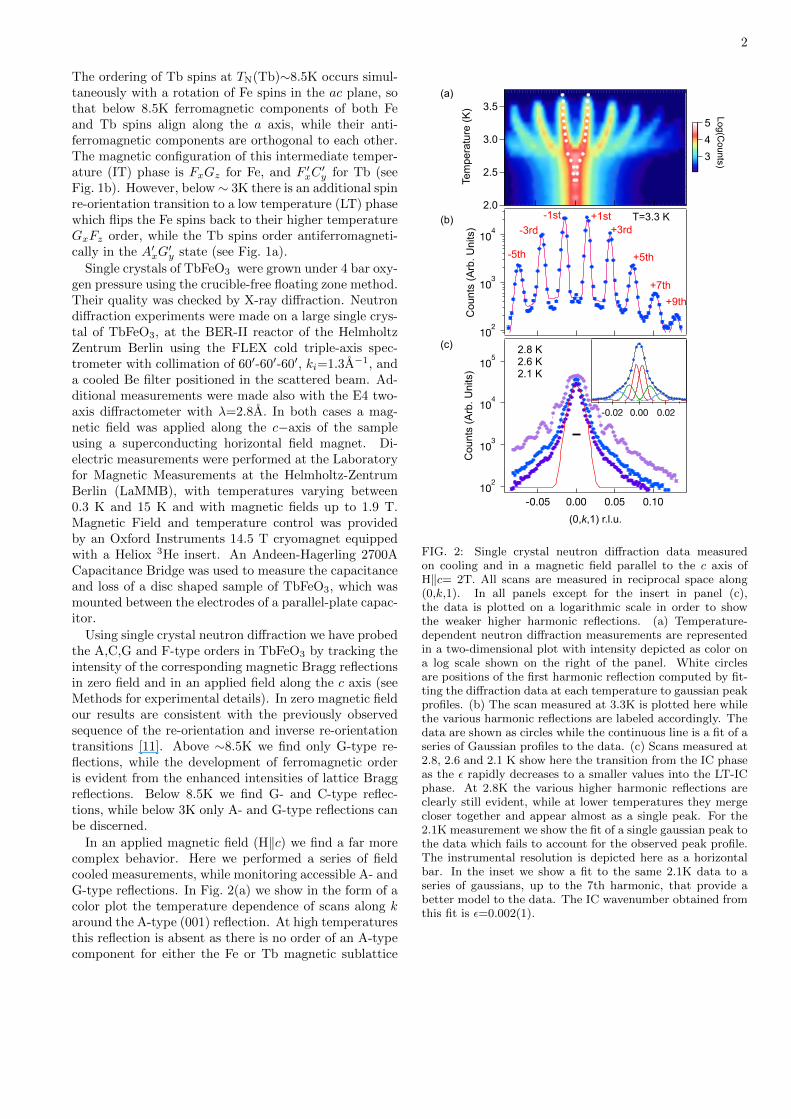
In an applied magnetic field (H‖c) we find a far morecomplex behavior. Here we performed a series of fieldcooled measurements, while monitoring accessible A- andG-type reflections. In Fig. 2(a) we show in the form of acolor plot the temperature dependence of scans along karound the A-type (001) reflection. At high temperaturesthis reflection is absent as there is no order of an A-typecomponent for either the Fe or Tb magnetic sublattice
3.5
3.0
2.5
2.0
Tem
pera
ture
(K)
543
102
103
104
Cou
nts
(Arb
. Uni
ts)
T=3.3 K +1st +3rd
+5th
+7th +9th
-1st -3rd
-5th
Log(Counts)
102
103
104
105
Cou
nts
(Arb
. Uni
ts)
0.100.050.00-0.05
(0,k,1) r.l.u.
2.8 K2.6 K2.1 K
(a)
(b)
(c)
-0.02 0.00 0.02
FIG. 2: Single crystal neutron diffraction data measuredon cooling and in a magnetic field parallel to the c axis ofH‖c= 2T. All scans are measured in reciprocal space along(0,k,1). In all panels except for the insert in panel (c),the data is plotted on a logarithmic scale in order to showthe weaker higher harmonic reflections. (a) Temperature-dependent neutron diffraction measurements are representedin a two-dimensional plot with intensity depicted as color ona log scale shown on the right of the panel. White circlesare positions of the first harmonic reflection computed by fit-ting the diffraction data at each temperature to gaussian peakprofiles. (b) The scan measured at 3.3K is plotted here whilethe various harmonic reflections are labeled accordingly. Thedata are shown as circles while the continuous line is a fit of aseries of Gaussian profiles to the data. (c) Scans measured at2.8, 2.6 and 2.1 K show here the transition from the IC phaseas the ε rapidly decreases to a smaller values into the LT-ICphase. At 2.8K the various higher harmonic reflections areclearly still evident, while at lower temperatures they mergecloser together and appear almost as a single peak. For the2.1K measurement we show the fit of a single gaussian peak tothe data which fails to account for the observed peak profile.The instrumental resolution is depicted here as a horizontalbar. In the inset we show a fit to the same 2.1K data to aseries of gaussians, up to the 7th harmonic, that provide abetter model to the data. The IC wavenumber obtained fromthis fit is ε=0.002(1).
3
as indicated in Fig. 1. However, on cooling a series ofreflections appears below 3.8K that seem to merge into asingle peak below ∼2.8K. Examination of the wavevectorof these reflections easily establishes that they are oddharmonics of up to 11th order. The wavevector of the1st harmonic is Q = (0, ε, 1) with ε ∼ 0.015 r.l.u. [seeFig. 2(b)]. The incommensurate periodicity of this phasethat we shall refer to as IC, is approximately 67 units cellsor ∼340 A. The full width at half maximum (FWHM)of these reflections is relatively sharp giving a coherencelength of ∼700 A or approximately two full cycles of thisunusual order.
The physical significance of these observations is thatthe Tb-spin order in a H‖c field develops a square-wavemodulation – a periodic array of widely separated do-main walls in Tb magnetic order. We ascribe the ob-served scattering to be dominated by Tb spins first be-cause of its substantially greater intensity compared tothe higher temperature Fe order found around for ex-ample G-type reflections and also because in zero fieldA-type reflections are associated only with Tb spin or-der. In the modulated A-state, Tb spins form ferromag-netic stripes in the ab planes with the width 170 A alongthe b axis. The a component of magnetization alternatesfrom stripe to stripe, while the stacking of spins alongthe c axis is antiferromagnetic. Investigation of an FeG-type reflection under the same condition suggests thatFe-spins are weakly perturbed by this unusual Tb-order(see supplementary information).
On cooling below 2.8K Fig. 2(a) would indicate thatthe Tb modulation abruptly disappears and the Tb sub-
LT-ICPhase
H||c
Fe (GxFz)Fe (GxFz)Tb (AxGy)
Fe (FxGz)Tb (FxCy)
ICPhase
μ oH
||c (T
)
Temperature (K)
wav
enum
ber !
Temperature (K)
TbFeO3
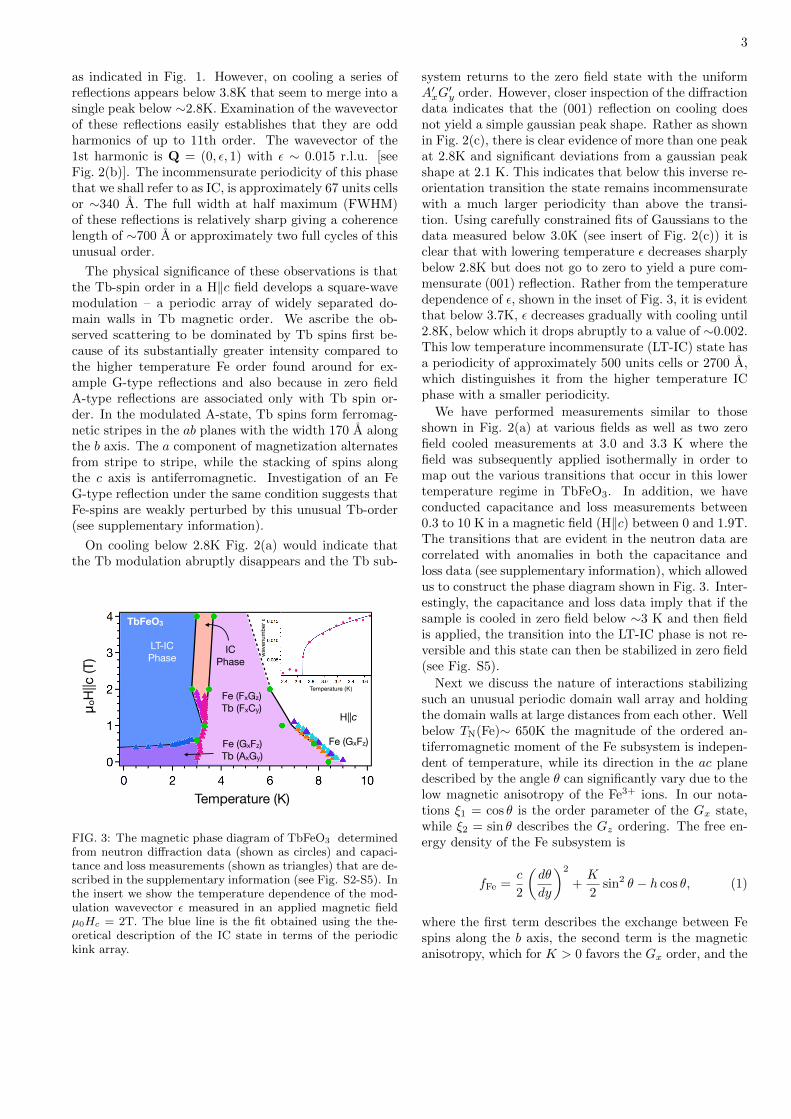
FIG. 3: The magnetic phase diagram of TbFeO3 determinedfrom neutron diffraction data (shown as circles) and capaci-tance and loss measurements (shown as triangles) that are de-scribed in the supplementary information (see Fig. S2-S5). Inthe insert we show the temperature dependence of the mod-ulation wavevector ε measured in an applied magnetic fieldµ0Hc = 2T. The blue line is the fit obtained using the the-oretical description of the IC state in terms of the periodickink array.
system returns to the zero field state with the uniformA′xG
′y order. However, closer inspection of the diffraction
data indicates that the (001) reflection on cooling doesnot yield a simple gaussian peak shape. Rather as shownin Fig. 2(c), there is clear evidence of more than one peakat 2.8K and significant deviations from a gaussian peakshape at 2.1 K. This indicates that below this inverse re-orientation transition the state remains incommensuratewith a much larger periodicity than above the transi-tion. Using carefully constrained fits of Gaussians to thedata measured below 3.0K (see insert of Fig. 2(c)) it isclear that with lowering temperature ε decreases sharplybelow 2.8K but does not go to zero to yield a pure com-mensurate (001) reflection. Rather from the temperaturedependence of ε, shown in the inset of Fig. 3, it is evidentthat below 3.7K, ε decreases gradually with cooling until2.8K, below which it drops abruptly to a value of ∼0.002.This low temperature incommensurate (LT-IC) state hasa periodicity of approximately 500 units cells or 2700 A,which distinguishes it from the higher temperature ICphase with a smaller periodicity.
We have performed measurements similar to thoseshown in Fig. 2(a) at various fields as well as two zerofield cooled measurements at 3.0 and 3.3 K where thefield was subsequently applied isothermally in order tomap out the various transitions that occur in this lowertemperature regime in TbFeO3. In addition, we haveconducted capacitance and loss measurements between0.3 to 10 K in a magnetic field (H‖c) between 0 and 1.9T.The transitions that are evident in the neutron data arecorrelated with anomalies in both the capacitance andloss data (see supplementary information), which allowedus to construct the phase diagram shown in Fig. 3. Inter-estingly, the capacitance and loss data imply that if thesample is cooled in zero field below ∼3 K and then fieldis applied, the transition into the LT-IC phase is not re-versible and this state can then be stabilized in zero field(see Fig. S5).
Next we discuss the nature of interactions stabilizingsuch an unusual periodic domain wall array and holdingthe domain walls at large distances from each other. Wellbelow TN(Fe)∼ 650K the magnitude of the ordered an-tiferromagnetic moment of the Fe subsystem is indepen-dent of temperature, while its direction in the ac planedescribed by the angle θ can significantly vary due to thelow magnetic anisotropy of the Fe3+ ions. In our nota-tions ξ1 = cos θ is the order parameter of the Gx state,while ξ2 = sin θ describes the Gz ordering. The free en-ergy density of the Fe subsystem is
fFe =c
2
(dθ
dy
)2
+K
2sin2 θ − h cos θ, (1)
where the first term describes the exchange between Fespins along the b axis, the second term is the magneticanisotropy, which for K > 0 favors the Gx order, and the
4
last term is the Zeeman interaction with the magneticfield Hz in the GxFz state.
The free energy of Tb spins is expanded in powers ofthe order parameters η1, describing the zero phase LTstate with antiparallel Tb spins in neighboring ab layers(Fig. 1a), and η2, describing the IT state with parallelTb spins in neighboring layers (Fig. 1b):
fTb =c12
(dη1dy
)2
+c22
(dη2dy
)2
+a12η21 +
a22η22
+b14η41 +
b122η21η
22 +
b24η42 + . . . . (2)
For ∆ = a2−a1 > 0 the Tb subsystem would order in thestate with η1 6= 0 below some temperature T0, at whicha1 = 0. However, the interaction between the Tb andFe spins favors the IT state with η2 6= 0 and θ = ±π2 ,in which both subsystems have a ferromagnetic momentalong the a axis. Since η2 and ξ2 = sin θ transform in thesame way (see the supplemental material), this interac-tion is a linear coupling,
fFe−Tb = −λξ2η2. (3)
For λ2 > ∆K, the ‘unnatural’ IT state with parallel Tbspins in neighboring layers and Fe spins rotated by 90◦
away from the easy axis, intervenes between the stateswith the ‘natural’ orders of Fe and Tb spins. In this wayone obtains the zero-field phase diagram of TbFeO3[11,13].
In addition, we consider the so-called Lifshitz invari-ants linear in order parameter gradients,
fL = g1 (η1∂yξ2 − ξ2∂yη1) + g2 (η1∂yη2 − η2∂yη1) , (4)
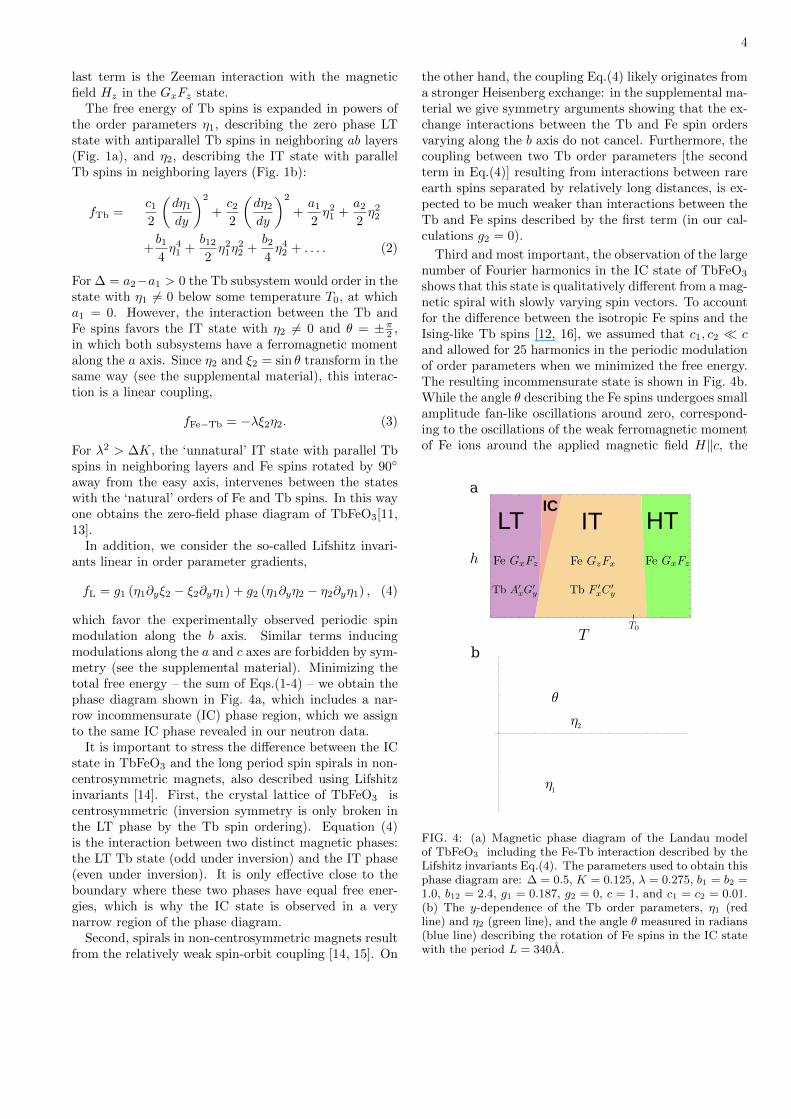
which favor the experimentally observed periodic spinmodulation along the b axis. Similar terms inducingmodulations along the a and c axes are forbidden by sym-metry (see the supplemental material). Minimizing thetotal free energy – the sum of Eqs.(1-4) – we obtain thephase diagram shown in Fig. 4a, which includes a nar-row incommensurate (IC) phase region, which we assignto the same IC phase revealed in our neutron data.
It is important to stress the difference between the ICstate in TbFeO3 and the long period spin spirals in non-centrosymmetric magnets, also described using Lifshitzinvariants [14]. First, the crystal lattice of TbFeO3 iscentrosymmetric (inversion symmetry is only broken inthe LT phase by the Tb spin ordering). Equation (4)is the interaction between two distinct magnetic phases:the LT Tb state (odd under inversion) and the IT phase(even under inversion). It is only effective close to theboundary where these two phases have equal free ener-gies, which is why the IC state is observed in a verynarrow region of the phase diagram.
Second, spirals in non-centrosymmetric magnets resultfrom the relatively weak spin-orbit coupling [14, 15]. On
the other hand, the coupling Eq.(4) likely originates froma stronger Heisenberg exchange: in the supplemental ma-terial we give symmetry arguments showing that the ex-change interactions between the Tb and Fe spin ordersvarying along the b axis do not cancel. Furthermore, thecoupling between two Tb order parameters [the secondterm in Eq.(4)] resulting from interactions between rareearth spins separated by relatively long distances, is ex-pected to be much weaker than interactions between theTb and Fe spins described by the first term (in our cal-culations g2 = 0).
Third and most important, the observation of the largenumber of Fourier harmonics in the IC state of TbFeO3
shows that this state is qualitatively different from a mag-netic spiral with slowly varying spin vectors. To accountfor the difference between the isotropic Fe spins and theIsing-like Tb spins [12, 16], we assumed that c1, c2 � cand allowed for 25 harmonics in the periodic modulationof order parameters when we minimized the free energy.The resulting incommensurate state is shown in Fig. 4b.While the angle θ describing the Fe spins undergoes smallamplitude fan-like oscillations around zero, correspond-ing to the oscillations of the weak ferromagnetic momentof Fe ions around the applied magnetic field H‖c, the
FIG. 4: (a) Magnetic phase diagram of the Landau modelof TbFeO3 including the Fe-Tb interaction described by theLifshitz invariants Eq.(4). The parameters used to obtain thisphase diagram are: ∆ = 0.5, K = 0.125, λ = 0.275, b1 = b2 =1.0, b12 = 2.4, g1 = 0.187, g2 = 0, c = 1, and c1 = c2 = 0.01.(b) The y-dependence of the Tb order parameters, η1 (redline) and η2 (green line), and the angle θ measured in radians(blue line) describing the rotation of Fe spins in the IC statewith the period L = 340A.
5
low-temperature Tb order parameter η1 exhibits suddenjumps.
To understand the nature of the force that holds theseatomically sharp domain walls at distances of ∼ 170A from each other, we (briefly) discuss an interestingfield-theoretical interpretation of the coupled system ofrare earth and transition metal spins. Consider a sin-gle domain wall located at y = 0 where the Ising-likeLT order parameter η1 shows a discontinuous jump from−|η1| to +|η1| or vice versa (see Fig. 5a). Such a kinkcan be assigned the topological charge Q = (η1(+∞) −η1(−∞))/2|η1| = ±1. The free energy per unit area of
the domain wall is the ‘bare’ energy F(0)DW resulting from
interactions between Tb spins plus
Fθ = −2gθ(0)Q+1
2
∫dy
[c
(dθ
dy
)2
+ (K + h) θ2
], (5)
where the first term is the Lifshitz invariant Eq.(4) (g =g1|η1| and g2 = 0), describing the interaction betweenthe Tb and Fe spins, while the second term is the freeenergy of Fe spins for |θ| � 1. Equation (5) can be inter-preted as an energy of a charged plane with the surfacecharge density gQ (a ‘nucleon’) interacting with the fieldθ, which describes spin waves in the Fe magnetic subsys-
tem playing the role of pions with the mass m =√
K+hc .
Minimizing Fθ with respect to θ(y), we obtain the distor-tion in the Fe spin ordering produced by the Tb domain
wall, θ(y) = Qg√c(K+h)
e−|y|l (see Fig. 5a), which reduces
the domain wall free energy:
FDW = F(0)DW −
g2√c(K + h)
. (6)
When FDW becomes negative, the domain wallstend to condense. Their density is, however, limitedby Yukawa-like interactions between the domain walls,which result from the exchange of massive particles and
have the range l = m−1 =√
cK+h . These interactions
attract equal ‘electric’ charges and repel opposite ones.Neighboring domain walls in a periodic array have op-posite ‘electric’ charges, since topological charges of thedomain walls alternate along the b axis. The interactionbetween two neighboring domain walls located at y1 andy2 [see Fig. 5(b)] is
U(y2 − y1) =g2√
c(K + h)e−|y2−y1|
l , (7)
and the total ‘electrostatic’ free energy of an array ofdomain walls with the charges {Qn} alternating along theb axis (including the ‘self-energy’ of the charged surfaces)is given by
Fθ = −∑n,m
QnU(yn − ym)Qm, (8)
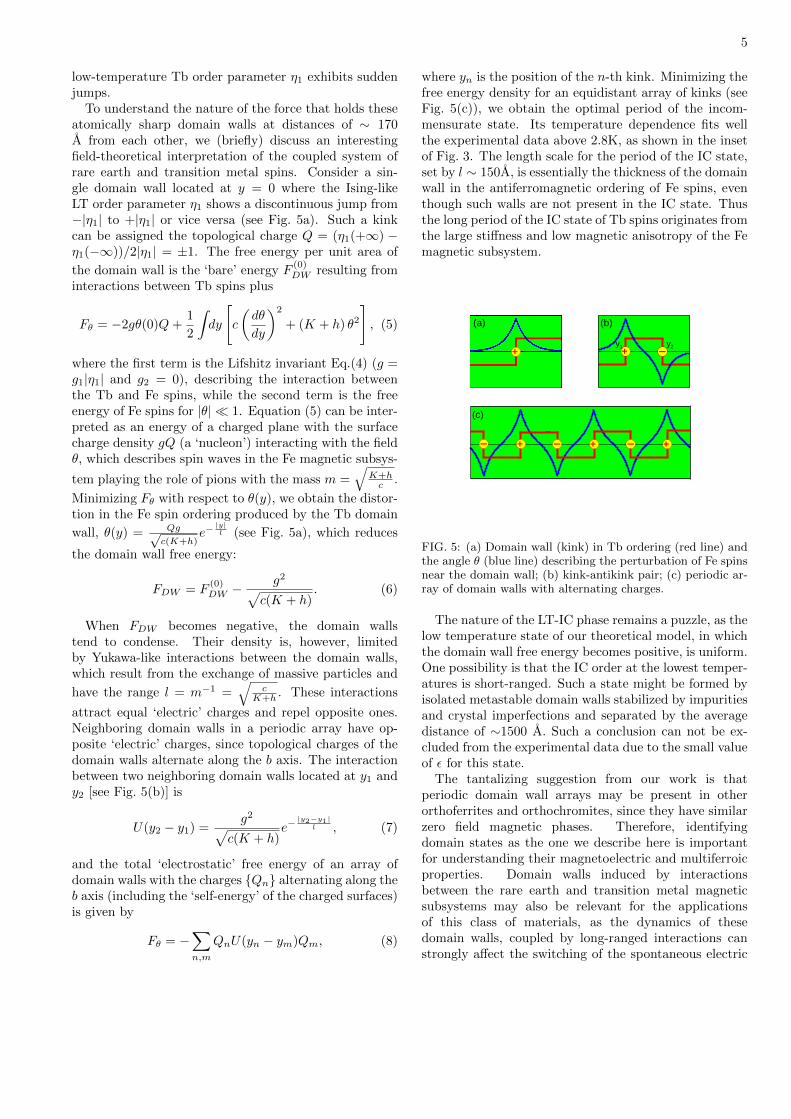
where yn is the position of the n-th kink. Minimizing thefree energy density for an equidistant array of kinks (seeFig. 5(c)), we obtain the optimal period of the incom-mensurate state. Its temperature dependence fits wellthe experimental data above 2.8K, as shown in the insetof Fig. 3. The length scale for the period of the IC state,set by l ∼ 150A, is essentially the thickness of the domainwall in the antiferromagnetic ordering of Fe spins, eventhough such walls are not present in the IC state. Thusthe long period of the IC state of Tb spins originates fromthe large stiffness and low magnetic anisotropy of the Femagnetic subsystem.
(a) (b)
y1 y2+ +
+++
(c)
FIG. 5: (a) Domain wall (kink) in Tb ordering (red line) andthe angle θ (blue line) describing the perturbation of Fe spinsnear the domain wall; (b) kink-antikink pair; (c) periodic ar-ray of domain walls with alternating charges.
The nature of the LT-IC phase remains a puzzle, as thelow temperature state of our theoretical model, in whichthe domain wall free energy becomes positive, is uniform.One possibility is that the IC order at the lowest temper-atures is short-ranged. Such a state might be formed byisolated metastable domain walls stabilized by impuritiesand crystal imperfections and separated by the averagedistance of ∼1500 A. Such a conclusion can not be ex-cluded from the experimental data due to the small valueof ε for this state.
The tantalizing suggestion from our work is thatperiodic domain wall arrays may be present in otherorthoferrites and orthochromites, since they have similarzero field magnetic phases. Therefore, identifyingdomain states as the one we describe here is importantfor understanding their magnetoelectric and multiferroicproperties. Domain walls induced by interactionsbetween the rare earth and transition metal magneticsubsystems may also be relevant for the applicationsof this class of materials, as the dynamics of thesedomain walls, coupled by long-ranged interactions canstrongly affect the switching of the spontaneous electric
6
polarization with an applied magnetic field and viceversa.
Acknowledgements: DNA and SL thank the DeutscheForschung Gemeinschaft for support under contract AR613/2-1. The neutron scattering work was supportedby the Danish National Research Council through DAN-SCATT. NPJ thanks Prof. Jrn Bindslev Hansen, for sup-port and guidance.
∗ Email of corresponding author: [email protected]† Email of corresponding author: [email protected]
[1] K. P. Belov, A. K. Zvezdin, A. M. Kadomtseva, and R. Z.Levitin,“Spin-reorientation transitions in rare-earth mag-nets”, Sov. Phys. Uspekhi 19, 574596 (1976).
[2] V. D. Buchel’nikov, N. K. Dan’shin, L. T. Tsymbal, andV. G. Shavrov, “Magnetoacoustics of rare-earth orthofer-rites”, Phys. Usp. 39, 547 - 572 (1996).
[3] A. V. Kimel, A. Kirilyuk, P. A. Usachev, R. V. Pis-arev, A. M. Balbashov, and Th. Rasing, “Ultrafast non-thermal control of magnetization by instantaneous pho-tomagnetic pulses”, Nature 435, 655-657 (2005).
[4] T. Kimura, T. Goto, H. Shintani, K. Ishizaka, T. Arima,and Y. Tokura, “Magnetic Control of Ferroelectric Po-larization”, Nature 426, 55 (2003).
[5] N. Hur, S. Park, P.A. Sharma, J.S. Ahn, S. Guha, and S-W. Cheong, “Electric polarization reversal and memoryin a multiferroic material induced by magnetic fields”,Nature (London) 429, 392 (2004).
[6] A. K. Zvezdin and A. A. Mukhin, “Magnetoelectric inter-actions and phase transitions in a new class of multifer-roics with improper electric polarization”, JETP Letters,88, 505 - 510 (2008).
[7] Y. Tokunaga, N. Furukawa, H. Sakai, Y. Taguchi, T.Arima, and Y. Tokura, “Composite domain walls in amultiferroic perovskite ferrite”, Nature Mater. 8, 558(2009).
[8] O. Prokhnenko, R. Feyerherm, M. Mostovoy, N.Aliouane, E. Dudzik, A. U. B. Wolter, A. Maljuk, and D.N. Argyriou, Coupling of Frustrated Ising Spins to theMagnetic Cycloid in Multiferroic TbMnO3, Phys. Rev.Lett. 99, 177206 (2007).
[9] N. Aliouane, O. Prokhnenko, R. Feyerherm, M.Mostovoy, J. Strempfer, K. Habicht, K. C. Rule, E.Dudzik, A. U. B. Wolter, A. Maljuk, and D. N. Argyriou,Magnetic order and ferroelectricity in RMnO3 multifer-roic manganites: coupling between R- and Mn-spins, J.Phys.: Condens. Matter 20, 434215 (2008).
[10] Y. Tokunaga, S. Iguchi, T. Arima, and Y. Tokura,“Magnetic-Field-Induced Ferroelectric State inDyFeO3”, Phys. Rev. Lett. 101, 097205 (2008).
[11] E.F. Bertaut, J. Chappert, J. Mareschal, J.P. Rebouillatand J. Sivardiere, “Structures Magnetiques de TbFeO3”,Solid State Commun. 5, 293 - 298 (1967).
[12] J. E. Bouree and J. Hammann, “Mise en evidenceexperimentale des effets de forme dans l’orthoferrite deterbium”, J. Phys. (Paris) 36, 391 (1975)
[13] K. P. Belov, A. K. Zvezdin, and A. A. Mukhin, Sov. Phys.JETP 49, 557 (1979).
[14] I. Dzyaloshinskii, Sov. Phys. JETP 19, 960 - 971 (1964).[15] T. Moriya, Phys. Rev. 120, 91 - 98 (1960).[16] R. Bidaux, J. E. Bouree and J. Hammann, “Dipolar in-
teractions in rare earth orthoferrites - II”, J. Phys Chem.Solids, 36, 655 - 659 (1975).
[17] E. F. Bertaut, in Magnetism, edited by G. T. Rado andH. Suhl (Academic, New York, 1963), Vol. 3, p. 149.
7
Supplemental material
SYMMETRY ANALYSIS
We use the so-called Bertaut’s notations[17] to describethe symmetry of magnetic states of TbFeO3 (see Table I).The ordering of Fe spins in the HT phase is described bythe Γ4 representation. In the IT state both Fe and Tbspin orders have Γ2 symmetry, while in the LT phase theFe order changes back to Γ4, while the ordering of Tbspins has Γ8 symmetry (see Fig. 1). Furthermore, theLifshitz invariant has the form
Γ8∂yΓ2 − Γ2∂yΓ8, (9)
from which Eq.(4) follows. We note that the rotationallysymmetric scalar products,
A′ · ∂yF− F · ∂yA′ and G′ · ∂yC−C · ∂yG′, (10)
where e.g. A′ · ∂yF = A′x · ∂yFx +A′y · ∂yFy +A′z · ∂yFz,are also invariant under all transformations of the Pbnmgroup showing that the coupling between inhomogeneousrare earth and transition metal magnetic orders can orig-inate from Heisenberg exchange interactions[9].
Fe Tb mx my mz
Γ1 AxGyCz C′z + + +
Γ2 FxCyGz F ′xC′y + − −
Γ3 CxFyAz C′xF′y − + −
Γ4 GxAyFz F ′z − − +
Γ5 G′xA′y − − −
Γ6 A′z − + +
Γ7 G′z + − +
Γ8 A′xG′y + + −
TABLE I: Transformation properties of representations ofPbnm space group under the three generators of the group:the two glide mirrors, mx : (x, y, z) → (1/2 − x, 1/2 + y, z)and my : (x, y, z)→ (1/2+x, 1/2−y, 1/2+z), and the mirrormz : (x, y, z)→ (x, y, 1/2− z).
MEASUREMENTS OF THE (011) G-TYPEREFLECTION
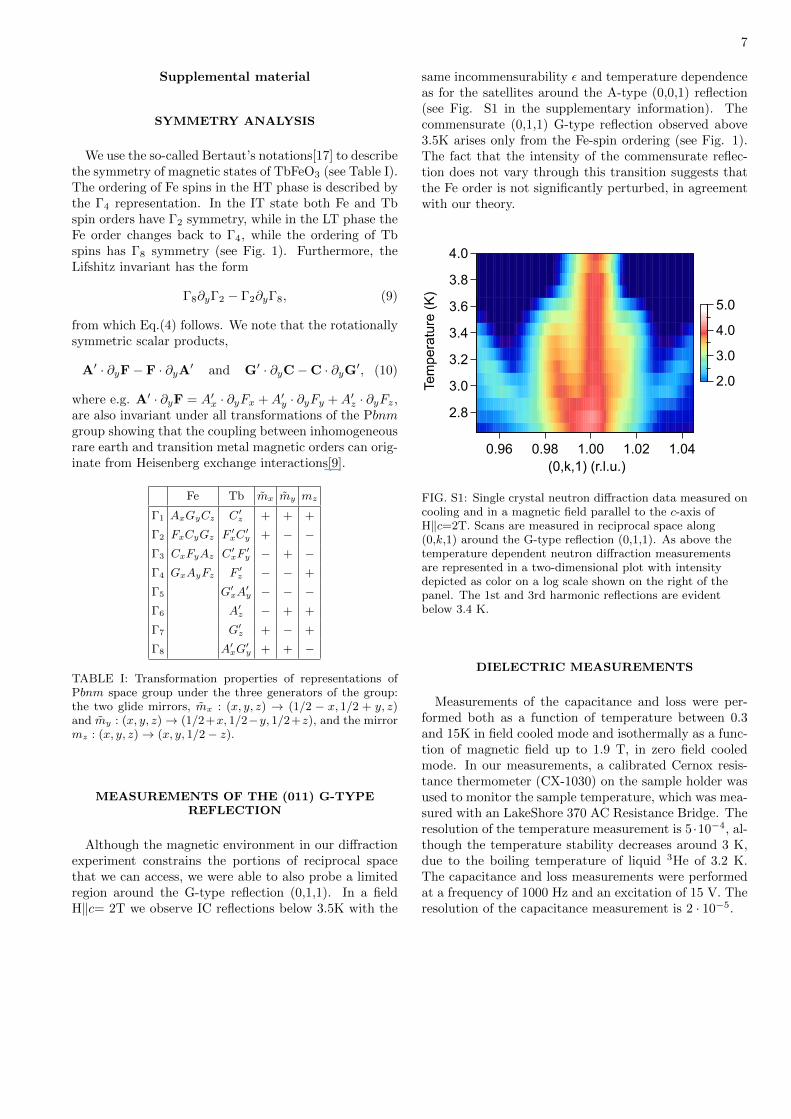
Although the magnetic environment in our diffractionexperiment constrains the portions of reciprocal spacethat we can access, we were able to also probe a limitedregion around the G-type reflection (0,1,1). In a fieldH‖c= 2T we observe IC reflections below 3.5K with the
same incommensurability ε and temperature dependenceas for the satellites around the A-type (0,0,1) reflection(see Fig. S1 in the supplementary information). Thecommensurate (0,1,1) G-type reflection observed above3.5K arises only from the Fe-spin ordering (see Fig. 1).The fact that the intensity of the commensurate reflec-tion does not vary through this transition suggests thatthe Fe order is not significantly perturbed, in agreementwith our theory.
4.0
3.8
3.6
3.4
3.2
3.0
2.8 T
empe
ratu
re (K
)1.041.021.000.980.96
(0,k,1) (r.l.u.)
5.0
4.0
3.0
2.0
FIG. S1: Single crystal neutron diffraction data measured oncooling and in a magnetic field parallel to the c-axis ofH‖c=2T. Scans are measured in reciprocal space along(0,k,1) around the G-type reflection (0,1,1). As above thetemperature dependent neutron diffraction measurementsare represented in a two-dimensional plot with intensitydepicted as color on a log scale shown on the right of thepanel. The 1st and 3rd harmonic reflections are evidentbelow 3.4 K.
DIELECTRIC MEASUREMENTS
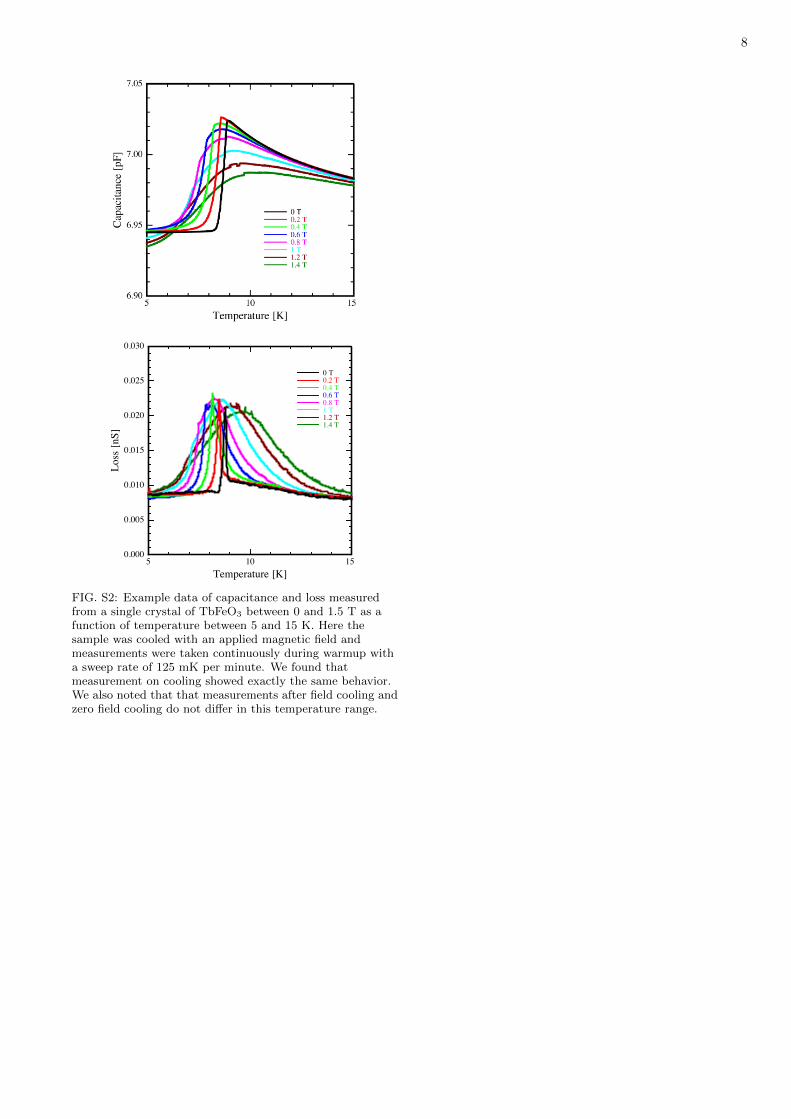
Measurements of the capacitance and loss were per-formed both as a function of temperature between 0.3and 15K in field cooled mode and isothermally as a func-tion of magnetic field up to 1.9 T, in zero field cooledmode. In our measurements, a calibrated Cernox resis-tance thermometer (CX-1030) on the sample holder wasused to monitor the sample temperature, which was mea-sured with an LakeShore 370 AC Resistance Bridge. Theresolution of the temperature measurement is 5 ·10−4, al-though the temperature stability decreases around 3 K,due to the boiling temperature of liquid 3He of 3.2 K.The capacitance and loss measurements were performedat a frequency of 1000 Hz and an excitation of 15 V. Theresolution of the capacitance measurement is 2 · 10−5.
8
5 10 15Temperature [K]
0.000
0.005
0.010
0.015
0.020
0.025
0.030
Loss[nS]
0 T0.2 T0.4 T0.6 T0.8 T1 T1.2 T1.4 T
FIG. S2: Example data of capacitance and loss measuredfrom a single crystal of TbFeO3 between 0 and 1.5 T as afunction of temperature between 5 and 15 K. Here thesample was cooled with an applied magnetic field andmeasurements were taken continuously during warmup witha sweep rate of 125 mK per minute. We found thatmeasurement on cooling showed exactly the same behavior.We also noted that that measurements after field cooling andzero field cooling do not differ in this temperature range.
9
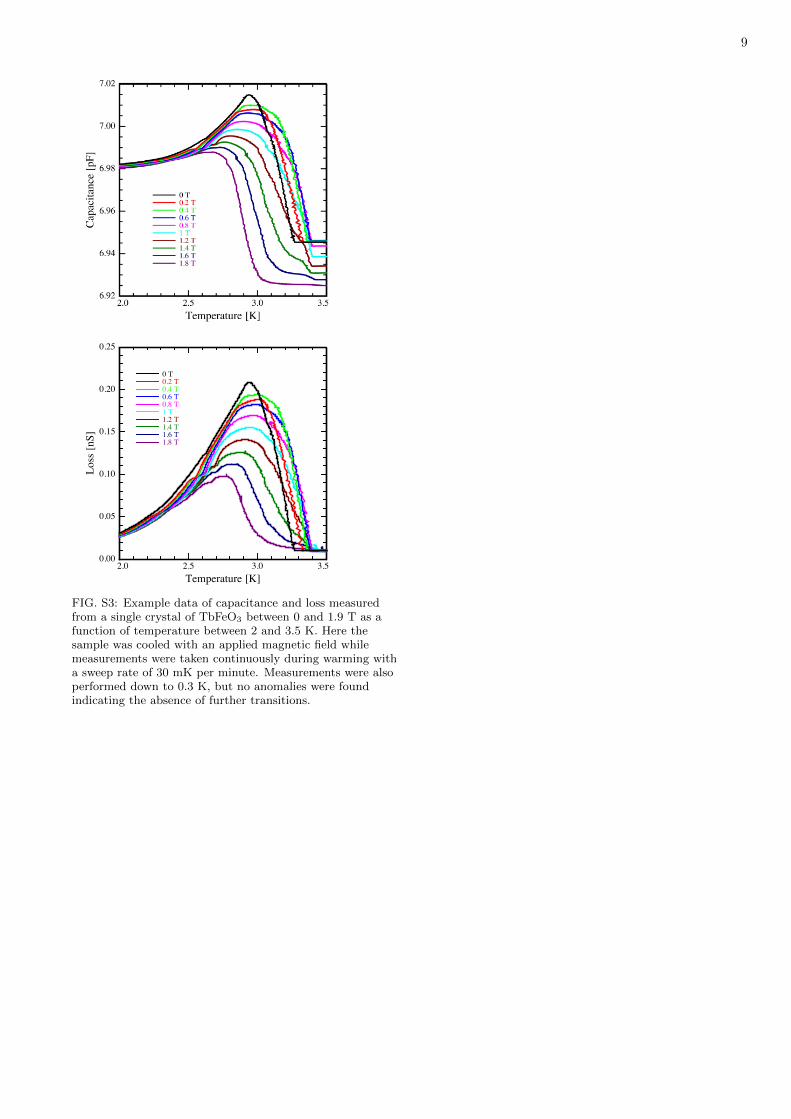
2.0 2.5 3.0 3.5Temperature [K]
0.00
0.05
0.10
0.15
0.20
0.25
Loss[nS]
0 T0.2 T0.4 T0.6 T0.8 T1 T1.2 T1.4 T1.6 T1.8 T
FIG. S3: Example data of capacitance and loss measuredfrom a single crystal of TbFeO3 between 0 and 1.9 T as afunction of temperature between 2 and 3.5 K. Here thesample was cooled with an applied magnetic field whilemeasurements were taken continuously during warming witha sweep rate of 30 mK per minute. Measurements were alsoperformed down to 0.3 K, but no anomalies were foundindicating the absence of further transitions.
10
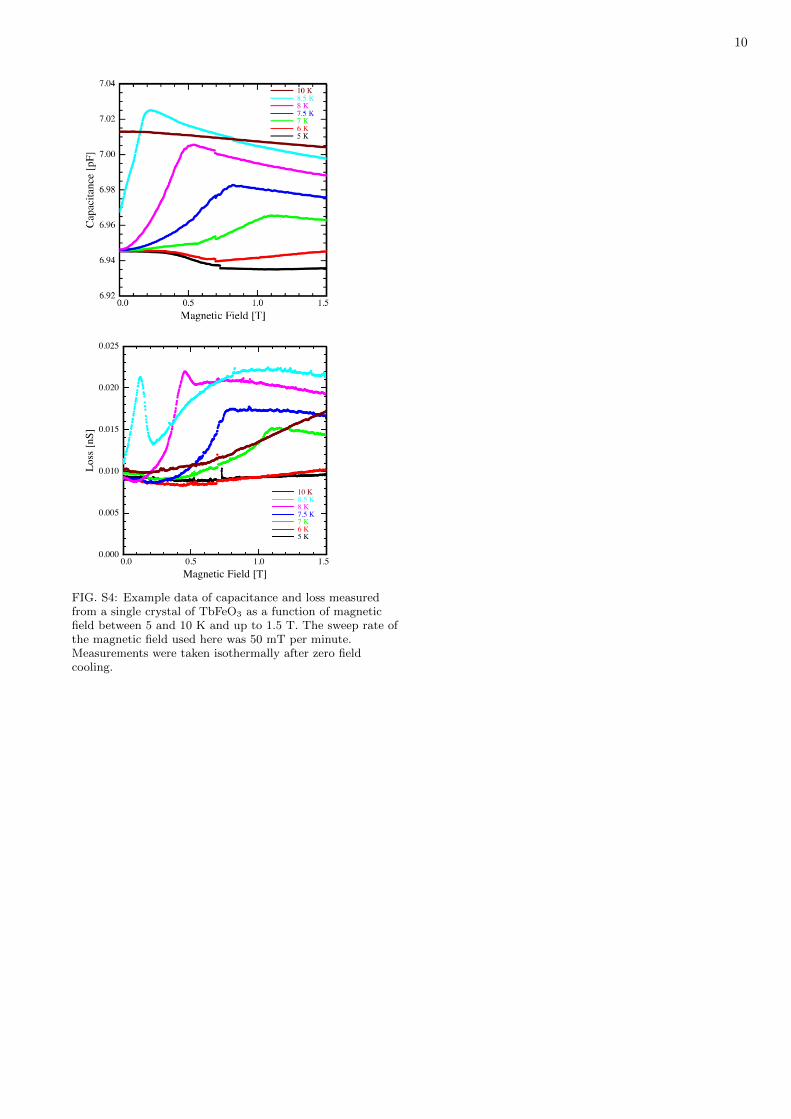
0.0 0.5 1.0 1.5Magnetic Field [T]
0.000
0.005
0.010
0.015
0.020
0.025
Loss[nS]
10 K8.5 K8 K7.5 K7 K6 K5 K
FIG. S4: Example data of capacitance and loss measuredfrom a single crystal of TbFeO3 as a function of magneticfield between 5 and 10 K and up to 1.5 T. The sweep rate ofthe magnetic field used here was 50 mT per minute.Measurements were taken isothermally after zero fieldcooling.
11
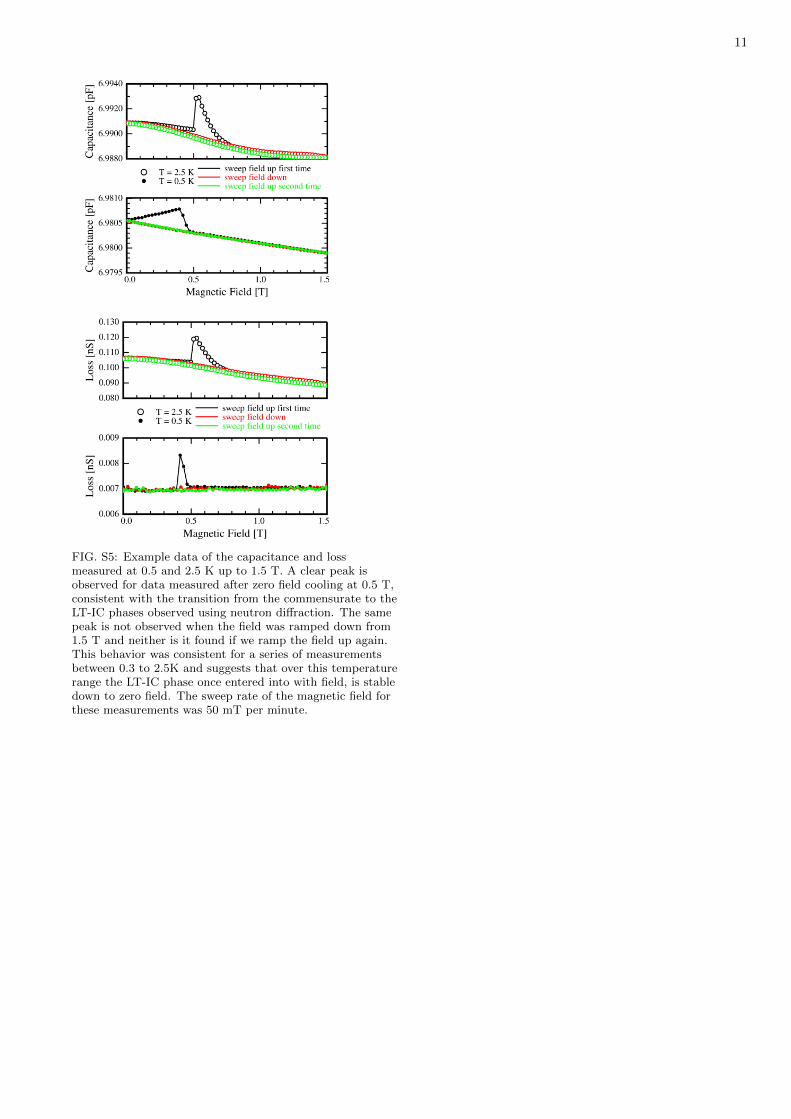
FIG. S5: Example data of the capacitance and lossmeasured at 0.5 and 2.5 K up to 1.5 T. A clear peak isobserved for data measured after zero field cooling at 0.5 T,consistent with the transition from the commensurate to theLT-IC phases observed using neutron diffraction. The samepeak is not observed when the field was ramped down from1.5 T and neither is it found if we ramp the field up again.This behavior was consistent for a series of measurementsbetween 0.3 to 2.5K and suggests that over this temperaturerange the LT-IC phase once entered into with field, is stabledown to zero field. The sweep rate of the magnetic field forthese measurements was 50 mT per minute.