soil erosion from sugar beet in central europe in response to climate change induced seasonal...
TRANSCRIPT

Available online at www.sciencedirect.com
) 91–105www.elsevier.com/locate/catena
Catena 72 (2008
Soil erosion from sugar beet in Central Europe in response to climatechange induced seasonal precipitation variations
Gerald Scholz a, John N. Quinton a,⁎, Peter Strauss b
a Lancaster Environment Centre, Lancaster University, Lancaster, LA1 4YQ, UKb Bundesamt für Wasserwirtschaft, Institute für Kulturtechnik und Bodenwasserhaushalt, Petzenkirchen, A-3252, Austria
Received 5 June 2006; received in revised form 2 April 2007; accepted 13 April 2007
Abstract
This study estimates the implications of projected seasonal variations in rainfall quantities caused by climate change for water erosion rates bymeans of a modeling case study on sugar beet cultivation in the Central European region of Upper-Austria. A modified version of the revisedMorgan–Morgan–Finney erosion model was used to assess soil losses in one conventional and three conservation tillage systems. The model wasemployed to a climatic reference scenario (1960–89) and a climate change scenario (2070–99). Data on precipitation changes for the 2070–99scenario were based on the IPCC SRES A2 emission scenario as simulated by the regional climate model HadRM3H. Weather data in daily time-steps, for both scenarios, were generated by the stochastic weather generator LARS WG 3.0. The HadRM3H climate change simulation did notshow any significant differences in annual precipitation totals, but strong seasonal shifts of rainfall amounts between 10 and 14% were apparent.This intra-annual precipitation change resulted in a net-decrease of rainfall amounts in erosion sensitive months and an overall increase of rainfallin a period, in which the considered agricultural area proved to be less prone to erosion. The predicted annual average soil losses under climatechange declined in all tillage systems by 11 to 24%, which is inside the margins of uncertainty typically attached to climate change impact studies.Annual soil erosion rates in the conventional tillage system exceeded 10 t ha−1 a−1 in both climate scenarios. Compared to these unsustainablyhigh soil losses the conservation tillage systems show reduced soil erosion rates by between 49 and 87%. The study highlights the importance ofseasonal changes in climatic parameters for the discussion about the impacts of global climate change on future soil erosion rates in CentralEurope. The results also indicate the high potential of adaptive land-use management for climate change response strategies in the agriculturalsector.© 2007 Elsevier B.V. All rights reserved.
Keywords: Climate change; Soil erosion; Precipitation; Sugar beet; Conservation agriculture; Erosion modelling
1. Introduction
Climate change of anthropogenic origin is widely acceptedas being reality by most scientists (IPCC, 2001b). Weatherrecords from meteorological stations around the world docu-ment a long-term trend of rising average global temperature of0.6±0.2 °K over the 20th century (IPCC, 2001b). Besidestemperature, climate change affects other weather parameters.Precipitation patterns are predicted to change and extremeweather events (floods, hurricanes, droughts, etc.) are likely tooccur more frequently. Karl et al. (1996) quantified the chance
⁎ Corresponding author. Tel.: +44 1524 593 654.E-mail address: [email protected] (J.N. Quinton).
0341-8162/$ - see front matter © 2007 Elsevier B.V. All rights reserved.doi:10.1016/j.catena.2007.04.005
to less than 1 in 1000 that the recent increase in extreme weatherevents and in the number of wet days in the USA could havetaken place under a quasi stationary climate. But considerableuncertainty exists with regard to the specific character of climatechange impacts, because most impacts will vary widely in scale,intensity and time of occurrence among different regions (IPCC,2001a). Also the individual vulnerability and adaptive capacityof the affected biophysical and socioeconomic systems willstrongly influence the severity of climate change impacts(IPCC, 2001a). It is likely that continued climatic change willaggravate the problem of accelerated soil erosion in most areasaround the world, which are affected by human activities. Thisis especially true for agricultural land, where many parametersinfluencing the soil's vulnerability to erosion are likely to be

92 G. Scholz et al. / Catena 72 (2008) 91–105
altered with global warming, such as precipitation amounts andintensities. Plant growth conditions and agricultural practicemay also change as land-use management strategies becomeadapted to a changing climate (e.g. Parry, 1990; Rosenzweigand Hillel, 1998; Williams et al., 2002). The specific degree ofchange in soil loss rates will depend on the climate sensitivity ofeach system and the intensity of local climate change effects.
Yang et al. (2003) estimated a global average increase in soilloss of 14% under climate change using a GIS-based RUSLEmodel (Revised Universal Soil Loss Equations (Renard et al.,1997)). They used a numerical climate change simulation andconsidered future changes in land cover based on actual andhistorical land-use data, present trends in land-use developmentand assumptions about future economic development. Lal(1994) pointed out, that such global estimations often depend onnumerous extrapolations and assumptions, which are likely toproduce huge errors. But there is also a small number of morespecific modelling studies trying to appraise the potentialimpact of climate change on soil erosion rates for selected areasaround the world (Table 1).
Table 1Selected studies on regional impacts of climate change on soil erosion
Publication Reseach design and results
Study area Models andtools
Studied parameters Soil erosionrate
Farvis-MortlockandBoardman(1995)1
UK SouthDowns
2×CO2
climatescenarioWXGEN2
EPIC3
Rainfall amounttemperature
+150%
Farvis-MortlockandGuerra(1999)
MatoGrosso,Brazil
HADCM25
WEPP4Precipitation
temperature CO2
Annualmean: +27%
Nicks(1993)
USA, 69sites
2×CO2
climatescenarioCLIGEN2
Mean temperatureRainfall amount and
frequency
+10.7 to83.9%
Pruski andNearing(2002b)
Varioussites in the
USA
WEPP Rainfall amount andintensity
+0.85 to2.38% per+1%precipitation
Savabi andStockle(2001)
Indiana,USA
WEPP Temperaturevegetation growth
CO2
Down to−5.5%
Michaelet al. (2005)
Saxony,Germany
ECHAM4-OPYC35
EROSION2D6
Precipitationintensities/extremeweather events
+22 to 66%
O'Neal et al.(2005)
MidwesternUSA, 11sites
HadCM3-Ggal5
CLIGENWEPP-CO2
Precipitation,temperature, soilcover, adaptivemanagement
+10 to 274%
Zhang andNearing(2005)
El Reno,Oklahoma,
USA
HadCM35
CLIGENWEPP
Precipitation,temperature, tillage
systems, cropgrowth
+18 to 30%
Pruski and Nearing (2002b) extended their research on thesensitivity of erosion processes to changes in rainfall (as quotedin Table 1) by using a modified version of the WEPP model toinclude the impacts of climate change on plant biomassproduction, such as CO2 fertilization, and changes in soilmoisture and solar radiation (Pruski and Nearing, 2002a). Basedon this method and climate simulations of the HadCM3 model,the following qualitative conclusions on the impact of climatechange on soil erosion were drawn: (i) both a change inprecipitation amounts and a shift in precipitation intensities areimportant aspects to consider in predicting future soil loss; (ii)significant precipitation increases are likely to increase soillosses at disproportional higher rates; (iii) soil erosion rates aremore sensitive to runoff than to biomass production. Nearing(2001) investigated the impact of climate change on rainfallcharacteristics related to their ability to cause soil particledetachment and transport (rainfall erosivity). The author usedthe output of global circulation models (GCMs) and statisticalrelationships on erosivity values from the RUSLE model tocompute climate change induced alterations of the erosivepower of rainfall in the USA. Despite certain inconsistencies,the results showed critical changes in rainfall erosivity of up to58% at some locations, which may considerably affect futuresoil erosion rates. Walling and Webb (1996) suggested on basisof empirical data from the Dnestr River in Ukraine that climateforcing already affected soil erosion rates on local scale. Thestudy analysed historical land-use data from the catchment areaand attributed a recorded five-fold increase in sediment loadscarried by the river since the 1950s in part to major land-usechanges, such as forest clearances, but more importantly toobserved climatic changes.
In central Europe, especially the cultivation of root crops,such as potatoes, carrots and sugar beet is often associated with ahigh risk of severe soil losses by water (e.g. Jones et al., 2003).This is accounted for by the coincidence of two factors: groundand canopy cover are low during the time of seedbed preparationand in the first weeks of vegetative development, and secondlythis period concurs with the time of the year showing the highestamount of erosive rainfall (Strauss et al., 1995).
There is a large toolbox of soil conservation measures (e.g.Hudson, 1995; Morgan, 2005). One such measure is conserva-tion agriculture, which seeks to avoid unsustainable soil losseswhile maintaining stable yields. Common approaches includereduced tillage and no-tillage systems, often combined withintercrop cultivation and mulching, to preserve the natural soilstructure and a vegetative soil surface cover (e.g. Cannell andHawes, 1994; Tebrügge and Düring, 1999). Maintaining a soilcover by utilising post-harvest residues or living vegetation toprotect soil surfaces from raindrop impact is particularlyimportant to limit soil erosion (e.g. Pimentel et al., 1993;Rose, 1994; Stocking, 1994).
The potential impacts of climate change on Europeanagriculture have been the focus of a number of studies. Forexample Downing et al. (2000) compiled a broad collection ofimpact studies on the effects of CO2 fertilization, temperaturevariability and precipitation changes on plant growth, cropyields, nutrient cycling and pest infestation. Also the process of

93G. Scholz et al. / Catena 72 (2008) 91–105
soil erosion and its consequences have been extensively studiedin recent decades (e.g. Wischmeier and Smith, 1978; Julien,1995; Summer et al., 1998) and the complex role of soilresources in agriculture under a changing climate have beenrecognized in various publications (e.g. Rosenzweig and Hillel,1998; Frisvold and Kuhn, 1999). However, studies on thepossible impact of climate change on erosion rates are rare andin particular for Central Europe such studies are indeed veryscarce (Table 1).
The aim of this case study is to estimate the impact of climatechange induced variations in seasonal rainfall pattern on soilerosion rates in the pre-alpine region (Alpenvorland) of Upper-Austria (Oberösterreich), Europe. The specific study objectivesare:
• To contribute to filling the gap of climate change impactstudies on soil erosion by providing a case study for anagricultural area in Central Europe.
• To assess the influence of land-use management strategiescompared to the impacts of seasonal changes in precipitationin this specific case, and to evaluate, if improved land-usemanagement can offset these impacts.
• To test a methodology for a rapid evaluation of the potentialimpact of seasonal rainfall variations on soil erosion rates ona local scale.
• To provide regional policy makers with additional informa-tion for policy development in the agricultural andenvironmental sector.
2. Methodology
The impact of climate change induced variations in seasonalrainfall pattern on soil erosion rates in the Central European
Fig. 1. Geographical distribution of crops with a high erosion risk in Austria. TheAlpenvorland and the locations of experimental plots Enns and Ried belong to the m
agricultural sector was assessed by means of a modelling casestudy on sugar beet (beta vulgaris) cultivation in Upper-Austria.Selected environmental, agricultural and climatic baselineconditions refer to a research project, which was carried outby Kunisch et al. (1995) in this region to determine soil lossesfrom experimental plots with consideration of differentagricultural practices.
2.1. The study region
Summer et al. (1998) documented a 32% increase insediment yields over the last 40 years in the Austrian part ofthe Danube river basin and agriculture was identified as themajor cause for soil erosion in the catchment area. The federalprovince of Upper-Austria is part of an agriculturally intensivecentral European region located north of the Alps. Nearly 50%of its total surface is classified as agricultural land. Fig. 1 showsthe geographical distribution of crops with a high soil erosionrisk in Austria (Strauss and Klaghofer, 2006). The study area islocated within this zone of crops with high erosion risk.
The Alpenvorland has an altitude reaching from 200 m to850 m above sea level (asl.). Mean annual precipitation isapproximately 1000 mm and the average temperature isbetween 6 and 8 °C depending on the altitude (OOE-GV,2005). The number of rain days is 127–135 per year(Hydrographischer Dienst in Österreich, 1994).
The main cultivated crops in Upper-Austria are cereals,maize, oilseeds, forage crops, potatoes and beets (Land-esregierung Oberösterreich, 2003). In this study we focus onsugar beet as it is a typical example of the erosion sensitive rootcrop farming in the region. Common tillage practices in sugarbeet cultivation include the use of cultivators (ripper) andmouldboard ploughs in autumn for weed control, to prevent soil
federal province of Upper-Austria is highlighted showing that the study regionost erosion sensitive areas of Austria (Strauss and Klaghofer, 2006).

94 G. Scholz et al. / Catena 72 (2008) 91–105
compaction and to quickly incorporate fertilizers and the cropresidues. The sugar beet seedbed is prepared in spring with twotillage operations using combinations of different types ofharrows. These practices do not include any particular measuresto prevent water erosion in the most critical period of the yearduring spring and early summer.
2.2. The reference study
Kunisch et al. (1995) researched the effect of different sugarbeet cultivation practices on soil erosion between 1992 and1995 in the Alpenvorland region. The project was carried out onthree sites in close proximity to each other. Two of them were inthe district Enns and one in the district Ried/Riedmark in Upper-Austria. Study sites needed to change because sugar beet is notcultivated in subsequent years on the same plot. Neverthelesscultivation practice and employed equipment were keptconstant over the period of the experiment and soil propertiesdiffered just slightly between locations as presented in Table 2.
Four different tillage systems for the cultivation of sugar beetwere analysed with respect to runoff production and sedimenttransport. The agricultural year began after the harvest of barley(Hordeum) or winter wheat (Triticum). This was followed bythe preparation of experimental plots either by conventionalploughing or by cultivation of intercrops. Sugar beet was sownin April and harvested after approximately 5 months. Thecomplete agricultural year in this cultivation system comprises aperiod of 13 months from seedbed preparation for intercropsuntil sugar beet is harvested. This means that the monthSeptember occurs twice in the agricultural year, but is has not
Table 2Important soil physical properties and related hydrological characteristics of theexperimental plots at study locations Enns and Ried in High Austria (BMLF,1972, 1982)
SoilProperties ofExperimentalPlots
Qualitative description of soil characteristics
Enns Ried/Riedmark
Type Brown earth, gley Brown earth, partly colluvialpH Neutral to weakly acidic Strong acidicInfiltrationcapacity
Low Medium
Waterstoragecapacity
Medium Medium
Organicmattercontent
Medium Low to medium
Workabilityaspects
Clods form whenwater is logged
Occasional surfacesealing
Agriculturalquality
High High
Soil textureofhorizons
A (20–30) cm: Slit, loamy siltBP (55–70 cm): Loamy silt,silty loam or loam S (100 cm):Loamy silt, silty loam, loam
A, AB (10–15 cm, 30–45 cm): Loamy sand or sandyloam B1, B2 (50–65 cm, 90–110 cm): Sandy loam, loam orsilty loam B3 (120 cm): Silt,sandy loam, loamy silt, or siltyloam
been double-counted as it is used first under conditions ofseedbed preparation and later under harvest conditions. Thistime frame has been chosen to take all erosion relevant periodsunder sugar beet cultivation into account and is maintainedthroughout this study. It is however only a partial analysis of theagricultural practice, which normally involves different cropsover two or more years on each plot. Unfortunately, the avail-able data set did not provide erosion data for entire rotationcycles.
The four cultivation practices on the experimental plots aredescribed as follows: For conventional tillage (PT) a mould-board plough was used in late August after harvesting thepreceding crop to break up the soil for incorporating mineraland organic fertilizers and to improve soil physical properties.The plots were ploughed again in November to create a stablefurrow over the winter, which prevented soil erosion to a largeextent. In April a rotary harrow trailing a tooth packer roller wasused for seedbed preparation directly before sugar beet wasdrilled.
In the reduced tillage with intercrops (RTI) treatment, theexperimental plots were ploughed just once after harvest,followed by seedbed preparation using a rotary harrow. Intercropspecies such as Mustard (Sinapis alba L.) and Phacelia (Phaceliatanacetifolia) as monocultures or as a mixture of Phacelia,Buckwheat (Fagopyrum esculentum), Persian Clover (Trifoliumresupinatum) and Common Vetch (Vicia sativa) were thenplanted. These species are usually killed by frost in January andthe residues create a nearly complete soil cover. A flail mowerwasapplied in February to cut the plant residues for mulching. It wasnecessary to spray a non-selective herbicide a few days beforesugar beet was drilled in order to reduce competition by weedgrowth. The sugar beet seedbed was prepared as for PT.
The conservation tillage with intercrops and mulching(CTIM) and no-tillage with intercrops and mulch (NTIM) useda subsoiler in combination with a rotary harrow for intercropseedbed preparation in autumn. In spring a flail mower and non-selective herbicides were applied in both systems to prepare theintercrop residues for sugar beet cultivation. The only differencebetween the two systems was that under NTIM the sugar beetwas drilled without seedbed preparation directly into the mulch,while in CTIM a seedbed was prepared by harrowing the plots orby using a rotary cultivator. Table 3 summarizes the major tillageoperations in the four cultivation systems, which potentiallyaffect the soil's vulnerability to erosion.
The experimental set-up in this reference study consisted of12 adjacent plots of 16 m2 created in a horizontal line. Erosiontraps collected sediment and runoff during the erosion sensitiveperiods of intercrop cultivation from August to October andduring the growing season of sugar beet from April toSeptember. Additionally, some rainfall simulation experimentswere undertaken in April 1993 and April/May 1995 andSeptember 1995. Runoff and sediment yield were measuredduring simulated extreme precipitation events of 35–45 mmwith an intensity of 60 mm h−1 in all four tillage systems onsmaller 12 m2 plots.
Compared to the PT average sediment yields in RTIdiminished by 69%, CTIM led to a decrease in erosion of

Table 3Agricultural calendar for the four tillage systems
Agriculturalcalendar
Major tillage operations affecting ground cover
PT RTI NTIM CTIM
September Ploughing Ploughing andharrowing
Harrow andsubsoil tiller
Harrow andsubsoil tiller
September – Intercropsowing
Intercropsowing
Intercropsowing
November Ploughing – – –February – Cutting of
intercropCutting ofintercrop
Cutting ofintercrop
Mid-April Seedbedpreparation/drilling
Seedbedpreparation/drilling
Seedbedpreparation/drilling
Directdrilling
September Harvest Harvest Harvest Harvest
95G. Scholz et al. / Catena 72 (2008) 91–105
93%; and NTIM reduced sediment loss by 98%. A substantialdifference between different intercrop species in terms of soilprotection could not be identified (Strauss and Schmid, 2004).Therefore no specific intercrop species was selected for thisstudy and the chosen vegetation parameter values refer tocommon intercrops species of similar vegetative development,such as Mustard, Phacelia and Alfalfa (see section on parameterselection).
The data gathered in the described experiments were used forthe calibration of the erosion model used in this study.Furthermore the same set of tillage systems and an identicalagricultural calendar were applied to the climate scenariosgenerated for the erosion model runs. Table 4 provides anoverview on the dataset produced by Kunisch et al. (1995).
2.3. The revised Morgan–Morgan–Finney soil erosion model—a modified version
The Morgan–Morgan–Finney (MMF) model is a simpleerosion model based on empirical relations for predictingannual soil loss from field-sized areas on hill-slopes (Morgan etal., 1984). Morgan et al. (1984) tried to retain the practicality ofUSLE (Universal Soil Loss Equation) in this model, butincorporated some of the more recent advances in the researchon soil erosion processes to strengthen the physical basis of the
Table 4Summary of the dataset on erosion measurements for Upper-Austria used in this stu
The applied dataset on erosion events: records of precipitation events and erosion
Recording period No. ofprecipitation
events
No. of erosiverain events
Number of erosionmeasurements pr
1992 a 8 3 141993 31 17 781994 58 8 261995 56 6 47Rainfall simulatorexperiments
3 3 26
Only the precipitation events in the respective years are included, during which the erothe aggregated number over all plots under observation.a Autumn only.
model. The model was extensively validated using erosion plotdata and successfully applied by researchers working in widerange of biophysical environments. In 2001, Morgan revised themodel and refined the description of the erosion processes andimproved its ease of use in terms of parameter selection. Nofundamental changes in the model settings resulted from theseadjustments. However, the revised MMFmodel can now also beapplied to small catchments as successfully demonstrated byMorgan (2001) in the repeated and extended validation.
The MMF model separates the erosion process into asediment phase and a water phase. In the water phase, thekinetic energy of rainfall and amount of runoff are calculated.The sediment phase of the model applies these terms to computethe mass of soil detached by rain splash and runoff wash, whichsum up to the total amount of soil detached during aprecipitation event. Furthermore, the sediment transportcapacity of the overland flow is calculated. Soil loss isdetermined by comparing soil detachment and runoff transportcapacity by treating them both as limiting factors in the soilerosion process. Results on erosion rates in the MMF model arein the case of transport limitation most sensitive to soilparameters and to annual rainfall. Whilst detachment limited,model results are most responsive to annual rainfall and averagedaily precipitation (Morgan, 2005).
The revised MMF model uses a set of 15 input parameters,which describe soil, rainfall, vegetation, and land-use manage-ment (Morgan, 2005). These parameters are applied as annualaverages to allow the estimation of soil loss per year during asingle time-step calculation. This process constitutes a majorsimplification in the model and significantly limits its applica-bility for this study. Recalling the study's objective of estimatingsoil erosion rates under climate change and bearing in mind thatsignificant changes in precipitation pattern are likely to beseasonal, an adaptation of the model was necessary. Theintroduction of an adequate temporal resolution to the modelrun was therefore realized achieving a proper reflection of theimpacts of intra-annual precipitation changes in the results.
Most sections of the model algorithm remain unaffected bychanging soil and vegetation parameters from annual averagesto monthly values (Table 5). However the computation of therunoff had to be altered, since the parameter annual rainfall is
dy
measurements
Max.ecipitation[mm]
Max. soil loss per event —conservation tillage [kg/m2]
Max. soil loss per event —conventional tillage [kg/m2]
36 1.44 0.0151 0.49 0.970 0.07 0.3344 0.2 0.79
35–45 1.69 2.83
sion traps on the 12 plots were installed. The number of erosion measurements is

Table 5The algorithm of the revised MMF erosion model including the modification ofthe runoff estimation in the water phase (Morgan, 2001; USDA, 2002)
Erosionmodelalgorithm
Equations, parameters and variables of the modified MMF erosionmodel
Equations Parameter/Variables
Water phase(1) ER=R×(1–A) ER — effective rainfall [mm](2) LD=ER×CC R — daily rainfall [mm]
A — interception coefficient [0–1](3) DT=ER−LD LD — leaf drainage [mm](4) KE(DT)=DT(8.95+
844 log I)CC — canopy cover [0–1]
(5) KE(LD)=LD((15.8−PH0.5)−5.87)
DT — direct throughfall [mm]KE — kinetic energy [J m−2]
(6) KEtot=KE(DT)+KE(LD)
I — typical intensity of erosive rain[mm h−1]
(7)MR ¼ 1000
CN� 10
PH — plant height [m]MR — potential maximum retention[mm]
(8)Q ¼ ðR� ð0:2MRÞÞ2
ðRþ 0:8MRÞCN — curve number (1–100)Q — runoff [mm]
Sediment phase(9) F=K×KEtot×10
−3 F — soil detachment by raindrop impact[kg m−2]K — soil detachability index [g J−1]
(10) H=ZQ1.5 sinS(1−GC)×10−3
H — soil detachment by runoff [kg m−2]
(11)Z ¼ 1
ð0:5� COHÞS — slope steepness [°] radiantGC — ground cover [0—1]
(12) J=F+H Z — resistance of soil [kPa−1]COH — cohesion of surface soil [kPa]
(13) G=CQ2sin S×10−3 J — total soil detachment [kg m−2](14) E=min(J, G) T — runoff transport capacity [kg m−2]
E — soil loss [kg m−2]
Table 6Ranges of vegetation parameters over the agricultural year in different tillagesystems
Vegetation parameter ranges over the year and parameter sources
Parameter PT RTI NTIM CTIM Source
A [0–1] 0–0.15 0.1–0.2 0.1–0.2 0.1–0.2 Morgan (2005),Hoyningen-Huene (1983)
PH [m] 0–0.6 0.01–0.5 0.01–0.5 0.01–0.5 CPIDS a
Kaffka (2001)CC [0–1] 0–0.95 0.1–0.95 0.1–0.95 0.1–0.95 CPIDS a;
Jensen and Spliid (2003),Schmidt et al. (1996)
GC [0–1] 0–0.15 0.03–0.08 0.42–0.8 0.42–0.8 Shelton et al. (1995),Schmidt et al. (1996)
a CPIDS — Crop Parameter Intelligent Database System from the NationalSoil Erosion Research Laboratory (NSERL), Purdue University, USA. (USDA,2005).
96 G. Scholz et al. / Catena 72 (2008) 91–105
used in the respective equations of the MMF model and therelationship between it and runoff is non-linear. A simplefragmentation of that term into smaller time-steps was notpossible. Instead, the runoff calculation method of the revisedMMF model was replaced with the Soil Conservation Service(SCS) curve number (CN) technique (Table 5, Eqs. (7) and (8))(Mockus, 1972). The SCS method has been used in a variety oferosion models such as EPIC or CREAMS (Chemicals, Runoffand Erosion from Agricultural Management Systems) and iswell established as a simple tool to calculate runoff from rainfallin hydrologic engineering and environmental impact assess-ments (Ponce and Hawkins, 1996).
The exchange of Morgan's runoff calculation methods withthe SCS method allows the use of daily precipitation time-stepsinstead of annual time-steps. Additionally, the total number ofinput parameters is reduced from 15 to 11. The parametersignored in the modified model version are annual rainfall (Ra),the ratio of actual to potential evapotranspiration (Et/Eo) and thesoil parameters bulk density (BD), soil moisture content (SM)and effective hydrological depth (EHD). These parameters, with
exception of annual rainfall, are difficult to determine withoutextensive field measurements and therefore often used for thecalibration of the revised MMF model, when field data areabsent. Those parameters being important to represent soilhydrological properties (BD, SM, EHD) are summarized in thecurve number (CN) of the SCS method (Mockus, 1972).
2.4. Parameter selection
The model algorithm requires information on a number ofparameters, which needs to be acquired through field researchor from empirical data sets. In this study, data were taken fromvarious empirical sources, including general values suggestedby Morgan (2001, 2005). These values were adapted asprecisely as possible to the local conditions in Upper-Austriausing the study of Kunisch et al. (1995). Vegetation parameterswere selected from various sources (Table 6). Data on intercropspecies were obtained from studies on Phacelia, Mustard andAlfalfa. The vegetative development of these species is similarand minor variations do not cause any noticeable influence onthe modelled erosion rates.
The crop management factor (C) in the MMF model is afactor equal to the product of C (crop/vegetation andmanagement) and P (erosion control practice) of the UniversalSoil Loss Equation (Morgan, 2001). Factor C in the MMFmodel is a significant term in the calculation of runoff transportcapacity. Here, C was used as a calibration term, because fewsources exist that suggest values for C as it is defined for theMMF model. For months with insufficient records for a soundcalibration, C was calculated after a method by Schwertmannet al. (1987) based on empirical data gathered in Bavaria,Germany. Schwertmann et al. (1987) provide detailed data forthe relative soil loss from various crop rotations dependenton farming techniques and cultivation periods over the yearcompared to the potential soil loss from uncultivated, ploughedfallow land (Schwarzbrache). C values are obtained bycombining the relative soil loss factor of the studied crop witha area-specific values for the relative amount of erosive rainfalloccurring in a specified period of time. Typically, C values

97G. Scholz et al. / Catena 72 (2008) 91–105
differ widely between crops, cultivation techniques anddifferent cultivation periods (Schwertmann et al., 1987). SinceBavaria and the study region Upper-Austria are geographicallyproximate and cultivation techniques are generally similar, themethod and input variables by Schwertmann et al. (1987)provide satisfactorily close estimates of C values used in thisstudy. For some months the C values were slightly modified inthe calibration process to improve the performance of theerosion model (see below).
The input values for the soil parameters in the erosion modelwere selected according to suggestions by Morgan (Morgan etal., 1998; Morgan, 2001). The soil detachment index (K) wasfixed at 0.9 g J−1 and the value for cohesion of surface soil(COH) at 3 kPa. These values correspond to those recom-mended for silt loam soils, which are reasonable representationsfor the brown earth soils of the experimental plots. The typicalintensity for erosive rain (I) for the region is best approximatedby a value of 10 mm h−1 (Morgan, 2001). These parameterswere kept constant in the model application. A slope steepness(S) of 15° and was chosen to reflect the conditions in theexperimental plots studied by Kunisch et al. (1995) representingtypical cultivation areas in Upper-Austria.
Soil parameters were treated as being constant across alltillage systems as well as over time with the exception of CN(Table 7). The curve number (CN) value in the SCS method forrunoff estimation is used for computing the soil's potentialmaximum retention of rainfall water, which depends mainly onthe infiltration properties of the soil and on its surface storagecapacity (USDA, 2002). Seasonal variations of the CN valuerelate to the hydrological effects of tillage operations andvegetation cover. Since the SCS method is mainly applied in theUSA, soils in Europe have not been consistently classified intoany of the hydrological soil groups being used for thedetermination of CN. The soils in the study region of Upper-Austria have hydrological features that correspond to the soilgroups B or C of the SCS method, which are characterised byhaving a slow to moderate rate of water transmission (Mockus,1969). This served as a starting point for the determination ofCN in the calibration process. Relevant seasonal changes ofrunoff behaviour caused by tillage operations were includedthrough this factor into the modelling process.
2.5. Calibration of the erosion model
The modified version of the revised MMF erosion model wascalibrated with precipitation and erosion data from experimentalplots cropped with sugar beet and various intercrop species inUpper-Austria. The parameters to be calibrated were CN repre-
Table 7Ranges and annual averages of the calibration terms C and CN in the different tillag
C-factor and CN in the revised MMF erosion model Rang
PT
C-factor 0.01–0.9 (0.25)CN 55–93 (71)
senting soil hydrological properties and the crop cover manage-ment factor C. Table 7 gives the ranges and annual averagevalues of CN and C, which resulted from the model calibrationand from supplementary calculations of C using the method ofSchwertmann et al. (1987). The averaged C factors in thedifferent tillage systems correspond sufficiently well to valuesestimated by Morgan (2005) and Schmidt et al. (1996). Thecalibration of the erosion model through the C and CN valueshas the function to effectively absorb the imprecision resultingfrom generalized soil and vegetation parameters chosen fromliterature. Thereby the local conditions determining soil erosionthrough water are better reproduced and model performance isimproved, even though the specific C and CN values occasion-ally appear to be slightly outside the conventional range nor-mally quoted in the literature in RUSLE and the MMF model.
Fig. 2 shows that the erosion model captures the response ofthe PT and CTIM treatments to increases in precipitation, whichis also true for the other treatments not represented in the figure.Model performance in all other tillage systems improves forprecipitation events between 20 and 35 mm.
Testing the model against the results of rainfall simulatorexperiments of Kunisch et al. (1995) showed that the modelunderestimates erosion rates during extreme rainfalls. Thesimulated events of 35–45 mm rainfall with an intensity of60 mm h−1 resulted in soil losses for PT, RTIM and CTIMsystems that exceed the model predictions by a factor 6.0 to 7.3.Conversely NTIM showed higher values in the soil lossprediction than actually measured. However, extreme events ofN35 mm rainfall per day are rare in the study region. AtVorchdorf meteorological station an annual average of 1.44rainfall events exceeded 35 mm between 1975 and 2001. Localrainfall intensities are usually below 60 mm h−1, which meanssoil losses during N35 mm events are likely to be on averagelower than measured in the high intensity rainfall simulatorexperiments. This is likely to reduce the error for N35 mmprecipitation events below the factor 6.0 to 7.3, but neverthelessthe model's underestimation of soil loss rates during extremerainfall events persists and is likely to cause a systematic error inthe results. This will be discussed below together with othersources of uncertainty relevant to this study.
The model performs reasonably well for the range ofprecipitation events up to 35 mm, which comprise about 98% ofthe potentially erosion relevant rainfall events over the year. Inthis range of rainfall events, the measured average erosion ratesare accurately reproduced and also the effect of differentagricultural practices on soil loss is adequately reflected. Astatistical evaluation of the calibrated model against field datameasured in May and June is given in Table 8. Measured
e systems
es and annual averages (in brackets) in different tillage systems
RTI NTIM CTIM
0.01–0.52 (0.15) 0.01–0.27 (0.07) 0.01–0.27 (0.06)75–82 (78) 65–70 (68) 60 (60)

Table 8The results of statistical tests on MMF erosion model performance for themonths May and June are given in this table
Statistical test of modelperformanceafter calibration
Model performance in different tillage systems
PT RTI NTIM CTIM
May 10degrees offreedom
χ2-value 1.69 2.21 6.48 10.78Probability 0.99 0.99 0.77 0.37
June 11degrees offreedom
χ2-value 7.92 3.63 1.83 2.00Probability 0.72 0.98 0.99 0.99
The model behaviour is satisfactory for these precipitation intensive periods,considering the high number of changing vegetation parameters in the earlygrowing stage of sugar beet.
Fig. 2. Model behavior after the calibrating it with the dataset of Kunisch et al.(1995) for the (a) PT and (b) CTIM treatment. In both cases three measurementsof each precipitation event give a range soil erosion data. Each measurement wasgained on a different plot. All three plots have been cultivated using exactly thesame tillage operations. The dashed trendline describes the model behaviour.
98 G. Scholz et al. / Catena 72 (2008) 91–105
sediment yields of single rainfall events were compared againstthe model predictions (as graphically demonstrated in Fig. 2)and resulting differences are expressed by the statistical χ2
distribution and the corresponding probabilities. A value closeto 1 describes a high accuracy of model predictions.
2.6. Weather data for climate change impact studies
The assessment of regional and local climate change, whichis essential for the precise estimation of impacts and for thedevelopment of specific response strategies, is difficult usingthe output of coupled global circulations models (GCMs). Manyfactors influencing regional climate, such as smaller topograph-ic features causing orographic rainfall, are not adequatelyrepresented in the coarse horizontal resolution of GCMs, whichtypically extends to 300 km representing several degreeslongitude and latitude in one grid cell (e.g. Benestad andForland, 2001; Hardy, 2003; Houghton, 2004). Finer gridresolutions are not yet possible because of the complexity of the
climatic system, the vast number of feedback reactions and thecurrent computational limitations (Harvey, 2000; Houghton,2004). One approach to overcome this deficiency is the use ofregional climate models (RCMs). These models use GCMoutput at their boundaries to simulate climate at a higherresolution for a limited geographical area (Wilby and Wigley,1997; Carter, 2001). RCMs numerically represent the atmo-sphere and land surfaces for simulating the important aspects ofthe climatic system as relevant for impact studies, such asradiation, rainfall and soil hydrology (PRECIS, 2004). RCMsare able to provide the high-resolution of climatic changes onthe temporal and spatial scales, needed to conduct soundregional impact studies.
The precipitation data for the climate change scenario in thisstudy is based on results of the model HadRM3H, which is themost recent RCM from the Hadley Centre for ClimatePrediction and Research, UK. HadRM3H is limited to theEuropean area and has a horizontal resolution of 0.5°×0.5°longitude, latitude respectively, and 19 atmospheric and foursoil levels. It also includes a sub-model of the sulphur cycle toestimate the cooling effect of sulphate aerosols from SO2
emissions (PRECIS, 2004). Boundary conditions forHadRM3H are provided by HadAM3, which is the atmosphericcomponent of HadCM3, the latest coupled atmospheric andoceanic GCM of the Hadley Centre (PRECIS, 2004; PRU-DENCE, 2004).
Results of two HadRM3H runs were used to create (i) aclimate change scenario with altered seasonal rainfall patternand (ii) a reference scenario, which represents the rainfallpattern in an undisturbed climate serving as baseline. Thereference scenario comprises the period 1960–1989 and theclimate change model run is based on the SRES emissionscenario A2 for the years 2070–2099. The A2 emissionscenario storyline assumes a heterogeneous world where thepreservation of local identities is emphasised. Global populationincreases steadily, economic growth and technological changeare fragmented and comparatively slow, whilst climate changerelevant gases continue to be emitted at high rates (IPCC, 2000).
Daily precipitation data for the climate change scenario(2070–99) and the baseline period (1960–89) were generatedwith the stochastic weather generator of the Long AshtonResearch Station (LARS WG 3.0) (Semenov and Barrow,

Fig. 3. Relative changes of seasonal precipitation quantities in Central Europe. The data refer to the SRES A2 scenario and compare a climate change run (2070–99)with a 1960–89 control run of the regional climate model HadRM3H. The 3×3 grid in the seasonal panes shows the area, over which the climate data have beenaveraged. The crosses in the SON pane mark the locations of experimental p lots in Enns (A) and Ried (B), and the Meteorological Station Vorchdorf (V).
99G. Scholz et al. / Catena 72 (2008) 91–105
2002). LARS WG was developed to produce artificial timeseries of weather data for hydrological and agricultural studiesand for climate change impact assessments (Semenov andBarrow, 2002). A series of wet and dry days, daily precipitationand solar radiation is simulated by means of semi-empiricaldistributions, which are derived from statistical characteristicsof observed weather at a particular location (Barrow and Lee,2000). Data for daily minimum and maximum temperatures aregenerated stochastically on the basis of daily mean temperaturesand standard deviations dependent on the day being either wetor dry (Semenov and Barrow, 2002). The location specificclimate parameters gained in the calibration process of LARSWG were perturbed with results of the HadRM3H runs.Thereby, daily weather data were generated for local climatechange scenarios (Semenov and Barrow, 2002). Modelverification is undertaken by comparing the statistics of asynthetic data set with the weather records used in the modelcalibration (Barrow and Lee, 2000).
2.7. Climate change and baseline scenario weather data
The described HadRM3H simulations of the IPCC SRES A2scenario (2070–99) and the corresponding control run (1960–89) provided the information on the magnitude of change in theconsidered climate parameters in the study region. Seasonalprecipitation changes (Fig. 3), temperature changes and thestandard deviation of mean temperatures have been computedbased on these model runs (Table 9).
To reduce the bias of single grid cell values in the simulationan arithmetic average over 1.5°×1.5° longitude and respective-ly latitude was calculated. This 3×3 grid cell pane includes thelocations where experimental plots were set up for the study ofKunisch et al. (1995), which was used to calibrate the erosionmodel, and the meteorological station Vorchdorf, whichprovided the records to calibrate the weather generator LARSWG.
Table 9 gives the results of HadRM3H climate simulationruns, which describe a strong uniform increase in temperatureand rather moderate change in annual precipitation for theperiod 2070–99 compared to 1960–89. A precipitation decreaseover summer (JJA) and autumn (SON) and an increase in spring(MAM) and winter (DJF) constitute a significant shift within theintra-annual precipitation pattern although the percent change inannual precipitation (−2.51%) is small.
2.8. Calibration of the weather generator and production oftime series rainfall data
The weather generator LARS WG was calibrated with a dataset from the Meteorological Station Vorchdorf, which liesapproximately 50 km south-west of the experimental plots Aand B. The calibration data comprise complete records ofprecipitation and temperature from 1975 to 2001 in daily time-steps. From this data set semi-empirical distribution of rainamounts and rain-day and dry-day series were derived. Basedon these, synthetic weather data were generated and statistically

Table 10The average number of annual precipitation events recorded at VorchdorfMeterological Station compared to those simulated for the baseline period(1960–89) and the climate change period (2070–99) using the LARS WG
AverageAnnualNumber ofPrecipitationEvents AfterDaily Intensities[mm day−1]
Number of precipitation events recorded andsimulated by LARS WG
Events recorded atVorchdorf
MeteorologicalStation 1975–2001
[a−1]
Events simulatedfor baseline
period 1960−89[a−1]
Events simulatedfor climatechange
period 2070–99[a−1]
N50.0 0.33 0.47 0.3035.0–49.9 mm 1.11 1.47 1.1725.0–34.9 mm 3.19 2.87 2.8015.0–24.9 mm 10.08 11.57 10.5010.0–14.9 mm 16.30 16.10 15.975.0–9.9 mm 34.41 33.33 33.633.0–4.9 mm 26.48 25.12 25.770.0–2.9 mm 77.63 75.13 75.93Total 170.52 166.07 166.07Averageannualprecipitation[mm]
1010.0 1016.1968.4
Table 9Seasonal average changes in precipitation, temperature and standard deviationof temperature
SRES A2ClimateChangeScenarioofHadRM3H
Changes of climatic parameter from 1960–89 to 2070–99
Totalprecipitation
[%]
Totalprecipitation
[mm]
Averagetemperature
[°]
Standard deviationtemperature [°]
DJF a 9.89 17.6 5.09 1.01MAMa 10.81 25.7 4.24 0.93JJA a −14.62 −55.8 5.58 1.17SONa −14.53 −35.2 5.55 0.97Annually b −2.51 −47.7 5.12 1.02
The values are 3×3 grid cell arithmetic averages including all three relevantlocation of the experimental plots and the meteorological station Vorchdorf.a DJF— December, January, February; MAM—May, April, March; JJA—
June, July, August; SON — September, October, November.b Precipitation change is the absolute change over the year and not the
arithmetic average of seasonal values.
100 G. Scholz et al. / Catena 72 (2008) 91–105
compared with the records to verify if there were significantdifferences between the artificial and empirical precipitationdistributions. After this validation a 30-year time series of dailyweather data was generated, which formed the baseline scenario(1960–89). The results obtained from the HadRM3H modelruns were used to perturb the climate parameters used in LARSWG and a second 30-year series of daily weather data wasgenerated, the climate change scenario (2070–99).
LARS WG reproduces the climatic conditions at Vorchdorfsatisfactorily with just minor deviations resulting from thestochastic component of the weather generator. Monthlychanges in precipitation, as simulated by the regional climatemodel HadRM3H, are reflected with great accuracy. Thedifference between perturbation factor and generated change inmonthly average precipitation does not exceed 0.6%. Hence,both weather data series of the reference and the climate changescenarios can be seen as adequate accounts of baseline climateand of the current knowledge on future climatic changes asrelevant to seasonal rainfall distribution.
Table 10 shows that the average number of annualprecipitation events remains constant in the two LARS WGsimulated 30-year series of weather data. A slight decreasecompared to the Vorchdorf records in classes of low rainfallintensity is evident, but this change is negligible, since lowerrainfall intensities have a limited impact on erosion processes.
Records from the experimental plots showed that precipita-tion events of less than 3 mm are not relevant for erosionprocesses, thus these rainfalls are not considered in the erosionmodelling exercise. Such low intensity rainfalls compriseapproximately 45% of the total number of precipitation events(Table 10). Also precipitation events occurring, presumably assnowfall, on days with an average temperature below 0.0 °C arenot included into the erosion model runs. Snowmelt erosion ismainly relevant in northern Europe (Jones et al., 2003),consequently it was seen to be unnecessary to integrate anadditional sub-model on snowmelt runoff into the erosionmodel.
3. Results
The calibrated erosion model was applied using two 30-yeartime-series of rainfall data generated by the LARS WG. Allrelevant precipitation events are documented in Table 11. Onedata series represents the climatic baseline condition form 1960to 1989 and the second series includes the climate changeperturbation as simulated by the climate model HadRM3H for2070 to 2099. While no significant difference in annualprecipitation amounts is predicted for the climate changescenario, a seasonal shift of precipitation from summer andautumn to winter and spring months was simulated (Table 9).This shift of precipitation quantities has a clearly observableimpact on the soil erosion rates in all four tillage systems.
Table 11 demonstrates a seasonal increase in soil erosionrates in spring (MAM) and winter (DJF) resulting from higherprecipitation rates in these seasons (Table 9) under climatechange conditions. This increase in soil loss is outweighed bydecreasing soil erosion rates in summer (JJA) and autumn(SON) following lower rainfall rates in these periods in theclimate change scenario. The net effect of increasing precipi-tation amounts in spring and winter and lower precipitationamounts in summer and autumn is a lower overall soil erosionrate across all four tillage systems ranging from 10.6% to 24.1%per agricultural year. Independent from the climatic circum-stances RTIM reduces soil erosion by about 41%. CTIMachieve reductions of 82% and NTIM 87%. These results are asuccessful reproduction of the protective effects of conservationtillage systems observed in the original dataset, which rangefrom 55–99% depending on tillage system and cultivatedintercrop species (Kunisch et al., 1995).
Fig. 4 clarifies the principal reason for an annual decrease insoil erosion of 10.6% to 24.1% caused by an overall 4.7%
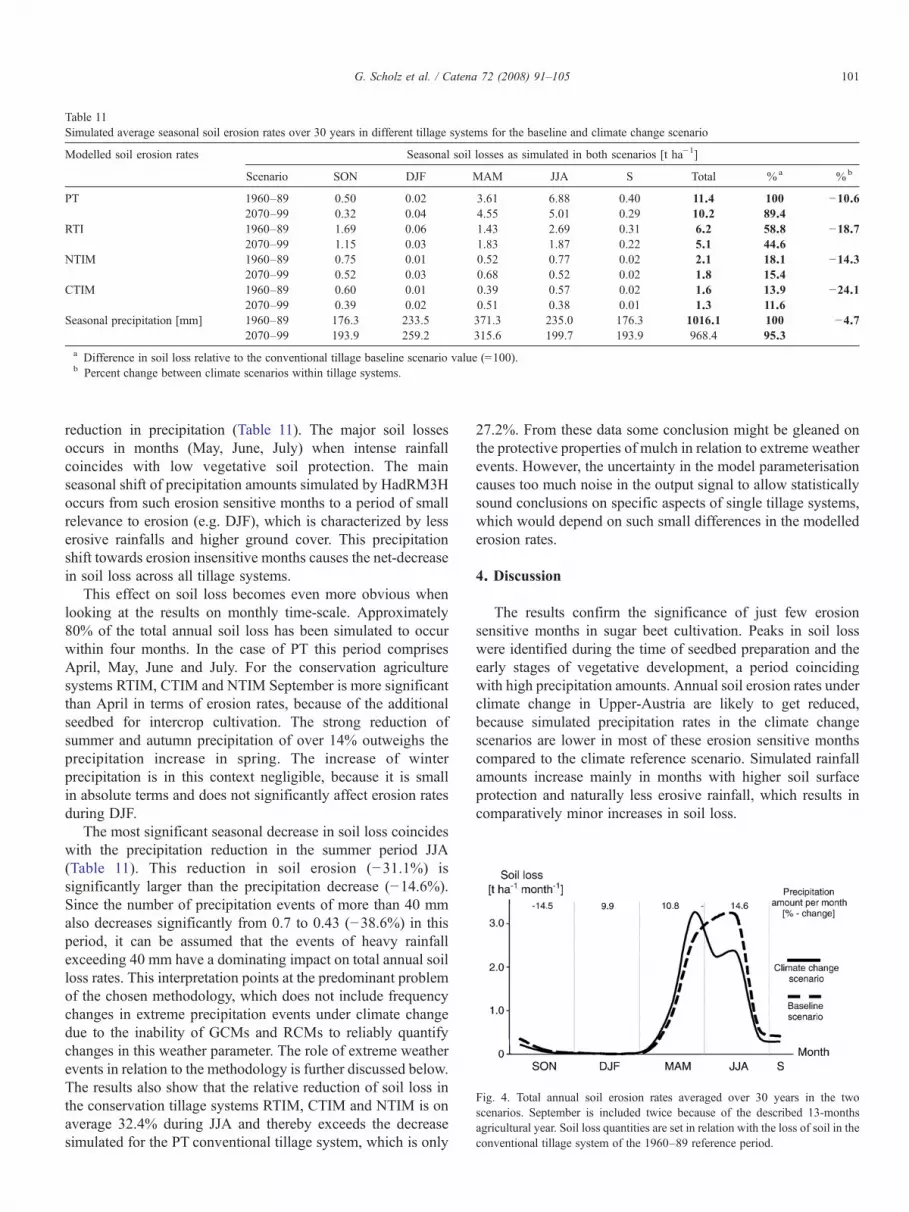
Table 11Simulated average seasonal soil erosion rates over 30 years in different tillage systems for the baseline and climate change scenario
Modelled soil erosion rates Seasonal soil losses as simulated in both scenarios [t ha−1]
Scenario SON DJF MAM JJA S Total % a %b
PT 1960–89 0.50 0.02 3.61 6.88 0.40 11.4 100 −10.62070–99 0.32 0.04 4.55 5.01 0.29 10.2 89.4
RTI 1960–89 1.69 0.06 1.43 2.69 0.31 6.2 58.8 −18.72070–99 1.15 0.03 1.83 1.87 0.22 5.1 44.6
NTIM 1960–89 0.75 0.01 0.52 0.77 0.02 2.1 18.1 −14.32070–99 0.52 0.03 0.68 0.52 0.02 1.8 15.4
CTIM 1960–89 0.60 0.01 0.39 0.57 0.02 1.6 13.9 −24.12070–99 0.39 0.02 0.51 0.38 0.01 1.3 11.6
Seasonal precipitation [mm] 1960–89 176.3 233.5 371.3 235.0 176.3 1016.1 100 −4.72070–99 193.9 259.2 315.6 199.7 193.9 968.4 95.3
a Difference in soil loss relative to the conventional tillage baseline scenario value (=100).b Percent change between climate scenarios within tillage systems.
Fig. 4. Total annual soil erosion rates averaged over 30 years in the twoscenarios. September is included twice because of the described 13-monthsagricultural year. Soil loss quantities are set in relation with the loss of soil in theconventional tillage system of the 1960–89 reference period.
101G. Scholz et al. / Catena 72 (2008) 91–105
reduction in precipitation (Table 11). The major soil lossesoccurs in months (May, June, July) when intense rainfallcoincides with low vegetative soil protection. The mainseasonal shift of precipitation amounts simulated by HadRM3Hoccurs from such erosion sensitive months to a period of smallrelevance to erosion (e.g. DJF), which is characterized by lesserosive rainfalls and higher ground cover. This precipitationshift towards erosion insensitive months causes the net-decreasein soil loss across all tillage systems.
This effect on soil loss becomes even more obvious whenlooking at the results on monthly time-scale. Approximately80% of the total annual soil loss has been simulated to occurwithin four months. In the case of PT this period comprisesApril, May, June and July. For the conservation agriculturesystems RTIM, CTIM and NTIM September is more significantthan April in terms of erosion rates, because of the additionalseedbed for intercrop cultivation. The strong reduction ofsummer and autumn precipitation of over 14% outweighs theprecipitation increase in spring. The increase of winterprecipitation is in this context negligible, because it is smallin absolute terms and does not significantly affect erosion ratesduring DJF.
The most significant seasonal decrease in soil loss coincideswith the precipitation reduction in the summer period JJA(Table 11). This reduction in soil erosion (−31.1%) issignificantly larger than the precipitation decrease (−14.6%).Since the number of precipitation events of more than 40 mmalso decreases significantly from 0.7 to 0.43 (−38.6%) in thisperiod, it can be assumed that the events of heavy rainfallexceeding 40 mm have a dominating impact on total annual soilloss rates. This interpretation points at the predominant problemof the chosen methodology, which does not include frequencychanges in extreme precipitation events under climate changedue to the inability of GCMs and RCMs to reliably quantifychanges in this weather parameter. The role of extreme weatherevents in relation to the methodology is further discussed below.The results also show that the relative reduction of soil loss inthe conservation tillage systems RTIM, CTIM and NTIM is onaverage 32.4% during JJA and thereby exceeds the decreasesimulated for the PT conventional tillage system, which is only
27.2%. From these data some conclusion might be gleaned onthe protective properties of mulch in relation to extreme weatherevents. However, the uncertainty in the model parameterisationcauses too much noise in the output signal to allow statisticallysound conclusions on specific aspects of single tillage systems,which would depend on such small differences in the modellederosion rates.
4. Discussion
The results confirm the significance of just few erosionsensitive months in sugar beet cultivation. Peaks in soil losswere identified during the time of seedbed preparation and theearly stages of vegetative development, a period coincidingwith high precipitation amounts. Annual soil erosion rates underclimate change in Upper-Austria are likely to get reduced,because simulated precipitation rates in the climate changescenarios are lower in most of these erosion sensitive monthscompared to the climate reference scenario. Simulated rainfallamounts increase mainly in months with higher soil surfaceprotection and naturally less erosive rainfall, which results incomparatively minor increases in soil loss.

Table 12Sources of uncertainty and estimations about their probable impact on the results
Uncertainty intools andmethods
Specification of uncertain elements
Origin Directionof change
Estimatedmagnitude
HadCM3/HadAM3
Incomplete knowledge onatmospheric physics
? ?
Simplifications in the climaticsystems
HadRM3 Uncertain boundary conditions(HadAM3)
? ?
Simplifications, still coarse resolutionSRES A2 Assumptions on socio-economic
development? Medium
Projections on atmospheric GHGconcentration
MeteorologicalRecords
Common measuring uncertainties ? Small
LARS WG Deficient weather simulation ? SmallRainfallintensities
Not explicitly considered + High
MMF erosionmodel
Underestimation of soil loss inextreme events
+ Medium
Simplifications in model algorithmCalibration Limited quantity of data resources ? ?
Measuring uncertainties in referencestudy
Vegetationparameter
Assumption: vegetative developmentremains unchanged under climatechange
? Small
Soil parameter Assumption: soil properties remainsunchanged under climate change
? Small
Curve number(CN)
Not measured in the field butestimated and used as calibrationvariable. Influence of climate changedisregarded.
? ?
Land-usemanagement
Adaptive land-use management (e.g.new crops, innovative technology)
– High
102 G. Scholz et al. / Catena 72 (2008) 91–105
The results contrast with studies conducted for other sites inthe UK, USA and Brazil as presented in Table 1. The observeddeviation is likely to be explained by significant differencesamong the predicted character of regional climate change in thevarious studies, which are reflected in the applied climate changescenarios. For example Botterweg (1994) assumed a climatechange scenario for Southern Norway with opposite seasonalprecipitation shifts than simulated by HadRM3H for Austria.The scenario applied for Norway predicted a decrease in springprecipitation and an increase of summer and autumn precipita-tion on balance outweighing the spring decrease. Botterweg(1994) consequently estimated an increasing annual soil lossunder climate change conditions. Comparing the two studies,which show contrary results caused by the same phenomenon ofintra-annual precipitation shifts in opposite directions, high-lights the importance of seasonal precipitation pattern for soilerosion research under climate change. But it also points at theuncertainties in climate change impact research (Table 12),especially in relation to the use GCM and RCM output.
The results of this study are likely to get modified byincluding other climate change impacts. For example climatechange is likely to cause an increase in extreme precipitationevents (IPCC, 2001a), which was not considered in the appliedmethodology. Rainfall simulator studies have shown that singleextreme events can results in soil losses on the conventionaltilled plots of up to 19.3 t ha−1. Based on the generated weatherdata, which show an annual average frequency of 1.9 rain eventswith an intensity of N35 mm in the reference period 1960–89, a20% increase of such events during the most erosion sensitivemonths could lift soil losses on average by about 4 t ha−1 in theconventional cropping system. This would significantly exceedthe erosion reductions gained by seasonal shifts in theprecipitation pattern. Other parameters not considered in thisstudy, which are responsive to climatic variability and climatechange, are likely to alter the simulated erosion rates further. Forexample the effect of CO2 fertilization and higher meantemperatures would favour enhanced plant growth resulting inimproved vegetative soil cover. This would have particularsignificance for sugar beet as it belongs to the category of C3
plants, which potentially benefit most from increasing atmo-spheric CO2 due to their metabolic properties. However, theseadvantages might be offset by increased water stress for cropplants over the summer period resulting from reducedprecipitation amounts. Also higher rates of pest infestationinhibiting plant growth have been predicted, which might resultinto reduced vegetative soil cover (Parry, 1990; Downing et al.,2000). Downing et al. (2000) documented that these opposedeffects often balance each other out and are therefore of minorimportance compared to adaptive measures in agriculturalmanagement. Soil responses to climate change may also playrole in the climate change impact assessment for the agriculturalsector (Armstrong et al., 1994). Fig. 5 gives a summary on themost important aspects of the complex climate–soil–plantinteractions, which influence soil erosion processes.
Finally wind erosion needs to be considered in the context ofclimate change and agriculture. Decreasing precipitation amountin summer time leaves soils drier and more susceptible to the
erosive forces of strong winds. The IPCC (2001a) stated anincreasing frequency of short-duration hazards like windstormsis likely, which will possibly raise total erosion rates in Europe.
As described in the introduction, the problem of high soil lossrates in root crop farming is well known and extensively describedin the literature on soil erosion (e.g. Kainz, 1989; Jones et al., 2003;Morgan, 2005). Soil erosion rates in conventional tillage exceed10 t ha−1 a−1 in both climate scenarios. Reduced tillage andpresence of intercrops limit these losses to 5 to 6 t ha−1 a−1. CTIMand NTIM have been shown to reduce soil erosion by 80 to 90%.The magnitude of these conservation effects corresponds to resultsgained in various studies on erosion control in root crop cultivation(e.g. Kainz, 1989). However, the estimated erosion rates forconventional and reduced tillage clearly exceed what is describedas long-term tolerable soil loss (UNEP, 2002; Jones et al., 2003).The results also show the potential of alternative tillage practices forerosion control and for offsetting adverse changes intra-annualprecipitation pattern caused by climate change. The protectiveeffect of vegetative soil cover is likely to prove even more valuablein terms of soil water conservation in a changing climate. Asdescribed above, crops are likely to experience higher water stressin climate change scenarios as projected by HadRM3H, when

Fig. 5. Climate change impacts acting on soil erosion processes by water are multifarious and complex. The figure shows in a qualitative way the most important ofthese interactions and feedback reactions, which depend on regional climate, specific physical, chemical and biological soil properties, vegetation and local land-useregimes. High uncertainties are affiliated with any attempt to predict the direction and the magnitude of change in these parameters. The central role of vegetation coverin erosion control becomes obvious as well as the related difficulties to predict vegetative development under climate change.
103G. Scholz et al. / Catena 72 (2008) 91–105
temperature increases coincide with decreasing precipitation overthe summer months. Assuming such conditions, a mulch coverwould decrease the direct evaporation of rainfall water and con-sequently more water would be retained in the soil being availablefor crop plants (Fig. 5).
The methodology used in the study shows some limitations,but nevertheless it proved to be an adequate approach for apreliminary assessment of the potential effects of climate changeinduced variations in seasonal precipitation pattern on soil erosionrates for the selected region. One shortcoming is that the appliedclimate scenario does not reflect any possible changes in thefrequency of extreme precipitation events. The simulatedfrequency change in N50 mm rainfall, as presented in the results,originates from the perturbation of LARSWGweather parameterand not from a genuine decrease of such events. Another problemis that the impact of varying rainfall intensity is not considered,because LARS WG does not generate break-point rainfall dataand the revised and modifiedMMF does not include precipitationintensity as a variable. Therefore soil losses caused duringextreme weather events are not adequately represented by usingthis method, even though the performance of the model isgenerally satisfactory with respect to the study objectives.
All climate change impact studies are subjected to consider-able uncertainty, which need to be adequately addressed whileusing the results of this and similar studies for further research andfor policy making purposes. Impact studies use a number of toolswith inherent uncertainty at various stages causing an unknownerror, which propagates through the assessment (Carter, 2001).Even though most climate change models and scenarios arehighly sophisticated, systematic and stochastic errors are stillabundant. Such errors are caused by a lack of knowledge about thebehaviour of certain compartments in the climatic systems, and byincompletely researched and unknown feedback reactions
(Santer, 1993). Regional and local studies integrate experimen-tally obtained knowledge, extrapolations and additional para-meters, all exhibiting inherent levels of uncertainty (Puhe andUlrich, 2001). Some aspects of parameter uncertainty as found inthis study have been outlined above and Table 12 summarizes allmajor sources of possible bias in the results.
Future research, which aims to investigate the impact ofclimate change on soil erosion, has to reduce the inherentuncertainties outlined in this paper. Important factors to beconsidered are rainfall intensities, increasing frequency ofextreme weather events and the vegetative development of cropplants influenced by various primary and secondary physical,chemical and biological impacts of climate change.
5. Conclusion
The results of this study show a decrease in soil loss fromboth conventional and conservation tillage systems from 10.6%to 24.1% per agricultural year caused climate change inducedseasonal rainfall variations. The decline of erosion rates ex-ceeds the change in precipitation quantity, which is predicted todecrease just slightly in the study region by about 5% under theIPCC climate change scenario SRES A2 scenario (2070–99).This effect can be attributed to a net decrease of precipitationin erosion sensitive months, while precipitation increases inmonths when agricultural soils used under sugar beet culti-vation are less prone to erosion. The computed magnitude ofchange in soil erosion rates can be considered to lie inside themargins of uncertainty typically attached to climate changeimpact studies.
The results of this modelling study successfully reproduce theunsustainably high rates of soil loss in conventional sugar beetfarming as measured in the field. Also the simulated soil erosion

104 G. Scholz et al. / Catena 72 (2008) 91–105
rates for the different tillage systems are well reproduced by therevised and modified MMF erosion model and agree with a widerange of studies by estimating a 41 to 87% reduction for threeconservation agricultural practices in comparison to the conven-tional tillage system.
Conservation tillage systems maintain their protective effecton soil resources independent from the applied climate scenario.This indicates the adaptive potential of the agricultural sectorfor regions where more adverse climate change impacts mightoccur.
The applied methodology was found to be an adequateapproach for a preliminary assessment of the problem soilerosion in a scenario of climate change induced seasonalvariations of precipitation pattern. Nevertheless some limitationsstill exist, primarily with respect to the impact of rainfallintensities and extreme precipitation events. However, theresults of this study indicate, despite the uncertainty, that climatechange induced seasonal variations in precipitation pattern donot have a major impact on soil erosion in Central Europe in thecase of spring sown crops such as sugar beet. This might beconsiderably different for other crop rotations and tillagepractices than those subjected to this study. Hence, furtherefforts should be directed at deepening the climate changeimpact research in this field and in assessing and improving theadaptive potential of European agriculture to prevent economicand environmental damage inflicted by a changing climate.
Acknowledgements
We acknowledge Dr. Wlodek Tych (Lancaster University)for his help on software issues, the PRUDENCE project (fundedby the EU through contract EVK2-CT2001-00132) for provid-ing HadRM3H seasonal climate change data on behalf of theHadley Center and UK Meteorological Office, and Dr. DavidViner (University of East Anglia) for his advise on RCM datahandling.
References
Armstrong, A.C., Matthews, A.M., Portwood, A.M., Addiscott, T.M., Leeds-Harrison, P.B., 1994. Modelling the effects of climate change on thehydrology and water quality of structured soils. In: Rounsevell, M.D.A.,Loveland, P.J. (Eds.), Soil Responses to Climate Change. Springer-Verlag,Heidelberg, pp. 113–136.
Barrow, E.M., Lee, R.J., 2000. Climate Change andEnvironmental Assessment—Part 2: Climate Change Guidance for Environmental Assessments. TheCanadian Institute for Climate Studies.
Benestad, R.E., Forland, E.J., 2001. Local climate scenarios for Norway basedon MPI's ECHAM/OPYC3, a new DNMI data analysis, and the commonEOF method. In: India, M.B., Bonillo, D.L. (Eds.), Detecting and modellingregional climate change. Springer Verlag, Heidelberg, pp. 471–482.
BMLF, 1972. Österreichische Bodenkartierung – Erläuterungen zur Bodenkarte1:25000 – Kartierungsbereich 10. Bundesministerium für Land-undForstwirtschaft, Wien.
BMLF, 1982. Österreichische Bodenkartierung – Erläuterungen zur Bodenkarte1:25000 – Kartierungsbereich 85. Bundesministerium für Land-undForstwirtschaft, Wien.
Botterweg, P., 1994. Modelling the effects of climate change on runoff anderosion in central southern Norway. In: Rickson, R.J. (Ed.), Conserving SoilResources: European Perspectives — Proceedings of the First International
Conference. European Society for Soil Conservation, European Society forSoil Conservation, pp. 273–285.
Cannell, R.Q., Hawes, J.D., 1994. Trends in tillage practices in relation tosustainable crop production with special reference to temperate climates.Soil and Tillage Research 30 (2–4), 245–282.
Carter, T.R., 2001. Uncertainties in assessing the impacts of regional climatechange. In: India, M.B., Bonillo, D.L. (Eds.), Detecting and ModellingRegional Climate Change. Springer Verlag, Heidelberg, pp. 441–470.
Downing, T.E., Harrison, P.A., Butterfield, R.E., Lonsdale, K.G., 2000. ClimateChange, Climatic Variability and Agriculture in Europe. EnvironmentalChange Institute, Oxford. 445 pp.
Farvis-Mortlock, D.T., Boardman, J., 1995. Nonlinear responses of soil erosionto climate change: a modelling study on the UK South Downs. Catena 25,365–387.
Farvis-Mortlock, D.T., Guerra, A.J.T., 1999. The implications of generalcirculation model estimates of rainfall for future erosion: a case study fromBrazil. Catena 37, 329–354.
Frisvold, G., Kuhn, B., 1999. Global Environmental Change and Agriculture.Edward Elgar Publishing Ltd., Cheltenham, Northampton. 345 pp.
Hardy, J.T., 2003. Climate Change — Causes, Effects, and Solutions. JohnWiley & Sons Ltd., Southern Gate, Chichester. 247 pp.
Harvey, L.D.D., 2000. Climate and global environmental change. PearsonEducation Ltd., Harlow, Essex. 240 pp.
Houghton, J., 2004. Global Warming. Cambridge University Press, Cambridge.351 pp.
Hoyningen-Huene, J.V., 1983. Die Interzeption des Niederschlages in land-wirtschaftlichen Pflanzenbeständen. Paul Parey Verlag (DVWK-Schrift),Hamburg, Berlin.
Hudson, N.W., 1995. Soil Conservation. Batsford Ltd, London.Hydrographischer Dienst in Österreich, 1994. Die Niederschläge, Schneever-
hältnisse und Luftemperaturen in Österreich im Zeitraum 1981–90. Beiträgezur Hydrographie Österreichs 52, Hydrographisches Zentralbüro imBundesministerium für Land-und Forstwirtschaft, Wien.
IPCC, 2000. Emissions Scenarios 2000, Special Report of the Intergovernmen-tal Panel on Climate Change. In: Nakicenovic, N., Swart, R. (Eds.),Cambridge University Press, Cambridge. 570 pp.
IPCC, 2001a. Climate Change 2001 — Impacts, Adaptation, and Vulnerability.Cambridge University Press, Cambridge. 1032 pp.
IPCC, 2001b. Climate Change 2001 — The Scientific Basis. CambridgeUniversity Press, Cambridge. 881 pp.
Jensen, P.K., Spliid, N.H., 2003. Deposition of Pesticides on the Soil Surface,Danish Environment Protection Agency_ Institute of Agricultural Sciences.
Jones, R.J.A., Bissonnais, Y.L., Diaz, J.S., Düwel, O., Øygarden, L., Bazzoffi,P., Prasuhn, V., Yordanov, Y., Strauss, P., Rydell, B., Uveges, J.B., Loj, G.,Vandekerckhove, M.L., 2003. Work package 2: nature and extend of soilerosion in Europe — Interim Report 3.31. EU Soil Thematic Strategy.Technical Working Group on ErosionEuropean Commission — GDEnvironment, Brussels.
Julien, P.T., 1995. Erosion and Sedimentation. Cambridge University Press,Cambridge. 280 pp.
Kaffka, S., 2001. The California Sugarbeet. University of California,Department of Agronomy and Range Science, Davis.
Kainz, M., 1989. Runoff, Erosion and Sugar Beet Yields in Conventional andMulched Cultivation Results of the 1988 Experiment — Soil TechnologySeries 1. In: Schwertmann, U., Auerswald, R.J.R. (Eds.), Soil erosionprotection measures in Europe. CATENA Verlag, Cremlingen-Dested,pp. 103–114.
Karl, T.R., Knight, R.W., Easterling, D.R., Quayle, R.G., 1996. Indices ofclimate change. United States Bulletin of the American MeteorologicalSociety 77 (2), 279–292.
Kunisch, J., Schmidt, G., Eigner, H., Kempl, F., Hagler, J., 1995. Zwischen-fruchtkulturen bei Zuckerrüben — Bodenschutzwirkung. Bundesminister-ium für Wissenschaft und Forschung, Wien. Not published.
Lal, R., 1994. Soil erosion by wind and water: problems and prospects, In: Lal,R. (Ed.), Soil Erosion Research Methods, 2nd edition. Soil and WaterConservation Society. St. Lucie Press, Delray Beach, pp. 1–10.
Landesregierung Oberösterreich, 2003. Grüner Bericht 2003: 25. Bericht überdie wirtschaftliche und soziale Lage der oberösterreichischen Land-und

105G. Scholz et al. / Catena 72 (2008) 91–105
Forstwirtschaft im Jahr 2003, Government of Oberösterreich — Agrar-undForstrechts-Abteilung, Linz.
Michael, A., Schmidt, J., Enke, W., Deutschländer, T., Malitz, G., 2005. Impactof expected increase in precipitation intensities on soil loss — results ofcomparative model simulations. Catena 61, 155–164.
Mockus, V., 1969. Chapter 9: Hydrologic Soil Cover Complexes. In: USDepartment of Agriculture (Ed.), Hydraulics and Hydrology- TechnicalReferences NRCS National Engineering Handbook, Part 630 Hydrology,Washington DC.
Mockus, V., 1972. Chapter 10: Estimation of Direct Runoff from Storm Rainfall.In: US Department of Agriculture (Ed.), Hydraulics and Hydrology —Technical References NRCS National Engineering Handbook, Part 630Hydrology, Washington DC.
Morgan, R.C.P., 2001. A simple approach to soil loss prediction: a revisedMorgan–Morgan-Finney Model. Catena 44, 305–322.
Morgan, R.C.P., 2005. Soil Erosion and Conservation, 3rd edition. BlackwellPublishing, Oxford. 304 pp.
Morgan, R.P.C., Morgan, D.D.V., Finney, H.J., 1984. A predictive model for theassessment of soil erosion risk. Journal of Agricultural EngineeringResearch 30, 245–253.
Morgan, R.P.C., Quinton, J.N., Smith, R.E., Govers, G., Poesen, J.W.A.,Auerswald, K., Chisci, G., Torri, D., Styczen, M.E., Folly, A.J.V., 1998. TheEuropean soil erosion model (EUROSEM): documentation and user guide,Silsoe College, Cranfield University, Bedford.
Nearing, M.A., 2001. Potential changes in rainfall erosivity in the U.S. withclimate change during the 21st Century. Journal of Soil and WaterConservation 56 (3), 229–232.
Nicks, A.D., 1993. Modeling hydrologic impacts of global change usingstochastically generated climate change scenarios. In: Eckstein, Y., Zaporozec,A. (Eds.), Industrial andAgricultural Impacts on theHydrologic Environment.Proceedings of the Second USA/CIS Joint Conference on EnvironmentalHydrology and Hydrogeology. Water Environment Federation, Alexandria.
O'Neal, M.R., Nearing, M.A., Vining, R.C., Southworth, J., Pfeifer, R.A., 2005.Climate change impacts on soil erosion in Midwest United States withchanges in crop management. Catena 61, 165–184.
OOE-GV, 2005. Landesregierung Oberösterreich—Geography. Government ofOberösterreich.
Parry, M., 1990. Climate Change and World Agriculture. Earthscan, London.157 pp.
Pimentel, D., Allen, J., Beers, A., Guinand, L., Hawkins, A., Linder, R.,McLaughlin, P., Meer, B., Musonda, D., Poisson, P., Salazar, S., Siebert, R.,Stoner, S., 1993. Soil erosion and agricultural productivity. In: Pimentel, D.(Ed.), World Soil Erosion and Conservation. Cambridge University Press,Cambridge, pp. 277–292.
Ponce, V.M., Hawkins, R.H., 1996. Runoff curve number: has it reachedmaturity? Journal of Hydrologic Engineering 1 (1), 11–19.
PRECIS, 2004. The Hadley Centre Regional Climate Modelling System.PRECIS (Providing Regional Climates for Impacts Studies) Met Office,Hadley Centre, Berkshire.
PRUDENCE, 2004. Prediction of Regional scenarios and Uncertainties forDefining European Climate change risks and Effects. DanishMeteorologicalInstitute.
Pruski, F.F., Nearing, M.A., 2002a. Climate-induced changes in erosion duringthe 21st century for eight U.S. locations. Water Resources Research 38 (12),34–1–34–11.
Pruski, F.F., Nearing, M.A., 2002b. Runoff and soil-loss response to changes inprecipitation: a computer simulation study. Journal of Soil and WaterConservation 57 (1), 7–16.
Puhe, J., Ulrich, B., 2001. Global climate change and human impacts on forestecosystems. Ecological Studies. Springer Verlag, Heidelberg. 592 pp.
Renard, K.G., Foster, G.R., Weesies, G.A., McCool, D.K., Yoder, D.C., 1997.Predicting Soil Erosion By Water: A Guide to Conservation Planning withthe Revised Universal Soil Loss Equation (RUSLE) — USDA AgriculturalHandbook 703. U.S. Department of Agriculture, Washington DC.
Rose, C.W., 1994. Research progress on soil erosion processes and a basis forsoil conservation practices, In: Lal, R. (Ed.), Soil Erosion ResearchMethods, 2nd edition. . Soil and Water Conservation Society. St. LuciePress, Delray Beach, pp. 159–180.
Rosenzweig, C., Hillel, D., 1998. Climate Change and the Global Harvest.Oxford University Press, Oxford. 324 pp.
Santer, B.D., 1993. Some issues in detecting climate change induced bygreenhouse gases using general circulation models. In: Kaiser, H.M.,Drennen, T. (Eds.), Agricultural Dimensions of Global Climate Change. St.Lucie Press, Boston, Delray Beach, pp. 45–66.
Savabi, M.R., Stockle, C.O., 2001. Modeling the possible impact of increasedCO2 and temperature on the soil water balance and soil erosion.Environmental Modelling and Software 16 (7), 631–640.
Schmidt, J., Werner, M.V., Michael, A., 1996. EROSION 2D/3D —Modellgrundlagen und Bedienungsanleitung, Vol. 1–3, Sächsische Land-esanstalt für Umwelt und Geologie. Sächsische Landesanstalt für Land-wirtschaft, Freiberg.
Schwertmann, U., Vogl, W., Kainz, M., 1987. Bodenerosion durch Wasser —Vorhersage des Abtrags und Bewertung von Gegenmaßnahmen. UlmerVerlag, Stuttgart. 64 pp.
Semenov, M.A., Barrow, E.M., 2002. LARS-WG — A Stochastic WeatherGenerator for Use in Climate Impact Studies, User Manual 3.0. RothamstedResearch, Hertfordshire. 27 pp.
Shelton, D.P., Smith, J.A., Jasa, P.J., Kanable, R., 1995. Estimating PercentResidue Cover Using the Calculation Method. University of Nebraska,Institute of Agriculture and Natural Resources.
Stocking, M.A., 1994. Assessing vegetative cover and management effects, In:Lal, R. (Ed.), Soil Erosion Research Methods, 2nd edition. Soil and WaterConservation Society. St. Lucie Press, Delray Beach, pp. 211–234.
Strauss, P., Klaghofer, E., 2006. Status of Soil Erosion in Austria. In: Boardman,J., Poesen, J. (Eds.), Soil Erosion in Europe. JohnWiley, London, NewYork,pp. 205–212.
Strauss, P., Schmid, G., 2004. Einfluss von Saattechnik und Zwischenfrucht aufden Oberflächenabfluss und die Bodenerosion im Zuckerrübenbau.Schriftenreihe des Bundesamtes für Wasserwirtschaft 20, 91–109.
Strauss, P., Auerswald, K., Blum, W.E.H., Klaghofer, E., 1995. Erosivität vonNiederschlägen. Ein Vergleich Österreich- Bayern. Z.f. Kulturtechnik undLandentwicklung 36 (6), 304–309.
Summer,W.,Klaghofer, E., Zhang,W. (Eds.), 1998.Modelling soil erosion, sedimenttransport and closely related hydrological processes. International Associationof Hydrological Sciences (IAHS) Publications, vol. 249. Wallingford, 453 pp.
Tebrügge, F., Düring, R.A., 1999. Reducing tillage intensity— a review of resultsfrom a long-term study in Germany. Soil and Tillage Research 53 (1), 15–28.
UNEP, 2002. GEO — Global Environmental Outlook 3. United NationsEnvironment Programme, Nairobi. 416 pp.
USDA, 2002. Part 630 Hydrology— National Engineering Handbook: Chapter8: Land Use and Treatment Classes. United States Department ofAgriculture, Wahsington DC.
USDA, 2005. Crop Parameter Intelligent Database System. United StatesDepartmnet of Agriculture — Agricultural Research Service.
Walling, D.E., Webb, B.W., 1996. Erosion and sediment yield: a globaloverview. In: Walling, D.E., Webb, B.W. (Eds.), International Symposiumon Erosion and Sediment Yield: Global and Regional Perspectives.International Association of Hydrological Sciences, Exeter, UK.
Wilby, R.L., Wigley, T.M.L., 1997. Downscaling general circulation modeloutput: a review of methods and limitations. Progress in Physical Geography21, 530–548.
Williams, A., Pruski, F.F., Nearing, M., 2002. Indirect impacts of climate changethat affect agricultural production: soil erosion. In: Doering, O.C., Randolph,J.C., Southworth, K., Pfeifer, R.A. (Eds.), Effects of Climate Change andVariability on Agricultural Production Systems. Kluwer AcademicsPublishers, Boston, pp. 249–264.
Wischmeier, W.H., Smith, D.D., 1978. Predicting rainfall erosion losses: a guideto conservation planning, Agricultural Handbook No. 537. U.S. Departmentof Agriculture, Washington DC.
Yang, D., Kanae, S., Oki, T., Koike, T., Musiake, K., 2003. Global potential soilerosion with reference to land use and climate change. HydrologicalProcesses 17, 2913–2928.
Zhang, X.C., Nearing, M.A., 2005. Impact of climate change on soil erosion,runoff, and wheat productivity in central Oklahoma. Catena 61, 185–195.