proteome analysis of sugar beet leaves under drought stress
TRANSCRIPT
REGULAR ARTICLE
Proteome analysis of sugar beet leaves under
drought stress
Mohsen Hajheidari1, Mohammad Abdollahian-Noghabi2, Hossein Askari1,Manzar Heidari1, Seyed Y. Sadeghian2, Eric S. Ober3 and Ghasem Hosseini Salekdeh1
1 Agricultural Biotechnology Research Institute of Iran, Karaj, Iran2 Sugar Beet Seed Institute, Karaj, Iran3 Broom’s Barn Research Station, Higham, Bury St Edmunds, Suffolk, UK
Drought is one of the major factors limiting the yield of sugar beet (Beta vulgaris L.). The identi-fication of candidate genes for marker-assisted selection (MAS) could greatly improve the effi-ciency of breeding for increased drought tolerance. Drought-induced changes in the proteomecould highlight important genes. Two genotypes of sugar beet (7112 and 7219-P.69) differing ingenetic background were cultivated in the field. A line-source sprinkler irrigation system wasused to apply irrigated and water deficit treatments beginning at the four-leaf stage. At 157 daysafter sowing, leaf samples were collected from well-watered and drought-stressed plants for pro-tein extraction and to measure shoot biomass and leaf relative water content. Changes induced inleaf proteins were studied by two-dimensional gel electrophoresis and quantitatively analyzedusing image analysis software. Out of more than 500 protein spots reproducibly detected andanalyzed, 79 spots showed significant changes under drought. Some proteins showed genotype-specific patterns of up- or downregulation in response to drought. Twenty protein spots wereanalyzed by liquid chromatography-tandem mass spectrometry (LC-MS/MS), leading to identi-fication of Rubisco and 11 other proteins involved in redox regulation, oxidative stress, signaltransduction, and chaperone activities. Some of these proteins could contribute a physiologicaladvantage under drought, making them potential targets for MAS.
Received: May 11, 2004Revised: October 20, 2004
Accepted: October 28, 2004
Keywords:
Drought / Marker-assisted selection / Oxidative stress / Sugar beet
950 Proteomics 2005, 5, 950–960
1 Introduction
Drought is a major limitation to agricultural productionworldwide [1]. Compared to grain crops that have sensitivereproductive stages, sugar beet is relatively tolerant to water
deficiency, but drought nevertheless causes serious losses tosugar yields in many regions with inadequate water supplies,such as the U.K. [2] and Iran [3]. Water shortages also causelosses in irrigated environments because of managementrestrictions and poor maintenance of infrastructure. Waterdeficit occurs when the rate of transpiration exceeds wateruptake and is compounded by salinity and high temperatures[4]. As water deficit develops in sugar beet, leaf water potentialand relative water content decreases and the growth rate ofleaves and storage root declines [5]. Low stomatal conductancealso means less CO2 uptake for dry matter production.
Traditional breeding strategies are limited by the geneticcomplexity of drought tolerance, low genetic variance of yieldcomponents under stress conditions, the lack of efficientselection techniques [6, 7], environment variability, and stronggenotype 6 environment interactions [8]. Marker-assistedselection (MAS) of specific traits that are related to drought
Correspondence: Dr. Ghasem Hosseini Salekdeh, AgriculturalBiotechnology Research Institute of Iran, PO Box 31535–1897,Karaj, IranE-mail: [email protected]: 198-261-2704539
Abbreviations: 2-Cys Prx, 2-cysteine peroxiredoxin; DAS, daysafter sowing; HSP, heat shock protein; MAS, marker-assistedselection; a-NAC, putative nascent polypeptide-associated com-plex a-chain; NDPK, nucleoside diphosphate kinase; PPIase, pep-tidyl-prolyl cis/trans isomerase; ROS, reactive oxygen species;SOD, superoxide dismutase
2005 WILEY-VCH Verlag GmbH & Co. KGaA, Weinheim www.proteomics-journal.de
DOI 10.1002/pmic.200401101
Proteomics 2005, 5, 950–960 IPC Proceedings 951
tolerance and the ability to pyramid two or more charactersmight prove increasingly useful. However, MAS will remaininefficient for quantitative trait loci (QTLs) that have smalleffects on phenotype and are sensitive to environmental con-ditions [9]. If the identification of QTLs could be taken to thelevel of specific cloned genes, MAS would become extremelyefficient, because the gene itself or its regulatory genes wouldbe the marker [10]. Therefore, the analysis of plant responsesto drought at the molecular level is crucial for improvement inmolecular breeding for drought tolerance.
Upon exposure to drought stress, plants exhibit a widerange of responses at the whole plant, cellular and molecularlevels [11]. The expression patterns of many genes change inresponse to water deficit including proteins involved in stresssignaling pathways [10], oxidative stress detoxification [10,12], protein folding [13], protein degradation [14], and pro-teins with function not directly related to stress. In general,plant responses are involved in maintenance of homeostasis,detoxification of harmful elements and recovery of growth[14]. 2-DE in conjunction with mass spectrometry (MS) is apowerful approach for identifying proteins that play animportant role in the drought response. However, there havebeen very few published proteomic studies of drought-stres-sed plants. Studies with rice [15], maize [16], and wild water-melon [17] show that a wide range of metabolic pathways canbe affected, ranging from photosynthesis to lignification. Toour knowledge, this is the first report of proteomic analysisof sugar beet, and the first to use plants grown underauthentic drought conditions in the field.
The objectives of this study were to (i) quantify changes inthe sugar beet leaf proteome under droughted and irrigatedconditions; (ii) test the degree of genetic variation in droughtresponse at the molecular level by measuring quantitativeand qualitative differences in protein abundance in twogenotypes differing in genetic background. The goal of thisresearch is to eventually identify candidate genes for MAS forimproved drought tolerance and water use efficiency.
2 Materials and methods
2.1 Plant growth
A field experiment was carried out in the experimentalgrounds of the Sugar Beet Seed Institute in Karaj, Iran. Twogenotypes (7112, 7219-P.69), previously described by Sade-ghian and Yavari [18], were sown in May, 2002, at a density of100 000 plants ha21 in rows spaced 50 cm apart. The experi-mental design was a split-block design with three replicationsin two halves [19]. Plots were uniformly irrigated from emer-gence until the four-leaf stage. Then, switching to a line-sourcesprinkler irrigation system [20], a continuous water deficitgradient was applied until harvest at 157 days after sowing(DAS). During the growth season, normal and stressed plantsreceived 935 and 380 mm water, respectively. The effect of thistreatment was to allow drought stress to develop slowly in
natural manner. It has been shown that rapid imposition of adrought shock alters the molecular and physiological respon-ses of plants [21]. The environmental conditions during thegrowth season are shown in Table 1. At harvest, three samplesper replication were taken. One sample consisted of 100 ran-domly selected plants from which the tops (lamina separatedfrom petiole and root crowns) were removed and dried at 807Cfor 48 h to determine shoot dry weight. For the second sample,the fourth fully expanded leaf from ten randomly selectedplants was removed to measure relative water content (RWC)according to Barrs and Weatherly [22].
RWC = [(FW2DW)/(TW2DW)]6100 (1)
where FW, DW, and TW are leaf fresh, dry, and turgidweights, respectively. The third sample for proteome analysisconsisted of similar leaves from another ten randomly selec-ted plants. These leaves were immediately frozen in liquid N2
prior to being bulked together for protein extraction.
2.2 Protein extraction and 2-DE
Denaturing protein extraction was applied according toDamerval et al. [23] and Kamo et al. [24], with some mod-ifications. The samples were ground with liquid nitrogenand incubated in 10% w/v TCA/acetone with 0.07% w/v DTTat 2207C for 1 h and were centrifuged at 35 0006g for15 min. The pellets were washed with ice-cold acetone con-taining 0.07% DTT, incubated at 2207C for 1 h and cen-trifuged at 12 0006g for 15 min. The washing step was per-formed twice and then pellets were lyophilized. The result-ant powder was resuspended in a solubilization bufferconsisting of 9 M urea, 4% w/v CHAPS, 1% w/v DTT, 1% v/vpH 3–10 ampholytes, and 35 mM Tris base. The total proteinconcentration was quantified by the Bradford assay (Bio-Rad,Hercules, CA, USA) with BSA as the standard. IEF and SDS-PAGE were carried out according to Görg et al. [25, 26] withminor modifications. For IEF, 18 cm IPG strips with a lineargradient (pH 4–7) were rehydrated using 350 mL of rehydra-tion buffer (8 M w/v urea, 2% w/v CHAPS, 0.28% w/v DTT,2% v/v IPG buffers) in a reswelling tray (Amersham Phar-macia Biotech, Uppsala, Sweden) at room temperature for16 h. For analytical and preparative gels, 125 mg and 1.5 mgprotein were loaded, respectively. IEF was conducted at 207Cwith Multiphor II and a DryStrip Kit (Amersham PharmaciaBiotech). The running conditions were as follows: 500 V for2 h, followed by 1000 V for 4 h, and finally 3500 V for 12 h.The focused IPG strips were equilibrated for 15 min in 10 mLequilibration solution (50 mM Tris-HCl buffer, pH 8.8, 6 M w/v urea, 30% w/v glycerol, 2% w/v SDS, 1% w/v DTT, with afew grains of bromophenol blue) and strips were transferredto a vertical SDS-polyacrylamide gel. The second dimensionwas performed on a 13% SDS-polyacrylamide gel using aProtean II Multi Cell (Bio-Rad). The protein spots in analyti-cal gels were visualized by silver nitrate [27]. Preparative gelswere stained with colloidal CBB G-250 [28, 29].
2005 WILEY-VCH Verlag GmbH & Co. KGaA, Weinheim www.proteomics-journal.de
952 M. Hajheidari et al. Proteomics 2005, 5, 950–960
Table 1. Environmental conditions during the field experiment, 2002
Month Relative humiditiy (%) Sunshine (h)
Windspeed (m/s)
Evaporation(mm)
Rain(mm)
Soil surface temperature (7C)
Max Min Mean Mean Mean Mean Max Min Mean
May 67.2 41.8 39.6 10.3 3.6 8.7 0.5 34.4 7.5 20.9June 48.1 12.8 26.6 11.8 2.3 11.7 0.0 42.2 12.5 27.0July 55.3 15.5 31.0 11.5 2.6 12.8 0.1 46.1 17.6 31.8August 60.6 16.5 34.6 11.4 2.7 12.4 0.0 44.7 16.4 30.6September 50.4 11.6 27.7 10.4 1.9 10.0 0.0 38.4 11.6 24.6October 54.2 18.2 35.4 8.4 1.2 6.1 0.1 31.6 8.7 20.2
2.3 Image and data analysis
Wet, silver-stained gels were scanned using a GS-700 densi-tometer (Bio-Rad) at a resolution of 600 dots and 12 bits perinch. Image treatment, spot detection, and quantification weredone using the Melanie-3 package (GeneBio, Geneva, Switzer-land). Spot detection was carried out on 12-bit images usingoptimized parameters as follows: number of smooths, 1; Lapla-cian threshold, 5; partial threshold, 5; saturation, 90; peaknessincrease, 100; minimum perimeter, 10. Spot detection and gelmatching weredone according to Melanie-3 default settings andspot pairs were investigated visually. The scatter plots be-tween gels of each data point were displayed to estimate gelsimilarity or experimental errors and calibration was per-formed using a fitting report whenever necessary (Melanie-3user manual). The molecular masses of protein on gels weredetermined by co-electrophoresis of standard protein mark-ers (Amersham Pharmacia Biotech) and pI of the proteinswere determined by migration of the protein spots on 18 cmIPG (pH 4–7, linear) strips. One 2-D gel per sample was runand percent volume of each spot was estimated and analyzed.Considering the two genotypes (7112 and 7219-P.69) and twotreatments (well-watered and droughted), genotype 6 treat-ment combinations were analyzed by two-way analysis ofvariance (ANOVA) using MSTATC software (East Lansing,MI, USA). Spots were determined to be significantly up- ordownregulation when P � 0.05.
2.4 LC-MS/MS analyses and database search
Twenty proteins which showed the largest drought-inducedchanges and could be detected by CBB staining were excisedfrom preparative CBB-stained gels and sent to the AustralianProteome Analysis Facility (APAF) for LC-MS/MS analysis.Protein samples were destained and underwent a 14 h trypticdigest at 377C. After digestion the gel pieces were extractedinitially with 0.1% aqueous formic acid (50 mL) and then with50 mL H2O:ACN (1:1) (0.1% formic acid) for 15 min. Thecombined extracts were dried and the peptides resuspended in0.1% aqueous formic acid (20 mL). Digested peptides wereseparated by nano-LC using an Ultimate HPLC and Famosautosampler system (LC-Packings, Amsterdam, Netherlands).
Samples (5 mL) were concentrated and desalted onto a microC18 precolumn with H2O:ACN (98:2, 0.1% formic acid) at20 mL/min. After a 4-min wash the precolumn was switchedinto line with the analytical column containing C18 RP silica(PEPMAP, 75mm615 cm, LC-Packings). Peptides were elutedfrom the column using a linear solvent gradient fromH2O:ACN (95:5, 0.1% formic acid) to H2O:ACN (40:60, 0.1%formic acid) at 200 nL/min overa 30 min period. The LCeluentwas subject to positive ion nanoflow electrospray analysis onan API QStar Pulsar i hybrid tandem mass spectrometer(Applied Biosystems, Foster City, CA, USA). The QStar wasoperated in information-dependent acquisition (IDA) mode.In IDA mode a TOF-MS survey scan was acquired (m/z 350–1700, 0.75 s), with the two largest multiply charged ions(counts. 15) in the survey scan sequentially subjected to MS/MS analysis. MS/MS spectra were accumulated for 5 s (m/z50–2000). A processing script was used to generate data suit-able for submission to the database search program (Mascot,Matrix Science http://www.matrixscience.com/). Where Mas-cot failed to provide identification, spectra were interpretedboth manually and using sequencing algorithms, withthe derived amino acids sequences subject to EMBL MSBLAST (http://dove.embl-heidelberg.de/Blast2/msblast.html)homology-based searching.
3 Results
3.1 Plant responses to drought stress
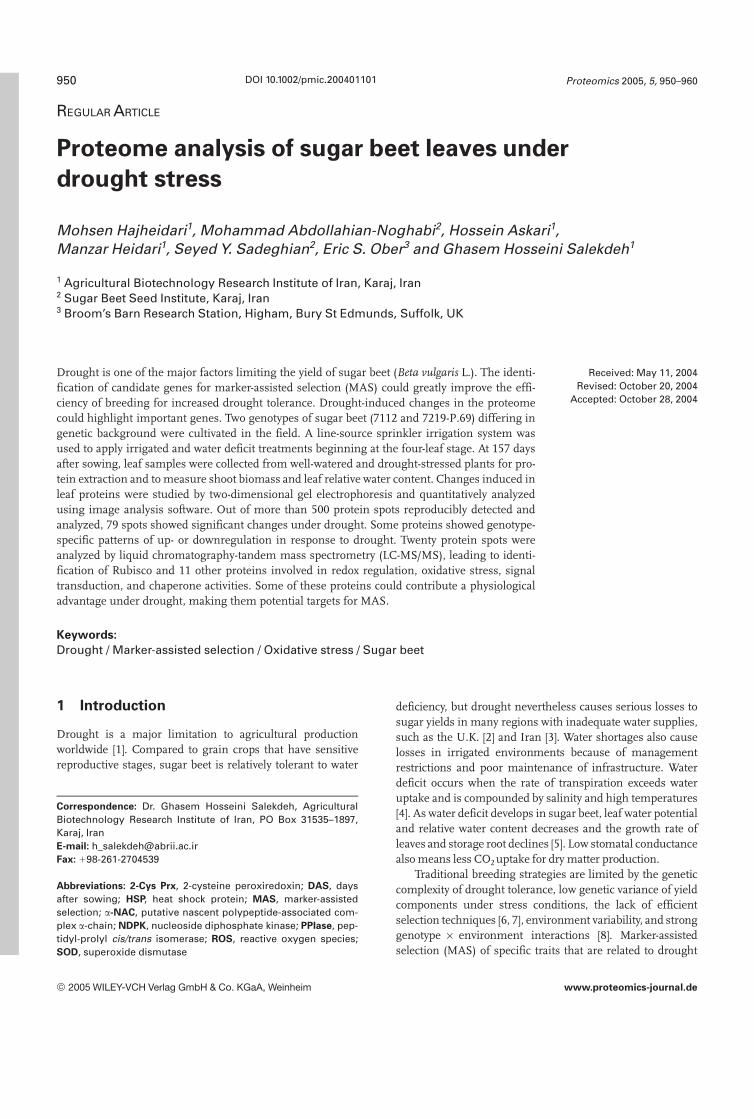
At 157 DAS, the shoot dry weight and leaf relative watercontents were markedly decreased by water deficit in bothgenotypes (Fig. 1). In drought stressed plants, shoot dryweight was approximately 50% of the irrigated controls inboth genotypes (Fig. 1a). The leaf relative water content instressed plants was decreased to 65% in both genotypes(Fig. 1b). Thus, in this study the two genotypes showedsimilar responses to drought and both experienced similarlevels of water deficit. However, proteomic analysis mayshow subtle differences in drought stress responses that arenot evident from measurements of dry matter and leaf waterstatus.
2005 WILEY-VCH Verlag GmbH & Co. KGaA, Weinheim www.proteomics-journal.de
Proteomics 2005, 5, 950–960 IPC Proceedings 953
Figure 1. (a) Mean shoot dry weight in lines of 7219-P.69 and 7112under irrigated and droughted conditions. (b) Mean leaf watercontent in lines 7219-P.69 and 7112 under irrigated and drought-ed conditions. Leaf samples were collected from 3 replicates(100 plants per replicate) at 157 DAS in the field.
3.2 Analysis of proteins altered under stress
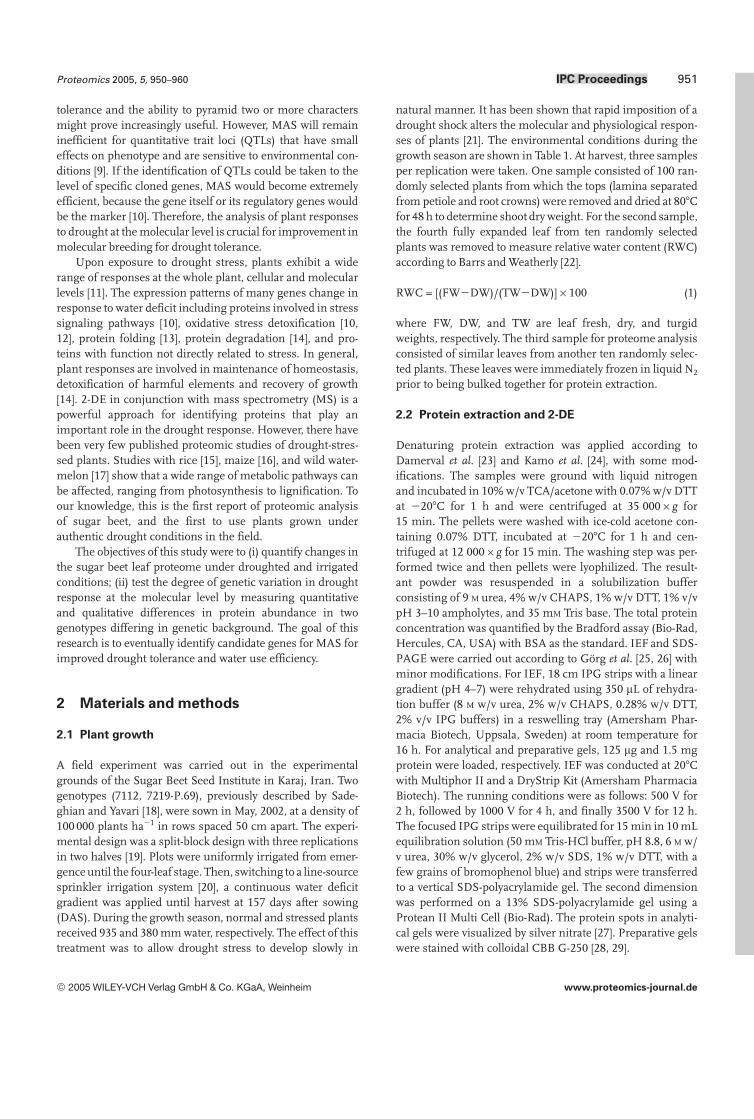
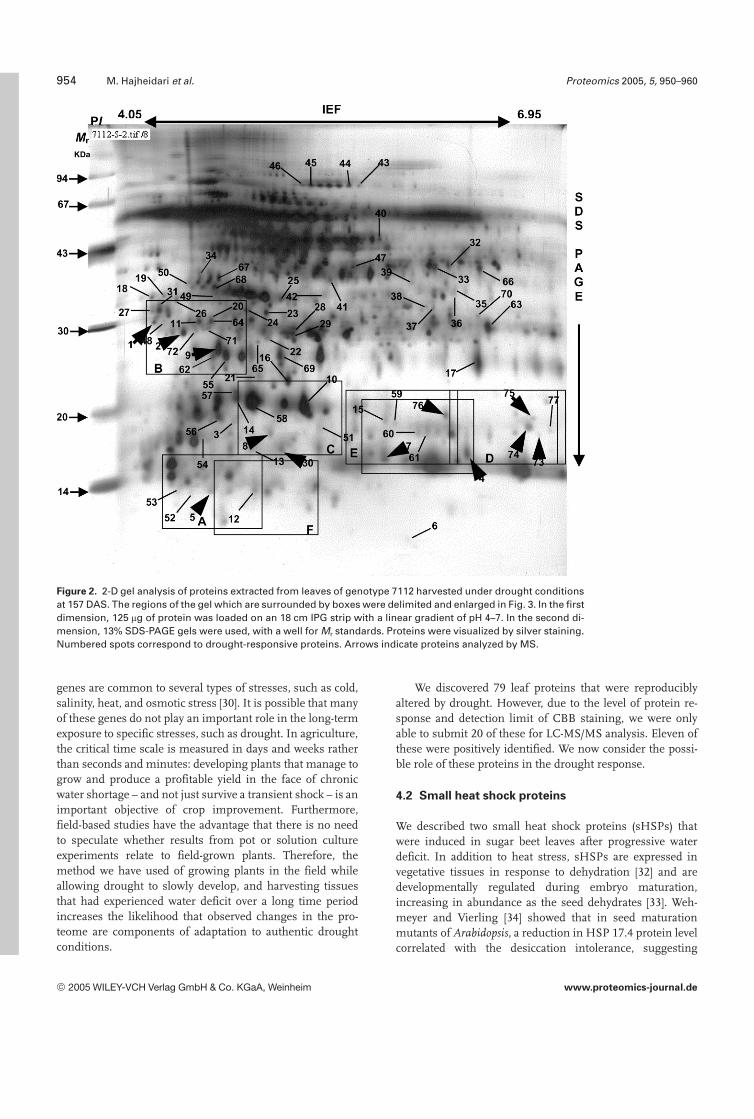
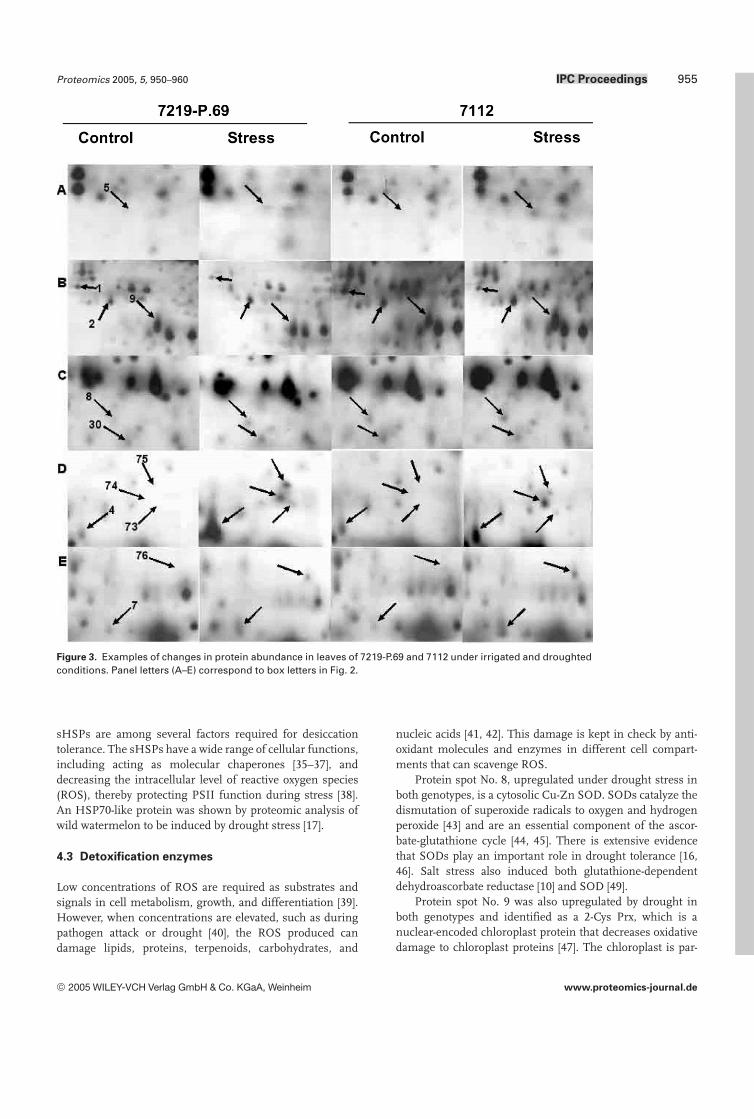
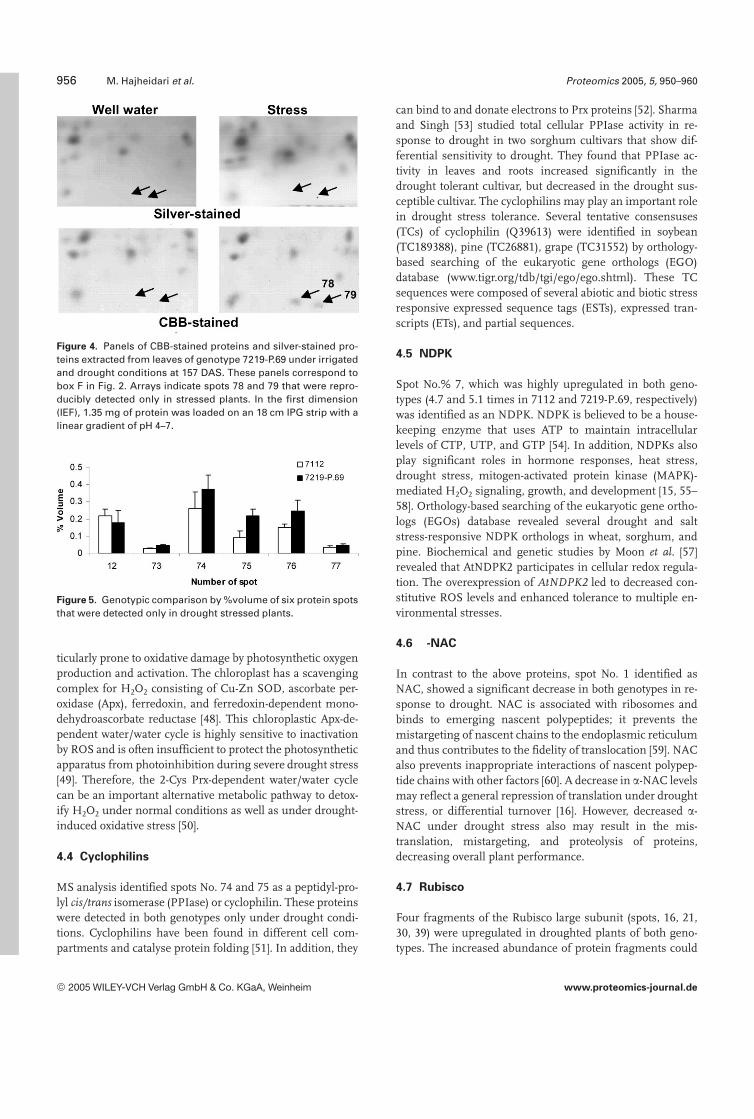
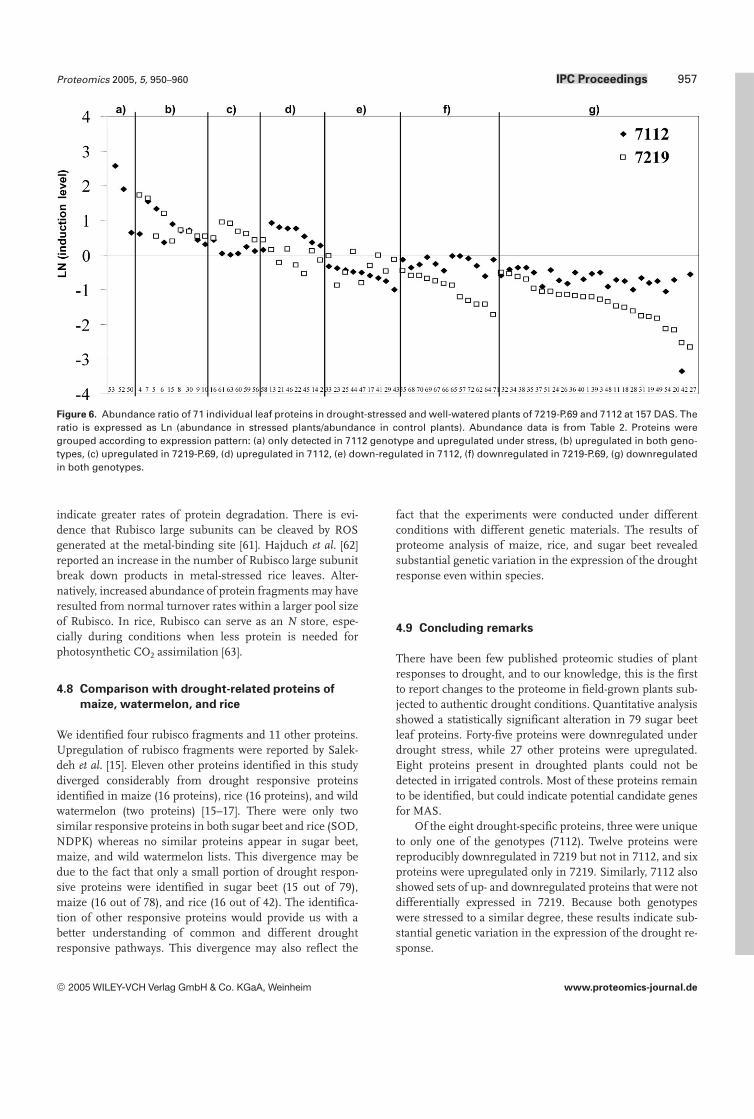
More than 500 spots were reproducibly detected on silver-stained gels. Of these, 77 spots showed significant changesin both stressed and control leaves in genotype 7112 (Fig. 2).Some of the protein changes in both genotypes under controland stress conditions are shown in more detail in Fig. 3. Inaddition, two proteins (78, 79) were visible only in CBB-stained preparative gels in stressed plants (Fig. 4). Consider-ing both genotypes, there were 79 responsive proteins: 27were upregulated, 44 were downregulated, and eight pro-teins were detected only in stressed plants (Fig. 5). We clas-sified the 71 responsive proteins that were detected in bothtreatments into several groups (Fig. 6). The major group(group g) was composed of 26 proteins that were down-regulated under stress in both genotypes. Twelve proteinswere downregulated only in 7219-P.69 (group f), whereasseven proteins were downregulated only in 7112 (group e).Ten proteins were upregulated in both genotypes (group b),whereas six and seven proteins were upregulated only in7219-P.69 (group c) and 7112 (group d), respectively. Three
spots, which were detected only in genotype 7112 (group a),were upregulated under stress. In summary, the number ofdownregulated proteins and the degree of down-regulationwas higher in genotype 7219-P.69. The induction factor(%volume of protein in stress condition/%volume of proteinin irrigated condition) of responsive proteins is shown inTable 2.
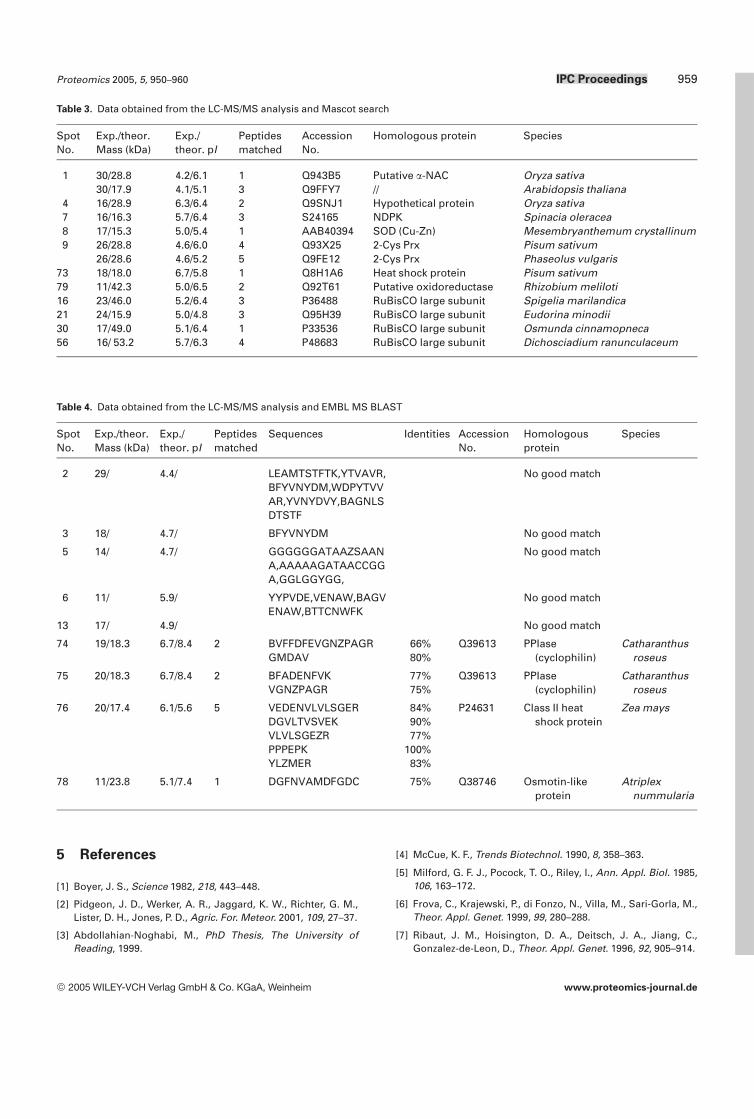
3.3 Protein identification
Twenty drought-responsive proteins were examined by LC-MS/MS. Spots that showed consistent positions on differentgels were considered to be the same proteins. Standardmarker proteins also were found at the same positions ondifferent gels. Mass data collected during an LC-MS/MSanalysis were analyzed using Mascot leading to identificationof 11 proteins (Table 3). These included two proteins detectedonly under water deficit conditions (heat shock protein(HSP) and putative oxidoreductase), and eight upregulatedproteins (2-cysteine peroxiredoxin (2-Cys Prx), superoxidedismutase (SOD), nucleoside-diphosphate kinase (NDPK),hypothetical protein, and four Rubisco fragments), and onedownregulated protein (putative nascent polypeptide-asso-ciated complex a-chain (a-NAC)). Where Mascot failed toprovide identification, spectra were interpreted both manu-ally and using sequencing algorithms. The derived aminoacids sequences were subject to EMBL MS BLAST homol-ogy-based searching leading to identification of four addi-tional proteins that were detected only in drought stressedplants: class II heat shock protein, osmotin-like protein, andtwo cyclophilins (Table 4).
4 Discussion
4.1 The proteomic approach
In order to identify genes that are crucial to crop improve-ment for water-limited environments, the vast array ofmRNAs with altered expression levels provides numerouspossibilities. One recent study in Arabidopsis showed that upto 30% of the transcriptome is responsive to stress and 1008mRNAs were specifically upregulated by water deficit [30].There were 370 genes of unknown function. Without a greatdeal of further work, it is difficult to identify promising can-didate genes, especially knowing that many mRNAs may notbe transcribed, or that changes in protein level or enzymeactivity can occur without any detectable change in transcriptabundance due to translational or other levels of control [31].By examining drought-induced changes in the proteome,focus is centered on changes in actual protein levels, thuslimiting the number of genes that initially must be con-sidered as possible targets.
The approach we used in this study has further advan-tages. It is widely known that there are numerous transientresponses to environmental shock, and that many of these
2005 WILEY-VCH Verlag GmbH & Co. KGaA, Weinheim www.proteomics-journal.de
954 M. Hajheidari et al. Proteomics 2005, 5, 950–960
Figure 2. 2-D gel analysis of proteins extracted from leaves of genotype 7112 harvested under drought conditionsat 157 DAS. The regions of the gel which are surrounded by boxes were delimited and enlarged in Fig. 3. In the firstdimension, 125 mg of protein was loaded on an 18 cm IPG strip with a linear gradient of pH 4–7. In the second di-mension, 13% SDS-PAGE gels were used, with a well for Mr standards. Proteins were visualized by silver staining.Numbered spots correspond to drought-responsive proteins. Arrows indicate proteins analyzed by MS.
genes are common to several types of stresses, such as cold,salinity, heat, and osmotic stress [30]. It is possible that manyof these genes do not play an important role in the long-termexposure to specific stresses, such as drought. In agriculture,the critical time scale is measured in days and weeks ratherthan seconds and minutes: developing plants that manage togrow and produce a profitable yield in the face of chronicwater shortage – and not just survive a transient shock – is animportant objective of crop improvement. Furthermore,field-based studies have the advantage that there is no needto speculate whether results from pot or solution cultureexperiments relate to field-grown plants. Therefore, themethod we have used of growing plants in the field whileallowing drought to slowly develop, and harvesting tissuesthat had experienced water deficit over a long time periodincreases the likelihood that observed changes in the pro-teome are components of adaptation to authentic droughtconditions.
We discovered 79 leaf proteins that were reproduciblyaltered by drought. However, due to the level of protein re-sponse and detection limit of CBB staining, we were onlyable to submit 20 of these for LC-MS/MS analysis. Eleven ofthese were positively identified. We now consider the possi-ble role of these proteins in the drought response.
4.2 Small heat shock proteins
We described two small heat shock proteins (sHSPs) thatwere induced in sugar beet leaves after progressive waterdeficit. In addition to heat stress, sHSPs are expressed invegetative tissues in response to dehydration [32] and aredevelopmentally regulated during embryo maturation,increasing in abundance as the seed dehydrates [33]. Weh-meyer and Vierling [34] showed that in seed maturationmutants of Arabidopsis, a reduction in HSP 17.4 protein levelcorrelated with the desiccation intolerance, suggesting
2005 WILEY-VCH Verlag GmbH & Co. KGaA, Weinheim www.proteomics-journal.de
Proteomics 2005, 5, 950–960 IPC Proceedings 955
Figure 3. Examples of changes in protein abundance in leaves of 7219-P.69 and 7112 under irrigated and droughtedconditions. Panel letters (A–E) correspond to box letters in Fig. 2.
sHSPs are among several factors required for desiccationtolerance. The sHSPs have a wide range of cellular functions,including acting as molecular chaperones [35–37], anddecreasing the intracellular level of reactive oxygen species(ROS), thereby protecting PSII function during stress [38].An HSP70-like protein was shown by proteomic analysis ofwild watermelon to be induced by drought stress [17].
4.3 Detoxification enzymes
Low concentrations of ROS are required as substrates andsignals in cell metabolism, growth, and differentiation [39].However, when concentrations are elevated, such as duringpathogen attack or drought [40], the ROS produced candamage lipids, proteins, terpenoids, carbohydrates, and
nucleic acids [41, 42]. This damage is kept in check by anti-oxidant molecules and enzymes in different cell compart-ments that can scavenge ROS.
Protein spot No. 8, upregulated under drought stress inboth genotypes, is a cytosolic Cu-Zn SOD. SODs catalyze thedismutation of superoxide radicals to oxygen and hydrogenperoxide [43] and are an essential component of the ascor-bate-glutathione cycle [44, 45]. There is extensive evidencethat SODs play an important role in drought tolerance [16,46]. Salt stress also induced both glutathione-dependentdehydroascorbate reductase [10] and SOD [49].
Protein spot No. 9 was also upregulated by drought inboth genotypes and identified as a 2-Cys Prx, which is anuclear-encoded chloroplast protein that decreases oxidativedamage to chloroplast proteins [47]. The chloroplast is par-
2005 WILEY-VCH Verlag GmbH & Co. KGaA, Weinheim www.proteomics-journal.de
956 M. Hajheidari et al. Proteomics 2005, 5, 950–960
Figure 4. Panels of CBB-stained proteins and silver-stained pro-teins extracted from leaves of genotype 7219-P.69 under irrigatedand drought conditions at 157 DAS. These panels correspond tobox F in Fig. 2. Arrays indicate spots 78 and 79 that were repro-ducibly detected only in stressed plants. In the first dimension(IEF), 1.35 mg of protein was loaded on an 18 cm IPG strip with alinear gradient of pH 4–7.
Figure 5. Genotypic comparison by %volume of six protein spotsthat were detected only in drought stressed plants.
ticularly prone to oxidative damage by photosynthetic oxygenproduction and activation. The chloroplast has a scavengingcomplex for H2O2 consisting of Cu-Zn SOD, ascorbate per-oxidase (Apx), ferredoxin, and ferredoxin-dependent mono-dehydroascorbate reductase [48]. This chloroplastic Apx-de-pendent water/water cycle is highly sensitive to inactivationby ROS and is often insufficient to protect the photosyntheticapparatus from photoinhibition during severe drought stress[49]. Therefore, the 2-Cys Prx-dependent water/water cyclecan be an important alternative metabolic pathway to detox-ify H2O2 under normal conditions as well as under drought-induced oxidative stress [50].
4.4 Cyclophilins
MS analysis identified spots No. 74 and 75 as a peptidyl-pro-lyl cis/trans isomerase (PPIase) or cyclophilin. These proteinswere detected in both genotypes only under drought condi-tions. Cyclophilins have been found in different cell com-partments and catalyse protein folding [51]. In addition, they
can bind to and donate electrons to Prx proteins [52]. Sharmaand Singh [53] studied total cellular PPIase activity in re-sponse to drought in two sorghum cultivars that show dif-ferential sensitivity to drought. They found that PPIase ac-tivity in leaves and roots increased significantly in thedrought tolerant cultivar, but decreased in the drought sus-ceptible cultivar. The cyclophilins may play an important rolein drought stress tolerance. Several tentative consensuses(TCs) of cyclophilin (Q39613) were identified in soybean(TC189388), pine (TC26881), grape (TC31552) by orthology-based searching of the eukaryotic gene orthologs (EGO)database (www.tigr.org/tdb/tgi/ego/ego.shtml). These TCsequences were composed of several abiotic and biotic stressresponsive expressed sequence tags (ESTs), expressed tran-scripts (ETs), and partial sequences.
4.5 NDPK
Spot No.% 7, which was highly upregulated in both geno-types (4.7 and 5.1 times in 7112 and 7219-P.69, respectively)was identified as an NDPK. NDPK is believed to be a house-keeping enzyme that uses ATP to maintain intracellularlevels of CTP, UTP, and GTP [54]. In addition, NDPKs alsoplay significant roles in hormone responses, heat stress,drought stress, mitogen-activated protein kinase (MAPK)-mediated H2O2 signaling, growth, and development [15, 55–58]. Orthology-based searching of the eukaryotic gene ortho-logs (EGOs) database revealed several drought and saltstress-responsive NDPK orthologs in wheat, sorghum, andpine. Biochemical and genetic studies by Moon et al. [57]revealed that AtNDPK2 participates in cellular redox regula-tion. The overexpression of AtNDPK2 led to decreased con-stitutive ROS levels and enhanced tolerance to multiple en-vironmental stresses.
4.6 Æ-NAC
In contrast to the above proteins, spot No. 1 identified asNAC, showed a significant decrease in both genotypes in re-sponse to drought. NAC is associated with ribosomes andbinds to emerging nascent polypeptides; it prevents themistargeting of nascent chains to the endoplasmic reticulumand thus contributes to the fidelity of translocation [59]. NACalso prevents inappropriate interactions of nascent polypep-tide chains with other factors [60]. A decrease in a-NAC levelsmay reflect a general repression of translation under droughtstress, or differential turnover [16]. However, decreased a-NAC under drought stress also may result in the mis-translation, mistargeting, and proteolysis of proteins,decreasing overall plant performance.
4.7 Rubisco
Four fragments of the Rubisco large subunit (spots, 16, 21,30, 39) were upregulated in droughted plants of both geno-types. The increased abundance of protein fragments could
2005 WILEY-VCH Verlag GmbH & Co. KGaA, Weinheim www.proteomics-journal.de
Proteomics 2005, 5, 950–960 IPC Proceedings 957
Figure 6. Abundance ratio of 71 individual leaf proteins in drought-stressed and well-watered plants of 7219-P.69 and 7112 at 157 DAS. Theratio is expressed as Ln (abundance in stressed plants/abundance in control plants). Abundance data is from Table 2. Proteins weregrouped according to expression pattern: (a) only detected in 7112 genotype and upregulated under stress, (b) upregulated in both geno-types, (c) upregulated in 7219-P.69, (d) upregulated in 7112, (e) down-regulated in 7112, (f) downregulated in 7219-P.69, (g) downregulatedin both genotypes.
indicate greater rates of protein degradation. There is evi-dence that Rubisco large subunits can be cleaved by ROSgenerated at the metal-binding site [61]. Hajduch et al. [62]reported an increase in the number of Rubisco large subunitbreak down products in metal-stressed rice leaves. Alter-natively, increased abundance of protein fragments may haveresulted from normal turnover rates within a larger pool sizeof Rubisco. In rice, Rubisco can serve as an N store, espe-cially during conditions when less protein is needed forphotosynthetic CO2 assimilation [63].
4.8 Comparison with drought-related proteins of
maize, watermelon, and rice
We identified four rubisco fragments and 11 other proteins.Upregulation of rubisco fragments were reported by Salek-deh et al. [15]. Eleven other proteins identified in this studydiverged considerably from drought responsive proteinsidentified in maize (16 proteins), rice (16 proteins), and wildwatermelon (two proteins) [15–17]. There were only twosimilar responsive proteins in both sugar beet and rice (SOD,NDPK) whereas no similar proteins appear in sugar beet,maize, and wild watermelon lists. This divergence may bedue to the fact that only a small portion of drought respon-sive proteins were identified in sugar beet (15 out of 79),maize (16 out of 78), and rice (16 out of 42). The identifica-tion of other responsive proteins would provide us with abetter understanding of common and different droughtresponsive pathways. This divergence may also reflect the
fact that the experiments were conducted under differentconditions with different genetic materials. The results ofproteome analysis of maize, rice, and sugar beet revealedsubstantial genetic variation in the expression of the droughtresponse even within species.
4.9 Concluding remarks
There have been few published proteomic studies of plantresponses to drought, and to our knowledge, this is the firstto report changes to the proteome in field-grown plants sub-jected to authentic drought conditions. Quantitative analysisshowed a statistically significant alteration in 79 sugar beetleaf proteins. Forty-five proteins were downregulated underdrought stress, while 27 other proteins were upregulated.Eight proteins present in droughted plants could not bedetected in irrigated controls. Most of these proteins remainto be identified, but could indicate potential candidate genesfor MAS.
Of the eight drought-specific proteins, three were uniqueto only one of the genotypes (7112). Twelve proteins werereproducibly downregulated in 7219 but not in 7112, and sixproteins were upregulated only in 7219. Similarly, 7112 alsoshowed sets of up- and downregulated proteins that were notdifferentially expressed in 7219. Because both genotypeswere stressed to a similar degree, these results indicate sub-stantial genetic variation in the expression of the drought re-sponse.
2005 WILEY-VCH Verlag GmbH & Co. KGaA, Weinheim www.proteomics-journal.de
958 M. Hajheidari et al. Proteomics 2005, 5, 950–960
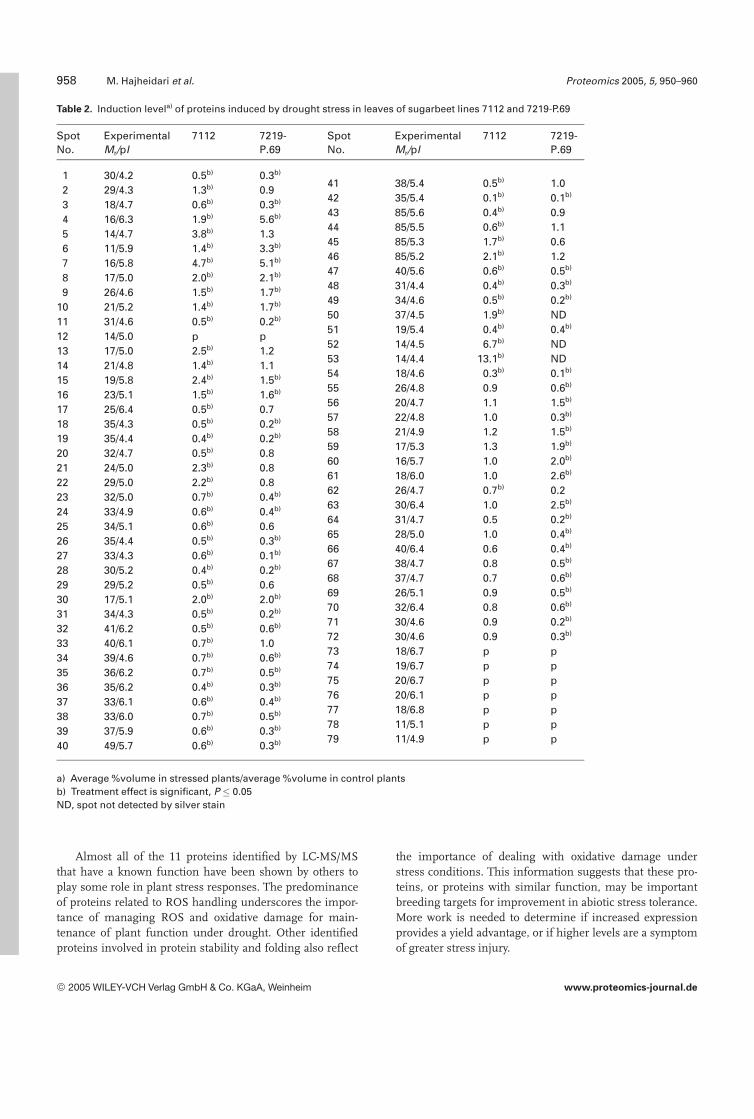
Table 2. Induction levela) of proteins induced by drought stress in leaves of sugarbeet lines 7112 and 7219-P.69
SpotNo.
ExperimentalMr/pI
7112 7219-P.69
SpotNo.
ExperimentalMr/pI
7112 7219-P.69
1 30/4.2 0.5b) 0.3b)
2 29/4.3 1.3b) 0.941 38/5.4 0.5b) 1.0
3 18/4.7 0.6b) 0.3b) 42 35/5.4 0.1b) 0.1b)
4 16/6.3 1.9b) 5.6b) 43 85/5.6 0.4b) 0.9
5 14/4.7 3.8b) 1.344 85/5.5 0.6b) 1.1
6 11/5.9 1.4b) 3.3b) 45 85/5.3 1.7b) 0.6
7 16/5.8 4.7b) 5.1b) 46 85/5.2 2.1b) 1.2
8 17/5.0 2.0b) 2.1b) 47 40/5.6 0.6b) 0.5b)
9 26/4.6 1.5b) 1.7b) 48 31/4.4 0.4b) 0.3b)
10 21/5.2 1.4b) 1.7b) 49 34/4.6 0.5b) 0.2b)
11 31/4.6 0.5b) 0.2b) 50 37/4.5 1.9b) ND
12 14/5.0 p p51 19/5.4 0.4b) 0.4b)
13 17/5.0 2.5b) 1.252 14/4.5 6.7b) ND
14 21/4.8 1.4b) 1.153 14/4.4 13.1b) ND
15 19/5.8 2.4b) 1.5b) 54 18/4.6 0.3b) 0.1b)
16 23/5.1 1.5b) 1.6b) 55 26/4.8 0.9 0.6b)
17 25/6.4 0.5b) 0.756 20/4.7 1.1 1.5b)
18 35/4.3 0.5b) 0.2b) 57 22/4.8 1.0 0.3b)
19 35/4.4 0.4b) 0.2b) 58 21/4.9 1.2 1.5b)
20 32/4.7 0.5b) 0.859 17/5.3 1.3 1.9b)
21 24/5.0 2.3b) 0.860 16/5.7 1.0 2.0b)
22 29/5.0 2.2b) 0.861 18/6.0 1.0 2.6b)
23 32/5.0 0.7b) 0.4b) 62 26/4.7 0.7b) 0.2
24 33/4.9 0.6b) 0.4b) 63 30/6.4 1.0 2.5b)
25 34/5.1 0.6b) 0.664 31/4.7 0.5 0.2b)
26 35/4.4 0.5b) 0.3b) 65 28/5.0 1.0 0.4b)
27 33/4.3 0.6b) 0.1b) 66 40/6.4 0.6 0.4b)
28 30/5.2 0.4b) 0.2b) 67 38/4.7 0.8 0.5b)
29 29/5.2 0.5b) 0.668 37/4.7 0.7 0.6b)
30 17/5.1 2.0b) 2.0b) 69 26/5.1 0.9 0.5b)
31 34/4.3 0.5b) 0.2b) 70 32/6.4 0.8 0.6b)
32 41/6.2 0.5b) 0.6b) 71 30/4.6 0.9 0.2b)
33 40/6.1 0.7b) 1.072 30/4.6 0.9 0.3b)
34 39/4.6 0.7b) 0.6b) 73 18/6.7 p p
35 36/6.2 0.7b) 0.5b) 74 19/6.7 p p
36 35/6.2 0.4b) 0.3b) 75 20/6.7 p p
37 33/6.1 0.6b) 0.4b) 76 20/6.1 p p
38 33/6.0 0.7b) 0.5b) 77 18/6.8 p p
39 37/5.9 0.6b) 0.3b) 78 11/5.1 p p
40 49/5.7 0.6b) 0.3b) 79 11/4.9 p p
a) Average %volume in stressed plants/average %volume in control plantsb) Treatment effect is significant, P � 0.05ND, spot not detected by silver stain
Almost all of the 11 proteins identified by LC-MS/MSthat have a known function have been shown by others toplay some role in plant stress responses. The predominanceof proteins related to ROS handling underscores the impor-tance of managing ROS and oxidative damage for main-tenance of plant function under drought. Other identifiedproteins involved in protein stability and folding also reflect
the importance of dealing with oxidative damage understress conditions. This information suggests that these pro-teins, or proteins with similar function, may be importantbreeding targets for improvement in abiotic stress tolerance.More work is needed to determine if increased expressionprovides a yield advantage, or if higher levels are a symptomof greater stress injury.
2005 WILEY-VCH Verlag GmbH & Co. KGaA, Weinheim www.proteomics-journal.de
Proteomics 2005, 5, 950–960 IPC Proceedings 959
Table 3. Data obtained from the LC-MS/MS analysis and Mascot search
SpotNo.
Exp./theor.Mass (kDa)
Exp./theor. pI
Peptidesmatched
AccessionNo.
Homologous protein Species
1 30/28.8 4.2/6.1 1 Q943B5 Putative a-NAC Oryza sativa30/17.9 4.1/5.1 3 Q9FFY7 // Arabidopsis thaliana
4 16/28.9 6.3/6.4 2 Q9SNJ1 Hypothetical protein Oryza sativa7 16/16.3 5.7/6.4 3 S24165 NDPK Spinacia oleracea8 17/15.3 5.0/5.4 1 AAB40394 SOD (Cu-Zn) Mesembryanthemum crystallinum9 26/28.8 4.6/6.0 4 Q93X25 2-Cys Prx Pisum sativum
26/28.6 4.6/5.2 5 Q9FE12 2-Cys Prx Phaseolus vulgaris73 18/18.0 6.7/5.8 1 Q8H1A6 Heat shock protein Pisum sativum79 11/42.3 5.0/6.5 2 Q92T61 Putative oxidoreductase Rhizobium meliloti16 23/46.0 5.2/6.4 3 P36488 RuBisCO large subunit Spigelia marilandica21 24/15.9 5.0/4.8 3 Q95H39 RuBisCO large subunit Eudorina minodii30 17/49.0 5.1/6.4 1 P33536 RuBisCO large subunit Osmunda cinnamopneca56 16/ 53.2 5.7/6.3 4 P48683 RuBisCO large subunit Dichosciadium ranunculaceum
Table 4. Data obtained from the LC-MS/MS analysis and EMBL MS BLAST
SpotNo.
Exp./theor.Mass (kDa)
Exp./theor. pI
Peptidesmatched
Sequences Identities AccessionNo.
Homologousprotein
Species
2 29/ 4.4/ LEAMTSTFTK,YTVAVR,BFYVNYDM,WDPYTVVAR,YVNYDVY,BAGNLSDTSTF
No good match
3 18/ 4.7/ BFYVNYDM No good match
5 14/ 4.7/ GGGGGGATAAZSAANA,AAAAAGATAACCGGA,GGLGGYGG,
No good match
6 11/ 5.9/ YYPVDE,VENAW,BAGVENAW,BTTCNWFK
No good match
13 17/ 4.9/ No good match
74 19/18.3 6.7/8.4 2 BVFFDFEVGNZPAGRGMDAV
66%80%
Q39613 PPIase(cyclophilin)
Catharanthusroseus
75 20/18.3 6.7/8.4 2 BFADENFVKVGNZPAGR
77%75%
Q39613 PPIase(cyclophilin)
Catharanthusroseus
76 20/17.4 6.1/5.6 5 VEDENVLVLSGERDGVLTVSVEKVLVLSGEZRPPPEPKYLZMER
84%90%77%
100%83%
P24631 Class II heatshock protein
Zea mays
78 11/23.8 5.1/7.4 1 DGFNVAMDFGDC 75% Q38746 Osmotin-likeprotein
Atriplexnummularia
5 References
[1] Boyer, J. S., Science 1982, 218, 443–448.
[2] Pidgeon, J. D., Werker, A. R., Jaggard, K. W., Richter, G. M.,Lister, D. H., Jones, P. D., Agric. For. Meteor. 2001, 109, 27–37.
[3] Abdollahian-Noghabi, M., PhD Thesis, The University ofReading, 1999.
[4] McCue, K. F., Trends Biotechnol. 1990, 8, 358–363.
[5] Milford, G. F. J., Pocock, T. O., Riley, I., Ann. Appl. Biol. 1985,106, 163–172.
[6] Frova, C., Krajewski, P., di Fonzo, N., Villa, M., Sari-Gorla, M.,Theor. Appl. Genet. 1999, 99, 280–288.
[7] Ribaut, J. M., Hoisington, D. A., Deitsch, J. A., Jiang, C.,Gonzalez-de-Leon, D., Theor. Appl. Genet. 1996, 92, 905–914.
2005 WILEY-VCH Verlag GmbH & Co. KGaA, Weinheim www.proteomics-journal.de
960 M. Hajheidari et al. Proteomics 2005, 5, 950–960
[8] Ober, E. S., Luterbacher, M. C., Ann. Bot. 2002, 89, 917–924.
[9] Flowers, T. J., Koyama, M. L., Flowers, S. A., Sudhakar, C. etal., J. Exp. Bot. 2000, 51, 99–106.
[10] Salekdeh, Gh. H., Siopongco, J., Wade, L. J., Ghareyazie, B.,Bennett, J., Field Crops Res. 2002, 76, 199–219.
[11] Hasegawa, P. M., Bressan, R. A., Zhu, J.-K., Bohnert, H. J.,Annu. Rev. Plant Physiol. Plant Mol. Biol. 2000, 51, 463–499.
[12] Ingram, J., Bartels, D., Annu. Rev. Plant Physiol. Plant Mol.Biol. 1996, 47, 337–403.
[13] Williams, J., Bulman, M., Huttly, A., Phillips, A., Neil, S.,Plant Mol. Biol. 1994, 25, 259–270.
[14] Xiong, L., Zhu, J. K., Plant Cell Environ. 2002, 25, 131–139.
[15] Salekdeh, Gh. H., Siopongco, J., Wade, L. J., Ghareyazie, B.,Bennett, J., Proteomics 2002, 2, 1131–1145.
[16] Riccardi, F., Gazeau, P., de Vienne, D., Zivy, M., Plant Physiol.1998, 117, 1253–1263.
[17] Kawasaki, S., Miyake, C., Kohchi, T., Fujii, M. et al., Plant CellPhysiol. 2000, 47, 864–873.
[18] Sadeghian, S. Y., Yavari, N., Agro. Crop Sci. 2004, 190, 138–140.
[19] Hanks, R. J., Visson, D. V., Hurst, R. L., Hubbard, K. G., SoilSci. Soc. Am J. 1980, 44, 886–888.
[20] Hanks, R. J., Keller, J., Rasmussen, V. P., Wilson, G. D., SoilSci. Soc. Am. J. 1976, 40, 426–429.
[21] Naidu, B. P., Paleg, L. G., Aspinall, D., Jennings, A. C., Jones,G. P., Aust. J. Plant Phys. 1990, 17, 653–664.
[22] Barrs, H. D., Weatherly, P. E., Aust. J. Biol. Sci. 1962, 15, 413–428.
[23] Damerval, C., de Viene, D., Zivy, M., Thiellement, H., Elec-trophoresis 1986, 7, 53–54.
[24] Kamo, M., Kawakami, T., Miyatake, N., Tsugita, A., Electro-phoresis 1995, 16, 423–430.
[25] Görg, A., Postel, W., Domscheit, A., Günther, S., Electro-phoresis 1988, 9, 681–692.
[26] Görg, A., Boguth, G., Obermaier, C., Weiss, W., Electropho-resis 1998, 19, 1516–1519.
[27] Blum, H., Beier, H., Gross, H. J., Electrophoresis 1987, 8, 93–99.
[28] Neuhoff, V., Arnold, N., Taube, D., Ehrhardt, W., Electropho-resis 1988, 9, 255–262.
[29] Smith, D. M., Tran, H. M., Epstein, L. B., in: Balkwill, F. R.(Ed.), Cytokines: A Practical Approach, 2nd ed., IRL Press,Oxford 1995, pp. 111–128.
[30] Kreps, J. A., Wu, Y., Chang, H-S., Zhu, T. et al., Plant Physiol.2002, 130, 2129–2141.
[31] Gygi, S. P., Rochon, Y., Franza, B. R., Aebersold, R., Mol CellBiol. 1999, 19, 1720–1730.
[32] Almoguera, C., Coca, M. A., Jordano, J., Plant J. 1993, 4,947–958.
[33] DeRocher, A., Vierling, E., Plant J. 1994, 5, 93–102.
[34] Wehmeyer, N., Vierling, E., Plant Physiol. 2000, 122, 1099–1108.
[35] Lee, G. J., Pokala, N., Vierling, E., J. Biol. Chem. 1995, 270,10432–10438.
[36] Lee, G. J., Roseman, A. M., Saibil, H. R., Vierling, E., EMBO J.1997, 16, 659–671.
[37] Münchbach, M., Dainese, P., Staudenmann, W., Narberhaus,F., James, P., Eur. J. Biochem. 1999, 263, 39–48.
[38] Heckathorn, S. A., Ryan, S. L., Baylis, J. A., Wang, D. et al.,Funct. Plant Biol. 2002, 29, 935–946.
[39] Dietz, K. J., Link, G., Pistorius, E. K., Scheibe, R., Prog. Bot.2002, 63, 207–245.
[40] Foyer, C. H., Mullineaux, P. M., Causes of PhotooxidativeStress and Amelioration of Defence Systems in Plants, CRCPress, Boca Raton, FL 1994.
[41] Baier, M., Dietz, K. J., Prog. Bot. 1998, 60, 283–314.
[42] Monk, L. S., Fagerstedt, K. V., Crawford, R. M. M., Plant Phy-siol. 1989, 76, 456–459.
[43] Foyer, C. H., Descourvieres, P., Kunert, K. J., Plant Cell Envi-ron. 1994, 17, 507–523.
[44] Bannister, J. V., Bannister, W. H., Rotils, G., CRC Crit. Rev.Biochem. 1987, 22, 110–180.
[45] Beyer, W., Imlay, J., Fridovich, I., Nucleic Acids Res. 1991, 40,221–253.
[46] Bowler, C., Van Montagu, M., Inze, D., Annu. Rev. Plant Phy-siol. 1992, 43, 83–116.
[47] Dietz, K. J., Horling, F., König, J., Baier, M., J. Exp. Bot. 2002,53, 1321–1329.
[48] Asada, K., Endo, T., Mano, J., Miyake, C., in: Satoh, K.,Murata, N. (Eds.), Stress Responses of PhotosyntheticOrganism, Elsevier Science, Amsterdam 1998, pp. 37–52.
[49] Shikanai, T., Takeda, T., Yamauchi, H., Sano, S. et al., FEBSLett. 1998, 428, 47–51.
[50] Dietz, K. J., Annu. Rev. Plant Biol. 2003, 54, 93–107.
[51] Leverson, J. D., Ness, S. A., Mol. Cell. 1998, 1, 203–211.
[52] Lee, S. P., Hwang, Y. S., Kim, Y. J., Kwon, K. S., et al., J. Biol.Chem. 2001, 276, 29826–29832.
[53] Sharma, A. D., Singh, P., Curr. Sci. (India) 2003, 911–918.
[54] Parks, R. E. J., Agarwal, R. P., in: Boyer, P. D. (Ed.), TheEnzymes, Academic Press, New York 1973.
[55] Choi, G., Yi, H., Lee, J., Kwon, Y. K. et al., Nature 1999, 401,610–613.
[56] Galvis, M. L., Marttila, S., Hakansson, G., Forsberg, J.,Knorpp, C., Plant Physiol. 2001, 126, 69–77.
[57] Moon, H., Lee, B., Choi, G., Shin, D. et al., Proc. Natl. Acad.Sci. USA 2003, 100, 358–363.
[58] Novikova, G. V., Moshkov, I. E., Smith, A. R., Kulaeva, O. N.,Hall, M. A., Planta 1999, 208, 239–246.
[59] Lauring, B., Sakai, H., Kreibich, G., Wiedmann, M., Proc.Natl. Acad. Sci. USA 1995, 92, 5411–5415.
[60] Beatrix, B., Sakai, H., Wiedmann, M., J. Biol. Chem. 2000,275, 37838–37845.
[61] Luo, S., Ishida, H., Makino, A., Mae, T., J. Biol. Chem. 2002,277, 12382–12387.
[62] Hajduch, M., Rakwal, R., Agrawal, G. K., Yonekura, M., Pre-tova, A., Electrophoresis 2001, 22, 2824–2831.
[63] Horton, P., J. Exp. Bot. 2000, 51, 475–485.
2005 WILEY-VCH Verlag GmbH & Co. KGaA, Weinheim www.proteomics-journal.de