morpho-physiological traits of sugar beet exposed to salt stress
TRANSCRIPT

International Sugar Journal | October 2013756 757www.internationalsugarjournal.com
Morpho–physiological traits of sugar beet exposed to salt stress
1Dipartimento di Agronomia, Animali, Alimenti, Risorse naturali e Ambiente (DAFNAE), Università degli Studi di Padova, Padova, Italy2Sugar Beet Research Institute, Chinese Academy of Agricultural Sciences, Harbin, China3Consiglio per la Ricerca e la Sperimentazione in Agricoltura, Centro di Ricerca per le Colture Industriali, CRA-CIN, Rovigo, Italy4Dipartimento di Agraria, Università degli Studi ‘Mediterranea’ di Reggio Calabria, Reggio Calabria, Italy
Piergiorgio Stevanato1*, Geng Gui2, Giovanni Cacco1, Enrico Biancardi3, Maria Rosa Abenavoli4, Alessandro Romano4 and Agostino Sorgonà4
Abstract Selection of traits increasing salt (NaCl) tolerance would improve the cultivation of sugar beet (Beta vulgaris L. subsp. vulgaris) in salty soils, by reducing or avoiding the usually linked losses in sugar yield and processing quality. This study analysed some adaptive morpho-physiological mechanisms in genotypes grown under controlled conditions in different salt concentrations. Parents and F1 hybrids obtained from a diallel cross were analysed for: i) mid-parent heterosis of root; ii) root length and its morphological components; and iii) length and dry weight of shoot (leaf + stem). Physiological traits such as: i) antioxidant enzyme activities in leaves; ii) root plasma membrane (pm) H+-ATPase activity; iii) leaf relative water content; and iv) shoot Na/K ratio, were also investigated. Through principal component analysis (PCA), it was possible to group the single morpho-physiological traits. This permitted discrimination of hybrids in relation to their response to salinity. The hybrid Hy-1 in presence of medium salt concentration performed well in terms of root morphology and enzyme activities, which were linked to the cell growth process. These findings evince a better understanding of the salt tolerance mechanisms in sugar beet and the identification of useful physio-biochemical traits useful for sugar beet breeding.
Keywords: sugar beet, salt stress, root morphology , antioxidants, H+-ATPase, PCA
* Contact author: [email protected]
Introduction
Salinity due to high concentration of NaCl in soil affects almost 6% of the world's cultivated land (FAO 2008). Salinity in cropped fields appears to be increasing due to more frequent droughts forecasted by the climate changes scenarios (Jones et al. 2007). For these reasons, the rising interest in improving the salt tolerance of crops is fully justified (Chinnusamy et al. 2005). Salt tolerance in plants is a complex trait (Flowers 2004) that includes several physiological mechanisms such as: i) maintenance of homeostasis through the extrusion and vacuolar compartmentalization of Na+; ii) production of the osmoprotectants necessary for osmotic adjustment; and iii) production of ROS (Reactive Oxygen Species) scavenging enzymes, and several anatomical adaptations, mainly of the roots (Munns 2005). Of course, these mechanisms, widespread to varying degrees in plants, are most effective in halophytes (Flowers and Flowers 2005). Salt harms the plant mainly through: i) reduction of the osmotic component of water potential; ii) direct toxicity; and iii) interference in water and nutrient uptake.
Root system as plant organ directly exposed to salinity, was used as plant testing for salt tolerance in maize (Khan et al.
2003), rice (Sabouri and Sabouri 2008), wheat (Ma et al. 2007) and soybean (Neves et al. 2010). However, root length and fresh and dry weight were the root parameters mainly investigated for salt tolerance, in spite of “several classes of root traits have the potential to be deployed in crop breeding programmes to improve soil resource acquisition” (Lynch and Brown 2012). The root length ratio (RLR, root length per unit of the plant’s dry mass) is a better trait than root length for describing plant’s potential for soil resource acquisition under stress conditions (Ryser 1998), because it avoids the “allometric effects” (Coleman et al. 1994) or the “apparent plasticity” (Weiner 2004). RLR was investigated for the adaptation to nitrate deficiency (Sorgonà et al. 2007) and drought tolerance (Romano et al. 2013). Furthermore, the changes in root tissue density (RTD, root dry mass per unit root volume) were related to the drought tolerance in sugar beet (Romano et al. 2013), while the root fineness (RF, root length per unit root volume) was considered to be the functional trait for the drought-tolerant herbaceous tallgrass prairie species (Tucker et al. 2011) and correlated with the root’s ability to take up water (Rewald et al. 2011). Nowadays, no information are available on the salt effects on these important root parameters. High salinity also reduces the length and weight of the root, but not the allocation parameters linked to the uptake of resources such as: i): root

International Sugar Journal | October 2013756 757www.internationalsugarjournal.com
length ratio (RLR); ii) root mass ratio (RMR); iii) root fineness (RF); and iv) root tissue density (RTD). The effects of environment on these parameters have been investigated by Ryser and Lambers (1995), Craine et al. (2001) and Hernandez et al. (2010).
Selection carried out under field conditions is difficult and strongly influenced by soil variability and genotype x environment interactions. In a controlled environment, the identification of morpho-physiological traits linked with salt tolerance is relatively easier and enhances the efficacy of the subsequent breeding procedures (Chen et al. 2011).
Sugar beet (Beta vulgaris L. subsp. vulgaris) has ancestral halophyte parents and its tolerance to salinity is relatively high when compared to other crops (Biancardi et al. 2012). However, sugar beet shows yield reductions in salty soils, partly due to a low salt tolerance in the early stages of development (Dadkhah 2011). This sensitivity seems to differ among varieties (Ghoulam et al. 2002), and also may depend on the proximity of the germinating seeds to the soil surface, where salt accumulates more frequently (Beatty and Ehlig 1973). Farkhondeh et al. (2012) have considered the various morpho-physiological mechanisms of adaptation of sugar beet under high levels of soil salinity. Other studies have evaluated the effects of salinity on the activity of vacuolar (V) H+-ATPase or pm H+-ATPase of leaves with the aim of understanding the mechanisms of Na+ vacuolar compartmentalization (Kirsch et al. 1996; Wakeel et al. 2010). But no one has taken into account the pm H+-ATPase in sugar beet root, which plays a key role through the modulation of Na+ entry and extrusion across the plasma membrane of root cells (Hasegawa et al. 2000; Apse and Blumwald 2007). Despite extensive research on ROS detoxification mechanisms (antioxidants and/or ROS scavenging enzymes such as ascorbate peroxidase, catalase and guaiacol peroxidase) in plants under salt stress, little attention has been paid to this defense mechanism in sugar beet. Similarly, there are no studies that have combined the different morpho-physiological traits through PCA analysis and hierarchical cluster analysis in sugar beet. This statistical approach has been applied successfully by Romano et al. (2013) to describe the morpho-physiological responses of sugar beet to drought stress. Therefore, in this study we used an analogous approach to better define the overall responses to salinity, and more clearly discriminate the different genotypes according to their tolerance. More specifically, the present study was designed in three phases: i) the pre-screening under salt stress of genotypes under environmental controlled conditions; ii) the identification of functional traits, such as root morphology parameters, antioxidant enzymes activities and H+-ATPase activity on F1 hybrids selected on
the basis of mid-parent heterosis of morphological traits; and iii) the statistical analyses of the data by multivariate approach, in order to highlight the level of genotypic variability under salt stress and describe the relationships among genotypes and functional traits.
Material and Methods
Sugar beet seeds were supplied by the Research Institute for Industrial Crops, (CRA-CIN, Rovigo, Italy). The seeds belonged to a diallel cross consisting of two male sterile lines (Ms-1 and Ms-2), three pollinators (Pl-1, Pl-2, and Pl-3) and their F1 hybrids. The commercial variety, "Shannon" (Lions Seeds, UK), was included as control and coded “Chk”.
Growth conditions and experimental treatments
The seeds were scarified with 3% (v/v) hydrogen peroxide, continuously agitated for about 14 hours and then washed thoroughly with deionised water. They then were placed in Petri dishes (Ø = 9 cm) containing moistened vermiculite and stored in a dark growth chamber at 25°C for 4 days. After this, the seedlings were transferred to modified Hoagland solution, continuously aerated and containing 200 µM Ca(NO3)2, 200 µM KNO3, 200 µM MgSO4, 40 µM KH2PO4 and a suitable mixture of microelements. After the treatment, the plantlets were placed in a growth chamber at 25/18°C and 70% relative humidity with a 14/10 h light/dark cycle (PPFD above shoot: 300 µE m-2 s-1). The nutrient solution, adjusted to pH 6.0 by 0.1 N KOH, was checked daily and changed every 2 days. On the sixth day, the plants of each genotype were transferred for 4 days to different nutrient solutions having the same composition as that used previously (T0) and with the addition of 60 or 180 mM NaCl (T1 and T2 respectively). These final concentrations were achieved gradually, in order to avoid osmotic shock, by addition of 30 mM NaCl per hour for 2 or 6 h in the case of 60 or 180 mM, respectively. The control consisted of the same genotypes, raised under the same experimental conditions, but without added NaCl.
Morphological roots analysis
On the 10th day (4 days after salt stress, DASS), ten seedlings of each genotype, from each salt treatment were collected and divided into roots and shoots and their fresh weights were immediately determined (RFW and SFW, g, respectively). The biometric features of roots were determined by the WinRhizo

International Sugar Journal | October 2013758 759www.internationalsugarjournal.com
Morpho–physiological traits of sugar beet exposed to salt stress
Pro v. 4.0 software package (Instruments Régent Inc., Canada). The following parameters were calculated: i) root length ratio (RLR, root length/whole plant dry weight, g cm-1); ii) root mass ratio (RMR, root dry weight/whole plant dry weight, g g-1); iii) root fineness (RF, root length/root volume, cm cm-3); and iv) root tissue density (RTD, root dry weight/root volume, g cm-3).
Estimation of heterosis and hybrids selection
The mid-parent heterosis (H) relative to root length and weight of the root and shoot was calculated, as indicated by Falconer and Mackay (1996), using the following formula:
H = (F1 – MP) / MP x 100where:F1=Value of the parameter in the hybridMP= Mean value of the parameter in the parents.
This formula calculates % of heterosis in the hybrid compared to the average value in the parents.
From the six initial hybrids, three hybrids showing an improvement with respect to the parents were selected. Leaf RWC, sodium and potassium content, H+-ATPase activity of roots and APX, CAT and GPX activity of shoots were determined on these to evaluate the existence of physiological mechanisms that are the basis of a better response in terms of development of the root system under salt stress.
Leaf relative water content
On the10th day (4 DASS), leaves from three seedlings of each genotype from each salt treatment were removed, weighed (LFW), then put in deionised water and left in the dark. After 48 h, they were weighed to determine the leaf turgid weight (LTW) and then placed at 60°C for 48 h, in order to determine the dry weight (LDW). The relative water content (RWC, %) of the leaves was calculated according to Barr and Weatherley (1962):
RWC (%) = [(LFW - LDW) / (LTW - LDW)] x 100
Sodium and potassium contents
Sodium and potassium contents in the shoot were determined for each selected genotype and each treatment, using an atomic absorption spectrophotometer (Perkin-Elmer mod. Lambda 35) (Allen et al. 1974). The quantities of the two cations, expressed in g per 100 g of dry matter, allowed the Na/K ratio to be calculated.
Enzyme extractions and activity assays
After 48 hours of exposure to T0, T1, and T2, three seedlings of each genotype, each treatment and each exposure time were collected and subjected to enzyme extractions and activity assays relative to ascorbate peroxidase (APX, EC 1.11.1.11), catalase (CAT, EC 1.11.1.6) and guaiacol peroxidase (GPX, EC 1.11.1.7). The procedures were according to Sanità di Toppi et al. (2005).
PM H+-ATPase activity
Isolation of plasma membrane vesicles
Plasma membrane vesicles were isolated from the roots of 10-day-old seedlings, after 4 days under salt stress (DASS) following the small scale procedure used by Giannini et al. (1988), and modified by Santi et al. (1995). Roots of seedlings from each treatment and genotype were homogenized in extraction buffer before having chimostatin added. After extraction, the samples were filtered and centrifuged. The suspension was layered over a 25/38% discontinuous sucrose gradient and then centrifuged. The vesicles that had banded at interface layers were collected and centrifuged. The pellets were re-suspended in an appropriate medium, immediately frozen in liquid nitrogen and stored at -80 °C until needed.
H+-ATPase activity and protein assay
ATP-hydrolysis activity was determined by measuring the release of inorganic phosphate, as described by Forbusch (1983). Assays were performed, with or without vanadate (V2O5), an inhibitor of P-type H+-ATPase, with sodium azide and KNO3, selective inhibitors of mitochondria and tonoplast H+-ATPase, respectively. The difference between these two activities was attributed to the pm-H+-ATPase. The procedure is described in more detail in Romano et al. (2013). Total soluble protein was estimated according to Bradford (1976) using bovine serum albumin as a standard.
Statistical analyses
The experiment had a completely randomized design with 10 replicates per treatment and genotype in morphological analyses, and three replicates per treatment and genotype in physiological analyses. All data were tested and transformed where required for normality (Kolmogorov-Smirnoff test) and homogeneity of variance (Levene-Median test). For each genotype, the original data were statistically analysed using one-way analysis of variance, where the experimental factor was the salt stress level (T0, T1, and T2). Subsequently, the Bonferroni test was used to compare the mean of the plant growth parameters and root morphology of seedlings under the three salt treatments for each genotype.
For each genotype, catalase, guaiacol peroxidase, and ascorbate peroxidase activities were processed statistically using two-way analysis of variance where the experimental factors were the three levels of salinity and time (24 and 48 hours). This was followed by the Bonferroni test. Statistical analyses were undertaken using the software SPSS Statistics v. 15.0 (IBM Corp., USA), while the graphics were prepared using the package SigmaPlot v. 8.0 (Jandel Scientific, San Rafael, CA, USA).
Principal components (PCA) and hierarchical cluster analyses (HCA)
The dataset derived from the morpho-physiological parameters of the selected genotypes was subjected to principal components analysis based on a correlation matrix of the following variables: RLR, RMR, RF, RTD, RWC, Na/K, CAT, APX, GPX and H+-ATPase. PCA produced uncorrelated multivariate

International Sugar Journal | October 2013758 759www.internationalsugarjournal.com
axes that might be interpreted as representing a given sugar beet strategy for adaptation to salt stress. Use of the correlation matrix standardizes differences among variables due to the measurement scale. The importance of different traits in a given axis is indicated by the relative loading of the trait in the eigenvector.
The clustering of groups (genotype and salinity level: Hy-1 T0, Hy-1 T1, Hy-1 T2, Hy-3 T0, Hy-3 T1, Hy-3 T2, Hy-3 T0, Hy-3 T1, Hy-3 T2, Chk T0, Chk T1 and Chk T2) performed by HCA allows the pattern of relationship to be shown between individuals of a population. The matrix of distance among the various groups was constructed using the Euclidean distance to the square of distance as an index, and the grouping method considered was that of average binding between groups. The number of clusters, within which groups were distributed, was identified by considering the highest relative increase in the coefficient of agglomeration that indicates the simultaneous presence of the same features in compared objects.
Results and discussion
Hybrid selection
The starting point for the hybrids selection, on which to carry out further investigations, has been the growth analysis of shoot and root dry weight and root length in T0 (control treatment), T1 (60 mM NaCl), and T2 (180 mM NaCl) concentrations. The shoot dry weight showed a weak and not significant variability in response to salt for all hybrids, except for hybrid Hy-3 that increased significantly at T2. On the contrary, the root dry weight seemed more affected
by salinity. Although T1 determined only a slight decrease in dry weight, T2 caused a significant reduction for all genotypes. At salt concentration T1, a weak increase of root length, not statistically significant, was found in hybrids Hy-1, Hy-4 and Hy-5, while this root parameter was negatively influenced in Hy-6. At T2 the root length is drastically reduced in all genotypes (table 1).
Other studies have given conflicting results: Akram et al. (2007) showed a significant reduction in both the root length and dry weight in different maize hybrids subjected to 100 mM NaCl, but a slight reduction in root length under 50 mM. A root length reduction was also observed in wild halophytes, although under higher salt concentration than those of this work (Akhzari et al. 2012). In contrast, the shoot and root dry weight was significantly reduced at both 100 and 200 mM NaCl in sunflower (Liu et al. 2010). In tomato grown in hydroponics with 100 mM NaCl, a gradual decrease in the shoot dry weight was observed with increasing salinity, while the root dry weight slightly rose (Debouba et al. 2006). In sugar beet, a reduction in root dry weight under increasing levels of salt was observed by Eisa and Ali (2005).
Heterosis refers to the phenomenon that progeny of diverse varieties of a species exhibit greater biomass, speed of development and, in general a better performances than both parents. In this work, heterosis calculation regarding the growth parameters displayed the greatest changes after exposure to T2 and, in particular, the root length of hybrids Hy-1 and Hy-3 exhibited the higher positive increase compared to their parents (table 2). These results are in agreement with observations in other species such as tomato (Saeed et al. 2011) and wheat (Tahira et al. 2011). However, Hy-5 showed the opposite behavior in relation
Table 1. Shoot (SDW) and root dry weight (RDW) and root length (RL) of sugar beet hybrids exposed to different NaCl concentrations (0, T0; 60 mM, T1; 180 mM, T2). The Var indicates the variation in percent of values observed at T1 or T2 treatments compared to that of T0. In brackets the standard errors. Statistical analysis: ANOVA one-way (factor: salt concentration). The asterisk indicates a significant difference respect to the T0 (*0,05>P<0,01; **0,01>P<0,001; ***0,001>P)
Genotype Treatment SDW (mg) Var (%) RDW (mg) Var (%) RL (cm) Var (%)
Hy-1 T0 8.12 (0.51) 1.68 (0.14) 27.95 (1.75)
T1 8.30 (0.42) +2.2 1.33 (0.09) -20.8 34.99 (1.41) +25.2
T2 8.79 (0.60) +8.3 1.03* (0.09) -38.7 18.99* (0.65) -32.1
Hy-2 T0 8.61 (0.71) 1.42 (0.12) 39.34 (2.80)
T1 7.81 (0.32) -9.3 1.38 (0.11) -2.8 35.12 (1.29) -10.7
T2 7.24 (0.31) -15.9 0.93* (0.11) -34.5 13.18** (0.60) -66.5
Hy-3 T0 6.92 (0.62) 1.32 (0.10) 31.04 (2.67)
T1 8.13 (0.44) +17.5 1.25 (0.10) -5.3 30.16 (1.50) -2.8
T2 9.21* (0.53) +33.1 0.91* (0.09) -31.1 19.83* (0.78) -36.1
Hy-4 T0 5.94 (0.48) 0.92 (0.11) 27.70 (1.30)
T1 6.43 (0.21) +8.2 0.89 (0.07) -3.3 33.10 (1.24) +19.5
T2 6.13 (0.38) +3.2 0.61 (0.10) -33.7 12.01** (0.47) -56.6
Hy-5 T0 7.16 (0.67) 1.33 (0.09) 30.29 (2.46)
T1 8.34 (0.39) +16.5 1.28 (0.08) -3.8 40.92 (0.88) +35.1
T2 7.24 (0.63) +1.1 0.56** (0.06) -57.9 13.00** (0.53) -57.1
Hy-6 T0 7.92 (0.51) 1.63 (0.09) 30.54 (1.28)
T1 6.4 0 (0.27) -19.2 1.08 (0.06) -33.7 21.73* (1.44) -28.8
T2 8.21 (0.58) +3.7 0.88* (0.09) -46.0 17.47* (0.88) -42.8

International Sugar Journal | October 2013760 761www.internationalsugarjournal.com
to salt concentration (increasing and decreasing root length at T1 and T2 respectively). Because heterosis allows the assessment of combining ability among the parents, this useful information can be exploited in breeding programs, to assess the potential of inbred lines and to help identify the nature of gene action involved in various quantitative characters. Therefore, the heterosis performances indicated the hybrids Hy-1, Hy-3, and Hy-5 as those on which to conduct further investigations.
Root morphological analysis
Since salinity caused direct toxic effects on plants and lowers the water potential both in soil environment, the root system is the organ most exposed to this stress and, hence, could play an important role in the plant adaptation to the salinization. In this work, root length ratio and its morphological components, the allocation (RMR) and structural parameters (RF and RTD) were considered as useful root traits of sugar beet response to this stress. RLR indicates how much of the plant biomass is used for the development of a more efficient root system. Under moderate level of salt stress (T1), there was an intraspecific variability: Hy-1 showed an increase of RLR which conversely was reduced in the commercial variety Chk, while Hy-3 and Hy-5 showed no change compared to the same control (table 3). Under conditions of severe salt stress (T2), the RLR value is significantly reduced in all genotypes (table 3). The result suggests that all genotypes under these conditions do not spend resources in developing a
Morpho–physiological traits of sugar beet exposed to salt stress
Table 2. Heterosis of shoot (SDW) and root dry weight (RDW) and root length (RL) of sugar beet hybrids exposed to different NaCl concentrations (0, T0; 60 mM, T1; 180 mM, T2) in percent of the parents mean.
Hybrid Trait MPH %
Hy-1
SDW
T0 T1 T2
-4.01 7.79 2.92
RDW 0.92 21.46 18.39
RL -2.75 35.63 56.17
Hy-2 SDW -20.00 -4.88 -24.60
RDW -17.20 6.15 -2.10
RL -9.20 -12.46 -12.44
Hy-3 SDW 32.69 48.62 75.24
RDW 50.86 78.57 106.82
RL 84.33 76.35 128.62
Hy-4 SDW -6.35 7.56 -2.40
RDW -5.15 -1.66 15.38
RL -3.73 5.33 3.85
Hy-5 SDW 2.90 22.96 -4.00
RDW 1.14 21.33 -27.74
RL 11.66 45.22 -18.46
Hy-6 SDW -1.25 -11.72 -3.53
RDW 15.60 -14.28 2.92
RL -21.81 -48.86 -7.25
Table 3. Root length ratio (RLR) and its components (RMR, root mass ratio; RF, root fineness; RTD, root tissue density) and root/shoot ratio (R/S) of sugar beet hybrids Hy-1. Hy-3 and Hy-5 and the variety (Chk) exposed to different NaCl concentrations (0, T0; 60 mM, T1; 180 mM, T2). The Var indicates the variation in percent of values observed at T1 or T2 treatments compared to that of T0. In brackets the standard errors. Statistical analysis: ANOVA one-way (factor: salt concentration). The asterisk indicates a significant difference respect to the T0 (*0,05>P<0,01; **0,01>P<0,001; ***0,001>P)
Genotype Treatment RLR Var (%) RMR Var (%) RF Var (%) RTD Var (%) R/S Var (%)
Hy-1 T0 2968.8 (302.3)
0.205 (0.012)
573.3 (70.6)
0.030 (0.003)
0.020 (0.168)
T1 3668.5* (145.6)
+23.6 0.16 (0.005)
-22.0 705.5* (49.2)
+23.1 0.026 (0.002)
-12.2 0.016 (0.137) -20.0
T2 1986.9* (102.3)
-33.1 0.123* (0.012)
-40.0 603.2 (31.4)
+5.2 0.031 (0.004)
+5.0 0.013* (0.108)
-35.0
Hy-3 T0 3756.3 (311.0)
0.203 (0.015)
552.7 (54.5)
0.026 (0.004)
0.023 (0.166)
T1 3214.4 (100.4)
-14.4 0.155 (0.005)
-23.6 572.8 (30.8)
+3.6 0.024 (0.002)
-6.9 0.016 (0.133) -30.4
T2 1983.0* (87.4)
-47.2 0.099** (0.010)
-51.2 529.1 (21.7)
- 4.3 0.024 (0.003)
-5.4 0.011** (0.089)
-52.2
Hy-5 T0 3918.9 (300.5)
0.199 (0.010)
462.8 (39.9)
0.020 (0.002)
0.015 (0.165)
T1 4342.1 (173.8)
+10.8 0.155 (0.005)
-22.1 757.3** (64.5)
+63.6 0.026 (0.003)
+30.2 0.008* (0.134)
-46.7
T2 1730.3** (98.8)
-55.8 0.082** (0.010)
-58.8 510.7 (38.4)
+10.4 0.022 (0.004)
+10.2 0.012* (0.075)
-20.0
Chk T0 5572.9 (196.5)
0.219 (0.010)
554.4 (66.5)
0.017 (0.003)
0.015 (0.179)
T1 4031.0* (191.7)
-27.7 0.177* (0.005)
-19.2 689.4 (52.1)
+24.3 0.029** (0.001)
+72.4 0.006** (0.151)
-60.0
T2 2187.3** (110.8)
-60.8 0.108** (0.007)
-50.7 593.7 (32.9)
+7.1 0.027** (0.002)
+62.9 0.008* (0.097)
-46.7
International Sugar Journal | October 2013760 761www.internationalsugarjournal.com
more efficient root system, but probably tend to limit the effects of salt on the shoot. This may explain both the significant reduction in root dry weight and length, and the absence of significant variations of the shoot dry weight (table 1). However, the changes of RLR depends on its morphological components (RMR, RF and RTD) by the following relationship: RLR=RMR×RF/TD (Ryser and Lambers 1995). In this study, the RMR was reduced under T2 in all hybrids, while under T1, it dropped significantly in the commercial variety Chk only (table 3). RF and RTD, which represent the structural component of RLR, are much less affected by salinity. However, Hy-1 and Hy-5 increased the RF when exposed to T1, while Hy-5 and the commercial variety Chk increased the RTD at concentrations T1 and T2 (table 3). These results indicated that all the sugar beet hybrids under T2 treatment pointed out a reduction of RLR which was due to a decreased biomass allocation to the root (RMR). Conversely, the increase of RLR in Hy-1 observed under T1 depended on the increase of root fineness. However, the Chk was the sugar beet genotype more susceptible to the salt stress because a lower RLR was also observed under T1 which was caused by both reduction of RMR and higher RTD values. At the same time, the R/S ratio was significantly reduced in all hybrids by the highest concentration T2, while only Hy-5 and Chk also showed a significant decrease under conditions of moderate stress T1 (table 3).
Overall, these results suggested a different adaptive mechanism
to the salt stress between the two sugar beet genotypes: Hy-1 would seem to react to the salinity stress by investing ‘energy’ in a more efficient root system for the soil exploration, while Chk reduced the root growth, investing more in the shoot biomass.
Enzymes activities
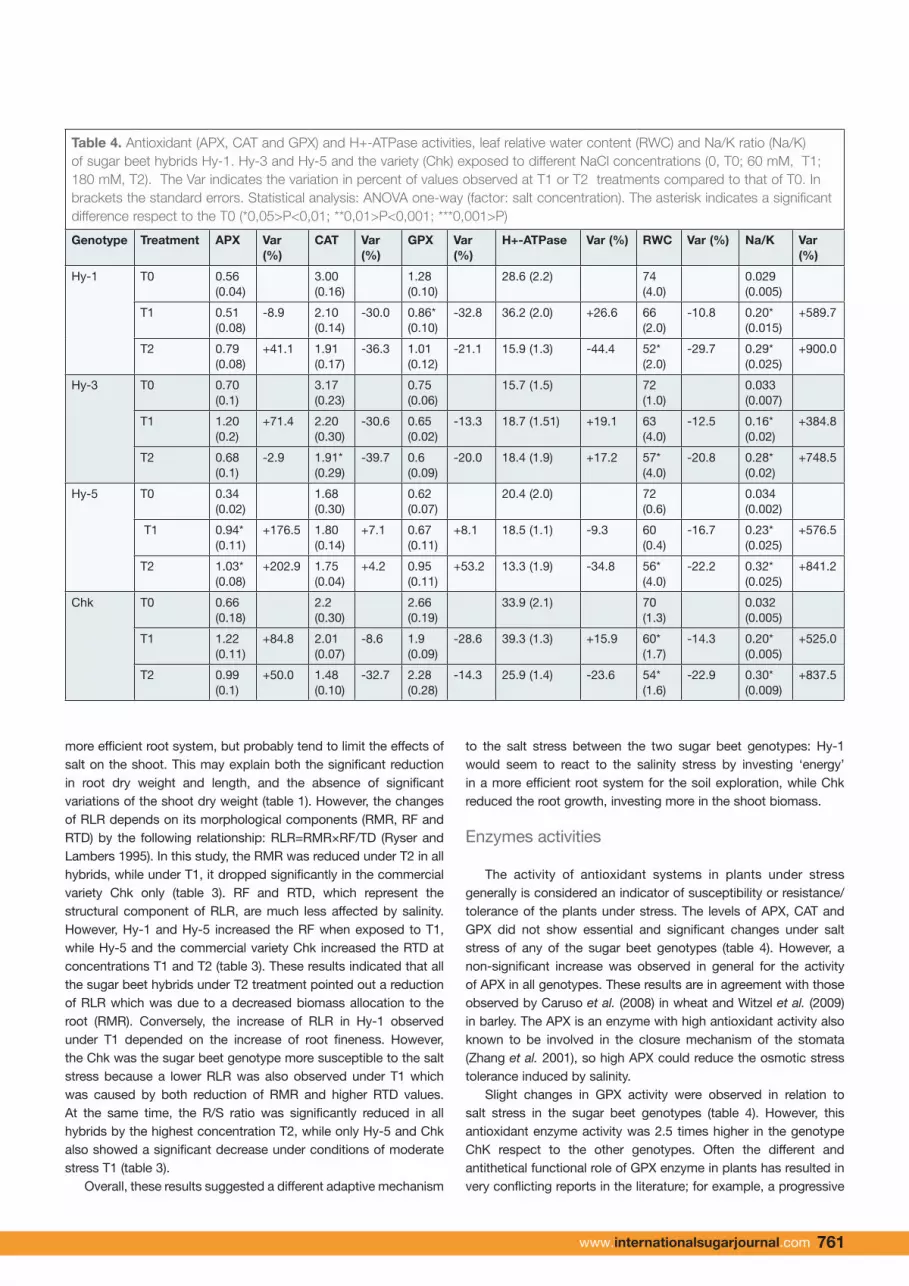
The activity of antioxidant systems in plants under stress generally is considered an indicator of susceptibility or resistance/tolerance of the plants under stress. The levels of APX, CAT and GPX did not show essential and significant changes under salt stress of any of the sugar beet genotypes (table 4). However, a non-significant increase was observed in general for the activity of APX in all genotypes. These results are in agreement with those observed by Caruso et al. (2008) in wheat and Witzel et al. (2009) in barley. The APX is an enzyme with high antioxidant activity also known to be involved in the closure mechanism of the stomata (Zhang et al. 2001), so high APX could reduce the osmotic stress tolerance induced by salinity.
Slight changes in GPX activity were observed in relation to salt stress in the sugar beet genotypes (table 4). However, this antioxidant enzyme activity was 2.5 times higher in the genotype ChK respect to the other genotypes. Often the different and antithetical functional role of GPX enzyme in plants has resulted in very conflicting reports in the literature; for example, a progressive
Table 4. Antioxidant (APX, CAT and GPX) and H+-ATPase activities, leaf relative water content (RWC) and Na/K ratio (Na/K) of sugar beet hybrids Hy-1. Hy-3 and Hy-5 and the variety (Chk) exposed to different NaCl concentrations (0, T0; 60 mM, T1; 180 mM, T2). The Var indicates the variation in percent of values observed at T1 or T2 treatments compared to that of T0. In brackets the standard errors. Statistical analysis: ANOVA one-way (factor: salt concentration). The asterisk indicates a significant difference respect to the T0 (*0,05>P<0,01; **0,01>P<0,001; ***0,001>P)
Genotype Treatment APX Var (%)
CAT Var (%)
GPX Var (%)
H+-ATPase Var (%) RWC Var (%) Na/K Var (%)
Hy-1 T0 0.56 (0.04)
3.00 (0.16)
1.28 (0.10)
28.6 (2.2) 74 (4.0)
0.029 (0.005)
T1 0.51 (0.08)
-8.9 2.10 (0.14)
-30.0 0.86* (0.10)
-32.8 36.2 (2.0) +26.6 66 (2.0)
-10.8 0.20* (0.015)
+589.7
T2 0.79 (0.08)
+41.1 1.91 (0.17)
-36.3 1.01 (0.12)
-21.1 15.9 (1.3) -44.4 52* (2.0)
-29.7 0.29* (0.025)
+900.0
Hy-3 T0 0.70 (0.1)
3.17 (0.23)
0.75 (0.06)
15.7 (1.5) 72 (1.0)
0.033 (0.007)
T1 1.20 (0.2)
+71.4 2.20 (0.30)
-30.6 0.65 (0.02)
-13.3 18.7 (1.51) +19.1 63 (4.0)
-12.5 0.16* (0.02)
+384.8
T2 0.68 (0.1)
-2.9 1.91* (0.29)
-39.7 0.6 (0.09)
-20.0 18.4 (1.9) +17.2 57* (4.0)
-20.8 0.28* (0.02)
+748.5
Hy-5 T0 0.34 (0.02)
1.68 (0.30)
0.62 (0.07)
20.4 (2.0) 72 (0.6)
0.034 (0.002)
T1 0.94* (0.11)
+176.5 1.80 (0.14)
+7.1 0.67 (0.11)
+8.1 18.5 (1.1) -9.3 60 (0.4)
-16.7 0.23* (0.025)
+576.5
T2 1.03* (0.08)
+202.9 1.75 (0.04)
+4.2 0.95 (0.11)
+53.2 13.3 (1.9) -34.8 56* (4.0)
-22.2 0.32* (0.025)
+841.2
Chk T0 0.66 (0.18)
2.2 (0.30)
2.66 (0.19)
33.9 (2.1) 70 (1.3)
0.032 (0.005)
T1 1.22 (0.11)
+84.8 2.01 (0.07)
-8.6 1.9 (0.09)
-28.6 39.3 (1.3) +15.9 60* (1.7)
-14.3 0.20* (0.005)
+525.0
T2 0.99 (0.1)
+50.0 1.48 (0.10)
-32.7 2.28 (0.28)
-14.3 25.9 (1.4) -23.6 54* (1.6)
-22.9 0.30* (0.009)
+837.5

International Sugar Journal | October 2013762 763www.internationalsugarjournal.com
Morpho–physiological traits of sugar beet exposed to salt stress
reduction of GPX with increasing salinity was observed in wheat by Marvi et al. (2011); on the contrary, an increase of this antioxidant enzyme activity was reported in barley (Khosravinejad et al. 2008).
An increase of CAT activity under salt stress conditions has been observed in maize (Gondim et al. 2012). Our results showed a weak activity, not always significant, affected by salinity (table 4). This is in agreement with the results obtained by Shim et al. (2003) in rice seedlings. In particular, the lack of CAT activity involvement would suggest a limited role of this enzyme in the processes of cellular protection. However, Hy-3 showed a significant reduction in CAT activity, in agreement with that observed by Azevedo Neto et al. (2006) in maize and by Cavalcanti et al. (2007) in cowpea.
The root pm H+-ATPase did not show any significant change at T1 and T2 treatments in all hybrids (table 4). These results are in agreement with what was found by Wakeel et al. (2010) on shoot H+-ATPase activity in sugar beet. In general, it can be observed that the enzymes and H+-ATPase are not particularly affected by salt stress. A similar result was obtained with the sugar beet hybrids under water stress (Romano et al. 2013); nevertheless, they may contribute to the genotypic characterization for resistance to salinity when the results are examined with a multivariate analysis technique.
Relative water content and Na/K ratio
The leaf relative water content (RWC) varied according to the NaCl concentration but not with the genotype (table 4). A severe stress condition (T2) significantly reduced RWC in all hybrids, while T1 reduced this parameter only in the control Chk. These results are in agreement with those obtained by Farkhondeh et al. (2012) in sugar beet. This indicates a lack of intraspecific variation in severe stress conditions. On the contrary, under conditions of moderate stress, the more tolerant genotypes were able to maintain a necessary but limited turgor for cell distension. Siddique et al. (2000) reported that a high RWC, in conditions of osmotic stress, indicates a greater ability to uptake water from the soil and to compensate for transpiration losses from the leaves.
The Na/K ratio, which has been found to be an index of salinity tolerance in several species (Munns et al. 2006), was heavily modified by NaCl treatments in all sugar beet genotypes: the Na/K ratio increased significantly under T2 (table 4). This result, in agreement with other authors (Vera-Estrella et al. 2005; Hardikar and Pandey 2011), suggested that vacuolar sequestration of Na+ could be an hypothetical physiological mechanisms of salt adaptation in sugar beet as well as demonstrated in the halophytes. On the other hand, the role of potassium is known on the input of water in guard cells surrounding the stomata (Taiz and Zeiger 1998), for cell expansion and photosynthesis (Chow et al. 1990); sugar beet could partially replace K+ with Na+ for turgor maintenance and other metabolic functions (Marschner 1995).
The results observed for Na/K, associated with those observed for root pm H+-ATPase (table 4) confirmed that sugar beet could increase the use of vacuolar storage as a strategy against salinity, instead of active Na exclusion from the plasma membrane (avoidance mechanism), as observed in other plant species less tolerant to salinity such as wheat (Cuin et al. 2011) and tomato (Wilson and Shannon 1995).
Principal component and hierarchical cluster analyses
The principal component analysis described the variability among the different sugar beet genotypes through the reduction and the grouping of the morphological, physiological and biochemical traits into Principal Components (Prin). About 72% of the variability present among the genotypes was explained by three Prins. More specifically, the first principal component (Prin 1) explained 29% of the variability and was characterized by high and positive coefficients of impact factors (loadings) on the R/S ratio, RLR and RMR (table 5). Hence, this component was representative of the “root morphology” and it evinces the plants’ potential to elongate their roots to acquire resources more effectively under conditions of high salinity. The second principal component (Prin 2) explained 26% of the variability, showing a high and positive coefficient on RWC and CAT and a large and negative coefficient for the Na/K ratio also (table 5). Considering the role of the K+ in water uptake of stomatal (Taiz e Zeiger 1998) and the CAT for the stomatal closure (Zhang et al. 2001), these physiological parameters together with RWC may be indicative of the “plant water status”. The third principal component (Prin 3) explained 17% of the variability and showed high positive coefficients on the H+-ATPase and GPX activities (table 5) and hence, it could represent the “cell growth process”.
The plotting of Prin 1 and 2 made it possible to highlight the effect of salt treatment rather than the genetic variability. In fact, the sugar beet genotypes were grouped in three clusters which were discriminate by the salt concentrations. In particular, the cluster I contained the hybrids exposed to T0 treatment, while
Table 5. Principal components of morpho-physiological traits of sugar beet genotypes exposed to different NaCl concentrations, R/S = Root/shoot ratio; RMR = Root mass ratio; RLR = Root length ratio; RWC = Relative water content; CAT = Catalase; Na/K = Sodium/potassium rate; H+-ATPase = Proton pump activity; GPX = Guaiacol peroxidase.
Statistics
Prin 1 Prin 2 Prin 3
Eigenvalue 2.364 2.102 1.385
Variability (%)
29.6 26.3 17.3
Variable
Eigenvectors
R/S 0.911
RMR 0.938
RLR 0.755
RWC 0.824
CAT 0.781
Na/K -0.837
H+-ATPase 0.824
GPX 0.802
International Sugar Journal | October 2013762 763www.internationalsugarjournal.com
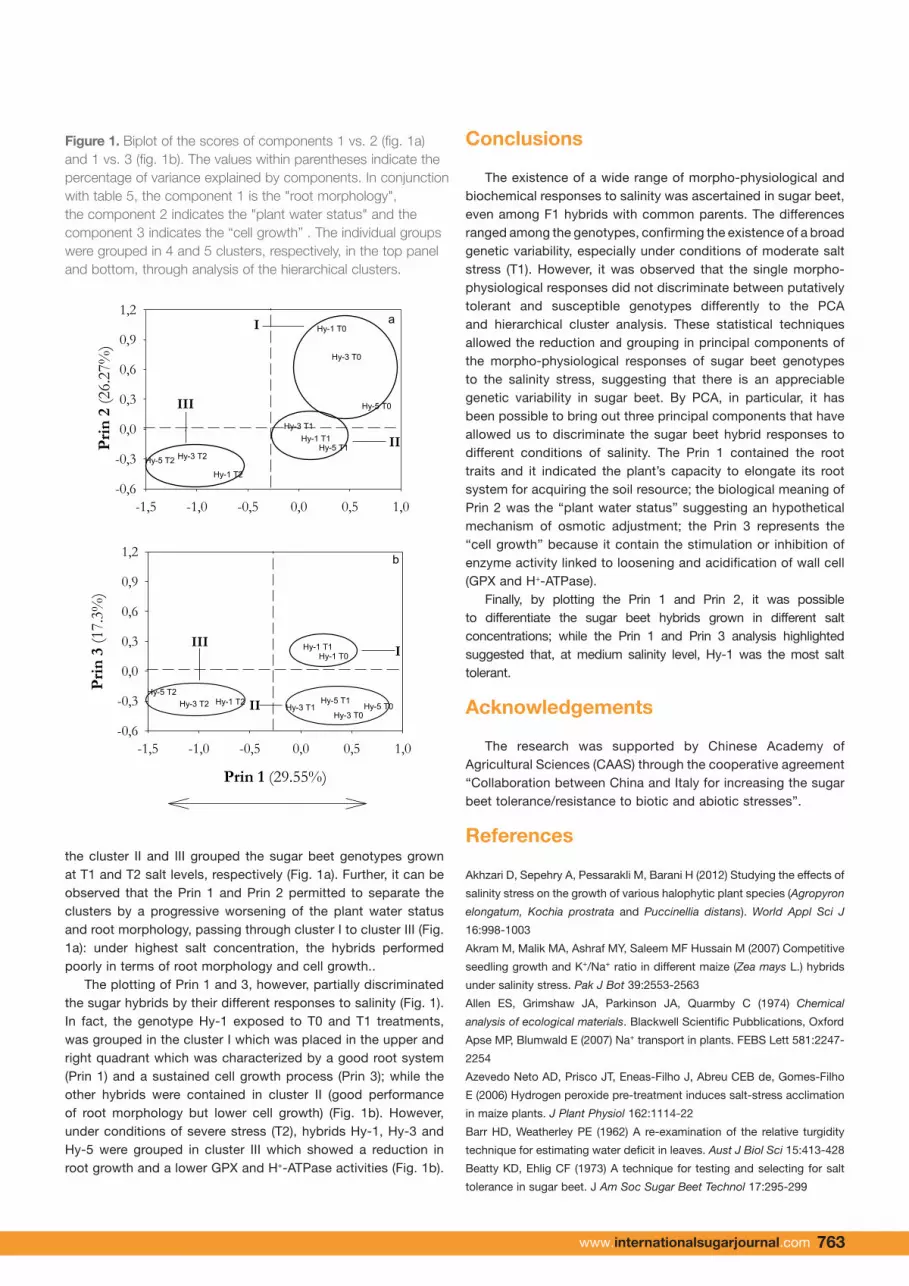
the cluster II and III grouped the sugar beet genotypes grown at T1 and T2 salt levels, respectively (Fig. 1a). Further, it can be observed that the Prin 1 and Prin 2 permitted to separate the clusters by a progressive worsening of the plant water status and root morphology, passing through cluster I to cluster III (Fig. 1a): under highest salt concentration, the hybrids performed poorly in terms of root morphology and cell growth..
The plotting of Prin 1 and 3, however, partially discriminated the sugar hybrids by their different responses to salinity (Fig. 1). In fact, the genotype Hy-1 exposed to T0 and T1 treatments, was grouped in the cluster I which was placed in the upper and right quadrant which was characterized by a good root system (Prin 1) and a sustained cell growth process (Prin 3); while the other hybrids were contained in cluster II (good performance of root morphology but lower cell growth) (Fig. 1b). However, under conditions of severe stress (T2), hybrids Hy-1, Hy-3 and Hy-5 were grouped in cluster III which showed a reduction in root growth and a lower GPX and H+-ATPase activities (Fig. 1b).
Conclusions
The existence of a wide range of morpho-physiological and biochemical responses to salinity was ascertained in sugar beet, even among F1 hybrids with common parents. The differences ranged among the genotypes, confirming the existence of a broad genetic variability, especially under conditions of moderate salt stress (T1). However, it was observed that the single morpho-physiological responses did not discriminate between putatively tolerant and susceptible genotypes differently to the PCA and hierarchical cluster analysis. These statistical techniques allowed the reduction and grouping in principal components of the morpho-physiological responses of sugar beet genotypes to the salinity stress, suggesting that there is an appreciable genetic variability in sugar beet. By PCA, in particular, it has been possible to bring out three principal components that have allowed us to discriminate the sugar beet hybrid responses to different conditions of salinity. The Prin 1 contained the root traits and it indicated the plant’s capacity to elongate its root system for acquiring the soil resource; the biological meaning of Prin 2 was the “plant water status” suggesting an hypothetical mechanism of osmotic adjustment; the Prin 3 represents the “cell growth” because it contain the stimulation or inhibition of enzyme activity linked to loosening and acidification of wall cell (GPX and H+-ATPase).
Finally, by plotting the Prin 1 and Prin 2, it was possible to differentiate the sugar beet hybrids grown in different salt concentrations; while the Prin 1 and Prin 3 analysis highlighted suggested that, at medium salinity level, Hy-1 was the most salt tolerant.
Acknowledgements
The research was supported by Chinese Academy of Agricultural Sciences (CAAS) through the cooperative agreement “Collaboration between China and Italy for increasing the sugar beet tolerance/resistance to biotic and abiotic stresses”.
References
Akhzari D, Sepehry A, Pessarakli M, Barani H (2012) Studying the effects of
salinity stress on the growth of various halophytic plant species (Agropyron
elongatum, Kochia prostrata and Puccinellia distans). World Appl Sci J
16:998-1003
Akram M, Malik MA, Ashraf MY, Saleem MF Hussain M (2007) Competitive
seedling growth and K+/Na+ ratio in different maize (Zea mays L.) hybrids
under salinity stress. Pak J Bot 39:2553-2563
Allen ES, Grimshaw JA, Parkinson JA, Quarmby C (1974) Chemical
analysis of ecological materials. Blackwell Scientific Pubblications, Oxford
Apse MP, Blumwald E (2007) Na+ transport in plants. FEBS Lett 581:2247-
2254
Azevedo Neto AD, Prisco JT, Eneas-Filho J, Abreu CEB de, Gomes-Filho
E (2006) Hydrogen peroxide pre-treatment induces salt-stress acclimation
in maize plants. J Plant Physiol 162:1114-22
Barr HD, Weatherley PE (1962) A re-examination of the relative turgidity
technique for estimating water deficit in leaves. Aust J Biol Sci 15:413-428
Beatty KD, Ehlig CF (1973) A technique for testing and selecting for salt
tolerance in sugar beet. J Am Soc Sugar Beet Technol 17:295-299
-1,5 -1,0 -0,5 0,0 0,5 1,0
Prin
2 (2
6.27
%)
-0,6
-0,3
0,0
0,3
0,6
0,9
1,2Hy-1 T0
Hy-3 T0
Hy-5 T0
Hy-1 T1Hy-3 T1
Hy-5 T1
Hy-1 T2
Hy-3 T2Hy-5 T2
Prin 1 (29.55%)
-1,5 -1,0 -0,5 0,0 0,5 1,0
Prin
3 (1
7.3%
)
-0,6
-0,3
0,0
0,3
0,6
0,9
1,2
Hy-1 T0
Hy-3 T0Hy-5 T0
Hy-1 T1
Hy-3 T1Hy-5 T1Hy-1 T2Hy-3 T2
Hy-5 T2
I
II
III
I
II
III
a
b
Figure 1 – Biplot of the scores of components 1 vs. 2 (fig. 1a) and 1 vs. 3 (fig. 1b). The
values within parentheses indicate the percentage of variance explained by components. In
conjunction with table 5, the component 1 is the "root morphology", the component 2
indicates the "plant water status" and the component 3 indicates the “cell growth” . The
individual groups were grouped in 4 and 5 clusters, respectively, in the top panel and bottom,
through analysis of the hierarchical clusters.
Figure 1. Biplot of the scores of components 1 vs. 2 (fig. 1a) and 1 vs. 3 (fig. 1b). The values within parentheses indicate the percentage of variance explained by components. In conjunction with table 5, the component 1 is the "root morphology", the component 2 indicates the "plant water status" and the component 3 indicates the “cell growth” . The individual groups were grouped in 4 and 5 clusters, respectively, in the top panel and bottom, through analysis of the hierarchical clusters.

International Sugar Journal | October 2013764 765www.internationalsugarjournal.com
Morpho–physiological traits of sugar beet exposed to salt stress
Biancardi E, Panella LW, Lewellen RT (2012) Beta maritima: the origin of
beets. Springer Science, New York-Heidelberg
Bradford M (1976) A rapid and sensitive method for the quantitation
of microgram quantities of protein utilizing the principle of protein-dye
binding. Anal Biochem 72:248-254
Caruso G, Cavaliere C, Guarino C, Gubbiotti R, Foglia P, Laganà A (2008)
Identification of changes in Triticum durum L. leaf proteome in response
to salt stress by two-dimensional electrophoresis and MALDI-TOF mass
spectrometry. Anal Bioanal Chem 391:381-390
Cavalcanti FR, Lima JPMS, Ferreira-Silva SL, Viegas RS, Silveira JAG
(2007) Roots and leaves display contrasting oxidative response during salt
stress and recovery in cowpea. J Plant Physiol 164:591-600
Chen YL, Dunbabin VM, Diggle AJ, Siddique KHM, Rengel Z (2011)
Development of a novel semi-hydroponic phenotyping system for studying
root architecture. Functional Plant Biol 38:355-363
Chinnusamy V, Jagendorf A, Zhu JK (2005) Understanding and improving
salt tolerance in plants. Crop Sci 45:437-448
Chow WS, Marylin CB, Anderson JM (1990) Growth and photosynthetic
responses of spinach to salinity: implications of K+ nutrition for salt
tolerance. Aust J Plant Physiol 17:563-578
Coleman JS, McConnaughay KDM, Ackerly DD (1994) Interpreting
phenotypic variation in plants. Trends Ecol Evol 9:187-191
Craine JM, Froehle J, Tilman DG, Wedin DA, Chapin FS III (2001) The
relationships among root and leaf traits of 76 grassland species and
relative abundance along fertility and disturbance gradients. Oikos 93:274-
285
Cuin TA, Bose J, Stefano G, Jha D, Tester M, Mancuso S, Shabala S
(2011) Assessing the role of root plasma membrane and tonoplast Na+/H+
exchangers in salinity tolerance in wheat: in planta quantification methods.
Plant Cell Environ 34:947-961
Dadkhah A (2011) Effect of salinity on growth and leaf photosynthesis of
two sugar beet (Beta vulgaris L.) cultivars. J Agr Sci Tech 13:1001-1012
Debouba M, Gouia H, Ghorbel MH (2006) NaCl effects, growth, ions and
water status of tomato (Lycopersicon esculentum) seedlings. Acta Bot Gall
153:297-307
Eisa SS, Ali SH (2005) Biochemical, physiological and morphological
responses of sugar beet to salinization. J Agric Sci Mansoura Univ
30:5231-5242
Falconer DS, Mackay TFC (1996) Introduction to quantitative genetics, 4th
Ed. 1996. Longmans Green, Harlow, Essex, UK
FAO (2008) Land and plant nutrition management service. http://www.fao.
org/ag/agl/agll/spush
Farkhondeh R, Nabizadeh E, Jalilnezhad N (2012) Effect of salinity stress
on proline content, membrane stability and water relations in two sugar
beet cultivars. Int J Agri Sci 2:385-392
Flowers TJ (2004) Improving crop salt tolerance. J Exp Bot 55:307-319
Flowers TJ, Flowers SA (2005) Why does salinity pose such a difficult
problem for plant breeders? Agr Water Manag 78:15-24
Forbusch B (1983) Assay of the Na+-, K+-ATPase in plasma membrane
preparations: increasing the permeability of membrane vesicles using
sodium dodecylsulfate buffered with bovine serum albumine. Anal
Biochem 128:159-163
Ghoulam C, Foursy A, Fares K (2002) Effects of salt stress on growth,
inorganic ions and proline accumulation in relation to osmotic adjustment
in five sugar beet cultivars. Environ Exp Bot 47:39-50
Giannini JL, Ruiz-Cristin J, Briskin DP (1988) A small scale procedure for
the isolation of transport competent vesicles from plants tissues. Anal
Biochem 174:561-567
Gondim FA, Gomes-Filho E (2012) Catalase plays a key role in salt stress
acclimation induced by hydrogen peroxide pretreatment in maize. Plant
Physiol Biochem 56:62-71
Hardikar SA, Pandey AN (2011) Growth, water status and nutrient
accumulation of seedlings of Cassia fistula L. in response to soil salinity.
An Biol 33:1-11
Hasegawa PM, Bressan RA, Zhu J, Bohnert HJ (2000) Plant cellular and
molecular responses to high salinity. Ann Rev Plant Physiol Plant Mol Biol
51:463-499
Hernàndez E, Vilagrosa A, Pausas JG, Bellot J (2010) Morphological traits
and water use strategies in seedlings of Mediterranean coexisting species.
Plant Ecol 207:233-244
Jones RN, Dettmann P, Park G, Rogers M, White T (2007) The relationship
between adaptation and mitigation in managing climate change risks: a
regional response from North Central Victoria, Australia. Mitig Adapt Strat
Glob Change 12:685-712
Khan AA, Rao SA, McNeilly T (2003) Assessment of salinity tolerance
based upon seedling root growth response functions in maize (Zea mays
L.). Euphytica 131:81-89
Khosravinejad F, Heydari R, Farboodnia T (2008) Antioxidant responses of
two barley varieties to saline stress. Res J Biol Sci 3:486-490
Kirsch M, An Z, Viereck R, Löw R, Rausch T (1996) Salt stress induces an
increased expression of V-type H+-ATPase in mature sugar beet leaves.
Plant Mol Biol 32:543-547
Liu J, Guo WQ, Shi DC (2010) Seed germination, seedling survival, and
physiological response of sunflowers under saline and alkaline conditions.
Photosynthetica 48:278-286
Lynch JP, Brown KM (2012) New roots for agriculture: exploiting the root
phenome Phil Trans R Soc 367:1598-1604
Ma LQ, Zhou EF, Huo NX, Zhou RH, Wang GY, Jia JZ (2007) Genetic
analysis of salt tolerance in a recombinant inbred population of wheat
(Triticum aestivum L.). Euphytica 153:109-117
Marschner H (1995) Mineral nutrition of higher plants. 2nd edition.
Academic Press, San Diego
Marvi H, Heidari M, Armin M (2011) Physiological and biochemical
responses of wheat cultivars under salinity stress. ARPN J Agric Biol Sci.
Vol 6 no 5
Munns R (2005) Genes and salt tolerance: bringing them together. New
Phytol 167:645-663
Munns R, James RA, Läuchli A. (2006) Approaches to increasing the salt
tolerance of wheat and other cereals. J Exp Bot 57:1025-43
Neves GYS, Marchiosi R, Ferrarese MLL, Siqueira-Soares RC, Ferrarese-
Filho O (2010) Root growth inhibition and lignification induced by salt
stress in soybean. J Agr Crop Sci 196:467-473
Rewald B, Ephrath JE, Rachmilevitch S (2011) A root is a root is a root?
Water uptake rates of citrus root orders Plant Cell Env 34:33-42
Romano A, Sorgonà A, Lupini A, Araniti F, Stevanato P, Cacco P, Abenavoli
MR (2013) Morpho-physiological responses of sugar beet (Beta vulgaris L.)
genotypes to drought stress. Acta Physiol Plant 35:853-865
Ryser P (1998) Intra- and interspecific variation in root length, root
turnover and the underlying parameters. Inherent variation in plant growth.
In: Backhuys Publishers (ed) Physiological mechanism and ecological
consequences. Leiden, The Netherlands, pp 441-465
Ryser P, Lambers H (1995) Root and leaf attributes accounting for the
performance of fast- and slow-growing grasses at different nutrient supply.
Plant Soil 170:251-265
Sabouri H, Sabouri A (2008) New evidence of QTLs attributed to salinity
tolerance in rice. Afr J Biotechnol 7:4376-4383
International Sugar Journal | October 2013764 765www.internationalsugarjournal.com
Saeed A, Saeed N, Shakeel A, Saleem MF (2011) Genetic analysis of NaCl
tolerance in tomato. Gen Mol Res 10:1754-1776
Sanità’ di Toppi L, Marabottini R, Vattuone Z, Musetti R, Favali MA,
Sorgonà A, Badiani M (2005) Cell wall immobilization and antioxidant
status of Xanthoria parietina thalli exposed to cadmium. Funct Plant Biol
32:611–618.
Santi S, Locci G, Pinton R, Cesco S, Varanini Z (1995) Plasma membrane
H+-ATPase in maize roots induced for NO3- uptake. Plant Physiol
109:1277-1283
Shim IS, Momose Y, Yamamoto A, Kim DW, Usui K (2003) Inhibition of
catalase activity by oxidative stress and its relationship to salicylic acid
accumulation in plants. Plant Growth Regul 8:285-292
Siddique BMR, Hamid A, Islam MS (2000) Drought stress effect on water
relation of wheat. Bot Bull Acad 41:35-39
Sorgonà A, Abenavoli MR, Gringeri PG, Cacco G, (2007) Comparing
morphological plasticity of roots orders in slow- and fast-growing citrus
rootstocks supplied with different nitrate levels. Ann Bot 100:1287-1296
Tahira W, Buutta M, Salam A (2011) Estimation of heterosis in root length of
wheat under different saline environment. Cereal Res Commun 39:306-314
Taiz L, Zeiger E (1998) Plant physiology. Sinauer Associates, Inc.
Publishers. Sunderland, Massachusetts, USA
Tucker SS, Craine JM, Nippert JB (2011) Physiological drought tolerance
and the structuring of tallgrass prairie assemblages. Ecosphere 2:1-19
Vera-Estrella R, Barkla BJ, García-Ramírez L, Pantoja O (2005) Salt stress
in Thellungiella halophila activates Na+ transport mechanisms required for
salinity tolerance. Plant Physiol 139:1507-1517
Wakeel AS, Hanstein B, Pitann B, Schubert S (2010) Hydrolytic and
pumping activity of H+-ATPase from leaves of sugar beet (Beta vulgaris L.)
as affected by salt stress. J Plant Physiol 167:725-731
Weiner J (2004) Allocation, plasticity and allometry in plants. Persp Plant
Ecol Evol System 6/4:207-215
Wilson C, Shannon MC (1995) Salt-induced Na+/H+ antiport in root plasma-
membrane of a glycophytic and halophytic species of tomato. Plant
Science 107:147-157
Witzel K, Weidner A, Giridara Kumar S, Börner A, Mock HP (2009) Salt
stress-induced alterations in the root proteome of barley genotypes with
contrasting response towards salinity. Exp Bot 60:3545-3557
Zhang X, Zhang L, Dong F, Gao J, Galbraith DW, Song CP (2001) Hydrogen
peroxide is involved in abscisic acid-induced stomatal closure in Vicia
faba. Plant Physiol 126:1438-1448
Abbreviations
APX Ascorbate Peroxidase CAT Catalase RF Root Fineness GPX Guaiacol Peroxidase HCA Hierarchical Component Analysis PCA Principal Component Analysis R/S Root/Shoot ratio RLR Root Length Ratio RMR Root Mass Ratio ROS Reactive Oxygen Species RTD Root Tissue Density RWC Relative Water Content