social mobility in hong kong
TRANSCRIPT
Social Mobility in Hong Kong
A thesis submitted tothe Faculty of Social Studies
University of Oxford
for the degree ofDoctor of Philosophy
in Sociology
Tak Wing ChanNuffield College
Trinity 1994
Social Mobility in Hong Kong
D.Phil. Thesis
Tak Wing ChanNuffield College
Trinity 1994
Abstract
This thesis examines the micro-process of social mobility in modern Hong Kong. It also studies Hong Kong's mobility regime in a conventional macro-comparative fashion. By applying the core model of social fluidity developed in the CASMIN (Comparative Analysis of Social Mobility in Industrial Nations) project to the mobility data collected in the 1989 Hong Kong Social Mobility Survey, I point to several distinctive features of Hong Kong's mobility regime. This exercise also allows me to engage in the ongoing debate concerning the degree of commonality and variation in relative mobility rates across industrial nations. Having made this macro- comparison, I turn to explore the micro-mobility process. Drawing on worklife data collected in the 1991-92 follow-up study, I consider the following issues: (a) typical mobility paths in Hong Kong, (b) how social networks facilitate the job search process, and (c) how career beginning affects subsequent mobility outcome. In this study, I also test and apply a new technique, Optimal Matching Analysis, which compares and classifies complete career sequences. Thus, apart from offering substantive findings on social mobility in Hong Kong, this thesis also seeks to make a technical contribution to the analysis of life course data.

To my parents
Chun Mou Chan and Wai Fong Poon
much love and admiration
Acknowledgments
I first became involved in mobility studies as a research assistant of the 1989 Hong Kong Social Mobility Survey. The change of my "job" from routine supervision of fieldwork to that of data analyses and thesis writing is, I guess, a form of worklife mobility. One of the things that I try to argue in this thesis is that social networks and social support is crucial for mobility. This I can happily confirm with my own experience. Many people gave me a lot of support, advice and assistance. To them, I would like to say a big and warm THANK YOU!
This study got off the ground with the support of the investigators of the 1989 survey: Thomas Wong, Tai Lok Lui and Robert Chung. They kindly allow me to use some of the 1989 data in this study. Specifically, a father-son mobility table forms the basis of the analyses of Chapter 3, and in Figure 4.1,1 use further data on first job.
The rest of this thesis is based on interviews I did in 1991-92. The fieldwork of the follow-up study was a great challenge, but it proved to be very rewarding. I am truly grateful to my 80 respondents who generously shared part of their life stories with me.
John Goldthorpe supervises this thesis, and my biggest thank you goes to him. He has been supportive, inspiring, and his feedback is always so prompt and detailed. Readers will, no doubt, find his influence in the following pages.
Justine Burley, Brendan Halpin, Richard Layte, Pat McGovern, Paul Nieuwbeerth, May Tarn and, especially, Katie Willis have read and commented on earlier drafts at different stages. They gave me a lot of ideas, and helped me write more clearly than I would otherwise be able to. My heartfelt appreciation goes to them, but, of course, the usual caveat applies.
Clive Payne and Liz Cowe have patiently and expertly advised me on technical matters related to loglinear modelling and optimal matching analysis respectively. They make my life as a quantitative researcher ten thousand times easier, so thanks a lot!
During my year of fieldwork, the Sociology Department of Hong Kong University kindly provided me with working space and other practical support. Professor Siu Lun Wong lent his name to my research by writing to the respondents. Graduate students I met in HKU, Annie Chan, Oliver Chan, Suzanne (Little Hill) Chan, Tony Fung, Eva Hung and Patrick Mok, were so good company that the occasional frustation met in fieldwork often became good laugh.
Finally, I would gratefully acknowledge financial support which came in the form of a J.K.Swire Memorial Scholarship (1989-91, 1992-93) and a Overseas Research Student Award (1990-92).
Tak Wing Chan June 1994
11
Contents
List of Tables
List of Figures
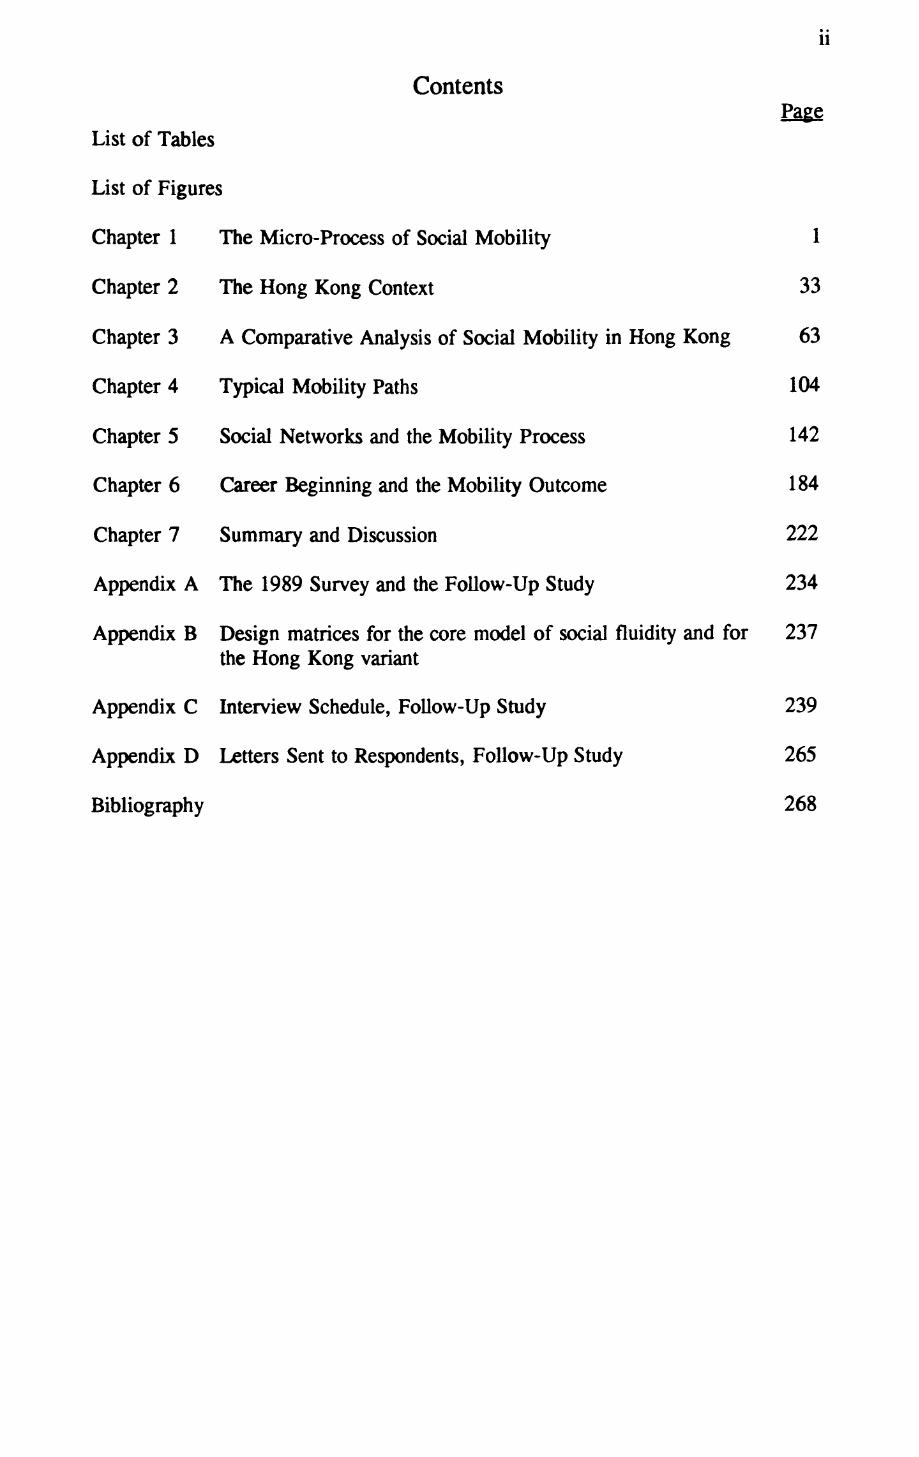
Chapter 1 The Micro-Process of Social Mobility
Chapter 2 The Hong Kong Context
Chapter 3 A Comparative Analysis of Social Mobility in Hong Kong
Chapter 4 Typical Mobility Paths
Chapter 5 Social Networks and the Mobility Process
Chapter 6 Career Beginning and the Mobility Outcome
Chapter 7 Summary and Discussion
Appendix A The 1989 Survey and the Follow-Up Study
Appendix C Interview Schedule, Follow-Up Study
Appendix D Letters Sent to Respondents, Follow-Up Study
Bibliography
Page
33
63
104
142
184
222
234
Appendix B Design matrices for the core model of social fluidity and for 237 the Hong Kong variant
239
265
268
Ill
Tables and Figures
Table1.1 The CASMIN class schema
2.1 Numbers of immigrants from China (legal and illegal)
2.2 Distribution of Hong Kong's immigrant population by former occupation in mainland China and by occupation in Hong Kong as of June 1954
2.3 Distribution of Hong Kong's working population by industry
2.4 Distribution of entrepreneurs by occupational origin
2.5 Distribution of entrepreneurs by first job
2.6 Class schemata (Tsang 1992)
2.7 Loglinear modelling of a Hong Kong mobility table, based on class schema of Oxford Mobility Study
2.8 Design matrices of models fitted in Table 2.7
2.9 Parameter estimates of loglinear models of Table 2.7
3.1 Fitting Hong Kong mobility data with CASMIN core model and modified models
3.2 Parameters in log-additive form for effects in the CASMIN core model, and in variant models for Hong Kong and other countries
3.3 Postulated effects of hierarchy, inheritance, sector, and affinity in the cells of the 7 x 7 inter-generational class mobility table
3.4 Effects parameters under the Hong Kong variant model
3.5 "True" and counterfactual outflow mobility rates of urban Japan
3.6 "True" and counterfactual outflow mobility rates of urban Sweden
3.7 Distribution of respondents by class of origin and class of destination for Hong Kong, Japan and range for European countries
3.8 Decomposition of total mobility rates (TMR) into total non-vertical (TNV) and total vertical (TV) mobility, and of total vertical mobility into total upward into total upward (TU) and total downward (TD) mobility for Hong Kong, Japan and range for European countries
4.1 Optimal matching analysis - Substitution matrix 1
4.2 Typical paths into the service class, substitution matrix 1
4.3 Optimal matching analysis - Substitution matrix 2
IV
4.4 Optimal matching analysis ~ Substitution matrix 3
4.5 Typical paths into the service class, substitution matrix 2
4.6 Typical paths into the service class, substitution matrix 3
4.7 Typical paths into the service class, substitution matrix 3, standardised sequences
4.8 Respondents on different mobility paths by various socio-demographic variables
5.1 Source of job news by class of job entered into
5.2 Source of job news by labour market experience
5.3 Type of relationship with job contact by class of job entered into
5.4 Class position of job contact by class of job entered into
5.5 Frequency of contact with, and subjective assessment of closeness to, job contact by class of job entered into
5.6 Whether contact knew respondent's family and close friends by class of job entered into
5.7 Duration of relationship with job contact by class of job entered into
6.1 Type of relationship with job contact by labour market experience
6.2 Qualification of respondents when first left school by mobility outcome
6.3 Parental attitude towards respondent's education by mobility outcome
6.4 Whether respondents had discussed career plan with, and/or received career advice from, parents by mobility outcome
6.5 Number of employer by mobility outcome
6.6 Number of major career change by mobility outcome
Figure3.1 European ranges of inflow rates and position of Japan and Hong Kong
3.2 European ranges of outflow rates and position of Japan and Hong Kong
4.1 Outflow to entry class and destination class by origin class, all respondents of main survey
6.1 Quartiles of the distributions of age of leaving school for the first time, first job, and first marriage for mobile and immobile respondents, and of age of entering the service class for mobile respondents
Chapter 1
The Micro-Process of Social Mobility
This thesis examines the micro-process of social mobility. The context of my
investigation is modern Hong Kong. Thus I have two objectives. As a contribution
to mobility studies in general, I seek to explore how class mobility actually takes
place; how macro-sociological findings often reported in comparative mobility studies
are linked to the social action of individuals. My second objective pertains to a more
local and substantive concern: in what ways is Hong Kong more (or less) open than
other societies, and how is class inequality perpetuated in this particular industrial
society?
Perhaps there is little need to make a case for my second objective (the fact that
suitable data are available provides some motivation to undertake this study; also, it
is natural to be curious about the society in which one was born and grew up). My
first objective, however, may need some explanation. This introductory chapter seeks
to explain why it is of theoretical and substantive importance that we know more
about the micro-mobility process. To this end, I will briefly review the development
of comparative mobility studies as well as past efforts to specify the mobility process.
My argument is that we do not yet have a satisfactory theory of the mobility process.
I will make some suggestions of how we can begin to develop such a theory. In
particular, research into career dynamics and social network analysis will be
discussed.
Stating the problem
It is important for us to know more about the micro-mobility process because
conventional comparative mobility studies are inadequate on two counts: (a) there is
a question which has not been satisfactorily answered ~ why is it that the relative
mobility rates of all industrial countries are largely the same? and (b) there is also a
question which has not been asked how do people actually become mobile? These
two questions are related. I would argue that a study of the micro-mobility process
should throw light on how unequal mobility chances are generated (the second
question), and by implication, its invariance across countries (the first question). Let
me elaborate these two points.
The unanswered question
Comparative mobility studies have always been concerned with the extent and the
sources of variations in mobility rates. After more than thirty years of empirical
investigation, it is now commonly accepted that the relative mobility rates of all
industrial nations are largely similar. 1 This is a major empirical finding, but we do
not know very well why this should be the case. To substantiate this point, I will
briefly review the development of comparative mobility studies.
This field of study developed in two phases. The first phase was based on national
mobility surveys conducted in the 1950s, and can be represented by the work of
Lipset and Zetterberg. After studying the published results of nine national mobility
surveys, they come to the conclusion that, "the overall pattern of social mobility
appears to be much the same in the industrial societies of various Western countries"
(1959:13, original emphasis).
For our present purpose, several points are notable. First, Lipset and Zetterberg
'Relative mobility rates are defined in terms of odds ratios. See Hout (1983) for an introduction to basic concepts in mobility research.
pitch their analysis at, what we now call, the level of absolute mobility rates. They
argue that because all industrial societies experience similar changes in their economic
and occupational structures, they should have similar absolute mobility rates. Second,
the class/occupational schemes of the nine surveys are different, so they have to
collapse the schemes to a threefold distinction of non-manual, manual, and farm.
This enables them to achieve some nominal comparability across the surveys, though
the issue of real non-comparability still exists (Goldthorpe 1985). This problem of
data quality seriously weakens their argument.
In any case, and this is the third point, Lipset and Zetterberg have overstated the
commonality in absolute rates that can be made of their data, particularly when
mobility flows from the farming classes are taken into account (Jones 1969). Indeed,
when data of a higher standard of comparability became available, significant
variation in absolute rates became even more evident (Grusky and Mauser 1984;
Erikson and Goldthorpe 1992a). 2 Mobility researchers often interpret such variation
as largely a result of the specificities in the economic and political history of
individual nations. The size and the rate of contraction of the farming classes is
particularly important in this regard.
Although the hypothesis of Lipset and Zetterberg has been discredited, the central
concern of comparative mobility studies remains unchanged. In particular,
Featherman, Jones and Hauser (1975) argue that the observed variance in absolute
mobility rates is due to factors exogenous to the processes that transmit social
advantages across generations, and it is these processes which are common to all
2Grusky and Hauser report that, "not only is there highly significant variation in observed mobility rates among industrialized nations, but there is no less variation among these nations than among nations that vary widely in the level of industrialization" (1984:22).
industrial countries. Hence, once the effect of the exogenous factors are controlled,
cross-national similarity in mobility rates, at the relative level, will become apparent.
As they put it (1975:340):
This new hypothesis differs [from that of Lipset and Zetterberg] in that it is specified in terms of circulation mobility, and states the genotypical pattern of mobility (circulation mobility) in industrial societies with a market economy and a nuclear family system is basically the same. The phenotypical pattern of mobility (observed mobility) differs according to the rate of change in the occupational structure, exogenously determined ... by (for example) technological change, the supply and demand of specific kind of labor ..., and changing social values affecting ... the demand for higher education, the rate of economic change, family size, and the spacing of children.
This argument, often labelled as the FJH hypothesis, is of great theoretical
significance because it contrasts sharply with several widely accepted views of how
mobility rates should vary with macro-sociological variables. 3 For example, Treiman,
characteristic of liberal theorists of industrialism, argues that, "the more industrialized
a society, the higher the rate of 'exchange' mobility" (1970:221). In other words,
relative mobility rates or social fluidity of industrial societies will, in his view,
increase concomitantly with economic development. The FJH hypothesis, however,
"allows an initial developmental effect on mobility, but it implies there is no further
effect once a certain level of industrialization is reached" (Grusky and Hauser
1984:20). Likewise, the FJH hypothesis also contradicts arguments which say that
state socialist countries are more open than capitalist countries (Parkin 1972), or that
social fluidity varies according to the cultural make-up of a society.
Given its importance, the FJH hypothesis has, not surprisingly, been subjected to
many empirical tests. Some researchers, such as Erikson and Goldthorpe (1992a),
3Note that although Featherman, Jones and Hauser use the dated terminology of "circulation" and "structural" mobility in this paper, it is clear from the context of their application that they are referring to what we now call relative and absolute mobility rates.
have offered empirical support to a weak version of the hypothesis, while others have
argued against it (Ganzeboom, Luijkx and Treiman 1989, Grusky and Mauser 1984,
Wong 1990).
Let us consider this ongoing debate in more detail. On the supporting side, Erikson
and Goldthorpe, working under the CASMIN (Comparative Analysis of Social
Mobility in Industrial Nations) project, have studied the mobility regimes of 15
nations. They acknowledge that the relative mobility rates of these nations are not
completely identical. Hence the FJH hypothesis cannot be accepted if it is held in the
strictest sense. But they point out that the original verbal formulation of the
hypothesis requires only a basic similarity rather than a complete identity of relative
rates. In other words, there is a discrepancy between the verbal formulation of the
hypothesis and the common social fluidity (CSF) model with which it is formally
tested.4 Furthermore, since the CSF model in fact accounts for almost 95% of the
total association in the three-way, origin by destination by nation, table, the
commonality in social fluidity across nations is very impressive indeed.
To provide a slightly relaxed framework to test the FJH hypothesis, Erikson and
Goldthorpe have developed a core model to represent what they think are the key
features of the cross-nationally common fluidity pattern. When this core model is
fitted to individual mobility tables, they find that, for most cases, there are
statistically significant deviations between the observed pattern and the model.
"The CSF model can be represented by the following equation:log Fijk = n + 04 + Dj + Nk + OD;; + ON* + DNjlL
where Fijk is the fitted value of cell ijk, n is a scale factor, O; , Dj and Nk are the main effects of the distribution of individuals over origins, destinations and nations respectively, and the remaining terms refer to the three possible two-way associations in the table. The distinguishing feature of this model is the absence of the three-way ODN term. In other words, it suggests that the association between origin and destination is identical across nations.
However, such deviations are not systematic in nature in the sense that they cannot
be interpreted in terms of macro-sociological variables such as level of economic
development or political complexion of government. Instead, they have to be
explained by specific features of individual societies. 5 Erikson and Goldthorpe argue,
quite rightly, that deviations from the core model of a non-systematic type do not
knock down the FJH hypothesis if it is taken "in a weaker, yet still meaningful and
at the same time empirically more plausible sense: that is, as claiming that across
industrial societies there prevails a common or core pattern of relative rates ... so that
even where cross-national differences do appear, they are still better understood as
variations on a common theme than as constituting a set of a distinctive types of
fluidity" (Ishida, Goldthorpe and Erikson 1991:956).
Other researchers, however, have reported negative findings. For example, Grusky
and Mauser contend that there is "evidence of systematic, cross-national variation in
mobility parameters" (1984:31). To repeat, for Erikson and Goldthorpe, it is not
variations in social fluidity per se. but those which are systematic and interpretable
in terms of macro-sociological variables, that are most damaging to the FJH
hypothesis. Wong (1990) and Ganzeboom, Luijkx and Treiman (1989) have also
reported negative findings. 6
Obviously, there is a need to assess and compare these conflicting results. However,
5One partial exception here is that strong and persistent political intervention on the part of the state seems to be able to reduce inequality of mobility chances. However, since the objective and the outcome of political intervention are quite variable, differences in fluidity patterns between socialist countries are no less important than those between socialist and capitalist countries. In this sense, there is no evidence for a socialist type of fluidity pattern.
6See also Jones (1992), Hout and Mauser (1992), Sorensen (1992) and Erikson and Goldthorpe (1992b) for further exchange between the two sides of the debate.
a fair and fully-fledged evaluation should, at least, start with a re-analysis of the data
sets used by the competing researchers. This is beyond the scope of this thesis, but
as a preliminary assessment, one should note the following:
(a) These conflicting claims are based on analyses of different data sets. Grusky and
Mauser have compared mobility data from 16 countries; Wong has studied 6 mobility
tables; Ganzeboom, Luijkx and Treiman have analyzed 149 mobility tables from 35
countries. Erikson and Goldthorpe, by comparison, have analyzed 15 mobility tables
- all of them are derived from the receding of original data at the unit record level.
Surely, different degrees of comprehensiveness, data quality, comparability, etc. can
be claimed by the various researchers (Erikson and Goldthorpe 1992b).
(b) The analyses are based on class/occupational schemes of different details. Erikson
and Goldthorpe use a 7-category schema (see Table 1.1); Ganzeboom, Luijkx and
Treiman have collapsed the CASMIN schema to a 6-category version; Wong uses a
7-category schema, which is very different from the CASMIN one not the least in
that it does not allow for any distinction between salaried as opposed to self-
employment; Grusky and Hauser use the minimal threefold distinction of non-
manual/manual/farm.
(c) Different assumptions about the class structure are made principally, in seeing
social class as either a categorical or an ordinal-level variable. Only Erikson and
Goldthorpe insist that there is no single hierarchy that ranks all social classes in a
natural and unequivocal manner. They argue that it is neither easy, nor of great
theoretical interest, to decide if movement between, say, an unskilled manual position
and farm work constitutes upward or downward mobility. The class of the self-
employed also complicates the problem of ranking. It includes occupations so diverse

8
in income and prestige that it makes little sense to suggest that it fits unequivocally
in a particular slot on a linear scale. Furthermore, Erikson and Goldthorpe argue that
since their principal concern lies in the issues of class interests and class formation,
determining the directions of social mobility is only marginal to their endeavour.
Other researchers do not share these views. Wong, for example, maintains that,
"[since] there is strong evidence that occupations are ranked in terms of
socioeconomic status or occupational prestige, occupation should be treated as an
ordinal measure" (1990:561). It is perhaps fair to say that, for many researchers,
deciding which position to take is as much a question of the availability of technical
tools as that of theoretical interests.7
(d) It follows from (c) that Erikson and Goldthorpe use only loglinear models in their
work, which do not require any presupposition of order among the class categories.
In contrast, Grusky and Hauser, Wong, and Ganzeboom, Luijkx and Treiman have
all employed logmultiplicative models: a set of technical tools that carry the opposite
assumption. 8 It is important to note that these different tools produce divergent
findings. As Wong puts it, "[variance] in social mobility may be detected if we adopt
an appropriate comparative strategy and use sensitive statistical methods" (1990:560).
The criteria for the appropriateness of strategy and the sensitivity of tools should be
discussed explicitly. But this is not my primary concern here. For our present
purpose, I believe it is adequate to note that the divergent findings reported above are
7Stier and Grusky, for example, argue that, "[the] nominalist viewpoint is still favored in some quarters (see Erikson and Goldthorpe 1987a), but recent methodological development has reduced its popularity. The emergence of association models was a critical turning point in the field, because these models made it possible to exploit more fully the metric properties of occupations" (1990:737, original emphasis).
8To be accurate, Erikson and Goldthorpe (1992a:91-92) have also developed a uniform-difference model which contains a logmultiplicative element. But it is used in relation to change over time, not to class categories.
related to the effects of study designs (data, class scheme, technical tools).
Obviously, there is a need to estimate how far these effects account for the
differences in the findings; or conversely, how much real difference is there.
To do so, more efforts should be spent on collecting mobility data of a high standard
of comparability from more countries, such that we can repeat the many tests
available to a wider range of cases. 9 But let us suppose that after repeated and more
rigorous examinations, the FJH hypothesis is finally confirmed. At that time, we still
have to answer one very important question: how do we explain the commonality in
social fluidity across nations?
Before we go on, I should add that, even at present, among the researchers who have
reservations about the FJH hypothesis, there are some who would agree that there is,
indeed, a very impressive common core of relative mobility rates. For example,
Grusky and Hauser state that, "[our] results make it quite clear that the 'cross-
nationally common element heavily predominates over the cross-nationally variable
one'. Not only does one simple model, quasi-perfect mobility, fits all of these data
satisfactorily, but its coefficients do not vary greatly between countries. These
findings of cross-national invariance support the FJH revision of the Lipset-Zetterberg
hypothesis" (1984:26).
And for those who did not explicitly say so, I would argue that their findings are in
fact consistent with the statement of Grusky and Hauser. For example, the CSF
model accounts for 96% of the total origin-destination association found in the six
mobility tables analyzed by Wong. (Incidentally, the association model that he
9See Ganzeboom, Luijkx and Treiman (1989:9-13) for an alternative research strategy, and Erikson and Goldthorpe (1992b:284-286) for criticisms of this strategy.
10
prefers does no better than the CSF model - it also explains 96% of the total
association, though it uses fewer degrees of freedom.)
So, it can be argued that the position of Erikson and Goldthorpe that, "the total
amount of the association between class origins and destinations that is cross-
nationally variable is, in any event, only very small relative to the amount that is
cross-nationally common" (1992a:389) is not that controversial. It follows that there
is, indeed, a need to explain the in variance of relative mobility rates now rather than
later.
There have been some attempts to provide an explanation. Featherman, Jones and
Mauser, in their article that first formulated the FJH hypothesis, note, "[that] the
organization of occupations across societies (at least of an industrialized type) is so
similar ... is not without sociological interest" (1975:333). Such similarity can be
argued as underpinning the common mobility processes that exist in all industrial
societies. Grusky and Mauser take up this lead later. They suggest that, "differences
in relative mobility chances arise primarily from variation in the resources and
desirability accorded occupations" (1984:22). Since cross-national studies of
occupational prestige have clearly demonstrated that there is substantial uniformity
across societies in how economic resources and desirability are accorded to
occupations, we should expect a largely common pattern of social fluidity as well.
As Grusky and Mauser put it, "the same processes which produce the uniformity in
prestige may also account for the in variance in mobility" (1984:26).
This line of thinking seems reasonable, but it is only a piece of theoretically informed
speculation. More importantly, it leads to further questions: why should there be
uniformity in occupational prestige, and how do the processes that produce such
11uniformity operate? Erikson and Goldthorpe (19875:161) in their interpretation of
the original formulation of Featherman, Jones and Hauser, suggest the following:
it is economic [i.e. the market] and familial institutions ... that primarily determine relative chances of social mobility from one generation to the next. Thus, provided that these institutions have a basically similar form, so too, it may be expected, will the pattern that such mobility chances display.
Again, this only breaks down the original question, without providing a satisfactory
answer. We still have to ask why the market and the family system of different
societies generate and perpetuate similar patterns of relative mobility chances. The
common core of relative mobility rates remains unexplained.
To sum up the discussion of this section, comparative mobility researchers have made
real and significant progress over the last thirty years. We now have many
sophisticated statistical tools at our disposal, and a wider range of data sets of
improved quality and comparability have become available. Given these
improvements, the old hypothesis of Lipset and Zetterberg has been disproved, and
although the FJH hypothesis remains contentious, all comparative studies have
documented an impressive common core of relative mobility rates. Some take this
as indicating a failure on the part of mobility researchers to adopt appropriate
comparative strategy and sensitive tools (e.g. Wong 1990). However, one can also
argue that the invariance of relative rates is a real phenomenon that needs to be
explained. As Erikson and Goldthorpe (1992a:389) suggest,
rather than making the assumption that variation in relative rates is systematic and that explaining this variation represents the chief goal of macrosociological endeavour, we should suspend this assumption and, instead of concentrating so exclusively on variation, we should regard the commonality that prevails in relative rates -- and their general persistence and pervasiveness as providing the major focus for macrosociological attention.
If we take the latter position, then one has to admit that, so far, we do not yet have
12
a satisfactory account of the invariance of relative rates. Perhaps this is, in part,
related to the fact that researchers are still preoccupied with the logically prior task
of ascertaining the extent and the sources of variation in mobility regimes. While this
is an important question, I would argue that it is time for us to address the question
of how mobility is generated. This brings us to the second inadequacy of
(comparative) mobility studies ~ the unasked question.
An analytical lacuna
Very simply put, mobility table analyses seek to tell us how much and what types of
mobility there are in a particular country over a particular period of time. What they
do not address is how people actually become mobile (or immobile). The fact that
mobility studies do not address the question of process has been noted by Sorensen
(1986). He argues that we lack a theory of "the mechanisms that generate mobility
in society ... a theory that reveals which variables produce mobility and, very
importantly, how they interact in producing it" (1986:76).
The theory that Sorensen has in mind is not the one which is implicit in status
attainment research, although this is sometimes described as the study of the process
of stratification. It is true that a path analytic model enables researchers to compare
the relative contribution of, say, education and class origin in explaining the overall
variance in occupational attainment, so it does specify which variables account for
attainment and how they interact in producing it. However, as Sorensen puts it, "[the
status attainment model] does not suggest how it is that these variables came to have
this influence. Thus we know that education makes a difference, but nothing in the
status attainment literature suggests why it makes a difference for access to jobs"
(1986:82-83). In other words, both status attainment study and mobility table
analysis, the two major approaches that study intergenerational transmission of class
13
advantages, fail to tell us how mobility comes about.
The cost of not having a theory of the mobility process is not just an academic
lacuna. Blalock (1991) makes this point forcefully when he notes that it is often
difficult to interpret observed patterns of inequality between social groups. Empirical
studies in the United States, for example, have repeatedly documented that
educational returns, in terms of occupation or income, are smaller for blacks than
they are for whites. How do we make sense of such findings? Are they unequivocal
proof of discrimination against blacks, or is it at least possible that other factors such
as different levels of effort or motivation between blacks and whites are also involved
in producing these inequalities? Blalock argues that because the empirical data
available to us pertain to the aggregated results of the social allocation process rather
than the process itself, we really have no factual basis on which to make any
interpretation. However, many sociologists are tempted to do so, and because most
sociologists do not want to "blame the victim", we tend to choose the former
interpretation rather than the latter. But sadly this is nothing more than imposing our
political values onto empirical observations.
Blalock suggests that this is problematic on two counts. First, although we may not,
because of personal political values, prefer certain interpretations, it is important that
"we give our opponents' explanation a fair chance" (1991 :xii). In other words,
scientific integrity requires us to include variables which do not match our political
values even though they may turn out to be embarrassingly powerful. To do so,
Blalock suggests, we will have to revise our research strategy, in particular, to collect
data that directly address the allocation process itself. Second, since we have not yet
given our opponents' explanations that fair chance to be proved right and useful, we
will not be able to convince people who happen to hold a different political view.
14
That is why the results of many sociological studies, and perhaps sociology itself,
have not been taken seriously.
Therefore, it is of substantive significance that we know, rather than speculate, how
inequality (in mobility chances) is generated. But what are the problems that hinder
the development of a theory of mobility (allocation) process, and how should we
begin to develop such a theory?
Sorensen (1986) has attempted to answer both questions. With respect to the first
question, he argues that the data used in mobility studies (and status attainment
research) are not suitable for the development of a theory of mobility process.
Mobility researchers normally employ occupational data of just two time points
(namely, son's current occupation, and father's occupation when the son was, say,
14 years old) to represent the very complex career histories of both the father and the
son. This practice is very misleading because, (a) at the time when they are
interviewed, respondents of mobility surveys are at very different stages of their
career, and (b) people's careers change in systematic directions. In other words,
although some respondents have just left school, others are approaching or have
reached "occupational maturity", and some are possibly experiencing occupational
decline before retirement, the current occupations of all these people are taken as
their respective class destinations. Hence, the concept of class destination is highly
problematic. Similarly, class origin is also a problematic concept. Given these
problems, Sorensen suggests, it is not surprising that the results of comparative
mobility analyses are often difficult to interpret, even though very sophisticated
statistical tools have been employed.
Sorensen's criticism certainly carries weight. An obvious first step towards
15
developing a theory of mobility process is to collect and analyze complete work
histories. But assuming that such data are available to us (and certainly they have
become available in more and more countries), we still have to ask what a theory of
mobility process would look like. Sorensen suggests that, "[the] complete
specification of such a theory usually requires a mathematical model" (1986:76), and
he has provided some examples which are sometimes called vacancy competition
models (Sorensen 1974, 1975, 1977, 1979, Sorensen and Tuma 1981, Sorensen and
Blossfeld 1989). Let us consider these formal deductive models briefly.
These models are slightly different from each other according to the context of their
application. For example, difference equations are used when discontinuous job shifts
are being considered, while differential equations are developed when mobility is seen
as movement along a continuum of socioeconomic status. However, one common
line of reasoning underlies all these models. Sorensen starts with two sets of
assumptions. The first set pertains to the structure of inequality and opportunity
how jobs are distributed by level of attainment, the rate at which vacancy appears,
and how vacancies move in the social system, etc. The second set of assumptions are
about individual resources that are relevant for job mobility ~ most importantly, he
assumes that the amount of human capital possessed by an individual remains constant
once he/she enters the labour market. This is, of course, completely opposite to the
assumption of human capital theory.
Given these assumptions, Sorensen proceeds to develop his models which all share
the basic idea represented by equation 1.1:
dy(t)/dt = c0 4- by(t) + c,x, (1.1)
16
where y(t) represents the occupational attainment of a person at time t, x, is a
summary measure of individual resources (including both ascribed and achieved
factors, such as family background and educational attainment), and c0 captures
unmeasured resource variables. In other words, Sorensen suggests that the rate of
change in attainment is affected by two factors: (a) the amount of resources
possessed by the individual, and (b) the level of attainment already achieved. The
coefficient b is assumed to be negative, so that for any individual (for whom xl is a
constant), "the higher the [present] achievement the less gain will take place.
Eventually the rate of change will be zero, and at that time the level of achievement
will be y(e) = -Co/b - c^/b" (Sorensen 1975:462).
Within a social system, b is the same for everyone, and differences in individual
attainment are explained by the different values of x,. However, the value of b varies
between social systems. In fact, b can be shown to be related to two parameters ~
one governs the distribution of jobs, and the other represents the rate of appearance
of vacancy. So b can be understood as a measure of the opportunity structure of a
social system. Essentially, what Sorensen does is to estimate and compare the value
of b for different systems. He has, for example, estimated the value of b for blacks
and whites in the United States, and is able to show that the opportunity structure for
blacks is worse than that for whites (Sorensen 1975). In his more recent work, he
uses more or less the same logic to compare the opportunity structure facing the
different birth cohorts in post-war Germany (Sorensen and Blossfeld 1989).
As theories of mobility process, how good are these models? Let me start by stating
what my position is not. Sociologists often dismiss formal mathematical models,
perhaps too offhandedly, as being based on unrealistic assumptions, or because they
usually do not fit empirical observations very well. Even Sorensen admits that,
17
"formalized theories of social processes are rare in sociology, and the mathematical
models that are used are often not good theories" (1986:76). However, unrealistic
assumptions can, in principle, be replaced by more realistic ones, more parameters
can be included in the model, and goodness of fit may be improved accordingly, so
there is nothing wrong in mathematical formalization itself. In fact, Sorensen's
models are very useful in that, as noted above, they explicitly make the long-
recognised distinction between opportunity structure and individual resources as two
separate factors that affect mobility outcome. Accordingly, they allow the researchers
to compare the opportunity structure across social systems, net of differences in
individual resources. It seems to me that this is where the strength of these models
lies.
However, I would also argue that Sorensen has failed to address, directly and fully,
the central concern of social mobility and status attainment research, namely the
transmission of social advantages across generations. This is so because the
parameter which measures the opportunity structure, b, is only a function of structural
variables, namely, the distribution of jobs and the rate of appearance of vacancies.
Nowhere in its derivation can we find measures of interests, or actions taken by
individuals and families to protect the class advantages they already have, or to
improve their current class position. Instead, these factors are lumped, and lost, in
another part of the model the summary measure of individual resources (in actual
practice, educational attainment is often used as a proxy for all relevant individual
resources).
The need to bring out the interaction between individual actions and the opportunity
structure can be better understood if we consider more closely the various contexts
in which Sorensen's models are applied. As noted above, they allow us to test
18
whether there is more opportunity in social system A than in social system B. But
such comparison makes sense only when the social systems under comparison are
distinct from each other. For example, it is interesting and legitimate to ask, other
things being equal, whether the cohort of Germans born in 1940 enjoy better mobility
chances than those born in 1950; or similarly, whether the employees of bureaucracy
A enjoy more opportunity of internal promotion than those in bureaucracy B.
However, it is more problematic when, say, the opportunity structures facing the
blacks and whites of America are compared. This is so because the blacks and the
whites are not two completely segregated groups, each competing among themselves
in their own labour markets. One can surely argue that the whites have better
opportunity partly, at least, because the blacks have worse.
The problem here is that Sorensen's models stipulate that the same amount of
opportunity is available everywhere to everyone in a social system; differential
attainment within that system is explained by the different capacity of individuals to
make use of such opportunities. So when he seeks to suggest that, overall, less
opportunity is available to blacks than to whites, he has to conceptualize them as
belonging to two distinct social systems. I think this is not what we want to say.
What we need is a theory that specifies the different opportunities and constraints that
people in various structural positions have, and how they make use of the resources
available to them (not just formal credentials) to compete for more advantageous
positions in the class structure. To use a common sociological idiom, it is the
complex interplay between structure and actions that should be the object of study.
However, to repeat a point made earlier, the fact that Sorensen's models are
unsatisfactory for our purpose does not imply that formalization is a futile enterprise.
There is obviously room for improvement, and this calls for greater research effort.
19
Having said this, I would also argue that we need to know more about the mobility
process first before a better model can be developed. Hence, the present study will
be undertaken in an inductive rather than a deductive vein.
Let me recapitulate the arguments so far. I have noted that comparative mobility
researchers are unable to explain one of their most important empirical findings,
namely the invariance of relative mobility rates across nations. I then argue that if
we knew more about how unequal mobility chances are generated, we would be in
a better position to account for their invariance across nations. Unfortunately, our
knowledge of the micro-process of mobility is truly meagre, and the few attempts
which seek to tackle this problem (status attainment studies, Sorensen's vacancy
competition models) are, for my purpose, unsatisfactory. Nonetheless, some positive
lessons can be drawn from these attempts. First, a theory of mobility process should
make use of complete work history data rather than occupational data of only two or
three time points. But the use of career data should not distract us from our central
concern of how social advantages are transmitted across generations. In other words,
for our purpose, we are interested in understanding the career dynamics because we
would like to know at what stage in the life course and in what ways are social
advantages passed on from father to son. Second, this theory should take into
consideration the effects of the opportunity structure and individual purposive actions
for mobility, as well as the interaction between the two.
The micro-process of social mobility
I have now cleared the ground for my exploration of the mobility process. In a
sense, I will have to start from scratch. However, a few studies are relevant to this
inquiry. In particular, a simple scheme of thinking about mobility opportunity
suggested by Skvoretz (1984) is a useful starting point. Skvoretz notes that three
20
types of factors, namely positional, historical (or temporal) and resource factors,
affect mobility outcome.
Positional factor captures the idea that, other things being equal, there are certain
positions within a stratified system which offer more mobility chances to their
incumbents than do other positions. Similarly, there can be some historical periods
which offer more mobility opportunities than others, such that, for example, if one's
worklife starts in the former rather than the latter period, one is more likely to
achieve mobility. Finally, individual resources has long been recognised as a key
determinant of mobility. Let us consider this scheme, especially the positional and
the resource factors, more carefully.
Positional factor typical mobility paths
The fact that certain positions regularly offer better mobility chances than others has
been successfully documented by researchers of organizational careers. Gaertner
(1990), for example, suggests that the various jobs within an organization can be
differentiated according to the function they serve with respect to an employee's
career ~ there are entry positions where new-comers join the organization and receive
initial training, plateau positions that serve as outlets for underperformers, exit
positions where people leave the organization, etc. Most interestingly, she suggests
that there are "assessment positions" in which the incumbents enjoy greater visibility
of their work and acquire new skills. Consequently, assessment positions often are
stepping stones to higher level positions.
Having made these distinctions, Gaertner then employs data derived from personnel
records to trace how a sample of public school administrators in the U.S. move
within the hierarchy of an education authority. Taking each job shift as a mobility
21
event, she constructs a cumulative mobility table similar to those analyzed by
Featherman and Selbee (1988). By applying loglinear models to the table, she is able
to show the degree of interconnectedness of the various posts in the hierarchy. This
then allows her to identify the assessment positions of the hierarchy.
The question for us is threefold. First, whether there are occupations in the national
labour market which are equivalent to assessment positions in organizations, in the
sense that they regularly offer better mobility chances. Second, if there are indeed
such positions, why is it that they can offer better opportunities? Third, how do
incumbents of such positions get to where they are in the first place?
Generally speaking, to answer the first question, we need to compare the work history
of two groups of people ~ they should come from the same class origin, but only one
group has achieved mobility into some desired class of destination, which, in this
study, is the service class (see Table l.l). 10 If we can discern typical job sequences
among the mobile people which cannot be found from those who are immobile, then
the sequences identified can be taken as mobility paths that lead to the service class.
Of course, social mobility into the service class takes many different routes, and the
explanation for mobility outcome would not be the same for all of them. For
example, a school child of working class background could be very bright
academically. He/she went to university immediately after finishing secondary
1(yThe service class is made up of large proprietors and "[employees who] exercise delegated authority or specialized knowledge and expertise in the interest of their employing organization ... such employees must then be accorded a legitimate area of autonomy and discretion and, to this extent, their performance will depend on the degree of moral commitment that they feel towards the organization rather than on the efficacy of external sanctions" (Erikson and Goldthorpe 1992a:42). See Erikson and Goldthorpe (1992a:35-47) for discussion of the CASMIN class schema.

22
school, and the degree he/she obtained, in turn, enabled him/her to take up a
recognised professional job. This is an instance of direct entry into the service class.
In this case, it is the school child's success in examinations rather than his/her career
experience which explains the mobility outcome.
However, there are also indirect routes into the service class where work experience
is much more relevant. We can imagine a second working class person who dropped
out from school at a much younger age than the first one. He/she has worked as a
wage worker for several years before a chance to return to college appeared. He/she
took up the chance, obtained better qualifications, and eventually got a service class
job. The interesting question here is whether certain types of lower level jobs
typically precede belated entry to college. If so, is it because a system of promotion
and training is established for these jobs only? These are empirical issues to be
examined.
We can also envisage a third situation in which someone left school with minimum
or no qualification. He/she became a wage worker for some years and then started
a business with a few partners. Here, as in the second situation, it would be
interesting to know if certain types of jobs typically precede entrepreneurship. To use
a term of Broom and Smith (1962), I am concerned with the "bridging occupations"
in class mobility - occupations in which one acquires skills, attributes or other
resources that would facilitate subsequent mobility.
This brings us to the second question -- what accounts for the bridging quality of the
typical mobility paths identified? With respect to organizational careers, Gaertner
suggests that assessment positions offer better chances of promotion because "[these]
positions usually imply a qualitative change in job content, allowing incumbents to

23
develop skills that will be necessary at higher levels and allowing members of the
organization to observe the incumbent's performance closely. These observation and
skill development characteristics of the positions increase the probability that capable
people will be promoted to positions of greater responsibility" (1990:136).
This explanation is unlikely to be wholly applicable in the context of class mobility
in the national labour market. So, how do we explain why some types of work
experience (job sequences) offer better chances of mobility than others? As noted
above, Broom and Smith suggest that certain occupations allow their incumbents to
develop useful skills, attributes and other resources. More specifically, they have
suggested five bridging attributes:
The first and vital attribute we call resocialization to emphasis the redirection of the perspectives and aspirations of the occupant. The second attribute, independency, indicates the dissociation of the occupant from ties and commitments that would restrict his mobility. We identify health and physical bearing as a third attribute. Fourth is access to information or to individuals in influential or useful positions. Fifth is financial competence. (1963:323, original emphasis)
The notion of bridging occupations is very suggestive. But the formulation of Broom
and Smith is inadequate in two senses. First, two of the five attributes that they refer
to, namely health and physical bearing and financial competence, describe the
incumbents rather than the structural locations. 11 Second, they have not provided any
systematic evidence of how these attributes are distributed over a wide range of
occupations, and whether they have any real effects on mobility outcome. Instead,
they have only made some impressionistic comments on how these attributes may
operate in five occupations (servant, soldier, teacher, pedlar, and sportsman) which
can only be taken as illustration of what the attributes mean.
11 1 am grateful to John Goldthorpe for alerting me to this point.
24
Having said this, it should also be noted that Broom and Smith have anticipated some
of the key ideas in subsequent research on job search behaviour access to
information and to individuals in influential and useful positions. To anticipate a later
point, one major concern of the present study is to test what types of social contacts
are most useful for class mobility. This question of social networks is also relevant
for the third question how do incumbents of the bridging occupations get to where
they are in the first place? Did they more or less wander into such positions without
much planning beforehand, or have they received advice about the greater promise
that these jobs provided? If so, where did this advice come from?
Resource factor strength of weak ties?
Individual and family resources have long been recognised as key determinants of
mobility outcome. This is evident from the variables included and tested in status
attainment models. However, the resources factors that are habitually considered are,
(a) parental socioeconomic status, and (b) respondent's education attainment. Both
of them refer to attributes that are lodged in the individual person rather than the
social relationship in which individuals are embedded. It has now become more
widely recognised that social relationships are also a form of resources which
individual actors may employ in their purposive actions. For example, Coleman
(1988:S100-S101) suggests a threefold distinction between physical, human and social
capital.
Social capital ... comes about through changes in the relations among persons that facilitate action. If physical capital is wholly tangible, being embodied in observable material form, and human capital is less tangible, being embodied in the skills and knowledge acquired by an individual, social capital is less tangible yet, for it exists in the relations among persons. Just as physical capital and human capital facilitate productive activity, social capital does as well.
To demonstrate the effect of social capital on individual performance, Coleman

25
examines the dropout rate of school children of various backgrounds. He does not
have much direct evidence to test his ideas, but using network concepts, he is able
to offer some quite plausible accounts of observed statistical patterns. For example,
he finds that, after controlling for other relevant variables, the number of times a
child has changed school previously has a significant positive effect on his/her
chances of dropping out. Coleman interprets this relationship as follows: very often
a child changes school because the family has moved to a new community. The
parents of this child, being new members of the community, probably do not know
the parents of other school children, so there is no intergenerational closure of
network (see Coleman 1988:5107, Fig. 2). Consequently, the parents find it harder
to monitor the behaviour of their child, and so the latter is more prone to dropping
out than others. Put more abstractly, the parents lack the social capital that is
available in an enclosed intergenerational network.
As noted, Coleman does not have any direct evidence of the effect of social networks
(social capital) on purposive action (paternal supervision of children). However, this
idea has received more attention and direct tests in studies of job search and
matching. Granovetter, for example, argues that "advancement [in the labour market]
can depend on knowing about appropriate job openings at just the right time"
(1983:202). Since the flow of job information is a function of the characteristics of
the social networks in which individuals are embedded, social networks should have
some effects on a person's labour market performance. To address this problem,
Granovetter (1973, 1974) studied the job search behaviour of a sample of
professional, technical and managerial workers in a Boston suburb. He discovered
that the majority of his respondents first heard about their present job from personal
contacts rather than through formal channels such as advertisements or employment
agencies. He also found that those who got their jobs through personal contacts were
26
generally better paid, more satisfied with their job than those who used formal
methods. But the most interesting finding is that among those who used personal
contacts to get their job, more people received job information from weak ties than
from strong ties (strength of ties is defined primarily in terms of frequency of
contacts). This looks counter-intuitive at first glance because close friends should
have stronger motivation to help each other, including that of forwarding job news.
Put differently, why is it that job information is more likely to flow through weak
ties? Granovetter is able to account for this with a network theory.
Simply put, Granovetter argues that the people to whom we are close probably know
each other, that is, if A is strongly related to both B and C, it is likely that there is
a link between B and C. 12 If we take bridging ties as those social ties the absence of
which would disconnect two persons or two groups of people, then strong ties are
very rarely bridging ties. Conversely speaking, it is weak ties that connect an
individual to distant and otherwise unrelated social circles. As Granovetter put it,
"there is ... a structural tendency for those to whom one is only weakly tied, to have
better access to job information one does not already have. Acquaintances, as
compared to close friends, are more prone to move in different circles than one's self.
Those to whom one is closest are likely to have the greatest overlap in contact with
those one already knows, so that the information to which they are privy is likely to
be much the same as that which one already has" (1974:52-53). Granovetter
summarizes this argument as "the strength of weak ties" (SWT) thesis.
The SWT thesis has attracted a lot of attention. Accordingly, it has been subjected
12Granovetter relies partly on cognitive balance theory to support this claim. The theory suggests that psychological strain will be created if A is strongly related to both B and C, but the latter two persons are not positively related to each other (see Granovetter 1973:1362-1363).
27
to repeated tests in various contexts (e.g. Lin, Ensel and Vaughn 1981, Marsden and
Hurlbert 1988, Flap and de Graaf 1988, Wegener 1991, see also Granovetter 1983
for his response to some of the earlier papers). Generally speaking, these tests
confirm Granovetter's findings, but they also point to how the effects of social ties
may vary for different social groups. For example, it is found that the rich, the
better educated, and those who are in administrative, managerial and professional
occupations are more likely to use weak ties than the poor, the not-so-well qualified
and the manual workers. More importantly, Lin, Ensel and Vaughn (1981) suggest
that the effect of weak ties on occupational attainment is an indirect one ~ it is more
likely that weak ties rather than strong ties connect an individual to a well-placed
contact in the occupational structure, and such contacts are useful for subsequent job
attainment. This is particularly true for those of low occupational status since their
close associates are probably of low occupational status too. However, it is also
likely that they are often forced to rely on strong ties in job search because weak ties
that reach to higher status are rare. Granovetter further argues that "in lower
socioeconomic groups, weak ties are often not bridges but represent friends' and
relatives' acquaintances; the information they provide would then not constitute a real
broadening of opportunity" (1983:208).
These studies clarify how weak ties facilitate the process of job mobility, but it should
also be noted that, in certain situations, strong ties can also be useful in facilitating
purposive social actions. Consider the social support literature in which researchers
ask the following question: which type of social support would be forthcoming from
whom, under what conditions? The key notion here is network density - the extent
of the interconnectedness among the people one knows. 13 Social support researchers
l3But as it is argued earlier, those people to whom one is strongly tied probably know each other. Hence, strong tie and high network density are related phenomena.
28
argue that information flows more effectively within a dense network. This implies
that one's behaviour would be closely "tracked, evaluated and sanctioned" in a dense
network. For example, Uehara, in her study of how single mothers cope with
unemployment, argues that "in the rare event that members [of a dense network] who
are viewed as capable fail to come forth with support, words spread rapidly
throughout the network, and criticism of the offender is likely to come from various
members. Those who would criticise are also those who would provide assistance
in times of need; members can thus ill afford to be considered uncooperative"
(1990:540).
Roughly the same line of argument has been used by Bott (1971). In discussing
variations of conjugal roles, she observes that the more connected (i.e. higher
network density) is the social networks within which a family is embedded, the more
segregated are the conjugal roles of husband and wife. This, she argues, is because
in a dense network, relatives and friends are under greater informal pressure to help
each other. Such external support would then become an alternative source of
emotional support as well as assistance for household tasks. As a result, there is less
need for task-sharing and joint activities between husband and wife (1971:60).
Intergenerational class mobility definitely requires substantial support and assistance
from one's associates. It follows that being embedded in a dense social network may
also facilitate mobility. Of course, a person can enjoy the support of a circle of close
friends who know each other, and is, at the same time, weakly tied to many other
people who could pass on job or business information. The effects of weak ties and
dense network are not necessarily incompatible with each other. The task for us is
to map out the conditions under which one of these effects become more important.
Bearing in mind that there are multiple mobility routes that lead to the service class,
29
it could be the case, for example, that weak ties are particularly important for those
who seek mobility through getting a salaried service class job (since what is often
needed is information), while the effect of dense social networks is more crucial for
those who are looking for a reliable business partner. Some of these ideas will be
tested in this thesis. Let me sum up the arguments of this introductory chapter.
I have argued that mobility researchers cannot account for one of their most important
empirical findings, namely the invariance of relative mobility rates across countries.
I have also argued that to provide such an account, we need to know more about the
micro-process of social mobility. We do not yet have a satisfactory theory of the
mobility process. But research into the following will be relevant to the development
of such a theory: (a) the career paths along which people become mobile, and (b) the
effect of social networks on job search and/or the formation of business partnership.
I will look into these issues below. Let me round off this chapter with a brief outline
for subsequent chapters.
Chapters outline
In Chapter 2,1 discuss several features of the post-war Hong Kong society which are
relevant to understanding its stratification order and mobility regime. More
specifically, the following topics will be covered: Hong Kong's industrialization
experience, its migration history and population characteristics, popular perception
of inequality and opportunity. In Chapter 3, I extend the CASMIN analysis to Hong
Kong, with a view to (a) testing some of the results reported by Erikson and
Goldthorpe, and (b) revealing the distinctive features of Hong Kong's fluidity pattern.
(The mobility data used in this chapter come from the 1989 Hong Kong Social
Mobility Survey. See Appendix A for detail of the survey.)
30
Readers will see that Chapter 3 is essentially a replication of Erikson and
Goldthorpe's work in the context of a new case: I will be using standard tools to test
a well defined hypothesis. This is not the case when I turn to explore the micro-
mobility process in subsequent chapters. Indeed, it is not entirely clear as to, not
only what techniques to use, but also what questions to ask in a study of the micro-
mobility process. In such a exploratory situation, it is advisable that a small study
be used to test out the feasibility and desirability of the various ways of approaching
the problem. This is what I did in a follow-up study conducted between November
1991 and June 1992 in which I revisited 80 respondents of the main survey. My
respondents were all from class IVab or Vila origin, and they were found in class
I+11, IVab or Vila at the time of 1989 survey. In other words, the mobility
experience of these 80 people include the following types: upward mobility into the
service class, immobility in class IVab or Vila, and mobility between class IVab and
Vila. (Detail of the follow-up study is provided in Appendix A.) Because of the
small N of the follow-up study, the results presented in Chapters 4, 5 and 6 should
only be regarded as tentative.
There are several differences between Chapter 3 and Chapters 4, 5 and 6 that need
to be highlighted. First, the unit of analysis for Chapters 4, 5, 6 is not the national
stratificational system, as is appropriate for macro-comparative research, but the
individual who strives to advance in the class structure. Second, the question I ask
in these three chapters is, in a sense, more restricted than that of Chapter 3. To
elaborate, Chapter 3 is a general study of Hong Kong's mobility regime. I am
interested in all aspects of its mobility pattern that are discernible by the CASMIN
core model. However, in Chapters 4, 5 and 6, I am concerned with upward mobility
31
into the service class only. 14 Third, Chapter 3 is about class mobility between
generations, and the only piece of information it uses is a father-son mobility table.
In contrast, in Chapters 4, 5 and 6, I turn to study the worklife process, and so in
place of the father-son table, I will be analysing complete work history data collected
in the follow-up study.
More specifically, Chapter 4 seeks to identify the "bridging occupations" or the
"typical mobility paths" of Hong Kong. To do so, "Optimal Matching Analysis", a
cluster analysis technique that compares and classifies complete career sequences will
be tested and applied. Thus, apart from offering substantive findings about mobility
paths in Hong Kong, this chapter also seeks to make a technical contribution to the
analysis of life course or work history data in general. Chapter 5 studies the effect
of social networks on job search. In particular, Granovetter's SWT thesis will be
examined critically. Chapter 6 studies the career beginning of the 80 respondents,
with a view to linking up my findings on the worklife process and the pattern of
intergenerational transmission of class advantages.
14As explained above, the CASMIN class schema is not meant to be a linear hierarchy, and so its categories are not ordered. But Erikson and Goldthorpe (1992a:123-125) argue that the service class, when compared to other classes, is distinctively more attractive as class of destination, and it offers more resources as class of origin that it is placed at the top level in a three-level hierarchical distinction among the classes (see discussion in Chapter 3). It is only in relation to mobility flow into and out of the service class that upward and downward mobility is defined respectively (cf. Goldthorpe 1987:43).

32
Table 1.1 The CASMIN class schema*
Eleven-category version
I Higher-grade professionals, administrators and officials; managers in large industrial establishments; large proprietor
II Lower-grade professionals, administrators and officials; higher-grade technicians; managers in small industrial establishments; supervisors of non-manual employees
Ilia Routine nonmanual employees, higher grade (administration and commerce)
Illb Routine nonmanual employees, lower grade (sales and services)
IVa Small proprietors, artisans etc. with employees
IVb Small proprietors, artisans etc. without employees
IVc Farmers and smallholders; other self-employed workers in primary production
V Lower-grade technicians; supervisors of manual workers
VI Skilled manual workers
Vila Semi- and unskilledmanual workers (not in agriculture etc.)
Vllb Agricultural and other workers in primary production
Seven-category version
I-fll "service class"
III"routine non-manual"
IVab"petty bourgeoisie"
IVc "farmers"
V+VI"skilled workers"
Vila"non-skilled workers"
Vllb"farm workers"
Source: Erikson and Goldthorpe (1992a:38-39, Table 2.1)

33
Chapter 2
The Hong Kong Context
This chapter provides an overview of the post-war Hong Kong society, focusing, in
particular, on those features which bear on its mobility regime. I will start with a
review of public perception of mobility chances, which, as will be clear, is generally
optimistic. Then I will consider three factors that may explain the presumed openness
of Hong Kong's class structure, namely demographic fluidity, economic dynamism,
and the prevalence of small firms. Having considered these "favourable" factors, I
will turn to some counter-evidence, principally those reported in two recent mobility
studies.
An open society?
Hong Kong has become to a much larger degree than 40 years ago a place where the individual can and must succeed on his own merit and achievements. There is considerable social mobility, and examples of millionaires who have risen from rags in 20 years are well known to all. If the poorest, least advantaged citizens are Chinese, so too are the very wealthiest men, and also the expanding middle classes. The effort required to raise one's economic and social status (the two are very closely associated) is enormous, but it has been achieved by many, and the constantly changing pattern of economic activity in Hong Kong as well as improvements in universal education have both contributed to making upward mobility more possible. (Baker 1983:472)
Many social scientists (e.g. Lau 1982, Lee 1982, Scott 1989) consider Hong Kong
as a relatively open and meritocratic society (though I would hasten to add that their
claims are often based on personal impression rather than systematic evidence).
Some also argue that the concept of social class itself has become obsolete, and thus
class analysis is irrelevant to the understanding of Hong Kong society. Lee, for
example, contends that, "it is no longer realistic to describe Hong Kong as a class
34
society" (1982:31). According to Lee, this is due to the following changes during the
post-war period: (a) growing affluence since the 1970s, (b) internal fragmentation
of the major social classes in terms of income and other firm-specific conditions, (c)
the emergence of new social divisions according to residential communities,
consumption patterns, professional affiliations, and so on, (d) a trend for social
selection to become progressively more meritocratic, and hence for higher mobility
rates. With respect to the last point, Lee (1982:25-26) claims that,
family background, race, sex and other ascriptive factors are no longer as important as they were in the past, in deciding a person's achievement. Technical competence has become the central criterion for appointment and promotion in most industrial and administrative bureaucracies. Achievement in competitive examinations testifies in objective terms a person's ability and qualifies him for a job. In this way, the bureaucracies level off social differences and break down barriers to social mobility.
For Lee, the summary effect of these changes is that "the 1970s marked the end of
ideology in Hong Kong". Readers will recognize that this is a set of familiar
arguments about the fading away of social class. Similar arguments have sometimes
been found to be empirically wanting in other countries. Whether they are valid for
Hong Kong remains to be tested. For my present purpose, I am most interested in
the last claim on the trend for social selection to become progressively more
meritocratic and mobility rates to become higher.
In this regard, it should be noted that most Hong Kong people agree with Lee in that
they also see Hong Kong as an open, meritocratic society. Surveys of social attitudes
conducted since the 1970s have repeatedly reported that something between 60 to 80
percent of the respondents endorsing such views as, "that Hong Kong is truly a land
of opportunity and people get pretty much of what they deserve here", or "Hong
35
Kong offered opportunities for upward mobile common people". 1 In other words,
there is a general optimism about mobility chances, at least since the 1970s.
However, there are several reasons for treating these findings cautiously. First, many
of these surveys were about young people. Some of them were conducted in selected
localities. This opens up the question of how far they represented the opinion of
people of all ages across the whole territory.
Second, given Hong Kong's geographical proximity to mainland China, and the fact
that 36% of Hong Kong's population were born there (see Hong Kong 1991 census),
it is possible that many respondents were implicitly comparing these two societies
when questions about mobility chance or efficacy of individual effort were put to
them. Since there is little scope for career choice or job mobility in China (Walder
1986, Davis 1992), one may argue that the reported optimism simply means that most
Hong Kong people know that the formal freedom of choosing and leaving jobs that
they enjoy in Hong Kong does not exist in China. In this sense, personal effort or
merit does make a bigger difference in Hong Kong. My point is: perhaps Hong
Kong people do see themselves as living in an open society, but only by comparison
to their neighbours across the border. 2
'See Chaney and Podmore (1973), and Lau and Ho (1982). In a survey conducted in 1985, 88% of the respondents agreed that, "Hong Kong [is] a place full of developmental opportunities. Hence it is individual efforts that count in one's success or failure" (Lau and Kuan 1988:63-64). Similarly, in a 1986 survey, 84% of the respondents agreed that, "provided a person had the ability and worked hard, he should have the opportunity to improve his social and economic status" (Lau and Kuan 1988:64-67). In the same survey, 26% of the respondents considered themselves as belonging to the lower class, and 73% the middle class. At the same time, 44% of the respondents considered their fathers as belonging to the lower class and 49% to the middle class. In other words, by their own judgement, more people felt that they had achieved upward mobility than suffered downward mobility.
2This interpretation may explain the apparently contradictory finding that when respondents were asked in more concrete terms about their own mobility prospects, they were much less optimistic. For example, over 70% of the respondents in the 1990 Hong Kong Social Indicators Survey said that they had little or no chance of
36
Third, can we assume that the same optimism existed in the 1950s and 1960s?
Empirical evidences from this period are very sketchy. Nonetheless, a survey of the
background, aspirations and performance of form 5 students done in 1967 suggests
that although H [an] emotional commitment to success is distributed widely throughout
the class structure" (Mitchell 1969:76), many students believed that they had little
chance to succeed in Hong Kong.
they feel Hong Kong is a closed society that provides very little opportunity for people like themselves. Most pupils have a very pessimistic view of Hong Kong, as seen in responses to the question: "How much opportunity is there in Hong Kong for you to be a success in your career?" Only five per cent feel there is "a great deal" of opportunity, 15 per cent feel there is "quite a bit," 69 per cent say "some, but not too much," and 12 per cent say there is "very little or none". (Mitchell 1969:82, emphasis added)
The picture painted by Mitchell is a far cry from the more recent surveys cited above.
Some corroborative but indirect evidence for Mitchell's finding can be found in the
commentaries on a youth riot in 1966. 3 The Commissioners of Inquiry for the
incident stated in their report that they "do not believe that political, economic and
social frustrations were the direct causes of the 1966 riots". But they noted that the
rioters were overwhelmingly young, poorly-educated, poorly-paid, inadequately-
housed and over-worked males, and the "comments of some social scientists stressed
a growing awareness amongst young people of the social and economic conditions in
Hong Kong and a growing sense of frustration at their limited chances in life and the
apparently wide gap between their aspirations and their achievement" (1966:147-148).
A recent commentator also concurs with this view. He thinks that the riot was
getting a better job (see Wong 1992:168).
3There was a riot in early April 1966 which lasted for five days and caused some casualties and quite substantial monetary loss. The Commissioners of Inquiry for the incident subsequently produced a lengthy report, which contains extensive discussion on the social and economic conditions of the rioters, as well as those of young people of Hong Kong in general, see "Kowloon disturbances, 1966: Report of Commission of Inquiry".
37
developed from these conditions,
The economic, political and social structure of colonial Hong Kong had produced a grey industrial world in which sixty- to seventy-hour working week, often in unsafe and unhealthy conditions, over crowding and limited prospects of upward mobility were the norms for young males. They did not have the optimism about their economic future or even the cultural values which had carried their fathers through the difficult years of the 1940s and 1950s. (Scott 1989:89, emphasis added)
On the whole, the evidence we saw suggest that the often reported (and celebrated)
optimism needs to be qualified: it is a relatively recent phenomenon (which may
reflect real changes in the opportunity structure), and its contextual meaning has to
be taken more carefully. But having made these qualifications, one will have to agree
that most Hong Kong people are optimistic about their mobility chances. What can
we make of this popular optimism? Since the present study is concerned with actual
instances of mobility, one may argue that subjective perception of mobility prospects
is only of secondary relevance. However, as Parkin put it, "optimistic attitudes
concerning mobility chances cannot be sustained in the face of continuously
disaffirming evidence" (1972:156). Thus, given the "consistent" optimism on the
part of the general public (since the 1970s), and the following features of Hong Kong
society (in short, its demographic fluidity, economic dynamism, and the prevalence
of small firms), there is good ground to argue that social mobility rates, at least in
the absolute sense, are indeed quite high in Hong Kong.
Population and immigration
Hong Kong is an immigrant society. The first post-war census reported that in 1961
slightly less than half (48%) of the population were born locally. This figure rose to
60% in 1991. Not surprisingly, over 90% of the immigrants came from mainland
China. Although there is little systematic data on their class origin, it should be safe
to assume that many of them had experienced drastic occupational change and thus
38
class mobility. For example, if the immigrants were predominantly of rural origin,
the shift from farming to industrial labour is, by definition, a form of class mobility.
Given the obvious connection between immigration and class mobility, let us consider
Hong Kong's immigration history briefly.
Table 2.1 shows the number of immigrants from mainland China between 1946 and
1989. The only systematic study on the background and condition of the immigrants
was a survey conducted in 1954 by Hambro on behalf of the United Nations High
Commissioner for Refugees. Hambro reported that "the majority [of the refugees]
come from urban, non-manual occupations, with an education level far above the
standard of the Chinese population in general" (1955:63). This is contrary to what
I have expected, namely that most immigrants were from the countryside.
Nonetheless, as can be seen from Table 2.2, while one-tenth of the immigrants were
previously farmers or fishermen, less than 2% of them stayed in farming or fishing
after their arrival in Hong Kong, so, in terms of worklife movement, there was
indeed an outflow from primary production to industrial occupations. More
generally, Hambro (1955:45) observed the following,
[there is a] considerable shift of occupations amongst immigrants after their arrival in Hong Kong. The general features of this shift are: (i) An almost complete reorientation of farmers, mainly towards other manual occupations; (ii) A considerable increase in the proportion of manual occupations; (iii) A considerable reduction in the proportion of higher occupations; (iv) A hugh rise in the proportion of the unemployed.
He also estimated that, in terms of occupation and social status, about two-thirds of
the refugees had experienced downward mobility (Hambro 1955:64). Regarding the
immigrants who came to Hong Kong after 1954,1 can only speculate on their social
origin from smaller surveys and journalistic accounts. My impression is that while
there were more peasants among the post-1954 immigrants, a sizable group of them
39
had at least some industrial experience. 4
Immigration also affects mobility rates indirectly. For example, the emigre capitalists
from Shanghai played a key role in building up Hong Kong's textile industries during
the 1950s (Wong 1988). At the same time, the constant influx of labour had kept
wages down. Both factors contributed to Hong Kong's export-oriented
industrialization. Economic growth has, in turn, induced changes in the occupational
and class structure, which led to more structural mobility. The causal chain between
migration, economic growth, changes in the occupational structure, and mobility rates
is long and intricate. So I will not make further speculation here. 5 Suffice it to say
that immigration from China is an important source of structural mobility in Hong
Kong.
Economic shifts
A second factor that may heighten mobility rates is Hong Kong's economic
dynamism. Before the Second World War, Hong Kong thrived on commerce and
entrepot trade. In 1931, manufacturing employed about one-fifth of the working
population (see Table 2.3); and most of the pre-war industries, such as ship-building,
ship-repairing and rope-making, were developed around port activities. The economy
was severely disrupted by the Japanese occupation. But after the War, the entrepot
4Referring to a survey conducted by a welfare agency, Siu suggests that, "85 percent of the recent immigrants are between the ages of 15 and 30, predominantly male. Seventy-nine percent are of rural origin" (1986:2, emphasis added). On the other hand, a report on the wave of refugee-influx in 1962 claims that, "[there] are some grounds for thinking that the Canton workers who were being sent back to the countryside were so discontented that the authorities want them out of the city at any price, even that of letting them out of the country; in order to avoid an explosion in the city they were helped on their way to Hongkong" (Far Eastern Economic Review. 7 June 1962, p.498, emphasis added).
5See Hout and Jackson (1986) for a discussion of the relationship between emigration, aggregated demand of the economy, and unemployment.
40
trade recovered rapidly. However, the communist revolution in mainland China in
1949, and the subsequent United Nations embargo against China (as a result of the
Korean War) brought the trade to a sudden halt. The loss of this traditional source
of income forced Hong Kong to switch to manufacturing in the early 1950s.
Because of the inflow of capital, labour and industrial expertise from China, the
liberalization of world trade, and other trading advantages gained through Hong
Kong's British connection (e.g. the Commonwealth Preferential Tariff System), Hong
Kong's export-oriented industrialization soon gathered momentum. In 1961, 43% of
the working population were employed in manufacturing. By 1971, this figure rose
to 47%. But since the late 1970s, consequent on changes such as growing
protectionism from Europe and the United States, competition from other countries
with even cheaper labour cost, Hong Kong has experienced yet another wave of
economic restructuring (Lui and Chiu 1993). This time the change is towards
finance, commerce and service, and away from manufacturing. By 1991,
manufacturing accounted for only 28% of the working population.
The post-war economic history of Hong Kong deserves a more detailed treatment.
But it will serve our purpose to note simply that the transitions outlined above took
place in a very short period of time. The economy of Hong Kong is truly in a state
of flux over the past 40 years. Such economic dynamism provides, in a modified
sense, an "open frontier" for the people of Hong Kong.6 As firms, branches of
industry, even the whole manufacturing sector, come in and fade out in quick
succession, one possible scenario is that people in previously booming sectors may
6Although I have discussed Hong Kong's economic dynamism in term of the overall shift from manufacturing to the service sector, the same argument also applies to shifts between individual branches of industry (e.g. the short-lived wig and denim booms in the 1960s and the 1970s respectively).
41
quickly lose their advantaged positions, while those of humble origins are able to
exploit new business niches or employment opportunities in growing sectors. In other
words, rapid economic shifts may lead to more rapid circulation of people between
social classes, i.e. higher (relative) mobility rates. (Alternatively, the old privileged
classes may keep their economic and social advantages by transferring their resources
to the new sectors. For example, a textile manufacturer may pull down his factory
building and become a property developer. Which of these two scenarios is true is
an empirical question.)
The prevalence of small firms
The factories of Hong Kong are distinctly small in size. In 1986, 99% of all
industrial establishments belonged to the small or small-medium sectors (defined as
factories employing 0-49 and 50-199 people respectively). Together, these two
sectors accounted for almost three quarters (73%) of all manufacturing workers, and
each of them contributed to about a third of the gross output (Sit and Wong 1989:25-
27). One can argue that the prevalence of small firms also facilitates social mobility.
Some preliminary evidence for this claim can be found in a survey done by Sit and
Wong (1989) on the proprietors of Hong Kong's small/small-medium factories. The
survey shows that close to two-thirds (64%) of the industrial entrepreneurs were born
in mainland China. In terms of class origin (see Table 2.4), about a third (35%) of
them came from "merchant" families,7 one-fifth were of peasant origin, a quarter
came from the working class (i.e. father being artisan/skilled worker or manual
worker), and less than 5% were of "industrialist" background. The last figure leads
7The precise meaning of the term "merchant" is unclear. In the context of the local usage of the term, it can refer to owners of trading firms, shop-keepers, pedlars, in fact, most self-employed persons.
42
Sit and Wong to suggest that, "the small industrial sector is a very competitive arena
and it is difficult for entrepreneurial families to maintain vocational continuity in this
sphere" (1989:93).
Sit and Wong (1989:69-71) also report that most of their respondents became factory
owners when they were still quite young: 44% of them were in their thirties, 25%
were even younger; and 80% of them had held only one previous job. Not
surprisingly, most (close to 80%) of those with prior work experience were employed
in manufacturing. This is important because the majority of the entrepreneurs were
not particularly well qualified, and they had to pick up technical and managerial skills
through work experience (Sit and Wong 1989:100-102). From Table 2.5, it can be
seen that close to 60% of the entrepreneurs started their worklife on the factory shop-
floor as operatives, about one-fifth were clerks or executives, while those who began
their career as managers or minor shareholders constituted only a very small minority
(Sit and Wong 1989:102-108).
To launch their business, almost all of the surveyed entrepreneurs had to rely on their
own funds; less than 1% of them were able to obtain loans from banks. This
certainly limited the size of their investment and the scale of their operation (hence
the small size of the average Hong Kong factory). But as Sit and Wong put it, "it
does prove that small businesses function as easy entry points for people with the
desire and ambition to run their own show and be manufacturers" (1989:147).
Putting these observations together, they (1989:104) suggest that going into small
scale manufacturing is a typical mobility path for people coming from disadvantaged
background.
The typical pattern for about 80% of the entrepreneurs is that they worked in one job, accumulating capital and kjiow-how, before becoming employers ... our respondents usually have few career
43
options open to them at first so that they tend to take up a job which they regard as below their worth ... the entrepreneurs tend to secure their employment mostly in the industrial sphere where educational qualifications are not particularly important. As a result, they gain industrial experience which later facilitate their transition into entrepreneurial role.
It should be noted that many of the self-made entrepreneurs surveyed by Sit and
Wong belonged to class IVab rather than class I+11 of the CASMIN schema.
However, the movement from, say, class Vila to class IVab is still a significant one,
and perhaps class IVab functions as a stepping stone for subsequent movement into
the service class. As Szczepanik (1958:21-22) observes,
Most Hong Kong firms, both commercial and industrial, started as modest ventures of single proprietors, gradually changing into a partnership and sometimes into a private company ... thus the original capital normally has to be provided from the founder's past personal savings, supplemented perhaps by a loan from friends and relatives. The expansion of the firm depended subsequently on the volume of profits ploughed back and on the credits provided by banks, wholesalers, docks, and godowns.
Of course, a small factory may go bankrupt instead of grow into a larger concern.
This is an empirical issue which I will return to in Chapters 3 and 4. For the
moment, let me simply note that the prevalence of small firms may also facilitate
social mobility.
Counter-evidence?
Having considered three factors that may lead us to expect Hong Kong to have
relatively high mobility rates, I will now examine some counter arguments. Two
recent papers on social mobility in Hong Kong are particularly relevant. The first
paper is by Tsang (1992). From a 5% sample of the 1981 census, he selects all
households in which (a) there were at least two generations -- a father and at least a
child, (b) both father and child were economically active, and (c) the child was
between the age of 15 and 27. The current occupations of the father and the child
44
were then taken as the child's origin and destination respectively. The mobility table
constructed in this manner contains 19,375 cases (10,440 of which refer to father-son
data, 8,935 were father-daughter data). 8 For his class schema, Tsang adopts the
eightfold occupational classification of the 1981 census. He has made some
distinctions within certain groups so that there are 14 categories in the full version of
his schema;9 this 14-category schema can be collapsed to a 10-category version and
a 5-category version (see Table 2.6).
Having constructed the mobility tables, Tsang fits a perfect mobility model (i.e.
independence model) and a quasi-perfect mobility model (quasi-independence model)
to them. 10 Not surprisingly, they do not fit any of the three tables satisfactorily by
conventional standard of goodness of fit. But by inspecting the residuals of the (non-
fitting) perfect mobility model, Tsang makes the following inferences about Hong
Kong's mobility pattern. From the residuals of 14 x 14 table, he argues that the
tendency for immobility is strongest for the two classes of "hawkers" and
8It should be noted at the outset that Tsang's analysis pertains to occupational mobility in early worklife. If it is true that (a) most people achieve occupational maturity in their mid-thirties, and (b) that the general direction of career mobility is from less advantaged positions to more advantaged ones, then Tsang should have underestimated the extent of upward mobility. He should also have missed some counter-mobility to higher socioeconomic positions in later career, and thus overestimated the degree of downward mobility.
*These distinctions are: (a) employers and non-employers are separated for both the "Professional, Technical & related workers" and "Administrative and Managerial worker"; (b) "supervisors and foremen" originally grouped in sales, service, and manufacturing sectors now form a group of their own; (c) "Hawkers" and "Domestic Helpers" are separated from "Sales workers" and "Service workers" respectively; (d) manufacturing workers are divided, according to skill levels, into "Operative workers", "Technicians and Craftsmen", and "Manufacturing Laborers". See Tsang (1992:52-57) for elaboration of the recoding.
10In the case of the 5 x 5 table, Tsang also tests a Revised Quasi-Perfect Mobility Model in which not only the diagonals cells but also the cells representing exchanges between Classes 1 and 2 (see the five class version of his schema in Table 2.6) are blocked out.
45
"agricultural workers and fishfolks", and that mobility crossing the manual/non-
manual boundary is rare (1992:60-66). From the 10 x 10 table, he claims that, "the
phenomenon of class inheritance is much more likely to happen at the two extremes
of the hierarchy" (1992:71). From the residuals of the 5 x 5 table, he suggests that,
"there are relatively greater opportunities for inter-class mobility between professional
and managerial classes and the routine non-manual workers" (1992:74-75). Given
these findings, Tsang suggests that, "four definite closures of mobility opportunities
prevail, showing that four social classes exist in the social structure of Hong Kong"
(1992:81), namely non-manual, skilled manual, semi-skilled manual, and unskilled
manual.
Generally speaking, Tsang's findings ~ principally that (a) the tendency for
immobility is stronger at the two ends of the occupational hierarchy, and (b) that
there is more short-range mobility within the manual or non-manual class than long-
range mobility that crosses the manual/non-manual boundary - are consistent with
results obtained in other mobility studies (e.g. Hout 1983). However, it has to be
said that they are based on data of quite doubtful quality, and somewhat unsatisfactory
analyses.
Let me elaborate my misgivings. I believe that census data are unsuitable for
mobility studies. To see this, readers should note that (at least in Hong Kong) census
data are collected by living quarters, not families. In other words, there are
occupational (and other) data of those family members who live together in the same
dwelling, but those who did not live with their father at the time of the 1981 census
had no chance of appearing in Tsang's mobility tables at all. The crucial question is
whether there is a systematic relationship between intergenerational cohabitation and
social class. If so, Tsang would have introduced serious bias into his study.
46
Tsang is well aware of this problem. In defense of his data, he compares the 5%
sample he uses for constructing the mobility tables with a separate 20% sample of the
same census. He finds that there is relatively little difference between the two
samples in terms of average educational attainment, monthly income, and
socioeconomic status. 11 Moreover, the differences that exist are not in the same
direction. On the ground of these findings, he argues that the 5% sample contains
"no apparent bias in market and class situations" (1992:29). This line of defense is,
however, inadequate because income and education are incomplete measures of
market and class situations. Other factors such as job security, promotion prospects,
and the degree of autonomy that one enjoys and the authority that one exercises at
work, etc. are equally important in determining class position. Thus, the question of
bias remains unanswered. 12
My second misgiving concerns Tsang's substantive claim. It seems that he only seeks
to show that there is no such thing as perfect mobility in Hong Kong. As noted
above, he fits a perfect mobility model and a quasi-perfect mobility model to his data.
When it turns out that they do not fit the data satisfactorily, he (1992:84) concludes
that,
Hong Kong, in an absolute sense, is not an open society. That is because within her social structure, there prevails a number of "lines of social cleavage" along which class inheritance and monopolization of social mobility opportunities are constituted and maintained.
nThis is a composite index Tsang constructs on the base of education attainment and income.
12However, since income and education are indeed the principal components for socioeconomic indices, Tsang's argument stands stronger for the status attainment analysis that he undertakes in a separate paper (Tsang 1993). In that case, I would like to see further comparison between the two samples across a whole range of measures of central tendency and variability of income and education than just their arithmetic means.
47
This is certainly true, but rather uninformatively so. In fact, one would be very
surprised if there is perfect mobility in Hong Kong, or that social origin and other
ascriptive factors no longer play any role in the social allocation process. What is of
interest is a detailed description of the pattern of unequal mobility chances in Hong
Kong (which Tsang has to some extent done, though on the basis of a non-fitting
model). I would also like to know whether this pattern is changing over time, and
how does it differ from the patterns of other countries. Tsang is also aware of this
criticism. However, it is difficult for him to ask comparative questions. To start
with, there is no comparable time series of mobility data in Hong Kong, and the fact
that his respondents are all young people, aged between 15 and 27, makes it
impracticable for him to split his sample into smaller age cohorts to study mobility
trends. 13
As for cross-national comparison, Tsang takes a theoretical decision to rule out such
attempt. Much in the line of Burawoy's (1976) criticism of the comparative status
attainment research of Treiman and Terrel (1975), he argues (1992:86) that,
most of the mobility studies in Western societies are neither culturally nor historically comparable to this study, which is based on the social structure of an oriental city still under British colonial rule in the early 1980s. As for our neighbouring countries, such as the three other Newly Industrialized Economies in East Asia, namely Singapore, Taiwan and South Korea, we still find that their social structure are not comparable to the uniqueness of that of Hong Kong. On the one hand, the occupational structures of both Taiwan and South Korea in which a large proportion of their incumbents engages in agricultural production are apparently not comparable to that of Hong Kong whose incumbents are mainly employed in manufacturing and servicing industries. On the other hand, the major difference between the social structures of Hong Kong and Singapore is their ethnic compositions. Singapore is a multi-racial and multi-cultural society, while Hong Kong is inhabited by a population of which the majority is Chinese. Taken together, if we are to make any comparison of the social
l3But there are other analyses which are straightforward to carry out, and will be of interest to mobility researchers, such as a comparison of the father-son and the father-daughter mobility tables.
48
mobility processes among these societies, we must deal with the aforementioned structural differences sensibly and not to homogenize their heterogeneity.
This is an exceptionalist argument by fiat. Hong Kong is said to be unique, and thus
incomparable to, apparently all countries, East or West. I will not repeat Treiman's
(1976) rejoinder to Burawoy here. Suffice it to say that insofar as we can agree that
Hong Kong shares some generic features with Britain, Japan or Singapore (e.g. all
being industrial societies), the question of whether Hong Kong is really so unique is
a matter for empirical examination. Thus, it would be interesting to see whether, and
if so, how the small size of Hong Kong's primary sector or its ethnic homogeneity
affects its mobility pattern. I will take up the task of cross-national comparison in
Chapter 3. Let me turn to the second mobility paper.
Wong and Lui (1992b) have analyzed the data of the 1989 Hong Kong Social
Mobility Survey, and they report the following findings. First, the class structure of
Hong Kong has undergone significant changes over time, including a big expansion
of the service class and a sharp contraction of the petty bourgeoisie (1992b:42-47).14
Second, the absolute mobility rates of Hong Kong are quite high. For example, in
terms of inflow rates, "about 60% of class I are upwardly mobile newcomers, with
no hitherto non-manual background or experience ... [as for] the unskilled working
class ... more than one-third of its membership came from people with petty
bourgeois background ... as for the inflow into petty bourgeoisie, nearly 40% was
from the three blue-collar classes" (1992b:50). On the whole, their judgement is that,
there has been a remarkable increase of opportunities, if the expansion of the "room at the top" [i.e. the service class] is anything to go by. And the society is, based on the absolute mobility rates ... open and mobile. (1992b:48)
l4Wong and Lui (1992a, 1992b) adopt the sevenfold class schema of the Oxford Mobility Study (see Goldthorpe 1987).
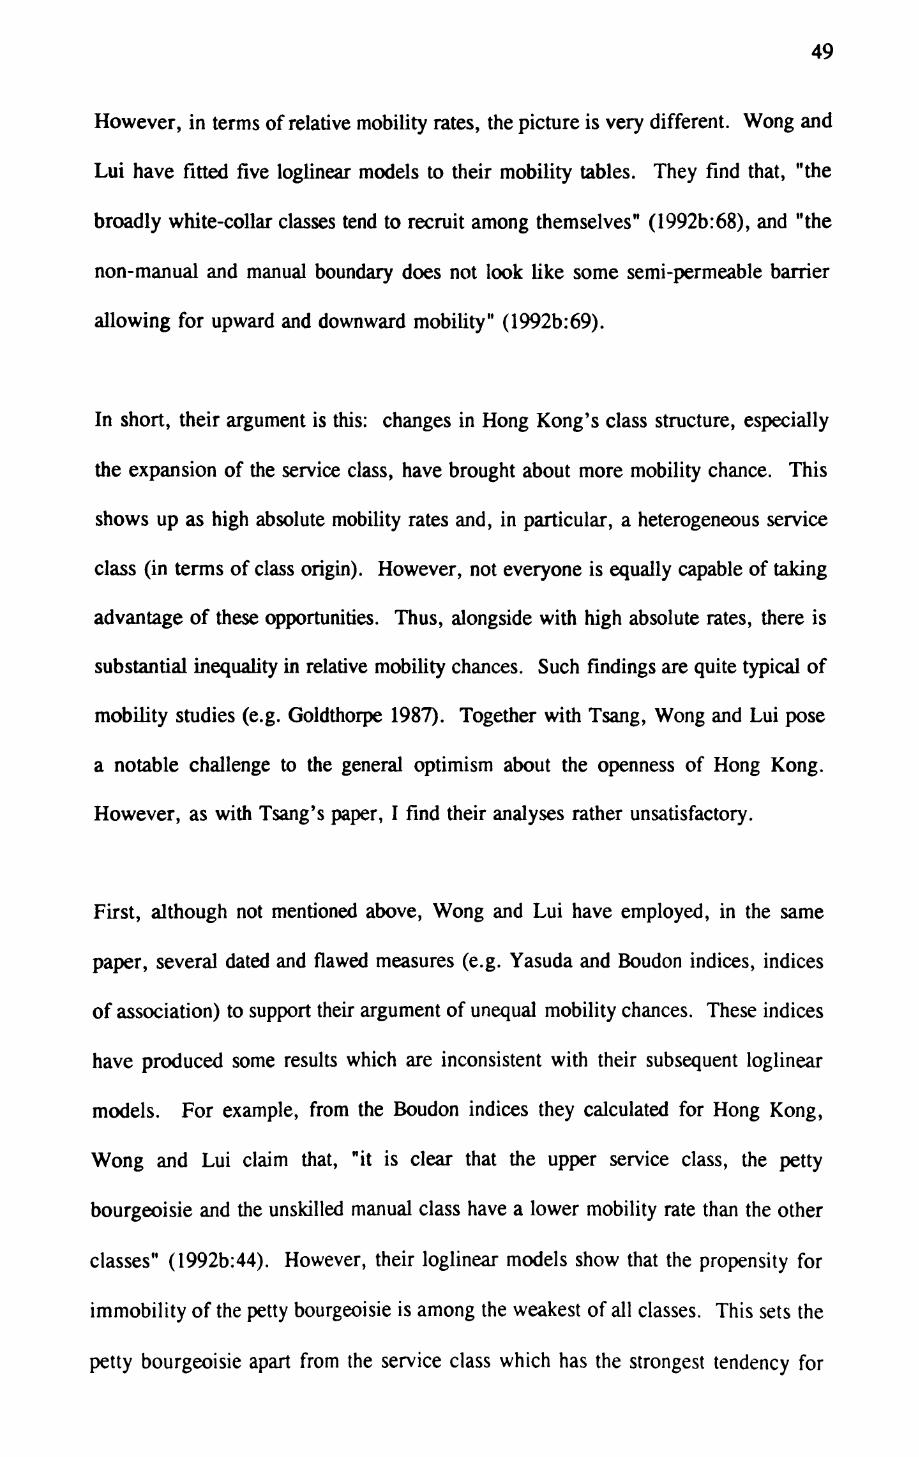
49
However, in terms of relative mobility rates, the picture is very different. Wong and
Lui have fitted five loglinear models to their mobility tables. They find that, "the
broadly white-collar classes tend to recruit among themselves" (1992b:68), and "the
non-manual and manual boundary does not look like some semi-permeable barrier
allowing for upward and downward mobility" (1992b:69).
In short, their argument is this: changes in Hong Kong's class structure, especially
the expansion of the service class, have brought about more mobility chance. This
shows up as high absolute mobility rates and, in particular, a heterogeneous service
class (in terms of class origin). However, not everyone is equally capable of taking
advantage of these opportunities. Thus, alongside with high absolute rates, there is
substantial inequality in relative mobility chances. Such findings are quite typical of
mobility studies (e.g. Goldthorpe 1987). Together with Tsang, Wong and Lui pose
a notable challenge to the general optimism about the openness of Hong Kong.
However, as with Tsang's paper, I find their analyses rather unsatisfactory.
First, although not mentioned above, Wong and Lui have employed, in the same
paper, several dated and flawed measures (e.g. Yasuda and Boudon indices, indices
of association) to support their argument of unequal mobility chances. These indices
have produced some results which are inconsistent with their subsequent loglinear
models. For example, from the Boudon indices they calculated for Hong Kong,
Wong and Lui claim that, "it is clear that the upper service class, the petty
bourgeoisie and the unskilled manual class have a lower mobility rate than the other
classes" (1992b:44). However, their loglinear models show that the propensity for
immobility of the petty bourgeoisie is among the weakest of all classes. This sets the
petty bourgeoisie apart from the service class which has the strongest tendency for
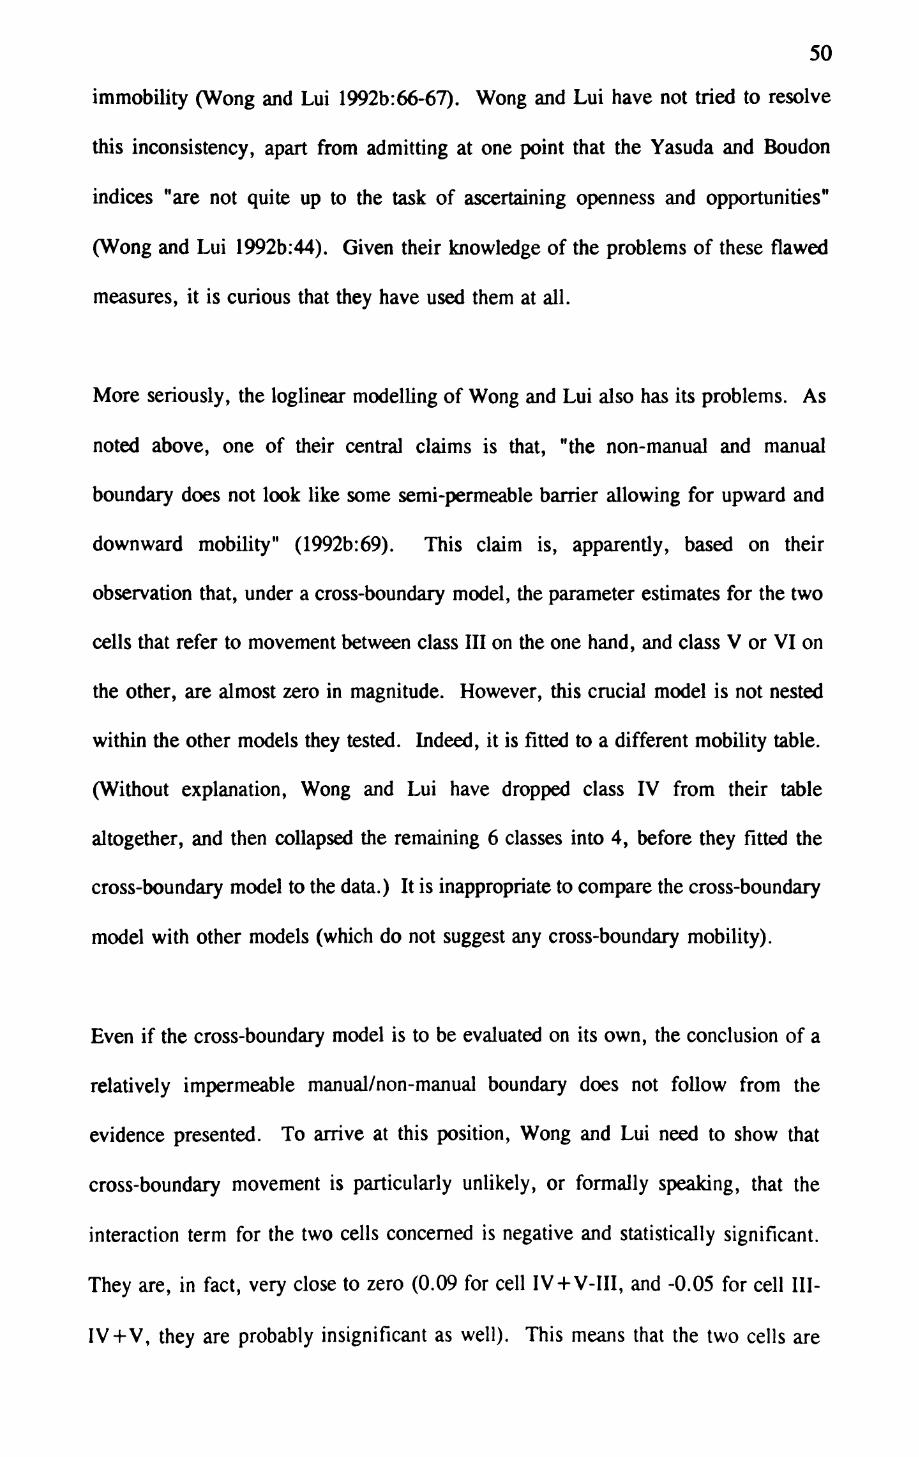
50
immobility (Wong and Lui 1992b: 66-67). Wong and Lui have not tried to resolve
this inconsistency, apart from admitting at one point that the Yasuda and Boudon
indices "are not quite up to the task of ascertaining openness and opportunities"
(Wong and Lui 1992b:44). Given their knowledge of the problems of these flawed
measures, it is curious that they have used them at all.
More seriously, the loglinear modelling of Wong and Lui also has its problems. As
noted above, one of their central claims is that, "the non-manual and manual
boundary does not look like some semi-permeable barrier allowing for upward and
downward mobility" (1992b:69). This claim is, apparently, based on their
observation that, under a cross-boundary model, the parameter estimates for the two
cells that refer to movement between class III on the one hand, and class V or VI on
the other, are almost zero in magnitude. However, this crucial model is not nested
within the other models they tested. Indeed, it is fitted to a different mobility table.
(Without explanation, Wong and Lui have dropped class IV from their table
altogether, and then collapsed the remaining 6 classes into 4, before they fitted the
cross-boundary model to the data.) It is inappropriate to compare the cross-boundary
model with other models (which do not suggest any cross-boundary mobility).
Even if the cross-boundary model is to be evaluated on its own, the conclusion of a
relatively impermeable manual/non-manual boundary does not follow from the
evidence presented. To arrive at this position, Wong and Lui need to show that
cross-boundary movement is particularly unlikely, or formally speaking, that the
interaction term for the two cells concerned is negative and statistically significant.
They are, in fact, very close to zero (0.09 for cell IV + V-III, and -0.05 for cell III-
IV+V, they are probably insignificant as well). This means that the two cells are
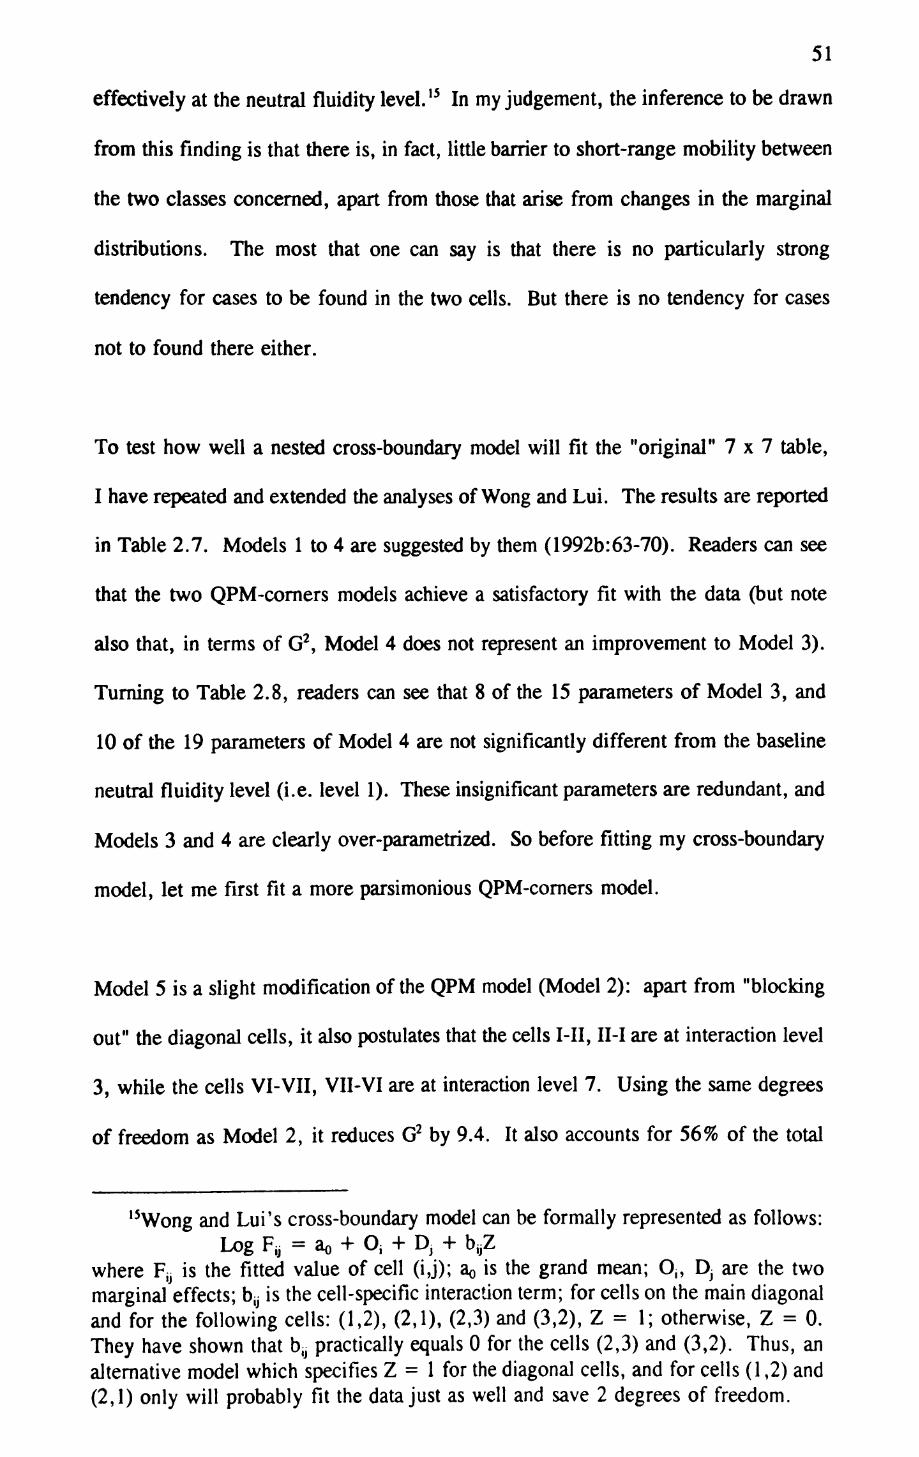
51
effectively at the neutral fluidity level. 15 In my judgement, the inference to be drawn
from this finding is that there is, in fact, little barrier to short-range mobility between
the two classes concerned, apart from those that arise from changes in the marginal
distributions. The most that one can say is that there is no particularly strong
tendency for cases to be found in the two cells. But there is no tendency for cases
not to found there either.
To test how well a nested cross-boundary model will fit the "original" 7x7 table,
I have repeated and extended the analyses of Wong and Lui. The results are reported
in Table 2.7. Models 1 to 4 are suggested by them (1992b:63-70). Readers can see
that the two QPM-corners models achieve a satisfactory fit with the data (but note
also that, in terms of G2 , Model 4 does not represent an improvement to Model 3).
Turning to Table 2.8, readers can see that 8 of the 15 parameters of Model 3, and
10 of the 19 parameters of Model 4 are not significantly different from the baseline
neutral fluidity level (i.e. level 1). These insignificant parameters are redundant, and
Models 3 and 4 are clearly over-parametrized. So before fitting my cross-boundary
model, let me first fit a more parsimonious QPM-corners model.
Model 5 is a slight modification of the QPM model (Model 2): apart from "blocking
out" the diagonal cells, it also postulates that the cells I-II, II-I are at interaction level
3, while the cells VI-VII, VII-VI are at interaction level 7. Using the same degrees
of freedom as Model 2, it reduces G2 by 9.4. It also accounts for 56% of the total
15Wong and Lui's cross-boundary model can be formally represented as follows:Log Fs = ao + Oi + D, + b,,Z
where F^ is the fitted value of cell (i,j); ao is the grand mean; Oj, Dj are the two marginal effects; b^ is the cell-specific interaction term; for cells on the main diagonal and for the following cells: (1,2), (2,1), (2,3) and (3,2), Z = 1; otherwise, Z = 0. They have shown that b^ practically equals 0 for the cells (2,3) and (3,2). Thus, an alternative model which specifies Z = 1 for the diagonal cells, and for cells (1,2) and (2,1) only will probably fit the data just as well and save 2 degrees of freedom.
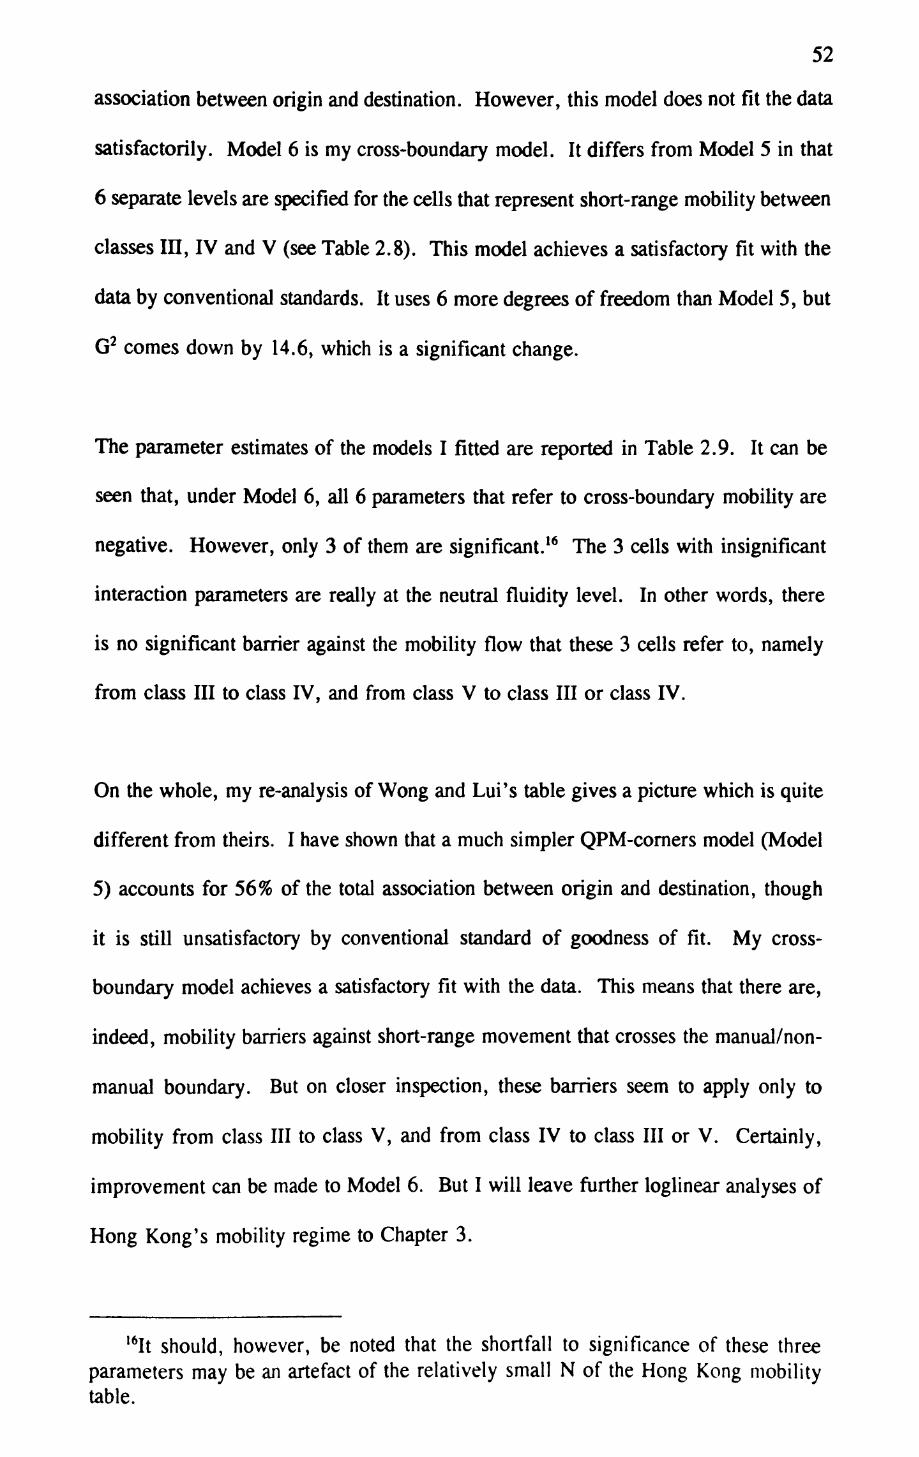
52
association between origin and destination. However, this model does not fit the data
satisfactorily. Model 6 is my cross-boundary model. It differs from Model 5 in that
6 separate levels are specified for the cells that represent short-range mobility between
classes III, IV and V (see Table 2.8). This model achieves a satisfactory fit with the
data by conventional standards. It uses 6 more degrees of freedom than Model 5, but
G2 comes down by 14.6, which is a significant change.
The parameter estimates of the models I fitted are reported in Table 2.9. It can be
seen that, under Model 6, all 6 parameters that refer to cross-boundary mobility are
negative. However, only 3 of them are significant. 16 The 3 cells with insignificant
interaction parameters are really at the neutral fluidity level. In other words, there
is no significant barrier against the mobility flow that these 3 cells refer to, namely
from class III to class IV, and from class V to class III or class IV.
On the whole, my re-analysis of Wong and Lui's table gives a picture which is quite
different from theirs. I have shown that a much simpler QPM-corners model (Model
5) accounts for 56% of the total association between origin and destination, though
it is still unsatisfactory by conventional standard of goodness of fit. My cross-
boundary model achieves a satisfactory fit with the data. This means that there are,
indeed, mobility barriers against short-range movement that crosses the manual/non-
manual boundary. But on closer inspection, these barriers seem to apply only to
mobility from class III to class V, and from class IV to class III or V. Certainly,
improvement can be made to Model 6. But I will leave further loglinear analyses of
Hong Kong's mobility regime to Chapter 3.
I6It should, however, be noted that the shortfall to significance of these three parameters may be an artefact of the relatively small N of the Hong Kong mobility table.
53
Chapter summary
In this chapter, I have argued that given the demographic fluidity, the economic
dynamism and the prevalence of small firms in Hong Kong, there are some ground
to think that mobility rates, at least in the absolute sense, are quite high in Hong
Kong. Also, most Hong Kong people are optimistic about their mobility chances (at
least since the 1970s). This optimism calls for empirical verification. Two attempts
have been made recently to assess Hong Kong's mobility regime, though, in my
judgement, they are both unsatisfactory. So much work remains to be done. Having
cleared the ground for my analyses, I will turn to a comparative analysis of the
mobility pattern in Hong Kong.
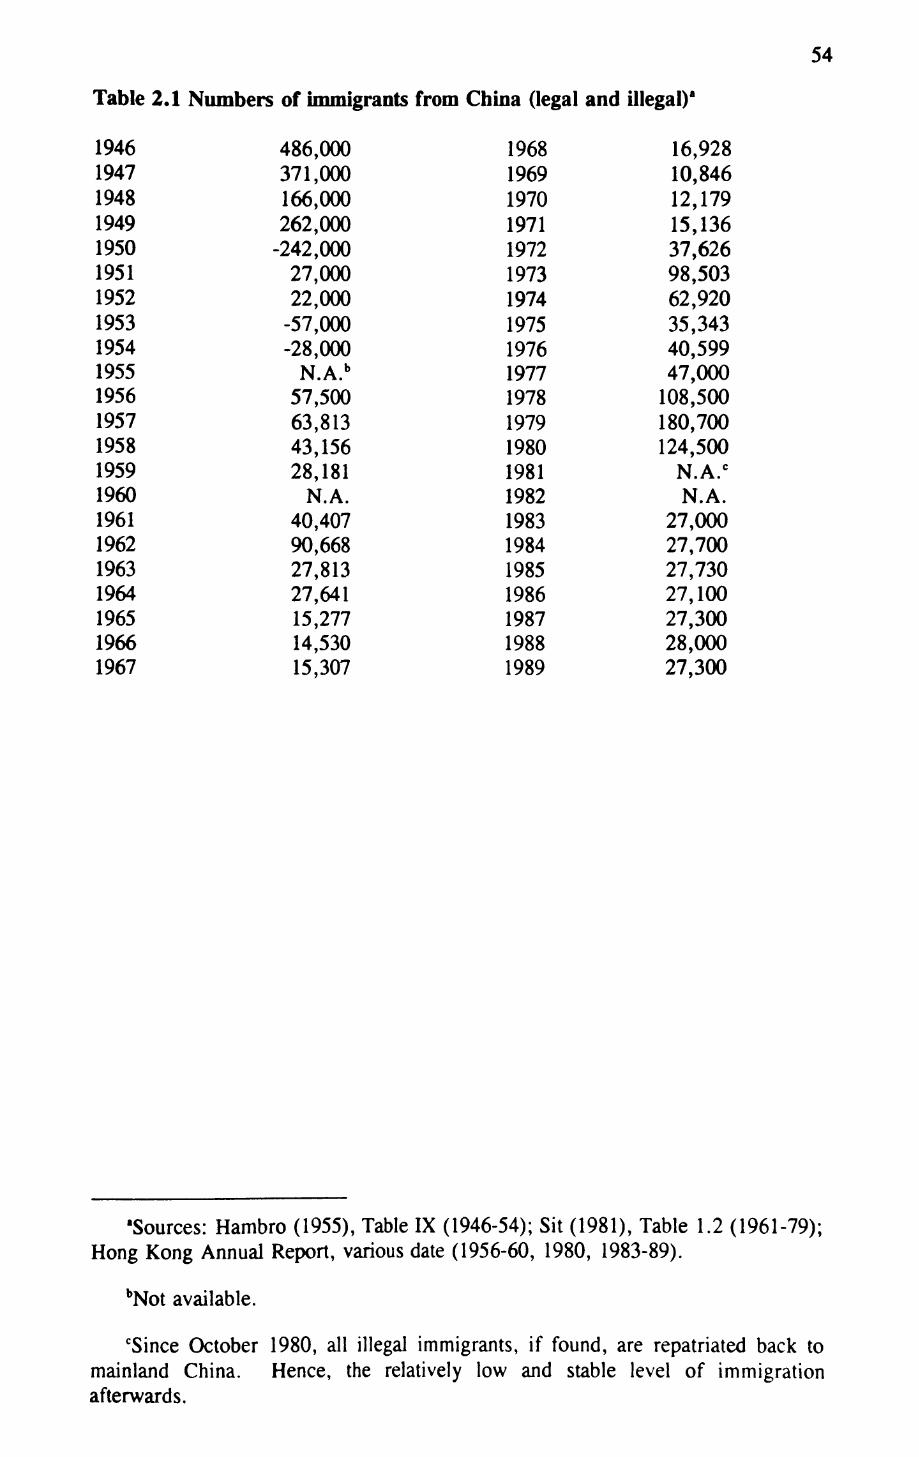
54
Table 2.1 Numbers of immigrants from China (legal and illegal)"
1946 486,000 1968 16,9281947 371,000 1969 10,8461948 166,000 1970 12,1791949 262,000 1971 15,1361950 -242,000 1972 37,6261951 27,000 1973 98,5031952 22,000 1974 62,9201953 -57,000 1975 35,3431954 -28,000 1976 40,5991955 N.A. b 1977 47,0001956 57,500 1978 108,5001957 63,813 1979 180,7001958 43,156 1980 124,5001959 28,181 1981 N.A. C1960 N.A. 1982 N.A.1961 40,407 1983 27,0001962 90,668 1984 27,7001963 27,813 1985 27,7301964 27,641 1986 27,1001965 15,277 1987 27,3001966 14,530 1988 28,0001967 15,307 1989 27,300
Sources: Hambro (1955), Table IX (1946-54); Sit (1981), Table 1.2 (1961-79); Hong Kong Annual Report, various date (1956-60, 1980, 1983-89).
bNot available.
"Since October 1980, all illegal immigrants, if found, are repatriated back to mainland China. Hence, the relatively low and stable level of immigration afterwards.
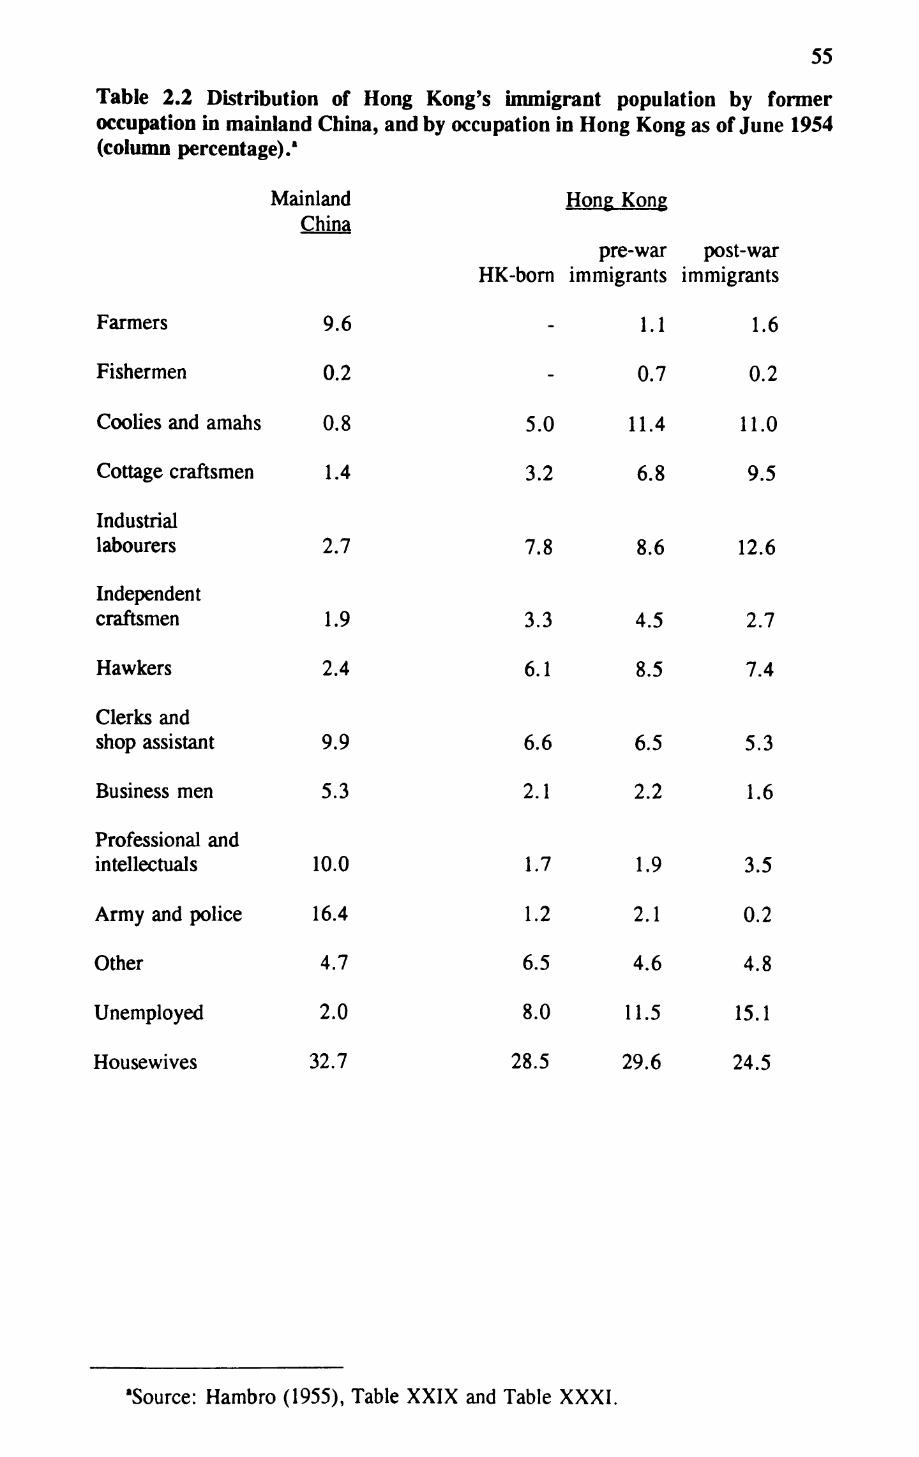
55
Table 2.2 Distribution of Hong Kong's immigrant population by former occupation in mainland China, and by occupation in Hong Kong as of June 1954 (column percentage)/
Mainland China
Farmers 9.6
Fishermen 0.2
Coolies and amahs 0.8
Cottage craftsmen 1.4
Industriallabourers 2.7
Independentcraftsmen 1.9
Hawkers 2.4
Clerks andshop assistant 9.9
Business men 5.3
Professional and intellectuals 10.0
Army and police 16.4
Other 4.7
Unemployed 2.0
Housewives 32.7
Hong Kong
pre-war post-war HK-born immigrants immigrants
-
-
5.0
3.2
7.8
3.3
6.1
6.6
2.1
1.7
1.2
6.5
8.0
28.5
1.1
0.7
11.4
6.8
8.6
4.5
8.5
6.5
2.2
1.9
2.1
4.6
11.5
29.6
1.6
0.2
11.0
9.5
12.6
2.7
7.4
5.3
1.6
3.5
0.2
4.8
15.1
24.5
Source: Hambro (1955), Table XXIX and Table XXXI.
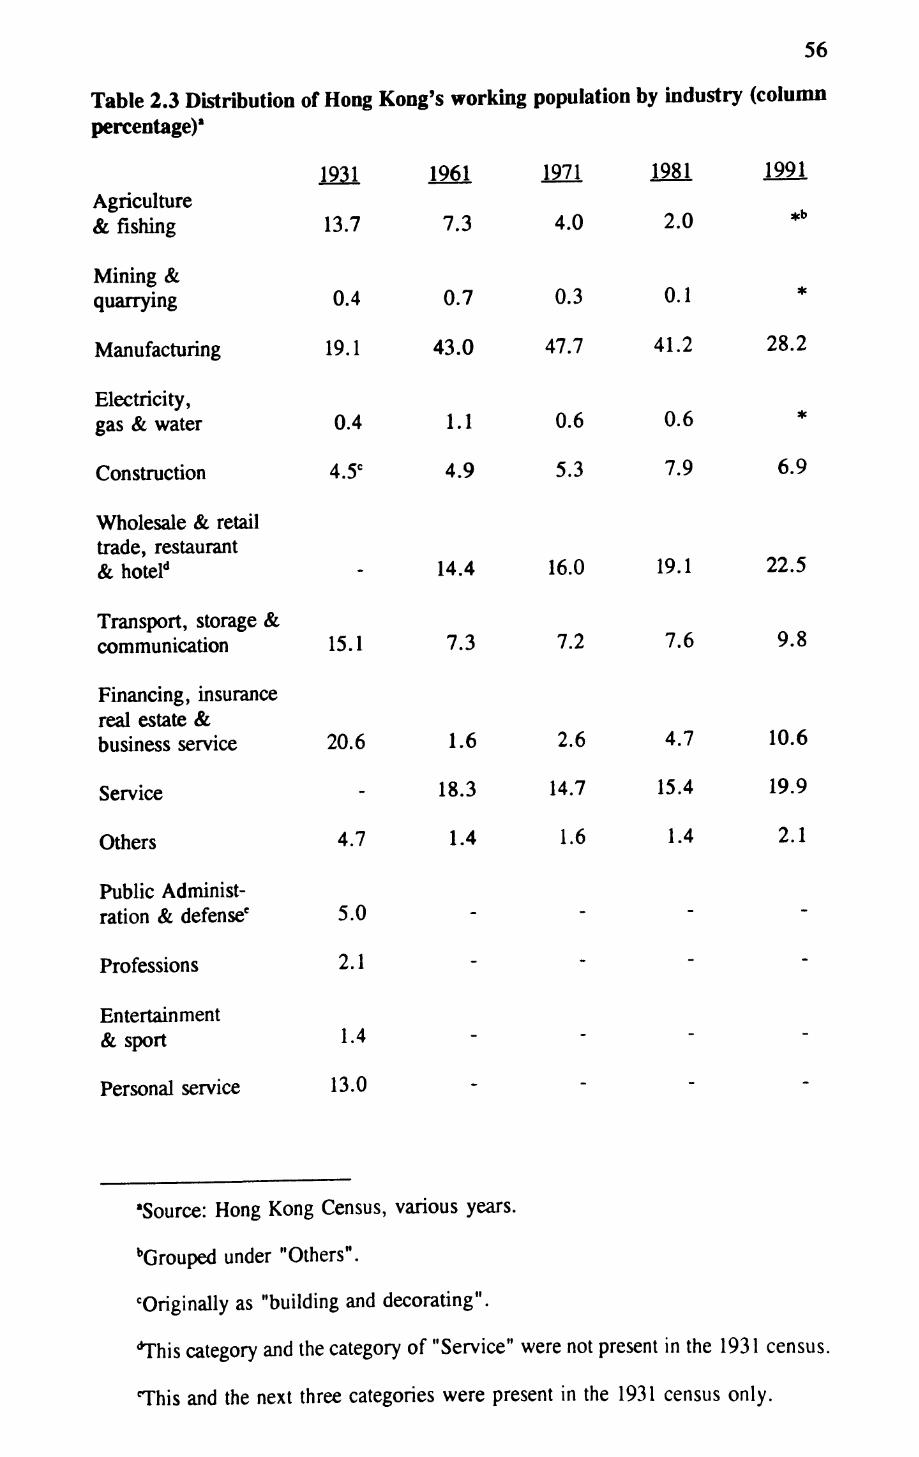
56
Table 2.3 Distribution of Hong Kong's working population by industry (column percentage)'
1991
*bAgriculture & fishing
Mining & quarrying
Manufacturing
Electricity, gas & water
Construction
1931
13.7
0.4
19.1
0.4
4.5C
1961
7.3
0.7
43.0
1.1
4.9
1971
4.0
0.3
47.7
0.6
5.3
1981
2.0
0.1
41.2
0.6
7.9
28.2
6.9
Wholesale & retailtrade, restaurant&hoteld - 14.4 16.0 19.1 22.5
Transport, storage &communication 15.1 7.3 7.2 7.6 9.8
Financing, insurance real estate &business service
Service
Others
Public Administ ration & defense*
Professions
Entertainment & sport
Personal service
20.6 1.6 2.6 4.7
18.3 14.7 15.4
4.7 1.4 1.6 1.4
5.0
2.1
1.4
13.0
10.6
19.9
2.1
-
-
-
'Source: Hong Kong Census, various years.
bGrouped under "Others".
"Originally as "building and decorating".
''This category and the category of "Service" were not present in the 1931 census.
This and the next three categories were present in the 1931 census only.
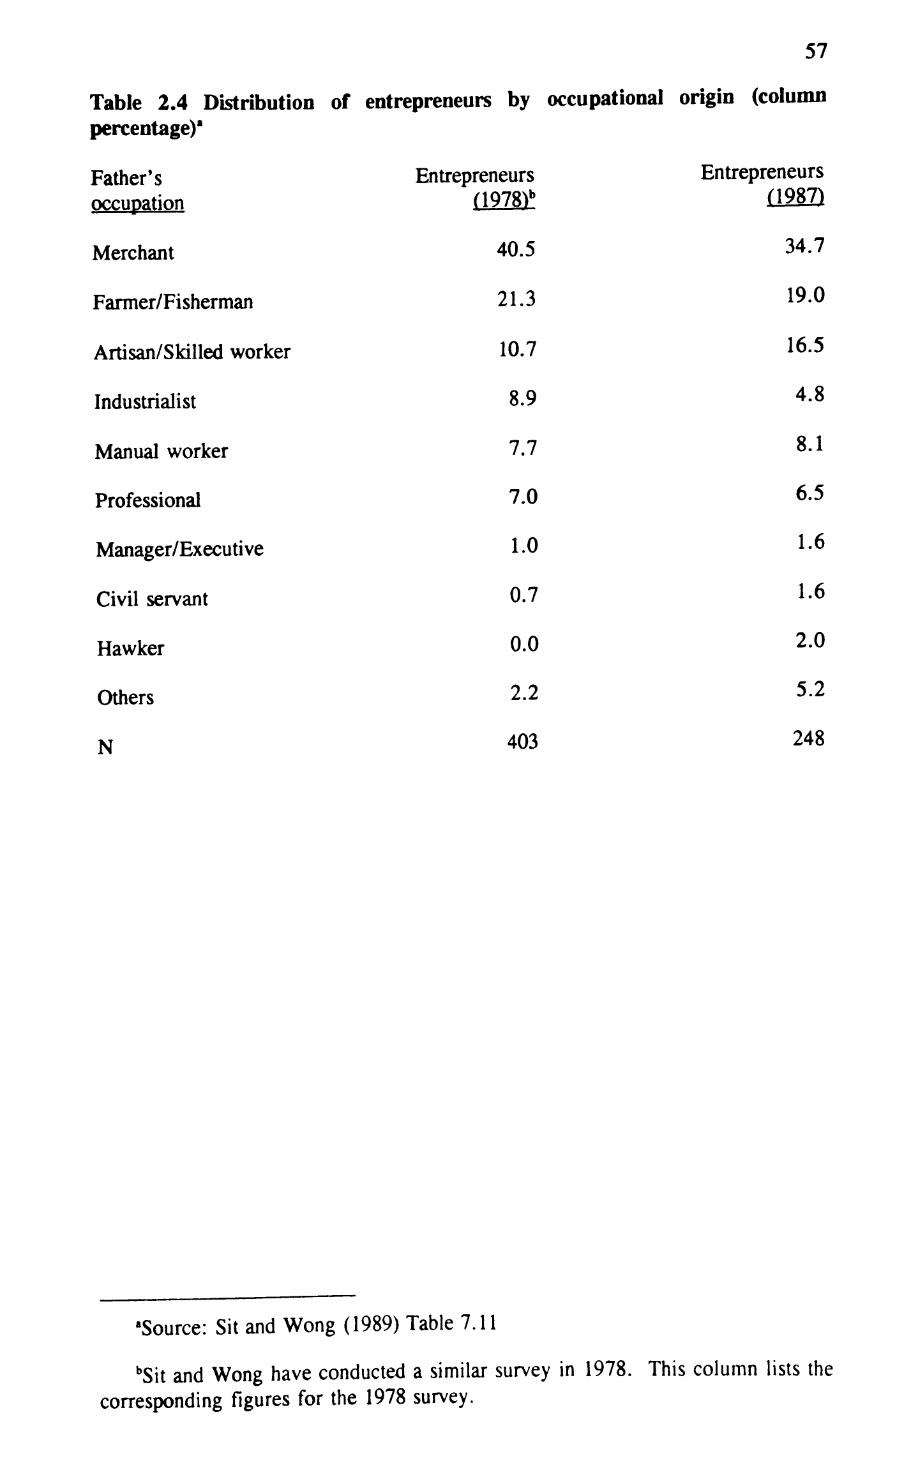
57
Table 2.4 Distribution of entrepreneurs by occupational origin (column percentage)"
Father's occupation
Merchant
Farmer/Fisherman
Artisan/Skilled worker
Industrialist
Manual worker
Professional
Manager/Executive
Civil servant
Hawker
Others
N
Entrepreneurs (1978V
40.5
21.3
10.7
8.9
7.7
7.0
1.0
0.7
0.0
2.2
403
Entrepreneurs (1987)
34.7
19.0
16.5
4.8
8.1
6.5
1.6
1.6
2.0
5.2
248
Source: Sit and Wong (1989) Table 7.11
bSit and Wong have conducted a similar survey in 1978. This column lists the corresponding figures for the 1978 survey.
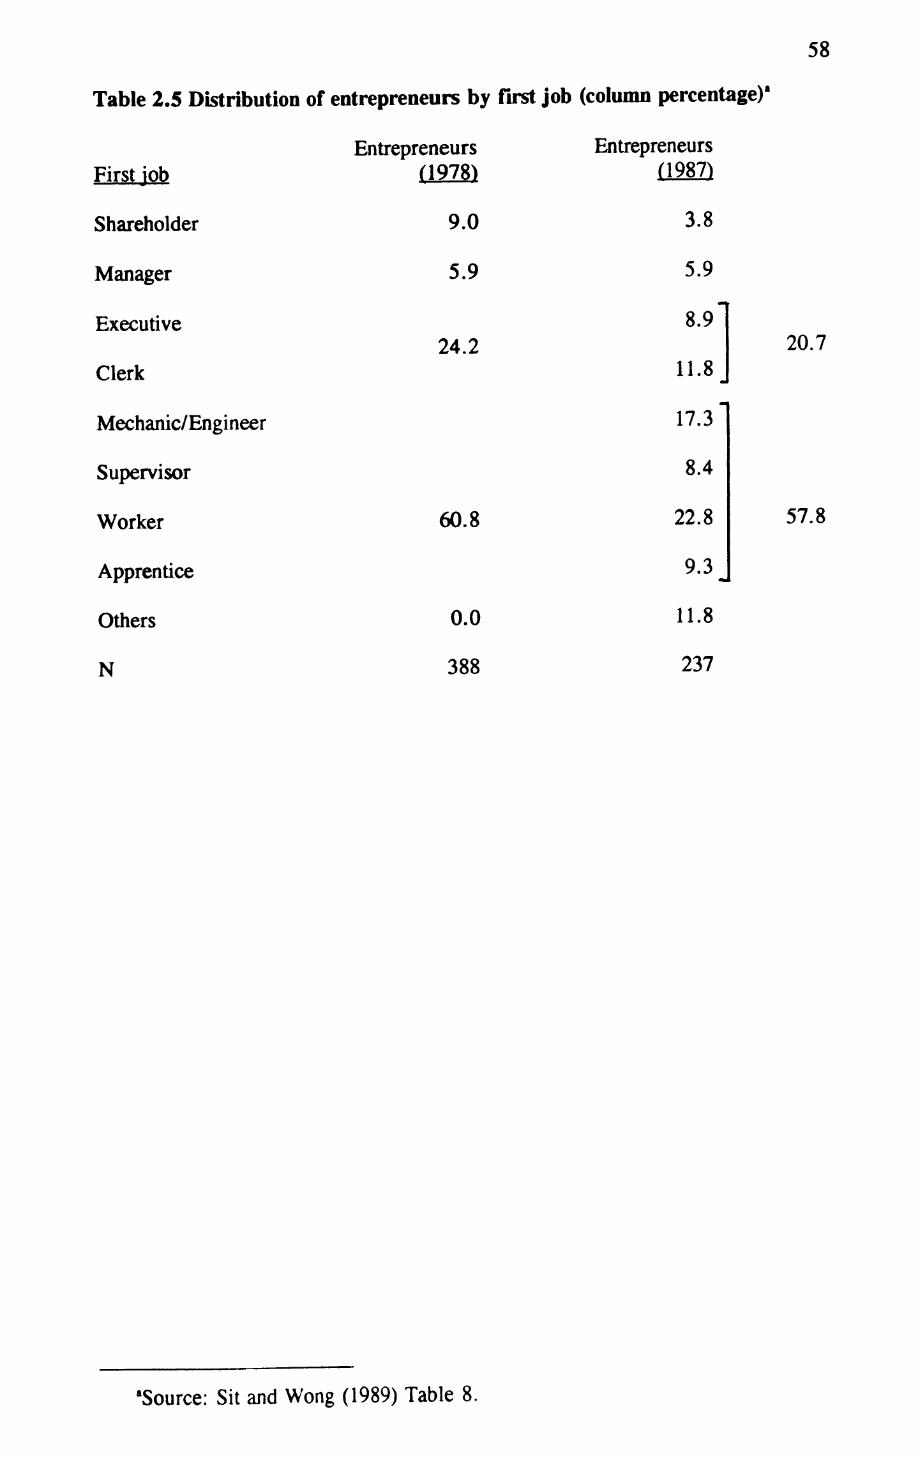
58
Table 2.5 Distribution of entrepreneurs by first job (column percentage)8
First job
Shareholder
Manager
Executive
Clerk
Mechanic/Engineer
Supervisor
Worker
Apprentice
Others
N
Entrepreneurs (1978)
9.0
5.9
24.2
60.8
0.0
388
Entrepreneurs (1987)
3.8
5.9
8.9
11.8
17.3
8.4
22.8
9.3«
11.8
237
20.7
57.8
Source: Sit and Wong (1989) Table 8.
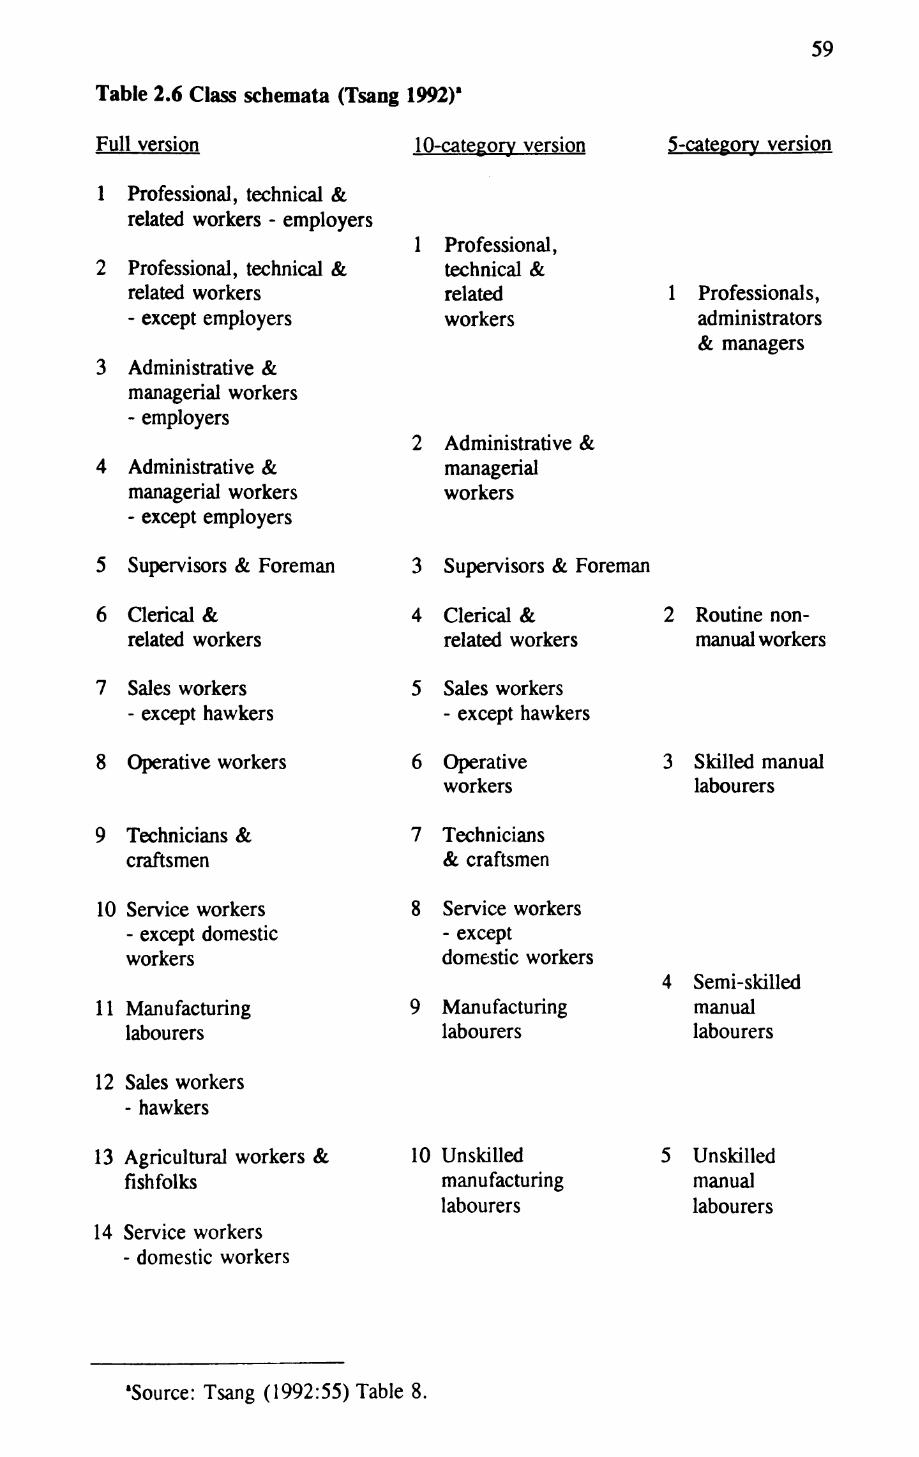
59
Table 2.6 Class schemata (Tsang 1992)'
Full version
1 Professional, technical & related workers - employers
2 Professional, technical & related workers- except employers
3 Administrative & managerial workers- employers
4 Administrative & managerial workers- except employers
5 Supervisors & Foreman
6 Clerical & related workers
7 Sales workers- except hawkers
8 Operative workers
9 Technicians & craftsmen
10 Service workers- except domestic workers
11 Manufacturing labourers
12 Sales workers- hawkers
13 Agricultural workers & fishfolks
14 Service workers- domestic workers
10-category version 5-cateeorv version
1 Professional, technical & related workers
1 Professionals, administrators & managers
2 Administrative & managerial workers
3 Supervisors & Foreman
4 Clerical & related workers
5 Sales workers- except hawkers
6 Operative workers
7 Technicians & craftsmen
8 Service workers- except domestic workers
9 Manufacturing labourers
10 Unskilled manufacturing labourers
2 Routine non- manual workers
3 Skilled manual labourers
4 Semi-skilled manual labourers
5 Unskilled manual labourers
Source: Tsang (1992:55) Table 8.
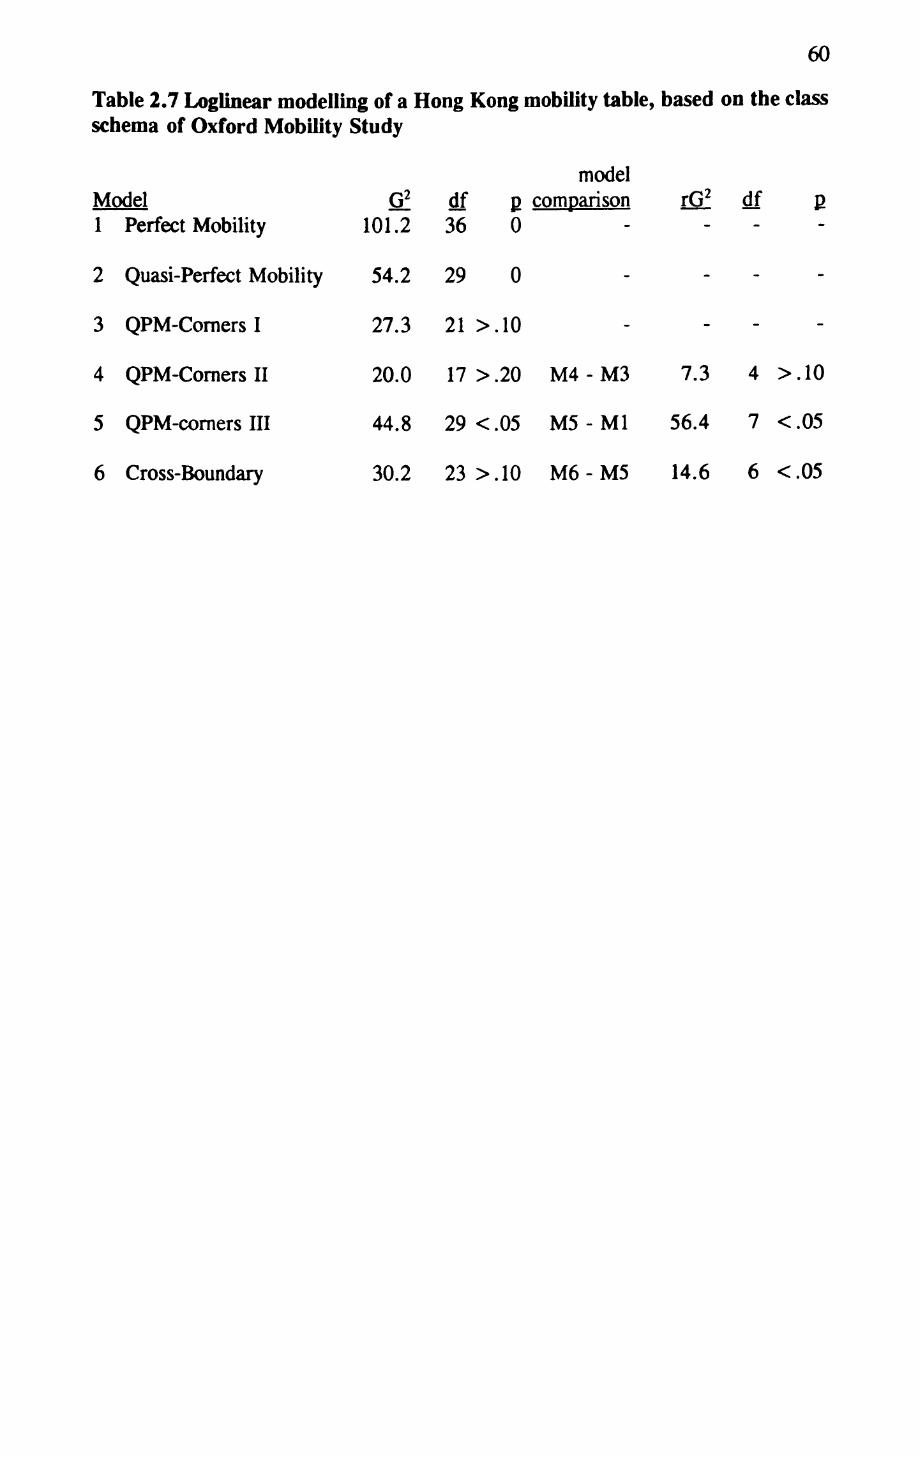
60
Table 2.7 Loglinear modelling of a Hong Kong mobility table, based on the class schema of Oxford Mobility Study
model Model G2. df p comparison rG2 df p1 Perfect Mobility 101.2 36 0 - -
2 Quasi-Perfect Mobility 54.2 29 0 - -
3 QPM-CornersI 27.3 21 >.10 - - -
4 QPM-Corners II 20.0 17 >.20 M4 - M3 7.3 4 >.10
5 QPM-corners III 44.8 29 <.05 M5 - Ml 56.4 7 <.05
6 Cross-Boundary 30.2 23 >.10 M6 - M5 14.6 6 <.05
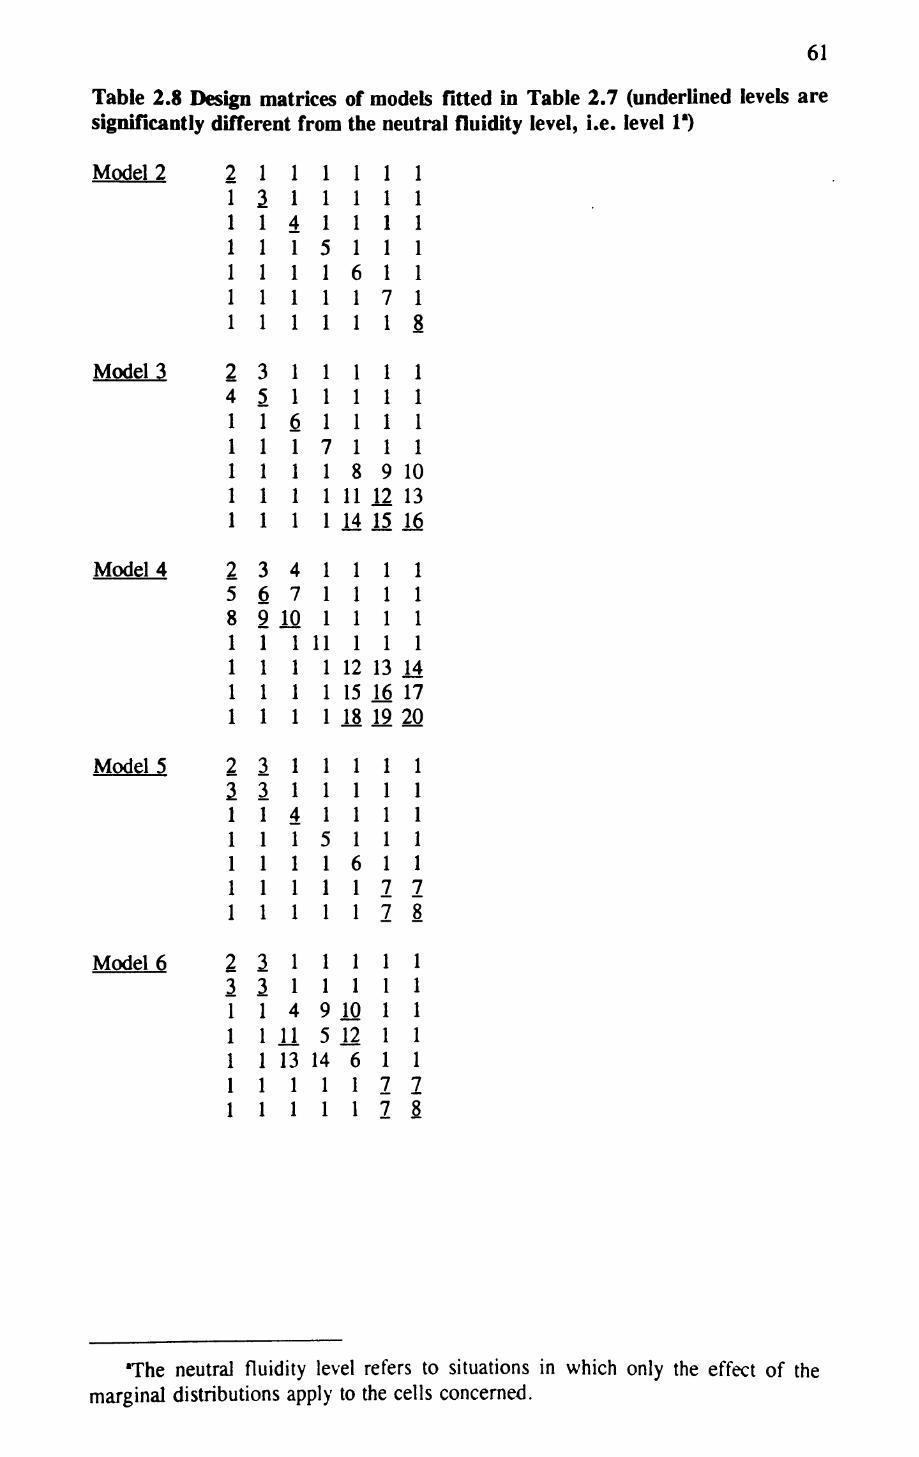
61
Table 2.8 Design matrices of models fitted in Table 2.7 (underlined levels are significantly different from the neutral fluidity level, i.e. level 1*)
Model 2 2111111
1211111
1141111
1115111
1111611
1111171
1111118
Model3 2311111 4511111 1161111 1117111 1 1 1 1 8 9 10 1 1 1 1 11 12 13 1 1 1 1 14 15 16
Model 4 2341111 5671111 8 9 1Q 1 1 1 1 1 1 1 11 1 1 1 1 1 1 1 12 13 14 1 1 1 1 15 16 17 1 1 1 1 18 19 20
Model 5 2aiiiii
3311111
1141111
1115111
1111611
1111177
1111178
Model 6 2311111 3311111 1 1 4 9 10 1 1 1 1 11 5 12 1 1 1 1 13 14 6 1 111111771111178
The neutral fluidity level refers to situations in which only the effect of the marginal distributions apply to the cells concerned.
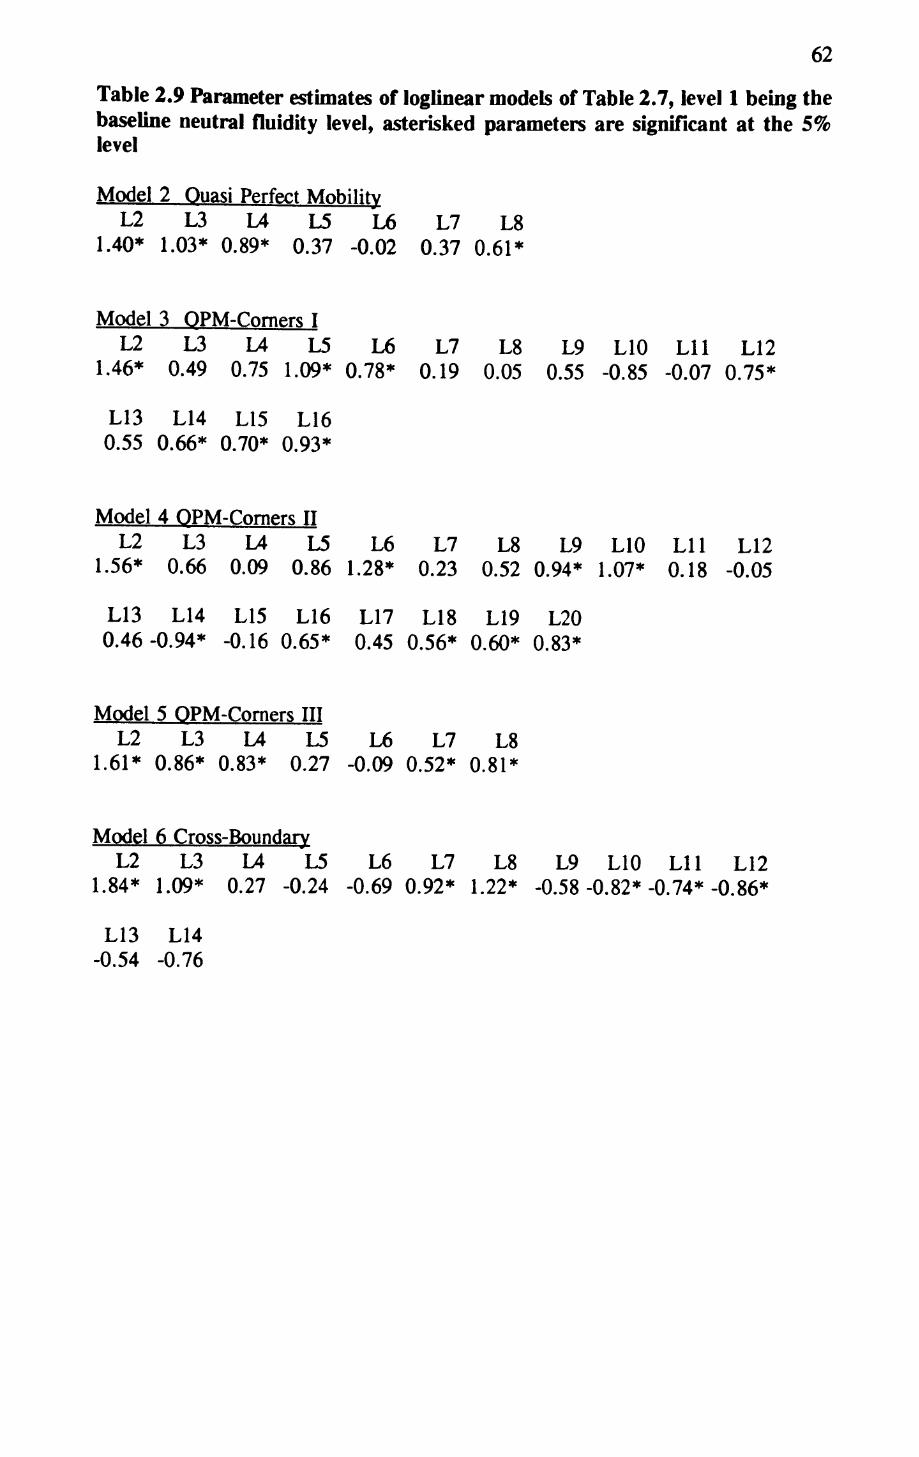
62
Table 2.9 Parameter estimates of loglinear models of Table 2.7, level 1 being the baseline neutral fluidity level, asterisked parameters are significant at the 5% level
Model 2 Quasi Perfect MobilityL2 L3 L4 L5 L6 L7 L8
1.40* 1.03* 0.89* 0.37 -0.02 0.37 0.61*
Model 3 QPM-Corners IL2 L3 L4 L5 L6 L7 L8 L9 L10 Lll L12
1.46* 0.49 0.75 1.09* 0.78* 0.19 0.05 0.55 -0.85 -0.07 0.75*
L13 L14 L15 L16 0.55 0.66* 0.70* 0.93*
Model 4 OPM-Corners IIL2 L3 L4 L5 L6 L7 L8 L9 L10 Lll L12
1.56* 0.66 0.09 0.86 1.28* 0.23 0.52 0.94* 1.07* 0.18 -0.05
L13 L14 L15 L16 L17 L18 L19 L20 0.46-0.94* -0.16 0.65* 0.45 0.56* 0.60* 0.83*
Model 5 OPM-Corners IIIL2 L3 L4 L5 L6 L7 L8
1.61* 0.86* 0.83* 0.27 -0.09 0.52* 0.81*
Model 6 Cross-BoundaryL2 L3 L4 L5 L6 L7 L8 L9 L10 Lll L12
1.84* 1.09* 0.27 -0.24 -0.69 0.92* 1.22* -0.58-0.82*-0.74*-0.86*
L13 L14 -0.54 -0.76
63
Chapter 3
A Comparative Analysis of Social Mobility in Hong Kong
This chapter examines Hong Kong's intergenerational class mobility regime from a
comparative perspective. More specifically, I fit the core model of social fluidity
developed in the CASMIN (Comparative Analysis of Social Mobility in Industrial
Nations) project to a Hong Kong mobility table. This exercise serves two purposes.
First, Hong Kong is used as a further test case for some of the results reported by
Erikson and Goldthorpe (1992a). Second, by way of this comparison, I hope to bring
out some of the distinctive features of Hong Kong's fluidity pattern.
The CASMIN project
Let me start by recapitulating from Chapter 1 the central hypothesis of recent
comparative mobility research. Mobility researchers are interested in the extent and
the sources of variations in mobility rates across nations. The FJH hypothesis,
originally formulated by Featherman, Jones and Hauser (1975), postulates that cross-
national variations in absolute mobility rates (i.e. inflow, outflow and total mobility
rates) are due to factors exogenous to the processes that transmit social advantages
across generations (but these processes are largely common for all industrial
societies). The effects of the exogenous factors are manifested in the marginal
distributions of the standard mobility table. Thus, if the margins, and hence the
exogenous factors, are statistically controlled for, it will become apparent that
mobility rates, at what is now commonly called the relative level, are largely the
same for all industrial societies with a market economy and a nuclear family system.
The FJH hypothesis has been subjected to many empirical tests. In particular,

64
Erikson and Goldthorpe (1992a), working under the auspices of the CASMIN project,
have developed a core model to represent their conception of the cross-nationally
common fluidity pattern. When this model is fitted to individual mobility tables of
European nations, they find that the deviations between the model and the observed
fluidity patterns are (a) small in magnitude, and (b) non-systematic in nature, in the
sense that they are better understood as arising from the specificities of the social and
economic histories of individual nations than in terms of macro-sociological variables.
Erikson and Goldthorpe argue that this is sufficient evidence for a weak version of
the FJH hypothesis.
Having found support for their argument among the European nations, they turn to
examine a few non-European cases. In particular, after studying the fluidity pattern
of Japan, they report that, "Japan does not display any greater deviations from our
model of core social fluidity than those found among European nations ... and there
would thus seem little basis for proposing a distinctive Japanese type of fluidity
pattern, rather than seeing Japanese fluidity as representing simply another national
variation on the common theme that our core model serves to define" (Ishida,
Goldthorpe and Erikson 1991:987, emphasis added; see also Erikson and Goldthorpe
1992a: 343-352).
In other words, Japan falls within the range of the European nations. But this does
not settle the larger question of whether there is an East Asian type of social fluidity.
This is because, as Erikson and Goldthorpe (1992a:173) themselves argue, it is not
deviations per se. but those which are systematic, and thus have to be understood in
terms of macro-sociological variables, that are most damaging to the FJH hypothesis.
It follows that to address the question of East Asian exceptionalism in social fluidity,
we need to examine more than one industrial country from East Asia, and see if they
65
deviate from the core model in the same way. If that is the case, we will have good
ground to argue for an East Asian type of social fluidity, and the FJH hypothesis will
have to be further qualified accordingly. With this concern in mind, this chapter put
the CASMIN core model to yet another test in the context of modern Hong Kong.
East Asian Exceptionalism in social fluidity
But is there a prima facie case for this exceptionalist argument? It seems to me that
some preliminary evidence can be found in the distinctive industrialization experience
of the East Asian countries. Indeed, Japan together with the East Asian Newly
Industrialized Countries (NICs), South Korea, Taiwan, Singapore and Hong Kong,
have often been taken as providing a distinct model of economic development (Deyo
1987, Gereffi and Wyman 1990).'
The term "East Asian growth model" is often used to mean several things, such as
a strong developmentalist state, export-oriented industrialization, and a repressive
labour control regime. For our present puipose, the strong state is of particular
relevance because the strength of the East Asian states has allowed them to
implement, quite apart from their industrial policies,2 other programmes which have
directly affected the class structure and the extent of class inequality in their country.
For example, the land reform of Taiwan and South Korea in the 1950s drastically
'It must be said that there are different views on what the East Asian growth model means. One school of thought stresses the common cultural make-up of the East Asian countries (e.g. Berger 1989). Others argue that the rapid growth of East Asia is the result of unfettered operation of the market (Belassa 1981). I cannot go into the relative merits and flaws of these approaches here. I will only note that I subscribe to what Evans and Stephens (1988) call the new historical comparative political economy approach.
2Indeed, the type of industrial policy found in South Korea or Taiwan is absent in Hong Kong. But see Schiffer (1991) for an unorthodox view of the state's role in Hong Kong's economic growth.
66
equalized rural income. Subsequent policy in both countries of squeezing agriculture
to promote industry has kept rural income low relative to the urban sector. This has
induced an exodus of labour from farms to urban factories, and thus helped to bring
about "a swifter, more abrupt, and more intense proletarianization [in Korea] than
occurred in 19th and 20th century Europe" (Koo 1990:669, see Sen and Koo 1992
for a similar argument about Taiwan). In Hong Kong, the massive public housing
programme can be seen as a wage paid by the state to its working class tenants. This
programme lessened the pressure for higher wage claims, and thus helped to maintain
Hong Kong's export competitiveness in labour cost. It also has some redistributive
function (Ho 1989, Castells, Goh and Kwok 1990).
It is also relevant that the East Asian states adopt an export-led industrialization rather
than import-substitution. Given the level of technology available to the East Asian
nations when they began industrialization, the decision to export meant that they had
to rely on light, labour intensive industries such as garment, footwear and toys. The
effect was a higher level of employment than would have been possible under an
import-substitution regime. It is true that the wage rate in East Asia was low by
Western standards, but a high level of employment seems to have an overall income
equalizing effect. Indeed, compared with their Latin America counterparts, the East
Asian countries have managed to sustain industrial growth with a relatively egalitarian
income distribution (but see Evans 1987 for caveats).
It is interesting to note that a strong, lasting socialist government is often thought to
be capable of ameliorating inequality, including that of mobility chances (e.g. Erikson
and Goldthorpe 1992a: 164-166). The East Asian states are generally more concerned
with promoting growth than distributive justice in their countries. Indeed, most of
them have long avowed to be anti-socialist. However, as a side effect of their
^^ r
industrialization program, they may have inadvertently brought about the same
equalizing effect as socialist governments, insofar as class mobility is concerned.
The pace of industrialization of the East Asian nations also distinguishes them from
the Western countries. For the latter, industrialization took place over a relatively
extended period of time. Consequently, there was a clear temporal order in gross
population flow between economic sectors -- first from agriculture to industry, and
then from industry to services. In contrast, because of the compressed
industrialization of East Asia, the contraction of the agricultural classes was
concomitant with the expansion of both the manual working class and the white collar
classes at more or less the same time. This could have affected the propensity of
mobility flow between social classes.
Taken together, features such as high speed economic growth, a strong
developmental state, export-led industrialization and a relatively egalitarian income
distribution have led many researchers to suggest that the East Asian NICs offer a
distinct model of economic development. To the extent that this is true, would it not
be reasonable to suggest that there is an East Asian type of social fluidity as well?3
Two general problems
I am going to address this question with data collected in the 1989 Hong Kong Social
Mobility Survey, but before I proceed to model fitting, two general problems need
to be addressed. They are: the relatively small sample size (N=752), and empty
cells (all 14 cells of the two columns representing destinations IVc and VHb). One
can argue that these two problems are partially related: if the sample is bigger, then,
3See Burris (1992) for a similar argument for a distinctive process of class formation among the East Asian NICs.
68
in principle, there is a greater chance for us to have some respondents of class IVc
and Vllb -- thus, overcoming the empty cell problem. That is to say, the empty cells
can be regarded as sampling zeros. While there may be some truth in this position,4
I would argue that it makes good sociological sense to consider the empty cells as
structural zeros. Hong Kong has been described as an "industrial colony" and a
"city-state". Its geographical setting, namely the absence of any significant rural
hinterland, has very much constrained the development of its economic and class
structure. The 1986 by-census reports that only one percent of the working
population are employed in agriculture. This means that finding employment or
business opportunity in the tiny primary sector of Hong Kong is, for most people,
extremely difficult. In this sense, I would argue that it is sociologically meaningful
and legitimate to take mobility flow into class IVc or Vllb as structurally impossible.
The imagery here is a highly advanced industrial society where the size of the
primary sector has dropped to its absolute minimum. Accordingly, the only
significant mobility flow is that within and between the secondary and tertiary sectors.
The hidden story is, of course, that millions of farmers elsewhere, especially in
China, are involved in producing food and other primary goods for Hong Kong.
Looking at the problem from a slightly different angle, the Hong Kong survey can
be regarded as a study of urban social mobility. Similar results could be obtained if
we chose to study the mobility experience of inhabitants of Tokyo, London or any
other major cities in the industrial world. The crucial difference here is that in the
'The 1989 Hong Kong mobility survey used two address lists. The first and principal one was a random sample of all residential addresses of the urban area. The second and much smaller one was a sample of segment addresses which listed clusters of cottages found in the rural, not-so-accessible, and relatively thinly populated parts of Hong Kong. The response rate from the second address list was lower than that from the first list. This may have led to an under-representation of farmers and farm workers in the sample.
69
case of Tokyo (or London), because there is no legal/political restriction on
geographical migration, we should be able to detect more population movement into
and out of the city. Some of the outward movement could be mobility flow into the
rural agricultural classes. In the case of Hong Kong, however, political boundaries
have decidedly segregated the mobility processes within Hong Kong itself and those
found in its neighbouring rural population. It is against this unique historical and
political context that the argument for treating the empty cells as structural zeros is
put forward.
Consequently, in the analyses below, I will be modelling a 7 x 5, rather than a 7 x
7, mobility table. It follows that the CASMIN core model is not fully applicable to
Hong Kong. As we shall see, two of the design matrices of the core model which
refer specifically to the agricultural classes have to be dropped. This is somewhat
unfortunate because one of key findings of the CASMIN project is that, "it is sector
effects barriers to mobility between agricultural and non-agricultural classes - that
play by far the major role in producing negative parameters" (Erikson and Goldthorpe
1992a: 136). By disallowing mobility into classes IVc and Vllb, and also, by partially
overlooking the propensity for immobility of farmers, 5 1 will not be able to examine
an important aspect of social fluidity (i.e. sector barriers) in the Hong Kong context.
However, this does not nullify the significance of this attempt to compare Hong
Kong's fluidity pattern with the core model along other dimensions. That is to say,
I recognize that an important feature of Hong Kong's fluidity pattern (i.e. the absence
of sector effect) is obviously unique. Accoidingly, I limit my objective to that of
testing how well the CASMIN core model captures the fluidity pattern between the
5Readers should note that the Hong Kong mobility table only records those farmers who had first been geographically mobile (from the mainland to Hong Kong), and then became socially mobile. By definition, those who were geographically immobile (i.e. those who stayed in rural China) would not appear in this study.

70
non-agricultural classes of Hong Kong.
The fact that there are relatively few cases (N=752) in the Hong Kong table must be
seen as a mixed blessing. On the one hand, small sample size often makes it easier
to obtain a model that satisfies the conventional standard of goodness of fit.
Subsequent analyses will show that, by such a standard, the core model fits the Hong
Kong case very well - in fact, better than it does for most countries in the CASMIN
sample. 6 On the other hand, small N also implies that, generally speaking, it will be
more difficult to obtain statistically significant parameters. This seems to be at work
in the following analyses as well. There is a need to estimate how far the shortfall
in the statistical significance of these parameters is an artefact of the small sample
size. However, this is beyond the scope of this thesis. Let me briefly recapitulate
the testing procedure of Erikson and Goldthorpe, and report the results of fitting the
CASMIN core model to the 7 x 5 Hong Kong mobility table.
The CASMIN core model
The CASMIN core model of social fluidity is a "topological" model with eight
matrices. These matrices are designed to capture four types of effects, namely
hierarchy, inheritance, sector, and affinity. Very briefly, these effects can be
6The full CASMIN sample contains fifteen countries which fall into three main groups. First, there are nine European countries (England and Wales, France, Federal Republic of Germany, Hungary, Republic of Ireland, Northern Ireland, Poland, Scotland, and Sweden) which form the core of the CASMIN data set. The data of these countries were receded from the unit record level by Erikson and Goldthorpe. Then there are three non-European cases (Australia, United States, and Japan) of which data quality is considered to be somewhat less satisfactory. Finally, mobility data of three other European countries (Czechoslovakia, Italy, and the Netherlands), which was coded by the original research teams according to the CASMIN class schema, have been made available to Erikson and Goldthorpe. This chapter compares Hong Kong with Japan and the nine core European countries.

71
understood as follows: 7
(1) Hierarchy effects: although Erikson and Goldthorpe argue that their class
schema does not follow a unidimensional hierarchy in a straightforward manner, they
suggest that the seven classes can still be graded according to the relative advantages
they offer as classes of origin, and their desirability as classes of destination. More
specifically, three hierarchical levels are identified. Class I+n constitutes the first
level; classes III, IVab and V+VI belong to the second level; and classes Vila and
Vllb form the third level. Class IVc, as class of origin, is included in the third level.
However, as class of destination, it is included in the second level. On the base of
this threefold distinction, the matrices HI1 and HI2 are designed to capture the
barriers to mobility across any level boundary and two level boundaries respectively.
In other words, HI2 pertains more specifically to long-range mobility.
(2) Inheritance effects: three levels of inheritance effects are postulated. The first
level (INI) is designed to measure a general immobility effect. It accounts for the
propensity for people to stay in their class of origin (i.e. to be found on the main
diagonal). IN2 aims to underscore the greater likelihood of immobility of classes
I+11, IVab and IVc. As for INS, it further underlines the particularly high propensity
for immobility of class IVc.
(3) Sector effect: this matrix (SE) seeks to capture the barriers to mobility
between agricultural and non-agricultural classes.
7Given the limitation of space, I can only refer readers to Erikson and Goldthorpe (1992a: 121-40) for more detailed discussion of these design matrices. The matrices, and their Hong Kong variants, are shown in Appendix B.
72
(4) Affinity effects: the first level of the affinity effects (API) refers to the very
small chance of mobility between classes I+11 and Vllb. The second level (AF2)
postulates several specific linkages between classes that would partially offset the
hierarchy and sector effects. In particular, it postulates affinity between classes I+11
and III on the one hand, and that between classes V+VI and Vila on the other. This
captures the often noted status distinction between white and blue collar. AF2 also
postulates affinity between I+11 and IVab, and that between IVab and IVc. These
can be understood as affinities arising from the common factor of ownership of means
of production. Finally, AF2 also postulates an asymmetric affinity from IVc and
Vllb to Vila.
Formally, the core model can be represented, in multiplicative form, by equation 3.1
—nt° D Ml * HI2 INI * IN2 * IN3 SE * API . AF2- n
where Fy is the expected frequency of cell ij, n is a scale factor, tj0 and tj° are the
main effects of class of origin and class of destination respectively, the remaining
terms refer to the effects of the eight design matrices. Erikson and Goldthorpe fit
equation 3.1 to national mobility tables at three levels of strictness. The first level
prescribes that the core model be fitted with cross-nationally common parameters. 8
The second level allows the core model be fitted with parameters estimated separately
8With the help of a multi-dimensional scaling exercise, Erikson and Goldthorpe find that the fluidity pattern of England and France would be closest to the "core" pattern of fluidity, if it exists at all. They then take the set of odd ratios derived when a strict CSF model is applied to England and France as the "empirically-derived pattern of core fluidity". By fitting this set of odd ratios to national mobility tables, they obtain counterfactual national mobility tables which suggest what the national mobility tables would look like if the CSF model is strictly correct (Erikson and Goldthorpe 1992a:l 15-21). The cross-nationally common parameters are estimated by fitting equation 3.1 to these counterfactual mobility tables.

73
for each nation. Finally, national variants of the core model are derived by
introducing minor modifications to the design matrices. These modifications must be
well supported by established sociological and historical analyses. That is to say,
they cannot be introduced for the purpose of improving goodness of fit alone. These
national variants of the core model are then fitted to the respective mobility tables.
It should be noted that of all the countries they studied, only England, France and
Sweden achieve an acceptable fit at level 2. 9 The rest require modifications to the
core model before an acceptable fit can be obtained.
Fitting the CASMIN core model to Hong Kong
What about the case of Hong Kong? I follow the same testing procedure in the
following analyses. The results are reported in panel A of Table 3.1. 10 (To facilitate
comparison, panel B, which shows how some of the same models are fitted to other
countries, is included.) As expected, the independence model (model 1) fits the data
poorly, but it provides a baseline for evaluating subsequent models.
Model 2 refers to the first level of fitting the CASMIN core model with cross-
nationally common parameters. As expected, it does not fit the Hong Kong data
satisfactorily. Further comparison between model 2 and model 7 suggests a complex
picture. On the one hand, in terms of standardised G2 , Hong Kong is well within the
European range, while Japan is outside the range. On the other hand, in terms of
other criteria, the core model (with fixed parameters) fits the Hong Kong data less
well than it does for both Japan and the European countries. Model 2 misplaces over
'That a good fit can be obtained for England and France at the second level is expected because the core model is designed on the basis of the fluidity patterns of these two countries. It should also be noted that the core model fits Czechoslovakia satisfactorily at the second level of testing.
10Model fitting and other analyses are done with GLIM, version 3.77.
74
9% of all cases in the Hong Kong table, and reduces only 54% of the G2 under the
independence model. The same model misplaces no more than 8% of the cases for
other countries, and accounts for at least some 75% of the G2 .
Model 3 refers to the second level of testing ~ core model with variable parameters.
Here the model achieves an acceptable fit with the Hong Kong data by conventional
standard of goodness of fit. Standardised G2 for Hong Kong falls to 19, while the
corresponding figure for all other countries is above 30. Readers should recall that
only three other countries ~ England, France and Sweden (also Czechoslovakia if the
full CASMIN sample is considered) -- achieve an acceptable fit at this level. The
percentage of misplaced cases in the Hong Kong table drops to about 5 %, which is
within the European range. Furthermore, this model accounts for about 80% of the
association between origin and destination.
Since there is no need to introduce modifications to the core model to achieve a good
fit for Hong Kong, it must be said that Hong Kong's fluidity pattern is, in fact, closer
to the core model than are most of the countries in the CASMIN sample. However,
inspection of the parameter estimates and their standard errors (Table 3.2) suggests
that further modifications to the core model for the Hong Kong case are needed.
The first thing to note about Table 3.2 is that the parameters estimated for Hong
Kong (panel 3) are of the same sign as the cross-nationally common parameters (panel
2). In terms of magnitude, INI, IN2, AF1 and AF2 of Hong Kong are notably
smaller than the corresponding core values, while the opposite is true for HI2.
Second, the parameters for IN3 and SE are not estimated by GLIM. This is expected
because these two matrices refer specifically to the effects of mobility into the
destinations IVc or Vllb. These two columns are regarded as structural zeros, and
75
thus have been blocked out in the estimation process. In other words, model 3 is
equivalent to the core model minus the IN3 and SE terms. These two matrices are
explicitly dropped in subsequent models. Third, three of the remaining six
parameters of model 3 are not significant by the conventional 5% standard (for
df=18, t-value should not be less than 2.10). HI1 is only very marginally
insignificant (t-value=2.09), followed by AFl (.81) and IN2 (.59).
I thus drop IN2 from the model. It has no effect on goodness of fit (cf. model 4 of
Table 3.1: a rise of .4 in G2 for one degree of freedom is insignificant). Comparison
between panels 3 and 4 of Table 3.2 also shows that dropping IN2 has little effect on
the estimate of other parameters. This suggests that IN2 should not be kept in the
model. 11
But should we also drop AFl from the model? In model 5, I have done that. The
result is still an acceptable fit. For one degree of freedom, G2 rises by only 0.7
(which is insignificant). Standardised G2 remains unchanged at 18, and there is
practically no change in the percentage of misplaced cases. Turning to panel 5 of
Table 3.2, it can be seen that dropping AFl leads to only one notable change in the
remaining parameters ~ the magnitude of HI2 increases from -.76 to -.82.
Apparently, HI2 now captures some of the effect originally measured by AFl, namely
the barriers to movement from Vila to I+II. It seems that AFl does measure some
real effects in Hong Kong's fluidity regime. For this reason, I prefer model 4 to
model 5.
To recapitulate, we now a have an acceptable model (model 4) that contains five
nTo repeat the cautionary note, the shortfall to significance of IN2 may, to some extent, be explained by the small N of the mobility table.
76
design matrices: HI1, HI2, INI, API and AF2. Of the three matrices dropped, INS
and SE are not estimated for substantive reason they refer specifically to mobility
barriers between agricultural and non-agricultural classes, something we cannot
measure for the Hong Kong mobility table. As for IN2, it is dropped because, given
the presence of other matrices in the model, it is highly insignificant.
Notice that I have not introduced any modification to individual cells of the remaining
matrices. Nor have I added new matrices to the core model to achieve a good fit.
In this sense, the core model fits the observed pattern of Hong Kong very well. By
formal convention of goodness of fit, there is no need to seek improvement to model
4. However, in view of the fact that this model does not refer explicitly to any
sectoral barriers to mobility (it is likely that they are now captured partially and
implicitly by other matrices), and that AF1 is designed to capture the negative affinity
between the service class and farm workers, I have further fitted a national variant
model for Hong Kong. In model 6, the AF1 term is included in the cell IVc-I+II. 12
This should enable API to capture some sector effects to mobility for which the SE
term was originally designed (namely, the barriers against mobility from farmer
origin to service class destination). The result of this modification is very
encouraging. By affecting only one cell, this model shows considerable improvement
to model 4. For the same degree of freedom, there is a drop of 5.1 in G2 . Model
6 misplaces 4% of all cases, and accounts for about 85% of the association between
origin and destination. 13 Thus, model 6 is preferable to model 4.
Three of the five parameters estimated under model 6 (HI1, INI, AF2) are very
12 I am grateful to John Goldthorpe for suggesting this modification.
13In fact, the G 2 returned by model 6 is so small that the standardised measure G2(S) becomes inapplicable. See note b of Table 3.1.
77
similar to their corresponding value under model 4, while HI2 decreases from -.76
to -.55 and API rises from -.51 to -1.05. 14 For 19 degrees of freedom, the critical
t-value of five percent is 2.09. By this standard, all five parameters are significant:
HI1 (t-value=2.09), HI2 (2.39), INI (3.17), API (2.23) and AF2 (2.50). I take
model 6 as the final model.
Table 3.3 maps out how the five parameters of my preferred model are applied to
individual cells of the mobility table, and Table 3.4 reports how the cell interaction
parameters under the Hong Kong model compared with those expected under the core
model. Table 3.4 is expressed in percentage terms. So a value of 100 means that
the cell interaction parameter under the Hong Kong model is at the same distance
from the neutral fluidity level as that expected under the core model; a value of 50
means that the cell parameter under the Hong Kong model is only half the distance
away from the neutral fluidity level; and a value of 200 means that it is twice the
distance away.
Table 3.4 is notable on two counts. First, the parameter of 3 cells (IVc-IVab, IVc-
Vlla, and Vllb-VIIa) is of the opposite sign to that expected under the core model.
This is due to the absence of a large negative term (SE) in Hong Kong (cf. Table
3.3). Second, compared to the core level, there are only 3 cells (IVc-I+II, Vlla-
I+II, I+11-Vila) in which Hong Kong's interaction parameter is further away from
the neutral fluidity level. There are 12 cells in which Hong Kong and the core model
are of roughly the same distance from the neutral fluidity level, and 20 cells are such
that Hong Kong is closer to the neutral fluidity level. To borrow an analogy used by
14The direction of change of HI2 lends some support to the modification we introduce to the API matrix. It seems that some of the sector effects formerly captured by HI2 under model 4 is now captured by AF1 under model 5.
78
Erikson and Goldthorpe, Table 3.4 suggests that although the contour of Hong Kong's
fluidity pattern follows the core model closely, the Hong Kong landscape is, at the
same time, much flatter than the core model. This implies that inequality in relative
mobility chances is less extreme in Hong Kong than that suggested by the core model.
Let us examine Hong Kong's fluidity pattern more carefully. The parameter
estimates of my preferred model (panel 6 of Table 3.2) are remarkable in several
ways. In the first place, the INI term (.38) of Hong Kong is the second weakest of
all countries in the CASMIN sample (the weakest is that of Sweden [.28]). 15 So the
propensity for immobility of all social classes of Hong Kong is rather low.
Furthermore, since IN2 is insignificant, Hong Kong's service class and petty
bourgeoisie are not significantly more immobile than other classes. (The IN2 term
of Japan is also insignificant.) Also, since there is no IN3 term in the Hong Kong
model, it must be said that Hong Kong's overall immobility effect is the weakest of
all the countries tested.
Second, and in sharp contrast to the above, the total hierarchy effect (HI1 + HI2) of
Hong Kong is quite strong. At the level of -.78, it is the third strongest of all eleven
countries considered here. More specifically, the HI1 term of Hong Kong, at -.23,
is almost identical to the core level (-.22), while its HI2 term (-.55), is the third
strongest of all countries. This suggests that: (a) people of IVc, Vila or Vllb origin
face considerable barriers to long-range mobility to I+11 destination, and (b) that
people of I+II origin are unlikely to fall as far as class Vila, even if they were to
I5The size of an individual parameter depends, in part, on what other parameters are included in the model. Since slightly different variants of the core model are accepted for each nation (some matrices are dropped, or the level of interaction of individual cells changed), the same parameters are not strictly comparable across nations. Having said this, such comparisons do suggest broad differences in the strength of the various effects across countries.
79
suffer from downward mobility.
Third, the modified API term of Hong Kong (-1.05) is the strongest of all countries
(the second strongest is that of Ireland [-.93]). This is consistent with the strong HI2
effect noted above, in that it underscores the difficulty of movement from farm
origins to the service class. 16
Finally, the AF2 term of Hong Kong (.25) is the weakest of all eleven countries (the
countries that have the second weakest AF2 term are Japan and Sweden [.37]). Since
the AF2 matrix postulates several specific linkages that would partially offset the
hierarchy and sector effects, its weakness further underlines the strength of the
hierarchy effect noted above. 17
To recapitulate our findings so far, three points are notable. First, the CASMIN core
model fits the Hong Kong mobility table very well. A satisfactory fit is achieved at
the second level of testing. This is true for only three other countries in the sample.
Second, it follows from the first point that the pattern of unequal mobility chances
described by the CASMIN model can be found in Hong Kong. However, we have
also seen that most of the cell interaction parameters of Hong Kong are closer to the
neutral fluidity level than are expected under the core model. Hence, Hong Kong
16One cautionary note with regard to the AF1 term: the AF1 matrix pertains not only to long-range, but also to cross-sector mobility. As suggested earlier, since our preferred model does not contain the SE matrix, the AF1 term is likely to have captured some "sector" effects. Accordingly, its magnitude could have been "inflated". This makes the comparison of the API term of Hong Kong with that of other countries more problematic.
17Since the AF2 term pertains to a number of different effects, it is possible that the small size of this parameter reflects the extreme weakness of some, rather than all, of the relevant linkages. The AF2 term should, thus, be interpreted cautiously and in conjunction with other matrices.
80
exhibits a relatively high degree of openness, which is the result of: (a) the absence
of sectoral barriers, and (b) the weakness of inheritance effects in Hong Kong. But,
and this is the third point, such relative openness is only half of the story. Indeed,
I would argue that the most notable, and rather puzzling, feature of Hong Kong's
fluidity pattern is that weak inheritance effects co-exist with relatively strong
hierarchy effects, particularly those against long-range mobility. In other words,
while it is relatively easy for our respondents to move away from the main diagonal,
those who are mobile in this minimal sense face rather formidable barriers along
hierarchical boundaries. The fact that a respondent has left his class origin does not
necessarily mean that he will travel very far up or down the class hierarchy.
Why should Hong Kong exhibit such a fluidity pattern? There is very little direct
evidence to give a satisfactory account here. Nevertheless, regarding the
insignificance of IN2, I would venture to suggest the following. Since the two
property-owning classes of Hong Kong, I+II and IVab, 18 are not significantly more
immobile than the other classes, one or both of the following should be true: (a)
direct inheritance of an ongoing business from one's father is not a particularly
attractive and/or feasible career option for many people, and (b) that coming from an
entrepreneurial family does not give a respondent a strong motivation, or useful social
contacts, or other social skills that would help him to set up his own business later.
These are very broad statements that need to be specified more carefully and then put
to empirical tests, but I believe that the relatively weak propensity for immobility of
classes I+II and IVab can partly be attributed to one prominent feature of Hong
18Class I-HI includes entrepreneurs as well as salaried professionals, managers, and administrators. The following argument applies only to what can be called the entrepreneurial segment of the service class.
81
Kong's industrial structure, namely the prevalence of small firms. In 1990, for
example, small and medium factories, defined as concerns employing 0-49 and 50-
199 workers respectively, accounted for 99% of all industrial establishments, 74%
of all manufacturing workers and 68% of the gross industrial output (Census and
Statistics Department 1990).
Generally speaking, being small means that there are relatively few assets to pass on
to one's successor, thus reducing the desirability of direct inheritance from the
successor's point of view. Being small probably also means that the firm has a
shorter life expectancy because, compared with large corporations, small firms are
more vulnerable to the vicissitudes of the market. While it may be the case that small
firms are constantly being set up in large number, many of them will go under within
a short period of time. Casual observers and academic researchers alike have often
reported some sort of entrepreneurialism in Hong Kong. This may well be true, but
I would argue that a prevalent desire to become one's own boss, or indeed even a
high birth rate of small businesses, should not be confused with their durability.
Because IN2 is insignificant, I would conjecture that the great majority of Hong
Kong's small firms do not last long enough to reach the point of intergenerational
succession. 19 It follows that models of Chinese family firms, such as that proposed
by Wong (1985), which postulate how their structure and dynamics change over
generations are, at best, limited in their applicability to a very small number of large
concerns.
Put differently, direct inheritance of property plays a relatively less important part in
perpetuating class inequality in Hong Kong. This does not make Hong Kong a
^Verification of this claim would call for a study of the birth and death rates -- i.e. the organizational ecology -- of Hong Kong's small firms.
82
classless society. Instead, given the strong hierarchy effects to mobility, I would
argue that, in Hong Kong, class inequality operates more effectively through other
mechanisms such as the certification of formal credentials.20
Counterfactual comparisons
Having described Hong Kong's fluidity pattern, let me return to the question of East
Asian exceptionalism. I will compare counterfactual and observed mobility tables so
as to test whether Hong Kong's fluidity pattern is more similar to the Japanese pattern
than it is to those of the European countries. Given the limit of space, I will consider
only one European case, namely Sweden. The choice of Sweden is based on earlier
findings that it shares many common features with Hong Kong (e.g. both countries
achieve an acceptable fit with the core model at the second level of testing, both have
weak inheritance effects). The two counterfactual tables I construct preserve the
marginal distributions of the Japanese and the Swedish mobility tables respectively,
but they contain the full set of Hong Kong's odds ratios. In other words, they
represent the counterfactual situations in which Hong Kong's fluidity pattern prevails
in the Japanese and the Swedish class structure. By comparing the absolute mobility
rates embedded in the "true" and the counterfactual Japanese tables, I can assess how
far Hong Kong's fluidity pattern differs from the Japanese one. Likewise, a
comparison of the "true" and the counterfactual Swedish tables will show how Hong
Kong differs from Sweden in social fluidity.
Operationally speaking, I start with the fitted Japanese table under its preferred
model. This represents the "true" mobility pattern of Japan after random noises have
been filtered out. I then take out the two columns representing the destinations IVc
20See Pong and Post (1991), Wong and Lui (1992b) for discussion of the effects of family background on educational attainment.
83
and Vllb. This results in a 7 x 5 mobility table, which I take as that of "urban"
Japan. 21 At this point, I turn to the fitted mobility table of Hong Kong under our
preferred model. This table is then subjected to a procedure of "iterative
simultaneous proportional adjustments" until its marginals become those of "urban"
Japan. 22 To repeat, the outcome of this exercise is a table that preserves the Japanese
marginals, but contains the full set of Hong Kong's odds ratios. In other words, it
shows what the Japanese mobility table would look like if Hong Kong's fluidity
pattern were to prevail in that country. The same procedure is then repeated for
Sweden. The "true" and counterfactual outflow rates of Japan and Sweden are
reported in Tables 3.5 and 3.6.
Let us start with the case of Japan. One striking feature of Table 3.5 is that, with the
exception of the I+H-I+II cell, there are fewer cases on the main diagonal of the
counterfactual table than on that of the "true" table. This implies that the overall
propensity for immobility is weaker in Hong Kong than in Japan. 23 But since the
21This last step implies the very strong assumption that the all rural population of Japan are either farmers or farm workers. This will most certainly introduce some bias into subsequent analyses. There is also the more complicated problem that the mobility processes linking the urban and the rural classes of Japan are, no doubt, different from those which happened in the context of Hong Kong. Having noted these problems, I would also argue that, given the nature of the data available to us, this procedure gives us the closest proxy of the mobility pattern of urban Japan.
basic idea is that the multiplication of a constant across the rows or columns of a mobility table would not affect the embedded odds ratios. Thus, by repeating this procedure, one can tailor a mobility table to fit a particular set of marginal distributions, but the fluidity pattern would remain unchanged. For more detailed discussion, see Mosteller (1968).
^he difference between the two tables is particularly marked for the routine non- manual and skilled manual workers. This seems to be the result of the notably high propensity for immobility of classes III, V-f VI, and Vila of Japan. Erikson and Goldthorpe observe that, "[in Japan] the propensity for immobility within classes III, V-I-VI, and Vila ... is twice as great as it would be in the absence of [INI] effect ... as against only one-and-a-half times as great under the core model; while, on the other hand, a relatively low propensity for immobility is implied within class 1 + II and IVab" (1992a:346).
84
I+II-I+II cell of the true table contains fewer cases, members of the Japanese service
class seem to be facing a slightly greater danger of downward mobility than their
counterparts in Hong Kong. 24
Second, compared with the "true" table, the counterfactual table has more cases in
the I+II-V+VI cell and fewer cases in the I+H-III cell. Thus, although members
of the Japanese service class are relatively less capable of keeping their advantaged
position, if they were to suffer downward mobility, they are not as likely as their
Hong Kong counterparts to fall through the manual/non-manual divide. This is
consistent with the observation that long-range downward mobility from the service
class to the working class is very rare in Japan (Ishida, Goldthorpe and Erikson
1991:971).
Third, from the first column of Table 3.5, one can see that if Hong Kong's fluidity
pattern were to prevail in Japan, class I+11 would become much more inaccessible
to people from IVc or Vllb origin. 25 However, people of all other origins would
enjoy better chances of mobility into the service class. This pattern accords well with
our knowledge of the strong API term of Hong Kong.
24The CASMIN researchers also point out that, in Japan, there is a popular practice to assign young entrants to routine clerical grades, even though they are of graduate status and are expected to move up to professional, administrative, or managerial positions eventually (Erikson and Goldthorpe 1992a:346-347). Thus, many of the respondents in the I+II-III cell of the original Japanese table are not really suffering from downward mobility. Instead, they are in a extended process of career mobility. Taking this into account, the small difference between the I+II-I+II cells of the original and the counterfactual tables looks even less significant.
25If one assumes that geographical mobility would itself require some kind of resources, then it must be the case that only the more resourceful people from farming origins can "appear" in the Hong Kong mobility table. Keeping this argument in mind, the exceptionally high barriers that prevent the sons of farmers and farm workers of Hong Kong from moving into the service class would seem somewhat puzzling.
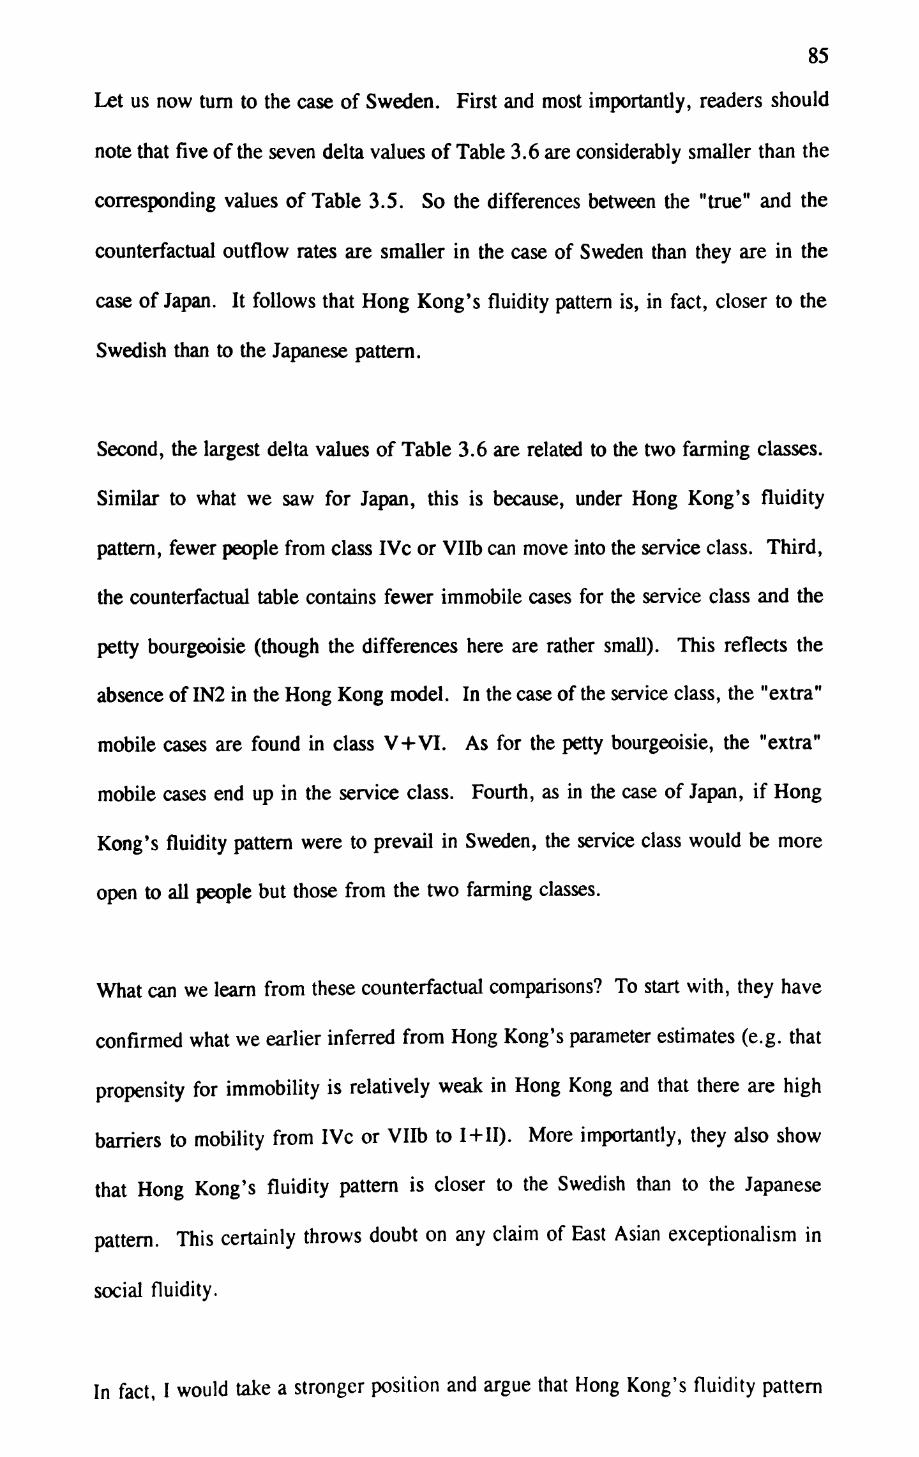
85
Let us now turn to the case of Sweden. First and most importantly, readers should
note that five of the seven delta values of Table 3.6 are considerably smaller than the
corresponding values of Table 3.5. So the differences between the "true" and the
counterfactual outflow rates are smaller in the case of Sweden than they are in the
case of Japan. It follows that Hong Kong's fluidity pattern is, in fact, closer to the
Swedish than to the Japanese pattern.
Second, the largest delta values of Table 3.6 are related to the two farming classes.
Similar to what we saw for Japan, this is because, under Hong Kong's fluidity
pattern, fewer people from class IVc or Vllb can move into the service class. Third,
the counterfactual table contains fewer immobile cases for the service class and the
petty bourgeoisie (though the differences here are rather small). This reflects the
absence of IN2 in the Hong Kong model. In the case of the service class, the "extra"
mobile cases are found in class V+VI. As for the petty bourgeoisie, the "extra"
mobile cases end up in the service class. Fourth, as in the case of Japan, if Hong
Kong's fluidity pattern were to prevail in Sweden, the service class would be more
open to all people but those from the two farming classes.
What can we learn from these counterfactual comparisons? To start with, they have
confirmed what we earlier inferred from Hong Kong's parameter estimates (e.g. that
propensity for immobility is relatively weak in Hong Kong and that there are high
barriers to mobility from IVc or Vllb to I+11). More importantly, they also show
that Hong Kong's fluidity pattern is closer to the Swedish than to the Japanese
pattern. This certainly throws doubt on any claim of East Asian exceptionalism in
social fluidity.
In fact, I would take a stronger position and argue that Hong Kong's fluidity pattern
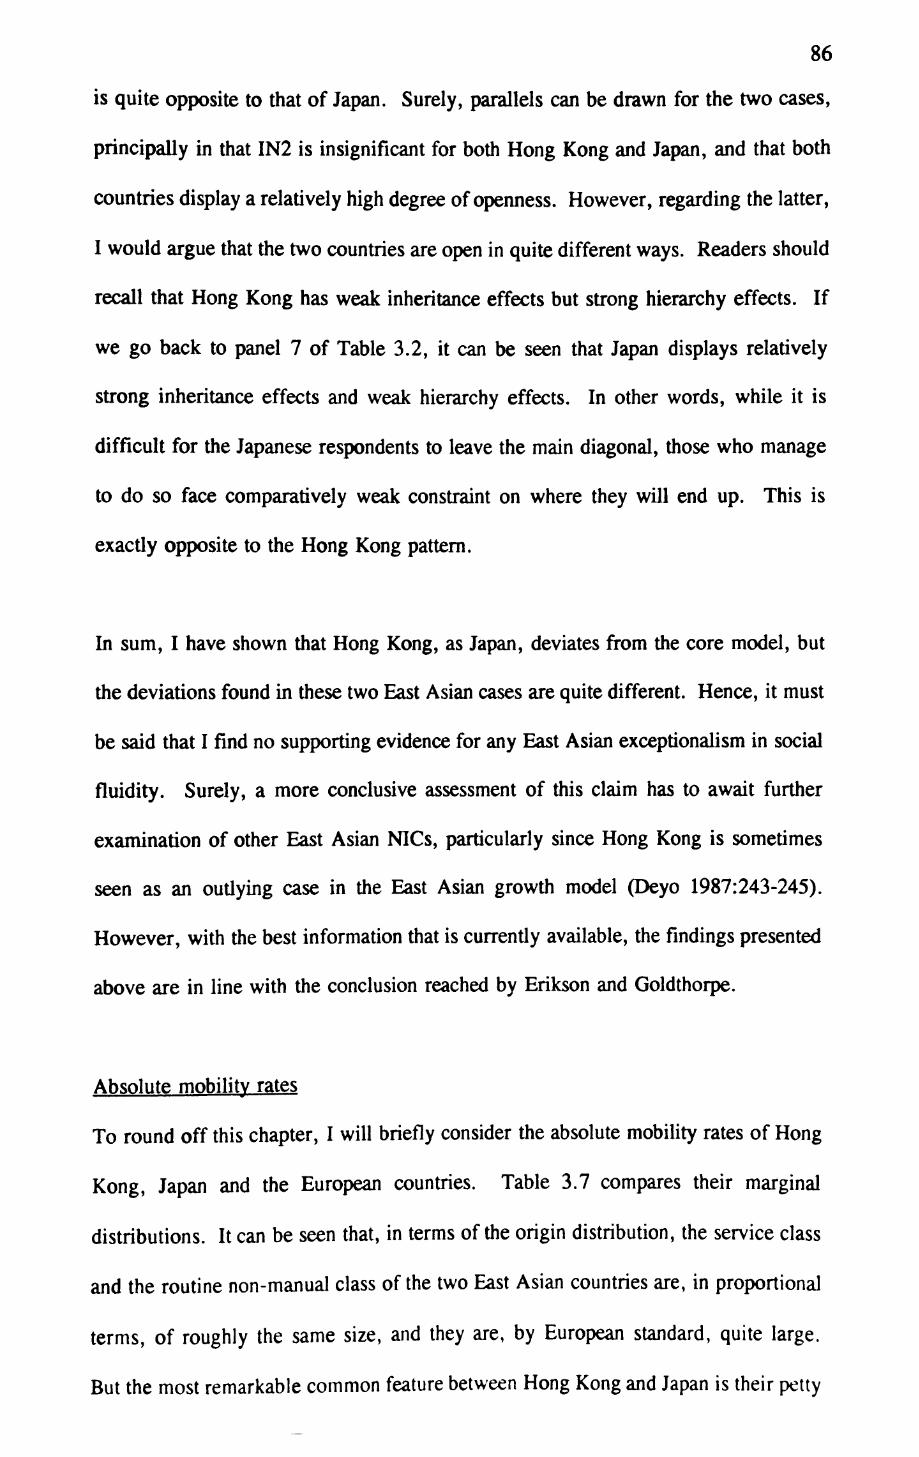
86
is quite opposite to that of Japan. Surely, parallels can be drawn for the two cases,
principally in that IN2 is insignificant for both Hong Kong and Japan, and that both
countries display a relatively high degree of openness. However, regarding the latter,
I would argue that the two countries are open in quite different ways. Readers should
recall that Hong Kong has weak inheritance effects but strong hierarchy effects. If
we go back to panel 7 of Table 3.2, it can be seen that Japan displays relatively
strong inheritance effects and weak hierarchy effects. In other words, while it is
difficult for the Japanese respondents to leave the main diagonal, those who manage
to do so face comparatively weak constraint on where they will end up. This is
exactly opposite to the Hong Kong pattern.
In sum, I have shown that Hong Kong, as Japan, deviates from the core model, but
the deviations found in these two East Asian cases are quite different. Hence, it must
be said that I find no supporting evidence for any East Asian exceptionalism in social
fluidity. Surely, a more conclusive assessment of this claim has to await further
examination of other East Asian NICs, particularly since Hong Kong is sometimes
seen as an outlying case in the East Asian growth model (Deyo 1987:243-245).
However, with the best information that is currently available, the findings presented
above are in line with the conclusion reached by Erikson and Goldthorpe.
Absolute mobility rates
To round off this chapter, I will briefly consider the absolute mobility rates of Hong
Kong, Japan and the European countries. Table 3.7 compares their marginal
distributions. It can be seen that, in terms of the origin distribution, the service class
and the routine non-manual class of the two East Asian countries are, in proportional
terms, of roughly the same size, and they are, by European standard, quite large.
But the most remarkable common feature between Hong Kong and Japan is their petty
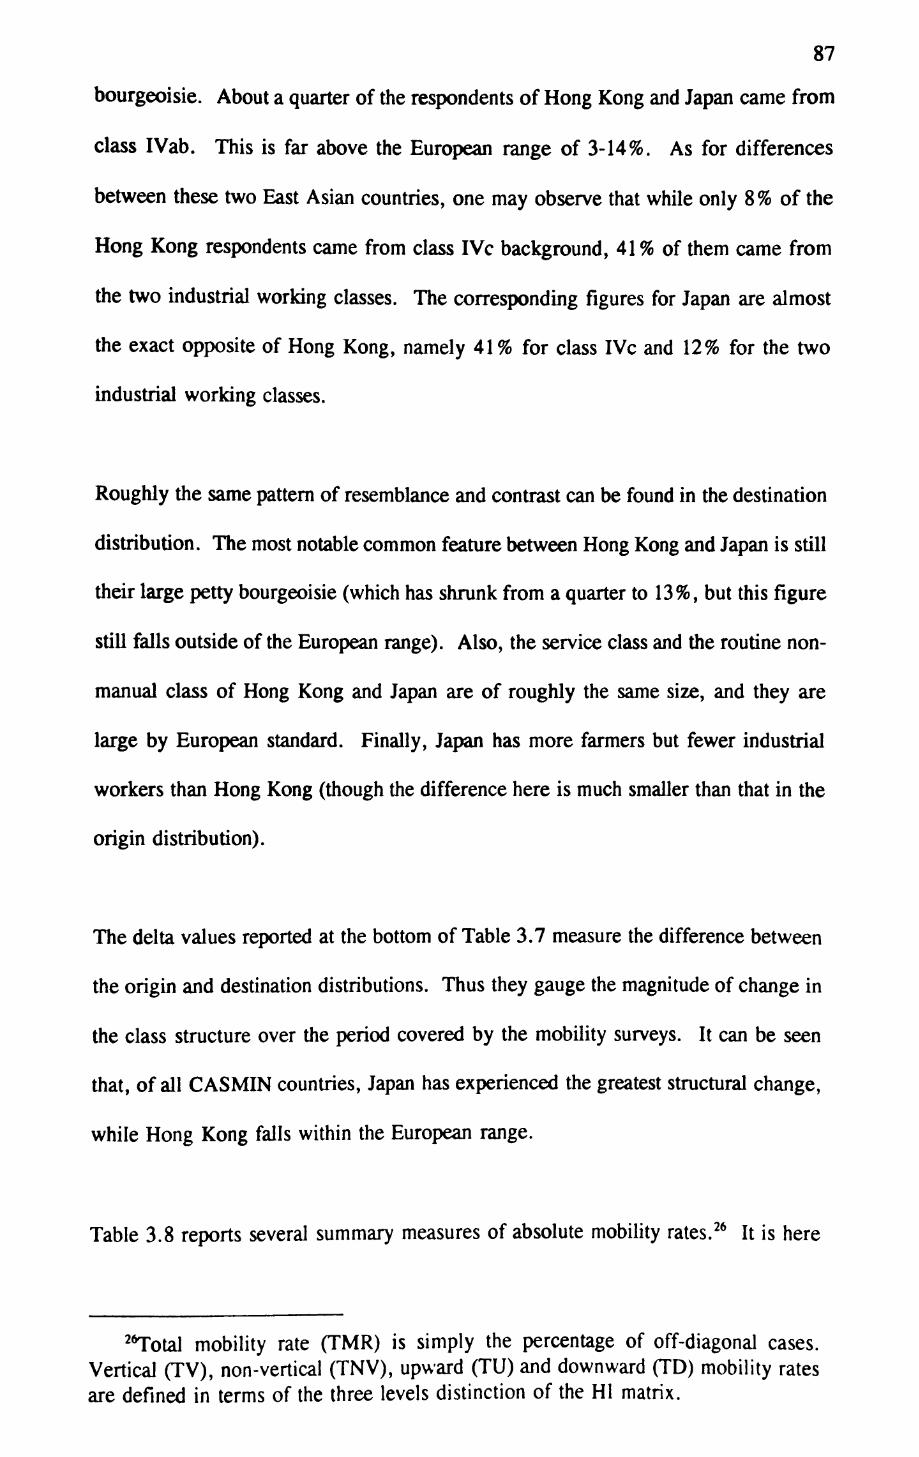
87
bourgeoisie. About a quarter of the respondents of Hong Kong and Japan came from
class IVab. This is far above the European range of 3-14%. As for differences
between these two East Asian countries, one may observe that while only 8% of the
Hong Kong respondents came from class IVc background, 41% of them came from
the two industrial working classes. The corresponding figures for Japan are almost
the exact opposite of Hong Kong, namely 41% for class IVc and 12% for the two
industrial working classes.
Roughly the same pattern of resemblance and contrast can be found in the destination
distribution. The most notable common feature between Hong Kong and Japan is still
their large petty bourgeoisie (which has shrunk from a quarter to 13%, but this figure
still falls outside of the European range). Also, the service class and the routine non-
manual class of Hong Kong and Japan are of roughly the same size, and they are
large by European standard. Finally, Japan has more farmers but fewer industrial
workers than Hong Kong (though the difference here is much smaller than that in the
origin distribution).
The delta values reported at the bottom of Table 3.7 measure the difference between
the origin and destination distributions. Thus they gauge the magnitude of change in
the class structure over the period covered by the mobility surveys. It can be seen
that, of all CASMIN countries, Japan has experienced the greatest structural change,
while Hong Kong falls within the European range.
Table 3.8 reports several summary measures of absolute mobility rates. 26 It is here
26Total mobility rate (TMR) is simply the percentage of off-diagonal cases. Vertical (TV), non-vertical (TNV), upward (TU) and downward (TD) mobility rates are defined in terms of the three levels distinction of the HI matrix.
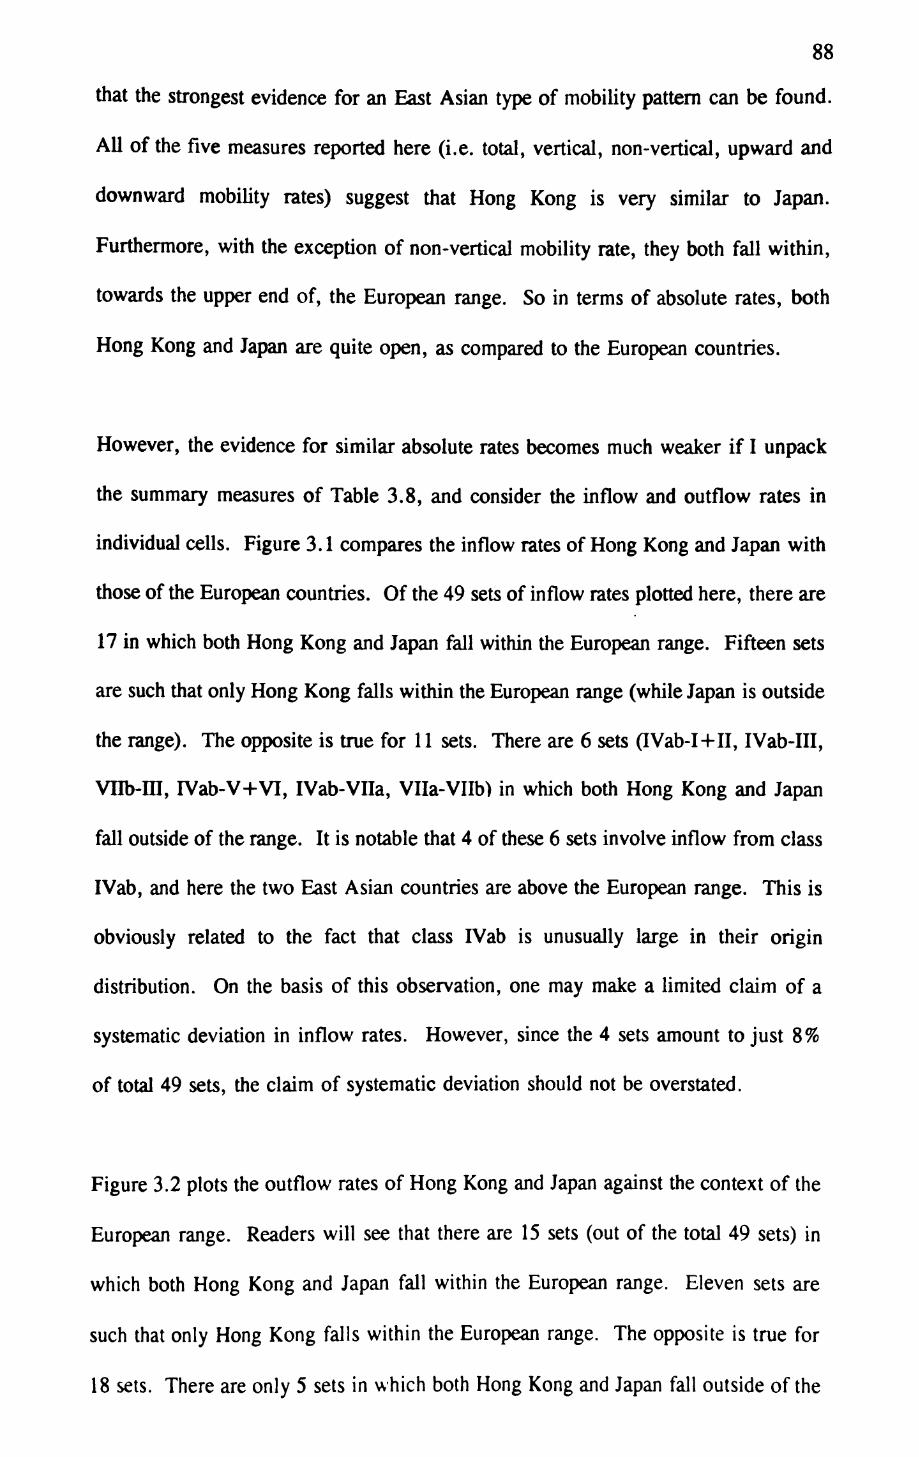
that the strongest evidence for an East Asian type of mobility pattern can be found.
All of the five measures reported here (i.e. total, vertical, non-vertical, upward and
downward mobility rates) suggest that Hong Kong is very similar to Japan.
Furthermore, with the exception of non-vertical mobility rate, they both fall within,
towards the upper end of, the European range. So in terms of absolute rates, both
Hong Kong and Japan are quite open, as compared to the European countries.
However, the evidence for similar absolute rates becomes much weaker if I unpack
the summary measures of Table 3.8, and consider the inflow and outflow rates in
individual cells. Figure 3.1 compares the inflow rates of Hong Kong and Japan with
those of the European countries. Of the 49 sets of inflow rates plotted here, there are
17 in which both Hong Kong and Japan fall within the European range. Fifteen sets
are such that only Hong Kong falls within the European range (while Japan is outside
the range). The opposite is true for 11 sets. There are 6 sets (IVab-I+II, IVab-III,
VHb-m, IVab-V+VI, IVab-VIIa, Vlla-VIIb) in which both Hong Kong and Japan
fall outside of the range. It is notable that 4 of these 6 sets involve inflow from class
IVab, and here the two East Asian countries are above the European range. This is
obviously related to the fact that class IVab is unusually large in their origin
distribution. On the basis of this observation, one may make a limited claim of a
systematic deviation in inflow rates. However, since the 4 sets amount to just 8%
of total 49 sets, the claim of systematic deviation should not be overstated.
Figure 3.2 plots the outflow rates of Hong Kong and Japan against the context of the
European range. Readers will see that there are 15 sets (out of the total 49 sets) in
which both Hong Kong and Japan fall within the European range. Eleven sets are
such that only Hong Kong falls within the European range. The opposite is true for
18 sets. There are only 5 sets in which both Hong Kong and Japan fall outside of the
89
range. But of these 5 sets, 3 (IVc-I+II, I+II-V+VI, I+II-VIIa) are such that Hong
Kong and Japan are on the opposite side of the European range. On the whole, it
must be said that, similar to what we saw for the inflow rates, the differences
between the two East Asian cases are no less significant than those between them and
the European nations.
Chapter summary
In this chapter, I have fitted the CASMIN core model to a Hong Kong mobility table.
The result is a very good fit. It is true that there are discrepancies between the
observed fluidity pattern of Hong Kong and the core model, principally in that the
IN2 matrix is insignificant and the API term has to be included in the IVc-I+II cell.
However, these deviations are quite small, and more importantly, they are different
from those observed in the Japanese case. Indeed, I have shown that Hong Kong's
fluidity pattern is characterised by very weak inheritance effects and rather strong
hierarchy effects, which is just the opposite of the Japanese pattern. This observation
is confirmed in a set of counterfactual comparisons, in which I show that, in terms
of social fluidity, Hong Kong is closer to Sweden than to Japan. So it must be said
that I find no evidence for the claim of East Asian exceptionalism in social fluidity.
Conversely put, my findings are consistent with the weak version of the FJH
hypothesis as defended by Erikson and Goldthorpe.
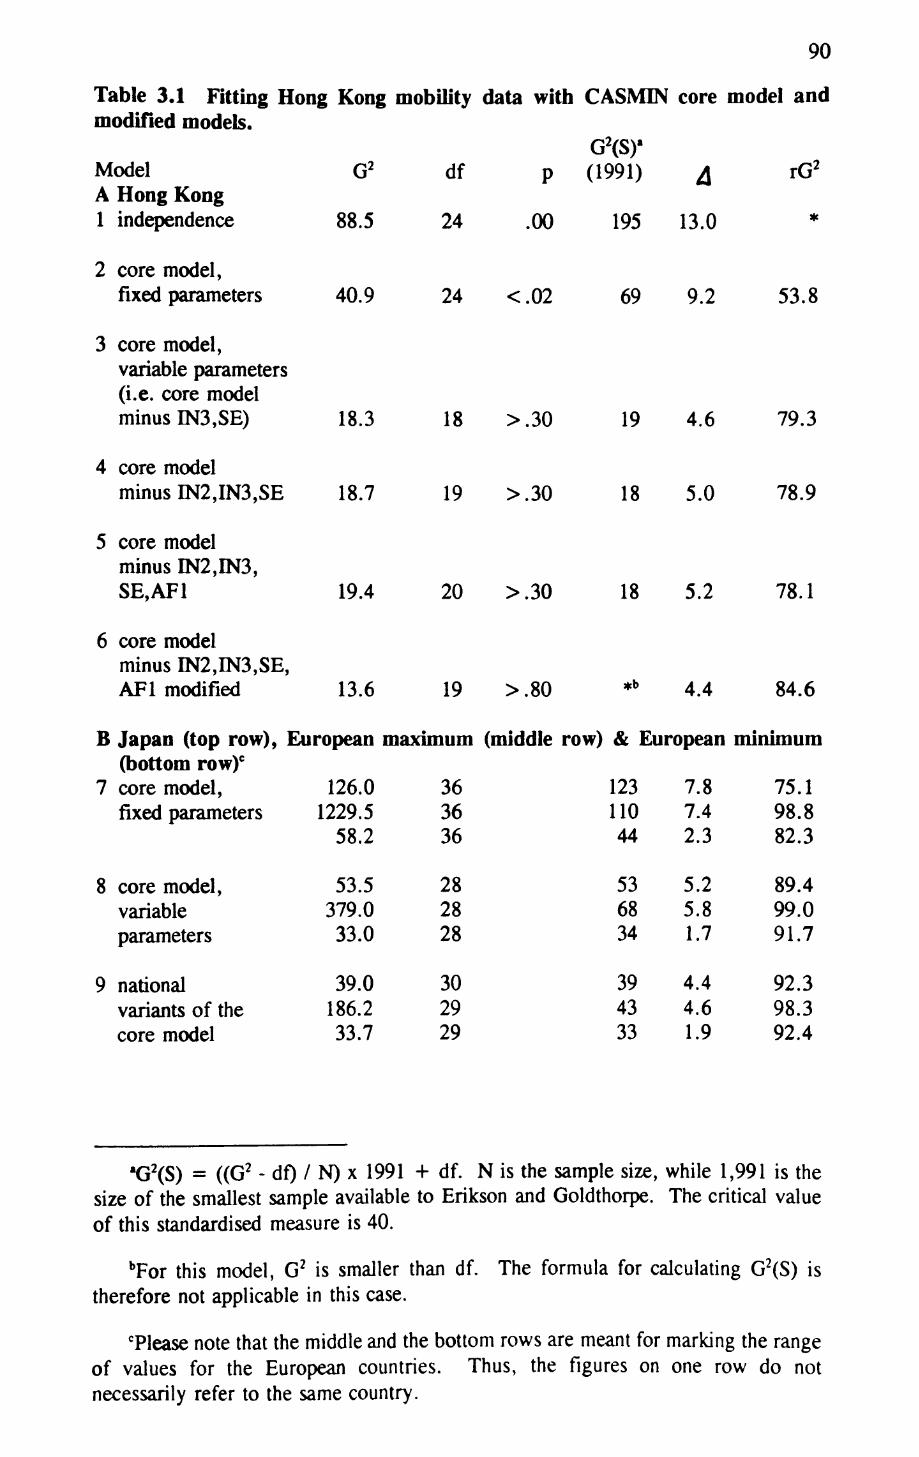
90
Table 3.1 Fitting Hong Kong mobility data with CASMIN core model and modified models.
G2(S)'Model G2 df p (1991) 4 rG2 A Hong Kong 1 independence 88.5 24 .00 195 13.0 *
2 core model, fixed parameters 40.9 24 <.02 69 9.2 53.8
3 core model, variable parameters (i.e. core model minus IN3,SE) 18.3
4 core modelminus IN2,IN3,SE 18.7
5 core model minus IN2,IN3, SE,AF1 19.4
6 core modelminus IN2,IN3,SE,API modified 13.6
18
19
>.30
>.30
19
18
4.6
5.0
79.3
78.9
20 >.30 18 5.2 78.1
19 >.80 *b 4.4 84.6
B Japan (top row), European maximum (middle row) & European minimum (bottom row)0
7 core model, 126.0 36 123 7.8 75.1 fixed parameters 1229.5 36 110 7.4 98.8
58.2 36 44 2.3 82.3
8 core model, variable parameters
9 national variants of the core model
53.5379.033.0
39.0186.233.7
282828
302929
536834
394333
5.25.81.7
4.44.61.9
89.499.091.7
92.398.392.4
G2(S) = ((G2 - df) / N) x 1991 + df. N is the sample size, while 1,991 is the size of the smallest sample available to Erikson and Goldthorpe. The critical value of this standardised measure is 40.
bFor this model, G2 is smaller than df. The formula for calculating G2 (S) is therefore not applicable in this case.
'Please note that the middle and the bottom rows are meant for marking the range of values for the European countries. Thus, the figures on one row do not necessarily refer to the same country.
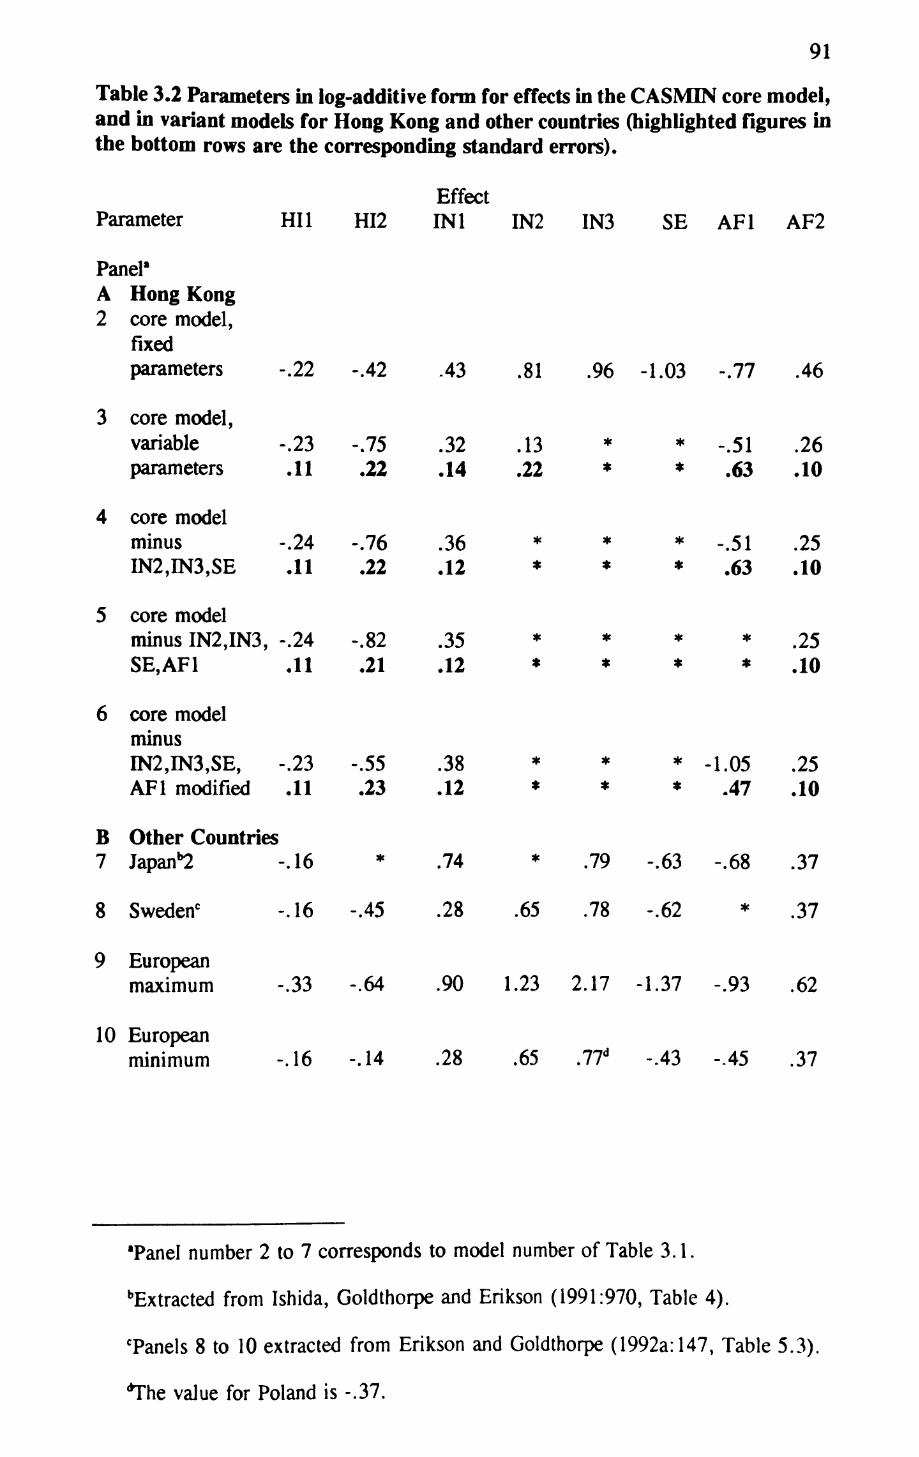
91
Table 3.2 Parameters in log-additive form for effects in the CASlVflN core model, and in variant models for Hong Kong and other countries (highlighted figures in the bottom rows are the corresponding standard errors).
Parameter
Panel'A Hong Kong2 core model,
fixed parameters
3 core model,
HI1 HI2EffectINI IN2 IN3 SE API AF2
-.22 -.42 .43 .81 .96 -1.03 -.77 .46
4
5
6
B7
8
variableparameters
core modelminusIN2,IN3,SE
core modelminus IN2,IN3, -.SE,AF1
core modelminusIN2,IN3,SE,AF1 modified
Other CountriesJapan1^
Sweden0
2311
2411
2411
2311
16
16
-.75.22
-.76.22
-.82.21
-.55.23
*
-.45
.32
.14
.36
.12
.35
.12
.38
.12
.74
.28
.13 * * -.51
.22 * * .63
* * * -.51* * * .63
* * * ** * * *
* * * -1.05* * * .47
* .79 -.63 -.68
.65 .78 -.62 *
.26
.10
.25
.10
.25
.10
.25
.10
.37
.37
9 European maximum
10 European minimum
-.33 -.64
-.16 -.14
.90 1.23 2.17 -1.37 -.93 .62
.28 .65 .77d -.43 -.45 .37
Panel number 2 to 7 corresponds to model number of Table 3.1.
Extracted from Ishida, Goldthorpe and Erikson (1991:970, Table 4).
Tanels 8 to 10 extracted from Erikson and Goldthorpe (1992a:147, Table 5.3).
*The value for Poland is -.37.
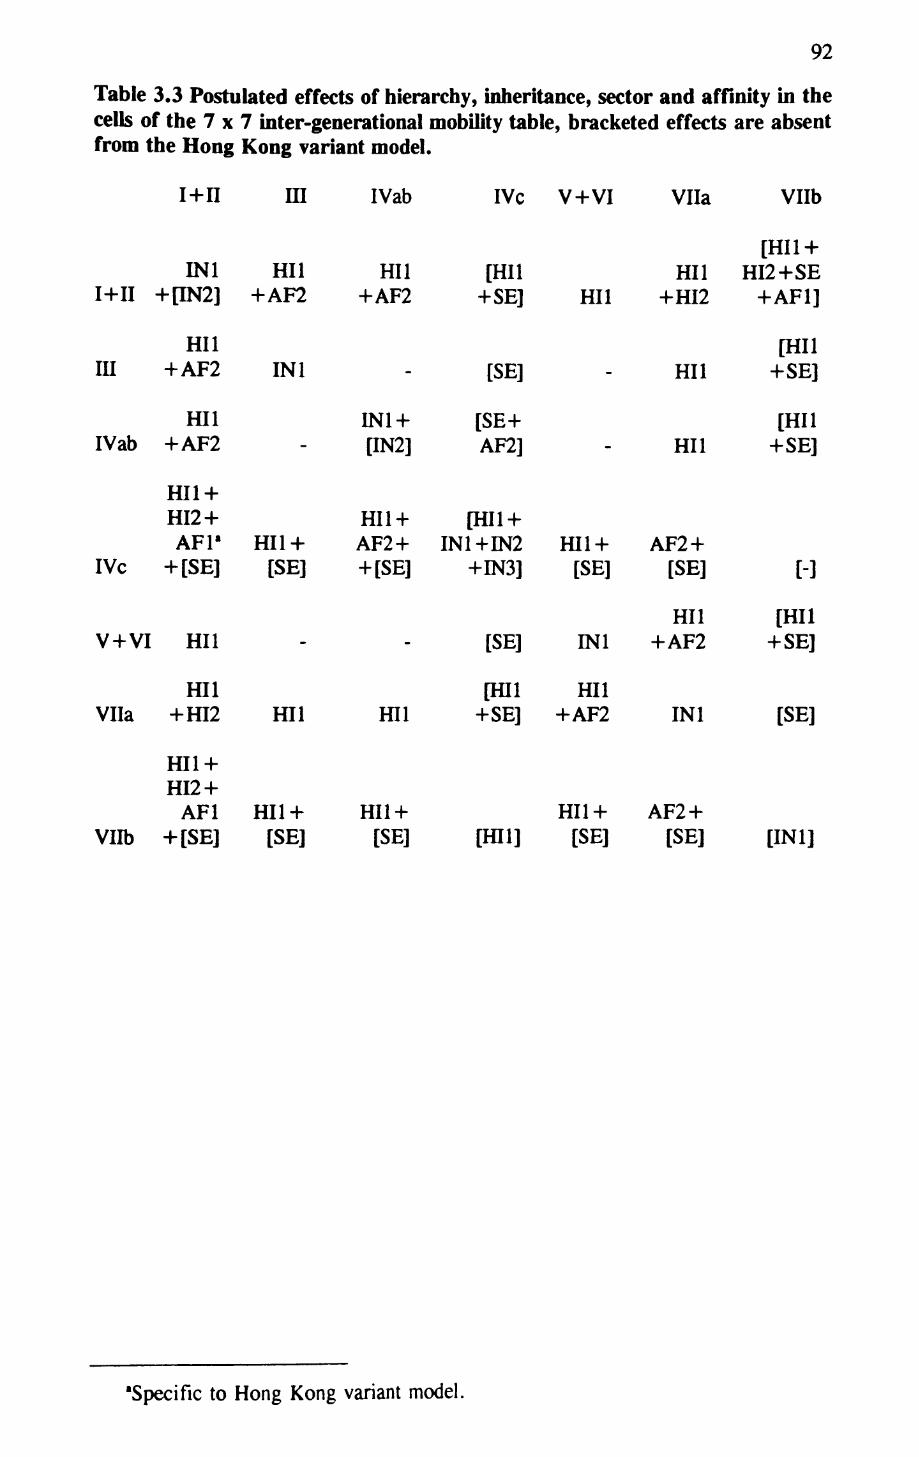
92
Table 3.3 Postulated effects of hierarchy, inheritance, sector and affinity in the cells of the 7x7 inter-generational mobility table, bracketed effects are absent from the Hong Kong variant model.
i+n ra IVab IVc V+VI Vila Vllb
I+II
III
IVc
INI h[IN2]
HIl+AF2
HIl+AF2
HI1 + HI2+ API"
+ [SE]
HIl
HIl+AF2
INI
-
HI1 + [SE]
HIl+AF2
-
IN1 + PN2]
HI1 +AF2 + + [SE]
[HIl +SE] HIl
[SE]
[SE+ AF2]
[HI1 + IN1+IN2 ffll +
+IN3] [SE]
[SE] INI
HIl +HI2
HIl
HIl
AF2 + [SE]
HIl+AF2
[HI1 + HI2+SE
+AF1]
[HIl +SE]
[HIl +SE]
H
[HIl +SE]
Vila
Vllb
HI1 +HI2
HI1 + HI2 +
AF1 + [SE]
ffll
HI1 + [SE]
HIl
Hll-f [SE]
[ffll +SE]
[ffll]
HIl-I-AF2
HI1 + [SE]
INI
AF2 + [SE]
[SE]
[INI]
'Specific to Hong Kong variant model.
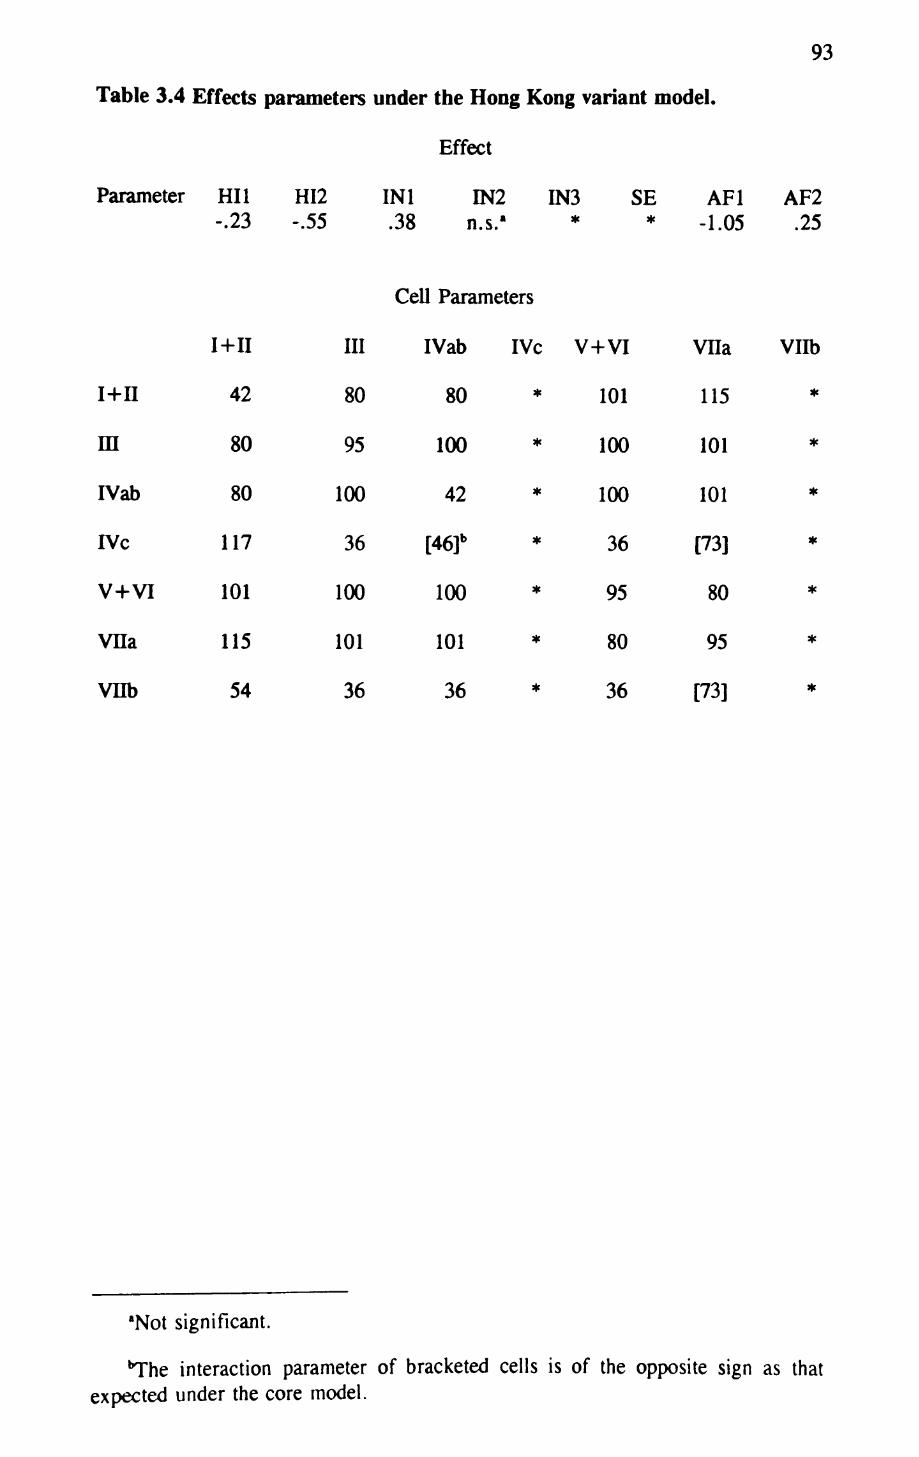
Table 3.4 Effects parameters under the Hong Kong variant model.
Effect
Parameter HI1 HI2 INI -.23 -.55 .38
IN2 IN3 n.s.« *
SE*
93
API AF2 -1.05 .25
Cell Parameters
i+n
m
IVab
IVc
V+VI
VHa
vnb
I+II
42
80
80
117
101
115
54
III
80
95
100
36
100
101
36
IVab
80
100
42
[46]b
100
101
36
IVc
*
*
*
*
*
*
*
V+VI
101
100
100
36
95
80
36
VHa
115
101
101
[73]
80
95
[73]
Vllb
'Not significant.
The interaction parameter of bracketed cells is of the opposite sign as that expected under the core model.
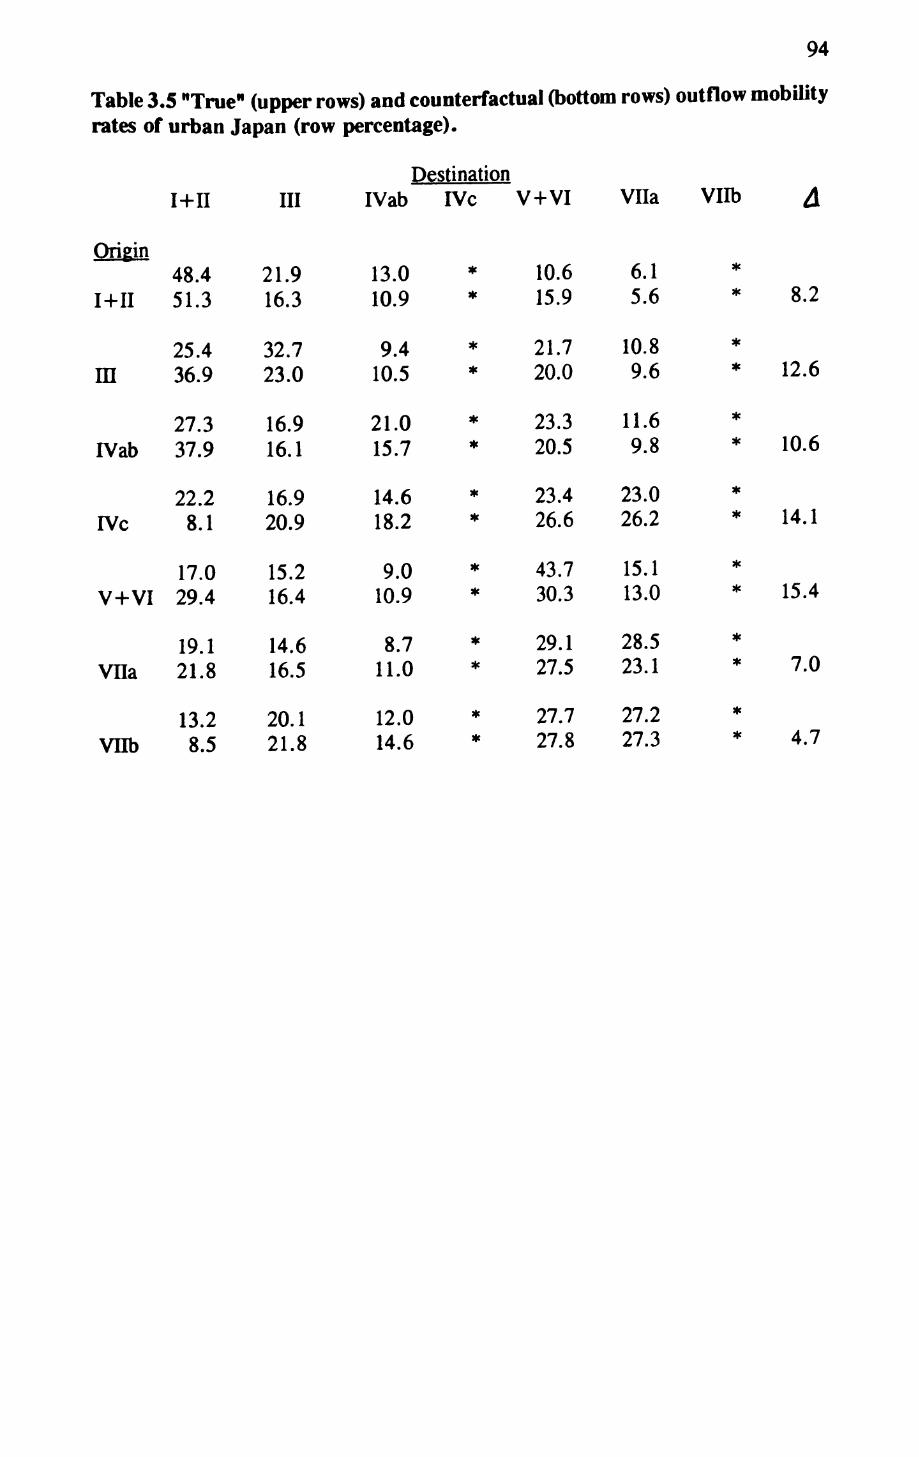
94
Table 3.5 "True" (upper rows) and counterfactual (bottom rows) outflow mobility rates of urban Japan (row percentage).
Destination
Origin
I+II
ra
IVab
IVc
V+VI
VHa
vnb
i+n
48.4 51.3
25.4 36.9
27.3 37.9
22.2 8.1
17.0 29.4
19.1 21.8
13.2 8.5
III
21.9 16.3
32.7 23.0
16.9 16.1
16.9 20.9
15.2 16.4
14.6 16.5
20.1 21.8
IVab
13.0 10.9
9.4 10.5
21.0 15.7
14.6 18.2
9.0 10.9
8.7 11.0
12.0 14.6
IVc
* *
**
* *
* *
* *
* *
**
V+VI
10.6 15.9
21.7 20.0
23.3 20.5
23.4 26.6
43.7 30.3
29.1 27.5
27.7 27.8
VHa
6.1 5.6
10.8 9.6
11.6 9.8
23.0 26.2
15.1 13.0
28.5 23.1
27.2 27.3
Vllb
# *
* *
* *
* *
* *
* *
* *
a
8.2
12.6
10.6
14.1
15.4
7.0
4.7
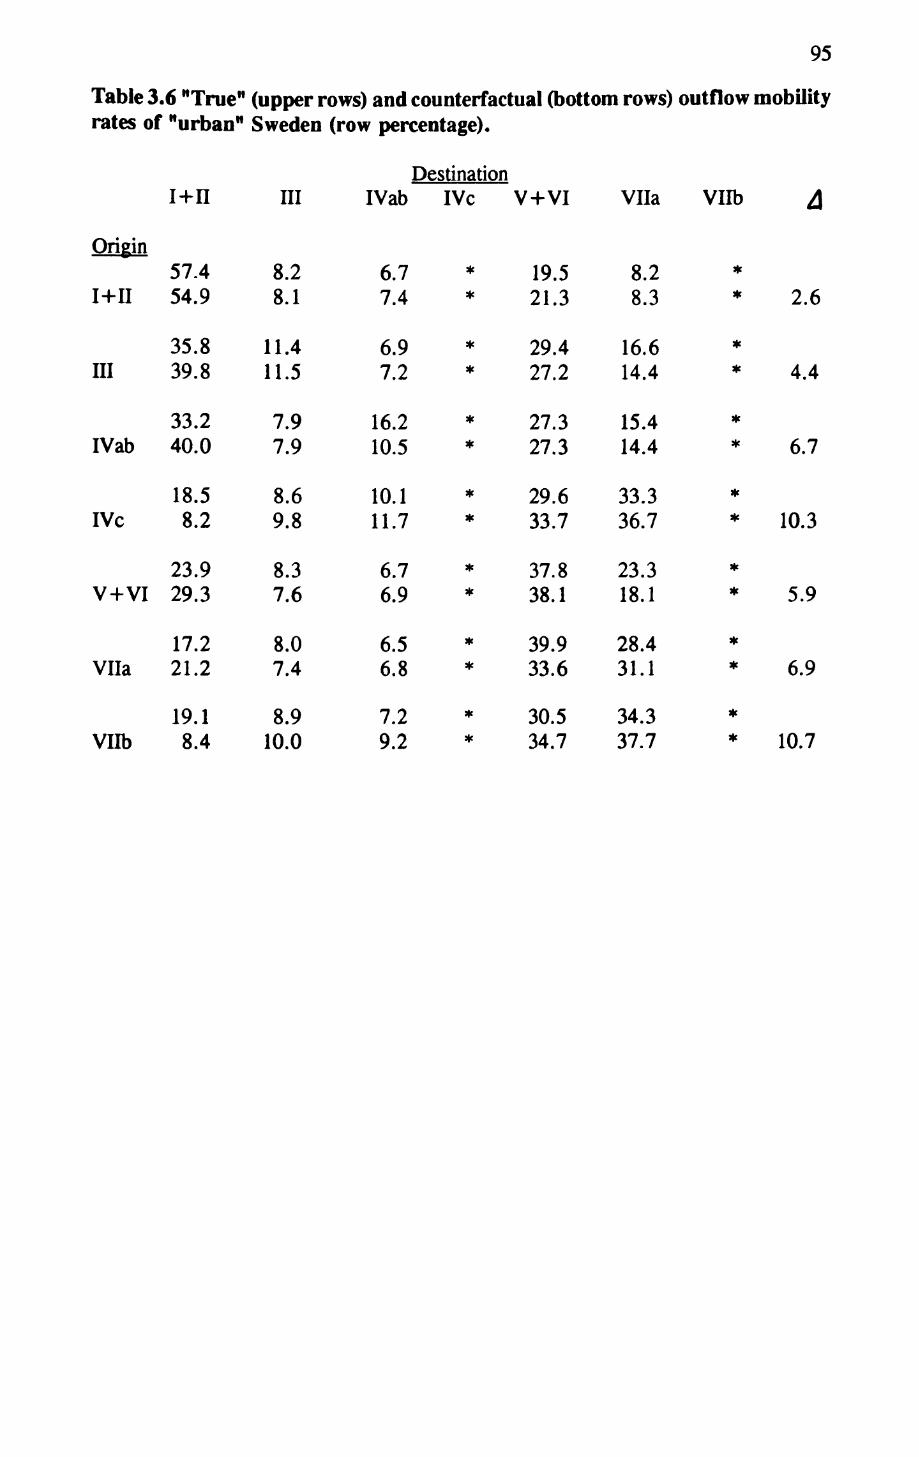
95
Table 3.6 HTrue" (upper rows) and counterfactual (bottom rows) outflow mobility rates of "urban" Sweden (row percentage).
Destination
Origin
i+n
III
IVab
IVc
V+VI
VUa
Vllb
i+n
57.4 54.9
35.8 39.8
33.2 40.0
18.5 8.2
23.9 29.3
17.2 21.2
19.1 8.4
III
8.2 8.1
11.4 11.5
7.9 7.9
8.6 9.8
8.3 7.6
8.0 7.4
8.9 10.0
IVab
6.7 7.4
6.97.2
16.2 10.5
10.1 11.7
6.7 6.9
6.5 6.8
7.2 9.2
IVc
* *
*
*
*
*
*
*
*
*
*
*
V+VI
19.5 21.3
29.427.2
27.3 27.3
29.633.7
37.8 38.1
39.9 33.6
30.5 34.7
Vila
8.2 8.3
16.614.4
15.4 14.4
33.3 36.7
23.3 18.1
28.4 31.1
34.3 37.7
Vllb ^
* 2.6
* 4.4
* 6.7
* * 10.3
* 5.9
* * 6.9
* 10.7
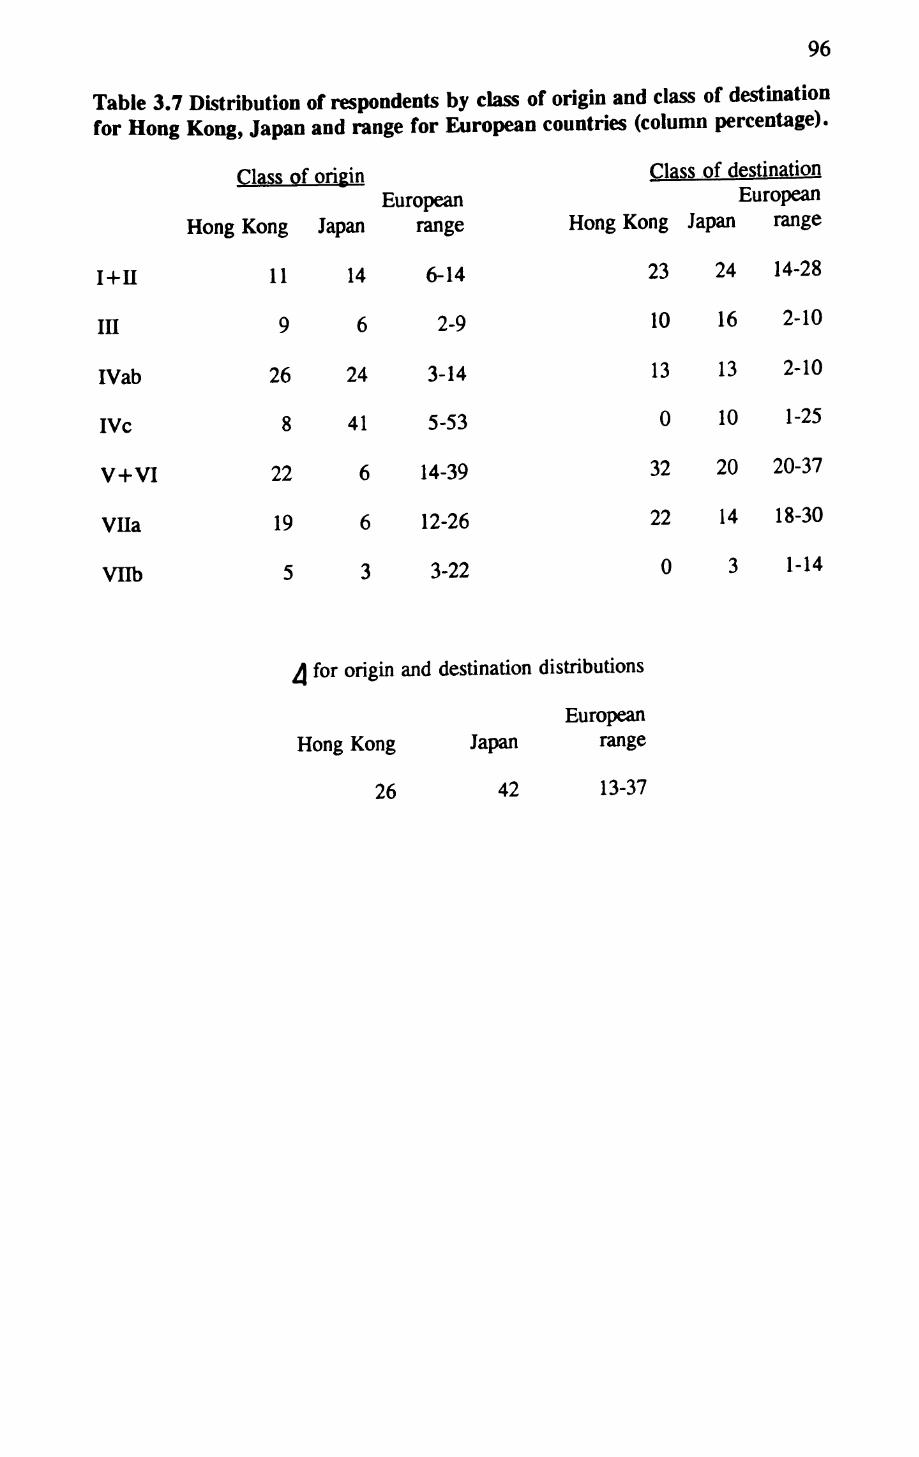
96
Table 3.7 Distribution of respondents by class of origin and class of destination for Hong Kong, Japan and range for European countries (column percentage).
Class of origin Class of destinationEuropean European
Hong Kong Japan range Hong Kong Japan range
I+n 11 14 6-14 23 24 14-28
in 96 2-9 10 16 2-10
IVab 26 24 3-14 13 13 2-10
IVc 8 41 5-53 0 10 1-25
V+VI 22 6 14-39 32 20 20-37
Vila 19 6 12-26 22 14 18-30
Vm> 5 3 3-22 0 3 1-14
for origin and destination distributions
European Hong Kong Japan range
26 42 13-37
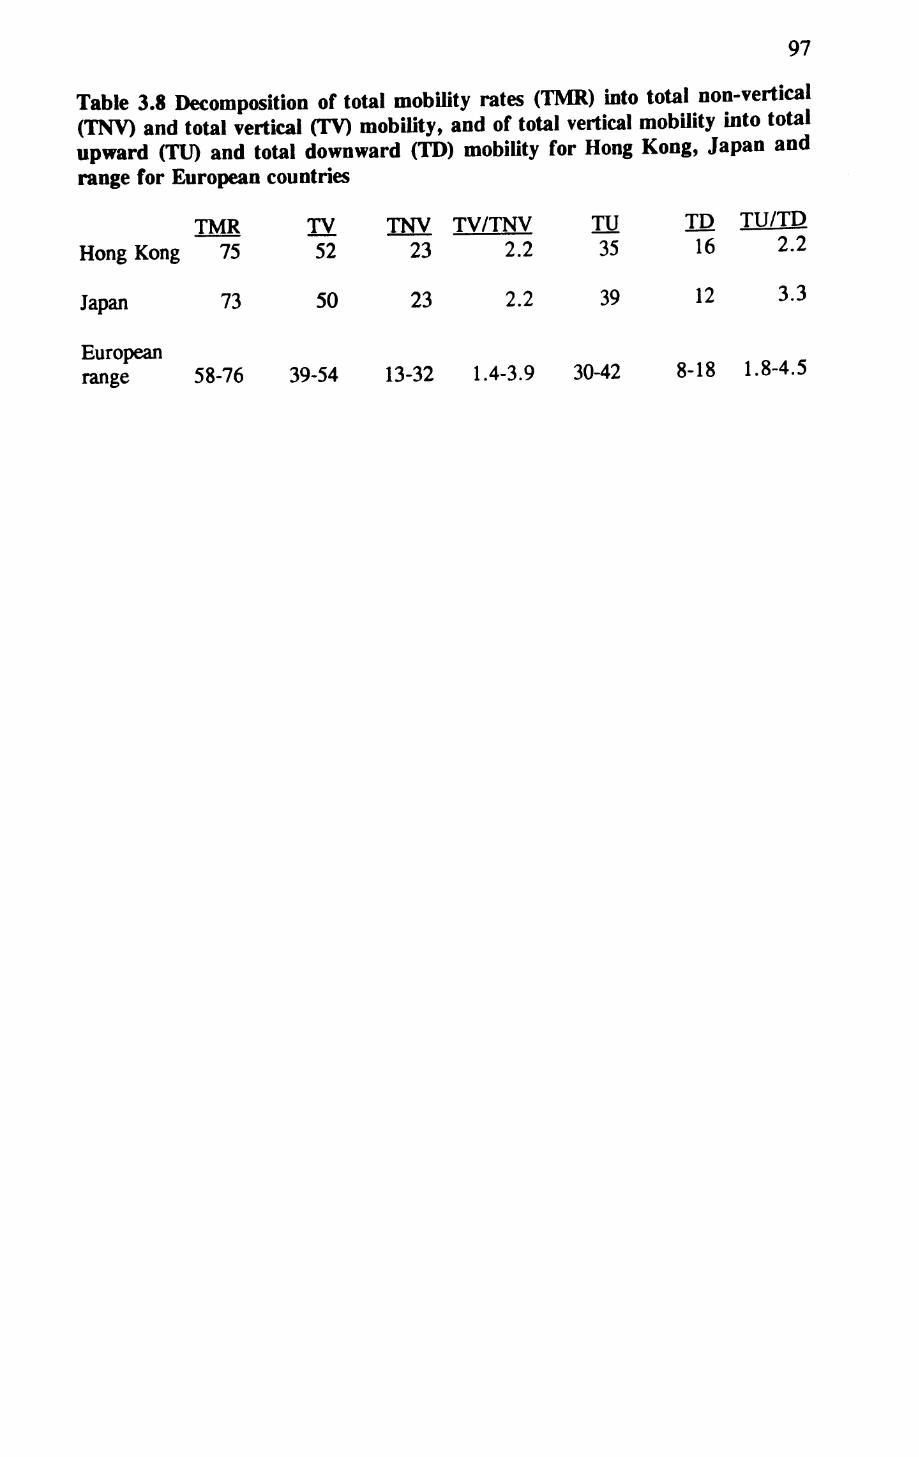
97
Table 3.8 Decomposition of total mobility rates (TMR) into total non-vertical (TNV) and total vertical (TV) mobility, and of total vertical mobility into total upward (TU) and total downward (TD) mobility for Hong Kong, Japan and range for European countries
TMR IV TNV TV/TNV TO ID TU/TD
Hong Kong 75 52 23 2.2 35 16 2.2
Japan 73 50 23 2.2 39 12 3.3
Europeanrange 58-76 39-54 13-32 1.4-3.9 30-42 8-18 1.8-4.5
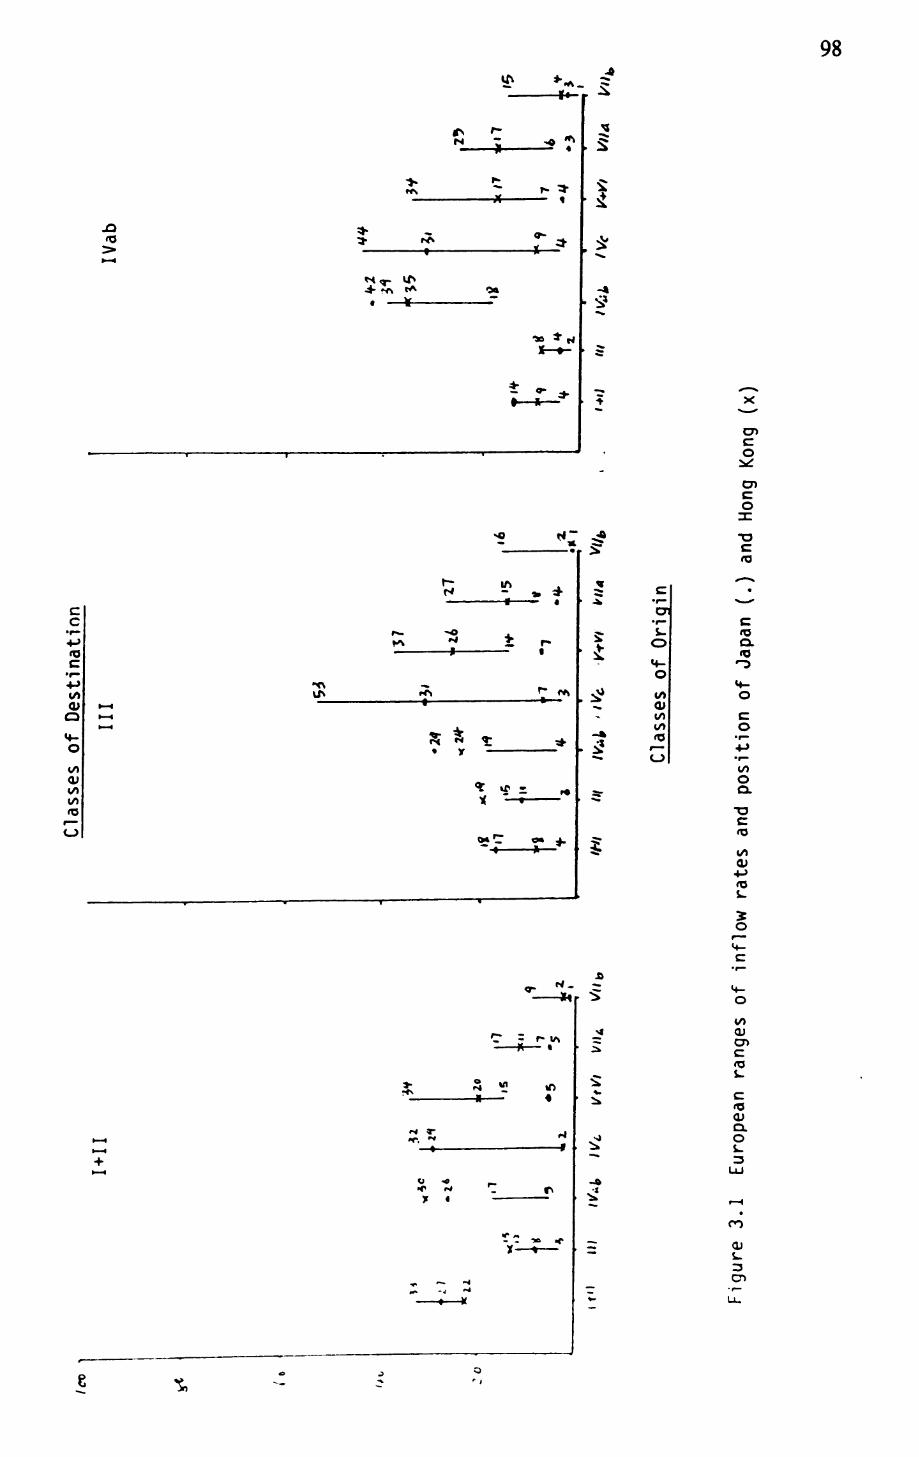
lev
^Classes
of D
estination
«
14"H
*• *
C j
i
i:
I + II
*c i* .1 91
3»
4
> 2.
•
• 20 ••
- £4 1
»g n4
i A *
III
•24
H
t««
II *
2* K?
" 3'\
'7
57 I £
Q
IV-
*7•27 i
5
IT
•
16 •z * i
IVab
<r i<
;
r T 1 T*
'» l t*
^ *•
4
.«
W *
25
:c/7
Tf
i7
t
A
it-
+ I
f '
it"
Hiin
lvf
V+Vi
Classes
of O
rigin
Figure 3.1
European ranges of inflow r
ates and
position of J
apan (.)
and
Hong Kong (x)
oo
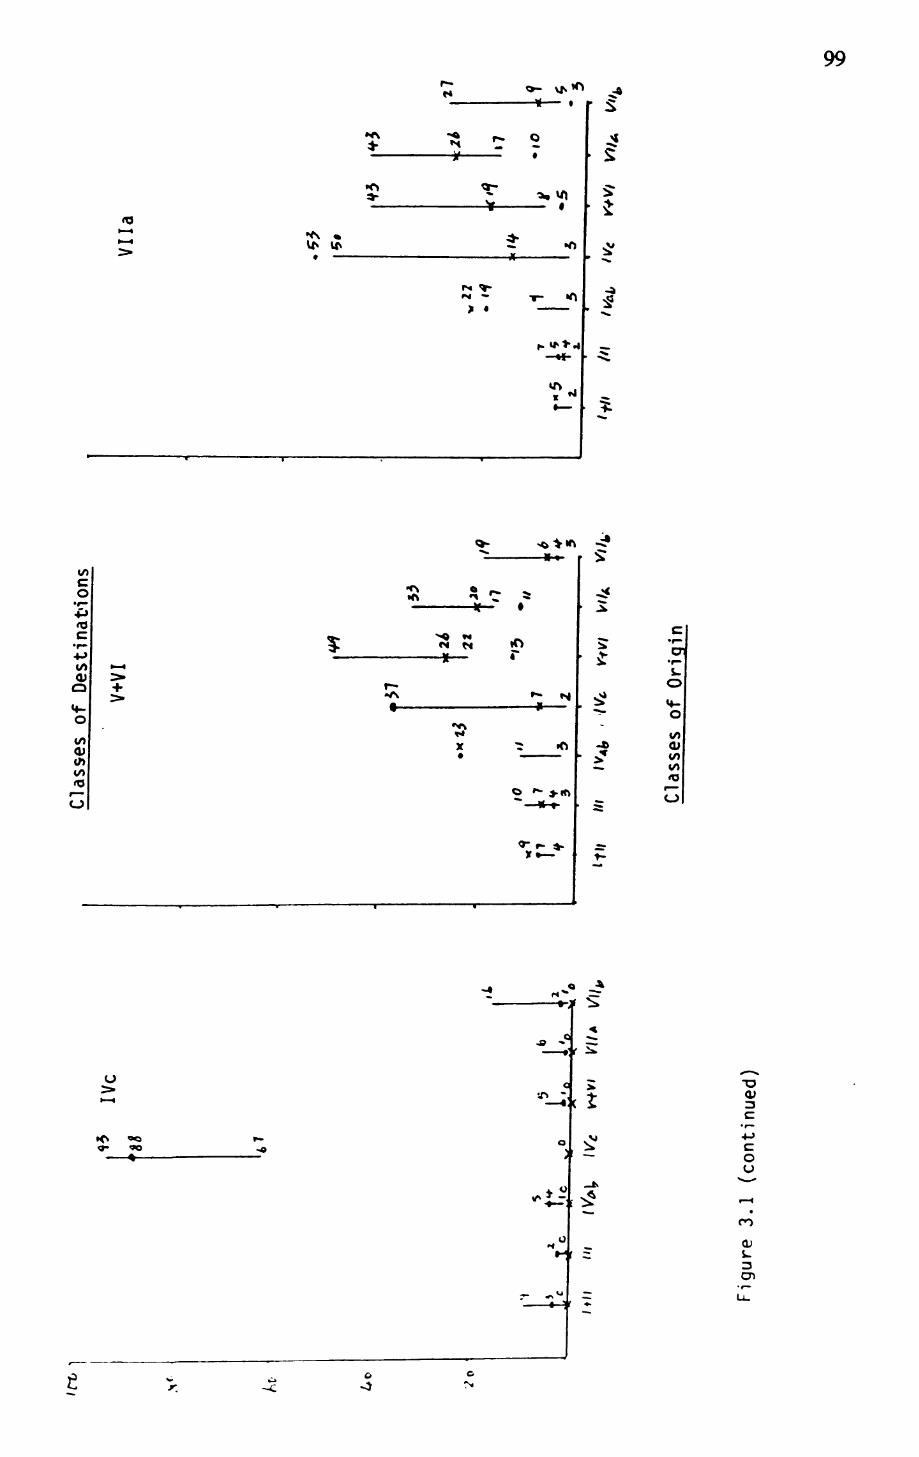
v At-
IVc
;» ^
Figure 3.
1 (continued)
Classes
of D
estinations
V+VI
•x21
33
v- 5
ttl,
Ml• 7
V*
Clas
ses
of O
rigin
Vila
27
7 5 v i
5.
In
-7
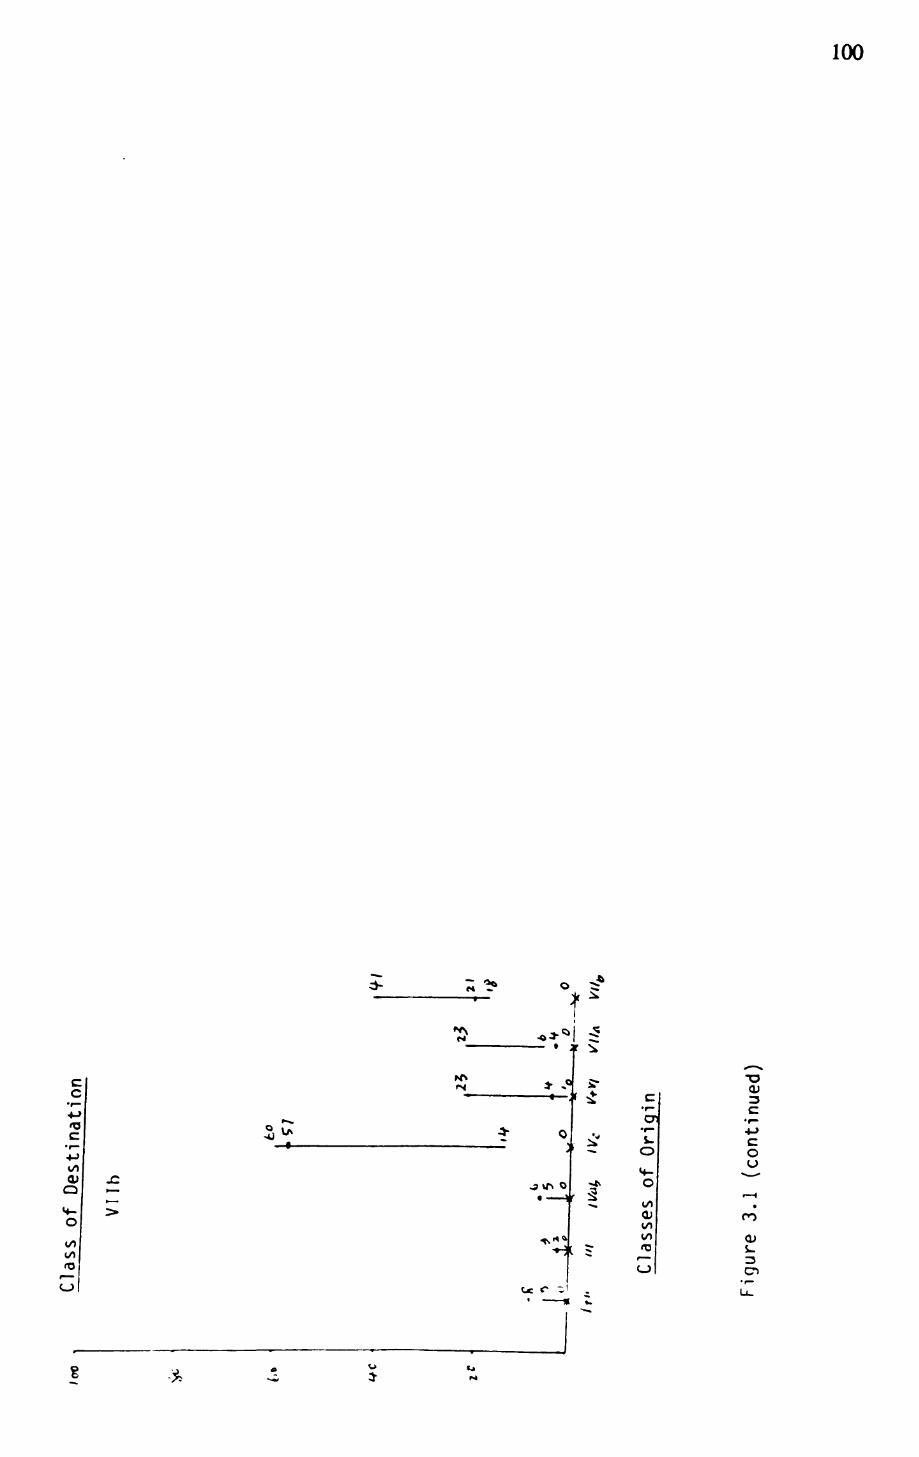
/00
Class
of D
estination
Vllh
• V
5
2521
b .vIt"
HI
Classes
of O
rigin
Figure 3
.1 (continued)
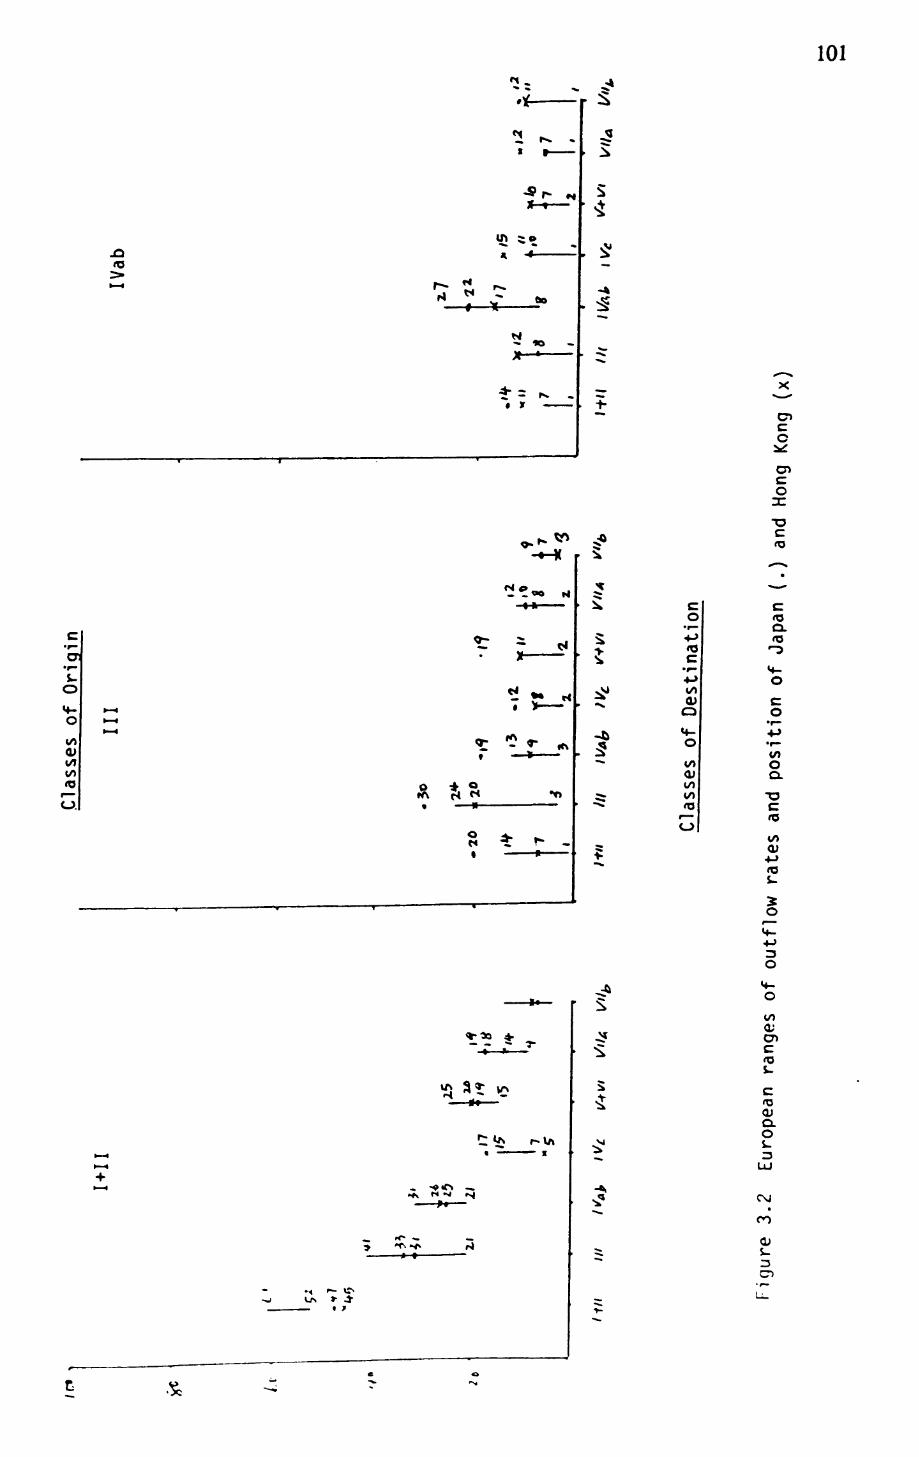
fc 26
Hli
I + II
".n
,5It-
1
- T
Cla
sses
of
Orig
in
III
5o
• 20
20
i' 3
- ll
T i/
i!J
9r
Tf 1
r i
* S
l z la
U
^
in
" 7H
H
IVab
21
,? r*»
" ( 7 r
, '2
1 •
Classes
of D
estination
Figure 3
.2
European ranges of o
utflow r
ates a
nd p
osition
of J
apan (.)
and
Hong K
ong
(x)
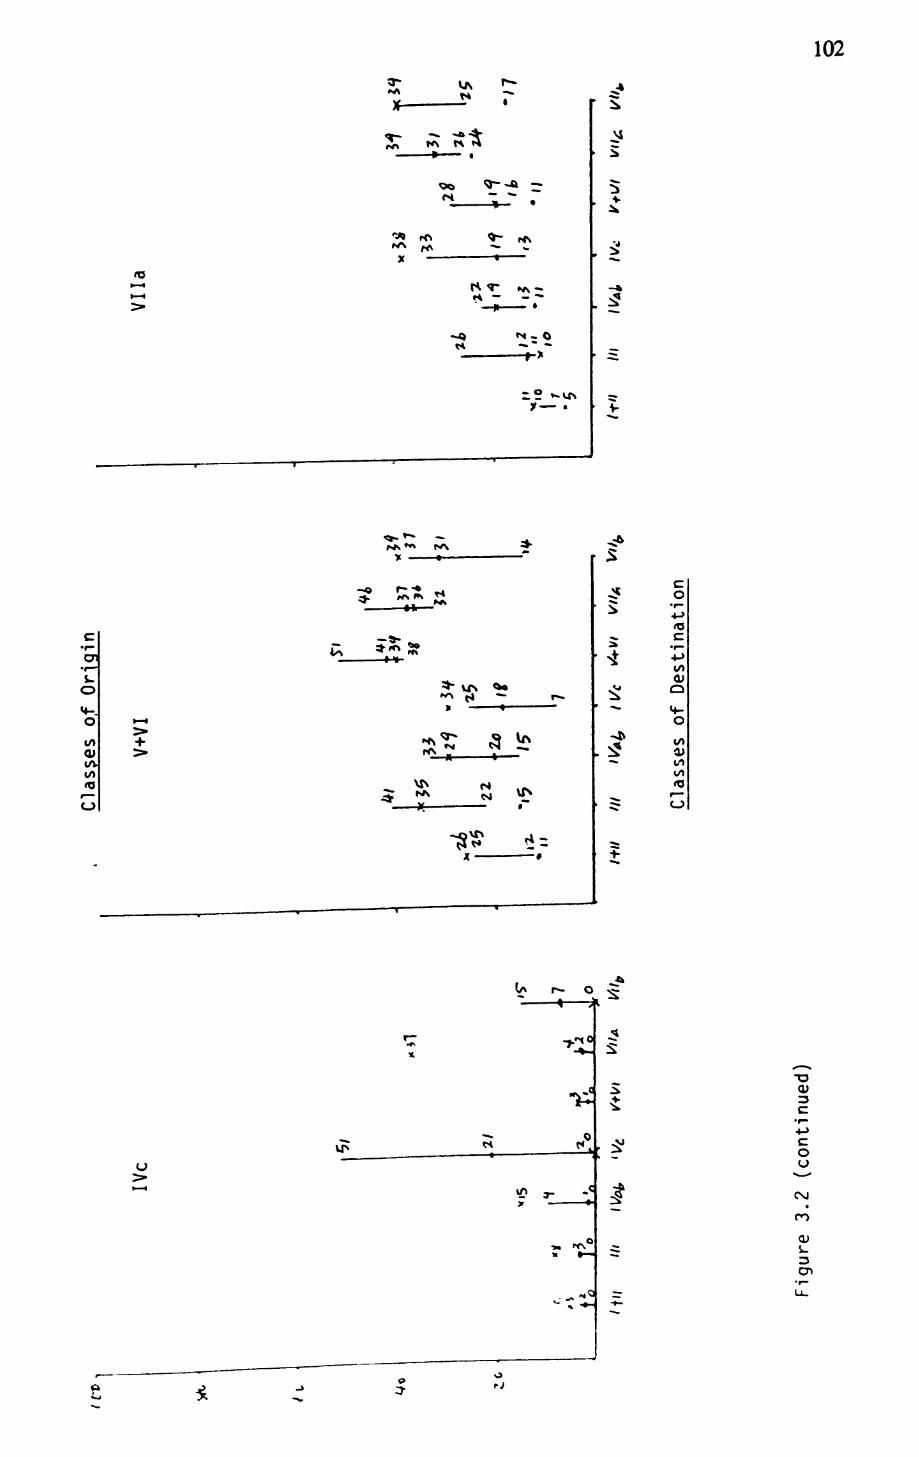
i it /1
IVc
inTl
41
,o
Cla
sses
of
Orig
in
V+VI
:
22It
J'
///
Vila
, 2*
1 5
Figure 3.
2 (continued)
Cla
sses
of
Des
tinat
ion
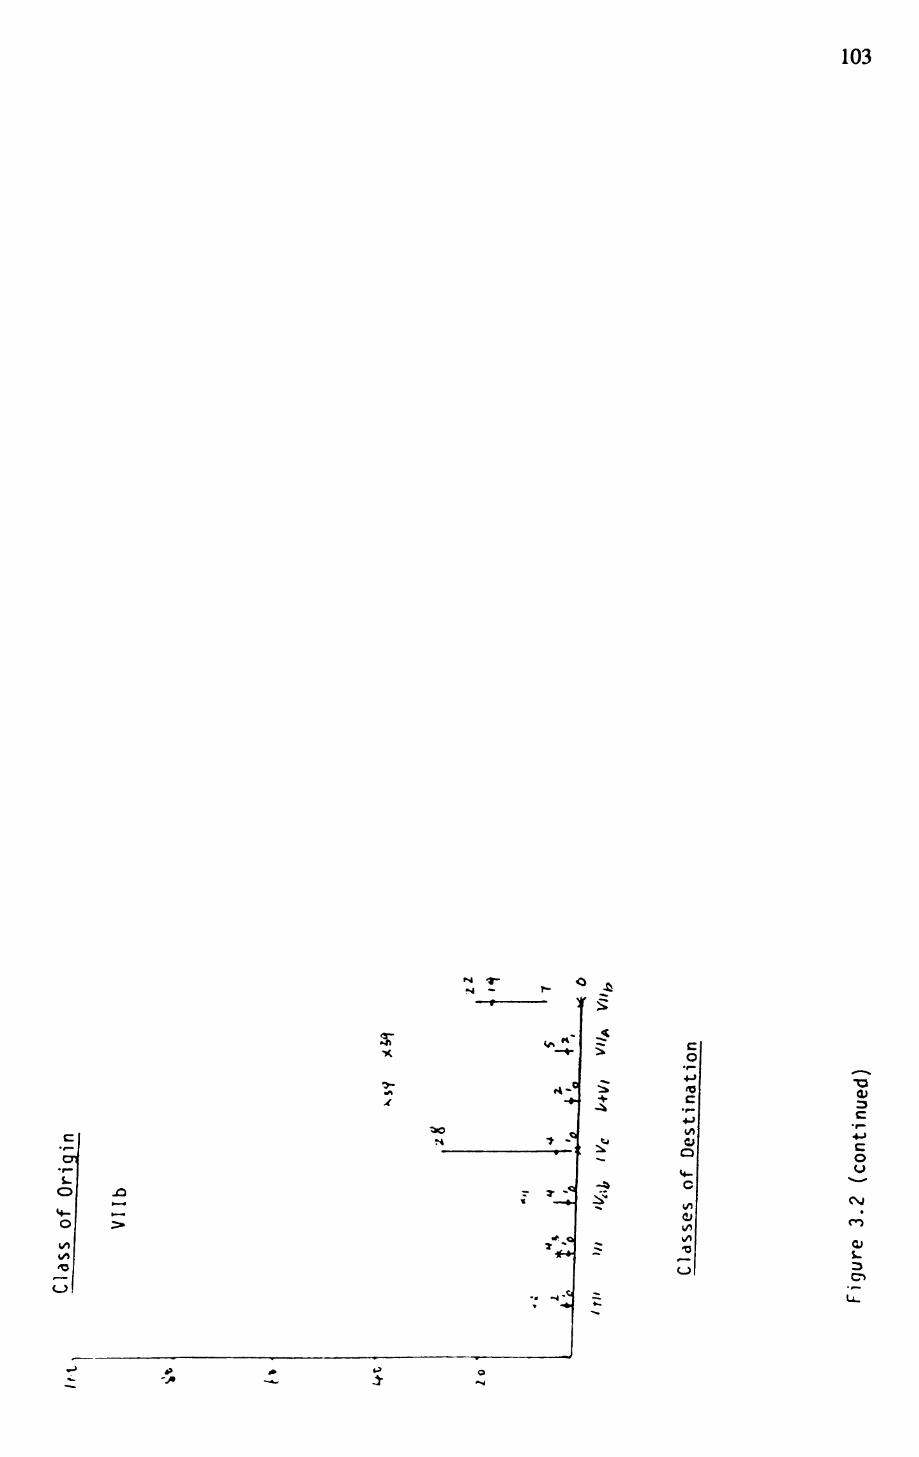
Lft
Zo
Class
of O
rigin
————————
Vllb **
'!
'//
'1
Classes
of D
estination
Figure 3
.2 (
continued)
s
104
Chapter 4
Typical Mobility Paths
As noted in Chapter 1, it is possible that certain occupations routinely offer better
prospects of worklife mobility to their incumbents than do others. Following Broom
and Smith (1963), I will call these positions bridging occupations. This chapter seeks
to identify the bridging occupations of Hong Kong. To this end, I will study the
career history of those respondents who have achieved worklife mobility into the
service class. More specifically, work history data collected in the follow-up study
will be subjected to optimal matching analysis, a cluster analysis technique recently
introduced into sociology. But first let us consider some preliminary evidence drawn
from the main survey.
Preliminary evidence
The main survey does not contain complete work history data. However, there is
information on the respondents' first job. 1 So as a crude measure of worklife
mobility, Figure 4.1 shows, for all respondents of the main survey, the outflow
patterns from class of origin to class of first job (entry class), and then to class of
destination. Since outflows of less than 10% to the entry class or less than 5% to the
destination class are omitted, this figure represents the more important mobility flows
between these three time points of the respondents' life course. 2
'In the 1989 survey, the term "first full-time job" was not defined in the question put to the respondents (say, in terms of number of hours worked per week). But since there is no locally recruited full-time army or any requirement for military service in Hong Kong, it should have been clear to the respondents that this question refers to civilian jobs only.
2Although smaller mobility flows between origin, entry and destination classes are not shown in Figure 4.1, readers should note that such exceptional cases do exist, and that, for some purposes, they are of equal theoretical importance as the norm.
105
Figure 4.1 is notable on several counts. First, the Hong Kong respondents have
experienced a fair amount of worklife movement. For example, for those who are
of service class origin, 57% have the same entry and destination class. For
respondents of other class origins, the corresponding figures are: 52% for class III,
56% for class IVab, 46% for class IVc, 49% for class V-f VI, 44% for class Vila,
and 51% for class Vllb. So, judging with only two observations, namely first and
current jobs, about half of the respondents have stayed in the same class throughout
their career. However, if occupational data at more time points were available, a
greater volume of worklife movement would be revealed.
Second, with respect to the question of counter-mobility into the service class, it can
be observed that for respondents of service class origin, 35% attained service class
status as they took up their first job. And among the 65% who took up non-service
class first job, only one in six were able to return to the service class through
worklife mobility. This amounts to 11 % of all respondents from service class origin.
This percentage is considerably lower than the corresponding figure for England
(25%) and France (18%), but it comes very close to that of the two former state
socialist countries in the CASMIN sample, Hungary (11 %) and Poland (8%) (Erikson
and Goldthorpe 1992a:288-89, Figure 8.1).
Third, for those who have experienced worklife mobility, their movement was
generally short in range, and was confined by the manual/non-manual boundary. In
fact, there were so few movements crossing this boundary that they were not
represented in Figure 4.1 at all. In other words, the worklife movement of those who
took up their first job in class III would most probably lead them to class I+11. At
the same time, for those who started in class V+VI or Vila, if they were to
experience worklife mobility, they would almost invariably end up in the other
106
manual class or in class IVab.
For our present purpose of identifying the bridging occupations, what is most striking
about Figure 4.1 is that, although Hong Kong's service class is not closed to people
from any class origin, nearly all of its members started their worklife in the service
class itself or in the routine non-manual class. This seems to be a distinctive feature
of Hong Kong -- Erikson and Goldthorpe (1992a) have documented significant
worklife movement from class V4-VI to class I+11 in England, France, Hungary and
Poland. Put differently (and disregarding the exceptional cases not shown in Figure
4.1), irrespective of class origin, any person who aspires to get into Hong Kong's
service class has to get a service class job right away when he leaves school, or
failing that, he should get a class in job.
In Chapter 3, I have noted that, from a comparative point of view, Hong Kong has
strong hierarchical barriers against intergenerational class mobility. From Figure 4.1,
one can see that these hierarchical barriers also operate against worklife mobility.
Relative to manual occupations, routine non-manual jobs are the bridging occupations
of Hong Kong.
Three cautionary notes are in order here. First, the routine non-manual class of the
CASMIN schema is occupationally a very broad and mixed category. It includes
occupations as diverse as typist, sales representative, shop assistant and radio operator
(just to give a few examples). It is likely that only some, rather than all, class III
jobs possess the bridging power. So it is important for us to be more specific. Here
one can at least make the distinction between class Ilia jobs (routine non-manual work
in administration and commerce) and class Illb jobs (personal service work).
107
Second, although worklife movement from the manual classes to the service class is
uncommon, if it can be shown that most of such movements originate from a small
set of manual occupations, then this set of jobs can still be considered as bridging
occupations. This is because, in a straightforward sense, they offer better prospects
of worklife mobility into the service class than other manual occupations.
Third, what Figure 4.1 compares is the bridging power of different first jobs. It is
not clear if the same conclusion will stand if we consider not just the first job, but the
entire career of the respondents. This is worth pondering because job-changing rate
is particularly high among young people. Many of the first jobs reported in Figure
4.1 may have lasted for only a very short period of time, and thus have little impact
on the respondent's career. For example, a respondent who took up a first job with
poor prospects may soon realize this, and quickly change to a more promising one.
If he moved into the service class from the second job, then I would argue that the
bridging occupation is his second rather than his first job. Unfortunately, this second
job is not represented in Figure 4.1. The general point here is that we will have to
consider the complete work history of the respondent ~ the duration of each job, how
one job leads to another, and so on. If this view is taken, then we should take typical
mobility paths rather than individual bridging occupations as the object of inquiry.
Optimal matching analysis
This brings us to the work history data of the follow-up study. The primary question
here is whether the socially mobile typically follow certain job sequences. There are
several ways to approach this question. The most straightforward one is simple
enumeration. For any finite set of discrete events, one can write down all logical
combinations of events, and then count the frequency of their occurrence in a sample
over a particular period of time (e.g. Hogan 1978, see also Berger, Steinmuller and
108
Sopp 1993 who consider only the empirically observed sequence types rather than all
logical combinations). The problem of this approach is that it will quickly become
very cumbersome as job classification becomes finer and as more detailed career data
become available. Alternatively, one can devise, on theoretical ground, a few basic
career types (e.g. steady promotion through bureaucracy, sharp rise to the top, etc.),
and then count how many cases there are in each type (e.g. Keller 1953). The
problem here is that the career types used in enumeration are theoretical constructs
rather than empirically derived categories. So it begs the original question of what
career types are empirically discernible.
There are other, technically more sophisticated, ways to handle work history data.
Gaertner (1990), for example, fits a saturated loglinear model to a cumulative job
event table. Then, from the cell parameters, she infers the transition probability
between every pair of jobs. This enables her to reconstruct the typical promotion
paths of her sample of education administrators. This is one way to identify typical
paths empirically. However, there is a serious drawback: it disregards variation in
job duration. Irrespective of how long a job was held, it appears as one observation
in the cumulative table. This means that a job that lasted three months is treated with
equal weight as another which was held for, say, 20 years. This is problematic to
the extent that the impact of an event on subsequent mobility chance depends on its
duration.
Class time budget studies (e.g. Gershuny 1993) do not share this shortcoming because
the object of this type of studies is precisely the amount of time (or what portion of
their career) people spent in different classes. However, these studies overlook the
order in which jobs were taken up. This is unsatisfactory because although it is
logically possible for, say, a school teacher of today to become an assistant secondary

109
principal tomorrow, and then a secondary curriculum supervisor later on, as Gaertner
has shown, this job sequence is empirically less probable than the following one:
teacher, secondary curriculum supervisor, and then assistant secondary principal. In
other words, jobs often appear in certain order, and people are often required to have
done job A before they are hired to do job B. To overlook the order of jobs is to
miss an important element of the structure of worklife.
Finally, hazard rate models (e.g. Mayer and Tuma 1990) predict how episode
duration (or the probability of the occurrence of an event) varies with sociological
variables. It is very powerful in modelling the forces that shape the unfolding of
events (e.g. what determines women's re-entry into the labour market after child
bearing). However, I would argue that to ascertain what ways there are for events
to unfold is a task which complements, if it does not have logical priority to, the
search for causal factors of change. On the whole, it must be said that the various
methods mentioned above tackle career data from different angles. Consequently,
they are useful and informative in their own ways. However, none of them models
the duration as well as the order of events fully and directly. This means that they
do not answer the central question of this chapter -- what are the typical mobility
paths that lead to the service class?3
To the best of my knowledge, optimal matching analysis (or optimal alignment
analysis) is the most suitable tool for handling our present problem. This method,
recently introduced into sociological analysis by Abbott,4 is a direct application of a
3See Halpin (1993) for an extended discussion of the strength and weaknesses of these tools for analysing work history data.
4Abbott and his associates have already applied this method to several substantive areas, including the development of the welfare state (Abbott and DeViney 1992), the order of professionalization (Abbott 1991), careers of musicians (Abbott and Hrycak
110
technique routinely used by molecular biologists who study DNA or protein
sequences. In fact, since optimal matching procedure is currently not available in all
social science packages, both Abbott and I resort to programs originally developed
for DNA or protein sequencing. 5 Since most sociologists are probably unfamiliar
with this method, let me briefly explain its nuts and bolts here (see Abbott and
Hrycak 1990 for an extended introduction).
Suppose the work history of two respondents can be represented as follows:
respondent A Vila Vila VI Vila Vila
respondent B Vila Vila V IVa
What optimal matching analysis does is to count how many substitutions, insertions
or deletions are needed in order to turn sequence A into sequence B, or vice versa.
In this example, both respondents started their worklife as unskilled manual workers.
Respondent A has taken up a skilled manual job mid-way through his worklife, but
he returned to class Vila in the end. This is largely a case of worklife immobility.
In contrast, respondent B became a foreman at about the same time as respondent A
took up the skilled manual job. He then moved on to become a small employer. One
possible way to turn sequence A into sequence B is to substitute V for VI (third
observation), IVa for Vila (fourth observation), and then delete Vila (fifth
observation). Now imagine that each substitution, insertion or deletion incurs a
1990), and Morris dances (Abbott and Forrest 1986). For theoretical statements of sequence analysis, see Abbott (1992, 1990, 1983).
5For his calculations, Abbott uses a software called the Belding Program Series. Unfortunately, I have not been able to obtain that program. The analysis of this chapter is done with the GCG (Genetics Computer Group) program PILEUP. Although the algorithms of these two programs are probably very similar, there could be minor differences, so they may give different results to the same set of sequences. The only way to check against this possibility is to repeat the analysis of this chapter with the Belding programs.
Ill"cost" to the pair of sequences under comparison ~ the more substitutions one makes,
the higher the cost, and the greater the distance between the pair (the same for
insertion and deletion). Depending on how much each substitution, insertion and
deletion costs, a overall similarity score (or distance score, depending on how the
calculation is programmed) can be given to this pair of sequences. (Deciding these
costs is a theoretical issue which I will come back to later.) Once such pairwise
comparison is repeated for all sequences in the sample, we will have a measure of
how far every sequence resembles every other sequences. These similarity scores are
then input to a clustering procedure which will tell us how many clusters of sequences
there are, and what the typical sequence of each cluster looks like.
So, optimal matching is essentially a technique of cluster analysis for sequence data.
Its result is sensitive to, among other things, (a) how the sequences are coded — the
job categories used, and (b) how substitution, insertion and deletion costs are defined.
For the analysis of this chapter, these two issues are operationalized as follows.
First, all worklife events are coded according to the full version of the CASMIN
schema (see Table 1.1). As a first attempt, I believe this 11-fold schema is
reasonably detailed for capturing most of the theoretically interesting worklife
movement experienced by our respondents. We may want to make some finer
distinctions within the 11 categories later on, but this will depend on the empirical
result of this first attempt. In addition to the 11 categories of work events, there are
also three categories of non-work events: unemployment, returning to full-time
education, and unspecified events. 6 With reference to these 14 categories, the work
Altogether, the 80 respondents of the follow-up study reported 527 spells of various work and non-work events. Out of this total, 4 events are classified as unspecified. In some of these cases, the respondents were unspecific about a particular period of their worklife because of very frequent job changes, which makes it very difficult for them to recall their career in detail. In one case, the respondent was not fully committed to any full time job - a few days of work were followed by
112
history of all respondents are recorded at yearly intervals. 7
Second, with respect to the issue of substitution costs, what has to be decided is the
relative similarity of events. For example, we may think that unskilled manual jobs
are more similar to skilled manual jobs than they are to service class jobs. Hence,
different substitution costs should be assigned to Vila-VI and VIIa-I. This should be
fairly uncontroversial. However, it is not so clear as to whether we should assign
different substitution costs to, say, V-VIIa and VI-Vila. In the end, these decisions
have to be grounded on our conception of theoretically important divisions between
social classes. Also, the usefulness of a particular set of substitution costs should
partly be judged on whether they produce theoretically and substantively meaningful
clustering of sequences. Consequently, there is inevitably an element of trial and
error in the following analysis.
At this point, I propose to adapt the hierarchial matrices of the CASMIN core model
in order to develop a provisional matrix of substitution costs (Table 4.1). This seems
appropriate given the relatively strong hierarchy effects seen in Hong Kong. As
noted in Chapter 3, Erikson and Goldthorpe suggest that the CASMIN class schema
can be divided into three hierarchical levels: class I+11 constitutes the first level,
classes III, IVab, and V+VI form the second level, and classes Vila and Vllb belong
to the third level. Class IVc, as class of origin, is regarded as part of the third level,
but as class of destination, it is included in the second level. Erikson and Goldthorpe
hold that this three-fold division captures broad differences between the social classes
in terms of their relative desirability as class of destination, and the relative
a few days of rest, and so on. This is used as a residual category.
7Events lasting between 6 and 12 months are rounded up to a year, while those shorter than 6 months are disregarded.

113
advantages they offer as class of origin. I have adopted this three-fold distinction in
Table 4.1. However, one minor change is required: since substitution matrices used
in optimal matching have to be symmetrical, class IVc is always included in the
second level. Table 4.1 is a similarity or proximity matrix (i.e. a large cell value
denotes relative closeness between the respective pair of events). So all diagonal cells
are given the largest value, 4. Cells that refer to movement within the same level are
coded 3, those which denote movement crossing one level boundary are coded 2, and
those which refer to movement crossing two level boundaries are coded 1.
Movement between work events on the one hand, and unemployment or unspecified
events on the other, is accorded with the smallest value, 0. But movement between
work events and full-time education is coded 1. Finally, since, for our present
purpose, there is no need to make a distinction between class I and class II jobs, cell
I-II is also coded 4.
As for insertion and deletion costs, it is reasonable to think that they should vary for
different events. For example, if returning to full-time education is unusual, then
inserting a spell of full-time education to a job sequence should cost more than
inserting a work spell. However, as Abbott and Hrycak (1990) point out, whether
a particular event is unusual depends on our prior knowledge of what a typical
sequence looks like. So, following their practice, I have set a fixed cost for all
insertions and deletions. 8
Typical mobility paths to the service class
8In fact, the PILEUP program does not allow the assignment of variable insertion/deletion cost. To be more accurate, it calculates insertion/deletion cost according to the following formula, C + n x W, where C is a fixed insertion/deletion cost (a constant for all events), n is the number of insertion/deletions needed in a particular "gap", and W is a gap-length weight. I have set C = 5 and W = 0.3.
114
Having defined the substitution and insertion/deletion costs, let us now turn to the
substantive question of this chapter. Thirty-seven of my 80 respondents have
achieved worklife mobility into the service class. This section optimally matches the
work history of these 37 people. The following analysis proceeds in two stages. In
the first stage, I seek to identify the typical paths that lead to the service class. My
objective is to reveal their structural features: what jobs typically precede what other
jobs, how long are the paths, and so on. I will also repeat the optimal matching
procedure with two variant substitution matrices with a view to testing the stability
of the clusterings produced. In the second stage, I will turn to the characteristics of
the people who use these paths. If it can be shown that there are systematic
differences between the users of the various paths, then there are grounds to argue
that different types of mobility opportunity are open to different people.
The result of the optimal matching of the 37 job sequences is shown in Table 4.2.9
Simply put, 4 clusters, or 4 typical paths, plus one outlying case which does not fit
into any cluster can be identified. The sequences of the first cluster are
distinguishable by a spell of "returning to full-time education" that lasted from 3 to
6 years. Those of the second cluster contain a long spell of class nia jobs, while the
distinguishing feature of the sequences of the third cluster is a long spell of class Vila
jobs. The fourth cluster is more mixed. It includes respondents who have worked
as skilled manual workers or small employers. Finally, case 39 stands out alone.
How stable is this clustering, especially with respect to the substitution costs? To
'The 37 job sequences are coded up to the point of the respondent's entry into the service class. For these 37 cases, the problem of right-hand censoring does not exist. However, it is possible that some respondents who were immobile at the time of the follow-up study achieve worklife mobility later on, so there is still an implicit problem of right-hand censoring.

115
answer this question, I have repeated the optimal matching procedure with two variant
substitution matrices. Substitution matrix 2 (Table 4.3) is simpler than the original
matrix 1 in that it postulates only one salient division between the social classes,
namely the manual/non-manual divide. This is an extension of what we saw in
Figure 4.1 — that non-manual first jobs offer far better chances of worklife mobility
into the service class than manual first jobs. In this variant matrix, all diagonal cells
are coded 3; cells which correspond to movement within either the manual or non-
manual class are coded 2; those which denote movement crossing the manual/non-
manual boundary are coded 1.
In contrast, substitution matrix 3 (Table 4.4) is more complex than the original matrix
1. Here I differentiate four hierarchical levels: the service class forms the first level,
classes Ilia and Illb constitute the second level, classes IVa, IVb, IVc and V form the
third level, and finally classes VI, Vila and Vllb make up the fourth level. In effect,
I recognise in matrix 3, as in matrix 2, the manual/non-manual divide in mobility
chance. However, I also postulate internal division within the manual as well as the
non-manual classes. Most notably, because there seems to be significant worklife
mobility between classes VI and Vila (as judged from Figure 4.1), these two classes,
along with class Vllb, are grouped together at the fourth level in matrix 3. Readers
will recall that in matrix 1 and in the CASMIN core model, class VI and class Vila
are placed at different hierarchical levels.
Given this four-fold division, the cell values of matrix 3 are assigned as follows: the
diagonal cells are given the highest value, 5; cells which denote movement within the
same level are coded 4; those which denote movement crossing one level boundary
are coded 3; cells corresponding to movement crossing two level boundaries are
coded 2; and those which denote movement crossing three level boundaries are coded

116
1. Also, for both variant matrices, movement between work events on the one hand,
and unemployment or unspecified events on the other is coded 0; and movement
between work events and full-time education is given a slightly higher value of 1.
Finally, cell I-II is given the value of the diagonal cells.
The 37 job sequences are optimally aligned again with these two variant matrices.
The clusterings produced are reported in Table 4.5 (matrix 2) and Table 4.6 (matrix
3). Readers will note that these two tables are quite similar to Table 4.2. First, the
two clusters of "returning to full-time education" and "class Ilia path" are found in
all three tables. Second, the component sequences of these two clusters are exactly
the same in the three tables. Third, case 39 stands out alone as an outlying case
under all three matrices.
The notable differences between the three tables concern careers in manual jobs. But
these differences correspond closely to the different matrix designs. For example,
under matrix 1, where class Vila and class VI are placed at separate hierarchical
levels, a cluster of largely "class Vila path" is identified. However, under matrix 3,
where those two classes are placed at the same level, the "class VI" and "class Vila"
paths are grouped together. At the same time, a separate cluster of "class IVa path"
becomes identifiable.
On the whole, I believe it is fair to say that the results of the above analysis are fairly
robust. There is an impressive common core across the three tables which accounts
for 21 of the 37 sequences (i.e. the two common clusters plus case 39), and the
variation across the tables follows interpretable patterns. Second, when it comes to
choosing between the three substitution matrices, I take it as a matter which hinges
entirely on what we think is the most useful way to conceptualize the different manual
117
careers into the service class. Matrix 2 seems least attractive to me, because under
this matrix the set of class Vila careers are grouped under two separate clusters. As
between the other two matrices, I prefer matrix 3 to matrix 1, because there seems
to be more worklife mobility between classes VI and Vila than between either of
them and class IVa. Accordingly, it seems more appropriate to have a substitution
matrix where classes VI and Vila, rather than class VI and class IVa, are placed at
the same hierarchical level. So, provisionally I will take the clusters of Table 4.6 as
representing the typical paths of worklife mobility into Hong Kong's service class.
Time warping
To check the clusterings of Table 4.6,1 will now consider an elaboration of the above
analysis which, as Abbott and Hrycak (1990) point out, concerns implicit assumptions
about the meaning of time. Take the examples of case 27 (whose work history can
be represented as 16nia) and case 30 (3IIIa). Both respondents were clerical workers
before they entered the service class, but it took the former 16 years, and the latter
only 3 years, to do so. In the previous analysis, I have implicitly assumed that social
processes operate at the same speed at all times in all cases. Under this intuitive
assumption of real clock time, the two sequences are different ~ to turn case 30 into
case 27, 13 units of class Ilia events have to be added to the former.
However, one may also think that the two work histories are substantively similar,
and that the difference in path length means only that while basically the same social
processes were at work in both cases, they were much slower in producing their
effects in case 27. To capture this idea, I follow Abbott and Hrycak in standardising
118
all sequences to the same length of 50 units. 10 Under this standardised measure of
time, two sequences are equivalent if the same set of events, each taking up the same
proportion of a career, appear in the same order in both sequences. The optimal
matching procedure, with substitution matrix 3, is applied to the standardised
sequences. The result is shown in Table 4.7.
It is evident that Table 4.7 is very similar to Table 4.6. The same four clusters are
identified in both tables, and only four sequences are placed under different clusters
in the two tables. More specifically, case 16, included under "class Ilia path" in
Table 4.6, appears as a manual career in Table 4.7. Case 20 moves in the opposite
direction. The outlier of Table 4.6, case 39, is now clustered under the "manual
path". Finally, case 11, grouped under the "manual path" previously, is now
included in the "class IVa path". On the whole, it must be said that the result of this
section does not suggest any need for significant revision of our previous findings.
Hence, the robustness of the typical paths identified is further confirmed. 11
Furthermore, this section also tells us something substantive about the mobility
10To be more accurate, since the PILEUP program can only read events in integral number of units (i.e. 3.25 years in class Ilia is unacceptable), the 37 sequences are standardised to as close to 50 units as possible. The length of the standardised sequences range from 45 to 58 units, the standard deviation being 2.5 years. Before standardisation, path length ranges from 1 to 29 units and standard deviation equals 6.5 years.
"Abbott and Hrycak have also proposed and tested a third, logarithmic, measure of time. The logarithmic transformation should make the difference between, say, 2 and 4 years more important than that between 10 and 15 years. In other words, it would de-emphasize the weight of very long spells in the optimal matching procedure. However, it seems to me that the logarithmic measure will require quite drastic rounding up of events into integral numbers. For example, the logarithmic transformation of 4, 5 and 6 years (real clock time) will become 1.4, 1.6 and 1.8 years respectively. After rounding up, they become 1, 2 and 2 years. It is difficult to justify why the same distance, in real clock time, between 4 and 5 years and 5 and 6 years should become so different in logarithmic time. For this reason, I have not repeated the analysis with logarithmic time.
119
process. To see this, I should first point out that real clock time does matter in
certain types of mobility. For example, to apply for a Junior Research Fellowship
in a Oxford college, a candidate is normally required to have spent no more than,
say, 5 years in graduate study. Otherwise, he/she will be considered too old for the
job. This is an example of what Rosenbaum (1979) calls the "tournament model of
career mobility". According to this model, career processes are comparable to, say,
a tennis tournament, where competing players have to proceed through certain
hierarchical rounds or stages. To get to the second round, one must first win out in
the first round. Moreover, a person's progress in the tournament is often measured
against a timetable (which may or may not be explicit). In other words, the stage in
which a person is competing at a particular age is compared to where most people of
the same age can be found. Falling behind the timetable is often taken by the
employer as reflecting inferior ability or potential. Conversely speaking, staying
ahead of the timetable is seen as a sign of high ability, and will, in itself, attract
further promotion opportunity. In other words, the speed (measured in real clock
time) of a person's career progress may have ramifications for eventual mobility
outcome.
But, since real clock time and standardised time give us largely the same result in the
above analysis, it seems that the tournament model does not describe the mobility
experience of our respondents very well. This anomaly from the tournament model
is partly due to the fact that our data pertain not only to career mobility within
organizations (where Rosenbaum's theory is meant to apply primarily), but also to
mobility between organizations. But allowing for this, the anomaly is still of
substantive interest -- it suggests that the mobility processes at work behind our 37
respondents were operating at variable speeds in different cases. Consider the
following example: a back-up singer took the leading role for one evening when the
120
star got sick, but he/she caught the eye of the director with that single performance,
and was given better parts in subsequent performances. 12 From the point of view of
the hopeful back-up singer, his/her break may come within a month, five years, or
indeed much longer, of singing in the chorus. The variability in waiting time (i.e.
uncertainty) must give chorus singers a lot of anxiety, but as far as its effect on
mobility chance is concerned, waiting time is far less determining for back-up singers
than for research fellows. The result presented above suggests that the singer
metaphor describes our respondents' experience better than does the metaphor of the
research fellow.
Structural features of the typical paths
Let us return to Table 4.6. More can be said about the four clusters identified. For
example, the six respondents of the first cluster began their worklife in either skilled
manual or routine non-manual jobs. 13 They returned to full-time education (at tertiary
level) within 1 to 4 years. As a result, they obtained better formal credentials which
enabled them to get a service class job immediately afterwards. It can further be
noted that for their tertiary education, two respondents went to local colleges, two
went to Taiwan, and two went to mainland China. Finally, all 6 respondents took up
salaried employment, rather than became entrepreneurs, as they entered the service
12I am grateful to John Goldthorpe for suggesting this example to me.
13At first glance, there are two exceptions here. First, Mr A of case 15 spent his first year out of secondary school unemployed. It should be noted that Mr A had actually worked as a bank teller (class Ilia) when he left school. He left the job within 4 months, and spent the rest of the year preparing for his second attempt of the A-Level exams. In other words, Mr A had, in fact, started his worklife in class Ilia, but given our coding rule, he was considered unemployed for that first year. Second, Mr C of case 6 started his career as a warehouse administrator (class II) in Guangzhou, China, but within one year, the communist takeover of mainland China saw him fleeing to Hong Kong. He was unemployed for the next three years. During that period, he lived on his savings and a small and unstable income from free-lance contributions to local magazines.
121
class.
The 14 respondents of the second cluster spent most, if not all, of their pre-service
class worklife in class Ilia. Three respondents (cases 16, 54, 18) appear to be
exceptional in that they started as unskilled manual workers, but the respondents of
cases 54 and 18 were working as office assistants during their spell in class Vila. In
other words, they were employed in white collar milieus. 14 As for case 16, the
respondent was a lorry driver and a van salesman during his spell in class Vila. He
subsequently changed to and settled in a salesman career, which in fact was a
continuation of one of his previous van salesman jobs. In any case, these three
respondents soon moved on from class Vila to class Ilia. The class Ilia jobs held by
the 14 respondents can be differentiated as follows: there were nine clerks, three
salesmen, one primary school teacher, and one architectural assistant. It should also
be noted that as they entered the service class, only 2 of the 14 respondents (cases 33,
46) became entrepreneurs. The rest have stayed in salaried employment.
The four respondents of the third cluster had 3 to 6 years in small businesses before
they reached the service class. Three of them were manual workers before they
became small employers, while the fourth (case 19) joined the family business when
he left school. It can be shown that, with the exception of case 26, their worklife
mobility is related to their entrepreneurial experience, in the sense that it is the people
they met, and/or the skills and expertise they developed in their business which
facilitated their mobility into the service class. Given this connection, it is rather
surprising to observe that only one respondent (case 30) entered the service class by
14 In Hong Kong, office assistants are menial workers in white collar settings. Their job is to carry out petty tasks such as making photocopies, emptying bins, picking up and delivering mail.
122
expanding his small business. The rest have turned to salaried employment.
The 12 respondents of the fourth cluster have all had a rather long spell in manual
jobs, but they can be divided into two groups according to the type of manual jobs
they held. Those of the first group (cases 10, 22, 12, 23, 14, 29, 7, 11) worked as
a machine operative, hospital cleaner, body massager, packer, general factory
labourer, electronic technician, construction leveller and repairman respectively. This
is a very mixed group, but the commonality between these occupations should be
evident when they are contrasted with those of the second group which, I would
argue, have some affinity to white collar jobs. Among the second group (cases 13,
20, 4, 24), there are two office assistants, a waiter, and an estimator. 15 As noted
above, although office assistants are included in class Vila, they actually work in
white collar milieus. The same can be said of the estimator. The relative affinity of
this second group to the white collar world can also be seen in the fact that three of
the four respondents of this group have also held class Ilia jobs. Because of this
affinity, I would argue that these 4 cases can be taken as variants of the "class Ilia
path". Finally, with the exception of case II,16 all respondents of the fourth cluster
stayed in salaried employment when they entered the service class.
Overall, Table 4.6 is notable in several ways. First, the second mobility path is the
largest cluster of the table. 17 This is consistent with a weak interpretation of Figure
15The estimator was employed in a container-repairing company. His job required him to inspect damaged containers, estimate the cost for repair work, and liaise with relevant parties over such matters as cost and responsibility. There was also some paperwork in this job.
16The respondents of cases 11 and 30 are the only two people in my sample who entered the service class by expanding an ongoing small (class IVa) business.
l7Given (a) the small N of Table 4.6, and (b) that the sample of the follow-up study is not representative of Hong Kong, observations on the relative size of the
123
4.1 — that prior experience in class III improves one's chance of worklife mobility
into the service class. If readers will concede that cases 4, 13, 20 and 24 (i.e. the
second subgroup) of the fourth cluster can be regarded as variants of the "class Ilia
path", then the numerical prevalence of the second mobility path is even more
impressive.
However, there is also a strong interpretation of Figure 4.1 ~ that one has to start
from (and stay in) class III in order to have any realistic chance of worklife mobility
into the service class. If this view is taken, then because 19 of our 37 respondents18
were not on the "class Ilia path", Table 4.6 is not completely consistent with Figure
4.1. Readers should also note that Table 4.6 goes further than Figure 4.1 in
specifying that only class Ilia possesses the bridging power. It also shows that once
a respondent has taken up a class Ilia job, he tends to stay there until he reaches the
service class.
Second, from the second last column of Table 4.6, it can be seen that the first two
mobility paths, namely "returning to full time-education" and "class Ilia path", are
much shorter than the other two. While, on average, it takes a respondent on the
first or the second path about 7 years to reach the service class, it takes those on the
third or the fourth path twice as long to do so. Since the standard deviation in path
length is relatively large for the last two clusters, there are short sequences in these
two clusters. However, upon closer inspection, readers will see that most of the
shorter sequences of the "manual path" (e.g. 3 of the 5 sequences shorter than 10
years) are those which I would consider as variants of the "class Ilia path". This is
clusters can only be taken as tentative.
18This includes the 6 cases of the first cluster, the 4 cases of the "class IVa path", 8 cases from the "manual path", and case 39.
124
in line with the point, made earlier, that class Ilia workers not only enjoy better
mobility chances, their "waiting time" is also shorter.
Third, "class IVa path" is the smallest cluster of the table. This is somewhat
unexpected given: (a) that Hong Kong has a large class of petty bourgeoisie (cf.
Chapter 3), and (b) that Hong Kong people are often described as entrepreneurial
(e.g. Sit and Wong 1989). The above analysis suggests that running a small business
is not a particularly promising career option insofar as worklife mobility into the
service class is concerned.
The relative unpopularity of the entrepreneurial path is also reflected in the type of
service class jobs taken up by our respondents. Of the 37 respondents, only four
(cases 33, 46, 30, 11) stayed as or became entrepreneurs as they took up their first
service class job. Having said this, it should also be noted that, among the 34
respondents who entered the service class as salaried employees, ten subsequently
went into businesses. In five instances (cases 20, 39, 42, 56, 58), the business set
up was of considerable size. So, these respondents were able to retain their service
class status. In the other five instances (cases 21, 40, 42, 54, 71), however, the
business was of relatively modest scale, and so for them, leaving salaried employment
also meant moving from class I+11 to class IVab. My point here is that there were
just as many people going from salaried service class positions to small businesses as
the other way around.
Fourth, 15 of the 37 respondents achieved service class status by internal promotion.
In other words, they stayed with the same employer as they took up their first service
125
class job. 19 From the last column of Table 4.6, it can be seen that 43% of those on
"class Ilia path", but 67% of those on the "manual path", gained mobility through
internal promotion. If this percentage can be taken as a rough measure of how often
the internal job ladder is used for mobility, then it seems that people on the "manual
path" are more reliant on the internal job ladder for worklife mobility than those on
"class Ilia path 11 . 20 I am not sure why this should be the case. One interpretation of
this finding is that the skills and experience of the upwardly mobile manual workers
are more firm-specific (i.e. less transferable between firms) than those of class Ilia
workers. A second interpretation is that manual workers do not have as much
information of outside service class jobs as class Ilia workers. Since I do not have
much corroboratory evidence for either of these views, I will not speculate further on
why we should have found the above pattern.
But the, admittedly tentative, finding that manual workers are more dependent on
internal job ladder for mobility does suggest one explanation for their generally poor
performance in worklife mobility. To see this, readers should recall that most manual
workers of Hong Kong are employed in small and medium factories (cf. Chapters 2
and 3) where internal job ladders probably do not exist. Conversely put, only a small
minority of Hong Kong's manual workers who are employed in atypically large firms
have access to the job ladders on which they are relatively dependent for worklife
mobility.
19I am grateful to May Tarn for alerting me to the importance of internal job ladder as a factor of worklife mobility.
Incidentally, 3 of the 4 cases which I take as variants of "class Ilia path" (cases 13, 20, 24) involve mobility using the internal job ladder. If these 4 cases are moved to the second cluster, then the percentage of internal promotion for the "class Ilia path" becomes 50% (9 out of 18), and that for the "manual path" becomes 63% (5 out of 8). So the difference between the two paths will be narrowed. But, roughly speaking, the same argument still applies.
126
Some evidence for (and an elaboration of) this view can be found by listing the
employers of the respondents who took the "manual path" and achieved mobility by
internal promotion. They (not counting the cases which I consider as variants of the
"class Ilia path") include a public hospital (case 10), a large hotel (case 12), a large
knitwear factory that has several plants (case 23), a telecommunication company (case
29), and a construction company (case 7). Obviously, these employers are not the
typical small and medium factories of Hong Kong. Indeed, four of them are outside
of the manufacturing sector. Since the majority of Hong Kong's manual workers are,
in fact, employed in manufacturing, this may suggest another reason of why manual
workers are, on the whole, less mobile than others.
User characteristics
Having considered the structural features of the typical mobility paths, let us now turn
to the characteristics of the users. As noted above, if one can show that there are
systematic differences between the users of the four mobility paths, then there is
ground to argue that different types of mobility opportunity are selectively open to
different types of people. In Table 4.8, I crosstabulate basic socio-demographic
variables of the respondents by the mobility path they took. From Panel A, it can be
observed that of all the 36 respondents, 9 were born before the second world war, 27
were born after the war. 21 Roughly speaking, the same distribution holds for the
"class Ilia path", the "class IVa path" and the "manual path", but for those on the
path of "returning to full-time education", only half were born after the war.
Unfortunately, since there are only 6 cases in the first column, it would be too bold
a statement to claim that the mobility path of "returning to full-time education" is less
21 The outlier, case 39, is not considered in this table.
127
accessible to the post-war generation. 22
Turning to Panel B, it can be seen that 86% of those on the "class Ilia path", but
only half of those on the "manual path", were locally born. Given the slightly larger
Ns of these two columns and the magnitude of this contrast, I would venture to
suggest that the shorter and more popular "class Ilia path" is generally less open to
immigrants.
From Panel C, readers can see that those on the "class Ilia path" are generally better
educated than those on the "manual path" ~ 86% of the former, but only 42% of the
latter, have finished upper secondary school when they took up their first job. This
difference is expected given that intermediate qualifications (i.e. upper secondary
education) are normally required for class Ilia but not for manual jobs.
With respect to the place of schooling, Panel D shows relatively little difference
between the mobility paths. However, from Panel E, readers can see that half of
those on the "manual path" were between the age of 12 and 15 when they took up
their first job. In contrast, none of those on the "class Ilia path" were so young when
they entered the labour market. Correspondingly, 29% of those on the "class Ilia
path", but none of those on the "manual career", were over 20 when they took up
their first job. In short, compared to people on the "manual path", those who took
the "class Ilia path" were late starters in the world of work. This is expected given
the difference in educational qualifications between the two groups.
22Given the very small Ns of first and third mobility paths, I will not refer to these two columns in the following discussion unless they show particularly striking distributions.
128
Finally, Panel F shows that although the 36 respondents were equally divided between
the two class origins, class IVab and Vila, they are unevenly distributed by the
mobility paths taken. More specifically, 83% of those on the "manual path" came
from class Vila, and 64% of those on the "class Ilia path" came from class IVab.
In other words, the "class Ilia path" is slightly more open to those of petty bourgeois
origin, and those coming from the more disadvantaged background of class Vila are
somewhat restricted to the longer "manual path". I am not sure why this should be
the case, but this contrast can, to some extent, be explained in terms of education
differential: while 83 % of those of class IVab origin hold intermediate qualifications,
only 56% of those from class Vila were similarly qualified. As we have seen, there
were fewer people with no intermediate qualifications on the "class Ilia path".
To sum up, those who use the "class IQa path" are, on average, better educated than
those who use the "manual path". Moreover, the former generally took up their first
job at a later age, more of them were locally born, and in terms of social origin, they
tend to came from class IVab rather than class Vila. Put differently, the "class Ilia
path" is less open to (a) immigrants, (b) people who come from unskilled manual
background, and (c) those who do not have intermediate qualifications.
Chapter summary
In this chapter, I have applied optimal matching analysis to some of the work history
data in the follow-up study. As a result, four typical mobility paths have been
identified. Of these four paths, the "class Ilia path" and the path of "returning to
full-time education" are much shorter than the "class IVa path" or "class VI and Vila
path". The "class Ilia path" is the most popular one, in the sense that it is the largest
cluster identified. This is consistent with the observation, made earlier on the basis
of incomplete worklife mobility data of the main survey, that routine non-manual jobs
129
offer much better chances of career mobility into the service class than manual jobs
do. I have also argued that although some cases are formally included under the
"manual path", since the respondents in question were working in white collar
milieus, they can be considered as pursuing variants of the "class Ilia path".
There is some evidence to suggest that, compared with people on "class Ilia path",
those who are on the "manual path" are more reliant on internal job ladder for
worklife mobility. It also seems that many of the mobile manual workers were
employed outside of the manufacturing sector. Given that most manual workers in
Hong Kong are employed in (a) small firms where internal job ladders probably do
not exist, and (b) the manufacturing sector, these findings (admittedly tentative) may
partly explain why manual workers were, on the whole, less mobile than others.
There is also some evidence which suggests that real clock time is not a determining
parameter in the mobility process.
Finally, I have argued that the various mobility paths are selectively open to people
of different background and characteristics. More specifically, the "class Ilia path"
is less open to immigrants, people without intermediate qualifications, and those who
come from class Vila background.
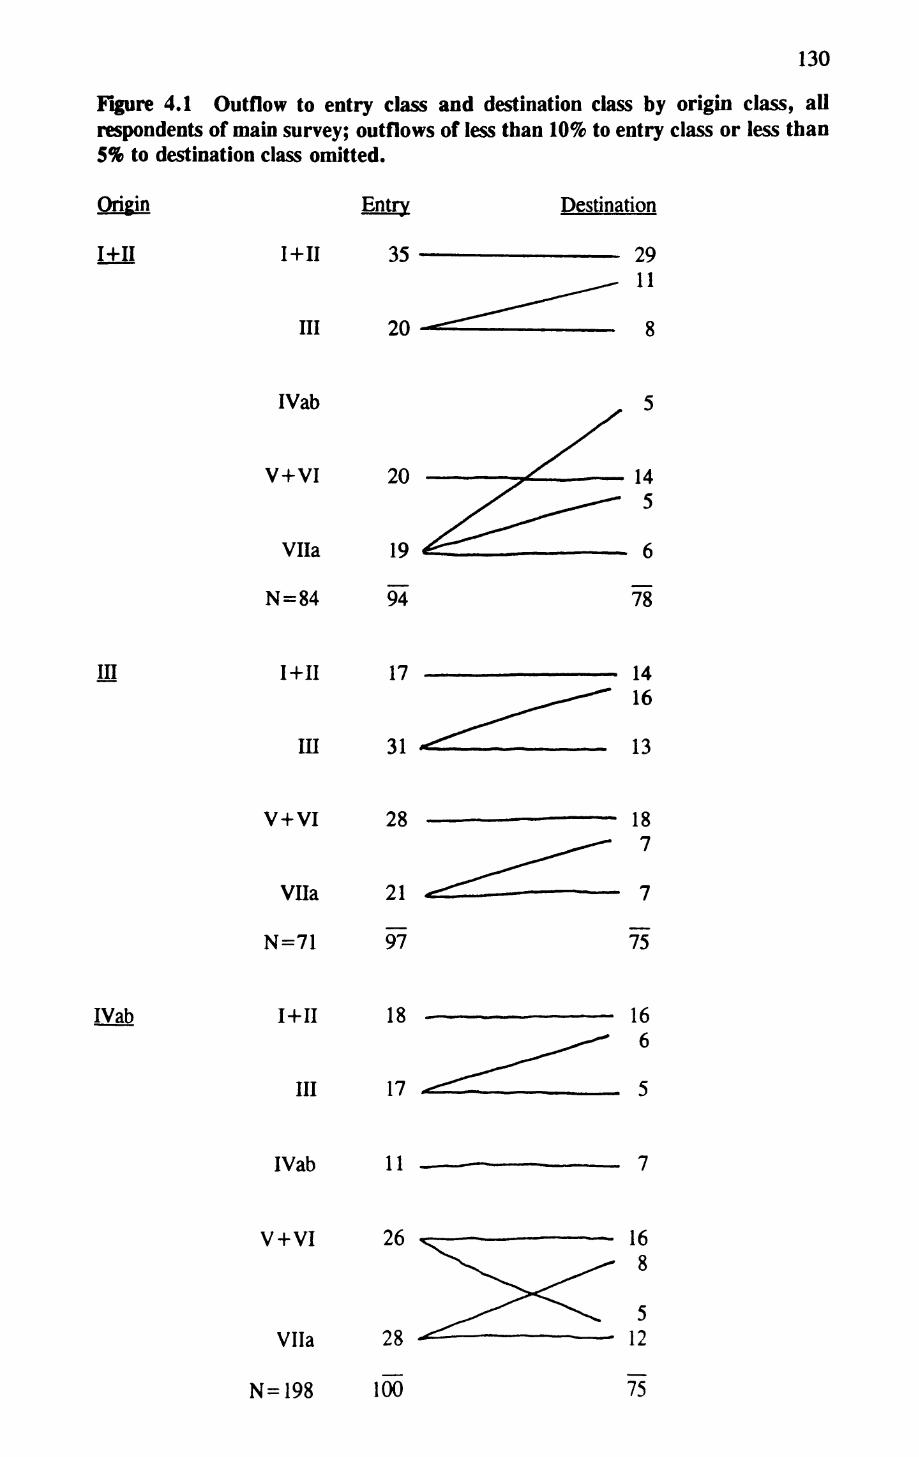
130
Figure 4.1 Outflow to entry class and destination class by origin class, all respondents of main survey; outflows of less than 10% to entry class or less than 5% to destination class omitted.
Origin
!±n I+II
III
Entry
35
Destination
2911
8
IVab
V+VI
Vila
N=84
in i+11
in
17
31
1416
13
V+VI
VUa
N=71
IVab I+II
III
18
17
166
IVab 11
V + VI
Vila
N=198
26
28
100 75
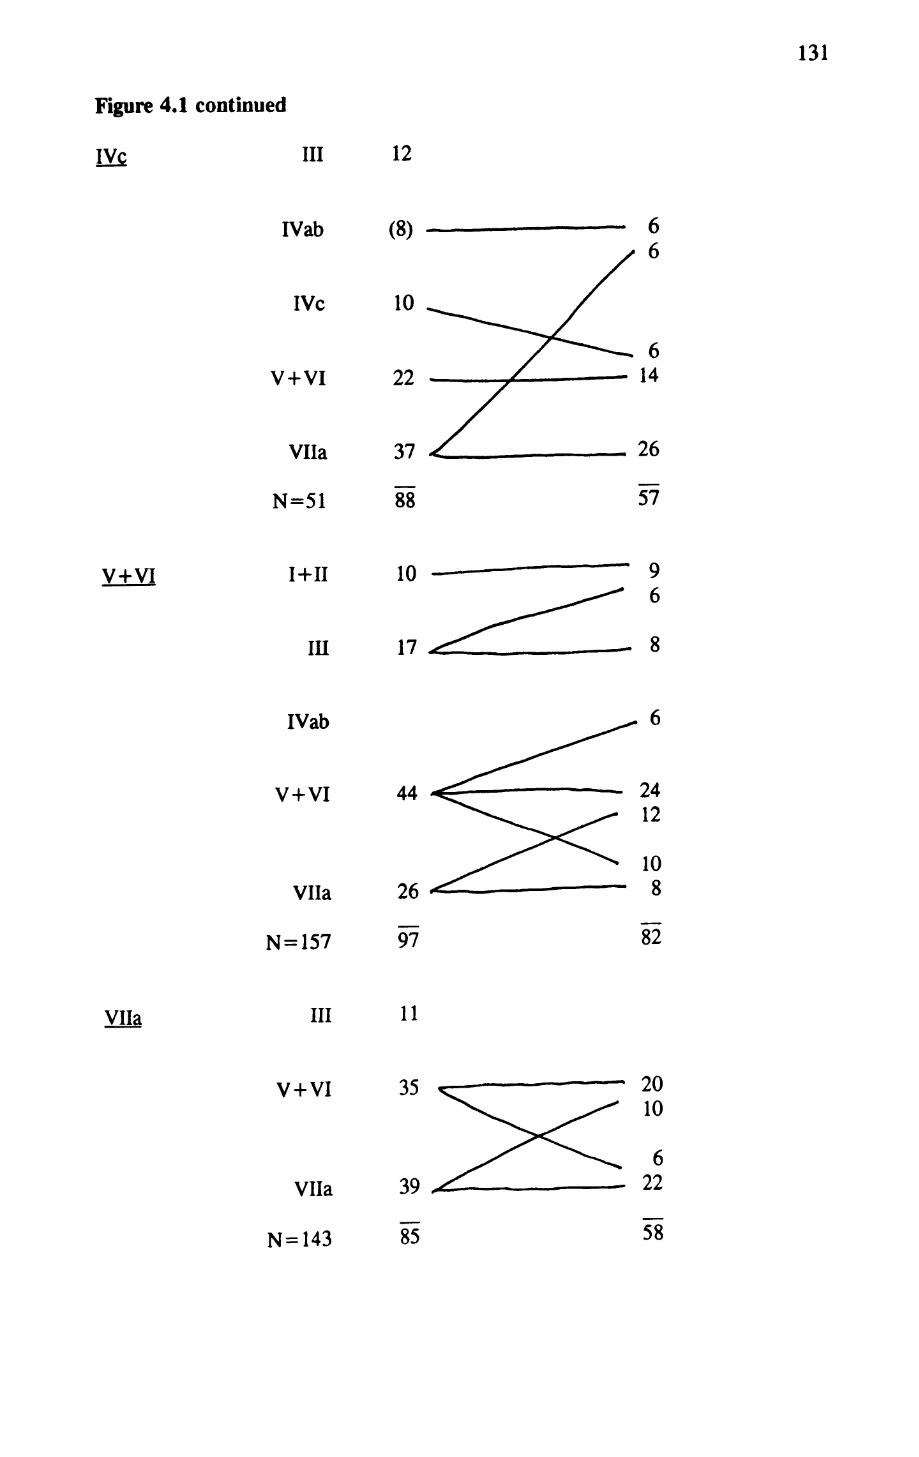
131
Figure 4.1 continued
V+VI
Vila
III
IVab
IVc
V+VI
Vila
N=51
I +11
m
IVab
V+VI
Vila
N=157
III
V+VI
Vila
N=143
12
(8)
10
22
37
10
44
26
97
11
96
8
82
58
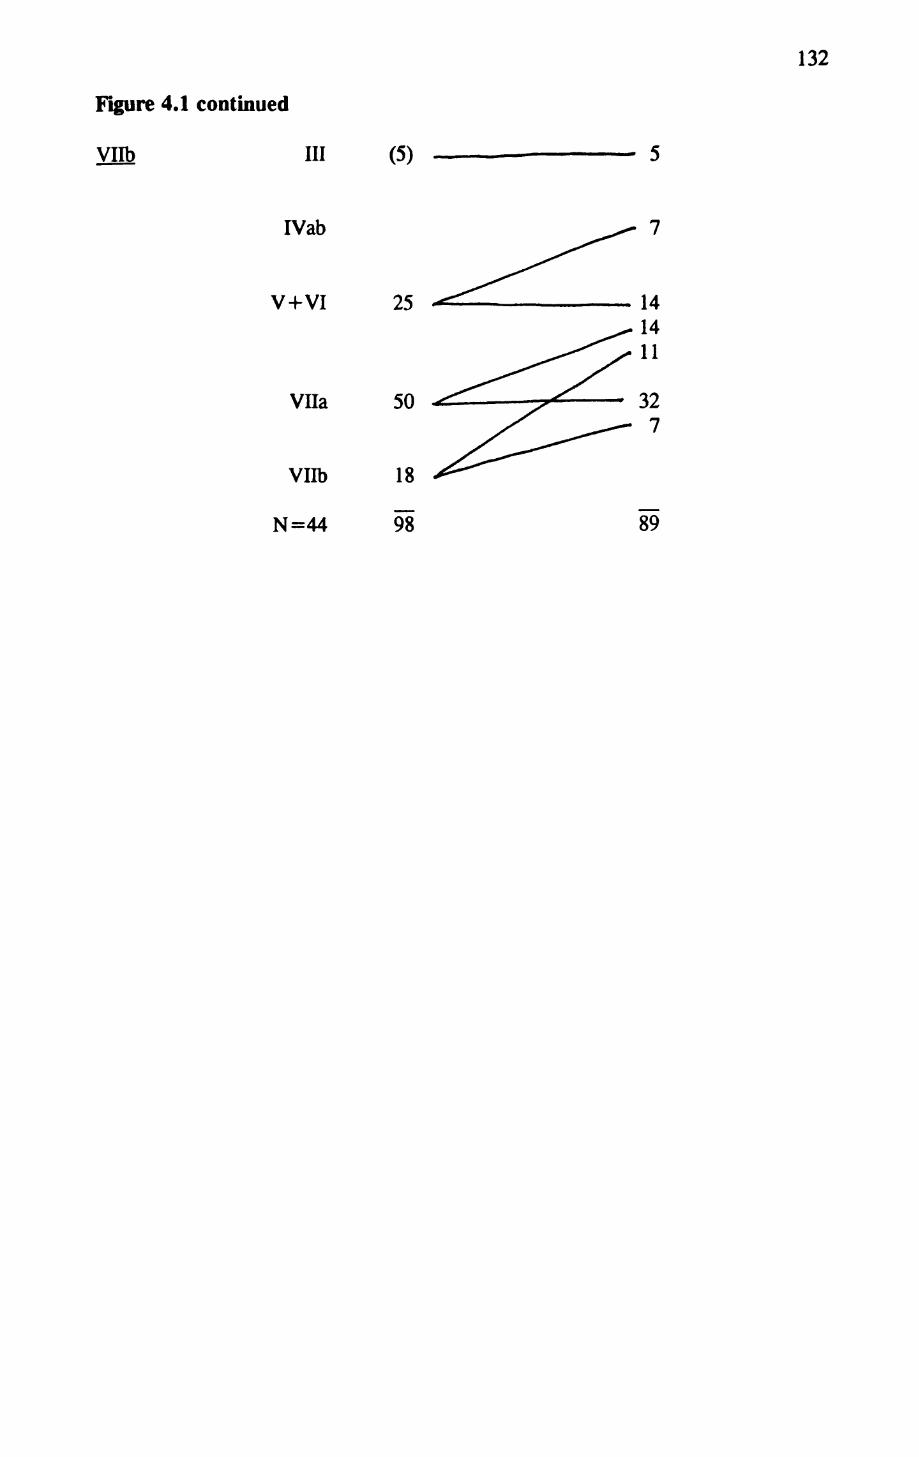
Figure 4.1 continued
Vllb III (5)
IVab
V+VI
Vllb
N=44
25
Vila 50
18
98 89
132
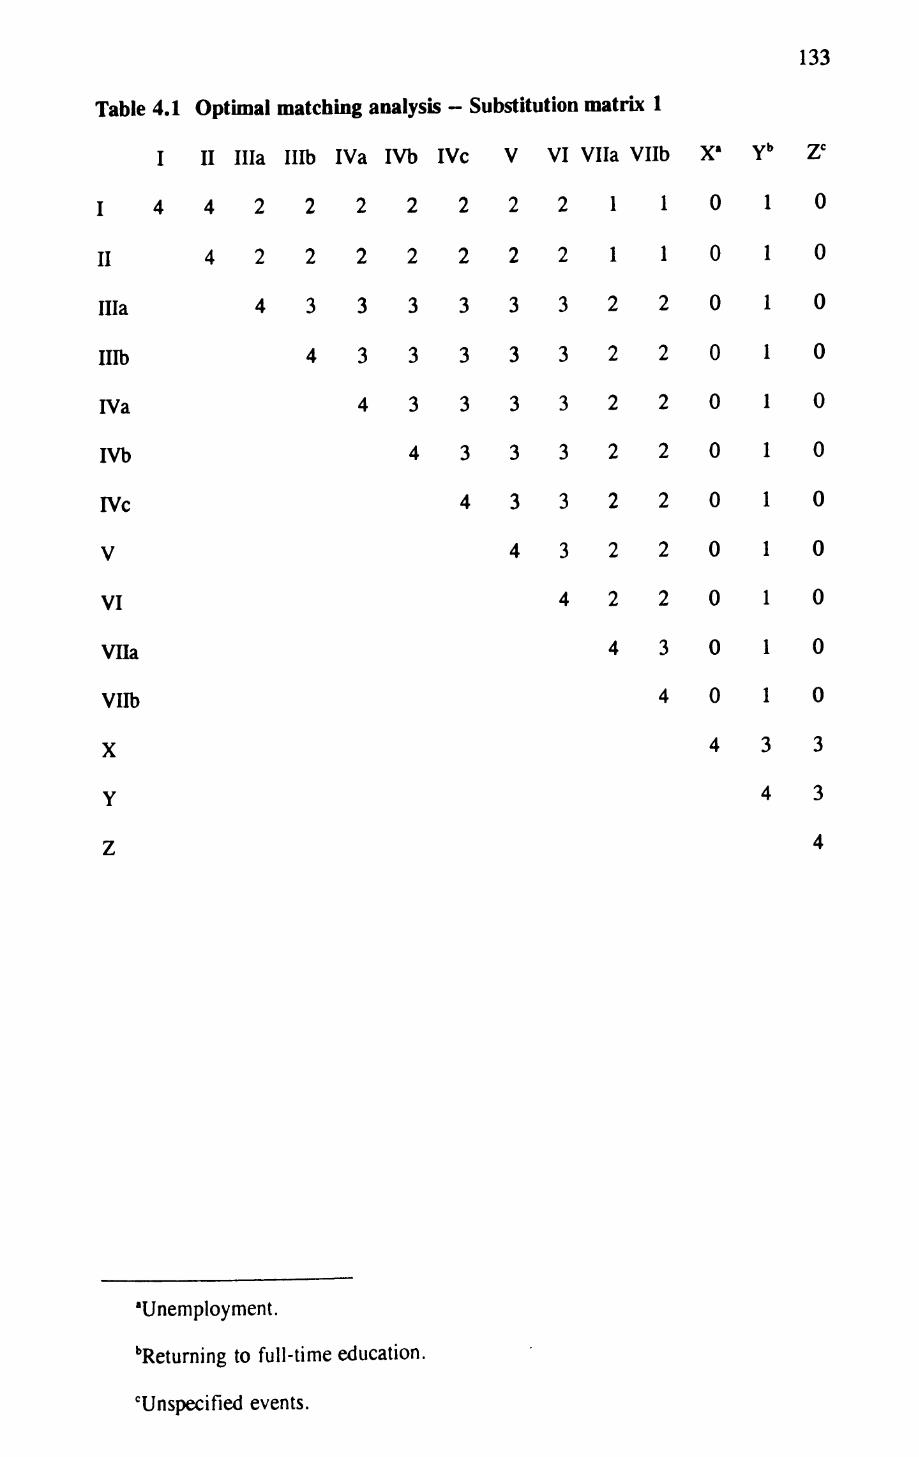
Table 4.1 Optimal matching analysis - Substitution matrix 1
I II Ilia Illb IVa IVb IVc V VI Vila Vllb X' Yl
133
14422
II 422
Ilia 4 3
Illb 4
IVa
IVb
IVc
V
VI
Vila
Vllb
X
Y
Z
2222211010
2222211010
3333322010
3333322010
4333322010
433322010
43322010
4322010
422010
43010
4010
433
4 3
4
'Unemployment.
bReturning to full-time education.
"Unspecified events.
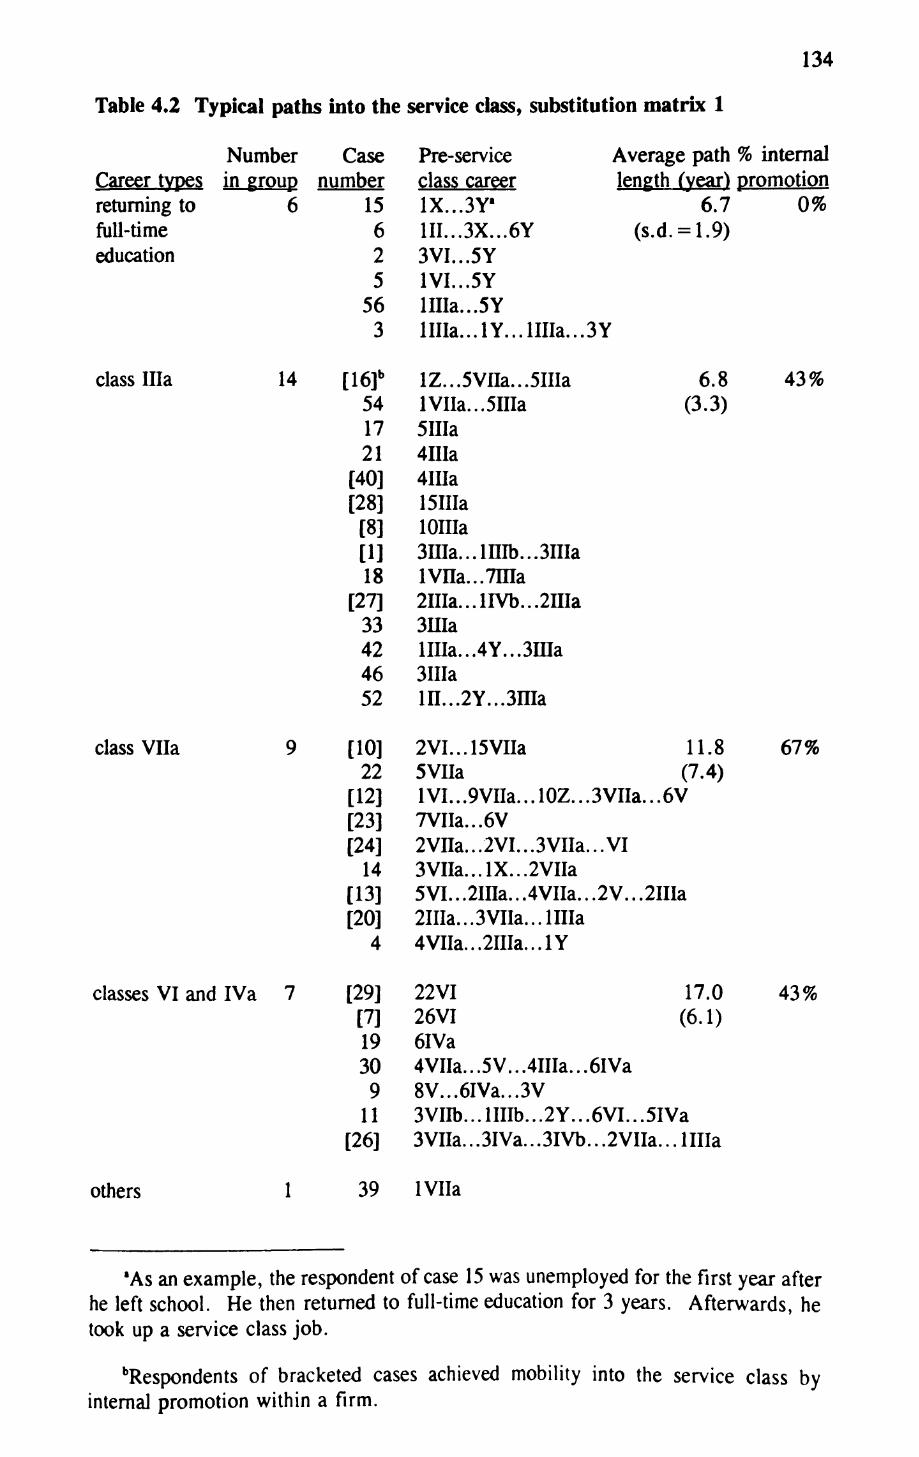
134
Table 4.2 Typical paths into the service class, substitution matrix 1
Number Case Career types in group number returning to 6 15 full-time 6 education 2
556
3
class Ilia 14
class Vila
classes VI and IVa 7
[16]b541721
[40][28]
[8][1] 18
[27] 33 42 4652
[10]22
[12][23][24]
14[13][20]
4
[29][7]1930
911
[26]
Pre-serviceclass careerIX.. .3Y11II...3X...6Y3VI...5Y1VI...5YHIIa...5Y
Average path % internallength (year) promotion
6.7 0%(s.d. =
6.8 (3.3)
43%
5IIIa 4IIIa 4IIIa
ioma3ma...lfflb...3IIIaivna...7ma3fflaima...4Y...3ffla 3IIIa in...2Y...3nia
2VI...15VIIa 11.85Vna (7.4)!VI...9Vna...lOZ...3VIIa...6V7VIIa...6V2VIIa...2VI...3VIIa...VI3VIIa...lX...2VIIa5VI...2ina...4VIIa...2V...:2IIIa...3VIIa...lina
17.0 (6.1)
67%
22VI26VI6IVa4VIIa...5V...4IIIa...6IVa8V...6IVa...3V3VIIb...lIIIb...2Y...6VI...5IVa3VIIa...3IVa...3IVb...2VIIa...lIIIa
43%
others 39 IVIIa
'As an example, the respondent of case 15 was unemployed for the first year after he left school. He then returned to full-time education for 3 years. Afterwards, he took up a service class job.
Respondents of bracketed cases achieved mobility into the service class by internal promotion within a firm.
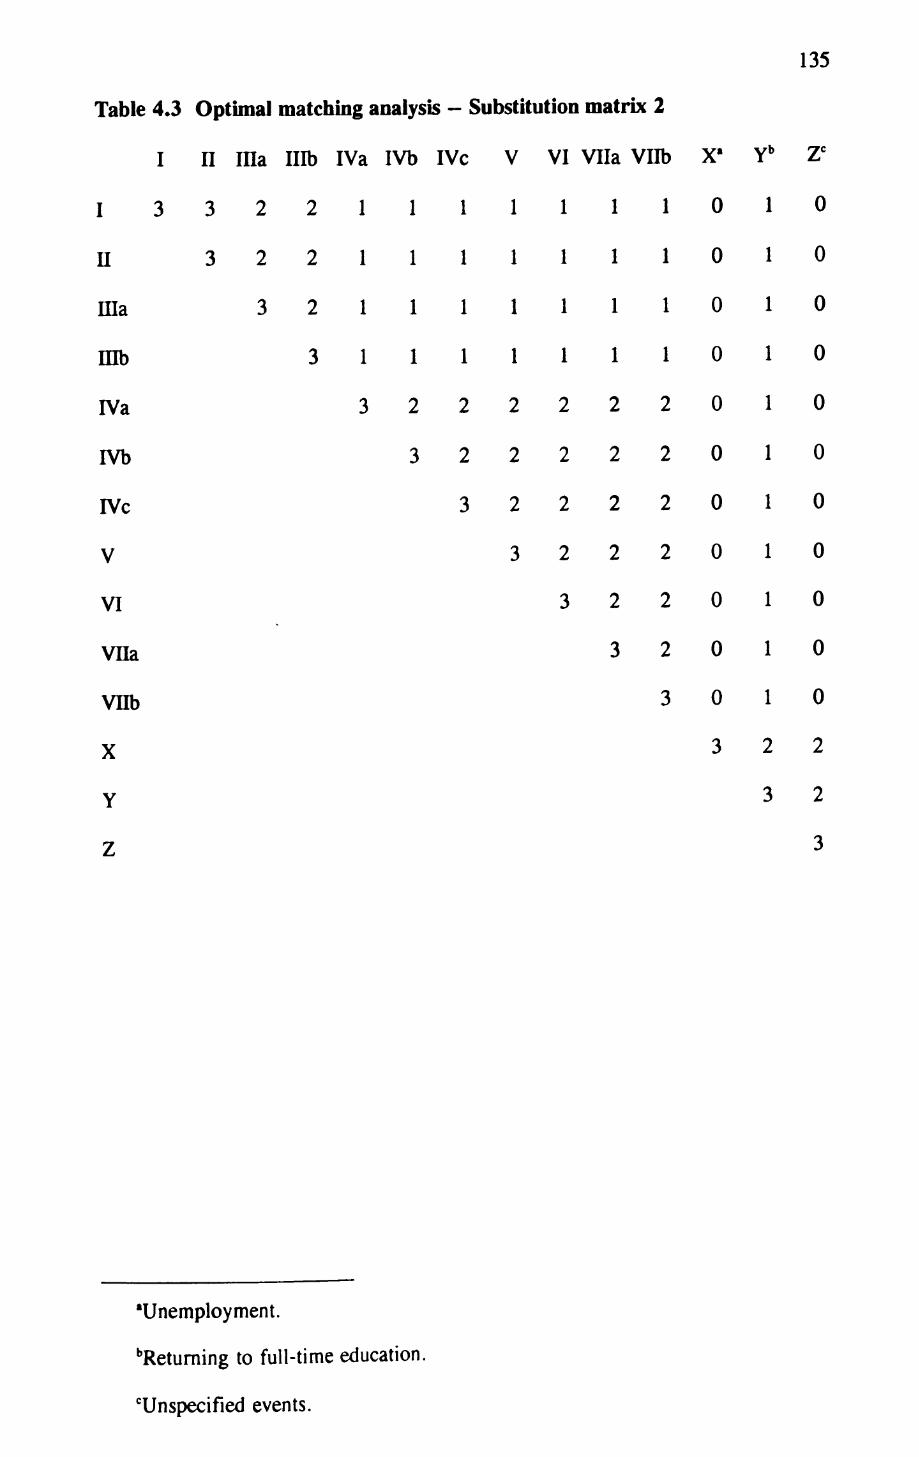
135
Table 4.3 Optimal matching analysis — Substitution matrix 2
I H Ilia Illb IVa IVb IVc V VI Vila Vllb X' Yb Zc
I 3
II
ma
mb
IVa
IVb
IVc
V
VI
VHa
vnb
X
Y
z
3221111111010
3221111111010
321111111010
31111111010
3222222010
322222010
32222010
3222010
322010
32010
3010
322
3 2
3
'Unemployment.
Returning to full-time education.
"Unspecified events.
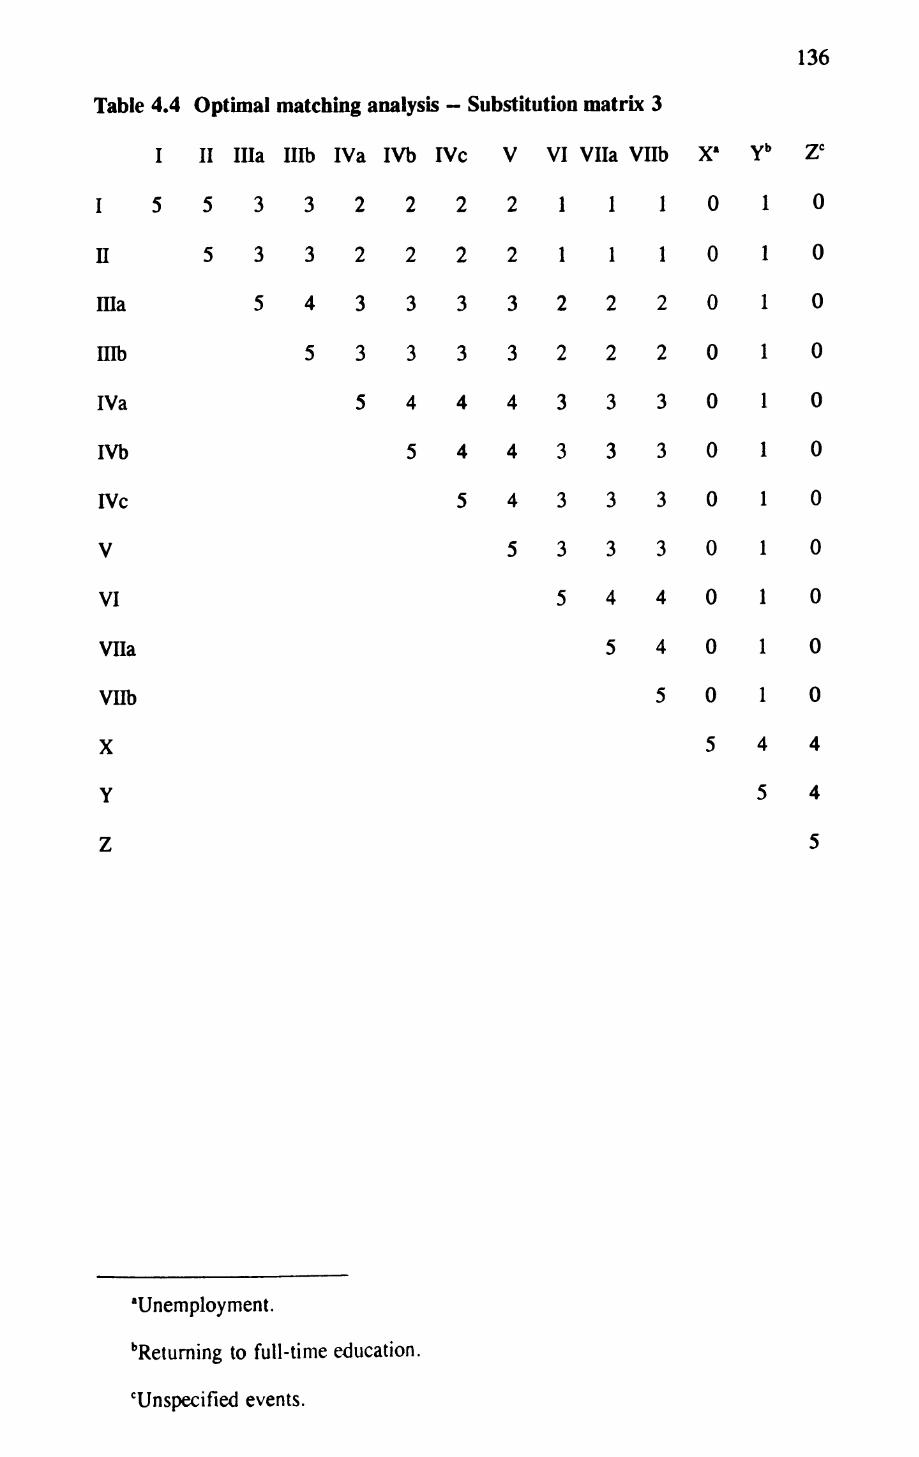
136
Table 4.4 Optimal matching analysis — Substitution matrix 3
I II Ilia Illb IVa IVb IVc V VI Vila Vllb X* Yb Zc
I 5
II
ma
mbIVa
IVb
IVc
V
VI
Vila
vnbX
Y
Z
5332222111010
5332222111010
543333222010
53333222010
5444333010
544333010
54333010
5333010
544010
54010
5010
544
5 4
5
'Unemployment.
Returning to full-time education.
""Unspecified events.
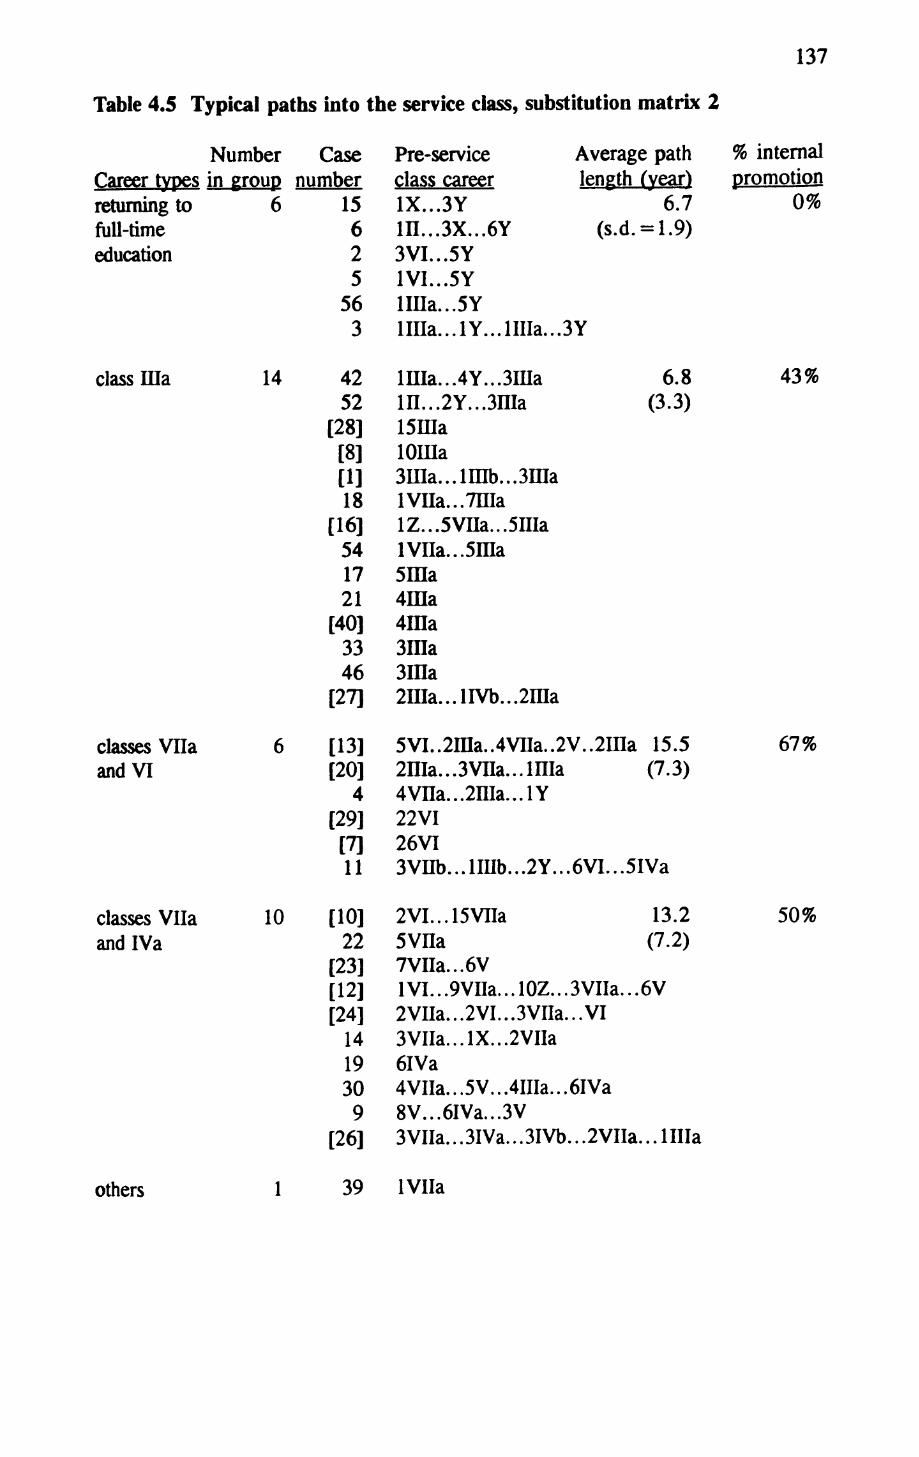
137
Table 4.5 Typical paths into the service class, substitution matrix 2
X^UIIIVWI V^U^Wr
Career types in group number returning to 6 full-time education
class Ilia
classes Vila and VI
classes Vila and IVa
14
10
Casenumber
15625
563
4252
[28][8][1]18
[16]541721
[40]3346
[27]
[13][20]
4[29]
[7]11
[10]22
[23][12][24]
1419309
[26]
Pre-serviceclass careerIX.. .3Y1H...3X...6Y3VI...5Y1VI...5Ylina...5Y
Average pathlength (year)
6.7(s.d. = 1.9)
ima...lY...HIIa...3Y
mia...4Y...3fflain...2Y...3ffla15fflalOina3ma...lfflb...3niaivna...7nialZ...5Vna...5IIIalVna...5ffla5ffla4ffla4ffla3ffia3ffla2nia...lIVb...2ffla
6.8(3.3)
5VI..2ina..4Vna..2V..2ffla 15.52ffla...3Vna...lffla4Vna...2IUa...lY22VI26VI3Vnb...lIHb...2Y..
2VI...15Vna5VHa7 Vila... 6V!VI...9Vna...lOZ...2Vna...2VI...3VIIa.3VIIa...lX...2VIIa6IVa4VIIa...5V...4IIIa...8V...6IVa...3V3VIIa...3IVa...3IVb
(7.3)
.6VI...5IVa
13.2(7.2)
3 Vila... 6V..VI
6IVa
...2 Vila... 1 Ilia
% internal promotion
43%
67%
50%
others 39 IVIIa
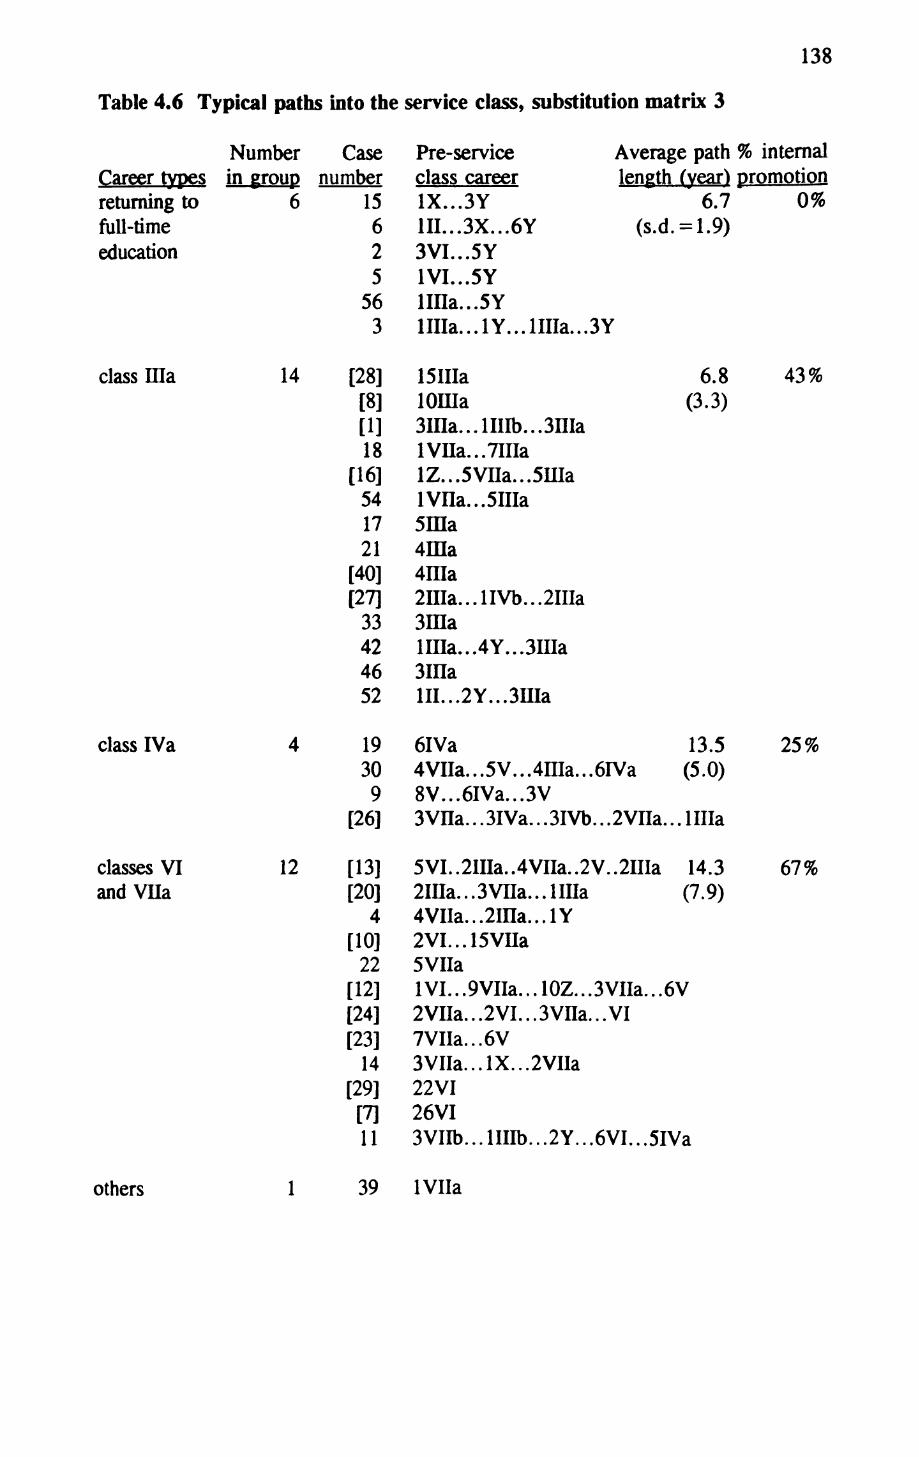
138
Table 4.6 Typical paths into the service class, substitution matrix 3
Career types returning to full-time education
Numberin group
6
class Ilia 14
class IVa
classes VI and Vna
12
Casenumber
15625
56 3
[28] [8][1]18
[16]541721
[40][27]
33424652
1930
9[26]
[13][20]
4[10]
22[12][24][23]
14[29]
[7]11
Pre-serviceclass careerIX...3Y1II...3X...6Y3VI...5Y1VI...5Yima...5Y
Average path % internallength (year) promotion
6.7 0%(s.d. = l
.3Y
lOHIa3ina...lIIIb...3nialVna...7IHa
6.8 (3.3)
43%
lVna...5IIIa5ma4IUa4ma2IHa...lIVb...2IHa3maima...4Y...3HIa3IHaHI...2Y...3nia
6IVa 13.54VIIa...5V...4nia...6IVa (5.0)8V...6IVa...3V3VHa.. .3IVa.. .3IVb.. .2VHa... lllla
5VI..2IIIa..4VIIa..2V..2IIIa 14.32IIIa...3VIIa...ima (7.9)4VIIa...2ina...lY2VI...15Vna5VIIa1VI.. .9VIIa... 10Z.. JVIIa.. .6V2VIIa...2VI...3Vna...VI7VIIa...6V3VIIa...lX...2VIIa22VI26VI
r ...6VI...5IVa
25%
67%
others 39 IVIIa
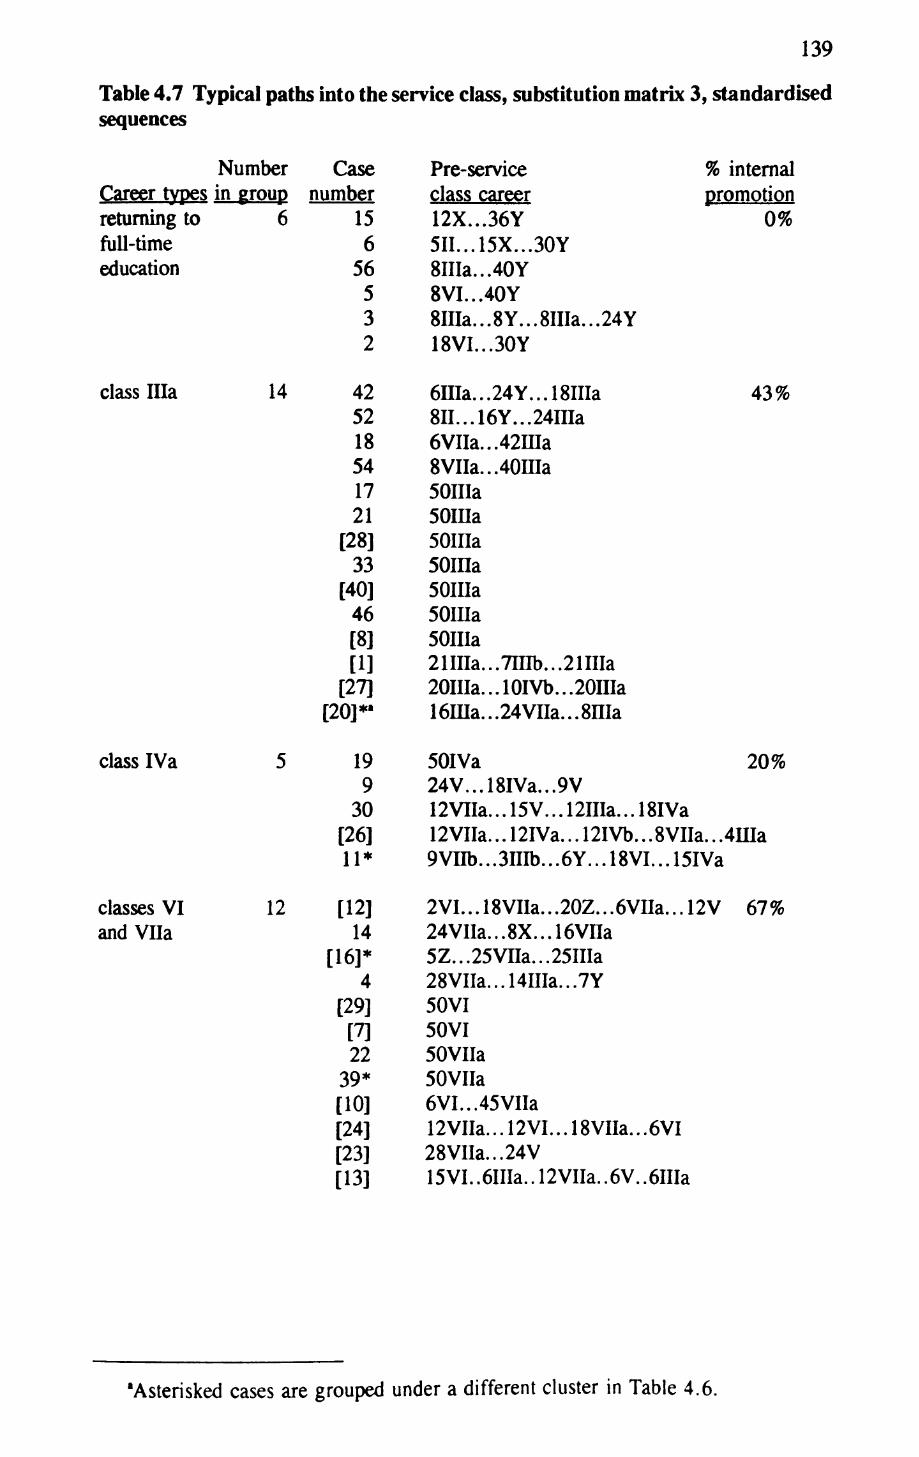
139
Table 4.7 Typical paths into the service class, substitution matrix 3, standardised sequences
Number Case Career types in group number returning to 6 15 full-time 6 education 56
5 3 2
class Ilia
class IVa
classes VI and VHa
14
12
42 52 18 54 17 21
[28] 33
[40] 46 [8][1]
[27][20]*1
19 9
30 [26] 11*
[12] 14
[16]*4
[29][7] 22
39* [10] [24] [23] [13]
Pre-serviceclass career12X...36Y5II...15X...30Y8IIIa...40Y8VI...40Y8IIIa...8Y...8IIIa...24Y18VI...30Y
6nia...24Y...18IIIa
% internalpromotion
0%
43%
6VIIa...42ma8VIIa...40ffla50IIIa50IIIa50IHa50ffla50IIIa50fflaSOIIIa
20IIIa...lOIVb...20IIIa 16nia...24Vna...8nia
50IVa 20% 24V...18IVa...9V 12VIIa...l5V...12IIIa...l8IVa 12VIIa... 12IVa... 12IVb.. .SVIIa.. .4HIa 9VIIb...3IIIb...6Y...18VI...15IVa
2VI...18VIIa...20Z...6Vna...l2V24VIIa...8X...16Vna5Z...25Vna...25IIIa28VIIa...l4UIa...7Y50VI50VI50VIIa50VIIa6VI...45VIIa12 Vila... 12 VI... 18 Vila... 6VI28 Vila... 24V15VI. .6IIIa.. 12VIIa. .6V. .
67%
'Asterisked cases are grouped under a different cluster in Table 4.6.
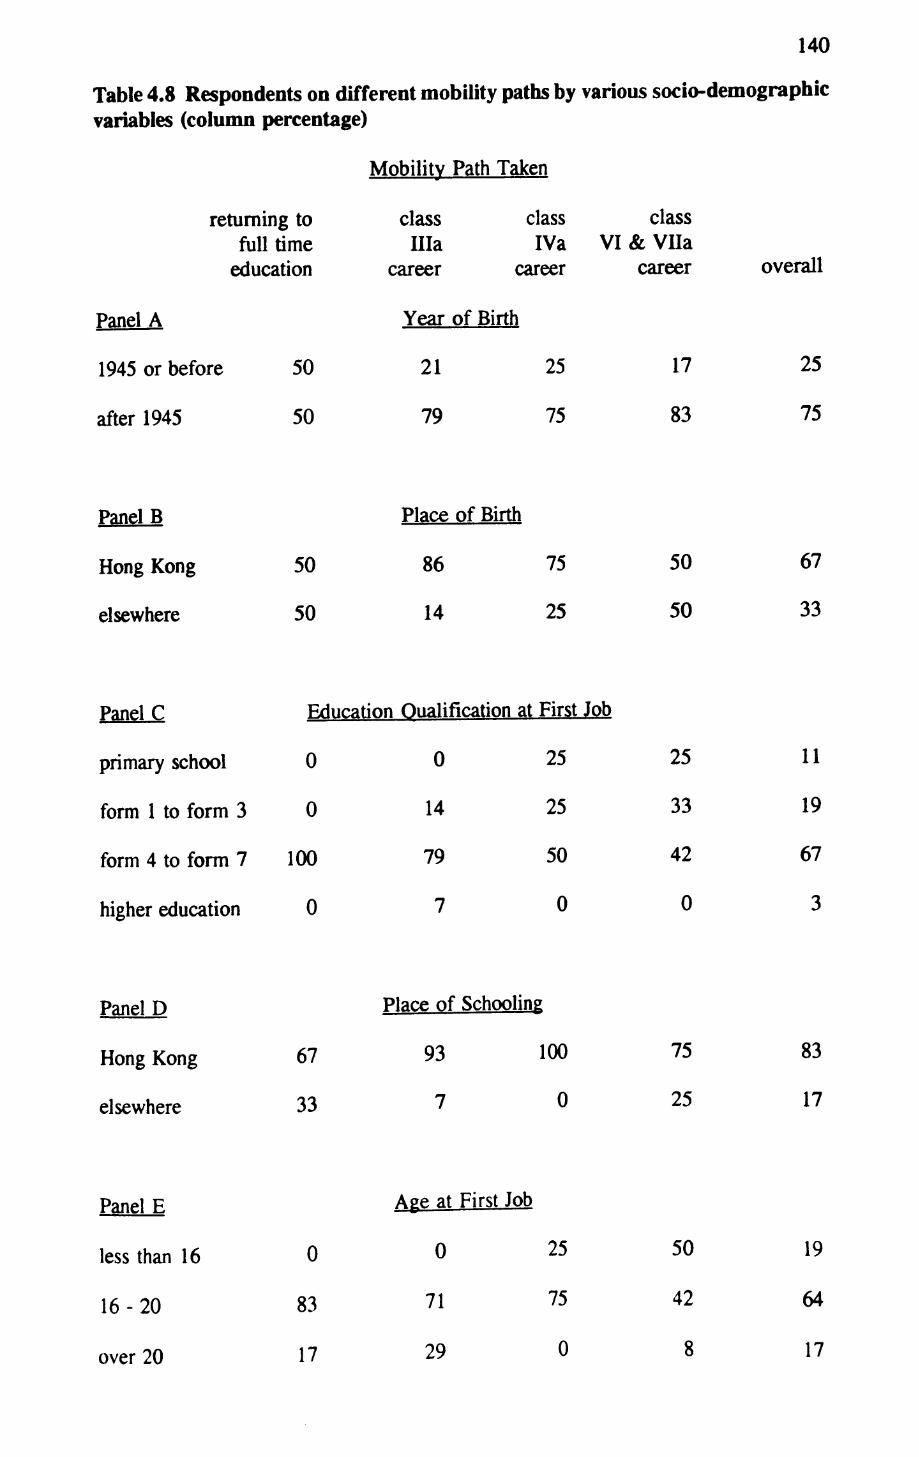
140
Table 4.8 Respondents on different mobility paths by various socio-demographic variables (column percentage)
Mobility Path Taken
returning to full time
education
Panel A
1945 or before
after 1945
Panel B
Hong Kong
elsewhere
Panel C
primary school
form 1 to form 3
form 4 to form 7
higher education
Panel D
Hong Kong
elsewhere
Panel E
less than 16
16-20
over 20
50
50
50
class Ilia
career
Year
21
79
Place
86
class IVa VI
career
of Birth
25
75
of Birth
75
50 14 25
Education Qualification at First Job
0
0
100
0
0
14
79
7
25
25
50
0
class & Vilacareer
17
83
50
50
25
33
42
0
overall
25
75
67
33
11
19
67
3
Place of Schooling
67
33
0
83
17
93
7
Age at
0
71
29
100
0
First Job
25
75
0
75
25
50
42
8
83
17
19
64
17
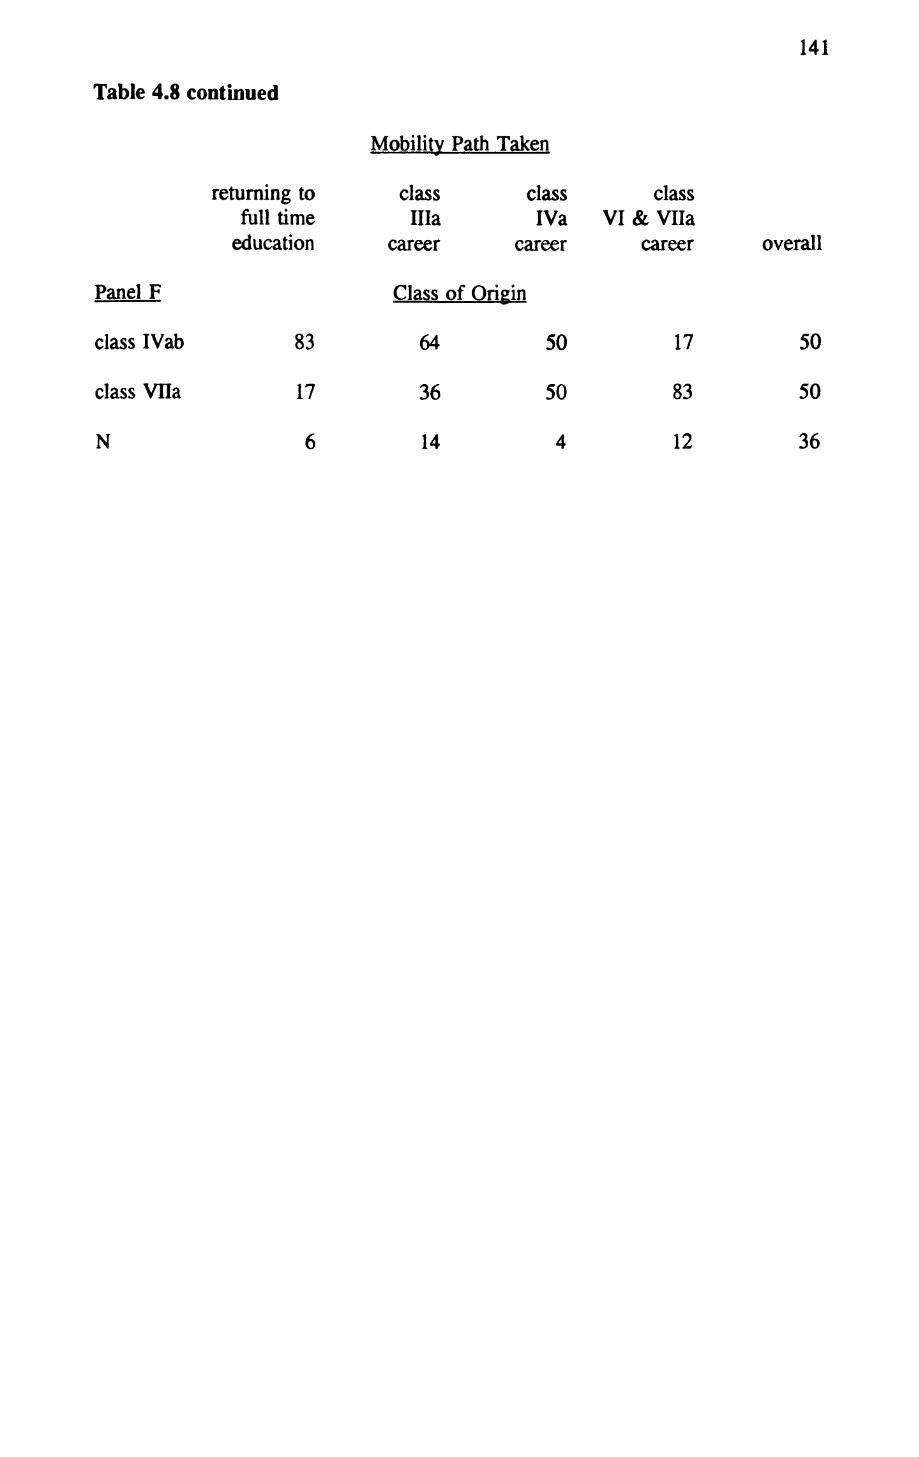
141
Table 4.8 continued
Mobility Path Taken
returning to class class classfull time Ilia IVa VI & Vila
education career career career overall
Panel F Class of Origin
class IVab 83 64 50 17 50
class Vila 17 36 50 83 50
N 6 14 4 12 36
142
Chapter 5
Social Networks and the Mobility Process
This chapter explores the effect of social networks on the mobility process. In
particular, in view of my earlier finding (cf. Chapter 4) that far more people achieve
worklife mobility into the service class by staying in wage employment than by going
into business, I will examine how personal contacts facilitate the job search process,
(in other words, the parallel question of how personal contacts affect the formation
of business partnership will not be discussed here.) Much of the following discussion
is inspired by Granovetter's "Strength of Weak Ties" (SWT) thesis. So following his
lead, I will address questions such as; (a) what type of contacts are useful for "getting
a job", (b) how useful contacts are acquired in the first place and maintained over
time, and (c) who are more likely to have such contacts.
Job search data collected in the follow-up study will be employed to answer these
questions. But it must be noted, at the outset, that only a fraction of all the job shifts
considered below resulted in our respondents getting their first service class jobs. In
other words, the job search process is not the same as the more specific process of
class mobility that was discussed in previous chapters. However, given the need to
augment the small N of the follow-up study, I will first pool all job shifts together for
analysis, irrespective of their "mobility significance". Towards the end of the
chapter, I will compare those moves that led to first service class jobs with other job
changes.
The strength of weak ties
I have briefly discussed Granovetter's "Strength of Weak Ties" thesis in Chapter 1
143
Let me elaborate his arguments here. In line with the findings of many labour
economists (e.g. Rees and Shultz 1970), Granovetter (1973, 1974) reports that
personal contacts are heavily used in the job search process. Based on a theory of
structural balance, he argues that if bridging ties are defined as those which serve as
the only connection between two persons (or two social clusters), then they are
probably weak rather than strong ties (tie strength is defined by, say, frequency of
contact). Hence, it is weak ties which link up distant parts of the social structure,
and it is weak ties which relay to a person information from remote social circles
which would otherwise be inaccessible. It follows that the more weak ties a person
has, the more labour market information he/she will receive, and this will in turn
facilitate job search. Hence the "Strength of Weak Ties".
Subsequent studies have generally supported Granovetter's argument, although they
also reveal greater variations in network effects (e.g. Lin, Ensel and Vaughn 1981,
Lin, Vaughn and Ensel 1981, De Graaf and Flap 1988, Marsden and Hurlbert 1988,
Wegener 1991, see also Granovetter 1982). I have discussed some of these studies
in Chapter 1. For our present purpose, it should be noted that two conditions need
to be met if the SWT thesis is to be fully validated. They are; (a) replication of the
weak ties effect at the aggregated level with representative data, and (b) verification
that the aggregated patterns are really generated by the micro-processes suggested by
Granovetter. As the studies cited above are all based on large scale sample surveys,
the investigators of these surveys have sought to demonstrate the weak ties effect at
the aggregated level (i.e. to meet the first condition). By comparison, the second
condition has so far been overlooked. This chapter, unlike previous endeavours,
seeks to test the SWT thesis at the micro level.
So what are the micro-mechanisms that Granovetter has in mind? To begin with, he
144
stresses that, "much labor-market information actually is transmitted as a byproduct
of other social processes" (1974:52). The majority of his respondents (especially
those who were better paid, more satisfied with their job) either had not actively
searched for their current job, 1 or if they had, the job news they received was not
related to their search effort. In this regard, Granovetter has given some vivid
examples of how news of job vacancies was passed on to his respondents during
chance meetings.
But individually random events do add up to stable aggregated patterns. First,
Granovetter observes that job contacts are often work contacts (i.e. former colleagues,
employers, or teachers) rather than relatives or social contacts. Moreover, work
contacts generally lead to better job offers. Having said that, family-social contacts
are important in their own ways. For instance, they are often in a better position to
help a person to make a major career change (e.g. switching to a completely different
field of work). This is because a person and his/her work contacts are very probably
working in the same field. Also, since family members normally span a wide age
range, they connect a person to a wider social world in terms of age. This may be
particularly important for young workers.
Second, many job contacts are old rather than recent acquaintances. Moreover, even
if little effort has been made by either party to maintain the relationship over time,
old acquaintances can still function effectively as job contacts. This implies that,
mobility seems to be self-generating: the more social and work settings one moves through, the larger the reservoir of personal
'Granovetter recognises that the notion of active search is problematic. It is possible that many people (especially professional, technical and managerial employees) always "keep their ears open for possibilities", but they will not take any positive action until some real opportunities present themselves. He estimates that 20% of his respondents fell in this category.
145
contacts he has who may mediate further mobility. It is because ties from past jobs and from before work are about as likely to be used as more recent ones that we have a cumulative effect, as if individuals "stockpile" their contacts. If only strong or recent ties mediate mobility, this could not be true. (Granovetter 1974:85)
This observation is, I should add, inconsistent with the assumption of most Markovian
models of career mobility.2 As a corollary, Granovetter (1974:85) further argues
that,
since relatively weak [ties] may be crucial, working on a job for two or three years may be sufficient to build a tie which will later be useful (though this is generally unanticipated). Too short a time may not be enough, since one's contact must have a definite impression of one's abilities and personality; staying too long in one's jobs, on the other hand, may foreclose future mobility by truncating the pool of personal contacts one might otherwise have built up.
In other words, there is an optimal duration of job tenure. Other things being equal,
a person whose career is composed of jobs held for the optimal duration should enjoy
better mobility chances than others.
Related to this point, Granovetter notes that while certain jobs (e.g. managerial posts)
require their incumbents to deal with people, others (e.g. technical laboratory work)
do not involve much personal interaction. It follows that managers will develop more
contacts in their daily work routine, and they will enjoy better mobility chances.
Similarly, people who are employed at the interface between firms (e.g. sales
2Most Markovian models assume that the probability of a system changing to a particular state, s, at time t+1 depends only on its state at time t. In other words, there is no direct effect of the various states that the system has previously gone through from time 1 through to t-1. This is the assumption of first order dependence. For example, these models assume that the chance of a person going into self- employment next year depends only on his/her current job. It does not matter what other jobs he/she has held before. In principle, higher order dependence can be assumed and modelled. In other words, one can search further backward in time for causes. However, in practice, this will soon make the model very cumbersome (see Abbott and Hrycak 1990 for a more detail discussion of this issue). The fact that common Markovian models are not fully appropriate for explaining career mobility justifies our effort to look for typical mobility paths in Chapter 4.
146
persons, purchasing officers) are particularly well positioned to make and accumulate
work contacts, and benefit from it.
I will not elaborate Granovetter's argument any further. It should already be clear
that many hypotheses of theoretical interest and significance can be derived from his
work. Unfortunately, existing studies in this area are almost exclusively concerned
with the weak ties effect. What researchers often do is to add, quite mechanistically,
a tie strength variable to a path analytic model of status attainment, and hope that a
significantly negative parameter estimate will be returned. Such effort is, of course,
useful and necessary, but I would argue that, if suitable data are available, we should
pay attention to the full range of hypotheses derivable from Granovetter's work.
Many of these hypotheses (such as that on optimal duration of job tenure) are
amenable to, indeed they require, quantitative verification by survey data. But in the
end, we will have to check whether these regularities are generated by the micro-
processes suggested by Granovetter. As Burt (1992) points out, the crux of the
matter is non-redundant information ~ to what extent is a person connected to diverse
social circles, and hence how far is the non-redundant information of these disparate
circles available to him/her. The number of weak ties that a person has is only a
proxy measure of how far he/she is diversely connected. In place of weak ties, Burt
proposes to use "structural holes" as an alternative proxy measure. I will not
compare the two measures here. My point is: since the follow-up study allows us
to examine the mechanisms of information diffusion directly, we should not be unduly
confined to the proxies.
Formal vs informal job search
Let us now turn to the data. Altogether, the 80 respondents of the follow-up study
147
reported 408 spells of wage employment.3 The longest of these spells lasted 38 years,
the shortest spanned only 3 months,4 while the average duration of a job was 3.7
years. For every spell of wage employment under a new employer, I asked the
respondent how he first heard about the job vacancy. If the answer was "from
someone I know", then I would follow-up with further questions to discover how the
respondent was related to his job contact. As far as possible, I also encouraged the
respondent to talk about the general context in which he took up the new job.5
Overall, as can be seen from the penultimate column of Table 5.1, personal contact
was the most important source of job information. Three quarters (76%) of all wage
jobs ever held by our respondents were found through personal contacts, one-fifth
were obtained by answering newspaper advertisement or "post-up" notices,6 and only
a very small minority (4%) were obtained through channels such as the government's
Local Employment Service, private employment agencies, or school's job placement
service. 7
3If, for example, a factory operative is promoted to become a foreman in the same factory, this will be coded as two jobs. However, since I am interested in the between-firm job search process, I consider only those jobs under different employers in this chapter. Hence the Ns of the tables is smaller than 408.
4For the purpose of coding, 3 months is the basic unit of event duration.
5Regrettably, I do not have systematic information on whether the respondent was actively looking for a new job at the time. Thus I cannot verify Granovetter's claim that most (professional, technical and managerial) jobs do not result from active search.
are announcements of job vacancies posted on lamp posts, notice-boards outside factory buildings, etc. Applicants usually walk in for interviews.
7This pattern is broadly consistent with the findings of two official surveys in Hong Kong on labour mobility conducted in 1982 and 1983. The 1983 survey has contacted over 39,000 persons in 14,105 households. One eighth (13.2%) of all respondents of this survey had changed jobs during the previous 12 months. And among the job-changers, 63.3% relied on assistance from their friends or relatives (personal contact) to find their current job; 27.5% answered or placed advertisements; while the rest registered with a public or a private employment agency, sent letters to firms directly, or used other means. Interestingly, the survey also reveals a
148
Table 5.1 also reveals that job search behaviour varies between social classes. About
80% of all manual (classes V+VI, Vila) jobs were found through personal contact.
The corresponding figure for non-manual (classes I+11, ni) jobs is 63%. It seems
that manual workers are, relative to non-manual workers, more reliant on personal
contacts in job search. 8
Turning to Panel A of Table 5.2, it is evident that job search behaviour also varies
with labour market experience, as indexed by the number of jobs a respondent had
previously held. First time job-seekers were slightly more inclined to use personal
contact (81% as compared to the overall level of 76%). Then the level of use of
personal contact declines such that 72% of the second, third, fourth or fifth jobs were
obtained in this manner. But it rises again to over 82% for sixth or subsequent jobs.
substantial difference in job search behaviour between male and female. While 69.9% of the male job-changers used personal contacts to find their current job, the corresponding figure for female job-changers is only 49.7%. As the findings of the two surveys are very similar, I will not report the findings of the 1982 survey here. But it is of some interest to note that since autumn 1981 the Hong Kong General Household Survey, which is conducted quarterly, has routinely asked its unemployed respondents what main action they have taken to find job. On average, 41.6% of the unemployed respondents of these surveys relied on personal contacts. In the round of the GHS done in spring 1990, respondents who were currently employed were also asked whether they had actively searched for another job in the last 30 days, and if they had, what main action was taken. It turned out that only 0.9% of the currently employed had been actively seeking jobs, but among this group of job-seekers, 58.2% used personal contacts. The same round shows that only 35.3% of the unemployed respondents used personal contacts to find a job (see Census and Statistics Department 1983, 1984, 1991).
8The prevalence of personal referral in job search and recruitment has been noted by many researchers (e.g. Rees and Shultz 1970), and various explanations have been put forward. For example, it has been suggested that employees would prefer personal referral to formal method because job intermediaries can usually give them job previews, making it easier for them to find jobs which match their choice. From the point of view of the employers, it is suggested that people employed through referral are usually of high ability. This is because the reputation of the intermediaries is at stake, and so they will only refer high-ability employees to the employers. Also, since intermediaries will give job previews to potential applicants, only suitable persons will apply. In other words, personal referral serves as a screening device.
149
This curvilinear relationship is an artefact, produced by the superimposition of two
opposite trends. Panels B, C and D of Table 5.2 clearly show that the relationship
between job search behaviour and labour market experience is itself a function of
social class. For service class jobs (Panel B), about half of the first, second or third
jobs were found through personal contact. This percentage rises steadily such that
57% of the fourth or fifth jobs, 86% of the sixth or seventh jobs, and all subsequent
jobs were obtained by this means. A similar trend of increasing use of personal
contact can also be seen for class III jobs (Panel C). 9 In contrast, Panel D shows a
decreasing trend for working class (V+VI, Vila) jobs: while 90% of the first jobs
were found through personal contact, this percentage declines more or less steadily
such that personal contacts accounted for only 70% of the 8th or subsequent jobs.
How can we explain these opposite trends? There may be different accounts, 10 but
'Two cautionary notes should however be noted: (a) Panel C shows greater fluctuation than Panel B, and (b) that there are only two cases in each of the two columns representing M 6th & 7th jobs" and "8th jobs & beyond" — such a small N should make us wary of the observed trend.
10For example, one may explain the increasing use of personal contact to get non- manual jobs as follows: in filling entry or junior level non-manual vacancies, the employer would want to be sure that the employees have a few basic abilities (in the context of clerical work in Hong Kong, this could be basic competence in the use of English). These basic abilities can often be adequately reflected in formal credentials. Moreover, the performance and true abilities of the employees can be monitored while they are employed at junior levels. Under-performers can be put in, what Gaertner (1990) calls, plateau positions of the firm, while promising employees will be placed in assessment positions ~ positions of greater responsibility and visibility which also offer better training and prospects of further promotion. In other words, from the employer's point of view, it is not essential that all employees recruited at the entry or junior levels are the best people available. It follows that formal methods can be relied upon as a relatively cheap means of recruitment for these jobs. Such hiring criteria of the employers are reflected in the relatively heavy use of formal job search on the part of young white collar employees. In contrast, to fill senior non- manual posts, the stake is much higher. The cost to the firm of having an unsuitable person employed at a senior level is much greater. Moreover, formal credentials or CVs would not be reliable to reflect many of the qualities that employers would require of senior employees. Hence, personal referral would be a more appropriate method of recruitment because it usually provides more comprehensive information about the applicants. In short, from the employer's point of view, the difference
150
my data support the following one. It starts with the idea that the job search method
that a person uses depends, to a large extent, on how useable the various methods are
to him/her. In particular, whether he/she will turn to personal contacts for job
referral is contingent on him/her having useful contacts in the first place. In Table
5.3, I crosstabulate, for those jobs obtained through personal contacts, contact type
by social class (of the job entered into). Overall, about a quarter (27%) of all
personal contacts were relatives of the respondents, 10% were former schoolmates,
and 13% were neighbours. Another 26% of the personal contacts were former or
present colleagues, or other people whom the respondents knew through work, while
8% were former superiors at work. Altogether work contacts accounted for about a
third of all personal contacts.
Not surprisingly, contact type varies between social classes. Nearly half (47%) of
the people who helped our respondents to get service class jobs were work contacts
(i.e. colleagues or superiors). However, only 26% of the contacts that led to class
Vila jobs, 32% of those that led to class III jobs, and 40% of those that led to class
V+VI jobs were work contacts. In other words, while work contacts are about as
useful as family-social contacts for getting service class jobs, the former are much
less useful than the latter for getting non-service class jobs.
This contrast is relevant to explaining the opposite trends noted above. By definition,
a respondent will not have any work contact before he enters the labour market.
between filling entry level and higher-level non-manual jobs is similar to that between buying a relatively standardised and cheap commodity (e.g. an apple) and buying a non-standardised and relatively expensive commodity (e.g. used car). Different methods of personnel search and selection are called for. Since I do not have any evidence on employers' hiring consideration and practices, the above account is purely speculative in nature, and it certainly does not explain why the trend of getting manual jobs is opposite in direction.
151
However, it is likely that the longer he works, the more work contacts he will
accumulate. Given the relative importance of work contacts for getting service class
jobs, a trend of progressively heavier use of personal contact from a relatively low
level can be expected.
Some supportive evidence for this argument can be found in cases which deviate from
the general trend. Of all the service class jobs obtained through formal methods, nine
were third or subsequent jobs. All of these nine cases are such that we would not
expect the respondent to be able to benefit from past work contacts. For example,
in three instances, the respondent was cut off from his old ties by geographical
movement. To see this, consider the following case materials.
Case 3: Mr C was born in Hong Kong in 1930. After finishing secondary
school, he worked as a clerk (class Ilia) for about two years. Then he went
to Peking University where he obtained a degree in English. For the next 27
years, he worked in Beijing, first as a translator (II), then as a university
teacher in translation (I). He returned to Hong Kong in 1980, after spending
some thirty years in Beijing. Of course, Mr C could not turn to his old
Beijing colleagues for job referral (although, as we shall see, one of them did
help him to get a job in Hong Kong later on). An old friend from secondary
school first hired him as a secretary (Ilia). Six months later, he changed to
a travel magazine and worked as a translator (II). He was invited by the
magazine's publisher to take up this job. This person was, however, a social
friend rather than a work contact of Mr C. In 1982, he got his seventh job
as an interpreter (II) in an American oil company by answering a newspaper
job advertisement.
152
Case 15: After finishing his A levels, Mr W briefly worked as a bank teller
(class ma). Then he went to Hong Kong Polytechnic for three years, and
obtained a diploma in quantity surveying. He had then worked as a quantity
surveyor (I) in two Hong Kong firms (both jobs were found through formal
application, and each lasted for about a year) before he went to England for
a one-year B.Sc. course. He decided to stay in England after finishing the
course. Through a private employment agency, he found a quantity surveyor
job (I). He held this job for 14 months. Then he returned to Hong Kong
where, by answering a newspaper job advertisement, he got his fifth job as a
project quantity surveyor (I).
In the above example, it would be very difficult for Mr W's English colleagues to
refer him to any job in Hong Kong. Also, if Granovetter is right about optimal
duration of job tenure, Mr W had not stayed in his previous Hong Kong jobs for long
enough to allow useful work contacts to build up. As a result, he had to rely on
newspaper job advertisements to find his fifth job (or his fourth service class job).
For the other six outlying cases (i.e. those in which a respondent, who was not at the
beginning of his career, used formal methods to get a service class job), the
respondents were taking up jobs in new fields. As noted above, work contacts are
not very useful in this situation. Consider the following case. 11
"Brief outlines of career movement of the other five cases are listed below. The last job in each case is the service class job obtained through formal method: Case 14: factory labourer ... unemployment ... factory packer ... police
constable Case 52: secondary school teacher ... resumed schooling, sixth form ... clerical
officer, civil service ... trade regulation officer, civil service Case 58: assistant engineer, electrical factory ... unemployment ... technical
assistant, aeroengineering firm ... factory inspector, labour department Case 58: assistant engineer, electrical factory ... unemployment ... technical
assistant, aeroengineering firm ... factory inspector, labour department... technician, construction company
Case 69: site foreman, construction company ... site coordinator, construction
153
Case 42: After finishing secondary school, Mr A worked in his father's
trading firm for a year (class Ilia). Then he went to a tertiary college to read
English. Afterwards, his girlfriend's brother introduced him to work in a
second trading firm as a technical clerk (Ilia). This firm was in the business
of dyeing materials. In this job, Mr A was primarily responsible for typing
and store-keeping. Three years later, he answered a newspaper advertisement
for a post of surveyor/liaison clerk (I) in a construction company, and was
hired. In this third job, Mr A's duty was to visit work sites, estimate the cost
of work, and submit tender for the job.
Altogether, the nine outlying cases suggest that if a respondent, who was not at the
beginning of his career, used formal methods to look for a service class job, it was
probably because he had experienced considerable career discontinuities, in spatial or
occupational terms, which made it difficult for him to turn to past work contacts for
assistance. In other words, he was pushed to use formal methods.
To understand the opposite trend for manual jobs, readers should recall that to get
manual jobs, family-social contacts (i.e. relatives, former schoolmates, neighbours)
are more useful than work contacts. Since a respondent can benefit from family-
social contacts right from the beginning of his worklife, heavier use of personal
contacts to get entry-level manual jobs can be expected. If one further postulates that
support and assistance from one's relatives and old schoolmates generally declines
over an adult's life course, 12 then the downward trend in the use of personal contacts
company ... assignment officer, Independent Commission Against Corruption
l2See Rossi and Rossi (1990) and Cooney and Uhlenberg (1992) for evidences that parental support of various forms (gifts, advice, service, help in child care) as well as children's perception of parents as potential source of help generally decline over
154
to get manual jobs can also be explained. In short, the opposite trends of Table 5.2
can, at least in part, be explained by the combined effects of two factors: (a) while
work contacts are more important for getting service class jobs, family-social contacts
are more useful for getting manual jobs, and (b) the availability of these two types
of contact change in opposite directions over a person's worklife. 13
Related to this argument is a caveat about a possible sampling bias. If it is true that
people usually have many family-social contacts (especially relatives) and few work
contacts at the beginning of their worklife; and if we further assume that the class
position entered into by a respondent is highly correlated with the class position of
his job contact (some evidence for this claim will be presented shortly); then since all
respondents of the follow-up study were of class IVab or Vila origin, it is probable
that, for their first few jobs, personal contacts would lead them to manual rather than
non-manual jobs. That is to say, the respondents did not have many people in their
social world they could turn to for referral to service class jobs. They were in effect
pushed to use formal methods in their search for service class positions. Conversely
put, if there had been some respondents of service class origin in the follow-up study,
one could have expected heavier use of personal contacts to get entry level service
class jobs.
A profile of "service-class-contacts"
Having reported how far personal contacts matter in getting wage jobs in general, and
the life course of the adult child.
13The routine non-manual class is the anomaly here. Relatives and former schoolmates were important for getting both class III and manual jobs. However, in contrast to the trend of decreasing use of personal contact to get manual jobs, there is, for class III jobs, a tendency for increasing use of personal contacts. I do not know why this is the case.
155
service class jobs in particular, I will now describe the people who introduced our
respondents to service class jobs (hereafter service-class-contacts). The question is:
do they differ from other job contacts? I have already noted, in relation to Table 5.3,
that contacts for non-service class jobs were often relatives, neighbours or old
schoolmates of the respondents, while to get service class jobs, work contacts were
just as important as family-social contacts. 14 So the first thing to note about service-
class-contacts is that there are more work contacts among them.
It is also possible that getting a service class job depends partly on having a well-
placed contact. This idea is well borne out by my data. As can be seen from Panel
A of Table 5.4, more than two thirds (68%) of the service-class-contacts were
themselves members of the service class; and one-fifth (21%) of them belonged to
class IVab. In sharp contrast, 61 % of the contacts that led to unskilled manual jobs
were themselves unskilled manual workers, and 40% of the contacts that led to skilled
manual jobs belonged to the skilled manual class.
In a way, Table 5.4 resembles a conventional father-son mobility table ~ 52% of the
cases fall on the main diagonal, and there are progressively fewer cases as one gets
further away from it. To verify this impression, I have fitted two loglinear models
to this contact-job table. The results are shown in Panel B. Model 1 is the
independence model, which postulates no association between contact's class and the
class of the job entered into. (Since we are considering only wage employment, the
column representing class IVab is blocked out as structural zeros in both models.)
l4Table 5.3 also shows that (a) relatives constitute 41% of all contacts that lead to class III jobs, and (b) that neighbours are important sources of information about class Vila vacancies -- one fifth of all contacts that lead to class Vila jobs belong to this category. Given the limitation of space, I will not discuss these findings in detail.
156
As expected, the independence model does not fit the table very well. But it provides
a baseline against which other models can be compared. Model 2 is the quasi-
independence model. It acknowledges the tendency for cases to be found on the main
diagonal, but it also stipulates perfect mobility among the off-diagonal cells. This
simple model accounts for 92% of the total association in the table, and achieves a
very good fit with the data. So, indeed, the contact-job table shares an important
feature with conventional father-son mobility tables, namely the "immobility effect". 15
On the whole, the pattern evident in the contact-job table is consistent with the
argument of Lin, Ensel and Vaughn (1981) that the occupational status of the job
contact (which is a measure of his/her resources) positively affects the status
attainable by the respondent. In particular, people who have contacts in the service
class enjoy a much better chance of getting service class jobs.
Of course, some service-class-contacts were not members of the service class. They
were mostly small employers (class IVa) who hired our respondents in their own firm
as managers or clerical supervisors. This is one example:
Case 54: When Mr K left school at the age of 16, a neighbour introduced
him to work as an office assistant (class Vila) in a forwarding company (this
person was a truck driver in the same firm). Within six years, he was
promoted to become a senior clerk (Ilia). Then he was invited to join a
second forwarding firm as a clerical supervisor (II) by the firm's proprietor,
Mr A (IVa). It should be noted that Mr K and Mr A did not know each other
before. By chance, Mr A met a friend, Mr C, on a plane. The latter had
l5Of course, it often takes models much more complex than the quasi- independence model to fit father-son mobility tables.

157
emigrated to the United States for some time, but before his emigration, he
was the immediate superior of Mr K in the first forwarding firm. Learning
that Mr A had just set up his own business, and that he badly needed some
experienced people to staff several positions, Mr C recommended Mr K to
him. After returning to Hong Kong, Mr A offered Mr K the job.
The above case illustrates how information about jobs and candidates is passed on
during chance meetings. It is also a good example of a respondent getting a job
which he has not actively searched for. Furthermore, it shows how an old
acquaintance in a remote place can still act as an effective job contact. We will
return to these themes later on. Let me cite another case in which a foreman
introduced a respondent to a service class job.
Case 21: After he had finished secondary school, a cousin of Mr L
introduced him to work as a junior clerk (class Ilia) in an electronics factory.
Within four years, he was promoted to become a shipping clerk (Ilia). Then
Mr L was invited to join a second electronics factory as a shipping supervisor
(II). The job contact in this case was a former colleague, a foreman (V) in
the first factory. She had changed to the second factory (where she also
worked as a foreman) some time earlier, and when she heard that there was
an opening of shipping supervisor, she recommended Mr L for the job. To
anticipate a later point, Mr L was not close to this foreman at all when they
were colleagues in the first factory. He did not know when she left the
factory, nor had they kept contact after she had gone. Similarly, the foreman
did not know how to get in touch with Mr L directly either - she had to
contact him through a friend they had in common.
158
This brings us to the question of the strength of weak ties. I have two measures of
tie strength -- frequency of contact, and respondent's assessment of how close he was
to the job contact. Let me start with frequency of contact. Panel A of Table 5.5
shows that strong ties (frequency of contact being once a week or more) accounted
for about half (52%) of all jobs obtained through personal contacts, intermediate ties
(less than once a week but more than once a year) accounted for about a third (31%),
and weak ties (once a year or less) were responsible for only 18% of the jobs.
Roughly speaking, the same relative order holds for classes III, V+VI and Vila jobs.
However, this order is completely reversed for service class jobs: weak ties
accounted for half of all service class jobs that were obtained through personal
contacts, intermediate ties accounted for another 38%, and strong ties were
responsible for just 13%.
Using almost identical cutting points (at least twice a week for strong ties, once a
year or less for weak ties, in between for intermediate ties), Granovetter observes that
his respondents (a sample of professional, technical and managerial workers in a
Boston suburb, N=54) received more job news from weak ties (27.8%) than from
strong ties (16.7%). But the majority (55.6%) of them heard about job vacancies
through intermediate rather than weak ties.
So our result is consistent with the SWT thesis. But what explains the very striking
weak ties effect in Hong Kong? Perhaps the very small sample size (there are only
16 service-class-contacts) is partly responsible for this. However, I cannot preclude
the possibility of a real difference between Granovetter's sample and the present one.
In any case, if we turn to the subjective measure of tie strength (respondent's
assessment of how close he was to the contact) in Panel B, a pattern more consonant
with Granovetter's findings can be observed. While most (63%) service class jobs
159
were found through moderately close contacts, our respondents received more job
news from people they considered as not close to them at all (31 %) than from their
close associates (6%). In other words, using this second measure, a relatively
modest, but still impressive weak ties effect can be observed. 16
Since our respondents did not know their service-class-contacts very well, one may
think that these contacts were not involved in our respondents' family and social life.
This is partly a question of network density. I have, again, two measures of network
density ~ whether the contact knew the family and the close friends of the
respondent. Admittedly, these two measures are seriously inadequate, but as rough
indices, they do point to a pattern which deserves some attention. Panel A of Table
5.6 shows that the service-class-contacts stood out from the rest — less than a quarter
(23%) of them knew the respondent's family, whereas for all other contacts, 59 to 80
percent did.
One may think that this contrast is an artefact, because (a) there were proportionately
fewer relatives among the service-class-contacts, and (b) that relatives usually know
one's family. So in Panel B, I screen out all contacts who were relatives of the
respondents, and consider only the non-relatives. Compared to Panel A, there is a
drop across the board in the percentage of contacts who knew the respondent's
family. However, the contrast between the service class and other classes remains.
Turning to the question of whether the contact knew the respondent's close friends
(Panel C), no sharp difference can be found between the service-class-contacts and
l6Panel B of Table 5.5 also shows that weak ties account for less than 8% of all non-service class jobs. Moreover, both measures of tie strength suggest that members of the routine non-manual class are most inclined to use strong ties.
160
other job contacts. In fact, the outliers of this Panel are those that led to skilled
manual jobs, but the difference here is clearly not as big as those seen in Panels A
and B.
Finally, I will consider for how long the respondent had known his contact. Readers
can see from Table 5.7 that one-fifth of all contacts were very recent acquaintances
of our respondents - they had known each other for one year or less. Relationships
that had stood for 6 to 10 years, 11 to 20 years, and over 30 years each accounted
for about a quarter of all cases. Six percent of the cases were relationships that had
stood for 21 to 30 years. For reasons unclear to me, no contact had known the
respondent for 1 to 5 years.
Against this general picture, what distinguishes the service-class-contacts is their
uneven distribution. Close to 80% of them were clustered in two groups — "between
6 to 10 years" and "over 30 years"; and there were fewer recent acquaintances among
the service-class-contacts. I am not sure why this should be the case. I also cannot
explain why there is no observation in the two categories of "1 to 5 years" and the
"11 to 20 years". However, the fact that nearly half (47%) of the service-class-
contacts had known the respondents for over 20 years is consistent with Granovetter's
suggestion that old associates are just as effective job contacts as recent ones. The
following is an example of an old acquaintance acting as a job contact from afar.
Case 3 (see above): Mr C was born in Hong Kong. But for 30 years, he had
worked in Beijing as a translator (class II) and a university teacher (I). After
returning to Hong Kong, he had worked as a secretary (Ilia), a translator (II),
an interpreter (II), and a book editor (II), and had even run a small translation
company (IVa) for three years, before he was offered a job of chief editor in

161
a major dictionary publisher. The managing director of this publishing house
had earlier attended a conference in Beijing where he met a former
subordinate of Mr C. Although the latter had not kept close contact with Mr
C since he left China, he recommended Mr C to the managing director for the
post of chief editorship in the publishing house.
I will shortly present more case materials to illustrate how job news travels from the
employer to the applicant, but let me first sum up our findings so far. On the whole,
our findings are consistent with Granovetter's argument. Service-class-contacts were
often work, rather than family-social, contacts. Seventy percent of them were
members of the service class, and about half of them were old acquaintance of our
respondents. It seems that little effort had been made by either the respondents or the
contacts to maintain their relationship over time. They rarely met each other, and
less than 10% of the respondents regarded their job contacts as their close friends.
Therefore, it can be said that most of the respondent-contact relationship were weak
ties. Also, only a quarter of the contacts knew the respondent's family, and just a
third of them knew the respondent's close friends. All but the very last of these
characteristics were peculiar to the service-class-contacts.
Let us look at more case materials. Given their numerical prominence, I will first
consider the work contacts. I can distinguish at least three ways in which work
contacts passed on job news to the respondents. The first and most straightforward
mechanism operates as follows: an old colleague of the respondent moves to a
different firm; he/she subsequently hears about a vacancy, and passes on the news to

162
the respondent. 17 Case 21 cited above is an example of such chain-like movement of
personnel between firms. The following is another example.
Case 18: When Mr N dropped out from school after form 3, he joined a
construction company as an office boy (class Vila). He got on very well in
this job. Within three years, he was promoted to become an architectural
trainee (Ilia) and then an architectural assistant (Ilia). He was also sponsored
by the company to attend a 4-year part-time course in Building Management
at Hong Kong Polytechnic. Unfortunately, the company went bankrupt soon
after he finished the course. For the next 12 months, Mr N shifted between
three different jobs. However, when the managing director of the
construction company became a vice president of a property development
firm, he offered Mr N the job of project coordinator (II) in the new company.
The key to the second mechanism is part-time work. For various reasons (e.g.
supplementary income), a respondent may take up a part-time job. This usually
brings him into contact with a wider range of people than his main job would allow.
Some of these people may later become job contacts. Consider the following cases.
Case 3 (see above): Mr C had previously worked as a translator (class II) and
a university teacher in translation (I) in Beijing. After coming to Hong Kong,
he worked as a secretary (Ilia), a translator (II) and an interpreter (II). While
employed in these jobs, he also did some freelance translation work in his
spare time. While looking for a publisher for his work, he came to know a
l7One can easily think of variants of this first mechanism. For instance, instead of changing to a second firm to take up a wage job, the former superior or colleague could have set up his/her own business.
163
general manager of a publishing house. After reading Mr C's work, the
manager offered him a post of guest editor (II) responsible for the publication
of two other books.
Case 6: Mr W was born in mainland China in 1929. After secondary school,
he worked briefly as a warehouse administrator (class II) in Guangzhou, but
a year later, the communists won the civil war in China, and Mr W fled to
Hong Kong. He did not know anyone in Hong Kong, could not speak the
local dialect (Cantonese), and his command of English was minimal. Because
of these disadvantages and the generally adverse economic conditions of the
time, he was unemployed for his first three years in Hong Kong. During this
period, he lived on his savings and a small and unstable income from
freelance contributions to local magazines. Since there was no prospect of
employment in the near future, Mr W decided to go back to school. He
enrolled in a newly established tertiary college to read Chinese and History.
He had won a small scholarship to support his study, but to earn
supplementary income, he also worked part-time for a research
institute/publisher for three years. Upon his graduation, he was invited to
take up a full-time researcher post (II) in the institute.
Case 19: After leaving school, Mr C worked in his father's "dry-storage
yard" (class IVa). In this family business, they maintained, repaired, tested
and sometimes built yachts. They were also involved in speedboat brokerage.
If someone was looking for a speedboat, Mr C would scout for a model and
test the boat for the buyer. After one of these deals, the buyer told Mr C that
he was also looking for a skipper (I) for his yacht. Mr C expressed interest
in the job and was hired.

164
Notice that Case 19 also illustrates how a former client can subsequently become a
work contact. I take this as the third mechanism of the "work contacts effect". To
elaborate, the operation of a small business often requires at least one partner to keep
frequent contact with people outside the firm. The work contacts thus accumulated
may provide useful job leads later on. The following is further example.
Case 9: Mr H left school as a form 5 graduate. Then he had worked for
eight years as a field supervisor (class V) in a small packing-removal company
before he set up his own packing-removal firm (IVa). He was encouraged to
do so by the principal client of his former employer ~ a large international
removal company for which smaller companies worked as subcontractors.
The management of this international company was unhappy with Mr H's
former employer, and it promised to place orders with Mr H if he set up his
own firm. Mr H heeded the advice, and the business went well. Six years
later, the client company decided to set up its own operation department. Jobs
which would have been subcontracted out under previous arrangement would
now be done by its own staff. As a result, it would no longer place orders
with Mr H, but it offered to incorporate Mr H and his staff into its new
operation department. Under such circumstances, Mr H returned to wage
employment and became an operation supervisor (V) of the client company.
Soon after he joined the company, a colleague (but Mr H first came to know
him as a client) left the firm to set up his own removal business. He asked
Mr H to join him. Mr H felt at that time that he should stay with his former
employees. So he declined the offer. About two years later, Mr H received
the same offer again. He accepted it and became an operation manager (II).
The details of the above cases vary considerably, but it should be clear that all three
165
mechanisms are consistent with the central idea of the SWT thesis. Having old
colleagues scattered in different firms, taking a part-time job, or operating a small
business all brought respondents into contact with a larger number of people in
different circles. As a result, the respondent received more non-redundant
information, and this, in turn, enhanced his mobility chances. Thus interpreted, the
case material is consistent with Granovetter's argument.
Let us now turn to the family-social contacts. Consider the following examples.
Case 17: Mr K was a form 5 graduate. Attracted by the job security of the
civil service, he became a clerk (class Ilia) in the labour department upon
graduation. But gradually he became dissatisfied with the poor promotion
prospects in the civil service. Five years later, his girlfriend's father invited
him to work in his firm (a manufacturer-cum-retailer of decorative lights).
He accepted the offer and became an assistant manager (II).
Case 27: Mr M left school after form 6. He had then worked as an account
clerk (class Ilia), and had also run a small music shop (IVb) before he settled
in a career as a salesman. Starting from the post of salesman (Ilia), he was
gradually promoted to become a senior sales executive (II). While working
as a salesman, he also operated a trading firm with a colleague on a part-time
basis for about 3 years. Then he was introduced to his present job as the
manager (II) of a trading firm by his cousin, Mr D. Mr D had been to
Taiwan for his university education, and had met his wife there. A relative
of Mr D's wife was setting up a toy factory in mainland China, and needed
someone whom he can trust to head a branch office in Hong Kong (in order
to support the operation of the mainland's factory). When Mr D learnt about
166
this vacancy, he recommended Mr M for the job.
It is certainly hazardous to generalise on the basis of just a few cases, but bearing this
warning in mind, the two cases (especially the last one) cited above do suggest that
the job referral process mediated by family-social contacts can be very convoluted.
In other words, family-social contacts do sometimes connect a person to distant social
circles, and thus made available to him the non-redundant information of these diverse
settings.
Contacts at the turning point of careers
As noted above, only a fraction of all the job shifts considered in this chapter led to
our respondents getting their first service class jobs. Moreover, not everyone took
up their first service class job under a new employer. A respondent could have
entered a firm as a routine non-manual or even a manual employee, and then received
promotion to a service class position within the firm. In this case, one may argue
that the key event or the turning point of the respondent's career was his entry to the
firm rather than his promotion. But the job contact at this turning point was not
classified in the last section as a service-class-contact.
Consider also the example of Mr M of case 2. He left school after form 5 and
became a construction leveller (class VI). Three years later, he returned to school
to do his A levels. Then he went to Taiwan for his university education. The degree
in engineering he obtained there enabled him to work as an engineer (class I) when
he returned to Hong Kong. In this case, one may argue that the key event of Mr M's
career was his return to school and higher education rather than his appointment to
the engineer job.
167
The general point here is that for some respondents, the turning point of their career
was temporally prior to their transition into the service class. By focusing, in the last
section, on the service-class-contacts, I have overlooked some people who were
crucial in the mobility experience of some of our respondents. It is important for us
to ask whether, and if so how, the contacts at the turning point of careers (labelled
hereafter as key contacts) differed from the service-class-contacts. This section seeks
to answer this question. The main problem here is to decide the turning point of a
respondent's career. Generally speaking, I have used two rules which are implicit
in the two examples noted above. First, if a respondent was promoted within a firm
to a service class position, then the turning point was his entry into that firm. 18
Second, if a respondent took up a service class job immediately after his return to
school or college, then the spell of resumed education will be taken as his turning
point. Of course, if a respondent previously of non-service class status took up a
service class job under a new employer, then this new job will be the turning point
of his worklife.
I have inspected all 37 careers in the follow-up study that contain at least a spell of
service class job (i.e. the cases examined in Chapter 4), and their turning points are
determined according to the above rules. The 37 turning points fall into three groups:
26 (70%) of them were events of wage employment, 5 (14%) were events of
entrepreneurial venture, and 6 (16%) were events of resumed schooling. Of the 26
wage jobs, 14 (54%) were service class jobs, 6 were class III jobs, and 6 were
manual (V+VI, Vila) jobs. I have already discussed the 14 service class jobs and
their contacts in the previous section, but here all 26 jobs are considered together and
l8There are exceptions where I have not chosen the entry of a person into a firm as his career turning point (see cases 10 and 26 below). There is certainly an arbitrary element in these cases. But after considering the case materials, I judge that the turning points chosen would best capture the career dynamic of each case.
168
the same set of questions discussed earlier - whether personal contact was involved
in the job search process, and if so, how the respondent was related to the contact —
are applied to them. The answers to these questions are listed in the last column of
Tables 5.1 and 5.3 to 5.7.
To sum up: two thirds of the key jobs were obtained through personal contacts
(Table 5.1). This is almost identical to the level of use of personal contacts to get
service class and routine non-manual jobs. Table 5.3 shows that 64% of the key
contacts can be classified as work contacts, 14% were relatives, and 7% were former
schoolmates. Evidently, this distribution is much closer to that of the service-class-
contacts than to other job contacts. Also, 73% of the key contacts did not know the
respondent's family, 80% of them did not know the respondent's close friends (Table
5.6). The corresponding figures for the service-class-contacts are 77% and 67%
respectively. A broad similarity between the two types of contacts is again manifest.
Differences between them can, of course, be found. For example, only 39% of the
key contacts, but 68% of the service-class-contacts were members of the service
class. Also, relative to the service-class-contacts, there were fewer small employers,
but more routine non-manual and manual workers among the key contacts. In other
words, the key contacts were more evenly distributed in terms of their own class
position. Turning to Table 5.5, readers can see that relatively more key contacts
were strongly tied to the respondents. (This is true in terms of both measures of tie
strength.) However, weak ties were used just as often as strong ones to get "key
jobs", and the level of use of weak ties to get "key jobs" was still considerably higher
than that for getting routine non-manual or manual jobs. On the whole, the strength
of weak ties was less impressive with respect to the key contacts, but it can still be
seen. Finally, compared to the service-class-contacts, there were more recent
169
acquaintances among the key contacts (Table 5.7).
On the whole, the general profile of the key contacts is similar to that of the service-
class-contacts. In any case, they were much more similar to each other than either
of them is to other job contacts. As a further test, I have split the key contacts into
two sub-groups: those that led to the service class jobs directly (i.e. those which
were studied in the last section) and the rest. With respect to all variables discussed
earlier (strong vs weak ties, work vs family-social contact, etc.), chi-square tests do
not reveal any significant difference between them. Given these results, I would
maintain that the observations made in the last section are robust. Indeed, if we
examine the case materials related to the key contacts, many of these observations can
be further confirmed. For example, the following two cases show how job news was
passed between old acquaintances who have kept minimal contact with each other.
Case 13: Mr H left school after form 2. Then he worked as a craftsman
(class VI) in two furniture workshops for four and a half years. Afterwards,
he changed to an interior decorator firm. There was less manual-artisan work
in this third job, and Mr H had hoped that it would eventually lead him into
interior design or sales work (Ilia). However, he had to quit the job two
years later because of respiratory problem. For the next three years, he
worked in two restaurants as a waiter (Vila). Then he joined a hotel, also as
a waiter (Vila). At that point, Mr H was thinking of settling in waiting jobs,
so he began to take English and Japanese classes so that he could
communicate with his customers more easily. His effort soon paid off.
Within three years, he was promoted to become a "captain" (V), but he also
began to feel unhappy about his career prospect. At about this time, he kept
running into an old workmate from one the restaurants he used to work on his
170
way home from the hotel. This person had left waiting jobs altogether, and
was then a sales manager of a company that sold office equipment and
supplies. Mr H thought that this might be a good career change, and he asked
this friend to introduce him to work in his firm. He did very well in this new
job — within 10 months, he was promoted from salesman (Ilia) to sales
supervisor (Ilia); after another 8 months, he was promoted to his present job
as a sales manager (II).
Case 24: Mr I left school as a form 5 graduate. Then he worked as an office
assistant (class Vila) in a company which installed theft and fire prevention
equipments. Eighteen months later, he took up a technical traineeship (VI) in
the same company, and began to attend a 3-year certificate course in
mechanical engineering in a technical institute. Mr I did not finish the course.
In fact, he left the company 18 months later to work as an assistant attendant
(Vila) in a property development company. Three years later, he ran into an
old schoolmate in a restaurant. They had played football together in school,
but they had not kept contact since graduation. This person was then manager
of a geotechnics and engineering company. When he learned that Mr I was
looking for a new job, he offered Mr I the job of trainee laboratory technician
(VI) in his company. Mr I was eventually promoted to become a senior
laboratory technician (II). At the time of the follow-up study, he was a site
agent (V) of the company.
Similarly, the following case illustrates how a respondent who was employed at the
interface between firms benefitted from his daily work contacts.
Case 20: After finishing form 6, Mr Y worked as a clerk (class Ilia) in a
171
small container-repairing company. His duty in this job was restricted to
simple paperwork. Eighteen months later, he was "promoted" to become an
estimator (Vila). This was a semi-manual job which involved outdoor work:
Mr Y would inspect damaged containers, estimate the cost for repair work,
and liaise with relevant parties over matters such as responsibility and
expenses. Consequently, Mr Y had to deal with many people in related trades
such as shipping and warehousing. About two years later, one of his daily
work contacts from a shipping company told him about a clerical (Ilia)
vacancy in another shipping company. Mr Y applied for the job and was
hired. Within a year, he was promoted to the position of clerical supervisor
(II) in the container-repairing department of the company. Eventually, he was
further promoted to become a controller (II) and a department manager (II).
In general, the mechanisms of job referral reported in the last section also apply to
the key contacts. However, the following two cases do suggest a different
mechanism.
Case 26: Mr A left school after form 4. He first worked as a factory
labourer (class Vila) for 6 months. Then through his elder brother he took
up an apprenticeship in glazing (Vila). Within 2 years, Mr A became a
subcontractor (IVa). However, the construction industry went into a slump
three or four years later, and he was forced to give up glazing work
altogether. Mr A's elder brother was then working as a self-employed truck
driver, and he brought Mr A into the trade. He worked as a self-employed
truck driver (IVb) for three years until a downturn of business pushed him out
of his job again. At this point, his elder brother was working as a chauffeur
in a garment factory. This garment factory was related to an electronics
172
factory through a common partner. When he heard about a vacancy for
chauffeur in the electronics factory, he introduced Mr A to the job. In this
job, Mr A worked for the factory's managing director. He got along with his
boss very well. The latter gradually felt that Mr A should not waste his talent
working as a chauffeur, so he promoted him to the position of computer
operator (Ilia) in the same company. The company also sponsored Mr A to
attend a part-time evening course in computer programming. When he
finished the course 18 months later, he was promoted to become a
programming trainee (II), and subsequently a programmer (II).
Case 10: Mr W had only had primary education. At the age of 12, he took
up an apprenticeship (class VI) in a metal workshop. Two years later, he
changed to work as an ironer (Vila) in a garment factory. After three years,
he changed again to a third factory and worked as a machine operative (Vila).
Mr W's father was a gardener in a public hospital. Through his colleagues,
he heard that a new hospital was going to be opened within a few years and
there would be many vacancies for porters, cleaners, etc. Thinking that these
jobs would offer far more job security than unskilled factory jobs, he put in
an application on Mr W's behalf. Two years later, Mr W was hired as a
cleaner (Vila) in the new hospital. He was assigned to work in the hospital's
milk room. According to Mr W, all casual workers in the hospital knew that
the X-ray department sometimes "promoted" its cleaners to the post of dark
room technicians. Recruitment for dark-room technicians was open and there
would be an aptitude test. However, because the cleaners in the X-ray
department would have informally picked up some relevant skills, they usually
stood a better chance in the test. Since becoming a dark-room technician was
one of the few promotion chances hospital cleaners could realistically hope

173
for, most of them wanted to get a transfer to the X-ray department. Naturally
this meant a long queue. Also, the head of the original department would
have to agree to release the cleaner before he/she could get the transfer, so
relationship with one's superior was very important. Mr W got on very well
with his supervisor, and, perhaps because he was the youngest cleaner in the
milk room, Mr W's supervisor thought that he should not spend his life in
such a menial position. Eventually, through her husband, who was a
radiographer in the hospital, the supervisor heard that there was a vacancy for
a cleaner in the X-ray department. She encouraged Mr W to apply and
supported his application. Mr W moved to the X-ray department at the age
of 27. Two years later, he passed the test and became a technician trainee.
After six months of training, he became a dark-room technician (II).
I have reported three ways in which work contacts facilitate the job search process
(having work contacts scattered in different firms, taking part-time jobs, and running
a small business), and I have suggested that the crux of these mechanisms is non-
redundant information. Set against this background, the two cases cited above are
interesting because they point to a fourth mechanism. The mobility experience of
these two respondents cannot be explained by the information benefit of their previous
jobs. In fact, their jobs as chauffeur and cleaner were both very restrictive in terms
of the range of people they met at work. However, in both cases, a superior acted
directly to transfer the respondent to a position with better promotion prospects; and
from these positions, the two respondents subsequently moved on to service class
posts. Such direct intervention by a superior was not observed among the service-
class-contacts. This should not be surprising given that it is much more difficult for
a superior to intervene directly in the context of inter-firm mobility.
174
Chapter summary
The evidences we saw in this chapter are consistent with Granovetter's SWT thesis.
I have found that our respondents relied heavily on personal contacts in job search,
irrespective of what type of jobs (e.g. service class, manual) they were looking for.
However, "service-class-contacts" (i.e. contacts that led to service class jobs) were
different from other job contacts: they were more likely to be work contacts; the
majority of them were members of the service class; many had known our
respondents for a long time; but they probably had not kept close contact with our
respondents over the years. On the whole, it must be said that our respondents were
only weakly tied to their service-class-contacts.
These findings allow us to answer the questions raised in the first paragraph of this
chapter: yes, there is a particular type of people who are more helpful than others
insofar as getting service class jobs is concerned (i.e. the "service-class-contacts"
described above). Moreover, since a person does not need to put in a lot of effort
to maintain his/her relationship with service-class-contacts, he/she can accumulate
these contacts without over-stretching his/her resources, such as time. How does one
get to know more service-class-contacts in the first place? Of course, there are
idiosyncratic factors (e.g. how "sociable" a person is) which affect the number and
type of people that one knows. But for our present purpose, I would emphasis the
importance of career history. Consider the three mechanisms of work contact effects
noted above: (a) having old colleagues scattered in many different firms, (b) taking
up part-time jobs, and (c) running a small business. These three mechanisms are all
about worklife history. Because work contacts known from a long time ago can still
function effectively as service-class-contacts, people who had held jobs which put
them into contact with the right type of people would enjoy better mobility chance
subsequently. This suggests some sort of path dependence, which is consistent with

175
the idea of "typical mobility paths" explored in Chapter 4.
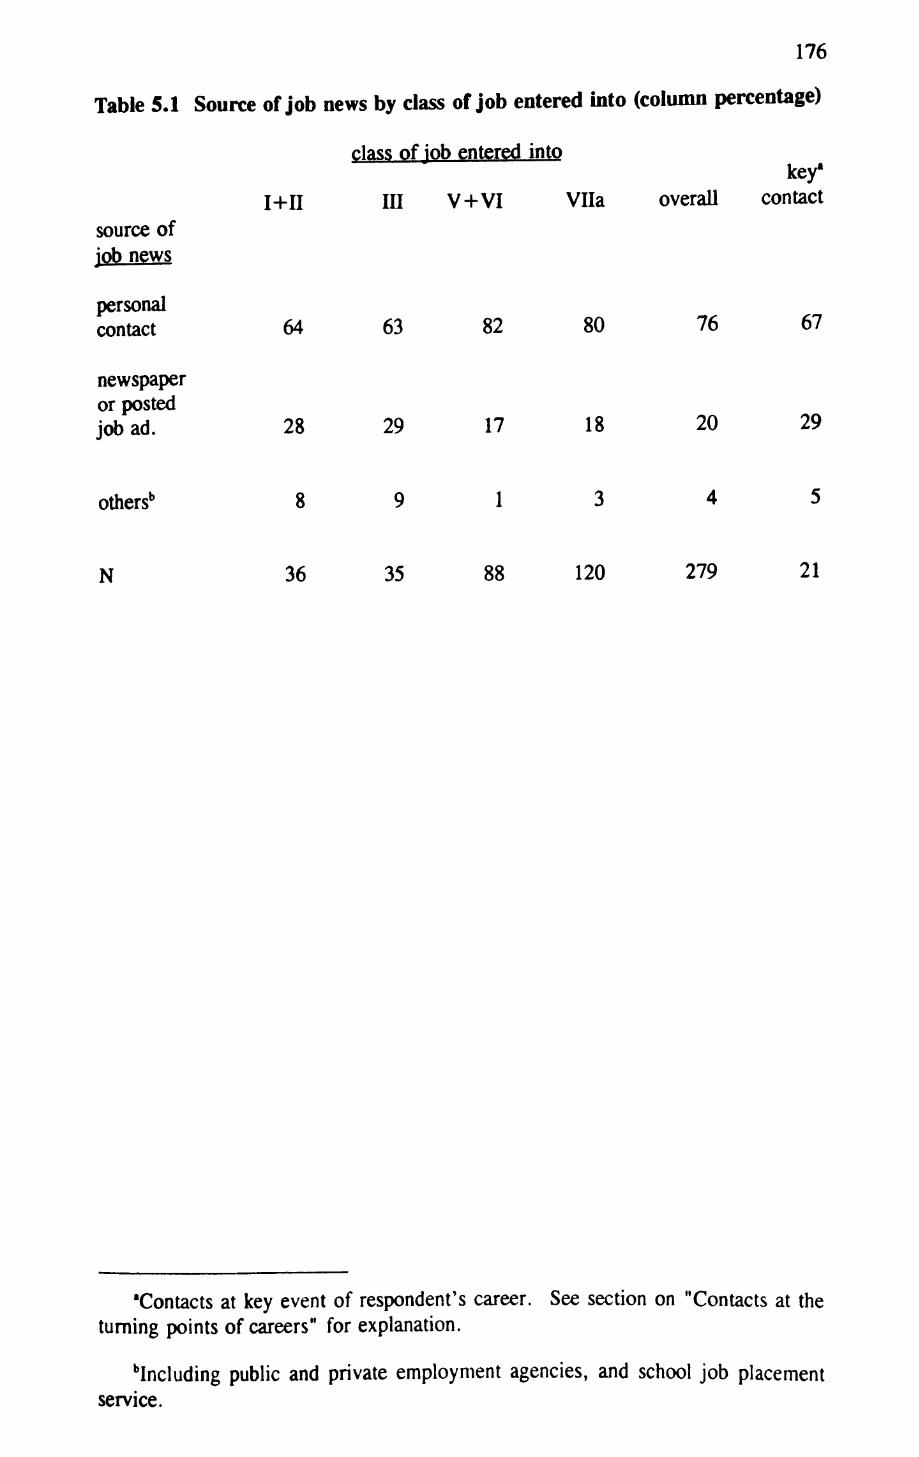
176
Table 5.1 Source of job news by class of job entered into (column percentage)
source of job news
personal contact
newspaper or posted job ad.
class of job entered into
I+II III V+VI Vila
64
28
63
29
82
17
80
18
key* overall contact
76
20
67
29
others'1 8
N 36 35 120 279 21
'Contacts at key event of respondent's career. See section on "Contacts at the turning points of careers" for explanation.
Including public and private employment agencies, and school job placement service.
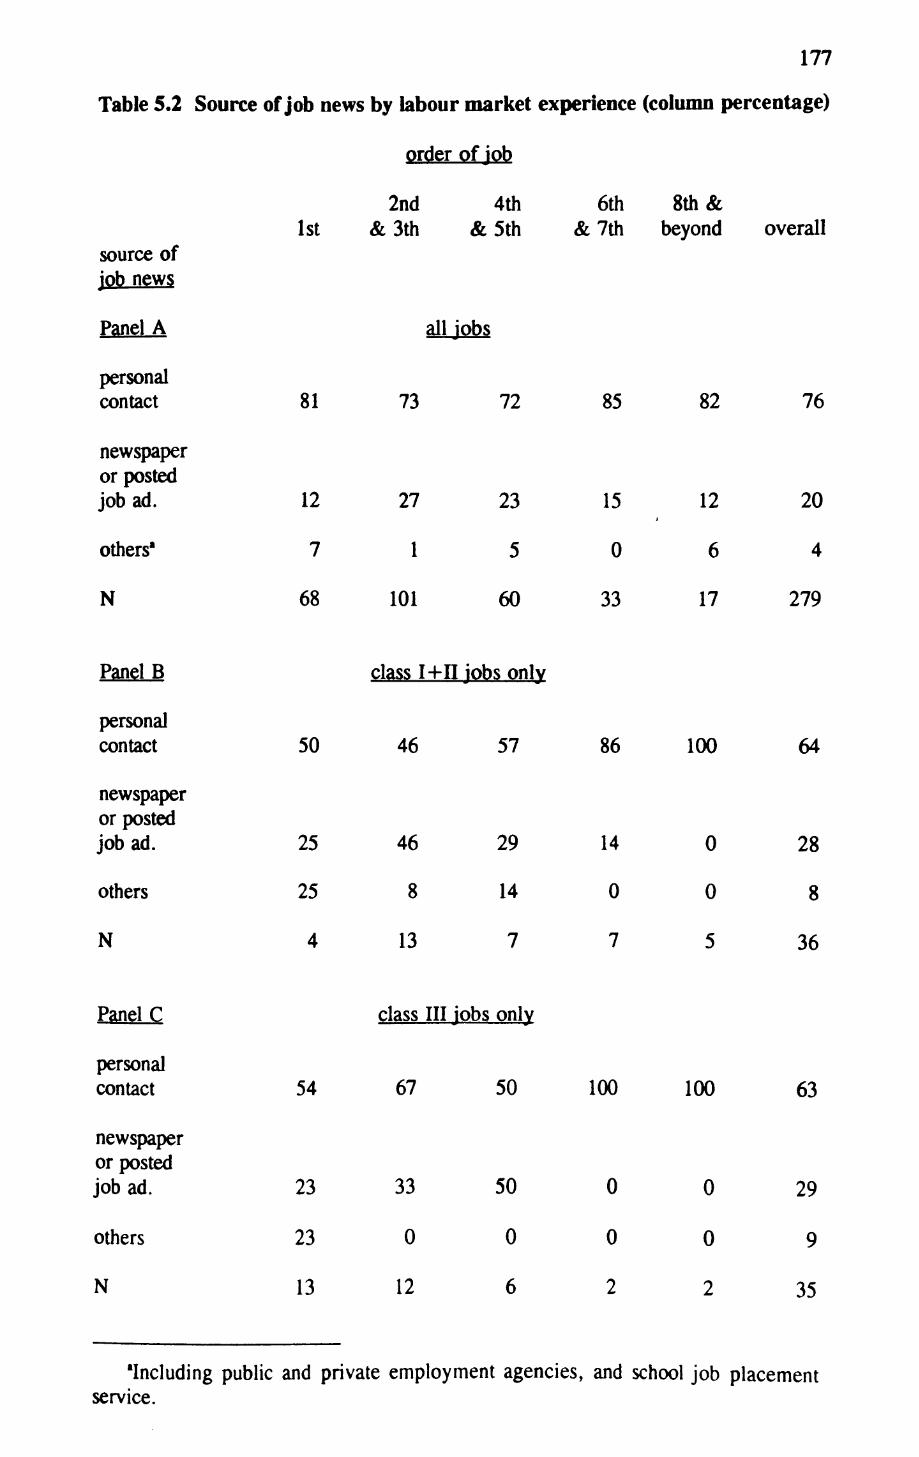
177
Table 5.2 Source of job news by labour market experience (column percentage)
order of job
source ofjob news
Panel A
personalcontact
newspaperor postedjob ad.
others*
N
Panel B
personalcontact
newspaperor postedjob ad.
others
N
Panel C
personalcontact
newspaperor postedjob ad.
others
N
2nd1st & 3th
aU
81 73
12 27
7 1
68 101
4th&5th
jobs
72
23
5
60
6th&7th
85
15
0
33
8th &beyond
82
12
6
17
overall
76
20
4
279
class I+n jobs only
50 46
25 46
25 8
4 13
class III
54 67
23 33
23 0
13 12
57
29
14
7
jobs only
50
50
0
6
86
14
0
7
100
0
0
2
100
0
0
5
100
0
0
2
64
28
8
36
63
29
9
35
'Including public and private employment agencies, and school job placement service.
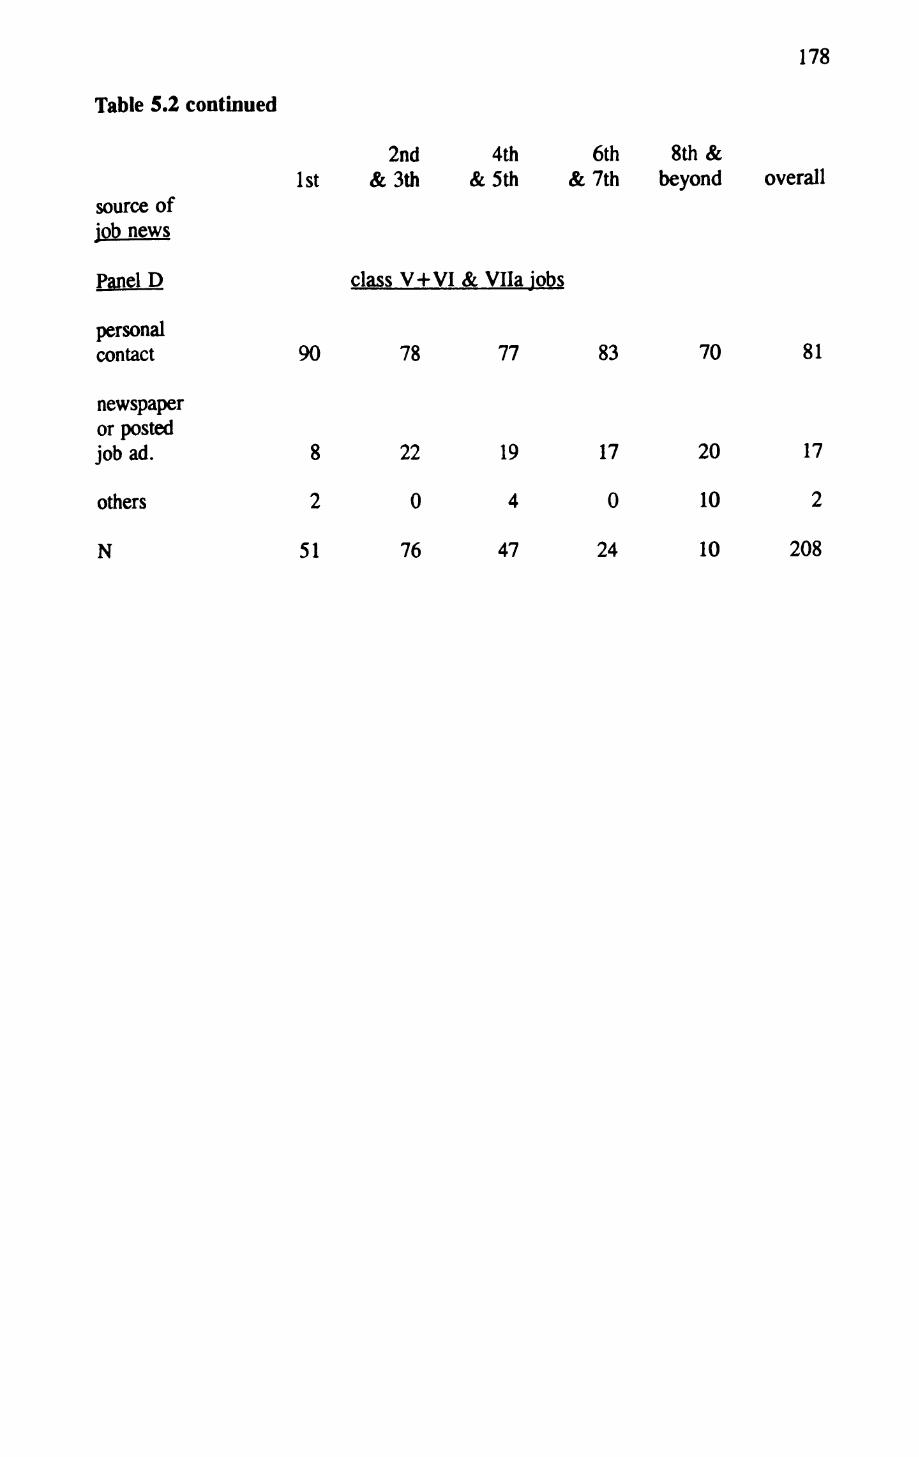
178
Table 5.2 continued
source of job news
Panel D
personal contact
newspaper or posted job ad.
others
N
2nd 4th 6th 8th & 1st & 3th & 5th & 7th beyond overall
90
8
51
class V+VI & Vila iobs
78 77
22
0
76
19
47
83
17
0
24
70
20
10
10
81
17
208
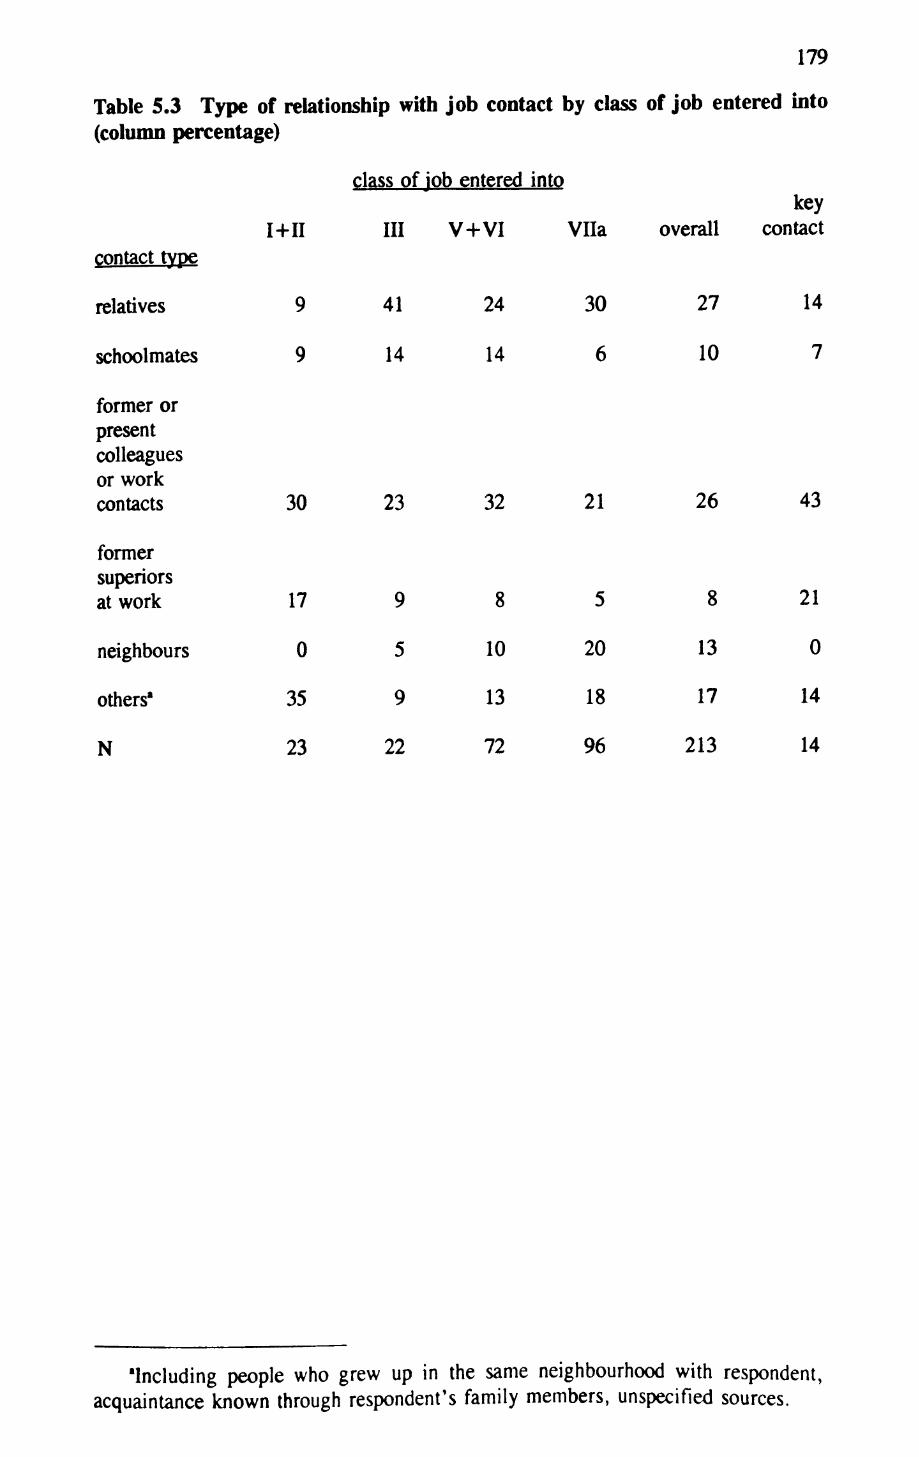
179
Table 5.3 Type of relationship with job contact by class of job entered into (column percentage)
contact type
relatives
schoolmates
former or present colleagues or work contacts
former superiors at work
neighbours
others*
N
i+nclass of job entered into
III V+VI Vilakey
overall contact
9
9
30
17
0
35
23
41
14
23
9
5
9
22
24
14
32
8
10
13
72
30
6
21
5
20
18
96
27
10
26
8
13
17
213
14
7
43
21
0
14
14
'Including people who grew up in the same neighbourhood with respondent, acquaintance known through respondent's family members, unspecified sources.
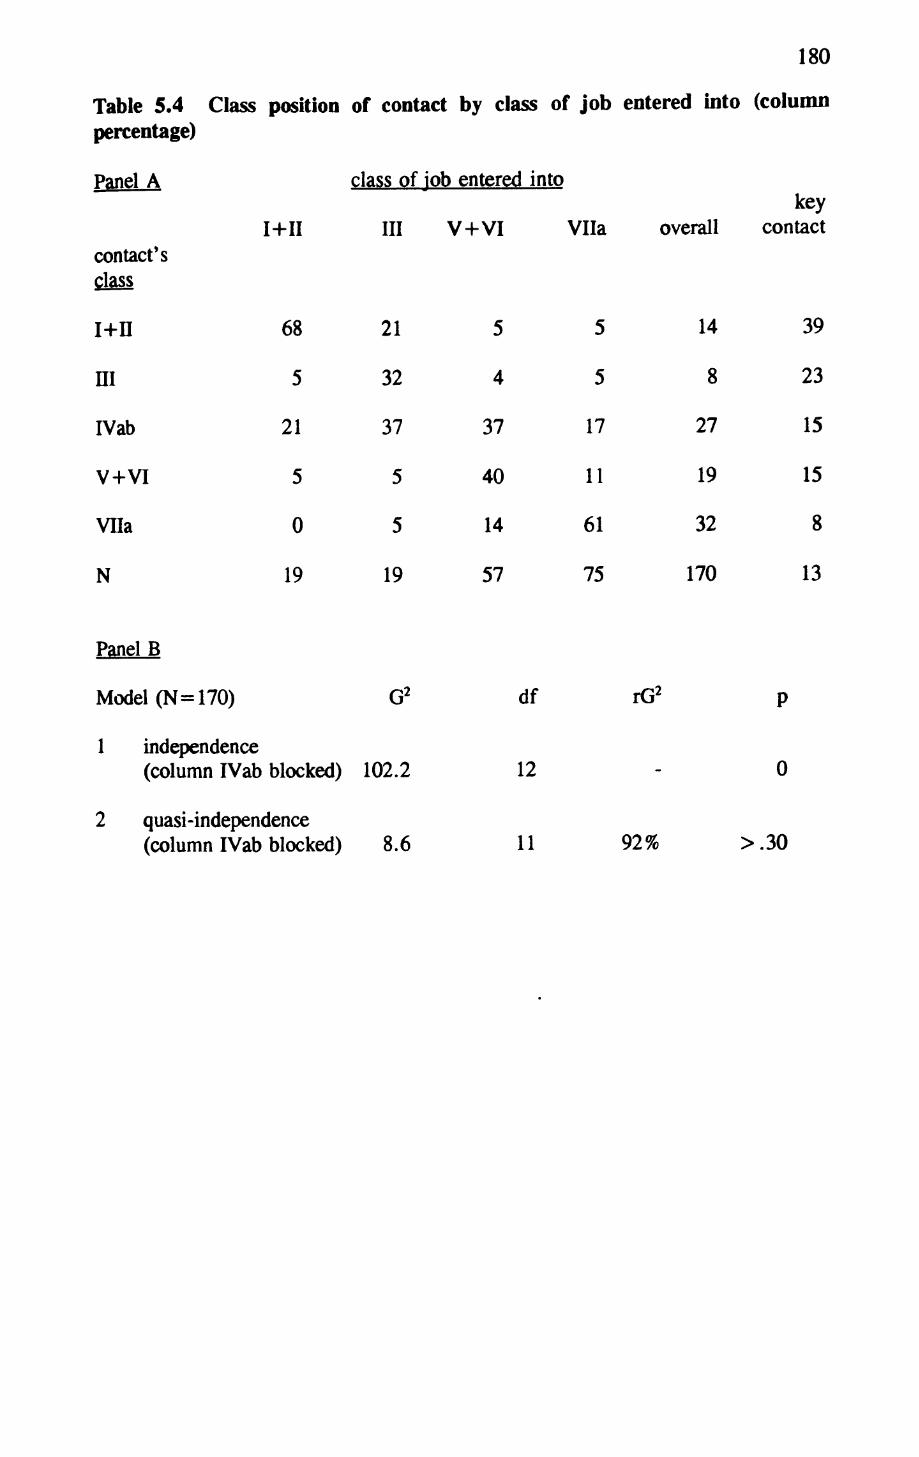
180
Table 5.4 Class position of contact by class of job entered into (column percentage)
Panel A class of Job entered into
Vilacontact'sclass
i+nffl
IVab
V+VI
Vila
N
I+II
68
5
21
5
0
19
III
21
32
37
5
5
19
V+VI
5
4
37
40
14
57
17
11
61
75
key overall contact
14
8
27
19
32
170
39
23
15
15
8
13
PanelB
Model (N= 170) G2
1 independence(column IVab blocked) 102.2
2 quasi-independence(column IVab blocked) 8.6
df
12
11
rG2
92%
0
>.30
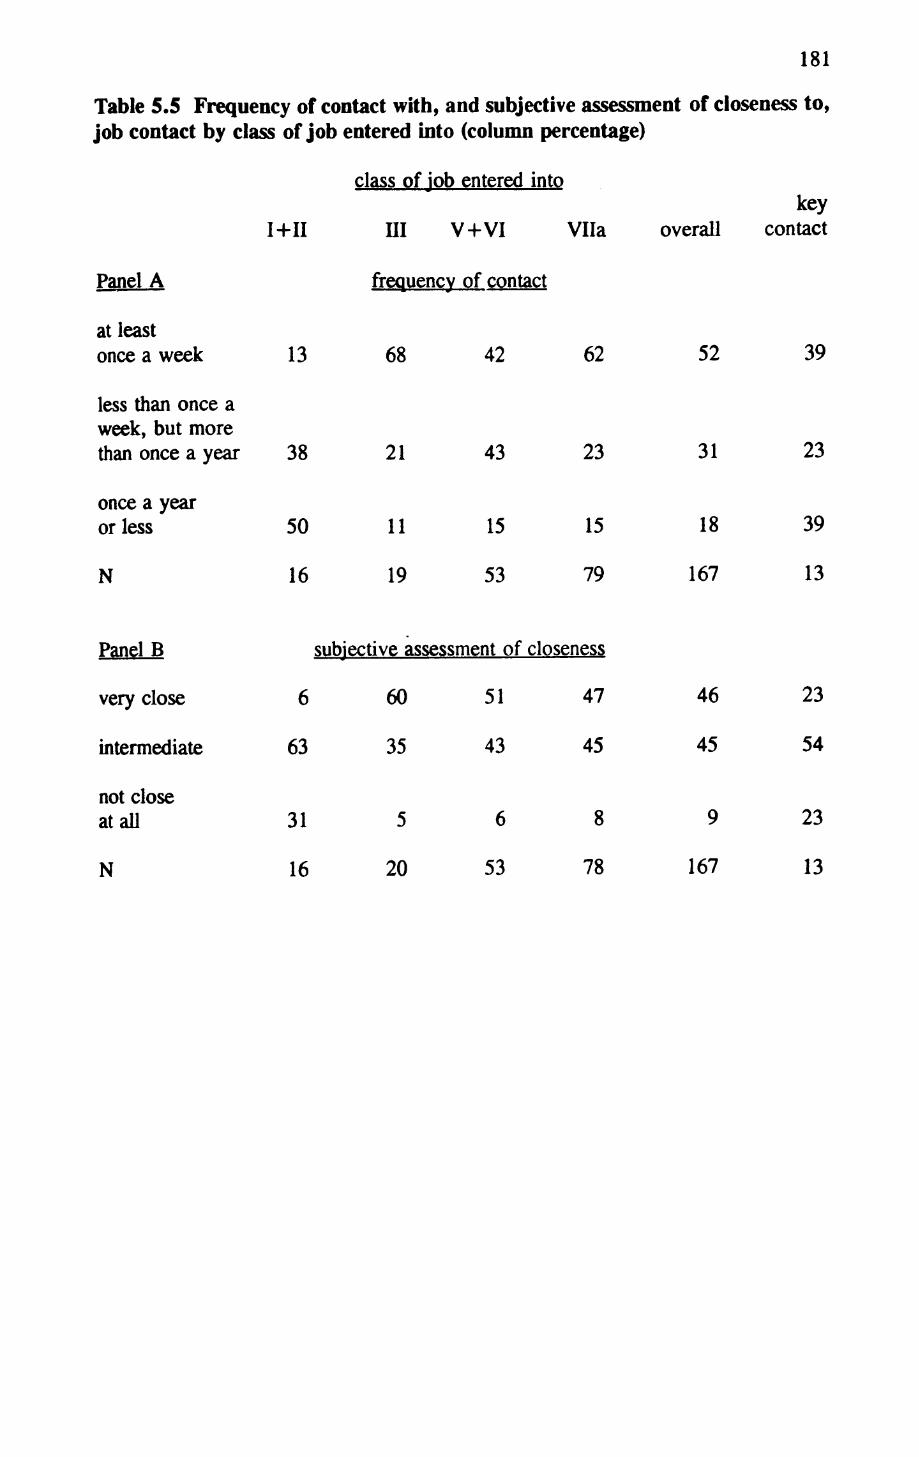
181
Table 5.5 Frequency of contact with, and subjective assessment of closeness to, job contact by class of job entered into (column percentage)
I-HI
Panel A
at least once a week
less than once a week, but more than once a year
once a year
class of job entered into
III V+VI Vila
frequency of contact
13 68 42 62
38 21 43 23
key overall contact
52
31
39
23
or less
N
Panel B
very close
intermediate
not close at all
N
50
16
11
19
15
53
subiective assessment of
6
63
31
16
60
35
5
20
51
43
6
53
15
79
closeness
47
45
8
78
18
167
46
45
9
167
39
13
23
54
23
13
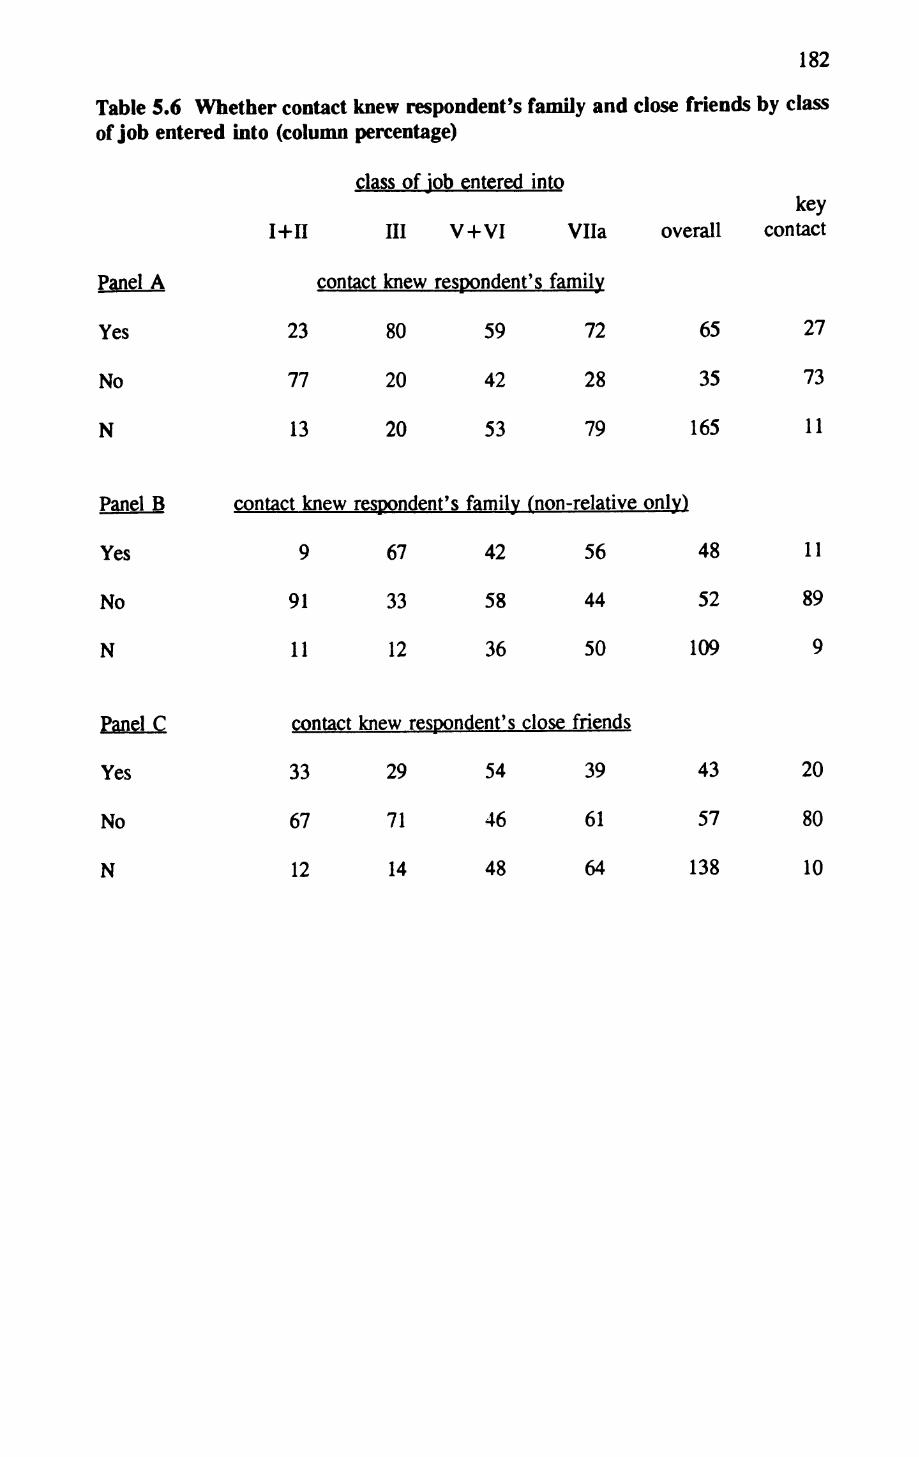
182
Table 5.6 Whether contact knew respondent's family and close friends by class of job entered into (column percentage)
class of Job entered into
Panel A
Yes
No
N
Panel B
Yes
No
N
Panel C
Yes
No
N
i+n III V+VI Vila overallkey
contact
contact knew respondent's family
23
77
13
contact knew
9
91
11
contact
33
67
12
80 59 72
20 42 28
20 53 79
respondent's family ( non-relative
67 42 56
33 58 44
12 36 50
knew respondent's close friends
29 54 39
71 46 61
14 48 64
65
35
165
onlv)
48
52
109
43
57
138
27
73
11
11
89
9
20
80
10
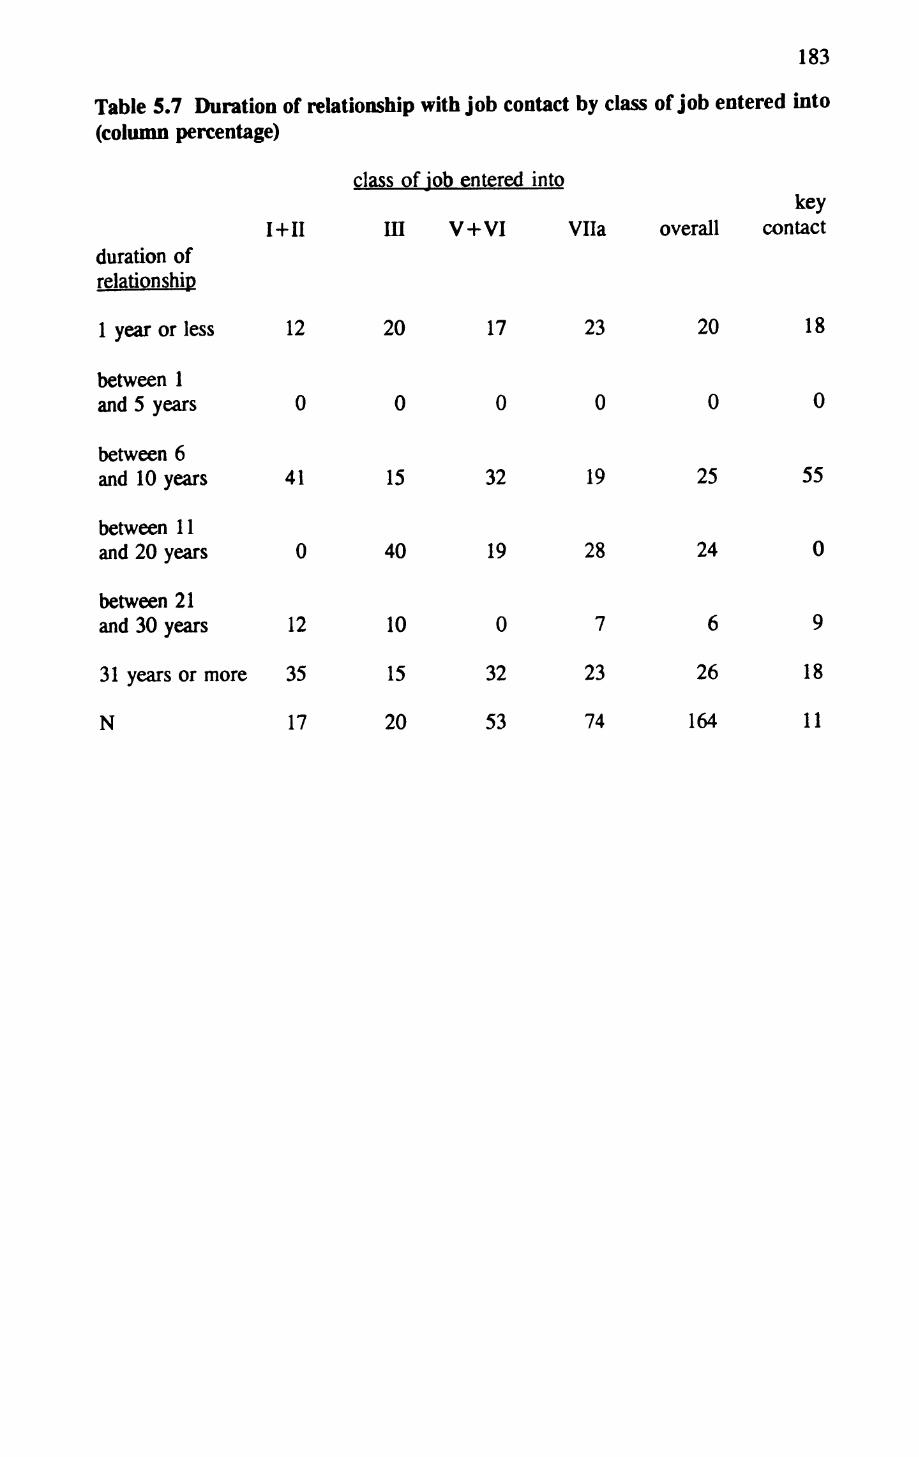
183
Table 5.7 Duration of relationship with job contact by class of job entered into (column percentage)
duration of relationship
1 year or less
between 1 and 5 years
between 6 and 10 years
between 11 and 20 years
between 21 and 30 years
class of job entered into
I+II ID V+VI Vila
12
0
41
0
12
31 years or more 35
20
0
15
40
17
0
32
19
23
0
19
28
key overall contact
20
0
25
24
18
0
55
0
N 17
10
15
20
0
32
53
7
23
74
6
26
164
9
18
11
184
Chapter 6
Career Beginning and Mobility Outcome
I have been studying worklife dynamics in the last two chapters. In this chapter, I
return to the question of intergenerational transmission of class (disadvantages by
closely examining a particular stage of the worklife, namely its beginning. I am, in
particular, concerned with how much parental assistance our respondents received
during this period. To address this question, both subjective (respondents' assessment
of the availability of parental support) and behavioural data (actual incidents of
parental help in job shifts) from the follow-up study will be examined. My general
argument will be that because our respondents came from relatively disadvantaged
(class IVab or Vila) background, their parents have relatively little resources,
material or otherwise, to invest in their long term mobility prospects while they were
making the crucial transition from school to the world of work. 1 The paucity of
parental support, in turn, adversely affected their subsequent mobility performance.
This, I submit, is one mechanism through which worklife process is related to the
persistence of inequality across generations.
Why study the transition from school to work?
Given our interest in the process of intergenerational class mobility, there are two
'Readers may think that this argument does not apply to petty bourgeois parents because they should have more resources than unskilled manual workers. Indeed, while class Vila is at the bottom of the threefold hierarchical division of the CASMIN schema, class IVab is placed at the middle level (cf. Chapter 3). This is true in a general sense, but I would stress that many members of Hong Kong's petty bourgeoisie are really own-account workers (e.g. hawkers) who do not enjoy much economic security. Conversely put, not many of them run small but substantial business. For instance, 35 respondents of the follow-up study were of class IVab origin. Among these 35 cases, 16 came from IVb rather than IVa. Readers will also see from the case materials presented below that many class IVa parents, being owner of grocery store or labour contractor, were not particularly well off.

185
reasons for paying close attention to career beginning. First, those respondents who
achieved worklife mobility into the service class did so rather quickly. The average
length of the typical mobility paths identified in Chapter 4 ranges from 7 to 14 years.
If all mobile respondents are pooled and considered together, they took, on average,
10 years (standard deviation being 6.5 years) to reach the service class. Since
members of the service class tend to stay there until they retire, it must be said that
much of the intergenerational class mobility that we wish to understand takes place
in early worklife.
Second, it is likely that parental influence on mobility outcome, say, through personal
referral to jobs, was stronger when a person was still at school or in his/her first few
years at work than it would be subsequently. Conversely put, as a person's labour
market experience grows, it is likely that worklife factors (such as work contacts
accumulated from previous jobs) will increasingly become more important in
determining labour market outcome. As Rossi and Rossi (1990:408) argue,
Providing information about job prospects or client/customers contacts relevant to an occupation is the type of help that declines over the life course of both parents and adult children. It is when adult children are getting started in life that job prospects and contacts matter most, something middle-aged parents, at their prime of engagement in the world of work, are best able to provide. Once the parents have retired, they have lost such connections and their adult children are well established on their own and need less help on job-related matters.
My data support this argument. Table 6.1 crosstabulates, for jobs obtained through
personal referral, type of job contact by respondent's labour market experience. It
is obvious that the importance of relatives as job contacts declines monotonically and
sharply: 53% of all contacts that led to first jobs, but only 22% of those that led to
second or third jobs, were relatives of our respondents. Indeed, by the time when
the respondent was looking for his 8th job, relatives were of no help at all. To
186
generalized from this finding, I would argue that career beginning is the interface
between intergenerational and worklife processes, and so it offers the best window
to observe the transmission of class (disadvantages across generations.
Parental strategies to improve respondents* mobility prospects
To take up the issues sketched above, I will turn to the follow-up study. Readers will
find that the data I use are far from ideal. This chapter was not planned at the stage
of fieldwork, and so questions about career beginning were not systematically put to
every respondent. As a result, apart from the usual caveat of small N, there is
another one of incomplete data. Nonetheless, it seems to me that several broad
patterns can still be discerned in the data, and provided I am careful enough in my
interpretation of these patterns, some general arguments can be made out of them.
One final note before I proceed to the data: in the following analysis, I assume that
parents are primarily interested in promoting their child's mobility prospect (into the
service class). 2 This assumption will be qualified later on, but it provides a vantage
point from which the argument of this chapter will be structured. Thus, I would like
to know what parents can do to improve their child's mobility chance; what are the
constraints that limit their action, and how do these constraints change as their child
grows up? In short, my question is: what strategies can parents pursue to promote
intergenerational mobility into the service class at different stages of their child's life
course?
Given the importance of formal credentials in occupational selection, and more
2There are no respondents of service class origin in the follow-up study. If there were, a parallel assumption would be that service class parents are interested in preventing their children from skidding down the class structure.

187
specifically, the association between higher education and membership of the service
class, 3 one obvious thing for parents to do is to encourage their child to obtain some
higher education before he/she enters the labour market. By definition, this strategy
can only be pursued when the child was still at school. So I take this as the first
strategy for parents to follow. However, this strategy may fail for several reasons:
the child may not want to stay in school, he/she may fail in the competition for a
place in the university, adverse financial conditions in the family may force him/her
to drop out, and so on. Indeed, in choosing respondents for the follow-up study, I
have deliberately screened out those who obtained higher qualification without any
interruption in education. So for all respondents discussed below, the first strategy
had failed. What then can parents do if it became clear that their child was not going
to have any higher education? To answer this question, I now turn to the data.
Timing of transitions
I will start with the timing of several events during late adolescence and young
adulthood. Events such as leaving school for the first time, getting first full-time job,
getting married, leaving parental home, having first child, etc. are crucial markers
of the transition from adolescence to adulthood. The timing of these events and the
order of their occurrence is governed by cultural norms, legal rules and various
institutional structures of a society (Hogan 1981, Featherman and Sorensen 1983,
Sorensen, Weinert and Sherrod 1986, Kerckhoff 1990, 1993). This issue of age
grading is not my principal concern here, but it is interesting to see if the timing of
these events differs between the mobile and the immobile respondents. 4
3See Mitchell (1972), Pong and Post (1991), Tang (1992), Tsang (1993), Wong and Lui (1992b) for discussion of the relationship between family background, education and occupational attainment in Hong Kong.
'The mobile respondents are the 37 people whose work history I studied in Chapter 4. The immobile respondents are the rest of the sample minus 5 cases.
188
Figure 6.1 shows the quartiles of the distribution of age of four events. It can be
seen from Panel A that the median respondent of the mobile group left school some
three years later than his counterpart in the immobile group. The interquartile range
of the mobile group is also wider than that of the immobile group by 1.5 years. If
we think of leaving school (and other events) as a population-level process, and that
the first and third quartiles as marking the beginning and the end of the population
transition respectively, then we can say that the mobile group was just beginning to
leave school when the immobile group has already finished doing so. Roughly the
same pattern can be observed for the age of first full-time job (Panel B).
The median mobile respondent also got married somewhat later than the median
immobile respondent (Panel C). However, the difference here is only one year, and
there is a considerable overlap between the two interquartile ranges. So in terms of
age of marriage, the two groups of respondents are much more similar to each other.
Conversely put, it is the school-leaving age and that of first full-time job that
distinguish the mobile respondents from the immobile respondents.
The finding that the mobile respondents left school and entered the labour market
some three years later than those who are immobile is related to the fact that the
former are generally better qualified than the latter. This can be seen from the first
two columns of Panel A of Table 6.2: only 8% of the immobile group, but more
than 70% of the mobile group, held upper secondary or better qualifications when
they first left school. Here I would note that some upper secondary qualifications is
required for most routine non-manual jobs in Hong Kong. I cannot provide full and
These five cases are excluded because they represent instances of downward mobility (cases 58, 65, 71, 72) or direct entry into the service class (case 69).

189
direct evidence for this claim here. 5 But if readers can accept this claim for the time
being, then it can be argued that the difference in qualifications evident in Table 6.2
is consistent with the general argument of Chapter 4. There we show that most of
the mobile respondents started their worklife from routine non-manual rather than
manual jobs. But to get into routine non-manual first jobs, they will need some upper
secondary qualifications, and, of course, to obtain such qualifications, they will have
to stay in school longer. Hence the difference in the ages of school-leaving and first
job.
Further evidence for this argument can be found in the third and fourth columns of
Panel A. Here I differentiate the mobile respondents according to the class of their
first job. It can be seen that all of those who had routine non-manual first jobs held
upper secondary or better qualifications when they left school. In contrast, only half
of those who had manual first jobs were similarly qualified (which is, of course, still
much higher than the 8% level of the immobile group).
It should be noted that people who leave school with upper secondary qualifications
are not in the most advantaged position ~ unlike those who have higher education,
it is very unlikely for them to get a service class job right away. However, compared
with those with even less qualifications, they enjoy a much better chance of worklife
mobility into the service class. 6 This brings us back to the question raised at the end
5Panel B of Table 6.2 offers some preliminary evidence for this claim. Here I consider only the mobile respondents. From an outflow perspective, no one with lower secondary or primary qualification had a class III first jobs.
6For some preliminary evidence from the follow-up study, consider the second and fourth rows of Panel C of Table 6.2. The odds ratio of the four cells equals 10.7. In other words, relative to people who left school with lower secondary qualifications, upper secondary school graduates were almost eleven times as likely to enter the service class through worklife mobility.
190
of the last section ~ what should parents do to promote their child's mobility
prospects if it seems unlikely that he/she will get any higher education before leaving
school (i.e. the first strategy fails)? The data we just examined suggest that the
second strategy for parents to pursue is to make sure that he/she obtains some upper
secondary qualifications.
Parental attitude towards respondent's education
If this is what parents should do, how far, as judged by our respondents, had they
done so? Did parents recognise the importance of upper secondary qualifications for
worklife mobility, and did they encourage our respondents to obtain such
qualifications? In the follow-up study, I asked most respondents how much education
their parents expected them to have, or whether their parents encouraged them to stay
in school when they were about to leave. Their responses are tabulated in Panel A
of Table 6.3. Note that we cannot determine the parental attitude for almost a quarter
(24%) of the cases. Such a high level of "don't know" response should make us
wary of the distribution of the valid cases. But bearing this admonition in mind, I
believe several features of Panel A are still notable.7
First, for both the mobile and the immobile groups, there were at least as many
indifferent parents (i.e. parents who were indifferent to whether the respondent should
stay in school or not) as there were supportive ones (i.e. parents who encouraged the
respondent to stay in school). The percentage of indifferent parents is higher among
the immobile group, but there is really little evidence to argue that, relative to
7The very high level of "don't know" response among the mobile respondents (30%) is due to the fact that this issue was not discussed with the first ten respondents, and that these respondents had all achieved worklife mobility into the service class. If it is true that mobile respondents were likely to have received some parental support, Table 6.3 should have underestimated the degree of positive support received by the mobile respondents.

191
respondents who are immobile, those who are mobile received more parental support
in schooling. 8 Second, again for both groups, there were very few parents who
actually discouraged the respondent to stay in school. If anything, there were
proportionately more unsupportive parents among the mobile group, but given the
weakness of our data, the 8% difference between the two groups does not support any
strong inference.
However, Panel A does suggest quite unmistakably that a large minority, if not the
majority, of our respondents did not receive positive parental support for their
education. This is inconsistent with what I expect of the parents. Why so? Am I
wrong in assuming that parents are interested in promoting their children's mobility
chance? Or is it because parents did not recognize the "mobility dividend" of formal
credentials?
I believe part of the difficulty here is related to the inadequacy of my measure of
parental attitude. Obviously, in terms of the amount of resources already committed,
those parents who stop supporting a child's education after upper secondary school
are quite different from those who withheld support when the child was still in
primary school. Also, popular expectation of how much education a child from
disadvantaged background should and can have may well change over time (probably
in the upward direction). So without proper control for qualifications already attained
by the respondent and historical timing (as indexed by, say, the respondent's year of
birth), the comparison of parental attitude in Panel A is quite hazardous. 9 While
8One may interpret this finding as suggesting that parental support is inconsequential for mobility outcome. I will come back to this issue later.
'Surely, problems such as adaptive preference that Elster (1983) refers to are also relevant here.

192
putting in proper control for these variables will require a larger data set (a partial
attempt with the present data set will be made later), let us turn to the case materials
for a better appreciation of what these parental attitudes mean.
Let me start with the unsupportive parents. Ironically, four of the five respondents
(cases 4, 22, 30, 56, 64) who had unsupportive parents achieved worklife mobility
into the service class. It is of some interest to see how they did that, but for the
moment, I will simply note that these five cases can be classified into two subgroups.
In the first subgroup, which contains two cases, the parents did question the value of
investing in their children's education beyond primary school. Their views were
indeed inconsistent with my inference from Table 6.2.
Case 4*10: Mr M's father was a taxi driver (class Vila) who, according to Mr
M, held the view that if he had the means, he would rather spend it on buying
a fish pond than sending his children to secondary school. As a result, Mr M
and all his siblings had only got primary education when they left school.
Case 64: Mr F was the fifth of nine children in a fishing family (class IVb).
He began schooling at the age of nine, and by the time he finished primary
school, he was already 18. According to Mr F, his father thought that there
was no point for his children to have more than primary education because he
reckoned that better qualifications would not mean higher income. In any
case, the family could not afford to send kids to secondary school. So Mr F
and all his siblings were asked to drop out after they had finished primary
school. They all worked on their father's fishing boat.
IC)Hereafter, the case number of mobile respondents will be asterisked.
193
In contrast to these two cases, parents of the second subgroup recognised the
"mobility dividend" of secondary qualifications. The withdrawal of their support for
the respondent's education was really a response to various types of contingency.
Consider the following example:
Case 30*: Mr A's father ran a small herbal drink shop (class IVb). At the
time when Mr A finished primary school, the financial situation of the family
was so bad that his parents decided that they could not support all their
children to go to school. So they asked Mr A to drop out so that his younger
brother could continue (who eventually finished secondary school).
Note that the parents in case 30* did not dispute the importance of secondary
qualifications for social mobility. They were only forced to make a trade off between
the desirability of investing in Mr A's long term career success, and the need to
respond to immediate financial pressure. Also note that they had selectively invested
in one child's mobility chance, rather than given up all hopes of intergenerational
mobility. For the other two cases of the second subgroup, the respondents were
asked to leave school after they had received some secondary education.
Case 22*: When he was an adolescent, Mr N was supported by his uncle who
was the owner of a small business (class IVa). The latter was upset by Mr
N's pro-communist inclination, and since he attributed the source of Mr N's
political views to the school he attended, he refused to support Mr N to go to
upper secondary school. (With the help of other relatives, Mr N was able to
finish upper secondary school in mainland China.)
Case 56*: Mr K finished his secondary school in Vietnam. His father was
194
a grocer (class IVb), and he had expected Mr K to work in the family shop,
and eventually to take over the business. Thus, although Mr K was admitted
to a university in China, he did not support him to take up the chance.
To sum up the above cases, I would argue that, on close inspection, only two of the
five "unsupportive" parents actually disputed the second strategy I infer from Table
6.2. In this sense, the apparent inconsistency between Tables 6.2 and 6.3 is less real
than what a cursory reading may suggest. What about the indifferent parents? Why
is it that they did not care much about how much education their son was going to
have? Of the 28 respondents who say that their parents were indifferent to their
education attainment, 11 entered the service class eventually. In elaboration of their
parents' attitude, many respondents have given accounts similar to the following ones.
Case 21*: Mr L's parents ran a small rattan goods workshop (class IVa).
According to Mr L, they were always so busy trying to make a living for the
family (of six children) that they could not pay much attention to his
education. Indeed, the family was under so much financial pressure that, for
his last two years at school, Mr L was supported by a cousin who worked as
a kitchen hand (class Vila). Mr L also noted that since his parents did not
have much education themselves, they could not give him much advice on
school or work anyway. Thus, although they would primarily like him to
have as much education as possible, they had not been particularly supportive.
In effect, it was entirely up to Mr L to decide for himself when he was going
to leave school (cf. Chapter 5).
Case 52*: Mr K also reports that his father, a self-employed truck driver
(class IVb), was so occupied with the need to "feed the family" that he could
195
not pay much attention to the education of his ten children (of which Mr K is
the seventh). In fact, his parents had only hoped that their children would
stay away from "troubles" (that they would not "go astray"). Beyond that,
they did not worry much about their educational attainment or career choices.
Themes found in the above accounts, such as adverse financial condition (also present
in. for example, cases 45 and 47), parents bogged down by the need to "feed the
family" (cases 38, 45), siblings crowding out individual attention (case 27*), etc.
were often mentioned by other respondents in various combinations. Sometimes the
effect of these factors, as we saw in case 52*, is that the parents lowered their
expectation of the respondent — that he would simply stay away from troubles. But
it is not easy to make strong inferences from this observation because, as we saw in
case 30*, the fact that a respondent did not receive full parental support in education
may only mean that the parents were selectively investing resources in other children.
While I cannot provide direct evidence to support this interpretation, 11 it is consistent
with a parental attitude often reported by our respondents (e.g. cases 33*, 40*, 44,
47), namely that "my parents were willing to support me to stay in school for as long
as I wanted, provided that I performed well academically".
Case 45: Mr T was the fourth of seven children. His father, a self-employed
plumber and electrician (class IVb), did not have a steady income. Although
Mr T's parents encouraged all their children to have more education, financial
strain and uncertainty meant that they could only support those children who
"If this is true, other things being equal, people with more siblings are less likely to have received parental support in education. Readers should also note that selective investment in children's education has been reported by other researchers. Salaff (1981), for example, observes a gender dimension in her study of 28 young women workers in Hong Kong -- that young women often give up their schooling so that their brothers can stay in school.

196
had demonstrated some academic aptitude. Mr T was not doing well in
primary school and, perhaps partly because of that, he was not keen on
staying in school himself. Consequently, when he decided to drop out after
finishing primary school, his parents made no objection. In contrast, two of
Mr T's siblings did better at school, and they were supported by the family
(with the partial help of a scholarship) until they had finished secondary
school.
However, performance in schoolwork is not a simple reflection of academic aptitude.
It is also affected by various socioeconomic and motivational factors. This is
recognised by some respondents.
Case 47: Like the previous respondent, Mr C was also the fourth of seven
children. His parents were self-employed hawkers (class IVb). They did not
have any paid employee, but all family members had to help out in the stall.
Mr C recalls that since he could not catch up with the schoolwork, he did not
want to stay in school himself. As a result, he chose to drop out after
finishing primary education. Although the family was under some financial
pressure at the time, Mr C reckons that his parents would have supported him
to go on if he was doing better at school. On the ground that most of those
who performed well in his class were from better-off families, he also thinks
that he would be able to do better in school, and hence obtain better
qualifications, if there was less financial pressure at home.
Taken together, the case materials we just reviewed confirm that our initial
assumption needs to be qualified. A sizable minority, if not the majority, of our
respondents did not receive positive parental support in schooling: outright

197
discouragement was rare, but lukewarm support was very common. Children who
did well at school were often encouraged to stay on, but the rest were allowed to drop
out. This means that potential late bloomers would have suffered.
Since I do not have respondents of service class origin in the follow-up study, I can
only speculate how far school children from more advantaged background face the
same problem. My hunch is that they do not. I would argue that because service
class parents are more resourceful, they can give more support to their children's
education, in the form of private tutorials, after-school classes, and a realistic chance
to repeat a grade if academic performance was unsatisfactory, etc. Indeed, the
growth of cram schools in Hong Kong and several other East Asian countries is so
phenomenal that "shadow education" has become a big business. Certainly, my
hypotheses that service class school children tend to respond to academic failure by
repeating a grade whereas others would drop out altogether; that the former
participate more heavily in shadow education, etc. remain to be tested (but see
Mitchell [1972:36-37] for some dated evidence for Hong Kong, and Stevenson and
Baker [1992] for recent evidence from Japan). However, to the extent that they are
true, it can be argued that the failure of perhaps up to half of all working class or
petty bourgeois parents to provide the same level of support to their children's
education as service class parents do is a source of the persistence of class inequality
over generations.
Having made the above qualification, it also has to be stressed that my initial
assumption is not entirely wrongheaded. To see this, compare my findings with
Willis 1 (1977) ethnographic account of a group of English working class schoolboys.
In his explanation of why working class kids get working class jobs, Willis argues
that "the lads" had, from an early age, internalized many working class shopfloor
198
values, such as the ideas that "all jobs are the same" or "practice is more important
than theory". These values, reinforced by their parents and the larger working class
community, led "the lads" to dispute the value of schooling and formal qualifications.
Hence they left school as soon as they could. This means that they had minimum or
no qualifications, and quite naturally would end up in working class jobs.
My data pertain to respondent's perception of parental attitude. So they are not
strictly comparable with those of Willis, but it seems to me that there is no evidence
to argue that, in Hong Kong, there is the kind of working class culture that underpins
the values held by Willis' English schoolboys. 12 This is so because, in all but two
cases, the indifference and discouragement shown by the Hong Kong parents was
very much more a pragmatic response to economic pressure than a principled
rejection of "middle class value of mobility". Indeed, under financial pressure, most
working class parents still invested selectively in one or two children who had shown
greater promise of success. So perhaps my assumption should be qualified as
follows: parents are primary interested in improving their children's mobility
prospects, and they will act accordingly if resources are available to them. To see
how the lack of resources can force a person to drop out despite parental support in
education, consider the following examples:
Case 26*: Mr A was a competent student, but when he was at form 4, his
father, who used to work as a subcontractor of goods porters (IVa), lost his
job. This threw the family into sudden economic difficulties, and Mr A had
to drop out. For the next 10 years, he worked in various manual jobs, such
l2The representativeness of Willis' findings remains questionable (Bulmer 1989:409-410). Readers should also note that at least a third of our Hong Kong respondents received positive parental support in schooling.

199
as glazing, truck-driving and chauffeur. Eventually, he proved his academic
ability by obtaining a diploma in computer programming through part-time
studies and became a computer programmer (cf. Chapter 5 and discussion
below).
Case 44: Mr W's father was a partner of a grocery store (IVa). According
to Mr W, he was a liberal-minded person and had wanted all his children
(sons and daughters) to have as much education as possible. However, he
died unexpectedly at the age of 40. Mr W was only 16 years old, and had
just finished form 1. He was not prepared to start working. Indeed, he had,
until then, never considered the possibility of leaving school. But since he is
the eldest son, he was obliged to leave school and took over his father's
business.
Parental advice on occupational choice
Apart from parental attitude towards schooling, I have also asked most of my
respondents whether they had discussed their career plan with their parents while they
were at school, and if so, what was their parents' advice. As expected, responses to
this question were often complex and rich in detail, but again it would be useful to
classify them by even a simple dichotomy. This is done in Table 6.4. What is
striking about this table is that more than half (55%) of the respondents had not
discussed their career plan with, and thus received no advice from, their parents. The
percentage of people with no parental advice is higher for the immobile group (66%)
than it is for the mobile group (43%). However, for both groups, people who had
not received parental advice greatly outnumber those who had. 13
13The caveat of footnote 7 applies here as well.
200
When respondents with no parental career advice were asked to elaborate their
answer, they often gave a combination of the following responses. First, that he
simply cannot recall any discussion of career plan with his parents. Second, that he
was not on good terms with his family, or that he was not living with his parents
(reflecting the immigrant background of many respondents). Hence, he made many
important decisions himself (cases 20*, 23*, 33*, 51, 54*, 66, 75). Third, because
his parents were uneducated manual workers, they could not offer many useful advice
anyway (cases 14*, 16*, 21*, 24*, 38, 50). Fourth, his parents were so busy making
a living for the family that they could not pay much attention to his career plan.
Indeed, given the financial situation of the family, they would be very happy if he can
get a job (cases 14*, 16*, 35, 38, 45, 52*, 55, 74).
For our present purpose, the last two responses are of greater interest because they
are systematic, rather than idiosyncratic reasons, of why people from class IVab or
Vila origin may receive less parental career advice. Readers will recall that these
two factors were often mentioned in relation to the lack of parental support in
education. Thus, much of the discussion of the last section applies here as well.
Anyway, the key point of Table 6.4 is that about half of our respondents had not
benefitted from parental advice in choosing their first jobs. But for those who had,
what advice was they given? Consider the following example.
Case 18*: Mr N was the youngest of six children of a grocer (class IVb).
He was doing quite well at school. But because of a personal row with a
teacher, he dropped out at the age of 17 without completing lower secondary
school. With the help of family members, Mr N soon got two job offers at
about the same time: a job of "office-boy" (Vila) in a construction company,
and a mechanic traineeship (Vila) in a franchised bus company. Mr N was
201
inclined to take the second job because it paid $300 more a month than the
first. However, his parents insisted that he should go for the first job
because, in their opinion, white collar jobs are of higher status than blue
collar ones even if they pay less. Mr N gave in after some arguments with
his parents. This turned out to be a wise decision. He did very well in the
construction company: he was quickly promoted to become an architectural
assistant (Ilia), and the company had twice sponsored him to attend part-time
courses in work-related subjects. Although Mr N experienced some career set
back when the company went bankrupted, he was later offered his first service
class job by a superior whom he knew from this company (cf. Chapter 5).
In this example, parental advice had directed Mr N to a first job (i.e. a class Vila job
in a white collar milieu) which, from what we know about typical mobility paths, is
more promising than the mechanic traineeship that Mr N would have chosen for
himself. Intergenerational effect in furthering mobility is borne out in this case. Five
other respondents (cases 17*, 27*, 28*, 36, 37) were also encouraged by their parents
to take up routine non-manual first jobs as clerks or salesmen. Some of these
suggestions were very specific (e.g. Mr Y of case 17* and Mr M of case 28* were
advised to apply for clerical jobs in the civil service), others were fairly general (e.g.
Mr K of case 36 was encouraged to "make a living with a pen"). In any case, among
these five respondents, those (cases 17*, 27*, 28*) who heeded such advice had
eventually become mobile, while those (cases 36, 37) who, because of choice or
circumstances, did not take the advice had remained immobile.
However, parental advice is not always shrewd and judicious. In the following cases,
the respondent's worklife mobility can be attributed partly to their disregard of
parental career advice.
202
Case 42*: Mr A had just finished upper secondary school when he joined his
father's (class IVa) trading firm as a clerk (ina). The firm was founded by
his grandfather, and Mr A was expected to take over the business eventually.
After a year in this job, Mr A came to realise that the trade in which they
were dealing was in decline, and that the company had no future. So he
decided to start a second career from scratch. He returned to a post-
secondary college to read English. Four years later, he graduated with a
diploma and joined another trading company as a technical clerk (Ilia). After
another three years, he switched to a third company to take up his first service
class job as a surveyor/liaison clerk (I) (cf. Chapter 5).
Case 54*: Mr K was 17 and was in lower secondary school when his father,
a sailor (class Vila), died in an accident. Economic hardship in the family
soon forced him to drop out from school. His mother suggested him to take
up a craft apprenticeship. But through the introduction of a neighbour, he
became an "office assistant" (Vila) in a freight company. He did very well
in this job, and was gradually promoted to become a clerk (Ilia) and then a
senior clerk (Ilia). After six years with his first employer, he was invited to
join another freight company to take up his first service class job as a clerical
supervisor (II) (cf. Chapter 5).
These two examples are interesting because they illustrate the two most common
types of parental advice given to our respondents, apart from that of "getting a
clerical job". Of the 17 respondents (mobile or not) who received parental advice,
five (cases 42*, 56*, 64, 67, 73) were encouraged to join their father's business, six
(cases 32, 47, 53, 54*, 62, 70) were advised to get a craft apprenticeship. But since
our respondents came from class IVab or Vila background, following in their father's
4^ ̂ ^•%*F
footsteps often meant going into a not-so-hopeful business. 14 Also, given the
difficulty of moving from skilled manual jobs to the service class (cf. Chapter 4),
taking a craft apprenticeship is not a promising career start either. Indeed, those who
took this advice (cases 64, 67, 73, 47, 53, 62) had remained immobile.
Of course, respondents who did not take parental advice were not necessarily better
off as they could have chosen jobs with even worse prospects. Mr B of case 32, for
example, became a packaging worker (class Vila) in a garment factory when he left
school. He then moved between several unskilled manual jobs such as errand-boy for
a cooked food stall (Vila), labourer in a wig factory (Vila), etc. before he settled
down as a taxi-driver (IVb). As for Mr C of case 70, he was too young (aged 12)
to take up any apprenticeship when he left school. So he first worked at home as an
out-worker (Vila) for three years. Subsequently, he became a casual labourer, and
then a skilled cutter (V+VI) in garment factories. Since then he had also worked as
a lorry attendant (Vila), and was a mini-bus driver for a social service centre (Vila)
at the time of the interview.
As noted earlier, under persistent financial pressure, and perhaps given other
limitations (e.g. lack of knowledge about schools and career possibilities [Jackson and
Marsden 1962:85-99]), parents often lower their expectation of (perhaps some of)
their children. When mobility into the service class is not seen as an attainable goal,
going into family business or craft apprenticeship are quite sensible advices. After
all, they usually offer greater job security and, in the long run, somewhat higher
income than do most unskilled manual jobs. However, for our present purpose, it is
I4 ln two instances (cases 64, 73), the respondents came from fishing families. For the rest, the respondent's father was owner-manager of trading company (case 42), grocery store (case 56), and motor garage (case 67) respectively.
204
important to note that about half of our respondents did not receive career advice
from their parents, and for those who did, the advice they got often reduced rather
than enhanced their chance of mobility into the service class.
Job stability in early worklife
So far we have been examining data of a subjective nature, namely respondents'
assessment of the availability of parental support and advice during their transition
from school to work. Let us now turn to a more behavioural aspect of early worklife
-job stability. Operationally, I will use two indicators of job stability and two time
frames for early worklife. My question can be put as follows: how many
employers15 had our respondents worked for, and how many major career changes
had they made, during the first five and ten years of their worklife? By major career
change, I mean job shift which are so drastic that experience and skills learned from
previous jobs are largely irrelevant to the new one. 16 In addressing this question, my
primary concern is, as above, in how far parental resources were mobilized to bring
about employer and career changes.
Panel A of Table 6.5 shows that, compared with the immobile respondents, the
mobile respondents were slightly less inclined to change employer. During their first
15In other words, different jobs with the same employer is not counted as a change.
16There is unavoidably some arbitrary elements in deciding whether a particular job shift is or is not a major career change. But as illustrations, I have taken the following move as major changes: from primary school teacher to clerk (both class Ilia jobs); lorry-driver to chauffeur (both Vila); labourer in wig factory to labourer in shoe factory. The following, in contrast, are not taken as major career changes: from container clerk (Ilia) or container estimator (Vila) to shipping clerk (Ilia); van salesman (Vila) to credit salesman (Ilia); employee hawker (Vila) to self-employed hawker (IVb); test engineer in electronics factory to quality assurance engineer in toy factory (both I+II). Also, the move from full-time education (after entry into the labour market) to work is not considered as a major change if the subject of study was related to the job that follows it.
205
five years at work, 41% of those who are mobile and 29% of those who remain
immobile had worked for only one employer. This is a moderate difference of 12%.
If we take two employers as the cutting line for job stability, the difference drops
further to 5% (71% vs 66%). Turning to the third and fourth columns, where I
differentiate the mobile respondents according to the class of their first job, it can be
seen that those who started from class III were less likely to change employer than
those who started from manual classes: 80% of the former worked for only one or
two employers during the first five years, while the latter changed employer almost
as frequently as the immobile respondents did.
Roughly the same pattern can be observed in Panel B: 65% of the mobile
respondents, compared to 50% of the immobile respondents, had worked for 1 to 3
employers during their first ten years at work. Again, there is internal differentiation
within the mobile group: 80% of those who started from class in had worked for 1
to 3 employers, while those who started from manual positions showed just as much
of job (in)stability as the immobile respondents did.
Turning to Table 6.6, it can be seen that the mobile respondents were also less
inclined to make major career change than were the immobile respondents, but the
difference between the two groups is, again, only moderate. After five years at
work, 51% of the former, but 37% of the latter, were staying in the same field of
work. Ten years into their worklife, there were still a third (32%) of the mobile
group staying in their original field of work. The corresponding figure for the
immobile group is 21 %. Broadly speaking, the distribution of career changes follows
the same pattern as that of employer changes. Readers should, however, note that
no internal differentiation within the mobile group can be found with respect to career
change. In other words, mobile respondents who started their worklife from manual
206
jobs were just as reluctant to make major career change as those who started from
class III jobs.
How should we make sense of these findings? One can argue that because mobility
is associated with greater job stability, it follows that job-hopping does not improve
one's mobility prospects. In other words, a respondent has to preserve in his job so
as to learn the skill, accumulate relevant experience, or simply to wait patiently for
his opportunity to come in order to become mobile. While this may be true to some
extent, I prefer to view the findings from another angle. I would see a change of
employer17 or career as effort on the part of the respondent to improve his mobility
chance. In other words, the occurrence of such an event indicates that the respondent
was unhappy with the mobility prospects (perhaps along with other things) of his
previous job. To the extent that this is true, the patterns described above are quite
consistent with what we know about typical mobility paths: since people who started
their worklife in class ni enjoyed better mobility prospects, they should be less
inclined to make employer or career changes. Hence the relatively high level of job
stability evident in the third column of Tables 6.5 and 6.6. 18
Two sets of questions follow from this observation. The first set concerns
respondents who started their worklife from class III. If they had tended to stay put
because they had enjoyed good mobility prospects right from the very beginning, how
17Strictly speaking, this applies only to voluntary changes. Unfortunately, I do not know who had taken the initiative in some of the employer-changes experienced by our respondents. So all employer-changes, irrespective of whether they were voluntary or not, will be considered in the following discussion.
18The fact that mobile respondents who started their worklife from manual jobs were just as reluctant to make major career changes as those who started from class III jobs (cf. third and fourth columns of Table 6.5) is an anomaly. But since there are only 37 cases in these two columns, I will disregard this problem here.
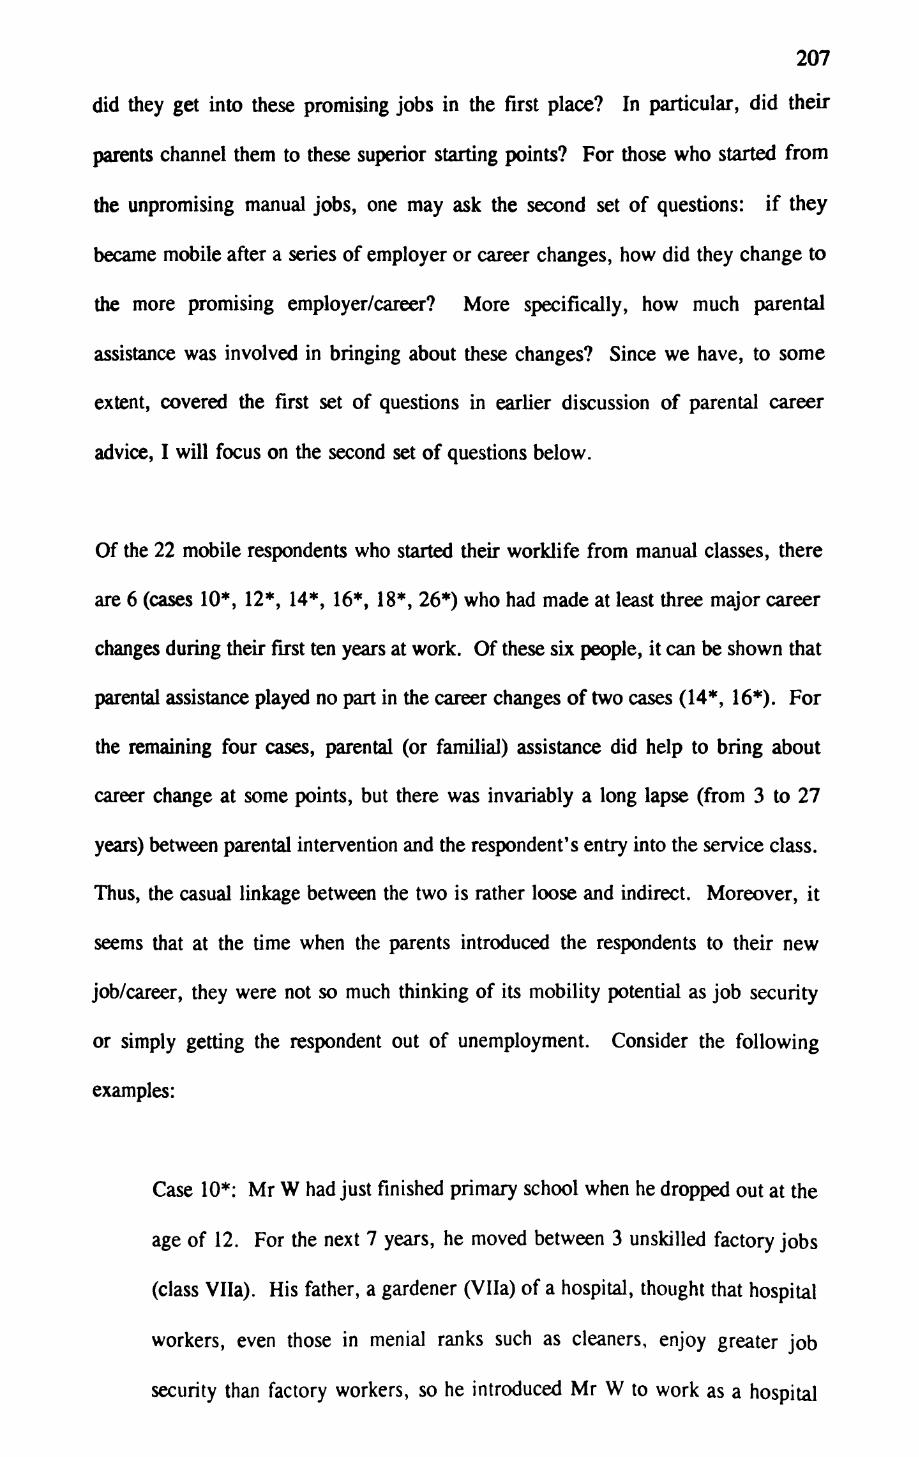
207
did they get into these promising jobs in the first place? In particular, did their
parents channel them to these superior starting points? For those who started from
the unpromising manual jobs, one may ask the second set of questions: if they
became mobile after a series of employer or career changes, how did they change to
the more promising employer/career? More specifically, how much parental
assistance was involved in bringing about these changes? Since we have, to some
extent, covered the first set of questions in earlier discussion of parental career
advice, I will focus on the second set of questions below.
Of the 22 mobile respondents who started their worklife from manual classes, there
are 6 (cases 10*, 12*, 14*, 16*, 18*, 26*) who had made at least three major career
changes during their first ten years at work. Of these six people, it can be shown that
parental assistance played no part in the career changes of two cases (14*, 16*). For
the remaining four cases, parental (or familial) assistance did help to bring about
career change at some points, but there was invariably a long lapse (from 3 to 27
years) between parental intervention and the respondent's entry into the service class.
Thus, the casual linkage between the two is rather loose and indirect. Moreover, it
seems that at the time when the parents introduced the respondents to their new
job/career, they were not so much thinking of its mobility potential as job security
or simply getting the respondent out of unemployment. Consider the following
examples:
Case 10*: Mr W had just finished primary school when he dropped out at the
age of 12. For the next 7 years, he moved between 3 unskilled factory jobs
(class Vila). His father, a gardener (Vila) of a hospital, thought that hospital
workers, even those in menial ranks such as cleaners, enjoy greater job
security than factory workers, so he introduced Mr W to work as a hospital
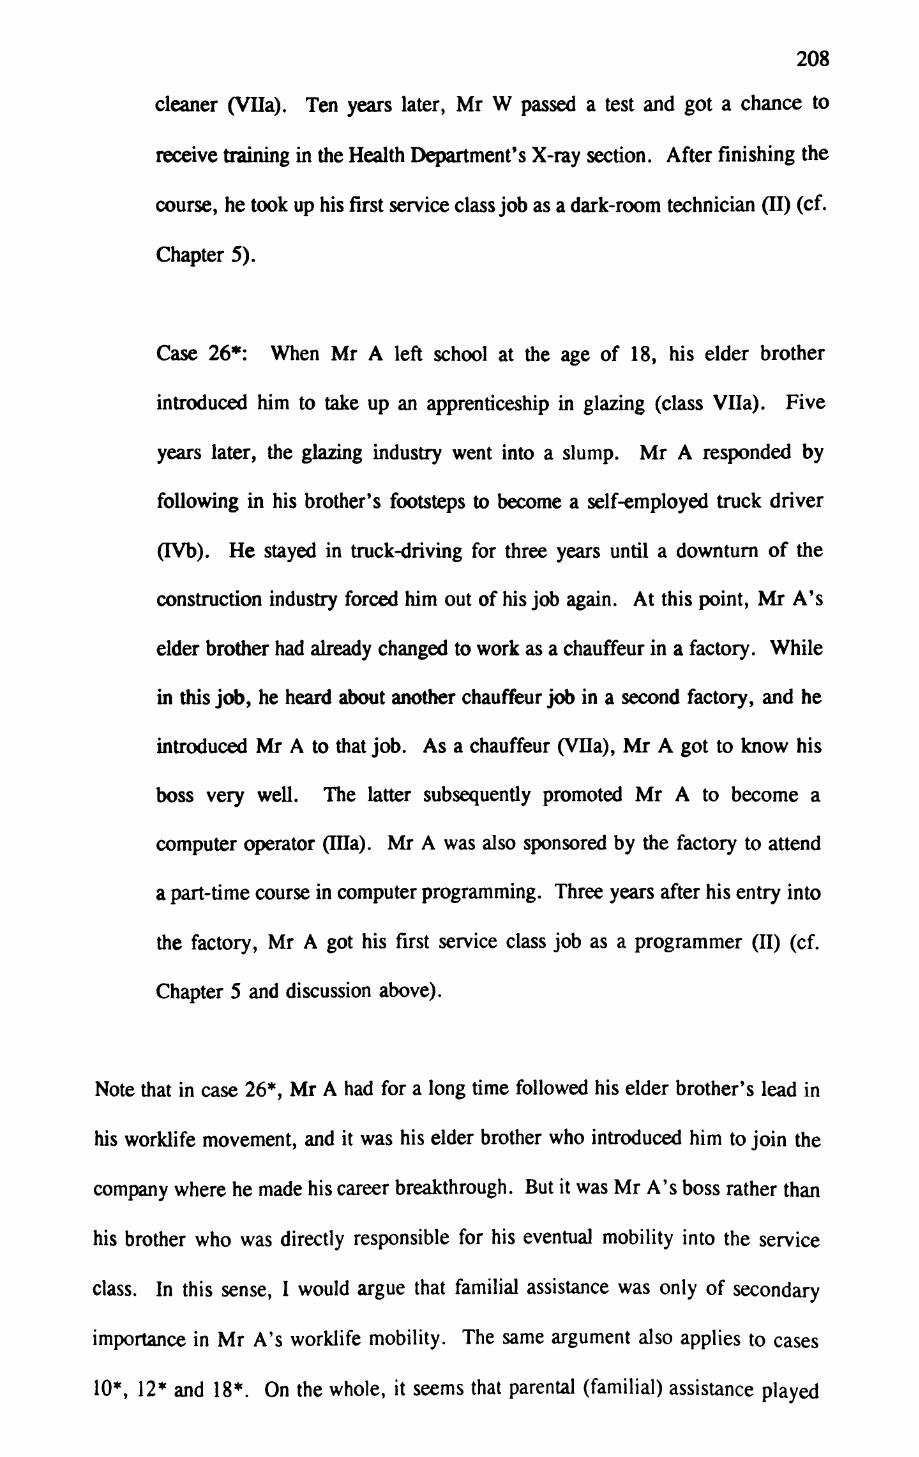
208
cleaner (Vila). Ten years later, Mr W passed a test and got a chance to
receive training in the Health Department's X-ray section. After finishing the
course, he took up his first service class job as a dark-room technician (II) (cf.
Chapter 5).
Case 26*: When Mr A left school at the age of 18, his elder brother
introduced him to take up an apprenticeship in glazing (class Vila). Five
years later, the glazing industry went into a slump. Mr A responded by
following in his brother's footsteps to become a self-employed truck driver
(IVb). He stayed in truck-driving for three years until a downturn of the
construction industry forced him out of his job again. At this point, Mr A's
elder brother had already changed to work as a chauffeur in a factory. While
in this job, he heard about another chauffeur job in a second factory, and he
introduced Mr A to that job. As a chauffeur (Vila), Mr A got to know his
boss very well. The latter subsequently promoted Mr A to become a
computer operator (Ilia). Mr A was also sponsored by the factory to attend
a part-time course in computer programming. Three years after his entry into
the factory, Mr A got his first service class job as a programmer (II) (cf.
Chapter 5 and discussion above).
Note that in case 26*, Mr A had for a long time followed his elder brother's lead in
his worklife movement, and it was his elder brother who introduced him to join the
company where he made his career breakthrough. But it was Mr A's boss rather than
his brother who was directly responsible for his eventual mobility into the service
class. In this sense, I would argue that familial assistance was only of secondary
importance in Mr A's worklife mobility. The same argument also applies to cases
10*, 12* and 18*. On the whole, it seems that parental (familial) assistance played
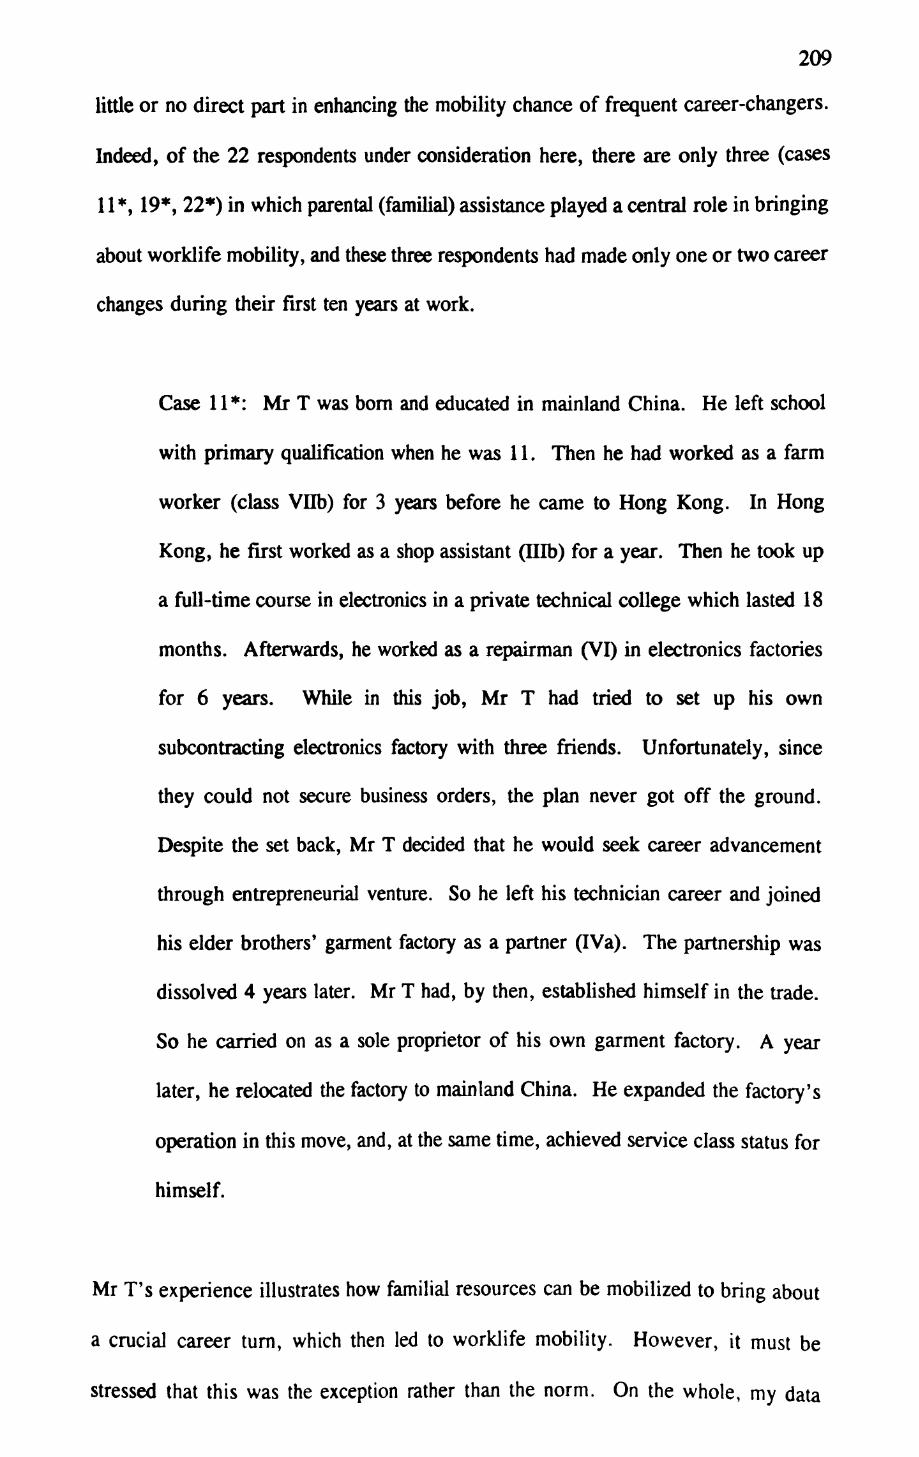
209
little or no direct part in enhancing the mobility chance of frequent career-changers.
Indeed, of the 22 respondents under consideration here, there are only three (cases
11*, 19*, 22*) in which parental (familial) assistance played a central role in bringing
about worklife mobility, and these three respondents had made only one or two career
changes during their first ten years at work.
Case 11*: Mr T was born and educated in mainland China. He left school
with primary qualification when he was 11. Then he had worked as a farm
worker (class Vnb) for 3 years before he came to Hong Kong. In Hong
Kong, he first worked as a shop assistant (Illb) for a year. Then he took up
a full-time course in electronics in a private technical college which lasted 18
months. Afterwards, he worked as a repairman (VI) in electronics factories
for 6 years. While in this job, Mr T had tried to set up his own
subcontracting electronics factory with three friends. Unfortunately, since
they could not secure business orders, the plan never got off the ground.
Despite the set back, Mr T decided that he would seek career advancement
through entrepreneurial venture. So he left his technician career and joined
his elder brothers' garment factory as a partner (IVa). The partnership was
dissolved 4 years later. Mr T had, by then, established himself in the trade.
So he carried on as a sole proprietor of his own garment factory. A year
later, he relocated the factory to mainland China. He expanded the factory's
operation in this move, and, at the same time, achieved service class status for
himself.
Mr T's experience illustrates how familial resources can be mobilized to bring about
a crucial career turn, which then led to worklife mobility. However, it must be
stressed that this was the exception rather than the norm. On the whole, my data

210
suggest that parental (familial) assistance played only a limited and indirect part in the
career changes of our respondents. This is consistent with what we saw in previous
sections. To recapitulate, I have shown that the majority of our respondents did not
enjoy positive parental support for their education, and that about half of them did not
receive any career advice from their parents. Moreover, for those who did receive
parental advice, the suggestion they got were often unsound in the sense that they
would not improve their mobility chances. If these findings explain why many people
of class FVab or Vila origin got into the "wrong" starting points in their worklife, the
materials we examined in this section further suggest that those who are stranded in
the "wrong" careers usually cannot rely on their parents to help them change to better
jobs. So both the subjective and the behavioural data we studied point to the same
conclusion — that very little parental support was given to our respondents as they
made the crucial transition from school to work. This, I would argue, adversely
affected their eventual mobility performance. Put differently, across the board,
people of class IVab or Vila origin are disadvantaged (or, at least, they received no
special advantage from their family) right from the beginning of their worklife.
Explaining variation in mobility outcome
Having said this, I would also stress that some of our respondents did overcome their
disadvantages and achieved worklife mobility into the service class. Why are they
more successful than others? So far, by focusing on the common barriers facing all
of our respondents, I have not considered variation in mobility outcome. Had Tables
6.3 and 6.4 shown that the mobile respondents received significantly more parental
support and advice than the immobile respondents, I may be able to explain the
difference in mobility outcome by this contrast. In other words, my overall argument
will be this: as people of service class origin enjoy relatively more parental support
and advice, they are more likely than others to be found in the service class. Hence
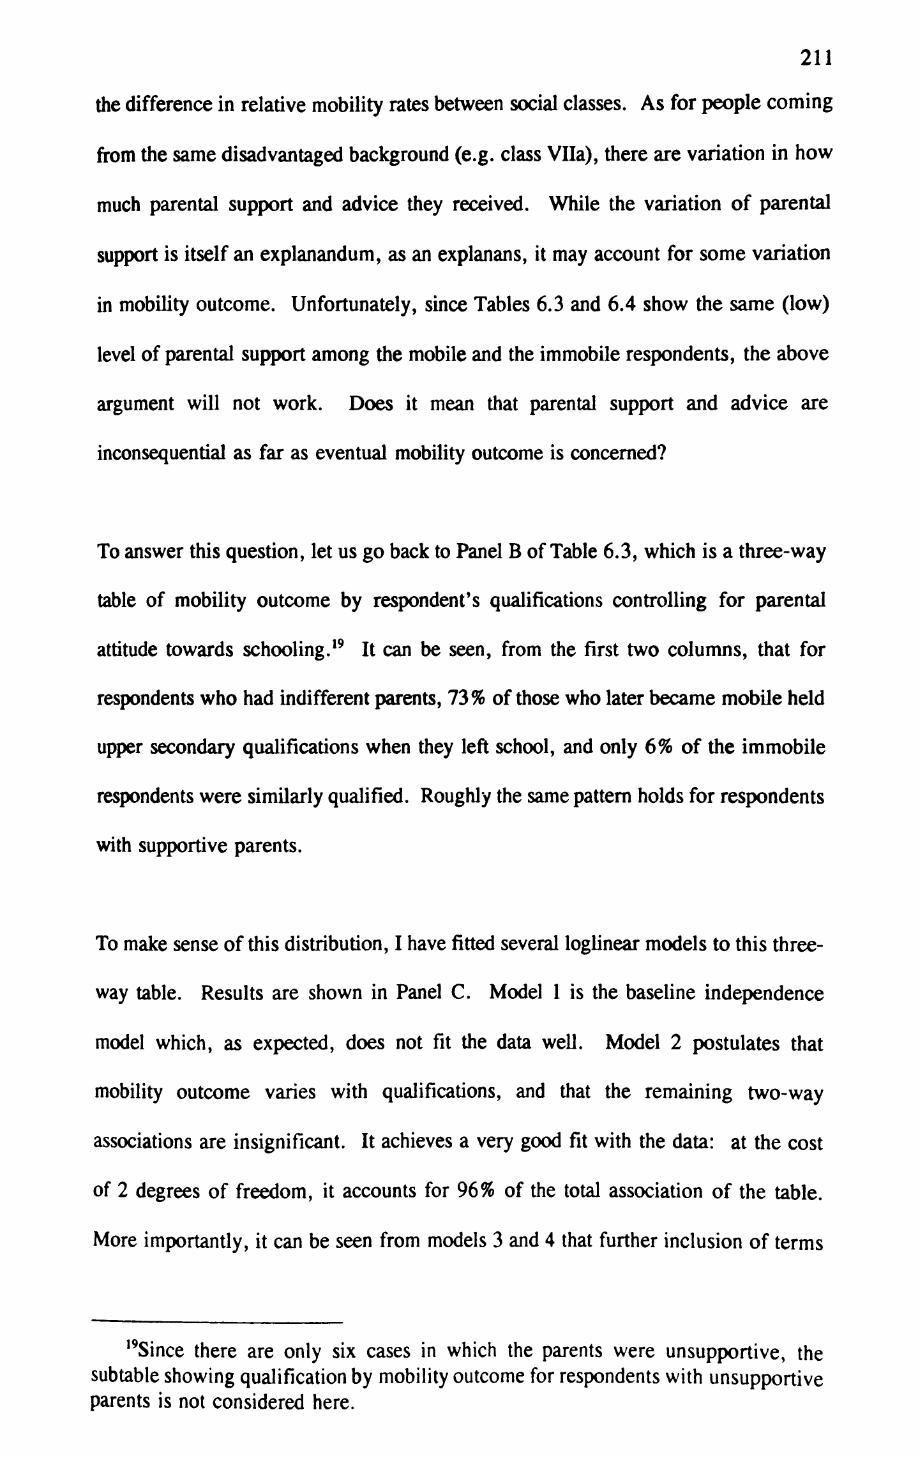
211
the difference in relative mobility rates between social classes. As for people coming
from the same disadvantaged background (e.g. class Vila), there are variation in how
much parental support and advice they received. While the variation of parental
support is itself an explanandum, as an explanans, it may account for some variation
in mobility outcome. Unfortunately, since Tables 6.3 and 6.4 show the same (low)
level of parental support among the mobile and the immobile respondents, the above
argument will not work. Does it mean that parental support and advice are
inconsequential as far as eventual mobility outcome is concerned?
To answer this question, let us go back to Panel B of Table 6.3, which is a three-way
table of mobility outcome by respondent's qualifications controlling for parental
attitude towards schooling. 19 It can be seen, from the first two columns, that for
respondents who had indifferent parents, 73% of those who later became mobile held
upper secondary qualifications when they left school, and only 6% of the immobile
respondents were similarly qualified. Roughly the same pattern holds for respondents
with supportive parents.
To make sense of this distribution, I have fitted several loglinear models to this three-
way table. Results are shown in Panel C. Model 1 is the baseline independence
model which, as expected, does not fit the data well. Model 2 postulates that
mobility outcome varies with qualifications, and that the remaining two-way
associations are insignificant. It achieves a very good fit with the data: at the cost
of 2 degrees of freedom, it accounts for 96% of the total association of the table.
More importantly, it can be seen from models 3 and 4 that further inclusion of terms
I9Since there are only six cases in which the parents were unsupportive, the subtable showing qualification by mobility outcome for respondents with unsupportive parents is not considered here.

212
which suggest association between parental attitude and qualifications (PQ) or parental
attitude and mobility outcome (PM) does not improve goodness of fit. In other
words, models 3 and 4 do not tell us anything more than what has already been said
in model 2. Moreover, when we, in model 5, drop the MQ term, G2 shoots up back
to model 1's level. Given these results, it must be said that parental support is
irrelevant to mobility outcome. What matters is whether the respondent left school
with upper secondary qualifications or not, and that, as judged by this admittedly
small study, is not contingent on parental attitude. This is one way to interpret the
three-way table.
Alternatively, if one is prepared to consider not just the technical results of model
fitting, then a second interpretation is possible. This interpretation blames the data
(which I collected myself), and it runs like this: although it may not be transparent
to the respondents themselves, upper secondary school graduates really had enjoyed
more parental support than those with less qualifications. That is to say, parents who
did not object to the respondent dropping out after upper secondary school may not
have been indifferent if the latter had chosen to leave school earlier. What I am
really saying here is that the quality of my measure of parental support is so poor that
the result presented in the last paragraph is misleading. 20 This is possible. But since
better measures (e.g. interviews with parents in a prospective study of educational and
occupational attainment) are not available, I cannot assess how far this is true. For
this reason, let us go back to the first interpretation.
20In a different way, our measure of parental career advice is also problematic. Notice that Table 6.4 shows that 66% of the immobile respondents, but only 43% of the mobile respondents, received no career advice from their parents. At the same time, however, the percentage of respondents with parental career advice is smaller for the mobile respondents. Surely, this is due to the many "don't know" responses to this question.

213
To recapitulate, my loglinear modelling suggests that parental attitude is unrelated
(and thus irrelevant) to educational attainment, and so indirectly, it is irrelevant to
mobility outcome as well. Suppose this is true, what more can we say about
intergenerational factors on worklife dynamics and the eventual mobility outcome?
I would suggest the following: a respondent's educational attainment depends on
many factors not considered above, and from the sociologist's point of view, many
of these unconsidered factors are random in nature (e.g. whether there was a teacher
who "spoke to" the respondent, and thus opened up the horizon of his intellectual
curiosity). So, for quite "random" reason, one working class school child could
finish upper secondary school, while another could not, but anyhow the first school
child would have enjoyed better mobility chance than the second.
My point is this: instances (as opposed to rate) of upward mobility are pretty
random, in the sense that they are not readily explainable in terms of the familiar
sociological idea of resources. In contrast, prevention of downward mobility from
the service class is much more interpretable in such terms. As argued above, service
class parents can actively draw on their resources to support and advice their children
during their transition from school to work; and if their children failed decidedly in
formal education, then inheritance of physical assets, or preferential placement in
"better" jobs through social connections, etc. can come into play. Again, I must
admit that I do not have empirical data to support this argument. But to the extent
that this is true, one can argue that the prevention of downward mobility from the
service class involves a lot of effort on the part of the parents. In contrast, upward
mobility from disadvantaged background into the service class depends mostly on the
effort of the young person without much parental assistance. This is why our
respondents' mobility performance is quite unrelated to the availability of parental
support and advice. This asymmetry between movement up and down the class

214
hierarchy accounts for the persistence of inequality across generations.
Chapter summary
In this chapter, I have shown that our respondents received little parental support and
advice during the crucial transition from school to work. This is why many of them
started badly in their career: leaving school without upper secondary qualifications,
taking up manual rather than routine non-manual jobs. Using case materials from the
follow-up study, I was able to show that the lack of parental support reflects not so
a much a rejection of "middle class value of mobility" on the part of the parents, as
the paucity of familial resources. There is also evidence to suggest that parental
assistance was not particularly useful insofar as subsequent career change is
concerned. In other words, the negative consequences of a bad career start are not
easily reversible, and those who started their worklife in the wrong jobs were often
stranded there. It should be apparent that the above findings point to one possible
linkage between class inequality and worklife dynamics, and I would argue that it is
linkages such as this which contribute to intergenerational transmission of class
disadvantages. It is unfortunate that I do not have respondents of service class origin
with poor formal credentials in the follow-up study, because if such cases were
available, it would be possible to see how parental resources were employed to
prevent downward mobility. This should provide a better test for the parental support
argument advanced in this chapter.
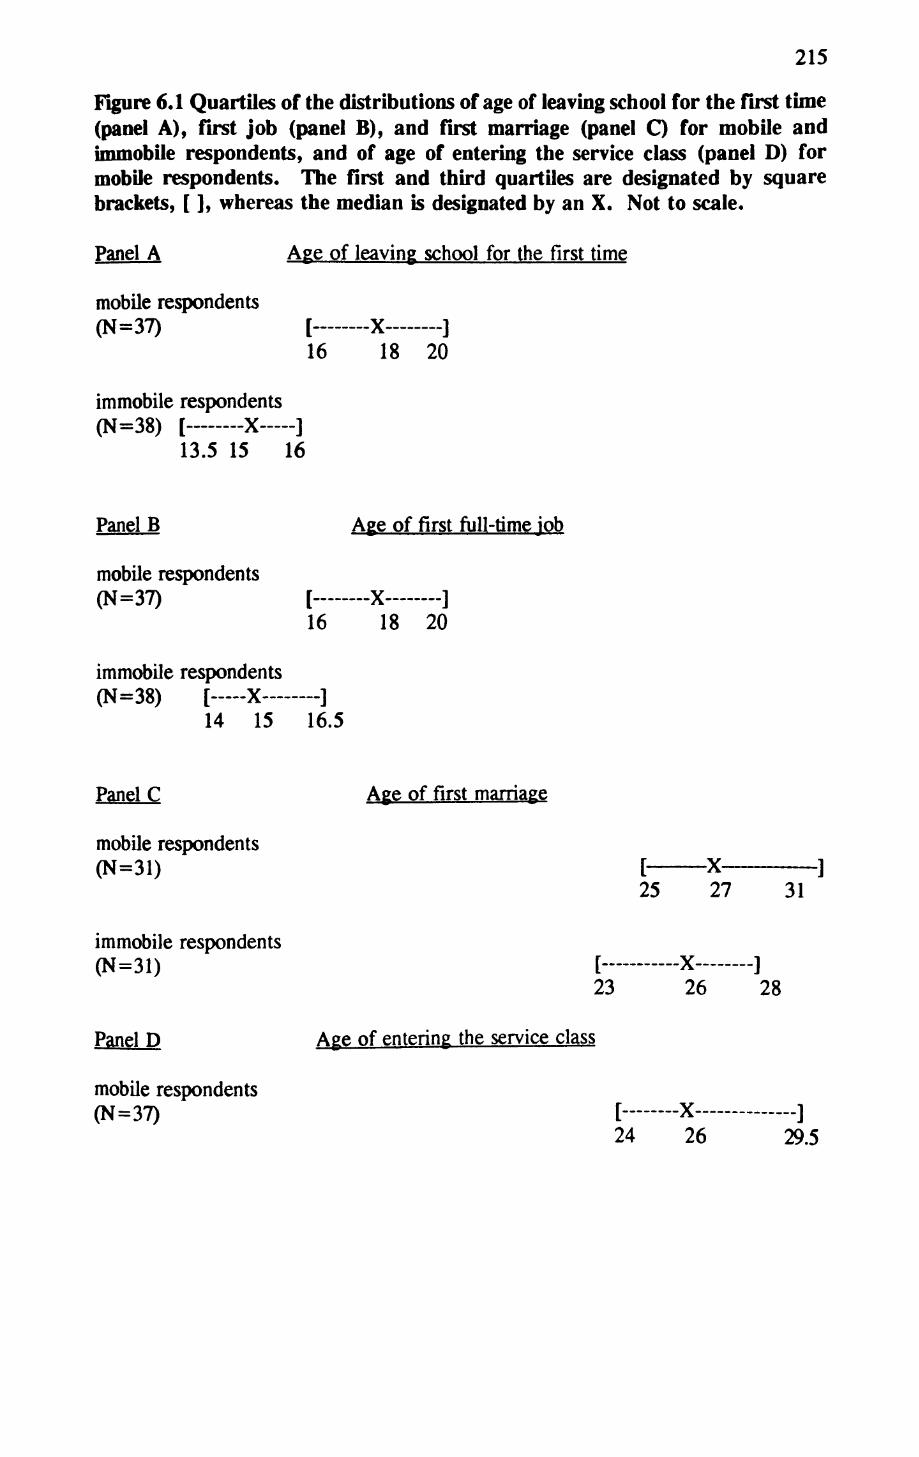
215
Figure 6.1 Quartiles of the distributions of age of leaving school for the first time (panel A), first job (panel B), and flrst marriage (panel C) for mobile and immobile respondents, and of age of entering the service class (panel D) for mobile respondents. The flrst and third quartiles are designated by square brackets, [ ], whereas the median is designated by an X. Not to scale.
Panel A
mobile respondents (N=37)
Age of leaving school for the first time
16
immobile respondents (N=38) [——— x——
13.5 15 16
18 20
Panel B
mobile respondents (N=37)
Age of first full-time job
[—16 18 20
immobile respondents (N=38) [——X———]
14 15 16.5
Panel C
mobile respondents (N=31)
immobile respondents (N=31)
Panel D
mobile respondents (N=37)
Age of first marriage
25-X-27 31
[————X——]23 26 28
Age of entering the service class
24 26----I
29.5
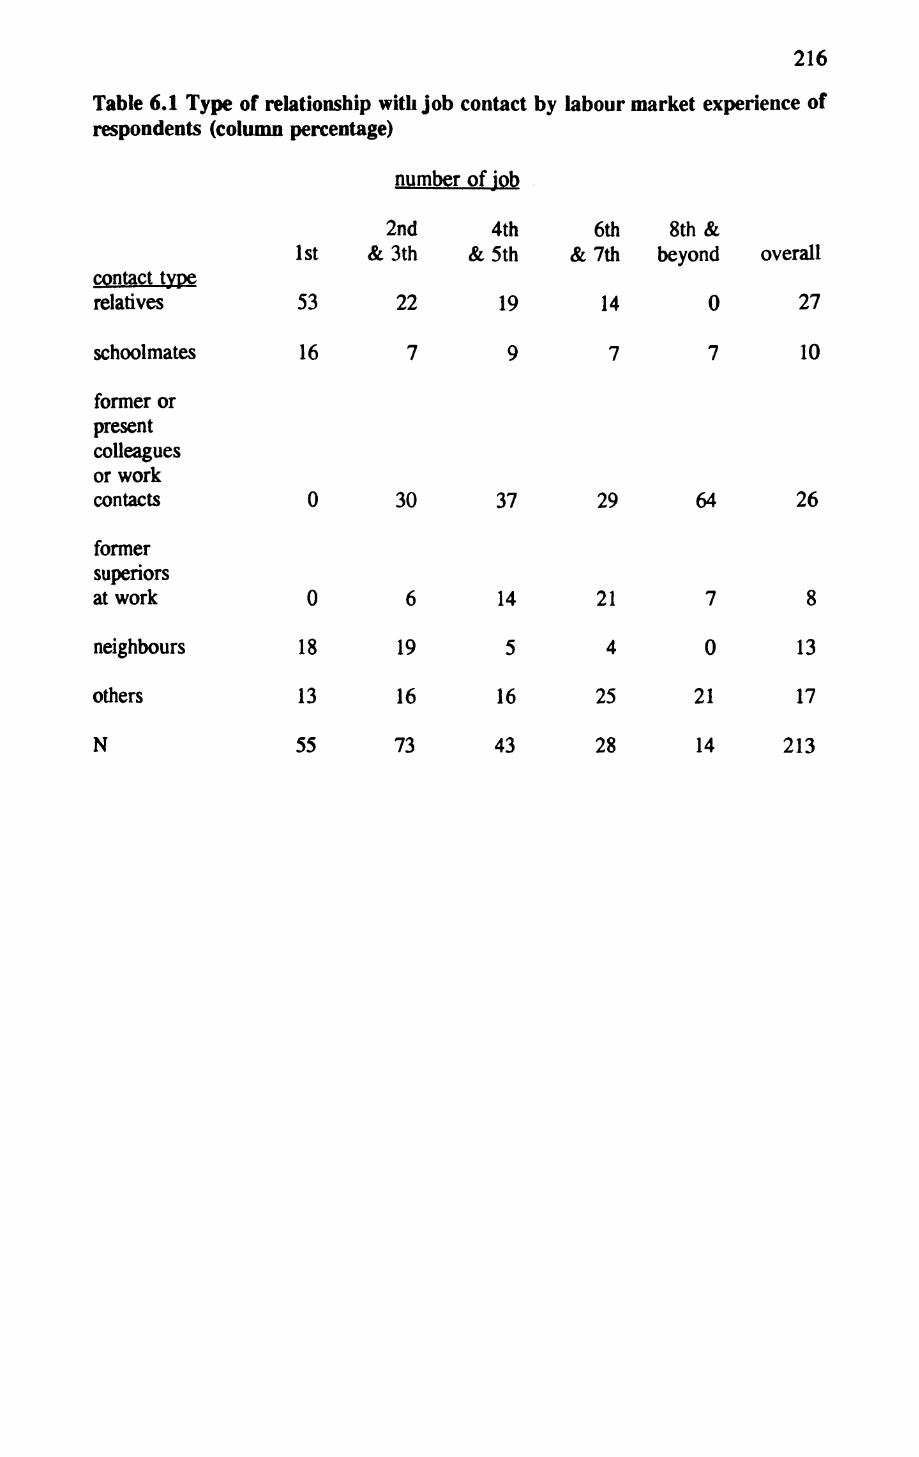
216
Table 6.1 Type of relationship with job contact by labour market experience of respondents (column percentage)
number of Job
contact typerelatives
schoolmates
former orpresentcolleaguesor workcontacts
formersuperiorsat work
neighbours
others
N
1st
53
16
0
0
18
13
55
2nd&3th
22
7
30
6
19
16
73
4th&5th
19
9
37
14
5
16
43
6th&7th
14
7
29
21
4
25
28
8th &beyond
0
7
64
7
0
21
14
overall
27
10
26
8
13
17
213
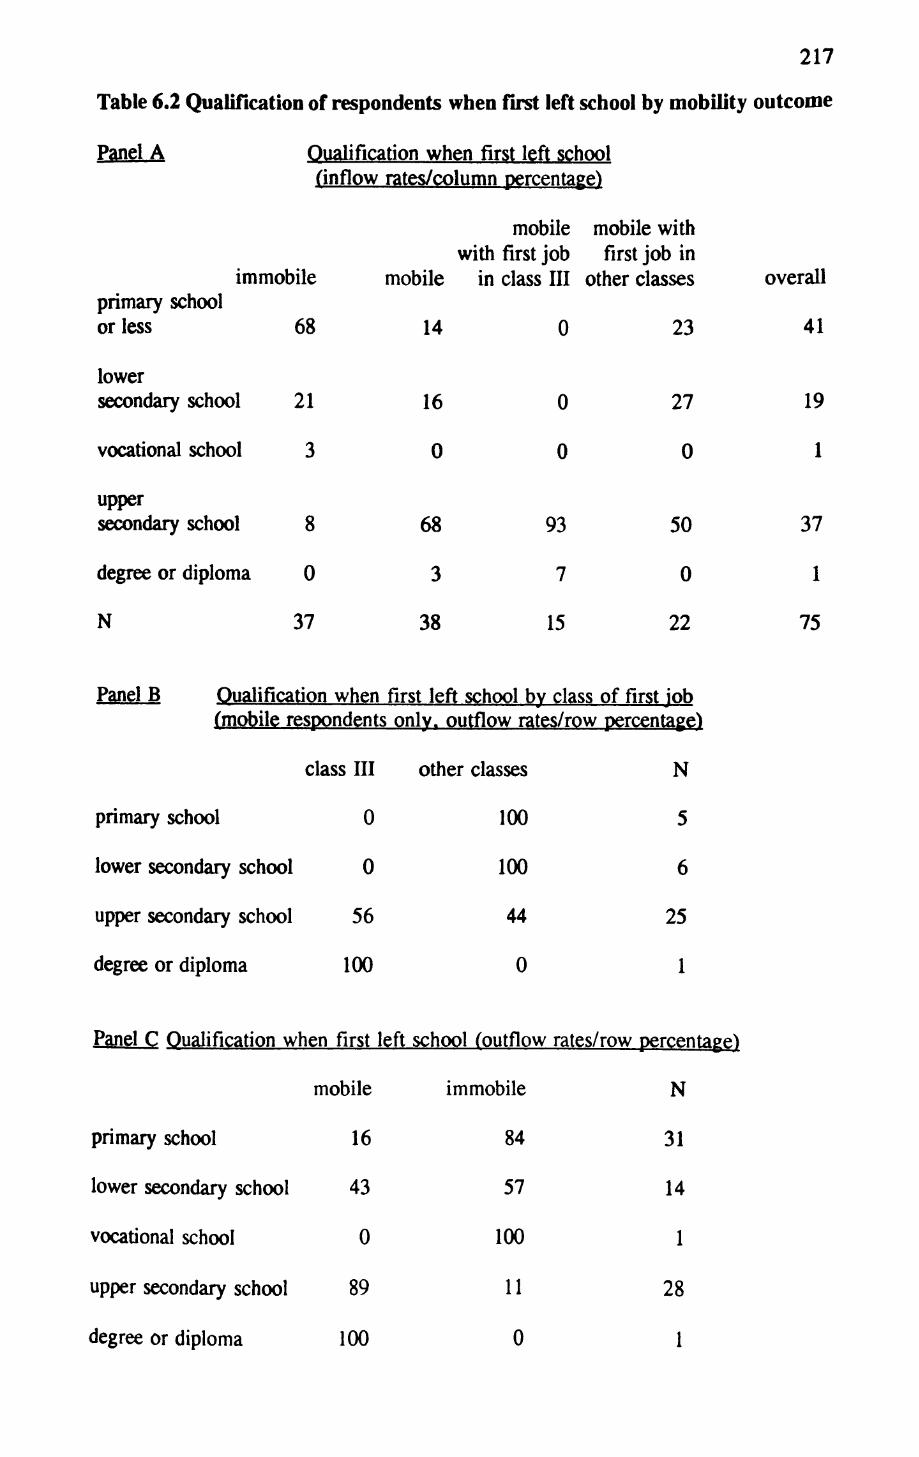
217
Table 6.2 Qualification of respondents when first left school by mobility outcome
Panel A Qualification when first left school(inflow rates/column percentage)
mobile mobile with with first job first job in
immobile mobile in class III other classes overall primary school or less 68 14 0 23 41
lower secondary school 21
vocational school 3
upper secondary school 8
degree or diploma 0
16 0
0 0
68 93
3 7
27
0
50
0
N 37 38 15 22
Panel B Qualification when first left school by class of first job
19
1
37
1
75
(mobile respondents onlv. outflow rates/row oercentaee)
class III
primary school 0
lower secondary school 0
upper secondary school 56
degree or diploma 100
Panel C Qualification when first left
mobile
primary school 16
lower secondary school 43
vocational school 0
upper secondary school 89
degree or diploma 100
other classes
100
100
44
0
school (outflow rates/row
immobile
84
57
100
11
0
N
5
6
25
1
percentage)
N
31
14
1
28
1

34
45
3
18
30
30
11
30
27
33
7
33
32
27
14
27
32
37
7
24
218
Table 6.3 Parental attitude towards respondent's education by mobility outcome
Panel A Parental attitude by mobility outcome (column percentage)
mobility mobility withwith first job first job in
immobile mobile in class III other classes overall
supportive
indifferent
not supportive
don't know
N 38 37 15 22 75
Panel B Qualification, by mobility outcome by parental attitude(column percentage)
indifferent parents supportive parentsmobile immobile mobile immobile
primary school or less 9 71 9 77
lower secondary school 18 18 18 23
vocational school 06 00
upper secondary school 73 6 73 0
N 11 17 11 13
Panel C Explaining mobility outcome by parental attitude & qualification.
Model (N=52)
2 [P][MQ]
3 [PQ][MQ]
4 [PM][MQ]
5 [PQ][PM]
G236.5
1.4
1.4
1.2
36.2
df 7
5
3
4
4
rG2 from Ml
96%
96%
97%
1%
P 0
>.90
>.70
>.80
0
There are two levels of parental attitude (P), supportive or indifference, two levels of mobility outcome (M), mobile or immobile, and three levels of qualifications (Q), primary school or less, lower secondary plus vocational school, or upper secondary school.

219
Table 6.4 Whether respondents had discussed career plan with, and/or received career advice from, parents by mobility outcome (column percentage)
no advice/ discussion
some advice/ discussion
don't know
N
immobile
66
mobile mobile withwith first job first job in
mobile in class HI other classes
43 33 50
overall
55
27
8
38
19
38
37
33
33
15
9
41
22
23
23
75
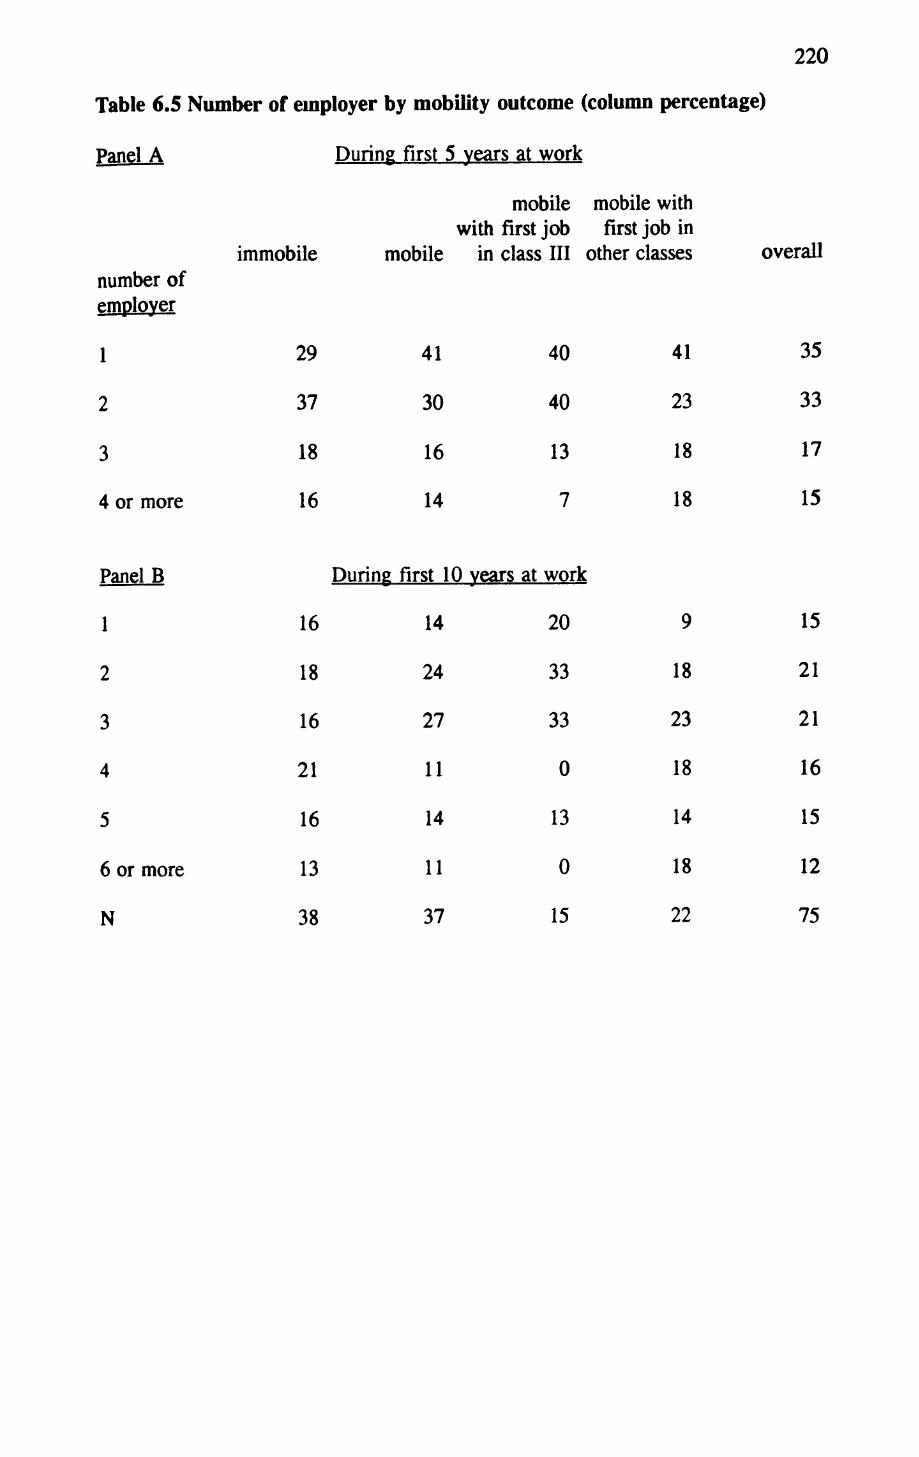
220
Table 6.5 Number of employer by mobility outcome (column percentage)
Panel A
immobile
During first 5 years at work
mobile mobile withwith first job first job in
mobile in class III other classes overallnumber of employer
1
2
3
4 or more
Panel B
1
2
3
4
5
6 or more
N
29
37
18
16
16
18
16
21
16
13
38
41
30
16
14
During first 10
14
24
27
11
14
11
37
40
40
13
7
vears at work
20
33
33
0
13
0
15
41
23
18
18
9
18
23
18
14
18
22
35
33
17
15
15
21
21
16
15
12
75
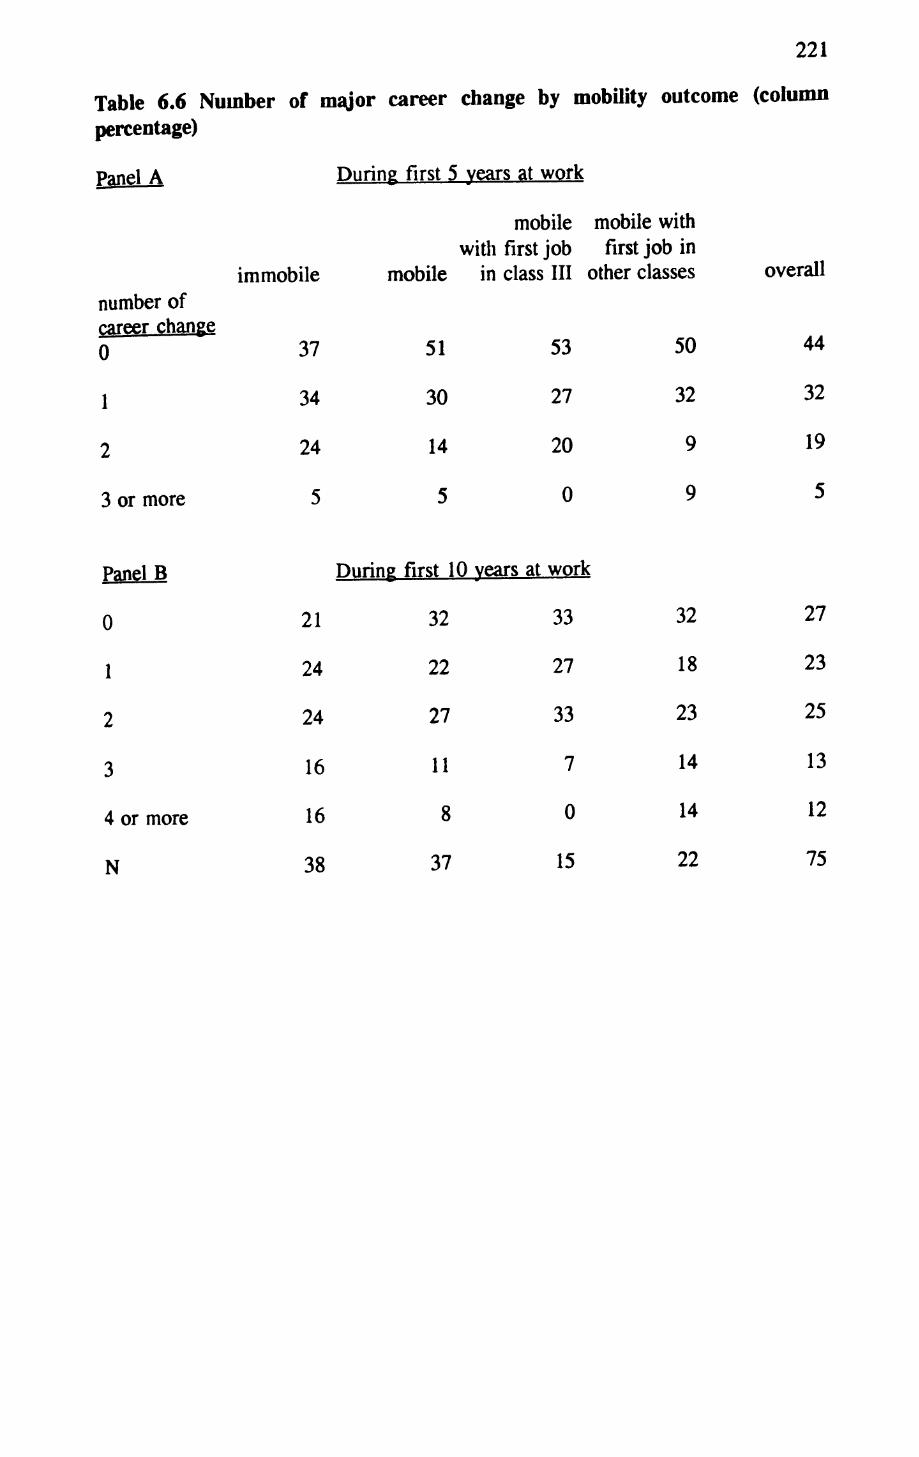
221
Table 6.6 Number of major career change by mobility outcome (column percentage)
Panel A During first 5 years at work
mobile mobile with with first job first job in
immobile number of career change 0 37
1
2
3 or more
Panel B
0
1
2
3
4 or more
N
34
24
5
21
24
24
16
16
38
mobile
51
30
14
5
During first 10
32
22
27
11
8
37
in class III other classes
53 50
27
20
0
years at work
33
27
33
7
0
15
32
9
9
32
18
23
14
14
22
overall
44
32
19
5
27
23
25
13
12
75
222
Chapter 7
Summary and Discussion
I began this thesis by noting that researchers in comparative social mobility cannot
satisfactorily account for one of their most important empirical findings, namely the
invariance of relative mobility rates across industrial nations (Erikson and Goldthorpe
1992a:389-397). I then suggested that to explain this invariance, we need to know
more about the micro-process of social mobility. The fact is that we do not know
much of how class (dis)advantages are transmitted from one generation to the next.
It is true that status attainment research and its variants (e.g. the new structuralism
in labour market studies) can tell us how much mobility can be explained by variables
such as social origin, educational attainment, gender or labour market segment.
However, these studies cannot explain how these variables come to have their
explanatory power (Sorensen 1986), and they certainly do not relate the mobility
process to the social action of individuals. There is a need to build a better link
between macro- and micro-research in mobility. This is the theoretical issue, put at
the most general level, that I set out to address in this study.
I also indicated in Chapter 1 that I have a more local and substantive concern,
namely: in what ways is Hong Kong more (or less) open than other industrial
countries; and how is class inequality perpetuated in this society? Let me first
summarize my substantive findings about Hong Kong. Then I will go back to the
theoretical issue of the macro-micro link in mobility research.
Social Mobility in Hong Kon£
Broadly speaking, there are two opposing views on the question of social mobility in
223
Hong Kong. People who subscribe to the first view think that Hong Kong is a
relatively open, meritocratic society. This is the dominant, though largely untested,
position among Hong Kong's social scientists (e.g. Lau 1982, Lee 1982, Scott 1989)
and the general public. In Chapter 2, I suggested several reasons why it may, to
some extent, be true. They are; (a) the fact that Hong Kong people are generally
optimistic about their personal chance of social and economic advancement, (b)
massive immigration may heighten mobility rates, (c) economic dynamism may
regularly provide new opportunities to people from disadvantaged background, and
(d) the prevalence of small firms may imply the existence of an alternative mobility
channel for those who cannot achieve mobility by virtue of formal credentials.
There are, of course, dissents to this optimistic orthodoxy (e.g. Tsang 1992, Wong
and Lui 1992b), but the evidences and arguments of the sceptics are rather
unsatisfactory. Thus, it remains unclear as to what Hong Kong's mobility regime is
like, and how open this society is.
In Chapter 3, I put these two opposing views to a direct test by extending the
CASMIN analysis to Hong Kong. It turns out that the CASMIN core model fits the
Hong Kong table very well; in fact, better than it does for most countries in the
CASMIN sample. This means that the pattern of unequal mobility chance described
by the core model is found in Hong Kong too. My analyses also reveal that Hong
Kong exhibits a relatively high degree of openness, which can be attributed to the
absence of sector barriers, and the weakness, by European standard, of inheritance
effects in Hong Kong. However, it does not follow that Hong Kong is a classless
society, because apart from the weak inheritance effects, I also found strong
hierarchical effects, especially those against long-range mobility. In other words,
while it is relatively easy for the people of Hong Kong to leave their class of origin,
224
those who are mobile in this minimal sense are unlikely to travel very far up or down
the class hierarchy. This, I submit, is a very important and rather puzzling feature
of Hong Kong's fluidity pattern.
I do not have a full account of the fluidity pattern described above, but as
afterthoughts, I would underline two points. First, the weakness of the inheritance
effects may be related to a key feature of Hong Kong's industrial structure, namely
the prevalence of small firms. Second, the strength of the hierarchical barriers is a
very important characteristic of Hong Kong's stratification order, through which, one
may argue, class inequality is manifested most clearly and reproduced most
effectively. Subsequent analyses also confirm this point.
To digress briefly from my summary of substantive findings on Hong Kong, I should
add that Chapter 3 also bears on comparative mobility research in general.
Specifically, as Hong Kong and Japan deviate from the core model in quite different
ways; and, indeed, as Hong Kong's fluidity pattern is more similar to the Swedish
pattern than the Japanese one, there is no evidence to suggest any East Asian
exceptionalism in social fluidity. My findings, in line with the work of Erikson and
Goldthorpe (1992a), support a weak version of the FJH hypothesis.
Having examined Hong Kong's fluidity pattern in a conventional macro-comparative
manner, I began my exploration of the micro-mobility process in Chapter 4. I first
tried to identify the bridging occupations of Hong Kong. By tracing mobility flow
between three principal time points (i.e. class of origin, class of first job and class
of destination), I showed that almost all instances of worklife mobility into Hong
Kong's service class started from a first job in class III. Thus, compared to manual
occupations, routine non-manual first jobs are the bridging occupations of Hong
225
Kong. In line with earlier findings of Chapter 3, this points to some kind of
hierarchical gap (white vs blue collar). Thus, one can argue that there are, in Hong
Kong, strong hierarchical barriers which obstruct not only intergenerational but also
worklife mobility.
In Chapter 4, I also tested a new technique which compares and classifies complete
career sequences. By applying this technique, Optimal Matching Analysis, to the
career history of those respondents of the follow-up study who had reached the
service class, I was able to identify four typical mobility paths, namely "returning to
full-time education", "class ma path", "class IVa path", and "class VI and Vila
path". The second of these four career types (i.e. "class Ilia path") was the largest
cluster. This is consistent with the finding, cited in the last paragraph, that routine
non-manual jobs provide better chance of worklife mobility than manual jobs do.
Respondents who were on the "class nia path" took, on average, about 7 years to
reach the service class, while those who followed the next most commonly used
mobility path, "class VI and Vila path", took twice as long to do so. There is some
evidence to suggest that internal promotion to the service class was less common
among the former than the latter. One interpretation of this finding is that people on
the "class VI and Vila path" were more dependent on internal job ladder for worklife
mobility. Given that (a) most small firms do not have internal job ladder, and (b)
manufacturing workers employed in small factories make up a large part of Hong
Kong's manual classes, the relative dependence of manual workers on internal job
ladder gives some insight into why they are less mobile.
There is also evidence to suggest that the various mobility paths are selectively open
to different people. Specifically, "class Ilia path" was relatively more open to people
226
who were born in Hong Kong, held intermediate qualifications, and came from class
IVab rather than class Vila origin. Finally, the finding that relatively few
respondents reached the service class through "class IVa path" is quite unexpected.
Despite the prevalence of small firms in Hong Kong, and the often celebrated
entrepreneurship of the Hong Kong people, my analyses suggest that running a small
business is not a particularly promising way to get to the service class.
In Chapter 5, I examined the effects of social networks on the mobility process.
Since most respondents stayed in wage employment as they entered the service class,
I focused on the question of how social networks facilitate the job search process.
As expected, I found that personal contacts were used extensively in job search, and
that work contacts played a prominent role in helping our respondents to get service
class jobs. In line with Granovetter's "Strength of Weak Ties" thesis, I also found
that most of the personal contacts that led to service class jobs were "weak ties".
Using case materials from the follow-up study, I was able to show that the observed
weak ties effect was indeed a result of having non-redundant information. This is
further confirmation of Granovetter's social network argument at the level of social
action. Because acquaintances, particularly work contacts, known from a long time
ago are crucial for future job changes (even if people had not kept close contact), the
entirety of a person's worklife affects his/her future mobility performance. This
suggests some sort of "path dependence", and is consistent with the idea of typical
mobility paths explored in Chapter 4.
Given the evidence for path dependence, I turned to study the early worklife of our
respondents in Chapter 6. I had expected that this will suggest some insight into why
some people achieved mobility while others did not. The findings were mixed, but
interesting. To start with, I found that most of our respondents received little

227
parental support as they made the crucial transition from school to work: up to half
of them did not receive positive parental support for their education; about the same
proportion did not discuss their career plan with their parents. Partly because of this,
many respondents had landed in jobs which, from what we know about typical
mobility paths, carry little prospect of worklife mobility into the service class. I also
found that parental assistance was not very useful in facilitating subsequent career
changes. This means that people who started badly in their worklife were often
stranded in the "wrong" jobs for a long time. In other words, the negative
consequences of a bad career start are not easily reversible. This is, again, consistent
with earlier findings of path dependence.
Using case matenals, I was able to show that the lack of parental support reflects not
so much a rejection of "middle class values of mobility" on the part of the parents as
the paucity of familial resources. This, I submit, is a crucial link between
intergenerational class inequality and worklife dynamics. Since working class and,
to a lesser extent, petty bourgeois parents are under severe resources constraint, they
can offer only very limited support to their children. As a result, people from these
origins are more liable to start badly in their career - leaving school without upper
secondary qualification, and going into manual rather than routine non-manual jobs.
As noted above, a bad start often means being stranded in the wrong job, and
following from that, a diminished chance of getting to know the right type of (work)
contacts for service class jobs. This is an example of how class inequality may affect
worklife dynamic which, in turn, reproduces the pattern of unequal mobility chance.
However, there is one finding which does not square well with the above parental
support argument: I have found that the mobile respondents received just as little
parental support as those who were immobile. Thus, level of parental support cannot
228
be used to explain variation in mobility outcome among people from the same
disadvantaged origin. Indeed, by comparing a few simple loglinear models, I showed
that mobility outcome does not depend on parental attitude towards education, once
the association between respondent's qualification and mobility outcome has been
taken into account. In other words, as far as worklife mobility into the service class
is concerned, it does not matter whether there was parental support; what matters is
whether a person left school with at least upper secondary qualification. To the
extent that a person's qualification is affected by, not only the level of parental
support, but also factors which are (from the sociologist's point of view) quite
random, one can argue that instances (as distinct from the rate) of upward mobility
into the service class is essentially unpredictable. On the other hand, one may also
think that this above anomaly is, in part, an artefact attributable to the poor quality
of my data — small N, missing cases, crude measures of parental support. This
remains to be verified.
It should be apparent from the above summary that the distinguishing feature of Hong
Kong's mobility regime is its hierarchical gaps. With regard to worklife mobility into
the service class, the gap between routine non-manual and manual classes is most
notable. People are streamed into either side of this gap at the beginning of their
worklife according to whether they have finished upper secondary school, and from
that point onwards, their chance of worklife mobility are, to a large extent,
determined.
Why should this be the case? I must admit that I have no good answer to this
question, but if readers would allow me to speculate, I think the following is relevant:
Hong Kong is a Chinese society; over 95% of its population are Chinese, and
members of this majority group speak Cantonese as their mother tongue. However,
229
Hong Kong is also a British colony, in which most business in the government above
the street level was conducted, until recently, almost exclusively in English. Hong
Kong also has an outward-looking economy. From its early days as an entrepot,
through its subsequent role as an exporter of manufactured goods, to its more recent
role as a regional financier and trading centre, there has always been a strong
presence of foreign firms and firms that deal primarily with Western markets. Most
of these firms are found in banking, trading, insurance, and various business and
financial service, rather than manufacturing. These firms form the "core" of the
economy, and their employees, who are mostly in white collar occupations, enjoy
higher wages, more job security and better promotion prospects than manufacturing
workers. However, to get a clerical position in the "core" firms or the civil service,
one needs to have some basic competence in English, which is normally certified by
a upper secondary school certificate. 1
This is why the completion of upper secondary school, and early entry into routine
non-manual jobs make such a big difference for worklife mobility into the service
class. It is true that, in almost all industrial nations, formal credentials are taken as
signs of functional skills, and so the better qualified generally get more rewards than
those who are not-so-well qualified. However, this difference is, in the case of Hong
Kong, buttressed by a linguistic gap, which is rooted in the larger political and
economical setting of this society. Those who can operate effectively in the largely
English-speaking, white collar world of commerce and civil service enjoy better
mobility chance than those who work in the Cantonese-speaking world of
'To be more accurate, the secondary schools of Hong Kong fall into two types according to the principal medium of instruction, English or Chinese, in classroom. The type of secondary school that a student went to is shown on his/her O level results slip. Many employers consider only those applicants who have attended "English" schools.
230
manufacturing and menial personal service. This makes the manual/non-manual gap
of Hong Kong wider than it would otherwise be. Hence, the particularly strong
hierarchical effects of Hong Kong.
Macro-micro link in mobility research
Having summarised my substantive findings on Hong Kong, let us return to the
theoretical issue of the macro-micro linkage in mobility studies. In Chapter 1, I
suggest that my objective, in undertaking the present study, is to relate findings of
macro-comparative research, in particular, the invariance of relative mobility rates,
to the social actions of individuals. I also note in the same chapter that it is not clear
what questions we should be asking in a micro-mobility study. As an exploratory
attempt, I have considered three issues: the typical paths for worklife mobility; the
effects of social networks on the job search process; and how career beginning is
related to eventual mobility outcome. Now that my study has ended, we are in a
position to consider: (a) whether I have asked the right questions, (b) how far have
I been successful in relating macro-mobility findings to the social actions of
individuals, and (c) do we have a better understanding of the invariance of relative
rates than before?
Readers will certainly have their own opinions on this study, but let me also put
forward my views. To do this, perhaps I should briefly reconstruct the reasoning that
underlies my inquiry. As intergenerational mobility is realised through worklife
events (i.e. the job shifts, internal promotion, business ventures, resumed education,
etc. that a person experiences or fails to experience), it is clear that any micro-
mobility study has to be grounded on a close examination of the worklife dynamics.
This concern for the worklife process, and a hunch that there are "bridging
occupations" in the class structure, led me to look for the typical mobility paths in
231
Hong Kong (Chapter 4). Among other things, I find that (a) most people stayed in
wage employment as they entered the service class, and (b) those who achieved
mobility did so rather quickly. Given these findings, I decided to focus my
subsequent inquiry on the job search process and the career beginning of our
respondents.
I think these are reasonable decisions, and I hope readers will agree that my analyses
do point to some non-trivial results. Having said that, the following needs to be
brought out more clearly: by focusing almost exclusively on wage employment, I
have overlooked other worklife events which involve quite different mobility
mechanisms. I have, for example, reported (but not explored) the two mobility paths
of "returning to full-time education" and "class IVa path" in Chapter 4. Similarly,
while considering wage employment in Chapter 5, I reported that weak ties effect
(non-redundant information) is quite irrelevant to mobility through internal promotion,
but no serious effort was made to investigate the social mechanism of internal
promotion. It should be apparent that the social forces that govern these
"overlooked" mobility types are different from those that regulate job shifts between
firms. They deserve careful treatment. However, the limitation of a doctoral thesis
and the small number of relevant cases in the follow-up study make it impractical for
me to go into these mechanisms. So I will not make any special apology for my
selective attention. But it has to be stressed that class mobility is a multifarious
phenomenon, and specialized effort should be made to investigate these "overlooked"
processes in the future.
Let us also consider the social actions that I refer to in this study. One major theme
of Chapter 5 is that news of job vacancies was often passed on to our respondents
during chance meetings. Indeed, many of them obtained jobs which they had not

232
actively looked for. In other words, getting a job is often a by-product of other social
processes. This insight is, of course, first suggested by Granovetter, and I make no
claim of originality here. But given this, there is a need to rethink what we mean by
social actions. Obviously, they should not be restricted to acts that are intended to
bring about immediate occupational movement, such as asking a former teacher to
write a job reference. Perhaps things that people do for fun, or to be sociable, such
as the occasional phone call or the drink after work, are forms of social actions which
are equally important for class mobility. However, I believe it is not simple
friendliness that is at issue here. This may sound cynical, but it strikes me that
friendliness does not correlated terribly strongly with occupational success. So the
content of the type of sociability that would facilitate class mobility remains to be
specified. This leads to the questions of what type of people are more capable of
maintaining the "right" kind of sociability, and whether this provides an alternative
basis for formulating a theory of cultural capital.
Having argued for a board conception of social actions, I should add that, in Chapter
6, I have explicitly subscribed to a narrow one. I assume that the parents of our
respondents were primarily interested in promoting intergenerational upward mobility,
and that, subject to the availability of resources, they would act consciously and
deliberately to improve their children's long term life chances. As argued above, I
think this is not a bad assumption. The problem is, however, that I do not have any
data collected directly from the parents to test it. As a result, I have to take on trust
their children's account of what they had done (or failed to do). What makes it even
more unsatisfactory is that, because of my interest in the process of upward mobility,
I decided to sample respondents of disadvantaged background only. Consequently,
I have been arguing mostly about the inaction of working class and petty bourgeois
parents (because of their lack of resources to act). Conversely put, I think it is
233
reasonable to assume that parents generally want to improve their children's mobility
prospects. But to test this assumption, a study of what service class parents (who
have the resources to act) have done to prevent intergenerational downward mobility
would be preferable to one that examines what working class parents have failed to
do to promote upward mobility — it is easier to theorise what had happened than what
had not happened. Furthermore, it would be very nice if data collected directly from
the parents are available, though I am not sure whether this is a practical fieldwork
suggestion.
Finally, a humble note on whether we have a better understanding of the in variance
of relative mobility rates than before. I think in the last couple of pages I have
managed to convey a sense of the complexity of the micro-mobility process. I would
happily admit that much work still needs to be done before we can say that we know
how people become (im)mobile in Hong Kong, or how class inequality is reproduced
in that society, not to mention the in variance of relative rates across industrial
nations. Of course, different mobility processes (or a mixture of these processes)
could produce the same overall pattern of class inequality. This calls for comparative
micro-mobility research. I guess as complete worklife data are being collected in
more and more countries, we are on course to undertake such research soon.
234
Appendix A: The 1989 Survey and the Follow-Up Study
The 1989 Hong Kong Social Mobility Survey
The survey was directed by Thomas Wong, Robert Chung (University of Hong Kong)
and Tai Lok Lui (Chinese University of Hong Kong). Data collection, which took
the form of face-to-face interview, was carried out by university students who were
trained by the researchers. Fieldwork took place between March and August of 1989.
Respondents were all male household heads, aged between 20 and 64. They were
selected from an address list provided by the Census and Statistics Department of the
Hong Kong Government. The list contained the address of 2,800 randomly selected
living quarters. A supplementary list of 29 batches of "segment addresses" was also
used. Segment addresses were clusters of 10 to 30 cottages found in urban squatter
area (8 batches) or remote rural area (21 batches). Generally speaking, they
represented the "thinly" populated parts of Hong Kong. Many of the cottages turned
out to be non-residential; some were not occupied; more importantly, they were
physically rather inaccessible. This led to a lot of difficulties of making contacts
during fieldwork. In the end, 11 segments were visited (including all eight of the
urban segments), but this produced only 12 successfully completed cases. Since the
farming population of Hong Kong are probably to be found in the segment addresses,
the low response rate from these addresses partly explains why there were no farmers
or farm workers in the sample.
Altogether, 2,159 households were visited. This led to 1,000 successfully completed
interviews. Many of the unsuccessful cases were instances where the address turned
out to be non-residential, or that the male household head was outside of the 20-64
age range. There were 363 cases of refusals and 317 cases where the male household
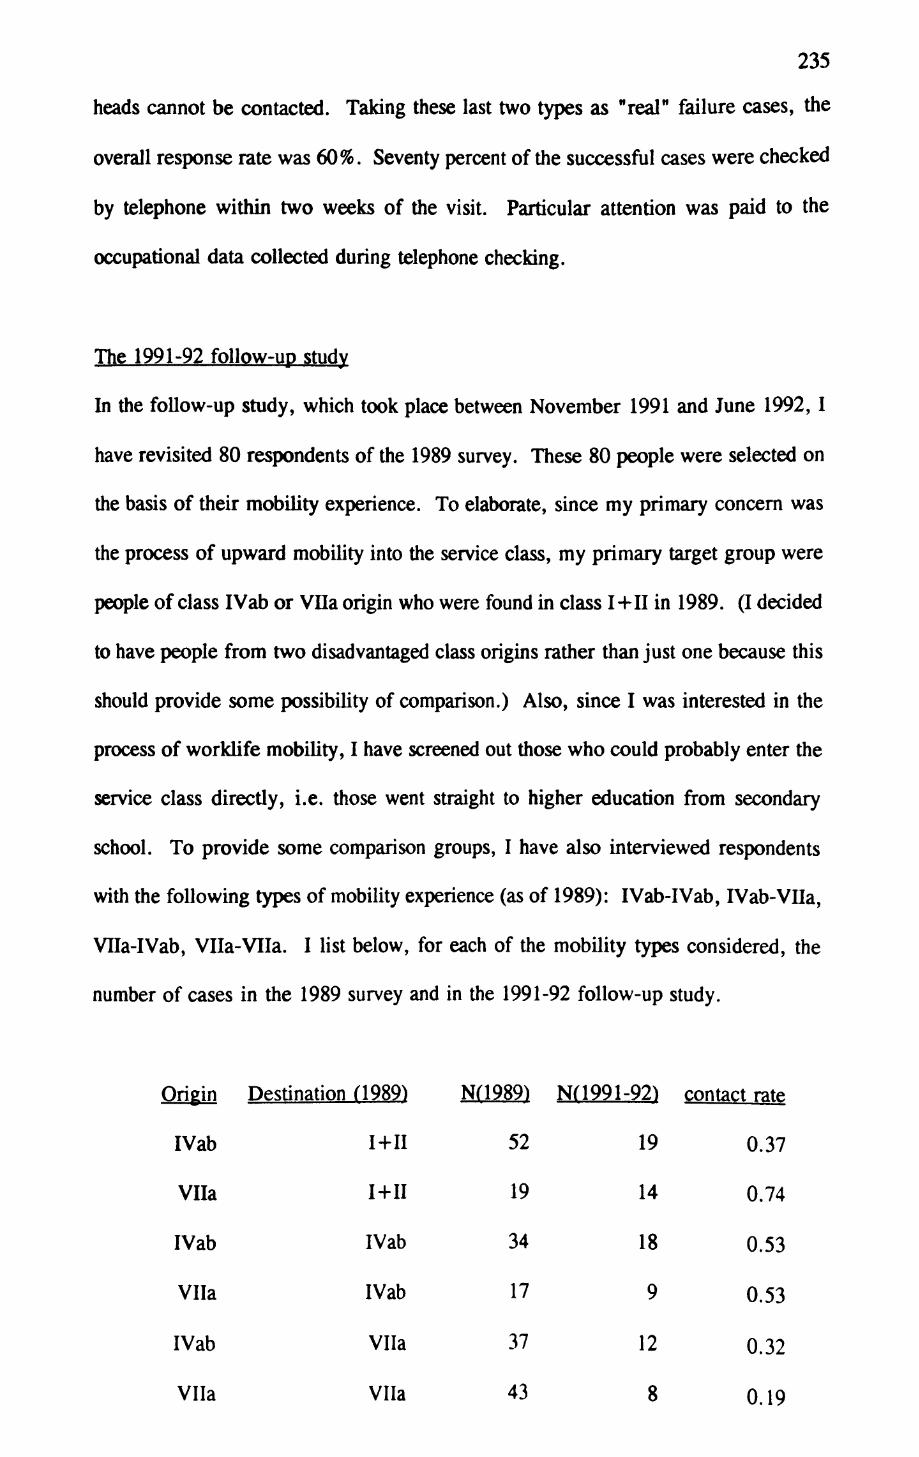
235
heads cannot be contacted. Taking these last two types as "real" failure cases, the
overall response rate was 60%. Seventy percent of the successful cases were checked
by telephone within two weeks of the visit. Particular attention was paid to the
occupational data collected during telephone checking.
The 1991-92 follow-up study
In the follow-up study, which took place between November 1991 and June 1992, I
have revisited 80 respondents of the 1989 survey. These 80 people were selected on
the basis of their mobility experience. To elaborate, since my primary concern was
the process of upward mobility into the service class, my primary target group were
people of class IVab or Vila origin who were found in class I+11 in 1989. (I decided
to have people from two disadvantaged class origins rather than just one because this
should provide some possibility of comparison.) Also, since I was interested in the
process of worklife mobility, I have screened out those who could probably enter the
service class directly, i.e. those went straight to higher education from secondary
school. To provide some comparison groups, I have also interviewed respondents
with the following types of mobility experience (as of 1989): IVab-IVab, IVab-Vila,
Vlla-IVab, Vila-Vila. I list below, for each of the mobility types considered, the
number of cases in the 1989 survey and in the 1991-92 follow-up study.
Origin Destination (1989) NH989) N( 1991-92) contact rate
IVab I+II 52 19 0.37
Vila
IVab
Vila
IVab
Vila
I+II
IVab
IVab
Vila
Vila
19
34
17
37
43
14
18
9
12
8
0.74
0.53
0.53
0.32
0.19
236
The last column of contact rate is simply the ratio between the two Ns. There were,
altogether, 65 unsuccessful attempts in the follow-up study; 34 of which were caused
by failure to trace the respondent who had moved since 1989. All but two
respondents were interviewed in face-to-face situations. The two exceptional cases
were interviewed by telephone on request of the respondents. Interviews were based
on the schedule provided in Appendix C. This common schedule ensures that a basic
inventory of information were obtained from all cases. However, I have also
encouraged the respondents to talk generally about his career history, job search
experience, the attitude of his parents toward his schooling, and so on. Thus, the
interviews were not standardised. The longest interviews took just under 3 hours, the
shortest lasted about 30 minutes, while the average interview took 72 minutes to
complete.

237
Appendix B: Design matrices for the core model of social fluidity and for the Hong Kong variant. 1
CORE HONG KONG
1222222 as core2111122211112222222 1 1211112222222 1 122222 1 1
1111122 as core111111111111112111111111111121111112111111
2111111 as core121111111211111112111111121111111211111112
2111111 not significant,1111111 therefore omitted11211111112111111111111111111111111
1111111 not applicable,1111111 therefore omitted11111111112111111111111111111111111
'See Erikson and Goldthorpe (1992a: 121-140) for further details.

238
1112112 not applicable,1112112 therefore omitted1112112222122 111121121112112222 122 1
1111112 11111121111111 11111111111111 11111111111111 21111111111111 11111111111111 11111112111111 2111111
AF2(h(ij» 1221111 as core211111121121111121121111112111112111111121
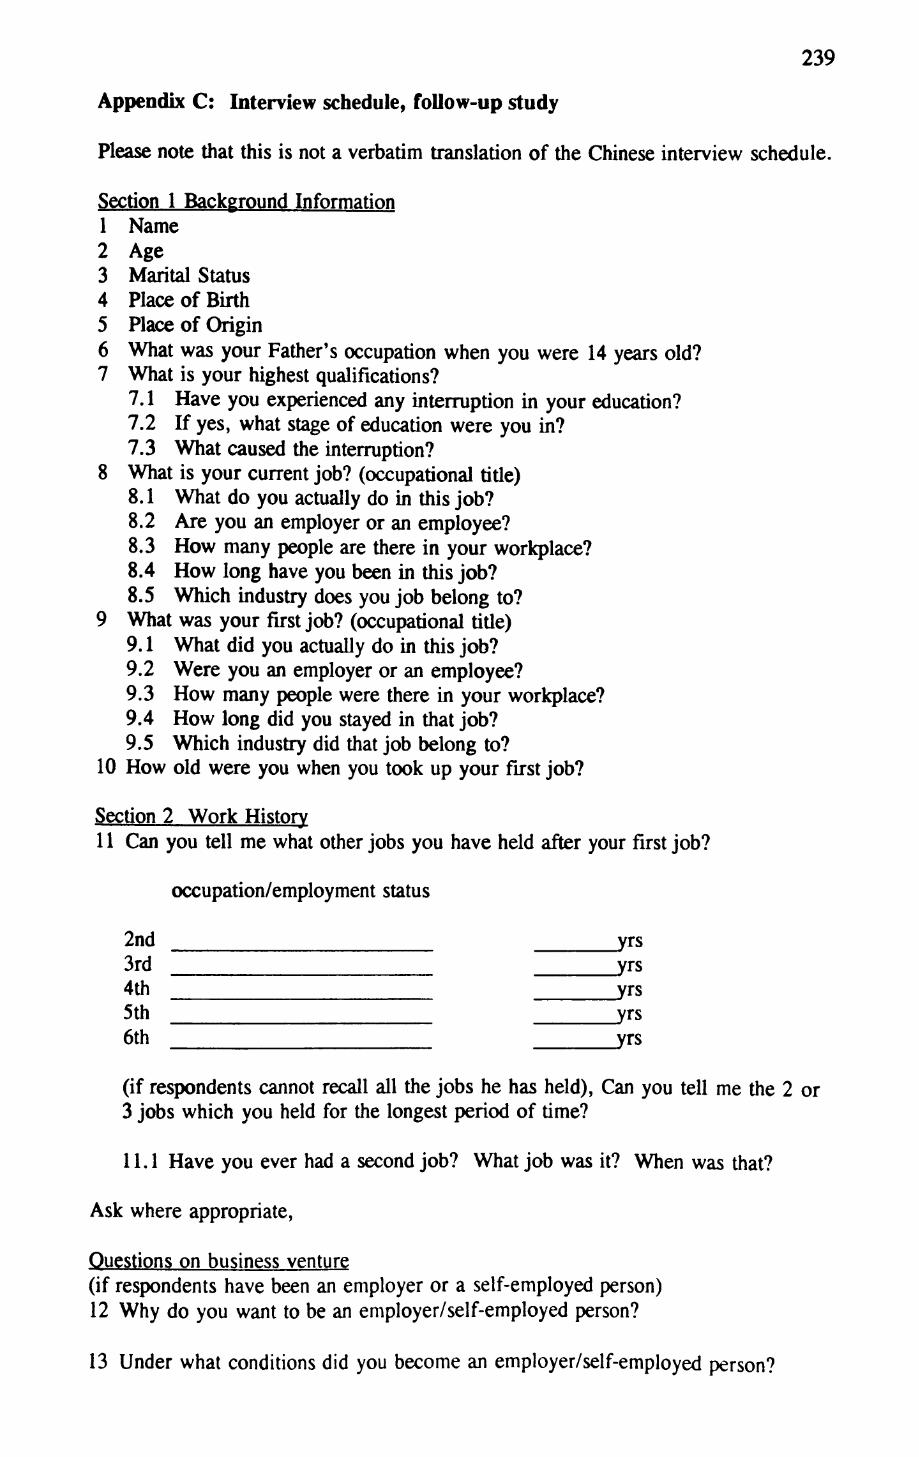
239
Appendix C: Interview schedule, follow-up study
Please note that this is not a verbatim translation of the Chinese interview schedule.
Section 1 Background Information1 Name2 Age3 Marital Status4 Place of Birth5 Place of Origin6 What was your Father's occupation when you were 14 years old?7 What is your highest qualifications?
7.1 Have you experienced any interruption in your education?7.2 If yes, what stage of education were you in?7.3 What caused the interruption?
8 What is your current job? (occupational title)8.1 What do you actually do in this job?8.2 Are you an employer or an employee?8.3 How many people are there in your workplace?8.4 How long have you been in this job?8.5 Which industry does you job belong to?
9 What was your first job? (occupational title)9.1 What did you actually do in this job?9.2 Were you an employer or an employee?9.3 How many people were there in your workplace?9.4 How long did you stayed in that job?9.5 Which industry did that job belong to?
10 How old were you when you took up your first job?
Section 2 Work History11 Can you tell me what other jobs you have held after your first job?
occupation/employment status
2nd ________________ _____yrs3rd ________________ _____yrs4th ________________ _____yrs5th ________________ _____yrs6th ________________ _____yrs
(if respondents cannot recall all the jobs he has held), Can you tell me the 2 or 3 jobs which you held for the longest period of time?
11.1 Have you ever had a second job? What job was it? When was that?
Ask where appropriate,
Questions on business venture(if respondents have been an employer or a self-employed person)12 Why do you want to be an employer/self-employed person?
13 Under what conditions did you become an employer/self-employed person?

240
14 What were you doing before you started your business?14.1 Were you working full-time?14.2 If yes, were you thinking of getting a new job?
15 How old were you at that point?
16 What do you think are the most important quality for a businessman?
17 (If answer to Q.I6 was 'having enough capital')17.1 Can you tell me how did you put together your start-up capital?
a from my own savings b bank loan c loan from friends or relatives
17.2 (if answer to Q.17.1 was 'c') Can you tell me who give you the loan? I'd like to know more about how you are related to this person. (GO TO QUESTIONS ON CONTACT CHARACTERISTICS)
18 (If answer to Q.I6 was 'know the trade well')Did anyone introduce you to the various things or people in the trade, or help you generally as you started your business? If so, can you tell me more about him/her? (GO TO QUESTIONS ON CONTACT CHARACTERISTICS)
19 When you started your business, did you have any partners? Who were they? Can you tell me more about them? (GO TO QUESTIONS ON CONTACT CHARACTERISTICS)
(After questions on contact characteristics, ask the following questions about business partners.)19.1 Was it you or was it one of your partners who initiated the partnership?
19.2 Why did you ask those people to become your partners? (or why do you think you partners ask you to join them?)
19.3 How did you know that this is a profitable business?
19.4 Did you consider going into other businesses?
19.5 Was there any special reason for going into business at that particular time?»
19.6 What was the division of labour between you and your partners?
19.7 Were you equally close to every partners?
19.8 Was every partner close to everyone else?
20 (if respondent's business subsequently failed)20.1 Can you tell me what problems your business ran into?
20.2 Could you turn to your business partners or other people for help?
21 (if respondent had never been an employer or self-employed) Have you ever considered running your own business?

241
21.1 if yes, did you make any concrete plan for that?
21.2 why didn't the plan materialise?
21.3 if not, why not?
Questions on resumed education22 (if respondent had experienced any interruption in education)
You obtained you degree/diploma after you had started working. Did you go back to school/college after you took up your first job?22.1 if yes, was that a full-time or a part-time course?
22.2 which college you went to?
22.3 if not, how did you get your degree/diploma?
23 Why did you go back to school/college?a to help me get a promotion or a new jobb to help my daily workc personal interestd just to kill timee to know friendsf I went with friends
24 When did you decide to return to school?
25 When did you decide to take that particular course?25.1 Have you considered other courses?
25.2 What explained the timing of your resumed schooling?
26 When you were considering which course to take, did anyone give you advice? I'd like to know more about this person. (GO TO QUESTIONS ON CONTACT CHARACTERISTICS)
(after questions on contact characteristics, ask the following questions)27 When you were considering returning to school, were you working? Was it full-
time or part-time work?
28 While you were taking that course, did you work at the same time? Was it full- time or part-time work? 28.1 if not, how did you manage financially?
29 How useful do you think your qualifications are for your career development?
30 (if respondent had never returned to school after entry into the labour market) A lot of people went back to school after they started to work in order to obtain better qualifications. Have you thought of doing so?30.1 if yes, why didn't you go back to school?
30.2 if not, why not?
Questions on getting wage job

242
(according to work history reported earlier, ask for each wage job) Can you tell me how did you get this job? Did someone tell you about the job vacancy, or did you read about it in the newspaper, etc.?
(if through personal contact)I'd like to know more about that person. GO TO QUESTIONS ON CONTACTCHARACTERISTICS
(QUESTIONS ON CONTACT CHARACTERISTICS)I How did you first come to know this person (job contact, business partner,
lender of start-up capital)? a we are relatives b we were old schoolmates c we were colleagues d he/she was my former superior at work e we grew up in the same neighbourhood f we belonged to the same organization (follow-up: what organization
was that?)g we were neighbours h cannot remember i knew him/her through a family member (follow-up: which family
member?) j others
n How long had you known each other at the time?
in How often did you meet each other?a more than once a weekb about once a weekc two or three times a monthd about once a monthe a few times a yearf about once a yearg less than once a year
IV Would you say you were very close to each other, close to each other, just ordinary friends, or not close to each other at all? a very close to each other b close to each other c just ordinary friends d not close to each other at all
V How did you get in touch with each other?a we visited each otherb only through telephonec in organization we both belonged tod chance meeting in the street, etc.e in workplacef others
VI What were he/she doing for a living (occupation)?
VII Did he/she know members of your family? (which one?)

243
Vin Did he/she know your other good friends?
Section 3 Social network (based on Fischer's [1982] scheme) Now I would like to ask you a few questions about your daily interaction with friends, colleagues or relatives. I'd appreciate if you can tell me the name of people that you have interaction with (their first names will do)
31 If you have to be away from Hong Kong for a short while, and need someone to take care of your place. Who would you ask to do so?
_________________________________(up to 8 names)
32 Did anyone help you in domestic chores in the last 3 months?
^________________________________(up to 8 names)
33 Did you have any of the following social activities in the last 3 months? a someone coming to your place for visit b you visit someone in their place c go out with someone for a meal, film, etc. d others (what were they?)
33.1 Can you tell me who did you visit (etc.)?
__________________________________(up to 8 names)
34 Do you meet people to talk about your hobbies, interest? If so, who do you meet to do so?
__________________________________(up to 8 names)
35 If you need to talk to someone about your worries, problems (or the problems of people you care about), who would you go to?
___________________________________ (up to 8 names)
36 Many people ask for their friends' opinions if they need to make a big decision. Will you do so? Who would you go to?
________________________(up to 8 names)
37 If you need to borrow a large sum of money, would you go to a bank or someone you know?
37.1 (if from personal source), who would you go to?
37.2 (if from a bank), suppose there is an emergency, is there someone you can ask for perhaps part of the loan?
.(up to 8 names)
38 Did you discuss problems you met in work with your colleagues or supervisors?

244
Who can you talk to about problems in work?
_________________________________(up to 8 names)
39 Can you tell me the names of all adults (aged 18 or above) living in this household?
40 Perhaps there are other people who have helped you a lot in your career. But for some reasons, you have not been keeping close contacts. If so, can you give me their names?
40.1 How did they help you?
41 Is there any other people who are important to you, but is not listed above?
(For the first five people named in Qs.31, 33, 34, 35, 36 and 37, ask the following questions)
I How did you first come to know this person? a we are relatives b we were old schoolmates c we were colleagues d he/she was former superior at work e we grew up in the same neighbourhoodf we belonged to the same organization (what organization was that?) g we were neighboursh knew him/her through a family member (which family member?) j others
II How often did you meet each other?a more than once a weekb about once a weekc two or three times a monthd about once a monthe a few times a yearf about once a yearg less than once a year
III Approximately how old is this person?a less than 20b 20-29c 30-39d 40-49e 50-59f 60 or above
IV His/her job is?Is he/she an employer/self-employed/employee?

245
V His/her marital status is a married b singlec divorced/separated/widowed d don't know
Do these five people know each other?P2 P3 P4 P5
PI Y/N Y/N Y/N Y/N
P2 Y/N Y/N Y/N
P3 Y/N Y/N
P4 Y/N
For everyone named from Qs.31-41, ask, on a separate form, about their sex, their relationship with the respondent, how long he/she had known the respondent, whether he/she is particularly close to the respondent, and whether he/she has the same occupation, hobby, place of origin, religious belief with the respondent.
Section 4 Supplementary information42 Can you tell me your grandfather's job?
father's father mother's father
43 Where (in which district) did you grow up?
44 How many brothers and sisters do you have? And what are the age differences between you?
45 Can you tell me their job?45.1 What do they actually do in this job?45.2 Are they their own boss or they working for other people?45.3 Which industry are they working in?
46 Do you have any particular plan for the next 5 years?
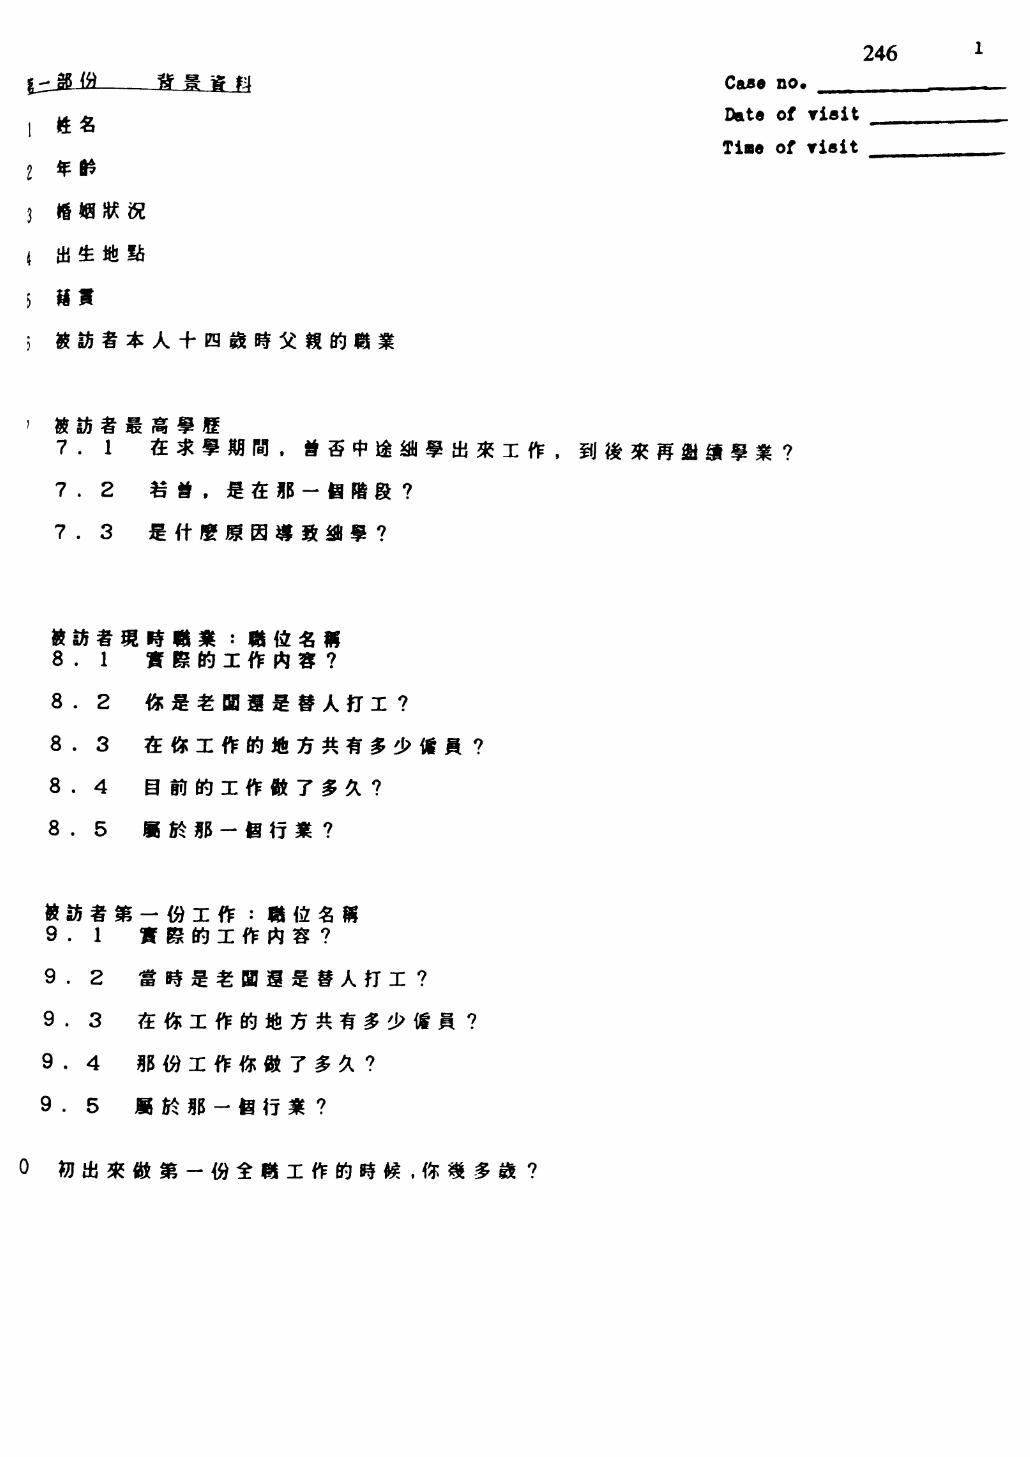
S' 6
' 6
'6
T ' 6
9*8
> ' 8
S "8
2 ' 8
i - 8
c2
' L
JO
jo
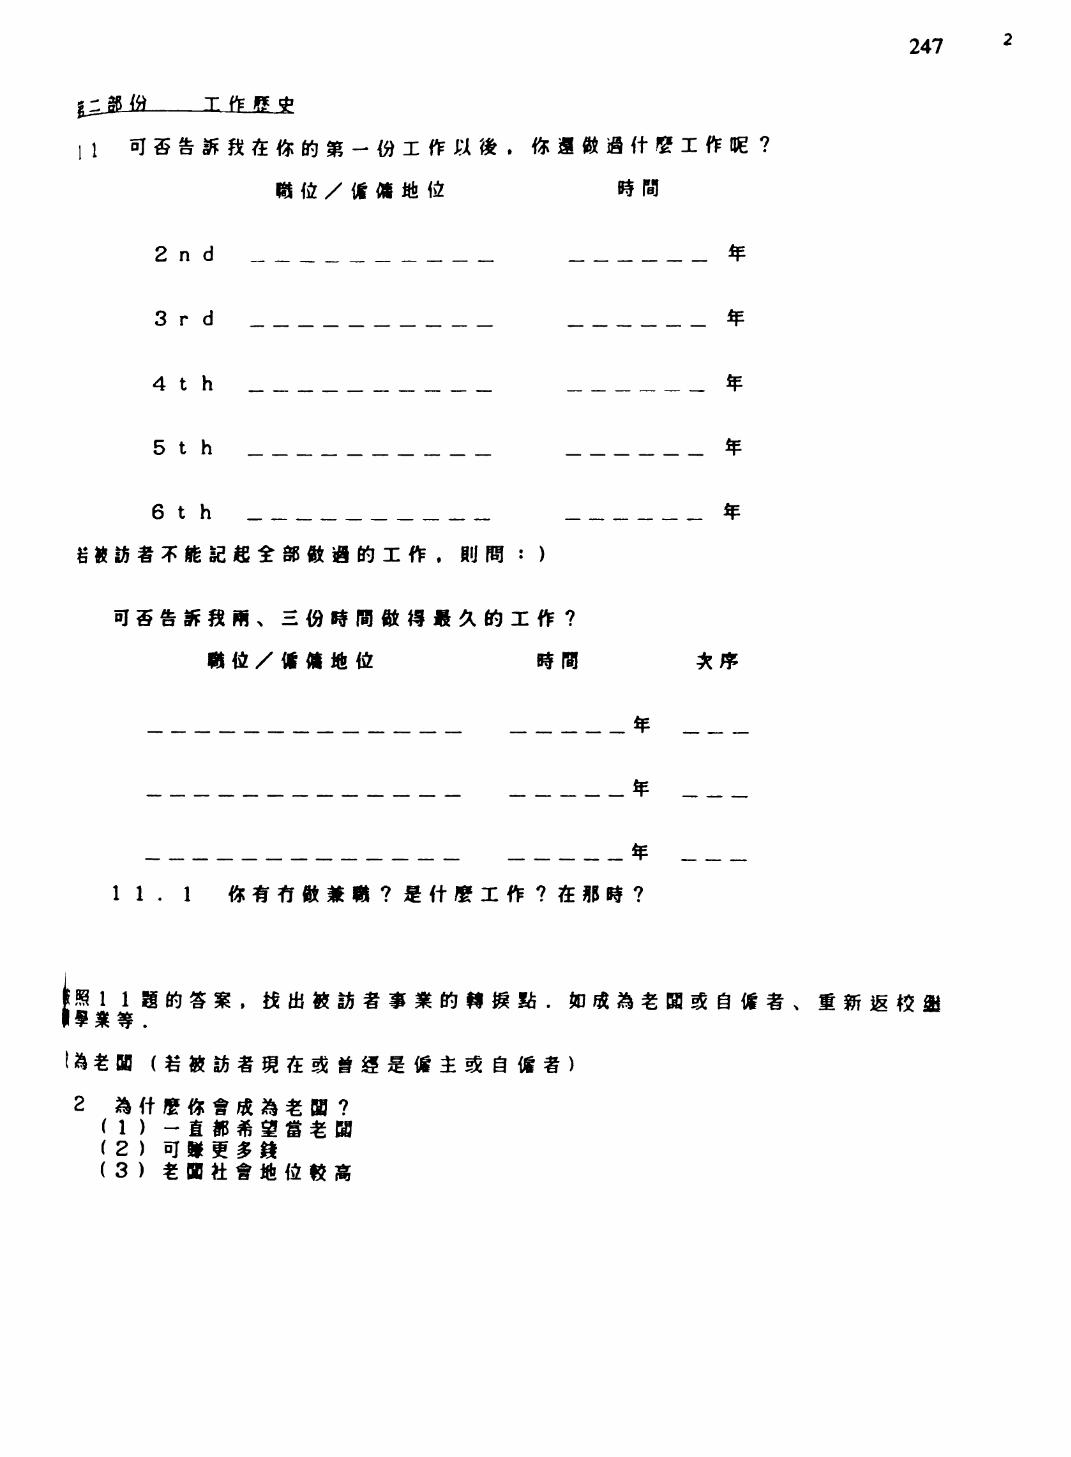
247
n<a T. ft? is *
ft ii X it fll $! $
2nd __________
3rd __________
4th __________
5th __________
6th __________
11. 1
.« 1
< 1 ) ( 2 ) (3)
£16
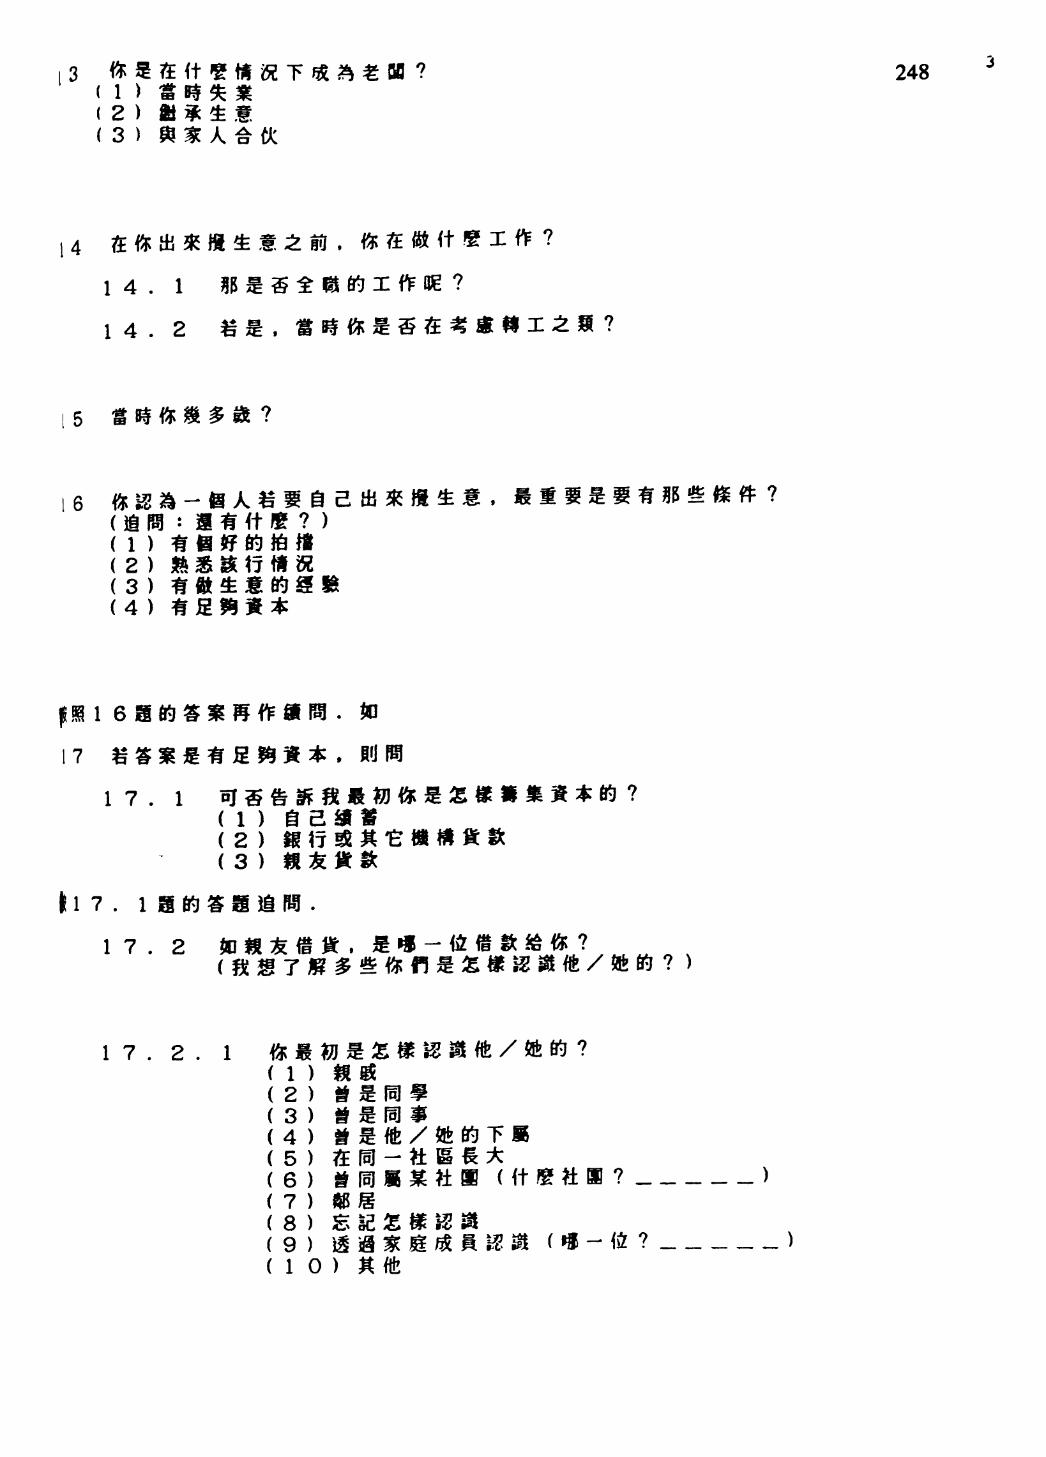
^
-N)
• ro
^i anera
3
o> 3
HI
3
aS flu
81
» 3
"*' ^"
"^ "^
^g
cu EE Hf flu
ro
H-
iJt*
w
E6 Ifr
S5 !r
3
.H
!
A -»
H M-
H
cHt
B •o oo u>
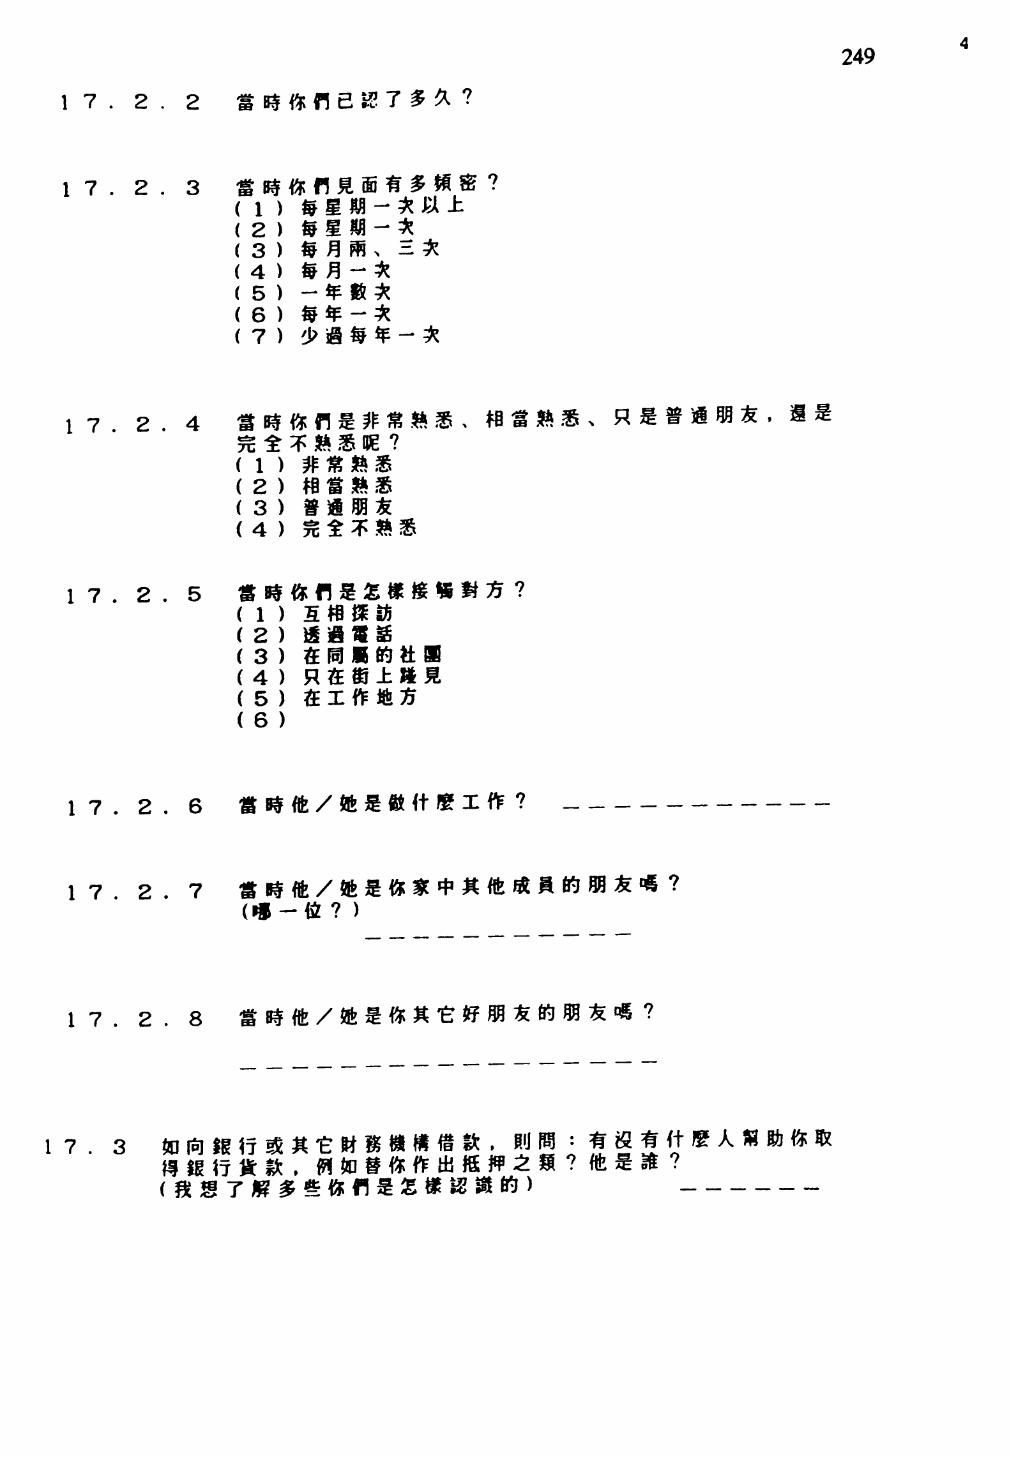
17.2.2
249
17.2.3 fctfttflll ( 1 ) $££
2 ) 51*34567 '> i
17.2.4
( 1 )( 2 )( 3 )( 4 )
3B IS3B x R• ^rf* \ f »
17.2.5
17.2.6
17.2.7
17.2.8
( 2)( 3 ) ( 4) (5)( 6 )
17.3
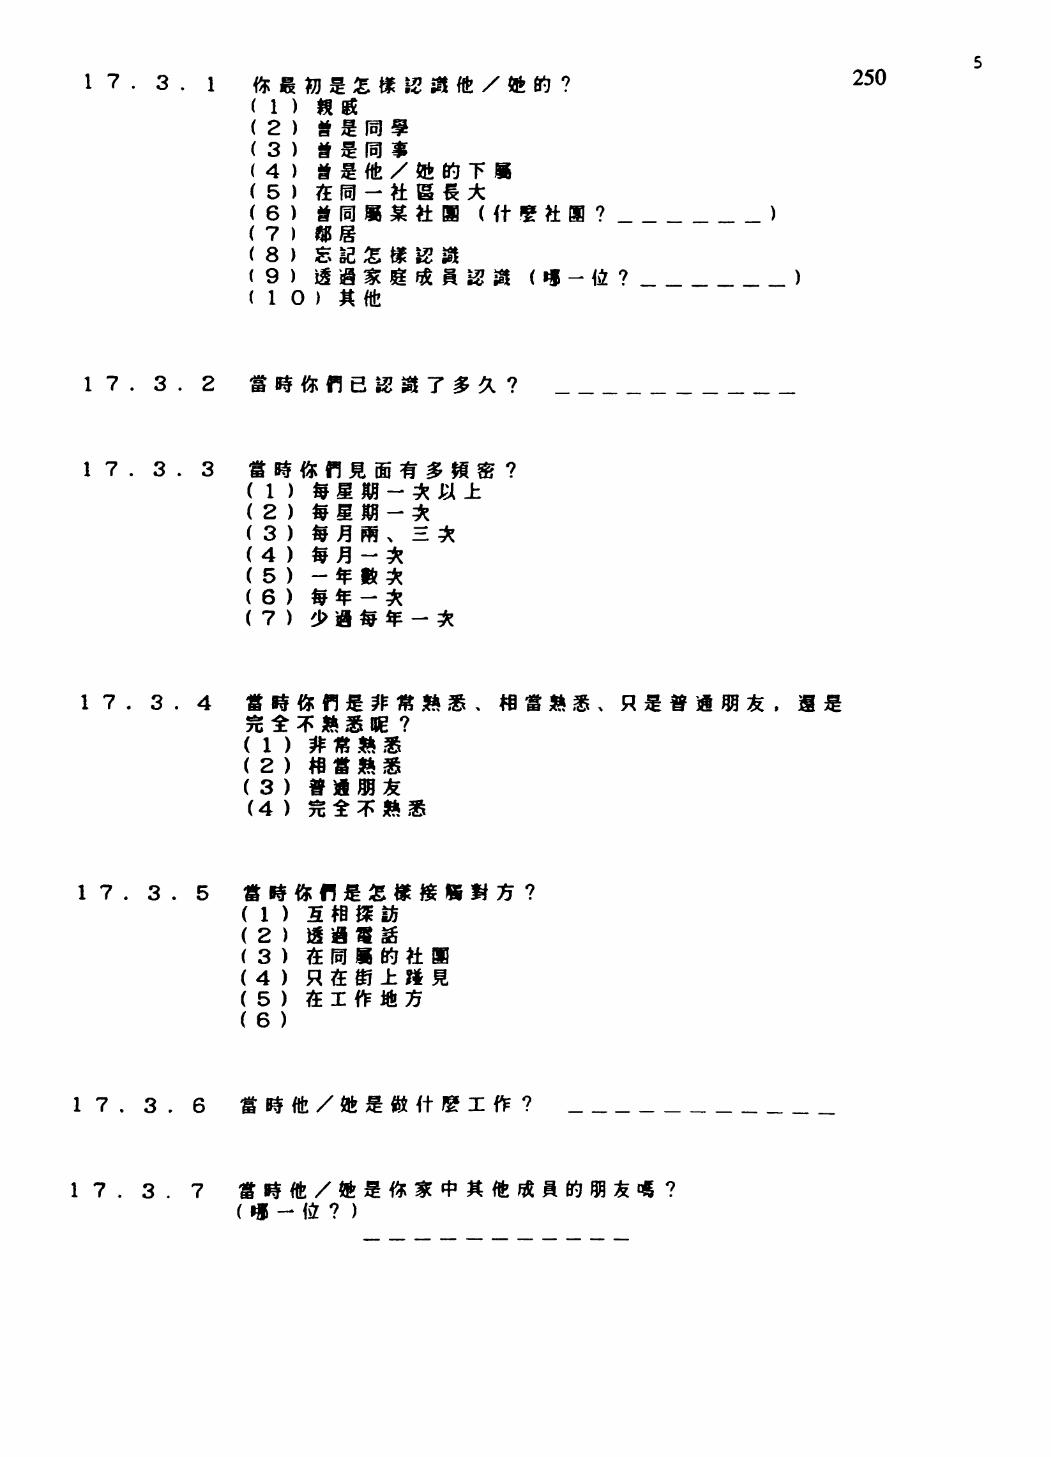
c^-
e\
o-m
DWCO•
h-
03CVJ•
CO
•K1
1 SC 1
1
CO•
CO
m•k
•wg:*anDW DC^t•
CO•
r-
^ CV] CO ^
IT) CD
10•
CO
c-
^H£\CD•
CO
«
•EhDWCO
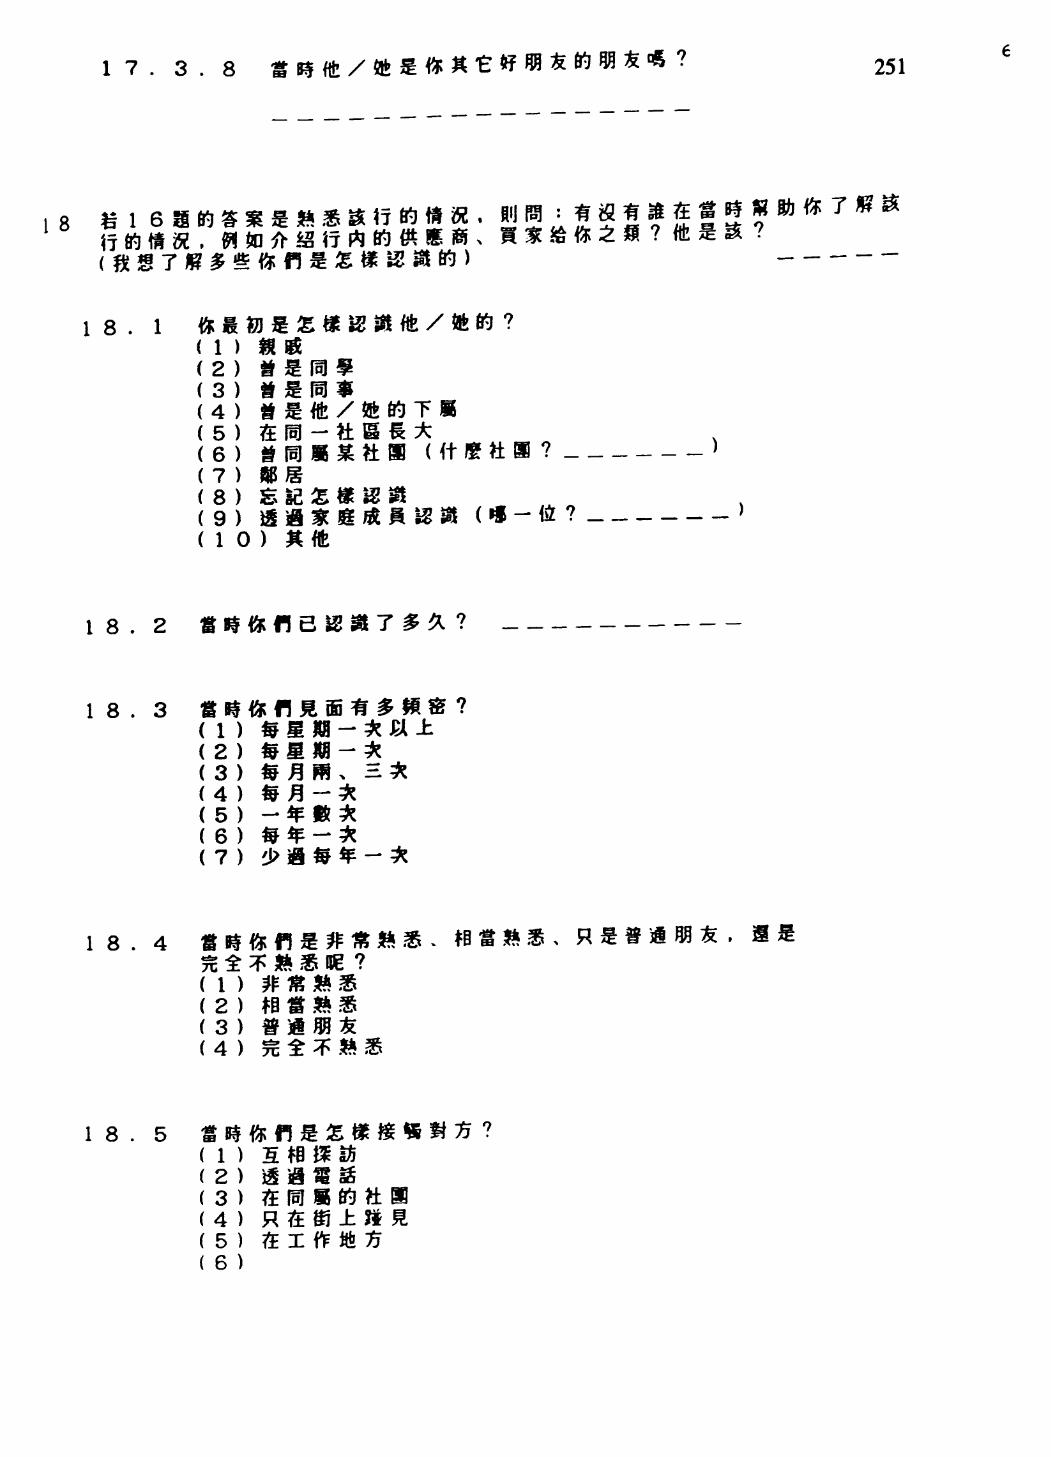
00
00
en 01
^> co
ro •-
J •Sr
oo • ^ V no XI
oo
^1 0
) C7
1 4^
00 C
O H-
•SB-
^ ^
uBU
OB
«B
mi
'
I I?
00
m cu
00
H A I
tin
ft ft e* \ ^
3
^MIU
T;
^S^-
bUk
>™
-*•
x^N
5fcn>
• »*
<•CO • 00
I \
I &
I tin
I 5?
I K
I rt- 3
si «
W
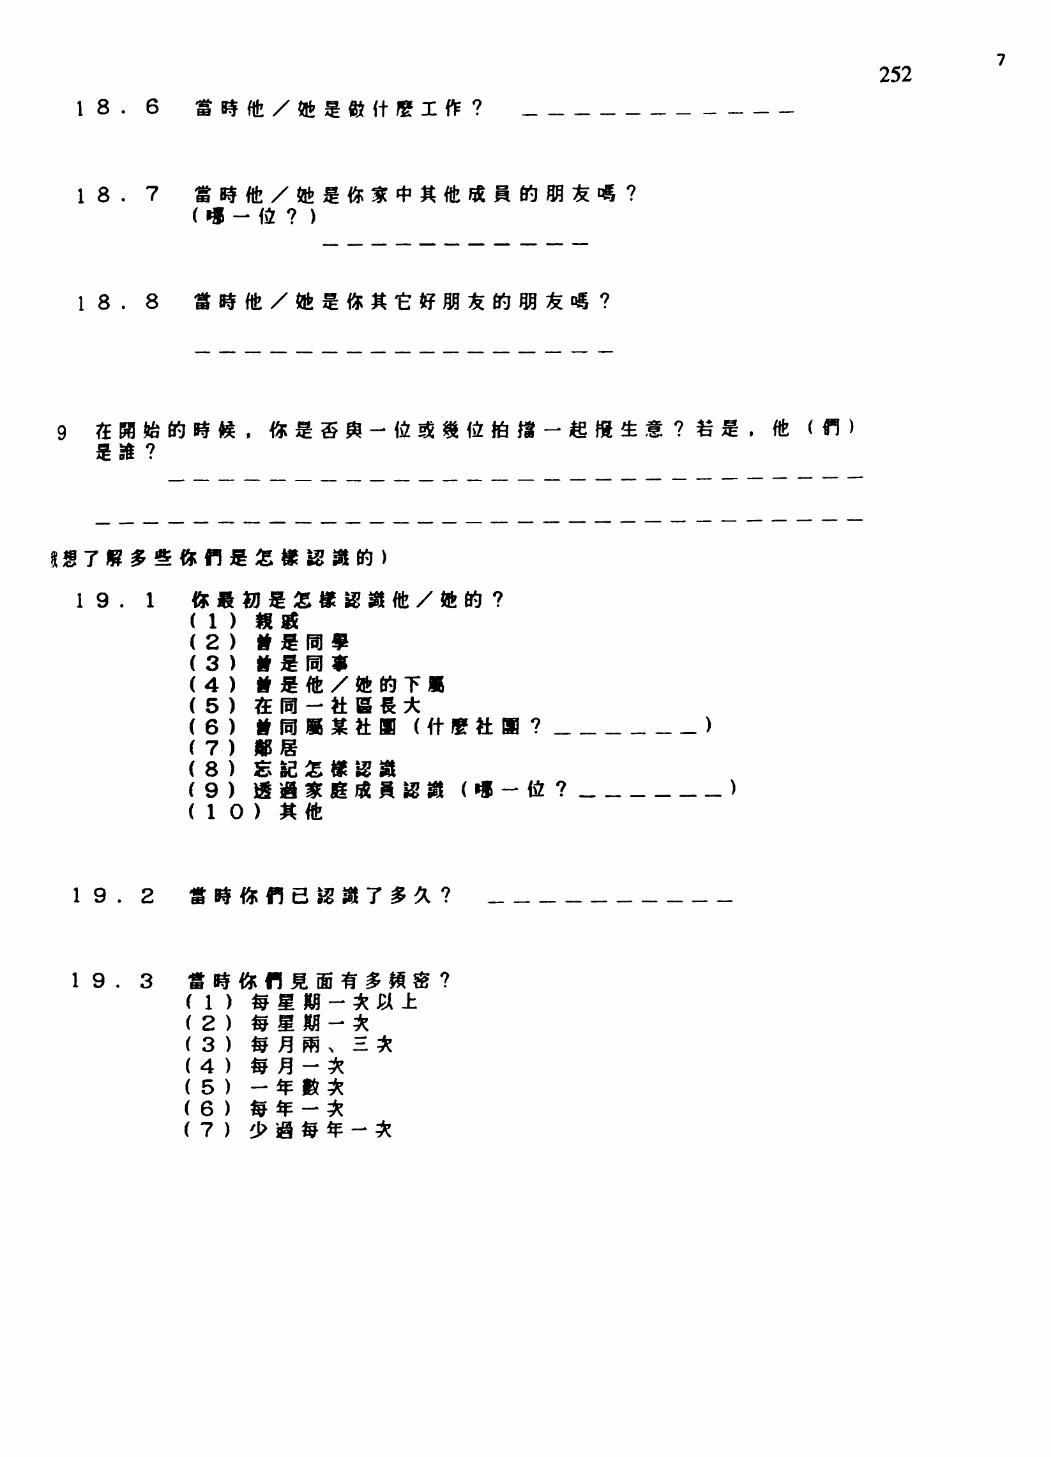
CO
CO CO
-o 0)
01 £»
• co r
o »-
I & I
I^*
I I
,
CO to 31 p
co
H-C
OO
O-J
m A t
IK 31 tin 3
\ & 3
3
I I
oo oo \ ^ fflD 5? ^t CT}
oo /HO JDQ 3
00 \ » flD
Si H
I I
Hf W fflQ
to
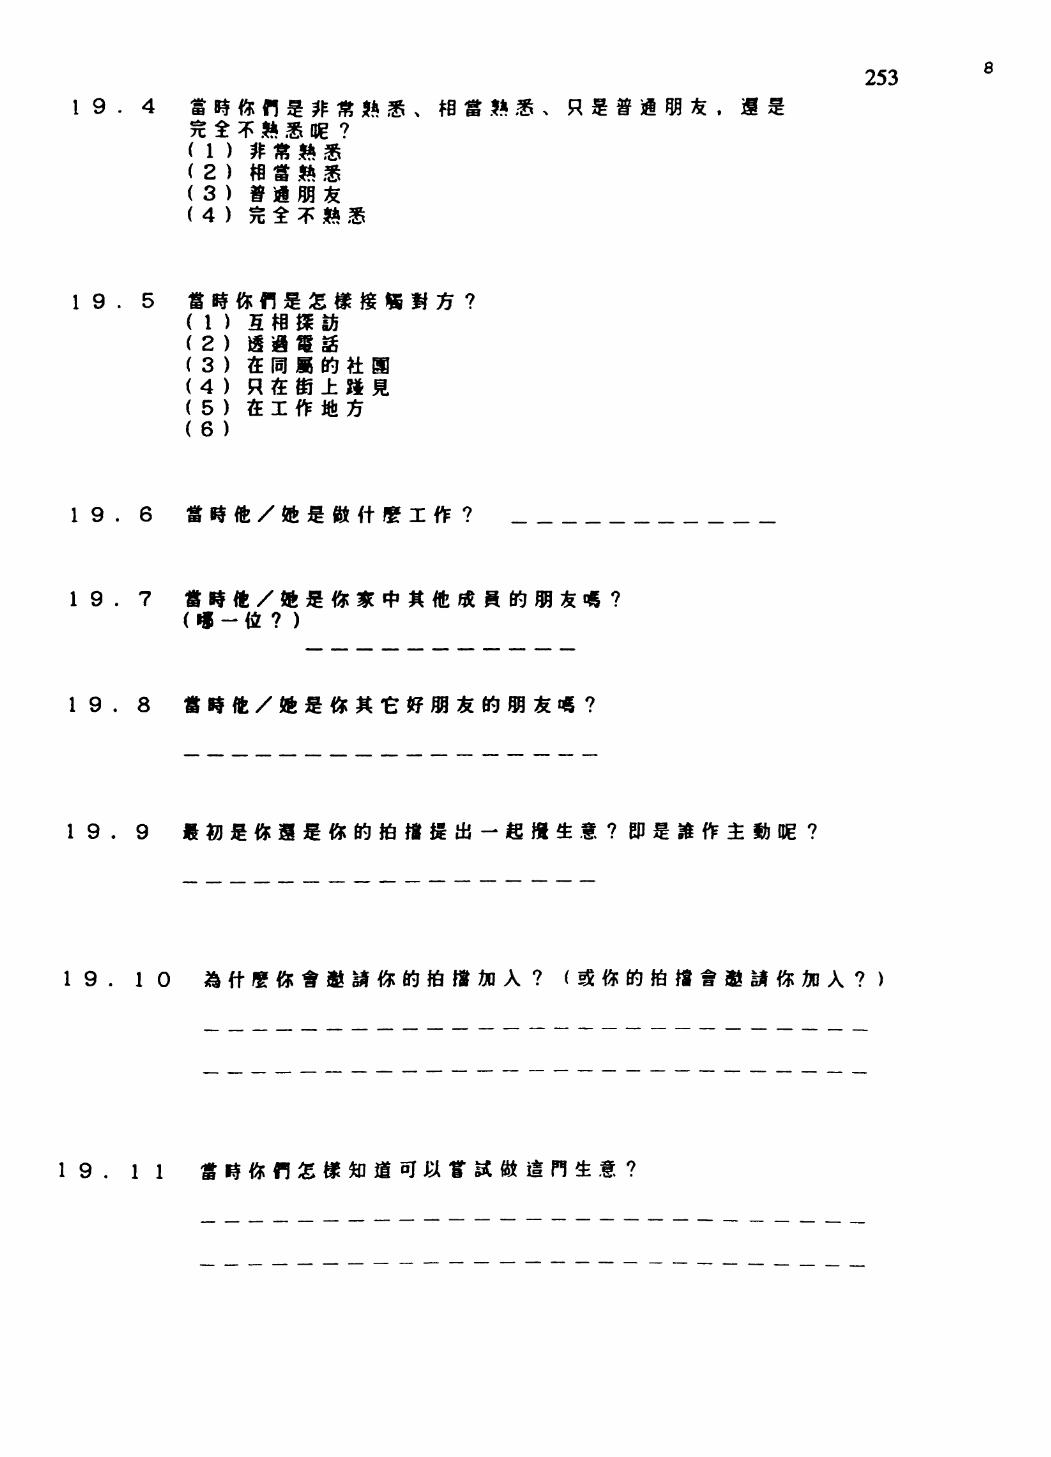
' e i
( i01 '61
6 -
6 '61
8 '61
L '61
9 * 6 T
§3 ft
( 9 )lS ( 9 ) #H ( t') feJ5 ( S ) 9. 9 ( 2 ) & 5 ( I )
9 ' 6 I
8
f ti ± ¥ £ ( fr )$i§PS ( 8 )S? « 9 « ( 2 )« «: tt ^ ( I )
6 SB » «f ± 5 2^^ ^ if Uf W & *' 6 i
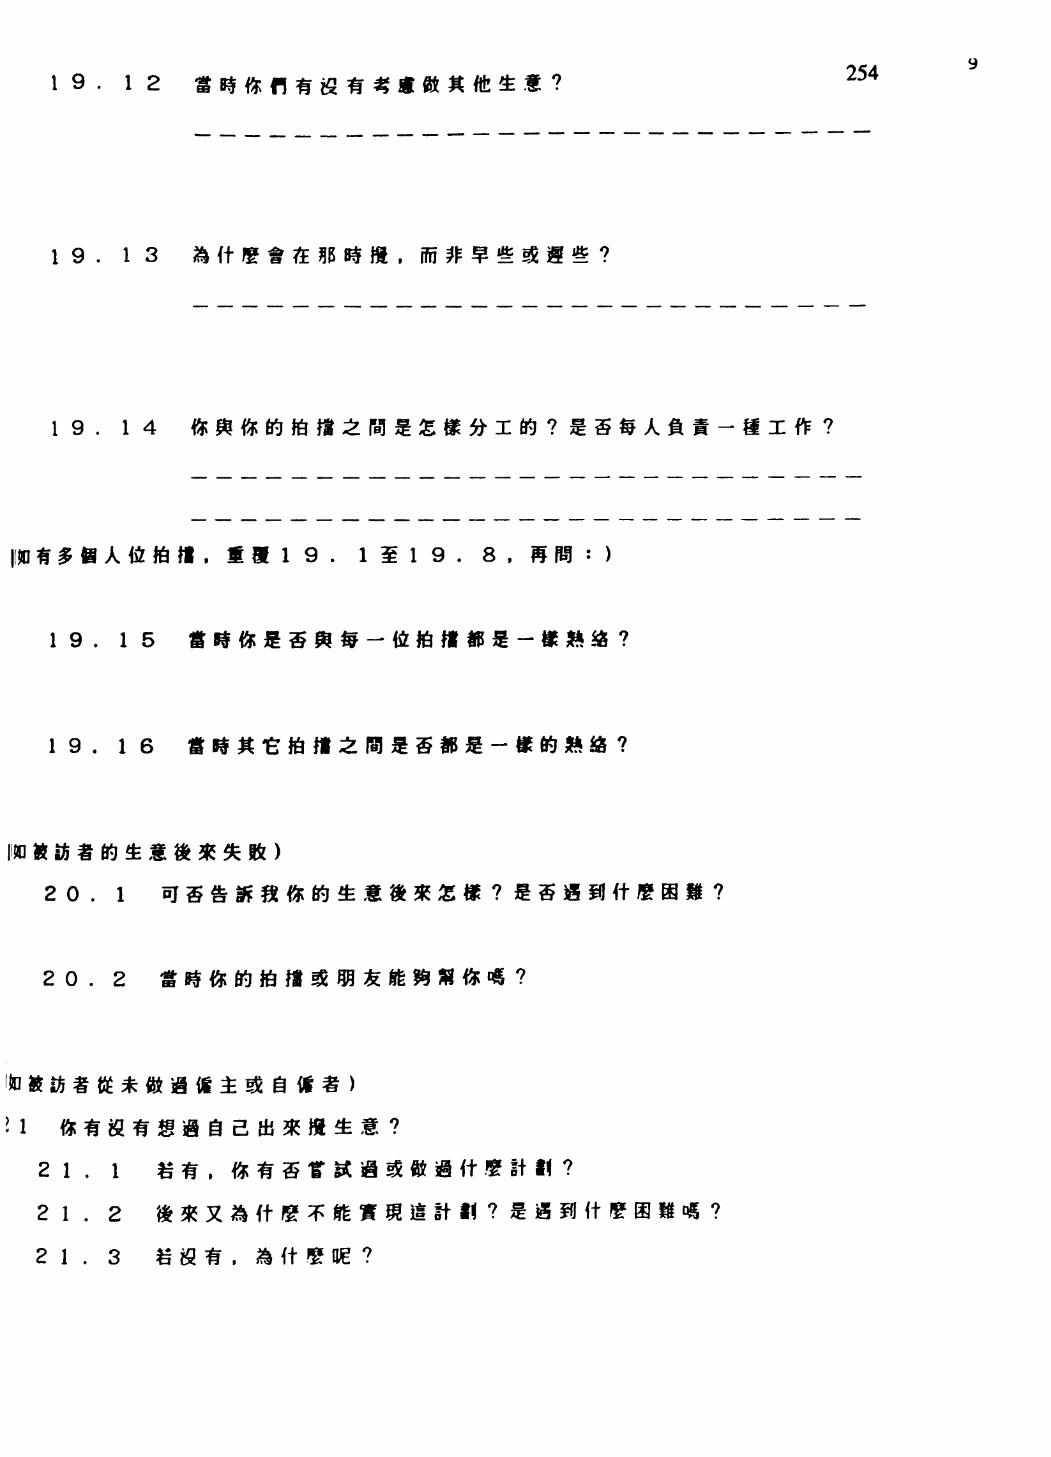
19. 12 254
19.13 & ft
19. 14
A & te » , 1 £ 1 9 . 1 M 1 9 . 8,
19. 15
19. 16
»20. 1
20. 2
it
21. i21.2
21.3 W . » It S BE ?
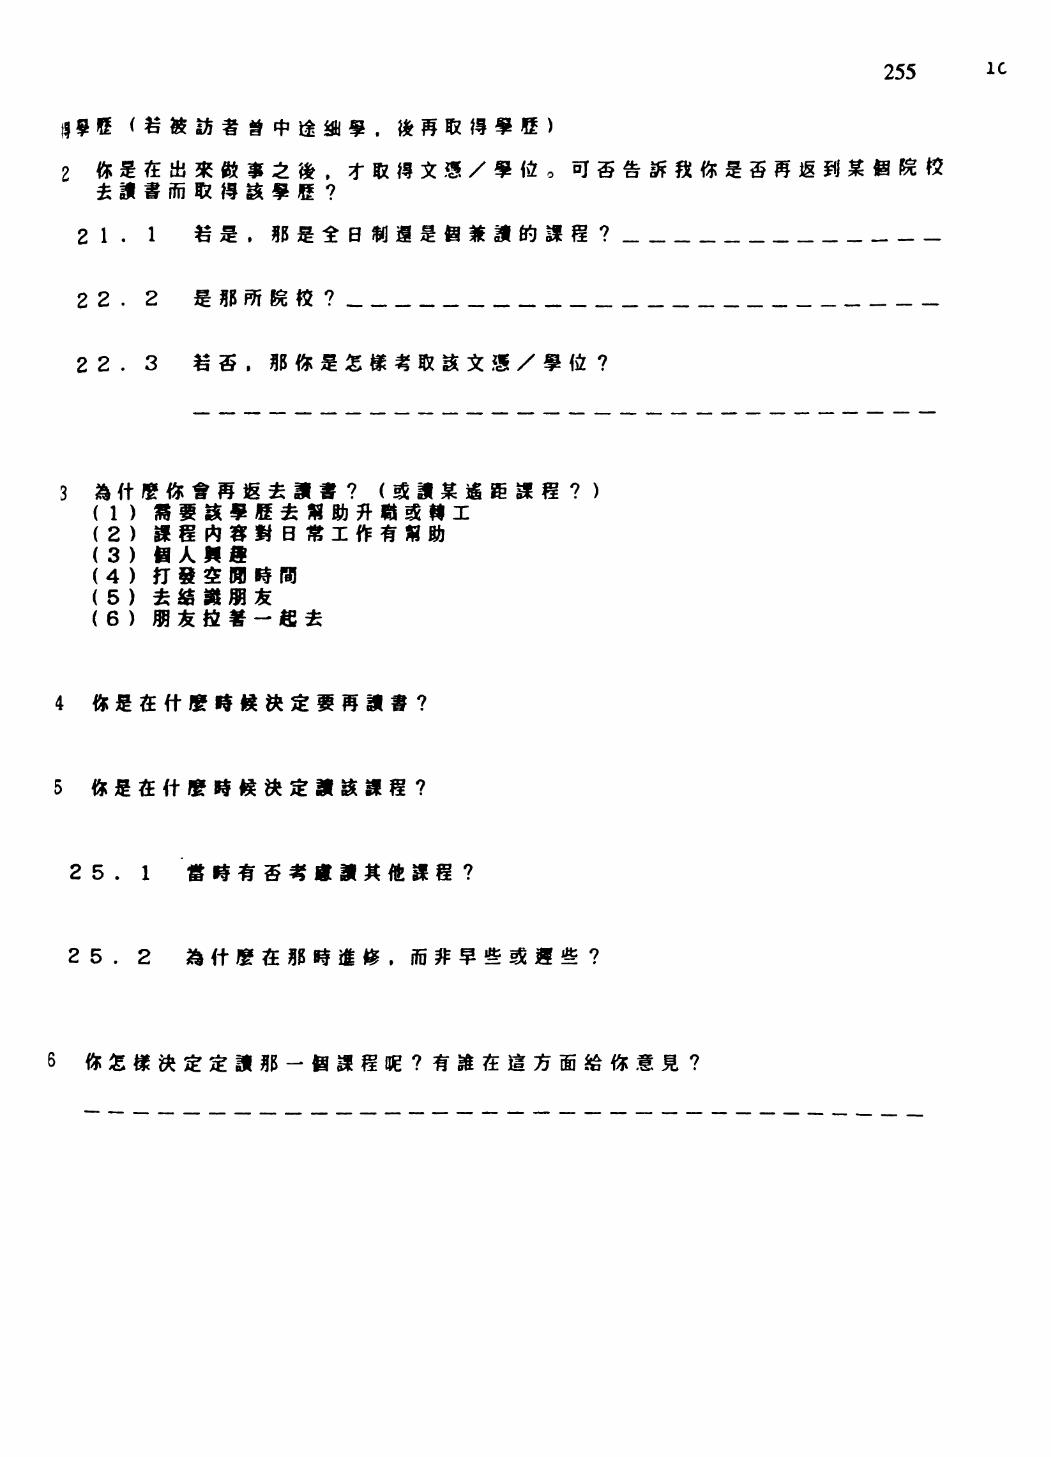
2
21.1
22.2
22.3
(1) ( 2 ) ( 3 )(4 )I O /(6) «*j
B
25.1
25.2
255 1C
Rtt
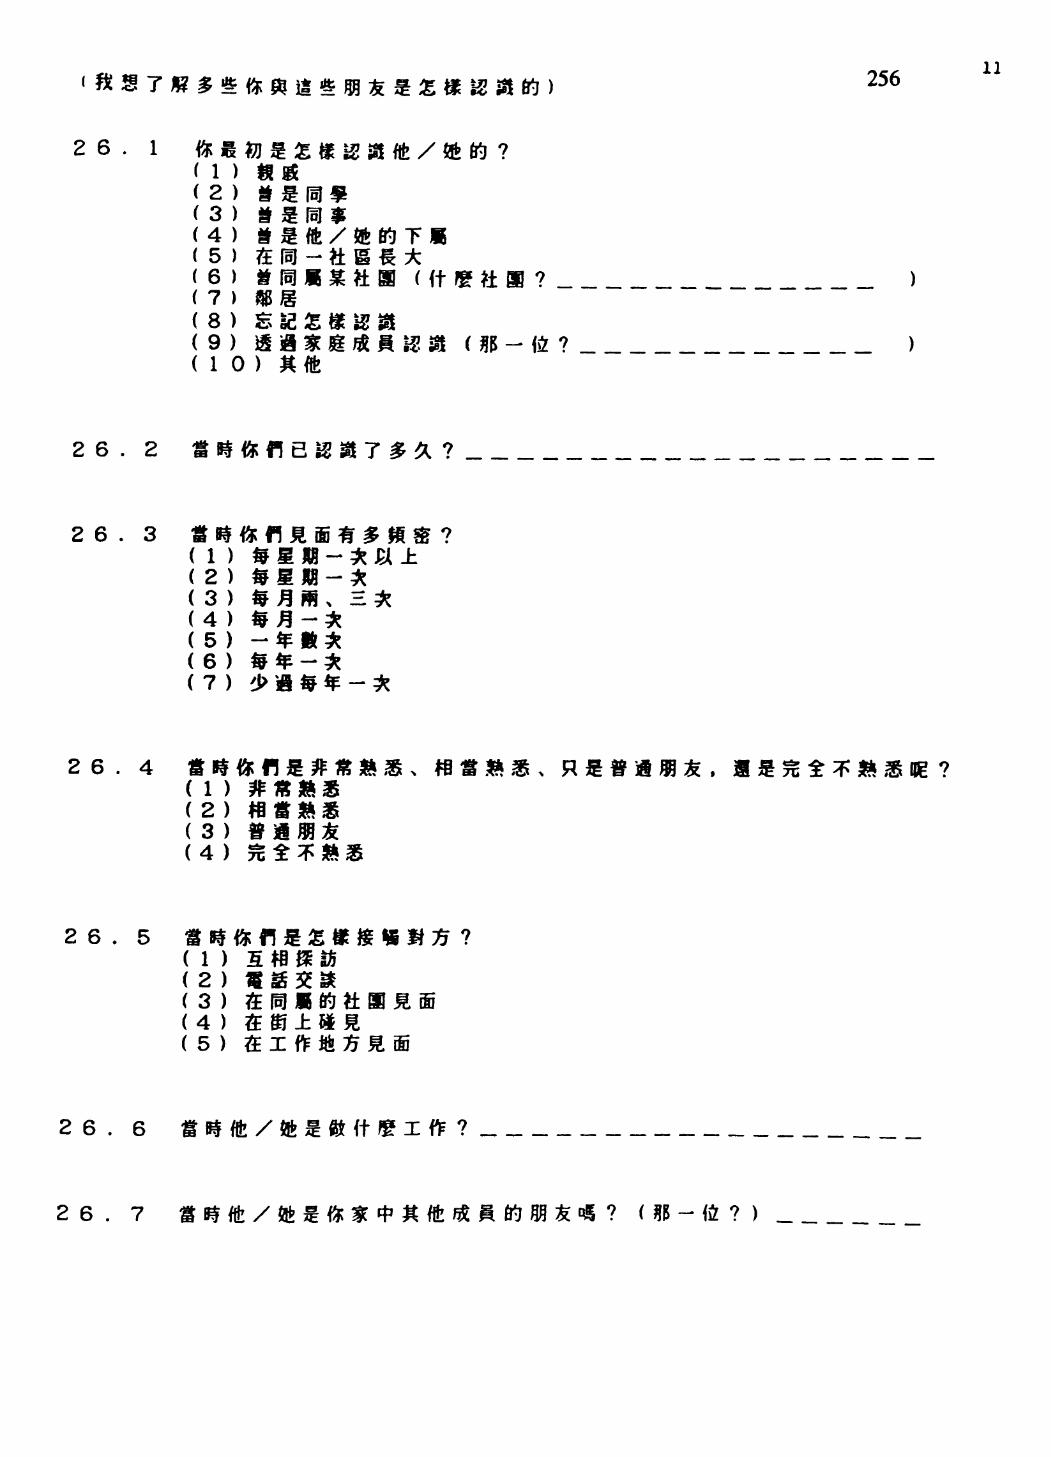
26.2
256 11
26. 1123
( 2 )( 3 ) ( 4 )4
567
)( 7 ) i ( 8 ) S ( 9 ) i! (10)
- (fi ?____________
26.3( 1 ) ( 2 ) ( 3 ) (4 )
56
( 5 ) -( ( 7
JB —
m
26.4
(2) ( 3 ) (4 )
26. 5( 1 )( 2 )( 3 )(4 )( 5 )
ffi JE
Mffi
26.6
26. 7 ? ( W - Ift ? ) ______
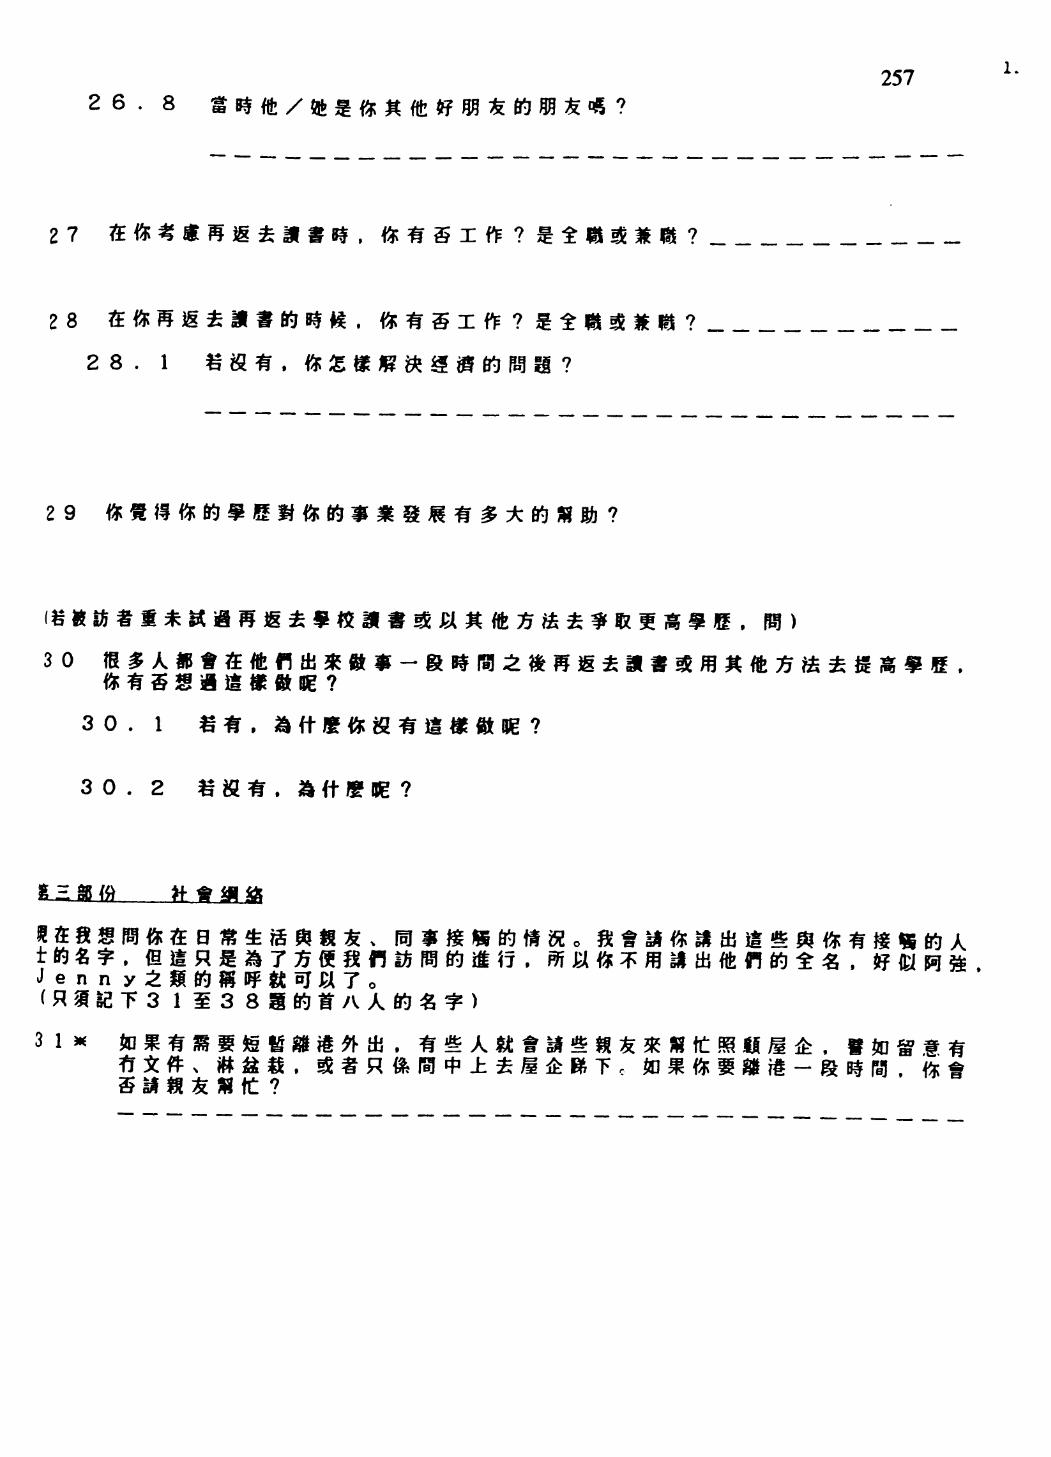
26. 8
27
28
28.
29
257
305 9 a it *
so.
30.2
0 A
3 i *-SEW.
«w
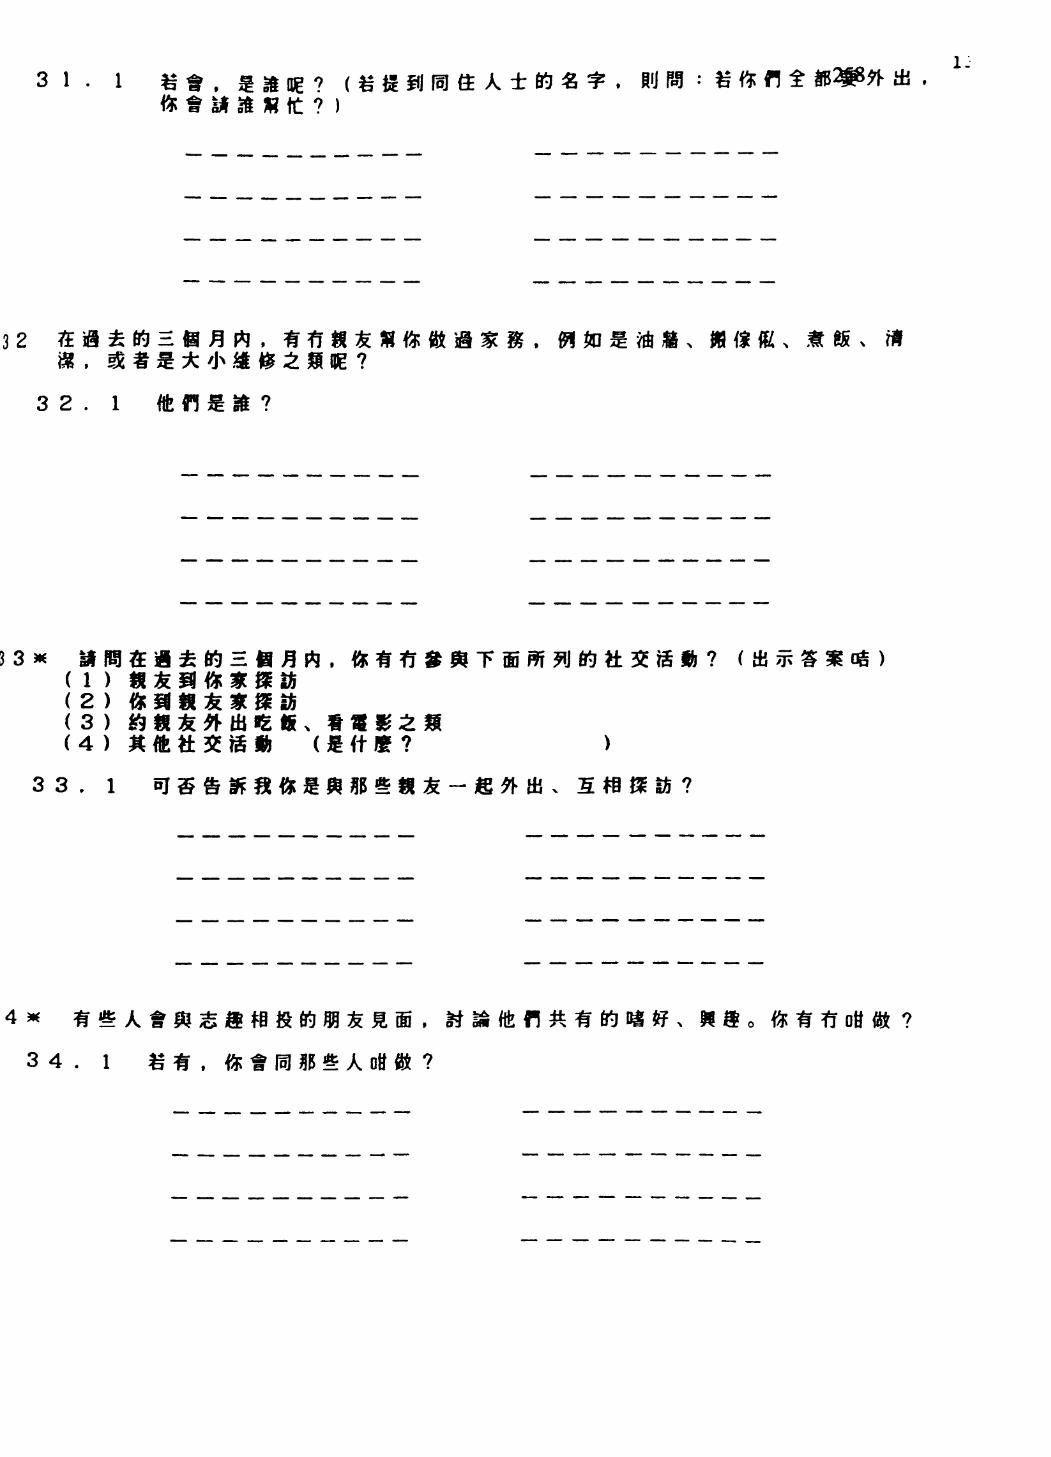
si- i . £ g ae ? ( € tz n $ » ft ? ): £ ft fl
1.
32
32.1
(2)(3)(4) ft
33. 1 Bj5&ffaftft*H*«*;&-tt*tfK
34. 1
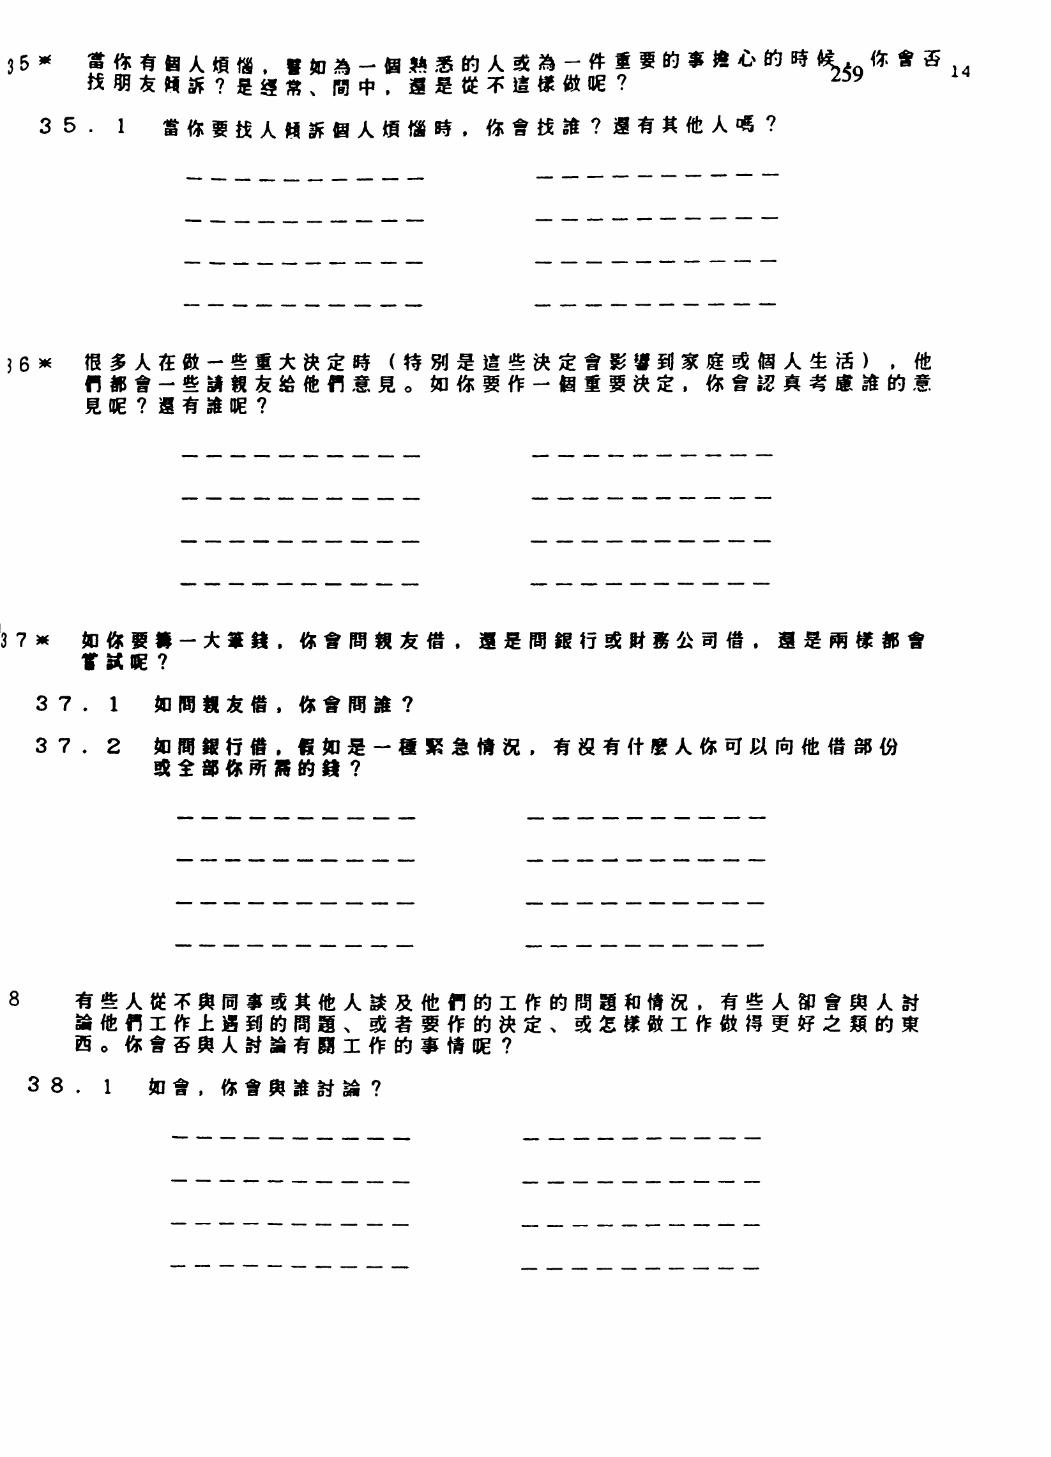
35*
35. 1
6 *
37.137. 2
A
8»ttfl:Ef|e±JBil» If m 9? to
38.1
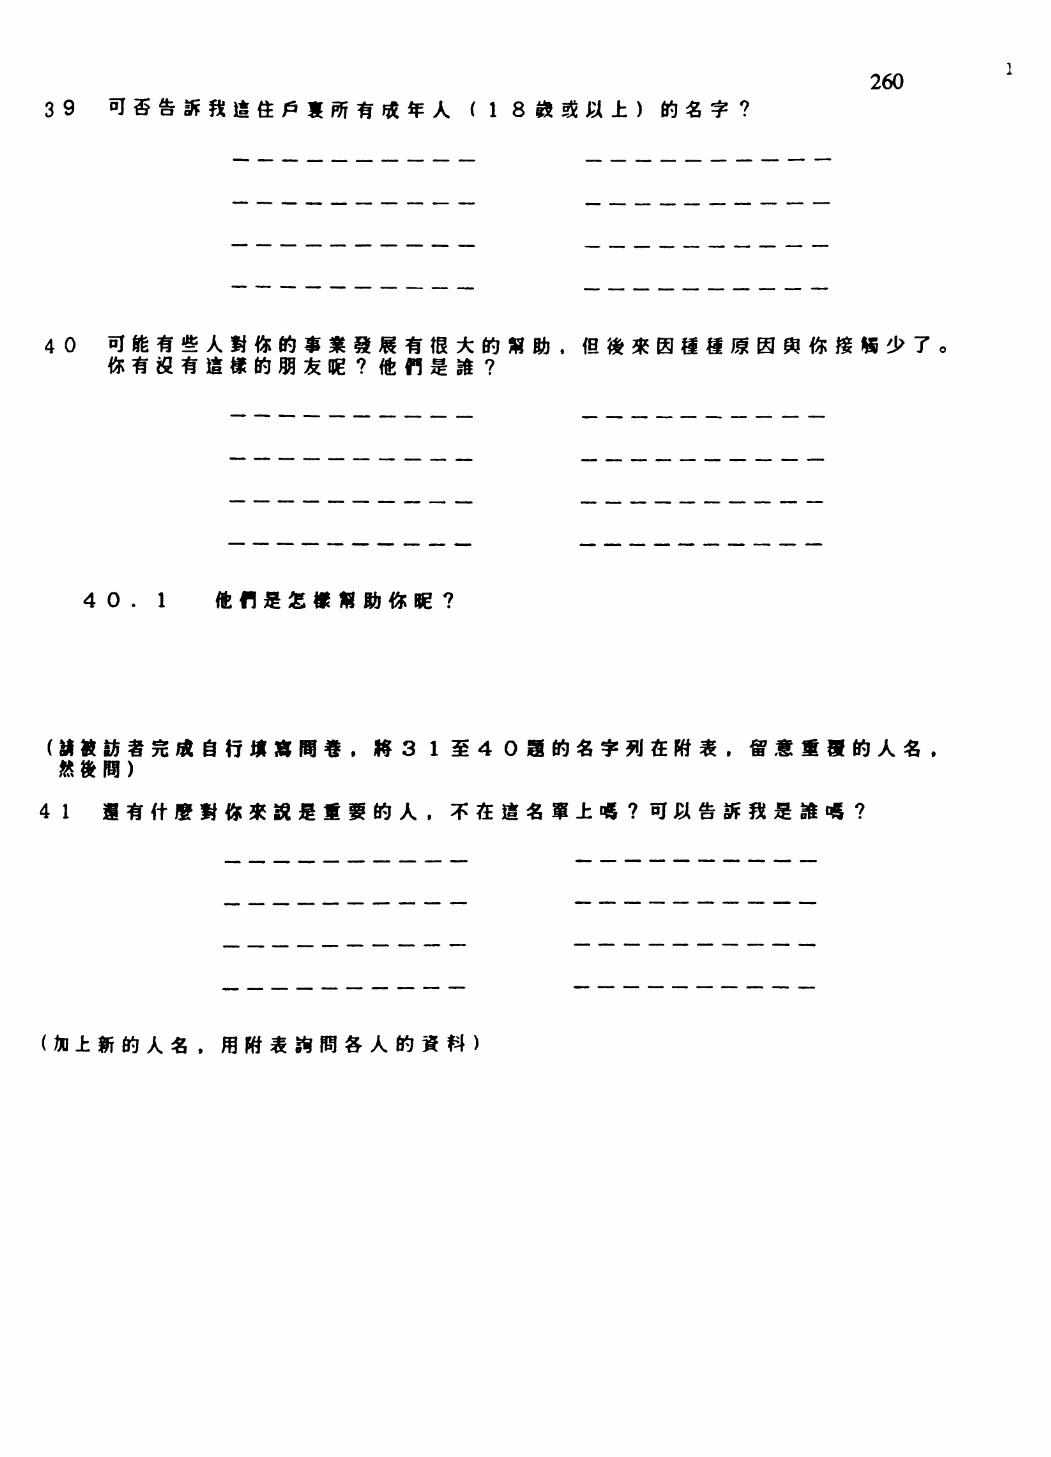
Y W A* T
y
I ' 0
0
092
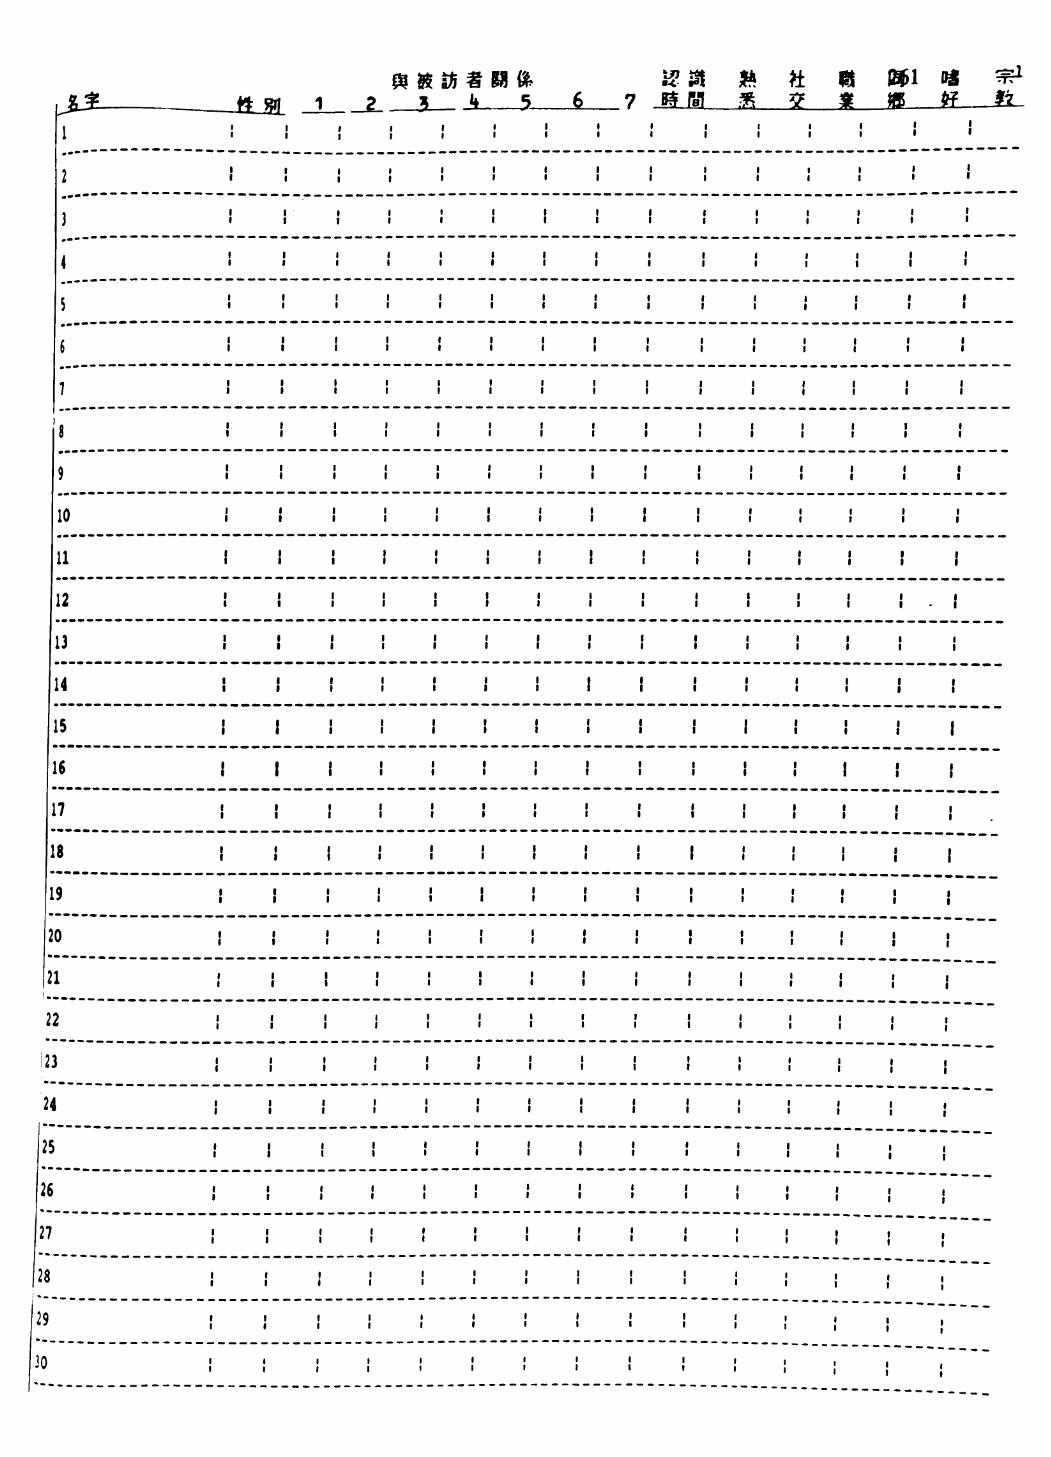
Of
8?
LI
9Z
9;
W.
tt!
I0
6
81
L\
9!
SI»**
H
CI
II
01
6
j|
i
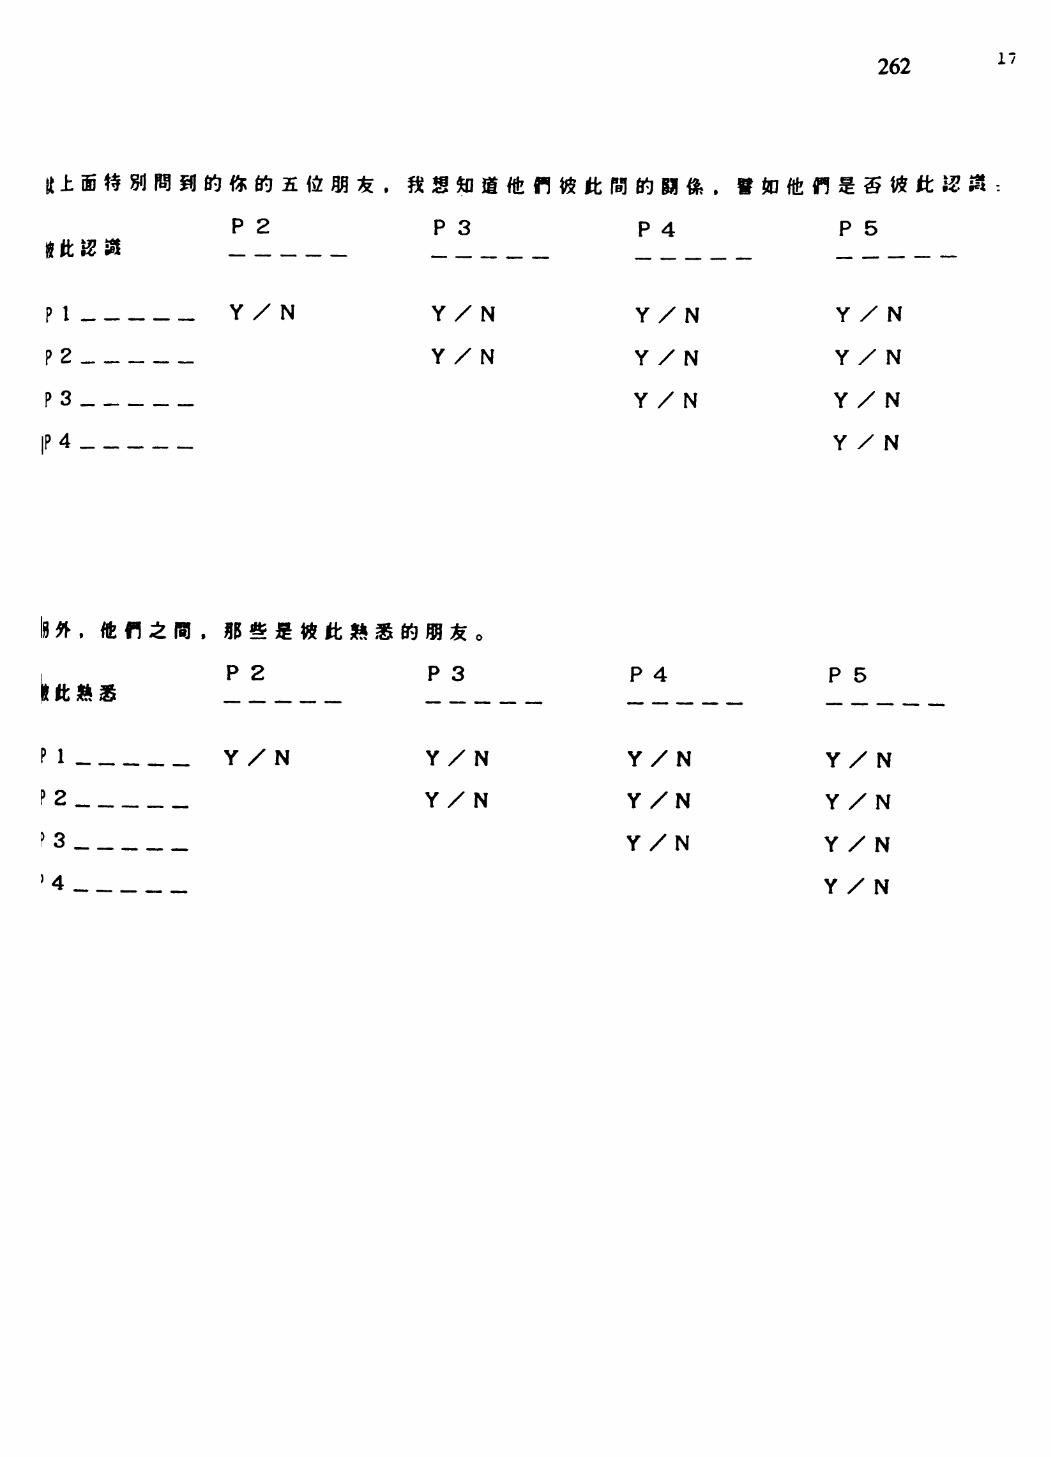
262 17
P 2
Pl______ Y/N
P2_____
P3_____
|P4______
P3 P4 P5
Y/N
Y/N
Y/N
Y/N
Y/N
Y/N
Y/N
Y/N
Y/N
10 * ,P2
Pl______ Y/N
P2_______
P3 ________
'4 ________
P 3
Y/N
Y/N
P 4
Y/N
Y/N
Y/N
P 5
Y/N
Y/N
Y/N
Y/N

42
43
44
263
ta
4 5
45.1
45.2
45. 3
AfTX ?
46
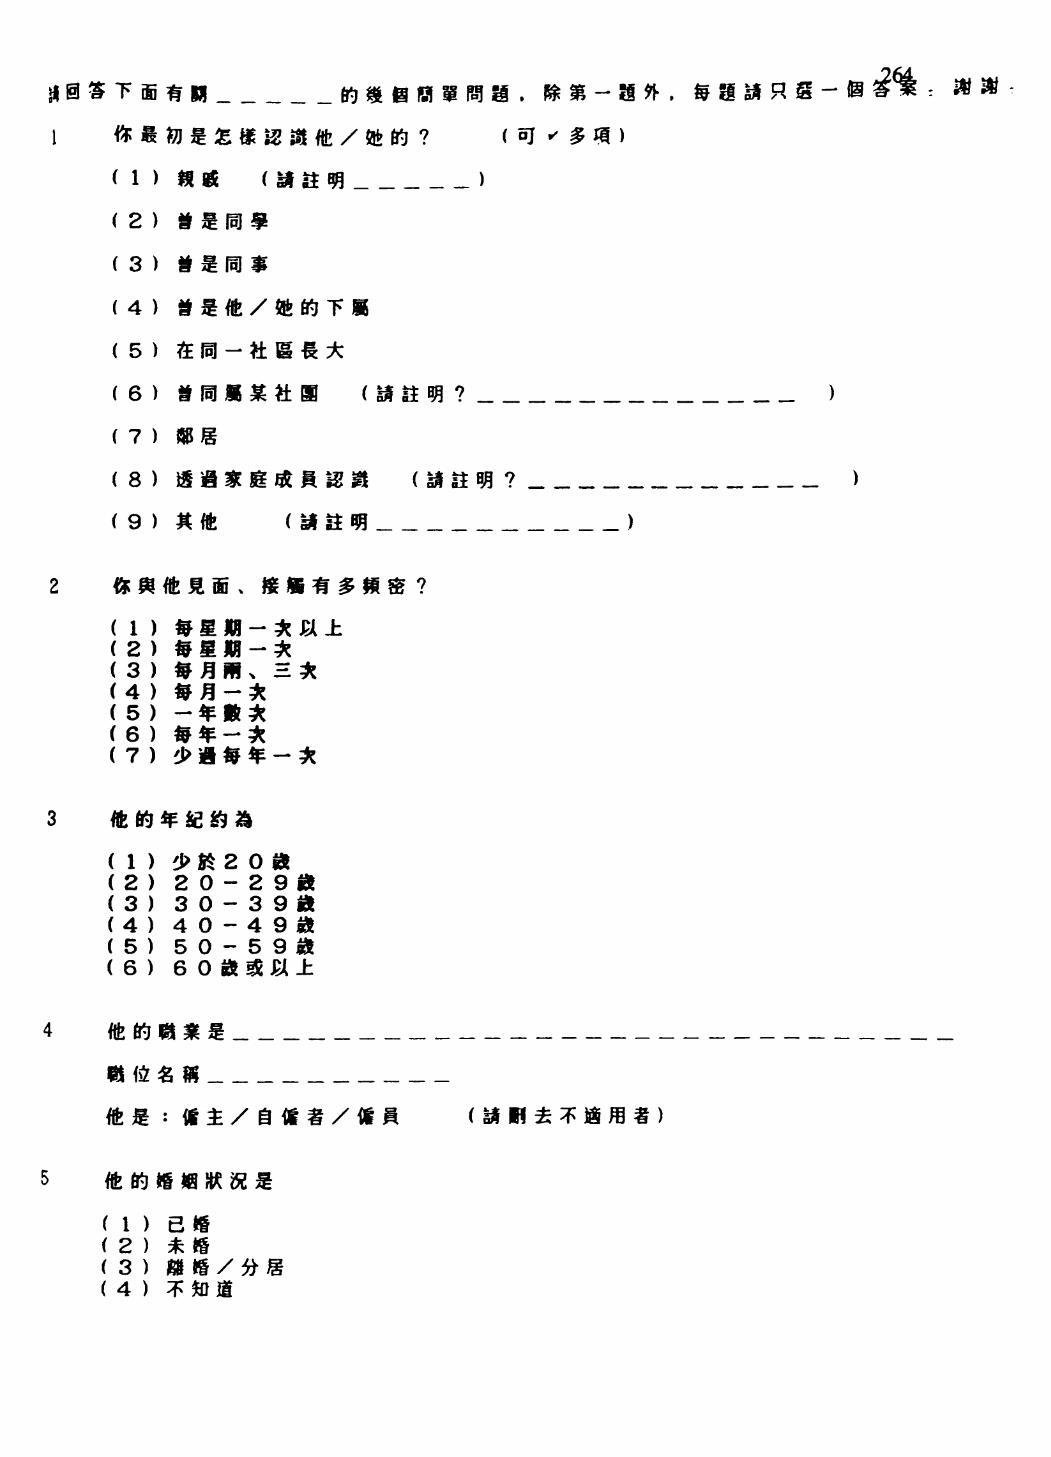
GOro
SI
a
f$
SIfin
K?
•• tit
ft m
Kf
I\
im
I
\
e* 3 & m
05O
1AG
OP
OH
-o>
oi ^
CO
CO H
-CD
00
05
01
SK
9
Mf
oo
oo
o^
an i
i i N
5ZC
DC
DC
DC
D»
1 1
BH
mKf
OK
HI a;
CO a*ai i
\ 3
ro
^-
flu m
5?
-HSU
B1
3"
aHf-
flffl a
NT
Ift
I
o,.
I I 3
$ •a
a -
~ «s XI KA I S
i
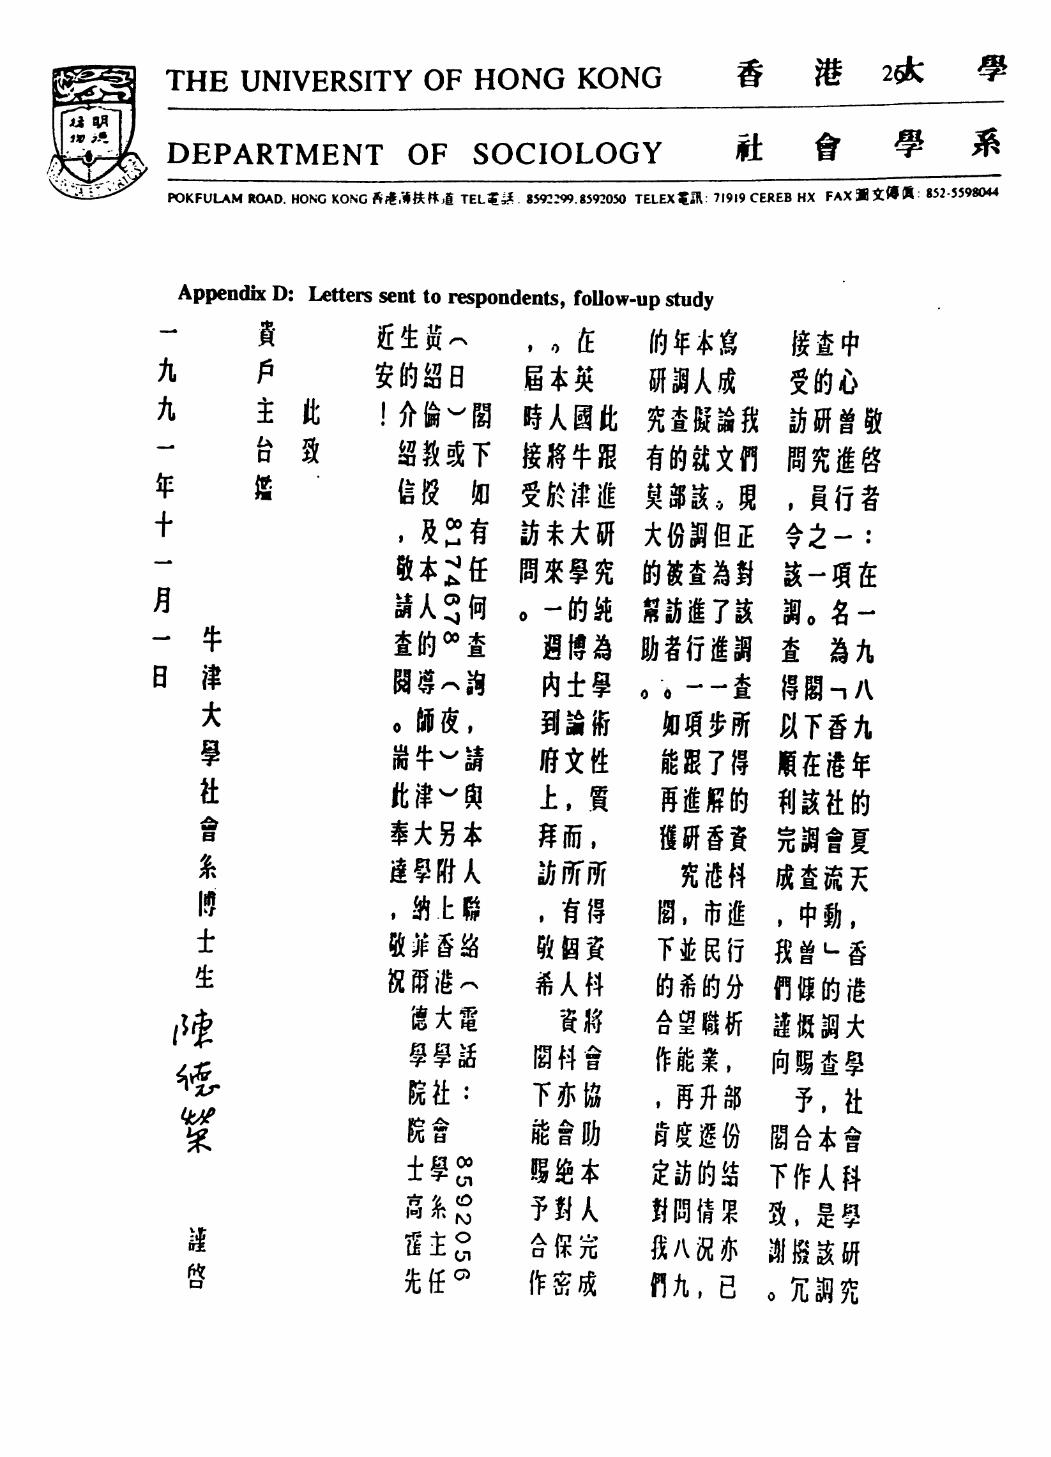
THE UNIVERSITY OF HONG KONG
DEPARTMENT OF SOCIOLOGY *tPOKFULAM ROAD. HONG KONGiG ffftffftttj TEL£i* 8592299.8592050 TELEX*JR: 71919 CEREB HX FAX»*»« 852-5598044
Appendix D: Letters sent to respondents, follow-up study
«- , o fc ft**fiAA
B ft *
aB
*IS±
gf
i ft !
&
jg-j^^
R t01
M
, lift»**»
8-JISw o fl "*
*m$% A
BXfi±, ISifi,
. tti , tft,
SOiS
?, it
TfUffflUa 1^ 70
A 3 *if* Hi! 7^ » LJ o Jb 6«1 7L
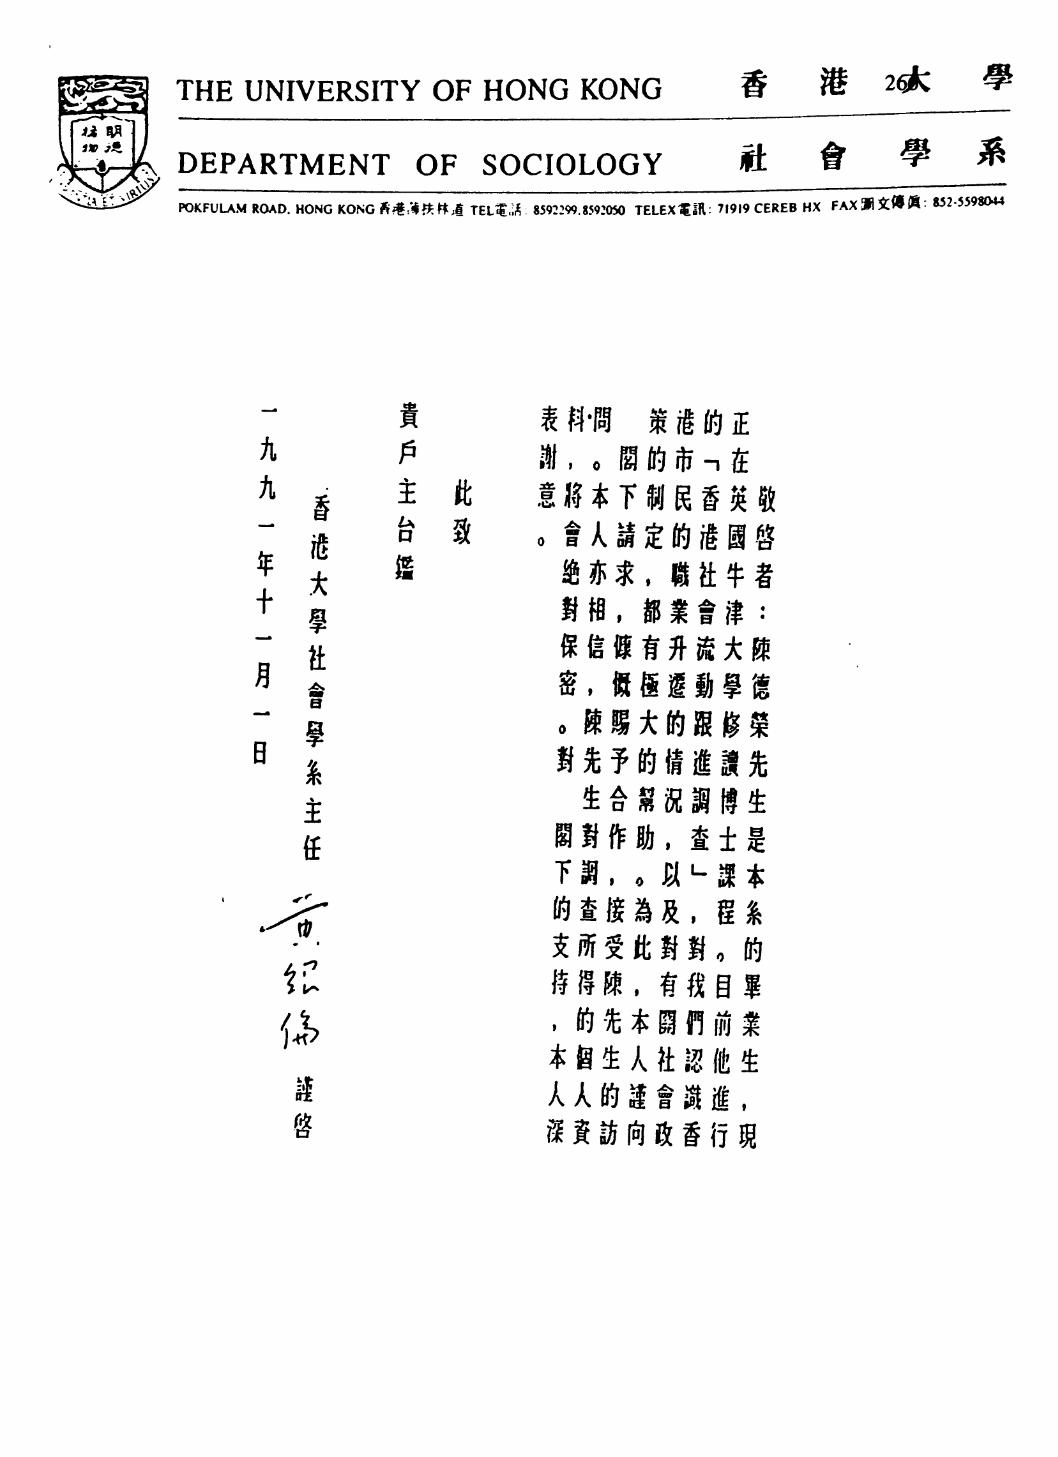
THE UNIVERSITY OF HONG KONGf3>
DEPARTMENT OF SOCIOLOGY *tPOKFULAM ROAD. HONG KONG IMM&K;! TEL^-i* 8592299.8592050 TELEX^IH: 71919 CEREB HX FAX»£<*«: 852-55980*4
KK
*I.
116 *
ft£U P
&
0
i a01B
i*
ff
h'7 U
if
tt65
-H
^WS^i
ff^tt, «±1T SB ,
e s « , f « a, 65 * * I fl iw* & 4 A a % It AAftltSl,

267
NUFFIELD COLLEGE OXFORD OXl INF
From: John H. Goldthorpe, Fil Dr, FBA, Official Fellow
July 15, 1991
To whom it may concern
This is to confirm that Mr. Chan Tak Wing is a graduate Student of Nuffieid College, University of Oxford, working for his D.Phil, degree under my supervision.
I would be most grateful if you would give him your full cooperation. I can testify to his discretion and competence.
Tel: direct: 0865-278559 secretary: 0865-278516 Fax: 0865-278621
signtaure removed
268
Bibliography
Abbott, A. (1983) "Sequences of Social Events: Concepts and Methods for the Analysis of Order in Social Processes", Historical Methods. 16:129-147.
——— (1990) "Conceptions of Time and Events in Social Science Methods: Causal and Narrative Approaches", Historical Methods. 23:140-150.
——— (1991) "The Order of Professionalization: An Empirical Analysis", Work and Occupations. 18:355-384.
——- (1992) "From Causes to Events: Notes on Narrative Positivism", Sociological Methods and Research. 20:428-455.
Abbott, A. and S. DeViney (1992) "The Welfare State as Transnational Event: Evidence from Sequences of Policy Adoption", Social Science History. 16:245-274.
Abbott, A. and J. Forrest (1986) "Optimal Matching Methods for Historical Sequences", Journal of Interdisciplinary History. 16:471-494.
Abbott, A. and A. Hrycak (1990) "Measuring Resemblance in Sequence Data: An Optimal Matching Analysis of Musicians' Careers", American Journal of Socjolegy., 96:144-185.
Baker, H.D.R. (1983) "Life in the Cities: the Emergence of the Hong Kong Man", China Quarterly. 95:469-79.
Balassa, B. (1981) The Newly Industrializing Countries in the World Economy. New York: Pergamon.
Berger, P.A., P. Steinmuller and P. Sopp (1993) "Differentiation of Life Courses? Changing Patterns of Labour-Market Sequences in West Germany", European Sociological Review. 9:43-61.
Berger, P.L. (1988) "An East Asian development model?", pp.3-11 in In search of an East Asian development model, edited by P. Berger and M. H-H. Hsiao, New Jersey: Transaction Press.
Blalock, H.M. (1991) Understanding Social Inequality: Modeling Allocation Process, Newbury Park, CA.: Sage.
Blau, P.M. and O.D. Duncan (1967) The American Occupational Structure. New York: Wiley.
Boot, E. (197H Family and Social Network, rev.ed., London: Tavistock.
Broom, L. and J.H. Smith (1963) "Bridging Occupations", British Journal of Sociology. 14:321-334.
Bulmer, M. (1989) "Theory and Method in Recent British Sociology: Whither the Empirical Impulse?", British Journal of Sociology. 40:393-417.
269
Burawoy, M. (1977) "Social Structure, Homogenization, and the Process of Status Attainment in the United States and Great Britain 11 , American Journal of Sociology. 82:1031-42.
Bums, V. (1992) "Late Industrialization and Class Formation in East Asia", Research in Political Economy. 13:245-283.
Burt, R.S. (1992) Structural Holes: The Social Structure of Competition. Cambridge, MA: Harvard University Press.
Castells, M., L. Goh and R.Y-W. Kwok (1990) The Shek Kip Mei Syndrome: Economic Development and Public Housing in Hong Kong and Singapore. Pion.
Census and Statistics Department, Hong Kong (1983) Social Data Collected by the General Household Survey: Special Topics Report No.I. Hong Kong: Government Printer.
——— (1984) Social Data Collected by the General Household Survey: Special Topics Report No.II. Hong Kong: Government Printer.
——— (1990) Survey of Industrial Production. Hong Kong: Government Printer.
——— (1991) Social Data Collected by the General Household Survey: Special Topics Report No. VII. Hong Kong: Government Printer.
Chancy, D.C. and D. Podmore (1973) Young Adults in Hong Kong: Attitudes in a Modernizing Society. Hong Kong: Centre of Asian Studies, University of Hong Kong.
Chung, Y.P. and R.Y.C. Wong, eds. (1992) The Economics and Financing of Hong Kong Education. Hong Kong: Chinese University Press.
Coleman, J.S. (1988) "Social Capital in the Creation of Human Capital", American Journal of Sociology. 94:S95-S120.
Cooney, T.M. and P. Uhlenberg (1992) "Support from Parents over the Life Course: The Adult Child's Perspective", Social Forces. 71:63-84.
Davis, D (1992) "Job Mobility in Post-Mao Cities: Increases on the Margins", China Quarterly. 132:1062-1085.
Deyo, F.C., ed. (1987) The Political Economy of the New Asian Industrialism. Ithaca: Cornell University Press.
Elster, J. (1983) Soup Grapes: Studies in the Subversion of Rationality. Cambridge: Cambridge University Press.
Erikson, R. and J.H. Goldthorpe (1987a) "Commonality and Variation in Social Fluidity in Industrial Nations. Part I: a Model for Evaluating the 'FJH hypothesis'". European Sociological Review. 1:1-22.
——— (1987b) "Commonality and Variation in Social Fluidity in Industrial Nations.
270
Part H: the Model of Core Social Fluidity Applied", European Sociological Review. 3:145-66.
—---- (1992a) Constant Flux: A Study of Class Mobility in Industrial Societies. Oxford: Clarendon Press.
—— (19925) "The CASMIN project and the American Dream", European Sociological Review. 8:283-306.
Erikson, R., J.H. Goldthorpe, and L. Portocarero (1979) "Intergenerational Class Mobility in Three Western European Societies: England, France, and Sweden", British Journal of Sociology. 30:415-41.
——— (1982) "Social Fluidity in Industrial Nations: England, France, and Sweden", British Journal of Sociology. 33:1-34.
Evans, P.B. (1987) "Class, State, and Dependence in East Asia: Lessons for Latin Americanists", pp.203-226, in The Political Economy of the New Asian Industrialism, edited by F.C. Deyo, Ithaca: Cornell University Press.
Evans, P.B. and J.D. Stephens (1988) "Development and the World Economy", pp.739-774, in Handbook of Sociology, edited by NJ. Smelser, Newbury Park, CA.: Sage.
Featherman, D.L., F.L. Jones and R.M. Mauser (1975) "Assumptions of Social Mobility Research in the U.S.: the Case of Occupational Status", Social Science Research. 4:329-60.
Featherman, D.L. and L.K. Selbee (1988) "Class Formation and Class Mobility", pp.247-264 in Social Structure and Human Lives, edited by M.W. Riley, Newbury Park, CA.: Sage.
Featherman, D.L. and A. Sorensen (1983) "Societal Transformation in Norway and Change in the life Course Transition into Adulthood", Acta Sociologica. 26:105-126.
Fischer, C.S. (1982) To Dwell among Friends: Personal Networks in Town and City. Chicago: University of Chicago Press.
Flap, H.D. and N.D. De Graaf (1988) "'With a Little Help from My Friends': Social Resources as an Explanation of Occupational Status and Income in West Germany, the Netherlands, and the United States", Social Forces. 67:452-72.
Gaertner, K.N. (1990) "The Structure of Organizational Careers", pp. 135-154 in Social Mobility and Social Structure, edited by R.L. Breiger, Cambridge: Cambridge University Press.
Ganzeboom, H.B.G., R. Luijkx and D.J. Treiman (1989) "Intergenerational Class Mobility in Comparative Perspective", Research in Social Stratification and Mobility. 8:3-84.
Gereffi, G. and D.L. Wyman, eds. (1990) Manufacturing Miracles T Princeton: Princeton University Press.
271
Gershuny, J. (1993) "Post-Industrial Career Structures in Britain", pp. 136-170 in Changing Classes: Stratification and Mobility in Post-Jndiistrial Societies, edited by G. Esping-Andersen, London: Sage.
Goldthorpe, J.H. (1987) Social Mobility and Class Structure in Modern Britain. 2nd edition, Oxford: Clarendon Press.
——— (1985) "On Economic Development and Social Mobility", British Journal of Sociology 36:549-73.
Granovetter, M.S. (1973) "The Strength of Weak Ties", American Journal of Sociology, 78:1360-380.
——— (1974) Getting a Job. Cambridge, MA.: Harvard University Press.
........ (1983) "The Strength of Weak Ties: A Network Theory Revisited",Sociological Theory. 1:201-33.
——— (1985) "Economic Action and Social Structure: The Problem of Embeddedness", American Journal of Sociology. 91:481-510.
Grusky, D.B. and R.M. Mauser (1984) "Comparative Social Mobility Revisited: Models of Convergence and Divergence in 16 Countries", American Sociological Review. 49:19-38.
Halpin, B. (1993) "Life-History Data and Social Mobility: Analyzing Change in Mobility During the Worklife", unpublished D.Phil, thesis, University of Oxford.
Hambro, E. (1955) The Problem of Chinese Refugees in Hong Kong: Report Submitted to the United Nations High Commissioner for Refugees. Holland: Sijthoff.
Ho, D.K.L. (1989) "The Political Economy of Public Housing: A Sociological Analysis", unpublished M.Phil, thesis, University of Hong Kong.
Hogan, D.P. (1978) "The Variable Order of Events in the Life Course", American Sociological Review. 43:573-586.
——— (1981) Transitions and Social Change: The Early Lives of American Men. New York: Academic Press.
Hong Kong Government (1967) Kowloon Disturbances. 1966: Report of Commission of Inquiry. Hong Kong: Government Printer.
Hout, M. (1983) Mobility Tables. Beverly Hills, CA.: Sage.
Hout, M. and J.A. Jackson (1986) "Dimensions of Occupational Mobility in the Republic of Ireland", European Sociological Review. 2:114-37.
Hout, M. and R.M. Hauser (1992) "Symmetry and Hierarchy in Social Mobility: A Methodological Analysis of the CASMIN model of Class Mobility", European Sociological Review. 8:239-266.
272
Ishida, H., J.H. Goldthorpe and R. Erikson (1991) "Intergenerational Class Mobility in Postwar Japan", American Journal of Sociology. 96:954-92.
Jackson, B. and D. Marsden (1962) Education and the Working Class- Some General Themes Raised bv a Study of 88 Working-Class Children in a Northern Industrial City. London: Routledge & Kegan Paul.
Jones, F.L. (1969) "Social Mobility and Industrial Society: A Thesis Reexamined", Sociological quarterly. 292-305.
——— (1992) "Common Social Fluidity: A Comment on Recent Criticisms", European Sociological Review, 8:233-238.
Keller, S. (1953) "The Social Origins and Career Lines of Three Generations of American Business Leaders", unpublished Ph.D. Thesis, Department of Sociology, Columbia University.
Kerckhoff, A.C. (1990) Getting Started: Transition to Adulthood in Great Britain. Boulder, Colorado: Westview Press.
——— (1993) Diverging Pathways: Social Structure and Career Deflections. Cambridge: Cambridge University Press.
Koo, H. (1990) "From Farm to Factory: Proletarianization in Korea", American Sociological Review. 55:669-681.
Lau, S.K. (1982) Society and Politics in Hong Kong. Hong Kong: Chinese University Press.
Lau, S.K. and K.F. Ho (1982) "Social Accommodation of Politics: the Case of the Hong Kong Young Workers", Journal of Commonwealth and Comparative Politics, 20:172-88.
Lau, S.K. and H.C. Kuan (1988) The Ethos of Hong Kong Chinese. Hong Kong: Chinese University Press.
Lee, M.K. (1982) "Emerging Patterns of Social Conflicts", pp.22-31 in Hong Kong in the 1980s, edited by J.Y.S. Cheng, Hong Kong: Summerson Educational Research Centre.
Lin, N., W.M. Ensel and J.C. Vaughn (1981) "Social Resources and Strength of Ties: Structural Factors in Occupational Status Attainment", American Sociological Review. 46:393-405.
Lipset, S.M. and H.L. Zetterberg (1959) "Social Mobility in Industrial Societies", pp. 11-75, in Social Mobility in Industrial Society, edited by S. Lipset and R. Bendix, Berkeley, CA.: University of California Press.
Lui, T.L. and S.Chiu (1993) "Industrial Restructuring and Labour-Market Adjustment under Positive Noninterventionism: The Case of Hong Kong", Environment and Planning A. 25:63-79.
Marsden, P.V. and J.S. Hurlbert (1988) "Social Resources and Mobility Outcome:
273
A Replication and Extension", Social Forces. 66:1038-1059.
Mayer, K.U. and N.B. Tuma, eds. (1990) Event History Analyst in Life Course Research. Madison, Wisconsin: The University of Wisconsin Press.
Mitchell, R.E. (1972) Pupil. Parent and School: A Hong Kong Study. Taipei: Orient Cultural Service.
Montgomery, J.D (1991) "Social Networks and Labor-Market Outcomes: Toward an Economic Analysis", American Economic Review. 81:1408-18.
—-— (1992) "Job Search and Network Composition: Implications of the Strength-of- Weak-Ties Hypothesis", American Sociological Review. 57:586-96.
Mosteller, F. (1968) "Association and Estimation in Contingency Tables", Journal of the American Statistical Association. 63:1-28.
Parkin, F. (1971) Class Inequality and Political Order: Social Stratification in Capitalist and Communist Societies. Paladin.
Pong, S-L. and D. Post (1991) "Trends in Gender and Family Background Effects on School Attainment: The Case of Hong Kong", British Journal of Sociology. 42:249-271.
Raub, W. and J. Wessie (1990) "Reputation and Efficiency in Social Interactions: An Example of Network Effects", American Journal of Sociology. 96:626-54.
Rees, A. and G.P. Shultz (1970) Workers and Wages in an Urban Labor Market. Chicago: University of Chicago Press.
Rindfuss, R.R., C.G. Swicegood and R.A. Rosenfeld (1987) "Disorders in the Life Course: How Common and Does it Matter?" American Sociological Review. 52:785-801.
Rosenbaum, J.E. (1979) "Tournament Mobility: Career Patterns in a Corporation", Administrative Science Quarterly. 14:220-241.
Rossi, A.S. and P.H. Rossi (1990) Of Human Bonding: Parent-Child Relations Across the Life Course. New York: Aldine De Gruyter.
Schiffer, J.R. (1991) "State Policy and Economic Growth: A Note of the Hong Kong Model", International Journal of Urban and Regional Research. 15:180-196.
Salaff, J.W. (1981) Working Daughters of Hong Kong: Filial Piety or Power in the Family?. Cambridge: Cambridge University Press.
Scott, I. (1989) Political Change and the crisis of legitimacy in Hong Kong. Hong Kong: Oxford University Press.
Sen, Y-S. and H. Koo (1992) "Industrial Transformation and Proletarianization in Taiwan", Critical Sociology. 19:45-67.
Sit, V.F.S. (1981) Urban Hong Kong. Hong Kong: Summerton Educational Research
274
Centre.
Sit, V.F.S. and S.L. Wong (1989) Small and Medium Industries in an Exoorti Oriented Economy: the Case of Hong Kong. Hong Kong: Centre of Asian Studies, University of Hong Kong.
Siu, H.F. (1988) "Immigrants and Social Ethos: Hong Kong in the Nineteen- Eighties", Journal of the Hong Kong Branch of the Roval Asiatic Society. 26:1-16.
Skvoretz, J. (1984) "The Logic of Opportunity and Mobility", Social Forces. 63:72- 97.
Sorensen, A.B. (1974) "A Model for Occupational Career", American Journal of Sociology. 80:44-57.
——— (1975) "The Structure of Intragenerational Mobility", American Sociological Review. 40:456-71.
——— (1977) "The Structure of Inequality and the Process of Attainment", American Sociological Review. 42:965-78.
——— (1979) "A Model and a Metric for the Analysis of the Intragenerational Status Attainment Process", American Journal Sociology. 85:361-84.
——— (1986) "Theory and Methodology in Social Stratification", pp.69-95 in Sociology from Crisis to Science?, vol 1, edited by U. Himmelstrand, London: Sage.
Sorensen, A.B. and N.B. Tuma (1981) "Labor Market Structures and Job Mobility", Research in Social Stratification and Mobility. 1:67-94.
Sorensen, A.B. and H-P. Blossfeld (1989) "Socioeconomic Opportunities in Germany in the Post-War Period", Research in Social Stratification and Mobility. 8:85- 106.
Sorensen, A.B., F.E. Weinert and L.R. Sherrod (1986) Human Development and the Life Course: Multidisciplinary Perspectives. Hillsdale, New Jersey: Lawrence Erlbaum.
Sorensen, J. (1992) "Locating Class Cleavages in Inter-generational Mobility: Cross- national Commonalities and Variations in Mobility Patterns", European Sociological Review. 8:267-282.
Stevenson, D.L. and D.P. Baker (1992) "Shadow Education and Allocation in Formal Schooling: Transition to University in Japan", American Journal of Sociology. 97:1639-57.
Stier, H. and D.B. Grusky (1990) "An Overlapping Persistence Model of Career Mobility", American Sociological Review. 55:736-56.
Tang, S.L.W. (1992) "Social Origins, Sex-sibling Order and Child Schooling", pp. 175-198 in The Economics and Financing of Hong Kone Education, edited
275
by Y.P. Chung and R.Y.C. Wong, Hong Kong: Chinese University Press.
Treiman, D.J. (1970) "Industrialization and Social Stratification", pp.207-234 in Social Stratification: Research and Theory for the 1970s, edited by E.G. Laumann, Indianapolis: Bobbs-Merrill.
———- (1976) "Towards Methods for a Quantitative Comparative Sociology: A Reply to Burawoy", American Journal of Sociology. 82:1042-56.
Treiman, D.J. and K. Terrel (1975) "The Process of Status Attainment in the United States and Great Britain", American Journal of Sociology. 81:563-83.
Tsang (1992) "The Class Structure of Hong Kong", Hong Kong Institute of Asia- Pacific Studies, Chinese University of Hong Kong, Occasional Paper No. 17.
——- (1993) "Educational and Early Socioeconomic Status Attainment in Hong Kong", Hong Kong Institute of Asia-Pacific Studies, Chinese University of Hong Kong, Occasional Paper No.23.
Uehara, E. (1990) "Dual Exchange Theory, Social Networks, and Informal Social Support", American Journal of Sociology. 96: 521-57.
Walder, A.G. (1986) Communist Neo-Traditionalism: Work and Authority in Chinese Industry. Berkeley and Los Angeles, California: University of California Press.
Wegener, B. (1991) "Job Mobility and Social Ties: Social Resources, Prior Job, and Status Attainment", American Sociological Review. 56: 60-71.
Willis, P. (1977) Learning to Labour: How Working Class Kids Get Working Class Jobs. Aldershot: Gower.
Wong, R.S-K. (1990) "Understanding Cross-National Variation in Occupational Mobility", American Sociological Review. 55:560-73.
Wong, S.L. (1985) "The Chinese Family Firm: A Model", British Journal of Sociology. 36:58-72.
——— (1988) Emigrant Entrepreneurs: Shanghai Industrialists in Hong Kong. Hong Kong: Oxford University Press.
Wong, T.W.P. (1992) "Social Indicators and the Experience of Social Mobility in Hong Kong", pp. 161-174, in The Development of Social Indicators Research in Chinese Societies, edited by S.K. Lau, P.S. Wan, M.K. Lee and S.L. Wong, Hong Kong: Chinese University of Hong Kong (in Chinese).
Wong, T.W.P. and T.L. Lui (1992a) "From One Brand of Politics to One Brand of Political Culture", Hong Kong Institute of Asia-Pacific Studies, Chinese University of Hong Kong, Occasional Paper No. 10.
_......- (I992b) "Reinstating Class: A Structural and Developmental Study of HongKong Society", Social Sciences Research Centre and Department of Sociology, University of Hong Kong, Occasional Paper No. 10.