sbevol29_hkiswebsite.pdf - the hong kong institute
TRANSCRIPT
ISSN 1816-9554
Vol. 29 Issue 1 April 2020
Vol. 29 Issue 1 April 2020
S U
R V E Y
I N G
A N
D B U
I L T E N V
I R O N
M E N
T

All rights reserved. No part of this Journal may be reproduced or transmitted in any form or by any means without the permission of the Hong Kong Institute of Surveyors. Contents of the Journal do not necessarily reflect the views or opinion of the Institute and no liability is accepted in relation thereto.
Copyright © 2020 The Hong Kong Institute of SurveyorsISSN 1816-9554
總辦事處 Head Office香港上環干諾道中111號永安中心12樓1205室Room 1205, 12/F Wing On Centre, 111 Connaught Road Central, Sheung Wan, Hong KongTelephone 電話: 2526 3679 Fax 傳真: 2868 4612E-mail 電郵: [email protected] Website 網址: www.hkis.org.hk
北京辦事處 Beijing Office中國北京市海淀區高樑橋斜街59號院1號樓中坤大廈6層616室 (郵編:100044)Room 616, 6/F, Zhongkun Plaza, No.59 Gaoliangqiaoxiejie, No.1 Yard, Haidian District, Beijing,China, 100044Telephone 電話: 86 (10) 8219 1069 Fax 傳真: 86 (10) 8219 1050E-mail 電郵: [email protected] Website 網址: www.hkis.org.hk
Information
Editorial Board
■■ Honorary EditorSr Raymond KamThe Hong Kong Institute of SurveyorsHong Kong SAR, People’s Republic of China
■■ Chairman and Editor-in-ChiefSr Professor K.W. ChauDepartment of Real Estate and ConstructionThe University of Hong KongHong Kong SAR, People’s Republic of China
■■ Editor Sr Professor Lawrence W.C. LaiDepartment of Real Estate and ConstructionThe University of Hong KongHong Kong SAR, People’s Republic of China
■■ Editorial AssistantsDr Mark Hansley ChuaDepartment of Real Estate and ConstructionThe University of Hong KongHong Kong SAR, People’s Republic of China
Mr Nixon T.H. LeungDepartment of Real Estate and Construction The University of Hong KongHong Kong SAR, People’s Republic of China
■■ MembersSr Dr. M.W. ChanDepartment of Building and Real EstateThe Hong Kong Polytechnic UniversityHong Kong SAR, People’s Republic of China
Sr Professor S.O. CheungDepartment of Architecture and Civil Engineering City University of Hong KongHong Kong SAR, People’s Republic of China
Dr. Cecilia ChuDepartment of Urban Planning and DesignThe University of Hong KongHong Kong SAR, People’s Republic of China
Sr Professor Daniel C.W. HoFaculty of Design and EnvironmentTechnological and Higher Education Institute of Hong KongHong Kong SAR, People’s Republic of China
Dr. John P. LeaFaculty of Architecture, Design & PlanningThe University of SydneyAustralia
Emeritus Professor Andrew Y.T. LeungDepartment of Architecture and Civil EngineeringCity University of Hong KongHong Kong SAR, People’s Republic of China
Sr Professor S.M. LoDepartment of Architecture and Civil EngineeringCity University of Hong KongHong Kong SAR, People’s Republic of China
Sr Professor Esmond C.M. MokDepartment of Land Surveying and Geo-InformaticsThe Hong Kong Polytechnic UniversityHong Kong SAR, People’s Republic of China
Professor Graeme NewellSchool of BusinessUniversity of Western SydneyAustralia
Professor L.Y. ShenSchool of Construction Management and Real EstateThe Chongqing University People’s Republic of China
Sr Dr. Conrad H.W. TangDepartment of Land Surveying and Geo-InformaticsThe Hong Kong Polytechnic UniversityHong Kong SAR, People’s Republic of China
Professor Chris WebsterDepartment of Urban Planning and DesignThe University of Hong KongHong Kong SAR, People’s Republic of China
Professor Cecilia Y.L. WongSchool of Environment, Education and DevelopmentThe University of ManchesterThe United Kingdom
Dr. Simon Y. YauDepartment of Public PolicyCity University of Hong KongHong Kong SAR, People’s Republic of China
■■ English editingDr. Peter Herbert
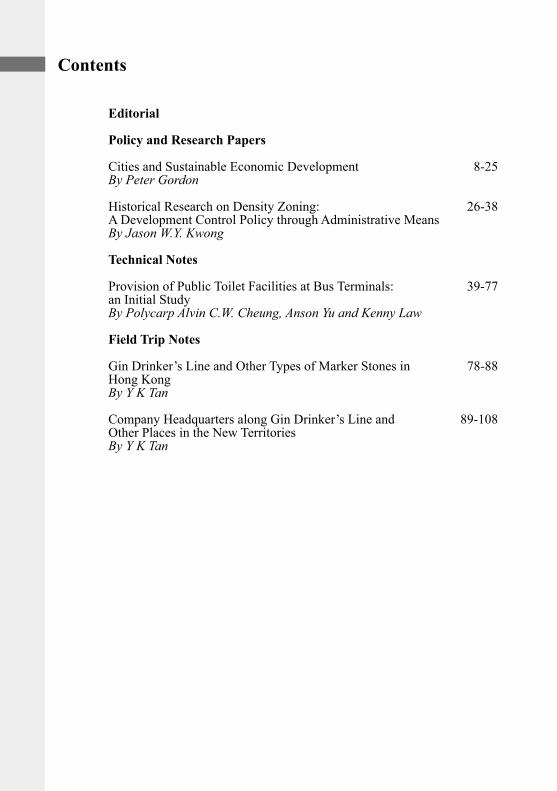
Contents
Editorial
Policy and Research Papers
Cities and Sustainable Economic Development 8-25By Peter Gordon
Historical Research on Density Zoning: 26-38A Development Control Policy through Administrative MeansBy Jason W.Y. Kwong
Technical Notes
Provision of Public Toilet Facilities at Bus Terminals: 39-77an Initial StudyBy Polycarp Alvin C.W. Cheung, Anson Yu and Kenny Law
Field Trip Notes
Gin Drinker’s Line and Other Types of Marker Stones in 78-88Hong KongBy Y K Tan
Company Headquarters along Gin Drinker’s Line and 89-108Other Places in the New TerritoriesBy Y K Tan
SBE5
Editorial
Surveying a sea of people
A surveyor, regardless of his or her political disposition or interests, is always area-sensitive and has no inherent difficulty helping the police, media, and various opinion bodies to more accurately gather intelligence on area-related matters as a security, property management, and traffic management concern even in the absence of high-tech reconnaissance devices.
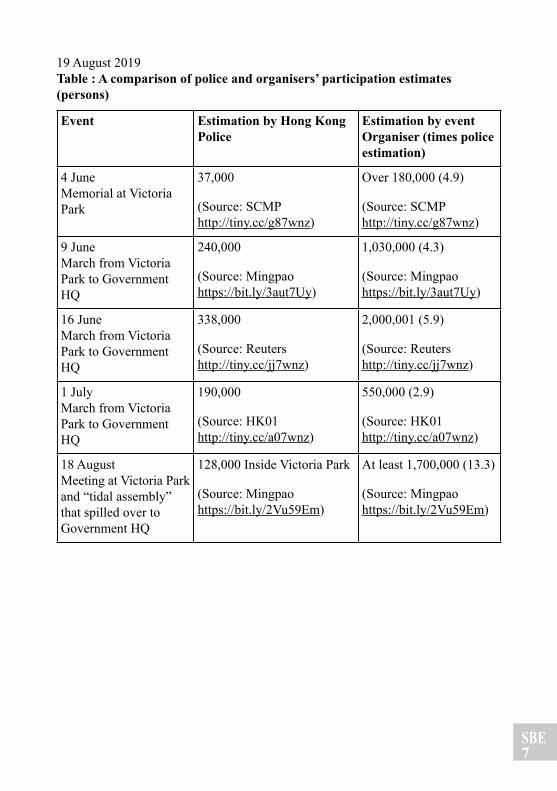
Jus t how many peop le ac tua l ly participated in various recent political demonstrations in Victoria Park, which usually spread west to Tamar Street, is an enigmatic issue, especially as the police’s estimates always differed significantly from those claimed by organisers. (see Table)
As we do not know how various calculations were made, it is pointless to judge whose estimate was more accurate.
Nor are we concerned about the meaning of the size of the multitude. We a r e o n l y c o n c e r n e d w i t h scientifically valid estimations.
At the height of a major demonstration, d e m o n s t r a t o r s o c c u p i e d t h e carriageways along the entire stretch of Yee Wo Street and Hennessy Road from Victoria Park to Queensway up to the
junction of Tamar Street.
This is a surveyor’s rough estimate based on the truism that the number of demonstrators is directly related to the area of the route on which they travel. Simple GIS calculations based on surveyor maps were made to obtain some basic measurements. As we shall see, the mathematics involved are intelligible to an average Hong Kong primary school student who has learned area calculation and the concept of ratio.
We shall work out the number of people that could be accommodated on this route by assuming a space density of one person per square metre (i.e., as per the Hong Kong Planning Standards and Guidelines requirement for local open space).
For simplicity, the number of people at Victoria Park’s vast assembly areas (about 2.5 ha or 24,500 square metres not yet counting the 3-ha open areas adjacent to it) and Tamar Park at either end of this route for a major demonstration were ignored in the calculation.
The length of this route is 2,192 metres. Assume that the average width of the carriageways is 20 metres (the width of Yee Wo Street and Hennessy Road to
SBE6
the immediate east of the Marsh Road junction is about 22.37 metres), then the total number of people is 2,192 m X 20m X 1 person/square metre or 43,837. Adding the 54,000 sqm x 1 person/square metre of Victoria Park, it gives 98,000 people at a given standstill peak moment of the event (say 0.1 million).
This 0.1 mill ion figure is surely conservative as this estimation: (a) ignores the capacity of the pedestrian paths along this route or folks who spilled over to Lockhart and even Gloucester Roads; (b) ignores people who flocked to Victoria Park from the east who had to start walking along King’s Road or Java Road from North Point/Fortress Hill MTR Station; and (c) assumes that demonstrators were in neat military parade formation.
Regardless of how one may interpret the meaning of this magnitude of people involved, the police may wish to take this figure as a benchmark or reference for better logistic purposes.
In passing, it should be noted that it seems that many commentators, even those highly-trained in higher mathematics, have no idea of space or scale. Certainly, none of them was a surveyor.
SBE7
Event Estimation by Hong Kong Police
Estimation by event Organiser (times police estimation)
4 June Memorial at Victoria Park
37,000
(Source: SCMPhttp://tiny.cc/g87wnz)
Over 180,000 (4.9)
(Source: SCMPhttp://tiny.cc/g87wnz)
9 June March from Victoria Park to Government HQ
240,000
(Source: Mingpaohttps://bit.ly/3aut7Uy)
1,030,000 (4.3)
(Source: Mingpaohttps://bit.ly/3aut7Uy)
16 June March from Victoria Park to Government HQ
338,000
(Source: Reuters http://tiny.cc/jj7wnz)
2,000,001 (5.9)
(Source: Reuters http://tiny.cc/jj7wnz)
1 July March from Victoria Park to Government HQ
190,000
(Source: HK01 http://tiny.cc/a07wnz)
550,000 (2.9)
(Source: HK01 http://tiny.cc/a07wnz)
18 August Meeting at Victoria Park and “tidal assembly” that spilled over to Government HQ
128,000 Inside Victoria Park
(Source: Mingpao https://bit.ly/2Vu59Em)
At least 1,700,000 (13.3)
(Source: Mingpao https://bit.ly/2Vu59Em)
19 August 2019Table : A comparison of police and organisers’ participation estimates (persons)
SBE8
Cities and Sustainable Economic DevelopmentPeter Gordon*
ABSTRACT
What is “sustainability”? How clear is it? How useful? It is impossibly vague. But sustainable economic development (SED) suggests a clear enough set of ideas for a useful discussion. I argue that SED is the real sustainability. I show that how we acknowledge the emerging order of urban settlement contributes to our understanding of SED. It follows that if we seek light-touch urban policies, letting our cities develop mostly bottom-up, we could achieve greater prosperity.
KEYWORDS
Cities, sustainable economic development (SED), agglomeration, innovation, growth
INTRODUCTION
“Sustainability is the process of maintaining change in a balanced environment, in which the exploitation of resources, the direction of investments, the orientation of technological development and institutional change are all in harmony and enhance both current and future potential to meet human needs and aspirations.” (Wikipedia)
“The most astonishing thing about the extraordinary growth and innovation that the U.S. and other economies have achieved over the past two centuries is that it does not astonish us.” (Baumol, Litan, and Schramm 2007)
“Capitalism has saved a couple of billion people and we have treated this miracle as a state secret.” (Brooks 2015)
*University of Southern California
SBE9
Surveying and Built Environment Vol 29(1), 8-25 April 2020 ISSN 1816-9554
Is there a useful “sustainability”? Some writers (Cowen 2018, McCloskey 2019) make the case for sustainable economic development (SED) as an ethical imperative. As people become wealthier, they have more choices. As they exercise more choices they become more prosperous. Also, as people become richer and more secure, they become more tolerant, less violent, more literate, and pollute less. World inequality also falls. Phelps (2013) calls it Mass Flourishing and also “the good life.”1 The link between freedom and prosperity is clear. I argue that this includes letting markets guide urban development. Ironically, the practice in the urban planning field is to do the opposite.
Man and beast know not to eat the seed corn. Provisioning for the future is fundamental. Economists have developed formal models that establish how much to put aside. But the formal models are weaker than they look. They necessarily rely on strong assumptions that include presumed knowledge about many things, including the pace of technological change. Yet the pace and the nature of technological change are not knowable. The further into the future the time horizon, the more so. A related problem is that formal models deal in aggregates, leaving out essential
information. Capital is much more complex than k or k(t) in a system of equations. Heterogeneous capital means that hammers are not substitutable for harbors and vice-versa. (Ikeda 2017)
An additional problem is that we may disagree about what to include in measures of wealth or well-being. Cowen (2018, p.30) suggests “wealth plus”2. He wants to expand measured GDP, adding the value of leisure t ime, household production3 and environmental amenities. To be sure, all three bring their own measurement problems and controversies.
In what follows, I argue that the growth discussion requires us to understand the nature of cities and how they are essential to SED. Here are the views of one of the most prominent thinkers on models of economic growth:
“The particular aggregate models I have set out utilize the idea of human capital quite centrally, but assign a central role as well to what I have been calling the external effects of human capital. This latter force is, it seems to me, on a quite different footing from the idea of human capital generally: The twenty years of research I have referred to earlier is almost
1 “Is there some action a government of India could take that would lead the Indian Economy to grow like Indonesia’s or Egypt’s? If so, what, exactly? If not, what is it about the ‘nature of India’ that makes it so? The consequences for human welfare involved in questions like these are simply staggering: once one starts to think about them, it is hard to think about anything else.” (italics added) (Robert 1985)
2 Similar to Social Progress Index by Fehder et al. (2018) 3 Already available in NIPA Satellite Accounts. https://www.bea.gov/data/special-topics/household-
production
SBE10
Cities and Sustainable Economic Development
exclusively concerned with the internal effects of human capital, or with investments in human capital the returns to which accrue to the individual (or his immediate family). If it is this research that permits us to ‘see’ human capital, then the external effects of this capital must be viewed as remaining largely invisible, or visible at the aggregative level only. For example, in section 4 I arrived at an estimate of y = 0.4 for the elasticity of U.S. output with respect to the external effects of human capital on production. Does this seem a plausible number? Or, putting the question in a better way: Is ’Y = 0.4 consistent with other evidence? But what other evidence? I do not know the answer to this question, but it is so central that I want to spend some time thinking about where the answer may be found. In doing so, I will be following very closely the lead of Jane Jacobs, whose remarkable book The Economy of Cities (1969) seems to me mainly and convincingly concerned (though she does not use this terminology) with the external effects of human capital.” (Lucas, 1988, p 36-37).
Cities are widely seen as “engines of growth”.4 They facilitate cooperation and inventiveness. I argue that this means they facilitate the emergence of large numbers of supply chains, including supply chains for ideas. This
also means that cities’ very complex structure is emergent and essential to prosperity. The spatial patterns that emerge reflect and locate the many (evolving) supply chains that underlie our prosperity.5
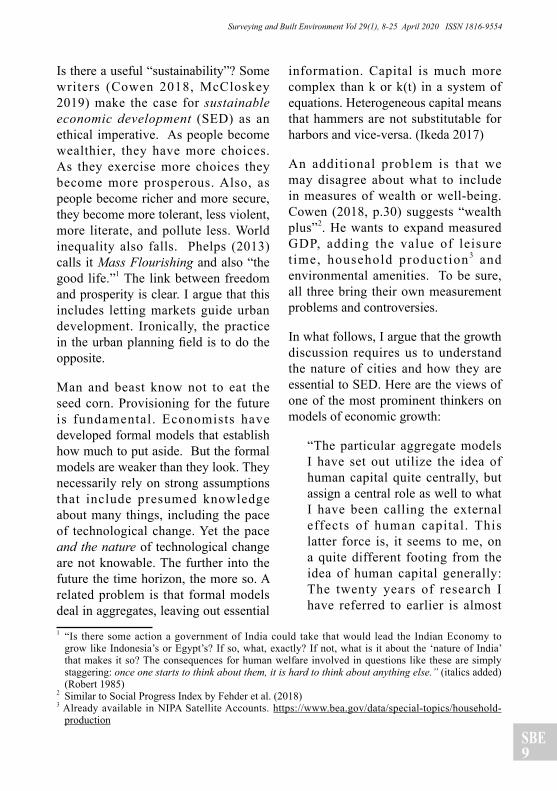
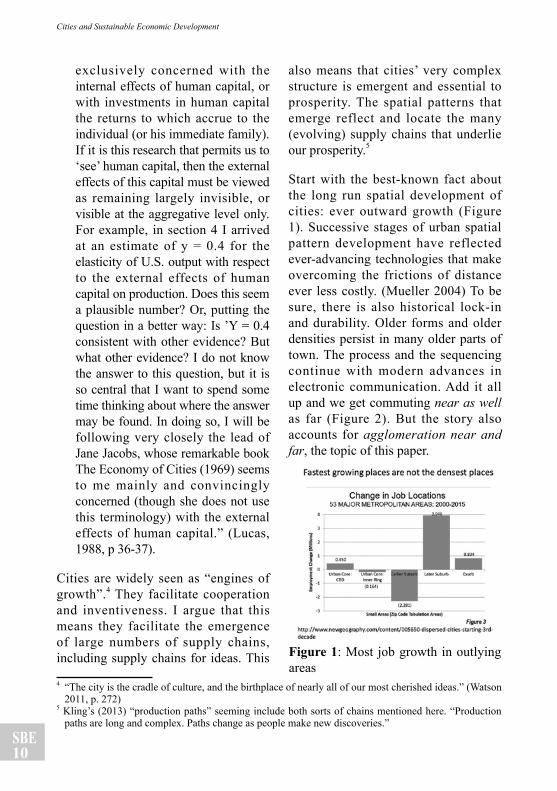
Start with the best-known fact about the long run spatial development of cities: ever outward growth (Figure 1). Successive stages of urban spatial pattern development have reflected ever-advancing technologies that make overcoming the frictions of distance ever less costly. (Mueller 2004) To be sure, there is also historical lock-in and durability. Older forms and older densities persist in many older parts of town. The process and the sequencing continue with modern advances in electronic communication. Add it all up and we get commuting near as well as far (Figure 2). But the story also accounts for agglomeration near and far, the topic of this paper.
4 “The city is the cradle of culture, and the birthplace of nearly all of our most cherished ideas.” (Watson 2011, p. 272)
5 Kling’s (2013) “production paths” seeming include both sorts of chains mentioned here. “Production paths are long and complex. Paths change as people make new discoveries.”
Figure 1: Most job growth in outlying areas
SBE11
Surveying and Built Environment Vol 29(1), 8-25 April 2020 ISSN 1816-9554
Figure 2 : Cities spread outward; commuting near as well as far
Source : U.S . Census Bureau , Amer ican Community Survey, 2009
GROWTH, PRODUCTIVITY, CITIES, IDEAS
SED happens when (1) capital flows to productive uses; and when (2) productivity grows.6 The two cannot be untangled; most new capital embodies new technology. So, how do capital accumula t ion and technologica l advance come about? Both must be encouraged (certainly not discouraged) by the institutional environment. Specifically, institutions that strengthen property rights matter. Of these, I argue that institutional arrangements that allow productive spatial arrangements in cities to emerge are essential.
Unlike Lucas, I discuss economic
growth and how it comes about without the neoclassical modeling paraphernalia of “optimization” or “equilibria” – or “nirvana economics”. (Demsetz 1969)
We know that people naturally seek to improve their situation, mostly via slow trial-and-error learning. Some will fail and some will succeed. But, as Lucas suggests, we cannot discuss productivity and technological change without discussing cities. Why are there cities? What do people (and firms) in cities want? They want space and they want access. They, therefore, evaluate tough trade-offs. Why do they value access? They want to exchange things and ideas.7 8 Just as Coase (1937) highlighted entrepreneurs’ challenge, deciding what to make vs what to buy, I add that this involves choosing what to make and buy and sell where. Supply chains, for ideas and for things, have a spatial dimension. This too is decentralized and emergent. This is how we get cities, specifically how we get the composition, layout and form of cities. It is also how we get realized networks, interactions and relationships.
New (including re-made, e.g., “new and improved”) th ings a re new combinations of old (existing) things. New ideas are new combinations of old
6 Formal measurements of productivity are fraught. The quality of our labor is hard to assess except via market tests.
7 They are social and they economize. Can we ever unscramble these? For this discussion, we do no have to.
8 In fact, people can surely do both at the same time: in most cases, “knowhow” (Carter 1989) is exchanged when there is a transaction. There can also be learning without any obvious transaction taking place.
SBE12
Cities and Sustainable Economic Development
ideas. Usually, new ideas before new goods. Both involve people interacting. People interacting and transacting do so via the many networks they form. This is the story of markets and comparative advantage. People form and maintain supply chains. These include supply chains for things as well as supply chains for ideas.
Supply chains for things are long recognized and appreciated. But there are also supply chains for ideas, formed similarly. Most ideas are not simply public goods that are “in the air”. Rather, in order to be productive, people hunt for useful ideas: useful to them and their enterprise at the moment. Just as some goods, more than others, belong in specific supply chains for goods, various ideas are sought because they are thought to fit into a particular chain of ideas.
When goods are exchanged, it is likely that “knowhow” is also exchanged. But ideas can also be sought and cultivated on their own – usually in anticipation of their being useful in a productive effort.9 In most (not all) cases, it is fairly clear that the entrepreneurs involved have some inkling of what may be useful. The entrepreneurial zeal with which useful new knowledge is sought in order to create more new knowledge outweighs the fact of its presumed publicness. The textbook public goods nature of ideas has been presumed to
dash the zeal with which people pursue ideas. But this makes little sense. The discovery of new ways of doing things enriches entrepreneurs -- and also all the rest of us.
Man and beast know that the acquisition (and processing) of useful information is essential to survival. For the case of humans, this applies to the acquisition of useful ideas which can be thought of as garnished information. Just as there are supply chains for things, there are spontaneously developed supply chains for ideas. We note where we found the nuggets and may go back for more.
Everyone participates in many of both types of supply chains, the ones for goods and the ones for ideas. This suggests that firms and people chose a location based on their many supply chain roles and activities – as suppliers as well as buyers. In any year, how many purchases and sales do we engage in – in how many places? When we chose a location, it is in the hope that our knowledge and product prospects are enhanced.
This suggests that the supply chains involved and their spatial configurations are emergent. In the modern era, either type of chain can have links that extend near as well as far.
An important fact about modern cities is that the big get bigger. But
9 Contra Marshall (1890) who famously stated that in cities, “The mysteries of the trade become no mysteries; but are as it were in the air, and children learn many of them unconsciously.” Anne Carter refers to “knowhow trading” which extends to the end of the chain involving important interactions with final consumers.
SBE13
Surveying and Built Environment Vol 29(1), 8-25 April 2020 ISSN 1816-9554
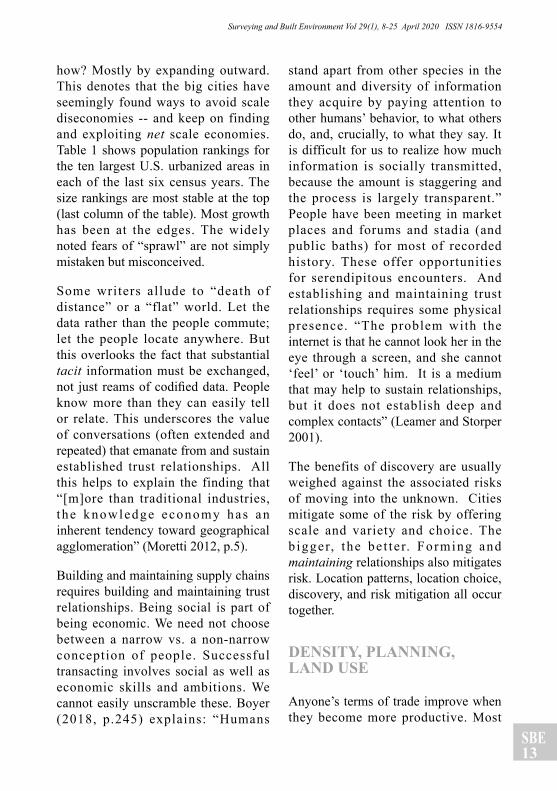
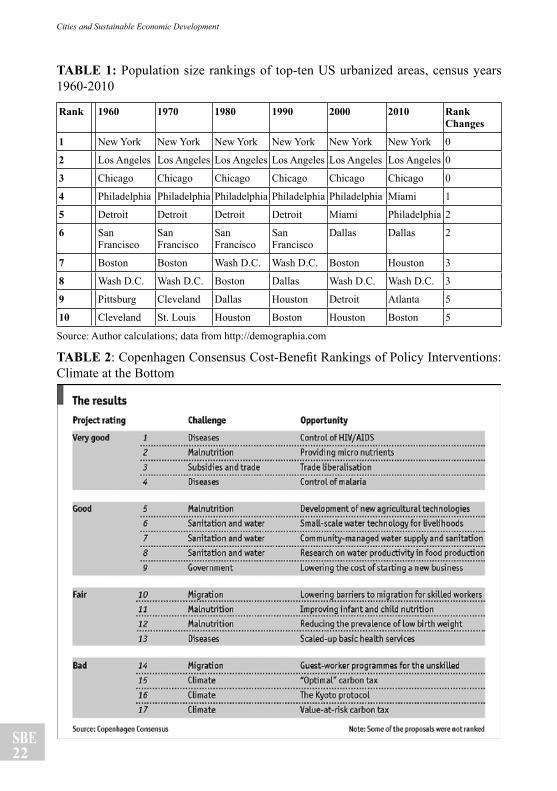
how? Mostly by expanding outward. This denotes that the big cities have seemingly found ways to avoid scale diseconomies -- and keep on finding and exploiting net scale economies. Table 1 shows population rankings for the ten largest U.S. urbanized areas in each of the last six census years. The size rankings are most stable at the top (last column of the table). Most growth has been at the edges. The widely noted fears of “sprawl” are not simply mistaken but misconceived.
Some writers allude to “death of distance” or a “flat” world. Let the data rather than the people commute; let the people locate anywhere. But this overlooks the fact that substantial tacit information must be exchanged, not just reams of codified data. People know more than they can easily tell or relate. This underscores the value of conversations (often extended and repeated) that emanate from and sustain established trust relationships. All this helps to explain the finding that “[m]ore than traditional industries, the knowledge economy has an inherent tendency toward geographical agglomeration” (Moretti 2012, p.5).
Building and maintaining supply chains requires building and maintaining trust relationships. Being social is part of being economic. We need not choose between a narrow vs. a non-narrow conception of people. Successful transacting involves social as well as economic skills and ambitions. We cannot easily unscramble these. Boyer (2018, p.245) explains: “Humans
stand apart from other species in the amount and diversity of information they acquire by paying attention to other humans’ behavior, to what others do, and, crucially, to what they say. It is difficult for us to realize how much information is socially transmitted, because the amount is staggering and the process is largely transparent.” People have been meeting in market places and forums and stadia (and public baths) for most of recorded history. These offer opportunities for serendipitous encounters. And establishing and maintaining trust relationships requires some physical presence. “The problem with the internet is that he cannot look her in the eye through a screen, and she cannot ‘feel’ or ‘touch’ him. It is a medium that may help to sustain relationships, but it does not establish deep and complex contacts” (Leamer and Storper 2001).
The benefits of discovery are usually weighed against the associated risks of moving into the unknown. Cities mitigate some of the risk by offering scale and variety and choice. The b igger, the be t te r. Forming and maintaining relationships also mitigates risk. Location patterns, location choice, discovery, and risk mitigation all occur together.
DENSITY, PLANNING, LAND USE
Anyone’s terms of trade improve when they become more productive. Most
SBE14
Cities and Sustainable Economic Development
people know this almost instinctively. What do we know about how we get enhanced productivity? Much involves enhanced inventiveness which is most likely to occur in cities where people can meet and exchange ideas. But most people who study these phenomena have been satisfied with the notion that area-wide population density is a good proxy measure of how cities benefit inventiveness. Higher densities suggest the possibility for more interactions.
While basically correct, most analysts’ reliance on area-wide density introduces two problems. First, what is the relevant boundary of the “city?” Surely, not the conventional and somewhat arbitrary administrative/political units. Second, the overall approach leaves no room for the fact that complex spatial patterns denote many densities to accommodate many tastes and many situations. A single overall (average) density measure is not informative enough. Large cities (large labor markets) offer many opportunities. Everyone seeks many interactions. This includes interactions near as well as less near. We chose many interactions, over many distances and involving many modes. “Spatial proximity” is unclear and can denote many things. It can be misleading. Location choice is complex.
A t w h a t d i s t a n c e d o p o t e n t i a l e x t e r n a l i t i e s b e c o m e re a l i z e d externalities? At what distance do alternate modes of communication and travel become cost-effective? For many people, the possibility of externalities is prima facie evidence of
market failure -- and an argument for political intervention. From welfare economics, there are well-known policy prescriptions on how to internalize externalities. From Coase we also know that when property rights are clear and transactions costs manageable, market forces will limit the distortionary effects of negative externalities. Any remaining externalities problems can conceivably be mitigated via policies that prescribe internalizing taxes and subsidies. But there may be less to be mitigated via taxes and subsidies than we might expect because the spatial arrangements that emerge -- when we let them -- are a spontaneous remedy for many potential externalities problems. Consider the following simple example.
“In many economics textbooks, the presence of externalities is invoked as a justification for government intervention in the marketplace. Yet the private sector often finds its own solutions to externality problems. This is the secret of the shopping mall’s success. Because a property developer owns the entire shopping complex, its profits depend on the entire mall, not on any particular shop. By choosing the right mix of tenants and charging rents that reflect each store’s contribution to the mall’s overall revenues – including the business it brings to other stores – the developer can ‘internalize’ the externality and maximize its profits.” (The Economist, March 1, 1997)
Private mall developers, as residual
SBE15
Surveying and Built Environment Vol 29(1), 8-25 April 2020 ISSN 1816-9554
claimants, know it is in their interest to arrange land uses in ways that internalize many externalities, the negative ones as well as the positive ones. While public zoning is supposed to minimize negative externalities, the private mall is designed to also exploit positive externalities where possible. (Pashigian and Gould 1998) Note also that the challenge of addressing externalities (rules or incentives) is lessened if private owners have found spatial arrangements that lessen many uncompensated externalities problems. Potential externalities are not the same as realized externalities. Even the knotty problem of reciprocal externalities is here left to the residual claimant.
The mall example poses the following question: up to what scale can such outcomes be expected? How large and how numerous can viable islands of purposeful planning be? The land use policies discussed by most people who write about cities involve large-scale and top-down guidance. But can any human mind possess enough knowledge?
Consider contrasts with the private mall example. Public land use planners claim that their plans are crafted to avoid negative externalities between “incompatible” land uses. This assumes significant top-down knowledge and responsibility. To make it worse, not only are top-down efforts hampered by the knowledge problem, but those at the top are inevitably tempted by cronyism and politics.
Nevertheless , modesty by urban planners is not forthcoming. Planners h a v e g o n e b e y o n d t h e o r i g i n a l ambitions and now strive to shape u rban deve lopment in the hope of alleviating complex social and environmenta l problems. “New urbanism”, “containment”, “transit-oriented development” and, of course, “sustainability” are popular. High housing prices have been a consequence as have been rail transit projects that bust budgets but disappoint in terms of ridership.
One movement worth noting has been the growing number of communities in the U.S. (usually outside the large cities) that are developed in a fashion reminiscent of the shopping mall. The movement can involve greater pu rv i ew fo r p r iva t e zon ing v i a private communities and homeowner associations. Initial land use design is via a market-oriented developer. Subsequent decisions are via whatever process the homeowner association adopts. But this also involves politics albeit at a more local level.
Nelson (2002) optimistically referred to this as a “quiet revolution” and the “privatization of zoning.” Profit-seeking developers are the planners. They assemble the raw land and engage in finance, planning, development and sales. Subject to various state laws they also draft rules of governance. They eventually hand off governance to a homeowners association or divide it between an association and the local government, depending on the
SBE16
Cities and Sustainable Economic Development
circumstance. Residents prefer a more local level of control; many traditional governments are happy to hand off responsibilities over to this new level of government. Nelson argues that compet i t ion between developers s u g g e s t s t h a t j u s t a s t h e m a n y physical features of the “proprietary communities” emerge from market competition, the rules of governance are also subject to market forces which bring forth more efficient private property value-enhancing “rules of the game”. In any particular setting, does a rule that there can be no loud parties after 9pm or after 10pm add more to residential values? Serious developers would make it their business to know. Innovation and experimentation are the best way to find out.
PLANNING AND AGGLOMERATION
Decreasing returns describe the world of the early neo-classicists, notably Malthus. But this was also a world that many were incentivized to leave behind. Urban economists emphasize that thriving cities and “agglomeration” economies offered an avenue of escape. Some are optimistic that the process can be somehow augmented and prescribe policies to encourage the spatial clustering of activities to prompt agglomeration economies. “Innovation clusters” are often included in regional plans as a goal.
But do we know enough about how large numbers of complex supply
chains are formed and managed to prescribe spatial policies? Designers are good at designing structures (large and small) as well as everything that goes inside these buildings. But how far can this design capability be scaled up? Brasilia and many other scale-up attempts are considered failures in terms of their inability to develop as originally promoted. Dreams of scaling up to the planning of desired spatial arrangements for a whole city or region run into the reality that at some scale it inevitably becomes more a matter of human action (and all the dynamic but often slow improvements from trial-and-error and tinkering and learning involved) than human design. Human design capabilities have limits. “A city is not a work of art.” (Jacobs 1961) Top-down ambitions must be tempered by what planners and designers can reasonably expect they can know (and accomplish) with any degree of confidence.
More than one author has suggested that agglomeration and electronic c o m m u n i c a t i o n c a n b e s e e n a s subs t i tu tes or complements . A network of contacts can mean many things. Managers of firms evaluate the possibilities and look for the blend of communications channels and modes that works best for them. This choice informs their concurrent evaluation of location choices.
Moretti’s discussion of agglomeration is mostly about transactions-based linkages and local “multipliers” – including the importance of linkages to
SBE17
Surveying and Built Environment Vol 29(1), 8-25 April 2020 ISSN 1816-9554
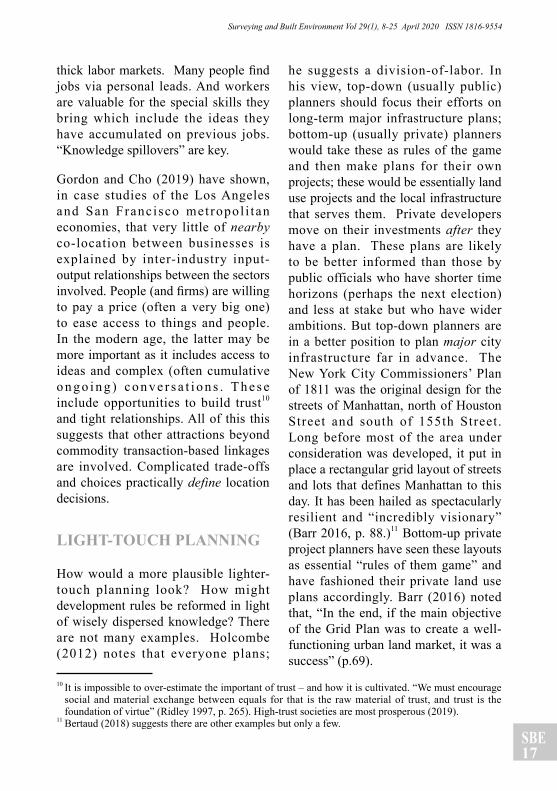
thick labor markets. Many people find jobs via personal leads. And workers are valuable for the special skills they bring which include the ideas they have accumulated on previous jobs. “Knowledge spillovers” are key.
Gordon and Cho (2019) have shown, in case studies of the Los Angeles and San Francisco metropol i tan economies, that very little of nearby co-location between businesses is explained by inter-industry input-output relationships between the sectors involved. People (and firms) are willing to pay a price (often a very big one) to ease access to things and people. In the modern age, the latter may be more important as it includes access to ideas and complex (often cumulative o n g o i n g ) c o n v e r s a t i o n s . T h e s e include opportunities to build trust10 and tight relationships. All of this this suggests that other attractions beyond commodity transaction-based linkages are involved. Complicated trade-offs and choices practically define location decisions.
LIGHT-TOUCH PLANNING
How would a more plausible lighter-touch planning look? How might development rules be reformed in light of wisely dispersed knowledge? There are not many examples. Holcombe (2012) notes that everyone plans;
he suggests a division-of-labor. In his view, top-down (usually public) planners should focus their efforts on long-term major infrastructure plans; bottom-up (usually private) planners would take these as rules of the game and then make plans for their own projects; these would be essentially land use projects and the local infrastructure that serves them. Private developers move on their investments after they have a plan. These plans are likely to be better informed than those by public officials who have shorter time horizons (perhaps the next election) and less at stake but who have wider ambitions. But top-down planners are in a better position to plan major city infrastructure far in advance. The New York City Commissioners’ Plan of 1811 was the original design for the streets of Manhattan, north of Houston Street and south of 155th Street. Long before most of the area under consideration was developed, it put in place a rectangular grid layout of streets and lots that defines Manhattan to this day. It has been hailed as spectacularly resilient and “incredibly visionary” (Barr 2016, p. 88.)11 Bottom-up private project planners have seen these layouts as essential “rules of them game” and have fashioned their private land use plans accordingly. Barr (2016) noted that, “In the end, if the main objective of the Grid Plan was to create a well-functioning urban land market, it was a success” (p.69).
10 It is impossible to over-estimate the important of trust – and how it is cultivated. “We must encourage social and material exchange between equals for that is the raw material of trust, and trust is the foundation of virtue” (Ridley 1997, p. 265). High-trust societies are most prosperous (2019).
11 Bertaud (2018) suggests there are other examples but only a few.
SBE18
Cities and Sustainable Economic Development
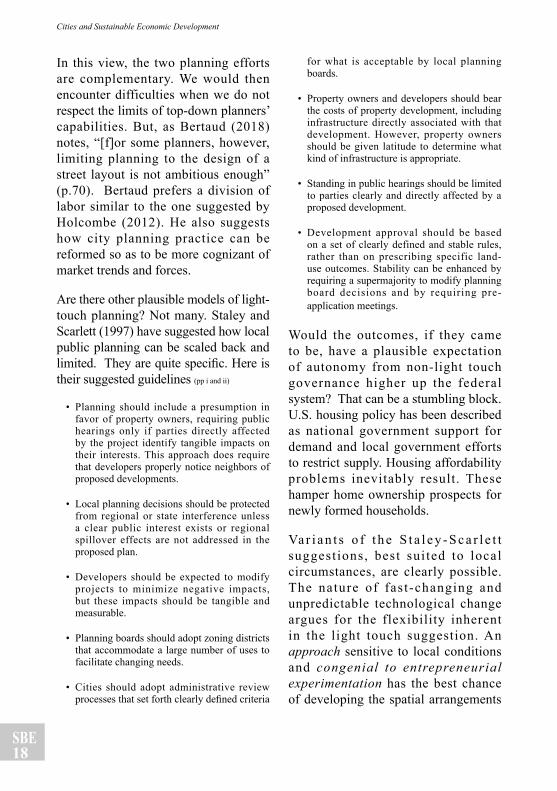
In this view, the two planning efforts are complementary. We would then encounter difficulties when we do not respect the limits of top-down planners’ capabilities. But, as Bertaud (2018) notes, “[f]or some planners, however, limiting planning to the design of a street layout is not ambitious enough” (p.70). Bertaud prefers a division of labor similar to the one suggested by Holcombe (2012). He also suggests how city planning practice can be reformed so as to be more cognizant of market trends and forces.
Are there other plausible models of light-touch planning? Not many. Staley and Scarlett (1997) have suggested how local public planning can be scaled back and limited. They are quite specific. Here is their suggested guidelines (pp i and ii)
• Planning should include a presumption in favor of property owners, requiring public hearings only if parties directly affected by the project identify tangible impacts on their interests. This approach does require that developers properly notice neighbors of proposed developments.
• Local planning decisions should be protected from regional or state interference unless a clear public interest exists or regional spillover effects are not addressed in the proposed plan.
• Developers should be expected to modify projects to minimize negative impacts, but these impacts should be tangible and measurable.
• Planning boards should adopt zoning districts that accommodate a large number of uses to facilitate changing needs.
• Cities should adopt administrative review processes that set forth clearly defined criteria
for what is acceptable by local planning boards.
• Property owners and developers should bear the costs of property development, including infrastructure directly associated with that development. However, property owners should be given latitude to determine what kind of infrastructure is appropriate.
• Standing in public hearings should be limited to parties clearly and directly affected by a proposed development.
• Development approval should be based on a set of clearly defined and stable rules, rather than on prescribing specific land-use outcomes. Stability can be enhanced by requiring a supermajority to modify planning board decisions and by requiring pre-application meetings.
Would the outcomes, if they came to be, have a plausible expectation of autonomy from non-light touch governance higher up the federal system? That can be a stumbling block. U.S. housing policy has been described as national government support for demand and local government efforts to restrict supply. Housing affordability problems inevitably result. These hamper home ownership prospects for newly formed households.
Va r i a n t s o f t h e S t a l e y - S c a r l e t t suggest ions, best sui ted to local circumstances, are clearly possible. The nature of fast-changing and unpredictable technological change argues for the flexibility inherent in the light touch suggestion. An approach sensitive to local conditions and congenial to entrepreneurial experimentation has the best chance of developing the spatial arrangements
SBE19
Surveying and Built Environment Vol 29(1), 8-25 April 2020 ISSN 1816-9554
that work, including workable spatial dimensionality and industry mix. This supersedes the debate over whether regional industrialization specialization or diversity are the better regional planning strategy. Like the other attributes of local industrial development, the most promising spatial organization and industry mix are more likely to emerge bottom-up than be determined via analysis and then promoted top-down. Local area industry mix is inevitably complex and includes peculiar degrees of specialization as well as diversity.
Ironies abound. Mills (2002) in “Truly Smart Growth” argues that top-down planners should back off from “smart” ambitions and consider the market processes at work as cities grow. Bertaud (2018) makes the same point. Benign processes are often stymied by politically-inspired rules and restrictions – and many of them touted as “smart”.
But the planning zeitgeist is in the almost opposite directions from a light touch. Public choice economics (although its champion and articulate expositor James Buchanan was awarded the Nobel Prize in economics in 1986 and significant work followed via the Virginia school of public choice (and many others)) has had little impact on discussions in “mainstream” economics or public policy or city planning. In economics there are still elaborate models that assume a benign and omniscient “social planner.” These
models do recognize that “nirvana economics” is implausible but revert to market failure discussions and (again) rescue by some sort of omnipotent and omniscient public sector, e.g., another implausible nirvana.
The many restrictions that smart growth advocates prescribe have prompted high housing prices – and “affordability” problems. There are, to be sure, also demand effects but the effects of restricted housing supply are clear and remediable if more scope for market forces is allowed. There is considerable evidence for this entirely plausible outcome. The straightforward prescription for enhanced consumer well-being is a less restrictive housing policy (Salem 2016).
Never the less , a l a rge l i t e ra tu re advances claims that it is necessary and feasible to arrest “sprawl” and achieve instead the “smart growth” of cities and regions, usually via bold top-down planning and even involving “master plans.” But is the outward growth that has characterized practically all major cities for almost all years for which we have data really a problem? And, ironies aside, how plausible is it that “smart” top-down planners can really better manage urban growth?
The critics do not see that the big cities continue to grow outward and prosper because they have seemingly found ways to avoid scale diseconomies and reap scale economies.12 Market
12 Evidence for this phenomenon in cities around the world can be found at this site. http://www.newgeography.com/category/story-topics/evolving-urban-form
SBE20
Cities and Sustainable Economic Development
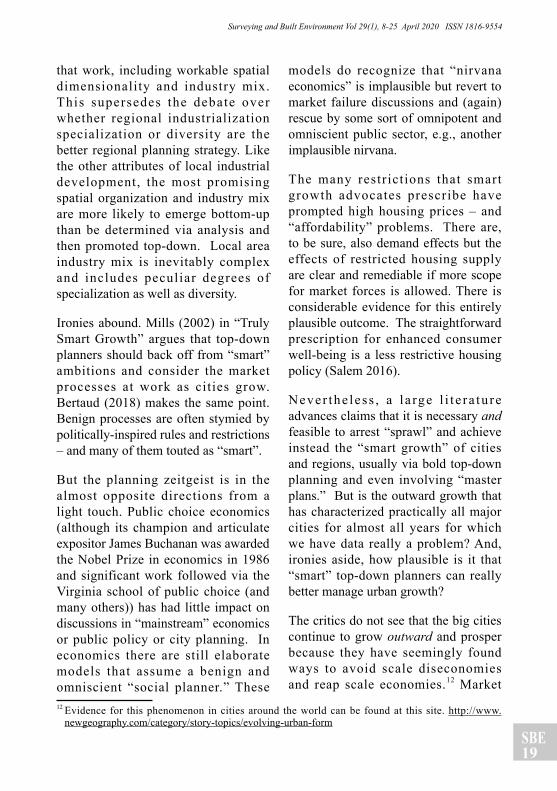
processes have seemingly found spatial patterns that work. These patterns are complex and most ly involve considerable dispersion. In spite of a plethora of land use policies, land markets have seemingly discovered spa t ia l a r rangements tha t a l low dispersing places to grow and compete successfully. Talk of economies or diseconomies of urban size must be elaborated or tempered by considering the role of spatial arrangements. The key point is that large-system complexity is surely beyond top=down planners’ abilities. The idea of land use complementarities are widely accepted. This means we must be prepared to let spatial arrangements and complementarities emerge (and evolve) based on information that only the locators can have. This means that land use planners must aspire to a more modest yet still difficult role.
ENVIRONMENT
Consider the case of pollution and the state of the environment which animates so much of the “sustainability” discussions. The Environmental Kuznets Curve (EKC) (Grossman and Krueger (1995)) links economic growth to changes in environmental quality. Based mainly on cross-country experiences, it plots an inverted-U: in the early stages of industrialization and development, there is environmental degradation; this is reversed once a plateau is passed. EKC supposedly peaks in the neighborhood of $5,000-
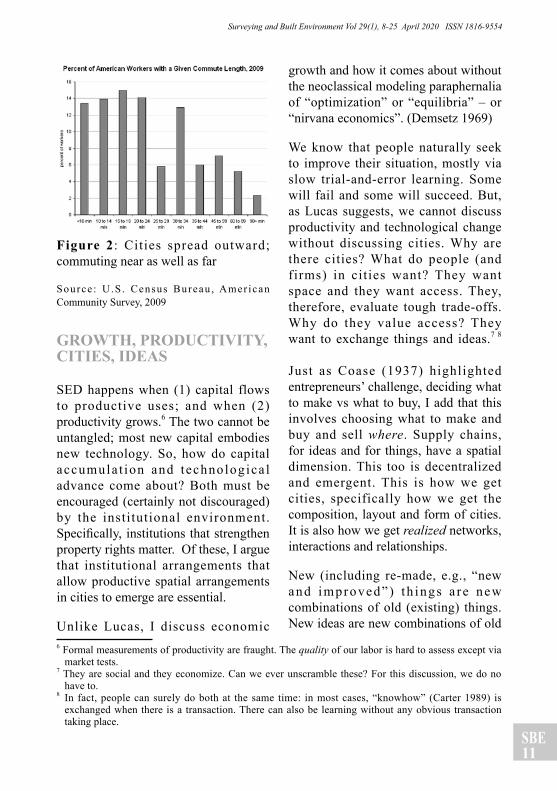
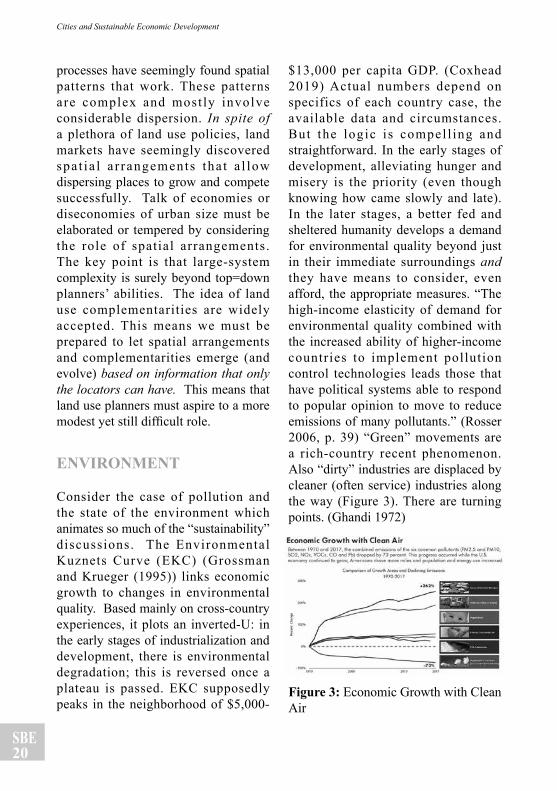
$13,000 per capita GDP. (Coxhead 2019) Actual numbers depend on specifics of each country case, the available data and circumstances. But the logic is compel l ing and straightforward. In the early stages of development, alleviating hunger and misery is the priority (even though knowing how came slowly and late). In the later stages, a better fed and sheltered humanity develops a demand for environmental quality beyond just in their immediate surroundings and they have means to consider, even afford, the appropriate measures. “The high-income elasticity of demand for environmental quality combined with the increased ability of higher-income countries to implement pollution control technologies leads those that have political systems able to respond to popular opinion to move to reduce emissions of many pollutants.” (Rosser 2006, p. 39) “Green” movements are a rich-country recent phenomenon. Also “dirty” industries are displaced by cleaner (often service) industries along the way (Figure 3). There are turning points. (Ghandi 1972)
Figure 3: Economic Growth with Clean Air
SBE21
Surveying and Built Environment Vol 29(1), 8-25 April 2020 ISSN 1816-9554
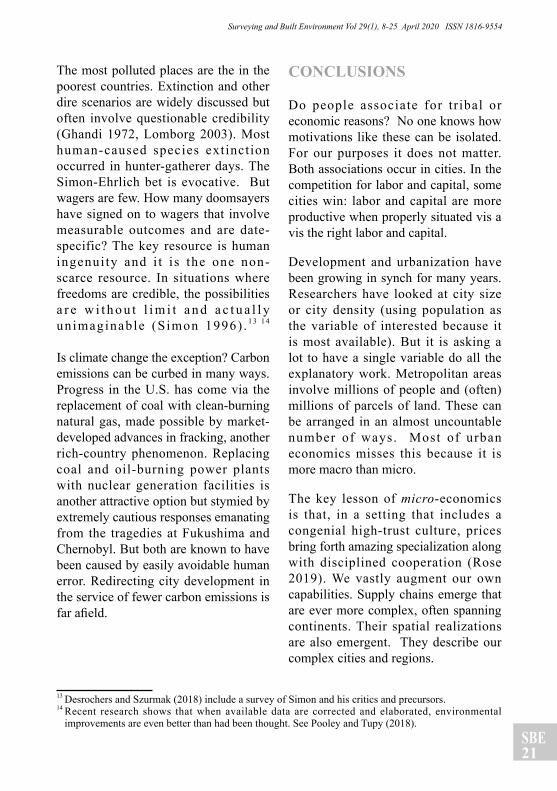
The most polluted places are the in the poorest countries. Extinction and other dire scenarios are widely discussed but often involve questionable credibility (Ghandi 1972, Lomborg 2003). Most human-caused species extinction occurred in hunter-gatherer days. The Simon-Ehrlich bet is evocative. But wagers are few. How many doomsayers have signed on to wagers that involve measurable outcomes and are date-specific? The key resource is human ingenuity and i t is the one non-scarce resource. In situations where freedoms are credible, the possibilities a r e w i t h o u t l i m i t a n d a c t u a l l y unimaginable (Simon 1996) . 13 14 Is climate change the exception? Carbon emissions can be curbed in many ways. Progress in the U.S. has come via the replacement of coal with clean-burning natural gas, made possible by market-developed advances in fracking, another rich-country phenomenon. Replacing coal and oil-burning power plants with nuclear generation facilities is another attractive option but stymied by extremely cautious responses emanating from the tragedies at Fukushima and Chernobyl. But both are known to have been caused by easily avoidable human error. Redirecting city development in the service of fewer carbon emissions is far afield.
CONCLUSIONS
Do people associate for tribal or economic reasons? No one knows how motivations like these can be isolated. For our purposes it does not matter. Both associations occur in cities. In the competition for labor and capital, some cities win: labor and capital are more productive when properly situated vis a vis the right labor and capital.
Development and urbanization have been growing in synch for many years. Researchers have looked at city size or city density (using population as the variable of interested because it is most available). But it is asking a lot to have a single variable do all the explanatory work. Metropolitan areas involve millions of people and (often) millions of parcels of land. These can be arranged in an almost uncountable number of ways. Most of urban economics misses this because it is more macro than micro.
The key lesson of micro-economics is that, in a setting that includes a congenial high-trust culture, prices bring forth amazing specialization along with disciplined cooperation (Rose 2019). We vastly augment our own capabilities. Supply chains emerge that are ever more complex, often spanning continents. Their spatial realizations are also emergent. They describe our complex cities and regions.
13 Desrochers and Szurmak (2018) include a survey of Simon and his critics and precursors.14 Recent research shows that when available data are corrected and elaborated, environmental
improvements are even better than had been thought. See Pooley and Tupy (2018).
SBE22
Cities and Sustainable Economic Development
TABLE 1: Population size rankings of top-ten US urbanized areas, census years 1960-2010
Rank 1960 1970 1980 1990 2000 2010 Rank Changes
1 New York New York New York New York New York New York 0
2 Los Angeles Los Angeles Los Angeles Los Angeles Los Angeles Los Angeles 0
3 Chicago Chicago Chicago Chicago Chicago Chicago 0
4 Philadelphia Philadelphia Philadelphia Philadelphia Philadelphia Miami 1
5 Detroit Detroit Detroit Detroit Miami Philadelphia 2
6 San Francisco
San Francisco
San Francisco
San Francisco
Dallas Dallas 2
7 Boston Boston Wash D.C. Wash D.C. Boston Houston 3
8 Wash D.C. Wash D.C. Boston Dallas Wash D.C. Wash D.C. 3
9 Pittsburg Cleveland Dallas Houston Detroit Atlanta 5
10 Cleveland St. Louis Houston Boston Houston Boston 5
Source: Author calculations; data from http://demographia.com
TABLE 2: Copenhagen Consensus Cost-Benefit Rankings of Policy Interventions: Climate at the Bottom
SBE23
Surveying and Built Environment Vol 29(1), 8-25 April 2020 ISSN 1816-9554
REFERENCES
Barr JM (2016), Building the Skyline: the Birth and Growth of Manhattan’s Skyscrapers. Oxford University Press.
Baumol WJ, Litan RE, and Schramm CJ (2007), Good Capitalism, Bad Capitalism, and the Economics of Growth and Prosperity. Yale University Press.
Bertaud A (2018), Order without Design: How Markets Shape Cities. Cambridge, MA: MIT Press.
Boyer P (2018), Minds Make Societies. New Haven: Yale University Press.
Brooks A (2015), The Conservative P a r a d o x , A m e r i c a n E n t e r p r i s e Institute. https://arthurbrooks.com/the-conservative-paradox/
Carter AP (1989), “Knowhow Trading As Economic Exchange,” Research Policy, 18:3, 155-163.
Coase RH (1937), “The Nature of the Firm,” Economica, 4(16), 386-405.
Cowen T (2018), Stubborn Attachments. San Francisco, Stripe Press.
Coxhead I (2019), “Environmentalism with Chinese Characteristics – A Review of Matthew E. Kahn and Siqi Zheng’s Blue Skies over Beijing: Economic Growth and the Environment in China,” Journal of Economic Literature, 57:1, 161-179.
Demsetz H (1969), “Information and Efficiency: Another Viewpoint,” Journal of Law and Economics, 12:1, 1–22.
Desrochers P and Szurmak J (2018), Population Bombed! Global Warming Po Foundation.
Fehder D, Porter M and Stern S (2018), “The Empirics of Social Progress: The Interplay between Subjective Well-Being and Societal Performance,” AEA Papers and Proceedings, 108, 477-82.
Ghandi I (1972), Speech at Plenary Session of United Nations Conference on Human Environment, Stockholm (June).
G o r d o n P a n d C h o J ( 2 0 1 9 ) , “ A g g l o m e r a t i o n N e a r a n d F a r : San Franc isco and Los Angeles Metropolitan Areas” presented at 58th meeting, Western Regional Science Association. Napa, California.
Grossman GM and Krueger AB (1995), “Economic Growth and the Environment,” Quarterly Journal of Economics, 110 (2), 353-377.
Holcombe RG (2012), “Planning and the Invisible Hand: Allies or Adversaries?” Planning Theory, 12(2), 199-210.
Ikeda S (2004), “Urban Interventionism and Local Knowledge,” The Review of Austrian Economics, 17(2-3), 247-264.
SBE24
Cities and Sustainable Economic Development
Ikeda S (2017), A City Cannot be a Work of Art,” Cosmos and Taxis, 4:2-3.
Jacobs J (1961), The Death and Life of Great American Cities. New York: Random House.
Kling A (2013), Memoirs of a Would-be Macroeconomist, http://arnoldkling.com/essays/papers/macromemoir.pdf
Leamer EE and Storper M (2001), “The Economic Geography of the Internet Age,” NBER Working Paper 8450.
Lomborg B (2003), The Skeptical Environmentalist: Measuring the Real State of the World, Vol. 1. Cambridge: Cambridge University Press.
Marshall A (1890), Principles of Economics, 8th ed. London: Macmillan.
M c C l o s k e y D H ( 2 0 1 8 / 2 0 1 9 ) , “Hayekian Liberalism Expressed in Speech Made Rich and Free,” Journal of Law and Liberty, 12, 253-276.
Mills ES (2002), “Truly Smart Growth” Cornell Real Estate Review, 1, 8-22.
Moretti E (2012), The New Geography of Jobs. New York: Houghton Mifflin Harcourt.
Mueller PO (2004), Transportation and Urban Form: Stages in the Spatial Evolution of the American Metropolis” in Hanson S and Giuliano G (eds.), The Geography of Urban Transportation (3rd ed.). New York: Guilford Press.
Nelson RH (2002), “Privatizing the Neighborhood” in Beito DT et al ed. The Voluntary City. Ann Arbor: The University of Michigan Press.
Pashigian BP and Gould ED (1998), “Internalizing Externalities: The Pricing of Space in Shopping Malls,” Journal of Law and Economics, 41, 115-142.
Phelps E (2013), Mass Flourishing. Princeton: Princeton University Press.
Pooley GL and Tupy ML (2018), The Simon Abundance Index: A New Way to Measure Availability of Resources. Washington, DC: Cato Institute Policy Analysis #857.
Ridley M (1997), The Origins of Virtue. UK: Penguin.
Robert L (1985), Alfred Marshall Lectures. University of Cambridge.
Rose DC (2019), Why Culture Matters Most. Oxford UK, Oxford University Press.
Rosser J Jr (2006), “International Evolution and the Environmental Kuznets Curve (EKC)” in Sinha A and Mitra S, Economic Development, Climate Change and the Environment. Routledge: Oxon, UK.
Salem R (2016), “Public Housing Pol ic ies : Change Could Prompt Economic Growth,” (http://www.kauffman.org/neg/sectoion-6).

SBE25
Surveying and Built Environment Vol 29(1), 8-25 April 2020 ISSN 1816-9554
Simon JL (1996) , The Ul t imate Resource 2 . Princeton: Princeton University Press.
Staley S and Scarlett L (1997), Market-Oriented Planning: Principles and Tools, Los Angeles: Reason Public Policy Institute, Policy Study 236.
Watson P (2011), The Great Divide. New York: Harper.
SBE26
Historical Research on Density Zoning: A Development Control Policy through Administrative MeansJason W.Y. Kwong *
ABSTRACT
Based on historical government documents obtained from the Government Records Service of the HKSAR Government, this paper aims to present the historical background of adopting “density zoning” through administrative means for development control in Hong Kong. The findings of this paper confirm that planning by contract operated in parallel with planning by edict to control the development bulks in Hong Kong from the 1950s to 1970s.
INTRODUCTION
The concept “planning by contract” was first used by Lai in 1993 to describe the de jure planning and development mechanism that operates by the leasehold land sale and development system which was originally the taken care of by government surveyors but after World War II (WWII) became subject to administrative town plans produced by government town planners (Lai 1997; 1998; 2002; 2004; 2005; 2010; Lai and Chau 2019). Density zoning is one administrative town planning policy tool that the Hong Kong Government has adopted since 1966.
* BSc(SURV) PhD MHKIS MRICSE-mail: [email protected]
SBE27
Surveying and Built Environment Vol 29(1), 26-38 April 2020 ISSN 1816-9554
This paper will first introduce the background of development control in Hong Kong after WWII. Then it will detail density zoning and the Hong Kong Government’s considerations to adopt it. The paper’s main part will present the Government’s view on implementing the density zoning through administrative means. Last, the paper will discuss the latest applications of density zoning.
BACKGROUND OF POST-WORLD WAR II DEVELOPMENT CONTROLS
After WWII, Hong Kong’s population greatly increased. The then-Buildings Ord inance o f 1935 re s t r i c t ed a maximum building height of five storeys for domestic buildings – unless the Governor in Council consented to a higher limit. Under such a height restriction, the plot ratios1 of buildings built from the 1940s to early 1950s were, on average, around three storeys.2
To cater to Hong Kong’s growing population, the Buildings Ordinance of 1955 and Building (Planning) Regulations of 1956 were enacted on 21 December 1955 and 17 April 1 The concept of “plot ratio” was first introduced
to Hong Kong in 1962 via the new Building (Planning) Regulations of 1962.
2 See “Draft Memorandum for Executive Council: Residential Density – Domestic Plot Ratios Permitted under the Building (Planning) Regulations” under GRS Records HKRS No.163-8-1.
1956 respectively to encourage high-rise developments. Under Building (Planning) Regulations of 1956, a volume formula was adopted to regulate the building bulk of new developments with reference to the width of the streets that the sites fronted. The “volume” formula allowed plot ratios of up to 19 for composite buildings that abutted three streets.3 As stated in the “Explanatory Note” of Building (Planning) Regulations of 1962, there had been criticism of the very high density developments allowed by the Building (Planning) Regulations of 1956, as they were undesirable on social, health, and practical grounds.
In 1962 , a new se t o f Bui ld ing (Planning) Regulations with plot ratio control4 was enacted on 19 September 1962 and took effect in 1966. The law remains in force to date. Under the First Schedule of the Building (Planning) Regulations of 1962, the maximum plot ratios were restricted to 10 and 15 for domestic and non-domestic buildings, respectively.
3 See “Draft Memorandum for Executive Council: Residential Density – Domestic Plot Ratios Permitted under the Building (Planning) Regulations” under GRS Records HKRS No.163-8-1.
4 With reference to the building control of New York Zoning Resolution 1961. See Information Note No.22 of Hong Kong 2030 (2007): (http://www.pland.gov.hk/pland_en/p_study/comp_s/hk2030/eng/wpapers/pdf/inform22.pdf).
SBE28
Historical Research on Density Zoning: A Development Control Policy through Administrative Means
DETAILS OF DENSITY ZONING
The restrictions under the Buildings Ordinance represent the maximum development parameters throughout Hong Kong, which were designed for developments in urban areas. Different development controls would be required for suburban areas.
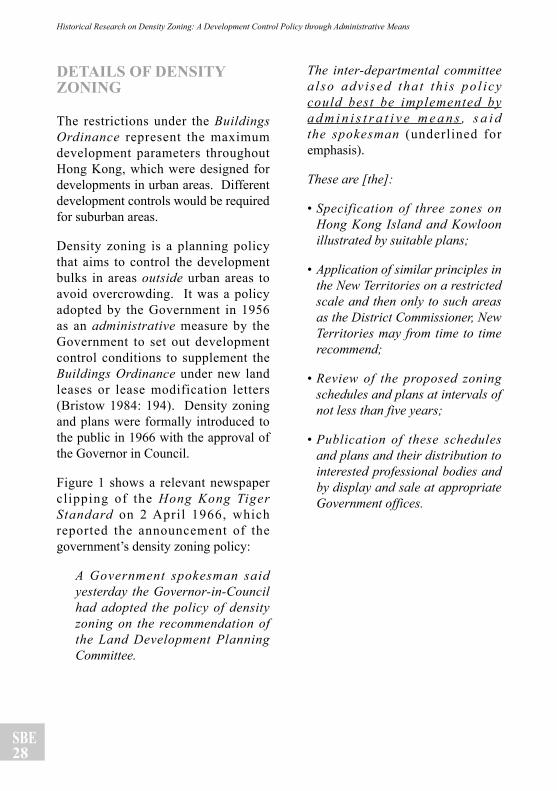
Density zoning is a planning policy that aims to control the development bulks in areas outside urban areas to avoid overcrowding. It was a policy adopted by the Government in 1956 as an administrative measure by the Government to set out development control conditions to supplement the Buildings Ordinance under new land leases or lease modification letters (Bristow 1984: 194). Density zoning and plans were formally introduced to the public in 1966 with the approval of the Governor in Council.
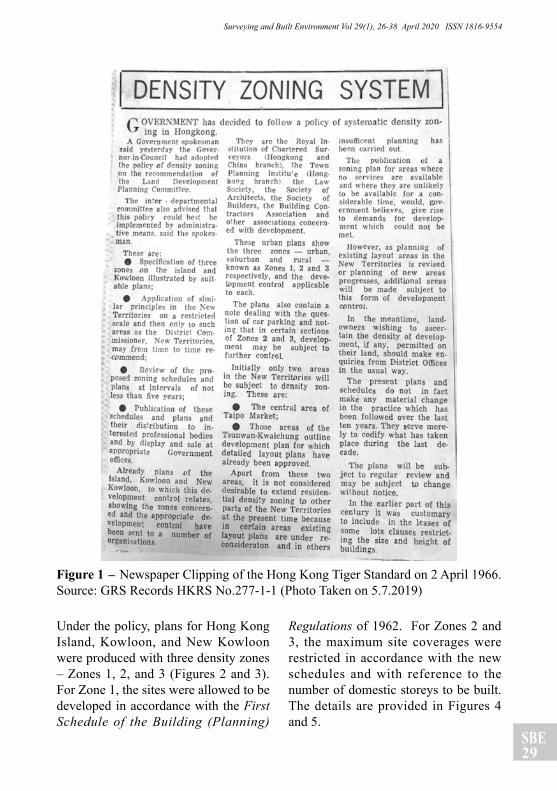
Figure 1 shows a relevant newspaper clipping of the Hong Kong Tiger Standard on 2 April 1966, which reported the announcement of the government’s density zoning policy:
A Government spokesman said yesterday the Governor-in-Council had adopted the policy of density zoning on the recommendation of the Land Development Planning Committee.
The inter-departmental committee a l so adv ised tha t th i s po l icy could best be implemented by a d m i n i s t r a t i v e m e a n s , s a i d the spokesman (underlined for emphasis).
These are [the]:
• Specification of three zones on Hong Kong Island and Kowloon illustrated by suitable plans;
• Application of similar principles in the New Territories on a restricted scale and then only to such areas as the District Commissioner, New Territories may from time to time recommend;
• Review of the proposed zoning schedules and plans at intervals of not less than five years;
• Publication of these schedules and plans and their distribution to interested professional bodies and by display and sale at appropriate Government offices.
SBE29
Surveying and Built Environment Vol 29(1), 26-38 April 2020 ISSN 1816-9554
Figure 1 - Newspaper Clipping of the Hong Kong Tiger Standard on 2 April 1966. Source: GRS Records HKRS No.277-1-1 (Photo Taken on 5.7.2019)
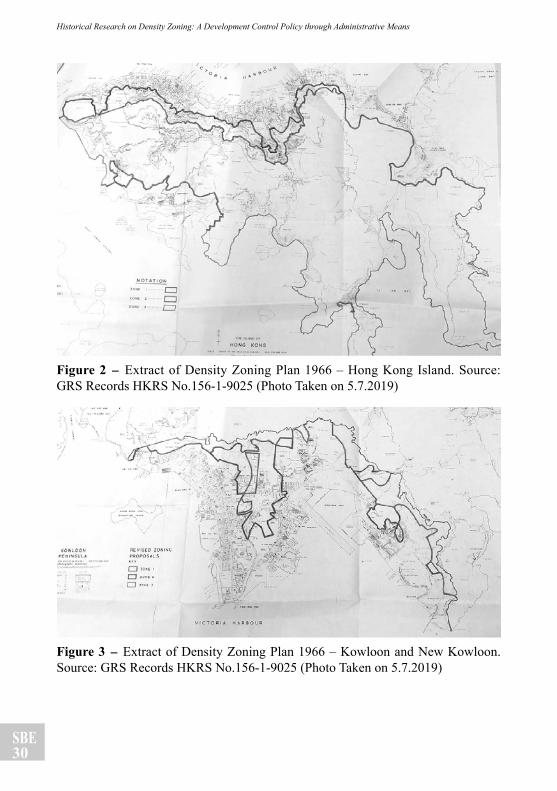
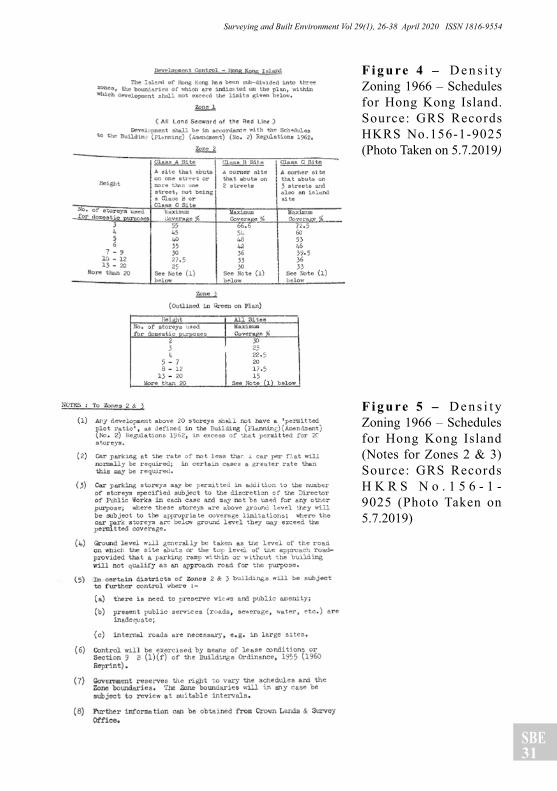
Under the policy, plans for Hong Kong Island, Kowloon, and New Kowloon were produced with three density zones – Zones 1, 2, and 3 (Figures 2 and 3). For Zone 1, the sites were allowed to be developed in accordance with the First Schedule of the Building (Planning)
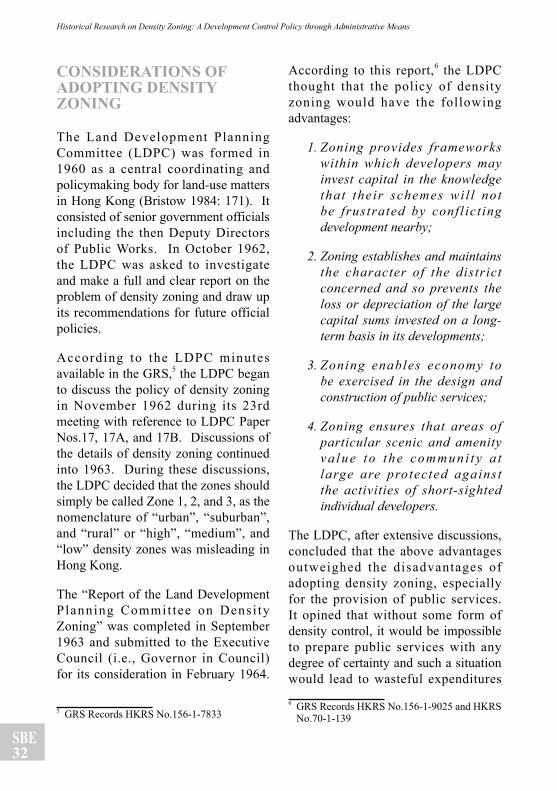
Regulations of 1962. For Zones 2 and 3, the maximum site coverages were restricted in accordance with the new schedules and with reference to the number of domestic storeys to be built. The details are provided in Figures 4 and 5.
SBE30
Historical Research on Density Zoning: A Development Control Policy through Administrative Means
Figure 2 - Extract of Density Zoning Plan 1966 – Hong Kong Island. Source: GRS Records HKRS No.156-1-9025 (Photo Taken on 5.7.2019)
Figure 3 - Extract of Density Zoning Plan 1966 – Kowloon and New Kowloon. Source: GRS Records HKRS No.156-1-9025 (Photo Taken on 5.7.2019)
SBE31
Surveying and Built Environment Vol 29(1), 26-38 April 2020 ISSN 1816-9554
F i g u re 4 - D e n s i t y Zoning 1966 – Schedules for Hong Kong Island. Source: GRS Records HKRS No.156-1-9025 (Photo Taken on 5.7.2019)
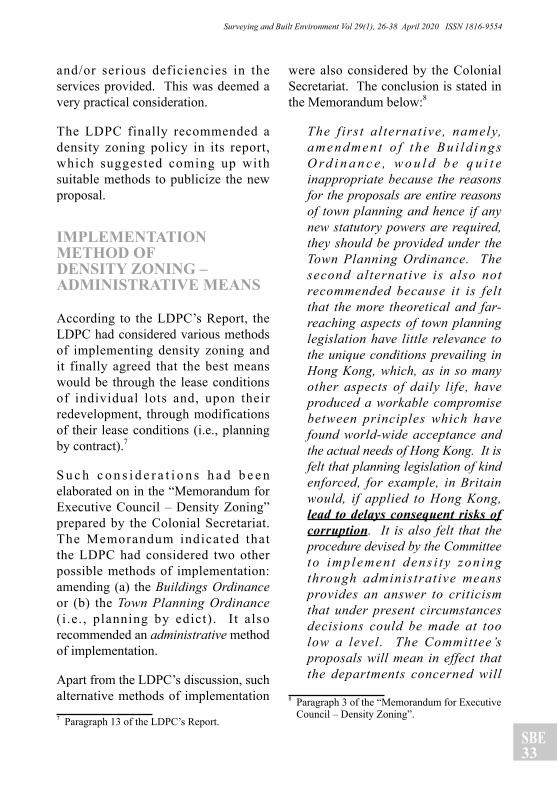
F i g u re 5 - D e n s i t y Zoning 1966 – Schedules for Hong Kong Island (Notes for Zones 2 & 3) Source: GRS Records H K R S N o . 1 5 6 - 1 -9025 (Photo Taken on 5.7.2019)
SBE32
Historical Research on Density Zoning: A Development Control Policy through Administrative Means
CONSIDERATIONS OF ADOPTING DENSITY ZONING
The Land Development Planning Committee (LDPC) was formed in 1960 as a central coordinating and policymaking body for land-use matters in Hong Kong (Bristow 1984: 171). It consisted of senior government officials including the then Deputy Directors of Public Works. In October 1962, the LDPC was asked to investigate and make a full and clear report on the problem of density zoning and draw up its recommendations for future official policies.
According to the LDPC minutes available in the GRS,5 the LDPC began to discuss the policy of density zoning in November 1962 during its 23rd meeting with reference to LDPC Paper Nos.17, 17A, and 17B. Discussions of the details of density zoning continued into 1963. During these discussions, the LDPC decided that the zones should simply be called Zone 1, 2, and 3, as the nomenclature of “urban”, “suburban”, and “rural” or “high”, “medium”, and “low” density zones was misleading in Hong Kong.
The “Report of the Land Development Planning Commit tee on Densi ty Zoning” was completed in September 1963 and submitted to the Executive Council (i.e., Governor in Council) for its consideration in February 1964.
5 GRS Records HKRS No.156-1-7833
According to this report,6 the LDPC thought that the policy of density zoning would have the following advantages:
1. Zoning provides frameworks within which developers may invest capital in the knowledge that the ir schemes wi l l not be frustrated by confl ict ing development nearby;
2. Zoning establishes and maintains the character of the district concerned and so prevents the loss or depreciation of the large capital sums invested on a long-term basis in its developments;
3. Zoning enables economy to be exercised in the design and construction of public services;
4. Zoning ensures that areas of particular scenic and amenity va lue t o t he commun i t y a t large are protected against the activities of short-sighted individual developers.
The LDPC, after extensive discussions, concluded that the above advantages outweighed the disadvantages of adopting density zoning, especially for the provision of public services. It opined that without some form of density control, it would be impossible to prepare public services with any degree of certainty and such a situation would lead to wasteful expenditures 6 GRS Records HKRS No.156-1-9025 and HKRS
No.70-1-139
SBE33
Surveying and Built Environment Vol 29(1), 26-38 April 2020 ISSN 1816-9554
and/or serious deficiencies in the services provided. This was deemed a very practical consideration.
The LDPC finally recommended a density zoning policy in its report, which suggested coming up with suitable methods to publicize the new proposal.
IMPLEMENTATION METHOD OF DENSITY ZONING – ADMINISTRATIVE MEANS
According to the LDPC’s Report, the LDPC had considered various methods of implementing density zoning and it finally agreed that the best means would be through the lease conditions of individual lots and, upon their redevelopment, through modifications of their lease conditions (i.e., planning by contract).7
S u c h c o n s i d e r a t i o n s h a d b e e n elaborated on in the “Memorandum for Executive Council – Density Zoning” prepared by the Colonial Secretariat. The Memorandum indicated that the LDPC had considered two other possible methods of implementation: amending (a) the Buildings Ordinance or (b) the Town Planning Ordinance ( i .e. , planning by edict). I t also recommended an administrative method of implementation.
Apart from the LDPC’s discussion, such alternative methods of implementation 7 Paragraph 13 of the LDPC’s Report.
were also considered by the Colonial Secretariat. The conclusion is stated in the Memorandum below:8
The f irs t al ternative, namely, a m e n d m e n t o f t h e B u i l d i n g s O rd i n a n c e , w o u l d b e q u i t e inappropriate because the reasons for the proposals are entire reasons of town planning and hence if any new statutory powers are required, they should be provided under the Town Planning Ordinance. The second alternative is also not recommended because it is felt that the more theoretical and far-reaching aspects of town planning legislation have little relevance to the unique conditions prevailing in Hong Kong, which, as in so many other aspects of daily life, have produced a workable compromise between principles which have found world-wide acceptance and the actual needs of Hong Kong. It is felt that planning legislation of kind enforced, for example, in Britain would, if applied to Hong Kong, lead to delays consequent risks of corruption. It is also felt that the procedure devised by the Committee t o imp lemen t dens i t y zon ing through administrative means provides an answer to criticism that under present circumstances decisions could be made at too low a level. The Committee’s proposals will mean in effect that the departments concerned will
8 Paragraph 3 of the “Memorandum for Executive Council – Density Zoning”.
SBE34
Historical Research on Density Zoning: A Development Control Policy through Administrative Means
be following the rules clearly laid down by the Governor in Council, without renouncing the system of administrative control which has the great advantage of flexibility to meet Hong Kong’s ever-changing circumstances and needs. It will thus be possible for the Governor in Council to review the rules from time to time and to modify them as circumstances change, without having to resort, on each occasion, to fresh legislation. For the above reasons the Committee’s suggested approach is recommended for the approval of Honourable Members…(underlined for emphasis)
The above conclusion clearly showed the advantages of adopting planning by contract over planning by edict to implement density zoning during the 1960s. The advantages of implementing this through administrative means are summarized in four points:
• Flexibility• Avoids delays• Avoids the risk of corruption• Clear directions from the Governor in
Council
However, as shown in the “Notes for Zones 2 & 3” of the adopted density zoning schedule (Figure 5), the policy of densi ty zoning would also be exercised by means of Section 9B(1)(f) of the Buildings Ordinance of 1955 (1960 Reprint). Subsequently, the said section has become known as Section 16(1)(g) of the Buildings Ordinance. The current version of Section 16(1)(g)
is provided below:
The Building Authority may refuse to give his approval of any plans of building works where — (g) the carrying out of the building works shown thereon would result in a building differing in height, design, type or intended use from buildings in the immediate neighbourhood or previously existing on the same site.
In accordance with the “Memorandum for Executive Council – Density Zoning,” the Deputy Director of Public Works (Buildings & Lands) explained that the power of the Building Authority under Section 9B(1)(f), which had long been a feature of the Buildings Ordinance, would continue to be used only on rare occasions and then only after very careful considerations. The LDPC considered that such a section was essential as a safeguard to prevent unrestricted lots from being intensively redeveloped with the effects stated in Section 9B(1)(f).
The above showed that there were limitations under planning by contract and the Buildings Ordinance could be the “last resort” of development control by government.
PUBLICITY FOR DENSITY ZONING
Publicity was also a major concern for the policy of density zoning. In its report,9 the LDPC suggested:9 Paragraph 14 of the LDPC’s Report.
SBE35
Surveying and Built Environment Vol 29(1), 26-38 April 2020 ISSN 1816-9554
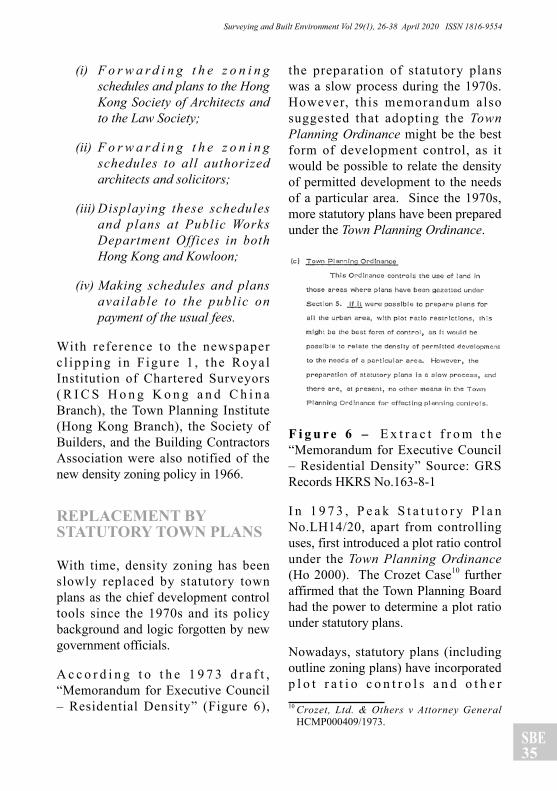
(i) F o r w a r d i n g t h e z o n i n g schedules and plans to the Hong Kong Society of Architects and to the Law Society;
(ii) F o r w a r d i n g t h e z o n i n g schedules to all authorized architects and solicitors;
(iii) Displaying these schedules and plans at Public Works Department Offices in both Hong Kong and Kowloon;
(iv) Making schedules and plans available to the public on payment of the usual fees.
With reference to the newspaper c l ipp ing in F igure 1 , the Royal Institution of Chartered Surveyors ( R I C S H o n g K o n g a n d C h i n a Branch), the Town Planning Institute (Hong Kong Branch), the Society of Builders, and the Building Contractors Association were also notified of the new density zoning policy in 1966.
REPLACEMENT BY STATUTORY TOWN PLANS
With time, density zoning has been slowly replaced by statutory town plans as the chief development control tools since the 1970s and its policy background and logic forgotten by new government officials.
A c c o r d i n g t o t h e 1 9 7 3 d r a f t , “Memorandum for Executive Council – Residential Density” (Figure 6),
the preparation of statutory plans was a slow process during the 1970s. However, this memorandum also suggested that adopting the Town Planning Ordinance might be the best form of development control, as it would be possible to relate the density of permitted development to the needs of a particular area. Since the 1970s, more statutory plans have been prepared under the Town Planning Ordinance.
F i g u r e 6 - E x t r a c t f r o m t h e “Memorandum for Executive Council – Residential Density” Source: GRS Records HKRS No.163-8-1
I n 1 9 7 3 , P e a k S t a t u t o r y P l a n No.LH14/20, apart from controlling uses, first introduced a plot ratio control under the Town Planning Ordinance (Ho 2000). The Crozet Case10 further affirmed that the Town Planning Board had the power to determine a plot ratio under statutory plans.
Nowadays, statutory plans (including outline zoning plans) have incorporated p l o t r a t i o c o n t r o l s a n d o t h e r 10 Crozet, Ltd. & Others v Attorney General
HCMP000409/1973.
SBE36
Historical Research on Density Zoning: A Development Control Policy through Administrative Means
development control parameters (e.g. height) into different zones. Statutory plans have become major development control tools and lease (land grant) conditions often follow development parameters under the prevai l ing statutory plans. The importance of density zoning has decreased.
CURRENT APPLICATION OF DENSITY ZONING
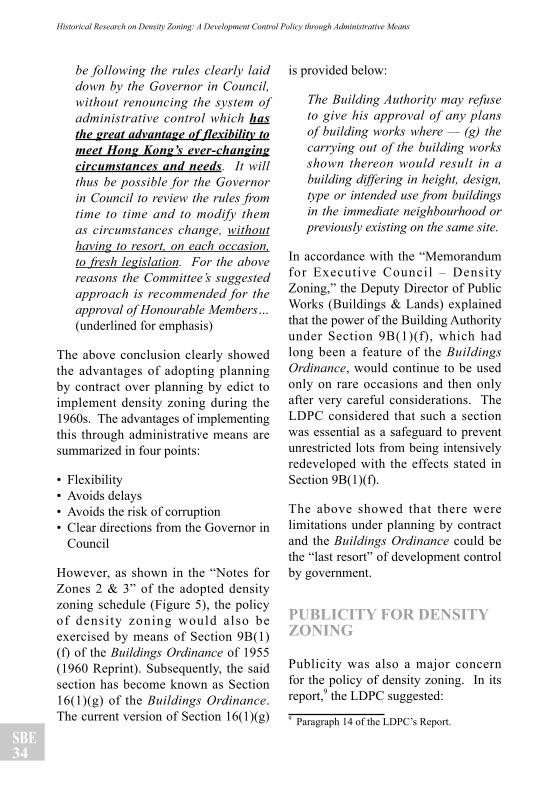
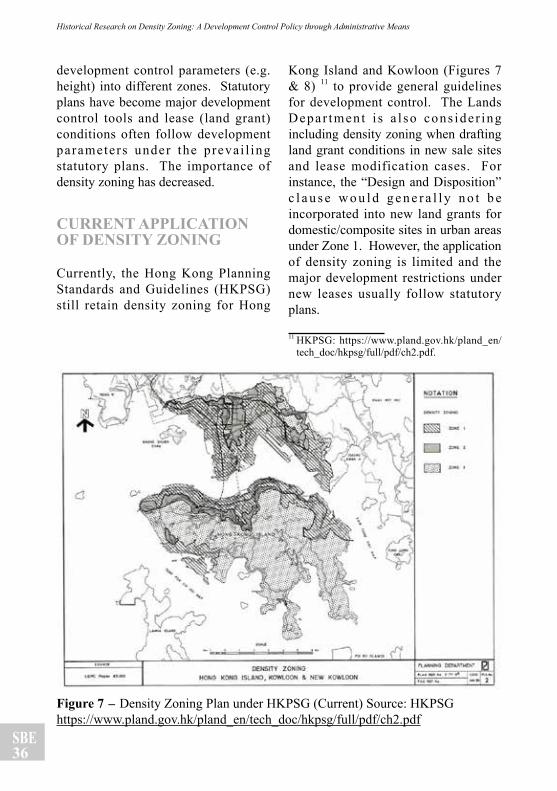
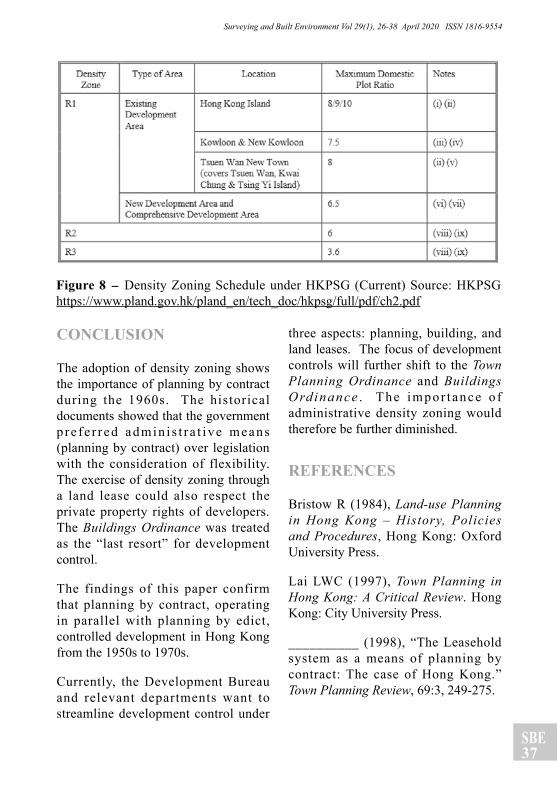
Currently, the Hong Kong Planning Standards and Guidelines (HKPSG) still retain density zoning for Hong
Kong Island and Kowloon (Figures 7 & 8) 11 to provide general guidelines for development control. The Lands Depar tment i s a l so cons ide r ing including density zoning when drafting land grant conditions in new sale sites and lease modification cases. For instance, the “Design and Disposition” c l a u s e w o u l d g e n e r a l l y n o t b e incorporated into new land grants for domestic/composite sites in urban areas under Zone 1. However, the application of density zoning is limited and the major development restrictions under new leases usually follow statutory plans.
11 HKPSG: https://www.pland.gov.hk/pland_en/tech_doc/hkpsg/full/pdf/ch2.pdf.
Figure 7 - Density Zoning Plan under HKPSG (Current) Source: HKPSG https://www.pland.gov.hk/pland_en/tech_doc/hkpsg/full/pdf/ch2.pdf
SBE37
Surveying and Built Environment Vol 29(1), 26-38 April 2020 ISSN 1816-9554
Figure 8 - Density Zoning Schedule under HKPSG (Current) Source: HKPSG https://www.pland.gov.hk/pland_en/tech_doc/hkpsg/full/pdf/ch2.pdf
CONCLUSION
The adoption of density zoning shows the importance of planning by contract during the 1960s. The historical documents showed that the government p re fe r red admin i s t r a t ive means (planning by contract) over legislation with the consideration of flexibility. The exercise of density zoning through a land lease could also respect the private property rights of developers. The Buildings Ordinance was treated as the “last resort” for development control.
The findings of this paper confirm that planning by contract, operating in parallel with planning by edict, controlled development in Hong Kong from the 1950s to 1970s.
Currently, the Development Bureau and relevant departments want to streamline development control under
three aspects: planning, building, and land leases. The focus of development controls will further shift to the Town Planning Ordinance and Buildings Ord inance . The impor tance o f administrative density zoning would therefore be further diminished.
REFERENCES
Bristow R (1984), Land-use Planning in Hong Kong – History, Policies and Procedures, Hong Kong: Oxford University Press.
Lai LWC (1997), Town Planning in Hong Kong: A Critical Review. Hong Kong: City University Press.
__________ (1998), “The Leasehold system as a means of planning by contract: The case of Hong Kong.” Town Planning Review, 69:3, 249-275.
SBE38
Historical Research on Density Zoning: A Development Control Policy through Administrative Means
__________ (2002), “Planning and property rights in Hong Kong under constitutional capitalism.” International Planning Studies, 7:3, 213-225
__________ (2004), “Spontaneous catallaxis in urban & rural development under planning by contract in a small open economy: The ideas of Hayek and Mises at work in town & country planning in Hong Kong.” The Review of Austrian Economics, 17:2/3, 155-186.
__________ (2005), “Planning by contract: the leasehold foundation of a comprehensively planned capitalist land market.” Economic Affairs, 25:4, 16-18.
__________ (2010), “A model of planning by contract: Integrating comprehensive state planning, freedom of contract, public participation and fidelity.” Town Planning Review, 8:6, 647-673.
Lai LWC and Chau KW (2019) , “A reinterpretation of Coase’s land monopoly model: Locational specificity and the betterment potential of land as de jure and de facto property.” Progress in Planning 131, 1-15.
GRS Records. HKRS No.70-1-139 HOUSING, HOUSING DENSITY ZONING.
__________. HKRS No.156-1-9025 DENSITY ZONING - DEVELOPMENT (HEIGHT) CONTROL - GENERAL QUESTIONS ON
__________. HKRS No.163-8-1 RESIDENTIAL PLOT RATIOS - BUILDING (PLANNING) AMAT REGS.
__________. K R S N o . 2 7 7 - 1 - 1 DENSITY ZONING - HONG KONG ISLAND, KOWLOON AND NEW KOWLOON.
Ho CK (2000) , Cont rac tua l and Statutory Planning In Hong Kong: The Evolution of OZPs Hong Kong: HKU Dissertation.
Rober ts PJ (1975) , Valuat ion of Development Land in Hong Kong, Hong Kong: Hong Kong University Press.
SBE39
Technical Notes
Provision of Public Toilet Facilities at Bus Terminus: an Initial StudyPolycarp Alvin C.W. Cheung1, Anson Yu2 and Kenny Law3
ABSTRACT
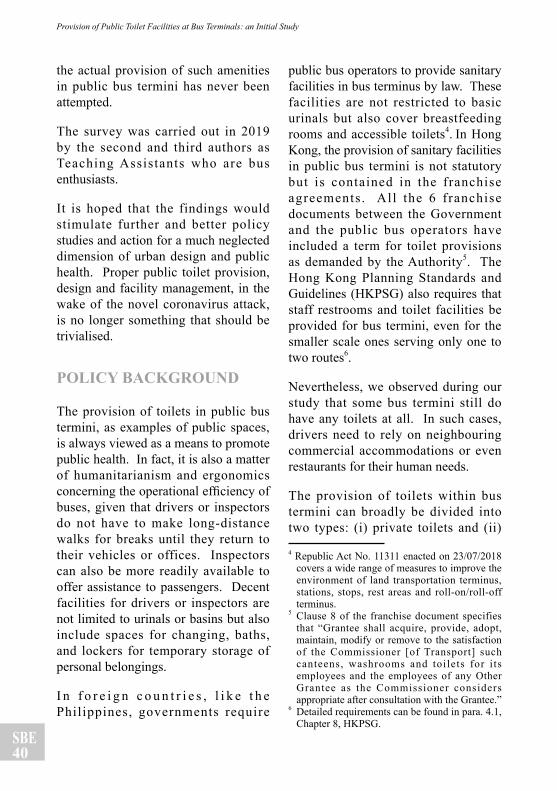
Out of concern for public health and ergonomics and as a matter of social justice and productivity, this technical note shows the basic results of site inspections on the provision of toilet facilities at a sample of 27 public bus termini in different districts of Hong Kong from March to June 2019. All except 4 of the surveyed sites were used by franchised buses. In brief, 12 termini were found to have no public toilet facilities and 8 had a subjective hygiene scores judged by the authors to be less than 50%.
KEYWORDS
Bus terminus, public health, ergonomics, social justice, toilets
BACKGROUND
A bus terminus is a place not just for a large number of buses but also for a huge number of bus passengers, bus drivers and traffic controllers. Proper and adequate public toilets, smoking, catering and sitting out facilities for them are essential especially for a city which is said to be world-class. However, hitherto, a study on
1 Estate Surveyor; Ph.D candidate, Department of Real Estate & Construction, University of Hong Kong.
2 Teaching Assistant, Department of Real Estate & Construction, University of Hong Kong.3 Research Assistant, Department of Real Estate & Construction, University of Hong Kong.
SBE40
Provision of Public Toilet Facilities at Bus Terminals: an Initial Study
the actual provision of such amenities in public bus termini has never been attempted.
The survey was carried out in 2019 by the second and third authors as Teaching Assistants who are bus enthusiasts.
It is hoped that the findings would stimulate further and better policy studies and action for a much neglected dimension of urban design and public health. Proper public toilet provision, design and facility management, in the wake of the novel coronavirus attack, is no longer something that should be trivialised.
POLICY BACKGROUND
The provision of toilets in public bus termini, as examples of public spaces, is always viewed as a means to promote public health. In fact, it is also a matter of humanitarianism and ergonomics concerning the operational efficiency of buses, given that drivers or inspectors do not have to make long-distance walks for breaks until they return to their vehicles or offices. Inspectors can also be more readily available to offer assistance to passengers. Decent facilities for drivers or inspectors are not limited to urinals or basins but also include spaces for changing, baths, and lockers for temporary storage of personal belongings.
I n f o r e i g n c o u n t r i e s , l i k e t h e Philippines, governments require
public bus operators to provide sanitary facilities in bus terminus by law. These facilities are not restricted to basic urinals but also cover breastfeeding rooms and accessible toilets4. In Hong Kong, the provision of sanitary facilities in public bus termini is not statutory but is contained in the franchise agreements. All the 6 franchise documents between the Government and the public bus operators have included a term for toilet provisions as demanded by the Authority5. The Hong Kong Planning Standards and Guidelines (HKPSG) also requires that staff restrooms and toilet facilities be provided for bus termini, even for the smaller scale ones serving only one to two routes6.
Nevertheless, we observed during our study that some bus termini still do have any toilets at all. In such cases, drivers need to rely on neighbouring commercial accommodations or even restaurants for their human needs.
The provision of toilets within bus termini can broadly be divided into two types: (i) private toilets and (ii)
4 Republic Act No. 11311 enacted on 23/07/2018 covers a wide range of measures to improve the environment of land transportation terminus, stations, stops, rest areas and roll-on/roll-off terminus.
5 Clause 8 of the franchise document specifies that “Grantee shall acquire, provide, adopt, maintain, modify or remove to the satisfaction of the Commissioner [of Transport] such canteens, washrooms and toilets for i ts employees and the employees of any Other Grantee as the Commissioner considers appropriate after consultation with the Grantee.”
6 Detailed requirements can be found in para. 4.1, Chapter 8, HKPSG.
SBE41
Surveying and Built Environment Vol 29(1), 39-77 April 2020 ISSN 1816-9554
public toilets. Usage of (i) is restricted to the staff or authorised persons of the bus companies. These premises were ei ther in the form of f ixed structures owned by the Government and leased to bus companies via the Government Property Agency (GPA) to accommodate their daily operations, or in the form of mobile pre-fabricated kiosks erected over vacant land. For the latter, the bus company pays for the rent of vacant government land to Lands Department instead of renting the structures thereon. In both cases, the bus companies will have to arrange for the daily management and cleaning of the premises. The rent payable for (i) is not nominal and is included in the operating costs of bus companies, while may be subsidised by the Government on a yearly basis.
Type ( i i ) r e f e r s t o t o i l e t s w i th unrestricted access and are open to the public use during opening hours of the bus termini. Most of them are constructed and managed by the Food and Environmental Hygiene Department (FEHD) to serve drivers, passengers, and anyone else free of charge, thus achieving a higher social purpose. This type of accommodation is commonly found in larger termini or transport interchanges.
RESEARCH CONTEXT
Past researches on working environments has always regard toilets as basic w e l f a r e f a c i l i t i e s p r o v i d e d b y employers. It has been established
that their availably and standards are highly correlated with working attitudes (Sembe and Ayuo 2017; Carlopio 1996), and job satisfaction (Ozturkoglu et al. 2016; Abdullah et al. 2007; Martel and Dupuis 2006). Inadequate or filthy toilets are always criticised for their adverse effects on productivity (Rothwell 1982) and eventually result in high turnover rates of employees (Rajan and Chandrasekaran 2013).
The need for comprehensive transport station facilities, which are not limited to toilets, has been widely addressed by researchers. For example, Jones (1995) stated that inadequate or non-provision of toilet facilities in bus terminus directly affected drivers’ experiences, which eventually posed safety risks to the public (Rowden et al. 2011). Jones (1995) also described that in some occasions drivers have to resort to street urination in the absence of proper toilets in the vicinity, and this left a bad impression on transit passengers.
A similar study was conducted by Greed and Daniels (2002) regarding public toilet provision along transit routes in Portishead of the U.K. In the paper, they highlighted the importance of toilets to bus drivers, especially those serving on routes which neither start nor end at depots. Some of these ‘new’ routes start at places where toilets are not readily available. A lack of toilet facilities at terminus is usually associated with complaints such as inconvenience, storage of personal belongings (Greed and Daniels 2002) and not conducive to with urban
SBE42
Provision of Public Toilet Facilities at Bus Terminals: an Initial Study
sustainability policies (Greed 2004) since it discourages the public from using public transport.
Besides adequate toilet provision in bus terminus, proper building designs such as sufficient lighting and efficient flushing devices (Siu (2006)), appropriate cleaning strategies (McGinnis et al (2019)), maintaining good air quality (Ohagim et al (2017)), as well as comprehensive sterilization (Alonge et al (2019)), are equally important for public toilets. Toilets have long been regarded as a breeding ground for a variety of germs and virus such as the highly contagious Staphylococcus, Legionnaires’ disease and Norovirus, which can infect human bodies via direct contact or airborne (a.k.a. ‘aerosol’) transmission. Worse still, previous research such as Adewoyin et al (2013) and Opere et al (2013) has demonstrated that some of these bacteria were antibiotic-resistant. These pathogens might pose severe a public health hazard to the community thanks to the high population density of our city.
The need for proper sanitary treatment for public toilets has been stressed in the literature. Flores et al (2011), McGinnis et al (2019) and Alonge et al (2019) revealed that toilet seats and door handles contained the highest bacterial population in public toilets despite daily cleaning, based on surface samples collected from public toilets in Colorado, Abuja, and Kathmandu respectively. Sampson et al (2019), on the other hand, discovered that water
contained inside a toilet bowl contained higher loads of bacteria than its surface. Furthermore, the waterborne Legionella (the pathogen of Legionnaires’ disease) were known to survive and grow in aquatic environments such as the cooling towers (Shelton et al (1994)) of air-conditioning systems, plumbing systems (Dennis et al (1982)) and toilet tanks (Holy et al (2013)). This disease was recently brought to public attention following an outbreak in the cooling tower of a railway station causing 11 infected in February 2020.
TERMINI INSPECTED
The 27 bus termini selected for this study are listed as follows:-
1. Kwai Shing Central Bus Terminus (葵盛中巴士總站)
2. Kwai Fong Station Bus Terminus (葵芳站巴士總站)
3. Riviera Gardens Bus Terminus (海濱花園總站)
4. Sea Crest Villa Bus Terminus (浪翠園巴士總站)
5. Lung Mun Oasis Bus Terminus (龍門居總站)
6. City One Shatin (沙田第一城)
7. Island Harbourview Bus Terminus (維港灣巴士總站)
8. Mong Kok East Station Bus Terminus (旺角東站巴士總站)
SBE43
Surveying and Built Environment Vol 29(1), 39-77 April 2020 ISSN 1816-9554
9. Lam Tin Public Transport Interchange (藍田公共運輸交匯處)
10. Laguna Verde Bus Terminus (海逸豪園巴士總站)
11. China Ferry Terminal Bus Terminus (中港碼頭總站)
12. Telford Gardens Bus Terminus (德福花園總站)
13. Exchange Square Bus Terminus (交易廣場巴士總站)
14. Wah Fu (South) (華富(南))
15. South Horizons Bus Terminus (海怡半島巴士總站)
16. Sai Wan Ho (Grand Promenade) (西灣河(嘉亨灣))
17. Tung Chung Town Centre Bus Terminus / Tung Chung Station Bus Terminus (東涌市中心巴士總站 /東涌站巴士總站)
18. Tung Chung Temporary Bus Terminus (東涌臨時巴士總站)
19. DB Plaza Bus Terminus (愉景廣場巴士總站)
20. DB North Plaza (愉景北商場)
21. Ma Wan (Tung Wan Bus Terminus) 馬灣(東灣巴士總站)
22. Allway Gardens Bus Terminus (荃威花園總站)
23. Quarry Bay Bus Terminus (鰂魚涌巴士總站)
24. Shau Kei Wan Bus Terminus (筲箕灣巴士總站)
25. Yiu Tung Estate (耀東邨)
26. Mui Wo Ferry Pier (梅窩碼頭)
27. Lee On Bus Terminus (利安巴士總站)
(The naming of each station is adapted from the route directory published by respective bus operators)
FINDINGS
The findings for each bus terminus are shown in Appendix 1.
CONCLUSION
It is hoped that these technical notes, based on a preliminary study covering 25 bus termini in Hong Kong, would provide some informed points of interest to stimulate further and better research and policy action in an area that affects public health and general welfare. In Hong Kong, Distr ict Councils are good avenues to articulate policy actions for such practical ordinary issues of public interest.
SBE44
Provision of Public Toilet Facilities at Bus Terminals: an Initial Study
REFERENCES
Abdullah MA, Khalid HN, Shuib M, Md Nor N, Muhammad Z, and Jauhar J (2007), “Job satisfaction amongst employees in Small and Medium Industries (SMIs) in the manufacturing sector: A Malaysian case,” Journal of Asia-Pacific Business, 8(4), 39-66.
A d e w o y i n A , M a j o l a g b e O , Ogunmoyewa T, and Abej ide M (2013), “Antibiotic resistance profile of microbial isolates of toilet-bowl of some students’ hostels in Ogbomoso, Nigeria,” European Journal of Applied Sciences, 5(3), 76-79.
Alonge O, Auwal B, and Aboh M (2019), “Bacterial contamination of toilet door handles on Baze University campus Abuja Nigeria ,” African Journal of Clinical and Experimental Microbiology, 20 (1), 35-41.
Carlopio JR (1996), “Construct validity of a physical work environment satisfaction questionnaire,” Journal of Occupational Health Psychology, 1:3, 330–344.
Dennis P, Fitzgeorge R, Taylor J, Bartlett C, and Barrow G (1982), “Legionella pneumophila in water plumbing systems,” The Lancet , 319(8278), 949-951.
Flores GE, Bates ST, Knights D, Lauber CL, Stombaugh J, Knight R, and Fierer N (2011), “Microbial biogeography of public restroom surfaces,” PLoS ONE, 6(11).
Greed C and Danials I (2002), User and Provider Perspectives on Public Toilet Provision, University of the West of England, Bristol.
Greed C (2004), “Public toilets: the need for compulsory provision,” Paper presented at the Proceedings of the Institution of Civil Engineers-Municipal Engineers.
Holy O, Matouskova I, and Juraskova E (2014), “Risk of hospital-acquired L e g i o n e l l o s i s f r o m m i c r o b i a l contamination of potable water at a Bone Marrow Transplant Unit in a Czech University Hospital,” Journal of Water Chemistry and Technology, 36(5), 247-251.
Jones R (1995), Ambivalent journey: US migration and economic mobility in North-Central Mexico, University of Arizona Press.
Martel JP and Dupuis G (2006), Quality of work life: Theoretical and methodological problems, and presentation of a new model and measuring instrument. Social Indicators Research, 77:2, 333-368.
McGinnis S, Marini D, Amatya P, and Murphy HM (2019), “Bacterial contamination on latrine surfaces in community and household latrines in Kathmandu, Nepal,” International journal of environmental research and public health, 16(2), 257.
Ohagim PI, Ikon GM, Matthew PC, and Ohagim, GA (2017), “Microbiological
SBE45
Surveying and Built Environment Vol 29(1), 39-77 April 2020 ISSN 1816-9554
assessment of indoor air in public toilets across selected motor parks in Owerri Metropolis, Nigeria,” Journal of Microbiology & Experimentation, 5(6), 166.
Opere BO, Ojo JO, Omonighehin E, and Bamidele M (2013), “Antibiotic susceptibility and plasmid profile analysis of pathogenic bacteria isolated from environmental surfaces in public toilets,” Transnational Journal of Science and Technology, 3(2), 22-30.
Oztu rkog lu O , Sayg ı l ı EE , and Ozturkoglu Y (2016), “A manufacturing-oriented model for evaluating the satisfaction of workers–Evidence from Turkey,” International Journal of Industrial Ergonomics, 54, 73-82.
Rajan D and Chandrasekaran K (2013), “Turnover among nurses in private hospitals,” Asian Journal of Research in Social Sciences and Humanities, 3:10, 186-207.
Rothwell S (1982), “Productivity improvement through reduced labour turnover,” Long Range Planning, 15:2, 67-76.
Rowden P, Matthews G, Watson B, and Biggs H (2011), “The relative impact of work-related stress, life stress and driving environment stress on driving outcomes,” Accident Analysis and Prevention, 43:4, 1332-1340.
Sampson T, Esheyigba A, and Baridam S (2019), “Bacteriological Assessment o f To i l e t S e a t s i n a N i g e r i a n University,” Journal of Advances in Microbiology, 19(4), 1-11.
Sembe F & Ayuo A (2017), “Effect of selected occupational health and safety management pract ices on job sat isfact ion of employees in university campuses in Nakuru Town, Kenya,” Journal of Human Resource Management, 5:5, 70-77.
Shelton BG, Flanders WD, and Morris GK (1994), “Legionnaires’ disease outbreaks and cooling towers with amplified Legionella concentrations,” Current Microbiology, 28(6), 359-363.
Siu KWM (2006), “Design quality of public toilet facilities,” International Journal of Reliability, Quality and Safety Engineering, 13(4), 341-354.
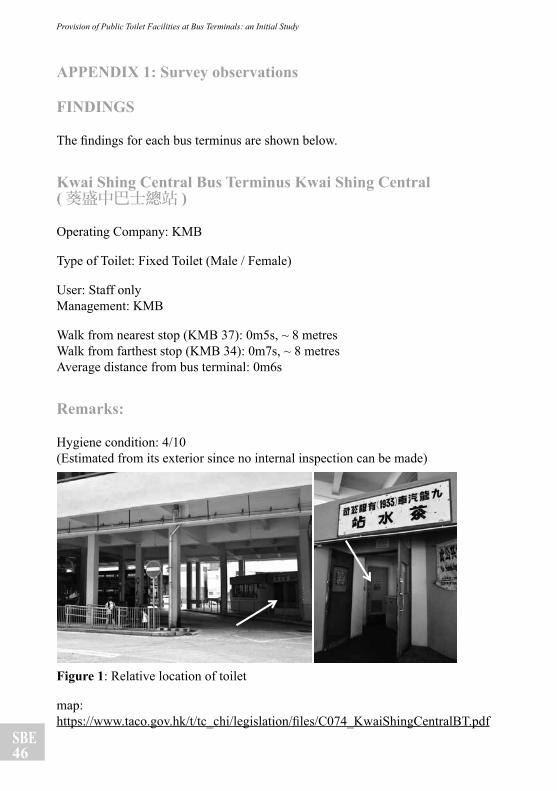
SBE46
Provision of Public Toilet Facilities at Bus Terminals: an Initial Study
APPENDIX 1: Survey observations
FINDINGS
The findings for each bus terminus are shown below.
Kwai Shing Central Bus Terminus Kwai Shing Central (葵盛中巴士總站 )
Operating Company: KMB
Type of Toilet: Fixed Toilet (Male / Female)
User: Staff onlyManagement: KMB
Walk from nearest stop (KMB 37): 0m5s, ~ 8 metresWalk from farthest stop (KMB 34): 0m7s, ~ 8 metresAverage distance from bus terminal: 0m6s
Remarks:
Hygiene condition: 4/10(Estimated from its exterior since no internal inspection can be made)
Figure 1: Relative location of toilet
map: https://www.taco.gov.hk/t/tc_chi/legislation/files/C074_KwaiShingCentralBT.pdf
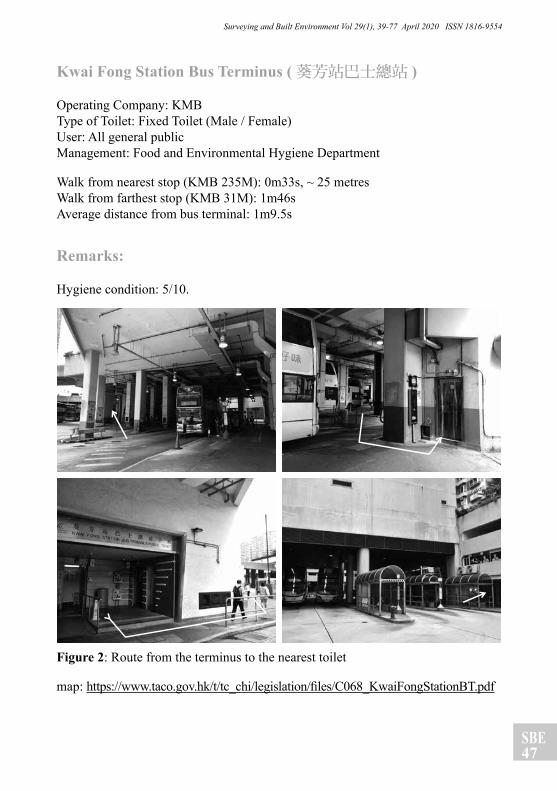
SBE47
Surveying and Built Environment Vol 29(1), 39-77 April 2020 ISSN 1816-9554
Kwai Fong Station Bus Terminus (葵芳站巴士總站 )
Operating Company: KMBType of Toilet: Fixed Toilet (Male / Female)User: All general publicManagement: Food and Environmental Hygiene Department
Walk from nearest stop (KMB 235M): 0m33s, ~ 25 metresWalk from farthest stop (KMB 31M): 1m46sAverage distance from bus terminal: 1m9.5s
Remarks:
Hygiene condition: 5/10.
Figure 2: Route from the terminus to the nearest toilet
map: https://www.taco.gov.hk/t/tc_chi/legislation/files/C068_KwaiFongStationBT.pdf
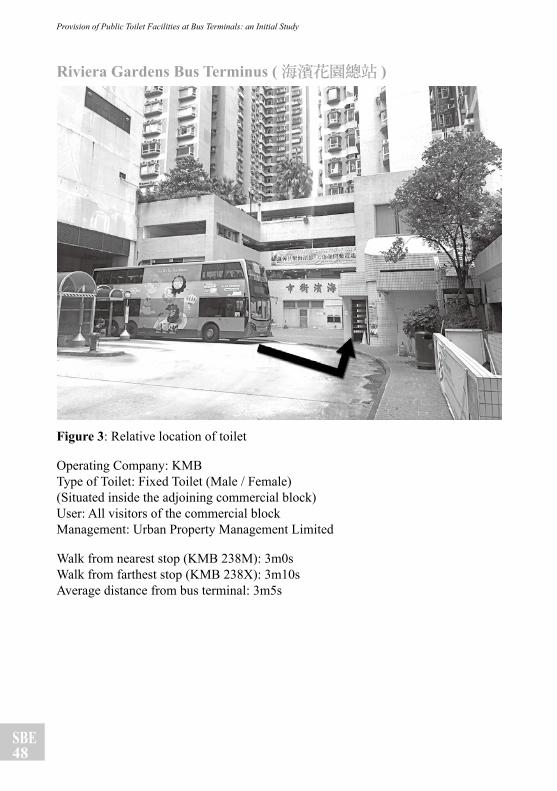
SBE48
Provision of Public Toilet Facilities at Bus Terminals: an Initial Study
Riviera Gardens Bus Terminus (海濱花園總站 )
Figure 3: Relative location of toilet
Operating Company: KMBType of Toilet: Fixed Toilet (Male / Female)(Situated inside the adjoining commercial block)User: All visitors of the commercial blockManagement: Urban Property Management Limited
Walk from nearest stop (KMB 238M): 3m0sWalk from farthest stop (KMB 238X): 3m10sAverage distance from bus terminal: 3m5s
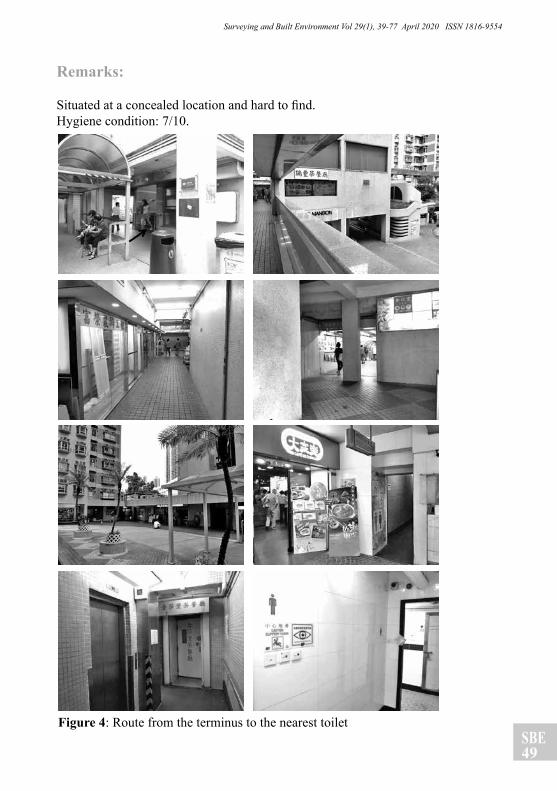
SBE49
Surveying and Built Environment Vol 29(1), 39-77 April 2020 ISSN 1816-9554
Remarks:
Situated at a concealed location and hard to find.Hygiene condition: 7/10.
Figure 4: Route from the terminus to the nearest toilet
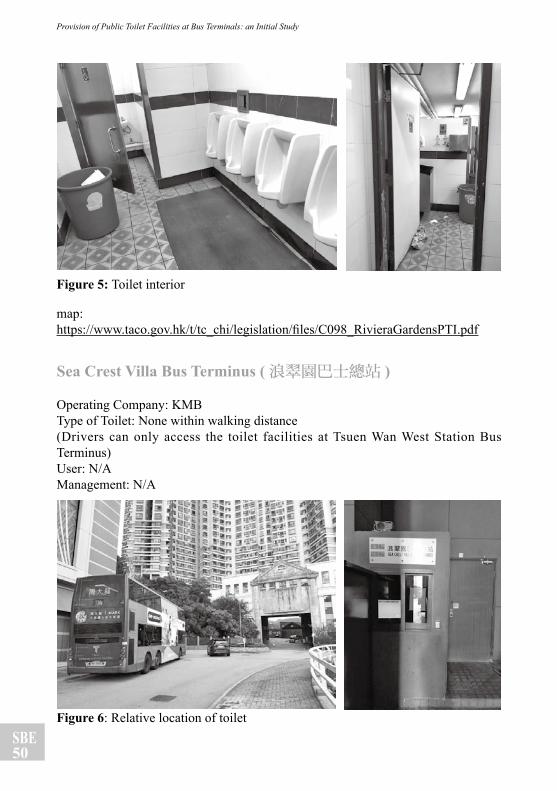
SBE50
Provision of Public Toilet Facilities at Bus Terminals: an Initial Study
Figure 5: Toilet interior
map: https://www.taco.gov.hk/t/tc_chi/legislation/files/C098_RivieraGardensPTI.pdf
Sea Crest Villa Bus Terminus (浪翠園巴士總站 )
Operating Company: KMBType of Toilet: None within walking distance(Drivers can only access the toilet facilities at Tsuen Wan West Station Bus Terminus)User: N/AManagement: N/A
Figure 6: Relative location of toilet
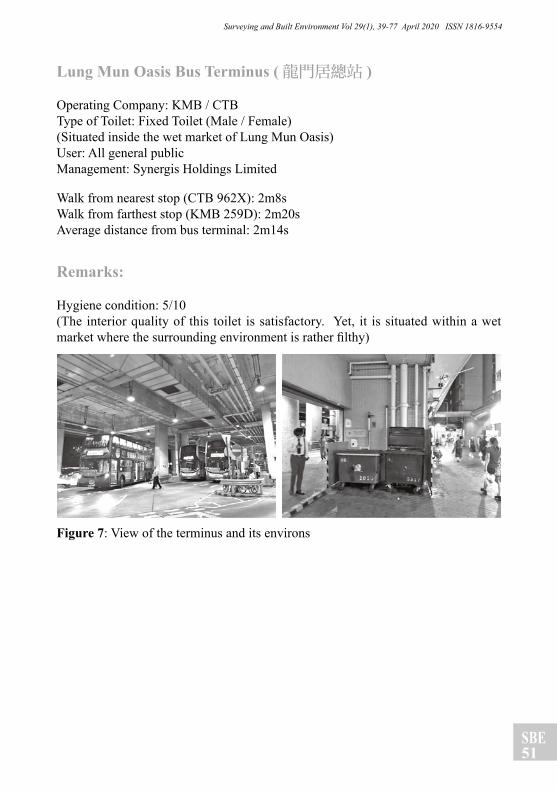
SBE51
Surveying and Built Environment Vol 29(1), 39-77 April 2020 ISSN 1816-9554
Lung Mun Oasis Bus Terminus (龍門居總站 )
Operating Company: KMB / CTBType of Toilet: Fixed Toilet (Male / Female)(Situated inside the wet market of Lung Mun Oasis)User: All general publicManagement: Synergis Holdings Limited
Walk from nearest stop (CTB 962X): 2m8sWalk from farthest stop (KMB 259D): 2m20sAverage distance from bus terminal: 2m14s
Remarks:
Hygiene condition: 5/10(The interior quality of this toilet is satisfactory. Yet, it is situated within a wet market where the surrounding environment is rather filthy)
Figure 7: View of the terminus and its environs
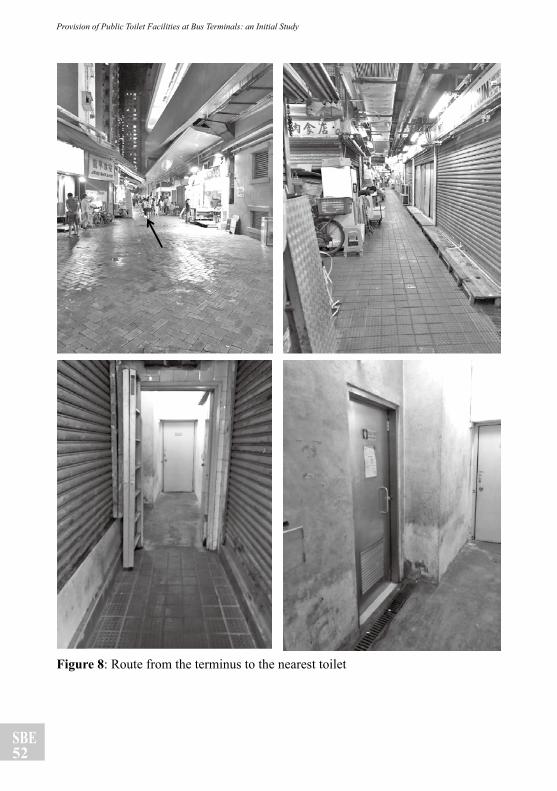
SBE52
Provision of Public Toilet Facilities at Bus Terminals: an Initial Study
Figure 8: Route from the terminus to the nearest toilet
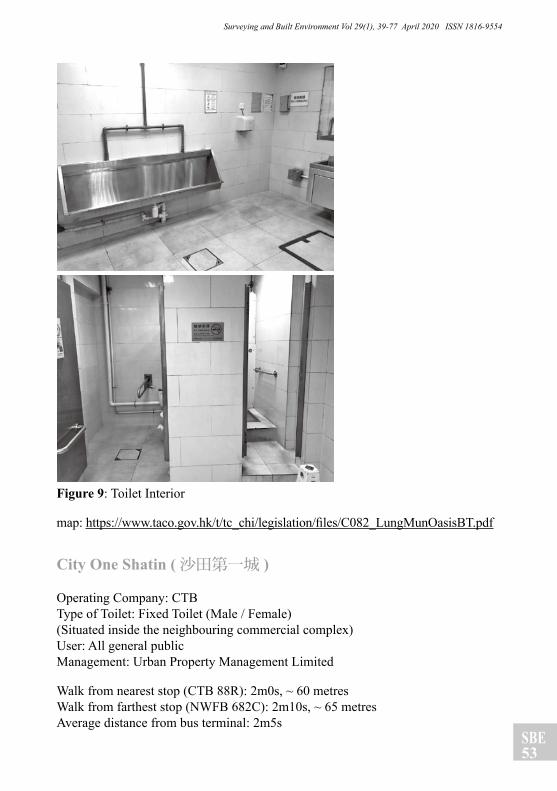
SBE53
Surveying and Built Environment Vol 29(1), 39-77 April 2020 ISSN 1816-9554
Figure 9: Toilet Interior
map: https://www.taco.gov.hk/t/tc_chi/legislation/files/C082_LungMunOasisBT.pdf
City One Shatin (沙田第一城 )
Operating Company: CTBType of Toilet: Fixed Toilet (Male / Female)(Situated inside the neighbouring commercial complex)User: All general publicManagement: Urban Property Management Limited
Walk from nearest stop (CTB 88R): 2m0s, ~ 60 metresWalk from farthest stop (NWFB 682C): 2m10s, ~ 65 metresAverage distance from bus terminal: 2m5s
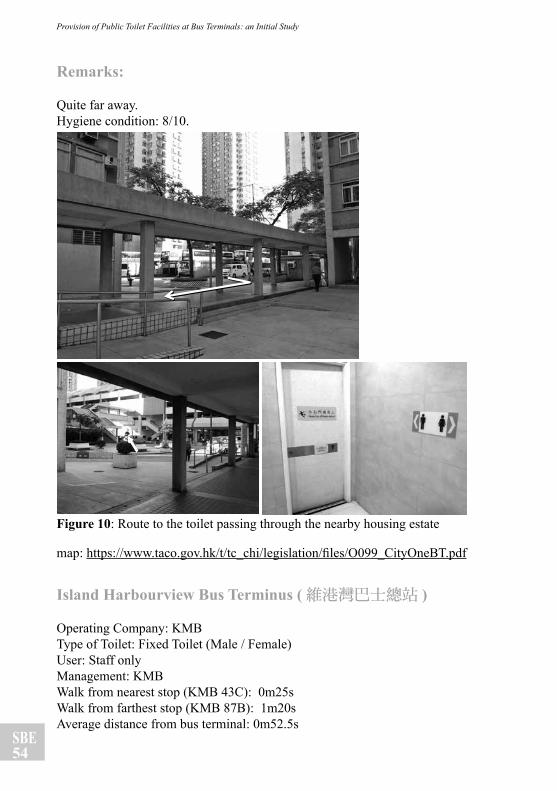
SBE54
Provision of Public Toilet Facilities at Bus Terminals: an Initial Study
Remarks:
Quite far away.Hygiene condition: 8/10.
Figure 10: Route to the toilet passing through the nearby housing estate
map: https://www.taco.gov.hk/t/tc_chi/legislation/files/O099_CityOneBT.pdf
Island Harbourview Bus Terminus (維港灣巴士總站 )
Operating Company: KMBType of Toilet: Fixed Toilet (Male / Female)User: Staff onlyManagement: KMBWalk from nearest stop (KMB 43C): 0m25sWalk from farthest stop (KMB 87B): 1m20sAverage distance from bus terminal: 0m52.5s
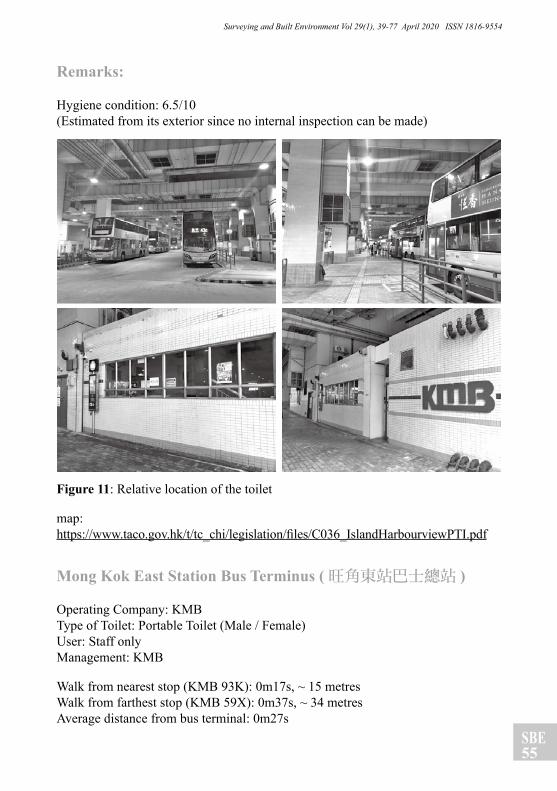
SBE55
Surveying and Built Environment Vol 29(1), 39-77 April 2020 ISSN 1816-9554
Remarks:
Hygiene condition: 6.5/10(Estimated from its exterior since no internal inspection can be made)
Figure 11: Relative location of the toilet
map: https://www.taco.gov.hk/t/tc_chi/legislation/files/C036_IslandHarbourviewPTI.pdf
Mong Kok East Station Bus Terminus (旺角東站巴士總站 )
Operating Company: KMBType of Toilet: Portable Toilet (Male / Female)User: Staff only Management: KMB
Walk from nearest stop (KMB 93K): 0m17s, ~ 15 metresWalk from farthest stop (KMB 59X): 0m37s, ~ 34 metresAverage distance from bus terminal: 0m27s
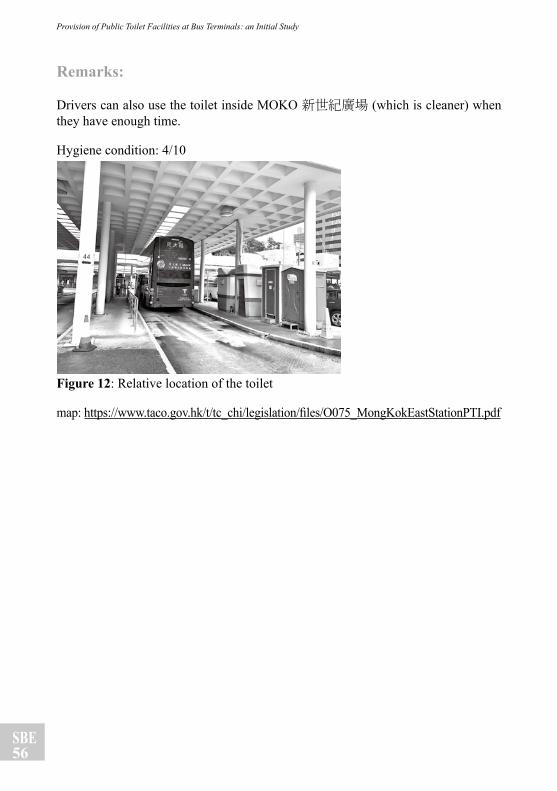
SBE56
Provision of Public Toilet Facilities at Bus Terminals: an Initial Study
Remarks:
Drivers can also use the toilet inside MOKO 新世紀廣場 (which is cleaner) when they have enough time.
Hygiene condition: 4/10
Figure 12: Relative location of the toilet
map: https://www.taco.gov.hk/t/tc_chi/legislation/files/O075_MongKokEastStationPTI.pdf
SBE57
Surveying and Built Environment Vol 29(1), 39-77 April 2020 ISSN 1816-9554
Lam Tin Public Transport Interchange (藍田公共運輸交匯處 )
Lam Tin Public Transport Interchange is situated next to Lam Tin MTR station, and is amongst the largest termini in Kowloon East. It accommodates a total of 34 bus routes on each working day. 14 nos. of them are terminating / departing here. This terminus comprises 3 portable toilets which are scattered at different locations to suit the needs of drivers.
Operating Company: KMBType of Toilet: Portable Toilet (Male / Female)User: Staff only Management: KMB
Toilet 1 (Male only):Walk from nearest stop (KMB 277X and 277E): Walk from farthest stop (KMB 216M):
Toilet 2 (Female only):Walk from nearest stop (KMB 216M): Walk from farthest stop (KMB 277X and 277E):
Toilet 3 (Male / Female with password door lock):Type: Portable ToiletWalk from nearest stop (Minibus): 0m5s, ~8 metres
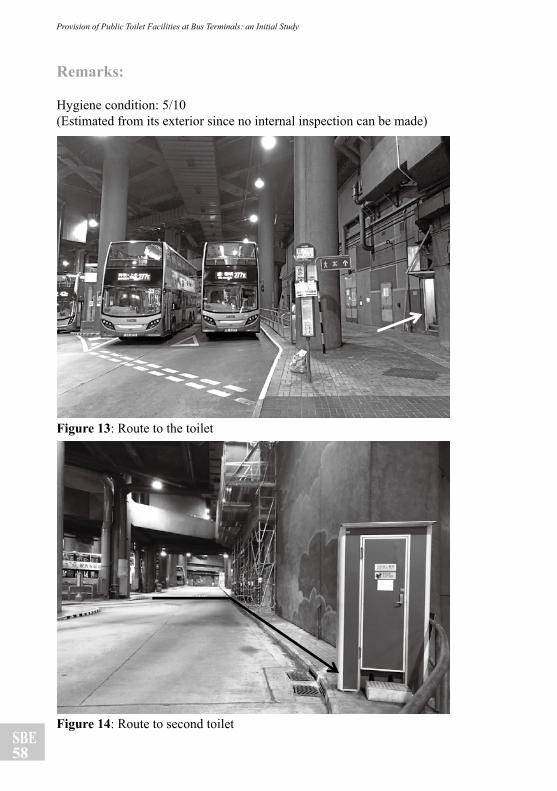
SBE58
Provision of Public Toilet Facilities at Bus Terminals: an Initial Study
Remarks:
Hygiene condition: 5/10(Estimated from its exterior since no internal inspection can be made)
Figure 13: Route to the toilet
Figure 14: Route to second toilet
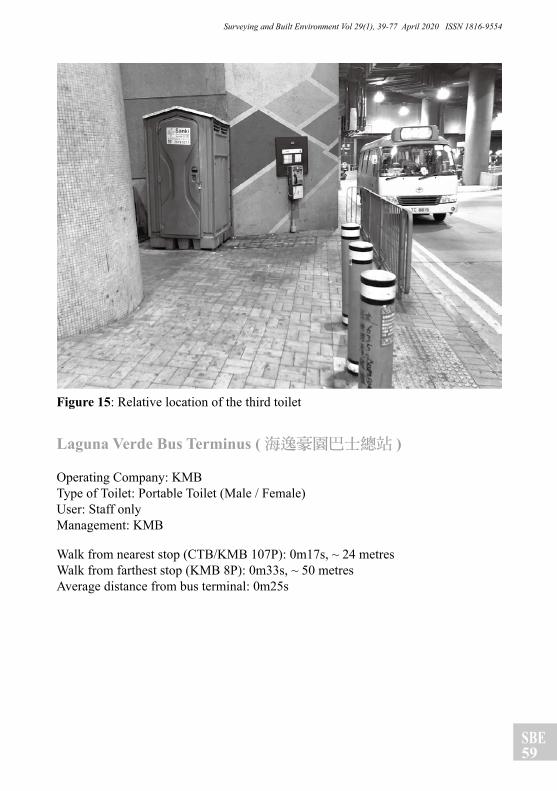
SBE59
Surveying and Built Environment Vol 29(1), 39-77 April 2020 ISSN 1816-9554
Figure 15: Relative location of the third toilet
Laguna Verde Bus Terminus (海逸豪園巴士總站 )
Operating Company: KMBType of Toilet: Portable Toilet (Male / Female)User: Staff only Management: KMB
Walk from nearest stop (CTB/KMB 107P): 0m17s, ~ 24 metresWalk from farthest stop (KMB 8P): 0m33s, ~ 50 metresAverage distance from bus terminal: 0m25s
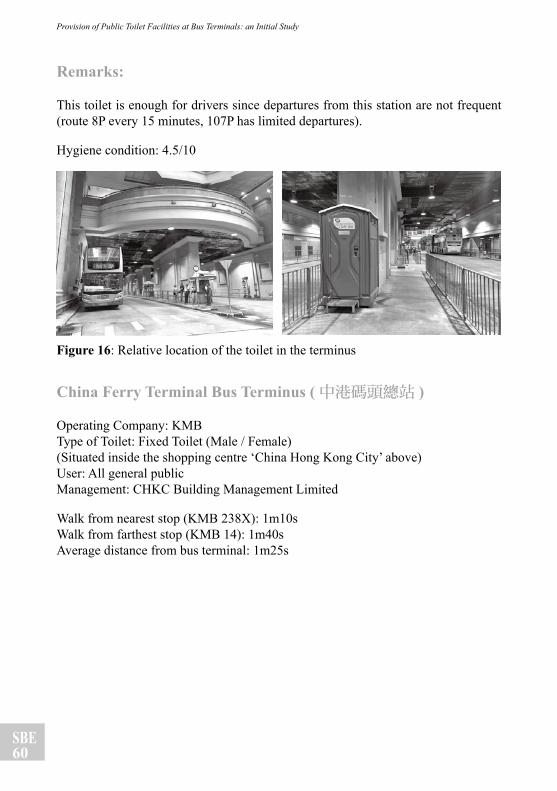
SBE60
Provision of Public Toilet Facilities at Bus Terminals: an Initial Study
Remarks:
This toilet is enough for drivers since departures from this station are not frequent (route 8P every 15 minutes, 107P has limited departures).
Hygiene condition: 4.5/10
Figure 16: Relative location of the toilet in the terminus
China Ferry Terminal Bus Terminus (中港碼頭總站 )
Operating Company: KMBType of Toilet: Fixed Toilet (Male / Female)(Situated inside the shopping centre ‘China Hong Kong City’ above)User: All general publicManagement: CHKC Building Management Limited
Walk from nearest stop (KMB 238X): 1m10sWalk from farthest stop (KMB 14): 1m40sAverage distance from bus terminal: 1m25s
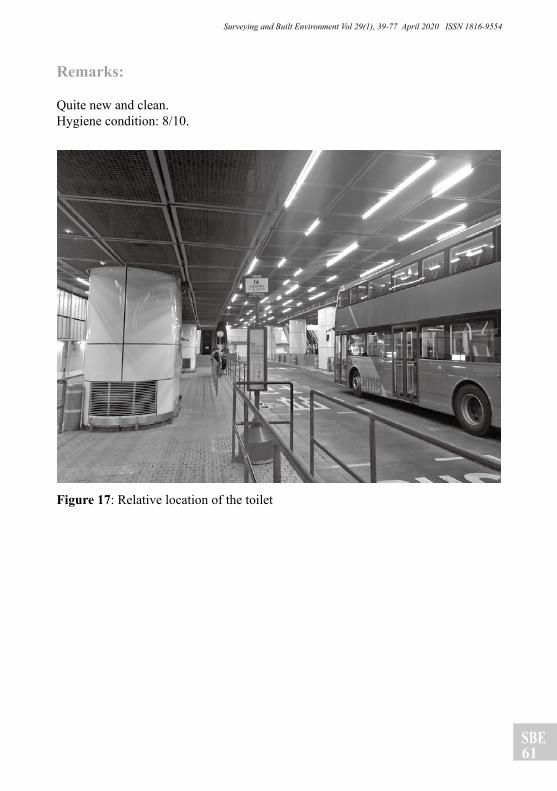
SBE61
Surveying and Built Environment Vol 29(1), 39-77 April 2020 ISSN 1816-9554
Remarks:
Quite new and clean.Hygiene condition: 8/10.
Figure 17: Relative location of the toilet
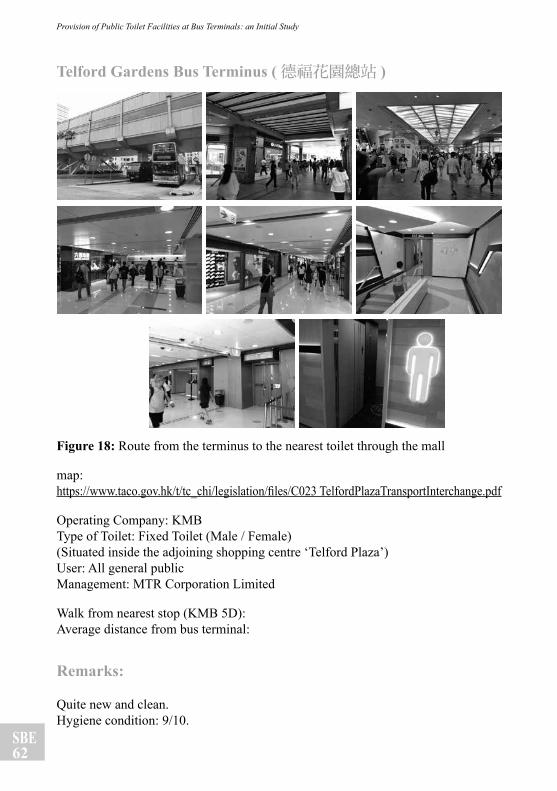
SBE62
Provision of Public Toilet Facilities at Bus Terminals: an Initial Study
Telford Gardens Bus Terminus (德福花園總站 )
Figure 18: Route from the terminus to the nearest toilet through the mall
map: https://www.taco.gov.hk/t/tc_chi/legislation/files/C023 TelfordPlazaTransportInterchange.pdf
Operating Company: KMBType of Toilet: Fixed Toilet (Male / Female)(Situated inside the adjoining shopping centre ‘Telford Plaza’)User: All general publicManagement: MTR Corporation Limited
Walk from nearest stop (KMB 5D): Average distance from bus terminal:
Remarks:
Quite new and clean.Hygiene condition: 9/10.
SBE63
Surveying and Built Environment Vol 29(1), 39-77 April 2020 ISSN 1816-9554
Exchange Square Bus Terminus (交易廣場巴士總站 )
Operating Company: KMB / CTB / NWFBType: Fixed Toilet (Male / Female)Usage: All general publicManagement: Food and Environmental Hygiene Department
Walk from nearest stop (CTB/KMB 690): 0m15sWalk from farthest stop (CTB 260): 1m45sAverage distance from bus terminal: 1m0s
Remarks:
Quite new and clean after renovation.Hygiene condition: 7/10.
This terminus used to accommodate another toilet which is restricted to staff. It was situated inside the staff common room at the mezzanine floor of the terminus. Yet, the toilet was dismantled and converted into a rest area since December 2018. Various drivers reported to us that this former toilet suffered from low usage due to its poor hygiene condition:
https://www.hk01.com/18區新聞/272336/新巴拆員工專用洗手間-工會-迫車長輪-爆棚-公廁
map: https://www.taco.gov.hk/t/tc_chi/legislation/files/C002_CentralExchangeSquareBT.pdf
SBE64
Provision of Public Toilet Facilities at Bus Terminals: an Initial Study
Wah Fu (South) (華富 (南 ))
Operating Company: NWFBType of Toilet: Fixed Toilet (Male / Female)User: Staff onlyManagement: NWFB
Walk from nearest stop (NWFB 4): 0m4s, ~ 2 metresWalk from farthest stop (NWFB 42): 0m19s, ~ 10 metresAverage distance from bus terminal: 0m11.5s, ~ 6 metres
Remarks:
Hygiene condition: 4/10(Estimated from its exterior since no internal inspection can be made)
map: https://www.taco.gov.hk/t/tc_chi/legislation/files/O031_WahFuSouthBT.pdf
South Horizons Bus Terminus (海怡半島巴士總站 )
Operating Company: CTB / NWFBType of Toilet: Fixed Toilet (Male)User: All general publicManagement: South Horizons Management Limited
Walking distance/time:From nearest stop (NWFB 590): 0m20s, ~ 40 metresFrom farthest stop (minibus 63): 0m53s, ~ 70 metresAverage distance from bus terminal: 0m36.5s, 55 metres
Remarks:
Female drivers can also use it since there are both Urinals (尿兜) and toilet compartment (廁格) regardless of the ‘male’ sign on the door.
Poor hygiene condition, 3/10.Recommendation: renovation is needed.
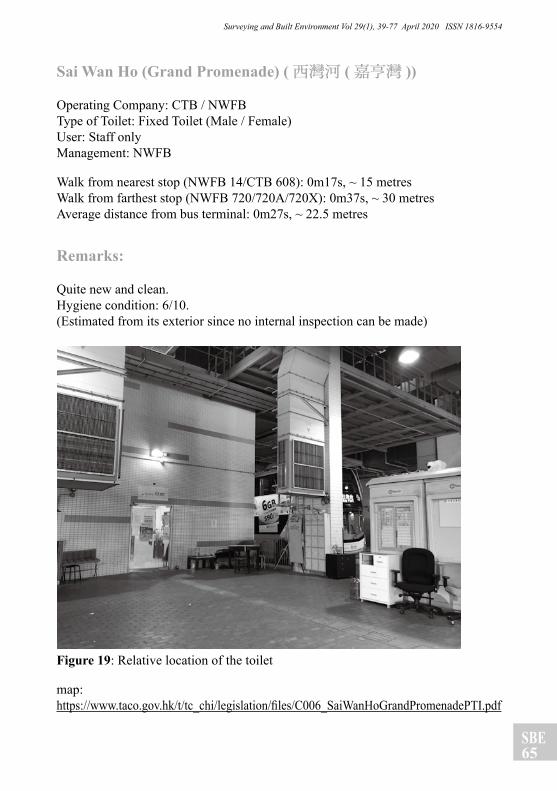
SBE65
Surveying and Built Environment Vol 29(1), 39-77 April 2020 ISSN 1816-9554
Sai Wan Ho (Grand Promenade) (西灣河 (嘉亨灣 ))
Operating Company: CTB / NWFBType of Toilet: Fixed Toilet (Male / Female)User: Staff only Management: NWFB
Walk from nearest stop (NWFB 14/CTB 608): 0m17s, ~ 15 metresWalk from farthest stop (NWFB 720/720A/720X): 0m37s, ~ 30 metresAverage distance from bus terminal: 0m27s, ~ 22.5 metres
Remarks:
Quite new and clean.Hygiene condition: 6/10.(Estimated from its exterior since no internal inspection can be made)
Figure 19: Relative location of the toilet
map: https://www.taco.gov.hk/t/tc_chi/legislation/files/C006_SaiWanHoGrandPromenadePTI.pdf
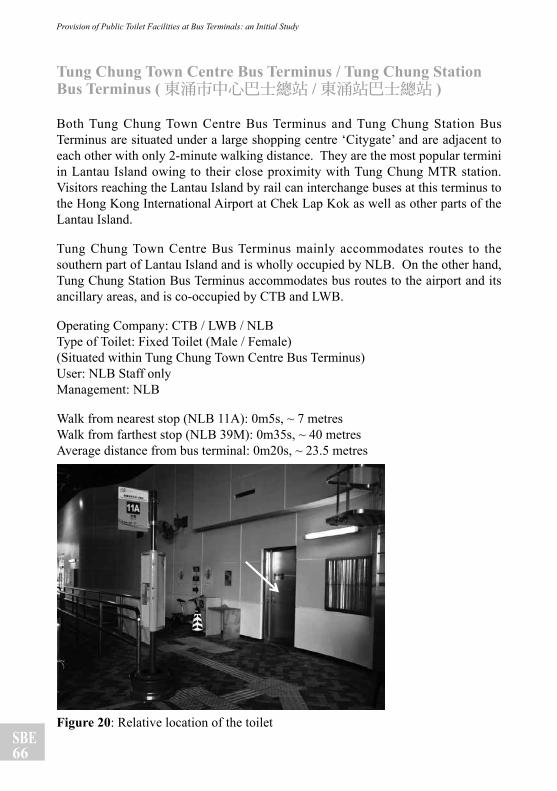
SBE66
Provision of Public Toilet Facilities at Bus Terminals: an Initial Study
Tung Chung Town Centre Bus Terminus / Tung Chung Station Bus Terminus (東涌市中心巴士總站 /東涌站巴士總站 )
Both Tung Chung Town Centre Bus Terminus and Tung Chung Station Bus Terminus are situated under a large shopping centre ‘Citygate’ and are adjacent to each other with only 2-minute walking distance. They are the most popular termini in Lantau Island owing to their close proximity with Tung Chung MTR station. Visitors reaching the Lantau Island by rail can interchange buses at this terminus to the Hong Kong International Airport at Chek Lap Kok as well as other parts of the Lantau Island.
Tung Chung Town Centre Bus Terminus mainly accommodates routes to the southern part of Lantau Island and is wholly occupied by NLB. On the other hand, Tung Chung Station Bus Terminus accommodates bus routes to the airport and its ancillary areas, and is co-occupied by CTB and LWB.
Operating Company: CTB / LWB / NLBType of Toilet: Fixed Toilet (Male / Female)(Situated within Tung Chung Town Centre Bus Terminus)User: NLB Staff only Management: NLB
Walk from nearest stop (NLB 11A): 0m5s, ~ 7 metresWalk from farthest stop (NLB 39M): 0m35s, ~ 40 metresAverage distance from bus terminal: 0m20s, ~ 23.5 metres
Figure 20: Relative location of the toilet
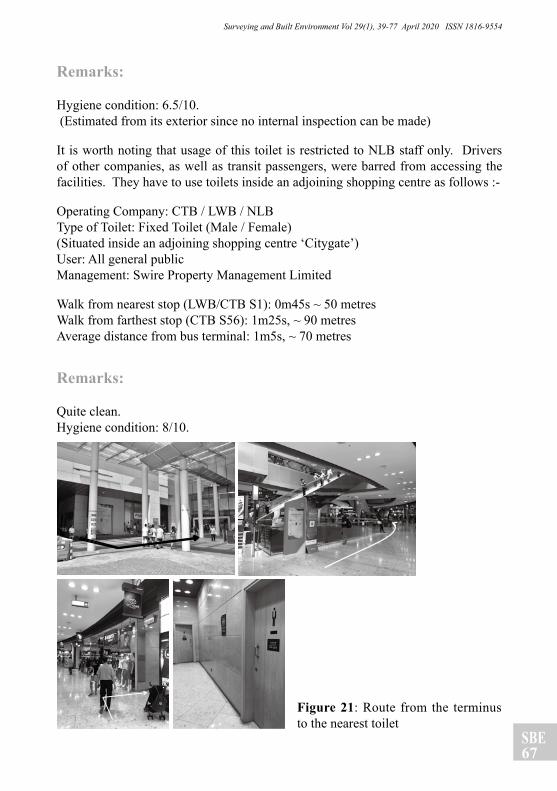
SBE67
Surveying and Built Environment Vol 29(1), 39-77 April 2020 ISSN 1816-9554
Remarks:
Hygiene condition: 6.5/10. (Estimated from its exterior since no internal inspection can be made)
It is worth noting that usage of this toilet is restricted to NLB staff only. Drivers of other companies, as well as transit passengers, were barred from accessing the facilities. They have to use toilets inside an adjoining shopping centre as follows :-
Operating Company: CTB / LWB / NLBType of Toilet: Fixed Toilet (Male / Female)(Situated inside an adjoining shopping centre ‘Citygate’)User: All general publicManagement: Swire Property Management Limited
Walk from nearest stop (LWB/CTB S1): 0m45s ~ 50 metresWalk from farthest stop (CTB S56): 1m25s, ~ 90 metresAverage distance from bus terminal: 1m5s, ~ 70 metres
Remarks:
Quite clean.Hygiene condition: 8/10.
Figure 21: Route from the terminus to the nearest toilet
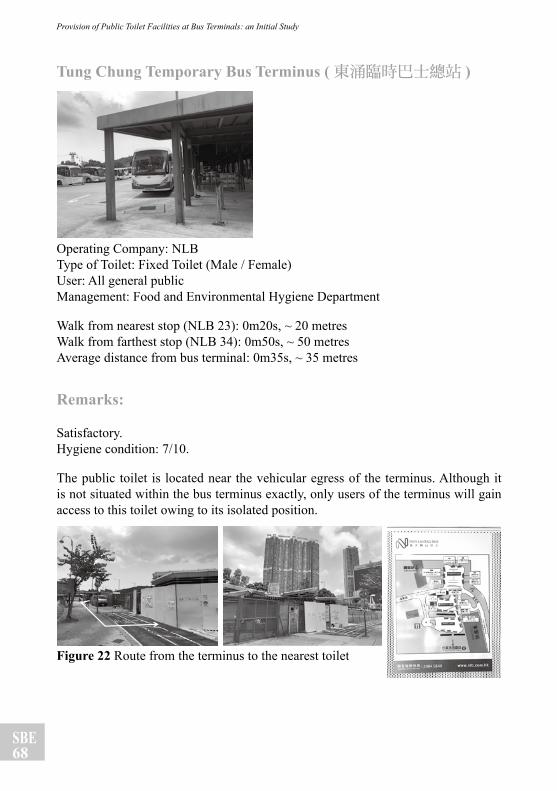
SBE68
Provision of Public Toilet Facilities at Bus Terminals: an Initial Study
Tung Chung Temporary Bus Terminus (東涌臨時巴士總站 )
Operating Company: NLBType of Toilet: Fixed Toilet (Male / Female)User: All general public Management: Food and Environmental Hygiene Department
Walk from nearest stop (NLB 23): 0m20s, ~ 20 metresWalk from farthest stop (NLB 34): 0m50s, ~ 50 metresAverage distance from bus terminal: 0m35s, ~ 35 metres
Remarks:
Satisfactory.Hygiene condition: 7/10.
The public toilet is located near the vehicular egress of the terminus. Although it is not situated within the bus terminus exactly, only users of the terminus will gain access to this toilet owing to its isolated position.
Figure 22 Route from the terminus to the nearest toilet
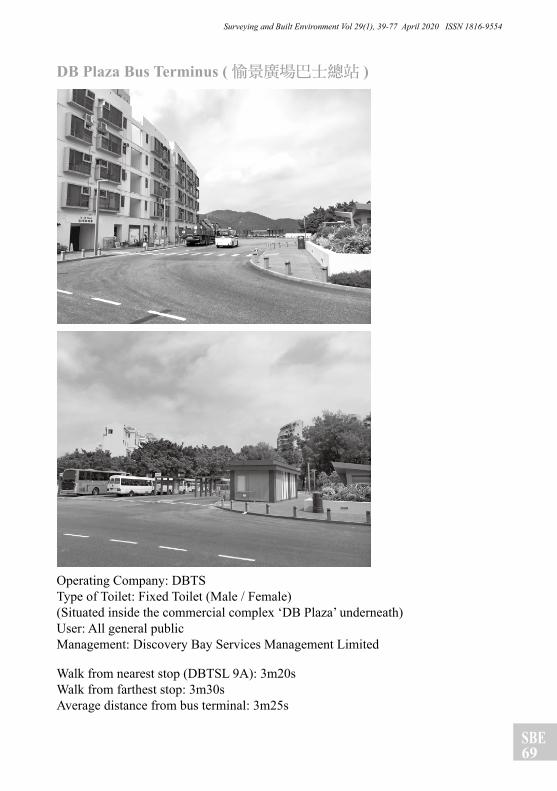
SBE69
Surveying and Built Environment Vol 29(1), 39-77 April 2020 ISSN 1816-9554
DB Plaza Bus Terminus (愉景廣場巴士總站 )
Operating Company: DBTSType of Toilet: Fixed Toilet (Male / Female)(Situated inside the commercial complex ‘DB Plaza’ underneath)User: All general public Management: Discovery Bay Services Management Limited
Walk from nearest stop (DBTSL 9A): 3m20s Walk from farthest stop: 3m30sAverage distance from bus terminal: 3m25s
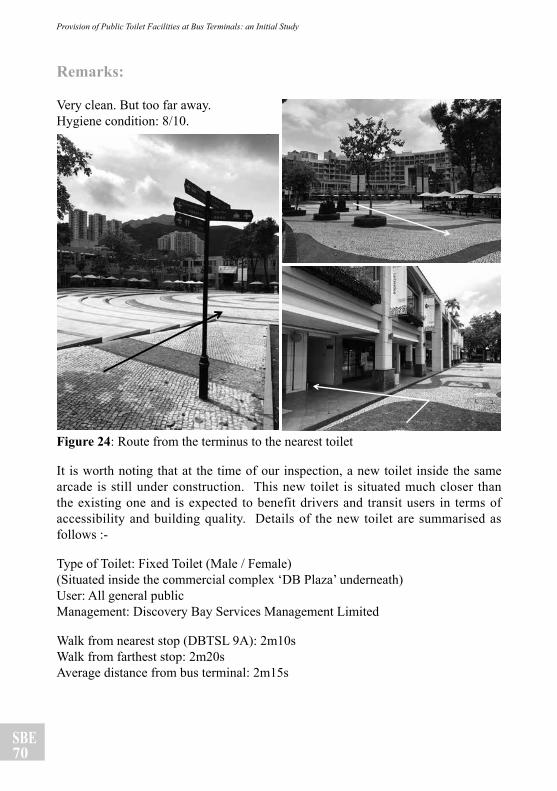
SBE70
Provision of Public Toilet Facilities at Bus Terminals: an Initial Study
Remarks:
Very clean. But too far away.Hygiene condition: 8/10.
Figure 24: Route from the terminus to the nearest toilet
It is worth noting that at the time of our inspection, a new toilet inside the same arcade is still under construction. This new toilet is situated much closer than the existing one and is expected to benefit drivers and transit users in terms of accessibility and building quality. Details of the new toilet are summarised as follows :-
Type of Toilet: Fixed Toilet (Male / Female)(Situated inside the commercial complex ‘DB Plaza’ underneath)User: All general public Management: Discovery Bay Services Management Limited
Walk from nearest stop (DBTSL 9A): 2m10sWalk from farthest stop: 2m20sAverage distance from bus terminal: 2m15s
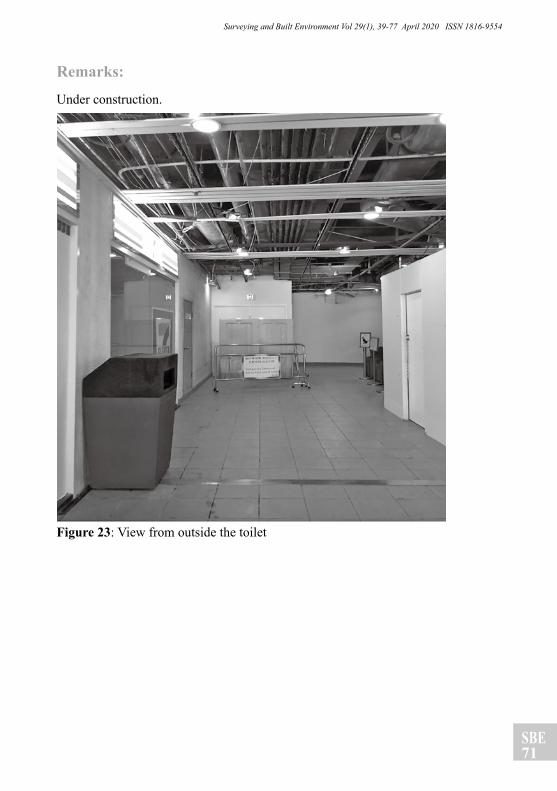
SBE71
Surveying and Built Environment Vol 29(1), 39-77 April 2020 ISSN 1816-9554
Remarks:
Under construction.
Figure 23: View from outside the toilet
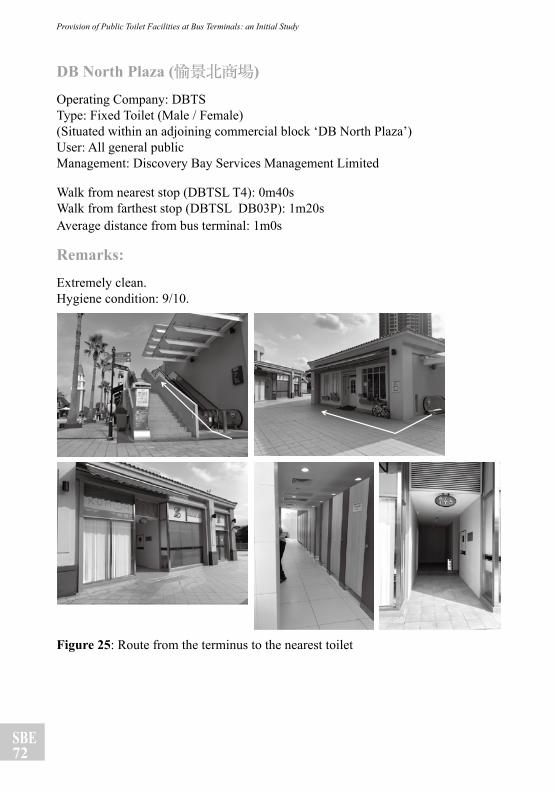
SBE72
Provision of Public Toilet Facilities at Bus Terminals: an Initial Study
DB North Plaza (愉景北商場)
Operating Company: DBTSType: Fixed Toilet (Male / Female)(Situated within an adjoining commercial block ‘DB North Plaza’)User: All general publicManagement: Discovery Bay Services Management Limited
Walk from nearest stop (DBTSL T4): 0m40sWalk from farthest stop (DBTSL DB03P): 1m20sAverage distance from bus terminal: 1m0s
Remarks:
Extremely clean. Hygiene condition: 9/10.
Figure 25: Route from the terminus to the nearest toilet
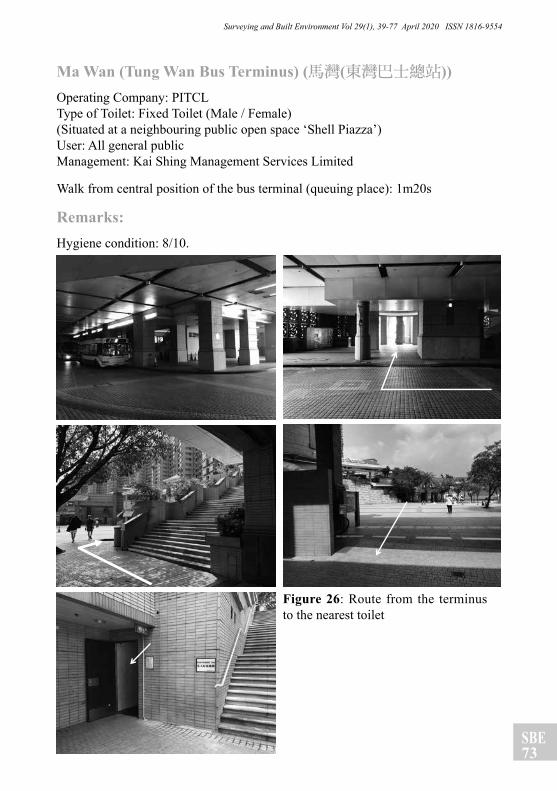
SBE73
Surveying and Built Environment Vol 29(1), 39-77 April 2020 ISSN 1816-9554
Ma Wan (Tung Wan Bus Terminus) (馬灣(東灣巴士總站))Operating Company: PITCLType of Toilet: Fixed Toilet (Male / Female)(Situated at a neighbouring public open space ‘Shell Piazza’)User: All general publicManagement: Kai Shing Management Services Limited
Walk from central position of the bus terminal (queuing place): 1m20s
Remarks:Hygiene condition: 8/10.
Figure 26: Route from the terminus to the nearest toilet
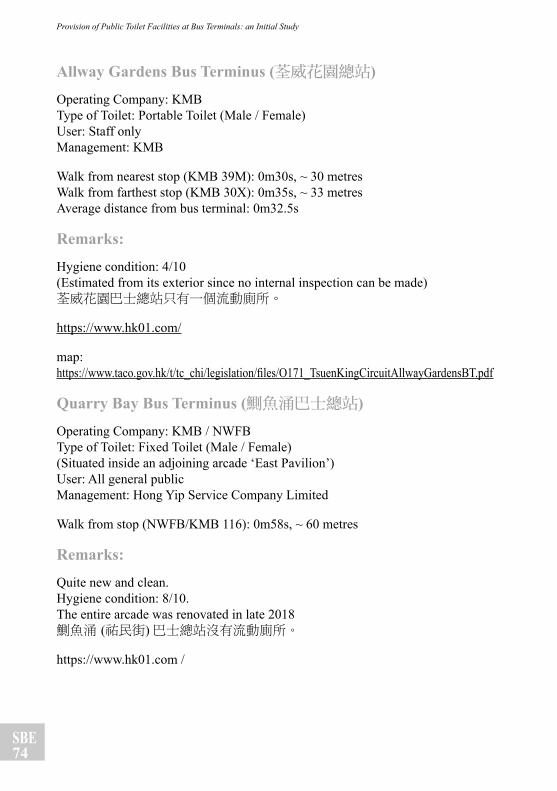
SBE74
Provision of Public Toilet Facilities at Bus Terminals: an Initial Study
Allway Gardens Bus Terminus (荃威花園總站)
Operating Company: KMBType of Toilet: Portable Toilet (Male / Female)User: Staff onlyManagement: KMB
Walk from nearest stop (KMB 39M): 0m30s, ~ 30 metresWalk from farthest stop (KMB 30X): 0m35s, ~ 33 metresAverage distance from bus terminal: 0m32.5s
Remarks:
Hygiene condition: 4/10(Estimated from its exterior since no internal inspection can be made)荃威花園巴士總站只有一個流動廁所。
https://www.hk01.com/
map: https://www.taco.gov.hk/t/tc_chi/legislation/files/O171_TsuenKingCircuitAllwayGardensBT.pdf
Quarry Bay Bus Terminus (鰂魚涌巴士總站)
Operating Company: KMB / NWFBType of Toilet: Fixed Toilet (Male / Female)(Situated inside an adjoining arcade ‘East Pavilion’)User: All general publicManagement: Hong Yip Service Company Limited
Walk from stop (NWFB/KMB 116): 0m58s, ~ 60 metres
Remarks:
Quite new and clean.Hygiene condition: 8/10.The entire arcade was renovated in late 2018鰂魚涌 (祐民街) 巴士總站沒有流動廁所。
https://www.hk01.com /
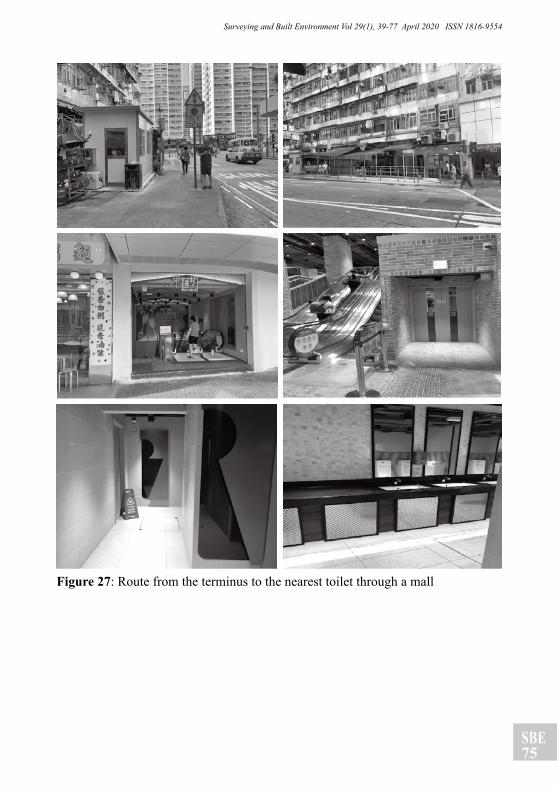
SBE75
Surveying and Built Environment Vol 29(1), 39-77 April 2020 ISSN 1816-9554
Figure 27: Route from the terminus to the nearest toilet through a mall

SBE76
Provision of Public Toilet Facilities at Bus Terminals: an Initial Study
Shau Kei Wan Bus Terminus (筲箕灣巴士總站)
Operating Company: KMB / CTB / NWFBType of Toilet: Portable Toilet (Male / Female)User: Staff onlyManagement: NWFB
Remarks:
Hygiene condition: 4/10.筲箕灣總站有約200位車長工作,但站內僅得一個化廁。https://www.hk01.com
map: https://www.taco.gov.hk/t/tc_chi/legislation/files/O017_ShauKeiWanAldrichStreetBT.pdf
Yiu Tung Estate (耀東邨)
Operating Company: KMB / CTB / NWFBType of Toilet: Portable Toilet (Male / Female)User: Staff onlyManagement: NWFB
Remarks:
Hygiene condition: 4/10.
photo:https://cdn.hk01.com/di/media/images/1832235/org/d5368696965a499f5634d38c7803be8f.jpg/sbGSPjJD3M6Ubz7Godg2N4MIWPDOoGoQIiPB7CIjwew
map: https://www.taco.gov.hk/t/tc_chi/legislation/files/O019_YiuTungEstateBT.pdf
Mui Wo Ferry Pier (梅窩碼頭)
Operating Company: NLBType of Toilet: Fixed Toilet (Male / Female)(Situated at the opposite side of Ngan Kwong Wan Rd)User: All general publicManagement: Food and Environment Hygiene Department
Walk from nearest stop (NLB A35/N35): 0m50s ~ 60 metresWalk from farthest stop (NLB 2): 1m30s, ~ 90 metresAverage distance from bus terminal: 1m10s, ~ 75 metres

SBE77
Surveying and Built Environment Vol 29(1), 39-77 April 2020 ISSN 1816-9554
Remarks:
Hygiene condition: 6/10.
Figure 28: Toilet interior and environs
Lee On Bus Terminus (利安巴士總站)
Operating Company: KMB / NWFBType of Toilet: Portable Toilet (Male / Female)User: Staff onlyManagement: KMB
Walk from nearest stop (KMB 286X): 0m20s, ~ 24 metresWalk from farthest stop (KMB/NWFB 680): 0m30s, ~ 35metresAverage distance from bus terminal: 0m25s, ~ 29.5metres
Remarks:
Hygiene condition: 4/10.
Useful links:
map: https://www.taco.gov.hk/t/tc_chi/legislation/open_air_ptfs_list.html
POR: https://www.taco.gov.hk/t/tc_chi/legislation/files/O007_PokfieldRoadBT.pdf
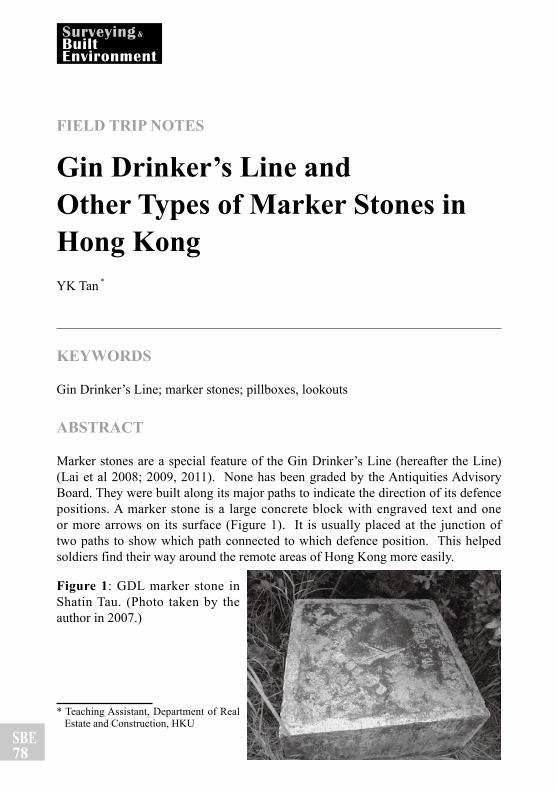
SBE78
FIELD TRIP NOTES
Gin Drinker’s Line and Other Types of Marker Stones in Hong KongYK Tan *
KEYWORDS
Gin Drinker’s Line; marker stones; pillboxes, lookouts
ABSTRACT
Marker stones are a special feature of the Gin Drinker’s Line (hereafter the Line) (Lai et al 2008; 2009, 2011). None has been graded by the Antiquities Advisory Board. They were built along its major paths to indicate the direction of its defence positions. A marker stone is a large concrete block with engraved text and one or more arrows on its surface (Figure 1). It is usually placed at the junction of two paths to show which path connected to which defence position. This helped soldiers find their way around the remote areas of Hong Kong more easily.
Figure 1: GDL marker stone in Shatin Tau. (Photo taken by the author in 2007.)
* Teaching Assistant, Department of Real Estate and Construction, HKU
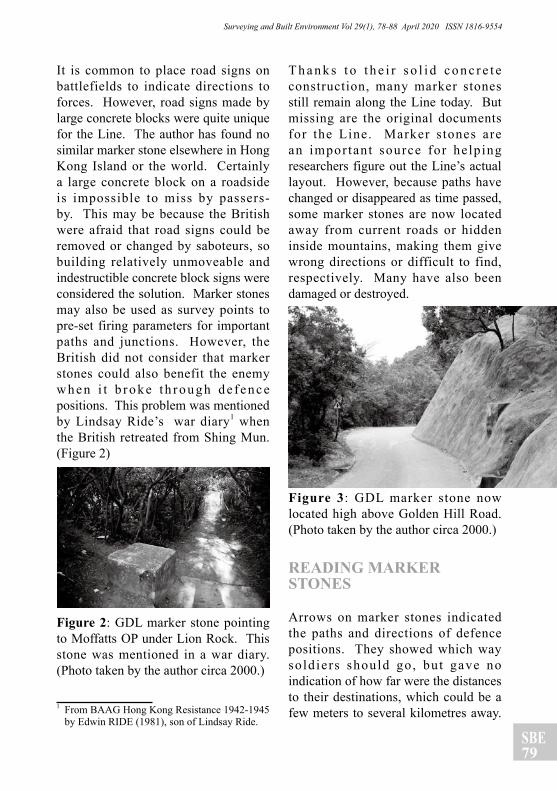
SBE79
Surveying and Built Environment Vol 29(1), 78-88 April 2020 ISSN 1816-9554
It is common to place road signs on battlefields to indicate directions to forces. However, road signs made by large concrete blocks were quite unique for the Line. The author has found no similar marker stone elsewhere in Hong Kong Island or the world. Certainly a large concrete block on a roadside is impossible to miss by passers-by. This may be because the British were afraid that road signs could be removed or changed by saboteurs, so building relatively unmoveable and indestructible concrete block signs were considered the solution. Marker stones may also be used as survey points to pre-set firing parameters for important paths and junctions. However, the British did not consider that marker stones could also benefit the enemy when i t b roke t h rough de fence positions. This problem was mentioned by Lindsay Ride’s war diary1 when the British retreated from Shing Mun. (Figure 2)
Figure 2: GDL marker stone pointing to Moffatts OP under Lion Rock. This stone was mentioned in a war diary. (Photo taken by the author circa 2000.)
1 From BAAG Hong Kong Resistance 1942-1945 by Edwin RIDE (1981), son of Lindsay Ride.
T h a n k s t o t h e i r s o l i d c o n c r e t e construction, many marker stones still remain along the Line today. But missing are the original documents for the Line. Marker stones are an important source for helping researchers figure out the Line’s actual layout. However, because paths have changed or disappeared as time passed, some marker stones are now located away from current roads or hidden inside mountains, making them give wrong directions or difficult to find, respectively. Many have also been damaged or destroyed.
Figure 3: GDL marker stone now located high above Golden Hill Road. (Photo taken by the author circa 2000.)
READING MARKER STONES
Arrows on marker stones indicated the paths and directions of defence positions. They showed which way soldiers should go, but gave no indication of how far were the distances to their destinations, which could be a few meters to several kilometres away.
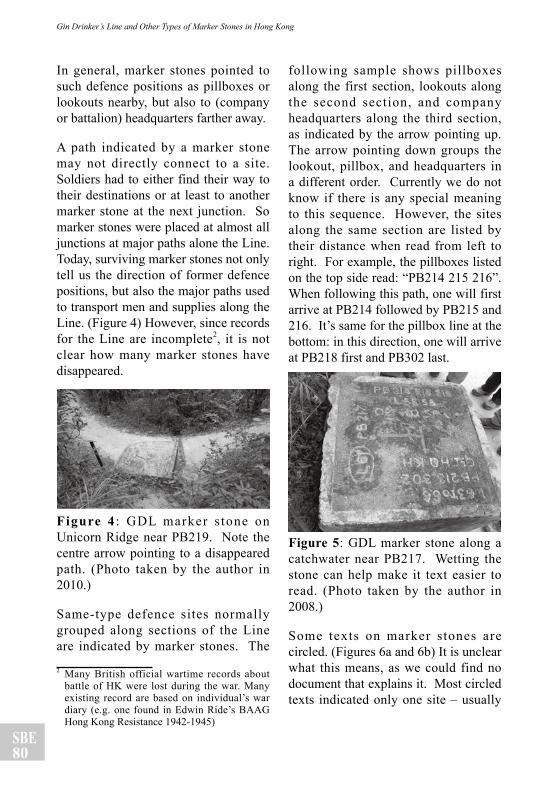
SBE80
Gin Drinker’s Line and Other Types of Marker Stones in Hong Kong
In general, marker stones pointed to such defence positions as pillboxes or lookouts nearby, but also to (company or battalion) headquarters farther away.
A path indicated by a marker stone may not directly connect to a site. Soldiers had to either find their way to their destinations or at least to another marker stone at the next junction. So marker stones were placed at almost all junctions at major paths alone the Line. Today, surviving marker stones not only tell us the direction of former defence positions, but also the major paths used to transport men and supplies along the Line. (Figure 4) However, since records for the Line are incomplete2, it is not clear how many marker stones have disappeared.
Figure 4 : GDL marker s tone on Unicorn Ridge near PB219. Note the centre arrow pointing to a disappeared path. (Photo taken by the author in 2010.)
Same-type defence sites normally grouped along sections of the Line are indicated by marker stones. The
2 Many British official wartime records about battle of HK were lost during the war. Many existing record are based on individual’s war diary (e.g. one found in Edwin Ride’s BAAG Hong Kong Resistance 1942-1945)
following sample shows pillboxes along the first section, lookouts along the second section, and company headquarters along the third section, as indicated by the arrow pointing up. The arrow pointing down groups the lookout, pillbox, and headquarters in a different order. Currently we do not know if there is any special meaning to this sequence. However, the sites along the same section are listed by their distance when read from left to right. For example, the pillboxes listed on the top side read: “PB214 215 216”. When following this path, one will first arrive at PB214 followed by PB215 and 216. It’s same for the pillbox line at the bottom: in this direction, one will arrive at PB218 first and PB302 last.
Figure 5: GDL marker stone along a catchwater near PB217. Wetting the stone can help make it text easier to read. (Photo taken by the author in 2008.)
Some texts on marker stones are circled. (Figures 6a and 6b) It is unclear what this means, as we could find no document that explains it. Most circled texts indicated only one site – usually
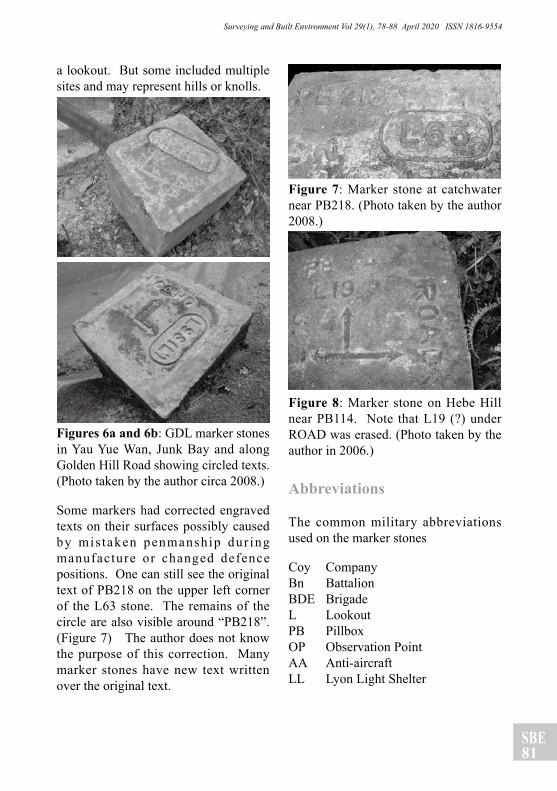
SBE81
Surveying and Built Environment Vol 29(1), 78-88 April 2020 ISSN 1816-9554
a lookout. But some included multiple sites and may represent hills or knolls.
Figures 6a and 6b: GDL marker stones in Yau Yue Wan, Junk Bay and along Golden Hill Road showing circled texts. (Photo taken by the author circa 2008.)
Some markers had corrected engraved texts on their surfaces possibly caused by mis taken penmanship dur ing manufacture or changed defence positions. One can still see the original text of PB218 on the upper left corner of the L63 stone. The remains of the circle are also visible around “PB218”. (Figure 7) The author does not know the purpose of this correction. Many marker stones have new text written over the original text.
Figure 7: Marker stone at catchwater near PB218. (Photo taken by the author 2008.)
Figure 8: Marker stone on Hebe Hill near PB114. Note that L19 (?) under ROAD was erased. (Photo taken by the author in 2006.)
Abbreviations
The common military abbreviations used on the marker stones
Coy CompanyBn BattalionBDE BrigadeL LookoutPB PillboxOP Observation PointAA Anti-aircraftLL Lyon Light Shelter
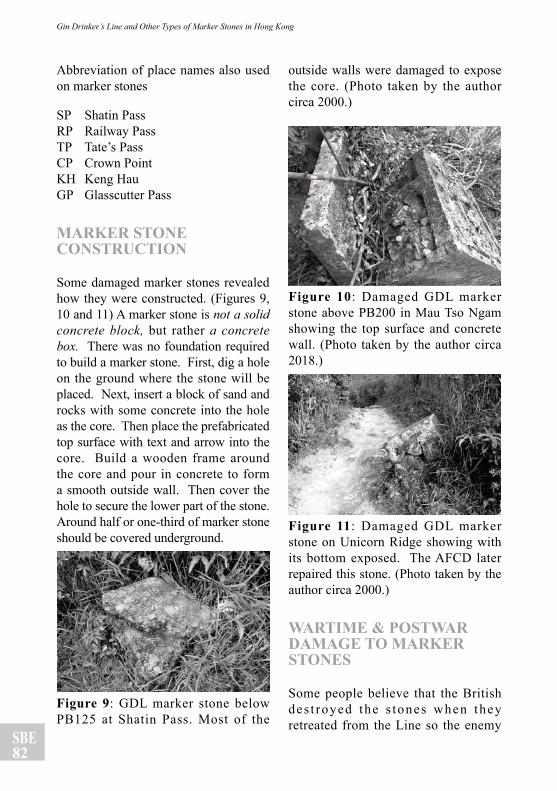
SBE82
Gin Drinker’s Line and Other Types of Marker Stones in Hong Kong
Abbreviation of place names also used on marker stones
SP Shatin PassRP Railway PassTP Tate’s PassCP Crown PointKH Keng HauGP Glasscutter Pass
MARKER STONE CONSTRUCTION
Some damaged marker stones revealed how they were constructed. (Figures 9, 10 and 11) A marker stone is not a solid concrete block, but rather a concrete box. There was no foundation required to build a marker stone. First, dig a hole on the ground where the stone will be placed. Next, insert a block of sand and rocks with some concrete into the hole as the core. Then place the prefabricated top surface with text and arrow into the core. Build a wooden frame around the core and pour in concrete to form a smooth outside wall. Then cover the hole to secure the lower part of the stone. Around half or one-third of marker stone should be covered underground.
Figure 9: GDL marker stone below PB125 at Shatin Pass. Most of the
outside walls were damaged to expose the core. (Photo taken by the author circa 2000.)
Figure 10: Damaged GDL marker stone above PB200 in Mau Tso Ngam showing the top surface and concrete wall. (Photo taken by the author circa 2018.)
Figure 11: Damaged GDL marker stone on Unicorn Ridge showing with its bottom exposed. The AFCD later repaired this stone. (Photo taken by the author circa 2000.)
WARTIME & POSTWAR DAMAGE TO MARKER STONES
Some people believe that the British des t royed the s tones when they retreated from the Line so the enemy
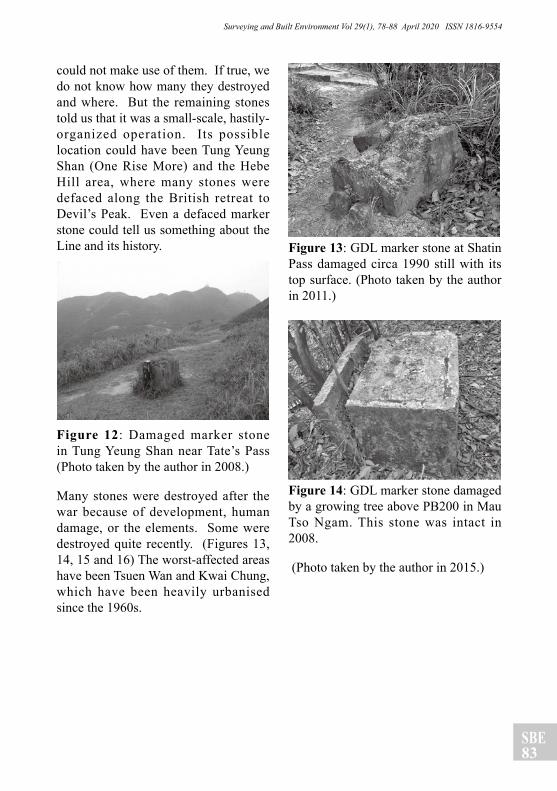
SBE83
Surveying and Built Environment Vol 29(1), 78-88 April 2020 ISSN 1816-9554
could not make use of them. If true, we do not know how many they destroyed and where. But the remaining stones told us that it was a small-scale, hastily-organized operation. Its possible location could have been Tung Yeung Shan (One Rise More) and the Hebe Hill area, where many stones were defaced along the British retreat to Devil’s Peak. Even a defaced marker stone could tell us something about the Line and its history.
Figure 12: Damaged marker stone in Tung Yeung Shan near Tate’s Pass (Photo taken by the author in 2008.)
Many stones were destroyed after the war because of development, human damage, or the elements. Some were destroyed quite recently. (Figures 13, 14, 15 and 16) The worst-affected areas have been Tsuen Wan and Kwai Chung, which have been heavily urbanised since the 1960s.
Figure 13: GDL marker stone at Shatin Pass damaged circa 1990 still with its top surface. (Photo taken by the author in 2011.)
Figure 14: GDL marker stone damaged by a growing tree above PB200 in Mau Tso Ngam. This stone was intact in 2008.
(Photo taken by the author in 2015.)
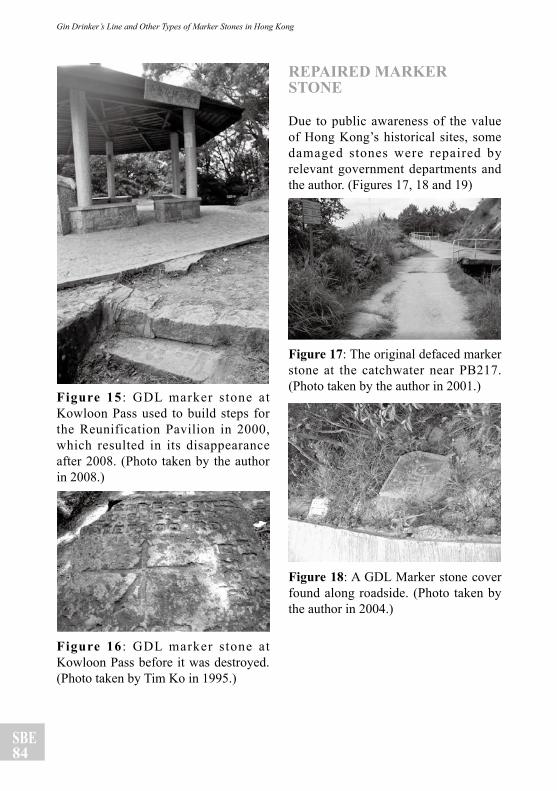
SBE84
Gin Drinker’s Line and Other Types of Marker Stones in Hong Kong
Figure 15 : GDL marker stone at Kowloon Pass used to build steps for the Reunification Pavilion in 2000, which resulted in its disappearance after 2008. (Photo taken by the author in 2008.)
Figure 16 : GDL marker stone at Kowloon Pass before it was destroyed. (Photo taken by Tim Ko in 1995.)
REPAIRED MARKER STONE
Due to public awareness of the value of Hong Kong’s historical sites, some damaged stones were repaired by relevant government departments and the author. (Figures 17, 18 and 19)
Figure 17: The original defaced marker stone at the catchwater near PB217. (Photo taken by the author in 2001.)
Figure 18: A GDL Marker stone cover found along roadside. (Photo taken by the author in 2004.)
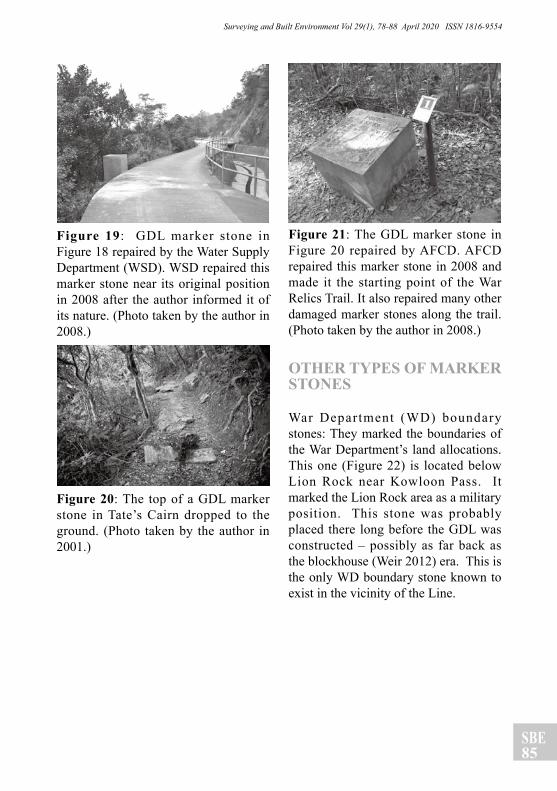
SBE85
Surveying and Built Environment Vol 29(1), 78-88 April 2020 ISSN 1816-9554
Figure 19: GDL marker stone in Figure 18 repaired by the Water Supply Department (WSD). WSD repaired this marker stone near its original position in 2008 after the author informed it of its nature. (Photo taken by the author in 2008.)
Figure 20: The top of a GDL marker stone in Tate’s Cairn dropped to the ground. (Photo taken by the author in 2001.)
Figure 21: The GDL marker stone in Figure 20 repaired by AFCD. AFCD repaired this marker stone in 2008 and made it the starting point of the War Relics Trail. It also repaired many other damaged marker stones along the trail. (Photo taken by the author in 2008.)
OTHER TYPES OF MARKER STONES
War Department (WD) boundary stones: They marked the boundaries of the War Department’s land allocations. This one (Figure 22) is located below Lion Rock near Kowloon Pass. It marked the Lion Rock area as a military position. This stone was probably placed there long before the GDL was constructed – possibly as far back as the blockhouse (Weir 2012) era. This is the only WD boundary stone known to exist in the vicinity of the Line.
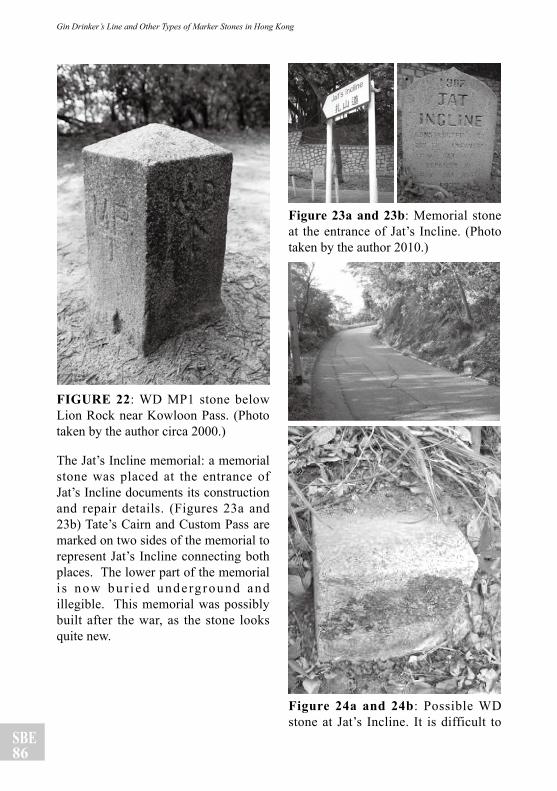
SBE86
Gin Drinker’s Line and Other Types of Marker Stones in Hong Kong
FIGURE 22: WD MP1 stone below Lion Rock near Kowloon Pass. (Photo taken by the author circa 2000.)
The Jat’s Incline memorial: a memorial stone was placed at the entrance of Jat’s Incline documents its construction and repair details. (Figures 23a and 23b) Tate’s Cairn and Custom Pass are marked on two sides of the memorial to represent Jat’s Incline connecting both places. The lower part of the memorial i s now bur ied underground and illegible. This memorial was possibly built after the war, as the stone looks quite new.
Figure 23a and 23b: Memorial stone at the entrance of Jat’s Incline. (Photo taken by the author 2010.)
Figure 24a and 24b: Possible WD stone at Jat’s Incline. It is difficult to
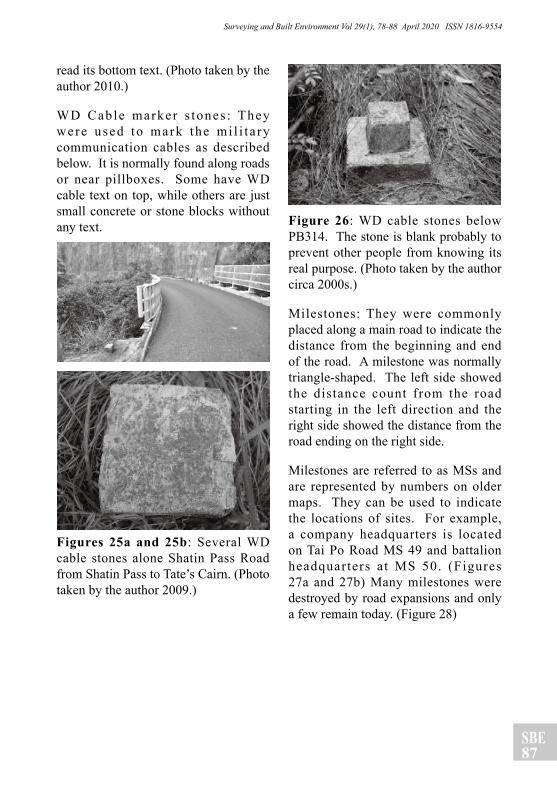
SBE87
Surveying and Built Environment Vol 29(1), 78-88 April 2020 ISSN 1816-9554
read its bottom text. (Photo taken by the author 2010.)
WD Cable marker s tones : They were used to mark the mi l i t a ry communication cables as described below. It is normally found along roads or near pillboxes. Some have WD cable text on top, while others are just small concrete or stone blocks without any text.
Figures 25a and 25b: Several WD cable stones alone Shatin Pass Road from Shatin Pass to Tate’s Cairn. (Photo taken by the author 2009.)
Figure 26: WD cable stones below PB314. The stone is blank probably to prevent other people from knowing its real purpose. (Photo taken by the author circa 2000s.)
Milestones: They were commonly placed along a main road to indicate the distance from the beginning and end of the road. A milestone was normally triangle-shaped. The left side showed the distance count from the road starting in the left direction and the right side showed the distance from the road ending on the right side.
Milestones are referred to as MSs and are represented by numbers on older maps. They can be used to indicate the locations of sites. For example, a company headquarters is located on Tai Po Road MS 49 and battalion headquarters at MS 50. (Figures 27a and 27b) Many milestones were destroyed by road expansions and only a few remain today. (Figure 28)
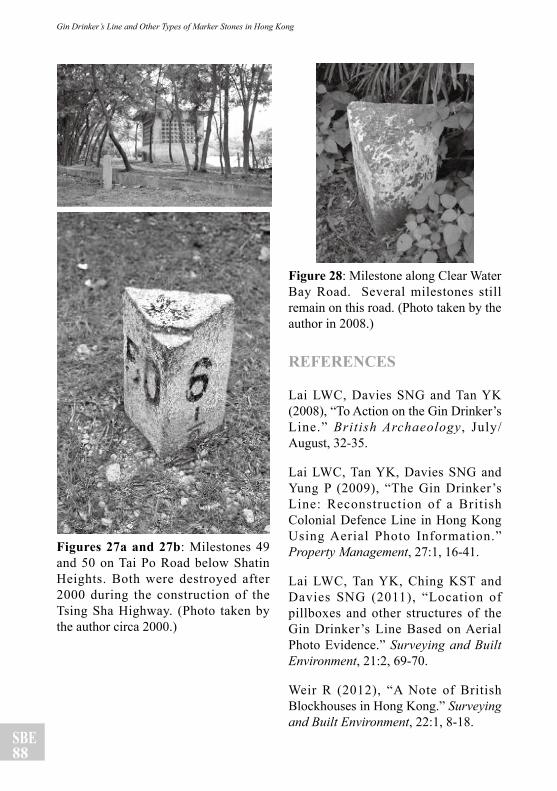
SBE88
Gin Drinker’s Line and Other Types of Marker Stones in Hong Kong
Figures 27a and 27b: Milestones 49 and 50 on Tai Po Road below Shatin Heights. Both were destroyed after 2000 during the construction of the Tsing Sha Highway. (Photo taken by the author circa 2000.)
Figure 28: Milestone along Clear Water Bay Road. Several milestones still remain on this road. (Photo taken by the author in 2008.)
REFERENCES
Lai LWC, Davies SNG and Tan YK (2008), “To Action on the Gin Drinker’s Line.” British Archaeology , July/August, 32-35.
Lai LWC, Tan YK, Davies SNG and Yung P (2009), “The Gin Drinker’s Line: Reconstruction of a British Colonial Defence Line in Hong Kong Using Aerial Photo Information.” Property Management, 27:1, 16-41.
Lai LWC, Tan YK, Ching KST and Davies SNG (2011), “Location of pillboxes and other structures of the Gin Drinker’s Line Based on Aerial Photo Evidence.” Surveying and Built Environment, 21:2, 69-70.
Weir R (2012), “A Note of British Blockhouses in Hong Kong.” Surveying and Built Environment, 22:1, 8-18.
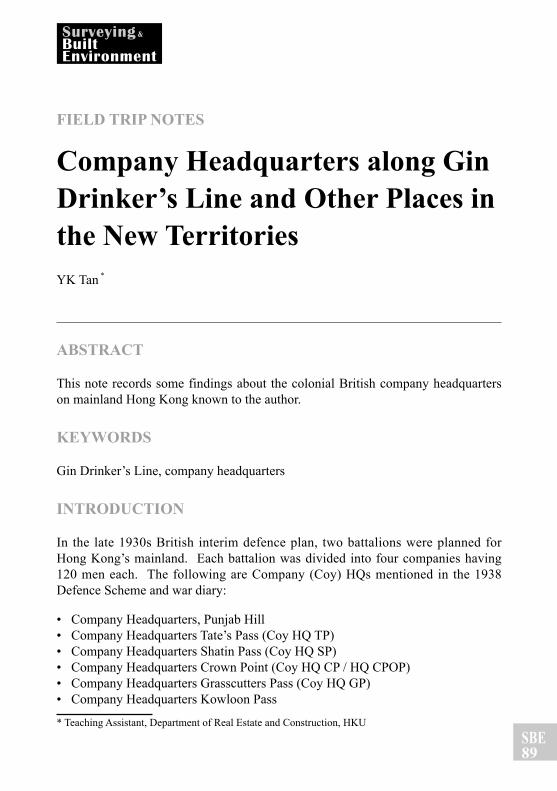
SBE89
FIELD TRIP NOTES
Company Headquarters along Gin Drinker’s Line and Other Places in the New TerritoriesYK Tan *
ABSTRACT
This note records some findings about the colonial British company headquarters on mainland Hong Kong known to the author.
KEYWORDS
Gin Drinker’s Line, company headquarters
INTRODUCTION
In the late 1930s British interim defence plan, two battalions were planned for Hong Kong’s mainland. Each battalion was divided into four companies having 120 men each. The following are Company (Coy) HQs mentioned in the 1938 Defence Scheme and war diary:
• Company Headquarters, Punjab Hill• Company Headquarters Tate’s Pass (Coy HQ TP)• Company Headquarters Shatin Pass (Coy HQ SP)• Company Headquarters Crown Point (Coy HQ CP / HQ CPOP)• Company Headquarters Grasscutters Pass (Coy HQ GP)• Company Headquarters Kowloon Pass
* Teaching Assistant, Department of Real Estate and Construction, HKU
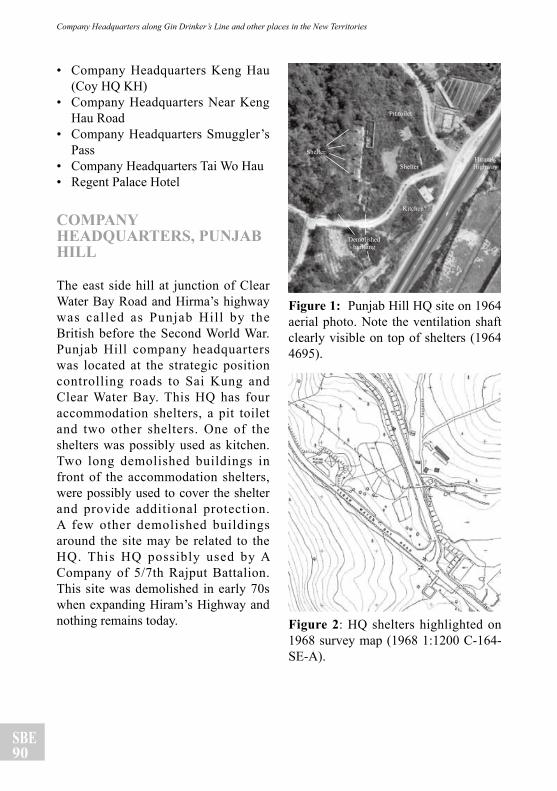
SBE90
Company Headquarters along Gin Drinker’s Line and other places in the New Territories
Figure 1: Punjab Hill HQ site on 1964 aerial photo. Note the ventilation shaft clearly visible on top of shelters (1964 4695).
Figure 2: HQ shelters highlighted on 1968 survey map (1968 1:1200 C-164-SE-A).
• Company Headquarters Keng Hau (Coy HQ KH)
• Company Headquarters Near Keng Hau Road
• Company Headquarters Smuggler’s Pass
• Company Headquarters Tai Wo Hau• Regent Palace Hotel
COMPANY HEADQUARTERS, PUNJAB HILL
The east side hill at junction of Clear Water Bay Road and Hirma’s highway was called as Punjab Hill by the British before the Second World War. Punjab Hill company headquarters was located at the strategic position controlling roads to Sai Kung and Clear Water Bay. This HQ has four accommodation shelters, a pit toilet and two other shelters. One of the shelters was possibly used as kitchen. Two long demolished buildings in front of the accommodation shelters, were possibly used to cover the shelter and provide additional protection. A few other demolished buildings around the site may be related to the HQ. This HQ possibly used by A Company of 5/7th Rajput Battalion. This site was demolished in early 70s when expanding Hiram’s Highway and nothing remains today.
Pit toilet
Shelter
Kitchen?
Demolished building
Hiram’s HighwayShelter
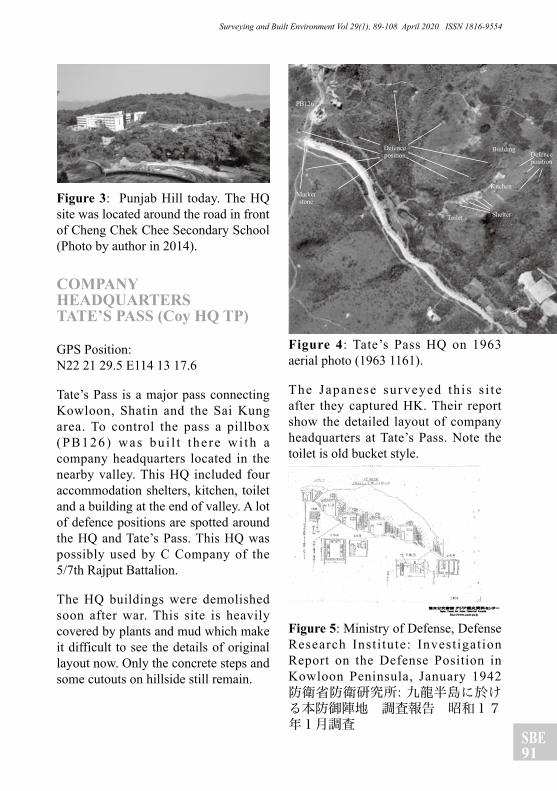
SBE91
Surveying and Built Environment Vol 29(1), 89-108 April 2020 ISSN 1816-9554
Figure 3: Punjab Hill today. The HQ site was located around the road in front of Cheng Chek Chee Secondary School (Photo by author in 2014).
COMPANY HEADQUARTERS TATE’S PASS (Coy HQ TP)
GPS Position: N22 21 29.5 E114 13 17.6
Tate’s Pass is a major pass connecting Kowloon, Shatin and the Sai Kung area. To control the pass a pillbox (PB126) was bu i l t the re wi th a company headquarters located in the nearby valley. This HQ included four accommodation shelters, kitchen, toilet and a building at the end of valley. A lot of defence positions are spotted around the HQ and Tate’s Pass. This HQ was possibly used by C Company of the 5/7th Rajput Battalion.
The HQ buildings were demolished soon after war. This site is heavily covered by plants and mud which make it difficult to see the details of original layout now. Only the concrete steps and some cutouts on hillside still remain.
Figure 4: Tate’s Pass HQ on 1963 aerial photo (1963 1161).
The Japanese surveyed th is s i te after they captured HK. Their report show the detailed layout of company headquarters at Tate’s Pass. Note the toilet is old bucket style.
Figure 5: Ministry of Defense, Defense Research Insti tute: Investigation Report on the Defense Position in Kowloon Peninsula, January 1942 防衛省防衛研究所: 九龍半島に於ける本防御陣地 調査報告 昭和17年1月調査
Defence position
Marker stone
Defence position
PB126
Building
Kitchen
Toilet Shelter
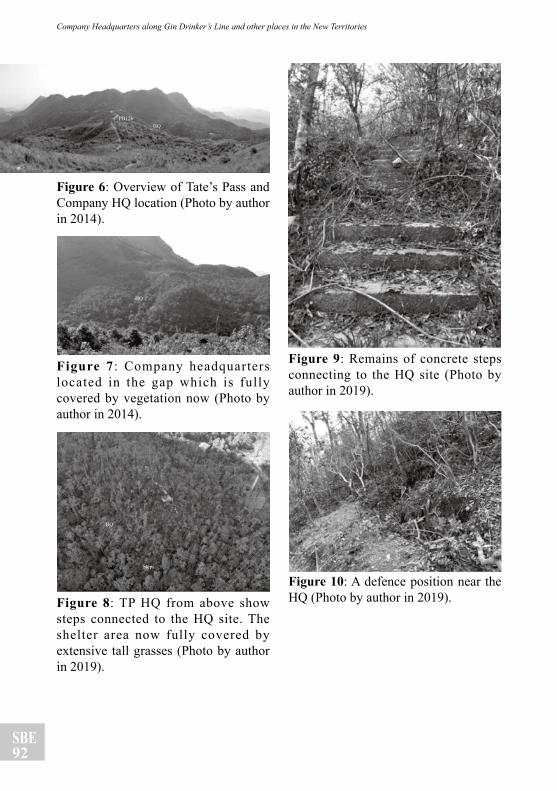
SBE92
Company Headquarters along Gin Drinker’s Line and other places in the New Territories
Figure 6: Overview of Tate’s Pass and Company HQ location (Photo by author in 2014).
Figure 7 : Company headquarters located in the gap which is fully covered by vegetation now (Photo by author in 2014).
Figure 8: TP HQ from above show steps connected to the HQ site. The shelter area now fully covered by extensive tall grasses (Photo by author in 2019).
Figure 9: Remains of concrete steps connecting to the HQ site (Photo by author in 2019).
Figure 10: A defence position near the HQ (Photo by author in 2019).
PB126HQ
HQ
HQ
Steps
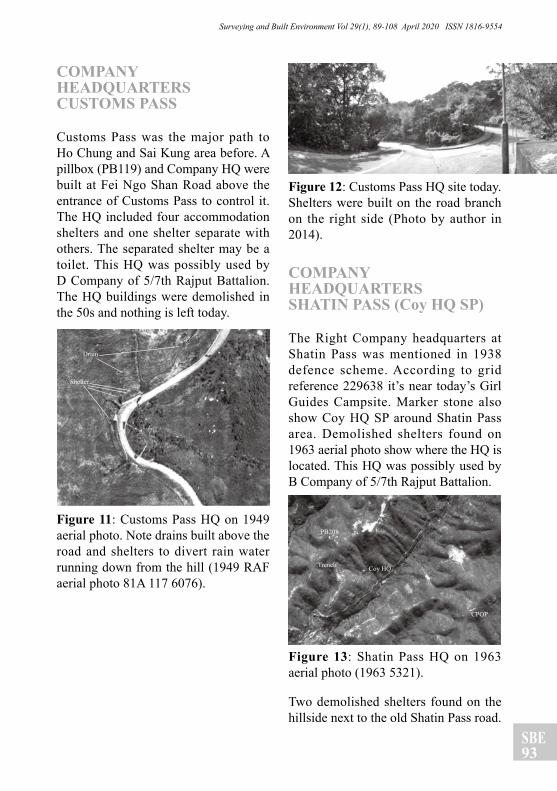
SBE93
Surveying and Built Environment Vol 29(1), 89-108 April 2020 ISSN 1816-9554
COMPANY HEADQUARTERS CUSTOMS PASS
Customs Pass was the major path to Ho Chung and Sai Kung area before. A pillbox (PB119) and Company HQ were built at Fei Ngo Shan Road above the entrance of Customs Pass to control it. The HQ included four accommodation shelters and one shelter separate with others. The separated shelter may be a toilet. This HQ was possibly used by D Company of 5/7th Rajput Battalion. The HQ buildings were demolished in the 50s and nothing is left today.
Figure 11: Customs Pass HQ on 1949 aerial photo. Note drains built above the road and shelters to divert rain water running down from the hill (1949 RAF aerial photo 81A 117 6076).
Figure 12: Customs Pass HQ site today. Shelters were built on the road branch on the right side (Photo by author in 2014).
COMPANY HEADQUARTERS SHATIN PASS (Coy HQ SP)
The Right Company headquarters at Shatin Pass was mentioned in 1938 defence scheme. According to grid reference 229638 it’s near today’s Girl Guides Campsite. Marker stone also show Coy HQ SP around Shatin Pass area. Demolished shelters found on 1963 aerial photo show where the HQ is located. This HQ was possibly used by B Company of 5/7th Rajput Battalion.
Figure 13: Shatin Pass HQ on 1963 aerial photo (1963 5321).
Two demolished shelters found on the hillside next to the old Shatin Pass road.
Shelter
Drain
CPOP
PB208
Coy HQTrench
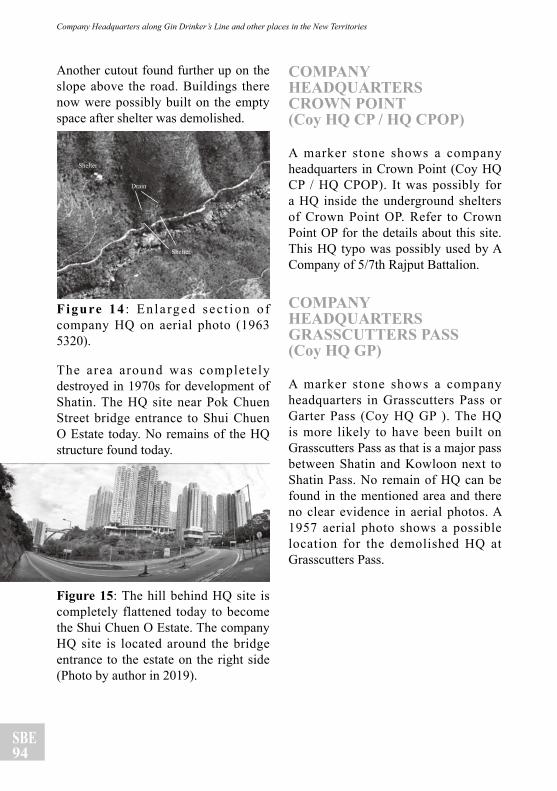
SBE94
Company Headquarters along Gin Drinker’s Line and other places in the New Territories
Another cutout found further up on the slope above the road. Buildings there now were possibly built on the empty space after shelter was demolished.
Figure 14 : En la rged sec t ion o f company HQ on aerial photo (1963 5320).
The area around was completely destroyed in 1970s for development of Shatin. The HQ site near Pok Chuen Street bridge entrance to Shui Chuen O Estate today. No remains of the HQ structure found today.
Figure 15: The hill behind HQ site is completely flattened today to become the Shui Chuen O Estate. The company HQ site is located around the bridge entrance to the estate on the right side (Photo by author in 2019).
COMPANY HEADQUARTERS CROWN POINT (Coy HQ CP / HQ CPOP)
A marker stone shows a company headquarters in Crown Point (Coy HQ CP / HQ CPOP). It was possibly for a HQ inside the underground shelters of Crown Point OP. Refer to Crown Point OP for the details about this site. This HQ typo was possibly used by A Company of 5/7th Rajput Battalion.
COMPANY HEADQUARTERS GRASSCUTTERS PASS (Coy HQ GP)
A marker stone shows a company headquarters in Grasscutters Pass or Garter Pass (Coy HQ GP ). The HQ is more likely to have been built on Grasscutters Pass as that is a major pass between Shatin and Kowloon next to Shatin Pass. No remain of HQ can be found in the mentioned area and there no clear evidence in aerial photos. A 1957 aerial photo shows a possible location for the demolished HQ at Grasscutters Pass.
Shelter
Drain
Shelter
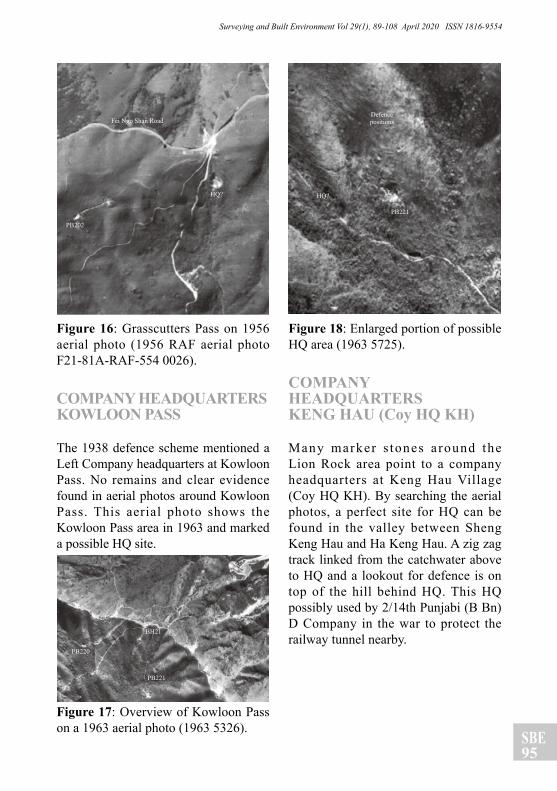
SBE95
Surveying and Built Environment Vol 29(1), 89-108 April 2020 ISSN 1816-9554
Figure 16: Grasscutters Pass on 1956 aerial photo (1956 RAF aerial photo F21-81A-RAF-554 0026).
COMPANY HEADQUARTERS KOWLOON PASS
The 1938 defence scheme mentioned a Left Company headquarters at Kowloon Pass. No remains and clear evidence found in aerial photos around Kowloon Pass. This aerial photo shows the Kowloon Pass area in 1963 and marked a possible HQ site.
Figure 17: Overview of Kowloon Pass on a 1963 aerial photo (1963 5326).
Figure 18: Enlarged portion of possible HQ area (1963 5725).
COMPANY HEADQUARTERS KENG HAU (Coy HQ KH)
Many marker s tones around the Lion Rock area point to a company headquarters at Keng Hau Village (Coy HQ KH). By searching the aerial photos, a perfect site for HQ can be found in the valley between Sheng Keng Hau and Ha Keng Hau. A zig zag track linked from the catchwater above to HQ and a lookout for defence is on top of the hill behind HQ. This HQ possibly used by 2/14th Punjabi (B Bn) D Company in the war to protect the railway tunnel nearby.
HQ?
Fei Ngo Shan Road
PB202
BH21
PB220
PB221
HQ?
Defence positions
PB221
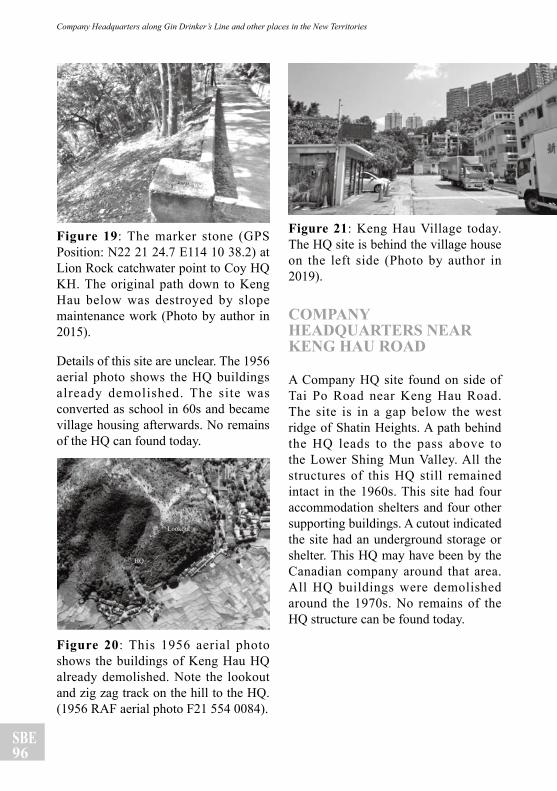
SBE96
Company Headquarters along Gin Drinker’s Line and other places in the New Territories
Figure 19: The marker stone (GPS Position: N22 21 24.7 E114 10 38.2) at Lion Rock catchwater point to Coy HQ KH. The original path down to Keng Hau below was destroyed by slope maintenance work (Photo by author in 2015).
Details of this site are unclear. The 1956 aerial photo shows the HQ buildings already demolished. The site was converted as school in 60s and became village housing afterwards. No remains of the HQ can found today.
Figure 20: This 1956 aerial photo shows the buildings of Keng Hau HQ already demolished. Note the lookout and zig zag track on the hill to the HQ. (1956 RAF aerial photo F21 554 0084).
Figure 21: Keng Hau Village today. The HQ site is behind the village house on the left side (Photo by author in 2019).
COMPANY HEADQUARTERS NEAR KENG HAU ROAD
A Company HQ site found on side of Tai Po Road near Keng Hau Road. The site is in a gap below the west ridge of Shatin Heights. A path behind the HQ leads to the pass above to the Lower Shing Mun Valley. All the structures of this HQ still remained intact in the 1960s. This site had four accommodation shelters and four other supporting buildings. A cutout indicated the site had an underground storage or shelter. This HQ may have been by the Canadian company around that area. All HQ buildings were demolished around the 1970s. No remains of the HQ structure can be found today.
HQ
Lookout
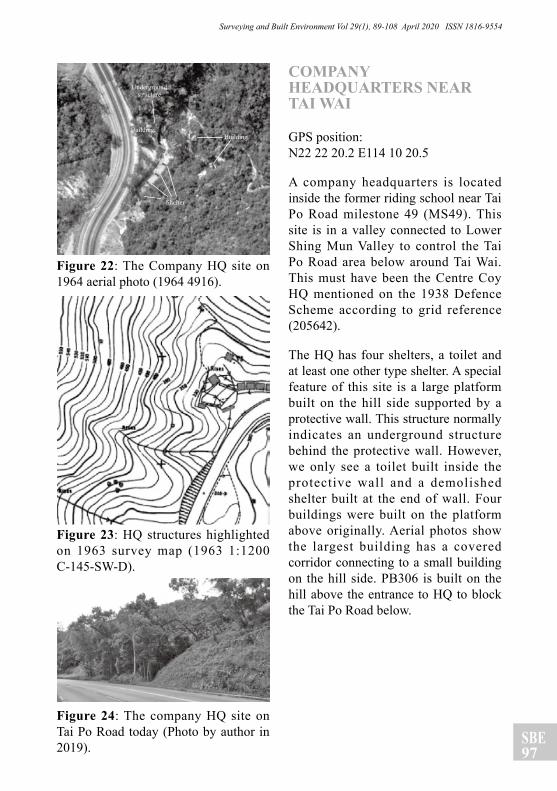
SBE97
Surveying and Built Environment Vol 29(1), 89-108 April 2020 ISSN 1816-9554
Figure 22: The Company HQ site on 1964 aerial photo (1964 4916).
Figure 23: HQ structures highlighted on 1963 survey map (1963 1:1200 C-145-SW-D).
COMPANY HEADQUARTERS NEAR TAI WAI
GPS position: N22 22 20.2 E114 10 20.5
A company headquarters is located inside the former riding school near Tai Po Road milestone 49 (MS49). This site is in a valley connected to Lower Shing Mun Valley to control the Tai Po Road area below around Tai Wai. This must have been the Centre Coy HQ mentioned on the 1938 Defence Scheme according to grid reference (205642).
The HQ has four shelters, a toilet and at least one other type shelter. A special feature of this site is a large platform built on the hill side supported by a protective wall. This structure normally indicates an underground structure behind the protective wall. However, we only see a toilet built inside the protective wall and a demolished shelter built at the end of wall. Four buildings were built on the platform above originally. Aerial photos show the largest building has a covered corridor connecting to a small building on the hill side. PB306 is built on the hill above the entrance to HQ to block the Tai Po Road below.
Building
Shelter
Building
Underground structure
Figure 24: The company HQ site on Tai Po Road today (Photo by author in 2019).
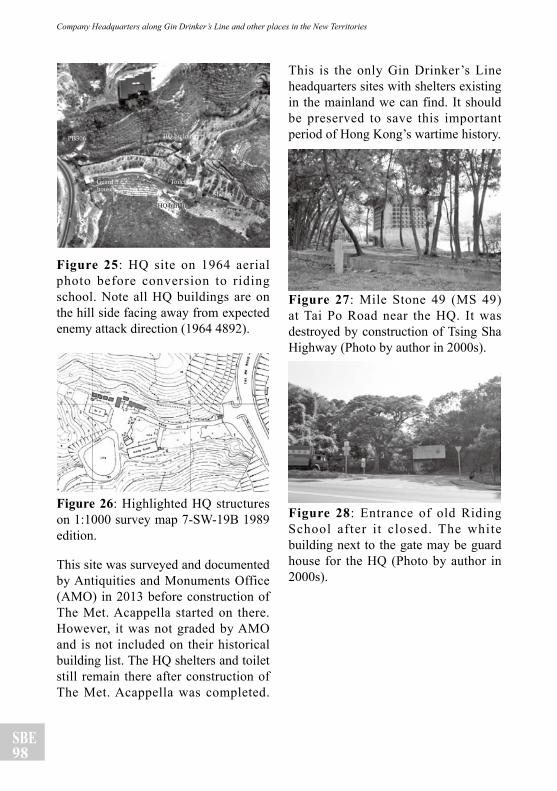
SBE98
Company Headquarters along Gin Drinker’s Line and other places in the New Territories
Figure 25: HQ site on 1964 aerial photo before conversion to riding school. Note all HQ buildings are on the hill side facing away from expected enemy attack direction (1964 4892).
Figure 26: Highlighted HQ structures on 1:1000 survey map 7-SW-19B 1989 edition.
This site was surveyed and documented by Antiquities and Monuments Office (AMO) in 2013 before construction of The Met. Acappella started on there. However, it was not graded by AMO and is not included on their historical building list. The HQ shelters and toilet still remain there after construction of The Met. Acappella was completed.
This is the only Gin Drinker’s Line headquarters sites with shelters existing in the mainland we can find. It should be preserved to save this important period of Hong Kong’s wartime history.
Figure 27: Mile Stone 49 (MS 49) at Tai Po Road near the HQ. It was destroyed by construction of Tsing Sha Highway (Photo by author in 2000s).
Figure 28: Entrance of old Riding School after it closed. The white building next to the gate may be guard house for the HQ (Photo by author in 2000s).
PB306
Guard house
Toilet
HQ building
Shelters
HQ buildingHQ building
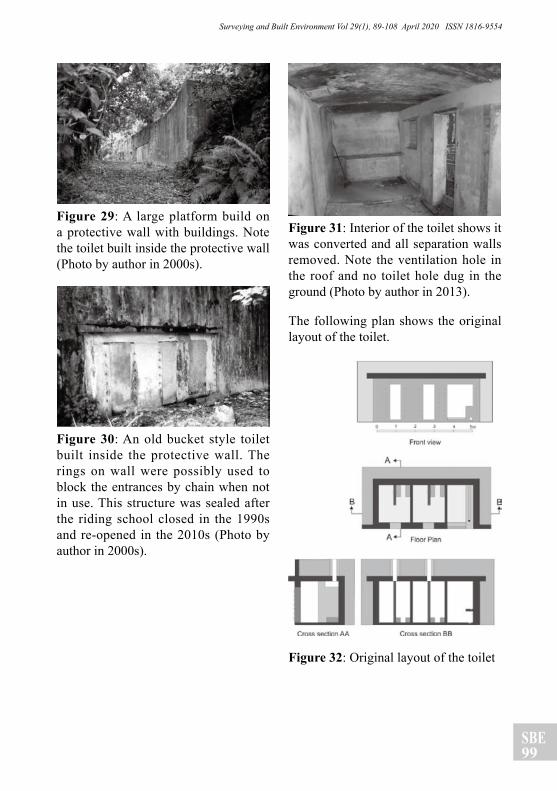
SBE99
Surveying and Built Environment Vol 29(1), 89-108 April 2020 ISSN 1816-9554
Figure 29: A large platform build on a protective wall with buildings. Note the toilet built inside the protective wall (Photo by author in 2000s).
Figure 30: An old bucket style toilet built inside the protective wall. The rings on wall were possibly used to block the entrances by chain when not in use. This structure was sealed after the riding school closed in the 1990s and re-opened in the 2010s (Photo by author in 2000s).
Figure 31: Interior of the toilet shows it was converted and all separation walls removed. Note the ventilation hole in the roof and no toilet hole dug in the ground (Photo by author in 2013).
The following plan shows the original layout of the toilet.
Figure 32: Original layout of the toilet
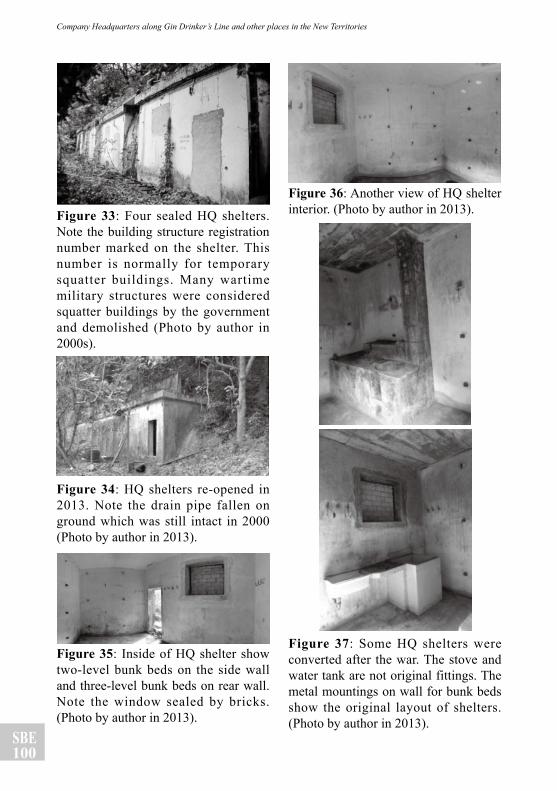
SBE100
Company Headquarters along Gin Drinker’s Line and other places in the New Territories
Figure 33: Four sealed HQ shelters. Note the building structure registration number marked on the shelter. This number is normally for temporary squatter buildings. Many wartime military structures were considered squatter buildings by the government and demolished (Photo by author in 2000s).
Figure 34: HQ shelters re-opened in 2013. Note the drain pipe fallen on ground which was still intact in 2000 (Photo by author in 2013).
Figure 35: Inside of HQ shelter show two-level bunk beds on the side wall and three-level bunk beds on rear wall. Note the window sealed by bricks. (Photo by author in 2013).
Figure 36: Another view of HQ shelter interior. (Photo by author in 2013).
Figure 37: Some HQ shelters were converted after the war. The stove and water tank are not original fittings. The metal mountings on wall for bunk beds show the original layout of shelters. (Photo by author in 2013).
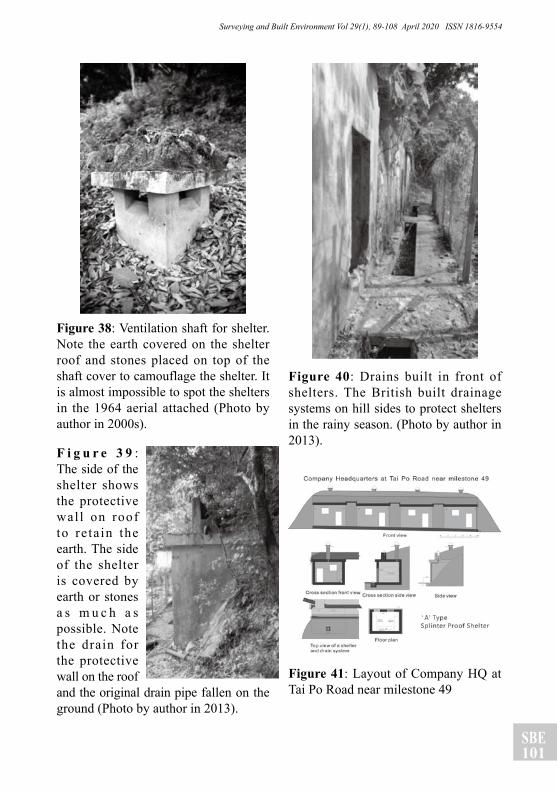
SBE101
Surveying and Built Environment Vol 29(1), 89-108 April 2020 ISSN 1816-9554
Figure 38: Ventilation shaft for shelter. Note the earth covered on the shelter roof and stones placed on top of the shaft cover to camouflage the shelter. It is almost impossible to spot the shelters in the 1964 aerial attached (Photo by author in 2000s).
F i g u r e 3 9 : The side of the shelter shows the protective wal l on roof to re ta in the earth. The side of the shelter is covered by earth or stones a s m u c h a s possible. Note the drain for the protective wall on the roof and the original drain pipe fallen on the ground (Photo by author in 2013).
Figure 40: Drains built in front of shelters. The British built drainage systems on hill sides to protect shelters in the rainy season. (Photo by author in 2013).
Figure 41: Layout of Company HQ at Tai Po Road near milestone 49
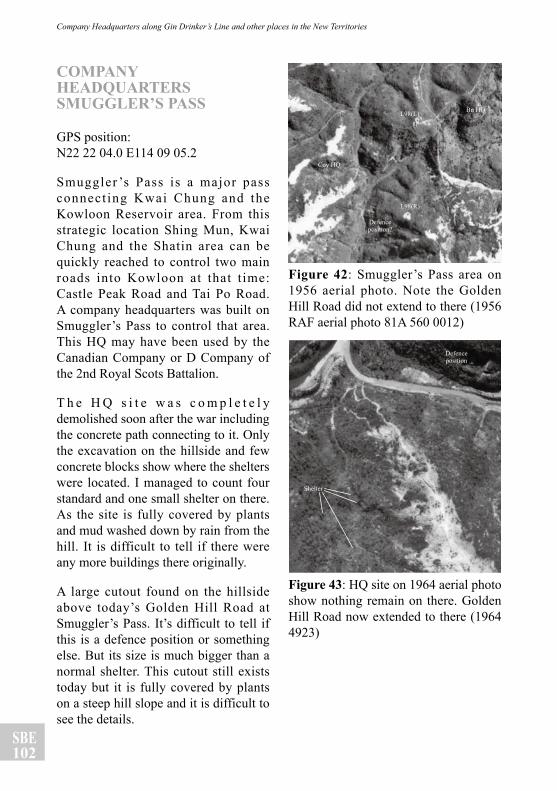
SBE102
Company Headquarters along Gin Drinker’s Line and other places in the New Territories
COMPANY HEADQUARTERS SMUGGLER’S PASS
GPS position: N22 22 04.0 E114 09 05.2
Smuggler ’s Pass is a major pass connect ing Kwai Chung and the Kowloon Reservoir area. From this strategic location Shing Mun, Kwai Chung and the Shatin area can be quickly reached to control two main roads into Kowloon at that t ime: Castle Peak Road and Tai Po Road. A company headquarters was built on Smuggler’s Pass to control that area. This HQ may have been used by the Canadian Company or D Company of the 2nd Royal Scots Battalion.
T h e H Q s i t e w a s c o m p l e t e l y demolished soon after the war including the concrete path connecting to it. Only the excavation on the hillside and few concrete blocks show where the shelters were located. I managed to count four standard and one small shelter on there. As the site is fully covered by plants and mud washed down by rain from the hill. It is difficult to tell if there were any more buildings there originally.
A large cutout found on the hillside above today’s Golden Hill Road at Smuggler’s Pass. It’s difficult to tell if this is a defence position or something else. But its size is much bigger than a normal shelter. This cutout still exists today but it is fully covered by plants on a steep hill slope and it is difficult to see the details.
Figure 42: Smuggler’s Pass area on 1956 aerial photo. Note the Golden Hill Road did not extend to there (1956 RAF aerial photo 81A 560 0012)
Figure 43: HQ site on 1964 aerial photo show nothing remain on there. Golden Hill Road now extended to there (1964 4923)
L98(R)
Coy HQ
L98(L) Bn HQ
Defence position?
Defence position
Shelter
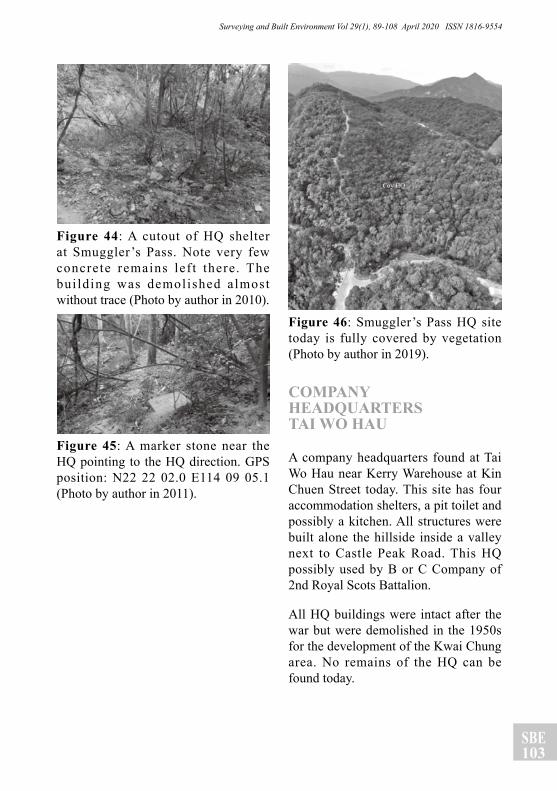
SBE103
Surveying and Built Environment Vol 29(1), 89-108 April 2020 ISSN 1816-9554
Figure 44: A cutout of HQ shelter at Smuggler’s Pass. Note very few concrete remains lef t there. The bui lding was demolished almost without trace (Photo by author in 2010).
Figure 45: A marker stone near the HQ pointing to the HQ direction. GPS position: N22 22 02.0 E114 09 05.1 (Photo by author in 2011).
Figure 46: Smuggler’s Pass HQ site today is fully covered by vegetation (Photo by author in 2019).
COMPANY HEADQUARTERS TAI WO HAU
A company headquarters found at Tai Wo Hau near Kerry Warehouse at Kin Chuen Street today. This site has four accommodation shelters, a pit toilet and possibly a kitchen. All structures were built alone the hillside inside a valley next to Castle Peak Road. This HQ possibly used by B or C Company of 2nd Royal Scots Battalion.
All HQ buildings were intact after the war but were demolished in the 1950s for the development of the Kwai Chung area. No remains of the HQ can be found today.
Coy HQ
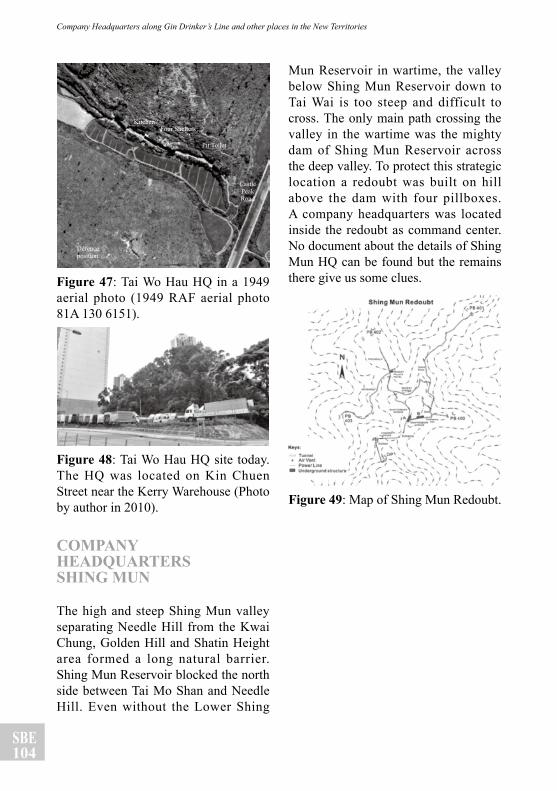
SBE104
Company Headquarters along Gin Drinker’s Line and other places in the New Territories
Figure 47: Tai Wo Hau HQ in a 1949 aerial photo (1949 RAF aerial photo 81A 130 6151).
Figure 48: Tai Wo Hau HQ site today. The HQ was located on Kin Chuen Street near the Kerry Warehouse (Photo by author in 2010).
COMPANY HEADQUARTERS SHING MUN
The high and steep Shing Mun valley separating Needle Hill from the Kwai Chung, Golden Hill and Shatin Height area formed a long natural barrier. Shing Mun Reservoir blocked the north side between Tai Mo Shan and Needle Hill. Even without the Lower Shing
Mun Reservoir in wartime, the valley below Shing Mun Reservoir down to Tai Wai is too steep and difficult to cross. The only main path crossing the valley in the wartime was the mighty dam of Shing Mun Reservoir across the deep valley. To protect this strategic location a redoubt was built on hill above the dam with four pillboxes. A company headquarters was located inside the redoubt as command center. No document about the details of Shing Mun HQ can be found but the remains there give us some clues.
Figure 49: Map of Shing Mun Redoubt.
Kitchen?
Pit Toilet
Four Shelters
Castle Peak Road
Defenceposition
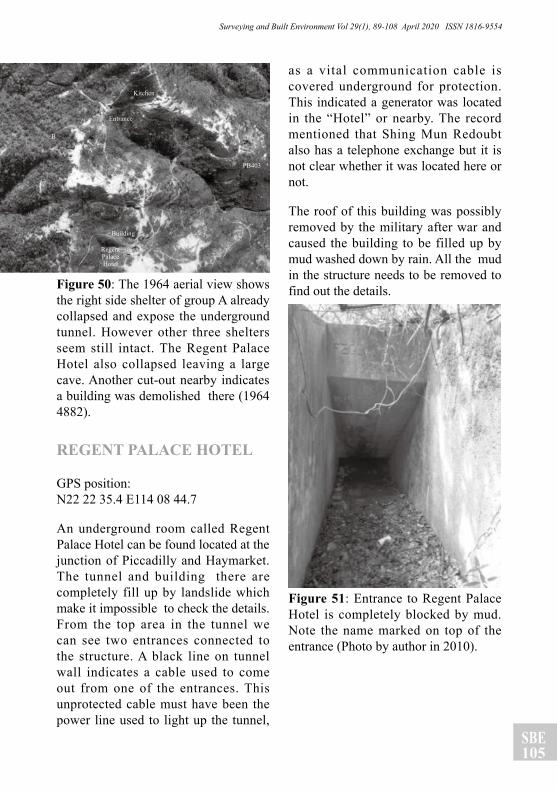
SBE105
Surveying and Built Environment Vol 29(1), 89-108 April 2020 ISSN 1816-9554
Figure 50: The 1964 aerial view shows the right side shelter of group A already collapsed and expose the underground tunnel. However other three shelters seem still intact. The Regent Palace Hotel also collapsed leaving a large cave. Another cut-out nearby indicates a building was demolished there (1964 4882).
REGENT PALACE HOTEL
GPS position: N22 22 35.4 E114 08 44.7
An underground room called Regent Palace Hotel can be found located at the junction of Piccadilly and Haymarket. The tunnel and building there are completely fill up by landslide which make it impossible to check the details. From the top area in the tunnel we can see two entrances connected to the structure. A black line on tunnel wall indicates a cable used to come out from one of the entrances. This unprotected cable must have been the power line used to light up the tunnel,
as a vital communication cable is covered underground for protection. This indicated a generator was located in the “Hotel” or nearby. The record mentioned that Shing Mun Redoubt also has a telephone exchange but it is not clear whether it was located here or not.
The roof of this building was possibly removed by the military after war and caused the building to be filled up by mud washed down by rain. All the mud in the structure needs to be removed to find out the details.
Figure 51: Entrance to Regent Palace Hotel is completely blocked by mud. Note the name marked on top of the entrance (Photo by author in 2010).
Kitchen
Building
Regent Palace Hotel
PB403
A
Entrance
B
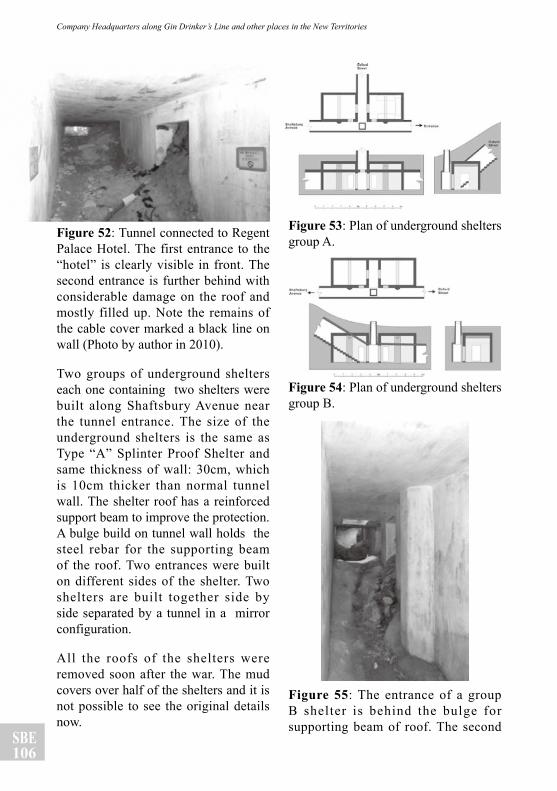
SBE106
Company Headquarters along Gin Drinker’s Line and other places in the New Territories
Figure 52: Tunnel connected to Regent Palace Hotel. The first entrance to the “hotel” is clearly visible in front. The second entrance is further behind with considerable damage on the roof and mostly filled up. Note the remains of the cable cover marked a black line on wall (Photo by author in 2010).
Two groups of underground shelters each one containing two shelters were built along Shaftsbury Avenue near the tunnel entrance. The size of the underground shelters is the same as Type “A” Splinter Proof Shelter and same thickness of wall: 30cm, which is 10cm thicker than normal tunnel wall. The shelter roof has a reinforced support beam to improve the protection. A bulge build on tunnel wall holds the steel rebar for the supporting beam of the roof. Two entrances were built on different sides of the shelter. Two shelters are built together side by side separated by a tunnel in a mirror configuration.
All the roofs of the shelters were removed soon after the war. The mud covers over half of the shelters and it is not possible to see the original details now.
Figure 53: Plan of underground shelters group A.
Figure 54: Plan of underground shelters group B.
Figure 55: The entrance of a group B shelter is behind the bulge for supporting beam of roof. The second
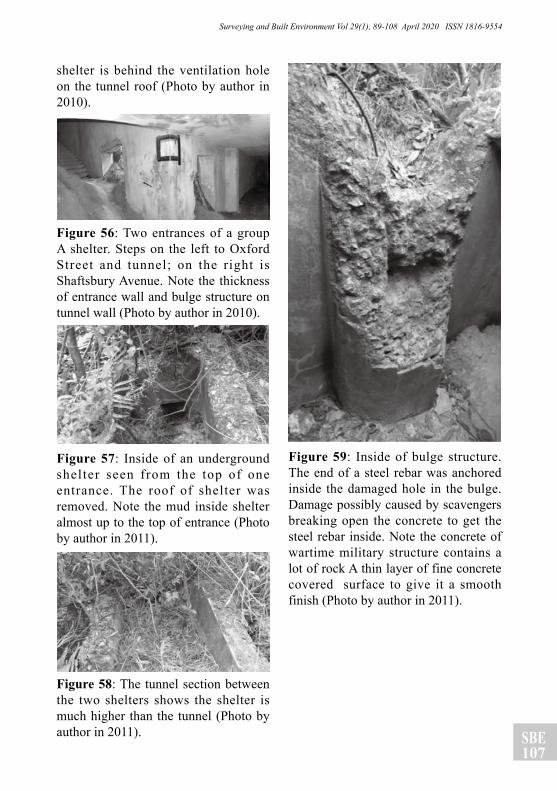
SBE107
Surveying and Built Environment Vol 29(1), 89-108 April 2020 ISSN 1816-9554
shelter is behind the ventilation hole on the tunnel roof (Photo by author in 2010).
Figure 56: Two entrances of a group A shelter. Steps on the left to Oxford Street and tunnel; on the right is Shaftsbury Avenue. Note the thickness of entrance wall and bulge structure on tunnel wall (Photo by author in 2010).
Figure 57: Inside of an underground shelter seen from the top of one entrance. The roof of shelter was removed. Note the mud inside shelter almost up to the top of entrance (Photo by author in 2011).
Figure 58: The tunnel section between the two shelters shows the shelter is much higher than the tunnel (Photo by author in 2011).
Figure 59: Inside of bulge structure. The end of a steel rebar was anchored inside the damaged hole in the bulge. Damage possibly caused by scavengers breaking open the concrete to get the steel rebar inside. Note the concrete of wartime military structure contains a lot of rock A thin layer of fine concrete covered surface to give it a smooth finish (Photo by author in 2011).
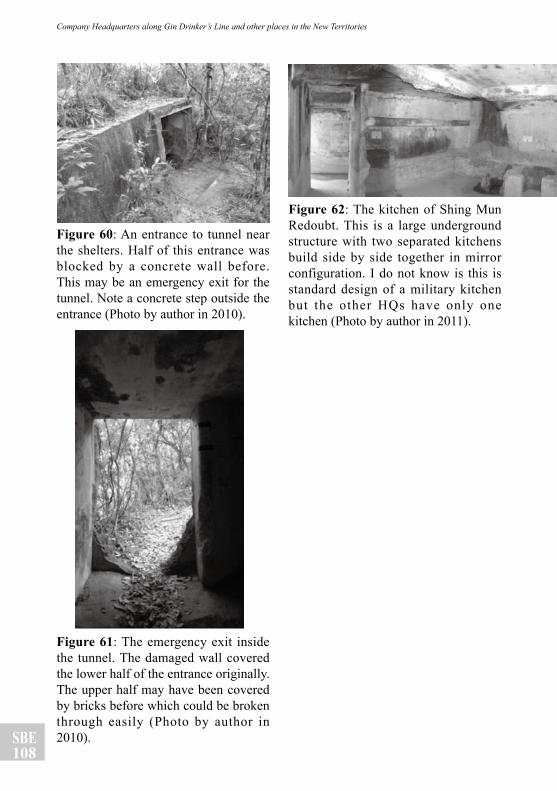
SBE108
Company Headquarters along Gin Drinker’s Line and other places in the New Territories
Figure 60: An entrance to tunnel near the shelters. Half of this entrance was blocked by a concrete wall before. This may be an emergency exit for the tunnel. Note a concrete step outside the entrance (Photo by author in 2010).
Figure 61: The emergency exit inside the tunnel. The damaged wall covered the lower half of the entrance originally. The upper half may have been covered by bricks before which could be broken through easily (Photo by author in 2010).
Figure 62: The kitchen of Shing Mun Redoubt. This is a large underground structure with two separated kitchens build side by side together in mirror configuration. I do not know is this is standard design of a military kitchen but the other HQs have only one kitchen (Photo by author in 2011).