smoothed particle hydrodynamics prediction of effective transport coefficients of lithium-ion...
TRANSCRIPT

This article appeared in a journal published by Elsevier. The attachedcopy is furnished to the author for internal non-commercial researchand education use, including for instruction at the authors institution
and sharing with colleagues.
Other uses, including reproduction and distribution, or selling orlicensing copies, or posting to personal, institutional or third party
websites are prohibited.
In most cases authors are permitted to post their version of thearticle (e.g. in Word or Tex form) to their personal website orinstitutional repository. Authors requiring further information
regarding Elsevier’s archiving and manuscript policies areencouraged to visit:
http://www.elsevier.com/authorsrights

Author's personal copy
Smoothed particle hydrodynamics prediction of effective transportcoefficients of lithium-ion battery electrodes
Jianbang Zeng, Wei Wu, Fangming Jiang ⁎Laboratory of Advanced Energy System, CAS Key Laboratory of Renewable Energy, Guangzhou Institute of Energy Conversion, Chinese Academy of Sciences (CAS), Guangzhou 510640, China
a b s t r a c ta r t i c l e i n f o
Article history:Received 25 November 2013Received in revised form 13 February 2014Accepted 15 March 2014Available online 12 April 2014
Keywords:Lithium-ion batteryEffective transport coefficientsSmoothed particle hydrodynamicsFormation factorSphere-based simulated annealing method
We develop a three-dimensional virtual physical property test platform based on the smoothed particle hydro-dynamics (SPH) method for the prediction of the effective transport coefficients, including the effective thermalconductivity, effective electronic conductivity, and effective Li+ species diffusivity of LiCoO2 electrodes of variousmicrostructures. The three-dimensional microstructure of the LiCoO2 electrode is reconstructed by a sphere-based simulated annealing method. SPH simulation results corroborate that the transport processes are stronglyaffected by the electrodemicrostructure. The calculated effective thermal conductivity by SPHmodel agreeswellwith the theoretical predictions by a semi-empirical effective mediummodel, while the effective mediummodelgenerally gives smaller effective electronic conductivity of the electrode than the SPHmodel. Comparing the SPH-predicted effective Li+ species diffusivity with the commonly-used Bruggeman approximation finds that thelatter generally overestimates the effective Li+ species diffusivity of the electrode. Furthermore, we derive theformation factor of electrolyte phase in the reconstructed electrode. It is found that the formation factorscalculated from SPH results are in good agreement with former experimental data.
© 2014 Elsevier B.V. All rights reserved.
1. Introduction
Lithium-ion batteries have been extensively used as power sourcesof mobile electronic devices, and are perceived to be promising alterna-tives to power sources of electric vehicles and other medium- to large-sized power or energy storage devices owing to advantages, e.g. highenergy density and near-zero memory effect [1]. Vital performance oflithium-ion batteries, such as safety, cycle life or capacity, is closely re-lated to the effective transport coefficients, including the effectivethermal conductivity, effective electronic (Li+) conductivity, and effec-tive Li+ (Li) species diffusivity, of electrodes. These effective transportcoefficients are mostly determined by the material intrinsic propertiesand the microstructure of the electrode. The volume fraction of eachcomponent, the particle shape and size distribution of solid activemate-rial and the geometrical connectivity of individual component etc. allmay have profound impact on the effective transport coefficients [2].Understanding the correlation of the effective transport coefficientsand electrode microstructure is the key to the design and optimizationof lithium-ion battery electrode microstructure.
The most straightforward theoretical models for the prediction ofeffective transport coefficients in heterogeneous multi-component ma-terials are generally some combinations of the classic series and parallelmodels [3–5]. In these theoretical models, the microscopic configura-tions in porous materials are simplified or idealized and the obtained
effective transport coefficients are only dependent on the volume frac-tion and bulk transport coefficient of each component. To involve theinformation of the microscopic configurations in porous materials,Kirkpatrick [6] modified the effective medium theory (EMT) model [7]for the calculation of effective thermal conductivity in two-componentmaterials by introducing a “flexible” factor. Based on a simple “step-process” concept, Jiang and Sousa [8] further extended the CarsonEMT model [7] for the calculation of effective thermal conductivity intwo-dimensional heterogeneous two- and three-component materials.The determination of “flexible” factor with respect to a particular medi-um usually resorts to physical experiments or numerical modeling.
Due to the rapid development of computer and computational tech-niques in recent years, numerical methods have been extensively usedto predict the effective transport coefficients ofmulti-componentmate-rials. Numerical prediction of effective transport coefficients of lithium-ion battery electrodes consists of two steps [9,10]. Thefirst step is the re-construction of themicrostructure of the electrode. Electrodes comprisemultiple components and are of various complicated microstructures.Experimental technique such as focused ion beam/scanning electronmicroscopy (FIB/SEM) is competent of three-dimensional reconstructionof electrode microstructures [11–14], but it is costly, time-consuming,and can normally generate a limited volume of electrode. Efforts havebeen expended to develop or utilize numerical methods for the recon-struction of three-dimensional electrode microstructures [15–20]. Com-pared with other numerical methods such as the Gaussian random fieldmethod [15], the multiple point geostatistical method [16], and theprocess-based stochastic reconstruction method [17,18], the simulated
Solid State Ionics 260 (2014) 76–85
⁎ Corresponding author. Tel.: +86 20 87057656.E-mail address: [email protected] (F. Jiang).
http://dx.doi.org/10.1016/j.ssi.2014.03.0160167-2738/© 2014 Elsevier B.V. All rights reserved.
Contents lists available at ScienceDirect
Solid State Ionics
j ourna l homepage: www.e lsev ie r .com/ locate /ss i

Author's personal copy
annealingmethod [19–22] is able to accommodate more statistical infor-mation extracted from sample electrodes and the reconstructed electrodeis thus more approximate to the real one.
The second step is pore- or particle-scalemodeling of relevant trans-port processes, including the heat transport, the charge (electron in thesolid active material and additives and Li+ in the electrolyte) transport,and the species (Li+ in the electrolyte and Li in the solid activematerial)transport. The traditional Eulerian-based numerical methods forpredicting the effective transport coefficients of multi-componentmaterials such asfinite differencemethod [23] andfinite elementmethod[24] generally require expensive or even prohibitive computational costwhen the microstructure of the particular material is too complicated.Therefore the micro/mesoscopic simulation methods for transport in po-rous media have received increasing attention in recent years. Shoshanyet al. [25] determined the effective thermal conductivity of porous mate-rials using the Monte Carlo method. Zhang et al. [26] predicted the effec-tive thermal conductivity of moist porous media through a randomlymixed model. Qian et al. [27] and Wang et al. [10] used two-dimensional five-speed (D2Q5) and nine-speed (D2Q9) latticeBoltzmann models, respectively, to predict the effective thermal conduc-tivity of porous materials. Jiang and Sousa [8] developed a two-dimensional virtual physical property test platform based on a relativelynovel numerical technique — smoothed particle hydrodynamics (SPH)method. They found that the effective thermal conductivities of two-dimensional heterogeneous two- and three-component materials pre-dicted by the modified EMT model with the “flexible” factor equal to4.5 agree well with the SPH predictions [8].
The SPH method has two defining characteristics, meshfree andLagrangian-based, which make it more advantageous than the tra-ditional Eulerian-based numerical techniques in what concernsthe following aspects: (1) particular suitability to tackle multi-disciplinary transport processes, (2) ease of handling complex freesurface and material interface, (3) relatively simple computercodes and ease of machine parallelization, and (4) intrinsic tran-sient essence. Application of the SPHmethod to predict the effectivetransport coefficients of lithium-ion battery electrodes can fullybenefit from these advantages.
One major objective of the present work is to develop a three-dimensional virtual physical property test platform via pore- orparticle-scale SPH numerical model, and innovatively employ it to pre-dict the effective transport coefficients of LiCoO2 electrodes of variousmicrostructures. The electrodes were reconstructed by a previouslydeveloped sphere-based simulated annealingmethod [21,22]. The geo-metrical connectivity of each component inside the reconstructed elec-trode is analyzed by the cluster analysis algorithm [28]. We will alsoderive the formation factor of the electrolyte phase in the reconstructedelectrode, and explore the correlation of the effective transport coeffi-cients and electrode microstructure.
2. Methodology
2.1. Reconstruction of electrodes
FIB/SEM images clearly identify that there are three components inLiCoO2 cathodes [21,22]: i) LiCoO2 particles as the solid active material,ii) electrolyte (providing pathways for Li+ species transport and chargetransport) filling the pores, and iii) solid additive particles (say,polyvinylidene fluoride, i.e. PVDF, serving as the binder of LiCoO2
particles, and acetylene black, i.e. AB, which has been added for theenhancement of electronic charge transport). Reconstruction of thethree-dimensional microstructure in lithium-ion battery electrodes interms of the sphere-based simulated annealing algorithm consists offive steps [21,22]:
Step 1: Statistical information extraction. Through experimental analysisand/or from FIB/SEM images of a LiCoO2 cathode, the statistical
information including the volume fractions of each component,the size distribution of LiCoO2 particles and the two-point corre-lation functions for themicrostructure of the LiCoO2 cathode, canbe obtained.
Step 2: Particle-system initialization. Initially, spherical LiCoO2 particlesare randomly positioned in an Lx × Ly × Lz box to satisfy thedesired volume fraction. With the help of a specially designedrandom number generator, radii of the spheres are specified tofollow the real particle diameter distribution curve obtainedfrom the analysis of LiCoO2 material powder. The overlap ofspheres is allowed with a probability given by
p vð Þ ¼ exp − vεv
� �ð1Þ
where v is the ratio of the overlapping volume to the volume of asphere and εv is a constant.
Step 3: New configuration generation. A new configuration is generatedbymoving a LiCoO2 particle, which is randomly selected from theold list of particles and moved at a displacement dr (dx, dy, dz).The moving distance in the x direction dx is determined fromthe following exponential distribution
p dxð Þ ¼1
adxεdxexp − dx
εdx
� �dxbLx
0 dx≥Lx
8<: ð2Þ
where adx =1− exp(−Lx/εdx), with εdx being a parameter con-trolling the distance of themovement. Likewise, thedy anddz canbe determined.
Step 4: Choice of new configuration. After a new configuration is gener-ated, the energy difference ΔE = Enew − Eold between the twosuccessive states is evaluated, where the energy or error functionis defined by
E ¼Xn
i¼1
Xu¼Ui maxð Þu¼0
f i uð Þ− f 0i uð Þ� �2 ð3Þ
where i=1, 2,…, n denotes the component identity. fi(u) repre-sents the ith statistical function of a reconstructed system andfi0(u) the corresponding reference statistical function; u is a posi-tion vector denoting a distance under the isotropic assumption.Each statistical function fi(u) can be matched to a maximum dis-tance denoted byUi(max). This change of the energy (i.e. the par-ticle movement) is accepted with the probability
p ΔEð Þ ¼ exp −ΔET
� �ΔEN0
1 ΔE≤0
8<: ð4Þ
where T is a parameter representing the role of temperature dur-ing the real annealing process, which is reduced by a factor of 0.9successively during the reconstruction process.
Step 5: Repeat step 2 to step 4 until the fi(u) of the generated configura-tion matches the target fi0(u) within a tolerance limit.
Step 6: Randomly arrange the additives on the surfaces of LiCoO2
particles to satisfy the desired component volume fraction.
With this microstructure reconstruction method, four LiCoO2
electrodes are reconstructed. The reconstructed electrodes all havedimensions of 13.2 × 13.2 × 13.2 μm. Themicrostructures of the four re-constructed electrodes are displayed in Fig. 1. Three components, theLiCoO2 particles, the electrolyte (pores) and the additive particles arewell distinguished. The electrodes have differing spatial distribution ofcomponents and micro-pore configurations, as evident by the sectioncuts (each of a fixed z position) depicted in Fig. 2. The size distributionof LiCoO2 particles inside all the four electrodes follows the Gaussiandistribution of 4.5 μm mean particle size, while volume fractions of
77J. Zeng et al. / Solid State Ionics 260 (2014) 76–85

Author's personal copy
containing components are different by electrode. All the spherical ad-ditive particles are distributed on the interface of the LiCoO2 phaseand the electrolyte phase, and the radii of the additive particles are0.2 μm for all the four electrodes. Table 1 summarizes the volume frac-tions of containing components inside the electrodes.
It isworth pointing out thatwe reconstructed the three-dimensionalmicrostructure of the electrode IV following two point correlationfunctions of LiCoO2 particles extracted from FIB/SEM images of a com-mercial (made by Amperex Technology Limited at Dongguan) LiCoO2
cathode. The product lithium-ion battery has specific capacity of 142–166 mAh/g and life cycle greater than 800. The reconstructed electrodeIV accordswell with the real electrode in terms of somemajor statisticalcharacteristics, including component volume fraction, two-point corre-lation functions of LiCoO2 particles, and size distribution of LiCoO2
particles. Electrodes I–III are three imaginary electrodes, which havedifferent compositions comparedwith electrode IV. Since the size distri-bution of LiCoO2 particles inside electrodes I–III still follows theGaussian distribution of 4.5 μm mean particle size, which is the sameas electrode IV, electrodes I–III can be manufactured in practice as well.
The geometrical connectivity of a certain phase is defined as the ratioof connective portion to the non-connective portion of this phase. Intu-itively, the connectivity affects the effective transport properties as theoccluded and dead-ended portions of a phase should have no contribu-tion to the related transport process. The cluster analysis algorithmpro-posed by Hoshen and Kopelman [28] was employed to determine thegeometrical connectivity of electrolyte or pore phase and solid phase(LiCoO2 particles and additives) in the reconstructed LiCoO2 electrodes,respectively. The proportions of the connective electrolyte or porephase and solid phase in the four reconstructed LiCoO2 electrodes (see
Fig. 1) have been tabulated in Table 2. The data show that the recon-structed electrodes all have good geometrical connectivity.
2.2. Virtual test platform
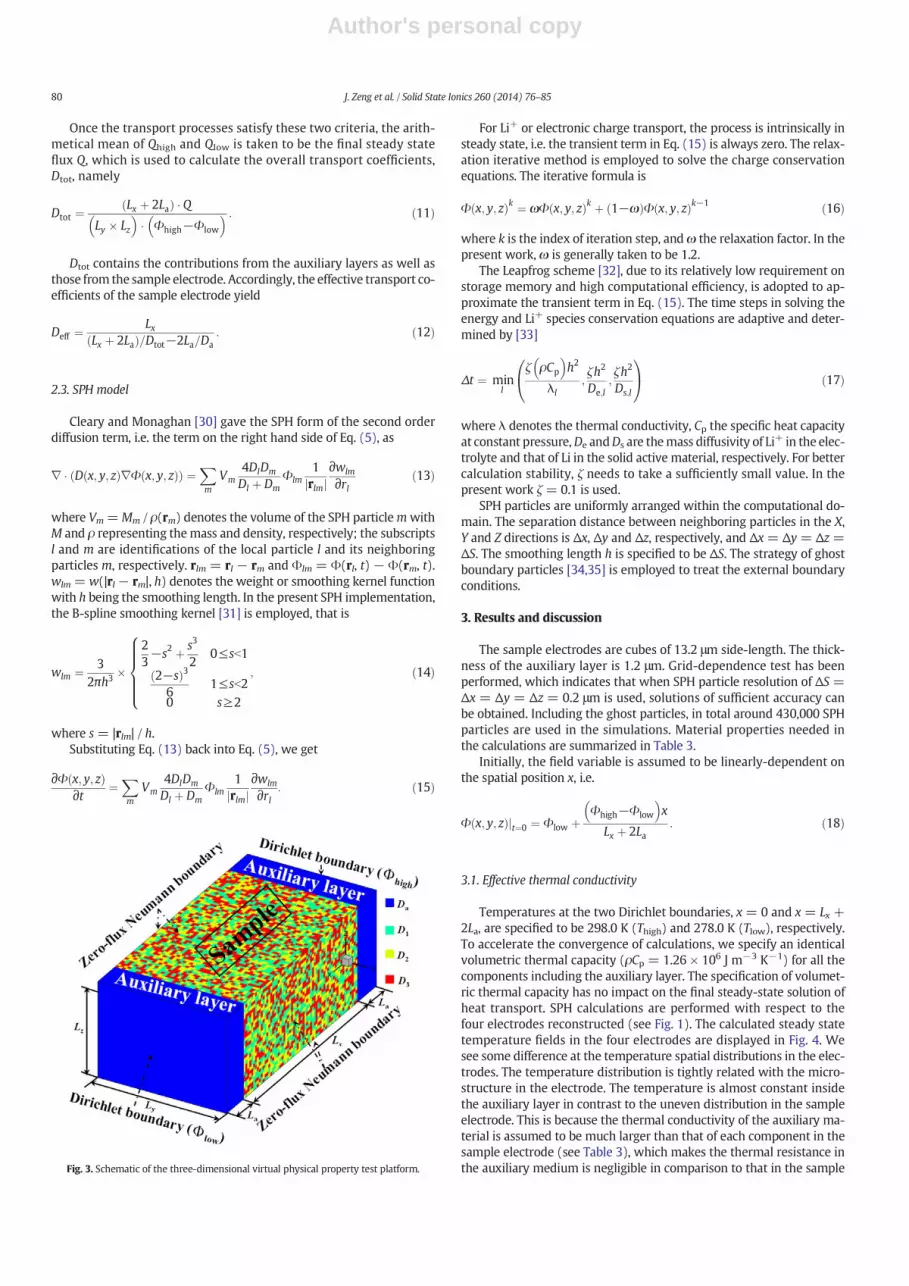
In the presentwork,we extend the two-dimensional virtual physicalproperty test platform [8] to three-dimensional, schematically shown inFig. 3. A piece of sample electrode (of thickness Lx) is sandwiched in-between two auxiliary layers (each of thickness La). Zero-fluxNeumannboundaries are assumed for all the side walls and Dirichlet boundarieswith constant values,Φhigh andΦlow, for the other two external surfaces,respectively. The sample electrode is made of three distinguishablecomponents. The Di denotes the generic bulk transport coefficient ofcomponent i. The generic bulk transport coefficient of the auxiliarymaterial, Da, is much larger than Di, i.e. Da ≫ Di, meaning the transportresistance in the auxiliarymedium is negligible in comparisonwith thatin the sample electrode.
For the transport processes in LiCoO2 cathodes, it is reasonable tomake the following assumptions [29].
i) The Li+ species transport occurs only in the electrolyte phase.ii) The electronic charge transport occurs only in the solid phase
(LiCoO2 particles and additives).iii) All the containing components can transport heat.
To derive the effective transport coefficients, all the transportprocesses can be described by a generic governing equation as [9,29]
∂Φ x; y; zð Þ∂t ¼ ∇ � D x; y; zð Þ∇Φ x; y; zð Þð Þ ð5Þ
Fig. 1.Microstructures of LiCoO2 electrodes reconstructed. (a) Electrode I; (b) electrode II; (c) electrode III; (d) electrode IV. Red: LiCoO2 particles; blue: additives; transparent: electrolyteor pores.
78 J. Zeng et al. / Solid State Ionics 260 (2014) 76–85

Author's personal copy
where D(x, y, z) andΦ(x, y, z) represent the material intrinsic propertyand the generic field variable at location (x, y, z), respectively. Note thatD(x, y, z) is component-wise. The geometrical domain considered is ofdimensions X × Y × Z (X= Lx +2La, Y= Ly and Z= Lz). At the Dirichletboundaries, it has
Φ x; y; zð Þjx¼0 ¼ Φhigh;Φ x; y; zð Þjx¼Lxþ2La¼ Φlow ð6Þ
and at the Neumann boundaries, we have
∂Φ x; y; zð Þ∂y j
y¼0&y¼Ly
¼ ∂Φ x; y; zð Þ∂z j
z¼0&z¼Lz¼ 0: ð7Þ
The flux quantities through the two Dirichlet boundaries at x = 0and x = Lx can be calculated by
Qhigh ¼ −Z Ly
y¼0
Z Lz
z¼0D x; y; zð Þ ∂Φ x; y; zð Þ
∂x jx¼0
dydz ð8aÞ
Q low ¼ −Z Ly
y¼0
Z Lz
z¼0D x; y; zð Þ∂Φ x; y; zð Þ
∂x jx¼Lxþ2La
dydz ð8bÞ
respectively.Qhigh andQlow should be equal under steady state conditions.In the present work, two criteria are employed to justify the onset ofsteady state: (1) the maximum of the relative variation of the fluxterms, Qhigh and Qlow, between two time points (t and t + 100△t) isless than 10−9, i.e.
maxQhighjtþ100Δt−Qhighjt
Qhighjt
����������; Q lowjtþ100Δt−Q lowjt
Q lowjt
��������
!b10−9 ð9Þ
and (2) the relative difference between Qhigh and Qlow is less than 10−3,i.e.
Qhigh−Q low
Qhigh
����������b10−3
: ð10Þ
Fig. 2. Section cuts (each of a fixed z position) showing spatial distribution of components and micro-pore configurations of the four LiCoO2 electrodes reconstructed. (a) Electrode I;(b) electrode II; (c) electrode III; (d) electrode IV. Red: LiCoO2 particles; blue: additives; transparent: electrolyte or pores.
Table 1Volume fraction of each containing component.
Volume fraction (%)
Component LiCoO2 particles Additives (AB + PVDF) Electrolyte or pore phase
Electrode I 54.36 4.80 40.84Electrode II 58.50 4.84 36.66Electrode III 63.07 4.93 32.00Electrode IV 68.46 5.40 26.14
Table 2Geometrical connectivity of each containing component.
Connectivity (%)
Component Electrolyte orpore phase
Solid phase(LiCoO2 particles and additives)
Electrode I 98.50 98.10Electrode II 98.30 99.60Electrode III 97.70 99.90Electrode IV 95.40 98.30
79J. Zeng et al. / Solid State Ionics 260 (2014) 76–85
Author's personal copy
Once the transport processes satisfy these two criteria, the arith-metical mean of Qhigh and Qlow is taken to be the final steady stateflux Q, which is used to calculate the overall transport coefficients,Dtot, namely
Dtot ¼Lx þ 2Lað Þ � Q
Ly � Lz� �
� Φhigh−Φlow
� � : ð11Þ
Dtot contains the contributions from the auxiliary layers as well asthose from the sample electrode. Accordingly, the effective transport co-efficients of the sample electrode yield
Deff ¼Lx
Lx þ 2Lað Þ=Dtot−2La=Da: ð12Þ
2.3. SPH model
Cleary and Monaghan [30] gave the SPH form of the second orderdiffusion term, i.e. the term on the right hand side of Eq. (5), as
∇ � D x; y; zð Þ∇Φ x; y; zð Þð Þ ¼Xm
Vm4DlDm
Dl þ DmΦlm
1rlmj j
∂wlm
∂rlð13Þ
where Vm =Mm / ρ(rm) denotes the volume of the SPH particlemwithM and ρ representing themass and density, respectively; the subscriptsl and m are identifications of the local particle l and its neighboringparticles m, respectively. rlm = rl − rm and Φlm = Φ(rl, t) − Φ(rm, t).wlm = w(|rl − rm|, h) denotes the weight or smoothing kernel functionwith h being the smoothing length. In the present SPH implementation,the B-spline smoothing kernel [31] is employed, that is
wlm ¼ 32πh3
�
23−s2 þ s3
20≤sb1
2−sð Þ36
1≤sb20 s≥2
;
8>>>><>>>>:
ð14Þ
where s = |rlm| / h.Substituting Eq. (13) back into Eq. (5), we get
∂Φ x; y; zð Þ∂t ¼
Xm
Vm4DlDm
Dl þ DmΦlm
1rlmj j
∂wlm
∂rl: ð15Þ
For Li+ or electronic charge transport, the process is intrinsically insteady state, i.e. the transient term in Eq. (15) is always zero. The relax-ation iterative method is employed to solve the charge conservationequations. The iterative formula is
Φ x; y; zð Þk ¼ ωΦ x; y; zð Þk þ 1−ωð ÞΦ x; y; zð Þk−1 ð16Þ
where k is the index of iteration step, andω the relaxation factor. In thepresent work, ω is generally taken to be 1.2.
The Leapfrog scheme [32], due to its relatively low requirement onstorage memory and high computational efficiency, is adopted to ap-proximate the transient term in Eq. (15). The time steps in solving theenergy and Li+ species conservation equations are adaptive and deter-mined by [33]
Δt ¼ minl
ζ ρCp
� �h2
λl;ζh2
De;l;ζh2
Ds;l
0@
1A ð17Þ
where λ denotes the thermal conductivity, Cp the specific heat capacityat constant pressure,De andDs are themass diffusivity of Li+ in the elec-trolyte and that of Li in the solid active material, respectively. For bettercalculation stability, ζ needs to take a sufficiently small value. In thepresent work ζ = 0.1 is used.
SPH particles are uniformly arranged within the computational do-main. The separation distance between neighboring particles in the X,Y and Z directions is Δx, Δy and Δz, respectively, and Δx = Δy = Δz =ΔS. The smoothing length h is specified to be ΔS. The strategy of ghostboundary particles [34,35] is employed to treat the external boundaryconditions.
3. Results and discussion
The sample electrodes are cubes of 13.2 μm side-length. The thick-ness of the auxiliary layer is 1.2 μm. Grid-dependence test has beenperformed, which indicates that when SPH particle resolution of ΔS =Δx = Δy = Δz = 0.2 μm is used, solutions of sufficient accuracy canbe obtained. Including the ghost particles, in total around 430,000 SPHparticles are used in the simulations. Material properties needed inthe calculations are summarized in Table 3.
Initially, the field variable is assumed to be linearly-dependent onthe spatial position x, i.e.
Φ x; y; zð Þjt¼0 ¼ Φlow þΦhigh−Φlow
� �x
Lx þ 2La: ð18Þ
3.1. Effective thermal conductivity
Temperatures at the two Dirichlet boundaries, x = 0 and x = Lx +2La, are specified to be 298.0 K (Thigh) and 278.0 K (Tlow), respectively.To accelerate the convergence of calculations, we specify an identicalvolumetric thermal capacity (ρCp = 1.26 × 10⁶ J m−3 K−1) for all thecomponents including the auxiliary layer. The specification of volumet-ric thermal capacity has no impact on the final steady-state solution ofheat transport. SPH calculations are performed with respect to thefour electrodes reconstructed (see Fig. 1). The calculated steady statetemperature fields in the four electrodes are displayed in Fig. 4. Wesee some difference at the temperature spatial distributions in the elec-trodes. The temperature distribution is tightly related with the micro-structure in the electrode. The temperature is almost constant insidethe auxiliary layer in contrast to the uneven distribution in the sampleelectrode. This is because the thermal conductivity of the auxiliary ma-terial is assumed to be much larger than that of each component in thesample electrode (see Table 3), which makes the thermal resistance inthe auxiliary medium is negligible in comparison to that in the sampleFig. 3. Schematic of the three-dimensional virtual physical property test platform.
80 J. Zeng et al. / Solid State Ionics 260 (2014) 76–85

Author's personal copy
Table 3Material properties.
LiCoO2 particles Additives (AB + PVDF) Electrolyte (LiPF6) Auxiliary layer a
Thermal conductivity (W m−1 K−1) 1.58 [36] 0.80 [37] 0.60 [36] 32.0Li+ species diffusivity (m2 s−1) 0 0 7.50 × 10⁻¹¹ [38] 1.50 × 10⁻⁹
Electronic conductivity (S m−1) 0.1 [39] 20.00 [40] 0 400.00
a Assumed.
Fig. 4. The steady state temperature distributions in the four electrodes: (a) electrode I; (b) electrode II; (c) electrode III; (d) electrode IV.
Fig. 5. Temperature contour plots on a few section-cuts (each of a fixed-z position) of electrodes II (a) and III (b).
81J. Zeng et al. / Solid State Ionics 260 (2014) 76–85
Author's personal copy
electrode. Contour plots, shown in Fig. 5, on a few section-cuts of elec-trodes II and III shedmore light on the effect of the electrodemicrostruc-ture on the heat transport. The positions of these section-cuts and themicro-structural details on these section cuts have been presented inFig. 2. Evident differences are seen between the results for electrodesII and III. Inspecting Figs. 2 and 5, it can be found with ease that thelocal temperature drop along the X direction is closely related to thecomponent distribution, where the component has larger thermal con-ductivity, smaller is the temperature drop. These results indicate thatthemicrostructure of the electrodehas great effect on the heat transportprocess.
For the prediction of effective transport coefficients in two-dimensional heterogeneous three-component materials, Jiang andSousa [8] further extended the Carson EMTmodel [7] based on a simple“step-process” concept for the prediction of effective thermal conduc-tivity of two-dimensional three-componentmaterial. First, the effectivetransport coefficient of components 1 and 2, Deff,12, is calculated by
Deff ;12 ¼ 1f−2
�f2
ε21−ε3
−1� �
D2 þf2
ε11−ε3
−1� �
D1
þffiffiffiffiffiffiffiffiffiffiffiffiffiffiffiffiffiffiffiffiffiffiffiffiffiffiffiffiffiffiffiffiffiffiffiffiffiffiffiffiffiffiffiffiffiffiffiffiffiffiffiffiffiffiffiffiffiffiffiffiffiffiffiffiffiffiffiffiffiffiffiffiffiffiffiffiffiffiffiffiffiffiffiffiffiffiffiffiffiffiffiffiffiffiffiffiffiffiffiffiffiffiffiffiffiffiffiffiffiffiffiffiffiffiffiffiffiffiffi
f2
ε21−ε3
−1� �
D2 þf2
ε11−ε3
−1� �
D1
2þ 2 f−4ð ÞD1D2
s �
ð19Þ
and then, the total effective transport coefficient Deff is calculated basedon Deff,12 and D3, as follows
Deff ¼1
f−2
�f2ε3−1
� �D3 þ
f2
ε1 þ ε2ð Þ−1� �
Deff ;12
þffiffiffiffiffiffiffiffiffiffiffiffiffiffiffiffiffiffiffiffiffiffiffiffiffiffiffiffiffiffiffiffiffiffiffiffiffiffiffiffiffiffiffiffiffiffiffiffiffiffiffiffiffiffiffiffiffiffiffiffiffiffiffiffiffiffiffiffiffiffiffiffiffiffiffiffiffiffiffiffiffiffiffiffiffiffiffiffiffiffiffiffiffiffiffiffiffiffiffiffiffiffiffiffiffiffiffiffiffiffiffiffiffiffiffiffiffiffiffiffiffiffiffiffiffiffiffiffiffiffiffi
f2ε3−1
� �D3 þ
f2
ε1 þ ε2ð Þ−1� �
Deff ;12
2þ 2 f−4ð ÞDeff ;12D3
s �
ð20Þ
where f is the “flexible” factor, andDi and εi (i=1, 2, 3) denote the prop-erty and volume fraction of the component i, respectively.
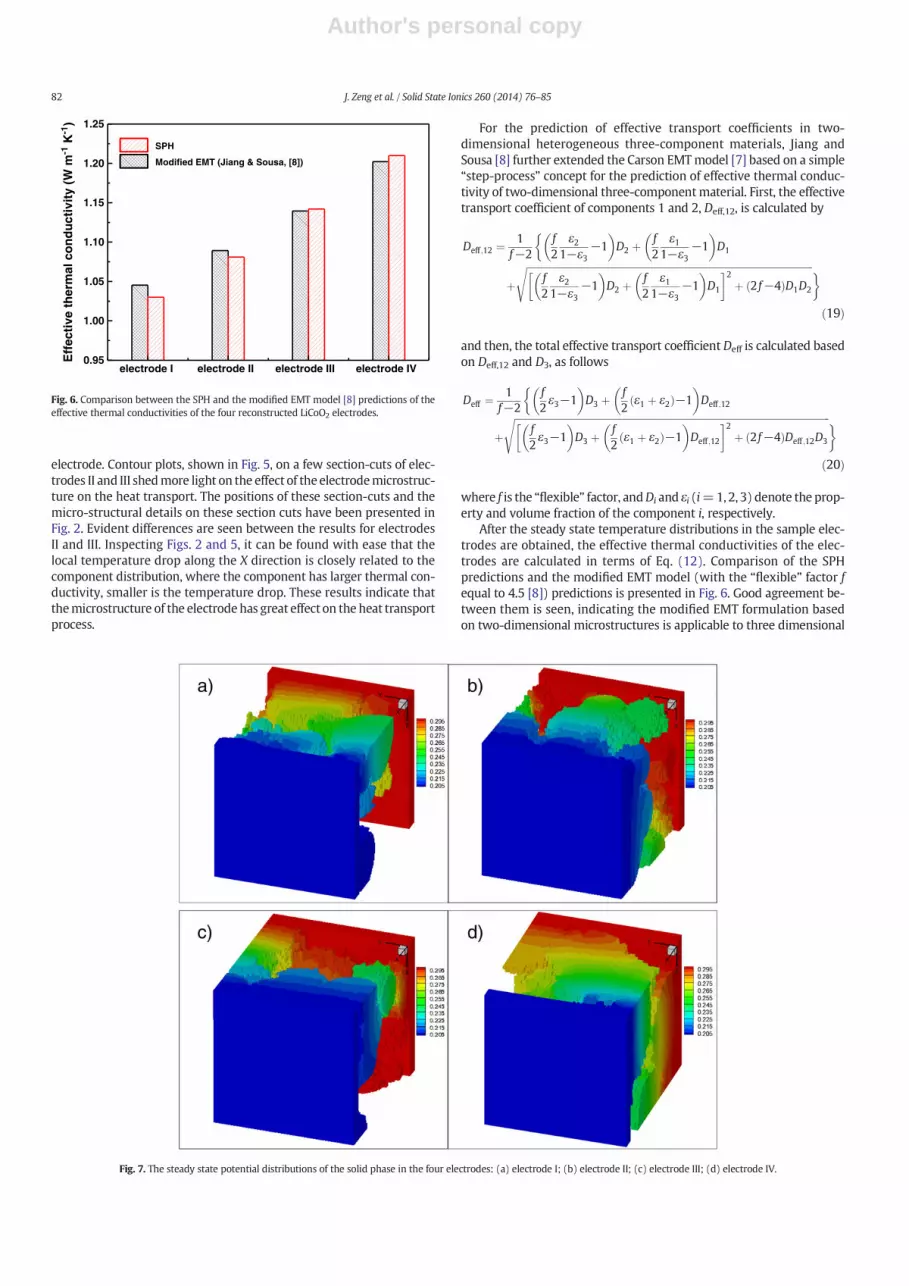
After the steady state temperature distributions in the sample elec-trodes are obtained, the effective thermal conductivities of the elec-trodes are calculated in terms of Eq. (12). Comparison of the SPHpredictions and the modified EMT model (with the “flexible” factor fequal to 4.5 [8]) predictions is presented in Fig. 6. Good agreement be-tween them is seen, indicating the modified EMT formulation basedon two-dimensional microstructures is applicable to three dimensional
electrode I electrode II electrode III electrode IV0.95
1.00
1.05
1.10
1.15
1.20
1.25
Eff
ecti
ve t
her
mal
co
nd
uct
ivit
y (W
m-1
K-1
)
SPH
Modified EMT (Jiang & Sousa, [8])
Fig. 6. Comparison between the SPH and the modified EMT model [8] predictions of theeffective thermal conductivities of the four reconstructed LiCoO2 electrodes.
Fig. 7. The steady state potential distributions of the solid phase in the four electrodes: (a) electrode I; (b) electrode II; (c) electrode III; (d) electrode IV.
82 J. Zeng et al. / Solid State Ionics 260 (2014) 76–85
Author's personal copy
electrodes. According to Table 1 and Fig. 6, we find that the effectivethermal conductivity of three-dimensional electrode increases withthe decrease of the volume fraction of electrolyte (i.e., the porosity ε),as the thermal conductivity of the electrolyte is the smallest amongthe three components composing the sample electrodes (see Table 3).
3.2. Effective electronic conductivity
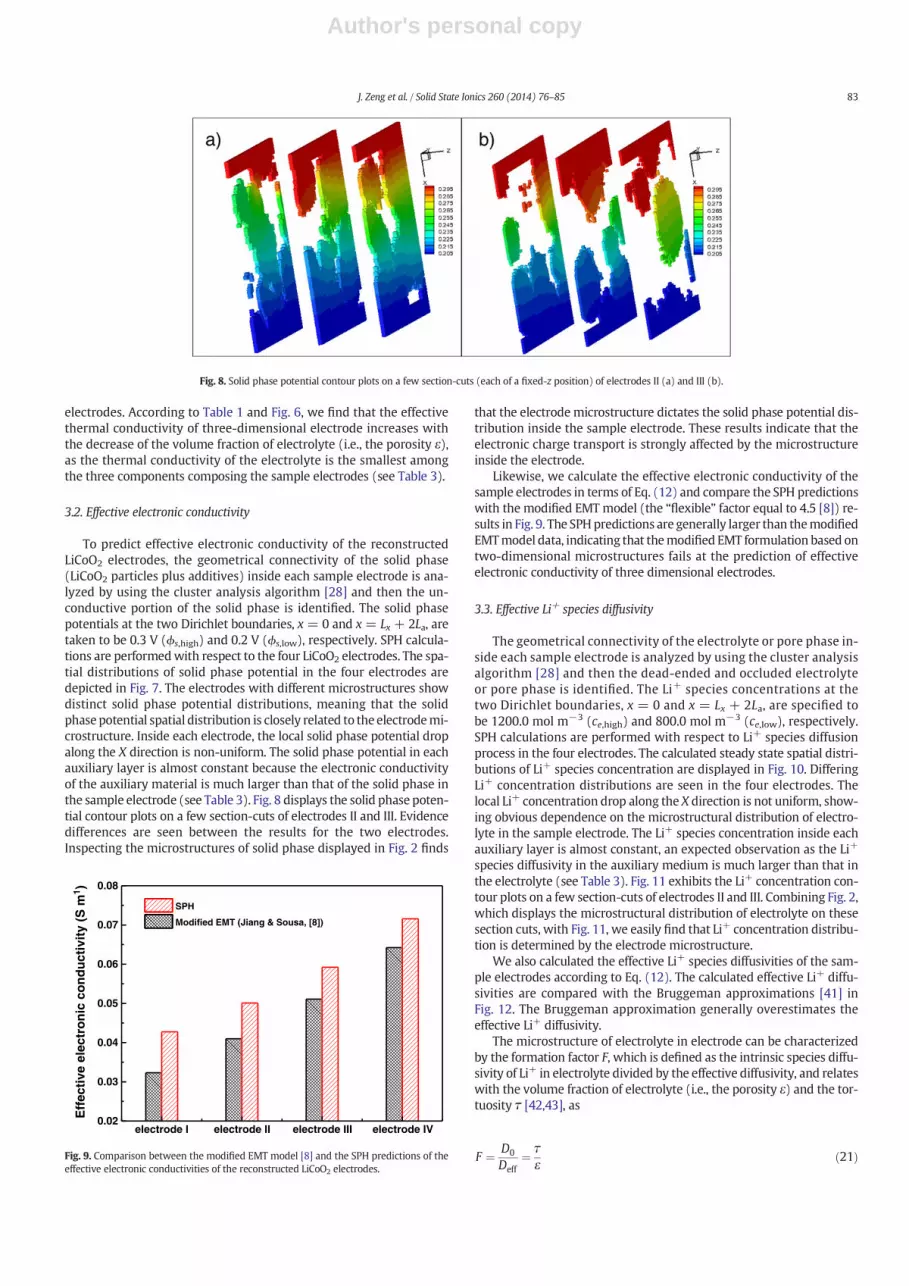
To predict effective electronic conductivity of the reconstructedLiCoO2 electrodes, the geometrical connectivity of the solid phase(LiCoO2 particles plus additives) inside each sample electrode is ana-lyzed by using the cluster analysis algorithm [28] and then the un-conductive portion of the solid phase is identified. The solid phasepotentials at the two Dirichlet boundaries, x = 0 and x = Lx + 2La, aretaken to be 0.3 V (ϕs,high) and 0.2 V (ϕs,low), respectively. SPH calcula-tions are performedwith respect to the four LiCoO2 electrodes. The spa-tial distributions of solid phase potential in the four electrodes aredepicted in Fig. 7. The electrodes with different microstructures showdistinct solid phase potential distributions, meaning that the solidphase potential spatial distribution is closely related to the electrodemi-crostructure. Inside each electrode, the local solid phase potential dropalong the X direction is non-uniform. The solid phase potential in eachauxiliary layer is almost constant because the electronic conductivityof the auxiliary material is much larger than that of the solid phase inthe sample electrode (see Table 3). Fig. 8 displays the solid phase poten-tial contour plots on a few section-cuts of electrodes II and III. Evidencedifferences are seen between the results for the two electrodes.Inspecting the microstructures of solid phase displayed in Fig. 2 finds
that the electrode microstructure dictates the solid phase potential dis-tribution inside the sample electrode. These results indicate that theelectronic charge transport is strongly affected by the microstructureinside the electrode.
Likewise, we calculate the effective electronic conductivity of thesample electrodes in terms of Eq. (12) and compare the SPH predictionswith the modified EMT model (the “flexible” factor equal to 4.5 [8]) re-sults in Fig. 9. The SPHpredictions are generally larger than themodifiedEMTmodel data, indicating that themodified EMT formulation based ontwo-dimensional microstructures fails at the prediction of effectiveelectronic conductivity of three dimensional electrodes.
3.3. Effective Li+ species diffusivity
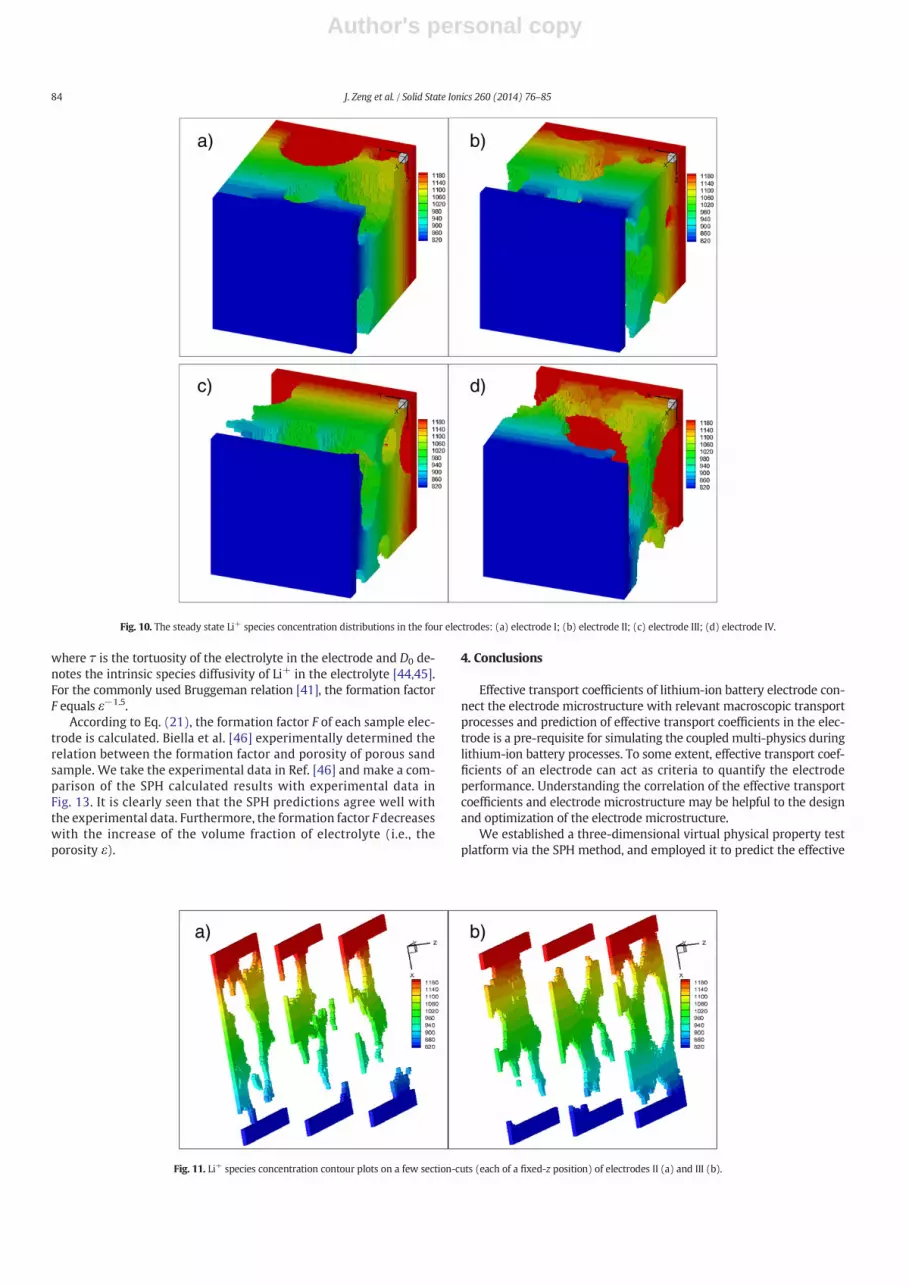
The geometrical connectivity of the electrolyte or pore phase in-side each sample electrode is analyzed by using the cluster analysisalgorithm [28] and then the dead-ended and occluded electrolyteor pore phase is identified. The Li+ species concentrations at thetwo Dirichlet boundaries, x = 0 and x = Lx + 2La, are specified tobe 1200.0 mol m−3 (ce,high) and 800.0 mol m−3 (ce,low), respectively.SPH calculations are performed with respect to Li+ species diffusionprocess in the four electrodes. The calculated steady state spatial distri-butions of Li+ species concentration are displayed in Fig. 10. DifferingLi+ concentration distributions are seen in the four electrodes. Thelocal Li+ concentration drop along the X direction is not uniform, show-ing obvious dependence on the microstructural distribution of electro-lyte in the sample electrode. The Li+ species concentration inside eachauxiliary layer is almost constant, an expected observation as the Li+
species diffusivity in the auxiliary medium is much larger than that inthe electrolyte (see Table 3). Fig. 11 exhibits the Li+ concentration con-tour plots on a few section-cuts of electrodes II and III. Combining Fig. 2,which displays the microstructural distribution of electrolyte on thesesection cuts, with Fig. 11, we easily find that Li+ concentration distribu-tion is determined by the electrode microstructure.
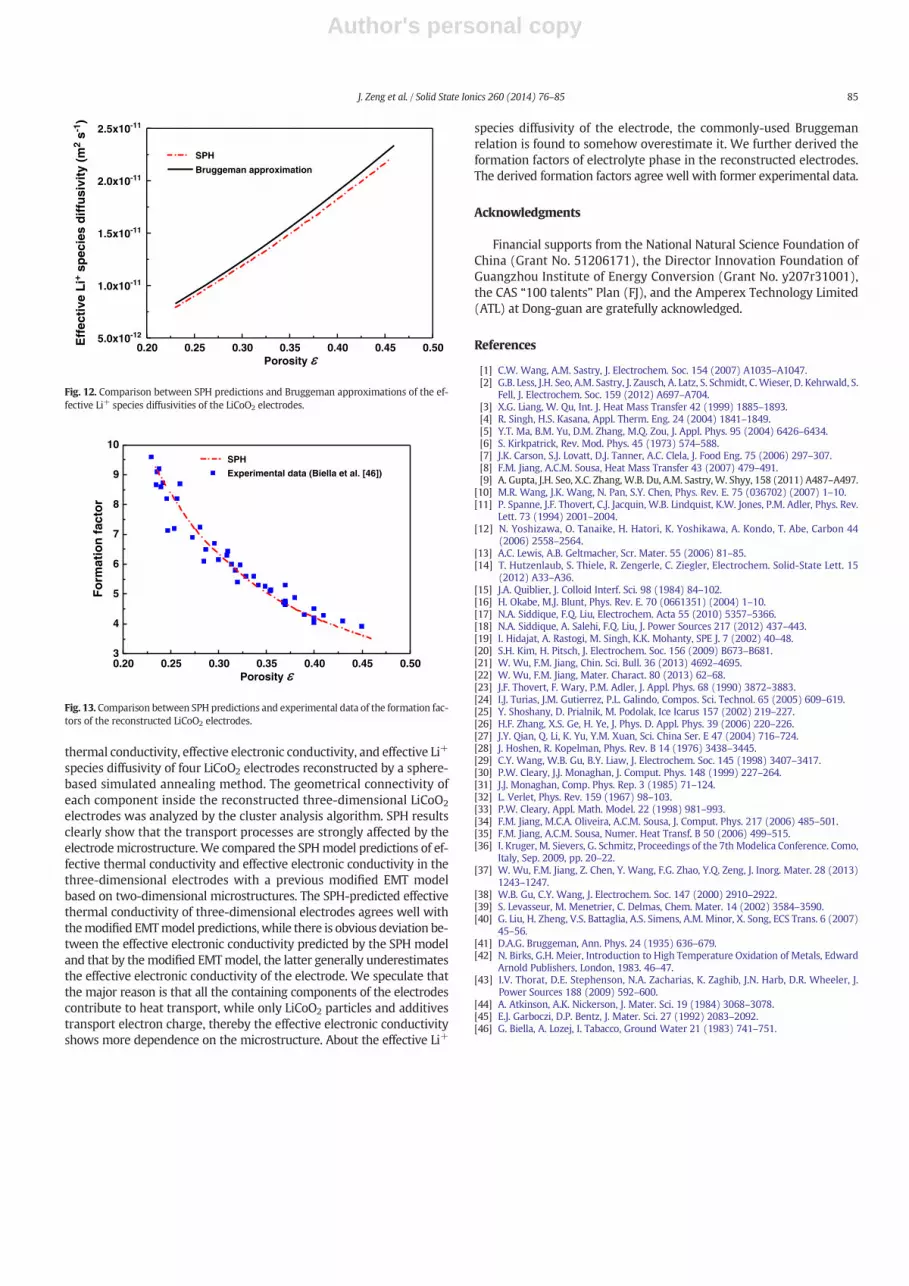
We also calculated the effective Li+ species diffusivities of the sam-ple electrodes according to Eq. (12). The calculated effective Li+ diffu-sivities are compared with the Bruggeman approximations [41] inFig. 12. The Bruggeman approximation generally overestimates theeffective Li+ diffusivity.
The microstructure of electrolyte in electrode can be characterizedby the formation factor F, which is defined as the intrinsic species diffu-sivity of Li+ in electrolyte divided by the effective diffusivity, and relateswith the volume fraction of electrolyte (i.e., the porosity ε) and the tor-tuosity τ [42,43], as
F ¼ D0
Deff¼ τ
εð21Þ
Fig. 8. Solid phase potential contour plots on a few section-cuts (each of a fixed-z position) of electrodes II (a) and III (b).
electrode I electrode II electrode III electrode IV0.02
0.03
0.04
0.05
0.06
0.07
0.08
Eff
ecti
ve e
lect
ron
ic c
on
du
ctiv
ity
(S m
1 )
SPH
Modified EMT (Jiang & Sousa, [8])
Fig. 9. Comparison between the modified EMT model [8] and the SPH predictions of theeffective electronic conductivities of the reconstructed LiCoO2 electrodes.
83J. Zeng et al. / Solid State Ionics 260 (2014) 76–85
Author's personal copy
where τ is the tortuosity of the electrolyte in the electrode and D0 de-notes the intrinsic species diffusivity of Li+ in the electrolyte [44,45].For the commonly used Bruggeman relation [41], the formation factorF equals ε−1.5.
According to Eq. (21), the formation factor F of each sample elec-trode is calculated. Biella et al. [46] experimentally determined therelation between the formation factor and porosity of porous sandsample. We take the experimental data in Ref. [46] and make a com-parison of the SPH calculated results with experimental data inFig. 13. It is clearly seen that the SPH predictions agree well withthe experimental data. Furthermore, the formation factor F decreaseswith the increase of the volume fraction of electrolyte (i.e., theporosity ε).
4. Conclusions
Effective transport coefficients of lithium-ion battery electrode con-nect the electrode microstructure with relevant macroscopic transportprocesses and prediction of effective transport coefficients in the elec-trode is a pre-requisite for simulating the coupled multi-physics duringlithium-ion battery processes. To some extent, effective transport coef-ficients of an electrode can act as criteria to quantify the electrodeperformance. Understanding the correlation of the effective transportcoefficients and electrode microstructure may be helpful to the designand optimization of the electrode microstructure.
We established a three-dimensional virtual physical property testplatform via the SPH method, and employed it to predict the effective
Fig. 10. The steady state Li+ species concentration distributions in the four electrodes: (a) electrode I; (b) electrode II; (c) electrode III; (d) electrode IV.
Fig. 11. Li+ species concentration contour plots on a few section-cuts (each of a fixed-z position) of electrodes II (a) and III (b).
84 J. Zeng et al. / Solid State Ionics 260 (2014) 76–85
Author's personal copy
thermal conductivity, effective electronic conductivity, and effective Li+
species diffusivity of four LiCoO2 electrodes reconstructed by a sphere-based simulated annealing method. The geometrical connectivity ofeach component inside the reconstructed three-dimensional LiCoO2
electrodes was analyzed by the cluster analysis algorithm. SPH resultsclearly show that the transport processes are strongly affected by theelectrodemicrostructure. We compared the SPHmodel predictions of ef-fective thermal conductivity and effective electronic conductivity in thethree-dimensional electrodes with a previous modified EMT modelbased on two-dimensional microstructures. The SPH-predicted effectivethermal conductivity of three-dimensional electrodes agrees well withthemodified EMTmodel predictions, while there is obvious deviation be-tween the effective electronic conductivity predicted by the SPH modeland that by themodified EMTmodel, the latter generally underestimatesthe effective electronic conductivity of the electrode. We speculate thatthe major reason is that all the containing components of the electrodescontribute to heat transport, while only LiCoO2 particles and additivestransport electron charge, thereby the effective electronic conductivityshows more dependence on the microstructure. About the effective Li+
species diffusivity of the electrode, the commonly-used Bruggemanrelation is found to somehow overestimate it. We further derived theformation factors of electrolyte phase in the reconstructed electrodes.The derived formation factors agree well with former experimental data.
Acknowledgments
Financial supports from the National Natural Science Foundation ofChina (Grant No. 51206171), the Director Innovation Foundation ofGuangzhou Institute of Energy Conversion (Grant No. y207r31001),the CAS “100 talents” Plan (FJ), and the Amperex Technology Limited(ATL) at Dong-guan are gratefully acknowledged.
References
[1] C.W. Wang, A.M. Sastry, J. Electrochem. Soc. 154 (2007) A1035–A1047.[2] G.B. Less, J.H. Seo, A.M. Sastry, J. Zausch, A. Latz, S. Schmidt, C.Wieser, D. Kehrwald, S.
Fell, J. Electrochem. Soc. 159 (2012) A697–A704.[3] X.G. Liang, W. Qu, Int. J. Heat Mass Transfer 42 (1999) 1885–1893.[4] R. Singh, H.S. Kasana, Appl. Therm. Eng. 24 (2004) 1841–1849.[5] Y.T. Ma, B.M. Yu, D.M. Zhang, M.Q. Zou, J. Appl. Phys. 95 (2004) 6426–6434.[6] S. Kirkpatrick, Rev. Mod. Phys. 45 (1973) 574–588.[7] J.K. Carson, S.J. Lovatt, D.J. Tanner, A.C. Clela, J. Food Eng. 75 (2006) 297–307.[8] F.M. Jiang, A.C.M. Sousa, Heat Mass Transfer 43 (2007) 479–491.[9] A. Gupta, J.H. Seo, X.C. Zhang, W.B. Du, A.M. Sastry, W. Shyy, 158 (2011) A487–A497.
[10] M.R. Wang, J.K. Wang, N. Pan, S.Y. Chen, Phys. Rev. E. 75 (036702) (2007) 1–10.[11] P. Spanne, J.F. Thovert, C.J. Jacquin, W.B. Lindquist, K.W. Jones, P.M. Adler, Phys. Rev.
Lett. 73 (1994) 2001–2004.[12] N. Yoshizawa, O. Tanaike, H. Hatori, K. Yoshikawa, A. Kondo, T. Abe, Carbon 44
(2006) 2558–2564.[13] A.C. Lewis, A.B. Geltmacher, Scr. Mater. 55 (2006) 81–85.[14] T. Hutzenlaub, S. Thiele, R. Zengerle, C. Ziegler, Electrochem. Solid-State Lett. 15
(2012) A33–A36.[15] J.A. Quiblier, J. Colloid Interf. Sci. 98 (1984) 84–102.[16] H. Okabe, M.J. Blunt, Phys. Rev. E. 70 (0661351) (2004) 1–10.[17] N.A. Siddique, F.Q. Liu, Electrochem. Acta 55 (2010) 5357–5366.[18] N.A. Siddique, A. Salehi, F.Q. Liu, J. Power Sources 217 (2012) 437–443.[19] I. Hidajat, A. Rastogi, M. Singh, K.K. Mohanty, SPE J. 7 (2002) 40–48.[20] S.H. Kim, H. Pitsch, J. Electrochem. Soc. 156 (2009) B673–B681.[21] W. Wu, F.M. Jiang, Chin. Sci. Bull. 36 (2013) 4692–4695.[22] W. Wu, F.M. Jiang, Mater. Charact. 80 (2013) 62–68.[23] J.F. Thovert, F. Wary, P.M. Adler, J. Appl. Phys. 68 (1990) 3872–3883.[24] I.J. Turias, J.M. Gutierrez, P.L. Galindo, Compos. Sci. Technol. 65 (2005) 609–619.[25] Y. Shoshany, D. Prialnik, M. Podolak, Ice Icarus 157 (2002) 219–227.[26] H.F. Zhang, X.S. Ge, H. Ye, J. Phys. D. Appl. Phys. 39 (2006) 220–226.[27] J.Y. Qian, Q. Li, K. Yu, Y.M. Xuan, Sci. China Ser. E 47 (2004) 716–724.[28] J. Hoshen, R. Kopelman, Phys. Rev. B 14 (1976) 3438–3445.[29] C.Y. Wang, W.B. Gu, B.Y. Liaw, J. Electrochem. Soc. 145 (1998) 3407–3417.[30] P.W. Cleary, J.J. Monaghan, J. Comput. Phys. 148 (1999) 227–264.[31] J.J. Monaghan, Comp. Phys. Rep. 3 (1985) 71–124.[32] L. Verlet, Phys. Rev. 159 (1967) 98–103.[33] P.W. Cleary, Appl. Math. Model. 22 (1998) 981–993.[34] F.M. Jiang, M.C.A. Oliveira, A.C.M. Sousa, J. Comput. Phys. 217 (2006) 485–501.[35] F.M. Jiang, A.C.M. Sousa, Numer. Heat Transf. B 50 (2006) 499–515.[36] I. Kruger, M. Sievers, G. Schmitz, Proceedings of the 7th Modelica Conference. Como,
Italy, Sep. 2009, pp. 20–22.[37] W. Wu, F.M. Jiang, Z. Chen, Y. Wang, F.G. Zhao, Y.Q. Zeng, J. Inorg. Mater. 28 (2013)
1243–1247.[38] W.B. Gu, C.Y. Wang, J. Electrochem. Soc. 147 (2000) 2910–2922.[39] S. Levasseur, M. Menetrier, C. Delmas, Chem. Mater. 14 (2002) 3584–3590.[40] G. Liu, H. Zheng, V.S. Battaglia, A.S. Simens, A.M. Minor, X. Song, ECS Trans. 6 (2007)
45–56.[41] D.A.G. Bruggeman, Ann. Phys. 24 (1935) 636–679.[42] N. Birks, G.H. Meier, Introduction to High Temperature Oxidation of Metals, Edward
Arnold Publishers, London, 1983. 46–47.[43] I.V. Thorat, D.E. Stephenson, N.A. Zacharias, K. Zaghib, J.N. Harb, D.R. Wheeler, J.
Power Sources 188 (2009) 592–600.[44] A. Atkinson, A.K. Nickerson, J. Mater. Sci. 19 (1984) 3068–3078.[45] E.J. Garboczi, D.P. Bentz, J. Mater. Sci. 27 (1992) 2083–2092.[46] G. Biella, A. Lozej, I. Tabacco, Ground Water 21 (1983) 741–751.
0.20 0.25 0.30 0.35 0.40 0.45 0.505.0x10-12
1.0x10⁻¹¹
1.5x10⁻¹¹
2.0x10⁻¹¹
2.5x10⁻¹¹
Eff
ecti
ve L
i+ sp
ecie
s d
iffu
sivi
ty (
m2
s-1)
SPH
Bruggeman approximation
Porosity
Fig. 12. Comparison between SPH predictions and Bruggeman approximations of the ef-fective Li+ species diffusivities of the LiCoO2 electrodes.
0.20 0.25 0.30 0.35 0.40 0.45 0.503
4
5
6
7
8
9
10
Fo
rmat
ion
fac
tor
SPH
Experimental data (Biella et al. [46])
Porosity
Fig. 13. Comparison between SPH predictions and experimental data of the formation fac-tors of the reconstructed LiCoO2 electrodes.
85J. Zeng et al. / Solid State Ionics 260 (2014) 76–85