small baseline volume of left hippocampus is associated with subsequent conversion of mci into...
TRANSCRIPT

ences 272 (2008) 48–59www.elsevier.com/locate/jns
Journal of the Neurological Sci
Small baseline volume of left hippocampus is associated with subsequentconversion of MCI into dementia: The Göteborg MCI study
C. Eckerström a, E. Olsson b,c, M. Borga d, S. Ekholm e, S. Ribbelin f, S. Rolstad a,G. Starck f,g, Å. Edman a, A. Wallin a, H. Malmgren b,⁎
a Institute of Neuroscience and Physiology, Göteborg University, Swedenb Department of Philosophy, Göteborg University, Swedenc Institute of Biomedicine, Göteborg University, Sweden
d Department of Biomedical Engineering, Linköping University, Swedene Department of Radiology, University of Rochester Medical Center, USA
f Department of Radiology, Göteborg University, Swedeng Department of Radiation Physics, Göteborg University, Sweden
Received 26 November 2007; received in revised form 17 March 2008; accepted 17 April 2008Available online 20 June 2008
Abstract
Background: Earlier studies have reported that hippocampal atrophy can to some extent predict which patients with mild cognitiveimpairment (MCI) will subsequently convert to dementia, and that converters have an enhanced rate of hippocampal volume loss.Objective: To further validate the hypothesis that hippocampal atrophy predicts conversion from MCI to dementia, to relate baselinehippocampal volume to different forms of dementia, and to investigate the role of hippocampal side differences and rate of volume loss overtime.Patients: The subjects (N=68) include patients with MCI at baseline and progression to dementia at the two-year follow-up (N=21), stableMCI patients (N=21), and controls (N=26). Among the progressing patients, 13 were diagnosed as having AD.Methods: The Göteborg MCI study is a clinically based longitudinal study with biannual clinical assessments. Hippocampal volumetry wasperformed manually on the MRI investigations at baseline and at the two-year follow-up.Results: Hippocampal volumetry could predict conversion to dementia in both the AD and the non-AD subgroup of converters. Lefthippocampal volume in particular discriminated between converting and stable MCI. Cut off points for individual discrimination were shownto be potentially useful. The converting MCI group had a significantly higher rate of hippocampal volume loss as compared to the stable MCIgroup.Conclusions: In MCI patients, hippocampal volumetry at baseline gives prognostic information about possible development of AD and non-AD dementia. Contrary to earlier studies, we found that left hippocampal volume has the best predictive power. Reliable predictions appear tobe possible in many individual cases.© 2008 Elsevier B.V. All rights reserved.
Keywords: Dementia; Alzheimer's disease; Vascular dementia; Mild cognitive impairment (MCI); Volumetric MRI; Hippocampus; Brain asymmetries
1. Introduction
The term mild cognitive impairment (MCI) describes astate where the cognitive functions are more impaired thanwould be expected from aging alone but not enough to bedescribed as dementia. The aetiology of MCI is multi-

49C. Eckerström et al. / Journal of the Neurological Sciences 272 (2008) 48–59
factorial and the prognosis differs within the group [1–3].Some MCI patients eventually convert to dementia, someremain stable and some may improve.
The hippocampus is located in the medial temporal lobe(MTL) and is believed to be involved in the pathogenesis ofdementia and cognitive decline. Neuropathological changesin the MTL can be seen early in AD [4]. A few studies havebeen published comparing neuroimaging volumetry of thehippocampus with neuropathological examinations. Theresults suggest that volumetrically measured hippocampalvolume loss is correlated with the detection of neuropatho-logical dementia markers [5–7]. These findings do not onlygive credibility to the volumetric findings but also strengthenthe belief that the MTL is a key region in AD. MCI as agroup shows diverse neuropathological pictures. Cerebro-vascular and Alzheimer pathologies have been demonstratedpost mortem in a high proportion of patients who hadreceived an MCI diagnosis [8]. Whether the degree of suchneuropathological changes in MCI is associated with laterconversion into overt dementia is still to be determined.
Cross-sectional volumetric magnetic resonance imaging(MRI) studies have found strong evidence that the hippo-campus is significantly smaller in MCI and Alzheimer’sdisease (AD) groups than in controls [9,10]. Longitudinalstudies have been performed to investigate if volumetry ofvarious structures in the brain could predict which MCIsubjects will convert to AD. Hippocampal and entorhinalvolumes have been shown to predict conversion [9, 11–15].
The hippocampus appears to be fairly intact in normalaging [16,17]. For MCI patients with incipient dementia anincreased atrophy rate could be expected. There are reportsof an annualized volume decline of about 2.2% in MCI [18]and the decline appears to be increased in converting MCIand AD patients compared to stable MCI patients andcognitively stable controls [19,20].
In the normal population, the right hippocampus is largerthan the left [21,22]. This asymmetry has been reported to bedecreased in AD [23]. The presence of apolipoproteinE epsilon 4 genotype in AD could be linked to furtherreduction or even reversal of normal asymmetry, according tosome reports [24,25], but other researchers have found no sucheffect [23]. Hippocampal asymmetry in MCI is not as wellstudied. One group reported that the left hippocampusdifferentiated better than the right between amnestic MCIpatients and controls [26], but another study showed decreasedasymmetry in converting compared to stable MCI [15].
There is evidence in the literature that hippocampalvolumetry may contribute prognostic information in theindividual case. For example, hippocampal volumetry togetherwith entorhinal cortex volumetry, age, and scores on threecognitive tests, resulted in a sensitivity of 83,3% at a specificityof 80% for the development of AD in MCI patients [14].
The majority of neuroimaging studies published in the fieldof MCI have focused on the development of AD, the mostcommon form of dementia. Vascular dementia, the secondmost common form of dementia, has been less studied in its
prodromal phases [27]. The term vascular cognitive impairmenthas been introduced to describe the cognitive changes associatedwith cerebrovascular disease where the impairment does notfulfil the criteria for vascular dementia [28]. There is someevidence that cognitive impairment in subcortical ischemicvascular disease (SIVD) is associatedwith hippocampal atrophy[29,30].One group reported that SIVDpatients had significantlysmaller hippocampi and entorhinal cortices (ERC) than controls,but significantly larger hippocampi and ERC than AD patients[31]. Another group reported additive effects of MRI whitematter hyperintensities and medial temporal lobe atrophy inrelation to cognitive deficits in MCI patients [32].
The present study, which was carried out within theGöteborgMCI study (see below), is the first part in a series ofcross-sectional and longitudinal investigations of MTLvolumes in subjects with MCI who either convert or do notconvert to dementia. It was based on a sample from the subsetof patients who were scanned with a 0.5T MRI scanner, andshould because of its inherent limitations consequently beregarded as a pilot study. A control group was also included.The present paper tests the hypothesis that baselinehippocampal volumes inMCI patients can predict conversionto dementia. We also address the following issues: asymme-tries (left compared to right hippocampal volume), clinicalsubgroup differences (development of AD or non-AD), andlongitudinal volume changes. In connection with the analysisof asymmetry we also present some tentative results about thepossibility of clinical predictions in the individual case.
2. Material
The Göteborg MCI study [2] is a clinically basedlongitudinal project that aims at identifying neurodegenera-tive, vascular and stress-related disorders prior to thedevelopment of dementia. At baseline patients and controlsundergo investigations including neurological, psychiatric,cognitive screening, neuropsychological testing, MRI,SPECT, EEG, sampling of blood and CSF. At biannualfollow-ups, most of these investigations are repeated. MRI isdone at the first (two-year) and the third (six-year) follow-up.Somatic disorders of possible neurological and neuropsychia-tric relevance are noted at each visit. Patients are excludedfrom the study if any of the following criteria are met: age N79or b49, Mini Mental State Examination (MMSE) [33] scoreb19, acute/instable somatic disease, severe psychiatricdisorder (major depressive disorder according to the DSM-III-R criteria, psychotic disorder, bipolar affective disorder),substance abuse, pseudodementia, or confusion caused bydrugs. Controls are recruited from other medical studies andorganizations for senior citizens. They are excluded if theyhave subjective or objective signs of cognitive disorder.
The categorization of patients as MCI and dementia wasbased on anamnestic data and check lists for cognitiveassessment [2]: 1. Stepwise Comparative Status Analysis(STEP) [34], cognitive variables 13–20 (memory disturbance,disorientation, reduced abstract thinking, visuospatial

Table 1Whole cohort: baseline demographic data, MMSE scores and educationyears
Group N Age Education MMSE
All MCI 42 67.9 (51–78) 11.4 (6–19) 27.8 (22–30)All MCI: men 18 66.8 (56–77) 13.3 (6–19) 28.5 (27–30)All MCI: women 24 68.8 (51–78) 10.1 (6–17.5) 27.3 (22–30)All converting MCI
(MCI-c)21 69.3 (51–78) 10.4 (6–17.5) 27.2 (22–30)
MCI-c: men 6 69.7 (63–75) 11.8 (6–16) 27.8 (27–29)MCI-c: women 15 69.1 (51–78) 9.8 (6–17.5) 27.0 (22–30)MCI-c: converters
into AD13 70.0 (51–76) 10.0 (6–15) 28.0 (26–30)
MCI-c: convertersinto non-AD
8 68.1 (58–78) 10.9 (6–17.5) 26.0 (22–30)
All stable MCI(MCI-s)
21 66.6 (56–78) 12.5 (8–19) 28.3 (24–30)
MCI-s: men 12 65.3 (56–77) 14.0 (8–19) 28.8 (27–30)MCI-s: women 9 68.2 (60–78) 10.6 (8–14) 27.7 (24–30)Controls 26 67.7 (59–80) 11.7 (6–18) 29.4 (26–30)Controls: men 8 68.9 (63–76) 10.6 (6–15) 29.3 (28–30)Controls: women 18 67.1 (59–80) 12.0 (6–15) 29.5 (28–30)
MCI = mild cognitive impairment. AD = Alzheimer's disease. Non-AD = otherforms of dementia. Results are given asMean value (Minimumvalue–Maximumvalue).
1 The first dataset consisted of 37 male subjects participating in a study ofthe metabolic syndrome. The second included 15 patients who had hadirradiation therapy for cancer in the neck region, and 15 matched controls.Both studies were made on an 1.5T scanner. Three judges, including bothjudges in the present study (CE and EO), segmented all the scans. Results,including reliability data, are being prepared for publication.
50 C. Eckerström et al. / Journal of the Neurological Sciences 272 (2008) 48–59
disturbance, poverty of language, sensory aphasia, visualagnosia; apraxia); 2. I-Flex, which is a short form of theExecutive Interview (EXIT) [35] (items number–letter task,word fluency, anomalous sentence repetition, interferencetask, Luria hand sequences, counting task); 3. MMSE; and 4.Clinical Dementia Rating (CDR) [36], a global measure offunctioning. The CDR assessment was based on informationfrom both the subject and an informant. For inclusion,subjective and objective (by an informant) verifications of aprogressive cognitive impairment formore than 6monthswererequired. In addition, a positive outcome on STEP, I-Flex,MMSE, or CDR was required. Subjects with more than twopositive outcomes on STEP or a score below 25 on theMMSE,were considered to fulfil criteria for dementia and were notincluded at baseline [2]. The diagnostic algorithm is congruentwith recent diagnostic recommendations [37]. On the basis ofthese scores, patients were classified according to the GlobalDeterioration Scale (GDS) [38] where 3 equals MCI and 4mild dementia. Furthermore, the (mildly) demented patientsreceived a clinical etiological diagnosis in congruency withICD-10 [39]. A comprehensive neuropsychological investiga-tion was also performed; however, the neuropsychologicaldata were not available to the clinician who made the aboveassessments and determined the GDS score.
Different MRI scanners have been used since the start of thestudy in 1999. A 0.5T magnet (Philips NT5) was used for thepart of the study presented in this paper. There were sometechnical problems with retrieval of the data for several of thepatients. As a result, the present study is limited to 42 patients(18 men/24 women, age 67.9±6.7, education years 11.4±3.6)and 26 controls (8 men/18 women, age 68.6±5.3, educationyears 11.7±3.4) who were examined both at baseline and at thetwo-year follow-up. One more patient was initially included buthad to be excluded because of the poor image quality at baseline.
The subjects (N=68) include 21 patients with MCI(assessed as GDS 3; cf. [38]) at baseline and conversion tomild dementia (GDS 4) at follow-up (converting MCI orMCI-c), 21 patients with MCI both at baseline and follow-up(stable MCI or MCI-s), and 26 controls. The MCI-c patientsconverted to AD (N=13) according to the NINCDS-ADRDAcriteria [40], subcortical vascular dementia (N=4) accordingto the Erkinjuntti criteria [41], mixed Alzheimer/vasculardementia (N=2), or frontotemporal dementia (N=2) accord-ing to the Lund and Manchester criteria [42]. In Table 1, thedistribution of sex, age, education years, and MMSE scores atbaseline and first follow-up, is presented for all subjects.
The majority (N=48) of the subjects were scanned twicewith the 0.5T scanner: MCI-c⁎ (N=14), MCI-s⁎ (N=15) andControls⁎ (N=19). The age distribution and years of educationamong the subset of subjects scanned twice were still similarbetween patients and controls at the first follow-up, and thegroup differences in sex distribution displayed in Table 1 remainapproximately the same.
The significant differences in sex distribution betweencontrols and patients and between MCI-c and MCI-s are dueto a bias in the sample. The sex difference can therefore not
be used to assess the relative risk for men and women toprogress from MCI to dementia.
At the time of writing the present paper, 53 of the 68subjects had gone through the second (four-year) follow-up.Ten subjects had left the study after the first follow-up. Fivehad not yet been assessed at the second follow-up andhence a systematic presentation of these results has to wait.However, in an attempt to explain certain unexpectedfindings at baseline and at the first follow-up, some of theavailable data from the second follow-up were explored forthe present study and will be reported below.
The use of antidepressants and cholinesterase inhibitors wasanalyzed to address the possibility that findings presented in thisarticle were secondary to pharmacological therapy. At baseline,6 patients in each patient group received antidepressants whilethree patients in the convertingMCI group and two in the stableMCI group were on medication with a cholinesterase inhibitor.None of the controls received these medications.
3. Methods: volumetry
3.1. Hippocampal segmentation
Hippocampal volumetry was done manually by means ofa custom method which had been developed on two otherdatasets (unpublished data).1 The segmentation was

Table 2MR scan parameters Philips NT5 0.5T scanner
Acquisition sequence 3D T1 FFE 3D T1 FFE T2 TSE
Orientation Coronal Axial Sagittal
Slice thickness mm 1.5 1.5 4Slice gap mm 0 0 0.4Repetition time ms 30 30 4682Echo time ms 10 10 120Flip angle ° 40 40 90Field of view mm 220 220 230Aquisition voxel
size M-Pmm 0.86/1.12 0.86/1.12 0.9/1.13
Reconstruction voxel size M-P mm 0.86/0.86 0.86/0.86 0.45/0.45
Table 3Definitions of hippocampal borders for the segmentation
Most anteriorslice
Most posteriorslice
Medialborder
Lateralborder
Inferiorborder
Landmarksetting wherethe uncal recessof the temporalhorn or thealveus is visiblein the sagittalyreformattedimage
Landmarksettingbetweengray matterof thehippocampaltail and thesurroundingwhite matterin thesagittallyreformattedimage
Borderbetweenhippocampalbody andtransversefissure;borderbetweenhippocampalhead andcruralcistern
Medialwall ofthetemporalhorn
Borderbetweengray matterof subiculumand thewhite matterin theparahippo-campal gyrus
51C. Eckerström et al. / Journal of the Neurological Sciences 272 (2008) 48–59
performed on an interactive Wacom™ PL700 screen in theHipposegm routine — a software which includes Bayesiannoise reduction and image intensity normalization [43]. Thenoise reduction was performed using bilateral filtering[44,45] with Gaussian kernels. The intensity normalizationwas done by approximating the histogram with Gaussianfitting. Five Gaussians were fitted to the data using the EMalgorithm [46]. The image values were then mapped to createa standardized distribution of gray scale values. This wasdone by distributing themeans of theGaussians equally over theintensity range and then applying a locally linear interpolation ofthe intensity values between the means of the Gaussians. TheHipposegm routine was developed in Matlab.
The segmentation was done on T1 weighted coronalslices which were scanned perpendicularly to the hippo-campal principal axis. The main scan parameters arepresented in Table 2.
The segmentation process consisted of two steps: 1. Point-wise landmark setting was done in the sagittal view of thereformatted coronal image where the demarcation in theoriginal coronal image is indiscernible or difficult to interpret[47,48]. 2. Segmentation of the hippocampus in the coronalimages was done by continuous pen drawing. The Hipposegmprogram samples pointwise from the pen drawing. By meansof the landmark setting, and intensity and noise preprocessing,the whole hippocampus including the tail [49] could besegmented without ad hoc determination of the most anteriorand the most posterior slice [50]. See Fig. 1.
Fig. 1. Left: sagittally reformatted view of the right hippocampus of a control subjec2 = markings of the tip of the hippocampal tail. Right: coronal view of the same suguided by the sagittal markings. 3 = same cross as 1, now appearing in the corona
Anatomical definitions of the hippocampus and thehippocampal formation are given in Duvernoy's sectionalanatomy of the hippocampus [51]. The hippocampal regionto be segmented in MR images is often adjusted to anintermediate of these definitions since MR images normallylack information about demarcation for certain parts. Table 3summarizes the rules adhered to in the present study.
Note that only the part of subiculum contiguous withhippocampus was included (Fig. 2). Since partial volumeeffects makes it difficult to demarcate the alveus from otherparts of the hippocampus on 0.5T and 1.5T scanners [52], theprocedure was slightly modified after the first session (firstrater) to include the alveus in the segmentation at the twofollowingvalidation sessions (first and second rater). SeeFig. 2.
Interpretation of the images in relation to the sectionalanatomy of the hippocampus [51] and segmentation guide-lines [47,48] is necessary as there often are parts of the imagewhere no distinct border can be found between adjacentanatomical regions of similar tissue types.
A 3D-visualisation was done after the preliminarysegmentation of the hippocampus to check for deviationsfrom anatomical and curvature expectations. See Fig. 1.
The first rater (CE) initially segmented all the scans (frombaseline and first follow-up, N=116) in one session thatextended over several weeks. The data from this session(CE1) were used in the main analysis of the present study.
t. 1 = cross marking the transition between hippocampal head and amygdala;bject at the level of the front of the hippocampal head; segmentation by CEl view of the right hippocampal head; 4 = left hippocampal head.

2 Note that for the purpose of normalizing hippocampal volumes, onemay bypass Eq. (ii) and use ICVell instead of ICVtot in the normalizingformula (iii) below. The rationale for calculating ICVtot is to get an actualestimate of ICV.3 Today it is more common to use a direct proportionality formula for
normalizing. However, the regression method accords better with the truerelation between hippocampal and intracranial volumes, does not producespurious correlations between normalized volumes and ICV, and may bemore robust to measurement errors than the proportional method [53].
Fig. 2. Left: coronal section of the body of the left hippocampus of a stable MCI patient, illustrating our choices of segmentation borders. Red = segmentation notincluding the alveus; blue = segmentation including the alveus. 1 = subiculum; 2 = alveus. Right: 3D visualization of the right hippocampus of the patient in Fig. 1.
52 C. Eckerström et al. / Journal of the Neurological Sciences 272 (2008) 48–59
Several months later (CE2), CE segmented the images from30 scans including the first and second scans of the 14converting MCI patients who had two scans. After that, thesecond rater (EO) segmented the hippocampus in the same30 scans. The CE2 and EO data were used for the reliabilityanalysis. The raters were always blinded for group belong-ing, patient/control ID and other header data.
3.2. Normalization
To reduce the variance in hippocampal volumes bynormalization to skull size, intracranial volumes (ICV) wereestimated for all subjects using a previously validatedmethod. Using the Hipposegm software, the contours ofthe intracranial cavity were drawn in the three orthogonalprojections. Slices were chosen in relation to landmarkswhere the area of the sectioned cavity can be expected to bemaximal. Two slices (one on each side of the midline) wereused in the sagittal view and their mean area was used as thesagittal intracranial area. The resulting three coronal, sagittaland transversal areas denoted ICAcor, ICAsag and ICAtrans
were applied in the formula
ICVell ¼ 4p3
ffiffiffiffiffiffiffiffiffiffiffiffiffiffiffiffiffiffiffiffiffiffiffiffiffiffiffiffiffiffiffiffiffiffiffiffiffiffiffiffiffiffiffiffiffiffiffiICAcor
⁎ICAsag⁎ICAtrans:
qðiÞ
ICVell is the true value of the intracranial volume if theintracranial cavity is an ellipsoid with its main axes parallel tothe orientations of the segmented slices. In the abovemen-tioned previous study of 30 subjects, a linear regression wasdone comparing ICVell with total intracranial volume ICVtot ascalculated from a full manual segmentation using 5 mmsagittal slices. The correlation between the two measures wasvery high (Pearson's r=0.990), and the regression equation forconverting ICVell into the final estimate of ICV, ICVtot, was:
ICVtot ¼ 142:125þ 1:109⁎ICVell: ðiiÞ
In the present study, we calculated the regression of leftand right hippocampal volumes on this final ICV estimate
(for simplicity abbreviated ICV from now on) in the firstscan of the control subjects (N=26).2 The underlyingassumption was that these regressions depict the “normal”relations between ICV and absolute hippocampal volumes.To get a normalized volume Vnorm from an absolute volumeVabs, we then used the formula [21]
Vnorm ¼ Vabs � k⁎ ICV�Mean ICVð Þð Þ ðiiiÞ
where ICV is the current ICV estimate, k is the detectedregression coefficient and Mean(ICV) refers to the meanestimated ICV in the 26 “normal” scans.3 In the controlgroup, mean normalized volume therefore equals meanabsolute volume.
Segmentation for the calculation of the ICV estimatewas performed by the first rater (CE) on all scans except22, which were all from the follow-up. In these 22 cases,the ICV estimates from the first scan were used. The26 subjects who had both their first and second scansegmented for ICV were used for the analysis of intraraterreliability, presupposing that ICV did not change betweenbaseline and follow-up.
In this paper no data from the ICV measurement exceptits reliability will be presented. An ANOVA analysisshowed that the differences in intracranial volume (ICV)between the groups in the present material were almostexclusively derived from the gender imbalances [54].Normalization eliminates practically all the gender variancein hippocampal volume, and normalized and absolutevolumes discriminate equally well between groups in our

53C. Eckerström et al. / Journal of the Neurological Sciences 272 (2008) 48–59
material, so we have chosen to present only the normalizedresults in this paper.
4. Methods: analysis
4.1. Reliability, hippocampal volumetry
Intrarater reliability for the hippocampal segmentationwas estimated by comparing the summed (left + right)absolute hippocampal volumes for the 30 scans whichwere segmented twice by CE. I.e., CE1 was compared withCE2. Interrater reliability was estimated by comparing thesecond of these segmentations (CE2) with those performedby EO on the same material. Note that there was a slightchange of the segmentation procedure between the tworatings by CE. Raw correlations (Pearson's r and Spearman'sρ) and intraclass correlation (ICC, two-way mixture model,single and average measure reliability) were calculated.
4.2. Reliability, intracranial volume
Intrarater reliability for the intracranial volume segmenta-tion was estimated by comparing the ICVestimates for the 26scan pairs for which the procedure was performed at bothbaseline and follow-up. Raw correlations (Pearson's r andSpearman's ρ) and ICC (two-way mixture model, singlemeasure reliability) were calculated.
4.3. Main analysis
Group and longitudinal comparisons of intracranial, andabsolute and normalized hippocampal volumes (left and rightside separately, as well as total volumes) were performed usingboth parametric and non-parametric methods. For groupcomparisons, the unpaired t test (two-tailed) was used togetherwithMann–Whitney'sU test. In one case anANOVA analysiswas performed. Intraindividual comparisons were made usingthe paired t test (two-tailed) and Wilcoxon's signed rank test.Beside these inter- and intragroup comparisons, hippocampaland intracranial volumes were related to demographicvariables such as sex, age and education years. For correla-tions, Pearson's r and Spearman's ρ were used. Since the
Table 4Total, normalized hippocampal volume (mm3) at baseline
Cohort 1: MCI-c 2: MCI-s
Both sexes (N=68)±1200.0"> (N=21) (N=21)4374.3±1200.0 4037.6±1096.8 4503.4±10
Men (N=26) (N=6) (N=12)4400.2±1172.2 4197.6±431.2 4497.7±11
Women (N=42) (N=15) (N=9)4358.3±1229.9 3973.6±1261.3 4510.9±10
p(m, w) 0.7817 0.4118 0.9580
The results are given as means±2 SD. MCI-c: subjects with mild cognitive impairmstable. p(m, w) (bottom row): parametric significance value (two-tailed t test) for tsignificance value (two-tailed t test) for the difference between MCI-c and MCI-s
results using parametric and non-parametric methods weregenerally in good agreement, only those from the parametricmethods are reported (with one exception).
4.4. Software used for the statistical analysis
The main calculations were made using StatView 5.0 forMacintosh. A selection of the results was cross-checkedusing Statistica 7.1 for Windows. For the reliability analysis,SPSS 14 for Windows was also used.
5. Results
No data on the relation between hippocampal volumes,age and education are presented since the non-significanttrends that emerged from the analysis of these factors did not,in our opinion, illuminate the basic questions of this paper.
5.1. Reliability
Intrarater reliability for the hippocampal segmentation (CE1vs CE2): Pearson's r=0.937, Spearman's ρ 0.916; singlemeasure ICC=0.712; average measure ICC=0.832. Interraterreliability (CE2 vs EO): Pearson' r=0.935, Spearman'sρ=0.935; single measure ICC=0.663; average measureICC=0.797.
Intrarater reliability for the ICV segmentation: Pearson'sr=0.986, Spearman's ρ=0.989; single measure ICC=0.986.
5.2. Hippocampal volume
Table 4 shows normalized total hippocampal volumes atbaseline for group comparisons and data split up on genderfor the individual groups.
There was an overrepresentation of men in the stable MCIgroup and an overrepresentation of women in the other twogroups. We have therefore included an analysis of hippo-campal volumes for men and women separately. Table 4shows that normalization removes the expected differencebetween the sexes attributable to the smaller ICV found inwomen, and thus allows for meaningful comparisonsbetween groups in spite of different gender compositions.
3: Controls p(1, 2) p(1, 3) p(2, 3)
(N=26) 0.0087 0.0043 0.817991.0 4542.1±1179.2
(N=8) 0.2412 0.5433 0.766653.5 4406.0±1574.1
(N=18) 0.0444 0.0030 0.661770.5 4602.6±987.0
0.4440
ent, converting to dementia. MCI-s: patients with mild cognitive impairment,he difference in total volume between men and women. p(1, 2): parametric, etc.

Table 5Total, right and left normalized hippocampal volumes (mm3, mean±2 SD) at baseline
Cohort 1: MCI-c 2: MCI-s 3: Controls p(1, 2) p(1, 3) p(2, 3)(N=68) (N=21) (N=21) (N=26)
Total 4374.3±1200.0 4037.6±1096.8 4503.4±1091.0 4542.1±1179.2 0.0087 0.0043 0.8179Right 2284.6±640.4 2137.8±617.0 2328.0±601.9 2368.0±622.2 0.0517 0.0156 0.6592Left 2089.8±600.2 1899.7±509.7 2175.4±532.1 2174.2±596.2 0.0014 0.0017 0.9887Diff 194.8±317.0 238.1±320.4 152.7±316.7 193.8±307.7 0.0898 0.3400 0.3732p(R,L) b0.0001 b0.0001 0.0003 b0.0001
MCI-c: MCI patients converting to dementia. MCI-s: stable MCI patients. Diff=right minus left volume. p(1, 2)=significance level according to an unpaired, two-tailed t test for the difference between MCI-c and MCI-s with respect to total volume, right and left volumes and their difference, etc. p(R, L)=significance of thedifference between left and right volumes according to a two-tailed t test for paired comparisons.
Fig. 3. Scattergram for normalized left hippocampal volumes at baseline,split on groups. Horizontal axis: Groups; 1 = MCI-c; 2 = MCI-s; 3 =controls. Vertical axis: Volume in mm3. Dotted horizontal lines: post hoc cutoff criteria at 2200 and 1800 mm3.
54 C. Eckerström et al. / Journal of the Neurological Sciences 272 (2008) 48–59
Table 4 also shows that the converting MCI group as awhole has a significantly smaller total hippocampal volumethan both the stable MCI group and the controls.
5.3. Hippocampal asymmetry
The normalized total, right and left hippocampal volumesat baseline and the difference between right and left sides areshown in Table 5.
It can be gathered from Table 5 that there is a significantoverall difference in (normalized) volume between the left andthe right hippocampus, in the order of almost 10%. There is atrend towards a larger asymmetry in MCI-c. This trend is notsignificant, but it is also reflected in the fact that left hippocampalvolumes tend to discriminate better than right volumes betweenMCI-c and the other groups. It is also seen that left hippocampalvolume differentiates better than total volume betweenconverters and others.
5.4. Discrimination at the individual level
It can be seen from Table 5 that the within-groupvariability with respect to hippocampal volumes is large.Hence, the detected differences between the groups do notguarantee that hippocampal volume has any discriminativevalue in the individual case. To address this issue, thescattergram for left hippocampal volumes is given in Fig. 3.Two cut off criteria at 2200 and 1800 mm3, which werechosen post hoc, are also shown.
The classifications resulting from the cut offs arepresented in Table 6, where the number of subjects foreach subgroup and volume interval is shown.
5.5. Converters to AD compared with converters to non-AD
Table 7 shows the baseline volumes of the MCI-csubjects who, within 2 years from baseline, convert into ADand non-AD dementia. Table 7 also shows baseline volumesfor MCI-s and controls.
There is an overall trend for smaller hippocampal volumes inthe “MCI-c to AD” than in the “MCI-c to non-AD” group, bothwith regards to left, right and total hippocampal volumes: the
subgroups are, however, small and none of the differencesreaches significance. The AD converters demonstrate signifi-cantly smaller total, right, and left hippocampal volumes thanthe non-converters and controls. The non-AD converters, by
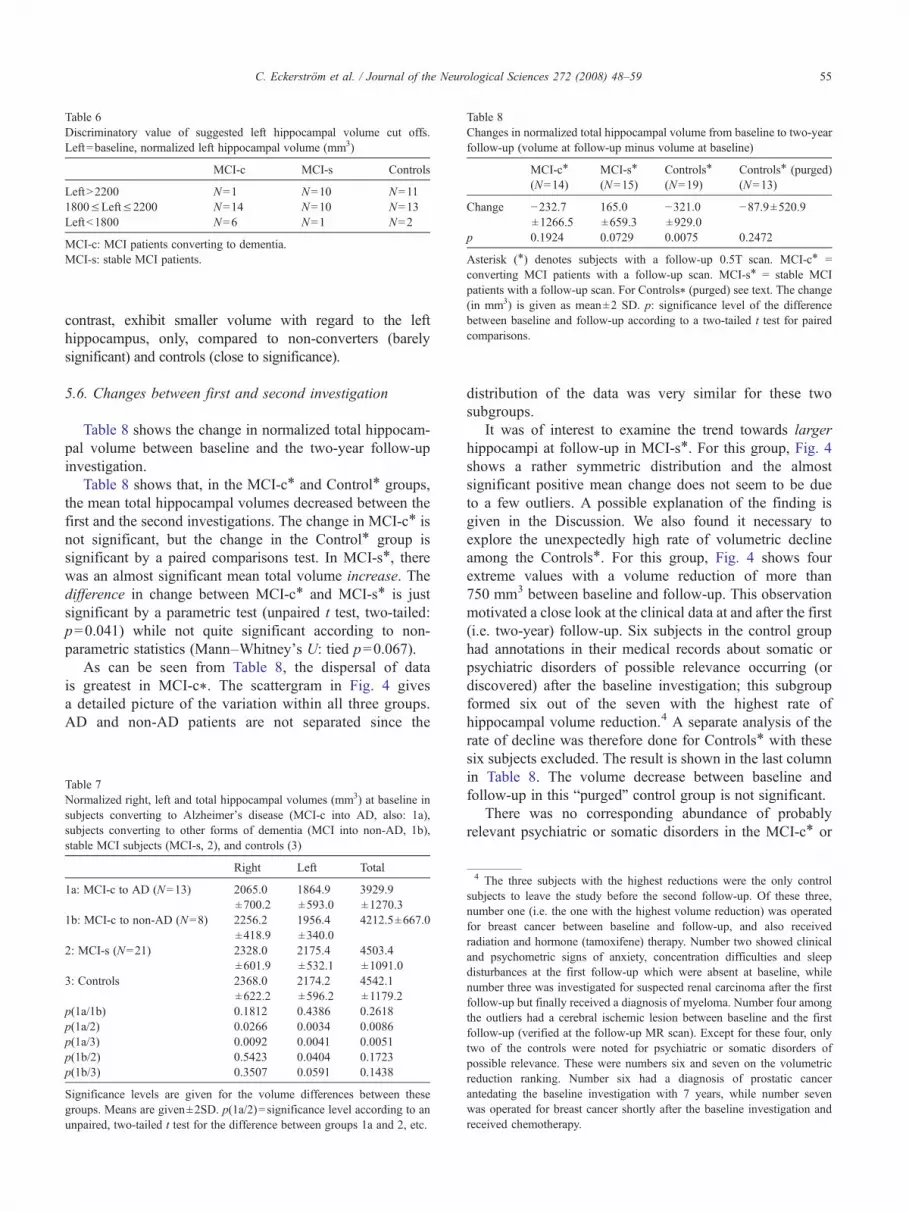
Table 6Discriminatory value of suggested left hippocampal volume cut offs.Left=baseline, normalized left hippocampal volume (mm3)
MCI-c MCI-s Controls
LeftN2200 N=1 N=10 N=111800≤Left≤2200 N=14 N=10 N=13Leftb1800 N=6 N=1 N=2
MCI-c: MCI patients converting to dementia.MCI-s: stable MCI patients.
Table 8Changes in normalized total hippocampal volume from baseline to two-yearfollow-up (volume at follow-up minus volume at baseline)
MCI-c⁎
(N=14)MCI-s⁎
(N=15)Controls⁎
(N=19)Controls⁎ (purged)(N=13)
Change −232.7±1266.5
165.0±659.3
−321.0±929.0
−87.9±520.9
p 0.1924 0.0729 0.0075 0.2472
Asterisk (⁎) denotes subjects with a follow-up 0.5T scan. MCI-c⁎ =converting MCI patients with a follow-up scan. MCI-s⁎ = stable MCIpatients with a follow-up scan. For Controls⁎ (purged) see text. The change(in mm3) is given as mean±2 SD. p: significance level of the differencebetween baseline and follow-up according to a two-tailed t test for pairedcomparisons.
55C. Eckerström et al. / Journal of the Neurological Sciences 272 (2008) 48–59
contrast, exhibit smaller volume with regard to the lefthippocampus, only, compared to non-converters (barelysignificant) and controls (close to significance).
5.6. Changes between first and second investigation
Table 8 shows the change in normalized total hippocam-pal volume between baseline and the two-year follow-upinvestigation.
Table 8 shows that, in the MCI-c⁎ and Control⁎ groups,the mean total hippocampal volumes decreased between thefirst and the second investigations. The change in MCI-c⁎ isnot significant, but the change in the Control⁎ group issignificant by a paired comparisons test. In MCI-s⁎, therewas an almost significant mean total volume increase. Thedifference in change between MCI-c⁎ and MCI-s⁎ is justsignificant by a parametric test (unpaired t test, two-tailed:p=0.041) while not quite significant according to non-parametric statistics (Mann–Whitney’s U: tied p=0.067).
As can be seen from Table 8, the dispersal of datais greatest in MCI-c⁎. The scattergram in Fig. 4 givesa detailed picture of the variation within all three groups.AD and non-AD patients are not separated since the
Table 7Normalized right, left and total hippocampal volumes (mm3) at baseline insubjects converting to Alzheimer's disease (MCI-c into AD, also: 1a),subjects converting to other forms of dementia (MCI into non-AD, 1b),stable MCI subjects (MCI-s, 2), and controls (3)
Right Left Total
1a: MCI-c to AD (N=13) 2065.0±700.2
1864.9±593.0
3929.9±1270.3
1b: MCI-c to non-AD (N=8) 2256.2±418.9
1956.4±340.0
4212.5±667.0
2: MCI-s (N=21) 2328.0±601.9
2175.4±532.1
4503.4±1091.0
3: Controls 2368.0±622.2
2174.2±596.2
4542.1±1179.2
p(1a/1b) 0.1812 0.4386 0.2618p(1a/2) 0.0266 0.0034 0.0086p(1a/3) 0.0092 0.0041 0.0051p(1b/2) 0.5423 0.0404 0.1723p(1b/3) 0.3507 0.0591 0.1438
Significance levels are given for the volume differences between thesegroups. Means are given±2SD. p(1a/2)=significance level according to anunpaired, two-tailed t test for the difference between groups 1a and 2, etc.
distribution of the data was very similar for these twosubgroups.
It was of interest to examine the trend towards largerhippocampi at follow-up in MCI-s⁎. For this group, Fig. 4shows a rather symmetric distribution and the almostsignificant positive mean change does not seem to be dueto a few outliers. A possible explanation of the finding isgiven in the Discussion. We also found it necessary toexplore the unexpectedly high rate of volumetric declineamong the Controls⁎. For this group, Fig. 4 shows fourextreme values with a volume reduction of more than750 mm3 between baseline and follow-up. This observationmotivated a close look at the clinical data at and after the first(i.e. two-year) follow-up. Six subjects in the control grouphad annotations in their medical records about somatic orpsychiatric disorders of possible relevance occurring (ordiscovered) after the baseline investigation; this subgroupformed six out of the seven with the highest rate ofhippocampal volume reduction.4 A separate analysis of therate of decline was therefore done for Controls⁎ with thesesix subjects excluded. The result is shown in the last columnin Table 8. The volume decrease between baseline andfollow-up in this “purged” control group is not significant.
There was no corresponding abundance of probablyrelevant psychiatric or somatic disorders in the MCI-c⁎ or
4 The three subjects with the highest reductions were the only controlsubjects to leave the study before the second follow-up. Of these three,number one (i.e. the one with the highest volume reduction) was operatedfor breast cancer between baseline and follow-up, and also receivedradiation and hormone (tamoxifene) therapy. Number two showed clinicaland psychometric signs of anxiety, concentration difficulties and sleepdisturbances at the first follow-up which were absent at baseline, whilenumber three was investigated for suspected renal carcinoma after the firstfollow-up but finally received a diagnosis of myeloma. Number four amongthe outliers had a cerebral ischemic lesion between baseline and the firstfollow-up (verified at the follow-up MR scan). Except for these four, onlytwo of the controls were noted for psychiatric or somatic disorders ofpossible relevance. These were numbers six and seven on the volumetricreduction ranking. Number six had a diagnosis of prostatic cancerantedating the baseline investigation with 7 years, while number sevenwas operated for breast cancer shortly after the baseline investigation andreceived chemotherapy.

Fig. 4. Scattergram for the change in normalized total hippocampal volumesbetween baseline and two-year follow-up, split on groups. Horizontal axis:Groups; 1 = MCI-c⁎; 2 = MCI-s⁎; 3 = Controls⁎. Vertical axis: Volumechange in mm3 (volume at follow-up minus volume at baseline).
56 C. Eckerström et al. / Journal of the Neurological Sciences 272 (2008) 48–59
MCI-s⁎ subjects after the baseline investigation. We foundthree more cancer diagnoses overall but they were mostprobably irrelevant for the present study as they were curedyears before enrolment into the study. A comprehensiveanalysis of the influence of somatic disorders has to await thecompletion of the second follow-up.
6. Discussion
The main findings in this paper are that hippocampalvolume predicts conversion to dementia in MCI patients, andthat left hippocampal volume seems to be the best marker forconversion.
There are potential problems arising when using the MCIdiagnosis. MCI is a heterogeneous condition reflectingdifferent aetiologies and therefore different prognoses. Tomake our results as clinically relevant as possible we havetried to include into the study all MCI patients referred to thememory clinic where the cause of the cognitive impairmentwas not easily discernable, regardless of suspected under-
lying disease. In accordance with this broad inclusionapproach we have not specifically selected patients at highrisk of developing dementia or at risk of developing specificforms of dementia. Instead we have monitored the patientsand if they eventually have deteriorated sufficiently to beregarded as demented, specific dementia diagnoses weregiven.
The use of antidepressants and cholinesterase inhibitorswas recorded. This was done in order to address the possibilitythat these medications might mask the clinical state or delayexpression of a neurodegenerative disease. In the case ofantidepressants, the investigation would also address thehypothetical effect on hippocampal neurogenesis [55]. The useof these medications in the patient groups was very similar andshould, therefore, not affect the results presented.
We found clear differences in total hippocampal volumeat baseline when comparing MCI-c with MCI-s as well aswith the control group. They are not significant for the malesubjects taken separately, but considering the actualdifferences in mean values this finding could very well bedue to the small number of men in the MCI-c group. Worthmentioning here is that normalization allowed for mean-ingful comparisons between the full (both genders) clinicalgroups in spite of an overrepresentation of men in our stableMCI group and an overrepresentation of women in the othertwo groups.
All patient groups and subgroups studied, as well as thecontrol group, showed smaller left than right hippocampi.But, this asymmetry seemed to be most pronounced in theconverters (MCI-c). The intergroup differences in asymme-try did not reach significance but left volume differentiatedbetter than right volume between MCI-c and the othergroups. From these findings it would seem that the lefthippocampus is involved earlier and more intimately in thedementia process than the right hippocampus, and that theleft hippocampus would be a potentially better neuroradio-logical biomarker for cognitive decline than right hippo-campus or total hippocampal volume. Earlier studies reportdecreased asymmetry in patients with AD [23–25]; however,in MCI there are somewhat discrepant previous findings[15,25]. Unfortunately, our material did not contain anyinformation regarding the handedness of the subjects andthere remains a possibility that this may have affected theresult [56].
The relatively small difference in total volume betweenthe MCI-s and the control groups is interesting. There are anumber of possible explanations. One would be that some orall MCI-s patients simply do not have a neurodegenerativedisorder and that the cognitive decline exhibited at baselineis secondary to some condition outside the exclusion criteria,such as subclinical depression or prolonged stress. Anotherpossibility is that some or all patients in this group do indeedhave a neurodegenerative disorder but that the expression orprogression of this disorder is slowed down by a brain orcognitive reserve. The ICV data (cf. above) give no supportfor the brain reserve hypothesis but the power of the study in

57C. Eckerström et al. / Journal of the Neurological Sciences 272 (2008) 48–59
this respect is small. Some support for an effect of cognitivereserve may be found in the fact that the stable patients werethose with the longest mean education. We intend toinvestigate this relation further in a future study.
The 30 scans used for calculation of intra- and interraterreliability for the hippocampal volume estimates were not arandom sample but were all but two from converting MCIpatients. This group contained the greatest deviations fromnormal hippocampal anatomy and should therefore be the mostdifficult to segment. In spite of this, high inter- and intraraterreliability for the hippocampal volumes estimates was achievedin terms of raw correlations. These high raw correlations are inour opinion sufficient ground for relying on the CE1 data for themain analysis. The reliabilities were considerably lower whenmeasured as intraclass correlations. This discrepancywas due torather large deviations in mean between the two raters andbetween CE1 and CE2. The latter deviation was most likely dueto the small, but distinct change in segmentation standardsintroduced between CE1 and CE2 (the latter segmentationsbeing used in the reliability analyses only).
With a marked difference in hippocampal volumebetween groups of patients who convert to dementiacompared to stable or control groups, there should be atheoretical possibility to find a threshold value for MCIpatients that will convert to dementia. By applying post hoccut off points for left normalized hippocampal volume atbaseline, we were able to classify 16 out of the 42 MCIpatients as either converters or stable, with only 2 falsepositives. Of course, the true value of such proposed cut offswould be in conjunction with a hypothesis, which will haveto be proposed, tested and refined in future studies.
The MCI-c group was analyzed with regard to whichdementia type was diagnosed at follow-up. Due to the smallnumber of patients they were only divided in an AD and anon-AD subgroup. The findings in the diagnostic subgroupsof the converting MCI must therefore be interpreted withcaution, in particular the non-AD group. As reported in thematerial description, the non-AD subgroup consisted of only8 patients with 3 different dementia diagnoses. There wereno significant volumetric differences between the AD andnon-AD subgroups. The AD group had significantly smallerhippocampal volumes than both the stable MCI group andthe control group. The non-AD group had significantly (orclose to significantly) smaller left hippocampus than thestable MCI group and the control group. In conclusion, ourdata do suggest that left hippocampal volume is linked to theprognosis of cognitive function irrespective of whether thepatients develop AD or some other form of dementia.
There was a trend towards decreased volume over time inthe MCI-c⁎ group, but this volume loss did not reachsignificance. Table 8 shows that this group had the greatestdispersal of data. This could possibly reflect different rates ofprogression in cognitive decline, or different underlyingdiseases with varying degrees of hippocampal involvement inthe disease progression. There was no discernible difference,however, between AD and non-AD patients with respect to
volume loss. The MCI-s⁎ group had an almost significantincrease in mean volume. This finding indicates that asubgroup of MCI-s⁎ may have had a reversible brainabnormality, e.g. due to a subclinical depression.
Surprisingly, the control group had a highly significanthippocampal volume decrease between baseline and follow-up. When investigating for severe somatic disorders in thecontrol group, we found a clear association between thepresence of severe somatic disease and hippocampal volumeloss between baseline and follow-up. It would seem that thehippocampus was either affected by the somatic disease or bythe treatment of this disease and there may be a link betweenhippocampal atrophy and the cognitive impairment that oftenfollows a severe somatic disease [57]. When the controlgroup was purged of subjects with severe somatic disease(and one subject with psychiatric symptomatology at firstfollow-up), the longitudinal hippocampal loss was smallerand no longer significant. The importance of a carefulexamination of the study material for somatic illnesses involumetric hippocampal research should be emphasized.Especially, the somatic status of patients and controls aftertheir inclusion in the study must be carefully checked.
7. Concluding remarks and future directions
The hippocampal volumetry analyses presented in thisarticle constitute a part of the Göteborg MCI study wherebaseline and follow-up scans were performed on a 0.5T MRscanner. Today, this field strength is no longer recommendedfor volumetric studies, but our state of the art MR-imageprocessing facilities in the Hipposegm routine and thereliable segmentation method made it possible to achieveplausible results also from images obtained at 0.5T. We willin future work analyze the part of the Göteborg MCI studywhere a 1.5T scanner was used and investigate theconsistency of the data from the two different scanners.
The entorhinal cortex (ERC) is affected by neuropatho-logical changes in AD earlier than the hippocampus [4] andwould therefore be a potentially better volumetric markerthan the hippocampus. There is evidence that atrophy of theERC can provide prognostic information separately orcombined with hippocampal volume assessments [10,12].We intend to investigate the ERC and other medial temporallobe structures as possible volumetric markers of cognitivedecline in future work.
Acknowledgements
This work was supported by grants from the Swedish ResearchCouncil (grants # 2002-5462, K2002-21P-14359-01A and 09946),Handlanden Hjalmar Svenssons Forskningsfond, PfannenstillsForskningsstiftelse, Alzheimerfonden, Axel Linders Stiftelse,Stiftelsen Gamla Tjänarinnor, The Sahlgrenska University Fundsand Stiftelsen Psykiatriska Forskningsfonden. We would like toextend our gratitude to Stig Eriksson, Christina Holmberg, KarinLind, Daniel Ruhe, Ewa Styrud, and Andreas Wrangsjö.

58 C. Eckerström et al. / Journal of the Neurological Sciences 272 (2008) 48–59
References
[1] Gauthier S, Reisberg B, Zaudig M, et al. Mild cognitive impairment.Lancet 2006;367(9518):1262–70.
[2] NordlundA, Rolstad S,HellstromP, SjogrenM,Hansen S,Wallin A. TheGoteborg MCI study: mild cognitive impairment is a heterogeneouscondition. J Neurol Neurosurg Psychiatry 2005;76(11):1485–90.
[3] Wolf H, Julin P, Gertz HJ, Winblad B, Wahlund LO. Intracranial volumein mild cognitive impairment, Alzheimer's disease and vasculardementia: evidence for brain reserve? Int J Geriatr Psychiatry 2004;19(10):995–1007.
[4] Braak H, Braak E. Frequency of stages of Alzheimer-related lesions indifferent age categories. Neurobiol Aging 1997;18(4):351–7.
[5] Csernansky JG, Hamstra J, Wang L, et al. Correlations betweenantemortem hippocampal volume and postmortem neuropathology inAD subjects. Alzheimer Dis Assoc Disord 2004;18(4):190–5.
[6] Gosche KM, Mortimer JA, Smith CD, Markesbery WR, Snowdon DA.Hippocampal volume as an index of Alzheimer neuropathology:findings from the Nun Study. Neurology 2002;58(10):1476–82.
[7] Jack Jr CR, Dickson DW, Parisi JE, et al. Antemortem MRI findingscorrelate with hippocampal neuropathology in typical aging anddementia. Neurology 2002;58(5):750–7.
[8] Bennett DA, Schneider JA, Bienias JL, Evans DA, Wilson RS. Mildcognitive impairment is related to Alzheimer disease pathology andcerebral infarctions. Neurology 2005;64(5):834–41.
[9] Geuze E, Vermetten E, Bremner JD. MR-based in vivo hippocampalvolumetrics: 2. Findings in neuropsychiatric disorders. Mol Psychiatry2005;10(2):160–84.
[10] Wolf H, Jelic V, Gertz HJ, Nordberg A, Julin P, Wahlund LO. A criticaldiscussion of the role of neuroimaging in mild cognitive impairment.Acta Neurol Scand Suppl 2003;179:52–76.
[11] Anstey KJ, Maller JJ. The role of volumetric MRI in understandingmild cognitive impairment and similar classifications. Aging MentHealth 2003;7(4):238–50.
[12] Chetelat G, Baron JC. Early diagnosis of Alzheimer's disease:contribution of structural neuroimaging. Neuroimage 2003;18(2):525–41.
[13] de Leon MJ, Mosconi L, Blennow K, et al. Imaging and CSF studies inthe preclinical diagnosis of Alzheimer's disease. Ann N Y Acad Sci2007;1097:114–45.
[14] Devanand DP, Pradhaban G, Liu X, et al. Hippocampal and entorhinalatrophy in mild cognitive impairment: prediction of Alzheimer disease.Neurology 2007;68(11):828–36.
[15] Tapiola T, Pennanen C, Tapiola M, et al. MRI of hippocampus andentorhinal cortex in mild cognitive impairment: a follow-up study.Neurobiol Aging 2008;29(1):31–8.
[16] Grieve SM, Clark CR, Williams LM, Peduto AJ, Gordon E.Preservation of limbic and paralimbic structures in aging. HumBrain Mapp 2005;25(4):391–401.
[17] Sullivan EV, Marsh L, Pfefferbaum A. Preservation of hippocampalvolume throughout adulthood in healthy men and women. NeurobiolAging 2005;26(7):1093–8.
[18] van de Pol LA, Barnes J, Scahill RI, et al. Improved reliability ofhippocampal atrophy rate measurement in mild cognitive impairmentusing fluid registration. NeuroImage 2007;34(3):1036–41.
[19] Jack Jr CR, Petersen RC, Xu Y, et al. Rates of hippocampal atrophycorrelate with change in clinical status in aging and AD. Neurology2000;55(4):484–90.
[20] Jack Jr CR, ShiungMM, Gunter JL, et al. Comparison of different MRIbrain atrophy rate measures with clinical disease progression in AD.Neurology 2004;62(4):591–600.
[21] Jack Jr C, Twomey C, Zinsmeister A, Sharbrough F, Petersen R,Cascino G. Anterior temporal lobes and hippocampal formations:normative volumetric measurements from MR images in young adults.Radiology 1989;172(2):549–54.
[22] Maller JJ, Anstey KJ, Reglade-Meslin C, Christensen H, Wen W,Sachdev P. Hippocampus and amygdala volumes in a random
community-based sample of 60–64 year olds and their relationshipto cognition. Psychiatry Res 2007;156(3):185–97.
[23] Barnes J, Scahill RI, Schott JM, Frost C, Rossor MN, Fox NC. DoesAlzheimer's disease affect hippocampal asymmetry? Evidence from across-sectional and longitudinal volumetric MRI study. Dement GeriatrCogn Disord 2005;19(5–6):338–44.
[24] Geroldi C, Laakso MP, DeCarli C, et al. Apolipoprotein E genotypeand hippocampal asymmetry in Alzheimer's disease: a volumetric MRIstudy. J Neurol Neurosurg Psychiatry 2000;68(1):93–6.
[25] Soininen H, Partanen K, Pitkanen A, et al. Decreased hippo-campal volume asymmetry on MRIs in nondemented elderlysubjects carrying the apolipoprotein E epsilon 4 allele. Neurology1995;45(2):391–2.
[26] Muller MJ, Greverus D, Weibrich C, et al. Diagnostic utility ofhippocampal size and mean diffusivity in amnestic MCI. NeurobiolAging 2007;28(3):398–403.
[27] Roman GC, Erkinjuntti T, Wallin A, Pantoni L, Chui HC. Subcorticalischaemic vascular dementia. Lancet Neurol 2002;1(7):426–36.
[28] O'Brien JT, Erkinjuntti T, Reisberg B, et al. Vascular cognitiveimpairment. Lancet Neurol 2003;2(2):89–98.
[29] Fein G, Di Sclafani V, Tanabe J, et al. Hippocampal and corticalatrophy predict dementia in subcortical ischemic vascular disease.Neurology 2000;55(11):1626–35.
[30] Mungas D, Jagust WJ, Reed BR, et al. MRI predictors of cognition insubcortical ischemic vascular disease and Alzheimer's disease.Neurology 2001;57(12):2229–35.
[31] Du AT, Schuff N, Laakso MP, et al. Effects of subcortical ischemicvascular dementia and AD on entorhinal cortex and hippocampus.Neurology 2002;58(11):1635–41.
[32] van der Flier WM, van Straaten EC, Barkhof F, et al. Medialtemporal lobe atrophy and white matter hyperintensities areassociated with mild cognitive deficits in non-disabled elderlypeople: the LADIS study. J Neurol Neurosurg Psychiatry 2005;76(11):1497–500.
[33] Folstein MF, Folstein SE, McHugh PR. “Mini-mental state”. Apractical method for grading the cognitive state of patients for theclinician. J Psychiatr Res 1975;12(3):189–98.
[34] Wallin A, Edman A, Blennow K, et al. Stepwise comparative statusanalysis (STEP): a tool for identification of regional brain syndromesin dementia. J Geriatr Psychiatry Neurol 1996;9(4):185–99.
[35] Royall DR, Mahurin RK, Gray KF. Bedside assessment of executivecognitive impairment: the executive interview. J Am Geriatr Soc1992;40(12):1221–6.
[36] Morris JC. Clinical dementia rating: a reliable and valid diagnostic andstaging measure for dementia of the Alzheimer type. Int Psychogeriatr1997;9(Suppl 1):173–6 discussion 177–178.
[37] Winblad B, Palmer K, Kivipelto M, et al. Mild cognitive impairment—beyond controversies, towards a consensus: report of the InternationalWorking Group on Mild Cognitive Impairment. J Intern Med 2004;256(3):240–6.
[38] Reisberg B, Ferris SH, de Leon MJ, Crook T. Global DeteriorationScale (GDS). Psychopharmacol Bull 1988;24(4):661–3.
[39] WHO. The ICD-10 classification of mental and behavioural disorders.Geneva: WHO; 1992.
[40] McKhann G, Drachman D, Folstein M, Katzman R, Price D, StadlanEM. Clinical diagnosis of Alzheimer's disease: report of the NINCDS-ADRDAWork Group under the auspices of Department of Health andHuman Services Task Force on Alzheimer's Disease. Neurology1984;34(7):939–44.
[41] Erkinjuntti T, Inzitari D, Pantoni L, et al. Research criteria forsubcortical vascular dementia in clinical trials. J Neural Transm Suppl2000;59:23–30.
[42] Clinical and neuropathological criteria for frontotemporal dementia.The Lund and Manchester Groups. J Neurol Neurosurg Psychiatry1994;57(4):416–8.
[43] Wrangsjö A. A Bayesian framework for image denoising [Thesis].Linköping: Linköping University; 2004.

59C. Eckerström et al. / Journal of the Neurological Sciences 272 (2008) 48–59
[44] Godtliebsen F, Spjotvoll E, Marron JS. A nonlinear Gaussian filterapplied to images with discontinuities. Journal of NonparametricStatistics 1997;8(1):21–43.
[45] Tomasi C, Manduchi R. Bilateral filtering for gray and color images.IEEE International Conference on Computer Vision; 1998. p. 839–46.
[46] Dempster A, LairdN, RubinD.Maximum likelihood from incomplete datavia the EM algorithm. J Royal Statistical Society B 1977;39(1):1–38.
[47] Pantel J, Cretsinger K, Keefe H. Hippocampus tracing guidelines.Iowa: University of Iowa Mental Health Clinical Research Center(MHCRC); 1998.
[48] Pantel J, O'Leary DS, Cretsinger K, et al. A new method for the in vivovolumetric measurement of the human hippocampus with highneuroanatomical accuracy. Hippocampus 2000;10(6):752–8.
[49] Maller JJ, Reglade-Meslin C, Anstey KJ, Sachdev P. Sex andsymmetry differences in hippocampal volumetrics: before and beyondthe opening of the crus of the fornix. Hippocampus 2006;16(1):80–90.
[50] Geuze E, Vermetten E, Bremner JD. MR-based in vivo hippocampalvolumetrics: 1. Review of methodologies currently employed. MolPsychiatry 2005;10(2):147–59.
[51] Duvernoy H. The human hippocampus. Third ed. Springer; 2005.[52] Wieshmann UC, Symms MR, Mottershead JP, et al. Hippocampal
layers on high resolution magnetic resonance images: real orimaginary? J Anat 1999;195(Pt 1):131–5.
[53] Sanfilipo MP, Benedict RH, Zivadinov R, Bakshi R. Correction forintracranial volume in analysis of whole brain atrophy in multiplesclerosis: the proportion vs. residual method. Neuroimage 2004;22(4):1732–43.
[54] Gur RC, Gunning- F, Dixon, Bilker WB, Gur RE. Sex differences intemporo-limbic and frontal brain volumes of healthy adults. CerebCortex 2002;12(9):998–1003.
[55] Warner-Schmidt JL, Duman RS. Hippocampal neurogenesis: opposingeffects of stress and antidepressant treatment. Hippocampus 2006;16(3):239–49.
[56] Anstey KJ, Maller JJ, Meslin C, et al. Hippocampal and amygdalarvolumes in relation to handedness in adults aged 60–64. Neuroreport2004;15(18):2825–9.
[57] Hopkins RO, Jackson JC. Long-term neurocognitive function aftercritical illness. Chest 2006;130(3):869–78.