sm2311.pdf - sensors and materials
TRANSCRIPT
2919Sensors and Materials, Vol. 32, No. 9 (2020) 2919–2928MYU Tokyo
S & M 2311
*Corresponding author: e-mail: [email protected]://doi.org/10.18494/SAM.2020.2906
ISSN 0914-4935 © MYU K.K.https://myukk.org/
Detection of Unbonded Defect under Surface of Material Using Phase Information of Rayleigh and A0 Mode Lamb Waves
Kazuhiko Imano*
Graduate School of Science and Engineering, Akita University,1-1 Tegata, Gakuen-cho, Akita City, 010-8502 Japan
(Received April 21, 2020; accepted June 17, 2020)
Keywords: unbonded, Rayleigh wave, laser probe method, finite element method, phase change information
An experiment on detecting an unbonded defect under the surface of a glass model using Rayleigh waves was executed. A 1 MHz Rayleigh wave was propagated on the glass model, and the vibration distribution on the material surface was probed by a laser beam. No information of the defect was detected from the Rayleigh wave amplitude distribution. On the other hand, the phase information of Rayleigh waves propagating on the material surface was focused on and acquired. As a result, the measured phase change for the propagation distance x (difference in phase slope) was detected in the unbonded defect area. In addition, finite element method (FEM) analysis was performed under the same conditions as in the experiment to verify the experimental results. A phase change was also observed on the unbonded defect, as in the experiment. The possibility of this method as a new detection method for the effective evaluation of unbonded defects in a material is described.
1. Introduction
In recent years, to improve the strength of a material, a layered structure is sometimes formed. However, a problem with layered materials is that unbonded defects occur. If stress is concentrated in unbonded areas, the strength of the material will decrease and the material may break.(1–5) The ultrasonic pulse method has been widely used as a nondestructive inspection method for materials and structures.(6,7) In this method, the probed surface has a finite size, and it is often probed by an ultrasonic probe having a size much larger than the wavelength of an ultrasonic wave and the size of a defect. Furthermore, the reflected signal from a small defect is averaged on the probed surface. Thus, it may not be possible to detect minute defects.(6,7) There is also a problem that the defect is very close to the ultrasonic probe, so the reflected signal is masked by the signal transmitted from the ultrasonic transmitter. In this paper, a method that can detect defects smaller than the wavelength of an ultrasonic wave is established without using expensive or large-scale equipment. That is, the defect exists on the subsurface of a material. In previous works,(8–11) the evaluation of phase characteristics
2920 Sensors and Materials, Vol. 32, No. 9 (2020)
by the laser probe method(8) was studied. The system used, which employs laser beam light as a probe, evaluates the phase modulation caused by the transmission of ultrasonic waves through a solid sample and passing through an area where residual stress and defects(9,10) exist near the surface of the sample. This system mainly consists of an ultrasonic transducer and a laser beam light, and the optical sensor is a noncontact method in air. By using a laser beam with a small spot diameter of about 20 μm, it is possible to measure a small area without being affected by spatial averaging effects.(8) Experiments using the laser probe method have shown that the residual stress acting on a small area affects the phase characteristics of propagating ultrasonic waves.(8–12) Here, the author created a defect model for the detection of unbonded defects and evaluated the phase change due to the defect model. To verify the experimental results, the finite element method (FEM)(7,12) was employed under the same conditions as in the experiments. On the basis of the above, the author created an unbonded defect to evaluate the phase change characteristics by the laser probe method and examined them experimentally and by simulation using the FEM. In this paper, the possibility of detecting an unbonded defect using the phase information of an ultrasonic wave has been focused on. It was found that the change in the phase characteristic in the defect area can be detected, and thus ultrasonic evaluation is possible by combining with an optical method. In the following, the effectiveness of this method will be clarified by reporting experiments for the unbonded defect model and its simulation to clarify the mode conversion between Rayleigh and A0 Lamb waves by FEM analysis. 2. Experiment on Phase Variation Using Laser Probe Method
2.1 Experimental system
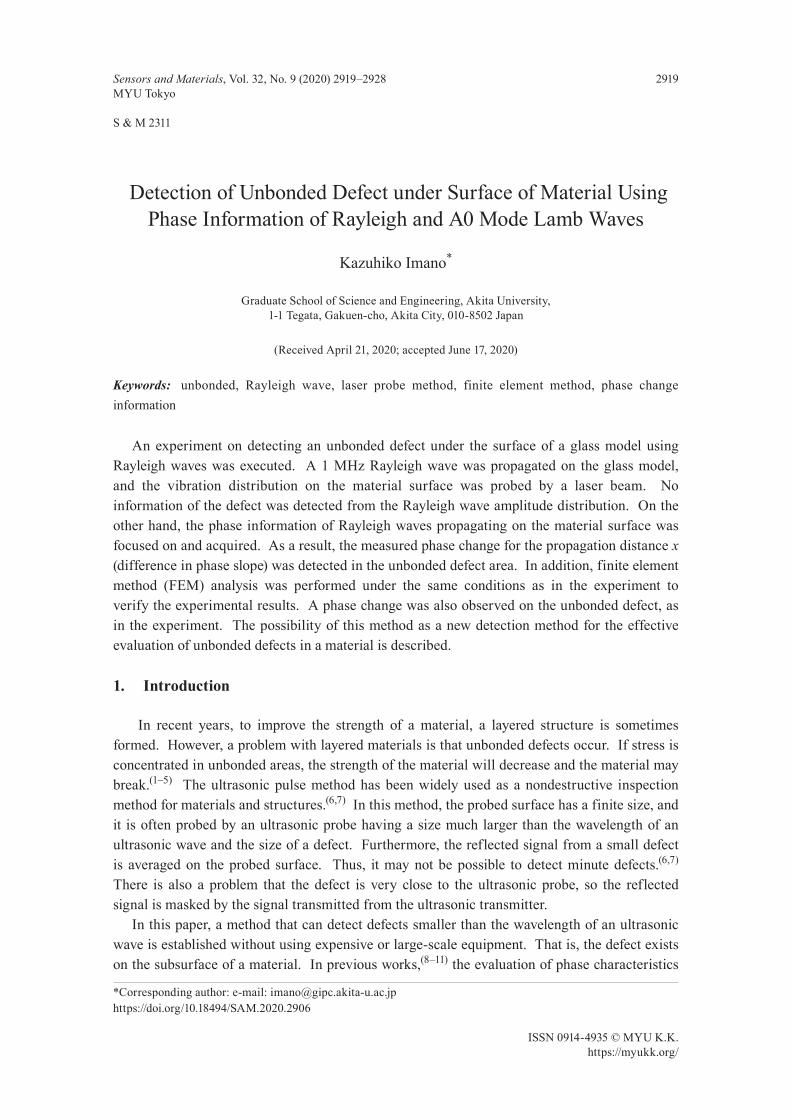
Figure 1 shows the defect model including a delaminated area. Soda-lime glass plates of 50 mm × 100 mm × 10 mm and 50 mm × 100 mm × 2 mm, i.e., with two different thicknesses, were adhered by 50-μm-thick double-sided tape (Nitto Denko, LA50). An unbonded defect
Fig. 1. (Color online) Two glass plates adhered with double-sided tape (50 µm) having 10-mm-wide unbonded area.
Sensors and Materials, Vol. 32, No. 9 (2020) 2921
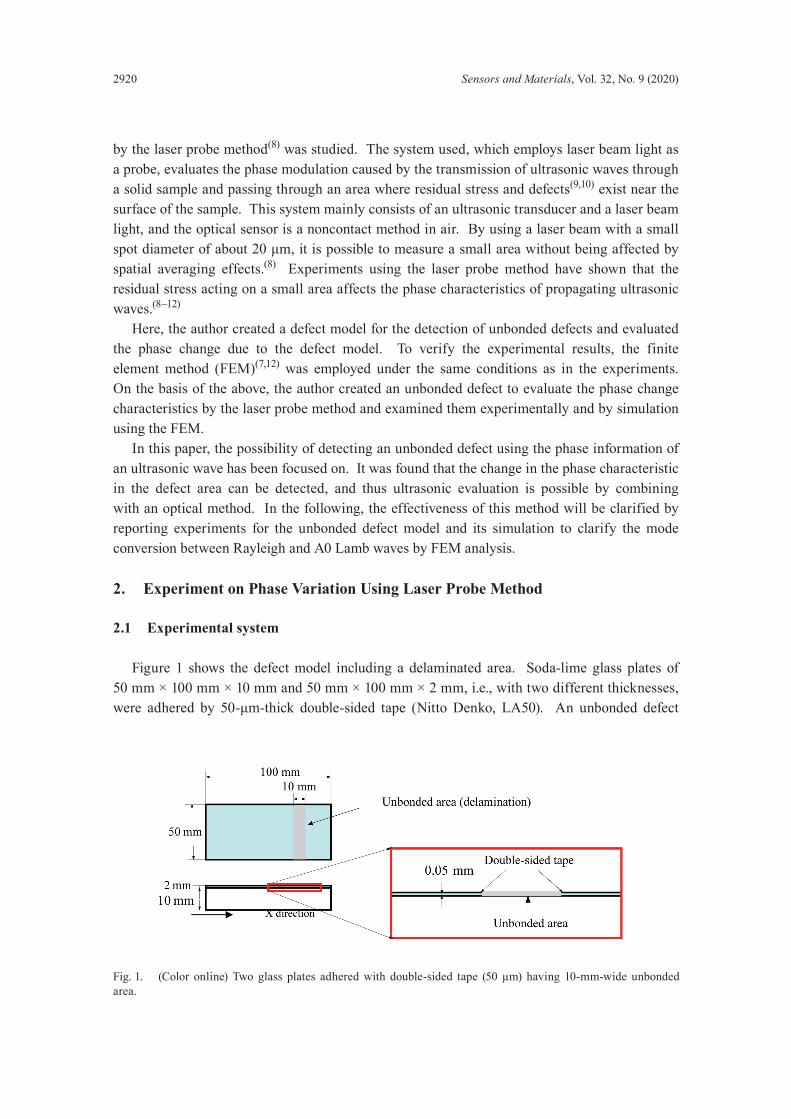
model was created by providing a 10-mm-wide unbonded area (gray shaded area in Fig. 1) between the two glass plates. The laser probe method(8) was used to detect this defect. A piezoelectric ceramic transducer (Fuji Ceramics, M-6) with a resonance frequency of 1 MHz was used. A 1 MHz Rayleigh wave was propagated on the glass sample surface via a high-density polystyrene wedge with oblique incidence to the glass sample surface. As shown in Fig. 2, the measurement started from the wedge tip as the origin (x = 0), and data was acquired from x = 0 mm to around 30 mm with intervals of 0.1 mm. An evaluation was performed using the data. The unbonded defect was from 10 to 20 mm from the origin as indicated in Fig. 2. Twenty cycles of burst sine waves of 10 Vpp were repeatedly generated from a function generator (Agilent, 33522B) with a 10 ms interval (100 Hz). This signal was input to a bipolar amplifier (NF, HSA4101) to amplify the voltage up to 100 V. The spatial length of the Rayleigh burst wave in this case was about 60 mm. A He-Ne laser beam with a diameter of 20 μm was irradiated from the direction perpendicular to the Rayleigh wave propagation direction (x direction) on the glass sample surface onto the unbonded defect as shown in Fig. 2. The reflected laser light was received by an avalanche photodiode (APD) (Hamamatsu Photonics: C5460) used as an optical sensor. Since the Rayleigh wave propagating on the glass sample was affected by the roughness of its surface as well as by internal defects, including unbonded defects, delamination, residual stress associated with defects, and cracks, the irradiated laser beam was phase-modulated. In other words, the reflected laser light collected the Rayleigh wave and the information of the defects, and the information was received by the APD.(8–12) The signal obtained from the APD has information in the form of an ultrasonic time waveform whose intensity is proportional to the sound pressure,(8) and this signal was input to a vector signal analyzer (VSA) (Agilent, 89441A). The input signal was quadrature-detected and the PC converted the time waveform data to the real and imaginary parts of the complex time waveform. The wavelength λ of the above Rayleigh wave of 1 MHz was 2.96 mm, and the unbonded model was located within 2 mm from the surface, that is, the unbonded area was at a “shallow” position with a depth of less than one wavelength.
Fig. 2. (Color online) Experimental arrangement for observing microscale defect using laser probe method.
2922 Sensors and Materials, Vol. 32, No. 9 (2020)
2.2 Experimental results
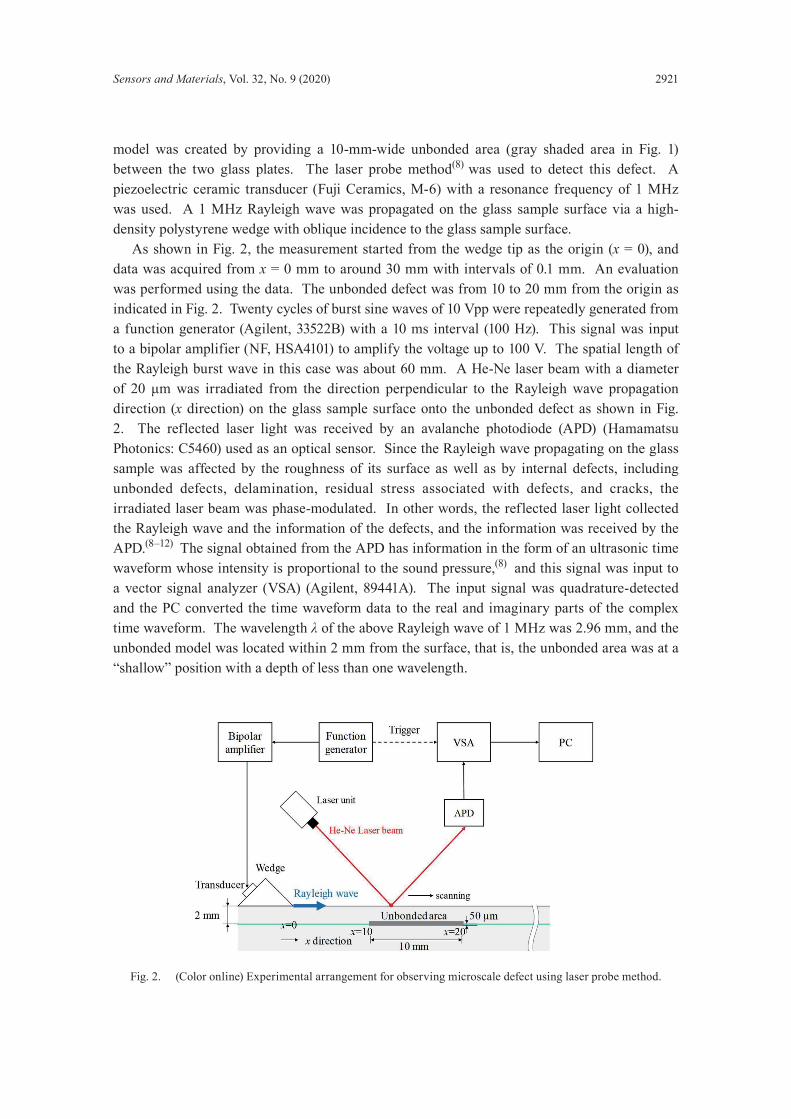
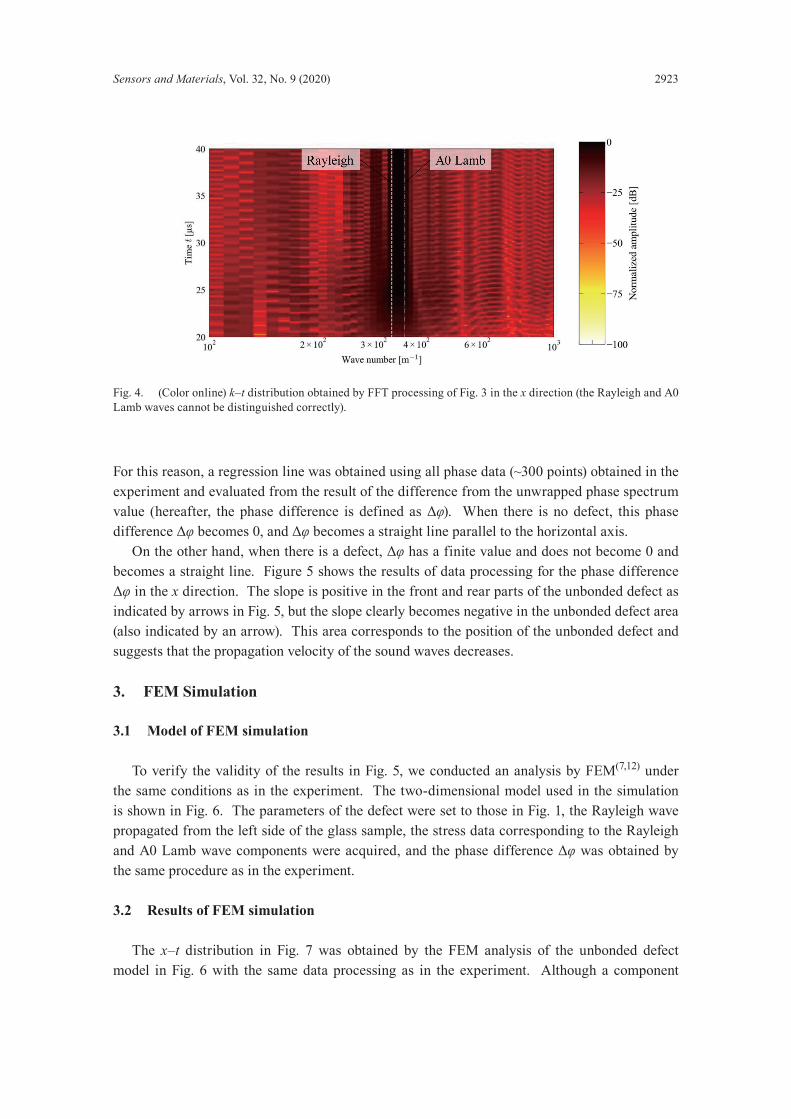
Figure 3 shows the time waveforms obtained from the VSA, which are shown for each He-Ne laser irradiation measurement position. In this x–t contour diagram, the time t and distance x are plotted on the vertical and horizontal axes, respectively. Since a time delay occurs as the Rayleigh wave propagates in the x direction, the part of the burst signal with a large amplitude (the dark band in Fig. 3) is going up to the right direction. When there is reflection from the defect, a component that goes to the upper left is observed in the negative direction of x. The reflected wave, however, cannot be observed in the unbonded model as indicated in Fig. 3. The position from x = 10 to 20 mm in this distribution (the gray shaded part in the figure) corresponds to the unbonded defect area, but the reflected wave from the defect cannot be detected and the defect cannot be detected from the amplitude information. To detect the unbonded defect from the same time amplitude information by phase measurement, the change in the time amplitude of the wave number spectrum in the x-direction was Fourier-transformed to Fig. 3. The results are shown in Fig. 4. In the figure, since the Fourier transform is performed in the x direction, the horizontal axis is converted to the wave number (1/λ, λ: wavelength). The wave number spectra of the Rayleigh and A0 Lamb waves almost overlap. On the other hand, Fig. 3 was Fourier-transformed in the time t direction, and the phase component of the frequency spectrum and the propagation distance in the x direction were processed. The experiment was performed at 1 MHz, and the phase changed periodically in the range of (−π–+π) for each half wavelength (= 1.98 mm) owing to the phase characteristics of tan−1z(∙). Therefore, the phase spectrum unwrapping process(13–18) was performed. Since the phase of the ultrasonic wave was delayed by the distance propagation of the sound wave, the phase spectrum became a straight line with a falling down to the right. In this experiment, the unbonded defect was located from 10 to 20 mm, but the defect could not be detected from the conventional amplitude of the wave number method as in Figs. 3 and 4.
Fig. 3. (Color online) x–t distribution obtained by laser probe method.
Sensors and Materials, Vol. 32, No. 9 (2020) 2923
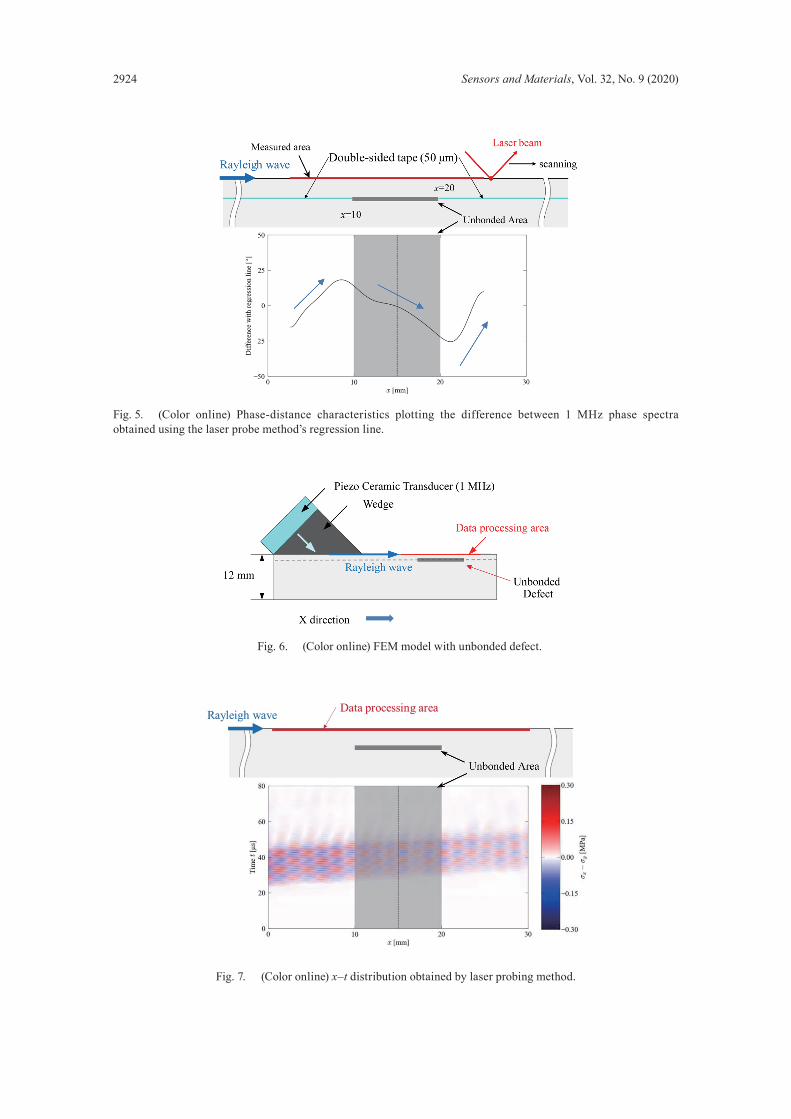
For this reason, a regression line was obtained using all phase data (~300 points) obtained in the experiment and evaluated from the result of the difference from the unwrapped phase spectrum value (hereafter, the phase difference is defined as Δφ). When there is no defect, this phase difference Δφ becomes 0, and Δφ becomes a straight line parallel to the horizontal axis. On the other hand, when there is a defect, Δφ has a finite value and does not become 0 and becomes a straight line. Figure 5 shows the results of data processing for the phase difference Δφ in the x direction. The slope is positive in the front and rear parts of the unbonded defect as indicated by arrows in Fig. 5, but the slope clearly becomes negative in the unbonded defect area (also indicated by an arrow). This area corresponds to the position of the unbonded defect and suggests that the propagation velocity of the sound waves decreases. 3. FEM Simulation
3.1 Model of FEM simulation
To verify the validity of the results in Fig. 5, we conducted an analysis by FEM(7,12) under the same conditions as in the experiment. The two-dimensional model used in the simulation is shown in Fig. 6. The parameters of the defect were set to those in Fig. 1, the Rayleigh wave propagated from the left side of the glass sample, the stress data corresponding to the Rayleigh and A0 Lamb wave components were acquired, and the phase difference Δφ was obtained by the same procedure as in the experiment.
3.2 Results of FEM simulation
The x–t distribution in Fig. 7 was obtained by the FEM analysis of the unbonded defect model in Fig. 6 with the same data processing as in the experiment. Although a component
Fig. 4. (Color online) k–t distribution obtained by FFT processing of Fig. 3 in the x direction (the Rayleigh and A0 Lamb waves cannot be distinguished correctly).
2924 Sensors and Materials, Vol. 32, No. 9 (2020)
Fig. 5. (Color online) Phase-distance characteristics plotting the difference between 1 MHz phase spectra obtained using the laser probe method’s regression line.
Fig. 6. (Color online) FEM model with unbonded defect.
Fig. 7. (Color online) x–t distribution obtained by laser probing method.
Sensors and Materials, Vol. 32, No. 9 (2020) 2925
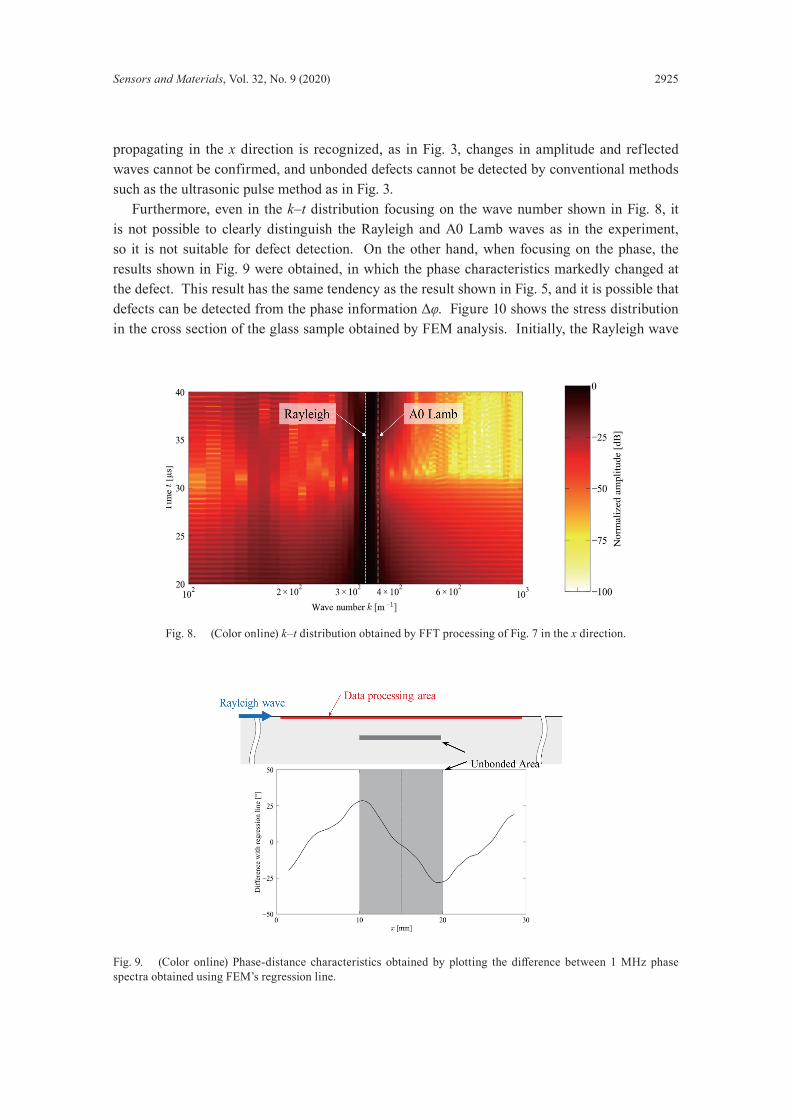
Fig. 8. (Color online) k–t distribution obtained by FFT processing of Fig. 7 in the x direction.
Fig. 9. (Color online) Phase-distance characteristics obtained by plotting the difference between 1 MHz phase spectra obtained using FEM’s regression line.
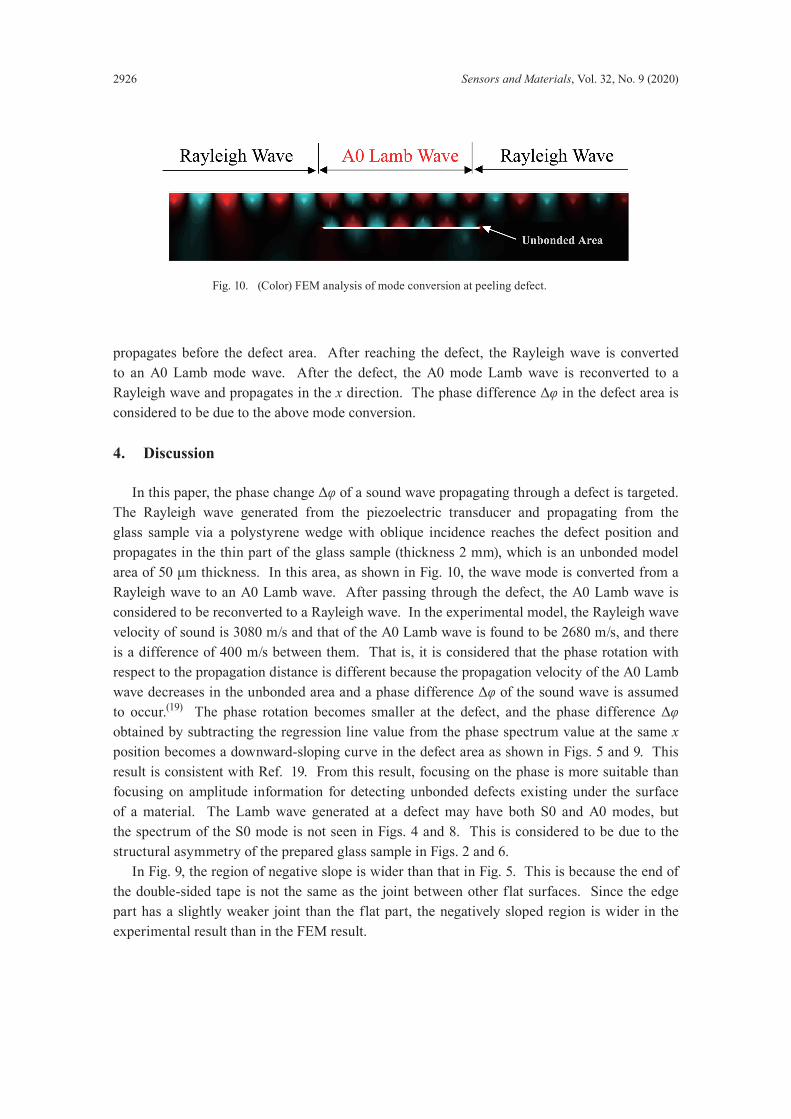
propagating in the x direction is recognized, as in Fig. 3, changes in amplitude and reflected waves cannot be confirmed, and unbonded defects cannot be detected by conventional methods such as the ultrasonic pulse method as in Fig. 3. Furthermore, even in the k–t distribution focusing on the wave number shown in Fig. 8, it is not possible to clearly distinguish the Rayleigh and A0 Lamb waves as in the experiment, so it is not suitable for defect detection. On the other hand, when focusing on the phase, the results shown in Fig. 9 were obtained, in which the phase characteristics markedly changed at the defect. This result has the same tendency as the result shown in Fig. 5, and it is possible that defects can be detected from the phase information Δφ. Figure 10 shows the stress distribution in the cross section of the glass sample obtained by FEM analysis. Initially, the Rayleigh wave
2926 Sensors and Materials, Vol. 32, No. 9 (2020)
propagates before the defect area. After reaching the defect, the Rayleigh wave is converted to an A0 Lamb mode wave. After the defect, the A0 mode Lamb wave is reconverted to a Rayleigh wave and propagates in the x direction. The phase difference Δφ in the defect area is considered to be due to the above mode conversion.
4. Discussion
In this paper, the phase change Δφ of a sound wave propagating through a defect is targeted. The Rayleigh wave generated from the piezoelectric transducer and propagating from the glass sample via a polystyrene wedge with oblique incidence reaches the defect position and propagates in the thin part of the glass sample (thickness 2 mm), which is an unbonded model area of 50 μm thickness. In this area, as shown in Fig. 10, the wave mode is converted from a Rayleigh wave to an A0 Lamb wave. After passing through the defect, the A0 Lamb wave is considered to be reconverted to a Rayleigh wave. In the experimental model, the Rayleigh wave velocity of sound is 3080 m/s and that of the A0 Lamb wave is found to be 2680 m/s, and there is a difference of 400 m/s between them. That is, it is considered that the phase rotation with respect to the propagation distance is different because the propagation velocity of the A0 Lamb wave decreases in the unbonded area and a phase difference Δφ of the sound wave is assumed to occur.(19) The phase rotation becomes smaller at the defect, and the phase difference Δφ obtained by subtracting the regression line value from the phase spectrum value at the same x position becomes a downward-sloping curve in the defect area as shown in Figs. 5 and 9. This result is consistent with Ref. 19. From this result, focusing on the phase is more suitable than focusing on amplitude information for detecting unbonded defects existing under the surface of a material. The Lamb wave generated at a defect may have both S0 and A0 modes, but the spectrum of the S0 mode is not seen in Figs. 4 and 8. This is considered to be due to the structural asymmetry of the prepared glass sample in Figs. 2 and 6. In Fig. 9, the region of negative slope is wider than that in Fig. 5. This is because the end of the double-sided tape is not the same as the joint between other flat surfaces. Since the edge part has a slightly weaker joint than the flat part, the negatively sloped region is wider in the experimental result than in the FEM result.
Fig. 10. (Color) FEM analysis of mode conversion at peeling defect.
Sensors and Materials, Vol. 32, No. 9 (2020) 2927
5. Conclusion
In this paper, mode conversion to an A0 Lamb wave generated by a Rayleigh wave passing over an unbonded defect was evaluated by measuring the phase change. It was shown that it is possible to detect an unbonded defect existing below a surface, which cannot be detected by a conventional method of amplitude and wave number analysis. The FEM analysis performed in this study did not consider the original residual stress in the glass sample or the residual stress during processing. The residual stress is important in determining the sound velocity; however, the distribution and its strength in the glass sample used in the experiment are not known quantitatively. Moreover, the phase characteristics when there is no residual stress and only defects are unclear. Also, in the experiment, the bonding strength between the two pieces of glass and the uniformity could not be controlled, and it is considered that there is a difference between the absolute value of the phase difference and the analysis result. In the future, I would like to examine to what depth this method can detect defects, as well as the size and shape of defects that can be detected.
Acknowledgments
This work was supported by JSPS KAKENHI Grant Number JP19K04404.
References
1 J. K Itasaka, R. Tanaka, and T. Nagai, Proc. Thermal and Nuclear Power Engineering Soc. (2015) 111 (in Japanese).
2 M. Arai, H. Hayashi, T. Miyake, and T. Uchiyama: Proc. Jpn. Soc. Computational Methods in Engineering 9 (2009) 05-091211 (in Japanese).
3 T. E. Tay: Appl. Mech. Rev. 56 (2003) 1. https://doi.org/10.1115/1.1504848 4 S. Yashiro J, Takatsubo, and N. Toyama: J. Jpn. Soc. Compos. Mater. 34 (2008) 60 (in Japanese). https://doi.
org/10.6089/jscm.34.60 5 T. Hayashi and K. Kawashima: Mech. Eng. J. A 67 (2001) 83 (in Japanese). 6 W. S. Lester: Fundamentals of Ultrasonic Nondestructive Evaluation: A Modeling Approach (Springer; AG
Switzerland, 2016) 2nd ed., Chap. 1. 7 P. Burraseans and S. Callegari, Eds. (Ultrasonic Nondestructive Evaluation System, Springer, Berlin, 2014)
Chaps. 1 and 2. 8 K. Imano: Jpn. J. Opt. 44 (2015) 488 (in Japanese). http://myosj.or.jp/wp-content/themes/osj/download/
kogaku/44-12/07.pdf 9 K.Imano and M. Akatuka: Int. J. Soc. Eng. Resour. 30 (2019) 18 (in Japanese). 10 M. Akatsuka and K. Imano: Int. J. Soc. Eng. Resour. 30 (2019) 18 (in Japanese). 11 K. Imano and M. Akatsuka: Int. J. Soc. Eng. Resour. 30 (2019) 6 (in Japanese). ht tps://doi.
org/10.5188%2Fsjsmerj.30.1_2_18 12 K. Suzuki and K. Imano: J. Acoust. Soc. Jpn. 76 (2020) 203 (in Japanese). 13 T. Khmaladze, T. Estein, and Z. Chen: Opt. Lett. 35 (2010) 1040. https://doi.org/10.1364/OL.35.001040. 14 C. Zuo, L. Huang, M. Zhang, Q. Chen, and A. Asundi: Opt. Laser Eng. 85 (2016) 84. https://doi.org/10.1016/
j.optlaseng.2016.04.022 15 P. L-Szreter, Ed.: Mathematics for Physical Science (De Gruyter Open Ltd., Berlin 2014) Chap. 8. 16 N. Takagi: Introduction of MATLAB (Kogakusha, Tokyo, 2002) (in Japanese). 17 K. Kitagama and I. Mizojiri: Optics 47 (2018) 165 (in Japanese). http://myosj.or.jp/wp-content/themes/osj/
download/kogaku/47-4/08.pdf
2928 Sensors and Materials, Vol. 32, No. 9 (2020)
18 D. C. Ghiglia and M. P. Priff: Optical Metrology (John Eiley and Sons, New York 1998) p. 276. 19 K. Imano: Sens. Mater. 32 (2020) 791. https://doi.org/10.18494/SAM.2020.2659
About the Author
Kazuhiko Imano graduated from Akita University in 1979 and became a research associate in the Department of Electric Engineering at Akita University. He was a visiting researcher at Tohoku University in 1985–1986. He became a lecturer, then an associate professor at Akita University, subsequently becoming a professor in 1997. He received his D.Eng. degree from Tohoku University in 1993. He is a member of the Institute of Electronics, Information and Communication Engineers, Acoustical Society of Japan, Society of Instrument and Control Engineers, Japanese Society for Non-Destructive Inspection, Acoustical Society of America, Institute of Electrical and Electronics Engineers, Society of Materials Engineering for Resources of Japan, and Imaging Society of Japan.