sloreta and fmri detection of medial prefrontal default
TRANSCRIPT
This article was downloaded by: [206.72.201.218]On: 17 January 2013, At: 17:00Publisher: RoutledgeInforma Ltd Registered in England and Wales Registered Number: 1072954 Registered office: Mortimer House,37-41 Mortimer Street, London W1T 3JH, UK
Journal of Neurotherapy: Investigations inNeuromodulation, Neurofeedback and AppliedNeurosciencePublication details, including instructions for authors and subscription information:http://www.tandfonline.com/loi/wneu20
sLORETA and fMRI Detection of Medial PrefrontalDefault Network Anomalies in Adult ADHDRex Cannon a b , Cynthia Kerson c & Adam Hampshire da Clinical Neuroscience, Self-Regulation and Biological Psychology Laboratory, Department ofPsychology, University of Tennessee, Knoxville, Tennessee, USAb Cole Neuroscience Center: Memory Disorders Clinic, University of Tennessee GraduateSchool of Medicine, Knoxville, Tennessee, USAc ISNR Research Foundation, San Rafael, California, USAd Centre for Brain and Mind, Department of Psychology, University of Western Ontario,London, Ontario, CanadaVersion of record first published: 30 Nov 2011.
To cite this article: Rex Cannon , Cynthia Kerson & Adam Hampshire (2011): sLORETA and fMRI Detection of Medial PrefrontalDefault Network Anomalies in Adult ADHD, Journal of Neurotherapy: Investigations in Neuromodulation, Neurofeedback andApplied Neuroscience, 15:4, 358-373
To link to this article: http://dx.doi.org/10.1080/10874208.2011.623093
PLEASE SCROLL DOWN FOR ARTICLE
Full terms and conditions of use: http://www.tandfonline.com/page/terms-and-conditions
This article may be used for research, teaching, and private study purposes. Any substantial or systematicreproduction, redistribution, reselling, loan, sub-licensing, systematic supply, or distribution in any form toanyone is expressly forbidden.
The publisher does not give any warranty express or implied or make any representation that the contentswill be complete or accurate or up to date. The accuracy of any instructions, formulae, and drug doses shouldbe independently verified with primary sources. The publisher shall not be liable for any loss, actions, claims,proceedings, demand, or costs or damages whatsoever or howsoever caused arising directly or indirectly inconnection with or arising out of the use of this material.
RESEARCH ARTICLES
sLORETA AND fMRI DETECTION OF MEDIAL PREFRONTAL DEFAULT NETWORKANOMALIES IN ADULT ADHD
Rex Cannon1,2, Cynthia Kerson3, Adam Hampshire4
1Clinical Neuroscience, Self-Regulation and Biological Psychology Laboratory, Departmentof Psychology, University of Tennessee, Knoxville, Tennessee, USA2Cole Neuroscience Center: Memory Disorders Clinic, University of Tennessee Graduate Schoolof Medicine, Knoxville, Tennessee, USA3ISNR Research Foundation, San Rafael, California, USA4Centre for Brain and Mind, Department of Psychology, University of Western Ontario, London,Ontario, Canada
Attention deficit hyperactivity disorder (ADHD) is a developmental psychiatric disorderthought to affect approximately 5 to 10% of school-age children, of whom 30 to 65% continueto exhibit symptoms into adulthood. The prevalence of ADHD in adults is also an estimated4%, second only to depression. Across studies there appear to be significant network dysfunc-tions involved in ADHD. Typically the foci of interest in ADHD included the insular cortices,frontal lobes, basal ganglia, and cerebellum. More recently, attention has been directed to thedefault network of the brain and its functional integrity in ADHD with focus on the precuneusand parietal lobes and interactions with medial prefrontal cortices. Functional magneticresonance imaging (fMRI) measures neurovascular coupling as measured by the blood oxyge-nated level dependent signal (BOLD). Electroencephalogram (EEG) measures brain electricalinformation. Because fMRI is an indirect measure of neuronal activity and EEG is a direct mea-sure, combining the results from these two imaging modalities under the same task conditionsmay provide a more complete story as to the what (EEG) and where (fMRI) activity exists. Thisarticle discusses the benefits of using standardized low resolution electromagnetic tomography(sLORETA) analysis of the EEG as compared to fMRI. The goal of the study, the data from whichwe use for our justification, was to discover the functional differences in ADHD and non-ADHDbrains with different brain imaging modalities. We hoped to elucidate functional connectivitypatterns by interpreting the data acquired with the EEG using sLORETA and the data acquiredwith the fMRI scans. We further hoped to find correlation with the sLORETA and fMRI interpre-tations so as to confirm that EEG is an adequate stand-alone methodology to evaluate ADHD.Participants included 6 ADHD and 7 non-ADHD subjects. They were initially interviewed byphone and administered the Connors Rating Scale and theMini International NeuropsychiatricInterview to determine accuracy of symptom reporting and to rule out psychological comorbid-ities. Exclusion criteria consisted of previous head trauma, recent drug or alcohol abuse(14 days), or neurological syndromes. We recorded sequential 19-channel EEG and fMRI dur-ing the eyes-open and eyes-closed states and while performing the Stroop test. The QEEGresults were evaluated with comparison to a normative database and with sLORETA analysis.
Received 1 August 2011; accepted 24 August 2011.This study was partially funded by the ISNR Research Foundation, the Hubbard Foundation, Mitsar, Ltd and NovaTech EEG. We
thank Dr. David Hubbard of the Hubbard Foundation for the use of the fMRI scanner at no cost, Dr. Leslie Sherlin of NovaTech EEGand Mitsar International for the loan of the Mitsar 202 and WinEEG training, and the ISNR Research Foundation for providing fundsfor organizational and technical aspects of this study.
Address correspondence to Cynthia Kerson, PhD, ISNR Research Foundation, 1925 Francisco Boulevard, E #12, San Rafael,CA 94901, USA. E-mail: [email protected]
Journal of Neurotherapy, 15:358–373, 2011Copyright # Taylor & Francis Group, LLC
ISSN: 1087-4208 print=1530-017X online
DOI: 10.1080/10874208.2011.623093
358
Dow
nloa
ded
by [
206.
72.2
01.2
18]
at 1
7:00
17
Janu
ary
2013

Functional connectivity was assessed using the seed-based approach in sLORETA. The fMRIresults were evaluated using Brain VoyagerTM and other neuroimaging software packages.sLORETA and fMRI data identify a region in medial Brodmann Area (BA) 10 of the default net-work. Furthermore, regional frontal differences extend to medial BA 32 with more emphasis toleft prefrontal. sLORETA determines there is less current source density at BA 10 in the ADHDparticipants than controls. sLORETA is adequate in localizing the sources of the EEG in thedefault network as contrasted with fMRI. It is important to note that sLORETA can provideimportant information about the direction of difference relative to the BOLD signal increase,which cannot be done with the fMRI alone.
INTRODUCTION
This study aimed to determine if the standar-dized low-resolution electromagnetic tomogra-phy (sLORETA) current source density (LCSD)levels in the default mode network (DMN)would correspond to other neuroimaging tech-niques, with the implication that differentialchanges in LCSD would occur relative to taskcondition. Functional magnetic resonanceimaging (fMRI) offers increased spatial resol-ution, whereas an electroencephalogram(EEG) offers unsurpassed temporal resolutionand a direct measure of neuronal activity (Hu,Stead, Dai, & Worrell, 2010). Through use ofthe inverse solution methodology, sLORETAmelds both and advises brain activity from atemporal and spatial perspective, providing amuch more comprehensive view (Pascual-Marqui, 2002; Pascual-Marqui, Michel, &Lehmann, 1994) and has received considerablevalidation from studies combining it with moreestablished localization methods, includingfMRI (Mulert et al., 2004; Vitacco, Brandeis,Pascual-Marqui, & Martin, 2002). However,localization of EEG current source density levelsin the default network has not been contrastedwith fMRI validation.
The original version of LORETA has under-gone extensive validation by independentlaboratories, including mathematical proofs(Sekihara, Sahani, & Nagarajan, 2005; Wagner,Fuchs, & Kastner, 2004). This method finds aparticular solution to the nonunique EEGinverse problem by assuming similar activationof neighboring neuronal sources, followed byan appropriate standardization of the currentdensity, producing images of electric neuronal
activity without localization bias (Greenblatt,Gan, Harmatz, & Shader, 2005; Pascual-Marqui, 2002; Sekihara et al., 2005).
Attention deficit hyperactivity disorder(ADHD) is a developmental psychiatric disorderthought to affect approximately 5 to 10% ofschool-age children (Faraone, Sergeant,Gillberg, & Biederman, 2003), of whom 30 to65% continue to exhibit symptoms into adult-hood (Faraone, Biederman, & Mick, 2006).Individuals with ADHD exhibit tendenciestoward reduced educational outcomes and anincreased incidence of comorbid psychiatricsyndromes, including substance abuse,antisocial behavior, anxiety, and depression(Spencer, Biederman, & Mick, 2007). Theetiology of ADHD and exact neurological sub-strates are currently unknown; in addition, theinteractions between genetics and environ-mental influences are still unclear. However,across studies there appear to be significant net-work disruptions involved in ADHD.
Recently, the default network of the brain(DMN) has gained growing interest in ADHD(Tian et al., 2008; Zang et al., 2007). TheDMN consists of functionally related regions(Table 1) that are consistently shown increasedin activity during rest with the eyes closed ascompared to functionally specific cognitivetasks or the eyes-opened resting condition(Shulman et al., 1997; Shulman et al., 1999;Shulman, Schwarz, Miezin, & Petersen, 1998).The DMN is synonymous with resting state net-work; however, the resting state network hasbeen suggested to include numerous networksof functionally connected neuronal assemblies(Damoiseaux et al., 2008; Damoiseaux et al.,2006; Fransson et al., 2007). It is important to
DETECTION OF DEFAULT NETWORK ANOMALIES 359
Dow
nloa
ded
by [
206.
72.2
01.2
18]
at 1
7:00
17
Janu
ary
2013
note that the DMN is not to be confused withnetworks of executive attention or networksassociated with monitoring attention and thephysical body (Buckner, Andrews-Hanna, &Schacter, 2008). Recent work by Fair andcolleagues (2008) have demonstrated that thebrain’s DMN exhibits less functional connectiv-ity in children than in adults. The DMN isproposed to support such core functions astheory of mind, self-related activities such asautobiographical self, stimulus independentthought, self-projection, self-reference andintrospective processes (Fair et al., 2008).
Concerning ADHD the DMN, insularcortices, frontal lobes, basal ganglia, and cere-bellum are foci of interest with a more recentinterest directed to the precuneus and parietallobes and their interactions with anterior cingu-late and medial prefrontal cortices (Castellanos,2001; Castellanos & Acosta, 2002; Castellanos,Glaser, & Gerhardt, 2006; Castellanos et al.,2008). Functional neuroimaging investigationsof brain activation patterns in ADHD inresponse to cognitively demanding tasks havefrequently been used. These studies haveshown that differences in cognitive controlbetween subjects with and without ADHD areassociated with differences in brain activationpatterns (Bush et al., 1999; Bush et al., 2002;Durston, 2003; Durston et al., 2003; Rubia,2002; Rubia et al., 2001; Rubia, Smith, Taylor,& Brammer, 2007). In particular, reduced acti-vation in prefrontal areas and linked decreasesin the recruitment of the subcortical striatal
regions during actions that require subjects toinhibit (or self-regulate) responses as part ofthe task, such as in the go=no-go or Stroop tasks(Bush et al., 1999; Rubia, 2002; Zang et al.,2005). This research paradigm has also demon-strated the anterior cingulate gyrus to be lessresponsive in ADHD populations as comparedto controls and has led to the suggestion thatthese regional deficits are central to ADHD(Bush, Valera, & Seidman, 2005).
Neuroimaging studies have also investi-gated behavioral control, attention, mentalrotation, and employed tasks thought to beassociated with motivated behavior, such asreward anticipation tasks (Konrad, Neufang,Hanisch, Fink, & Herpertz-Dahlmann, 2006;Scheres, Milham, Knutson, & Castellanos,2007; Silk et al., 2005). The results confirmdeficits in striatal and prefrontal activation, aswell as changes in activation in parietal areas.The general findings emphasize the importanceof fronto-striatal networks in ADHD. Althoughthere is no definitive physiological model ofADHD, further evidence for fronto-striatalimpairment in this population comes from theresearch into stimulant medications as well asanimal models of hyperactivity that implicatedopamine pathways associated with theseregions (Gainetdinov et al., 1999). This path-way is proposed to be heavily involved insaliency, reward, learning, and decipheringcues for motivation to appropriate behavior,among other things, all relevant dysregulationin the ADHD brain.
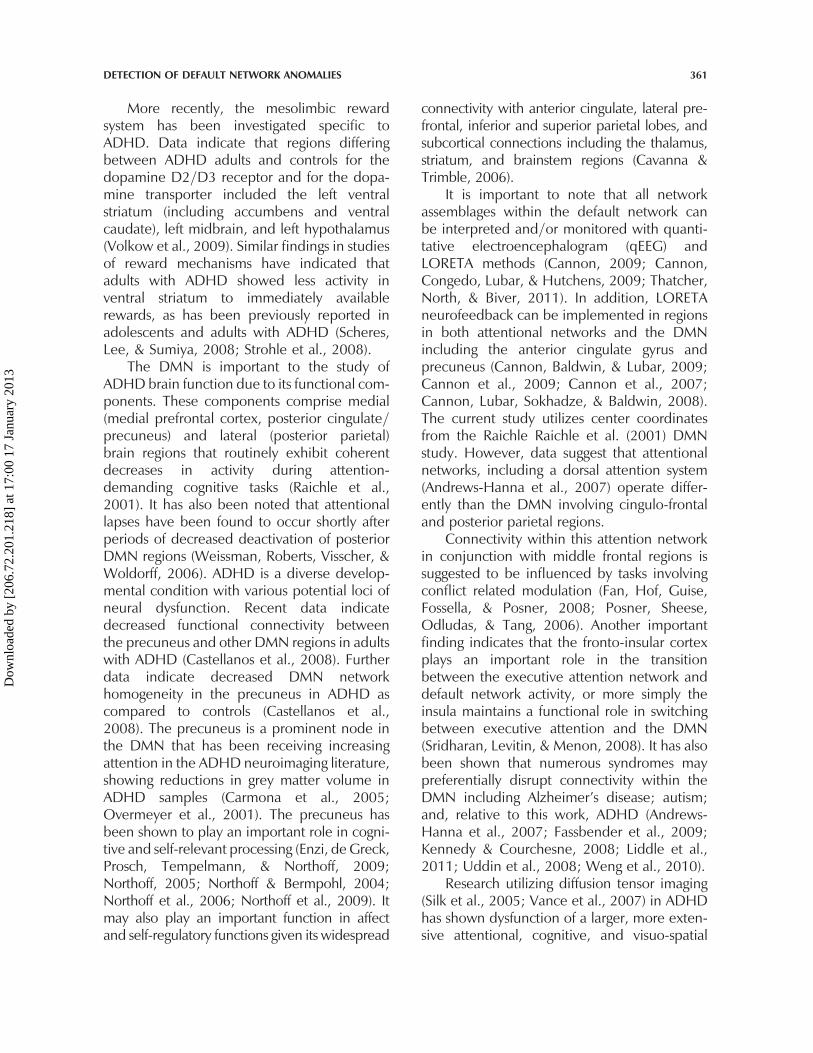
TABLE 1. sLORETA=Montreal Neurological Institute Coordinates for Default NetworkRegions (Raichle et al., 2001)
Orientation brodmann area X Y Z Neuroanatomical label
(1) Medial 31=7 �5 �49 40 Dorsal Posterior Cingulate=Precuneus(2) Left 40 �53 �39 42 Parietal lobe=supramarginal gyrus(3) Left 39=19 �45 �67 36 Angular gyrus(4) Right 40 45 �57 34 Parietal Lobe=supramarginal gyrus(5) Left lateral 8 �27 27 40 Frontal eye fields(6) Right 8=9 5 49 36 Frontal lobes(7) Left 9 �15 55 26 Dorsolateral prefrontal cortex(8) Left 10 �19 57 8 Anterior prefrontal cortex(9) Medial 10 �1 47 �4 Middle frontal lobe(10) Left 10=47 �33 45 �6 Inferior frontal lobe(11) Medial 32 3 31 �10 Anterior cingulate(12) Left 20 �49 �19 �18 Inferior temporal gyrus
360 R. CANNON ET AL.
Dow
nloa
ded
by [
206.
72.2
01.2
18]
at 1
7:00
17
Janu
ary
2013
More recently, the mesolimbic rewardsystem has been investigated specific toADHD. Data indicate that regions differingbetween ADHD adults and controls for thedopamine D2=D3 receptor and for the dopa-mine transporter included the left ventralstriatum (including accumbens and ventralcaudate), left midbrain, and left hypothalamus(Volkow et al., 2009). Similar findings in studiesof reward mechanisms have indicated thatadults with ADHD showed less activity inventral striatum to immediately availablerewards, as has been previously reported inadolescents and adults with ADHD (Scheres,Lee, & Sumiya, 2008; Strohle et al., 2008).
The DMN is important to the study ofADHD brain function due to its functional com-ponents. These components comprise medial(medial prefrontal cortex, posterior cingulate=precuneus) and lateral (posterior parietal)brain regions that routinely exhibit coherentdecreases in activity during attention-demanding cognitive tasks (Raichle et al.,2001). It has also been noted that attentionallapses have been found to occur shortly afterperiods of decreased deactivation of posteriorDMN regions (Weissman, Roberts, Visscher, &Woldorff, 2006). ADHD is a diverse develop-mental condition with various potential loci ofneural dysfunction. Recent data indicatedecreased functional connectivity betweenthe precuneus and other DMN regions in adultswith ADHD (Castellanos et al., 2008). Furtherdata indicate decreased DMN networkhomogeneity in the precuneus in ADHD ascompared to controls (Castellanos et al.,2008). The precuneus is a prominent node inthe DMN that has been receiving increasingattention in the ADHD neuroimaging literature,showing reductions in grey matter volume inADHD samples (Carmona et al., 2005;Overmeyer et al., 2001). The precuneus hasbeen shown to play an important role in cogni-tive and self-relevant processing (Enzi, de Greck,Prosch, Tempelmann, & Northoff, 2009;Northoff, 2005; Northoff & Bermpohl, 2004;Northoff et al., 2006; Northoff et al., 2009). Itmay also play an important function in affectand self-regulatory functions given its widespread
connectivity with anterior cingulate, lateral pre-frontal, inferior and superior parietal lobes, andsubcortical connections including the thalamus,striatum, and brainstem regions (Cavanna &Trimble, 2006).
It is important to note that all networkassemblages within the default network canbe interpreted and=or monitored with quanti-tative electroencephalogram (qEEG) andLORETA methods (Cannon, 2009; Cannon,Congedo, Lubar, & Hutchens, 2009; Thatcher,North, & Biver, 2011). In addition, LORETAneurofeedback can be implemented in regionsin both attentional networks and the DMNincluding the anterior cingulate gyrus andprecuneus (Cannon, Baldwin, & Lubar, 2009;Cannon et al., 2009; Cannon et al., 2007;Cannon, Lubar, Sokhadze, & Baldwin, 2008).The current study utilizes center coordinatesfrom the Raichle Raichle et al. (2001) DMNstudy. However, data suggest that attentionalnetworks, including a dorsal attention system(Andrews-Hanna et al., 2007) operate differ-ently than the DMN involving cingulo-frontaland posterior parietal regions.
Connectivity within this attention networkin conjunction with middle frontal regions issuggested to be influenced by tasks involvingconflict related modulation (Fan, Hof, Guise,Fossella, & Posner, 2008; Posner, Sheese,Odludas, & Tang, 2006). Another importantfinding indicates that the fronto-insular cortexplays an important role in the transitionbetween the executive attention network anddefault network activity, or more simply theinsula maintains a functional role in switchingbetween executive attention and the DMN(Sridharan, Levitin, & Menon, 2008). It has alsobeen shown that numerous syndromes maypreferentially disrupt connectivity within theDMN including Alzheimer’s disease; autism;and, relative to this work, ADHD (Andrews-Hanna et al., 2007; Fassbender et al., 2009;Kennedy & Courchesne, 2008; Liddle et al.,2011; Uddin et al., 2008; Weng et al., 2010).
Research utilizing diffusion tensor imaging(Silk et al., 2005; Vance et al., 2007) in ADHDhas shown dysfunction of a larger, more exten-sive attentional, cognitive, and visuo-spatial
DETECTION OF DEFAULT NETWORK ANOMALIES 361
Dow
nloa
ded
by [
206.
72.2
01.2
18]
at 1
7:00
17
Janu
ary
2013
network that involves frontal, striatal, andparietal areas. The authors proposed, in agree-ment with others, that network integrity is offundamental importance for attentional andcognitive control (Mesulam, 1990). The impor-tant network assemblages of significance wereidentified in the white matter underlyingright occipito-parietal cortex, left inferiorfrontal cortex=striatum, and left inferior tem-poral regions. Connectivity nearing statisticalsignificance was also reported in white matterunderlying the right and left inferior parietalregions (Silk, Vance, Rinehart, Bradshaw, &Cunnington, 2009).
We hypothesized that sLORETA wouldaccurately localize the statistically significantsource that corresponds with the fMRI signal(or activation) difference between adults withADHD and controls. FMRI advises the differ-ence in blood oxygen levels between rest andtask states. However, this difference can meanmore than one thing. For example, if there is lit-tle change in activation between both states, itcould either mean low activation during task oran elevated (hypervigilant) resting state. Con-versely a large difference in activity could meanthe subject is overactivated (utilizing greaterenergy resources) during the task state or themechanisms seen in a healthy DMN are notpresent in the ADHD brain. Thus, the shift inenergy can be defined as under- or overarousalin the correct state (rest or task). Furthermore,the frequency of the current source densitymay explain the origin of the EEG activity. Thecurrent study examined the BOLD and LCSDin the DMN during eyes-open resting.
METHODS
A study, recently completed by Cynthia Kersonand her colleagues was performed at theApplied fMRI Institute in San Diego,California. Subjects were interviewed viaphone or Skype following a script that ruledout suicidal ideation, traumatic brain injury,medication intake other than stimulants (whichwere ceased 3 days prior to the examination),claustrophobia, pregnancy, nonambulatoryaccess, schizophrenia or other Axis III disorder,
and=or metal implants and verbally respondedto the Mini International NeuropsychiatricInterview questionnaire (Dunbar, 1998), forinclusion into the ADHD or non-ADHD group.The participants also completed the ConnorsAdult ADHD Rating Scale Self-Report ShortVersion (CAARS-SS; Conners et al., 1999).
The participants were screened using aquestionnaire specific to ADHD symptomologyduring the initial interview. The answer scale isnever, rarely, sometimes, often, and very often.Should the subject answer mostly often or veryoften to these six questions, he or she wouldbe admitted into the study as an ADHD subject(following congruent results on the CAARS).Conversely, those who answered mostly neveror rarelywould be included in the control group.
The verbally administered Mini Inter-national Neuropsychiatric Interview instrumentwas intended to rule out comorbid disorders,including major depressive disorder, mania,panic disorder, obsessive-compulsive disorder,social phobia, psychotic disorders, includingschizophrenia, posttraumatic stress disorder,anorexia or bulimia, antisocial personalitydisorder, and=or other mood disorder withpsychotic features. Alcohol or psychoactivesubstance abuse or dependence is also usuallyquestioned during this interview, but we didnot include those questions as they posed ethi-cal issues. Two ADHD subjects reported historyof mild depression and one reported anxiety,although neither was medicated. We acceptedthese subjects because they were not medicatedand symptoms were not current. None of thecontrols reported symptoms from any of theaforementioned disorders during this interview.
There are 26 questions on the CAARS-SSthat distinguish non-ADHD adults from ADHDadults. The answer scale is 0 (not at all, never),1 (just a little, once in a while), 2 (pretty much,often), and 3 (very much, very frequently), andthe answers result in scaling for inattention=memory problems, hyperactivity, restlessness,impulsivity and emotional lability, problemswith self–concept, and an overall ADHD index.The six ADHD adults in this study had an aver-age of 21.5 on the overall ADHD index (92percentile; raw score was 22.33 for the women
362 R. CANNON ET AL.
Dow
nloa
ded
by [
206.
72.2
01.2
18]
at 1
7:00
17
Janu
ary
2013
[97 percentile] and 20.66 for the men [87percentile]). This is contrasted by the averageoverall ADHD index of 10.5 for controls(41.14 percentile; 10.4 for the women [52 per-centile] and 7 for the men [25.66 percentile]).
Twenty-four potential subjects wererecruited through local practitioners andChildren and Adults With Attention DeficitHyperactivity Disorder. Of these, 10 non-ADHD and 9 ADHD subjects were recruited.Of the five who were excluded, three reportedcurrent major depressive disorder and were onselective serotonin re-uptake inhibitors, onereported recent history of suicide attempt,and one did not want to participate withoutpay. However, three non-ADHD recruitedsubjects did not complete the study (onebecame anxious in the MRI scanner, one can-celled due to time constraints, and one wasphysically unsuited), and three recruitedADHD subjects were disqualified (two becameanxious in the scanner and the third rescindedconsent after completing both the fMRI andEEG sections of the evaluation). Therefore,the total participants were seven non-ADHDand six ADHD adults. All participants in thisstudy were right-handed. After signing theinformed consent, each participant first under-went a qEEG or fMRI scan, depending upon arandom assignment, and then proceeded tothe respective imaging or qEEG device.
QEEG is the procedure in which the brain’selectrical processes are recorded. QEEG com-prises computerized imaging and statistical pro-cedures to aid in the detection of abnormalpatterns often associatedwith specific pathologi-cal conditions. It is a direct and reliable signatureof neural activity and provides ideal temporalresolution in the millisecond time domain(Coburn et al., 2006; Hughes & John, 1999).
The subjects were seated in a quiet roomaway from any telephones and other ordinaryoffice noise. Their scalps were prepped withNuPrep and alcohol to clean and abrade theskin at the 19 electrode sites as designated bythe 10=20 international system (Jasper, 1958)and linked-ear reference. The subjects werethen fitted with a spandex cap (ElectroCapInternational, Eaton, OH, USA) that contains
electrodes at the 10=20 sites, aligning theelectrodes to the proper locations on the scalp.The subjects were briefly educated on artifactproduction and contamination (e.g., how thesignal compared when calm and relaxed toduring eye blinks and saccades and whenshoulder, facial, and=or neck tension persisted)and asked to remain quiet and still during therecording session. The participants completed5-min eyes-closed and eyes-opened restingbaselines. ERP procedures were also conduc-ted using the Stroop task; however, theseresults are not presented in this work.
EEG recordings were acquired using theMitsar 202 (Mitsar Ltd, St. Petersburg, Russia)amplifier system. The EEG was sampled by24-bit AD converter at 250 samples per second,and the low and high pass filters were set at 0.0and 50.0Hz, respectively. Data were acquiredusing the WinEEG acquisition program. Datawere then transported into the Eureka software(NovaTech EEG, Mesa, AZ, USA), where it wasplotted and carefully inspected using manualartifact-rejection. All episodic artifacts includingeye blinks, eye movements, jaw clenching,body movements, or electrocardiogram (EKG)artifact were removed from the EEG stream.
The fMRI scanner was a Siemens 3 T TimTrio. The images were collected every 2 s. Thescanner employed Syngo B15 software withthe BOLD fMRI and Neuro3D packages. TheRF transmitter contains one 35 kW narrowbandRF transmitter and one 8 kW broadband RFtransmitter. Its gradient strength=slew strengthis �mTIM=� 200 T=(m�2) with 32 receiverchannels. The stimuli delivery system was anAvotec Silent Scan 3100 research audio systemand NEC NP 4000, XGA 1280� 768 rear pro-jection system. A luminit 75� diffuse screenand Presentation software were used for thetask presentation. A fiber optic keypad wasused for participant responses.
Each subject was instructed about the tasksthey were to perform in the scanner. In thiscase, the FANTAB Neuropsychological Batterywas used, which is a version of the CANTAB(Cambridge, England) Neuropsychological TestBattery that is fashioned to work in the scan-ner. After task instruction, the subject changed
DETECTION OF DEFAULT NETWORK ANOMALIES 363
Dow
nloa
ded
by [
206.
72.2
01.2
18]
at 1
7:00
17
Janu
ary
2013
into hospital scrubs. They were covered with ablanket and fitted for the head-motion cage.The keypad was positioned to their dominanthand. They were shuttled into the scanner,given time to acclimate, and began withcross-hair fixation to be used as the baselinecomparator to the tasks, followed by the FAN-TAB battery. At the end they remained still,listening to music for 12min to record theindividual anatomical aspects of their brain. AT1-weighted anatomical image was alsoacquired for registration purposes (MP-RAGE,TR¼ 2500 ms; TE¼ 4.35 ms; TI¼ 900 ms; Flipangle¼ 8; 176 slices; FOV¼ 256mm).
STROOP Observations
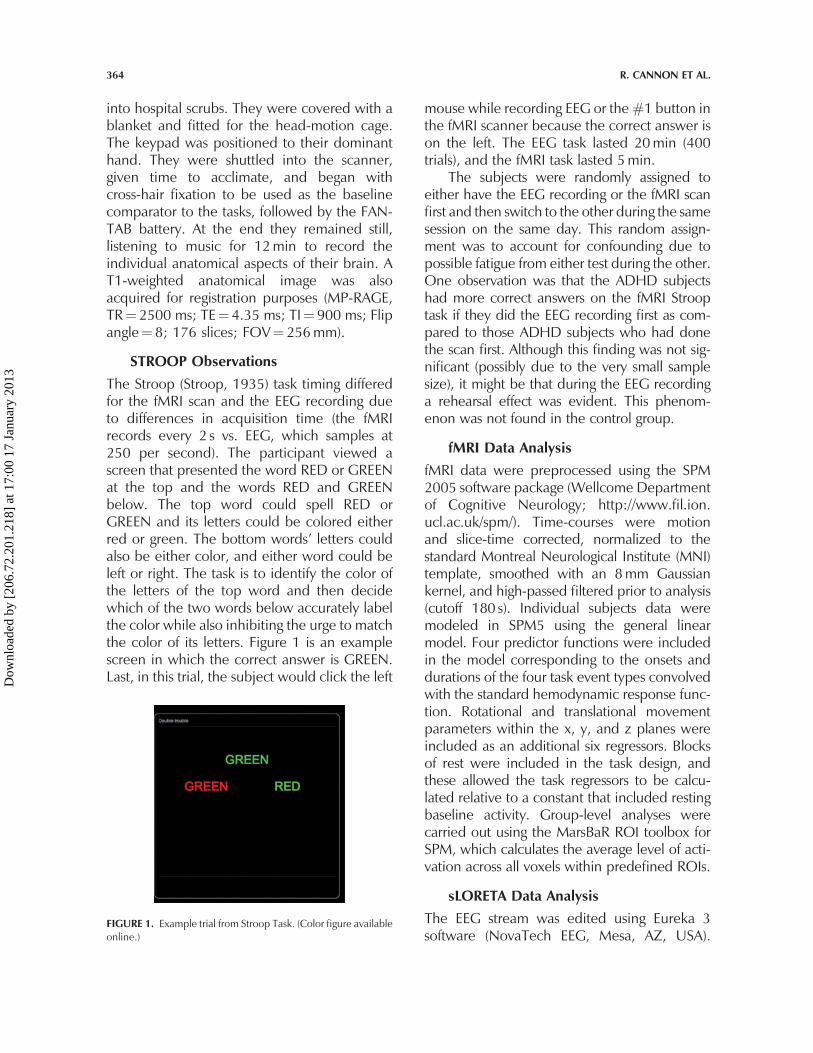
The Stroop (Stroop, 1935) task timing differedfor the fMRI scan and the EEG recording dueto differences in acquisition time (the fMRIrecords every 2 s vs. EEG, which samples at250 per second). The participant viewed ascreen that presented the word RED or GREENat the top and the words RED and GREENbelow. The top word could spell RED orGREEN and its letters could be colored eitherred or green. The bottom words’ letters couldalso be either color, and either word could beleft or right. The task is to identify the color ofthe letters of the top word and then decidewhich of the two words below accurately labelthe color while also inhibiting the urge to matchthe color of its letters. Figure 1 is an examplescreen in which the correct answer is GREEN.Last, in this trial, the subject would click the left
mouse while recording EEG or the#1 button inthe fMRI scanner because the correct answer ison the left. The EEG task lasted 20min (400trials), and the fMRI task lasted 5min.
The subjects were randomly assigned toeither have the EEG recording or the fMRI scanfirst and then switch to the other during the samesession on the same day. This random assign-ment was to account for confounding due topossible fatigue from either test during the other.One observation was that the ADHD subjectshad more correct answers on the fMRI Strooptask if they did the EEG recording first as com-pared to those ADHD subjects who had donethe scan first. Although this finding was not sig-nificant (possibly due to the very small samplesize), it might be that during the EEG recordinga rehearsal effect was evident. This phenom-enon was not found in the control group.
fMRI Data Analysis
fMRI data were preprocessed using the SPM2005 software package (Wellcome Departmentof Cognitive Neurology; http://www.fil.ion.ucl.ac.uk/spm/). Time-courses were motionand slice-time corrected, normalized to thestandard Montreal Neurological Institute (MNI)template, smoothed with an 8mm Gaussiankernel, and high-passed filtered prior to analysis(cutoff 180 s). Individual subjects data weremodeled in SPM5 using the general linearmodel. Four predictor functions were includedin the model corresponding to the onsets anddurations of the four task event types convolvedwith the standard hemodynamic response func-tion. Rotational and translational movementparameters within the x, y, and z planes wereincluded as an additional six regressors. Blocksof rest were included in the task design, andthese allowed the task regressors to be calcu-lated relative to a constant that included restingbaseline activity. Group-level analyses werecarried out using the MarsBaR ROI toolbox forSPM, which calculates the average level of acti-vation across all voxels within predefined ROIs.
sLORETA Data Analysis
The EEG stream was edited using Eureka 3software (NovaTech EEG, Mesa, AZ, USA).
FIGURE 1. Example trial from Stroop Task. (Color figure availableonline.)
364 R. CANNON ET AL.
Dow
nloa
ded
by [
206.
72.2
01.2
18]
at 1
7:00
17
Janu
ary
2013
EEG resampling was obtained by means ofnatural cubic spline interpolation, as the EEGis a continuous signal constituted by oscillationof potential differences over time. All active taskconditions and baseline data were processedwith particular attention given to the frontaland temporal leads. All episodic eye blinks,eye movements, teeth clenching, jaw tension,body or neck movements, and possible EKGwere removed from the EEG stream. Fouriercross-spectral matrices were then computedand averaged over 75% overlapping four-second artifact-free epochs, which resulted inone cross-spectral matrix for each subject foreach discrete frequency. The EEG data wereanalyzed utilizing the following frequencydomains: delta (0.5–3.5Hz), theta (3.5–7.5Hz), alpha 1 (7.5–10.0Hz), alpha 2 (10.0–12.0Hz), and beta (12.0–32.0Hz).
To assess the electrophysiological differ-ences between groups, sLORETA was employedto localize the generators of the scalp EEG powerspectra. The sLORETA solution space is restric-ted to the cortical gray matter in the digitizedMNI atlas with a total of 6,239 voxels at 5mmspatial resolution (Pascual-Marqui, 2002;Pascual-Marqui, Esslen, Kochi, & Lehmann,2002). The average common reference wascomputed prior to the sLORETA estimations.The calculated tomographic sLORETA imagescorrespond to the estimated neuronal genera-tors of brain activity within each frequencydomain (Frei et al., 2001). This procedureresulted in one 3D sLORETA image for eachsubject for each frequency range.
To evaluate the DMN regions betweengroups a region of interest (ROI) file with theMNI coordinates for the 12 seed points for theDMN regions was constructed (see Table 1).Each of the ROI values consisted of the currentsource density levels from each ROI seed andone single voxel (its nearest neighbor) for totalvoxel size 10mm3. The resulting file producedlog transformed average current source densityacross multiple EEG segments for all subjectsfor each seed (ROI). These data were organizedinto Microsoft Excel spreadsheets and thenentered into SPSS 19 for analysis. Secondaryanalysis examined differences between groups
across the whole brain. sLORETA images corre-sponding to the estimated neuronal generatorsof brain activity within each given frequencyrange were calculated (Frei et al., 2001). Thisprocedure resulted in one 3D sLORETA imagefor each subject for each frequency range. Thesignificance threshold was based on a randomi-zation test utilizing 5000 data randomizations.The mean current density for all frequenciesbetween groups was compared and t valuesplotted onto a MRI template.
RESULTS
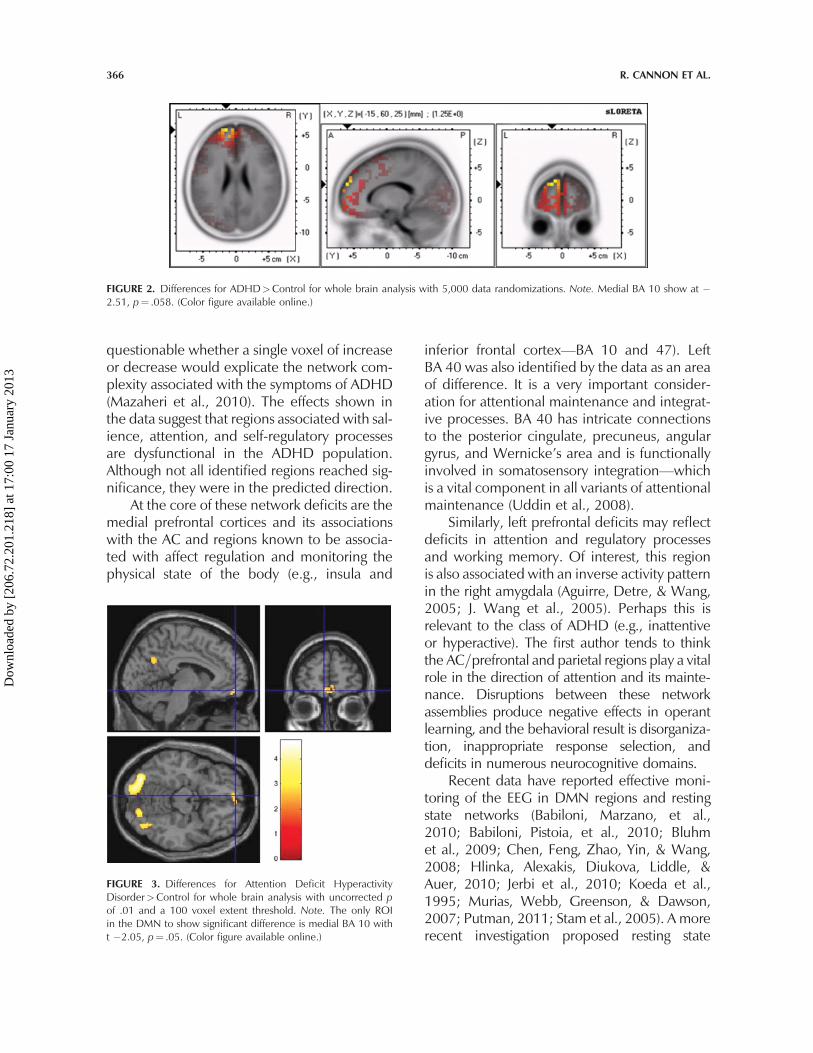
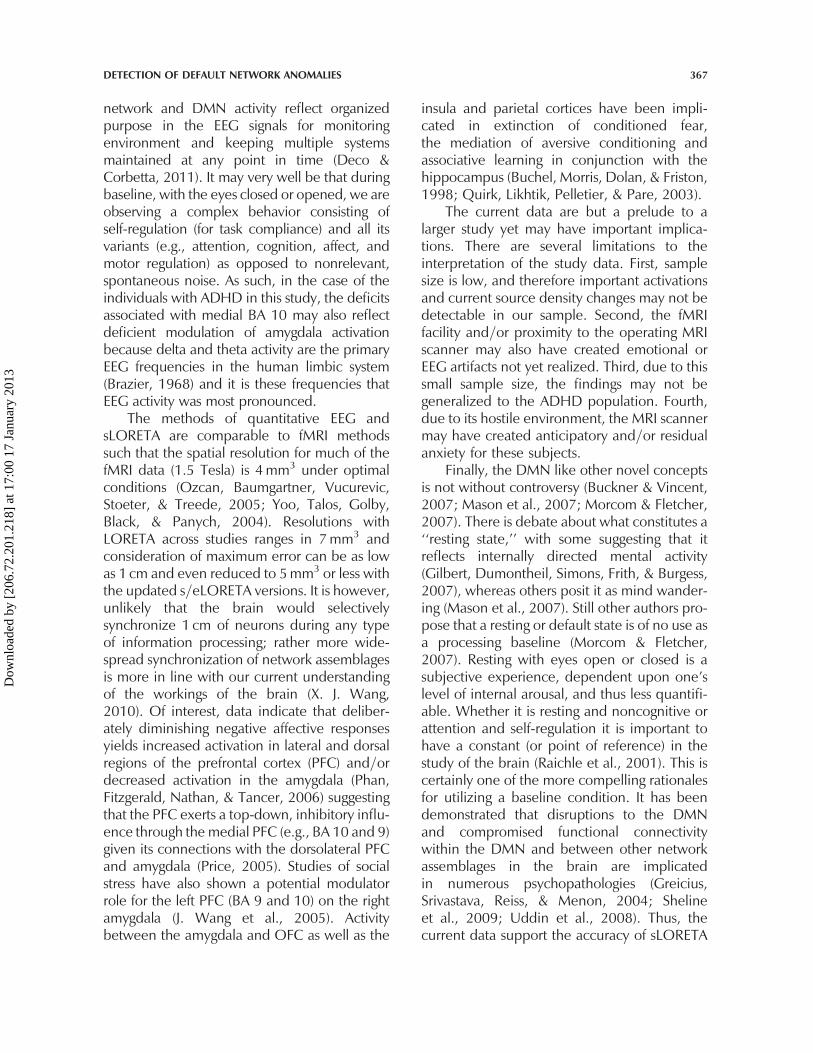
The sLORETA and fMRI resting state datalocalize activation and decreased currentsource density in medial BA 10 with increasedactivation=current source density levelsextending to BA 32. As previously stated, oneof the ambiguities associated with the fMRIsignal and test results is that it does not provideinformation about the direction of differences.However, complimentary sLORETA data dem-onstrate the ADHD subjects show less activityin medial BA 10 than controls during the restingstate in primarily the delta frequency. Figure 2shows the voxel-by-voxel sLORETA compari-sons for controls>ADHD. The maxim regionof difference for total relative power is shownat �15, 60, 25 with t¼ 1.25, p¼ .298. How-ever, in the comparison of medial BA 10 inthe DMN specifically, the ADHD group showsless delta activity than controls. This was theonly difference in all frequency domains andalthough not significant it is in the desired direc-tion. On the other hand, the fMRI activation atmedial BA 10 shows a significant differencebetween ADHD and control as shown inFigure 3. Other DMN areas showed similareffects but not at significant levels; these includeROI 5, 8, 10, and 11 as shown in Table 1. Theprimary frequency domains shown as deficit inthe ADHD group were delta and alpha.
DISCUSSION
The agreement between sLORETA and fMRI forthe differences between ADHD and control inmedial BA 10 is robust. Of importance, it is
DETECTION OF DEFAULT NETWORK ANOMALIES 365
Dow
nloa
ded
by [
206.
72.2
01.2
18]
at 1
7:00
17
Janu
ary
2013
questionable whether a single voxel of increaseor decrease would explicate the network com-plexity associated with the symptoms of ADHD(Mazaheri et al., 2010). The effects shown inthe data suggest that regions associated with sal-ience, attention, and self-regulatory processesare dysfunctional in the ADHD population.Although not all identified regions reached sig-nificance, they were in the predicted direction.
At the core of these network deficits are themedial prefrontal cortices and its associationswith the AC and regions known to be associa-ted with affect regulation and monitoring thephysical state of the body (e.g., insula and
inferior frontal cortex—BA 10 and 47). LeftBA 40 was also identified by the data as an areaof difference. It is a very important consider-ation for attentional maintenance and integrat-ive processes. BA 40 has intricate connectionsto the posterior cingulate, precuneus, angulargyrus, and Wernicke’s area and is functionallyinvolved in somatosensory integration—whichis a vital component in all variants of attentionalmaintenance (Uddin et al., 2008).
Similarly, left prefrontal deficits may reflectdeficits in attention and regulatory processesand working memory. Of interest, this regionis also associated with an inverse activity patternin the right amygdala (Aguirre, Detre, & Wang,2005; J. Wang et al., 2005). Perhaps this isrelevant to the class of ADHD (e.g., inattentiveor hyperactive). The first author tends to thinkthe AC=prefrontal and parietal regions play a vitalrole in the direction of attention and its mainte-nance. Disruptions between these networkassemblies produce negative effects in operantlearning, and the behavioral result is disorganiza-tion, inappropriate response selection, anddeficits in numerous neurocognitive domains.
Recent data have reported effective moni-toring of the EEG in DMN regions and restingstate networks (Babiloni, Marzano, et al.,2010; Babiloni, Pistoia, et al., 2010; Bluhmet al., 2009; Chen, Feng, Zhao, Yin, & Wang,2008; Hlinka, Alexakis, Diukova, Liddle, &Auer, 2010; Jerbi et al., 2010; Koeda et al.,1995; Murias, Webb, Greenson, & Dawson,2007; Putman, 2011; Stam et al., 2005). A morerecent investigation proposed resting state
FIGURE 2. Differences for ADHD>Control for whole brain analysis with 5,000 data randomizations. Note. Medial BA 10 show at �2.51, p¼ .058. (Color figure available online.)
FIGURE 3. Differences for Attention Deficit HyperactivityDisorder>Control for whole brain analysis with uncorrected pof .01 and a 100 voxel extent threshold. Note. The only ROIin the DMN to show significant difference is medial BA 10 witht �2.05, p¼ .05. (Color figure available online.)
366 R. CANNON ET AL.
Dow
nloa
ded
by [
206.
72.2
01.2
18]
at 1
7:00
17
Janu
ary
2013
network and DMN activity reflect organizedpurpose in the EEG signals for monitoringenvironment and keeping multiple systemsmaintained at any point in time (Deco &Corbetta, 2011). It may very well be that duringbaseline, with the eyes closed or opened, we areobserving a complex behavior consisting ofself-regulation (for task compliance) and all itsvariants (e.g., attention, cognition, affect, andmotor regulation) as opposed to nonrelevant,spontaneous noise. As such, in the case of theindividuals with ADHD in this study, the deficitsassociated with medial BA 10 may also reflectdeficient modulation of amygdala activationbecause delta and theta activity are the primaryEEG frequencies in the human limbic system(Brazier, 1968) and it is these frequencies thatEEG activity was most pronounced.
The methods of quantitative EEG andsLORETA are comparable to fMRI methodssuch that the spatial resolution for much of thefMRI data (1.5 Tesla) is 4mm3 under optimalconditions (Ozcan, Baumgartner, Vucurevic,Stoeter, & Treede, 2005; Yoo, Talos, Golby,Black, & Panych, 2004). Resolutions withLORETA across studies ranges in 7mm3 andconsideration of maximum error can be as lowas 1 cm and even reduced to 5mm3 or less withthe updated s=eLORETA versions. It is however,unlikely that the brain would selectivelysynchronize 1 cm of neurons during any typeof information processing; rather more wide-spread synchronization of network assemblagesis more in line with our current understandingof the workings of the brain (X. J. Wang,2010). Of interest, data indicate that deliber-ately diminishing negative affective responsesyields increased activation in lateral and dorsalregions of the prefrontal cortex (PFC) and=ordecreased activation in the amygdala (Phan,Fitzgerald, Nathan, & Tancer, 2006) suggestingthat the PFC exerts a top-down, inhibitory influ-ence through the medial PFC (e.g., BA 10 and 9)given its connections with the dorsolateral PFCand amygdala (Price, 2005). Studies of socialstress have also shown a potential modulatorrole for the left PFC (BA 9 and 10) on the rightamygdala (J. Wang et al., 2005). Activitybetween the amygdala and OFC as well as the
insula and parietal cortices have been impli-cated in extinction of conditioned fear,the mediation of aversive conditioning andassociative learning in conjunction with thehippocampus (Buchel, Morris, Dolan, & Friston,1998; Quirk, Likhtik, Pelletier, & Pare, 2003).
The current data are but a prelude to alarger study yet may have important implica-tions. There are several limitations to theinterpretation of the study data. First, samplesize is low, and therefore important activationsand current source density changes may not bedetectable in our sample. Second, the fMRIfacility and=or proximity to the operating MRIscanner may also have created emotional orEEG artifacts not yet realized. Third, due to thissmall sample size, the findings may not begeneralized to the ADHD population. Fourth,due to its hostile environment, the MRI scannermay have created anticipatory and=or residualanxiety for these subjects.
Finally, the DMN like other novel conceptsis not without controversy (Buckner & Vincent,2007; Mason et al., 2007; Morcom & Fletcher,2007). There is debate about what constitutes a‘‘resting state,’’ with some suggesting that itreflects internally directed mental activity(Gilbert, Dumontheil, Simons, Frith, & Burgess,2007), whereas others posit it as mind wander-ing (Mason et al., 2007). Still other authors pro-pose that a resting or default state is of no use asa processing baseline (Morcom & Fletcher,2007). Resting with eyes open or closed is asubjective experience, dependent upon one’slevel of internal arousal, and thus less quantifi-able. Whether it is resting and noncognitive orattention and self-regulation it is important tohave a constant (or point of reference) in thestudy of the brain (Raichle et al., 2001). This iscertainly one of the more compelling rationalesfor utilizing a baseline condition. It has beendemonstrated that disruptions to the DMNand compromised functional connectivitywithin the DMN and between other networkassemblages in the brain are implicatedin numerous psychopathologies (Greicius,Srivastava, Reiss, & Menon, 2004; Shelineet al., 2009; Uddin et al., 2008). Thus, thecurrent data support the accuracy of sLORETA
DETECTION OF DEFAULT NETWORK ANOMALIES 367
Dow
nloa
ded
by [
206.
72.2
01.2
18]
at 1
7:00
17
Janu
ary
2013
in monitoring the DMN with statistically similarresults as fMRI, with the added information ofthe directionality of the contrast betweengroups and important information about thedirect neural activity associated with the signalactivation.
REFERENCES
Aguirre, G. K., Detre, J. A., & Wang, J. (2005).Perfusion fMRI for functional neuroimaging.International Review of Neurobiology, 66,213–236.
Andrews-Hanna, J. R., Snyder, A. Z., Vincent, J.L., Lustig, C., Head, D., Raichle, M. E., &Buckner, R. L. (2007). Disruption of large-scale brain systems in advanced aging.Neuron, 56, 924–935.
Babiloni, C., Marzano, N., Iacoboni, M.,Infarinato, F., Aschieri, P., Buffo, P. . . ., DelPercio, C. (2010). Resting state corticalrhythms in athletes: A high-resolution EEGstudy. Brain Research Bulletin, 81(1), 149–156.
Babiloni, C., Pistoia, F., Sara, M., Vecchio, F.,Buffo, P., Conson, M. . . ., Rossini, P. M.(2010). Resting state eyes-closed corticalrhythms in patients with locked-in-syndrome:An EEG study. Clinical Neurophysiology, 121,1816–1824.
Bluhm, R., Williamson, P., Lanius, R., Theberge,J., Densmore, M., Bartha, R. . . ., Osuch, E.(2009). Resting state default-mode networkconnectivity in early depression using a seedregion-of-interest analysis: Decreased con-nectivity with caudate nucleus. Psychiatryand Clinical Neurosciences, 63, 754–761.
Brazier, M. A. (1968). Studies of the EEGactivity of limbic structures in man. Electro-encephalography and Clinical Neurophysiol-ogy, 25, 309–318.
Buchel, C., Morris, J., Dolan, R. J., & Friston, K.J. (1998). Brain systems mediating aversiveconditioning: an event-related fMRI study.Neuron, 20, 947–957.
Buckner, R. L., Andrews-Hanna, J. R., &Schacter, D. L. (2008). The brain’s defaultnetwork: Anatomy, function, and relevanceto disease. Annals of the N Y Academy ofSciences, 1124, 1–38.
Buckner, R. L., & Vincent, J. L. (2007). Unrestat rest: Default activity and spontaneousnetwork correlations. Neuroimage, 37,1091–1096; 1097–1099.
Bush, G., Frazier, J. A., Rauch, S. L., Seidman,L. J., Whalen, P. J., Jenike, M. A., &Biederman, J. (1999). Anterior cingulatecortex dysfunction in attention-deficit=hyperactivity disorder revealed by fMRI andthe Counting Stroop. Biological Psychiatry,45, 1542–1552.
Bush, G., Valera, E. M., & Seidman, L. J.(2005). Functional neuroimaging of atten-tion-deficit=hyperactivity disorder: A reviewand suggested future directions. BiologicalPsychiatry, 57, 1273–1284.
Bush, G., Vogt, B. A., Holmes, J., Dale, A. M.,Greve, D., Jenike, M. A., & Rosen, B. R.(2002). Dorsal anterior cingulate cortex: Arole in reward-based decision making.Proceedings of the National Academy ofSciences U S A, 99(1), 523–528.
Cannon, R. (2009). Functional connectivity in cor-tical core components of the self and the defaultnetwork of the brain (Unpublisheddoctoral dis-sertation). University of Tennessee, Knoxville,Tennessee.
Cannon, R. L., Baldwin, D. R., & Lubar, J. F.(2009). Self, other and object processing inthe addicted brain. Journal of Neurotherapy,13, 239–276.
Cannon, R., Congedo, M., Lubar, J., &Hutchens, T. (2009). Differentiating anetwork of executive attention: LORETAneurofeedback in anterior cingulate anddorsolateral prefrontal cortices. InternationalJournal of Neuroscience, 119, 404–441.
Cannon, R., Lubar, J., Congedo, M., Thornton,K., Towler, K., & Hutchens, T. (2007). Theeffects of neurofeedback training in thecognitive division of the anterior cingulategyrus. International Journal of Neuroscience,117, 337–357.
Cannon, R., Lubar, J., Sokhadze, E., & Baldwin,D. (2008). LORETA neurofeedback foraddiction and the possible neurophysiologyof psychological processes influenced: Acase study and region of interest analysis ofLORETA neurofeedback in right anterior
368 R. CANNON ET AL.
Dow
nloa
ded
by [
206.
72.2
01.2
18]
at 1
7:00
17
Janu
ary
2013
cingulate cortex. Journal of Neurotherapy,12, 227–241.
Carmona, S., Vilarroya, O., Bielsa, A., Tremols,V., Soliva, J. C., Rovira, M. . . ., Bulbena, A.(2005). Global and regional gray matter reduc-tions in ADHD: A voxel-based morphometricstudy. Neuroscience Letters, 389, 88–93.
Castellanos, F. X. (2001). Neural substrates ofattention-deficit hyperactivity disorder.Advances in Neurology, 85, 197–206.
Castellanos, F. X., & Acosta, M. T. (2002). [Syn-drome of attention deficit with hyperactivityas the expression of an organic functionaldisorder]. Revista de Neurologia, 35(1), 1–11.
Castellanos, F. X., Glaser, P. E., & Gerhardt,G. A. (2006). Towards a neuroscience ofattention-deficit=hyperactivity disorder:Fractionating the phenotype. Journal ofNeuroscience Methods, 151(1), 1–4.
Castellanos, F. X., Margulies, D. S., Kelly, C.,Uddin, L. Q., Ghaffari, M., Kirsch, A. . . .,Milham, M. P. (2008). Cingulate-precuneusinteractions: A new locus of dysfunctionin adult attention-deficit=hyperactivitydisorder. Biological Psychiatry, 63, 332–337.
Cavanna, A. E., & Trimble, M. R. (2006). Theprecuneus: A review of its functionalanatomy and behavioural correlates. Brain,129(Pt. 3), 564–583.
Chen, A. C., Feng, W., Zhao, H., Yin, Y., &Wang, P. (2008). EEG default mode networkin the human brain: spectral regional fieldpowers. Neuroimage, 41, 561–574.
Coburn, K. L., Lauterbach, E. C., Boutros, N.N., Black, K. J., Arciniegas, D. B., & Coffey,C. E. (2006). The value of quantitative elec-troencephalography in clinical psychiatry: Areport by the Committee on Research ofthe American Neuropsychiatric Association.Journal of Neuropsychiatry and ClinicalNeuroscience, 18, 460–500.
Conners, C. K., Erhardt, J. N., Epstein, D.,Parker, J. D. A., Sitarenios, G., & Sparrow, E.(1999). Self-rating of ADHD symptoms inadults I: Factor structure and normative data.Journal of AttentionDisorders, 3(3), 141–151.
Damoiseaux, J. S., Beckmann, C. F., Arigita, E. J.,Barkhof, F., Scheltens, P., Stam, C. J. . . .,Rombouts, S. A. (2008). Reduced resting-state
brain activity in the ‘‘default network’’ in nor-mal aging. Cerebral Cortex, 18, 1856–1864.
Damoiseaux, J. S., Rombouts, S. A., Barkhof,F., Scheltens, P., Stam, C. J., Smith, S. M.,et al. (2006). Consistent resting-state net-works across healthy subjects. Proceedingsof the National Academy of Sciences U S A,103, 13848–13853.
Deco, G., & Corbetta, M. (2011). The dynami-cal balance of the brain at rest. The Neuros-cientist, 17, 107–123.
Dunbar, G. (1998). The Mini InternationalNeuropsychiatric Interview (M.I.N.I.): Thedevelopment and validation of a structureddiagnostic psychiatric interview. Journal ofClinical Psychiatry, 59 (suppl 20), 22–33.
Durston, S. (2003). A review of the biologicalbases of ADHD: What have we learnedfrom imaging studies? Mental Retardationand Developmental Disabilities ResearchReviews, 9, 184–195.
Durston, S., Tottenham, N. T., Thomas, K. M.,Davidson, M. C., Eigsti, I. M., Yang, Y. . . .,Casey, B. J. (2003). Differential patterns ofstriatal activation in young children withand without ADHD. Biological Psychiatry,53, 871–878.
Enzi, B., de Greck, M., Prosch, U.,Tempelmann, C., & Northoff, G. (2009). Isour self nothing but reward? Neuronal over-lap and distinction between reward andpersonal relevance and its relation to humanpersonality. PLoS One, 4(12), e8429.
Fair, D. A., Cohen, A. L., Dosenbach, N. U.,Church, J. A., Miezin, F. M., Barch, D. M.. . ., Schlaggar, B. L. (2008). The maturingarchitecture of the brain’s default network.Proceedings of the National Academy ofSciences U S A, 105, 4028–4032.
Fan, J., Hof, P. R., Guise, K. G., Fossella, J. A., &Posner, M. I. (2008). The functionalintegration of the anterior cingulate cortexduring conflict processing. Cerebral Cortex,18, 796–805.
Faraone, S. V., Biederman, J., & Mick, E.(2006). The age-dependent decline of atten-tion deficit hyperactivity disorder: A meta-analysis of follow-up studies. PsychologicalMedicine, 36, 159–165.
DETECTION OF DEFAULT NETWORK ANOMALIES 369
Dow
nloa
ded
by [
206.
72.2
01.2
18]
at 1
7:00
17
Janu
ary
2013
Faraone, S. V., Sergeant, J., Gillberg, C., &Biederman, J. (2003). The worldwide preva-lence of ADHD: Is it an American condition?World Psychiatry, 2, 104–113.
Fassbender, C., Zhang, H., Buzy, W. M.,Cortes, C. R., Mizuiri, D., Beckett, L., &Schweitzer, J. B. (2009). A lack of defaultnetwork suppression is linked to increaseddistractibility in ADHD. Brain Research,1273, 114–128.
Fransson, P., Skiold, B., Horsch, S., Nordell, A.,Blennow, M., Lagercrantz, H., & Aden, U.(2007). Resting-state networks in the infantbrain. Proceedings of the National Academyof Sciences U S A, 104, 15531–15536.
Frei, E., Gamma, A., Pascual-Marqui, R.,Lehmann, D., Hell, D., & Vollenweider, F.X. (2001). Localization of MDMA-inducedbrain activity in healthy volunteers usinglow resolution brain electromagnetic tom-ography (LORETA). Human Brain Mapping,14, 152–165.
Gainetdinov, R. R., Wetsel, W. C., Jones, S. R.,Levin, E. D., Jaber, M., & Caron, M. G.(1999). Role of serotonin in the paradoxicalcalming effect of psychostimulants on hyper-activity. Science, 283, 397–401.
Gilbert, S. J., Dumontheil, I., Simons, J. S.,Frith, C. D., & Burgess, P. W. (2007).Comment on ‘‘Wandering minds: Thedefault network and stimulus-independentthought’’. Science, 317, 43.
Greenblatt, D. J., Gan, L., Harmatz, J. S., &Shader, R. I. (2005). Pharmocokinetics andpharmacodynamics of single-dose triazolam:Electroencephalography compared withtheDigit-Symbol SubstitutionTest.British Jour-nal of Clinical Pharmacology, 60, 244–248.
Greicius, M. D., Srivastava, G., Reiss, A. L., &Menon, V. (2004). Default-mode networkactivity distinguishes Alzheimer’s diseasefrom healthy aging: Evidence from functionalMRI. Proceedings of the National Academy ofSciences U S A, 101, 4637–4642.
Hlinka, J., Alexakis, C., Diukova, A., Liddle, P. F.,& Auer, D. P. (2010). Slow EEG pattern pre-dicts reduced intrinsic functional connectivityin the default mode network: An inter-subjectanalysis. Neuroimage, 53(1), 239–246.
Hu, S., Stead, M., Dai, Q., & Worrell, G. A.(2010). On the recording reference contri-bution to EEG correlation, phase synchrony,and coherence. IEEE Transactions on Sys-tems, Man and Cybernetics B Cybernetics,40, 1294–1304.
Hughes, J. R., & John, E. R. (1999). Conven-tional and quantitative electroencephalogra-phy in psychiatry. Journal of Neuropsychiatryand Clinical Neuroscience, 11, 190–208.
Jasper, H. H. (1958). The ten-twenty electrodesystem of international federation. Electroen-cephalography and Clinical Neurophysiol-ogy, 10, 371–375.
Jerbi, K., Vidal, J. R., Ossandon, T., Dalal, S. S.,Jung, J., Hoffmann, D. . . ., Lachaux, J. P.(2010). Exploring the electrophysiologicalcorrelates of the default-mode networkwith intracerebral EEG. Frontiers in SystemsNeuroscience, 4, 27.
Kennedy, D. P., & Courchesne, E. (2008).Functional abnormalities of the defaultnetwork during self- and other-reflectionin autism. Social Cognitive and AffectiveNeuroscience, 3, 177–190.
Koeda, T., Knyazeva, M., Njiokiktjien, C.,Jonkman, E. J., De Sonneville, L., &Vildavsky, V. (1995). The EEG in acallosalchildren. Coherence values in the restingstate: left hemisphere compensatory mech-anism? Electroencephalogry and ClinicalNeurophysiology, 95, 397–407.
Konrad, K., Neufang, S., Hanisch, C., Fink, G.R., & Herpertz-Dahlmann, B. (2006). Dys-functional attentional networks in childrenwith attention deficit=hyperactivity disorder:Evidence from an event-related functionalmagnetic resonance imaging study. Biologi-cal Psychiatry, 59, 643–651.
Liddle, E. B., Hollis, C., Batty, M. J., Groom, M.J., Totman, J. J., Liotti, M. . . ., Liddle, P. F.(2011). Task-related default mode networkmodulation and inhibitory control in ADHD:Effects of motivation and methylphenidate.Journal of Child Psychology and Psychiatry,52, 761–771.
Mason, M. F., Norton, M. I., Van Horn, J. D.,Wegner, D. M., Grafton, S. T., & Macrae,C. N. (2007). Wandering minds: The default
370 R. CANNON ET AL.
Dow
nloa
ded
by [
206.
72.2
01.2
18]
at 1
7:00
17
Janu
ary
2013
network and stimulus-independent thought.Science, 315, 393–395.
Mazaheri, A., Coffey-Corina, S., Mangun, G.R., Bekker, E. M., Berry, A. S., & Corbett,B. A. (2010). Functional disconnection offrontal cortex and visual cortex in attention-deficit=hyperactivity disorder. BiologicalPsychiatry, 67, 617–623.
Mesulam, M. M. (1990). Large-scale neurocog-nitive networks and distributed processingfor attention, language, and memory. Annalsof Neurology, 28, 597–613.
Morcom, A. M., & Fletcher, P. C. (2007). Doesthe brain have a baseline? Why we should beresisting a rest. Neuroimage, 37, 1073–1082.
Mulert, C., Jager, L., Schmitt, R., Bussfeld, P.,Pogarell, O., Moller, H. J. . . ., Hegerl, U.(2004). Integration of fMRI and simultaneousEEG: Towards a comprehensive understand-ing of localization and time-course of brainactivity in target detection. Neuroimage,22(1), 83–94.
Murias, M., Webb, S. J., Greenson, J., &Dawson, G. (2007). Resting state corticalconnectivity reflected in EEG coherence inindividuals with autism. Biological Psychiatry,62, 270–273.
Northoff, G. (2005). Is emotion regulationself-regulation? Trends in Cognitive Science,9, 408–409.
Northoff, G., & Bermpohl, F. (2004). Corticalmidline structures and the self. Trends inCognitive Science, 8, 102–107.
Northoff, G., Heinzel, A., de Greck, M.,Bermpohl, F., Dobrowolny, H., & Panksepp,J. (2006). Self-referential processing in ourbrain—A meta-analysis of imaging studieson the self. Neuroimage, 31(1), 440–457.
Northoff, G., Schneider, F., Rotte, M.,Matthiae, C., Tempelmann, C., Wiebking,C. . . ., Panksepp, J. (2009). Differential para-metric modulation of self-relatedness andemotions in different brain regions. HumanBrain Mapping, 30, 369–382.
Overmeyer, S., Bullmore, E. T., Suckling, J.,Simmons, A., Williams, S. C., Santosh, P. J.,& Taylor, E. (2001). Distributed grey andwhite matter deficits in hyperkinetic disorder:MRI evidence for anatomical abnormality in
an attentional network. Psychological Medi-cine, 31, 1425–1435.
Ozcan, M., Baumgartner, U., Vucurevic, G.,Stoeter, P., & Treede, R. D. (2005). Spatialresolution of fMRI in the human parasylviancortex: Comparison of somatosensory andauditory activation.Neuroimage, 25, 877–887.
Pascual-Marqui, R. D. (2002). Standardizedlow-resolution brain electromagnetic tomo-graphy (sLORETA): technical details. Meth-ods and Findings in Experimental andClinical Pharmacology, 24Suppl D, 5–12.
Pascual-Marqui, R. D., Esslen, M., Kochi, K., &Lehmann, D. (2002). Functional imagingwith low-resolution brain electromagnetictomography (LORETA): A review. Methodsand Findings in Experimental and ClinicalPharmacology, 24Suppl C, 91–95.
Pascual-Marqui, R. D., Michel, C. M., &Lehmann, D. (1994). Low resolution electro-magnetic tomography: A new method forlocalizing electrical activity in the brain. IntJ Psychophysiol, 18(1), 49–65.
Phan, K. L., Fitzgerald, D. A., Nathan, P. J., &Tancer, M. E. (2006). Association betweenamygdala hyperactivity to harsh faces andseverity of social anxiety in generalized socialphobia. Biological Psychiatry, 59, 424–429.
Posner, M. I., Sheese, B. E., Odludas, Y., &Tang, Y. (2006). Analyzing and shapinghuman attentional networks. Neural Net-works, 19, 1422–1429.
Price, J. L. (2005). Free will versus survival:brain systems that underlie intrinsic con-straints on behavior. Journal of ComparativeNeurology, 493(1), 132–139.
Putman, P. (2011). Resting state EEG delta-betacoherence in relation to anxiety, behavioralinhibition, and selective attentional proces-sing of threatening stimuli. International Jour-nal of Psychophysiology, 80(1), 63–68.
Quirk, G. J., Likhtik, E., Pelletier, J. G., & Pare,D. (2003). Stimulation of medial prefrontalcortex decreases the responsiveness of cen-tral amygdala output neurons. Journal ofNeuroscience, 23, 8800–8807.
Raichle, M. E., MacLeod, A. M., Snyder, A. Z.,Powers, W. J., Gusnard, D. A., & Shulman,G. L. (2001). A default mode of brain
DETECTION OF DEFAULT NETWORK ANOMALIES 371
Dow
nloa
ded
by [
206.
72.2
01.2
18]
at 1
7:00
17
Janu
ary
2013

function. Proceedings of the National Acad-emy of Sciences U S A, 98, 676–682.
Rubia, K. (2002). The dynamic approach toneurodevelopmental psychiatric disorders:use of fMRI combined with neuropsychologyto elucidate the dynamics of psychiatricdisorders, exemplified in ADHD and schizo-phrenia. Behavior and Brain Research,130(1–2), 47–56.
Rubia, K., Russell, T., Overmeyer, S., Brammer,M. J., Bullmore, E. T., Sharma, T. . . ., Taylor,E. (2001). Mapping motor inhibition:Conjunctive brain activations across differentversions of go=no-go and stop tasks. Neuro-image, 13, 250–261.
Rubia, K., Smith, A. B., Taylor, E., & Brammer,M. (2007). Linear age-correlated functionaldevelopment of right inferior fronto-striato-cerebellar networks during response inhi-bition and anterior cingulate during error-related processes. Human Brain Mapping,28, 1163–1177.
Scheres, A., Lee, A., & Sumiya, M. (2008).Temporal reward discounting and ADHD:task and symptom specific effects. Journalof Neural Transmission, 115, 221–226.
Scheres, A., Milham, M. P., Knutson, B., &Castellanos, F. X. (2007). Ventral striatalhyporesponsiveness during reward antici-pation in attention-deficit=hyperactivitydisorder. Biological Psychiatry, 61, 720–724.
Sekihara, K., Sahani, M., & Nagarajan, S. S.(2005). Localization bias and spatial resol-ution of adaptive and non-adaptive spatialfilters for MEG source reconstruction. Neuro-image, 25, 1056–1067.
Sheline, Y. I., Barch, D. M., Price, J. L., Rundle,M. M., Vaishnavi, S. N., Snyder, A. Z. . . .,Raichle, M. E. (2009). The default modenetwork and self-referential processes indepression. Proceedings of the NationalAcademy of Sciences U S A, 106, 1942–1947.
Shulman, G. L., Corbetta, M., Buckner, R. L.,Raichle, M. E., Fiez, J. A., Miezin, F. M., &Petersen, S. E. (1997). Top-down modu-lation of early sensory cortex. CerebralCortex, 7, 193–206.
Shulman, G. L., Ollinger, J. M., Akbudak, E.,Conturo, T. E., Snyder, A. Z., Petersen, S. E.,
& Corbetta, M. (1999). Areas involved inencoding and applying directional expecta-tions to moving objects. Journal of Neuro-science, 19, 9480–9496.
Shulman, G. L., Schwarz, J., Miezin, F. M., &Petersen, S. E. (1998). Effect of motion contraston human cortical responses tomoving stimuli.Journal of Neurophysiology, 79, 2794–2803.
Silk, T. J., Vance, A., Rinehart, N., Bradshaw, J.L., & Cunnington, R. (2009). White-matterabnormalities in attention deficit hyperactiv-ity disorder: A diffusion tensor imaging study.Human Brain Mapping, 30, 2757–2765.
Silk, T., Vance, A., Rinehart, N., Egan, G.,O’Boyle, M., Bradshaw, J. L., & Cunnington,R. (2005). Fronto-parietal activation inattention-deficit hyperactivity disorder, com-bined type: Functional magnetic resonanceimaging study. British Journal of Psychiatry,187, 282–283.
Spencer, T. J., Biederman, J., & Mick, E.(2007). Attention-deficit=hyperactivity dis-order: diagnosis, lifespan, comorbidities,and neurobiology. Journal of PediatricPsychology, 32, 631–642.
Sridharan, D., Levitin, D. J., & Menon, V.(2008). A critical role for the right fronto-insular cortex in switching between central-executive and default-mode networks.Proceedings of the National Academy ofSciences U S A, 105, 12569–12574.
Stam, C. J., Montez, T., Jones, B. F., Rombouts,S. A., van der Made, Y., Pijnenburg, Y. A., &Scheltens, P. (2005). Disturbed fluctuationsof resting state EEG synchronization inAlzheimer’s disease. Clinical Neurophysiol-ogy, 116, 708–715.
Strohle, A., Stoy, M., Wrase, J., Schwarzer, S.,Schlagenhauf, F., Huss, M. . . ., Heinz, A.(2008). Reward anticipation and outcomesin adult males with attention-deficit=hyperactivity disorder. Neuroimage, 39,966–972.
Stroop, J. (1925). Studies of interference inserial verbal reactions. Journal of Experi-mental Psychology, 18(6), 643–662.
Thatcher, R. W., North, D. M., & Biver, C. J.(2011). Diffusion spectral imaging modulescorrelate with EEG LORETA neuroimaging
372 R. CANNON ET AL.
Dow
nloa
ded
by [
206.
72.2
01.2
18]
at 1
7:00
17
Janu
ary
2013
modules. Human Brain Mapping. Advanceonline publication. doi:10.1002=hbm.21271
Tian, L., Jiang, T., Liang, M., Zang, Y., He, Y., Sui,M., &Wang, Y. (2008). Enhanced resting-statebrain activities inADHDpatients:A fMRI study.Brain & Development, 30, 342–348.
Uddin, L. Q., Kelly, A. M., Biswal, B. B.,Margulies, D. S., Shehzad, Z., Shaw, D. . . .,Milham, M. P. (2008). Network homogeneityreveals decreased integrity of default-modenetwork in ADHD. Journal of NeuroscienceMethods, 169(1), 249–254.
Vance, A., Silk, T. J., Casey, M., Rinehart, N. J.,Bradshaw, J. L., Bellgrove, M. A., &Cunnington, R. (2007). Right parietal dys-function in children with attention deficithyperactivity disorder, combined type: Afunctional MRI study. Molecular Psychiatry,12, 826–832, 793.
Vitacco, D., Brandeis, D., Pascual-Marqui, R.,& Martin, E. (2002). Correspondence ofevent-related potential tomography andfunctional magnetic resonance imagingduring language processing. Human BrainMapping, 17(1), 4–12.
Volkow, N. D., Wang, G. J., Kollins, S. H.,Wigal, T. L., Newcorn, J. H., Telang, F. . . .,Swanson, J. M. (2009). Evaluating dopaminereward pathway in ADHD: Clinical implica-tions. Journal of the American MedicalAssociation, 302, 1084–1091.
Wagner, M., Fuchs, M., & Kastner, J. (2004).Evaluation of sLORETA in the presence ofnoise and multiple sources. Brain Topogra-phy, 16, 277–280.
Wang, J., Rao, H., Wetmore, G. S., Furlan, P.M., Korczykowski, M., Dinges, D. F., &
Detre, J. A. (2005). Perfusion functionalMRI reveals cerebral blood flow patternunder psychological stress. Proceedings ofthe National Academy of Sciences U S A,102, 17804–17809.
Wang, X. J. (2010). Neurophysiologicaland computational principles of corticalrhythms in cognition. Physiology Review,90, 1195–1268.
Weissman, D. H., Roberts, K. C., Visscher, K.M., & Woldorff, M. G. (2006). The neuralbases of momentary lapses in attention.Nature Neuroscience, 9, 971–978.
Weng, S. J., Wiggins, J. L., Peltier, S. J.,Carrasco, M., Risi, S., Lord, C., & Monk,C. S. (2010). Alterations of resting statefunctional connectivity in the defaultnetwork in adolescents with autism spec-trum disorders. Brain Research, 1313,202–214.
Yoo, S. S., Talos, I. F., Golby, A. J., Black, P. M.,& Panych, L. P. (2004). Evaluating require-ments for spatial resolution of fMRI for neu-rosurgical planning. Human Brain Mapping,21(1), 34–43.
Zang, Y. F., He, Y., Zhu, C. Z., Cao, Q. J., Sui,M. Q., Liang, M. . . ., Wang, Y. F. (2007).Altered baseline brain activity in childrenwith ADHD revealed by resting-statefunctional MRI. Brain & Development, 29,83–91.
Zang, Y. F., Jin, Z., Weng, X. C., Zhang, L.,Zeng, Y. W., Yang, L. . . ., Faraone, S. V.(2005). Functional MRI in attention-deficit hyperactivity disorder: Evidence forhypofrontality. Brain & Development, 27,544–550.
DETECTION OF DEFAULT NETWORK ANOMALIES 373
Dow
nloa
ded
by [
206.
72.2
01.2
18]
at 1
7:00
17
Janu
ary
2013