shorter 146sm half-life and revised 146sm-142nd ages of planetary mantle differentiation
TRANSCRIPT

1
A Shorter 146Sm Half-Life Measured and Implications for 146Sm-142Nd Chronology in the Solar System
N. Kinoshita1, M. Paul2*, Y. Kashiv3*, P. Collon3, C. M. Deibel4,5, B. DiGiovine4, J. P. Greene4,
D. J. Henderson4, C. L. Jiang4, S. T. Marley4, T. Nakanishi6, R. C. Pardo4, K. E. Rehm4,
D. Robertson3, R. Scott4, C. Schmitt3, X. D. Tang3, R. Vondrasek4, A. Yokoyama6
1Research Facility Center for Science and Technology, U. of Tsukuba, Japan 2Racah Institute of Physics, Hebrew University, Jerusalem, Israel 91904 3Department of Physics, University of Notre Dame, Notre Dame, IN 46556-5670 4Physics Division, Argonne National Laboratory, Argonne , IL 60439 5Joint Institute for Nuclear Astrophysics, Michigan State University, East Lansing, MI 46624 6Faculty of Chemistry, Institute of Science and Engineering, Kanazawa University, Japan
The extinct p-process nuclide 146Sm serves as an astrophysical and geochemical
chronometer through measurements of isotopic anomalies of its α-decay daughter
142Nd. Based on analyses of 146Sm/147Sm alpha-activity and atom ratios, we
determined the half-life of 146Sm to be 68 ± 7 (1σ) million years (Ma), which is
shorter than the currently used value of 103 ± 5 Ma. This half-life value implies a
higher initial 146Sm abundance in the early solar system, (146Sm/144Sm)0 =
0.0094±0.0005 (2σ), than previously estimated. Terrestrial, Lunar and Martian
planetary silicate mantle differentiation events dated with 146Sm-142Nd converge to a
shorter time span and in general to earlier times, due to the combined effect of the
new 146Sm half-life and (146Sm/144Sm)0 values.
___________________________________________________
*To whom correspondence should be addressed. E-mail: [email protected] (M.P.); [email protected] (Y.K.)

2
The α decay of 146Sm serves as a clock for determining the chronology of solar system
formation (1) and planetary differentiation (2) and can reveal insights into p-process
nucleosynthesis of solar 146Sm (3). The correlation between anomalies in isotopic abundances of
142Nd and the Sm content, first observed (4) in meteorites, provided evidence for extinct 146Sm
(entirely decayed to 142Nd). Neodymium-142 anomalies relative to the chondritic uniform
reservoir (CHUR) observed in meteorite parent bodies (5-7), Earth (8-11), Moon (12-14) and
Mars (15-18), primarily positive, are attributed to a small fractionation during partial melting or
solidification favoring Sm in the solid phase in the silicate mantle owing to the slightly higher
incompatibility of Nd, while 146Sm was still live (not entirely decayed). Caro et al. (18) inferred
in addition that the Sm/Nd ratio of bulk Earth, Moon and Mars is 5-10 % higher than CHUR,
which accounts for part of the positive anomalies, possibly due to fractionation and collisional
erosion (2, 14, 18, 19).
The half-life of 146Sm, which sets the scale of the 146Sm-142Nd clock, was previously
measured four times (20-23) between 1953 and 1987 and its currently adopted value, derived
from the works of Friedman et al. (22) and Meissner et al. (23), is 103 ± 5 Ma. Considering the
range of measured 146Sm half-life ( 1462/1t ) values (~ 50 Ma (20), 74±15 Ma (21), 103 ± 5 Ma
(22,23)) and its importance in solar system chronology (2), we re-determined 1462/1t by measuring
the α-activity ratio and atom ratio of 146Sm to naturally-occurring 147Sm in activated samples of
147Sm and using the equation 1472/1
147
146
146
1471462/1 t
NN
AA
t ××= . Here, 1472/1t denotes the 147Sm alpha-decay
half-life, 107.0 ± 0.9 billion years (Ga) (24), and AA, NA the alpha activity and atom number of
ASm in the sample, respectively. The ratio measurement eliminates most systematic uncertainties
in determining the α activity due to detector efficiency and geometrical acceptance. We
produced three independent 146Sm source materials by activating isotopically enriched 147Sm

3
targets via the following nuclear reactions: (i) 147Sm(γ,n)146Sm (using 50-MeV electron
bremsstrahlung radiation); (ii) 21-MeV proton irradiation through the 147Sm(p,2nε)146Sm
reaction and (iii) fast-neutron activation 147Sm(n,2n)146Sm (25). We prepared spectroscopic
alpha sources (20-100 μg) from the three activations and counted them during several months
using a silicon surface-barrier detector at Kanazawa University (Fig. 1, 25), determining thus the
α-activity ratio. For the determination of the 146Sm/147Sm atom ratio, we used accelerator mass
spectrometry (AMS) at the ATLAS facility (Argonne National Laboratory) because of the need
to discriminate isobaric 146Nd interferences, observed to be critical in our experiment when using
thermal-ionization mass spectrometry (26). The AMS isobaric separation was accomplished by
the combined action of the high energy of the Sm ions after acceleration and use of a gas-filled
magnetic spectrograph (27, 28, Fig.1). Two methods were used to determine the 146Sm/147Sm
atom ratio: 146Sm counting rate versus either 147Sm22+ charge current or quantitatively attenuated
147Sm counting rate, giving consistent results (see (25, 29) for details on sample preparation and
methods of measurement).
Our measured 146Sm half-life is shorter than the adopted value by a factor 0.66 ± 0.07
(1σ) (unweighted average and standard deviation) (Fig. 2). This corresponds to a 146Sm half-life
of 68 ± 7 Ma (1σ); the systematic error (1 %) associated with the 147Sm half-life (24) is small
compared to the random errors. Our value is shorter by ~30% than the values (102.6 ± 4.8 Ma)
and (103.1 ± 4.5) Ma from (22, 23), respectively, and consistent (within larger uncertainties)
with the two earlier works of Dunlavey and Seaborg (20) and Nurmia et al. (21), ~50 Ma and 74
± 15 Ma, respectively. Different from these previous measurements, our AMS determination of
146Sm is free of isobaric contributions (146Nd) which can cause contamination in rare-earth
chemistry and mass spectrometry. The determination of an isotopic ratio (146Sm/147Sm) makes

4
our experiment also insensitive to systematic effects inherent to measuring an absolute number
of 146Sm atoms as was done in previous measurements.
Our 146Sm half-life value implies a reevaluation of the initial (146Sm/144Sm)0 ratio in the
solar system and reinterpretation of the 146Sm source and dating of planetary differentiation
events (Table 1). Although evidence for extinct 146Sm was found in many meteorites, the
majority show evidence of chemical and isotopic re-equilibration which potentially altered the
initial ratio (5-7). In a recent study, Boyet et al. (30) selected a number of meteorites which
appear to have remained closed Sm-Nd systems. Using the individual 146Sm/144Sm ratios of the
meteorites and 147Sm-143Nd ages, they re-determined the initial solar system value (146Sm/144Sm)0
= 0.0085±0.0007 (2σ) (compared to 0.008±0.001 (2σ) used in most studies (6)). As a basis for
comparison, we fit the same set of data using our measured 146Sm half-life and derive an initial
ratio (146Sm/144Sm)0 = 0.0094±0.0005 (2σ) (Fig. 3). A fit taking into account uncertainties in
both age and isotopic ratio leads, however, to the less precise value 0.0094 0018.00015.0
+− (2σ). The
determination of an experimental 146Sm decay curve from meteoritic data would require
precision in 146Sm abundances beyond present capability or more data on meteorites dated to
< 4,500 Ma before present. The initial (146Sm/144Sm)0 ratio results from the decay of 146Sm in the
interstellar medium (ISM) during an isolation interval Δ and both these quantities depend on the
146Sm half-life. The initial ratio can be expressed (1, 31) in terms of the ISM abundance
(146Sm/144Sm)ISM as )/exp()/exp()()( 144
146
144
146
0144
146
ττκτ Δ−=Δ−=TP
PSmSm
SmSm
ISM (1) , where P146/P144
denotes the 146,144Sm p-process production ratio (taken as ~ 1), τ = 98 Ma is the 146Sm mean life
determined in this work, T ~ 10 Ga the presolar age of the Galaxy and κ = p(T)/<p> the ratio of
p-process rate just before solar system formation to the average p-process rate (κ ranging from 1
for the uniform-production (closed box) model (1) to ~ 2.7 for an open-box model (31) with

5
Galactic-disk enrichment in low-metallicity gas). The isolation interval Δ calculated from eq. (1)
with our half-life and (146Sm/144Sm)0 values is reduced by factor of ~ 2.5 - 20 from previous
estimates to ~5 Ma in the closed-box model and ~100 Ma in the open-box model.
The 146Sm decay curve using 1462/1t = 68 Ma, (146Sm/144Sm)0 = 0.0094 and the two other
decay curves with 1462/1t = 103 Ma (with (146Sm/147Sm)0 = 0.0085 (30) and 0.008 (6)) intersect in
the range of 30-50 Ma (Fig. 3). This reduces the age of late events (≥ 50 Ma) (age is measured in
this work relative to the birth of the solar system) but has a minor effect on earlier events (Table
1). Samarium-146 observations in terrestrial samples can be divided into two groups: (i) most
terrestrial rocks display a 142Nd/144Nd ratio higher by ~18 parts per million (ppm) than CHUR (9)
and (ii) anomalies in the 142Nd/144Nd ratio relative to the terrestrial standard, both positive, in
rocks from Greenland and Australia (2,10), and negative, in rocks from Northern Quebec (2,11).
Two explanations were offered for the (i) anomalies, that the mantle had to differentiate within
≤ 30 Ma (2, 9) or that Earth (and the Moon and Mars) has a bulk Sm/Nd ratio 5-10% higher than
CHUR (2, 14, 18) and neither is affected by the new values presented here. At the same time,
ages derived from (ii) change significantly. One such example is the differentiation age of the
depleted mantle source of Archean rocks from Isua (Greenland) (2): the interpretation of this
array as an isochron (2) leads now to an age of 120 Ma rather than 170 Ma. The revised age
improves the agreement with the 70-170 Ma 176Lu-176Hf differentiation age derived from the
Hadean Jack Hills zircons (Australia) (2), strongly suggesting that one global differentiation
event is sampled in both cases. Another example is the isochron which dates the differentiation
of the enriched mantle source of rocks from Quebec (11), whose estimated age decreases from
287 8153
+− to 205 54
35+− Ma. An array of Lunar rocks (12, 13) has been similarly interpreted as an
isochron (2) which dates the solidification of the Lunar magma ocean. The isochron-inferred age

6
decreases with the new values from 242 ± 22 to 170 ± 15 Ma. A recent study by Borg et al. (32)
dated a Lunar sample, ferroan anorthosite (FAN) 60025, by three methods, Pb-Pb, 147Sm-143Nd
and 146Sm-142Nd. The Pb-Pb and 147Sm-143Nd systems gave consistent ages of 208.8 ± 2.4 and
201 ± 11 Ma, respectively, but the 146Sm-142Nd age, 3830250+
− Ma, showed a discrepancy. Our
value of 146Sm half-life revises the latter to 2520175+
− Ma (Table 1) and removes most of this
discrepancy, bringing the 146Sm-142Nd age into agreement with the 147Sm-143Nd age. This is an
important point considering that FAN 60025 is now the only rock dated precisely enough with
the different systems to trace their decay. The new 146Sm age of FAN60025 remains in accord
with the revised younger age of the Lunar array isochron.
References and Notes
1. G. J. Wasserburg, M. Busso, R. Gallino, K. M. Nollett, Short-lived nuclei in the early
Solar System: Possible AGB sources. Nucl. Phys. A 777, 5–69 (2006).
2. G. Caro, Early silicate earth differentiation. Annu. Rev. Earth Planet. Sci., 39, 31-58
(2011).
3. J. Audouze, D. N. Schramm, 146Sm: A chronometer for p-process nucleosynthesis.
Nature 237, 447-449 (1972).
4. G. W. Lugmair, K. Marti, Sm-Nd-Pu time pieces in the Angra dos Reis meteorite. Earth
Planet. Sci. Lett. 35, 273-284 (1977).
5. A. Prinzhofer, D. A. Papanastassiou, G. J. Wasserburg, Samarium-neodymium evolution
of meteorites. Geochim. Cosmochim. Acta 56, 797-815 (1992).
6. L. E. Nyquist, B. Bansal, H. Wiesmann, C.-Y. Shih, Neodymium, strontium and
chromium isotopic studies of the LEW86010 and Angra dos Reis meteorites and the
chronology of the angrite parent body. Meteoritics 29, 872–885 (1994).

7
7. B. W. Stewart, D. A. Papanastassiou, G. J. Wasserburg, Sm–Nd chronology and
petrogenesis of mesosiderites. Geochim. Cosmochim. Acta 58, 3487–3509 (1994).
8. C. L. Harper, Jr., S. B. Jacobsen, Evidence from coupled 147Sm–143Nd and 146Sm–142Nd
systematics for very early (4.5 Gyr) differentiation of the Earth’s mantle. Nature 360, 24-
31 (1992).
9. M. Boyet, R. W. Carlson, 142Nd evidence for early (> 4.53 Ga) global differentiation of
the silicate Earth. Science 309, 576–581 (2005).
10. V. C. Bennett, A. D. Brandon, A. P. Nutman, Coupled 142Nd-143Nd isotopic evidence for
Hadean mantle dynamics. Science 318, 1907–1910 (2007).
11. J. O’Neil, R. W. Carlson, D. Francis, R. K. Stevenson, Neodymium-142 evidence for
Hadean mafic crust. Science 321, 1828–1831 (2008).
12. L. E. Nyquist et al., 146Sm–142Nd formation interval for the lunar mantle. Geochim.
Cosmochim. Acta 59, 2817–2837 (1995).
13. M. Boyet, R. W. Carlson, A highly depleted moon or a non-magma ocean origin for the
lunar crust? Earth Planet. Sci. Lett. 262, 505–516 (2007).
14. A. D. Brandon, T. J. Lapen, V. Debaille, B. L. Beard, K. Rankenburg, C. Neal, Re-
evaluating 142Nd/144Nd in Lunar mare basalts with implications for the early evolution
and bulk Sm/Nd of the Moon. Geochim. Cosmochim. Acta 73, 6421–6445 (2009).
15. C. L. Harper, Jr., L. E. Nyquist, B. Bansal, H. Wiesmann, H., C.-Y. Shih, Rapid accretion
and early differentiation of Mars indicated by 142Nd/144Nd in SNC meteorites. Science
267, 213–217 (1995).
16. C. N. Foley, M. Wadhwa, L. E. Borg, P. E. Janney, R. Hines, T. L. Grove, The early
differentiation history of Mars from 182W-142Nd isotope systematics in the SNC
meteorites. Geochim. Cosmochim. Acta 69, 4557–4571 (2005).

8
17. V. Debaille, A. D. Brandon, Q. Z. Yin, B. Jacobsen, Coupled 142Nd–143Nd evidence for a
protracted magma ocean in Mars. Nature 450, 525–528 (2007).
18. G. Caro, B. Bourdon, A. N. Halliday, G. Quitté, Super-chondritic Sm/Nd ratios in Mars,
the Earth and the Moon. Nature 452, 336–339 (2008).
19. H. S. C. O’Neill, H. Palme, Collisional erosion and the nonchondritic composition of the
terrestrial planets. Philos. Trans. R. Soc. Ser. A 366, 4205–4238 (2008).
20. D. C. Dunlavey, G. T. Seaborg, Alpha activity of 146Sm as Detected with Nuclear
Emulsions. Phys. Rev. 92 206 (1953).
21. M. Nurmia, G. Graeffe, K. Valli, J. Aaltonen, Alpha activity of Sm-146. Ann. Acad.
Scient. Fenn. A.VI.148, 1-8 (1964).
22. A. M. Friedman et al., Alpha decay half-lives of 148Gd, 150Gd and 146Sm. Radiochim. Acta
5, 192-194 (1966).
23. F. Meissner, W.-D. Schmidt-Ott, L. Ziegeler, Half-life and α-energy of 146Sm. Z. Phys. A
327, 171-174 (1987).
24. K. Kossert, G. Joerg, O. Naehle, C. L. v. Gostomski, High-precision measurement of the
half-life of 147Sm. Appl. Rad. Isot. 67, 1702-1706 (2009).
25. Materials and methods are available on Science online
26. H. Tazoe, H. Obata, H. Amakawa, Y. Nozaki, T. Gamo, Precise determination of the
cerium isotopic compositions of surface seawater in the Northwest Pacific Ocean and
Tokyo Bay. Mar. Chem. 103, 1-14 (2007).
27. M. Paul et al., Heavy ion separation with a gas-filled magnetic spectrograph. Nucl. Inst.
Methods Phys. Res. A 277, 418-420 (1989).
28. N. Kinoshita et al., Ultra-sensitive detection of p-process nuclide 146Sm produced by
(γ,n), (p,pnε) and (n,2n) reactions. J. Phys. G: Nucl. Part. Phys. 35, 014033 (2008).

9
29. N. Kinoshita et al., New AMS Method to Measure the Atom Ratio 146Sm/147Sm for a
Half-life Determination of 146Sm, Nucl. Instr. Methods B (2012),
http://dx.doi.org/10.1016/j.nimb.2012.01.013.
30. M. Boyet, R. W. Carlson, M. Horan, Old Sm–Nd ages for cumulate eucrites and
redetermination of the solar system initial 146Sm/144Sm ratio. Earth Planet. Sci. Lett. 291,
172–181 (2010).
31. N. Dauphas, T. Rauscher, B. Marty and L. Reisberg, Short-lived p-nuclides in the early
solar system and implications on the nucleosynthetic role of X-ray binaries. Nucl. Phys. A
719, 287c-295c (2003).
32. L. E. Borg, J. N. Connelly, M. Boyet, R. W. Carlson, Chronological evidence that the
Moon is either young or did not have a global magma ocean. Nature 477, 70-72 (2011).
33. N. Dauphas, A. Pourmand, Hf–W–Th evidence for rapid growth of Mars and its status as
a planetary embryo. Nature 473, 489–493 (2011).
34. N. Kinoshita et al., Technological development for half-life measurement of 146Sm
nuclide. J. Nucl. Radiochem. Sci. 8, 109-112 (2007).
35. M. Schlapp et al., A new 14 GHz electron-cyclotron-resonance ion source for the heavy
ion accelerator facility ATLAS. Rev. Sci. Inst. 69, 631-633 (1998).
36. M. Paul et al., AMS of heavy elements with an ECR ion source and the ATLAS linear
accelerator. Nucl. Inst. Methods Phys. Res. B 172, 688-692 (2000).
37. J. K. Boehlke et al., Isotopic Compositions of the Elements, 2001. J. Phys. Chem. Ref.
Data, 34, 57-67 (2005).
38. T. Kleine, K. Mezger, C. Münker, H. Palme, A. Bischoff, 182Hf-182W isotope systematics
of chondrites, eucrites and Martian meteorites: Chronology of core formation and early

10
mantle differentiation in Vesta and Mars. Geochim. Cosmochim. Acta 68, 2935-2946
(2004).
39. G. Beard, M. L. Wiedenbeck, Natural Radioactivity of Sm147. Phys. Rev. 95, 1245-1246
(1954).
40. G. Beard, W. H. Kelly, The use of a samarium loaded liquid scintillator for the
determination of the half-life of Sm147. Nucl. Phys. 8, 207-209 (1958).
41. R. D. MacFarlane, T. P. Kohman, Natural Alpha Radioactivity in Medium-Heavy
Elements. Phys. Rev. 121, 1758-1769 (1961).
42. P. M. Wright, E. P. Steinberg, L. E. Glendenin, Half-Life of Samarium-147. Phys.
Rev.123, 205-208 (1961).
43. D. Donhoffer, Bestimmung der halbwertszeiten der in der natur vorkommenden
radioaktiven nuklide Sm147 und Lu176 mittels flüssiger szintillatoren. Nucl. Phys. 50, 489-
496 (1964).
44. M. C. Gupta and R. D. MacFarlane, The natural alpha radioactivity of samarium. J. Inorg.
Nucl. Chem. 32, 3425-3432 (1970).
45. N. Kinoshita, A. Yokoyama, T. Nakanishi, Half-Life of Samarium-147. J. Nucl.
Radiochem. Sci. 4, 5-7 (2003)
46. J. Su et al.., Alpha decay half-life of 147Sm in metal samarium and Sm2O3. Eur. Phys. J. A
46, 69–72 (2010).
Acknowledgements: We thank R. Carlson, W. Kutschera, K. Nollett and J. Schiffer for helpful
discussions, and three anonymous reviewers for comments which greatly benefited the paper.
This work is supported in part by Grant-in-Aid for Scientific Research Program of Japan Society
for the Promotion of Science (20740161). This work is supported by the U.S. Department of

11
Energy, Office of Nuclear Physics, under contract Nr. DE-AC02-06CH11357 and by the NSF
JINA Grant Nr. PHY0822648.
Supporting Online Material: Materials and Methods
SOM text
Figs. S1 to S6
Table S1, S2

12
Table 1: The effect of the shorter 146Sm half-life on estimated time of differentiation events.
Time after start of SS formation (Ma) Planetary
body Sample / Mantle differentiation event Reference
From ref. in col. 3a
Revised in present workb
Terrestrial rocks 18 ppm higher than CHUR / depleted–enriched reservoirs
9 ≤ 30 No change
Archean array, Isua, Greenland /
depleted source 2 170c 120d
Earth
Nuvvuagittuq greenstone belt, Northern Quebec, Canada /
enriched sourcee 11 287 81
53+− 205 54
35+−
f
Lunar array / LMO solidificationg 2 242 ± 22 170 ± 15h
Moo
n
FAN 60025 / LMO solidificationg,i 32 250 3830
+− 175 25
20+−
j
Nakhlites / solidification of depleted source
16 8 – 25k Favors young agel
Mar
s
Enriched shergottites / solidification of source
17 ~110m ~90 n
a Derived in the original studies (col. 3) using 146
2/1t = 103 Ma (22,23), (146Sm/147Sm)0 = 0.008 (6),
t0 = 4,567 Ma (see text).
b Derived using the value presented in this work.
c Using (146Sm/147Sm)0 = 0.0085.
d Reinterpretation of Fig. 3 of Caro (2).
e Measured in faux-amphibolite and gabbro (> 3,800 Ma before present).
f Reinterpretation of Fig. 3 of O'Neil et al. (11).
g LMO = Lunar magma ocean.

13
h Reinterpretation of Fig. 8 of Caro (2).
i FAN = ferroan anorthosite.
j Reinterpretation of Fig. 2b of Borg et al. (32).
k Calculated a depleted source of 147Sm/144Nd ~0.255-0.266 (180Hf/183W = ~22-43) for the
Martian mantle source.
l Calculated a less depleted source of 147Sm/144Nd ~0.245 (180Hf/183W ~ 20) for the Martian
mantle source (Fig. S5, 25). The young age may be in line with the recent finding that Mars
accreted within ~ 4 Ma (33).
m Calculated assuming the data form a mixing line and the source has CHUR Sm/Nd ratio. See
Fig. S5 (25). Alternative interpretation of the data line as an isochron and a source with super-
chondritic Sm/Nd ratio gives an age of ~40 Ma (18).
n See Fig. S6 (25).

14
Figure legends
Figure 1: (left) Alpha spectra from 147Sm activated via (γ,n), (n,2n) and (p,2nε) reactions,
determining the 146Sm/147Sm activity ratio; (right) identification spectra measured for a (n,2n)
activated sample (upper right) and non-activated natSm (lower right). The spectra display energy
loss vs. position signals from a detector along the focal plane of a gas-filled magnetic
spectrograph. The device separates in position (magnetic rigidity) 146Sm ions from 146Nd isobaric
ions (originating from chemical impurities in the sample or in ion source structural material),
owing to their different mean ionic charge state in the gas (25). The observed 126Xe19+ group is
transmitted by the accelerator due to its charge-to-mass ratio being quasi-degenerate with that of
146Sm22+ and originates from residual gas in the ion source. In order to determine the 146Sm/147Sm
ratios (25), the count rate in the 146Sm group was normalized to 147Sm, alternately transported
through the accelerator (see Fig. 2). The blank spectrum shown for the natSm sample (lower right)
corresponds to a ratio 146Sm/147Sm < 10-11.
Figure 2: Double ratios of the 146Sm/147Sm atom ratio measured by AMS to that expected in the
same sample from its 146Sm/147Sm α activity ratio using the currently adopted 146Sm half-life,
103 Ma (22, 23). The double ratio is equivalent to the ratio of our measured 146Sm half-life to the
currently adopted value (right vertical axis). The single dashed line (red) corresponds to a ratio of
1. The notations G-x, N-x, P-x on the horizontal axis denote various independently prepared
samples from the bremsstrahlung, neutron and proton irradiations, respectively. The plotted
value for each sample is the unweighted mean and standard deviation of the double ratios
measured in repeat measurements of that sample (see Table S1 and Figs. S4, S5 for individual

15
values). The error bars represent random statistical errors in AMS ion counting and α activity,
uncertainty in dilution factors and random errors in ion transmission. The unweighted mean and
standard deviation of the double ratios shown, 0.66 ± 0.07, correspond to a 146Sm half-life of 68
± 7 Ma. Diamond and circles represent values measured by normalizing 146Sm counts to 147Sm22+
charge and squares to counts of a quantitatively attenuated 147Sm beam measured in the same
detector as 146Sm ions, avoiding possible systematic uncertainties in the charge current
measurement or in transmission efficiency between the Faraday cup and detector (25, 29).
Figure 3: Reinterpretation of the (146Sm/144Sm)0 initial ratio measured in selected meteorites
((30) and references therein) plotted against the meteorite age after solar system formation in Ma
(upper horizontal axis) or time in Ma before present (bp) (lower horizontal axis). The time of
solar system formation is taken as 4568 Ma bp. The set of meteorites selected by Boyet et al.
(30) as closed Sm-Nd systems is used here: 4 eucrites (Moore County, EET87520, Caldera,
Binda), one mesosiderite (Mt. Padburry) and one angrite (LEW 86010). For the latter, a weighted
average of the age and isotopic ratio of two measurements (30) was used here. Two additional
eucrites (Y980318/433), with lower isotopic ratios, are shown but not included in the calculation
(30). The data are fitted by a new decay curve (solid blue line) using the 146Sm half-life value
measured in this work ( 1462/1t = 68 Ma) and yield an initial solar system ratio r0= (146Sm/144Sm)0 =
0.0094 ± 0.0005 (2σ), compared to the curve from Boyet et al. (30) (dashed) with 1462/1t = 103 Ma,
r0= 0.0085 ± 0.0007 (2σ) and that used in most studies (6) (dotted) with 1462/1t = 103 Ma, r0= 0.008
± 0.001. Both the 146Sm half-life value of 68 Ma and the initial solar system ratio r0=
(146Sm/144Sm)0 = 0.0094 determined in this work are used for the age determination of
differentiation processes (Table 1).

101
102
103
147Sm(γ,n)147
Sm
146Sm
1
101
102
103
104
Cou
nts/
chan
nel 147
Sm(n,2n)
146Sm
147Sm
1
α energy (MeV)
101
102
103
147Sm(p,2nε)
146Sm
147Sm
147Eu
11.5 2.5 3.5
900
1000
1100
1200146
Nd146
Sm
146Nd
126Xe
520 560 600 640focal plane position (ch. nr.)
900
1000
1100
1200ΔE
3 (c
hann
el n
umbe
r)

Sample number
0
0.2
0.4
0.6
0.8
1
1.2
1.4
146 S
m/14
7 Sm
mea
s/ex
pect
.
G-2
N-2
P-3
P-4
unweighted ave. =N
-8
N-7
N-8
N-7
(p,2nε)
0.2
0.4
0.6
0.8
1
1.2
1.4
0
147
t1/2 ( 146Sm
) measured/adopted0.66 ± 0.07
bremsstrahlung (γ,n)(n,2n)-
147Sm charge
(n,2n)-147
Sm counts

44004450450045504600
Time (Ma bp)
0.004
0.006
0.008
0.010
r =
146 S
m/14
4 Sm
0 50 100 150 200
Eucrites(Moore CountyEET87520CalderaBinda)Eucrite (not incl. in fit)Y980318/433Mesosiderite (Mt. Padburry)Angrite(LEW 86010)
t1/2(146
Sm) = 68 My
t1/2(146
Sm) = 103 Myr0 = 0.0085
t1/2(146
Sm) = 103 Myr0 = 0.008
solarsystem
0.0094
Age after solar system formation (My)

1
Supporting Online Material for
A Shorter 146Sm Half-Life Measured and Implications for 146Sm-142Nd Chronology in the Solar System
N. Kinoshita, M. Paul, Y. Kashiv, P. Collon, C. M. Deibel, B. DiGiovine, J. P. Greene, D. J. Henderson, C. L. Jiang, S. T. Marley, T. Nakanishi, R. C. Pardo, K. E. Rehm,
D. Robertson, R. Scott, C. Schmitt, X. D. Tang, R. Vondrasek, A.Yokoyama
correspondence to: [email protected] This PDF file includes:
Materials and Methods SOM text Figs. S1 to S6 Tables S1,S2

2
Materials and Methods
Activation of 147Sm, sample preparation for alpha-activity and AMS measurements
Three independent 146Sm source materials were produced for the experiments by activating
isotopically enriched targets of 147Sm via the following nuclear reactions: (i) 147Sm(γ,n)146Sm
(using bremsstrahlung radiation with an end-point energy of 50 MeV from the Electron Linear
Accelerator at Tohoku University, Japan); (ii) 147Sm(p,2nε)146Sm (using 21 MeV protons from
the AVF cyclotron at Osaka University, Japan) and (iii) 147Sm(n,2n)146Sm (using fast neutrons
from the Japan Material Testing Reactor, Oarai, Japan). Following the activations, the Sm
targets were dissolved and Sm was purified (see protocol of chemical procedure below). In the
case of the proton-induced activation, Eu was separated from the Sm target and 146Eu let to
decay to 146Sm for about three months. 146Sm decay products and residual Sm were then
chemically separated and purified.
Spectroscopic alpha sources (20-100 µg) from the three activations were prepared by
precipitation onto Teflon micropore filters (4.9 cm2 filtering area). Alpha activities (Fig. 1, see
Table S1) were measured during several months at Kanazawa University (Japan), using a
silicon surface-barrier detector of 450 mm2 active area and ~20% efficiency (34).
In order to prepare samples for atom ratio measurements, the Sm sources were dissolved and
quantitatively diluted with high-purity natSm in various ratios (Table S1), in order to have
samples of typically 10 mg having an effective natural Sm isotopic composition. The solutions
were purified of Nd impurities by repeated liquid-chromatography steps using a lanthanide-
specific resin (Ln resin, manufactured by Eichrom Ltd.); see protocol below. The samples were
eventually reduced to high-purity Sm metal, observed to have higher ionization yields in the
Electron Cyclotron Resonance (ECR) ion source (see below) than Sm oxide. This was
performed by the following steps for each individual sample: (i) Sm hydroxide was
precipitated with ammonia solution and evaporated to dryness; (ii) ignited to oxide in quartz

3
crucible at 600oC; (iii) oxide thoroughly mixed with freshly filed Zr powder and pressed to
3mm diameter pellets; (iv) pellets introduced in a tightly fitting cylindrical tube made of 0.1
mm thick Ta having 1 mm diameter orifice; (v) sealed tube placed in high-vacuum (10-5 Pa)
evaporator and resistively heated to ~1300oC; (vi) reduced and evaporated metallic Sm
collected by distillation on water-cooled Cu collector placed just above the 1-mm orifice. The
Sm sample was eventually pressed in a holder made of high-purity Al to be used as sputter
cathode in the ECR ion source.
Protocol and chemical procedures
Protocols and chemical procedures used to prepare the activated samples for alpha-activity and
atom ratio measurements are shown below as flow charts.

4
Chemistry of (p,2nεεεε) sample P-x
target 96% enriched 147Sm2O3 35 mg
13.5 M HNO3
evaporated to ~0.1 mL
discard
let stand for 3 months 146Eu→146Sm
precipitate (Fe, Sm)
×2
catio
n e
xch
ang
e
HP
LC c
olum
n
(4.6
mmφ
× 2
50 m
m)
water 60 mL
0.3 M α-HIBA solution discard (Sm fraction)
Eu + ~30 µg of Sm
supernatant (α-HIBA removed)
12 M HCl
12 M HCl Sm3+
Dow
ex 1
X8
evaporated to ~0.1 mL
1/2 1/2
same procedure as in right-hand branch
α spectrometry
12 M HCl
Fe carrier 1 mg
NH3 water
same dilution procedure as in
right branch
AMS sample P-3

5
discard
catio
n ex
chan
ge
HP
LC c
olu
mn
(4.6
mm
φ ×
25
0 m
m)
water 60 mL
0.3 M α-HIBA solution Eu discard
Sm fraction
precipitate (Fe, Sm)
×2
sup (α-HIBA)
12 M HCl ~30 µg Sm
ani
on e
xcha
nge
co
lum
n D
owe
x 1X
8
12 M HCl
12 M HCl
Fe carrier 1 mg
NH3 water
α spectrometry
NH3 water
filtrate on a Teflon filter
4M HCl (~30 mL) ~1/300
ICP-MS measurement
to determine Sm content
natSm solution(HNO3):dilution for AMS sample
ppt sup
high purity HCl (a few drops)
deionized water (50 mL)
Eic
hro
m
LN r
esin
2
mL
0.25M high pure HCl (20 mL)
0.5M high pure HCl (10 mL)
Nd (discarded)
Sm
precipitate sup
NH3 water
dry up (800°C)
AMS sample (P-4)
ammonia solution

6
Chemistry of (γγγγ,n) sample G-x
target 93% enriched 147Sm2O3 ~15 mg 12 M HCl
dry up
discard
water
water 60 mL
0.3 M α-HIBA solution separates lanthanides
Sm
discard
catio
n e
xch
ang
e
HP
LC c
olum
n
(4.6
mmφ
× 2
50
mm
)
precipitate (Fe, Sm)
×2
supernatant (α-HIBA)
12 M HCl
Fe carrier 1 mg
NH3 water
12 M HCl ~100 µg Sm
ani
on
exc
han
ge
colu
mn
Dow
ex
1X8
12 M HCl
α spectrometry
NH3 water
filtrate on a Teflon filter (4.9 cm2)
4M HCl (~30 mL) ~1/300
ICP-MS measurement
to determine Sm content
natSm solution: dilution for AMS
precipitate supernatant
high purity HCl (a few drops)
deionized water (50 mL)
Eic
hro
m
LN r
esin
2
mL
0.25M high purity HCl (20 mL)
0.5M high purity HCl (10 mL)
Nd (discard)
Sm
precipitate supernatant
NH3 water
dry up
AMS sample (G-2)

7
Chemistry of (n,2n) sample N-x
precipitate supernatant
target 96% enriched 147Sm2O3 12.0 mg
NH3 solution
0.25 M HCl 10 mL
0.4 M HCl 11 mL Sm
×5
0.4 M HCl 11− mL Eu
12M HCl
12 M HCl (a few drops)
water (5 mL)
Stock solution
Eic
hro
m
LN r
esin
2
mL
discard
~1/300 ICP-MS measurement
~50 µg Sm
α spectrometry
NH3 water
filtrate on a Teflon filter known amount
natSm solution dilution to AMS sample:
precipitate sup
high purity HCl (a few drops)
deionized water (50 mL)
Eic
hro
m
LN r
esin
2
mL
0.25M high pure HCl (20 mL)
0.5M high pure HCl (10 mL)
Nd (discard)
Sm
precipitate supernatant
NH3 water
dry up
same dilution procedure as in left branch
AMS sample (N-7)
same dilution procedure as in left branch
AMS sample (N-8)
AMS sample (N-2)

8
Detection of 146Sm by accelerator mass spectrometry at the ATLAS facility
Accelerator mass spectrometry (AMS) was used for the determination of 146Sm/147Sm
because of the need to discriminate against isobaric 146Nd originating from residual
impurities and structural materials of the ion source. The AMS 146Sm/147Sm measurements
were made with the Electron Cyclotron Resonance Ion Source (ECRIS)-ATLAS accelerator
facility at Argonne National Laboratory.
Highly-charged positive ions are produced in the plasma chamber of the ECRIS (35) by ion
sputtering of the Sm metallic sample. In order to reduce background of parasitic ions, the
chamber walls were lined with a closely fit cylinder made of quartz transparent to the
microwave radiation (~100W at 14 GHz) which ignites and maintains the plasma. 146Sm22+
and 147Sm22+ ions, alternately selected by magnetic separation, were bunched and accelerated
to a final energy of 6 MeV/u in the superconducting linear accelerator. Acceleration of
neighboring isotopes such as 146Sm and 147Sm, both in 22+ charge state, requires adjustment
of resonator field amplitudes and ion-optical elements by scaling a master tune according to
the m/q ratios of the atomic mass and charge state of the ions, in order to conserve an exact
velocity profile. The accelerator system acts then as a high-energy accelerator mass
spectrometer and its abundance sensitivity (defined as the abundance ratio of two resolvable
neighboring isotopes) before the detection system was shown (36) to be ~5×10-12 for Pb
isotopes, separating in the present experiment 146Sm from 147Sm. Molecular ions are totally
dissociated in the ECR plasma and any molecular ion re-formed at a later stage cannot be
injected at the magnetic rigidity corresponding to the high charge-state ions selected for
acceleration.

9
Isobaric separation of 146Sm and residual 146Nd ((m/q)/δ(m/q)~2.4×106), beyond the
separation power of the accelerator, is achieved in a gas-filled magnetic spectrograph (27).
The ions are then physically separated due to their (Z-dependent) mean charge state in the
gas, unambiguously identified and counted by measurement of their position and differential
energy loss in a focal-plane detector (Fig. 1 right panel). For a quantitative determination of
the atom ratio, the count rate of 146Sm22+ ions in the focal-plane detector was normalized to
the charge current (of the order of several nA) of the 147Sm22+ beam, transported after proper
scaling of the accelerator to electron-suppressed Faraday cup positioned before the
spectrograph entrance. The fraction of ions produced by the ECRIS in the 22+ charge state is
considered identical for the two isotopes. The atom ratio for each measured sample is listed
in Table S1 and is shown (Fig. 2 and Fig. S3), divided by the expected atom ratio calculated
using its alpha activity, its dilution factor (Table S1) and the currently adopted half-life value
of 146Sm (103 Ma, (22,23)). The double ratio, equivalent to the ratio of our measured half-life
to that currently adopted is 0.66 ± 0.07 (unweighted average of the different samples and
standard deviation). The corresponding 146Sm half-life value is 68 ± 7 Ma. The standard
deviation accounts for random errors in ion-counting, alpha activity, dilution and fluctuations
in ion transmission of the accelerator system (Figs. 2, S2, S3, Table S1). In order to estimate
the effective uncertainty associated with these fluctuations, difficult to control in the
accelerator, we performed repeat measurements of each sample and conservatively take the
unweighted standard deviation of the measurements as the uncertainty in each set of data
points. The systematic uncertainty in our determination of the 146Sm half-life introduced by
the uncertainty in the 147Sm half-life is negligible, when using the high precision value (107.0
± 0.9 Ga) (24); see Table S2 for a compilation of available data on 147Sm half-life. The
reliability of the m/q scaling procedure used to transport alternately 146Sm22+ or 147Sm22+ from

10
the ECRIS to the detection setup, was checked by measuring the ratio of charge currents for
147Sm22+ and 152Sm22,23+ (Fig. S2). The measured 152Sm/147Sm (1.8±0.2), after correcting
when necessary for the 23+/22+ population ratio (Figs. S1, S2), is consistent with the natural
abundance ratio 1.785 ± 0.024 (derived from (37)), showing that the average transmission at
different m/q settings is constant.
The measurements of sample N-8 were less reproducible than others, possibly due to lower
quality of sample N-8 or lower performance of the accelerator system during the N-8
measurement, resulting in less stable ion transmission. This is observed in the increased
scatter of the 152Sm/147Sm and 146Sm/147Sm ratios of N-8 in Figs. S2 and S3. It is also
expressed by the larger random error in the N-8 double ratio (Fig. 2, Table S1) than for other
samples. The poorer stability of N-8 led us to take a larger set of repeat measurements of its
atom ratios (Figs. S2, S3) in order to obtain a valid result. The random errors assigned to the
N-8 data points in Figs. S2 and S3 are, however, statistically consistent with the scatter due
to the fluctuations in ion transmission.
For two of the samples (N-7 and N-8), the atom ratios were also measured by alternately
counting 146Sm22+ (unattenuated) and 147Sm22+ (attenuated) in the focal plane detector. The
measurement method is described in detail in (29): quantitative attenuation of 1:105, required
for the abundant 147Sm22+ ions, is obtained with the 12 MHz pulsed and ns-bunched ATLAS
beam by chopping ion pulses with an RF sweeper in a (digitally measured) ratio of 1:105. As
shown in (29), the measured atom ratios (Fig. 2) are consistent with those described above
and confirm that no unaccounted ion losses occur between the Faraday cup and focal plane
detector. The ion spectra accumulated for attenuated beams of 147Sm and 152Sm (Fig. 2 in 29)
show also that the respective beams are isotopically pure.

11
SOM Text
Sm dilution (P-3, P-4, G-2, N-2,7,8) Index
1. Preparation of Sm solution for dilution and ICP-MS measurement
2. P-3
3. P-4
4. G-2
5. N-2
Preparation of Sm solution for dilution and ICP-MS measurement
1. A weighing bottle was dried in a vacuum oven (130 oC) for a couple of hours, the bottle
was put in a desiccator for 30 min, and then weight of the bottle was measured. This
procedure was repeated totally 3 times.
Weight: 15.031 g → 15.031 g → 15.031 g Average: 15.031 g
2. Approximately 1.5 g of natural Sm2O3 (Nakalai Tesque Co., purity: 99.9%) was taken in
the weighing bottle. Then, bottle was dried in a vacuum oven (130 oC) for a couple of
hours, the bottle was put in a desiccator for 30 min, and then weight of the bottle was
measured. This procedure was also repeated 3 times.
Weight: 16.288 g → 16.288 g → 16.288 g Average: 16.288 g
Weight of Sm2O3: 16.288 − 15.031 = 1.257 g
3. The Sm2O3 was dissolved in ~10 mL of c.HNO3 and then diluted to 50.003 g with
deionized water.
Sm concentration is: 63.21003.50999.072.348
36.300257.1 =÷××
= 21.6 mg natSm/g-soln.
This Sm solution was used for the following dilution (P-3, P-4, G-2, N-2).
4. Preparation of Sm solution for ICP-MS measurement.
Sm-1: 55.9 mg of 21.6 mg natSm/g-soln. was diluted to 58.7 g → 20.6 µg natSm/g
Sm-2: 258.9 mg of Sm-1(20.6 µg/g) was diluted to 65.31 g → 81.7 ng natSm/g
12
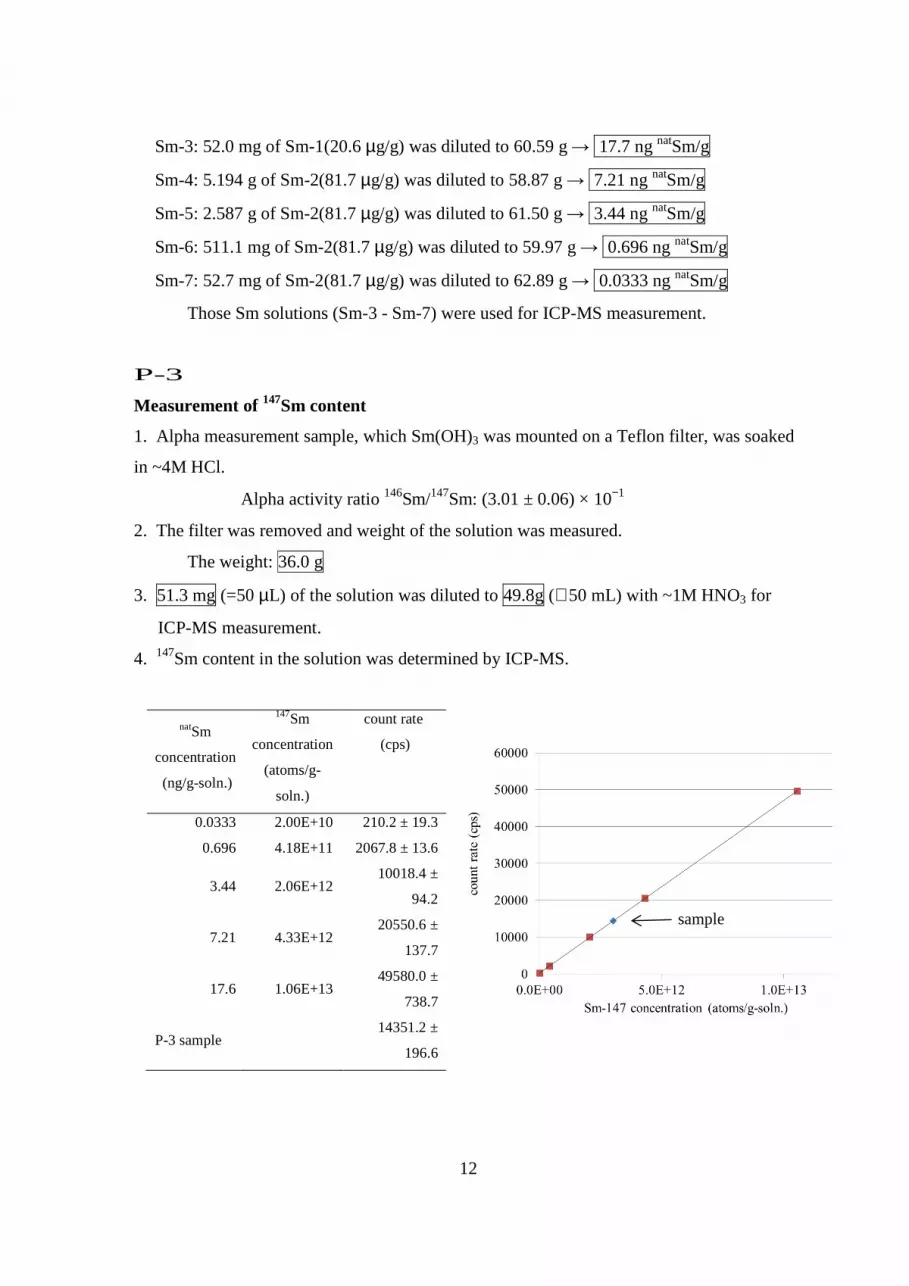
Sm-3: 52.0 mg of Sm-1(20.6 µg/g) was diluted to 60.59 g → 17.7 ng natSm/g
Sm-4: 5.194 g of Sm-2(81.7 µg/g) was diluted to 58.87 g → 7.21 ng natSm/g
Sm-5: 2.587 g of Sm-2(81.7 µg/g) was diluted to 61.50 g → 3.44 ng natSm/g
Sm-6: 511.1 mg of Sm-2(81.7 µg/g) was diluted to 59.97 g → 0.696 ng natSm/g
Sm-7: 52.7 mg of Sm-2(81.7 µg/g) was diluted to 62.89 g → 0.0333 ng natSm/g
Those Sm solutions (Sm-3 - Sm-7) were used for ICP-MS measurement.
P-3
Measurement of 147Sm content
1. Alpha measurement sample, which Sm(OH)3 was mounted on a Teflon filter, was soaked
in ~4M HCl.
Alpha activity ratio 146Sm/147Sm: (3.01 ± 0.06) × 10−1
2. The filter was removed and weight of the solution was measured.
The weight: 36.0 g
3. 51.3 mg (=50 µL) of the solution was diluted to 49.8g (≅ 50 mL) with ~1M HNO3 for
ICP-MS measurement.
4. 147Sm content in the solution was determined by ICP-MS.
natSm
concentration
(ng/g-soln.)
147Sm
concentration
(atoms/g-
soln.)
count rate
(cps)
0.0333 2.00E+10 210.2 ± 19.3
0.696 4.18E+11 2067.8 ± 13.6
3.44 2.06E+12 10018.4 ±
94.2
7.21 4.33E+12 20550.6 ±
137.7
17.6 1.06E+13 49580.0 ±
738.7
P-3 sample
14351.2 ±
196.6
y=4.684×10⁻⁹x+2.028×10²
sample

13
Concentration of activated 147Sm solution is :39 103.51
8.49
10684.4
8.202)6.1962.14351(−− ×
××
−±
= (2.92 ± 0.06) × 1015 147Sm atoms/g
Dilution and purification for AMS measurement
5. 36.6 g of activated 147Sm solution was mixed with 4.45 g (= 4 mL, 5.78 × 10¹⁹ 147Sm
atoms) of natSm solution (21.6 mg natSm/g-soln.).
6. The solution was mixed well and then Sm was precipitated with ammonia water.
7. The Sm precipitate was dissolved in a few drops of HCl and diluted to ~50 mL with
deionized water.
8. 1 mL of the solution was loaded on each Ln resin column. 20 mL of 0.25M HCl was
passed through the column. Subsequently, 0.50 M HCl was passed through the column.
Sm comes out with 0.50 M HCl. Sm was precipitated with ammonia water. The
precipitate was heated in an oven (450 oC, 7 hours). The precipitate was shipped to
Argonne.
Dilution rate is : 6.3610)06.092.2(
1078.56.3610)06.092.2(15
1915
××±×+××±
= 551 ± 8
P-4
Measurement of 147Sm content
1. Alpha measurement sample, which Sm(OH)3 was mounted on a Teflon filter, was soaked
in ~4M HCl.
Alpha activity ratio 146Sm/147Sm: (4.58 ± 0.10) × 10−1
2. The filter was removed and weight of the solution was measured.
The weight: 37.7g
3. 51.9 mg (=50 µL) of the solution was diluted to 51.7g (≅ 50 mL) with ~1M HNO3 for
ICP-MS measurement.

14
4. 147Sm content in the solution was determined by ICP-MS.
natSm
concentration
(ng/g-soln.)
147Sm
concentration
(atoms/g-
soln.)
count rate
(cps)
0.0333 2.00E+10 210.2 ± 19.3
0.696 4.18E+11 2067.8 ± 13.6
3.44 2.06E+12 10018.4 ± 94.2
7.21 4.33E+12 20550.6 ± 137.7
17.6 1.06E+13 49580.0 ± 738.7
P-4 sample 8252.2 ± 90.0
Concentration of activated 147Sm solution is
39 109.51
7.51
10684.4
8.202)0.902.8252(−− ×
××
−±= (1.71 ± 0.02) × 1015 147Sm atoms/g
Dilution and purification for AMS measurement
5. 37.7 g of activated 147Sm solution was mixed with 4.44 g (= 4 mL, 5.76 × 10¹⁹ 147Sm
atoms) of natSm solution (21.6 mg natSm/g-soln.).
6. The solution was mixed well and then Sm was precipitated with ammonia water.
7. The Sm precipitate was dissolved in a few drops of HCl and diluted to ~50 mL with
deionized water.
8. 1 mL of the solution was loaded on each Ln resin column. 20 mL of 0.25M HCl was
passed through the column. Subsequently, 0.50 M HCl was passed through the column.
Sm comes out with 0.50 M HCl. Sm was precipitated with ammonia water. The
precipitate was heated in an oven (450 oC, 7 hours). The precipitate was shipped to
Argonne.
Dilution rate is :7.3710)02.071.1(
1076.57.3710)02.071.1(15
1915
××±×+××±
= 894 ± 10
y=4.684×10⁻⁹x+2.028×10²
sample

15
G-2
Measurement of 147Sm content
1. Alpha measurement sample, which Sm(OH)3 was mounted on a Teflon filter, was soaked
in ~4M HCl.
Alpha activity ratio 146Sm/147Sm: (4.04 ± 0.14) × 10−3
2. The filter was removed and weight of the solution was measured.
The weight: 38.7g
3. 51.2 mg (=50 µL) of the solution was diluted to 51.9g (≅ 50 mL) with ~1M HNO3 for
ICP-MS measurement.
4. 147Sm content in the solution was determined by ICP-MS.
natSm concentration (ng/g-soln.)
147Sm concentration
(atoms/g-soln.)
count rate (cps)
0.0333 2.00E+10 210.2 ± 19.3 0.696 4.18E+11 2067.8 ± 13.6
3.44 2.06E+12 10018.4 ±
94.2
7.21 4.33E+12 20550.6 ±
137.7
17.6 1.06E+13 49580.0 ±
738.7
G-2 sample
50862.0 ± 213.6
Concentration of activated 147Sm solution is: =×
××
−±−− 39 102.51
9.51
10684.4
8.202)6.2130.50862(
= (1.09 ± 0.01) × 1017 147Sm atoms/g
Dilution and purification for AMS measurement
5. 38.7 g of activated 147Sm solution was mixed with 4.46 g (= 4 mL, 5.78 × 10¹⁹ 147Sm
atoms) of natSm solution (21.6 mg natSm/g-soln.).
6. The solution was mixed well and then Sm was precipitated with ammonia water.
7. The Sm precipitate was dissolved in a few drops of HCl and diluted to ~50 mL with
deionized water.
y=4.684×10⁻⁹x+2.028×10²
sample

16
8. 1 mL of the solution was loaded on each Ln resin column. 20 mL of 0.25M HCl was
passed through the column. Subsequently, 0.50 M HCl was passed through the column.
Sm comes out with 0.50 M HCl. Sm was precipitated with ammonia water. The
precipitate was heated in an oven (450 oC, 7 hours). The precipitate was shipped to
Argonne.
Dilution rate is : =××±
×+××±7.3810)01.009.1(
1078.57.3810)01.009.1(16
1916
137 ± 1
N-2, N-7, N-8
Measurement of 147Sm content
1. 1.09 g of activated 147Sm stock solution was diluted to 34.3 g with ~1M HNO3.
Alpha activity ratio 146Sm/147Sm: (6.27 ± 0.14) × 10−3
2. In addition, 51.8 mg (=50 µl) of the diluted solution was diluted to 50.8g (≅ 50 mL) with
~1M HNO3 for ICP-MS measurement.
3. 147Sm content in the solution was determined by ICP-MS.
natSm concentration (ng/g-soln.)
147Sm concentration
(atoms/g-soln.)
count rate (cps)
0.0333 2.00E+10 210.2 ± 19.3 0.696 4.18E+11 2067.8 ± 13.6
3.44 2.06E+12 10018.4 ±
94.2
7.21 4.33E+12 20550.6 ±
137.7
17.6 1.06E+13 49580.0 ±
738.7
N-2 sample
80302.0 ± 465.8
Concentration of activated 147Sm solution is:
=××
××
−±−− 09.1
3.34
108.51
8.50
10684.4
8.202)8.46580302(39
(5.28 ± 0.03) × 1017 147Sm atoms/g
y=4.684×10⁻⁹x+2.028×10²
sample

17
Dilution and purification for AMS measurement (N-2)
4. 1.08g of activated 147Sm solution was mixed with 4.43 g (= 4 mL, 5.75 × 10¹⁹ 147Sm
atoms) of natSm solution (21.6 mg natSm/g-soln.).
5. The solution was mixed well and then Sm was precipitated with ammonia water.
6. The Sm precipitate was dissolved in a few drops of HCl and diluted to ~50 mL with
deionized water.
7. 1 mL of the solution was loaded on each Ln resin column. 20 mL of 0.25M HCl was
passed through the column. Subsequently, 0.50 M HCl was passed through the column.
Sm comes out with 0.50 M HCl. Sm was precipitated with ammonia water. The
precipitate was heated in an oven (450 oC, 7 hours). The precipitate was shipped to
Argonne.
Dilution rate is: =××±
×+××±08.110)03.028.5(
1075.508.110)03.028.5(17
1917
102 ± 1
Dilution and purification for AMS measurement (N-7)
4. 2.013g of activated 147Sm solution was mixed with 8.311 g (= 8 mL, 3.42 × 10¹⁹ 147Sm
atoms) of natSm solution (6.86 mg natSm/g-soln.).
5. The solution was mixed well and then Sm was precipitated with ammonia water.
6. The Sm precipitate was dissolved in a few drops of HCl and diluted to ~50 mL with
deionized water.
7. 1 mL of the solution was loaded on each Ln resin column. 20 mL of 0.25M HCl was
passed through the column. Subsequently, 0.50 M HCl was passed through the column.
Sm comes out with 0.50 M HCl. Sm was precipitated with ammonia water. The
precipitate was heated in an oven (450 oC, 7 hours). The precipitate was shipped to
Argonne.
Dilution rate is: =××±
×+××±013.210)03.028.5(
1042.3013.210)03.028.5(17
1917
33.2 ±0.2

18
Dilution and purification for AMS measurement (N-8)
4. 1.020g of activated 147Sm solution was mixed with 3.164g (= 3 mL, (4.94±0.19)×1019 147Sm atoms) of natSm solution (26.0±1.0 mg natSm/g-soln.).
5. The solution was mixed well and then Sm was precipitated with ammonia water.
6. The Sm precipitate was dissolved in a few drops of HCl and diluted to ~50 mL with
deionized water.
7. 1 mL of the solution was loaded on each Ln resin column. 20 mL of 0.25M HCl was
passed through the column. Subsequently, 0.50 M HCl was passed through the column.
Sm comes out with 0.50 M HCl. Sm was precipitated with ammonia water. The
precipitate was heated in an oven (450 oC, 7 hours). The precipitate was shipped to
Argonne.
Dilution rate is : =××±
×±+××±020.110)03.028.5(
10)19.094.4(020.110)03.028.5(17
1917
92.8 ±5.0

19
Fig. S1. Charge state distribution measured after the first analysis magnet following the ECR ion
source for a metallic sample of enriched 152Sm. The magnet current on the horizontal axis
determines the magnetic field of the injection mass spectrometer. The analyzed beam current
(vertical axis) was measured in a Faraday cup at the image position of the analysis magnet.
Charge state 22+ for 147Sm and 22+, 23+ for 152Sm were used in the experiment and the
charge state distribution shown served for normalization.

20
Fig. S2
Isotopic ratio 152Sm/147Sm measured during our experiment using the same accelerator
scaling procedure as used for the ratio 146Sm/147Sm. The unweighted average and standard
deviation value, 1.8 ± 0.2 shown in the figure, is consistent with the natural ratio 1.785 ±
0.024 (derived from (37)). Sample N-8 showed larger fluctuations than other samples and
additional measurements were made. Error bars represent random errors estimated in ion
transmission through the accelerator; the standard deviation of the data points (0.2) is
consistent with these random errors.

21
Fig. S3
Individual (repeat) determinations of the double ratio of the 146Sm/147Sm atom ratio measured
by AMS in individual repeat measurements of various samples to that expected in the same
sample from its 146Sm/147Sm α activity ratio using the 146,147Sm currently adopted half-lives.
The double ratio is equivalent to the ratio of the presently measured 146Sm half-life to that
adopted in the literature. Error bars represent statistical errors in alpha activity and ion
counting, random errors in dilution ratios and ion transmission. The AMS atom ratios are
measured relative to the charge current of 147Sm22+ measured in an electron-suppressed
Faraday Cup in front of the gas-filled magnetic spectrograph. Fluctuations observed for
sample N-8 are larger than for other samples but consistent with the random errors assigned

22
(see also Fig. S2). The unweighted average of the individual points is slightly different from
the average (0.66) in Fig. 2 because there data of each sample were grouped and averaged.
The uncertainty shown is the standard deviation of the data points (unweighted).

23
Fig. S4
Dilution plot for samples N-x (Table S1) prepared by dilution from a common stock solution
of the neutron activated (147Sm(n,2n)146Sm) material. The horizontal axis represents the
inverse of the dilution factor and the vertical axis the atom ratio 146Sm/147Sm measured by
AMS after dilution. Solid dots correspond to normalization by 147Sm22+ charge and solid
squares by 147Sm counts (see SOM Materials and methods). The lower solid line represents a
best linear fit of the data points whose slope is proportional to the measured 146Sm half-life
(68 ± 7 Ma). The upper solid line is the dilution line for the N-x samples expected from the α
activity measured and the currently adopted 146Sm half-life value (103 Ma).

24
Fig. S5
Reinterpretation of the differentiation age and 147Sm/144Nd ratio of the depleted Martian
mantle source of nakhlite meteorites (Foley et al. (16) and references therein, compare with
Fig.5 in (16)), using the values derived in our work for the 146Sm half-life 1462/1t = 68 Ma and
solar system initial ratio r0= (146Sm/144Sm)0 = 0.0094. The axes represent the deviation in
142Nd isotopic abundance from CHUR in units of 10-4
( , where DM stands for depleted mantle) plotted
against the deviation of 182W isotopic abundance ( ).
Yellow squares are the individual nakhlites measured and the red diamond is their mean (16).
( )( )
4tan183182
183182182 101 ×
−=
dards
DM
WW
WWWε
( )( )
4
144142
144142
142 101 ×
−=
CHUR
DM
NdNd
NdNdNdε

25
Black curves are models calculated using eqs. 5-6 of Foley et al. (16) (with the new 1462/1t and
r0 values): upper curve is a majorite-bearing deep mantle (MDM) source, 147Sm/144Nd ~0.303
and 180Hf/183W ~126; lower curve is garnet-bearing shallow mantle (GSM) source,
147Sm/144Nd ~0.266 and 180Hf/183W ~43. Open circles on the black curves have ages (after
start of SS formation) labeled with “Ma”. Blue curves are depleted mantle models by Kleine
et al. (38): upper curve is a source with 147Sm/144Nd = 0.281 and 180Hf/183W = 27, middle
curve is a source with 147Sm/144Nd = 0.255 and 180Hf/183W = 22, lower curve is a source with
147Sm/144Nd = 0.231 and 180Hf/183W = 18. Labeled dashed lines connect points of same age
(in Ma) on blue curves. The mean data point (red diamond) is best matched by a composition
147Sm/144Nd = 0.245 and 180Hf/183W = 20 (green curve). This composition is less depleted
than that inferred in Foley et al. (16), where the data were best explained by 147Sm/144Nd =
0.255-0.266 and 180Hf/183W = 22-43. In addition, the reinterpretation of the data favors the
younger part of the 8-25 Ma age range inferred in the original paper. The young age may be
in line with the recent finding that Mars accreted within ~ 4 Ma (33).

26
Fig. S6
Reinterpretation of the differentiation age of the Martian mantle source of the shergotttite
meteorites measured by Debaille et al. (17) (solid squares), using the values derived here 1462/1t
= 68 Ma and r0= (146Sm/144Sm)0 = 0.0094; compare with their Fig. 2. The axes
represent ε142Nd (rel. to the terrestrial standard) vs. ε143Nd
( ) at time t = 150 Ma before present (bp). Green
squares – depleted shergottites, yellow square – intermediate shergottite, red squares –
enriched shergottites. Alternating black and blue diagonal dashed lines are loci of equal
mantle depletion ages (Ma bp), as labeled. Alternating black and blue solid curves are loci of
equal 147Sm/144Nd ratios, as labeled. Lines were calculated with eqs. 1-2. of Debaille et al.
( )( )
4
144143
144143143 101)( ×
−=
CHUR
t
DM
t
NdNd
NdNdtNdε

27
(17) and their parameters, with the exception of the new values from our work, 1462/1t and r0=
(146Sm/144Sm)0. The solid black diagonal line is a mixing line between the different
shergottite groups. Following Debaille et al. (17), the differentiation age of the enriched
shergottite source is determined by the isochron which passes through the intersection of the
mixing line and the 147Sm/144Nd = 0.159 line. In our figure, this is the 4,476 Ma isochron line
(dashed green) that corresponds to ~90 Ma after the start of SS formation (taken as 4,568 Ma
bp). This analysis assumes that the Sm/Nd ratio of the source is CHUR. Caro et al. (18)
interpreted the mixing line as an isochron and assumed a super-chondritic Sm/Nd ratio for
the source. In this case, all shergottite groups came from one depleted Martian mantle source
with a differentiation age of ~40 Ma.

28
Table S1: Alpha-activity and atom ratios of 146Sm and 147Sm in the activated samples.
Sample notation
147Sm activation
147Sm activity
146Sm activity
146Sm/147Sm activity ratio
Dilution ratio
to AMS sample
146Sm/147Sm expected atom
ratioa
146Sm22+/147Sm22+ measured atom
ratio
(146Sm/147Sm)meas./ (146Sm/147Sm)expect.
(mBq) (mBq) (10-3) (10-8) (10-8)
G-2 (γ,n) 46.0 ± 0.1 0.185 ± 0.007
4.04 ± 0.14 137 ± 1 2.83 ± 0.16 1.90 ± 0.21b 0.670 ± 0.081
P-3 (p,2nε) 9.80 ± 0.09
2.95 ± 0.05 301 ± 6 551 ± 8 52.7 ± 2.7 31.1 ± 2.7b 0.590 ± 0.056
P-4 6.28 ± 0.07
2.89 ± 0.05 460 ± 10 894 ± 10 49.6 ± 2.5 30.5 ± 2.6c 0.615 ± 0.051
31.5 ± 1.3c 0.635 ± 0.027 31.4 ± 0.9c 0.634 ± 0.018 31.4 ± 0.9c 0.633 ± 0.018 29.6 ± 0.6c 0.596 ± 0.011 29.2 ± 0.6c 0.589 ± 0.012 29.4 ± 0.6c 0.593 ± 0.012
P-4 unw ave ± st devd
30.5 ± 1.0 0.61±0.02
N-2 (n,2n) 42.3 ± 0.1 0.263 ± 0.006
6.27 ± 0.14 102 ± 0.6
5.92 ± 0.3 3.81 ± 0.35b, c 0.643 ± 0.064
3.26 ± 0.25b, c 0.551 ± 0.048 3.48 ± 0.24b, c 0.588 ± 0.046
N-2 unw ave ± st dev
3.52 ± 0.28 0.59±0.05
N-7 33.2 ±
0.2 18.2 ± 0.9 12.0 ± 0.3c 0.657 ± 0.031
11.3 ± 1.0c 0.622 ± 0.061 13.2 ± 0.9c 0.726 ± 0.056 11.6 ± 0.2c 0.640 ± 0.027
N-7 unw ave ± st dev
12.02 ± 0.83 0.66±0.05
N-7e 14.8 ± 0.7c 0.81 ± 0.05 13.4 ± 1.8c 0.74 ± 0.10 14.8 ± 0.6c 0.81 ± 0.05 14.6 ± 0.5c 0.80 ± 0.04
N-7d unw ave ± st dev
14.4 ± 0.67 0.79 ± 0.05
N-8 92.8 ±
5.0 6.51 ± 0.5 4.97 ± 0.50c 0.763 ± 0.092
4.37 ± 0.42c 0.671 ± 0.078 5.03 ± 0.30c 0.772 ± 0.069 4.45 ± 0.20c 0.683 ± 0.055 3.54 ± 0.39c 0.544 ± 0.070 4.08 ± 0.45c 0.627 ± 0.081 4.03 ± 0.64c 0.619 ± 0.107 4.10 ± 0.39c 0.630 ± 0.073 4.87 ± 0.09c 0.748 ± 0.052 4.45 ± 0.13c 0.683 ± 0.050 4.94 ± 0.21c 0.759 ± 0.060

29
5.26 ± 1.18c 0.808 ± 0.189 N-8 unw
ave ± st dev 4.51 ± 0.51 0.69 ± 0.08
N-8e 3.64 ± 0.13c 0.56 ± 0.04
3.66 ± 0.16c 0.56 ± 0.04 4.37 ± 0.40c 0.67 ± 0.08 4.14 ± 0.65c 0.64 ± 0.11 4.94 ± 0.75c 0.76 ± 0.13 4.59 ± 0.70c 0.71 ± 0.12 4.32 ± 0.15c 0.66 ± 0.05 3.75 ± 0.40c 0.58 ± 0.07 5.48 ± 0.08c 0.84 ± 0.06 4.51 ± 0.75c 0.69 ± 0.12
N-8e unw ave ± st dev
4.34 ± 0.59 0.67± 0.10
unw ave of ave ±st devf
0.66 ± 0.07
a calculated from cols 3,4, t1/2(146Sm)= 103 Ma (22,23), t1/2(
147Sm)= 107.0 Ga (24) b 146Sm22+/152Sm23+ measured and converted to 146Sm22+/147Sm22+ ratio using measured 22+/23+ charge
state ratio (Fig. S1) c repeat measurements of the same sample
d unweighted average and standard deviation e measured relative to attenuated 147Sm count rate (29) f unweighted average of sample averages and standard deviation

30
Table S2 : Compilation of 147Sm half-life measurements in the literature
Method Half-life (1011 a) Ref.
4π gas flow counter 1.25 ± 0.06 Beard et al., 1954 (39)
Liquid Scintillation 1.28 ± 0.04 Beard et al., 1958 (40)
Ionization Chamber 1.15 ± 0.05 MacFarlane et al., 1961
(41)
Liquid Scintillation 1.05 ± 0.02 Wright et al., 1961 (42)
Liquid Scintillation 1.04 ± 0.03 Donhoffer, 1964 (43)
Ionization chamber 1.06 ± 0.02 Gupta et al., 1970 (44)
Solid state detector 1.17 ± 0.02 Kinoshita et al., 2003
(45)
Liquid scintillation 1.070 ± 0.009a Kossert et al., 2009 (24)
Track detectors 1.06 ± 0.01 (metal Sm) 1.07 ± 0.01 (Sm2O3)
Su et al., 2010 (46)
a Value used in this work.

16