shaping the future - olam international
TRANSCRIPT
Olam
International Limited
Annual R
eport 2012
Shaping the FutureHow Olam is driving sustainable growth while solving for risk
Seeing the Big Picture Addressing the global supply demand imbalance in the agri-complex
Empowering Our People Leveraging our strengths by developing global leaders
Growing Responsibly Improving small-scale farmer incomes & livelihoods
Olam International Limited9 Temasek Boulevard11-02 Suntec Tower TwoSingapore 038989
Telephone (65) 6339 4100Facsimile (65) 6339 9755www.olamonline.com
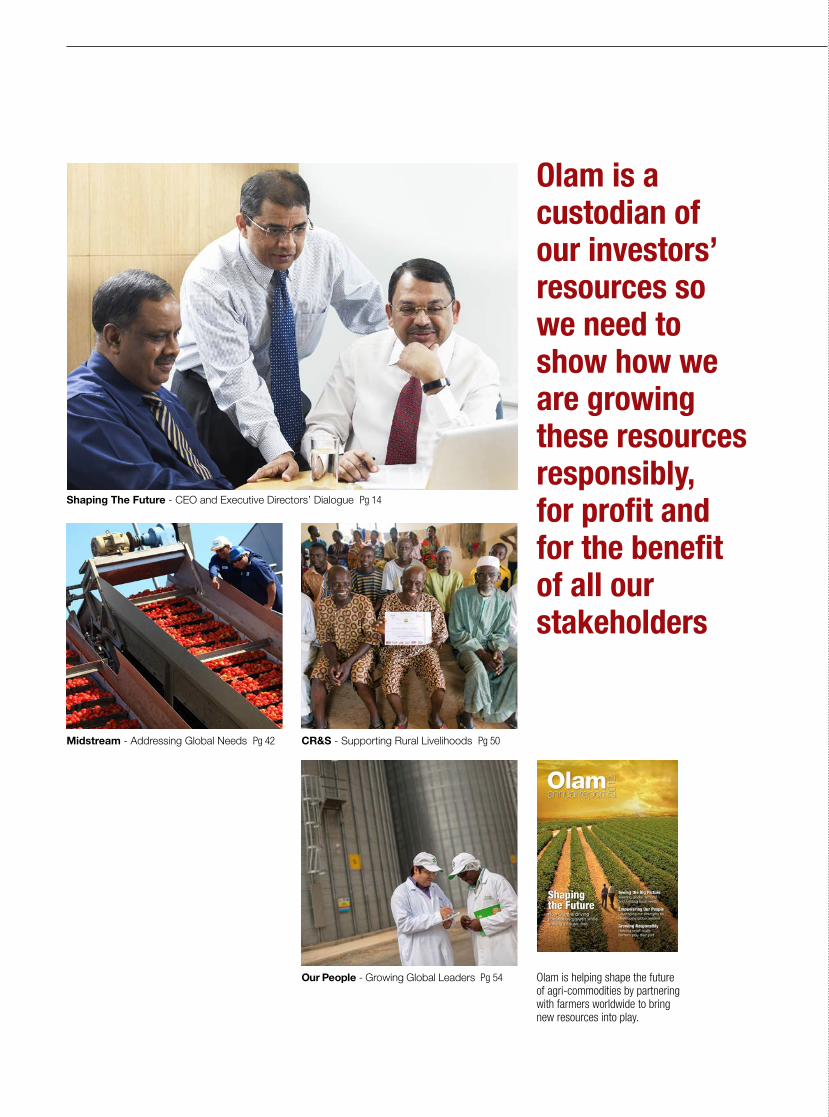
Shaping The Future - CEO and Executive Directors’ Dialogue Pg 14
Midstream - Addressing Global Needs Pg 42
Olam is helping shape the future of agri-commodities by partnering with farmers worldwide to bring new resources into play.
Olam is a custodian of our investors’ resources so we need to show how we are growing these resources responsibly, for profit and for the benefit of all our stakeholders
CR&S - Supporting Rural Livelihoods Pg 50
Our People - Growing Global Leaders Pg 54
1
02 Performance Overview
04 Performance Analysis
06 Financial Summary
07 Financial Highlights
08 Chairman’s Statement
10 Board of Directors
14 CEO and Executive Directors’ Dialogue CEO Sunny Verghese and Executive Directors Sridhar Krishnan and A. Shekhar discuss Olam’s approach to sustainable long-term growth
28 Executive Committee
30 Global Presence
32 Business Review Senior managers discuss what is driving global growth in the agri-businesses sector
34 Upstream
38 Origination
42 Midstream
46 New Growth
50 Corporate Responsibility & Sustainability Implementing processes to deliver sustainable products across all our geographies
54 Our People
56 Risk Management
58 Corporate Governance Why good Corporate Governance is vital for success
77 Key Information Regarding Directors
81 Corporate Information
82 6-Year Financial Analysis
86 General Information
89 Directors’ Report and Audited Financial Statements
Contents
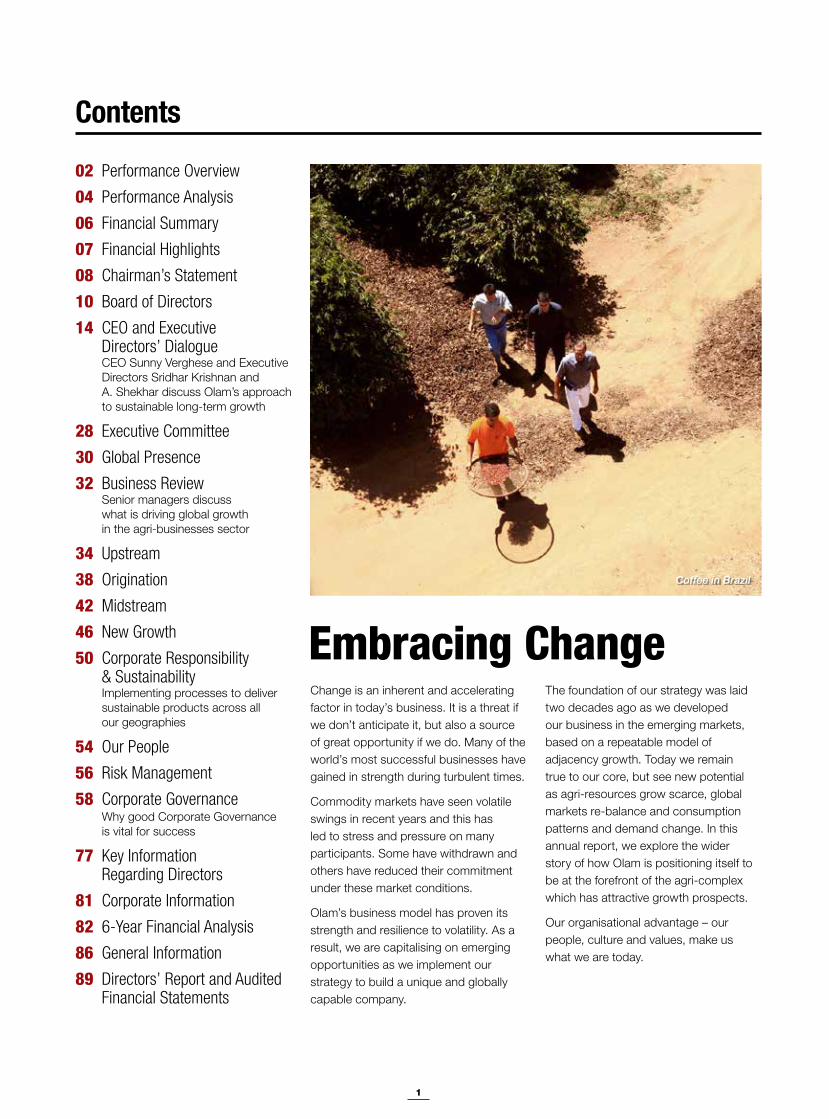
Embracing ChangeChange is an inherent and accelerating factor in today’s business. It is a threat if we don’t anticipate it, but also a source of great opportunity if we do. Many of the world’s most successful businesses have gained in strength during turbulent times.
Commodity markets have seen volatile swings in recent years and this has led to stress and pressure on many participants. Some have withdrawn and others have reduced their commitment under these market conditions.
Olam’s business model has proven its strength and resilience to volatility. As a result, we are capitalising on emerging opportunities as we implement our strategy to build a unique and globally capable company.
The foundation of our strategy was laid two decades ago as we developed our business in the emerging markets, based on a repeatable model of adjacency growth. Today we remain true to our core, but see new potential as agri-resources grow scarce, global markets re-balance and consumption patterns and demand change. In this annual report, we explore the wider story of how Olam is positioning itself to be at the forefront of the agri-complex which has attractive growth prospects.
Our organisational advantage – our people, culture and values, make us what we are today.
Coffee in Brazil
2
VOLUME
SALES REVENUE
NET CONTRIBUTION
NET CONTRIBUTION / TONNE
EBITDA
NPAT
FY2011
FY2012
8.5mtonnes
10.7mtonnes
+26.3%
FY2011
FY2012
S$1.4bS$1.2b
+13.0%
FY2011
FY2012
S$957.8mS$863.0m
+11.0%
FY2011
FY2012
S$129
S$145
(11.0%)
FY2011
FY2012
S$403.8m
S$444.6m
(9.2%)
FY2011
FY2012
S$17.1bS$15.8b
+8.2%
Performance Overview
3
EPS
FY2011
FY2012
(26.2%)
S$0.203
S$0.150
ROIC
FY2011
FY2012
10.7%14.3%
(3.6%)
ROE
FY2011
FY2012
14.2%21.3%
(7.1%)
EQUITY SPREAD
FY2011
FY2012
4.2%11.3%
(7.1%)
CAPITAL SPREAD
FY2011
FY2012
3.5%7.1%
(3.6%)
NET ASSET VALUE PER SHARE*
* Before Fair Value Adujstment Reserve
FY2011
FY2012
S$1.45
S$1.15 +25.8%
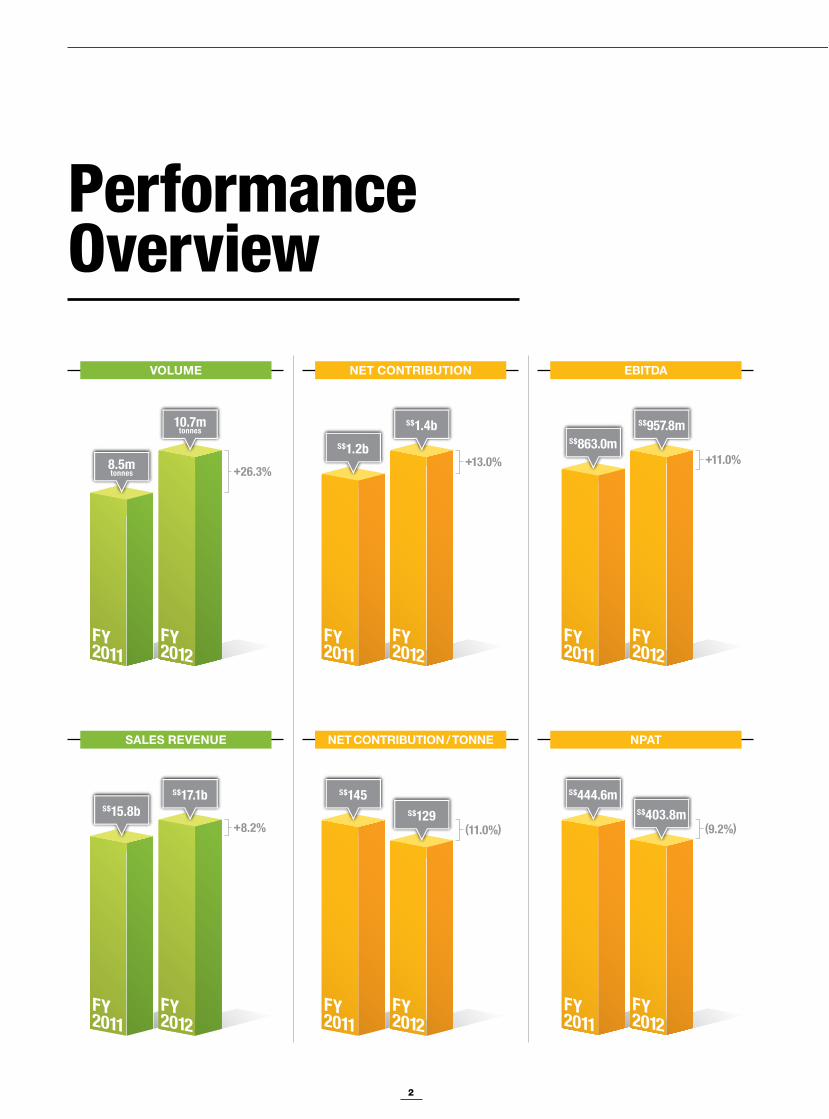
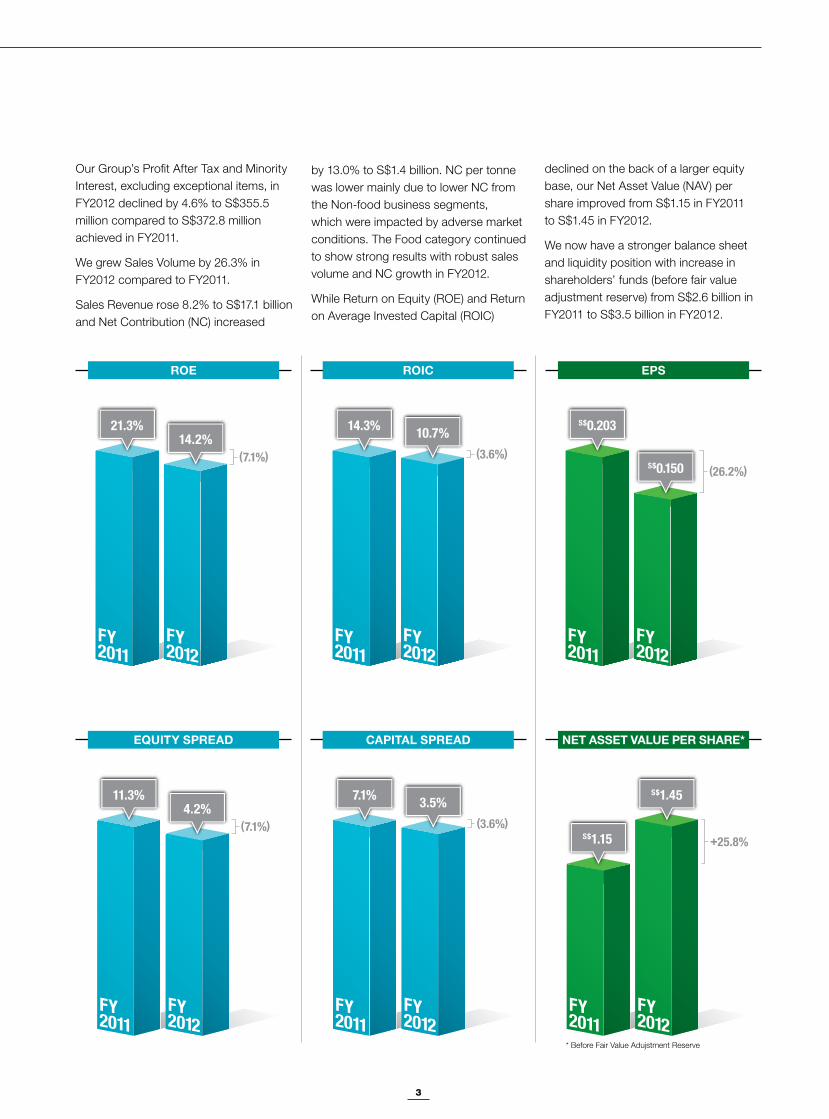
by 13.0% to S$1.4 billion. NC per tonne was lower mainly due to lower NC from the Non-food business segments, which were impacted by adverse market conditions. The Food category continued to show strong results with robust sales volume and NC growth in FY2012.
While Return on Equity (ROE) and Return on Average Invested Capital (ROIC)
declined on the back of a larger equity base, our Net Asset Value (NAV) per share improved from S$1.15 in FY2011 to S$1.45 in FY2012.
We now have a stronger balance sheet and liquidity position with increase in shareholders’ funds (before fair value adjustment reserve) from S$2.6 billion in FY2011 to S$3.5 billion in FY2012.
Our Group’s Profit After Tax and Minority Interest, excluding exceptional items, in FY2012 declined by 4.6% to S$355.5 million compared to S$372.8 million achieved in FY2011.
We grew Sales Volume by 26.3% in FY2012 compared to FY2011.
Sales Revenue rose 8.2% to S$17.1 billion and Net Contribution (NC) increased
4
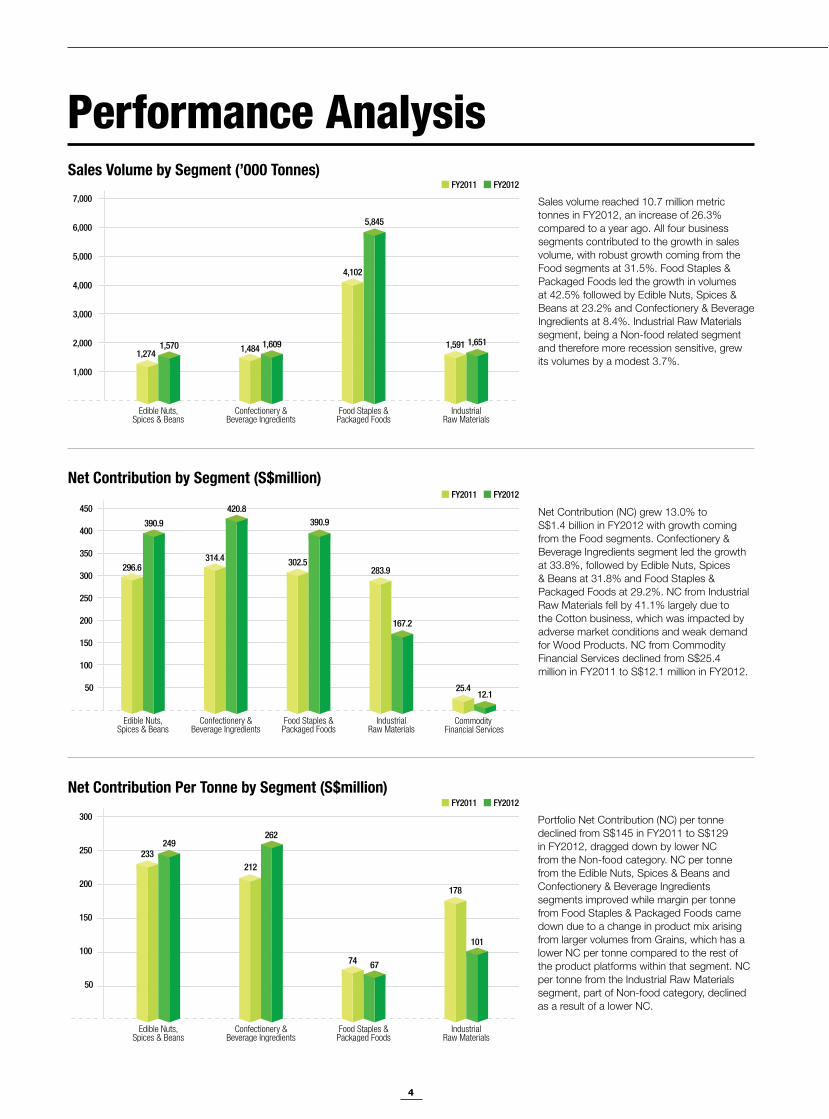
Sales volume reached 10.7 million metric tonnes in FY2012, an increase of 26.3% compared to a year ago. All four business segments contributed to the growth in sales volume, with robust growth coming from the Food segments at 31.5%. Food Staples & Packaged Foods led the growth in volumes at 42.5% followed by Edible Nuts, Spices & Beans at 23.2% and Confectionery & Beverage Ingredients at 8.4%. Industrial Raw Materials segment, being a Non-food related segment and therefore more recession sensitive, grew its volumes by a modest 3.7%.
Edible Nuts,Spices & Beans
Confectionery &Beverage Ingredients
Food Staples &Packaged Foods
IndustrialRaw Materials
1,000
2,000
3,000
4,000
5,000
6,000
7,000
1,2741,570
4,102
5,845
1,591 1,651
FY2011 FY2012
1,484 1,609
Sales Volume by Segment (’000 Tonnes)
Net Contribution (NC) grew 13.0% to S$1.4 billion in FY2012 with growth coming from the Food segments. Confectionery & Beverage Ingredients segment led the growth at 33.8%, followed by Edible Nuts, Spices & Beans at 31.8% and Food Staples & Packaged Foods at 29.2%. NC from Industrial Raw Materials fell by 41.1% largely due to the Cotton business, which was impacted by adverse market conditions and weak demand for Wood Products. NC from Commodity Financial Services declined from S$25.4 million in FY2011 to S$12.1 million in FY2012.
Edible Nuts,Spices & Beans
Confectionery &Beverage Ingredients
Food Staples &Packaged Foods
Commodity Financial Services
IndustrialRaw Materials
50
100
150
200
250
300
350
400
450
314.4
420.8
302.5
390.9
283.9
167.2
25.412.1
296.6
390.9
FY2011 FY2012
Net Contribution by Segment (S$million)
Portfolio Net Contribution (NC) per tonne declined from S$145 in FY2011 to S$129 in FY2012, dragged down by lower NC from the Non-food category. NC per tonne from the Edible Nuts, Spices & Beans and Confectionery & Beverage Ingredients segments improved while margin per tonne from Food Staples & Packaged Foods came down due to a change in product mix arising from larger volumes from Grains, which has a lower NC per tonne compared to the rest of the product platforms within that segment. NC per tonne from the Industrial Raw Materials segment, part of Non-food category, declined as a result of a lower NC.
50
100
150
200
250
300
233249
212
262
74 67
178
101
FY2011 FY2012
Edible Nuts,Spices & Beans
Confectionery &Beverage Ingredients
Food Staples &Packaged Foods
IndustrialRaw Materials
Net Contribution Per Tonne by Segment (S$million)
Performance Analysis
5
Value Chain Initiatives Net Contribution (S$m) Growth %
EBITDA (S$m) Growth %
FY2012 FY2011 FY2012 FY2011
Supply Chain & VAS 956 864 10.7% 614 572 7.2%
Margin (%) 6.5% 6.2% 4.1% 4.1%
Margin Per Tonne 105 121 67 80
% Share 69.2% 70.7% 64.1% 66.3%
Upstream 192 170 12.7% 174 154 12.8%
Margin (%) 51.0% 55.7% 46.3% 50.5%
Margin Per Tonne 662 633 600 573
% Share 13.9% 13.9% 18.2% 17.9%
Midstream & Downstream 234 189 23.8% 170 136 24.8%
Margin (%) 12.3% 11.5% 9.0% 8.3%
Margin Per Tonne 187 176 137 127
% Share 16.9% 15.4% 17.8% 15.8%
Total 1,382 1,223 13.0% 958 863 11.0%
Margin (%) 8.1% 7.7% 5.6% 5.5%
Margin Per Tonne 129 145 90 102
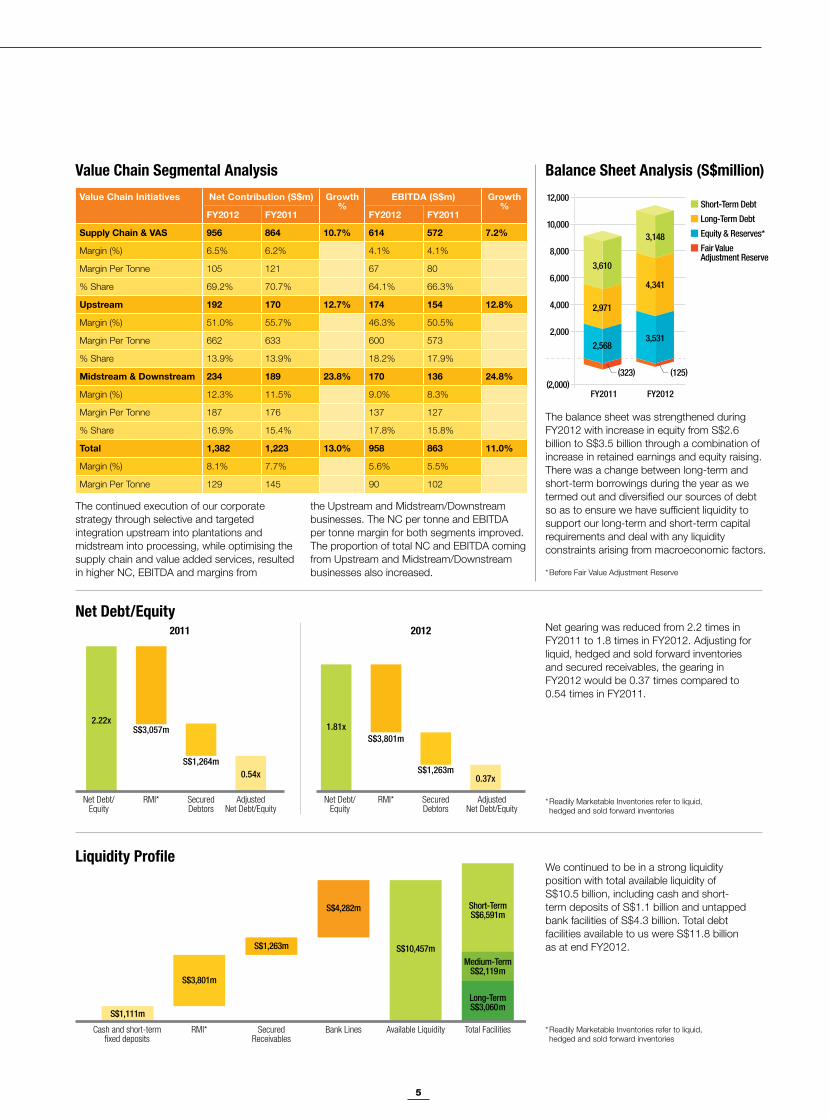
The balance sheet was strengthened during FY2012 with increase in equity from S$2.6 billion to S$3.5 billion through a combination of increase in retained earnings and equity raising. There was a change between long-term and short-term borrowings during the year as we termed out and diversified our sources of debt so as to ensure we have sufficient liquidity to support our long-term and short-term capital requirements and deal with any liquidity constraints arising from macroeconomic factors.
The continued execution of our corporate strategy through selective and targeted integration upstream into plantations and midstream into processing, while optimising the supply chain and value added services, resulted in higher NC, EBITDA and margins from
Net Debt/Equity
* Readily Marketable Inventories refer to liquid, hedged and sold forward inventories
* Readily Marketable Inventories refer to liquid, hedged and sold forward inventories
* Before Fair Value Adjustment Reserve
FY2012
2,000
(2,000)
4,000
6,000
8,000
10,000
12,000
FY2011
3,610
2,971
2,568
(323)
3,148
4,341
3,531
(125)
Balance Sheet Analysis (S$million)
Net Debt/Equity
RMI* SecuredDebtors
AdjustedNet Debt/Equity
2.22x
0.54x
S$3,057mS$3,801m
S$1,264m
Net Debt/Equity
RMI* SecuredDebtors
AdjustedNet Debt/Equity
1.81x
0.37xS$1,263m
2011 2012
Cash and short-termfixed deposits
RMI* SecuredReceivables
Bank Lines Available Liquidity Total Facilities
S$1,111m
S$3,801m
S$1,263m
S$4,282m
S$10,457m
Short-TermS$6,591m
Medium-TermS$2,119m
Long-TermS$3,060m
Net gearing was reduced from 2.2 times in FY2011 to 1.8 times in FY2012. Adjusting for liquid, hedged and sold forward inventories and secured receivables, the gearing in FY2012 would be 0.37 times compared to 0.54 times in FY2011.
We continued to be in a strong liquidity position with total available liquidity of S$10.5 billion, including cash and short-term deposits of S$1.1 billion and untapped bank facilities of S$4.3 billion. Total debt facilities available to us were S$11.8 billion as at end FY2012.
Liquidity Profile
Value Chain Segmental Analysis
the Upstream and Midstream/Downstream businesses. The NC per tonne and EBITDA per tonne margin for both segments improved. The proportion of total NC and EBITDA coming from Upstream and Midstream/Downstream businesses also increased.
Short-Term Debt
Long-Term Debt
Fair Value Adjustment Reserve
Equity & Reserves*
6
Financial Summary
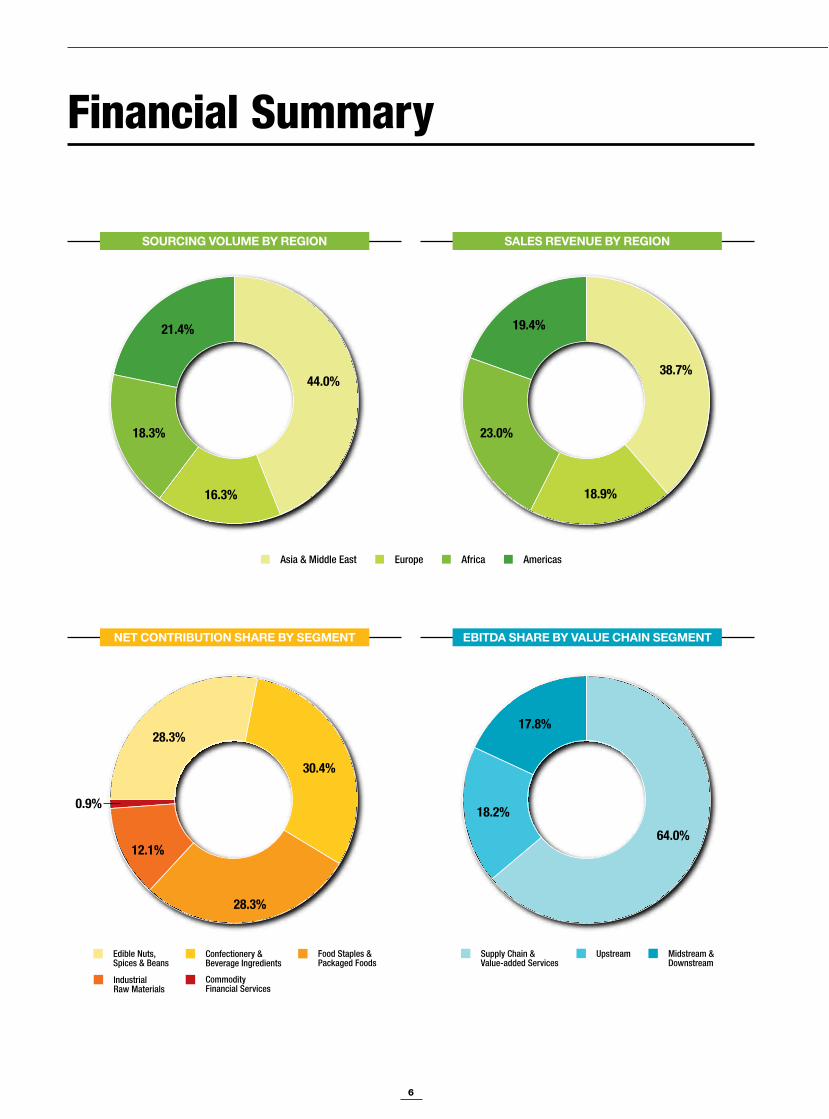
SALES REVENUE BY REGION
EBITDA SHARE BY VALUE CHAIN SEGMENT
SOURCING VOLUME BY REGION
NET CONTRIBUTION SHARE BY SEGMENT
38.7%
18.9%
23.0%
19.4%
64.0%
18.2%
17.8%
44.0%
16.3%
18.3%
21.4%
Supply Chain & Value-added Services
Upstream Midstream & Downstream
Edible Nuts, Spices & Beans
Confectionery & Beverage Ingredients
Food Staples & Packaged Foods
Industrial Raw Materials
Commodity Financial Services
Asia & Middle East AfricaEurope Americas
28.3%
30.4%
28.3%
12.1%
0.9%
7
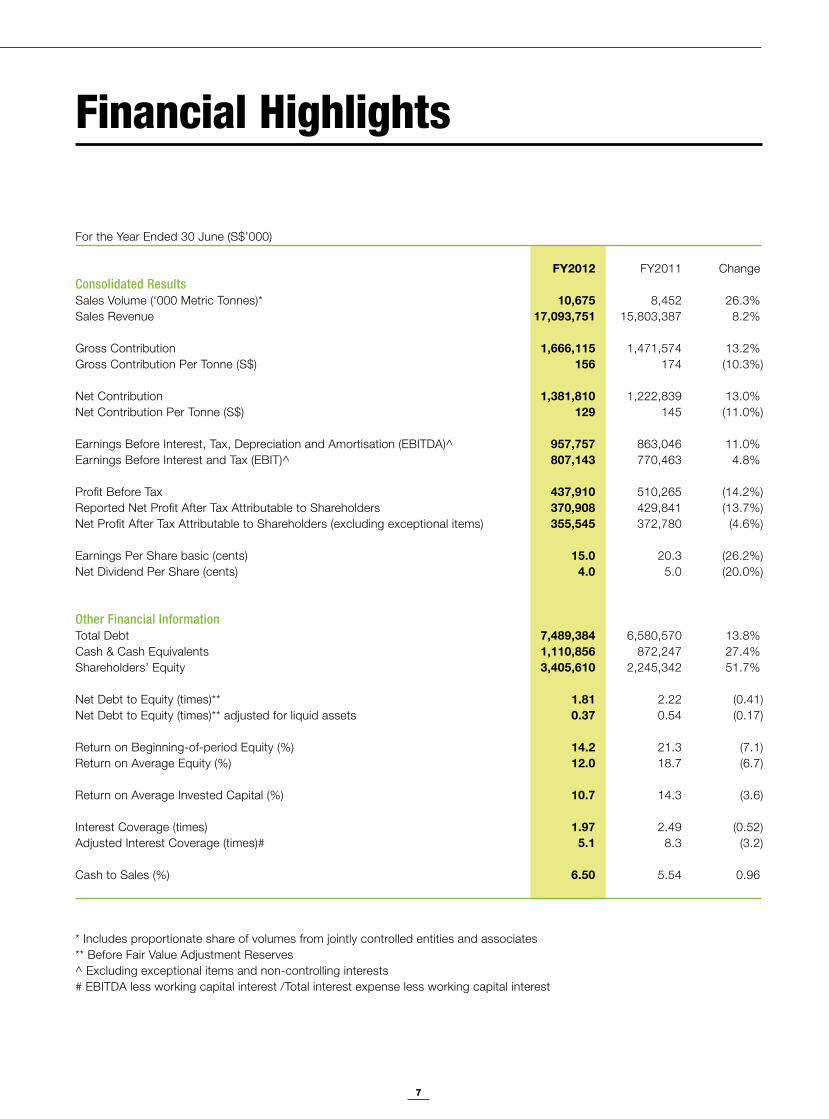
For the Year Ended 30 June (S$’000) FY2012 FY2011 Change Consolidated Results Sales Volume (‘000 Metric Tonnes)* 10,675 8,452 26.3% Sales Revenue 17,093,751 15,803,387 8.2% Gross Contribution 1,666,115 1,471,574 13.2% Gross Contribution Per Tonne (S$) 156 174 (10.3%) Net Contribution 1,381,810 1,222,839 13.0% Net Contribution Per Tonne (S$) 129 145 (11.0%) Earnings Before Interest, Tax, Depreciation and Amortisation (EBITDA)^ 957,757 863,046 11.0% Earnings Before Interest and Tax (EBIT)^ 807,143 770,463 4.8% Profit Before Tax 437,910 510,265 (14.2%) Reported Net Profit After Tax Attributable to Shareholders 370,908 429,841 (13.7%) Net Profit After Tax Attributable to Shareholders (excluding exceptional items) 355,545 372,780 (4.6%) Earnings Per Share basic (cents) 15.0 20.3 (26.2%) Net Dividend Per Share (cents) 4.0 5.0 (20.0%) Other Financial Information Total Debt 7,489,384 6,580,570 13.8% Cash & Cash Equivalents 1,110,856 872,247 27.4% Shareholders’ Equity 3,405,610 2,245,342 51.7% Net Debt to Equity (times)** 1.81 2.22 (0.41) Net Debt to Equity (times)** adjusted for liquid assets 0.37 0.54 (0.17) Return on Beginning-of-period Equity (%) 14.2 21.3 (7.1) Return on Average Equity (%) 12.0 18.7 (6.7) Return on Average Invested Capital (%) 10.7 14.3 (3.6) Interest Coverage (times) 1.97 2.49 (0.52) Adjusted Interest Coverage (times)# 5.1 8.3 (3.2) Cash to Sales (%) 6.50 5.54 0.96
* Includes proportionate share of volumes from jointly controlled entities and associates ** Before Fair Value Adjustment Reserves^ Excluding exceptional items and non-controlling interests # EBITDA less working capital interest /Total interest expense less working capital interest
Financial Highlights
8
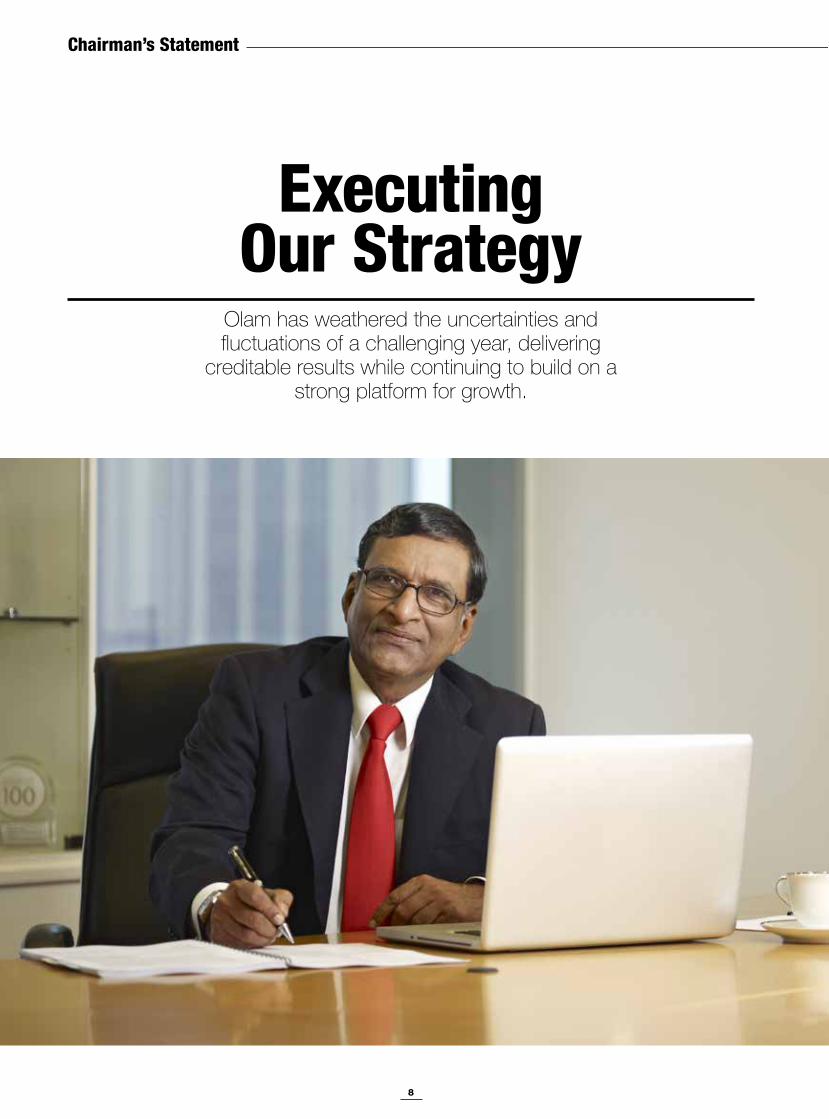
Chairman’s Statement
Executing Our Strategy
Olam has weathered the uncertainties and fluctuations of a challenging year, delivering
creditable results while continuing to build on a strong platform for growth.
9
FY2012 has been a challenging year for Olam characterised by macroeconomic uncertainties emanating broadly from Europe and the Middle East. The European sovereign debt crisis has cast a long shadow over global economic performance and the recovery is expected to be slow. Olam has weathered the resultant uncertainties and fluctuations, delivering creditable results and continuing to build on a strong platform for growth.
Our results were achieved under these difficult market conditions. However, our investments continue to lay the foundations that will shape the future of our company. We remain focused on our strategy and I am optimistic about the long-term prospects for continuing growth in the agri-commodity complex, as well as the opportunities this presents for delivering our strategy going forward.
We recorded a sales revenue growth of 8.2% in FY2012 to S$17.1 billion and a Profit after Tax and Minority Interest of S$355.5 million, excluding exceptional items, which was 4.6% below our excellent FY2011 performance. Our FY2012 results, while marginally lower than last year, demonstrate by and large, the resilience of the Olam model and our ability to deliver across highly volatile commodity and economic cycles.
I am optimistic about the long-term prospects for continuing growth in our sector and the opportunities this presents for delivering our strategy going forward. ”
The optimism, energy and determination of our talented multi-cultural team has enabled us to navigate this difficult period skilfully. Our Food-related business segments continued on their strong upward trajectory, delivering good volume and margin growth in FY2012. However our Non-food related segments registered a decline in Net Contribution this year, due to unfavourable market conditions that were driven by exceptional events.
I would like to take this opportunity to thank all our shareholders for their unstinting support and confidence in Olam. The Board of Directors is pleased to recommend a first and final dividend of 4.00 cents per share, subject to the approval of our shareholders. This amounts to a dividend pay-out of S$95.61 million and a pay-out ratio of 26% for FY2012.
A more detailed review of our results for the year and the operating performance of the Group is contained in the Financial Report on pages 90 to 183 of this report.
Good governance is the foundation on which we have built our business and this is deeply embedded in our business culture. We remain firmly committed to maintaining high standards in governance processes as a part of our accountability to all our shareholders.
The Board works closely with our management team on areas of strategy, risk, compliance and sustainability, all of which are critical to investors. We continue the process of evaluating the Board and individual members in their roles on our Board and Board Committees. We have a talented and committed team. We continue to invest in our people and develop leaders.
On behalf of the Board, I would like to congratulate and thank our global team of 18,000 Olamites for continuing to display an extraordinary commitment and putting in the discretionary effort which resulted in a strong performance under difficult economic and market conditions.
I would also like to thank my fellow Directors on the Board, our shareholders, investors, business partners and other stakeholders for their ongoing support of Olam. We will continue to build on our distinctive strengths and valuable experience gained through tough times to deliver value to our shareholders.
R. Jayachandran Chairman
“

10
Board of DirectorsBoard of Directors
11
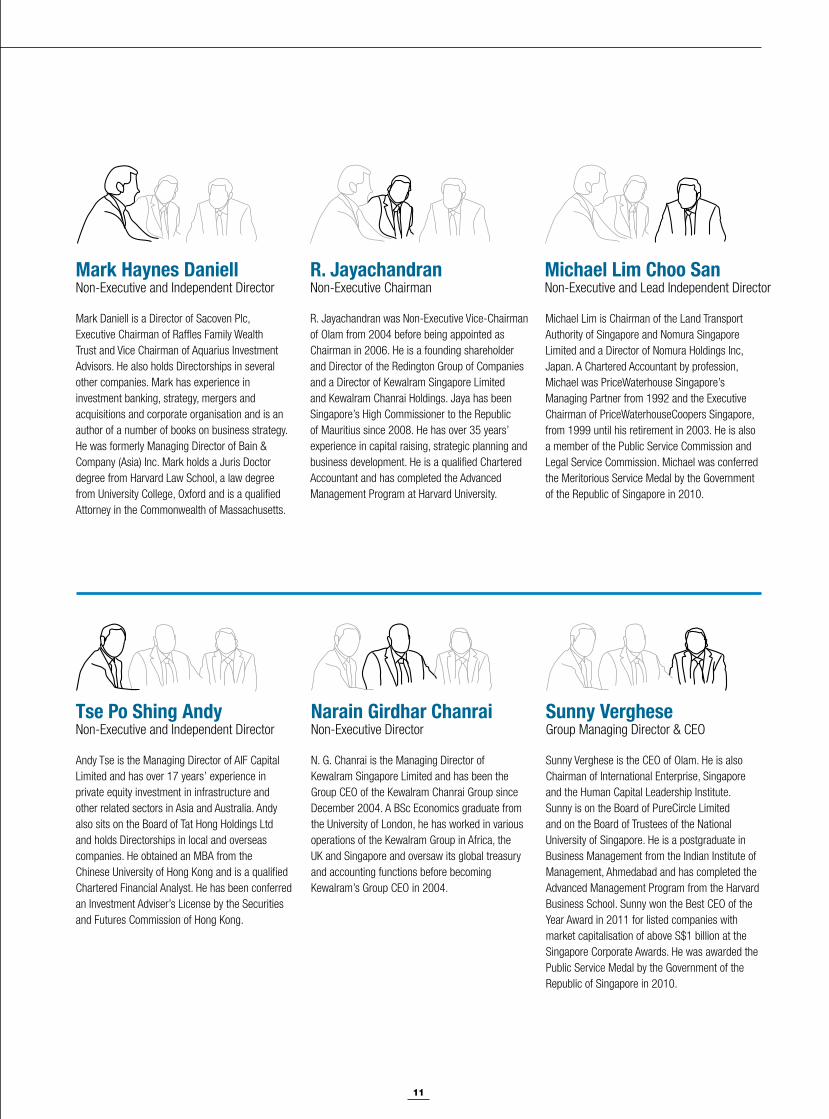
Narain Girdhar ChanraiNon-Executive Director
N. G. Chanrai is the Managing Director of Kewalram Singapore Limited and has been the Group CEO of the Kewalram Chanrai Group since December 2004. A BSc Economics graduate from the University of London, he has worked in various operations of the Kewalram Group in Africa, the UK and Singapore and oversaw its global treasury and accounting functions before becoming Kewalram’s Group CEO in 2004.
Sunny VergheseGroup Managing Director & CEO
Sunny Verghese is the CEO of Olam. He is also Chairman of International Enterprise, Singapore and the Human Capital Leadership Institute. Sunny is on the Board of PureCircle Limited and on the Board of Trustees of the National University of Singapore. He is a postgraduate in Business Management from the Indian Institute of Management, Ahmedabad and has completed the Advanced Management Program from the Harvard Business School. Sunny won the Best CEO of the Year Award in 2011 for listed companies with market capitalisation of above S$1 billion at the Singapore Corporate Awards. He was awarded the Public Service Medal by the Government of the Republic of Singapore in 2010.
Tse Po Shing AndyNon-Executive and Independent Director
Andy Tse is the Managing Director of AIF Capital Limited and has over 17 years’ experience in private equity investment in infrastructure and other related sectors in Asia and Australia. Andy also sits on the Board of Tat Hong Holdings Ltd and holds Directorships in local and overseas companies. He obtained an MBA from the Chinese University of Hong Kong and is a qualified Chartered Financial Analyst. He has been conferred an Investment Adviser’s License by the Securities and Futures Commission of Hong Kong.
R. JayachandranNon-Executive Chairman
R. Jayachandran was Non-Executive Vice-Chairman of Olam from 2004 before being appointed as Chairman in 2006. He is a founding shareholder and Director of the Redington Group of Companies and a Director of Kewalram Singapore Limited and Kewalram Chanrai Holdings. Jaya has been Singapore’s High Commissioner to the Republic of Mauritius since 2008. He has over 35 years’ experience in capital raising, strategic planning and business development. He is a qualified Chartered Accountant and has completed the Advanced Management Program at Harvard University.
Michael Lim Choo SanNon-Executive and Lead Independent Director
Mark Haynes DaniellNon-Executive and Independent Director
Mark Daniell is a Director of Sacoven Plc, Executive Chairman of Raffles Family Wealth Trust and Vice Chairman of Aquarius Investment Advisors. He also holds Directorships in several other companies. Mark has experience in investment banking, strategy, mergers and acquisitions and corporate organisation and is an author of a number of books on business strategy. He was formerly Managing Director of Bain & Company (Asia) Inc. Mark holds a Juris Doctor degree from Harvard Law School, a law degree from University College, Oxford and is a qualified Attorney in the Commonwealth of Massachusetts.
Michael Lim is Chairman of the Land Transport Authority of Singapore and Nomura Singapore Limited and a Director of Nomura Holdings Inc, Japan. A Chartered Accountant by profession, Michael was PriceWaterhouse Singapore’s Managing Partner from 1992 and the Executive Chairman of PriceWaterhouseCoopers Singapore, from 1999 until his retirement in 2003. He is also a member of the Public Service Commission and Legal Service Commission. Michael was conferred the Meritorious Service Medal by the Government of the Republic of Singapore in 2010.

12
Board of Directors

13
Sridhar KrishnanExecutive Director
Sridhar Krishnan is responsible for the Group’s Rice, Wood Products and Packaged Foods businesses and has functional oversight of the Human Resources, Corporate Communications, Insurance and Administration functions. He is a member of the Corporate Executive Team and the Executive Human Resources Committee. He has over 37 years’ experience, more than half of which have been with Olam. Sridhar has held many senior positions in Olam including being the Global Product Head for several businesses. He holds a Bachelor’s degree in Commerce and is a postgraduate in Business Management from a leading business school in India.
Wong Heng TewNon-Executive and Independent Director
Wong Heng Tew was Managing Director, Investments at Temasek Holdings and concurrently their Chief Representative in Vietnam. Following his retirement in 2008, Heng Tew is now Advisory Director for Temasek Holdings and on the Board of several companies. His experience lies in investments, mergers and acquisitions, restructuring of companies and divestments. In 1998, he was appointed to the Pro Tem Committee for the formation of the Singapore Exchange.!He holds Bachelor’s degree in Engineering from the University of Singapore and has completed the Program for Management Development at Harvard Business School.
Robert Michael TomlinNon-Executive and Independent Director
Robert Tomlin (Robin) is Vice Chairman of Lepercq de Neuflize Asia and a Trustee of Singapore Management University. He also holds Directorships in several other companies. He currently chairs the Design Singapore Council and the Singapore Repertory Theatre. Robin retired from UBS Investment Bank as Vice-Chairman, Asia. Prior to this, he was also with the Schroder Group, where he became CEO, Southeast Asia. Robin holds a BA in Modern Languages from Downing College, Cambridge and is a Business Management Graduate from Harvard Business School.
A. ShekharExecutive Director
A. Shekhar leads the Company’s overall Strategy and New Business Development activities as well as the Corporate Finance & Accounts, Banking & Treasury, Audit & Corporate Affairs, Strategic Investments, Investor Relations and Manufacturing and Technical Services functions. He has 25 years’ experience, 20 of which have been with Olam. Shekhar has held various senior roles in Country Management, leading Global Functions, as well as being the Global Product Head for many businesses. He holds a degree in Aeronautical Engineering and a postgraduate degree in Business Management, and has completed the Advanced Management Program from the Harvard Business School.
Jean-Paul PinardNon-Executive and Independent Director
Jean-Paul Pinard is currently a Board Member of several overseas companies. He spent 17 years with the International Finance Corporation, Washington DC (IFC), becoming Director of the Agribusiness Department, responsible for managing IFC’s US$1.5 billion portfolio of loan and equity investments in agribusiness and food industries. Jean-Paul has a PhD in Economics from the University of California and a Diplome d’Ingenieur from the Ecole Polytechnique, Paris.
14
CEO and Executive Directors’ Dialogue
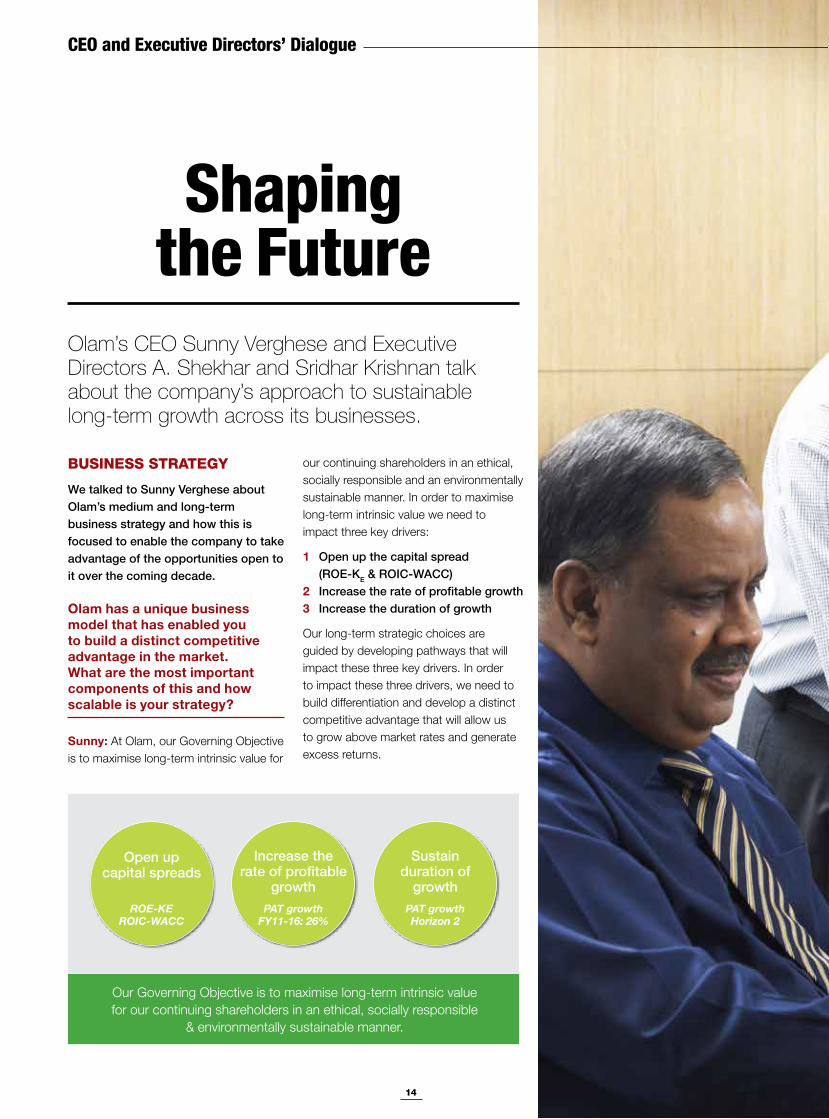
Shaping the Future
Olam’s CEO Sunny Verghese and Executive Directors A. Shekhar and Sridhar Krishnan talk about the company’s approach to sustainable long-term growth across its businesses.
BUSINESS STRATEGY
We talked to Sunny Verghese about Olam’s medium and long-term business strategy and how this is focused to enable the company to take advantage of the opportunities open to it over the coming decade.
Olam has a unique business model that has enabled you to build a distinct competitive advantage in the market. What are the most important components of this and how scalable is your strategy?
Sunny: At Olam, our Governing Objective is to maximise long-term intrinsic value for
our continuing shareholders in an ethical, socially responsible and an environmentally sustainable manner. In order to maximise long-term intrinsic value we need to impact three key drivers:
1 Open up the capital spread (ROE-KE & ROIC-WACC) 2 Increase the rate of profitable growth 3 Increase the duration of growth
Our long-term strategic choices are guided by developing pathways that will impact these three key drivers. In order to impact these three drivers, we need to build differentiation and develop a distinct competitive advantage that will allow us to grow above market rates and generate excess returns.
Our Governing Objective is to maximise long-term intrinsic value for our continuing shareholders in an ethical, socially responsible
& environmentally sustainable manner.
Sustain duration of
growthPAT growth Horizon 2
Increase the rate of profitable
growthPAT growth
FY11-16: 26%
Open up capital spreads
ROE-KE ROIC-WACC
15
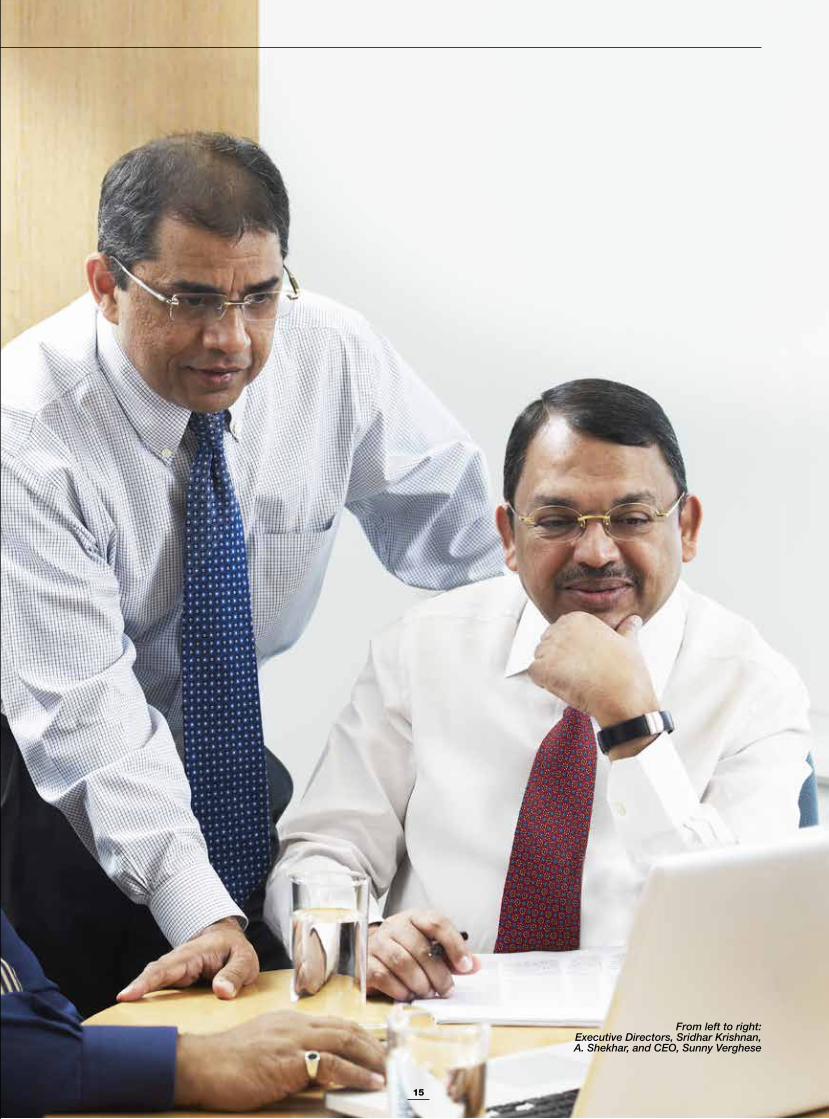
From left to right:Executive Directors, Sridhar Krishnan, A. Shekhar, and CEO, Sunny Verghese
16
Superior origination,
trading & risk
managementskills
Emerging market expertise
Repeatableand
scalable adjacency
based growth formula
Organisationaladvantage
DeliveryModel
Well diversi!edacross scale platforms
- global footprint
Leadershipand relevantglobal scale
Focusedon single
asset class
Defensible position
Unique PortfolioSelective
integration across value
chain
Olam’sCompetitiveAdvantage
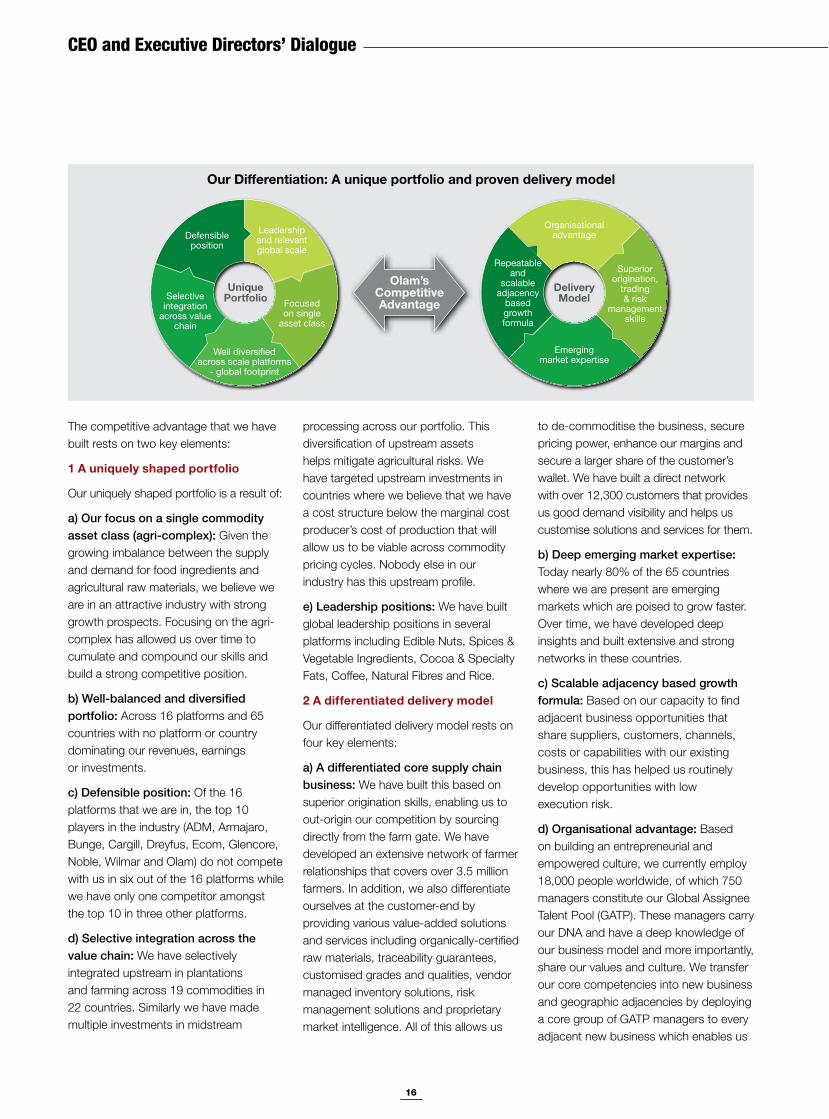
Our Differentiation: A unique portfolio and proven delivery model
CEO and Executive Directors’ Dialogue
The competitive advantage that we have built rests on two key elements:
1 A uniquely shaped portfolio
Our uniquely shaped portfolio is a result of:
a) Our focus on a single commodity asset class (agri-complex): Given the growing imbalance between the supply and demand for food ingredients and agricultural raw materials, we believe we are in an attractive industry with strong growth prospects. Focusing on the agri-complex has allowed us over time to cumulate and compound our skills and build a strong competitive position.
b) Well-balanced and diversified portfolio: Across 16 platforms and 65 countries with no platform or country dominating our revenues, earnings or investments.
c) Defensible position: Of the 16 platforms that we are in, the top 10 players in the industry (ADM, Armajaro, Bunge, Cargill, Dreyfus, Ecom, Glencore, Noble, Wilmar and Olam) do not compete with us in six out of the 16 platforms while we have only one competitor amongst the top 10 in three other platforms.
d) Selective integration across the value chain: We have selectively integrated upstream in plantations and farming across 19 commodities in 22 countries. Similarly we have made multiple investments in midstream
processing across our portfolio. This diversification of upstream assets helps mitigate agricultural risks. We have targeted upstream investments in countries where we believe that we have a cost structure below the marginal cost producer’s cost of production that will allow us to be viable across commodity pricing cycles. Nobody else in our industry has this upstream profile.
e) Leadership positions: We have built global leadership positions in several platforms including Edible Nuts, Spices & Vegetable Ingredients, Cocoa & Specialty Fats, Coffee, Natural Fibres and Rice.
2 A differentiated delivery model
Our differentiated delivery model rests on four key elements:
a) A differentiated core supply chain business: We have built this based on superior origination skills, enabling us to out-origin our competition by sourcing directly from the farm gate. We have developed an extensive network of farmer relationships that covers over 3.5 million farmers. In addition, we also differentiate ourselves at the customer-end by providing various value-added solutions and services including organically-certified raw materials, traceability guarantees, customised grades and qualities, vendor managed inventory solutions, risk management solutions and proprietary market intelligence. All of this allows us
to de-commoditise the business, secure pricing power, enhance our margins and secure a larger share of the customer’s wallet. We have built a direct network with over 12,300 customers that provides us good demand visibility and helps us customise solutions and services for them.
b) Deep emerging market expertise: Today nearly 80% of the 65 countries where we are present are emerging markets which are poised to grow faster. Over time, we have developed deep insights and built extensive and strong networks in these countries.
c) Scalable adjacency based growth formula: Based on our capacity to find adjacent business opportunities that share suppliers, customers, channels, costs or capabilities with our existing business, this has helped us routinely develop opportunities with low execution risk.
d) Organisational advantage: Based on building an entrepreneurial and empowered culture, we currently employ 18,000 people worldwide, of which 750 managers constitute our Global Assignee Talent Pool (GATP). These managers carry our DNA and have a deep knowledge of our business model and more importantly, share our values and culture. We transfer our core competencies into new business and geographic adjacencies by deploying a core group of GATP managers to every adjacent new business which enables us
17
grains, sugar and cotton complexes. Our results were particularly impacted by the fat tail events in the cotton business and to a lesser extent, demand erosion in the Wood Products business. We believe that these developments are mostly cyclical in nature and not structural. While this will post near-term headwinds in some of our platforms, the
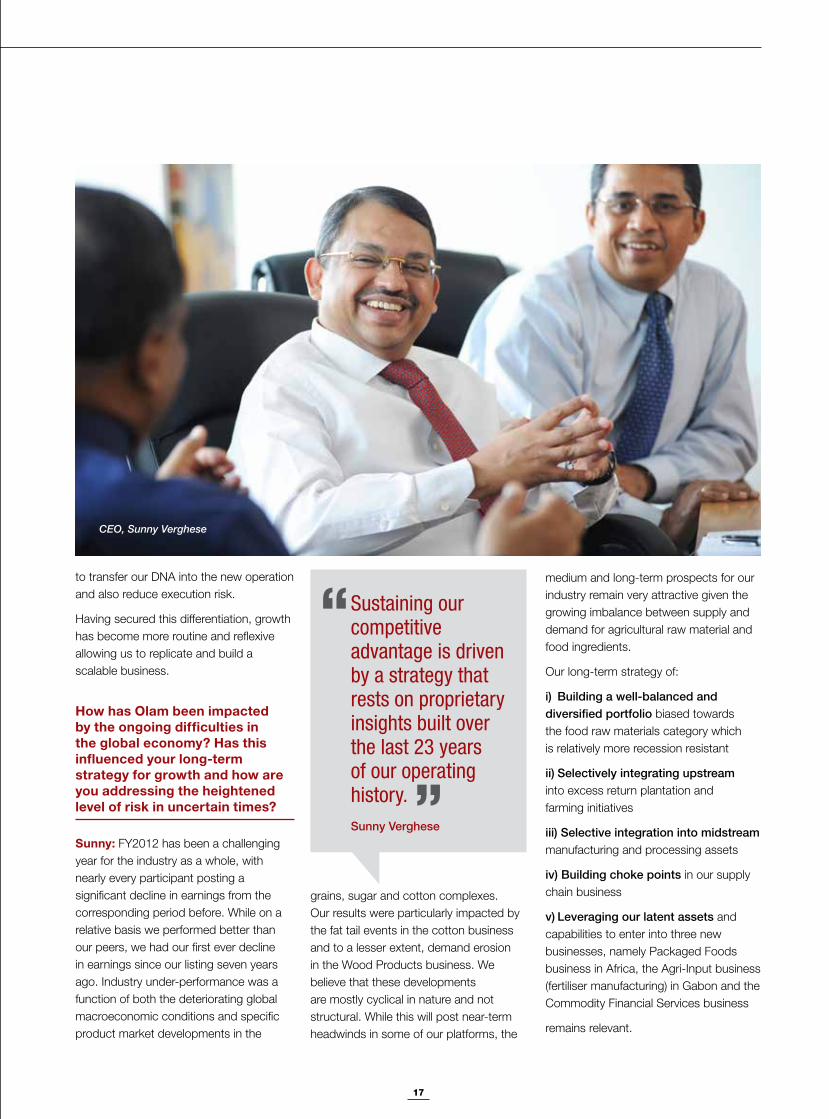
Sustaining our competitive advantage is driven by a strategy that rests on proprietary insights built over the last 23 years of our operating history. ”
“
Sunny Verghese
to transfer our DNA into the new operation and also reduce execution risk.
Having secured this differentiation, growth has become more routine and reflexive allowing us to replicate and build a scalable business.
How has Olam been impacted by the ongoing difficulties in the global economy? Has this influenced your long-term strategy for growth and how are you addressing the heightened level of risk in uncertain times?
Sunny: FY2012 has been a challenging year for the industry as a whole, with nearly every participant posting a significant decline in earnings from the corresponding period before. While on a relative basis we performed better than our peers, we had our first ever decline in earnings since our listing seven years ago. Industry under-performance was a function of both the deteriorating global macroeconomic conditions and specific product market developments in the
medium and long-term prospects for our industry remain very attractive given the growing imbalance between supply and demand for agricultural raw material and food ingredients.
Our long-term strategy of:
i) Building a well-balanced and diversified portfolio biased towards the food raw materials category which is relatively more recession resistant
ii) Selectively integrating upstream into excess return plantation and farming initiatives
iii) Selective integration into midstream manufacturing and processing assets
iv) Building choke points in our supply chain business
v) Leveraging our latent assets and capabilities to enter into three new businesses, namely Packaged Foods business in Africa, the Agri-Input business (fertiliser manufacturing) in Gabon and the Commodity Financial Services business
remains relevant.
CEO, Sunny Verghese
18
CEO and Executive Directors’ Dialogue
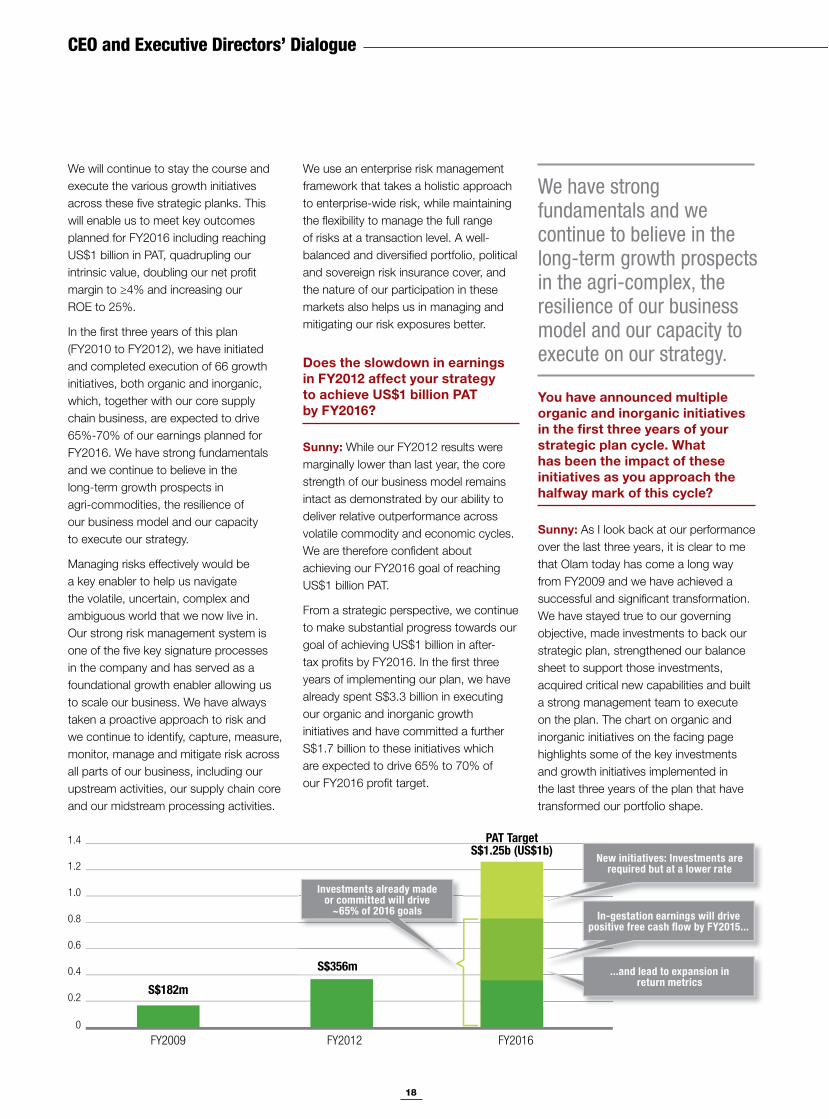
We will continue to stay the course and execute the various growth initiatives across these five strategic planks. This will enable us to meet key outcomes planned for FY2016 including reaching US$1 billion in PAT, quadrupling our intrinsic value, doubling our net profit margin to !4% and increasing our ROE to 25%.
In the first three years of this plan (FY2010 to FY2012), we have initiated and completed execution of 66 growth initiatives, both organic and inorganic, which, together with our core supply chain business, are expected to drive 65%-70% of our earnings planned for FY2016. We have strong fundamentals and we continue to believe in the long-term growth prospects in agri-commodities, the resilience of our business model and our capacity to execute our strategy.
Managing risks effectively would be a key enabler to help us navigate the volatile, uncertain, complex and ambiguous world that we now live in. Our strong risk management system is one of the five key signature processes in the company and has served as a foundational growth enabler allowing us to scale our business. We have always taken a proactive approach to risk and we continue to identify, capture, measure, monitor, manage and mitigate risk across all parts of our business, including our upstream activities, our supply chain core and our midstream processing activities.
We use an enterprise risk management framework that takes a holistic approach to enterprise-wide risk, while maintaining the flexibility to manage the full range of risks at a transaction level. A well-balanced and diversified portfolio, political and sovereign risk insurance cover, and the nature of our participation in these markets also helps us in managing and mitigating our risk exposures better.
Does the slowdown in earnings in FY2012 affect your strategy to achieve US$1 billion PAT by FY2016?
Sunny: While our FY2012 results were marginally lower than last year, the core strength of our business model remains intact as demonstrated by our ability to deliver relative outperformance across volatile commodity and economic cycles. We are therefore confident about achieving our FY2016 goal of reaching US$1 billion PAT.
From a strategic perspective, we continue to make substantial progress towards our goal of achieving US$1 billion in after-tax profits by FY2016. In the first three years of implementing our plan, we have already spent S$3.3 billion in executing our organic and inorganic growth initiatives and have committed a further S$1.7 billion to these initiatives which are expected to drive 65% to 70% of our FY2016 profit target.
You have announced multiple organic and inorganic initiatives in the first three years of your strategic plan cycle. What has been the impact of these initiatives as you approach the halfway mark of this cycle?
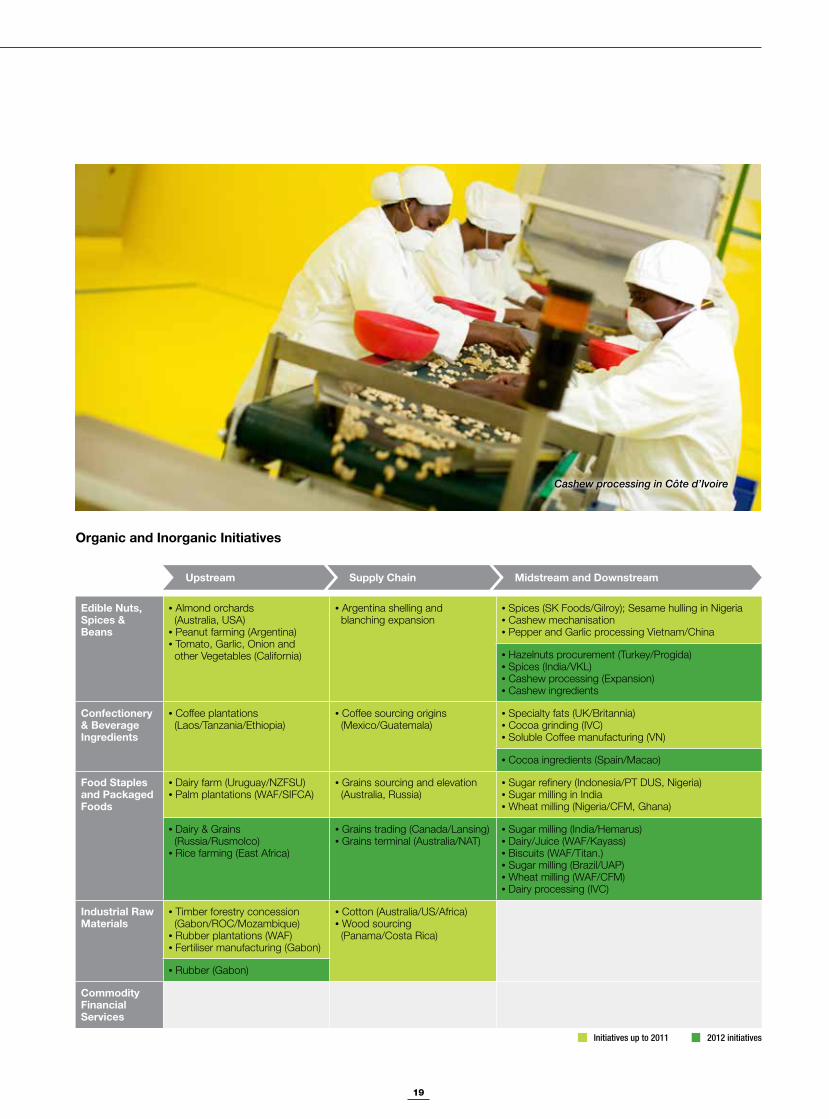
Sunny: As I look back at our performance over the last three years, it is clear to me that Olam today has come a long way from FY2009 and we have achieved a successful and significant transformation. We have stayed true to our governing objective, made investments to back our strategic plan, strengthened our balance sheet to support those investments, acquired critical new capabilities and built a strong management team to execute on the plan. The chart on organic and inorganic initiatives on the facing page highlights some of the key investments and growth initiatives implemented in the last three years of the plan that have transformed our portfolio shape.
FY2009
S$182m
S$356m
PAT TargetS$1.25b (US$1b)
FY2012 FY2016
0.2
0.4
0.6
0.8
1.0
1.2
1.4
0
b)New initiatives: Investments are
required but at a lower rate
S$356m
Investments already made or committed will drive
~65% of 2016 goals In-gestation earnings will drive positive free cash flow by FY2015...
...and lead to expansion in return metrics
We have strong fundamentals and we continue to believe in the long-term growth prospects in the agri-complex, the resilience of our business model and our capacity to execute on our strategy.
19
Edible Nuts, Spices & Beans
Almond orchards (Australia, USA) Peanut farming (Argentina) Tomato, Garlic, Onion and
other Vegetables (California)
Argentina shelling and blanching expansion
Spices (SK Foods/Gilroy); Sesame hulling in Nigeria Cashew mechanisation Pepper and Garlic processing Vietnam/China
Hazelnuts procurement (Turkey/Progida) Spices (India/VKL) Cashew processing (Expansion) Cashew ingredients
Confectionery & Beverage Ingredients
Coffee plantations (Laos/Tanzania/Ethiopia)
Coffee sourcing origins (Mexico/Guatemala)
Specialty fats (UK/Britannia) Cocoa grinding (IVC) Soluble Coffee manufacturing (VN)
Cocoa ingredients (Spain/Macao)
Food Staples and Packaged Foods
Dairy farm (Uruguay/NZFSU) Palm plantations (WAF/SIFCA)
Grains sourcing and elevation (Australia, Russia)
Sugar refinery (Indonesia/PT DUS, Nigeria) Sugar milling in India Wheat milling (Nigeria/CFM, Ghana)
Dairy & Grains (Russia/Rusmolco) Rice farming (East Africa)
Grains trading (Canada/Lansing) Grains terminal (Australia/NAT)
Sugar milling (India/Hemarus) Dairy/Juice (WAF/Kayass) Biscuits (WAF/Titan.) Sugar milling (Brazil/UAP) Wheat milling (WAF/CFM) Dairy processing (IVC)
Industrial Raw Materials
Timber forestry concession (Gabon/ROC/Mozambique) Rubber plantations (WAF) Fertiliser manufacturing (Gabon)
Cotton (Australia/US/Africa) Wood sourcing
(Panama/Costa Rica)
Rubber (Gabon)
Commodity Financial Services
Upstream Supply Chain Midstream and Downstream
Initiatives up to 2011 2012 initiatives
Organic and Inorganic Initiatives
Cashew processing in Côte d’Ivoire
20
CEO and Executive Directors’ Dialogue
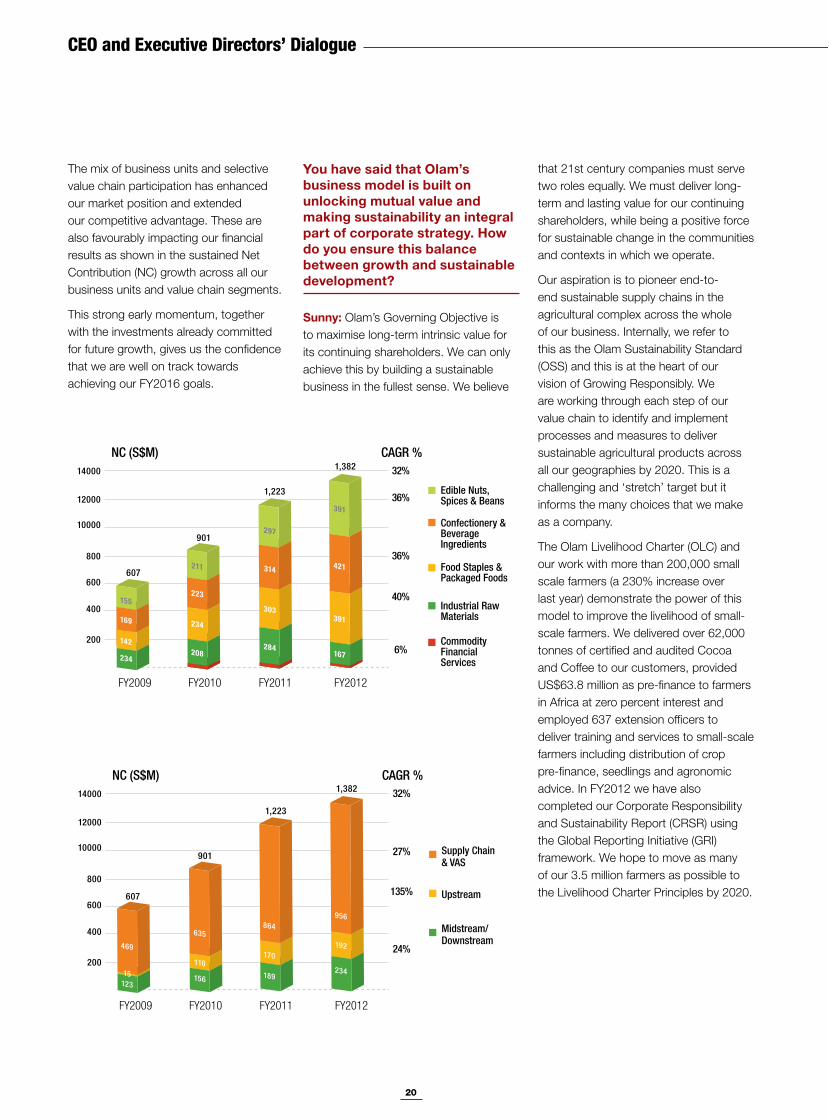
The mix of business units and selective value chain participation has enhanced our market position and extended our competitive advantage. These are also favourably impacting our financial results as shown in the sustained Net Contribution (NC) growth across all our business units and value chain segments.
This strong early momentum, together with the investments already committed for future growth, gives us the confidence that we are well on track towards achieving our FY2016 goals.
that 21st century companies must serve two roles equally. We must deliver long-term and lasting value for our continuing shareholders, while being a positive force for sustainable change in the communities and contexts in which we operate.
Our aspiration is to pioneer end-to-end sustainable supply chains in the agricultural complex across the whole of our business. Internally, we refer to this as the Olam Sustainability Standard (OSS) and this is at the heart of our vision of Growing Responsibly. We are working through each step of our value chain to identify and implement processes and measures to deliver sustainable agricultural products across all our geographies by 2020. This is a challenging and ‘stretch’ target but it informs the many choices that we make as a company.
The Olam Livelihood Charter (OLC) and our work with more than 200,000 small scale farmers (a 230% increase over last year) demonstrate the power of this model to improve the livelihood of small-scale farmers. We delivered over 62,000 tonnes of certified and audited Cocoa and Coffee to our customers, provided US$63.8 million as pre-finance to farmers in Africa at zero percent interest and employed 637 extension officers to deliver training and services to small-scale farmers including distribution of crop pre-finance, seedlings and agronomic advice. In FY2012 we have also completed our Corporate Responsibility and Sustainability Report (CRSR) using the Global Reporting Initiative (GRI) framework. We hope to move as many of our 3.5 million farmers as possible to the Livelihood Charter Principles by 2020.
You have said that Olam’s business model is built on unlocking mutual value and making sustainability an integral part of corporate strategy. How do you ensure this balance between growth and sustainable development?
Sunny: Olam’s Governing Objective is to maximise long-term intrinsic value for its continuing shareholders. We can only achieve this by building a sustainable business in the fullest sense. We believe
CAGR %NC (S$M)32%
27%
135%
24%
Supply Chain & VAS
Upstream
Midstream/Downstream
FY2009 FY2010 FY2011 FY2012
200
400
600607
901
1,223
1,382
800
10000
14000
12000
12315
469
156
110
635
189
170
864
234
192
956
CAGR %NC (S$M)32%
36%
36%
40%
6%
Confectionery &Beverage Ingredients
Food Staples &Packaged Foods
Industrial RawMaterials
CommodityFinancial Services
FY2009 FY2010 FY2011 FY2012
200
400
600607
901
1,223
1,382
800
10000
14000
12000Edible Nuts,Spices & Beans
234
142
169
155
208
234
223
211
284
303
314
297
167
391
421
391
21
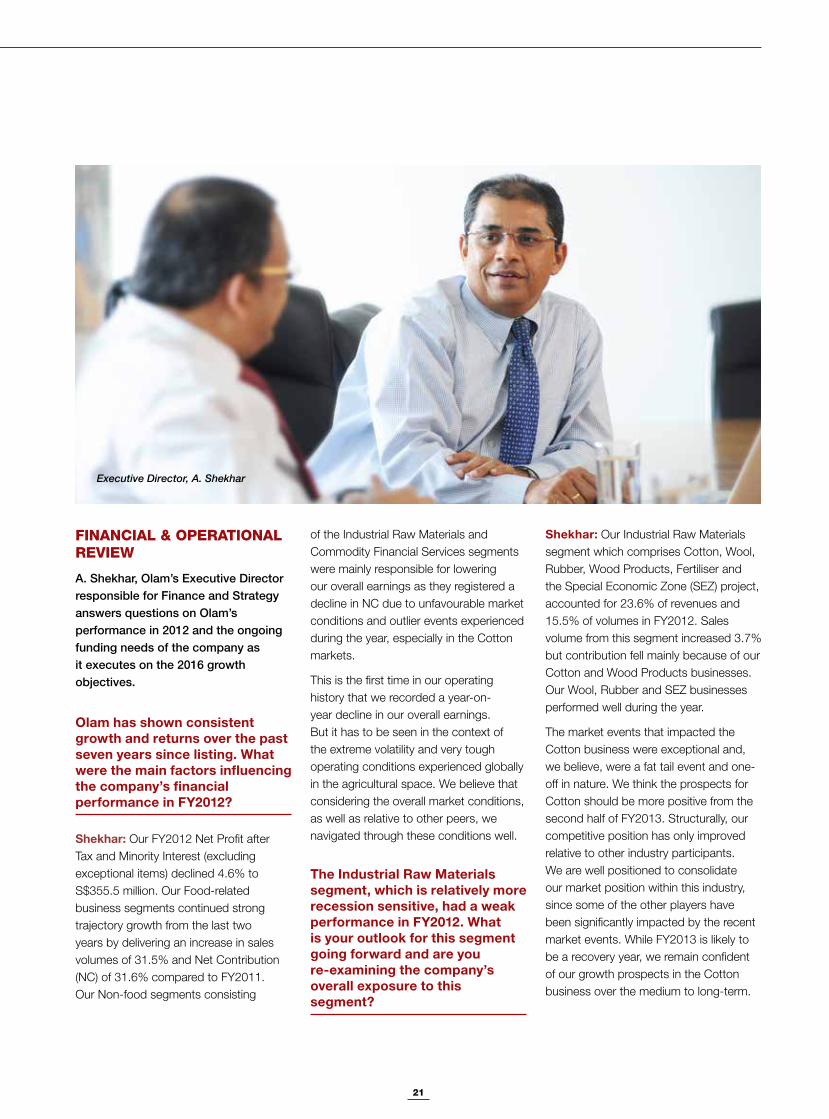
FINANCIAL & OPERATIONAL REVIEW
A. Shekhar, Olam’s Executive Director responsible for Finance and Strategy answers questions on Olam’s performance in 2012 and the ongoing funding needs of the company as it executes on the 2016 growth objectives.
Olam has shown consistent growth and returns over the past seven years since listing. What were the main factors influencing the company’s financial performance in FY2012?
Shekhar: Our FY2012 Net Profit after Tax and Minority Interest (excluding exceptional items) declined 4.6% to S$355.5 million. Our Food-related business segments continued strong trajectory growth from the last two years by delivering an increase in sales volumes of 31.5% and Net Contribution (NC) of 31.6% compared to FY2011. Our Non-food segments consisting
of the Industrial Raw Materials and Commodity Financial Services segments were mainly responsible for lowering our overall earnings as they registered a decline in NC due to unfavourable market conditions and outlier events experienced during the year, especially in the Cotton markets.
This is the first time in our operating history that we recorded a year-on-year decline in our overall earnings. But it has to be seen in the context of the extreme volatility and very tough operating conditions experienced globally in the agricultural space. We believe that considering the overall market conditions, as well as relative to other peers, we navigated through these conditions well.
The Industrial Raw Materials segment, which is relatively more recession sensitive, had a weak performance in FY2012. What is your outlook for this segment going forward and are you re-examining the company’s overall exposure to this segment?
Shekhar: Our Industrial Raw Materials segment which comprises Cotton, Wool, Rubber, Wood Products, Fertiliser and the Special Economic Zone (SEZ) project, accounted for 23.6% of revenues and 15.5% of volumes in FY2012. Sales volume from this segment increased 3.7% but contribution fell mainly because of our Cotton and Wood Products businesses. Our Wool, Rubber and SEZ businesses performed well during the year.
The market events that impacted the Cotton business were exceptional and, we believe, were a fat tail event and one-off in nature. We think the prospects for Cotton should be more positive from the second half of FY2013. Structurally, our competitive position has only improved relative to other industry participants. We are well positioned to consolidate our market position within this industry, since some of the other players have been significantly impacted by the recent market events. While FY2013 is likely to be a recovery year, we remain confident of our growth prospects in the Cotton business over the medium to long-term.
Executive Director, A. Shekhar
22
CEO and Executive Directors’ Dialogue
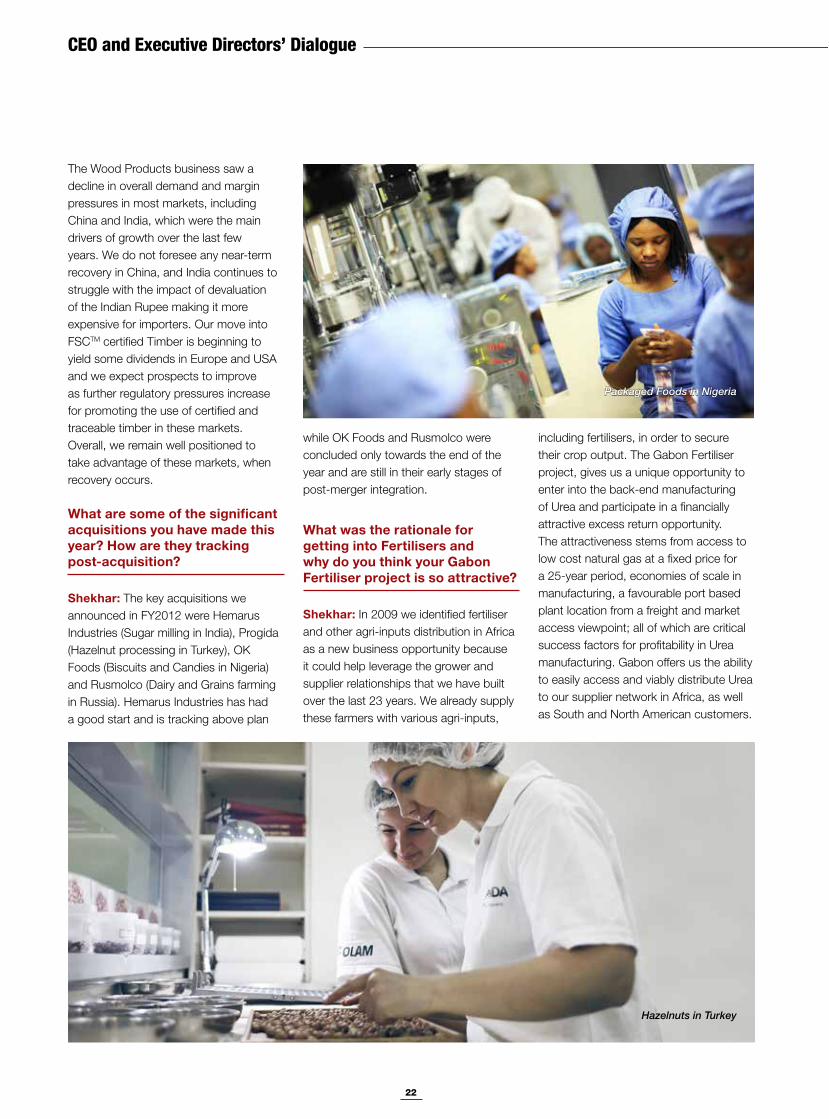
The Wood Products business saw a decline in overall demand and margin pressures in most markets, including China and India, which were the main drivers of growth over the last few years. We do not foresee any near-term recovery in China, and India continues to struggle with the impact of devaluation of the Indian Rupee making it more expensive for importers. Our move into FSCTM certified Timber is beginning to yield some dividends in Europe and USA and we expect prospects to improve as further regulatory pressures increase for promoting the use of certified and traceable timber in these markets. Overall, we remain well positioned to take advantage of these markets, when recovery occurs.
What are some of the significant acquisitions you have made this year? How are they tracking post-acquisition?
Shekhar: The key acquisitions we announced in FY2012 were Hemarus Industries (Sugar milling in India), Progida (Hazelnut processing in Turkey), OK Foods (Biscuits and Candies in Nigeria) and Rusmolco (Dairy and Grains farming in Russia). Hemarus Industries has had a good start and is tracking above plan
while OK Foods and Rusmolco were concluded only towards the end of the year and are still in their early stages of post-merger integration.
What was the rationale for getting into Fertilisers and why do you think your Gabon Fertiliser project is so attractive?
Shekhar: In 2009 we identified fertiliser and other agri-inputs distribution in Africa as a new business opportunity because it could help leverage the grower and supplier relationships that we have built over the last 23 years. We already supply these farmers with various agri-inputs,
including fertilisers, in order to secure their crop output. The Gabon Fertiliser project, gives us a unique opportunity to enter into the back-end manufacturing of Urea and participate in a financially attractive excess return opportunity. The attractiveness stems from access to low cost natural gas at a fixed price for a 25-year period, economies of scale in manufacturing, a favourable port based plant location from a freight and market access viewpoint; all of which are critical success factors for profitability in Urea manufacturing. Gabon offers us the ability to easily access and viably distribute Urea to our supplier network in Africa, as well as South and North American customers.
Packaged Foods in Nigeria
Hazelnuts in Turkey
23
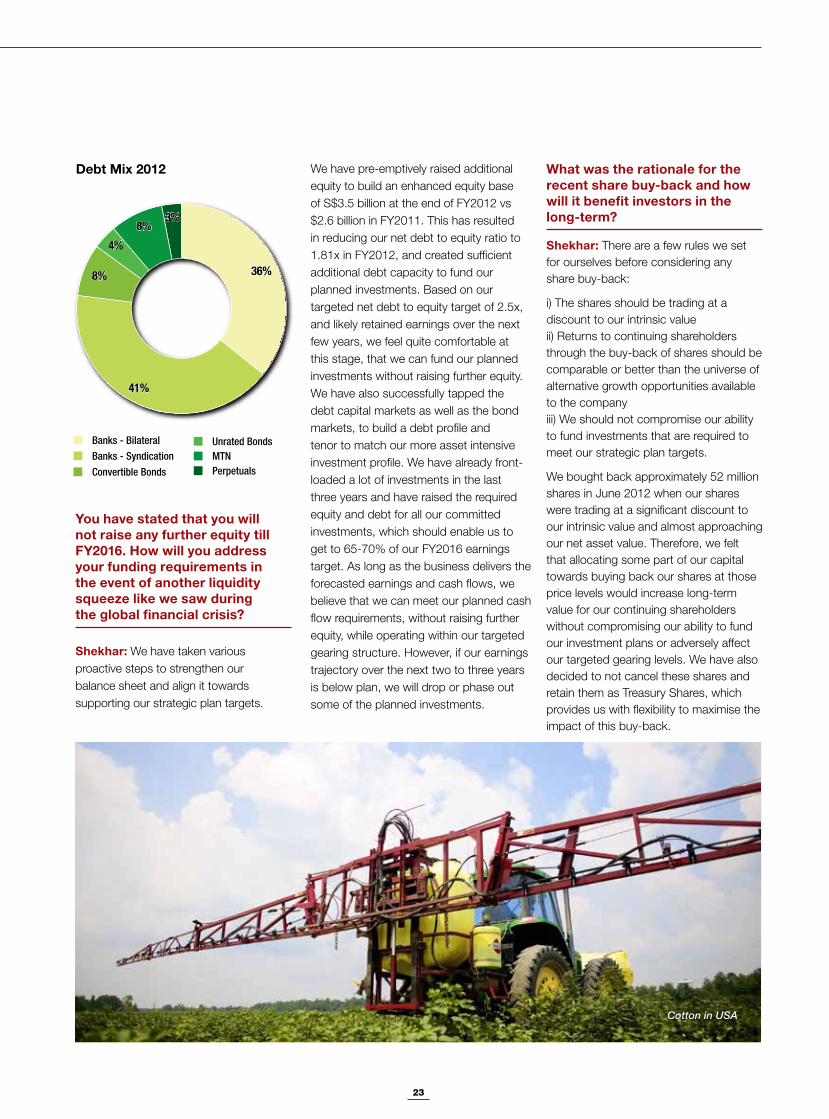
36%
41%
8%
4%
8%3%
Banks - BilateralBanks - SyndicationConvertible Bonds
Unrated BondsMTNPerpetuals
You have stated that you will not raise any further equity till FY2016. How will you address your funding requirements in the event of another liquidity squeeze like we saw during the global financial crisis?
Shekhar: We have taken various proactive steps to strengthen our balance sheet and align it towards supporting our strategic plan targets.
We have pre-emptively raised additional equity to build an enhanced equity base of S$3.5 billion at the end of FY2012 vs $2.6 billion in FY2011. This has resulted in reducing our net debt to equity ratio to 1.81x in FY2012, and created sufficient additional debt capacity to fund our planned investments. Based on our targeted net debt to equity target of 2.5x, and likely retained earnings over the next few years, we feel quite comfortable at this stage, that we can fund our planned investments without raising further equity. We have also successfully tapped the debt capital markets as well as the bond markets, to build a debt profile and tenor to match our more asset intensive investment profile. We have already front-loaded a lot of investments in the last three years and have raised the required equity and debt for all our committed investments, which should enable us to get to 65-70% of our FY2016 earnings target. As long as the business delivers the forecasted earnings and cash flows, we believe that we can meet our planned cash flow requirements, without raising further equity, while operating within our targeted gearing structure. However, if our earnings trajectory over the next two to three years is below plan, we will drop or phase out some of the planned investments.
What was the rationale for the recent share buy-back and how will it benefit investors in the long-term?
Shekhar: There are a few rules we set for ourselves before considering any share buy-back:
i) The shares should be trading at a discount to our intrinsic value ii) Returns to continuing shareholders through the buy-back of shares should be comparable or better than the universe of alternative growth opportunities available to the company iii) We should not compromise our ability to fund investments that are required to meet our strategic plan targets.
We bought back approximately 52 million shares in June 2012 when our shares were trading at a significant discount to our intrinsic value and almost approaching our net asset value. Therefore, we felt that allocating some part of our capital towards buying back our shares at those price levels would increase long-term value for our continuing shareholders without compromising our ability to fund our investment plans or adversely affect our targeted gearing levels. We have also decided to not cancel these shares and retain them as Treasury Shares, which provides us with flexibility to maximise the impact of this buy-back.
Cotton in USA
Debt Mix 2012
24
CEO and Executive Directors’ Dialogue
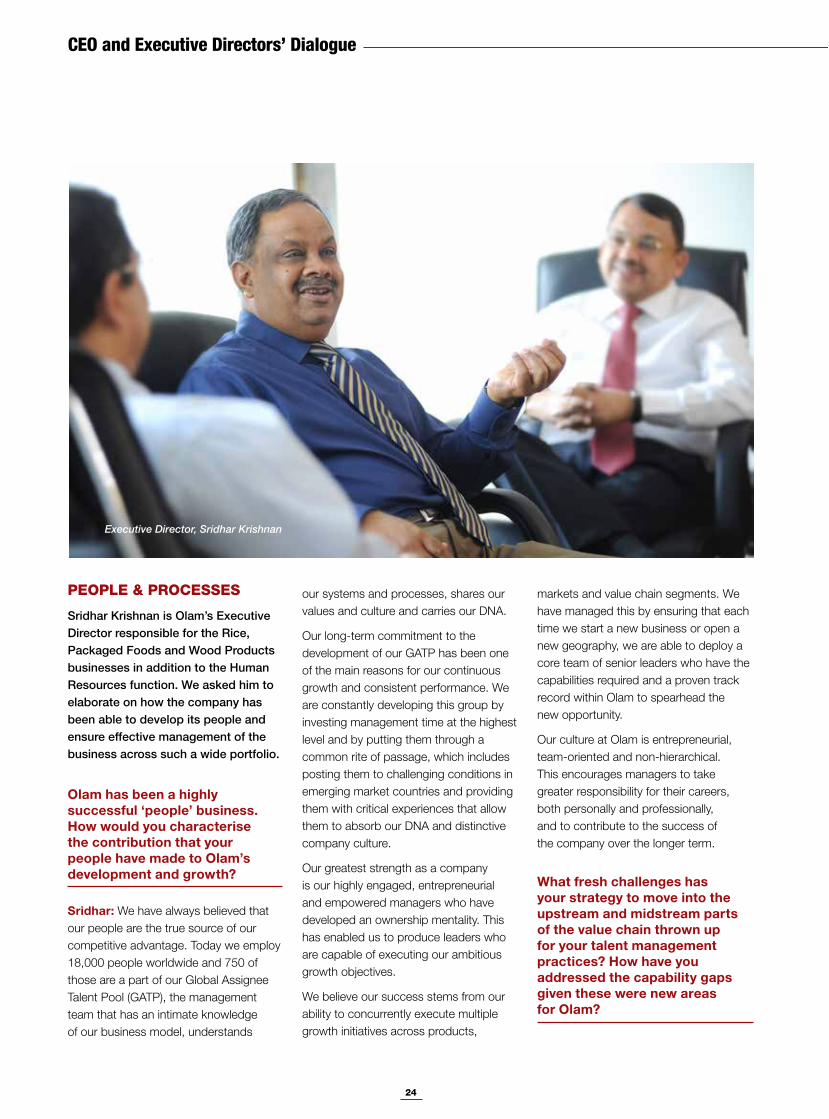
PEOPLE & PROCESSES
Sridhar Krishnan is Olam’s Executive Director responsible for the Rice, Packaged Foods and Wood Products businesses in addition to the Human Resources function. We asked him to elaborate on how the company has been able to develop its people and ensure effective management of the business across such a wide portfolio.
Olam has been a highly successful ‘people’ business. How would you characterise the contribution that your people have made to Olam’s development and growth?
Sridhar: We have always believed that our people are the true source of our competitive advantage. Today we employ 18,000 people worldwide and 750 of those are a part of our Global Assignee Talent Pool (GATP), the management team that has an intimate knowledge of our business model, understands
our systems and processes, shares our values and culture and carries our DNA.
Our long-term commitment to the development of our GATP has been one of the main reasons for our continuous growth and consistent performance. We are constantly developing this group by investing management time at the highest level and by putting them through a common rite of passage, which includes posting them to challenging conditions in emerging market countries and providing them with critical experiences that allow them to absorb our DNA and distinctive company culture.
Our greatest strength as a company is our highly engaged, entrepreneurial and empowered managers who have developed an ownership mentality. This has enabled us to produce leaders who are capable of executing our ambitious growth objectives.
We believe our success stems from our ability to concurrently execute multiple growth initiatives across products,
markets and value chain segments. We have managed this by ensuring that each time we start a new business or open a new geography, we are able to deploy a core team of senior leaders who have the capabilities required and a proven track record within Olam to spearhead the new opportunity.
Our culture at Olam is entrepreneurial, team-oriented and non-hierarchical. This encourages managers to take greater responsibility for their careers, both personally and professionally, and to contribute to the success of the company over the longer term.
What fresh challenges has your strategy to move into the upstream and midstream parts of the value chain thrown up for your talent management practices? How have you addressed the capability gaps given these were new areas for Olam?
Executive Director, Sridhar Krishnan
25
Sridhar: Our continued focus over the years on a single asset class (the agri-complex) and an asset-light supply chain model enabled us to build deep insights and capabilities in our core business and consolidate our competitive position. Our immediate goal after the launch of our new strategy in FY2009 was to embed similar levels of capability and expertise in the areas of upstream plantation, midstream manufacturing, farming and primary processing which are new to Olam within a short time frame.
This meant putting in place an accelerated process of building global leaders internally with the right mindset to manage capital intensive assets to minimise execution risks. We established two new centralised functions, namely Plantations and Manufacturing and Technical Services (MATS) to acquire and drive expertise in these new areas across the organisation. We established through a competency mapping process,
the key skills and capabilities required for these new roles. Leveraging on our compelling employee value proposition, we have acquired a team of 32 specialists in plantation and farming, as well as 108 specialists in MATS within a short two year period after embarking on this revised strategy. We also focused on aligning the cultures of the acquired companies with the Olam culture and building a ‘One Company’ mindset across the organisation. We have also rolled out a comprehensive process of culture building across the organisation to strengthen our organisational advantage.
We further initiated a coaching culture to embed coaching skills in the Olam leadership team to ensure expertise is transferred by our senior leaders to their team members. At the same time we have designed and rolled out formal and experiential learning programmes to address the developmental needs of managers.
Olam’s business model is known to be very ‘management-intensive’. With an ever increasing scale of operations and some recent senior management changes, what steps are you taking to ensure the continuity and scalability of your talent pool?
Sridhar: Over the last 23 years, we have competed and won on the basis of our organisational advantage that rests on the strengths and capabilities of our people. Our people management processes and distinctive culture has enabled us to build a high engagement and a strong ownership mentality within the company. This has also enabled us to achieve low attrition rates relative to our industry. We have consistently had high engagement scores in the mid 80s which compares to the top decile companies globally. We have also regularly attracted high calibre managers and over time transformed them into successful leaders who have helped to grow our businesses to the prominent global positions that they have achieved today.
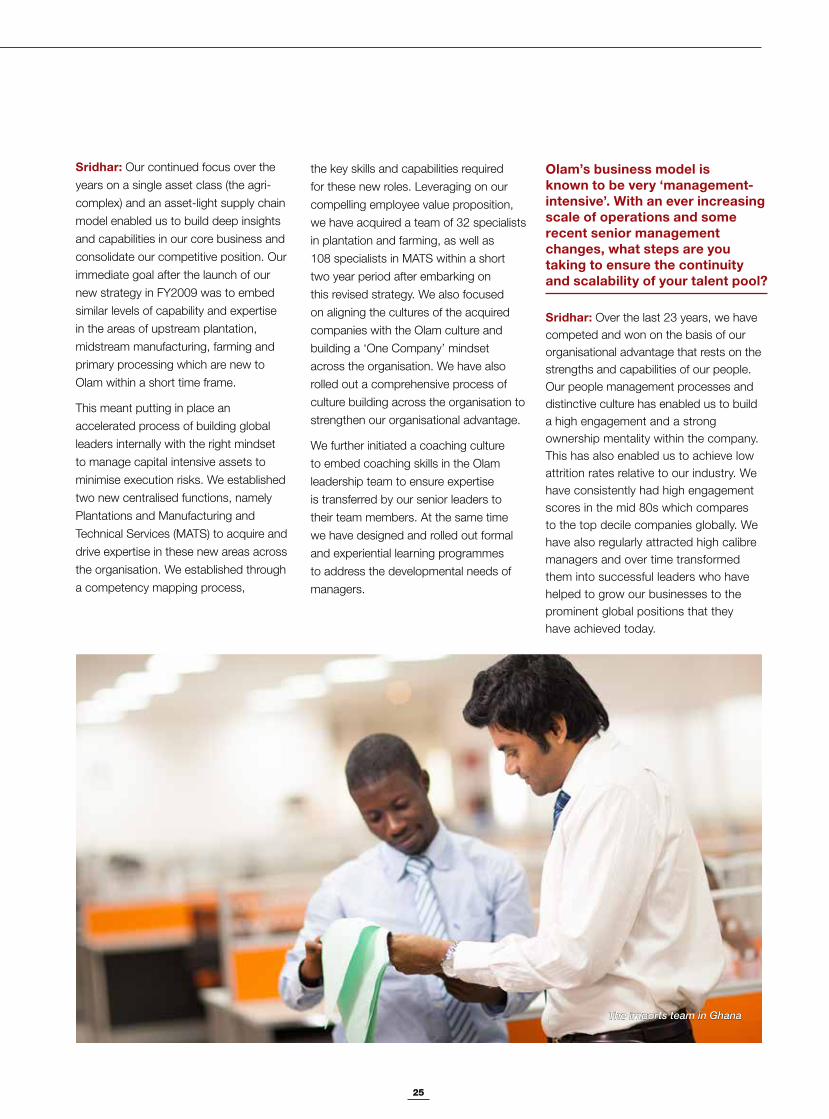
The imports team in Ghana
26
CEO and Executive Directors’ Dialogue
Our practice in creating entrepreneurial roles, our capacity to embed stretch and ambition, the opportunities that we provide as a high-growth company to our people to assume larger roles relatively quickly, our ability to motivate them by providing independence in their roles, and our compensation and reward systems that supports long-term orientation are key elements of this successful model. This has made Olam attractive to some of the best talent in the industry.
In recognition of our success in building leaders, Olam was named in the 2009 list of Global Top Companies for Leaders in a study conducted by Hewitt Associates in partnership with The RBL Group and Fortune Magazine. We also received the 2012 Asian Human Capital Award jointly sponsored by the Singapore Ministry of Manpower, INSEAD, CNBC Asia and Human Capital Leadership Institute, which honours innovative and impactful people practices adopted by Asia-based organisations.
Our Management Trainee and Graduate Trainee Programmes, which comprise 30% of our annual hire, form a key part of our talent management pipeline. Our
manpower plans and succession planning programmes have ensured that there are two to three successors for every critical role in the company that allows us to plan for managerial transition in a smooth and seamless way. This was demonstrated again this year in terms of filling the roles created by some of the management departures that you referred to in your question.
Olam now operates across 65 countries, employs over 18,000 people and is involved in upstream, supply chain, midstream and downstream businesses. How does the management team review, control and direct such diverse operations?
Sridhar: Our company has grown and diversified significantly over the years across businesses, geographies and functions. To ensure that we enhance our capacity to execute our strategy, effectively manage and control our business despite the diversity and be predictable in our performance, we have designed an organisational structure and
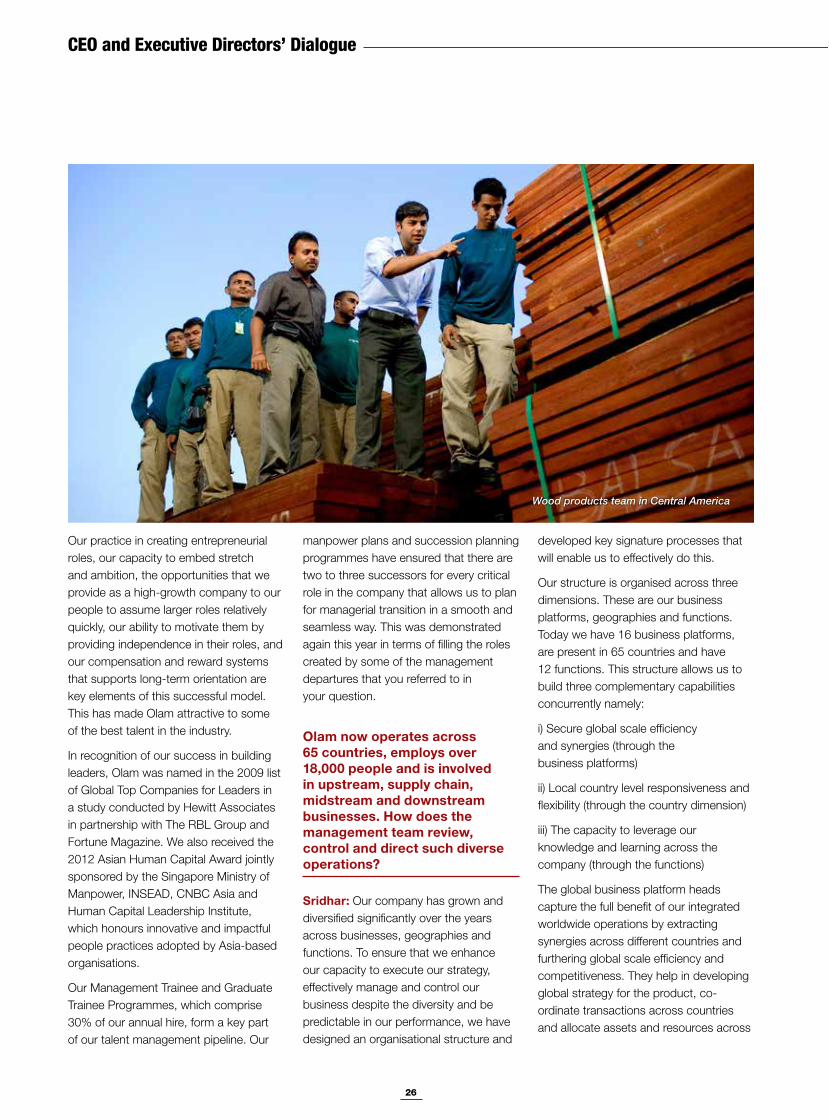
Wood products team in Central America
developed key signature processes that will enable us to effectively do this.
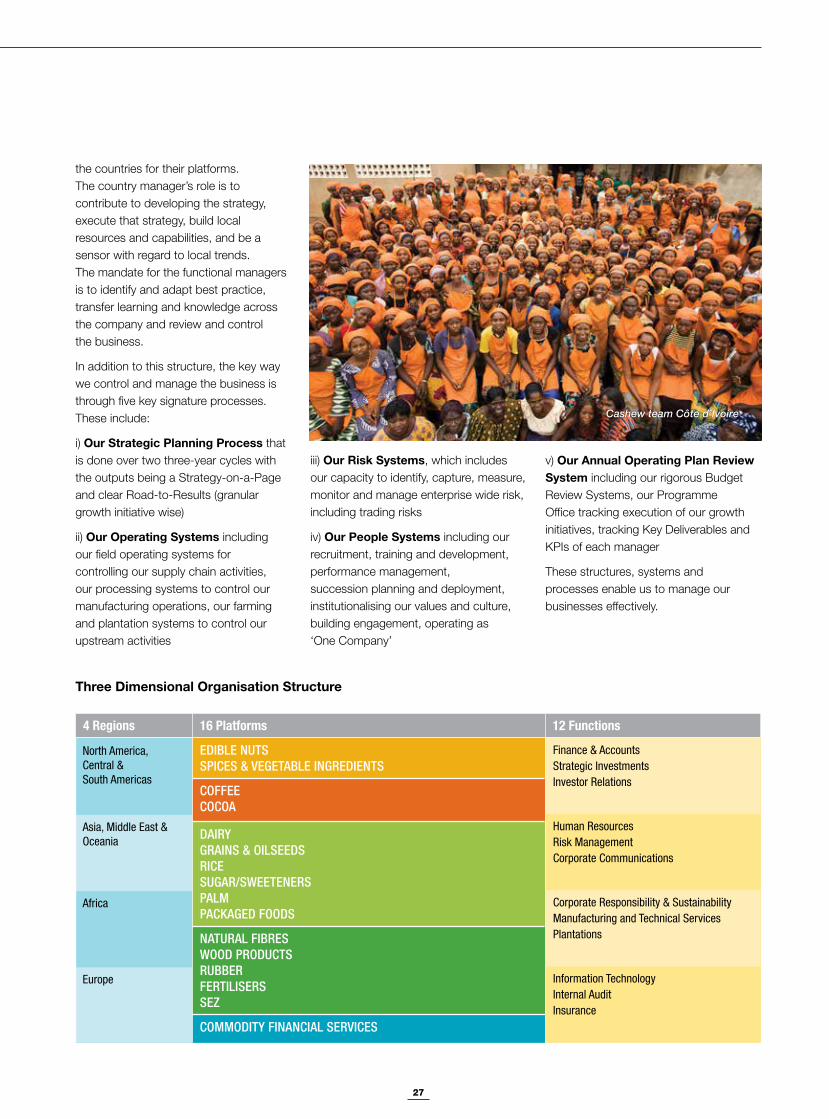
Our structure is organised across three dimensions. These are our business platforms, geographies and functions. Today we have 16 business platforms, are present in 65 countries and have 12 functions. This structure allows us to build three complementary capabilities concurrently namely:
i) Secure global scale efficiency and synergies (through the business platforms)
ii) Local country level responsiveness and flexibility (through the country dimension)
iii) The capacity to leverage our knowledge and learning across the company (through the functions)
The global business platform heads capture the full benefit of our integrated worldwide operations by extracting synergies across different countries and furthering global scale efficiency and competitiveness. They help in developing global strategy for the product, co-ordinate transactions across countries and allocate assets and resources across
27
the countries for their platforms. The country manager’s role is to contribute to developing the strategy, execute that strategy, build local resources and capabilities, and be a sensor with regard to local trends. The mandate for the functional managers is to identify and adapt best practice, transfer learning and knowledge across the company and review and control the business.
In addition to this structure, the key way we control and manage the business is through five key signature processes. These include:
i) Our Strategic Planning Process that is done over two three-year cycles with the outputs being a Strategy-on-a-Page and clear Road-to-Results (granular growth initiative wise)
ii) Our Operating Systems including our field operating systems for controlling our supply chain activities, our processing systems to control our manufacturing operations, our farming and plantation systems to control our upstream activities
iii) Our Risk Systems, which includes our capacity to identify, capture, measure, monitor and manage enterprise wide risk, including trading risks
iv) Our People Systems including our recruitment, training and development, performance management, succession planning and deployment, institutionalising our values and culture, building engagement, operating as ‘One Company’
4 Regions 16 Platforms 12 Functions
EDIBLE NUTSSPICES & VEGETABLE INGREDIENTS
Finance & AccountsStrategic Investments Investor Relations
Human ResourcesRisk ManagementCorporate Communications
Corporate Responsibility & SustainabilityManufacturing and Technical ServicesPlantations
Information TechnologyInternal AuditInsurance
COFFEECOCOA
DAIRYGRAINS & OILSEEDSRICESUGAR/SWEETENERSPALMPACKAGED FOODS
NATURAL FIBRESWOOD PRODUCTSRUBBERFERTILISERSSEZ
COMMODITY FINANCIAL SERVICES
North America,Central & South Americas
Asia, Middle East &Oceania
Africa
Europe
Cashew team Côte d’Ivoire
Three Dimensional Organisation Structure
v) Our Annual Operating Plan Review System including our rigorous Budget Review Systems, our Programme Office tracking execution of our growth initiatives, tracking Key Deliverables and KPIs of each manager
These structures, systems and processes enable us to manage our businesses effectively.
28
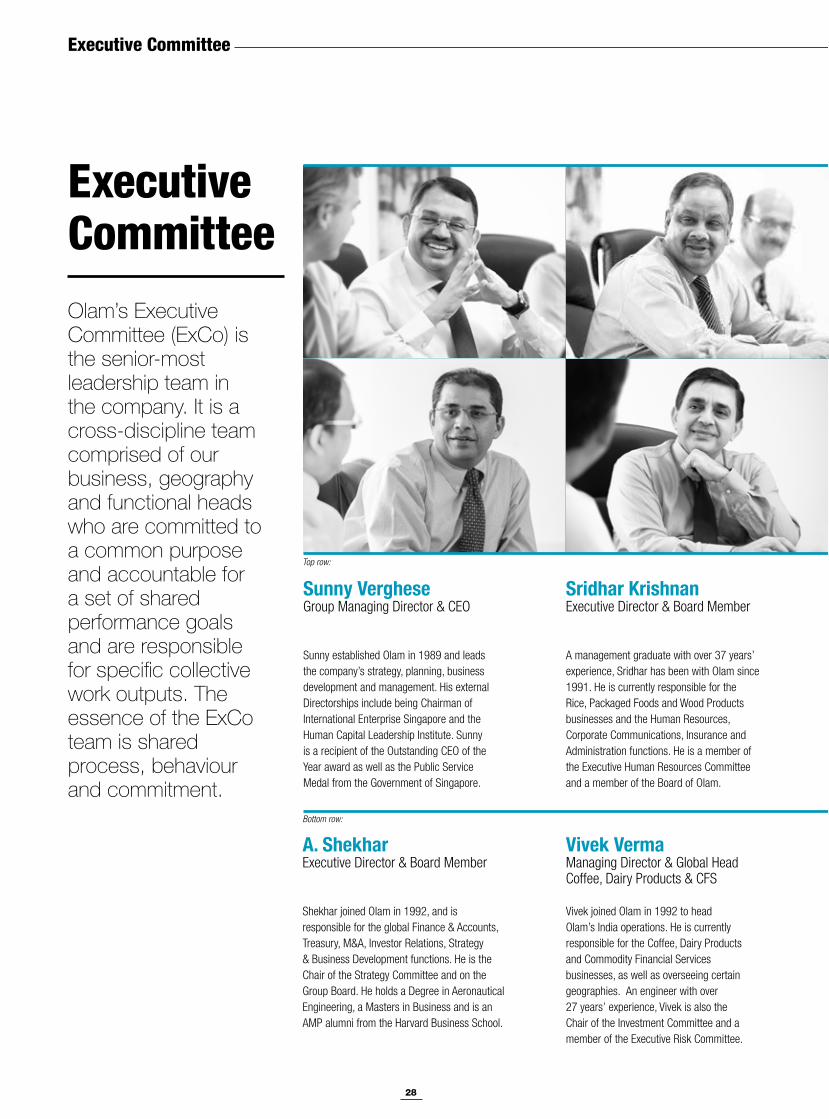
Sunny VergheseGroup Managing Director & CEO
Sunny established Olam in 1989 and leads the company’s strategy, planning, business development and management. His external Directorships include being Chairman of International Enterprise Singapore and the Human Capital Leadership Institute. Sunny is a recipient of the Outstanding CEO of the Year award as well as the Public Service Medal from the Government of Singapore.
Vivek VermaManaging Director & Global Head Coffee, Dairy Products & CFS
Vivek joined Olam in 1992 to head Olam’s India operations. He is currently responsible for the Coffee, Dairy Products and Commodity Financial Services businesses, as well as overseeing certain geographies.! An engineer with over 27 years’ experience, Vivek is also the Chair of the Investment Committee and a member of the Executive Risk Committee.
Sridhar KrishnanExecutive Director & Board Member
A management graduate with over 37 years’ experience, Sridhar has been with Olam since 1991. He is currently responsible for the Rice, Packaged Foods and Wood Products businesses and the Human Resources, Corporate Communications, Insurance and Administration functions. He is a member of the Executive Human Resources Committee and a member of the Board of Olam.
Executive Committee
A. ShekharExecutive Director & Board Member
Shekhar joined Olam in 1992, and is responsible for the global Finance & Accounts, Treasury, M&A, Investor Relations, Strategy & Business Development functions. He is the Chair of the Strategy Committee and on the Group Board. He holds a Degree in Aeronautical Engineering, a Masters in Business and is an AMP alumni from the Harvard Business School.
Top row:
Bottom row:
Executive CommitteeOlam’s Executive Committee (ExCo) is the senior-most leadership team in the company. It is a cross-discipline team comprised of our business, geography and functional heads who are committed to a common purpose and accountable for a set of shared performance goals and are responsible for specific collective work outputs. The essence of the ExCo team is shared process, behaviour and commitment.

29
Venkatramani SrivathsanManaging Director, Regional Head & Global Head Fertiliser
Srivathsan is a Chartered Accountant and joined Olam in 1994. After handling country and regional finance roles, Sri moved into operations and is currently the Global Head of the Fertiliser business in addition to overseeing Olam’s operations in Nigeria, Cameroon and Gabon. He is a member of the Investment Committee and the Executive Internal Audit Committee.
Ashok KrishenManaging Director & Global Head Edible Nuts
Ashok is a management graduate with 26 years’ experience. He has been with Olam since 1992 and is today the Global Head of the Edible Nuts platform which includes Cashew, Peanuts, Almonds and Hazelnuts. He is a member of the Strategy Committee and the Executive Risk Committee.
Gerard ManleyManaging Director & Global Head Cocoa, Specialty Fats, Sugar & Sweeteners
Gerry has 30 years’ experience in the Cocoa and Chocolate industry and is currently Chairman of the Federation of Cocoa Commerce. He has been with Olam since 1998 and is currently Chair of the Executive Corporate Responsibility and Sustainability Executive Committee and a member of the Strategy Committee and the Executive Risk Committee.
Ranveer ChauhanManaging Director, Regional Head & Global Head Palm
Ranveer joined Olam in 1993 and is the Global Head of the Palm business in addition to overseeing Olam’s operations in West, East and South Africa. A management graduate with over 25 years’ experience in agri-commodities, he is an alumni of IIM-A (India). Ranveer is a member of the Executive Human Resources Committee.
Ashok HegdeManaging Director & Global Head Rubber, Risk & IT
Ashok joined Olam in 1994 in Africa and spearheaded Olam’s foray into SE Asia. He has handled Country Head, Regional Controller and Business Head roles over the past 18 years and is currently responsible for the Rubber business and the Risk and IT functions.!He is a member of the Investment Committee and Chair of the Executive Risk Committee.
Jagdish PariharManaging Director & Global Head Natural Fibres
Jagdish has been with Olam since 1990 and over the past 23 years has been involved in the creation of many businesses in Olam’s portfolio. He is now responsible for the Natural Fibres division covering the Cotton and Wool businesses. Jagdish is a member of the Strategy Committee, the Executive Risk Committee and the Chair of the Executive Internal Audit Committee.
30
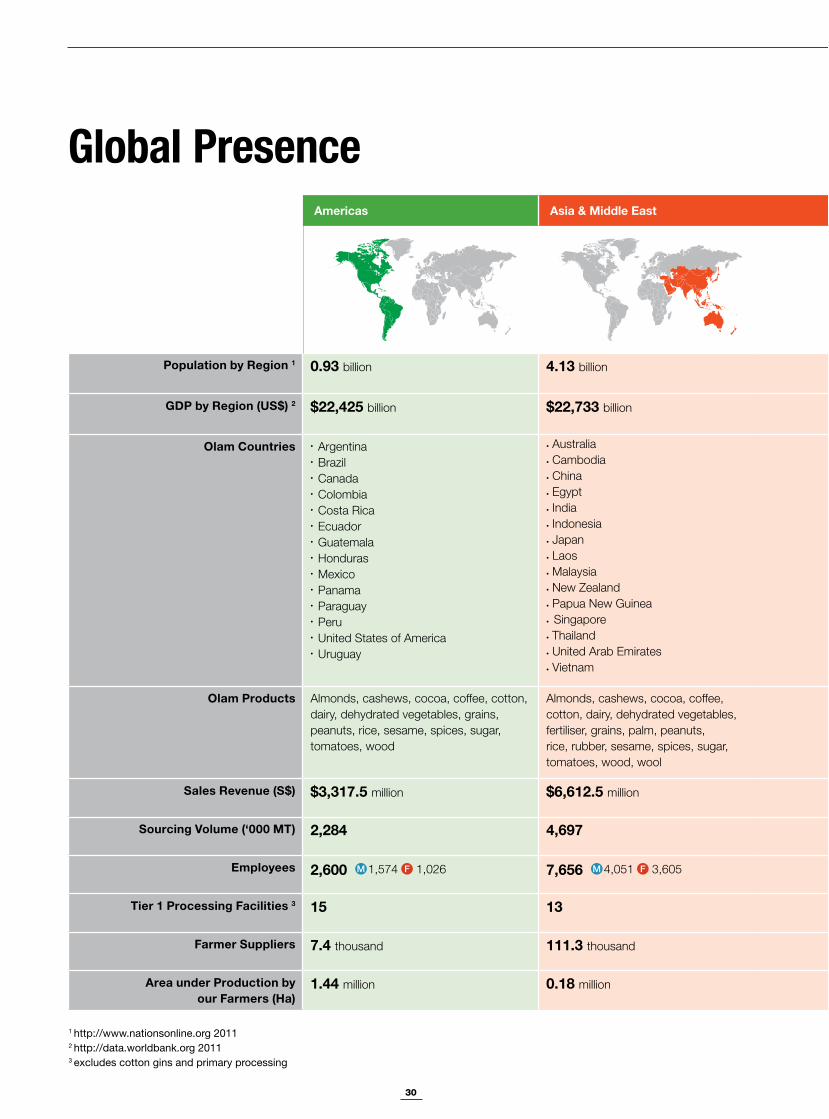
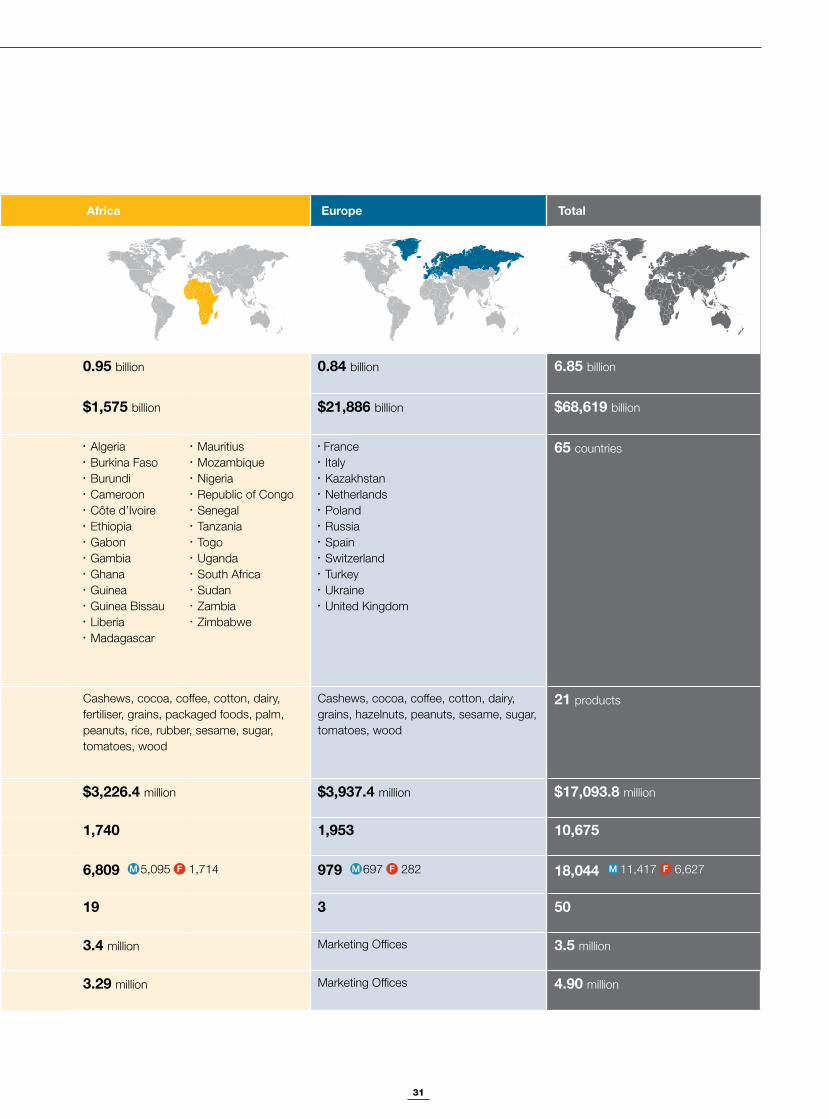
Global Presence Americas Asia & Middle East Africa Europe Total
Population by Region 1 0.93 billion 4.13 billion 0.95 billion 0.84 billion 6.85 billion
GDP by Region (US$) 2 $22,425 billion $22,733 billion $1,575 billion $21,886 billion $68,619 billion
Olam Countries ArgentinaBrazilCanadaColombia
Panama
CambodiaChina
IndiaIndonesia
Laos
Thailand
Vietnam
NetherlandsPoland
65
Olam Products 21
Sales Revenue (S$) $3,317.5 million $6,612.5 million $3,226.4 million $3,937.4 million $17,093.8 million
Sourcing Volume (‘000 MT) 2,284 4,697 1,740 1,953 10,675
Employees 2,600 M 1,574 F 1,026 7,656 M 4,051 F 3,605 6,809 M 5,095 F 1,714 979 M 697 F 282 18,044 M 11,417 F 6,627
Tier 1 Processing Facilities 3 15 13 19 3 50
Farmer Suppliers 7.4 111.3 3.4 million 3.5 million
Area under Production by our Farmers (Ha)
1.44 million 0.18 million 3.29 million 4.90 million
1 http://www.nationsonline.org 2011 2 http://data.worldbank.org 2011 3 excludes cotton gins and primary processing
31
Americas Asia & Middle East Africa Europe Total
Population by Region 1 0.93 billion 4.13 billion 0.95 billion 0.84 billion 6.85 billion
GDP by Region (US$) 2 $22,425 billion $22,733 billion $1,575 billion $21,886 billion $68,619 billion
Olam Countries ArgentinaBrazilCanadaColombia
Panama
CambodiaChina
IndiaIndonesia
Laos
Thailand
Vietnam
NetherlandsPoland
65
Olam Products 21
Sales Revenue (S$) $3,317.5 million $6,612.5 million $3,226.4 million $3,937.4 million $17,093.8 million
Sourcing Volume (‘000 MT) 2,284 4,697 1,740 1,953 10,675
Employees 2,600 M 1,574 F 1,026 7,656 M 4,051 F 3,605 6,809 M 5,095 F 1,714 979 M 697 F 282 18,044 M 11,417 F 6,627
Tier 1 Processing Facilities 3 15 13 19 3 50
Farmer Suppliers 7.4 111.3 3.4 million 3.5 million
Area under Production by our Farmers (Ha)
1.44 million 0.18 million 3.29 million 4.90 million
32
Business Review
32
Seeing the Big Picture
Olam has successfully developed a unique business model that has enabled us to participate globally across the agriculture value chain and achieve leading positions in many of our businesses. This has enhanced our ability to deliver unmatched quality, consistency, innovation and value for our customers, ensuring we continue on our path to growth despite the recent volatility in world markets.
There is an increasing desire for product traceability, as well as a growing emphasis on food safety and responsible sourcing. This has an impact across all our supply chains in products as diverse as cocoa, coffee, dairy, dehydrated vegetables, rice, timber, cotton and palm. At Olam we are pioneering new ways to meet this demand across our portfolio of products.
Several Olam businesses are expanding their reach by investing in selective upstream assets and developing manufacturing capabilities that will enhance our ability to meet increased demand, improve our margins and returns, and help achieve Olam’s goal to be a !4% NPAT and 25% ROE company by 2016.
In this review Olam’s senior managers discuss what’s driving global growth in agri-business, how we are responding to the opportunities this presents and some of the initiatives that are coming to fruition through the innovation and commitment of our people.
3333
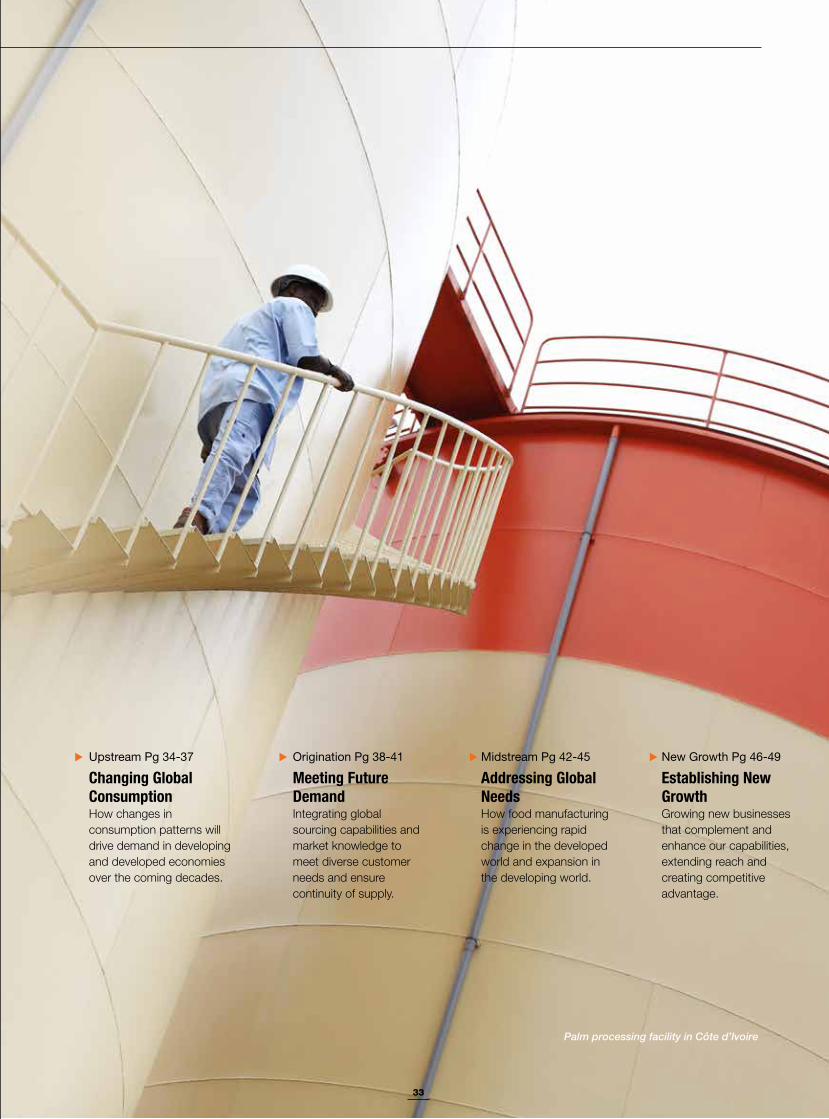
Upstream Pg 34-37
Changing Global Consumption
Origination Pg 38-41
Meeting Future Demand
Midstream Pg 42-45
Addressing Global Needs
New Growth Pg 46-49
Establishing New Growth
Palm processing facility in Côte d’Ivoire
3434
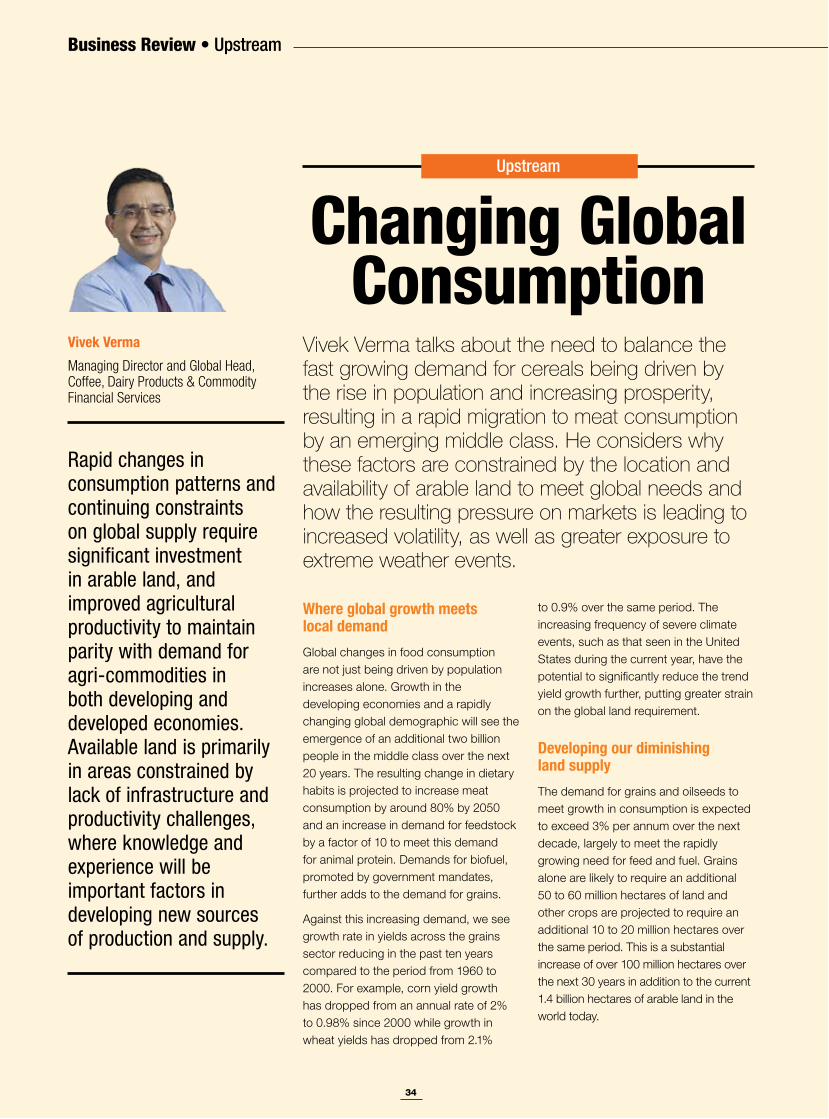
Upstream
Where global growth meets local demand
Changing Global Consumption
Vivek Verma talks about the need to balance the fast growing demand for cereals being driven by the rise in population and increasing prosperity, resulting in a rapid migration to meat consumption by an emerging middle class. He considers why these factors are constrained by the location and availability of arable land to meet global needs and how the resulting pressure on markets is leading to increased volatility, as well as greater exposure to extreme weather events.
Developing our diminishing land supply
Rapid changes in consumption patterns and continuing constraints on global supply require significant investment in arable land, and improved agricultural productivity to maintain parity with demand for agri-commodities in both developing and developed economies. Available land is primarily in areas constrained by lack of infrastructure and productivity challenges, where knowledge and experience will be important factors in developing new sources of production and supply.
Vivek Verma
Managing Director and Global Head, Coffee, Dairy Products & Commodity Financial Services
Upstream
3535
More limited supplies of fresh water
Impact on global stock ratios
Growing opportunities
Comment at [email protected]
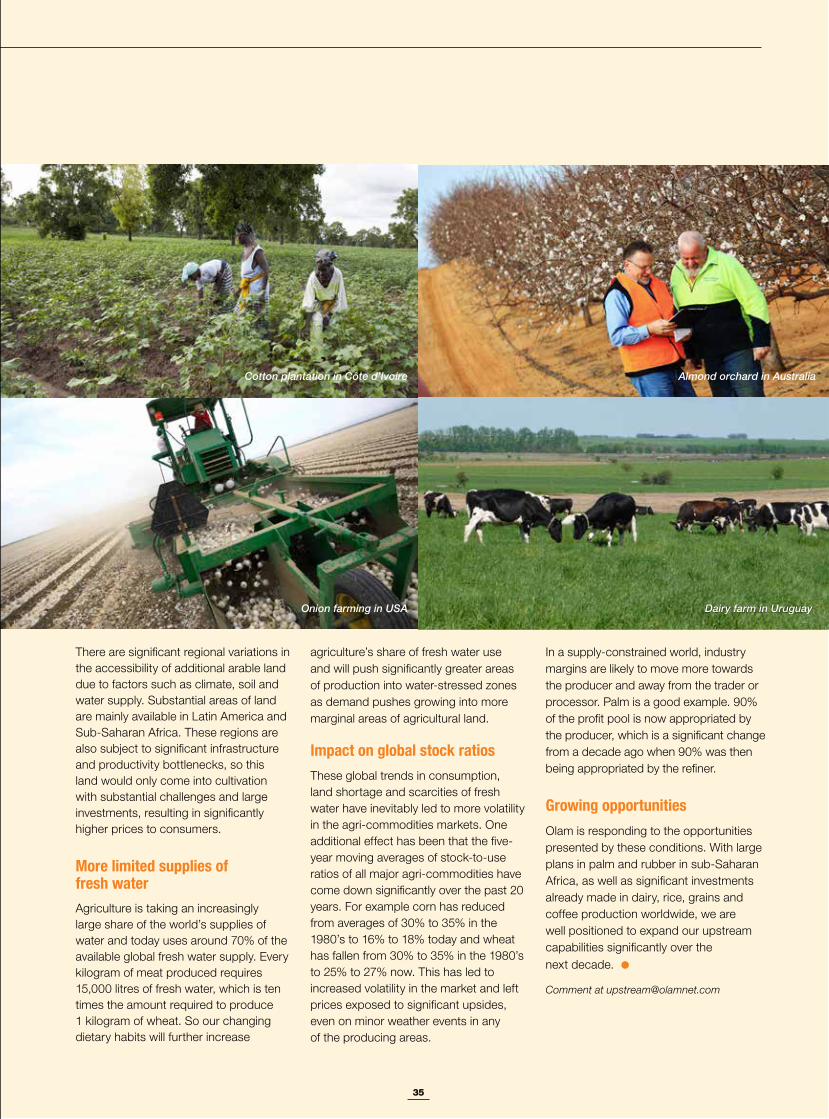
Onion farming in USA
Cotton plantation in Côte d’Ivoire Almond orchard in Australia
Dairy farm in Uruguay
36
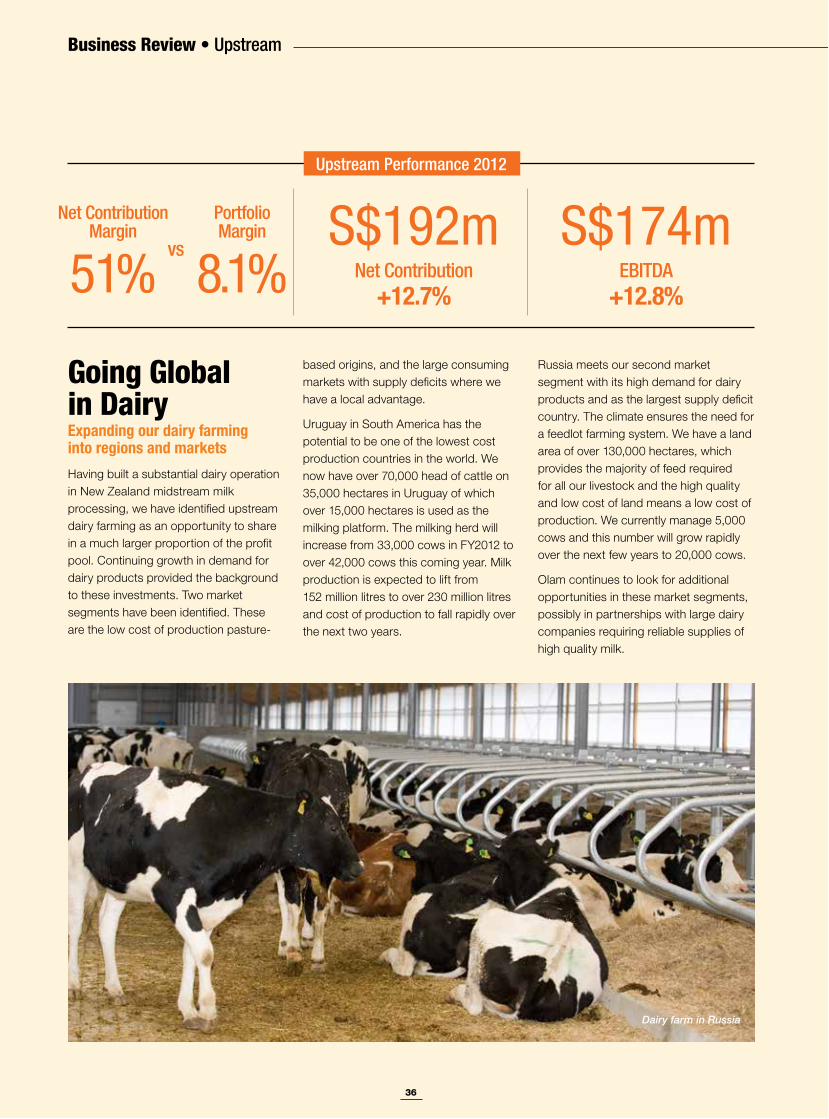
Upstream
Going Global in DairyExpanding our dairy farming into regions and markets
Dairy farm in Russia
Upstream Performance 2012
Portfolio Margin
8.1%Net Contribution
Margin
51%S$192m
Net Contribution +12.7%
S$174mEBITDA
+12.8%
vs
37
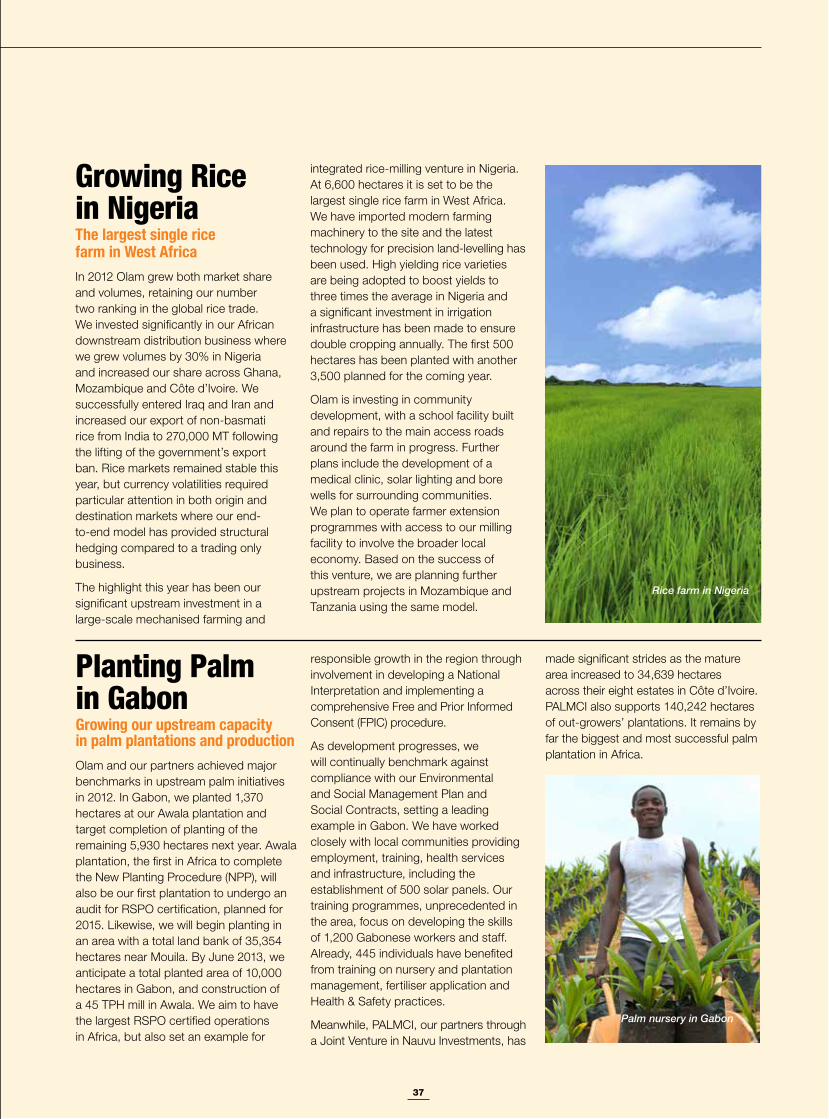
Rice farm in Nigeria
Planting Palm in GabonGrowing our upstream capacity in palm plantations and production
Palm nursery in Gabon
Growing Rice in NigeriaThe largest single rice farm in West Africa
38
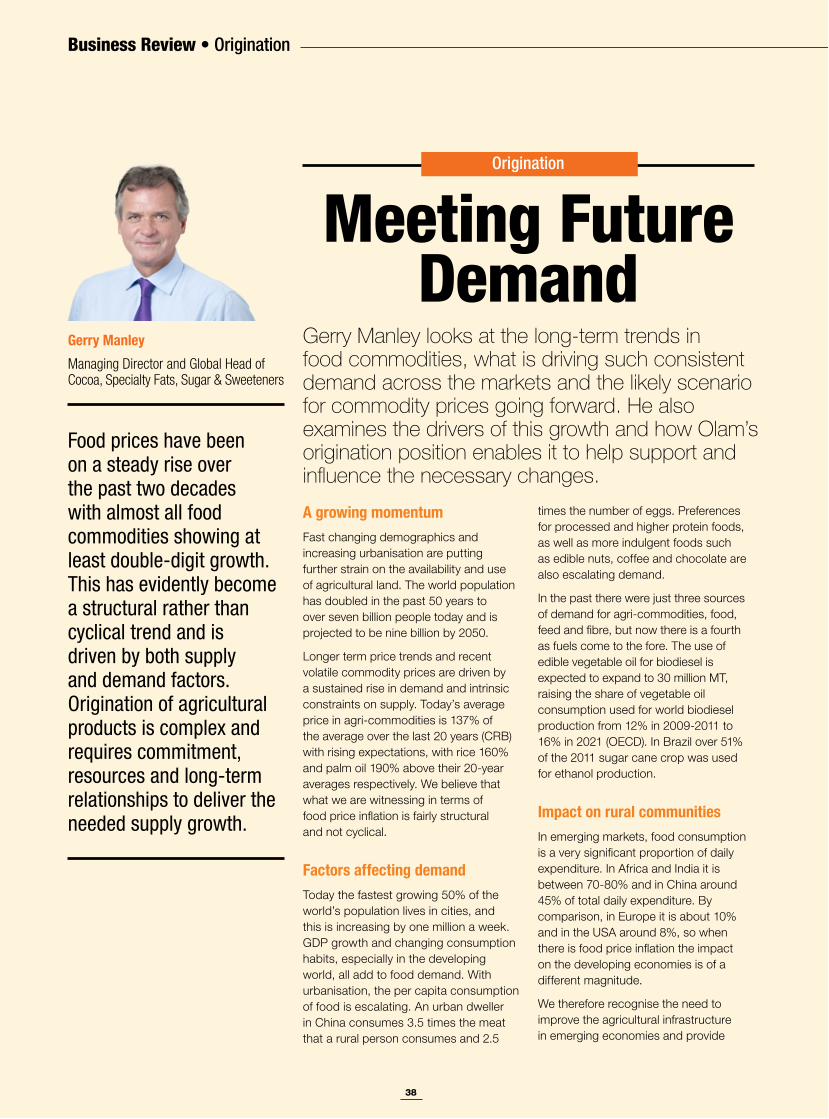
Origination
Meeting Future Demand
Gerry Manley looks at the long-term trends in food commodities, what is driving such consistent demand across the markets and the likely scenario for commodity prices going forward. He also examines the drivers of this growth and how Olam’s origination position enables it to help support and influence the necessary changes.
Food prices have been on a steady rise over the past two decades with almost all food commodities showing at least double-digit growth. This has evidently become a structural rather than cyclical trend and is driven by both supply and demand factors. Origination of agricultural products is complex and requires commitment, resources and long-term relationships to deliver the needed supply growth.
Gerry Manley
Managing Director and Global Head of Cocoa, Specialty Fats, Sugar & Sweeteners
Origination
A growing momentum
Factors affecting demand
Impact on rural communities
39
Origination was our heart and our beginning
The future
Comment at [email protected]
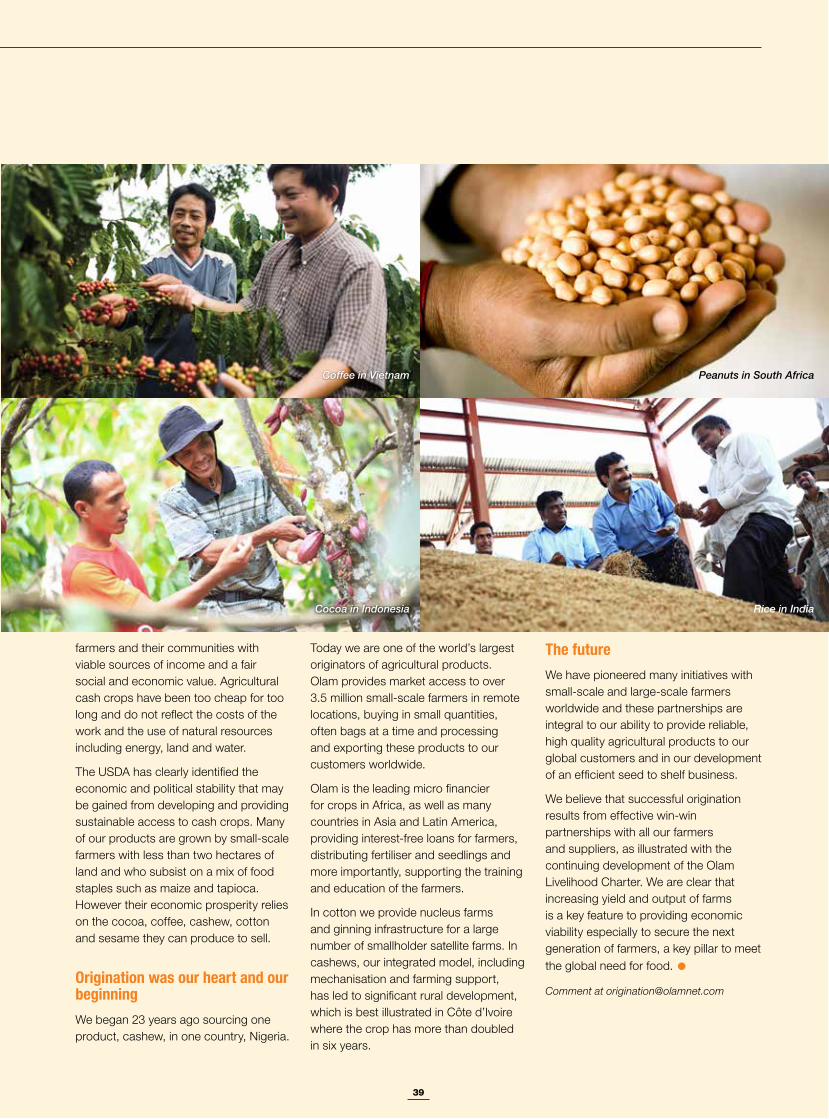
Cocoa in Indonesia
Coffee in Vietnam Peanuts in South Africa
Rice in India
40
Origination
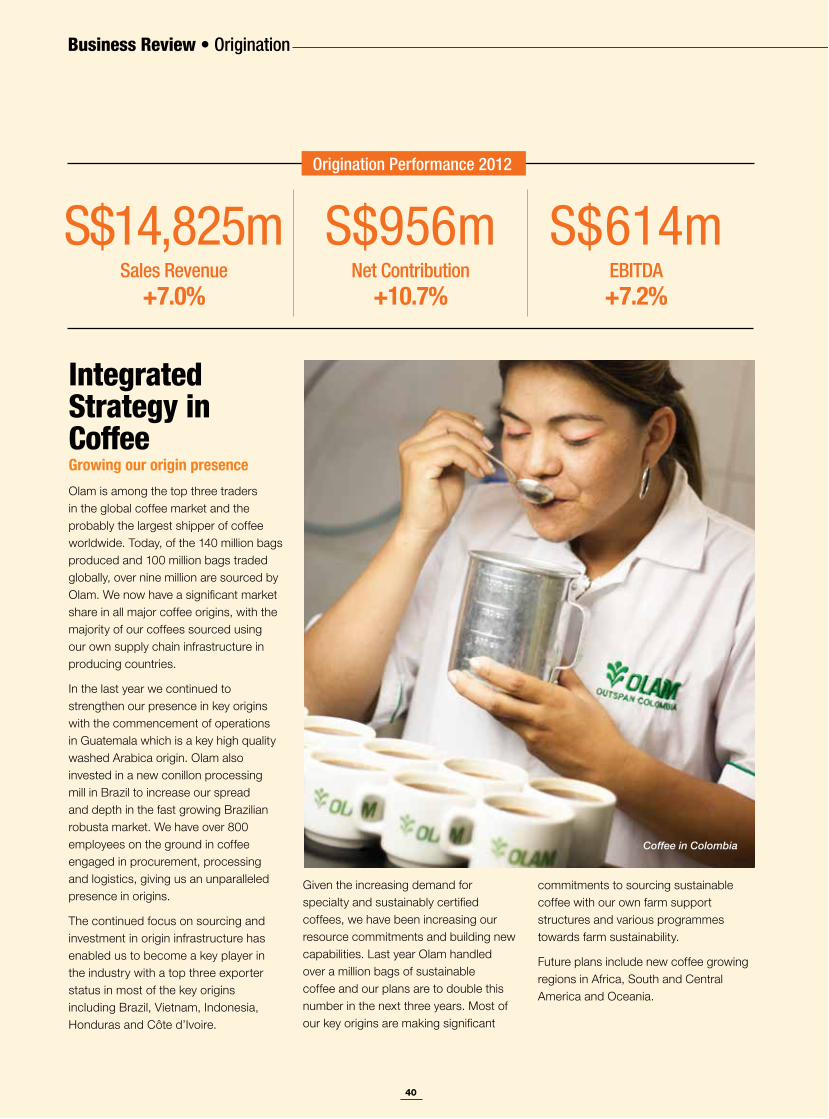
Integrated Strategy in CoffeeGrowing our origin presence
Origination Performance 2012
S$14,825mSales Revenue
+7.0%
S$956mNet Contribution
+10.7%
S$614mEBITDA +7.2%
Coffee in Colombia
41
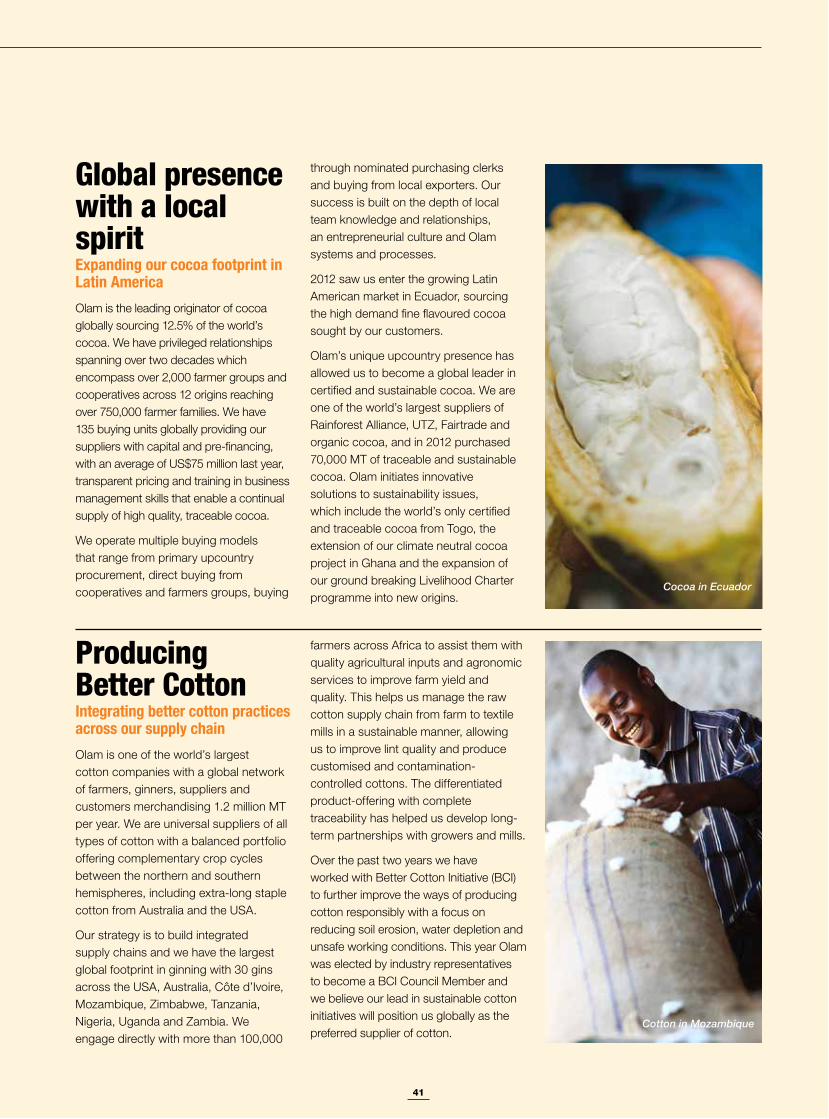
Producing Better CottonIntegrating better cotton practices across our supply chain
Global presence with a local spiritExpanding our cocoa footprint in Latin America
Cocoa in Ecuador
Cotton in Mozambique
42
Midstream
Delivering cost-effective manufacturing solutions
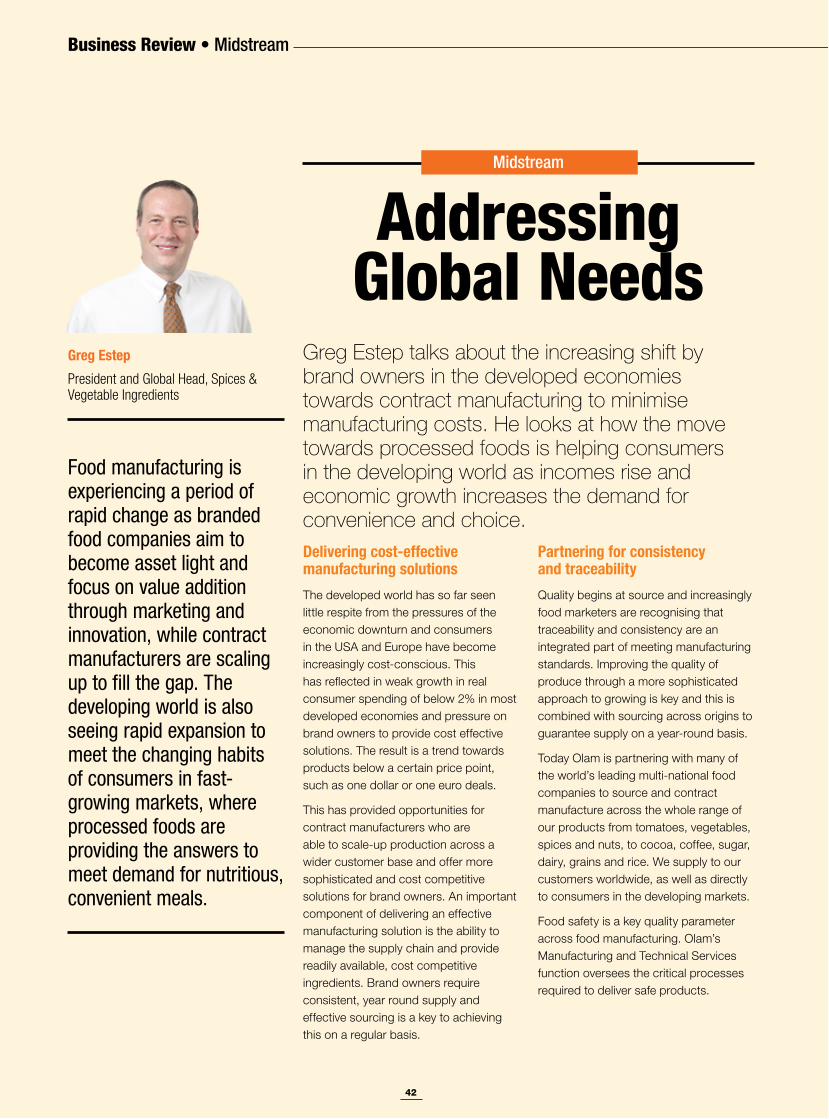
Greg Estep
President and Global Head, Spices & Vegetable Ingredients
Addressing Global Needs
Greg Estep talks about the increasing shift by brand owners in the developed economies towards contract manufacturing to minimise manufacturing costs. He looks at how the move towards processed foods is helping consumers in the developing world as incomes rise and economic growth increases the demand for convenience and choice.
Partnering for consistency and traceability
Food manufacturing is experiencing a period of rapid change as branded food companies aim to become asset light and focus on value addition through marketing and innovation, while contract manufacturers are scaling up to fill the gap. The developing world is also seeing rapid expansion to meet the changing habits of consumers in fast-growing markets, where processed foods are providing the answers to meet demand for nutritious, convenient meals.
Midstream
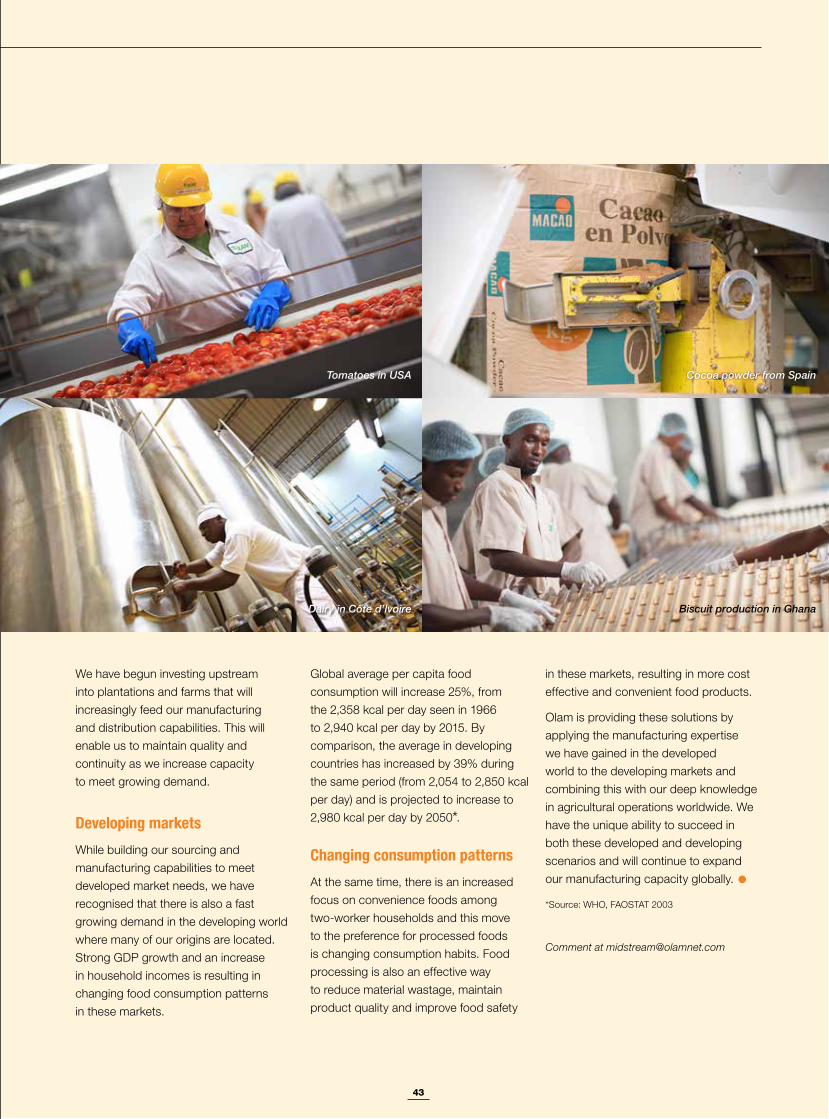
43
Dairy in Côte d’Ivoire
Cocoa powder from Spain
Biscuit production in Ghana
Tomatoes in USA
Developing markets *
Changing consumption patterns
Comment at [email protected]
44
Midstream
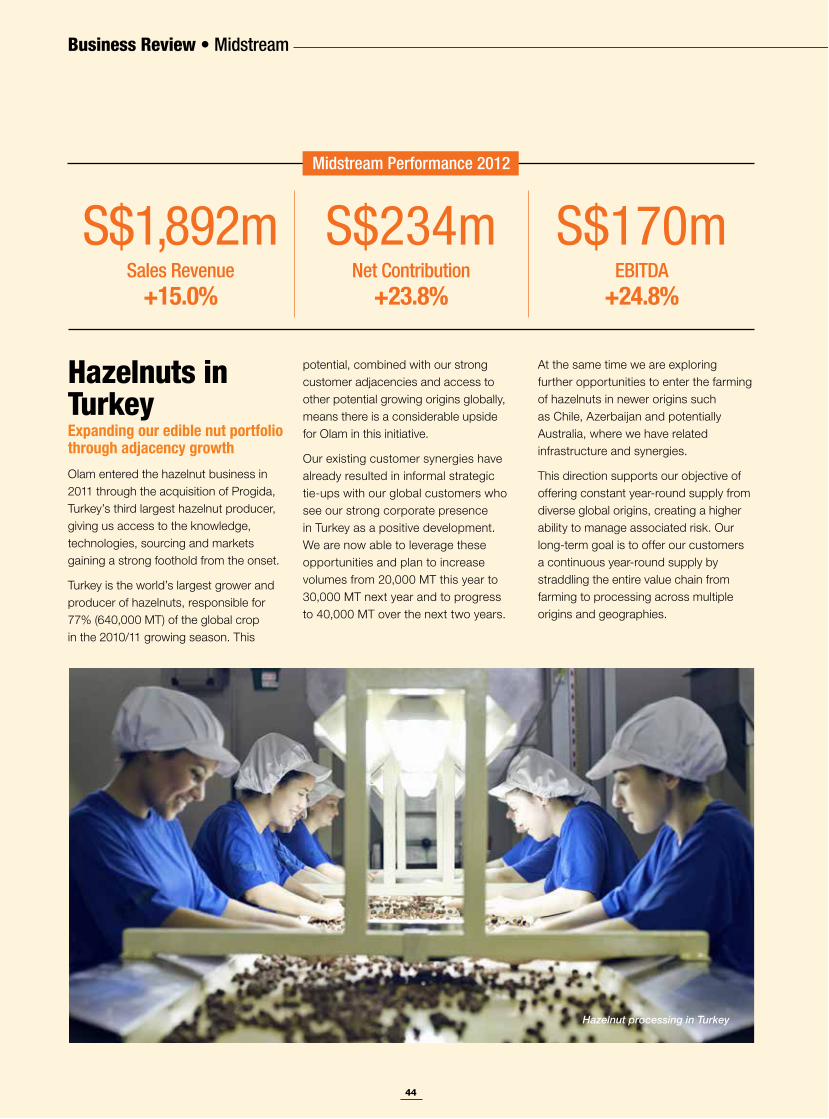
Hazelnuts in TurkeyExpanding our edible nut portfolio through adjacency growth
Midstream Performance 2012
Hazelnut processing in Turkey
S$1,892mSales Revenue
+15.0%
S$234mNet Contribution
+23.8%
S$170mEBITDA
+24.8%
45
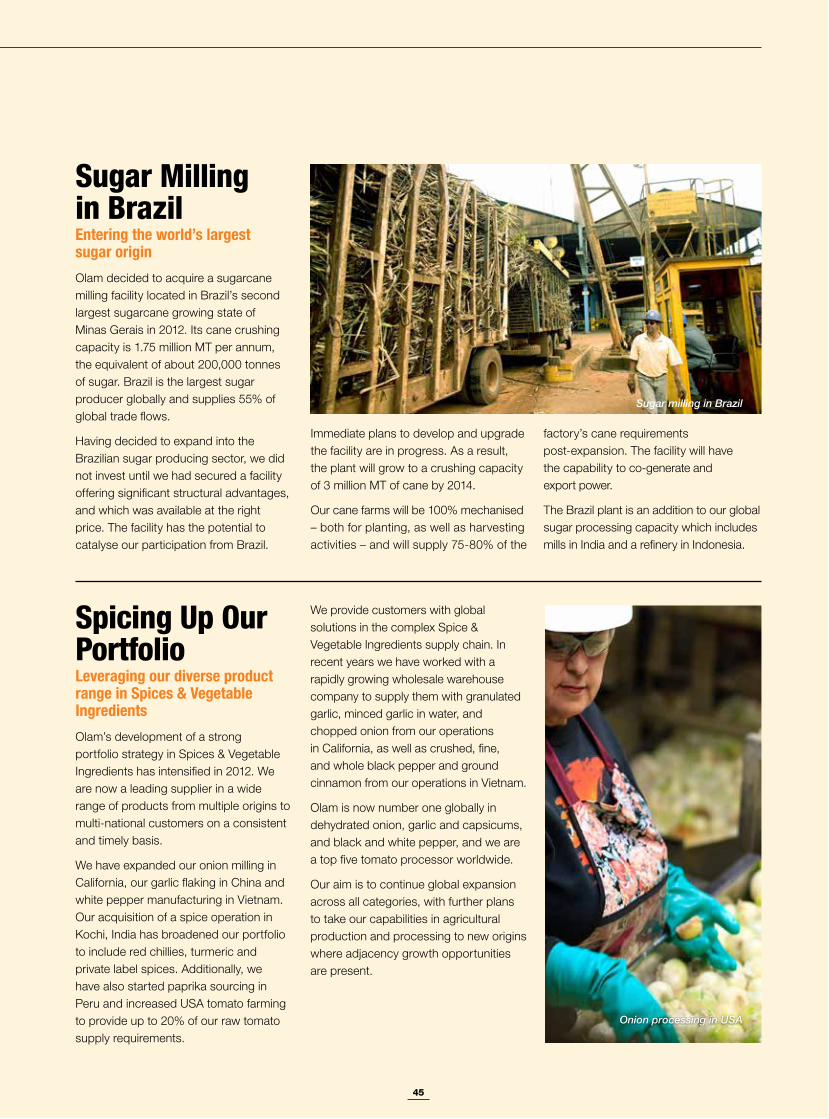
Sugar Milling in BrazilEntering the world’s largest sugar origin
Spicing Up Our PortfolioLeveraging our diverse product range in Spices & Vegetable Ingredients
Onion processing in USA
Sugar milling in Brazil
46
New Growth
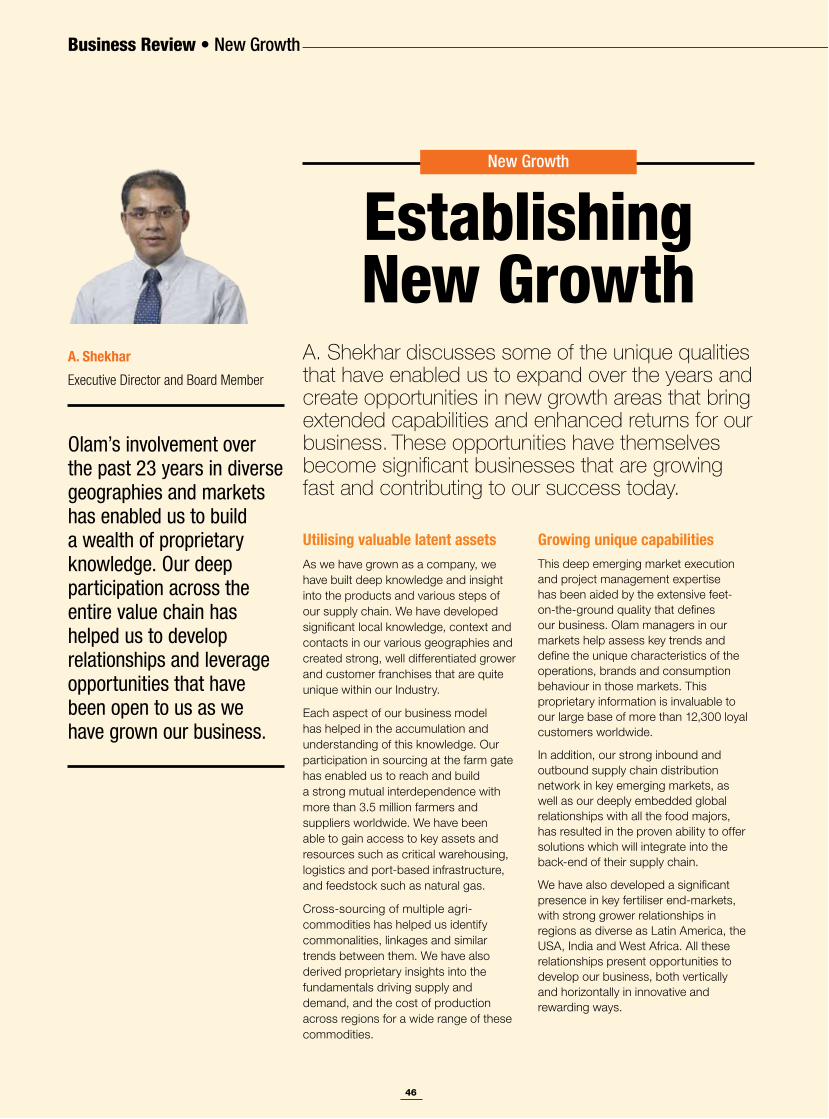
A. Shekhar Executive Director and Board Member
Establishing New Growth
A. Shekhar discusses some of the unique qualities that have enabled us to expand over the years and create opportunities in new growth areas that bring extended capabilities and enhanced returns for our business. These opportunities have themselves become significant businesses that are growing fast and contributing to our success today.
Olam’s involvement over the past 23 years in diverse geographies and markets has enabled us to build a wealth of proprietary knowledge. Our deep participation across the entire value chain has helped us to develop relationships and leverage opportunities that have been open to us as we have grown our business.
Utilising valuable latent assetsAs we have grown as a company, we have built deep knowledge and insight into the products and various steps of our supply chain. We have developed significant local knowledge, context and contacts in our various geographies and created strong, well differentiated grower and customer franchises that are quite unique within our Industry.
Each aspect of our business model has helped in the accumulation and understanding of this knowledge. Our participation in sourcing at the farm gate has enabled us to reach and build a strong mutual interdependence with more than 3.5 million farmers and suppliers worldwide. We have been able to gain access to key assets and resources such as critical warehousing, logistics and port-based infrastructure, and feedstock such as natural gas.
Cross-sourcing of multiple agri-commodities has helped us identify commonalities, linkages and similar trends between them. We have also derived proprietary insights into the fundamentals driving supply and demand, and the cost of production across regions for a wide range of these commodities.
Growing unique capabilitiesThis deep emerging market execution and project management expertise has been aided by the extensive feet-on-the-ground quality that defines our business. Olam managers in our markets help assess key trends and define the unique characteristics of the operations, brands and consumption behaviour in those markets. This proprietary information is invaluable to our large base of more than 12,300 loyal customers worldwide.
In addition, our strong inbound and outbound supply chain distribution network in key emerging markets, as well as our deeply embedded global relationships with all the food majors, has resulted in the proven ability to offer solutions which will integrate into the back-end of their supply chain.
We have also developed a significant presence in key fertiliser end-markets, with strong grower relationships in regions as diverse as Latin America, the USA, India and West Africa. All these relationships present opportunities to develop our business, both vertically and horizontally in innovative and rewarding ways.
New Growth
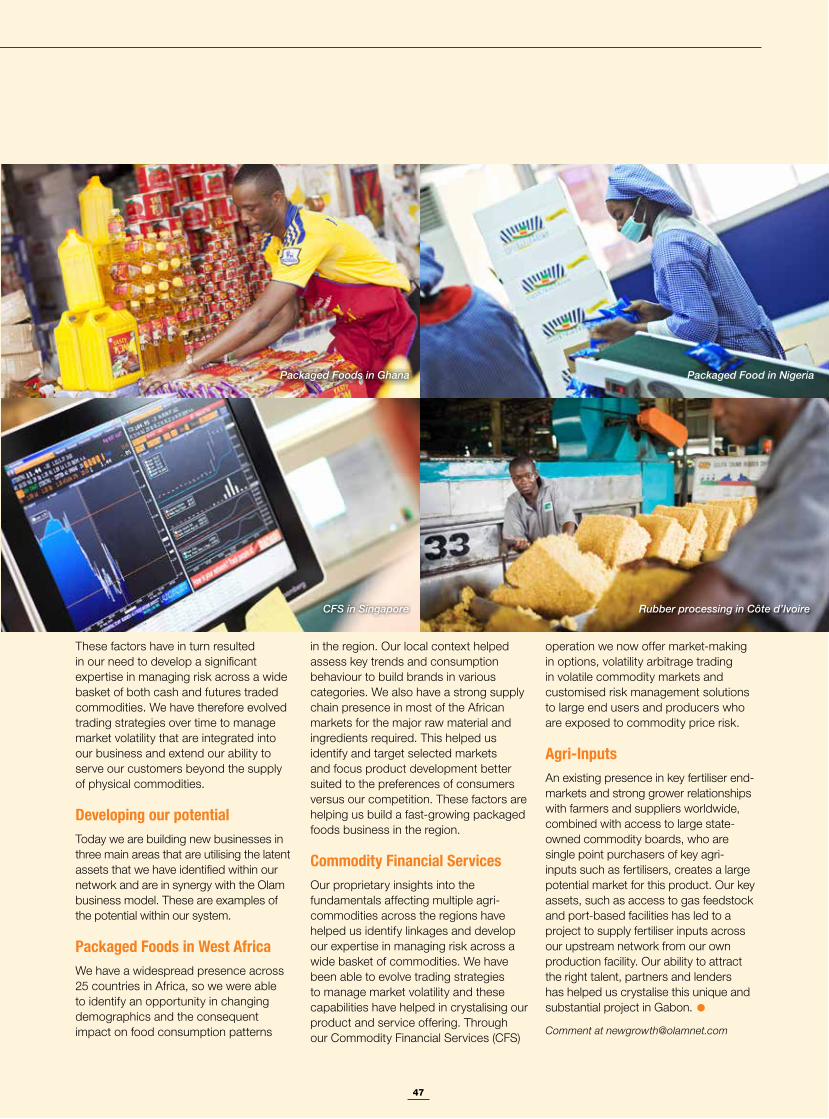
47
These factors have in turn resulted in our need to develop a significant expertise in managing risk across a wide basket of both cash and futures traded commodities. We have therefore evolved trading strategies over time to manage market volatility that are integrated into our business and extend our ability to serve our customers beyond the supply of physical commodities.
Developing our potentialToday we are building new businesses in three main areas that are utilising the latent assets that we have identified within our network and are in synergy with the Olam business model. These are examples of the potential within our system.
Packaged Foods in West AfricaWe have a widespread presence across 25 countries in Africa, so we were able to identify an opportunity in changing demographics and the consequent impact on food consumption patterns
in the region. Our local context helped assess key trends and consumption behaviour to build brands in various categories. We also have a strong supply chain presence in most of the African markets for the major raw material and ingredients required. This helped us identify and target selected markets and focus product development better suited to the preferences of consumers versus our competition. These factors are helping us build a fast-growing packaged foods business in the region.
Commodity Financial ServicesOur proprietary insights into the fundamentals affecting multiple agri-commodities across the regions have helped us identify linkages and develop our expertise in managing risk across a wide basket of commodities. We have been able to evolve trading strategies to manage market volatility and these capabilities have helped in crystalising our product and service offering. Through our Commodity Financial Services (CFS)
operation we now offer market-making in options, volatility arbitrage trading in volatile commodity markets and customised risk management solutions to large end users and producers who are exposed to commodity price risk.
Agri-InputsAn existing presence in key fertiliser end-markets and strong grower relationships with farmers and suppliers worldwide, combined with access to large state-owned commodity boards, who are single point purchasers of key agri-inputs such as fertilisers, creates a large potential market for this product. Our key assets, such as access to gas feedstock and port-based facilities has led to a project to supply fertiliser inputs across our upstream network from our own production facility. Our ability to attract the right talent, partners and lenders has helped us crystalise this unique and substantial project in Gabon.
Comment at [email protected]
Packaged Foods in Ghana
CFS in Singapore
Packaged Food in Nigeria
Rubber processing in Côte d’Ivoire
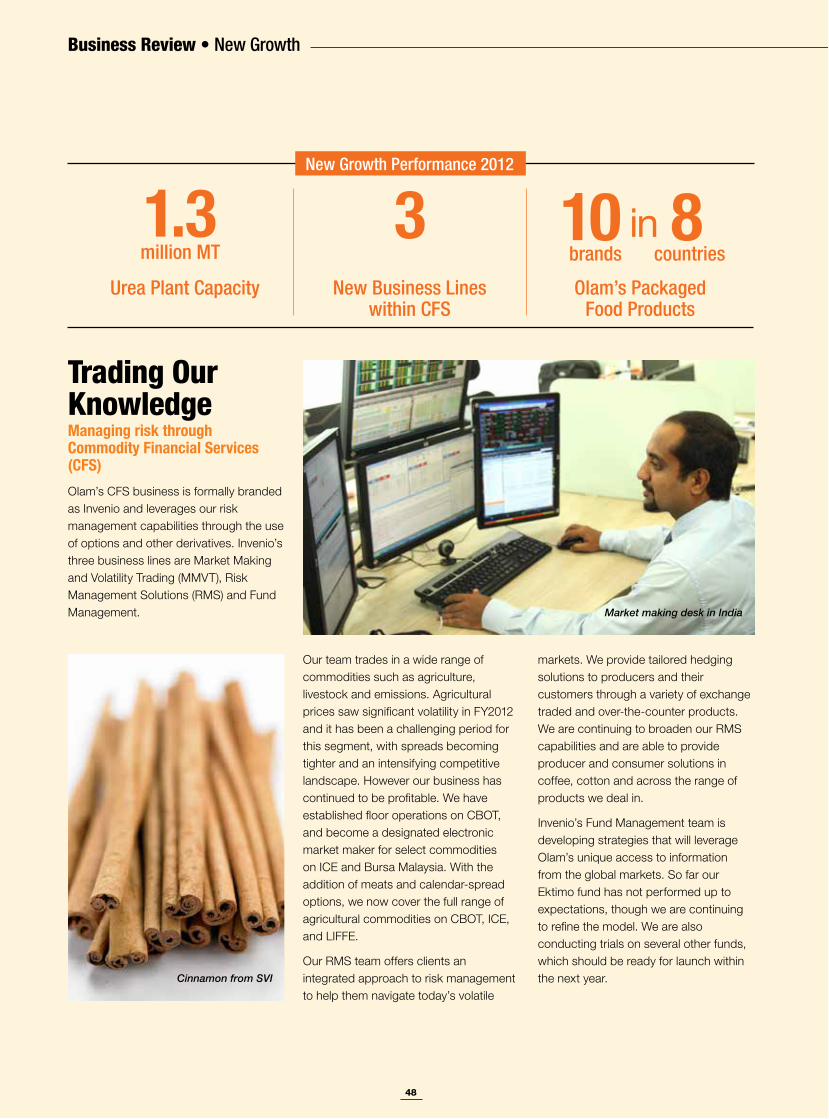
48
New Growth
Trading Our KnowledgeManaging risk through Commodity Financial Services (CFS)Olam’s CFS business is formally branded as Invenio and leverages our risk management capabilities through the use of options and other derivatives. Invenio’s three business lines are Market Making and Volatility Trading (MMVT), Risk Management Solutions (RMS) and Fund Management.
Our team trades in a wide range of commodities such as agriculture, livestock and emissions. Agricultural prices saw significant volatility in FY2012 and it has been a challenging period for this segment, with spreads becoming tighter and an intensifying competitive landscape. However our business has continued to be profitable. We have established floor operations on CBOT, and become a designated electronic market maker for select commodities on ICE and Bursa Malaysia. With the addition of meats and calendar-spread options, we now cover the full range of agricultural commodities on CBOT, ICE, and LIFFE.
Our RMS team offers clients an integrated approach to risk management to help them navigate today’s volatile
markets. We provide tailored hedging solutions to producers and their customers through a variety of exchange traded and over-the-counter products. We are continuing to broaden our RMS capabilities and are able to provide producer and consumer solutions in coffee, cotton and across the range of products we deal in.
Invenio’s Fund Management team is developing strategies that will leverage Olam’s unique access to information from the global markets. So far our Ektimo fund has not performed up to expectations, though we are continuing to refine the model. We are also conducting trials on several other funds, which should be ready for launch within the next year.
Market making desk in India
Cinnamon from SVI
New Growth Performance 2012
1.3 3Olam’s Packaged
Food Products
10brands
8countries
inNew Business Lines
within CFSUrea Plant Capacity
million MT

49
Entry Into FertilisersA new business opportunity for global supplyOlam made its debut into the fertilisers business this year through a number of significant initiatives, with the aim of becoming a dominant supplier of fertilisers in the African market. To help establish our presence, we began trading in fertilisers by sourcing externally and selling to buyers of cocoa, cashew and other Olam-related products.
To meet our long-term supply requirements we have invested in a major project in Gabon to construct a 1.3 million MT Urea plant using natural gas as feed stock. We have completed
Consumer Food ProductsRamping up growth in our Packaged Foods BusinessEconomists predict African nations will lead the world in the rate of growth for consumer products over the next 10 to 20 years. Growth in household incomes and the resulting trends in food consumption mean there will be strong demand for packaged foods with convenience and food safety as the driving factors.
Nigeria is currently the world’s leading growth market in packaged foods. The market averaged GDP Growth of 7.2% from 2006-2010 and has a projected growth rate of 8.7% per annum for FMCG products from 2011-2020. Our US$250 million investment made last year in Nigerian and Ghana based
packaged foods businesses is a targeted approach to fill this demand.
We already have an established distribution network in our key target markets of Nigeria, South Africa, Ghana, and MBTN (Mali, Burkina Faso, Togo and Niger). Our current portfolio consists of Tomato Paste, Pasta, Seasonings, Confectionery, Instant Noodles, Dairy Products, and Fruit Juices across eight brands including Tasty Tom, De Rica, Enrista, Pearl, OK, Cherie, Blue Boat and Nature Fresh.
Today we are amongst the top two players in tomato paste, biscuits, confectionery, and selected seasonings. We have established an innovation centre in India to support our R&D efforts in these markets and we will continue to invest in distribution, brand building and innovation to help achieve a leadership position in the sector.
the Front End Engineering Design (FEED) in June with Technip France and are currently doing an open book estimate which will be finally converted into a Lump Sum Turnkey Contract (LSTK). We have also received EIA (Environmental Impact Assessment) clearance from the Government of Gabon.
Our current focus is in the Western African markets where we have already secured a tender with the Ghanaian government to supply 30,000 MT and are now looking at the Nigerian and Ivorian markets. We also actively work with Olam upstream operations to cater to their fertiliser needs. The estimated volume for the West African market alone is 1.68 million MT per annum.
Retail market in Nigeria
Fertiliser in USA

50
Corporate Responsibility & Sustainability
Improving Small-scale Farmer Incomes and Livelihoods
Jean-Paul PinardNon-Executive Director and Chairman of the Board CR&S Committee
“Small-scale farmers play a vital part in feeding our growing population, particularly where that growth is the highest, in the emerging world where 50 to 60% of the population is involved in agriculture. One of our main opportunities to enhance global food production, while improving rural livelihoods is thus through promoting small-scale farming.”
Issues that lock small-scale farmers into poverty and limit their production potentialA critical issue facing small-scale farmers in emerging economies is their lack of liquidity or access to finance to fund their activities, for example to replace ageing tree crops or buy disease-resistant, high-yield seeds. Nor are they often able to afford agricultural inputs for pest and weed control. All this limits their production potential. Also, many of them
It is estimated that 40% of the people on earth earn their living as small-scale farmers. These farmers are going to play a critical part in feeding the burgeoning global population, but only if appropriate supporting mechanisms are put in place so they can realise their full potential. It is estimated that, on average, small-scale farmers work less than two hectares of land. Partly as a result, many of them are among the poorest people on earth, living in a self-perpetuating poverty loop that can only be addressed if core issues are well understood.
are just not able to feed their families without cash-flow assistance.
Lack of proper education and training in farming techniques also contributes to a pattern of low yields and poor crop quality. This in turn means that income from farming is not maximised. Furthermore, as literary and numeracy skills are not commonly found, understanding the business aspects of agricultural production remains a challenge for many. Small-scale farmers
Cocoa farmer training in Ghana
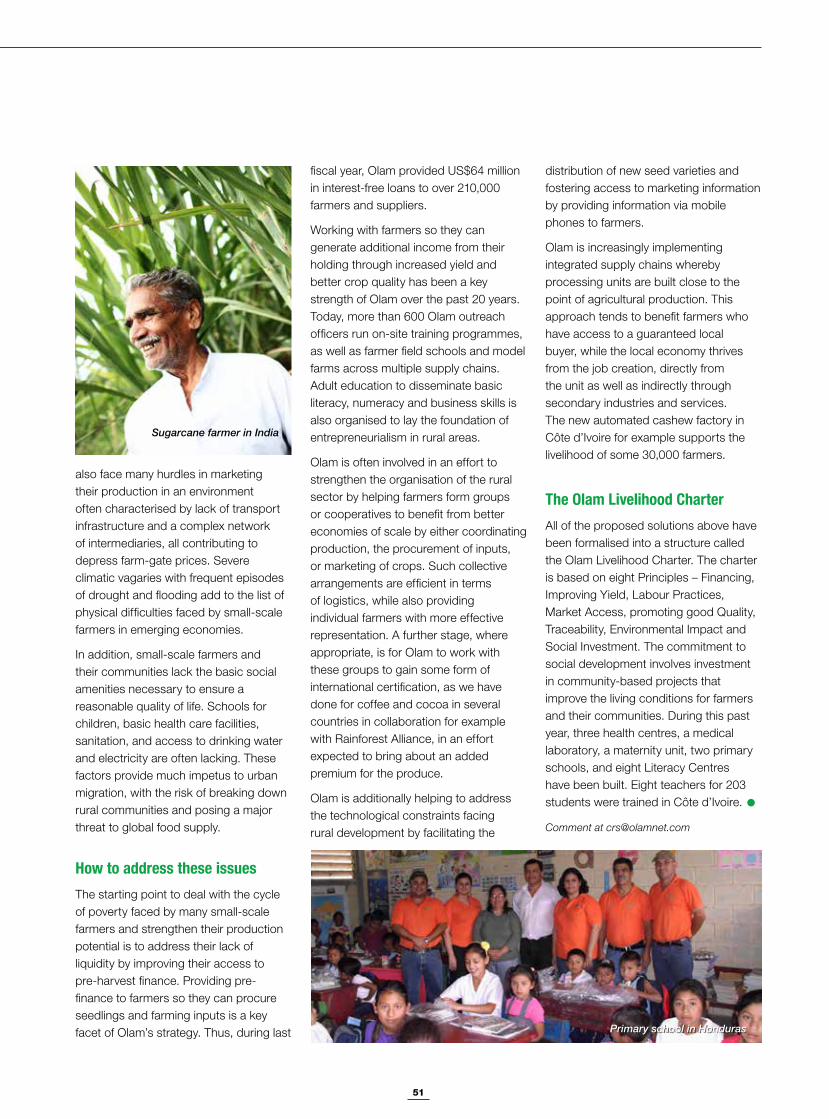
51
also face many hurdles in marketing their production in an environment often characterised by lack of transport infrastructure and a complex network of intermediaries, all contributing to depress farm-gate prices. Severe climatic vagaries with frequent episodes of drought and flooding add to the list of physical difficulties faced by small-scale farmers in emerging economies.
In addition, small-scale farmers and their communities lack the basic social amenities necessary to ensure a reasonable quality of life. Schools for children, basic health care facilities, sanitation, and access to drinking water and electricity are often lacking. These factors provide much impetus to urban migration, with the risk of breaking down rural communities and posing a major threat to global food supply.
How to address these issuesThe starting point to deal with the cycle of poverty faced by many small-scale farmers and strengthen their production potential is to address their lack of liquidity by improving their access to pre-harvest finance. Providing pre-finance to farmers so they can procure seedlings and farming inputs is a key facet of Olam’s strategy. Thus, during last
fiscal year, Olam provided US$64 million in interest-free loans to over 210,000 farmers and suppliers.
Working with farmers so they can generate additional income from their holding through increased yield and better crop quality has been a key strength of Olam over the past 20 years. Today, more than 600 Olam outreach officers run on-site training programmes, as well as farmer field schools and model farms across multiple supply chains. Adult education to disseminate basic literacy, numeracy and business skills is also organised to lay the foundation of entrepreneurialism in rural areas.
Olam is often involved in an effort to strengthen the organisation of the rural sector by helping farmers form groups or cooperatives to benefit from better economies of scale by either coordinating production, the procurement of inputs, or marketing of crops. Such collective arrangements are efficient in terms of logistics, while also providing individual farmers with more effective representation. A further stage, where appropriate, is for Olam to work with these groups to gain some form of international certification, as we have done for coffee and cocoa in several countries in collaboration for example with Rainforest Alliance, in an effort expected to bring about an added premium for the produce.
Olam is additionally helping to address the technological constraints facing rural development by facilitating the
distribution of new seed varieties and fostering access to marketing information by providing information via mobile phones to farmers.
Olam is increasingly implementing integrated supply chains whereby processing units are built close to the point of agricultural production. This approach tends to benefit farmers who have access to a guaranteed local buyer, while the local economy thrives from the job creation, directly from the unit as well as indirectly through secondary industries and services. The new automated cashew factory in Côte d’Ivoire for example supports the livelihood of some 30,000 farmers.
The Olam Livelihood CharterAll of the proposed solutions above have been formalised into a structure called the Olam Livelihood Charter. The charter is based on eight Principles – Financing, Improving Yield, Labour Practices, Market Access, promoting good Quality, Traceability, Environmental Impact and Social Investment. The commitment to social development involves investment in community-based projects that improve the living conditions for farmers and their communities. During this past year, three health centres, a medical laboratory, a maternity unit, two primary schools, and eight Literacy Centres have been built. Eight teachers for 203 students were trained in Côte d’Ivoire.
Comment at [email protected]
Primary school in Honduras
Sugarcane farmer in India
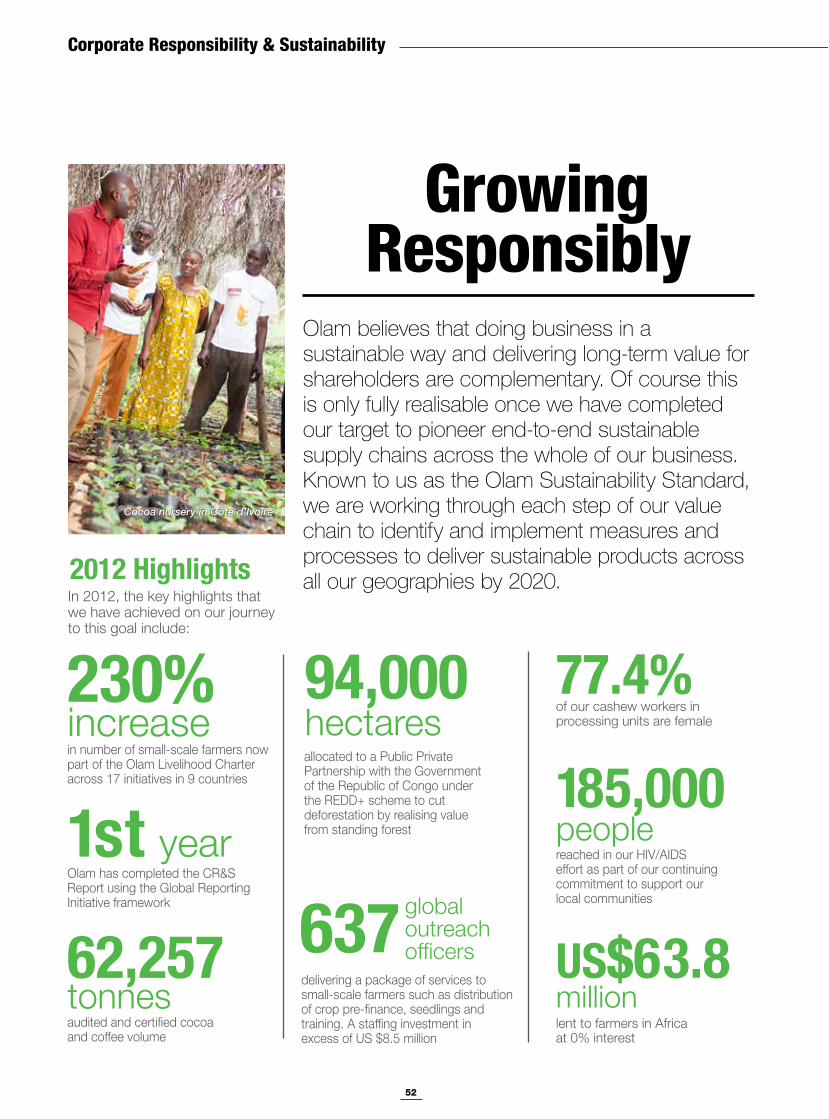
52
Corporate Responsibility & Sustainability
in number of small-scale farmers now part of the Olam Livelihood Charter across 17 initiatives in 9 countries
of our cashew workers in processing units are female
77.4%230%increase
Olam has completed the CR&S Report using the Global Reporting Initiative framework
1st year
2012 Highlights
delivering a package of services to small-scale farmers such as distribution of crop pre-finance, seedlings and training. A staffing investment in excess of US $8.5 million
637 global outreach officers
allocated to a Public Private Partnership with the Government of the Republic of Congo under the REDD+ scheme to cut deforestation by realising value from standing forest
94,000hectares
reached in our HIV/AIDS effort as part of our continuing commitment to support our local communities
185,000people
lent to farmers in Africa at 0% interest
Growing Responsibly
Olam believes that doing business in a sustainable way and delivering long-term value for shareholders are complementary. Of course this is only fully realisable once we have completed our target to pioneer end-to-end sustainable supply chains across the whole of our business. Known to us as the Olam Sustainability Standard, we are working through each step of our value chain to identify and implement measures and processes to deliver sustainable products across all our geographies by 2020.
In 2012, the key highlights that we have achieved on our journey to this goal include:
audited and certified cocoa and coffee volume
62,257tonnes
US$63.8million
Cocoa nursery in Côte d’Ivoire
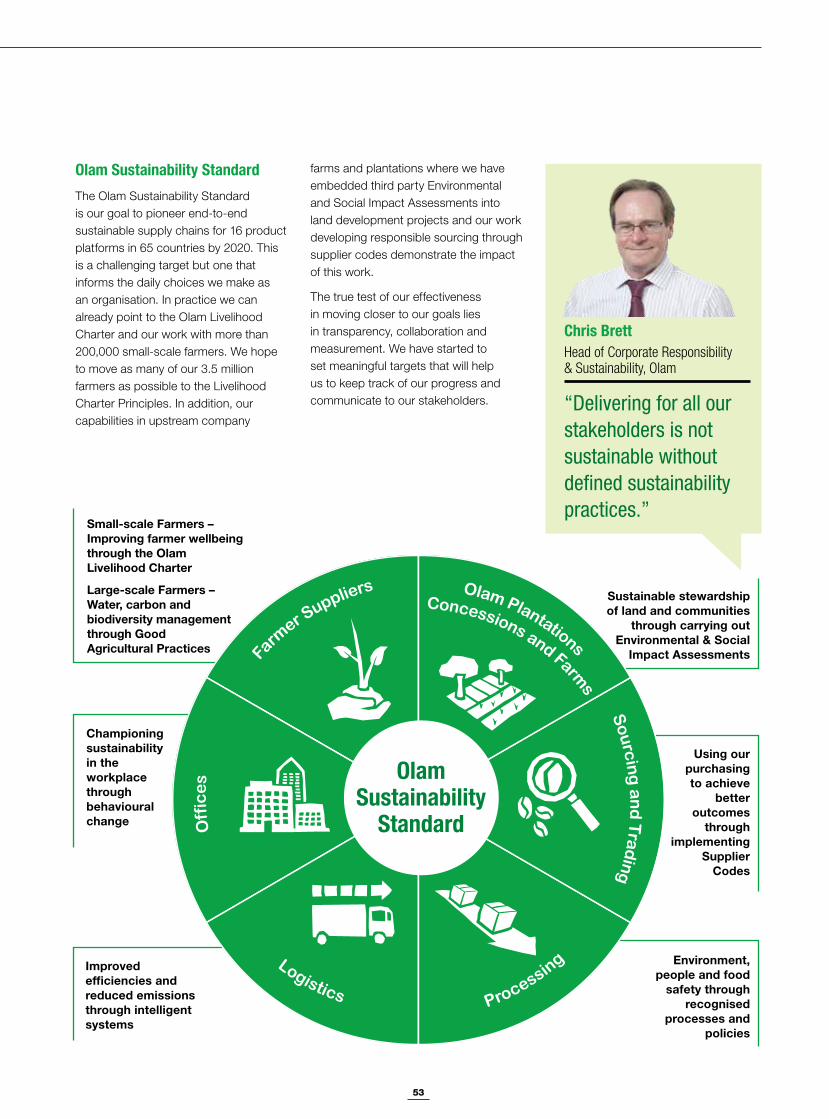
53
Olam Sustainability StandardThe Olam Sustainability Standard is our goal to pioneer end-to-end sustainable supply chains for 16 product platforms in 65 countries by 2020. This is a challenging target but one that informs the daily choices we make as an organisation. In practice we can already point to the Olam Livelihood Charter and our work with more than 200,000 small-scale farmers. We hope to move as many of our 3.5 million farmers as possible to the Livelihood Charter Principles. In addition, our capabilities in upstream company
farms and plantations where we have embedded third party Environmental and Social Impact Assessments into land development projects and our work developing responsible sourcing through supplier codes demonstrate the impact of this work.
The true test of our effectiveness in moving closer to our goals lies in transparency, collaboration and measurement. We have started to set meaningful targets that will help us to keep track of our progress and communicate to our stakeholders.
Fa
rmer
Suppliers
Off
ice
s
LogisticsPro
cessing
So
urc
ing
an
d T
ra
din
g
Olam Plantations
Concessions and F
a
rms
Olam Sustainability
Standard
Using our purchasing to achieve
better outcomes
through implementing
Supplier Codes
Environment, people and food
safety through recognised
processes and policies
Small-scale Farmers – Improving farmer wellbeing through the Olam Livelihood Charter
Large-scale Farmers – Water, carbon and biodiversity management through Good Agricultural Practices
Championing sustainability in the workplace through behavioural change
Improved efficiencies and reduced emissions through intelligent systems
Chris BrettHead of Corporate Responsibility & Sustainability, Olam
“Delivering for all our stakeholders is not sustainable without defined sustainability practices.”
Sustainable stewardship of land and communities
through carrying out Environmental & Social
Impact Assessments

54
Our People
In 2009 we re-framed our corporate strategy to focus on moving into three new areas:
Upstream into plantations, farming, forestry concessions and dairy farming
Midstream and Downstream into processing and manufacturing of agricultural products
Leveraging our latent assets and capabilities to enter into the commodity financial services and the packaged foods business
We refreshed this strategy in 2011.
Developing talent in response to our new strategyOne of the critical success factors for us to achieve our revised strategy and growth plans was to make our leadership model
Empowering Our People
scalable and replicable. The addition of many acquisitions added significantly to the workforce, meaning the task of aligning the organisation was even more challenging. We therefore identified five critical steps to achieving our objectives:
1 Building capabilities in our new business areas of plantations and manufacturing
2 Accelerating the process of growing global leaders to manage capital intensive businesses
3 Aligning our performance to our business strategy to minimise execution risk
4 Embedding the Olam DNA in our newly acquired businesses
5 Rewarding performance to ensure a long-term view
Over the past 23 years we have competed and succeeded on account of the strengths and capabilities of our people. From the very beginning, we have attracted professional managers who have become successful leaders while helping to grow our businesses to the prominent global positions they occupy today.
Ranveer Chauhan
Member of the Executive Human Resources Committee
“The culture at Olam is entrepreneurial, team-oriented and non-hierarchical, encouraging employees to take greater responsibility for their careers, to grow both personally and professionally and to contribute to the success of the company throughout their careers.”
MATS QEHS workshop in Ghana

55
In recognition of our success in building leaders, Olam was named in the 2009 list of Global Top Companies for Leaders in a comprehensive study conducted by, Hewitt Associates, in partnership with The RBL Group and Fortune.
Further, Olam has been conferred the Asian Human Capital Award, at the Singapore Human Capital Summit in September 2012. The first of its kind in Asia, the Asian Human Capital Award honours innovative and impactful people practices adopted by Asia-based organisations. This award is jointly sponsored by the Singapore Ministry of Manpower, INSEAD, CNBC Asia and Human Capital Leadership Institute.
Ensuring a rich talent pipelineAt the core of Olam’s growing management strength is the Global Assignee Talent Pool (GATP), which today comprises 750 managers in key positions. At the heart of this growth is our management trainee and graduate trainee programme. Each year an average 30% of total hires are recruited through this programme, which is globally coordinated across the best universities and business schools worldwide.
In the past, these trainees, post completion, have been placed in commercial and operational roles. We have now extended this to technical and agronomy graduates to ensure a ready talent pipeline for our expertise-led roles.
Building our capabilityTwo new specialist functions were added to our structure: Plantations and Farming, and Manufacturing & Technical Services (MATS). These functions now represent the third dimension of our organisation matrix and comprise the global functional managers who are driving these areas of expertise across the company. Within a short period of two years after introducing our revised strategy we had acquired a team of 32 specialists in Plantations and Farming (upstream) and 108 specialists in MATS (midstream).
Three dimensional organisationUnder this organisation structure our strategic planning process involves a large cross-section of managers who contribute to and learn about the key objectives, processes and outcomes of all activities. The three dimensions of this structure facilitate the process of compiling winning business strategies and help drive growth.
Growing global leadersBeyond this our overall talent strategy is to provide global careers in a rapidly growing company, consistently investing in different parts of the world. Our ethos is to create highly entrepreneurial roles demanding stretch and ambition and the opportunity to gain reward through a blend of salaries, performance bonuses and equity compensation.
Sustaining ‘one company’ strengthsAs businesses grow they can potentially become ‘silos’ so that collaboration becomes compromised. We do not want to lose the feel of a small company even as we grow, so strengthening our diagonal assets provides the glue to link the various business units together to operate as ‘one company’. These assets create the connections between the various parts of the company and are essential in carrying our DNA to new acquisitions to embed our culture and values.
Creating Diagonal Assets
Integrating Forums
Strengthen Matrix
Mindset
Institutionalise Shared Values & behaviour
Shared Goals & Purpose
Creating Diagonal Assets through Four Pillars
We have strengthened our diagonal assets through a number of integrating mechanisms. These include an Executive Committee of ten senior leaders in the company; three specialist committees of the Executive Committee in strategy, human resources and investment; a Management Committee which is an 80 member team consisting of regional heads, business heads and functional heads; seven Management Committee standing committees on various cross-cutting issues; and many cross-functional task forces.
Our human resource strategy is at the core of our business success and will continue to be a major driving force going forward.
Comment at [email protected]
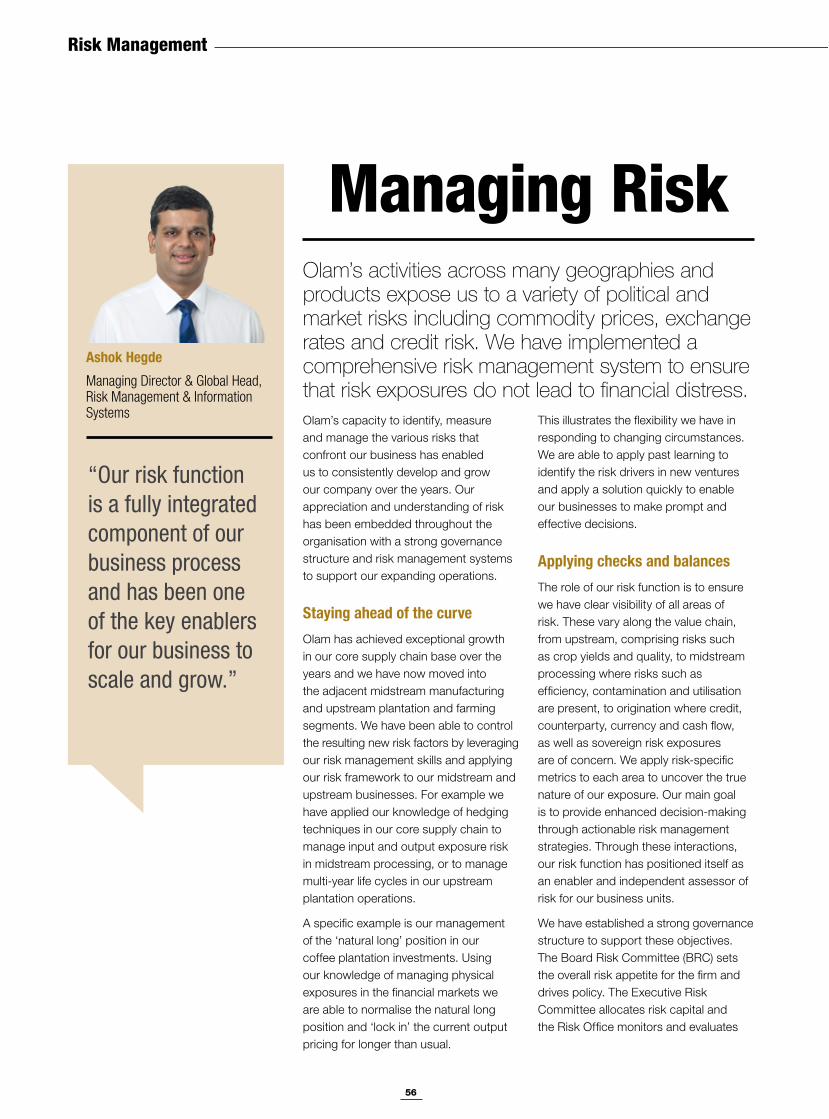
56
Risk Management
Olam’s activities across many geographies and products expose us to a variety of political and market risks including commodity prices, exchange rates and credit risk. We have implemented a comprehensive risk management system to ensure that risk exposures do not lead to financial distress.
Ashok Hegde
Managing Director & Global Head, Risk Management & Information Systems
“Our risk function is a fully integrated component of our business process and has been one of the key enablers for our business to scale and grow.”
Managing Risk
Olam’s capacity to identify, measure and manage the various risks that confront our business has enabled us to consistently develop and grow our company over the years.!Our appreciation and understanding of risk has been embedded throughout the organisation with a strong governance structure and risk management systems to support our expanding operations.
Staying ahead of the curveOlam has achieved exceptional growth in our core supply chain base over the years and we have now moved into the adjacent midstream manufacturing and upstream plantation and farming segments. We have been able to control the resulting new risk factors by leveraging our risk management skills and applying our risk framework to our midstream and upstream businesses. For example we have applied our knowledge of hedging techniques in our core supply chain to manage input and output exposure risk in midstream processing, or to manage multi-year life cycles in our upstream plantation operations.
A specific example is our management of the ‘natural long’ position in our coffee plantation investments. Using our knowledge of managing physical exposures in the financial markets we are able to normalise the natural long position and ‘lock in’ the current output pricing for longer than usual.
This illustrates the flexibility we have in responding to changing circumstances. We are able to apply past learning to identify the risk drivers in new ventures and apply a solution quickly to enable our businesses to make prompt and effective decisions.
Applying checks and balancesThe role of our risk function is to ensure we have clear visibility of all areas of risk. These vary along the value chain, from upstream, comprising risks such as crop yields and quality, to midstream processing where risks such as efficiency, contamination and utilisation are present, to origination where credit, counterparty, currency and cash flow, as well as sovereign risk exposures are of concern. We apply risk-specific metrics to each area to uncover the true nature of our exposure. Our main goal is to provide enhanced decision-making through actionable risk management strategies. Through these interactions, our risk function has positioned itself as an enabler and independent assessor of risk for our business units.
We have established a strong governance structure to support these objectives. The Board Risk Committee (BRC) sets the overall risk appetite for the firm and drives policy. The Executive Risk Committee allocates risk capital and the Risk Office monitors and evaluates
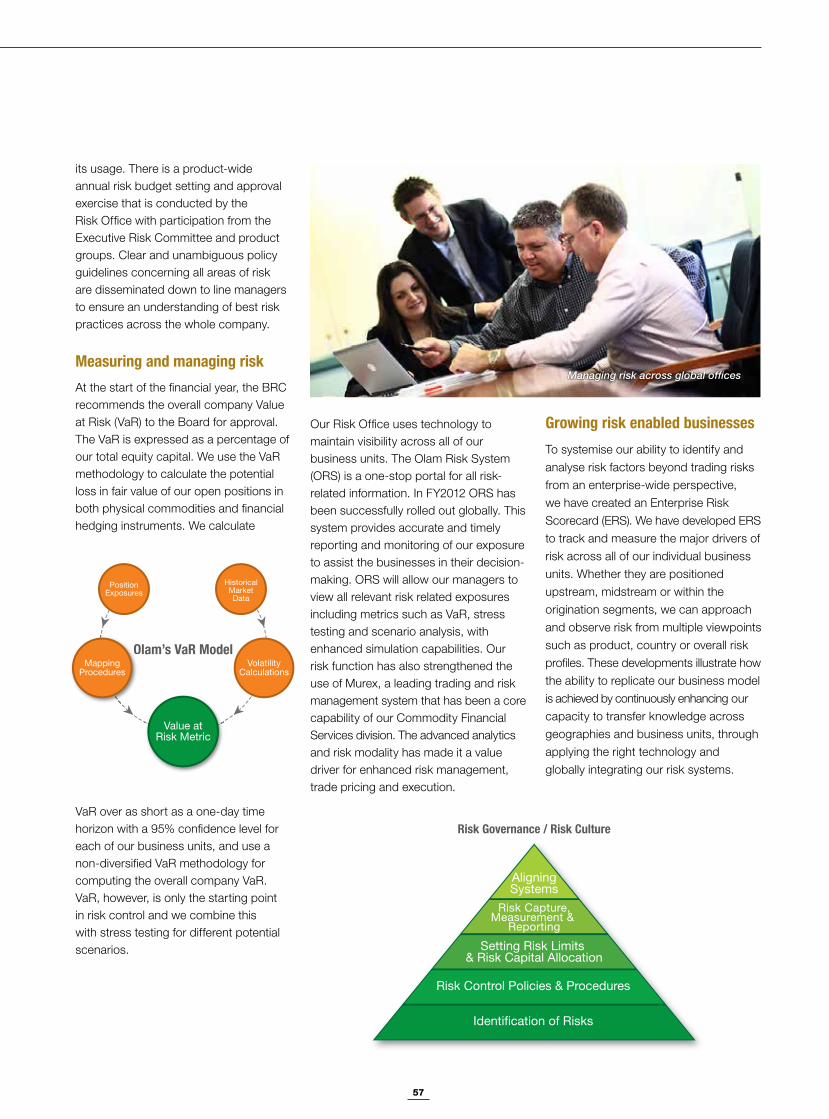
57
Identi!cation of Risks
Risk Control Policies & Procedures
Setting Risk Limits & Risk Capital Allocation
Risk Capture,Measurement &
Reporting
AligningSystems
Risk Governance / Risk Culture
its usage. There is a product-wide annual risk budget setting and approval exercise that is conducted by the Risk Office with participation from the Executive Risk Committee and product groups. Clear and unambiguous policy guidelines concerning all areas of risk are disseminated down to line managers to ensure an understanding of best risk practices across the whole company.
Measuring and managing risk At the start of the financial year, the BRC recommends the overall company Value at Risk (VaR) to the Board for approval. The VaR is expressed as a percentage of our total equity capital. We use the VaR methodology to calculate the potential loss in fair value of our open positions in both physical commodities and financial hedging instruments. We calculate
Our Risk Office uses technology to maintain visibility across all of our business units. The Olam Risk System (ORS) is a one-stop portal for all risk-related information. In FY2012 ORS has been successfully rolled out globally. This system provides accurate and timely reporting and monitoring of our exposure to assist the businesses in their decision-making. ORS will allow our managers to view all relevant risk related exposures including metrics such as VaR, stress testing and scenario analysis, with enhanced simulation capabilities. Our risk function has also strengthened the use of Murex, a leading trading and risk management system that has been a core capability of our Commodity Financial Services division. The advanced analytics and risk modality has made it a value driver for enhanced risk management, trade pricing and execution.
Olam’s VaR ModelVolatility
Calculations
OMapping
Procedures
Value atRisk Metric
HistoricalMarketData
PositionExposures
VaR over as short as a one-day time horizon with a 95% confidence level for each of our business units, and use a non-diversified VaR methodology for computing the overall company VaR. VaR, however, is only the starting point in risk control and we combine this with stress testing for different potential scenarios.
Growing risk enabled businesses
To systemise our ability to identify and analyse risk factors beyond trading risks from an enterprise-wide perspective, we have created an Enterprise Risk Scorecard (ERS). We have developed ERS to track and measure the major drivers of risk across all of our individual business units. Whether they are positioned upstream, midstream or within the origination segments, we can approach and observe risk from multiple viewpoints such as product, country or overall risk profiles. These developments illustrate how the ability to replicate our business model is achieved by continuously enhancing our capacity to transfer knowledge across geographies and business units, through applying the right technology and globally integrating our risk systems.
Managing risk across global offices
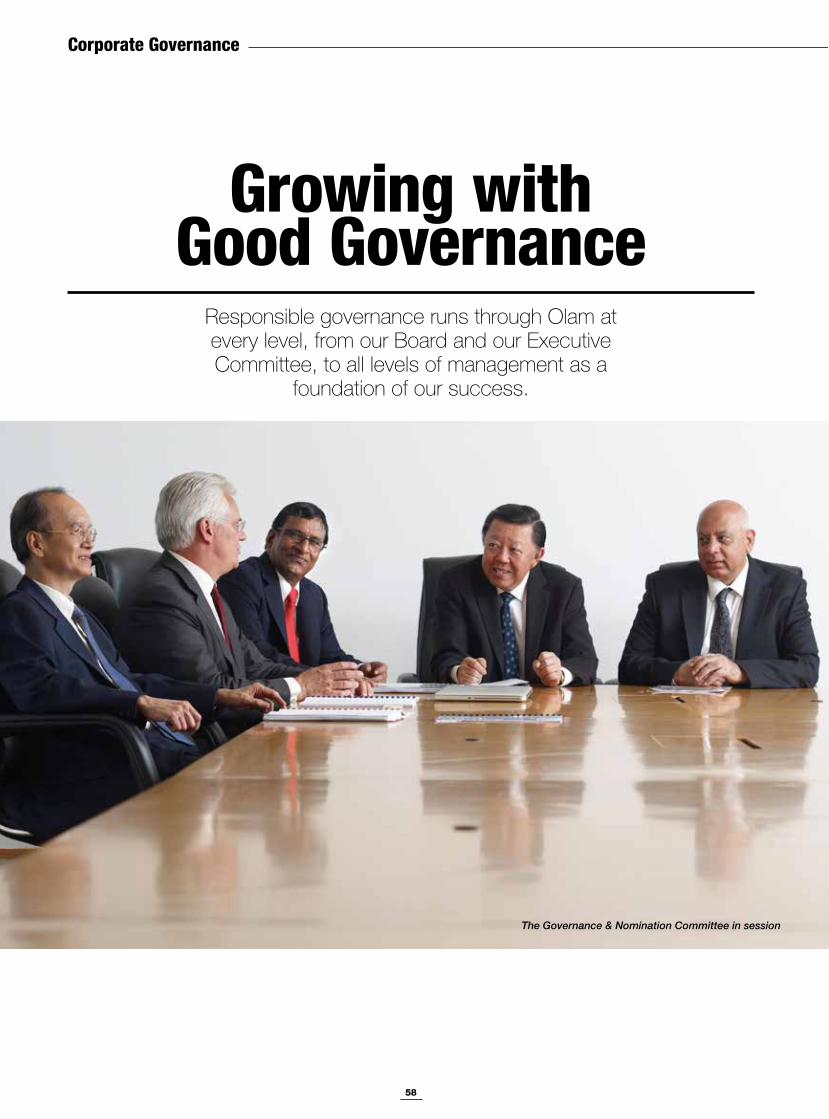
58
Corporate Governance
Growing with Good Governance
Responsible governance runs through Olam at every level, from our Board and our Executive Committee, to all levels of management as a
foundation of our success.
The Governance & Nomination Committee in session
59
Good governance is a foundation of our business and is strongly embedded in our management culture. This means ensuring we are growing responsibly, while maintaining our focus on the external factors that are affecting our business and the opportunities they present.”
“
Founding principlesWe believe our corporate governance journey is one of continuous collaboration between the members of the Board and the Management team to ensure continuous improvement in our governance systems in order that they meet the requirements of a rapidly growing organisation.
Olam is a diversified global company with operations in 65 countries, across 16 platforms and employing 18,000 people. We are responsible to our shareholders for managing our business for their benefit, as well as that of our customers, partners, employees and the communities in which we operate. This necessitates an integral system of checks and balances that will ensure transparency of decision-making and a high level of integrity in the way we deal with all our stakeholders.
Role of the Governance and Nomination Committee The role of the Committee is to ensure we observe a high standard of corporate governance that is in keeping with our overarching philosophy of delivering consistent financial performance with integrity. To this end we strongly support the principles of openness, integrity and accountability, as set out in the Code of Corporate Governance and we have already implemented a number of initiatives in advance of the recommendations in the 2012 Code. To date, we have acted to ensure that more than 50% of our Board Members are Independent and we have conducted a rigorous review of the independence of each member under expert legal advice. This has included the establishment of a
Olam Governance & Nomination Committee members Michael Lim, Mark Daniell, Wong Heng Tew and Narain Girdhar Chanrai discussing governance issues with our Board Chairman, R. Jayachandran.
Board Risk Committee and a Corporate Responsibility & Sustainability Committee since the listing of the Company, as well as the appointment of a Lead Independent Director. We recognise and value the importance of Board and individual member evaluation, not simply because it represents good corporate governance practices, but it can be a valuable process in improving Board performance and in ensuring the effectiveness of the Board to lead and control the Company. We follow a rigorous Board and individual member evaluation process conducted annually. In our annual Board and individual member evaluation exercise, the ability of the Directors to objectively discharge their duties and responsibilities at all times, as well as the ability to objectively listen and discuss issues with one another, are important assessment criteria.
Benchmarking our performanceWe believe that benchmarking our Corporate Governance is not about scoring and ranking, but how well we have integrated our governance processes within our business and operations. The success of this is borne out by our success as a whole and the recognition of our peers. This was highlighted by our award as the Best Managed Board (Gold)for companies with market capitalisation of S$1 billion and above at the Singapore Corporate Awards 2011.
Olam was also amongst the top three mainboard-listed company in the 2011 ST Resources Governance Index (RGI), which measures corporate governance performance based on indicators of ethical culture and transparency.
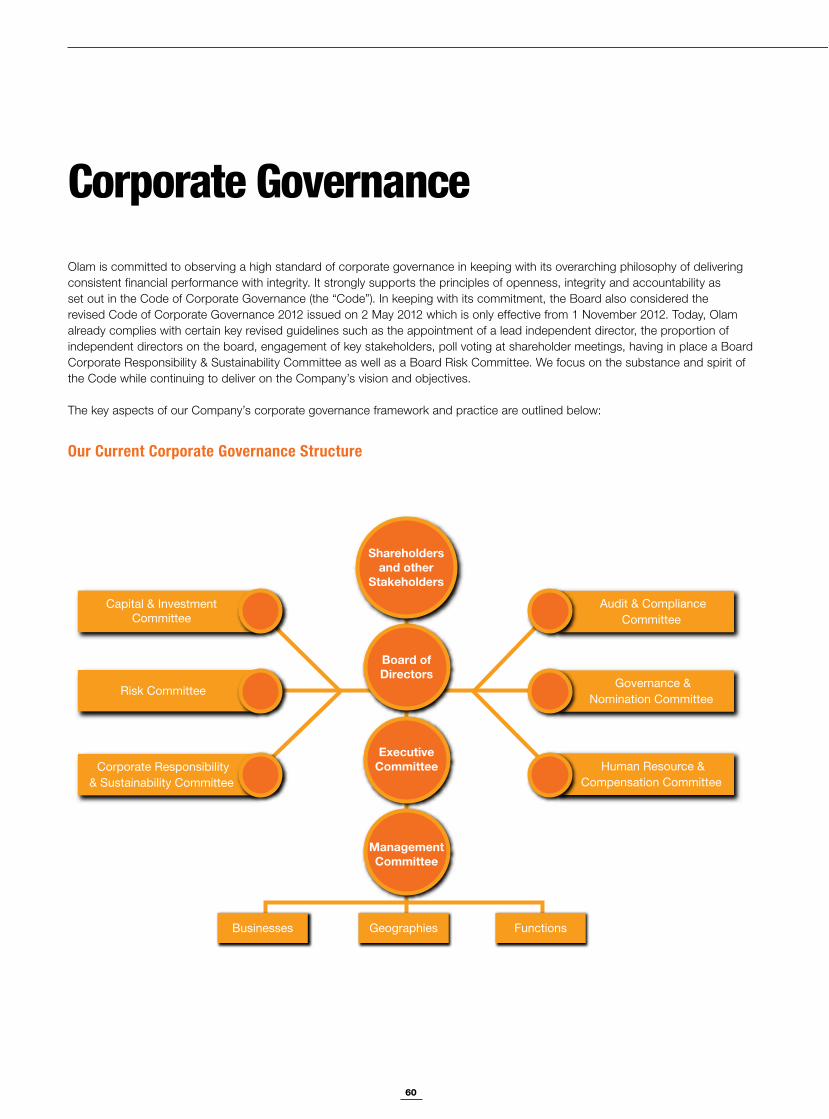
60
Corporate GovernanceOlam is committed to observing a high standard of corporate governance in keeping with its overarching philosophy of delivering consistent financial performance with integrity. It strongly supports the principles of openness, integrity and accountability as set out in the Code of Corporate Governance (the “Code”). In keeping with its commitment, the Board also considered the revised Code of Corporate Governance 2012 issued on 2 May 2012 which is only effective from 1 November 2012. Today, Olam already complies with certain key revised guidelines such as the appointment of a lead independent director, the proportion of independent directors on the board, engagement of key stakeholders, poll voting at shareholder meetings, having in place a Board Corporate Responsibility & Sustainability Committee as well as a Board Risk Committee. We focus on the substance and spirit of the Code while continuing to deliver on the Company’s vision and objectives.
The key aspects of our Company’s corporate governance framework and practice are outlined below:
Our Current Corporate Governance Structure
Board ofDirectors
ExecutiveCommittee
ManagementCommittee
Audit & ComplianceCommittee
Governance &Nomination Committee
Human Resource &Compensation Committee
Businesses Geographies Functions
Corporate Responsibility& Sustainability Committee
Capital & Investment Committee
Risk Committee
Shareholders and other
Stakeholders
61
Our History From the Company’s founding in 1995, we have consistently pursued the highest standards of corporate governance. The Board comprises of both Non-executive and Executive Directors and holds regular meetings to review the operations, business and performance of the Company. There is a clear division of responsibility between the Chairman and the Chief Executive Officer, ensuring a balance of power and authority. The financial statements of the Group are audited by Ernst & Young, one of the top four accounting firms globally.
The Board’s Conduct of Affairs (Principle 1) Principal Role of the BoardOlam is led by an international and dynamic Board which engages actively in the business of the Company. The Board provides effective leadership and support to the Senior Management team of the Company. Collectively, the Board and the Senior Management team ensure the long-term success of the Company. Apart from their statutory and fiduciary responsibilities, the foremost functions of the Board are:
(a) To provide entrepreneurial leadership, set strategic objectives, and ensure that the necessary financial and human resources are in place for the company to meet its objectives as well as to regularly review the execution and the implementation of the corporate strategy;
(b) To oversee the process and framework for evaluating the adequacy of internal controls, risk management, financial reporting and compliance and satisfy itself as to the adequacy and effectiveness of such processes and framework;
(c) To review Senior Management’s performance and determine the compensation for Executive Directors and Senior Management and oversee succession planning;
(d) To approve major acquisitions, divestments, capital raising exercises and annual budgets;
(e) To ensure the Company’s compliance with laws and regulations as may be relevant to the business;
(f) To assume responsibility for corporate governance;
(g) To set the Company’s value and standards, and ensure that obligation to shareholders and others are understood and met, from time to time;
(h) To oversee and consider corporate responsibility and sustainability issues, policies, standards and strategy in the context of the Company’s activities that may have an impact on environment and social issues; and
(i) To identify the key stakeholder groups and consider their perceptions.
Authority LimitApart from statutory matters that require Board approvals, the Board approves transactions exceeding authority limits established under an internal policy, while delegating authority for transactions below those limits to Board Committees and the Executive Committee to ensure business efficacy.
Delegation of Authority: Board CommitteesTo assist the Board in discharging their responsibilities, several Board committees namely the Audit & Compliance Committee, Governance & Nomination Committee, Human Resource and Compensation Committee, Risk Committee and Corporate Responsibility & Sustainability Committee have been established. Each of these Board Committees has clear written Terms of References which set out the role, authority, qualifications for committee membership and process of each committee. All the Board Committees are actively engaged and play an important role in ensuring good corporate governance in the Company.
The Terms of References of the Board Committees are reviewed annually by each committee taking into consideration the changing needs in the business and operations of the Company, relevant laws and regulations, etc.
Ad-hoc sub-committees of the Board may from time to time be formed as part of the Board’s commitment to engage and provide leadership to Management in areas concerning the business and operations of the Company. The Commodity Financial Services Business sub-committee and the Project Financing sub-committee which comprises of Independent Directors and are supported by the Executive team, were two such sub-committees constituted.
Objective JudgementDirectors are expected to exercise independent and objective judgement in the best interests of the Company. In the annual Board and peer performance evaluation exercise, the ability to objectively discharge their duties and responsibilities at all times as fiduciaries in the interests of the Company as well as the ability to objectively listen and discuss issues with one another, are important assessment criteria.
62
Corporate Governance
Board MeetingsThe dates of Board, Board Committee and Annual General meetings are scheduled one year in advance. The Board sets aside a full day in each quarter to review and evaluate the Company’s business, operations and performance and address key policy matters. These quarterly Board meetings include presentations by senior management team members and the executive team from the business units and functions, and sometimes external consultants on strategic issues relating to specific business areas or areas of law, thus providing the Board with important updates and an understanding of the Group’s businesses as well as the platform to engage with the key executives and managers. The Board also sets aside time at each scheduled Board meeting to meet without the presence of Management and the Executive Directors. In addition to the regular meetings, ad-hoc Board briefings, conference calls and physical meetings are held to deliberate on urgent and substantive matters. Offsite Board and Board committee meetings are also organized in various geographies where the Group operates for Directors to gain understanding on the ground activities and development of the different business units. The Company’s Articles of Association provides for Board meetings to be conducted via telephone conference, video conference, audio visual or other similar communications equipment. Besides meetings of the Board, the Board pursuant to the Company’s Articles of Association and the Board committees under their Terms of Reference may also make decisions by way of circulating resolutions.
Tables showing the number of Board, Board Committees and Non-Executive Directors’ meetings held during the year under review along with the attendance of Directors are provided below.
Attendance at Board and Non-Executive Directors’ Meetings held during the year
Name of Director
Scheduled Board Meetings Ad Hoc Board Meetings Non-Executive Directors’ MeetingsNumber of Meetings
Held
Number of Meetings Attended
Number of Meetings
Held
Number of Meetings Attended
Number of Meetings
Held
Number of Meetings Attended
R. Jayachandran 4 4 2 2 2 2Narain Girdhar Chanrai 4 4 2 2 2 2Michael Lim Choo San 4 4 2 2 2 2Robert Michael Tomlin 4 4 2 2 2 2Mark Haynes Daniell 4 4 2 2 2 2Wong Heng Tew 4 4 2 2 2 2Tse Po Shing Andy 4 3 2 1 2 2Jean-Paul Pinard 4 4 2 2 2 2Sunny Verghese* 4 4 2 2 – –Sridhar Krishnan* 4 4 2 2 – –A. Shekhar* 4 4 2 2 – –
* These are Executive Directors
Attendance at Board Committee Meetings held during the year
Name of Director
Audit & Compliance Committee
Human Resource & Compensation
Committee
Governance & Nomination
Committee
Capital &Investment Committee
Risk Committee
Corporate Responsibility
& Sustainability Committee
Meetings Held
Meetings Attended
Meetings Held
Meetings Attended
Meetings Held
Meetings Attended
Meetings Held
Meetings Attended
Meetings Held
Meetings Attended
Meetings Held
Meetings Attended
R. Jayachandran 4 3 4 4 7 6Narain Girdhar Chanrai 6 6 4 4 7 6Michael Lim Choo San 6 6 4 4 4 4Robert Michael Tomlin 6 6 7 7 4 3 4 3Mark Haynes Daniell 6 5 4 4 4 4 4 4Wong Heng Tew 6 6 4 4 4 4Tse Po Shing Andy 7 6 4 4Jean-Paul Pinard 4 4 7 6 4 4Sunny Verghese 7 7 4 4Sridhar Krishnan 4 4 4 4A. Shekhar 7 6 4 4
63
Induction and Orientation of DirectorsNewly appointed directors are issued with formal letters upon their appointment, which outline their duties and obligations as Directors and are also given a handbook containing relevant information concerning the Group. Orientation Programmes, which include visits to the Group’s operations, briefing on the various operations of the Group and meeting with key management personnel, are arranged for newly appointed Directors.
Directors’ TrainingTo keep the Directors abreast of developments in the industry as also in the Company’s global operations, country visits and interactions with business and geography teams are amongst the different types of exposure provided to the Directors as part of their ongoing education. Directors are also invited to participate in sessions and talks conducted by specialists and experts on trends, developments and issues concerning the industry which the Company operates. Furthermore, Directors are taken through detailed presentations on the development and progress of the Group’s key operations. Briefings and updates on directors’ duties and responsibilities and changes to the relevant laws and regulations such as the Singapore Exchange Listing Rules, Code of Corporate Governance, Companies Act, etc. are also provided to the Board. The Board was briefed on the revised Code of Corporate Governance as soon as it was issued.
Board Composition and Guidance (Principle 2)Competencies, Diversity and BalanceTo align with the extensive geographical spread and complexity of the business, the existing Board comprises of directors with diverse skills and background. Our Directors bring with them wide-ranging experience in finance and accounting, banking, investment, management and strategic planning. The size, composition and blend of experience of the current Board allow discussions on matters of policy, strategy and performance to be informed, critical and constructive. A brief profile and the key information of each Director is given on pages 76 to 81 of this annual report.
Board SizeOur Board currently consists of 11 members with more than 50% being independent directors. The Governance & Nomination Committee (GNC) carries out a yearly examination of the Board size to ensure that it is appropriate for effective decision-making. The GNC is of the view that, given the magnitude, nature and complexity of the Group’s business and operations, the Board should have between 10 and 12 members, who as a group, possess the required capabilities, skills and experience for the Board to discharge its duties and responsibilities effectively as well as to make objective decisions.
IndependenceThe GNC is tasked with the responsibility of determining on an annual basis whether or not a Director is independent, bearing in mind the definition of an Independent Director under the Corporate Governance Code. Annually, each Director is required to complete a Confirmation of Independence checklist based on the guidelines provided in the Corporate Governance Code. Each Director is required under the Confirmation to critically assess his independence and to confirm in the checklist whether he considers himself independent. During the year under review, the Confirmation of Independence checklist was revised to align with the Revised Corporate Governance Code. The GNC critically reviews the checklist completed by each Director to determine whether a Director is independent. Having carried out their review for FY 2012, with the exception of the three Executive Directors, the GNC has determined that six out of eight Directors, who are non-executive, are independent.
The Non-executive, Independent Directors fulfill a pivotal role in corporate accountability. Their role is particularly important as they provide unbiased and independent views, advice and judgement to take care of the interests, not only of the Company but also of shareholders, employees, customers, suppliers and the many communities in which the Company conducts business. During the year under review, the Non-executive Directors met quarterly, without the presence of Management, to review the performance of Management and the reporting of the Group’s performance by Management.
Chairman and Chief Executive Officer (Principle 3)The Chairman, R. Jayachandran is a Non-Executive Director and is not related to the CEO or other members of the Senior Management team. There is a clear division of responsibility between the Chairman and the Chief Executive Officer (CEO) to ensure a balance of power and authority. The Chairman is responsible for ensuring the effectiveness of the Board and Board Committees as well as the governance process. The CEO is at the helm of the Management team and has overall responsibility of the Company’s operations and organisational effectiveness. The CEO remains accountable to the Board for the decisions and actions taken as well as for the performance of the Group. The Chairman works closely with the CEO on matters to be tabled at meetings as well as in ensuring that Board members receive accurate, timely and clear information. Under the leadership of the Chairman, the Board held robust, open and constructive discussions at its meetings with adequate time allocated to sufficiently review issues tabled. Along with the CEO, the Chairman monitors the translation of the Board’s decisions, requests and recommendations into executive action.
64
Corporate Governance
Lead Independent DirectorThe Lead Independent Director who is also the Chairman of the GNC is an appointment approved by the Board. The appointment of a Lead Independent Director is part of the Board succession planning in order to provide continuity of leadership at the Board level in the absence of the Chairman. The Lead Independent Director also acts as a bridge between the Independent Directors and the Chairman and is also available to shareholders if they have concerns relating to matters which contact through the normal channels of the Chairman, CEO or Executive Directors has failed to resolve, or where such contact is inappropriate.
Board Membership (Principle 4)The Governance & Nomination Committee (GNC) established by the Board is chaired by Michael Lim Choo San, the Lead Independent Director. The GNC is comprised of entirely non-executive Directors, majority of whom including the GNC Chairman, are independent Directors. Its members are:
– R. Jayachandran (Non-Executive Director)– N. G. Chanrai (Non-Executive Director)– Mark Daniell (Non-Executive and Independent Director)– Wong Heng Tew (Non-Executive and Independent Director)
The GNC met four times during the year under review and invited other Independent Directors as well as external legal advisers to attend certain meetings. The GNC is guided by a written Terms of Reference with principal functions as follows:
(a) To review the size, skills and composition of the Board to ensure there is adequate representation in respect of issues and challenges, without compromising Board effectiveness and participation. Furthermore, to identify the critical needs in terms of expertise and skills, as well as knowledge of the jurisdictions in which Olam operates.
(b) To recommend the appointment and re-appointment of Directors.
(c) To conduct an annual review of the independence of each Director.
(d) To assess the effectiveness of the Board and its members.
(e) To recommend performance criteria for evaluating the Board’s performance.
(f) To recommend membership for board committees.
(g) To consider and review Company’s corporate governance principles.
(h) To consider questions of possible conflicts of interest of board members and senior executives.
During the year under review, the GNC was briefed on the recommendations of the revised Code of Corporate Governance and had in turn briefed the Board on the proposed changes to be included in the Corporate Governance Code. Along with Management, the GNC facilitated a formal briefing by external legal advisers when the revised Corporate Governance Code was issued in May 2012.
Succession PlanningIn a joint review of the Terms of Reference of the Board Committees by the Board along with the recommendations of the GNC, review of the Board succession plans including the Chairman remain as a principal role of the GNC while review of the succession plans for key positions in the Group including the CEO is delegated to the Human Resource & Compensation Committee (HRCC). The GNC actively reviews the present Board composition and the necessity of refreshing the Board.
Retirement and Re-electionAll Directors submit themselves for re-nomination and re-election at least once in three years. Pursuant to the Articles of Association of the Company, one third of the Directors shall retire from office at the Company’s annual general meeting. A retiring Director is eligible for re-election at the annual general meeting. The Group Managing Director/CEO, as a Director, is subject to the same retirement by rotation provision as the other Directors. In addition, the Company’s Articles of Association also provides that a newly appointed Director must submit himself for re-election at the annual general meeting following the appointment. At the forthcoming Annual General Meeting for 2012 (AGM), Mark Daniell, Wong Heng Tew, Tse Po Shing Andy and Sridhar Krishnan will retire and will be eligible for re-election by the shareholders at the meeting. Mark Daniell, Wong Heng Tew and Tse Po Shing Andy are considered independent by the GNC consequent to their annual assessment of independence of directors and do not have any relationships including immediate family relationships with any Director, the Company or its 10% shareholders. The details of the retirement and re-election of the Directors are provided in the key information of each Director on pages 76 to 81 of this Annual Report.
New Appointments, Selection and Re-nomination of DirectorsAll new appointments, selection and re-nomination of Directors are reviewed and proposed by the GNC. The GNC has access to external search consultants and resources to identify potential candidates. Board members may also make recommendations to the GNC. Shortlisted candidates are met by the GNC Chairman along with the Board Chairman prior to the approval at the Board level. Some of the criteria considered by the GNC while evaluating Directors’ appointments are:
65
(a) Independence of mind.
(b) Capability and how he/she could meet the needs of the Company and simultaneously complements the skill set of the other Board members.
(c) Experience and track record in multi-national companies.
(d) Ability to commit time and effort toward discharging his/her responsibilities as a Director.
(e) Reputation and integrity.
Key Information Regarding DirectorsKey information regarding Directors, such as academic and professional qualifications, board committees served on (as a member or chairman), date of first appointment as a director, date of last re-election as a director, directorships both present and past held over the preceding three years in other listed companies and other major appointments, is disclosed in pages 76 to 81 of this Annual Report. Information relating to Directors’ shareholding and interests in the Group is disclosed in the Directors’ Report of this Annual Report.
Board Performance (Principle 5) The Board considers the importance of putting the right people, with the range of skills, knowledge and experience together for effective governance of the Group’s business. The GNC assists the Board in ensuring that the Board is comprised of individuals whose background, skills, experience and personal characteristics will enhance the present Board and meet its future needs.
Based on the recommendations of the GNC, the Board has laid down a preliminary set of assessment criteria to assess the effectiveness of the Board as a whole and contribution of each director to the effectiveness of the Board. The assessment criteria for the Board evaluation covers amongst other criteria, Board performance in relation to discharging its principal functions, its effectiveness in ensuring the long term success of the Company, composition of the Board, relationship amongst Board members and the adequacy and performance of Board Committees in relation to discharging the responsibilities set out in their respective terms of reference. The individual Directors’ assessment criteria are in relation to their industry and functional expertise, level of involvement, contribution, objectivity and interactive skills when working with Board members and participation at Board meetings. During the year, the GNC carried out an evaluation of the effectiveness of the Board, the individual Board Members and the Chairman of the Board. The results of the evaluations are critically reviewed by the GNC with proposed follow-up actions planned. The follow-up actions are undertaken by the GNC Chairman along with
the Chairman of the Board. Meetings between the individual Director and the Board Chairman as well as the GNC Chairman may be set up with a view to sharing feedbacks and comments received and to work out action plans to address specific issues raised.
In the course of the year, the GNC further reviewed the effectiveness and relevance of the Board and individual director performance evaluation process which aims to help the Board uncover its strengths and challenges so that the Board would be in a position to further improve on the discharge of its oversight duties.
Access to Information (Principle 6)Accountability (Principle 10)Board Members to have complete, adequate and timely informationBoard to provide a balanced and understandable assessment of the company’s performance, position and prospects The agenda for the Board Meeting along with all back up materials are sent to all Directors prior to all board and board committee meetings. This is sent sufficiently in advance to enable the Directors to obtain further details and explanations where necessary. Members of the Management team are invited to be present at the Board and Board Committees meeting to provide additional insight into the matters tabled for deliberation. Directors have direct access to the Company’s Senior Management, Board Secretariat and the Company Secretary and are provided with their contact details. Non-Executive Directors meet with Senior Management independently to be briefed on various issues. Board members are invited to participate in the Annual Management Committee Meetings to interact with Management as well as to gain insight on the development and plans of the Company. Presentations on the Group’s business and activities are provided to the Board throughout the year by the Company’s Management team. The Board takes independent professional advice as and when necessary to enable it or the Independent Directors to discharge their responsibilities effectively.
The role of the Company Secretary is clearly defined and includes the responsibility of ensuring that the board procedures are followed and that applicable rules and regulations are complied with. The Board is further supported by an executive Board Secretariat team which provides additional information that the Board members may need. The executive Board Secretariat team provides information and summary on changes in regulation or law, as circumstances require.
66
Corporate Governance
The Board has adopted a policy of openness and transparency in the conduct of the Company’s affairs while preserving the commercial interests of the Company. The Company has been reporting its financial results quarterly and holding media and analyst meetings to coincide with the quarterly results announcements.
Financial results and other price sensitive information are disseminated to shareholders via SGXNET, to the SGX-ST, press releases, the Company’s website and through media and analyst briefings.
The Company has in place a comprehensive investor relations programme to keep investors informed of material developments in the Company’s business and affairs beyond that which is prescribed, but without prejudicing the business interests of the Company.
Procedures for Developing Remuneration Policies (Principle 7)Level and Mix of Remuneration (Principle 8)Disclosure on Remuneration (Principle 9) Human Resource & Compensation Committee (HRCC)The HRCC is chaired by Mark Daniell, an Independent and Non-Executive Director with R. Jayachandran, Wong Heng Tew and Jean-Paul Pinard as its members. Apart from R. Jayachandran who is the Non-Executive Chairman of the Board, all members of the HRCC are Independent and Non-executive Directors. The HRCC met four times during the year under review and the CEO, Executive Human Resources Team and the President of Human Resources function were invited to attend certain meetings. The HRCC is established by the Board with the following principal functions:
(a) To review executive and leadership development process and programme;
(b) To review and recommend executive compensation policy and equity based plans;
(c) To review succession plans for key positions in the Group including the CEO;
(d) To establish and oversee the process for evaluating the performance of the CEO and key management personnel in the fulfillment of their responsibilities, meeting objectives and performance targets; and
(e) To review annually the adequacy of the fees paid to non-executive directors.
The HRCC carries out regular discussions with the CEO and the Board on succession planning at the most senior levels including that of the CEO.
The HRCC, is supported by its executive arm, The Executive Human Resources Committee (HRC) with Sunny Verghese as its Chair and Sridhar Krishnan and Ranveer Chauhan as its members.
Remuneration Policy for Non-Executive DirectorsThe remuneration framework for non-executive directors adopted by the HRCC consists of a base fee for membership on the Board, chairing the Board and as Lead Independent Director, fees for membership of board committees, fees for chairing Board Committees and an attendance fee for Board Offsite meetings. In addition, the HRCC had recommended the extension of Olam’s share option scheme to include non-executive directors and independent directors to recognize the invaluable role played by them in furthering the business interests of the Group. In reviewing the remuneration of non-executive directors, the HRCC have taken into consideration the knowledge and expertise of the individual directors, the responsibilities vested upon them and the time commitment required from the non-executive directors given the complexities of the business and the business structure. They also looked at the fees paid to peer companies. Non-executive directors should however not be excessively remunerated. To facilitate timely payment of Directors’ fees, Directors’ fees are paid in advance on a quarterly basis for the current financial year once approval is obtained from shareholders at the annual general meeting. The HRCC may commission an independent review by an external consultant on the remuneration framework of directors as well as key management personnel. The fees structure of non-executive directors’ remuneration, which remained unchanged since FY 2011, is set out below.
Nature of Appointment S$
Board of DirectorsBase Fee (Chairman) 160,000Base Fee (Member) 60,000
Audit & Compliance CommitteeChairman’s fee 50,000Member’s fee 25,000
Capital & Investment CommitteeChairman’s fee 50,000Member’s fee 25,000
Governance & Nomination CommitteeHuman Resource & Compensation CommitteeCorporate Responsibility & Sustainability CommitteeRisk CommitteeChairman’s fee 30,000Member’s fee 15,000
Lead Independent Director 15,000
Attendance Fee at Board Offsite 2,500
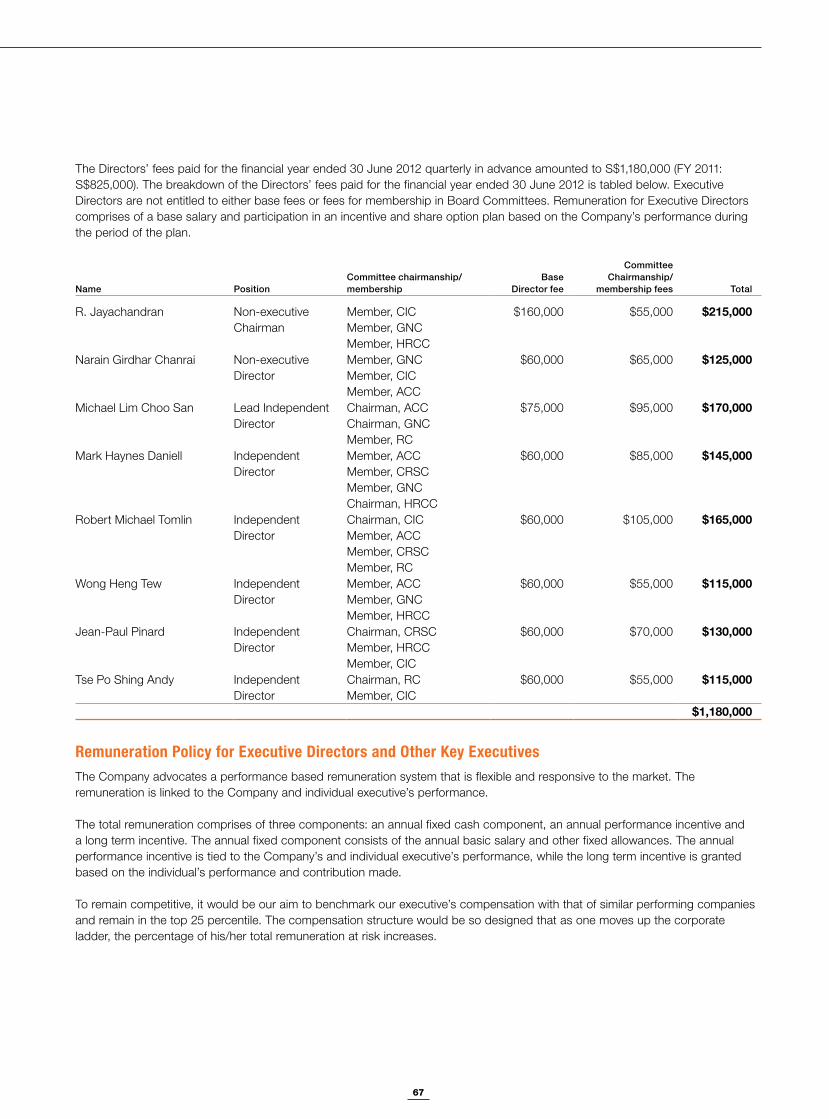
67
The Directors’ fees paid for the financial year ended 30 June 2012 quarterly in advance amounted to S$1,180,000 (FY 2011: S$825,000). The breakdown of the Directors’ fees paid for the financial year ended 30 June 2012 is tabled below. Executive Directors are not entitled to either base fees or fees for membership in Board Committees. Remuneration for Executive Directors comprises of a base salary and participation in an incentive and share option plan based on the Company’s performance during the period of the plan.
Name PositionCommittee chairmanship/membership
BaseDirector fee
CommitteeChairmanship/
membership fees Total
R. Jayachandran Non-executive Chairman
Member, CICMember, GNCMember, HRCC
$160,000 $55,000 $215,000
Narain Girdhar Chanrai Non-executive Director
Member, GNCMember, CICMember, ACC
$60,000 $65,000 $125,000
Michael Lim Choo San Lead Independent Director
Chairman, ACCChairman, GNCMember, RC
$75,000 $95,000 $170,000
Mark Haynes Daniell Independent Director
Member, ACCMember, CRSCMember, GNCChairman, HRCC
$60,000 $85,000 $145,000
Robert Michael Tomlin Independent Director
Chairman, CICMember, ACCMember, CRSCMember, RC
$60,000 $105,000 $165,000
Wong Heng Tew Independent Director
Member, ACCMember, GNCMember, HRCC
$60,000 $55,000 $115,000
Jean-Paul Pinard Independent Director
Chairman, CRSCMember, HRCCMember, CIC
$60,000 $70,000 $130,000
Tse Po Shing Andy Independent Director
Chairman, RC Member, CIC
$60,000 $55,000 $115,000
$1,180,000 Remuneration Policy for Executive Directors and Other Key Executives The Company advocates a performance based remuneration system that is flexible and responsive to the market. The remuneration is linked to the Company and individual executive’s performance.
The total remuneration comprises of three components: an annual fixed cash component, an annual performance incentive and a long term incentive. The annual fixed component consists of the annual basic salary and other fixed allowances. The annual performance incentive is tied to the Company’s and individual executive’s performance, while the long term incentive is granted based on the individual’s performance and contribution made.
To remain competitive, it would be our aim to benchmark our executive’s compensation with that of similar performing companies and remain in the top 25 percentile. The compensation structure would be so designed that as one moves up the corporate ladder, the percentage of his/her total remuneration at risk increases.
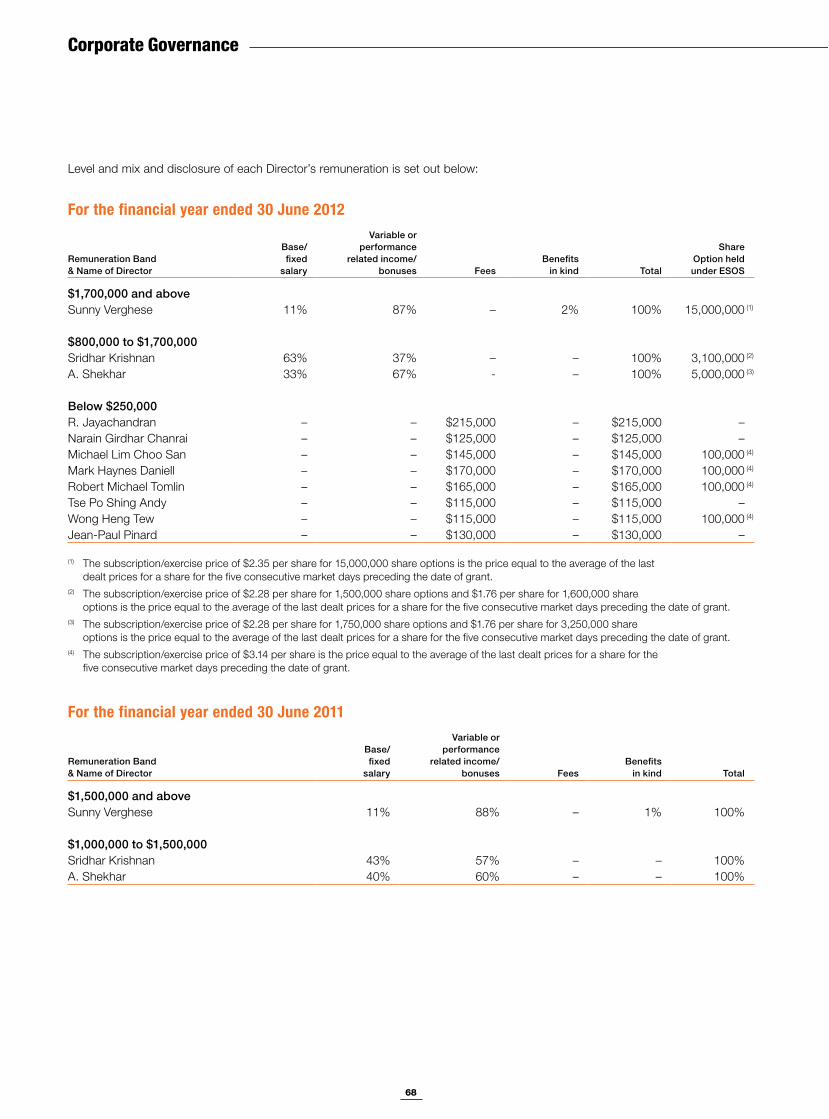
68
Corporate Governance
Level and mix and disclosure of each Director’s remuneration is set out below:
For the financial year ended 30 June 2012
Remuneration Band & Name of Director
Base/fixed
salary
Variable or performance
related income/bonuses Fees
Benefits in kind Total
Share Option held under ESOS
$1,700,000 and aboveSunny Verghese 11% 87% – 2% 100% 15,000,000 (1)
$800,000 to $1,700,000Sridhar Krishnan 63% 37% – – 100% 3,100,000 (2)
A. Shekhar 33% 67% - – 100% 5,000,000 (3)
Below $250,000R. Jayachandran – – $215,000 – $215,000 –Narain Girdhar Chanrai – – $125,000 – $125,000 –Michael Lim Choo San – – $145,000 – $145,000 100,000 (4)
Mark Haynes Daniell – – $170,000 – $170,000 100,000 (4)
Robert Michael Tomlin – – $165,000 – $165,000 100,000 (4)
Tse Po Shing Andy – – $115,000 – $115,000 –Wong Heng Tew – – $115,000 – $115,000 100,000 (4)
Jean-Paul Pinard – – $130,000 – $130,000 –
(1) The subscription/exercise price of $2.35 per share for 15,000,000 share options is the price equal to the average of the last dealt prices for a share for the five consecutive market days preceding the date of grant.
(2) The subscription/exercise price of $2.28 per share for 1,500,000 share options and $1.76 per share for 1,600,000 share options is the price equal to the average of the last dealt prices for a share for the five consecutive market days preceding the date of grant.
(3) The subscription/exercise price of $2.28 per share for 1,750,000 share options and $1.76 per share for 3,250,000 share options is the price equal to the average of the last dealt prices for a share for the five consecutive market days preceding the date of grant.
(4) The subscription/exercise price of $3.14 per share is the price equal to the average of the last dealt prices for a share for the five consecutive market days preceding the date of grant.
For the financial year ended 30 June 2011
Remuneration Band & Name of Director
Base/fixed
salary
Variable or performance
related income/bonuses Fees
Benefitsin kind Total
$1,500,000 and aboveSunny Verghese 11% 88% – 1% 100%
$1,000,000 to $1,500,000Sridhar Krishnan 43% 57% – – 100%A. Shekhar 40% 60% – – 100%
69
Level and Mix of Remuneration of the Top Five Executives for the Year Ended 30 June 2012In considering the disclosure of remuneration of the top 5 executives of the Company, the Company regarded the industry conditions in which the Company operates as well as the confidential nature of key executives’ remuneration. The Company believes that the disclosure of remuneration of its top 5 executives as recommended by the Code would be prejudicial to the Company’s interests and hamper its ability to retain and nurture the Group’s talent pool. The Company has instead presented the remuneration band of the top five executives (who are not also directors of the Company) as follows:
Remuneration Band No. of Executives
$1,000,000 to $2,000,000 5
Remuneration of employees who are immediate family members of a Director or the CEONo employee of the Company and its subsidiaries was an immediate family member of a Director or the CEO and whose remuneration exceeded $50,000 during the year under review. Immediate family member means the spouse, child, adopted child, step-child, brother, sister and parent.
Employee Share SchemeDetails of employee share schemes which include, size of grants, methodology of valuing stock options, exercise price of options that were granted as well as outstanding, whether the exercise price was at the market or otherwise on the date of grant and vesting schedule are disclosed in the Directors’ Report and the notes to financial statements in this Annual Report.
Audit & Compliance Committee (Principle 11)The Audit & Compliance Committee (ACC) comprised of majority independent Directors and is chaired by Michael Lim, with the three independent Directors, Robert Tomlin, Mark Daniell and Wong Heng Tew and the non-executive Director, Narain Girdhar Chanrai as its members. The ACC met six times during the year under review and the Group CFO, Executive Directors, President of Internal Audit and the external auditors were invited to attend these meetings. The principal functions of the ACC are to:
(a) Assist the Board in discharging its statutory and other responsibilities on internal controls, financial and accounting matters, operational and compliance controls, and business and financial risk management policies and systems, and to ensure that a review of the effectiveness of the same (which may be carried out by the external or internal auditors) is conducted at least annually.
(b) Review with the external auditors their audit plan, their evaluation of the system of internal controls, their audit report, their management letter, the Company management’s response and allocation of audit resources according to the key business and financial risk areas as well as the optimum coverage and efforts between the external and internal auditors.
(c) Review the quarterly and annual financial statements before submission to the Board of Directors for approval, focusing in particular, on changes in accounting policies and practices, major operating risk areas and overview of all group risk on an integrated basis, significant adjustments resulting from the audit, the going concern statement, compliance with accounting standards as well as compliance with any stock exchange and statutory/regulatory requirements.
(d) Review the internal controls and procedures and ensure co-ordination between the external auditors and the Company management, reviewing the assistance given by the management team to the auditors, and discussing problems and concerns, if any, arising from the interim and final audits, and any matters which the auditors may wish to discuss (in the absence of the management where necessary).
(e) Review and discuss with the external auditors any suspected fraud or irregularity, or suspected infringement of any relevant laws, rules or regulations, which has, or is likely to have, a material impact on the Group’s operating results or financial position, and the management’s response to the same.
(f) Review and approve the audit plans of the external and internal auditors.
(g) Consider the appointment or re-appointment of the external auditors and matters relating to resignation or dismissal of the auditors.
(h) Review the scope and results of the audit and its cost effectiveness and the independence and objectivity of the external auditors annually.
(i) Review transactions falling within the scope of Chapter 9 of the SGX Listing Manual.
(j) Undertake such other reviews and projects as may be requested by our Board of Directors and report to the Board of Directors its findings from time to time on matters arising and requiring the attention of the ACC.
(k) Undertake such other functions and duties as may be required by statute or the Listing Manual, and by such amendments made thereto from time to time.
70
Corporate Governance
The ACC has full access to and cooperation of the Management and full discretion to invite any Director or executive officer to attend its meetings. The Company has an Internal Audit team which together with the external auditors, reports their findings and recommendations independently to the ACC. During the year, the ACC reviewed the unaudited financial statements of the Company before the announcement of the financial results and the audited financial statements prior to despatch to the shareholders.
Internal AuditThe ACC regularly review the resource adequacy and the effectiveness of the internal audit function as well as the areas of audit undertaken by the internal audit team. During the year under review, the ACC is satisfied that the team has appropriate standing within the Company. The Committee met with the internal auditors during the year under review, without the presence of management, to discuss with them any issues of concern.
External AuditorsThe ACC reviewed the nature and extent of all non-audit services performed by the external auditors to establish whether their independence has in any way been compromised as a result. From the review, the ACC has confirmed that the non-audit services performed by the external auditors would not affect their independence. Details of fees payable to the auditors in respect of audit and non-audit services are set out in the notes to financial statements of this Annual Report. The Company has complied with Rule 712, and Rule 715 read with Rule 716 of the SGX Listing Manual in relation to its auditing firms.
As part of good corporate governance practices, the ACC during the year carried out a review of the external audit services provided, including an evaluation of services which other leading audit service firms could provide based on proposals submitted. Taking all relevant factors into consideration, the ACC made its recommendation to the Board, and the Board determined that the current auditors be re-appointed.
Whistle-BlowingOn the recommendation of the ACC and the approval of the Board, the Company has formalized a Code of Conduct with an objective to conduct business in compliance with the letter and spirit of the law and other accepted standards of business conduct and to maximize shareholder value for its continuing shareholders in an ethical and environmentally sustainable manner. It provides the key standards and policies that everyone
working in and for the Company should adhere to. This Code also encourages and provides a channel for employees to report possible improprieties, unethical practices, etc. in good faith and confidence without fear of reprisals or concerns. All information and report are received confidentially to protect the identity and the interest of all whistle-blowers. Different modes of reporting are provided in the Code including an internal compliance hotline and email. To ensure that all incidents that are reported are adequately brought to the notice of the stakeholders concerned as well as to initiate corrective action, a reporting structure is provided in detail in the Code. There have been no reported incidents under the Code for FY2012.
Internal Controls (Principle 12)The Company’s internal controls structure consists of the policies and procedures established to provide reasonable assurance that the organisation’s related objectives would be achieved.
At Olam, the internal controls extends beyond the accounting and finance function – its scope is Company-wide and touches all activities of the Company.
Our Field Operations Manual (FOM) is the main guidebook which prescribes the process and documentation requirement for all our procurement, grading, sorting, processing, storage, transits and shipment of our products. Strict adherence of this FOM is the key to our control over operational risks. To ensure that this is happening, we have periodical internal and external audit reviews.
To round off the process, we link the Internal Audit findings into the manager’s performance evaluation system, to ensure the desired influence on behaviour.
The Company’s Enterprise Risk Management (ERM) framework covers Market Risks, Credit & Counter Party Risks, Operational Risks and Information Risks. The Company has a Risk Committee and an independent Risk Control function to measure and monitor Market Risks and Credit & Counter Party Risks. Our risk management system is outlined on pages 56 & 57.
The Board, with the concurrence of the ACC, is of the opinion that the internal controls, addressing the financial, operational and compliance risks of the Company, were adequate to meet the needs of the Group in its current business environment. This is based on the work performed by the internal and external auditors, the internal controls and risk management systems established and reviewed by Management as well as the regular reviews undertaken by various Board Committees.
71
Whilst the internal audit and the internal controls systems put in place by Management provides reasonable assurance against material financial misstatements or loss, reliability, relevance and integrity of information (including financial information), completeness of records, safeguarding of assets, effectiveness and efficiency of operations and compliance with applicable policies, laws and regulations, it is opined that such assurance cannot be absolute in view of the inherent limitations of any internal audit and internal controls systems against the occurrence of significant human and system errors, poor judgement in decision-making, losses, fraud or other irregularities.
Internal Audit Function (Principle 13)The internal audit function is established to support the Governance Process and provide a source of confidence to the ACC that there is sound managerial control over all aspects of the operations of Olam including statutory compliances, accounting, asset management and control systems.
The President of Internal Audit & Assurance reports directly to the Chairman of the ACC and administratively to the CEO of the Company. The Internal Audit team has full, free and unrestricted access at all times to all books, personnel, documents, accounts, property, vouchers, records, correspondence and other data of the Company. The Internal Auditors also have the right, to enter any premises of the Group and to request any officer to furnish all information and such explanations deemed necessary for them to form an opinion on the probity of action, adequacy of systems and/or of controls.
The scope of Internal Audit is comprehensive to enable the effective and regular review of all operational, financial and related activities. The Internal Audit coverage extends to all areas of the Company and its controlled entities and includes financial, accounting, administrative, computing and other operational activities. An internal compliance monitoring system was developed as a self assessment tool for monitoring the performance of the business units on key control aspects and processes.
The ACC reviews the proposed scope of the Internal Audit function, the performance of the Internal Audit function and the Internal Audit Plan semi-annually. It ensures that no limitation on audit has been interposed. The Internal Audit’s summary of findings and recommendations are reviewed and discussed at the ACC meetings.
The ACC is assisted in the discharge of this function by the Executive Audit Committee (EAC). The EAC has Jagdish Parihar, Global Head & Managing Director of the Cotton Business as its chair and V. Srivathsan, Global Head &
Managing Director of Agri-Inputs, S. Suresh, President of Finance & Accounts and Rajeev Kadam, Global Head of Internal Audit as its members.
Risk Management (Principle 12)Risk Committee The Board is responsible for the governance of risk. To assist the Board in carrying out its responsibility of overseeing the Company’s risk management framework and policies, the Board Risk Committee was established in 2005. The Risk Committee is chaired by our Non-Executive and Independent Director, Tse Po Shing Andy with Robert Tomlin, Michael Lim Choo San, Sunny Verghese and Sridhar Krishnan as its members. The RC met four times during the year under review and it has oversight of the following matters:
(a) To review with Management the Group’s guideline, policies and systems to govern the process for assessing and managing risks;
(b) To review and recommend risk limits and budgets;
(c) To review major non-compliances with risk policies; and
(d) To review benchmarks for and major risk exposures from such risks;
(e) To request, receive and review reports from management on the action taken to monitor and manage the exposures;
(f) To identify and evaluate new risk on an enterprise level and to table a report to the Board.
(g) To review the Enterprise Risk Scorecard bi-annually and determine the risks to be escalated to the Board.
(h) To review the framework and effectiveness of the Enterprise Risk Scorecard.
(i) To review reports of significant issues prepared by the Executive Risk Committee.
During the year under review, the RC was briefed on the Risk Governance Guidelines issued by the Corporate Governance Council further to the revised Code of Corporate Governance issued in May 2012 and had in turn briefed the Board on the Risk Governance Guidelines. Today, the Company is already complying with the recommendations contained in the Risk Governance Guidelines such as the approach to risk governance for the Group and establishing the right mechanisms and framework to identify risks inherent in the Group’s business model and strategy, risks from external factors, etc., monitoring the company’s exposure to risk and the key risks that could impact the business, strategy, reputation and long-term viability of the Group. The Board along with the RC, the Executive Risk team and Management have instilled the right culture throughout the company for effective risk governance.
72
Corporate Governance
The committee is assisted by the Executive Risk Committee (ERC), which ensures the day to day tracking, monitoring and control of risks. The Risk Committee Chairman is provided with regular risks reports and updates by the ERC. The ERC is chaired by Ashok Hegde, Global Head of IT & Risk and has the Managing Directors of our Coffee, Cocoa, Edible Nuts and Cotton businesses as its members. During the year under review, the RC carried out a rigorous review of the Enterprise Risk Scorecard and engaged Management actively in ensuring the adequacy, effectiveness and relevant of the Enterprise Risk Scorecard against the business and operations of the Group.
Capital & Investment CommitteeThe Capital & Investment Committee (CIC) is chaired by the Independent and Non-Executive Director, Robert Tomlin. The members of the Committee are R. Jayachandran, N.G. Chanrai, Tse Po Shing Andy, Jean-Paul Pinard, Sunny Verghese and A. Shekhar.
Apart from the generally scheduled meetings, the CIC held frequent meetings via telephone conference as and when required to discuss any proposed capital projects of the Group. The CIC met seven times during the year and has oversight of the following matters:
(a) To review and recommend financial strategies, policies, gearing and financial risks, new business risks, and capital structure of the Company;
(b) To review and recommend equity capital raising plans;
(c) To review and recommend debt capital raising plans and significant banking arrangements;
(d) To review investment policy guidelines and capital expenditure plans;
(e) To review and assess the adequacy of foreign currency management;
(f) To review and recommend on mergers, acquisitions and divestments; and
(g) To review and recommend on dividend policy and dividend declarations.
The CIC has, as its executive arm the Executive Investment Committee (“EIC”) with Vivek Verma as its Chair and Ashok Hegde and V. Srivathsan as its members. In addition, the Sub-Committee of the CIC with Robert Tomlin, R. Jayachandran and Sunny Verghese as its members, was constituted to facilitate a fast track review of time sensitive investments and investments of a confidential nature. The Sub-Committee of the CIC remains accountable to the CIC for any decisions taken.
Corporate Responsibility & Sustainability CommitteeAs a seed to shelf provider of agri-commodities, Olam has a responsibility to build sustainable end-to-end supply chains. The Corporate Responsibility & Sustainability Committee (CRSC) is chaired by our Non-executive and Independent Director, Jean-Paul Pinard and has Mark Haynes Daniell, Robert Tomlin, A. Shekhar and Sridhar Krishnan as its members. The committee met four times during the year. The terms of reference of this committee includes:
(a) To review and recommend to the Board the CR&S vision and strategy for the Group;
(b) To ensure CR&S perspectives are fully integrated into the Company’s strategy;
(c) To track global CR&S trends and assess their potential impact on the Group;
(d) To monitor implementation, through the Executive CR&S committee, the strategy as well as the policies and investments in the CR&S area;
(e) To review and approve all corporate publications and website content related to CR&S;
(f) To undertake an annual review of progress made on key initiatives;
(g) To support Management’s response to crises, where required; and
(h) To review the Company’s annual Corporate Responsibility & Sustainability Report.
The CRSC is assisted in the formulation and implementation of various sustainability policies and projects, by the Executive CR&S Committee with Gerry Manley as its Chair and Chris Brett Vice President, Corporate Responsibility & Sustainability as one of its members.
As part of the CRSC vigorous engagement in corporate responsibility and sustainability matters concerning the Group’s business and operations, the CRSC visited certain of the Company’s global operations with some members of the Management team to better enable the committee in providing leadership to the Executive CRS Committee. The CRSC actively monitors corporate responsibility and sustainability issues and the report by Management on such issues in the Company’s pursuit of various investments.
73
Communication with Shareholders (Principle 14) Greater shareholder participation at Annual General Meetings (Principle 15)Investor communication: A key thrust areaAt Olam, we believe it is important for us to communicate our business, strategic developments, financial and non-financial information to investors, analysts (collectively referred to as the investing community) and key intermediaries (including financial media, brokers and independent research organisations) who provide research and information on the Company. Concurrently, we aim to understand their perspectives and requirements for decision-making and improve the two-way process.
The Investor Relations department has lead responsibility in engaging these stakeholders with the active involvement of the Group CEO and the Group CFO, and in consultation with the Corporate Responsibility and Sustainability department on Environmental, Social and Governance issues.
Earning investors’ trust and confidence is at the heart of the Company’s investor relations efforts. Olam values strengthening relations with shareholders and investors through active engagement with the investing community and key intermediaries. Through these efforts, we continue to embrace strong principles in corporate governance and transparency.
Delivering quality and timely information in a transparent mannerBesides communicating a clear business strategy, we aim to deliver quality and timely information to the investing community and key intermediaries. On a quarterly basis, we hold media and analysts conferences to announce our financial and operating results. The interim and full year conferences are webcast live to cater to the needs of global audiences. (The full financial statements, press releases and other presentation materials provided at the conferences are disseminated through the SGXNET onto the SGX-ST website outside trading hours. The same are also uploaded onto the Company’s website and disseminated by email to subscribers to news alerts.)
In addition to these quarterly events, we hold media and analysts conferences and teleconference calls to communicate important corporate developments such as mergers and acquisitions announcements. Media and analysts conferences that are held for important announcements are also webcast live. Transcripts of webcast events are available on our Investor Relations website to facilitate users’ navigation through the various topics discussed at the conference.
Engaging the investing communityApart from these forums, we hold frequent dialogues through meetings, telephone and video conference calls with the investing community to facilitate their understanding of the Company’s business model and growth strategies.
We aim to reach out to a broad spectrum of investors across the globe as part of our efforts to achieve a geographically diversified shareholder base. As part of this aim, we actively engage analysts with the objective of extending research coverage and thereby our reach to investors. As of end-FY2012, 23 research institutions cover Olam compared to 20 in FY2011. We are actively and continuously involved in discussions with other leading international and local research firms to initiate coverage on our stock.
Investment roadshows are held regularly on an ongoing basis to meet the investing community. We believe these roadshows enhance the visibility of Olam among diverse groups of investors and provide the investing community with access to the Management team, thereby addressing their concerns and helping them to better understand our business environment, business model and growth potential.
In Singapore, we typically hold a non-deal investment roadshow to visit our shareholders and prospective investors and communicate the interim and full year financial and operating results. We also attend Singapore-held investment conferences on a selected basis. Investment roadshows or conferences in other major, targeted investing countries, including Greater China, Malaysia, Japan, London, Continental Europe and the US, are also scheduled along with these activities to reach out to shareholders and prospective investors in these locations.
Where necessary, the frequency of conducting such roadshows and attending investment conferences may increase to meet the Company’s requirements to communicate important key messages and address market concerns (such as when the global financial crisis broke out in 2008) or in response to demands by the investing community for more frequent contact or clarification on current issues. We also take the initiative to help the investing community get a view of our business through field visits. In FY2012, we took several key shareholders on a site visit to Nigeria and Gabon where most of our recent large investments are made.
74
Corporate Governance
The calendar of investment roadshows and conferences for FY2012 is given below:
Date Event
31 August 2011 Post Full Year FY2011 Results Singapore Roadshow7 September 2011 UBS Asean and India Conference, Singapore12-15 September 2011 London and Continental Europe Roadshow15 September 2011 Goldman Sachs Commodities Conference, Singapore26-27 September 2011 HSBC Commodities Conference, Singapore12 October 2011 OSK|DMG’s Corporate Day, Hong Kong27 October 2011 CIMB ASEAN Conference, Kuala Lumpur28 November 2011 Nomura Investor Forum, Tokyo7-9 December 2011 New York and Boston Roadshow5 January 2012 OSK|DMG Corporate Day, Singapore10 January 2012 DBS Vickers Pulse of Asia Conference, Singapore15-16 February 2012 Post Q2 FY2012 Results Singapore Roadshow5-6 March 2012 UOBKH Asean Corporate Day, Taipei19-21 March 2012 Credit Suisse Asian Investment Conference, Hong Kong30 April – 5 May 2012 Site Visit to Nigeria and Gabon16-17 May 2012 Post Q3 FY2012 Results Singapore Roadshow21 May 2012 CIMB Singapore Corporate Day22-23 May 2012 HSBC 2nd Annual Asean Conference, Singapore20 June 2012 Standard Chartered Earth’s Resources Conference, Hong Kong28-29 June 2012 Citi ASEAN Investor Conference, Singapore
Apart from these scheduled programmes, the Investor Relations department periodically receives investor/analyst requests for meetings or conference calls to discuss and to ask questions on the Company. Generally, we accede to all requests for meetings/calls where our schedule permits provided these meetings/calls do not fall within the closed periods prior to the announcement of financial results. In total, we conduct in excess of 400 investor meetings each year.
While Olam actively pursues an outreach programme to institutional investors who account for the largest percentage of the Company’s shareholder base, it does not neglect its relations with the smaller employee and retail shareholders. We keep our employee shareholders informed of our Company’s performance and investor relations activities via our employee portal and employee communications programmes. Interaction with retail investors are facilitated by the shareholder communication services of the Securities Investors’ Association (SIAS) of Singapore, such as the corporate profiles seminars specially tailored to the needs of retail investors.
Tracking changes in the shareholder base and interaction with the investing communityWe track and monitor changes in our shareholder base on monthly basis so that we may approach and engage shareholders who have come up on the register as well as sellers of the stock to understand their reasons for the exit.
We maintain an active electronic database of the investing community, which allows us to target investors and track every investor meeting so that we can measure the frequency and quality of each interaction. This system also enables us to deliver our Company results and announcements to the investing community electronically at the same time as these are disseminated through the SGXNET so that investors have access to our information on a timely basis.
As the internet and other electronic means of communication have become more accessible, we continue to leverage such means to achieve a greater and faster reach to the investing community and facilitate their information gathering process by providing online easy-to-access financial and non-financial information, resources and tools.
Obtaining and acting on feedback from the investing communityWe conduct investor perception surveys where in a 2011/12 study we explored how 30 investors view the Company on strategy, the global macro climate, routes to growth, financials and valuation, peer comparisons, controlling shareholders, Management and investor relations and communication. These 30 investors consist of current holders, prospects and sellers of the stock split across Asia, the US, UK and Switzerland. The results of these surveys are shared with the Company’s Management team and Board of Directors. These findings aid the planning and messaging of our investor relations campaigns to help address investors’ concerns.
75
Encouraging greater shareholder participation at Annual General MeetingsWe regard the annual/extraordinary general meeting (AGM) as an opportunity to communicate directly with shareholders. We are committed to efforts to establish more effective ways of communicating with our shareholders around the AGM. Shareholders are informed of these meetings through notices published in the newspapers or through circulars. To encourage more shareholder participation, our AGMs are held in Singapore’s Central Business District that is easily accessible by most shareholders.
Board members including the Chairman of the Audit & Compliance Committee, the Human Resource & Compensation Committee and the Governance & Nomination Committee and key executives of the Senior Management team attend the AGM. Our external auditors and legal advisers are also present at the AGM to assist the Directors in addressing shareholders’ queries.
We treat shareholder issues, particularly those that require shareholders’ approval, such as the re-election of Directors and approval of Directors’ fees, as distinct subjects and submit them to the AGM as separate resolutions.
Voting in absentia by mail or electronic means requires careful study and is only feasible if there is no compromise to either the integrity of the information and/or the true identity of the shareholder. In support of greater transparency and toward an efficient voting system, the Company conducted electronic poll voting instead of voting by show of hands at the Extraordinary General Meeting and the 17th AGM held in 2011. Shareholders who are present in person or represented at the meeting will be entitled to vote on a one-share, one-vote basis on each of the resolutions by poll, using an electronic voting system. In addition, the voting results of all votes cast in respect of each resolution are instantaneously displayed at the meeting and announced to the SGX-ST following the AGM.
Accolades Best Annual Report (Bronze), Singapore Corporate Awards 2012Olam was second runner-up for Best Annual Report at the Singapore Corporate Awards 2012 for companies with S$1 billion and above in market capitalisation. The Annual Report Award (ARA) has three objectives: 1) To encourage excellent financial reporting presentation and a wider scope of disclosures beyond the minimum regulatory requirements that are in tandem with the needs of investors and other stakeholders such as employees, creditors and the general public; 2) To create awareness of the role of both mandatory accounting standards and voluntary practices issued by the Accounting Standards Council and The Institute of Certified
Public Accountants of Singapore; and 3) The ARA was introduced to increase awareness through the encouragement of social responsibility reporting that business enterprises and organisations are responsible to the community both as employers and corporate citizens.
Medium cap corporate of the yearOlam received the Medium Cap Corporate of the Year award at the annual Asiamoney Awards 2012 for the second consecutive year. In Asiamoney’s Dec/Jan 2012 issue, Olam is reported to have been long regarded as a strong corporate and analysts believe that Olam’s effective execution of its strategy has been the main driver of its success.
ST Resources Governance Index 2011 Olam was amongst top three in the ST Resources Governance Index (RGI) for 2011. Launched in December 2011, the RGI measures corporate governance performance based on indicators of ethical culture and transparency and also enables comparison between the top SGX companies in the area of corporate governance performance. The independent RGI ranks the top 30 SGX mainboard-listed companies based on market capitalisation for their performance in corporate governance. Rankings are based on three main areas: Compliance (25%), Capacity (38%) and Commitment (32%), as well as a 5% “Plus Mark” for transparency and openness.
Most transparent companyOlam was named the winner in the “Commerce” category for the “Most Transparent Company Award” at the SIAS Investors’ Choice Awards 2011. Olam was judged the winner by nominations received from financial journalists, analysts, fund managers and retail investors represented by SIAS.
Securities Transactions The Company is committed to transparency, fairness and equity in dealing with all shareholders and in ensuring adherence to all laws and regulations that govern a company listed and trading on the Singapore Exchange Securities Trading Limited (“SGX-ST”). The Employee Share Dealing Committee (“ESDC”) was set up to formulate and review the best practices in the dealing of securities by directors, executives and employees. The ESDC is chaired by Ranveer Singh Chauhan with V Srivathsan as the co-chair and Joydeep Bose, N. Muthukumar and Sriram Subramanian as its members. The ESDC reports to the CEO.
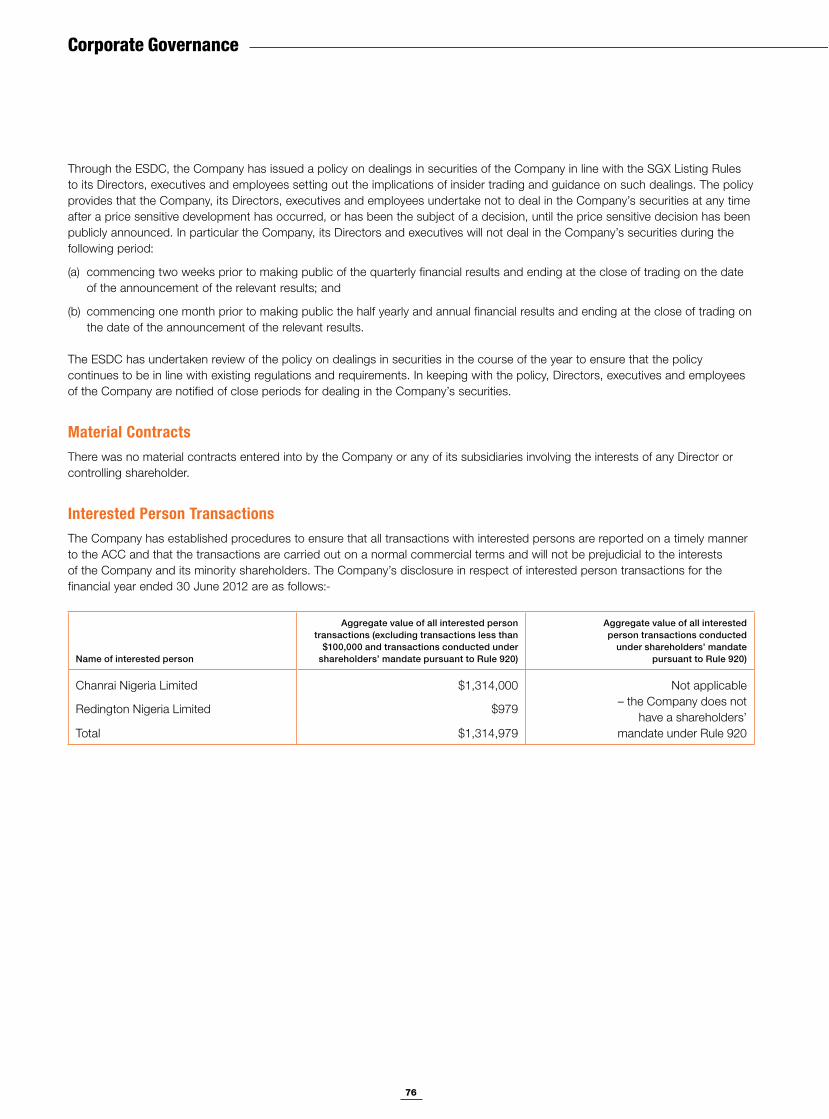
76
Corporate Governance
Through the ESDC, the Company has issued a policy on dealings in securities of the Company in line with the SGX Listing Rules to its Directors, executives and employees setting out the implications of insider trading and guidance on such dealings. The policy provides that the Company, its Directors, executives and employees undertake not to deal in the Company’s securities at any time after a price sensitive development has occurred, or has been the subject of a decision, until the price sensitive decision has been publicly announced. In particular the Company, its Directors and executives will not deal in the Company’s securities during the following period:
(a) commencing two weeks prior to making public of the quarterly financial results and ending at the close of trading on the date of the announcement of the relevant results; and
(b) commencing one month prior to making public the half yearly and annual financial results and ending at the close of trading on the date of the announcement of the relevant results.
The ESDC has undertaken review of the policy on dealings in securities in the course of the year to ensure that the policy continues to be in line with existing regulations and requirements. In keeping with the policy, Directors, executives and employees of the Company are notified of close periods for dealing in the Company’s securities.
Material Contracts There was no material contracts entered into by the Company or any of its subsidiaries involving the interests of any Director or controlling shareholder.
Interested Person TransactionsThe Company has established procedures to ensure that all transactions with interested persons are reported on a timely manner to the ACC and that the transactions are carried out on a normal commercial terms and will not be prejudicial to the interests of the Company and its minority shareholders. The Company’s disclosure in respect of interested person transactions for the financial year ended 30 June 2012 are as follows:-
Name of interested person
Aggregate value of all interested person transactions (excluding transactions less than
$100,000 and transactions conducted under shareholders’ mandate pursuant to Rule 920)
Aggregate value of all interested person transactions conducted
under shareholders’ mandate pursuant to Rule 920)
Chanrai Nigeria Limited $1,314,000 Not applicable – the Company does not
have a shareholders’ mandate under Rule 920
Redington Nigeria Limited $979
Total $1,314,979
77
Key Information Regarding Directors
R. JayachandranNon-Executive ChairmanDate of first appointment as a director: 4 July 1995Date of last re-election as a director: 28 October 2010Age as at 30 June 2012: 68Board committee(s) served on: Capital & Investment Committee (Member)Governance & Nomination Committee (Member)Human Resource & Compensation Committee (Member)Academic & Professional Qualification(s): Bachelor of Commerce, University of MadrasInstitute of Chartered Accountants of IndiaAdvanced Management Programme, Harvard UniversityPresent Directorships Listed companies Redington India Ltd (Non-Executive Director)Others Aquarius Capital Asia Pte Ltd (Non-Executive Director)Aquarius Capital Mauritius Limited (Non-Executive Director)Aquarius Investment Advisors Pte Ltd (Non-Executive Director)Aquarius Investments Ltd (Non-Executive Director)Aquarius Real Estate Investments Ltd (Executive Director)Aquarius Equity Investments Pte Ltd (Non-Executive Director)Cadensworth FZE (Non-Executive Director)Eljay Holdings Ltd. (Non-Executive Director)KC Tex International Ltd (Non-Executive Director)Kewalram Singapore Limited (Executive Director)Napier Healthcare Solutions Pte Ltd (Executive Chairman)Napier Healthcare Solutions (India) Ltd (Non-Executive Chairman)Napier Healthcare Solutions Inc. (Non-Executive Director)Afri Ventures Ltd (Non-Executive Director)Kewalram Chanrai Holdings Limited (Non-Executive Director)Wyndham Holdings Ltd (Non-Executive Director)Olam Investments Limited (Non-Executive Director)Redington Distribution Pte Ltd (Non-Executive Director)Redington Gulf FZE (Non-Executive Director)Redington (Mauritius) Limited (Non-Executive Director)Redington Africa Distribution FZE (UAE) (Non-Executive Director)Redington Egypt Ltd (Non-Executive Director)Redington International Holdings Ltd (Non-Executive Director)RPL Pte Ltd (Non-Executive Director)Major Appointments (other than Directorships)Hindu Endowments Board (Board Member)National Heritage Board (Board Member)Past Directorships held over the preceding three years Media Investments LtdFernwood Investments Ltd
Narain Girdhar ChanraiNon-Executive DirectorDate of first appointment as a director: 4 July 1995Date of last re-election as a director: 28 October 2011Age as at 30 June 2012: 64Board committee(s) served on: Audit & Compliance Committee (Member)Capital & Investment Committee (Member)Governance & Nomination Committee (Member)
Academic & Professional Qualification(s): Bachelor of Economics, University of LondonPresent Directorships Listed companies NilOthers Afri Investments Ltd (Non-Executive Director)Afri Ventures Ltd (Non-Executive Director)Afri Ventures FZE (Non-Executive Director)Afri Ventures Kenya Ltd (Non-Executive Director)Afcott Cam SRL (Non-Executive Director)Afcott Ghana Ltd (Non-Executive Director)Afcott Nigeria PLC (Non-Executive Director)Aflon Nigeria PLC (Non-Executive Director)Afprint Nigeria PLC (Non-Executive Director)Ardmore Investments Limited (Non-Executive Director)Campestre Ltd (Non-Executive Director)Chanrai International South Africa Ltd (Non-Executive Director)Chanrai Nigeria Ltd (Non-Executive Director)Clarke Holdings Ltd (Non-Executive Director)DKC Trustees Ltd (Non-Executive Director)Eco Oils Ltd (Non-Executive Director)Eco Oils Sdn Bhd (Non-Executive Director)Eco Oils (Negeri Sembilan) Sdn Bhd (Non-Executive Director)Eco Oils (Sabah) Sdn Bhd (Non-Executive Director)Ecowater Management Ltd (Non-Executive Director)Evershine Ventures Ltd – Ras AL Khaimah (Non-Executive Director)GKC Trustees Ltd (Non-Executive Director)KC Agro Ltd (Non-Executive Director)KC Investments Ltd (Non-Executive Director)KC Realty Ltd (Non-Executive Director)Kewalram Cam SRL (Non-Executive Director)Kewalram Chanrai (MEA) LLC (Non-Executive Director)Kewalram Ghana Ltd (Non-Executive Director)Kewalram Singapore Limited (Managing Director)Kewalram Philippines Inc (Non-Executive Director)Kewalram Realty Land (Non-Executive Director)Kewalram Realty Inc (Non-Executive Director)Kewalram Nigeria Ltd (Non-Executive Director)Kewalram Textiles Pvt Ltd (Non-Executive Director)Leonie Investments Ltd (Non-Executive Director)MKC Trustees Ltd (Non-Executive Director)Olam Investments Limited (Non-Executive Director)PT Kewalram Indonesia (President Commissioner)Redington Mauritius Limited (Non-Executive Director)RPL Pte Ltd (Non-Executive Director)Springfield Agro Ltd (Non-Executive Director)Southern Fashions Ltd (Non-Executive Director)Sunola Foods Ltd (Non-Executive Director)Sunseed Nigeria PLC (Non-Executive Director)Templestow Investments Ltd (Non-Executive Director)Major Appointments (other than Directorships) Alceba 2007 Trust (Trustee)Kewalram Chanrai Foundation (Trustee)Jaslok Hospital & Research Centre (Trustee)Past Directorships held over the preceding three years Nil
78
Key Information Regarding Directors
Michael Lim Choo SanNon-Executive and Lead Independent DirectorDate of first appointment as a director: 24 September 2004Date of last re-election as a director: 28 October 2011Date of first appointment as lead independent director: May 2010Age as at 30 June 2012: 65Board committee(s) served on: Audit & Compliance Committee (Chairman)Governance & Nomination Committee (Chairman)Risk Committee (Member)Academic & Professional Qualification(s): Bachelor of Commerce & Administration,
Victoria University of Wellington, New ZealandChartered Accountant, New ZealandFellow, Institute of Certified Public Accountants of SingaporePresent Directorships Listed companies Nomura Holdings Inc, Japan (Non-Executive Director)Others Land Transport Authority (Chairman)Nomura Singapore Limited (Chairman)Nomura Asia Holding N.V. (Non-Executive Director)Wah Hin & Company (Private) Limited (Non-Executive Director)Major Appointments (other than Directorships) Accounting Standards Council (Chaiman)Pro-Tem Singapore Accountancy Council (Chairman)Public Service Commission (Member)Legal Service Commission (Member)Past Directorships held over the preceding three years Chemoil Energy LimitedPSA International Ltd
Sunny VergheseGroup Managing Director and Chief Executive Officer Date of first appointment as a director: 11 July 1996Date of last re-election as a director: 28 October 2011Age as at 30 June 2012: 53Board committee(s) served on: Capital & Investment Committee (Member)Risk Committee (Member)Academic & Professional Qualification(s): Postgraduate Degree in Business Management,
Indian Institute of Management, AhmedabadAdvanced Management Programme, Harvard Business SchoolPresent Directorships Listed companies PureCircle LimitedOthers International Enterprise Singapore (Chairman)Far East Agri Pte. Ltd. (Non-Executive Director)Nauvu Investments Pte. Ltd. (Non-Executive Director)Invenio Commodity Financials Pte. Ltd. (Non-Executive Director)Invenio Holdings Pte. Ltd. (Chairman)Australian Cotton Corporation Pty Ltd (Non-Executive Director)Café Outspan Vietnam Limited (Chairman)Olam Americas, Inc. (Non-Executive Director)Olam Australia Pty Ltd (Non-Executive Director)Olam Europe B.V. (Non-Executive Director)Olam Europe Limited (Non-Executive Director)Olam Investment Australia Pty Ltd (Non-Executive Director)Olam Insurance Limited (Non-Executive Director)Olam Ivoire Sarl (Non-Executive Director)Olam Nigeria Limited (Non-Executive Director)Olam South Africa (Proprietary) Ltd (Non-Executive Director)
Olam Vietnam Limited (Chairman)Queensland Cotton Corporation Pty Ltd (Non-Executive Director)Queensland Cotton Holdings Pty Ltd (Non-Executive Director)QC Brazil Pty Ltd (Non-Executive Director)QC Management Pty Ltd (Non-Executive Director)QC International Pty Ltd (Non-Executive Director)Société SIFCA (Non-Executive Director)Major Appointments (other than Directorships) National University of Singapore Board of Trustees (Trustee)Human Capital Leadership Institute (Chairman)Past Directorships held over the preceding three years CitySpring Infrastructure Management Pte LtdOlam (Mocambique) LimitadaOlam Exports (India) LtdLamco SrlAnderson Clayton CorpQC (US) Inc.QC (US) International, Inc.QC (US) Marketing, Inc.
Robert Michael TomlinNon-Executive and Independent DirectorDate of first appointment as a director: 24 September 2004Date of last re-election as a director: 28 October 2010Age as at 30 June 2012: 67Board committee(s) served on: Capital & Investment Committee (Chairman)Audit & Compliance Committee (Member)Corporate Responsibility & Sustainability Committee (Member)Risk Committee (Member)Academic & Professional Qualification(s): Bachelor in Modern Language, Downing College CambridgeBusiness Management Graduate, Harvard Business SchoolPresent Directorships Listed companies NilOthers Dane Court Pte Ltd (Executive Director)Invenio Holdings Pte. Ltd. (Non-Executive Director)Lasalle College for the Arts Limited (Non-Executive Director)Lepercq de Neuflize Asia Pte Ltd (Vice Chairman)Lepercq-Amcur SICAV SIF (Non-Executive Director)Major Appointments (other than Directorships) DesignSingapore Council (Chairman)Singapore Management University (Trustee)Singapore Repertory Theatre (Chairman)Yong Siew Toh Conservatory (Governor)Past Directorships held over the preceding three years ACES LtdAviva LtdAviva Life Insurance Co. LtdMediacorp Pte LtdNavigator Investment Services Pte Ltd
Mark Haynes DaniellNon-Executive and Independent DirectorDate of first appointment as a director: 31 October 2002Date of last re-election as a director: 29 October 2009Age as at 30 June 2012: 57Board committee(s) served on: Human Resource & Compensation Committee (Chairman)Audit & Compliance Committee (Member)Governance & Nomination Committee (Member)Corporate Responsibility & Sustainability Committee (Member)
79
Academic & Professional Qualification(s): Bachelor of Law, Oxford UniversityJuris Doctor Degree, Harvard Law SchoolQualified Attorney in the Commonwealth of MassachusettsPresent Directorships Listed companies Sacoven PLC (Non-Executive Director)Others The Cuscaden Group Pte Ltd (Chairman)Aquarius Investment Advisors Pte Ltd (Vice Chairman)Cuscaden Georgia, Ltd (Non-Executive Director)Raffles Family Wealth Trust Pte Ltd (Executive Chairman)Tiryaki Agro Gida San. Ve Tic.A.S. (Non-Executive Director)Major Appointments (other than Directorships) NilPast Directorships held over the preceding three years Aquarius Capital (Mauritius) LimitedAquarius Capital Asia Pte LtdExeter Premedia Private LtdMerlindus Technologies Pte Ltd
Tse Po Shing AndyNon-Executive and Independent DirectorDate of first appointment as a director: 12 September 2002Date of last re-election as a director: 29 October 2009Age as at 30 June 2012: 46Board committee(s) served on: Risk Committee (Chairman)Capital & Investment Committee (Member)Academic & Professional Qualification(s): MBA, Chinese University of Hong KongQualified Chartered Financial AnalystLicensed with the Securities and Futures Commission
of Hong Kong as a Responsible OfficerPresent Directorships Listed companies Tat Hong Holdings Ltd (Non-Executive Director)Others AIF Capital (India) Private Limited (Executive Director)AIF Capital Asia III GP Limited (Executive Director)AIF Capital Asia IV GP Limited (Executive Director)AIF Capital Asia Management IV, Ltd. (Executive Director)AIF Capital Asia Management Ltd. (Executive Director)AIF Capital China Limited (Executive Director)AIF Capital III Designated Limited Partner, Ltd. (Executive Director)AIF Capital III Life Science Limited (Executive Director)AIF Capital Innovations Limited (Executive Director)AIF Capital Limited (Managing Director, Executive Director)AIF Capital Machinery Investment Limited (Executive Director)AIF Capital Partners, Ltd. (Executive Director)AIF Capital Telecom Infrastructure Limited (Executive Director)AIFCP Mauritius Direct Investment Limited (Executive Director)Canteric Pte. Ltd. (Alternate Director, Non-Executive)CN Innovations Co., Ltd. (Non-Executive Director)CN Innovations Holdings (BVI) Limited (Non-Executive Director)CN Innovations Holdings Limited (Non-Executive Director)Glam Estates Pte. Ltd. (Non-Executive Director)Good View Group Limited (Executive Director)Green Mobility Innovations Limited (Non-Executive Director)Idea Key Limited (Non-Executive Director)Ink Color International Pte. Ltd. (Alternate Director, Non-Executive)Orange Amber International Limited (Executive Director)Orizaba Limited (Executive Director)
Pacific Plas Pte. Ltd. (Alternate Director, Non-Executive) Parrys Park Investments Limited (Non-Executive Director)Polymer Resources Pte. Ltd. (Alternate Director, Non-Executive) Prime Pathway Limited (Executive Director)Pure Glory Global Limited (Executive Director)Pure Perfect Holdings Limited (Executive Director)Ruby Fortune Investments Limited (Executive Director)Tai-I International (Bermuda) Limited (Non-Executive Director)Zyoxel Limited (Non-Executive Director)Tai-I Jiang Corp (Guangzhou) Co., Ltd. (Non-Executive Director)Tai-I Copper (Guangzhou) Co., Ltd. (Non-Executive Director)Major Appointments (other than Directorships) NilPast Directorships held over the preceding three years ACE Decision LimitedAIF Steel Investment Holding Pte. Ltd.Asian Infrastructure Fund Advisers LimitedGrand Bay Venture LimitedJava Jalan (Mauritius) Holdings LimitedJava Jalan Investment Inc.New Frontier (Holdings) Limited Russell AIF Singapore Investments LimitedSelect Idea Group LimitedSuper Elect Limited
Wong Heng TewNon-Executive and Independent DirectorDate of first appointment as a director: 10 October 2003Date of last re-election as a director: 28 October 2010Age as at 30 June 2012: 60Board committee(s) served on: Audit & Compliance Committee (Member)Governance & Nomination Committee (Member)Human Resource & Compensation Committee (Member)Academic & Professional Qualification(s): Bachelor of Engineering, University of SingaporeCompleted Programme for Management Development,
Harvard Business SchoolPresent Directorships Listed companies Vietnam Growth Fund Limited Others Aspen Holdings Limited (Non-Executive Director)Cypress Holdings Limited (Non-Executive Director)Mercatus Co-operative Limited (Non-Executive Director)Heliconia Capital Management Pte Ltd (Non-Executive Director)NTUC Fairprice Co-operative Limited (Non-Executive Director)Industrial & Services Co-Operative Society Ltd
(Non-Executive Director)ASEAN Potash Mining Public Company Limited
(Non-Executive Director)Asean Bintulu Fertilizer Sdn Bhd (Non-Executive Director)Certis CISCO Security Pte Ltd (Non-Executive Director)Centaura Investments (Mauritius) Pte Ltd (Non-Executive Director)Maju Investments (Mauritius) Pte Ltd (Non-Executive Director)Aranda Investments (Mauritius) Pte Ltd (Non-Executive Director)Perikatan Asia Sdn Bhd (Non-Executive Director) Tuas Fund Investments Pte Ltd (Non-Executive Director)Major Appointments (other than Directorships) Nil
80
Key Information Regarding Directors
Past Directorships held over the preceding three years Indochina Fund Management Pte Ltd.HOPU Management Co. Ltd. Temasek Financial (I) Pte LtdEH Group LtdOE Global Ventures LimitedOrchard Energy Pte LtdRRJ Management LimitedSurbana Fund Management Pte Ltd Surbana Township Development Fund Pte LtdSurbana Corporation Pte Ltd
Jean-Paul PinardNon-Executive and Independent DirectorDate of first appointment as a director: 29 October 2008Date of last re-election as a director: 28 October 2010Age as at 30 June 2012: 62Board committee(s) served on: Corporate Responsibility & Sustainability Committee (Chairman)Human Resource & Compensation Committee (Member)Capital & Investment Committee (Member)Academic & Professional Qualification(s): PhD in Economics, University of CaliforniaDiplome d’Ingenieur, Ecole Polytechnique ParisPresent Directorships Listed companies Yantai Changyu Pioneer Wine Company LimitedOthers Yantai Changyu Group Company Limited Major Appointments (other than Directorships) NilPast Directorships held over the preceding three years United Trading (Sodrugestvo Group)
Sridhar KrishnanExecutive DirectorDate of first appointment as a director: 1 April 1998Date of last re-election as a director: 29 October 2009Age as at 30 June 2012: 58Board committee(s) served on: Corporate Responsibility & Sustainability Committee (Member)Risk Committee (Member)Academic & Professional Qualification(s): Bachelor Degree in Commerce, University of Delhi, IndiaPostgraduate Degree in Business Management,
University of Delhi, IndiaPresent Directorships Listed companies NilOthers Napier Healthcare Solutions Pte Ltd (Non-Executive Director)Olam Burundi SA (Non-Executive Director)Olam Europe Limited (Non-Executive Director)Olam Europe B.V. (Non-Executive Director)Olam Agro India Limited (Non-Executive Director)Olam Insurance Limited (Non-Executive Director)Olam Liberia Limited (Non-Executive Director)
Olam Nigeria Limited (Non-Executive Director)Olam Shanghai Limited (Non-Executive Director)Olam Tanzania Limited (Non-Executive Director)Olam Vietnam Limited (Vice Chairman)Outspan Costa Rica S.A. (Non-Executive Director)Outspan Ivoire SA (Non-Executive Director)Outspan Panama S.A. (Non-Executive Director)tt Timber International AG (Non-Executive Director)Major Appointments (other than Directorships) NilPast Directorships held over the preceding three years Singapore Commodity Exchange Limited
A. ShekharExecutive DirectorDate of first appointment as a director: 1 April 1998Date of last re-election as a director: 28 October 2011Age as at 30 June 2012: 49Board committee(s) served on: Capital & Investment Committee (Member)Corporate Responsibility & Sustainability Committee (Member)Academic & Professional Qualification(s): Bachelor Degree in Aeronautical Engineering, Panjab University, IndiaPostgraduate Degree in Business Management, Panjab University, IndiaAdvanced Management Programme, Harvard Business SchoolPresent Directorships Listed companies NilOthers Café Outspan Vietnam Limited (Vice Chairman)Far East Agri Pte. Ltd. (Non-Executive Director)Key Foods Hong Kong Limited (Non-Executive Director)Olam Americas Inc. (Non-Executive Director)Olam Burkina Sarl (Non-Executive Director)Olam Europe BV (Non-Executive Director)Olam Information Services Limited (Non-Executive Director)Olam Liberia Limited (Non-Executive Director)Olam Madagascar Sarl (Non-Executive Director)Olam (Mocambique), Limitada (Non-Executive Director)Olam Nigeria Limited (Non-Executive Director)Olam Orchards Australia Pty Ltd (Non-Executive Director)Olam Shanghai Limited (Non-Executive Director)Olam Tanzania Limited (Non-Executive Director)Olam US Holdings, Inc. (Non-Executive Director)Olam Vietnam Limited (Director)Outspan Colombia S.A. (Non-Executive Director)Outspan Ivoire SA (Non-Executive Director)Outspan PNG Ltd (Non-Executive Director)Qingdao Key Foods Co. Ltd (Non-Executive Director)Major Appointments (other than Directorships) NilPast Directorships held over the preceding three years Nil
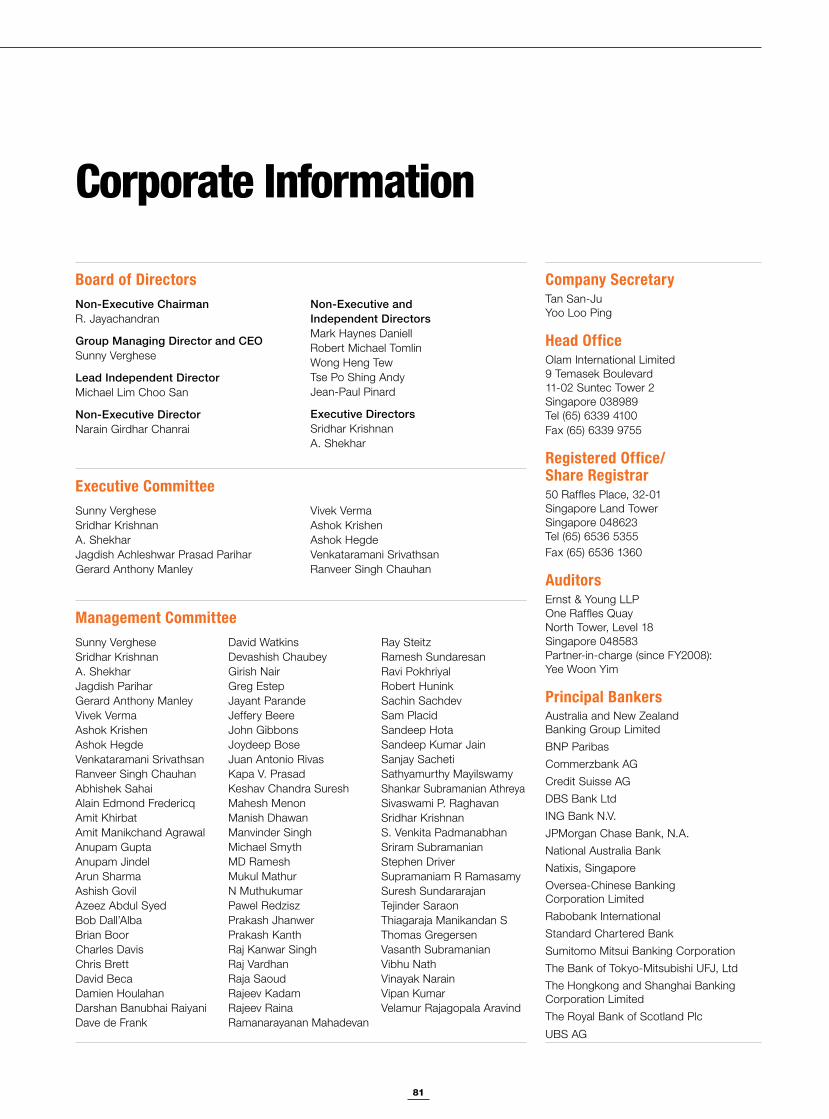
81
Non-Executive Chairman R. Jayachandran
Group Managing Director and CEO Sunny Verghese
Lead Independent Director Michael Lim Choo San
Non-Executive Director Narain Girdhar Chanrai
Non-Executive and Independent Directors Mark Haynes Daniell Robert Michael Tomlin Wong Heng Tew Tse Po Shing Andy Jean-Paul Pinard
Executive Directors Sridhar Krishnan A. Shekhar
Board of Directors
Corporate Information
Company SecretaryTan San-JuYoo Loo Ping
Head OfficeOlam International Limited9 Temasek Boulevard11-02 Suntec Tower 2Singapore 038989Tel (65) 6339 4100Fax (65) 6339 9755
Registered Office/ Share Registrar50 Raffles Place, 32-01Singapore Land TowerSingapore 048623Tel (65) 6536 5355Fax (65) 6536 1360
AuditorsErnst & Young LLPOne Raffles QuayNorth Tower, Level 18Singapore 048583Partner-in-charge (since FY2008): Yee Woon Yim
Principal Bankers Australia and New Zealand Banking Group Limited BNP ParibasCommerzbank AGCredit Suisse AG DBS Bank Ltd ING Bank N.V.JPMorgan Chase Bank, N.A.National Australia BankNatixis, SingaporeOversea-Chinese Banking Corporation LimitedRabobank InternationalStandard Chartered BankSumitomo Mitsui Banking CorporationThe Bank of Tokyo-Mitsubishi UFJ, LtdThe Hongkong and Shanghai Banking Corporation LimitedThe Royal Bank of Scotland Plc
UBS AG
Sunny VergheseSridhar KrishnanA. ShekharJagdish Achleshwar Prasad PariharGerard Anthony Manley
Vivek VermaAshok KrishenAshok HegdeVenkataramani SrivathsanRanveer Singh Chauhan
Executive Committee
Sunny VergheseSridhar KrishnanA. ShekharJagdish PariharGerard Anthony ManleyVivek VermaAshok KrishenAshok HegdeVenkataramani SrivathsanRanveer Singh ChauhanAbhishek SahaiAlain Edmond FredericqAmit KhirbatAmit Manikchand AgrawalAnupam GuptaAnupam JindelArun SharmaAshish GovilAzeez Abdul SyedBob Dall’AlbaBrian BoorCharles DavisChris BrettDavid BecaDamien HoulahanDarshan Banubhai RaiyaniDave de Frank
David WatkinsDevashish ChaubeyGirish NairGreg EstepJayant ParandeJeffery BeereJohn GibbonsJoydeep BoseJuan Antonio RivasKapa V. PrasadKeshav Chandra Suresh Mahesh MenonManish DhawanManvinder SinghMichael SmythMD RameshMukul MathurN MuthukumarPawel RedziszPrakash JhanwerPrakash KanthRaj Kanwar SinghRaj VardhanRaja SaoudRajeev KadamRajeev RainaRamanarayanan Mahadevan
Ray SteitzRamesh SundaresanRavi PokhriyalRobert HuninkSachin SachdevSam PlacidSandeep HotaSandeep Kumar JainSanjay SachetiSathyamurthy MayilswamyShankar Subramanian AthreyaSivaswami P. RaghavanSridhar KrishnanS. Venkita PadmanabhanSriram SubramanianStephen DriverSupramaniam R RamasamySuresh SundararajanTejinder SaraonThiagaraja Manikandan SThomas GregersenVasanth SubramanianVibhu NathVinayak NarainVipan KumarVelamur Rajagopala Aravind
Management Committee
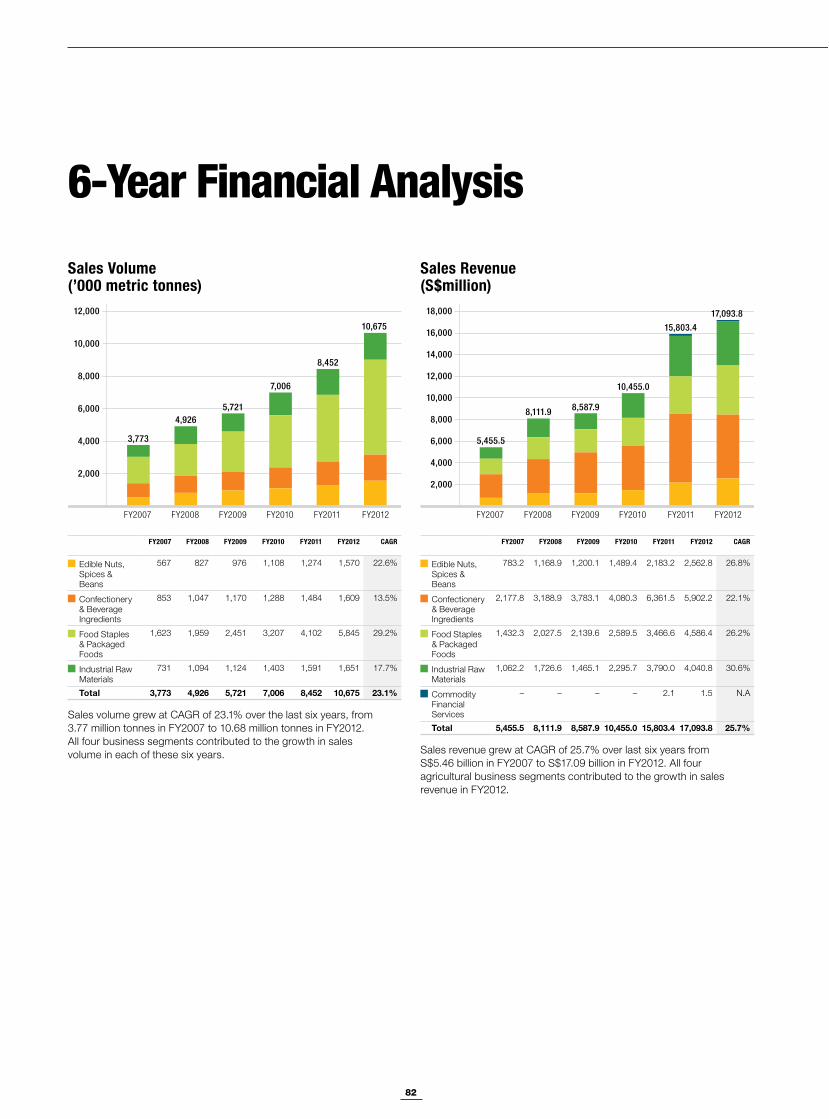
82
6-Year Financial Analysis
Sales Volume (’000 metric tonnes)
Sales Revenue (S$million)
FY2007 FY2008 FY2009 FY2010 FY2011 FY2012 CAGR
Edible Nuts, Spices & Beans
783.2 1,168.9 1,200.1 1,489.4 2,183.2 2,562.8 26.8%
Confectionery & Beverage Ingredients
2,177.8 3,188.9 3,783.1 4,080.3 6,361.5 5,902.2 22.1%
Food Staples & Packaged Foods
1,432.3 2,027.5 2,139.6 2,589.5 3,466.6 4,586.4 26.2%
Industrial Raw Materials
1,062.2 1,726.6 1,465.1 2,295.7 3,790.0 4,040.8 30.6%
Commodity Financial Services
– – – – 2.1 1.5 N.A
Total 5,455.5 8,111.9 8,587.9 10,455.0 15,803.4 17,093.8 25.7%
Sales revenue grew at CAGR of 25.7% over last six years from S$5.46 billion in FY2007 to S$17.09 billion in FY2012. All four agricultural business segments contributed to the growth in sales revenue in FY2012.
FY2007 FY2008 FY2009 FY2010 FY2011 FY2012 CAGR
Edible Nuts, Spices & Beans
567 827 976 1,108 1,274 1,570 22.6%
Confectionery & Beverage Ingredients
853 1,047 1,170 1,288 1,484 1,609 13.5%
Food Staples & Packaged Foods
1,623 1,959 2,451 3,207 4,102 5,845 29.2%
Industrial Raw Materials
731 1,094 1,124 1,403 1,591 1,651 17.7%
Total 3,773 4,926 5,721 7,006 8,452 10,675 23.1%
Sales volume grew at CAGR of 23.1% over the last six years, from 3.77 million tonnes in FY2007 to 10.68 million tonnes in FY2012. All four business segments contributed to the growth in sales volume in each of these six years.
2,000
4,000
6,000
8,000
10,000
12,000
FY2007 FY2008 FY2009 FY2010 FY2011 FY2012
3,773
10,675
4,9265,721
7,006
8,452
FY2007 FY2008 FY2009 FY2010 FY2011 FY2012
5,455.5
17,093.8
8,111.9 8,587.9
10,455.0
15,803.4
2,000
4,000
6,000
8,000
10,000
12,000
14,000
16,000
18,000
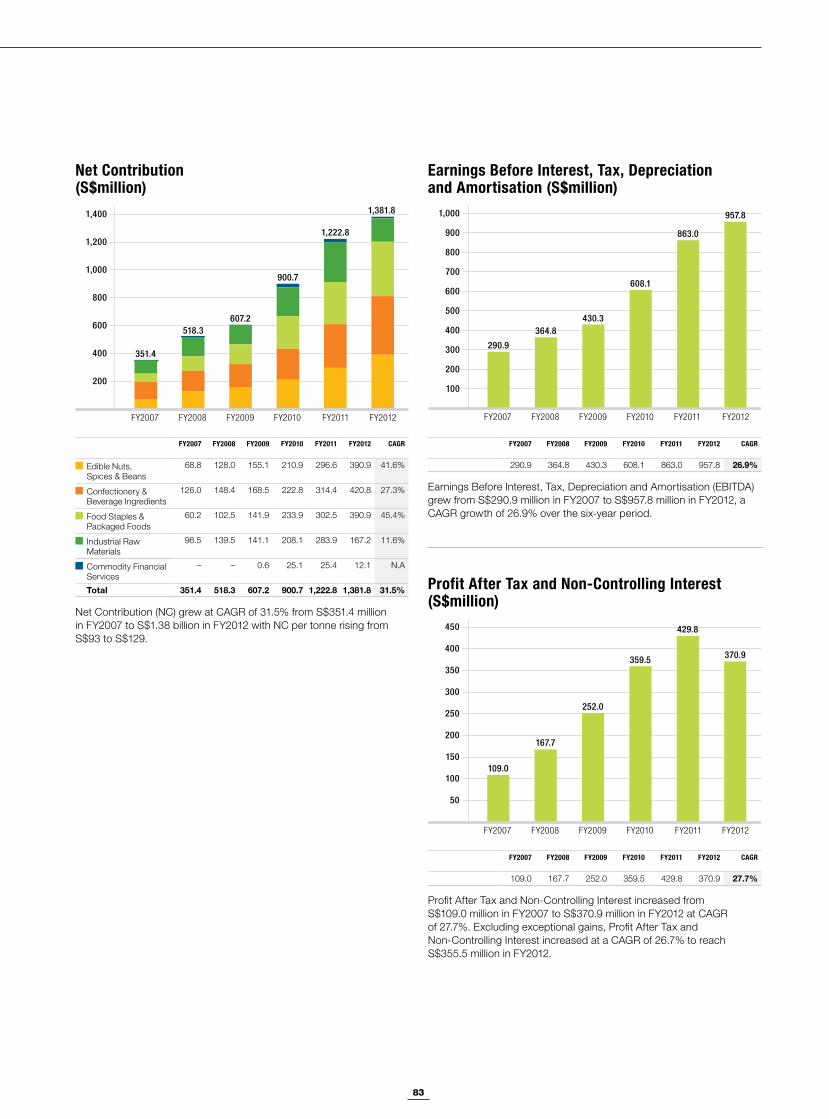
83
FY2007 FY2008 FY2009 FY2010 FY2011 FY2012 CAGR
Edible Nuts, Spices & Beans
68.8 128.0 155.1 210.9 296.6 390.9 41.6%
Confectionery & Beverage Ingredients
126.0 148.4 168.5 222.8 314.4 420.8 27.3%
Food Staples & Packaged Foods
60.2 102.5 141.9 233.9 302.5 390.9 45.4%
Industrial Raw Materials
96.5 139.5 141.1 208.1 283.9 167.2 11.6%
Commodity Financial Services
– – 0.6 25.1 25.4 12.1 N.A
Total 351.4 518.3 607.2 900.7 1,222.8 1,381.8 31.5%
Net Contribution (NC) grew at CAGR of 31.5% from S$351.4 million in FY2007 to S$1.38 billion in FY2012 with NC per tonne rising from S$93 to S$129.
Net Contribution (S$million)
Earnings Before Interest, Tax, Depreciation and Amortisation (S$million)
FY2007 FY2008 FY2009 FY2010 FY2011 FY2012 CAGR
290.9 364.8 430.3 608.1 863.0 957.8 26.9%
Earnings Before Interest, Tax, Depreciation and Amortisation (EBITDA) grew from S$290.9 million in FY2007 to S$957.8 million in FY2012, a CAGR growth of 26.9% over the six-year period.
Profit After Tax and Non-Controlling Interest (S$million)
FY2007 FY2008 FY2009 FY2010 FY2011 FY2012 CAGR
109.0 167.7 252.0 359.5 429.8 370.9 27.7%
Profit After Tax and Non-Controlling Interest increased from S$109.0 million in FY2007 to S$370.9 million in FY2012 at CAGR of 27.7%. Excluding exceptional gains, Profit After Tax and Non-Controlling Interest increased at a CAGR of 26.7% to reach S$355.5 million in FY2012.
FY2007 FY2008 FY2009 FY2010 FY2011 FY2012
290.9
364.8 430.3
608.1
863.0
957.8
100
200
300
400
500
600
700
800
900
1,000
50
100
150
200
250
300
350
400
450
FY2007 FY2008 FY2009 FY2010 FY2011 FY2012
109.0
167.7
252.0
359.5
429.8
370.9
200
400
600
800
1,000
1,200
1,400
FY2007 FY2008 FY2009 FY2010 FY2011 FY2012
351.4
1,381.8
518.3607.2
900.7
1,222.8
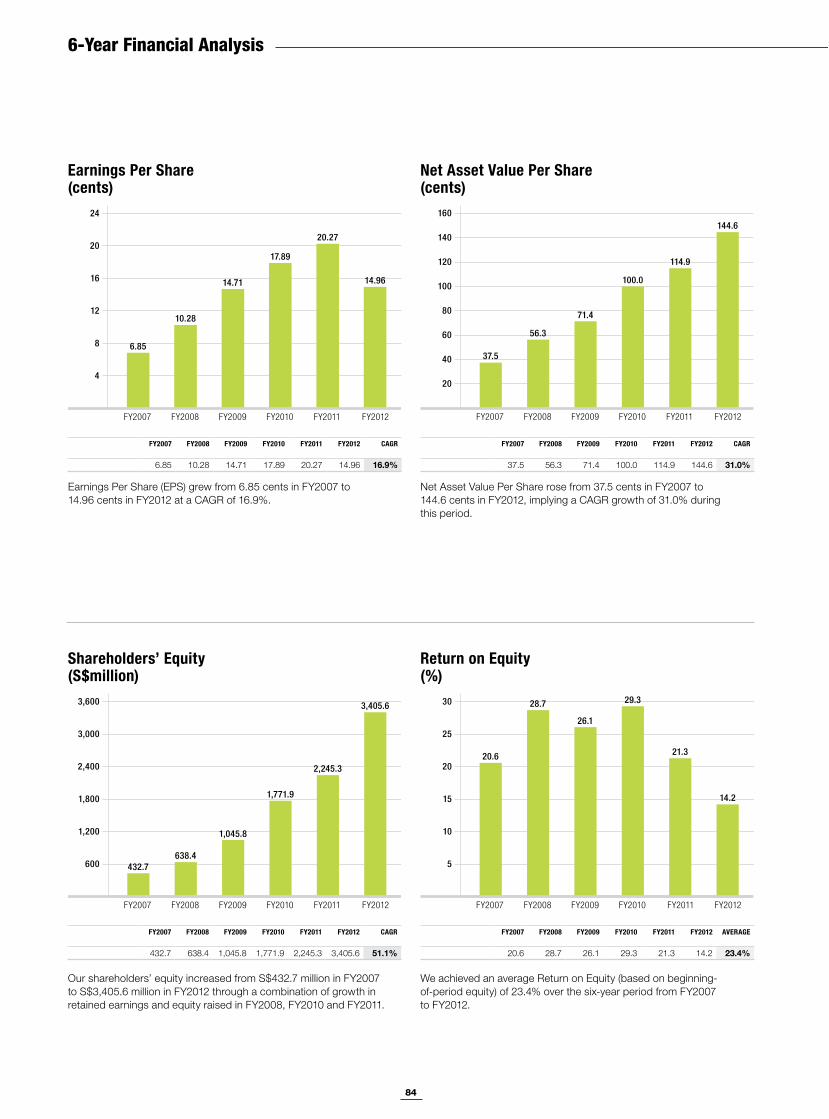
84
6-Year Financial Analysis
FY2007 FY2008 FY2009 FY2010 FY2011 FY2012 CAGR
6.85 10.28 14.71 17.89 20.27 14.96 16.9%
Earnings Per Share (EPS) grew from 6.85 cents in FY2007 to 14.96 cents in FY2012 at a CAGR of 16.9%.
FY2007 FY2008 FY2009 FY2010 FY2011 FY2012 CAGR
37.5 56.3 71.4 100.0 114.9 144.6 31.0%
Net Asset Value Per Share rose from 37.5 cents in FY2007 to 144.6 cents in FY2012, implying a CAGR growth of 31.0% during this period.
Earnings Per Share (cents)
Net Asset Value Per Share (cents)
Return on Equity (%)
Shareholders’ Equity (S$million)
FY2007 FY2008 FY2009 FY2010 FY2011 FY2012 CAGR
432.7 638.4 1,045.8 1,771.9 2,245.3 3,405.6 51.1%
Our shareholders’ equity increased from S$432.7 million in FY2007 to S$3,405.6 million in FY2012 through a combination of growth in retained earnings and equity raised in FY2008, FY2010 and FY2011.
FY2007 FY2008 FY2009 FY2010 FY2011 FY2012 AVERAGE
20.6 28.7 26.1 29.3 21.3 14.2 23.4%
We achieved an average Return on Equity (based on beginning- of-period equity) of 23.4% over the six-year period from FY2007 to FY2012.
FY2007 FY2008 FY2009 FY2010 FY2011 FY2012
6.85
10.28
14.71
17.89
20.27
14.96
4
8
12
16
20
24
FY2007 FY2008 FY2009 FY2010 FY2011 FY2012
37.5
56.3
71.4
100.0
114.9
144.6
20
40
60
80
100
120
140
160
600
1,200
1,800
2,400
3,000
3,600
FY2007 FY2008 FY2009 FY2010 FY2011 FY2012
432.7638.4
1,045.8
1,771.9
2,245.3
3,405.6
FY2007 FY2008 FY2009 FY2010 FY2011 FY2012
20.6
28.7
26.1
29.3
21.3
14.2
5
10
15
20
25
30
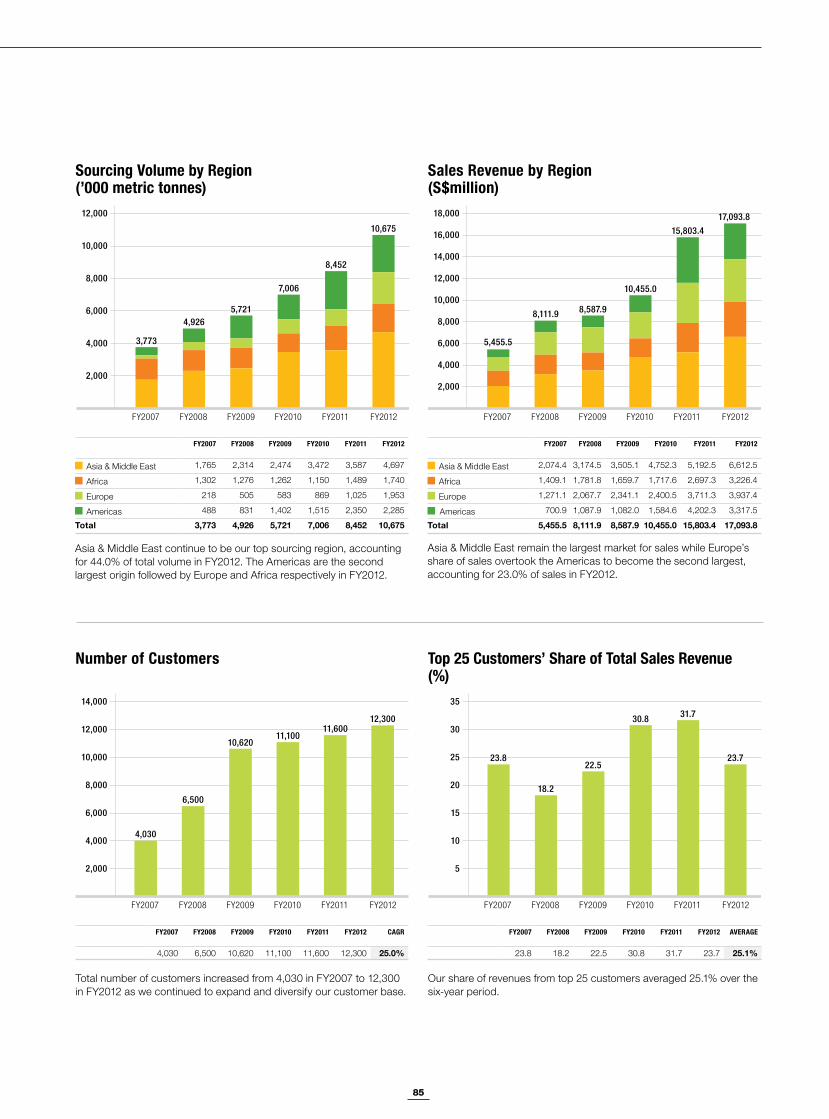
85
FY2007 FY2008 FY2009 FY2010 FY2011 FY2012
Asia & Middle East 1,765 2,314 2,474 3,472 3,587 4,697
Africa 1,302 1,276 1,262 1,150 1,489 1,740
Europe 218 505 583 869 1,025 1,953
Americas 488 831 1,402 1,515 2,350 2,285
Total 3,773 4,926 5,721 7,006 8,452 10,675
Asia & Middle East continue to be our top sourcing region, accounting for 44.0% of total volume in FY2012. The Americas are the second largest origin followed by Europe and Africa respectively in FY2012.
FY2007 FY2008 FY2009 FY2010 FY2011 FY2012
Asia & Middle East 2,074.4 3,174.5 3,505.1 4,752.3 5,192.5 6,612.5
Africa 1,409.1 1,781.8 1,659.7 1,717.6 2,697.3 3,226.4
Europe 1,271.1 2,067.7 2,341.1 2,400.5 3,711.3 3,937.4
Americas 700.9 1,087.9 1,082.0 1,584.6 4,202.3 3,317.5
Total 5,455.5 8,111.9 8,587.9 10,455.0 15,803.4 17,093.8
Asia & Middle East remain the largest market for sales while Europe’s share of sales overtook the Americas to become the second largest, accounting for 23.0% of sales in FY2012.
Sourcing Volume by Region (’000 metric tonnes)
Number of Customers Top 25 Customers’ Share of Total Sales Revenue (%)
Sales Revenue by Region (S$million)
FY2007 FY2008 FY2009 FY2010 FY2011 FY2012 AVERAGE
23.8 18.2 22.5 30.8 31.7 23.7 25.1%
Our share of revenues from top 25 customers averaged 25.1% over the six-year period.
FY2007 FY2008 FY2009 FY2010 FY2011 FY2012 CAGR
4,030 6,500 10,620 11,100 11,600 12,300 25.0%
Total number of customers increased from 4,030 in FY2007 to 12,300 in FY2012 as we continued to expand and diversify our customer base.
FY2007 FY2008 FY2009 FY2010 FY2011 FY2012
4,030
6,500
10,62011,100
11,600 12,300
2,000
4,000
6,000
8,000
10,000
12,000
14,000
FY2007 FY2008 FY2009 FY2010 FY2011 FY2012
23.8
18.2
22.5
30.8 31.7
23.7
5
10
15
20
25
30
35
FY2007 FY2008 FY2009 FY2010 FY2011 FY2012
3,773
10,675
2,000
4,000
6,000
8,000
10,000
12,000
4,926 5,721
7,006
8,452
FY2007 FY2008 FY2009 FY2010 FY2011 FY2012
5,455.5
17,093.8
8,111.9 8,587.9
10,455.0
2,000
4,000
6,000
8,000
10,000
12,000
14,000
16,000
18,000
15,803.4
86
General Information
IntroductionOur Annual Report and Accounts for FY2012 present an overview of the Company (Olam International Limited) and the Group (Olam International Limited and its subsidiaries) management’s discussion of the Company’s financial performance in FY2012, compared to that in prior years and our plans and strategies for the future. This guide is intended to walk you through the basics of how to read our Annual Report and Accounts for FY2012.
Business Segmentation and ReportingWe organise the products and services which we supply into five reporting segments – Edible Nuts, Spices & Beans; Confectionery & Beverage Ingredients; Food Staples & Packaged Foods; Industrial Raw Materials and Commodity Financial Services. The table below shows the mix of products and services within each segment.
Business Segment Products
Edible Nuts, Spices & Beans
CashewsPeanutsAlmondsHazelnutsSpices & Vegetable IngredientsSesame Beans (Pulses, Lentils & Peas)
Confectionery & Beverage Ingredients
CocoaCoffeeSheanuts
Food Staples & Packaged Foods
RiceSugar and Natural SweetenersGrains (Wheat, Barley, Corn)Palm ProductsDairy Products Packaged Foods
Industrial Raw Materials
Cotton WoolWood ProductsRubberAgri Inputs (Fertiliser)Special Economic Zone (SEZ) Project
Business Segment Products
Commodity Financial Services
Market MakingRisk Management SolutionsCommodity Funds Management
Additional information is provided on the progress we made on the various value chain initiatives across three value chain segments as follows:
Value Chain Segment Value Chain Activity
Supply Chain & Value Added Services (VAS)
This segment includes all activities relating to Origination, Sourcing, Primary Processing, Logistics, Trading and Marketing (including VAS) and Risk Management of agricultural products and the CFS business.
Upstream This segment includes all activities relating to Farming (annual row crops), Plantations (perennial tree crops), Dairy Farming and Forest Concessions.
Midstream & Downstream
This segment includes all activities relating to Secondary Processing, Contract Manufacturing, Branded Distribution and Private Label activities, and the SEZ project.
Background to Analysing Financial Statements One of the key drivers of our profitability is the volume of products supplied. Given our integration and end-to-end supply chain capabilities, we seek to match the supply of our products with demand from our customers. The volume of agricultural products we supply is largely within our control and is a function of the extent of our supply chain infrastructure in the origins (producing countries) and the markets (consuming countries). Volumes include proportionate share of volumes from jointly controlled entities and associates.
We measure and track our profitability in terms of Gross Contribution (GC) and Net Contribution (NC) per tonne of product supplied.
General Information on Olam International Limited Annual Report 2012 for the Financial Year Ended 30 June 2012 (FY2012)
87
GC is calculated as the total revenue from the sale of goods and services plus other income and share of gains or losses from jointly controlled entities and associates, less interest income, cost of goods sold (raw material costs plus other direct costs, including packing costs etc.), shipping and logistics expenses, claims and commissions, net gains or losses from changes in fair value of biological assets, net measurement of derivative instruments, non-controlling interests and non-recurring exceptional items which were recorded for the year.
For the purposes of determining NC, finance costs excluding interest on debt for fixed capital investments, net of interest income are reduced from the GC.
For analysing the performance of the Group, our share of profits from jointly controlled entities and associates has been included in the GC and NC. The proportionate share of volumes has also been included for the calculation of GC and NC per tonne.
For every transaction, we target a minimum NC per tonne of product supplied based on the investment, risks, complexities and value added services that we provide to our customers to meet their specific requirements. We are focused on enhancing these margins by providing value-added services such as vendor managed inventory solutions, organic certification, traceability guarantees, fair trade produce certification, customised grades and quality, processed ingredients supply, proprietary market intelligence and risk management solutions.
We believe that reporting profit measures of GC and NC provide valuable additional information on our underlying earnings trends to our shareholders. The terms GC and NC are not defined terms under the Singapore Financial Reporting Standards (FRS) and may not, therefore, be comparable to similarly-titled profit measurements reported by other companies. These measures are not intended to be substitutes for, or superior to, FRS measurements of profit. GC and NC are key metrics used by management to measure the progress of Olam in the execution of its strategic plan. We believe that the communication and explanation of the GC and NC profit measures are essential in order for readers of Olam’s financial statements to understand fully the performance of the Company and the Group.
DisclaimerCertain sections of our Annual Report and Accounts for FY2012 have been audited. The sections that have been audited are set out on pages 90 to 183. Readers should note that legislation in Singapore governing the preparation and dissemination of financial statements may differ from legislation in other jurisdictions.
Except where you are a shareholder, this material is provided for information purposes only and is not, in particular, intended to confer any legal rights on you. This Annual Report and Accounts do not constitute an invitation to invest in the Company’s shares. Any decision you make by relying on this information is solely your responsibility. The information given is as of the dates specified, is not updated and any forward-looking statement is made subject to the reservation specified in the following paragraph.
Cautionary statementThis document may contain forward-looking statements. Words such as ‘expects’, ‘anticipate’, ‘intends’ or the negative use of these terms and other similar expressions of future performance or results and their negatives are intended to identify such forward-looking statements. These forward-looking statements are based upon current expectations and assumptions regarding anticipated developments and other factors affecting the Group. They are not historical facts, nor are they guarantees of future performance.
Because these forward-looking statements involve risks and uncertainties, there are important factors that could cause actual reports to differ materially from those expressed or implied by these forward-looking statements, including among others, competitive pricing and activity, demand levels for the products that we supply, cost variances, the ability to maintain and manage key supplier and customer relationships, supply chain sources, currency values, interest rate, the ability to integrate acquisitions and complete planned divestitures, physical risks, environmental risk, the ability to manage regulatory, tax and legal matters and resolve pending matters within current estimates, legislative, fiscal and regulatory development, political, economic and social conditions in the geographic markets where the Group operates and new or changed priority of the Company’s or its subsidiaries’ Boards. Further details of potential risks and uncertainties affecting the Group are described in the Group’s prospectus dated 31 January 2005 and filings of information memorandums and circulars with the Singapore Exchange (SGX).
These forward-looking statements speak only as of the date of this document. Except as required by any applicable law or regulation, the Group expressly disclaims any obligation or undertaking to release publicly any updates or revision to any forward-looking statements contained herein to reflect any change in the Group’s expectations with regard thereto or any change in events, conditions or circumstances on which any such statement is based.

88
Hazelnuts in Turkey
89
Olam International Limitedand Subsidiary CompaniesAnnual Financial Statements30 June 2012
Contents
90 Report of the Directors
96 Statement by the Directors
97 Independent Auditor’s Report
98 Profit and Loss Accounts
99 Statements of Comprehensive Income
100 Balance Sheets
101 Statements of Changes in Equity
105 Consolidated Cash Flow Statement
106 Notes to the Financial Statements
184 Substantial Shareholders
185 Statistics of Shareholdings
186 Notice of Annual General Meeting
191 Proxy Form
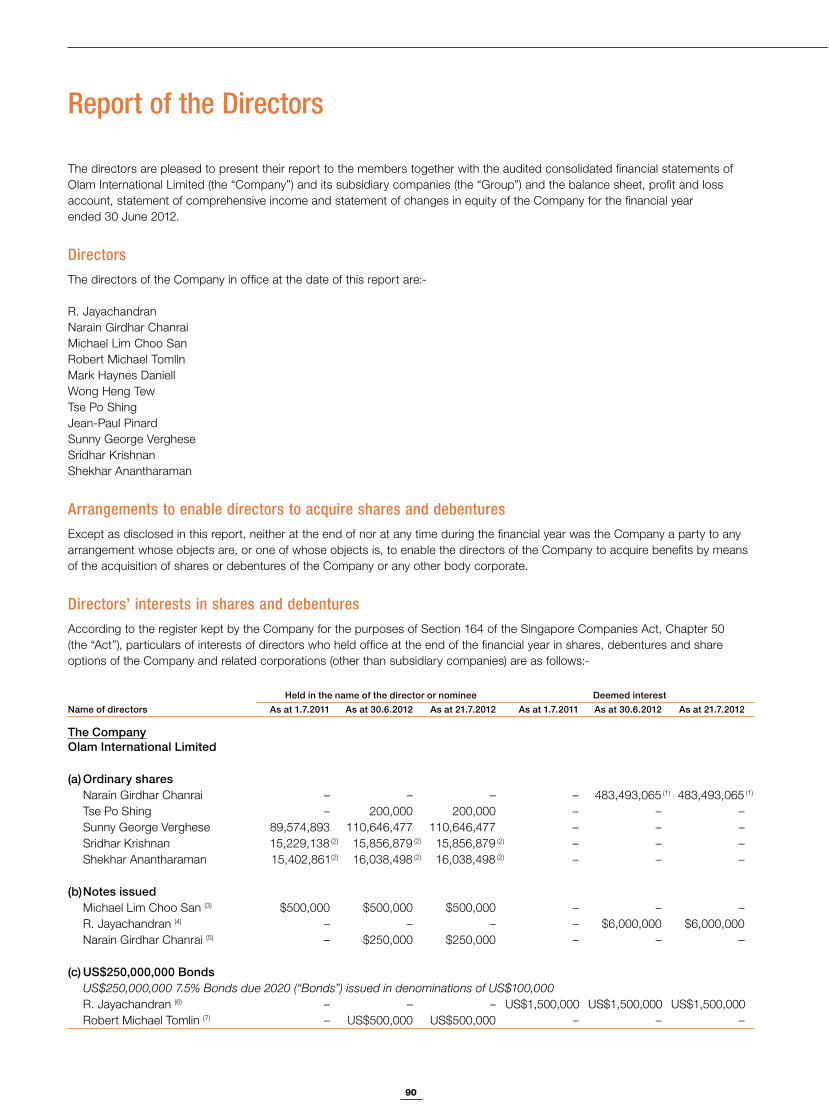
90
Report of the Directors
The directors are pleased to present their report to the members together with the audited consolidated financial statements of Olam International Limited (the “Company”) and its subsidiary companies (the “Group”) and the balance sheet, profit and loss account, statement of comprehensive income and statement of changes in equity of the Company for the financial year ended 30 June 2012.
DirectorsThe directors of the Company in office at the date of this report are:-
R. JayachandranNarain Girdhar ChanraiMichael Lim Choo SanRobert Michael TomlinMark Haynes DaniellWong Heng Tew Tse Po ShingJean-Paul PinardSunny George VergheseSridhar KrishnanShekhar Anantharaman
Arrangements to enable directors to acquire shares and debenturesExcept as disclosed in this report, neither at the end of nor at any time during the financial year was the Company a party to any arrangement whose objects are, or one of whose objects is, to enable the directors of the Company to acquire benefits by means of the acquisition of shares or debentures of the Company or any other body corporate.
Directors’ interests in shares and debenturesAccording to the register kept by the Company for the purposes of Section 164 of the Singapore Companies Act, Chapter 50 (the “Act”), particulars of interests of directors who held office at the end of the financial year in shares, debentures and share options of the Company and related corporations (other than subsidiary companies) are as follows:-
Held in the name of the director or nominee Deemed interestName of directors As at 1.7.2011 As at 30.6.2012 As at 21.7.2012 As at 1.7.2011 As at 30.6.2012 As at 21.7.2012
The CompanyOlam International Limited
(a) Ordinary sharesNarain Girdhar Chanrai – – – – 483,493,065 (1) 483,493,065 (1)
Tse Po Shing – 200,000 200,000 – – –Sunny George Verghese 89,574,893 110,646,477 110,646,477 – – –Sridhar Krishnan 15,229,138 (2) 15,856,879 (2) 15,856,879 (2) – – –Shekhar Anantharaman 15,402,861(2) 16,038,498 (2) 16,038,498 (2) – – –
(b) Notes issued Michael Lim Choo San (3) $500,000 $500,000 $500,000 – – –R. Jayachandran (4) – – – – $6,000,000 $6,000,000Narain Girdhar Chanrai (5) – $250,000 $250,000 – – –
(c) US$250,000,000 BondsUS$250,000,000 7.5% Bonds due 2020 (“Bonds”) issued in denominations of US$100,000R. Jayachandran (6) – – – US$1,500,000 US$1,500,000 US$1,500,000Robert Michael Tomlin (7) – US$500,000 US$500,000 – – –
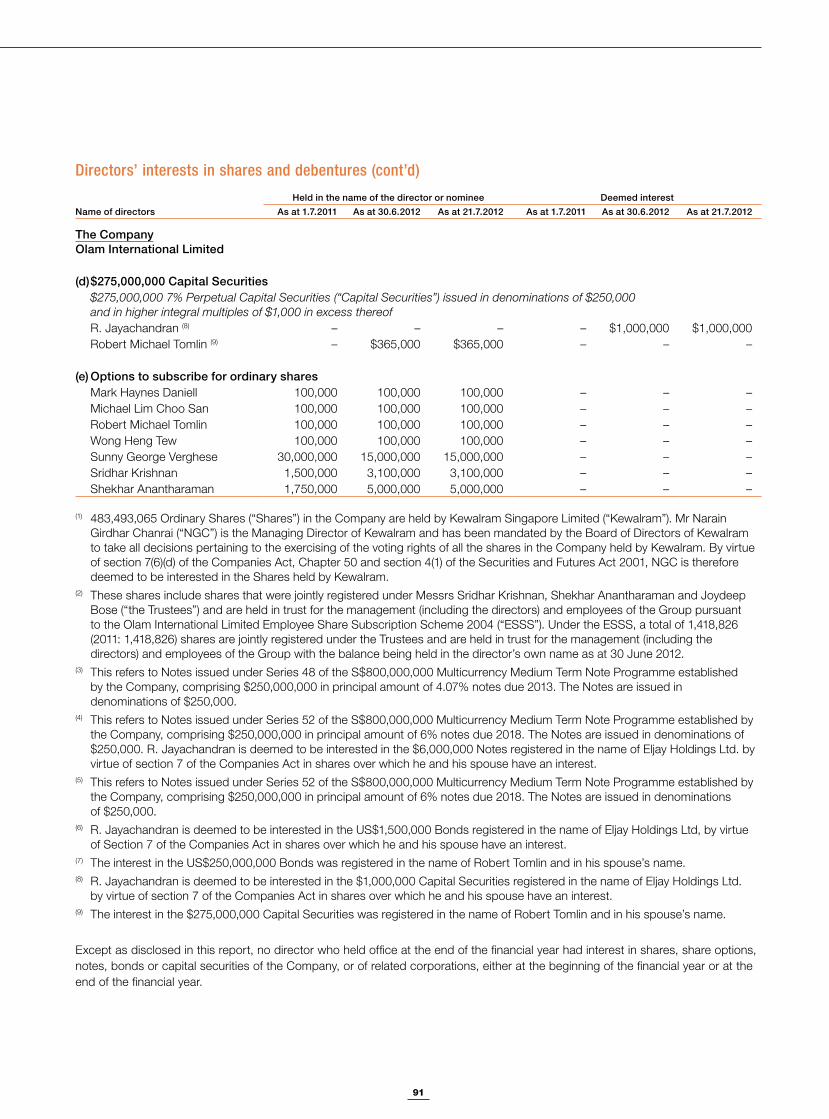
91
Directors’ interests in shares and debentures (cont’d)
Held in the name of the director or nominee Deemed interestName of directors As at 1.7.2011 As at 30.6.2012 As at 21.7.2012 As at 1.7.2011 As at 30.6.2012 As at 21.7.2012
The CompanyOlam International Limited
(d) $275,000,000 Capital Securities$275,000,000 7% Perpetual Capital Securities (“Capital Securities”) issued in denominations of $250,000 and in higher integral multiples of $1,000 in excess thereofR. Jayachandran (8) – – – – $1,000,000 $1,000,000Robert Michael Tomlin (9) – $365,000 $365,000 – – –
(e) Options to subscribe for ordinary sharesMark Haynes Daniell 100,000 100,000 100,000 – – –Michael Lim Choo San 100,000 100,000 100,000 – – –Robert Michael Tomlin 100,000 100,000 100,000 – – –Wong Heng Tew 100,000 100,000 100,000 – – –Sunny George Verghese 30,000,000 15,000,000 15,000,000 – – –Sridhar Krishnan 1,500,000 3,100,000 3,100,000 – – –Shekhar Anantharaman 1,750,000 5,000,000 5,000,000 – – –
(1) 483,493,065 Ordinary Shares (“Shares”) in the Company are held by Kewalram Singapore Limited (“Kewalram”). Mr Narain Girdhar Chanrai (“NGC”) is the Managing Director of Kewalram and has been mandated by the Board of Directors of Kewalram to take all decisions pertaining to the exercising of the voting rights of all the shares in the Company held by Kewalram. By virtue of section 7(6)(d) of the Companies Act, Chapter 50 and section 4(1) of the Securities and Futures Act 2001, NGC is therefore deemed to be interested in the Shares held by Kewalram.
(2) These shares include shares that were jointly registered under Messrs Sridhar Krishnan, Shekhar Anantharaman and Joydeep Bose (“the Trustees”) and are held in trust for the management (including the directors) and employees of the Group pursuant to the Olam International Limited Employee Share Subscription Scheme 2004 (“ESSS”). Under the ESSS, a total of 1,418,826 (2011: 1,418,826) shares are jointly registered under the Trustees and are held in trust for the management (including the directors) and employees of the Group with the balance being held in the director’s own name as at 30 June 2012.
(3) This refers to Notes issued under Series 48 of the S$800,000,000 Multicurrency Medium Term Note Programme established by the Company, comprising $250,000,000 in principal amount of 4.07% notes due 2013. The Notes are issued in denominations of $250,000.
(4) This refers to Notes issued under Series 52 of the S$800,000,000 Multicurrency Medium Term Note Programme established by the Company, comprising $250,000,000 in principal amount of 6% notes due 2018. The Notes are issued in denominations of $250,000. R. Jayachandran is deemed to be interested in the $6,000,000 Notes registered in the name of Eljay Holdings Ltd. by virtue of section 7 of the Companies Act in shares over which he and his spouse have an interest.
(5) This refers to Notes issued under Series 52 of the S$800,000,000 Multicurrency Medium Term Note Programme established by the Company, comprising $250,000,000 in principal amount of 6% notes due 2018. The Notes are issued in denominations of $250,000.
(6) R. Jayachandran is deemed to be interested in the US$1,500,000 Bonds registered in the name of Eljay Holdings Ltd, by virtue of Section 7 of the Companies Act in shares over which he and his spouse have an interest.
(7) The interest in the US$250,000,000 Bonds was registered in the name of Robert Tomlin and in his spouse’s name.(8) R. Jayachandran is deemed to be interested in the $1,000,000 Capital Securities registered in the name of Eljay Holdings Ltd.
by virtue of section 7 of the Companies Act in shares over which he and his spouse have an interest.(9) The interest in the $275,000,000 Capital Securities was registered in the name of Robert Tomlin and in his spouse’s name.
Except as disclosed in this report, no director who held office at the end of the financial year had interest in shares, share options, notes, bonds or capital securities of the Company, or of related corporations, either at the beginning of the financial year or at the end of the financial year.
92
Report of the Directors
Directors’ contractual benefitsExcept as disclosed in the financial statements, since the end of the previous financial year, no director of the Company has received or become entitled to receive a benefit by reason of a contract made by the Company or a related corporation with the director, or with a firm of which the director is a member, or with a company in which the director has a substantial financial interest.
Employee share subscription schemeThe Olam International Limited Employee Share Subscription Scheme 2004 (“the ESSS”) was implemented on 26 October 2004. The ESSS comprised 73,913,044 ordinary shares of $0.23 per share, which were fully allotted and issued by the Company.
Olam employee share option schemeThe Olam Employee Share Option Scheme (“the ESOS”) was approved by the shareholders on 4 January 2005 at the Extraordinary General Meeting of the Company. The ESOS Rules were amended on 29 October 2008 at the Extraordinary General Meeting of the Company. Under the amended rules, the directors (including Non-Executive Directors and Independent Directors) and employees of the Group are eligible to participate in the ESOS, and all subsequent options issued to the Group’s employees and Executive Directors shall have a life of ten years instead of five. For Options granted to the Company’s Non-Executive Directors and Independent Directors, the Option Period shall be no longer than five years. Controlling Shareholders and associates of Controlling Shareholders are not eligible to participate in the ESOS.
The objectives of the ESOS are to provide an opportunity for employees of the Group, directors (including Non-Executive Directors and Independent Directors) or full-time employees of the Company, to participate in the equity of the Company so as to motivate them to greater dedication, loyalty and a higher standard of performance, and to give recognition to employees of the Group who have contributed to the success and development of the Company and/or the Group.
Subject to any adjustment as stated in the ESOS, the subscription price for each share in respect of which a Market Price Option is exercisable shall be at a price (the “Market Price”) equal to the average of the last dealt prices for a share, as determined by reference to the daily official list or any other publication published by SGX-ST, for the five consecutive Market days immediately preceding the offering date of that option, rounded up to the nearest whole cent.
Each Option shall be exercisable, in whole or in part, during the option period as follows:-
(a) in the case of a Market Price Option, a period commencing after the first anniversary of the Offering Date and expiring on the tenth anniversary of such Offering Date.
(b) in the case of an Incentive Option, a period commencing after the second anniversary of the Offering Date and expiring on the tenth anniversary of such Offering Date.
It is provided that, in the case of Non-Executive Directors or Independent Directors, such option period shall not extend beyond the fifth anniversary of such offering date or any maximum period that may be prescribed by law.
In the event of an Option being exercised in part, the balance of the Option not exercised shall continue to be exercisable until such time as it lapses in accordance with the ESOS.
As at the date of this report, the ESOS is administered by the Human Resource & Compensation Committee, which comprises the following directors:-
Mark Haynes Daniell – ChairmanR. JayachandranWong Heng TewJean-Paul Pinard
During the financial year ended 30 June 2012, there were 15,200,000 ordinary shares issued pursuant to the exercise of options granted under the ESOS.
93
Olam employee share option scheme (cont’d)Details of all the options to subscribe for ordinary shares of the Company pursuant to the ESOS outstanding as at 30 June 2012 are as follows:-
Expiry date Exercise price ($) Number of options
2 July 2012 3.14 1,099,0005 September 2012 3.03 2,000,0008 October 2012 3.14 750,00029 October 2012 3.14 400,0009 January 2013 2.89 1,315,00012 June 2013 2.65 933,00021 July 2019 2.28 43,850,00017 February 2020 2.35 15,000,00023 July 2020 2.64 4,975,00017 December 2020 3.10 2,080,00014 March 2021 2.70 2,105,00030 December 2021 2.16 6,230,00015 June 2022 1.76 65,000,000Total 145,737,000
The details of options granted to the directors of the Group, are as follows:-
Name of Participant
Options granted during
financial year under review
Exercise Price for options
granted during the financial year
under review
Aggregate options granted
since thecommencement
of the scheme to the end of
financial year under review
Aggregateoptions exercised
since the commencement
of the schemeto the end of
financial yearunder review
Aggregate options
outstanding as at the end
of financial year under review
Mark Haynes Daniell – – 100,000 – 100,000Michael Lim Choo San – – 100,000 – 100,000Robert Michael Tomlin – – 100,000 – 100,000Wong Heng Tew – – 100,000 – 100,000Sunny George Verghese – – 30,000,000 15,000,000 15,000,000Sridhar Krishnan 1,600,000 $1.76 3,900,000 800,000 3,100,000Shekhar Anantharaman 3,250,000 $1.76 5,800,000 800,000 5,000,000
The options granted to Mark Haynes Daniell, Michael Lim Choo San, Robert Michael Tomlin and Wong Heng Tew, who are Independent and Non-Executive Directors of the Company, were approved by the shareholders of the Company at the Annual General Meeting held on 29 October 2007. These options are exercisable in tranches of 25%, 35% and 40% on or after the first, second and third anniversaries of 29 October 2007. The options will expire on 29 October 2012 (five years after the date of the grant).
The 15,000,000 options granted to Sunny George Verghese in 2005 are exercisable in three equal tranches of 5,000,000 each on or after the first, second and third anniversaries respectively of the date of the admission of the Company to the official list of the SGX-ST (11 February 2005) at the exercise price of $0.62 if the vesting conditions are met. These options were exercised during the year under review. The 15,000,000 options granted to Sunny George Verghese in 2010 are exercisable in three equal tranches of 5,000,000 each on or after the first, second and third anniversaries of the grant date (17 February 2010) at the exercise price of $2.35. The options will expire ten years after the date of grant.
The 1,500,000 options granted to Sridhar Krishnan and 1,750,000 options granted to Shekhar Anantharaman in 2009 are exercisable in tranches of 25% and 75% at the end of the third anniversary and fourth anniversary from the date of grant (21 July 2009) at the exercise price of $2.28 if the vesting conditions are met. The 1,600,000 options granted to Sridhar Krishnan and 3,250,000 options granted to Shekhar Anantharaman in 2012 are exercisable in tranches of 25% and 75% at the end of the third and fourth anniversary respectively from the date of grant (15 June 2012) at the exercise price of $1.76 if the vesting conditions are met. The options will expire ten years after the date of grant.
94
Report of the Directors
Olam employee share option scheme (cont’d)Apart from that which is disclosed above, no directors or employees of the Group received 5% or more of the total number of options available under the ESOS.
The options granted by the Company do not entitle the holder of the options, by virtue of such holding, to any right to participate in any share issue of any other company.
There were no Incentive Options granted from commencement of ESOS to the financial year end under review.
There were no options granted at a discount.
There were no options granted to controlling shareholders of the Company and their associates.
Invenio Equity Participation Scheme Invenio Holdings Pte. Ltd. (“Invenio”), a subsidiary of the Company, had implemented the Invenio Equity Participation Scheme (the “Invenio Equity Scheme”) which was approved and adopted by the shareholders of Invenio at an Extraordinary General Meeting held on 13 January 2011.
The Invenio Equity Scheme was set up to incentivise and reward selected eligible employees and give participants an opportunity to have a personal equity interest in Invenio and, amongst other objectives, motivate participants to optimise their performance standards and efficiency and to maintain a high level of contribution to Invenio and its subsidiaries (the “Invenio Group”).
Participation in the Scheme is restricted to directors and employees of the Invenio Group (including associated companies over which Invenio has control), and employees of the Company or its subsidiaries who have been seconded or deputed to Invenio and who hold an executive position in Invenio. Controlling shareholders of the Company and their associates are not eligible to participate in the Invenio Equity Scheme.
Employees selected to participate receive an initial allotment of Invenio shares for which they will pay a fixed multiple of then-prevailing book value at the relevant time, as specified in the Invenio Equity Scheme. Subsequently, a portion of up to 50% of any cash or other incentive due to them as employees under any performance-based bonus or incentive scheme initiated by the Invenio Group for its employees will be paid to them in the form of Invenio shares allotted to them, valued at a fixed multiple of the then-prevailing book value at the relevant time, in accordance with the Invenio Equity Scheme.
The shares will be ordinary shares in Invenio, ranking pari passu with other ordinary shares in Invenio’s issued share capital in respect of all entitlements, including dividends or other distributions, save that the Invenio Equity Scheme provides for certain obligations and restrictions on transfer of the shares by Participants.
The details of the awards granted under the Scheme are as follows:-
Year of Award No. of Holders No. of Shares
2011 18 2,670,000
During the year, Invenio purchased 105,000 shares from two (2) employees under the Scheme and held them as treasury shares. There were no new shares granted during the financial year under review.
Audit and Compliance CommitteeThe Audit and Compliance Committee (the “ACC”) comprises four Independent Directors and a Non-Executive Director. The members of the ACC are Mr. Michael Lim Choo San (Chairman), Mr. Robert Michael Tomlin, Mr. Mark Haynes Daniell, Mr. Wong Heng Tew and Mr. Narain Girdhar Chanrai. The ACC performed the functions specified in Section 201B of the Singapore Companies Act, the Singapore Code of Corporate Governance and the Listing Manual of the Singapore Exchange.
The ACC held six meetings during the year under review. The ACC met with the Company’s external and internal auditors to discuss the scope of their work, the results of their examination and their evaluation of the Company’s internal accounting control systems.
95
Audit and Compliance Committee (cont’d)The ACC reviewed the following:-
accounting controls and the cooperation given by the Company’s management to the external and internal auditors;
for adoption;
carried out by the internal auditors;
programmes, and any reports received from regulators;
Further, the ACC
groups believed should be discussed privately with the ACC;
compensation for the renewed period be approved; and
considered appropriate.
The ACC had full access and cooperation of the management and full discretion to invite any director or executive officer to attend its meetings.
The ACC also reviewed the cost effectiveness of the audit conducted by the external auditors and the nature and extent of all non-audit services performed by the external auditors, and has confirmed that such services would not affect their independence.
The ACC had during the year reviewed the external audit services provided. The ACC made its recommendations to the Board and the Board determined that Ernst & Young LLP will be re-appointed as auditors of the Company at the forthcoming Annual General Meeting.
Further details regarding the functions of the ACC are disclosed in the Report on Corporate Governance in the Company’s Annual Report to shareholders.
AuditorsErnst & Young LLP have expressed their willingness to accept re-appointment as auditors.
On behalf of the Board,
R. JayachandranDirector
Sunny George VergheseDirector
Singapore28 September 2012
96
Statement by the Directors
We, R. Jayachandran and Sunny George Verghese, being two of the directors of Olam International Limited, do hereby state that, in the opinion of the directors:-
(i) the accompanying balance sheets, profit and loss accounts, statements of comprehensive income, statements of changes in equity and consolidated cash flow statement together with notes thereto are drawn up so as to give a true and fair view of the state of affairs of the Group and of the Company as at 30 June 2012 and the results of the business, changes in equity of the Group and of the Company and cash flows of the Group for the financial year ended on that date; and
(ii) at the date of this statement, there are reasonable grounds to believe that the Company will be able to pay its debts as and when they fall due.
On behalf of the Board,
R. JayachandranDirector
Sunny George VergheseDirector
Singapore28 September 2012
97
Independent Auditor’s ReportFor the financial year ended 30 June 2012 To the Members of Olam International Limited
Report on the financial statementsWe have audited the accompanying financial statements of Olam International Limited (the “Company”) and its subsidiaries (collectively, the “Group”) set out on pages 98 to 183, which comprise the balance sheets of the Group and the Company as at 30 June 2012, profit and loss accounts, statements of comprehensive income and statements of changes in equity of the Group and the Company and consolidated cash flow statement of the Group for the year then ended, and a summary of significant accounting policies and other explanatory information.
Management’s responsibility for the financial statements
Management is responsible for the preparation of financial statements that give a true and fair view in accordance with the provisions of the Singapore Companies Act, Chapter 50 (the “Act”) and Singapore Financial Reporting Standards, and for devising and maintaining a system of internal accounting controls sufficient to provide a reasonable assurance that assets are safeguarded against loss from unauthorised use or disposition; and transactions are properly authorised and that they are recorded as necessary to permit the preparation of true and fair profit and loss accounts and balance sheets and to maintain accountability of assets.
Auditor’s responsibility
Our responsibility is to express an opinion on these financial statements based on our audit. We conducted our audit in accordance with Singapore Standards on Auditing. Those standards require that we comply with ethical requirements and plan and perform the audit to obtain reasonable assurance about whether the financial statements are free from material misstatement.
An audit involves performing procedures to obtain audit evidence about the amounts and disclosures in the financial statements. The procedures selected depend on the auditor’s judgement, including the assessment of the risks of material misstatement of the financial statements, whether due to fraud or error. In making those risk assessments, the auditor considers internal control relevant to the entity’s preparation of the financial statements that give a true and fair view in order to design audit procedures that are appropriate in the circumstances, but not for the purpose of expressing an opinion on the effectiveness of the entity’s internal control. An audit also includes evaluating the appropriateness of accounting policies used and the reasonableness of accounting estimates made by management, as well as evaluating the overall presentation of the financial statements.
We believe that the audit evidence we have obtained is sufficient and appropriate to provide a basis for our audit opinion.
Opinion
In our opinion, the consolidated financial statements of the Group and the balance sheet, profit and loss account, statement of comprehensive income and statement of changes in equity of the Company are properly drawn up in accordance with the provisions of the Act and Singapore Financial Reporting Standards so as to give a true and fair view of the state of affairs of the Group and of the Company as at 30 June 2012 and of the results and changes in equity of the Group and the Company and cash flows of the Group for the year ended on that date.
Report on other legal and regulatory requirements
In our opinion, the accounting and other records required by the Act to be kept by the Company and by those subsidiaries incorporated in Singapore of which we are the auditors have been properly kept in accordance with the provisions of the Act.
Ernst & Young LLPPublic Accountants and Certified Public AccountantsSingapore 28 September 2012
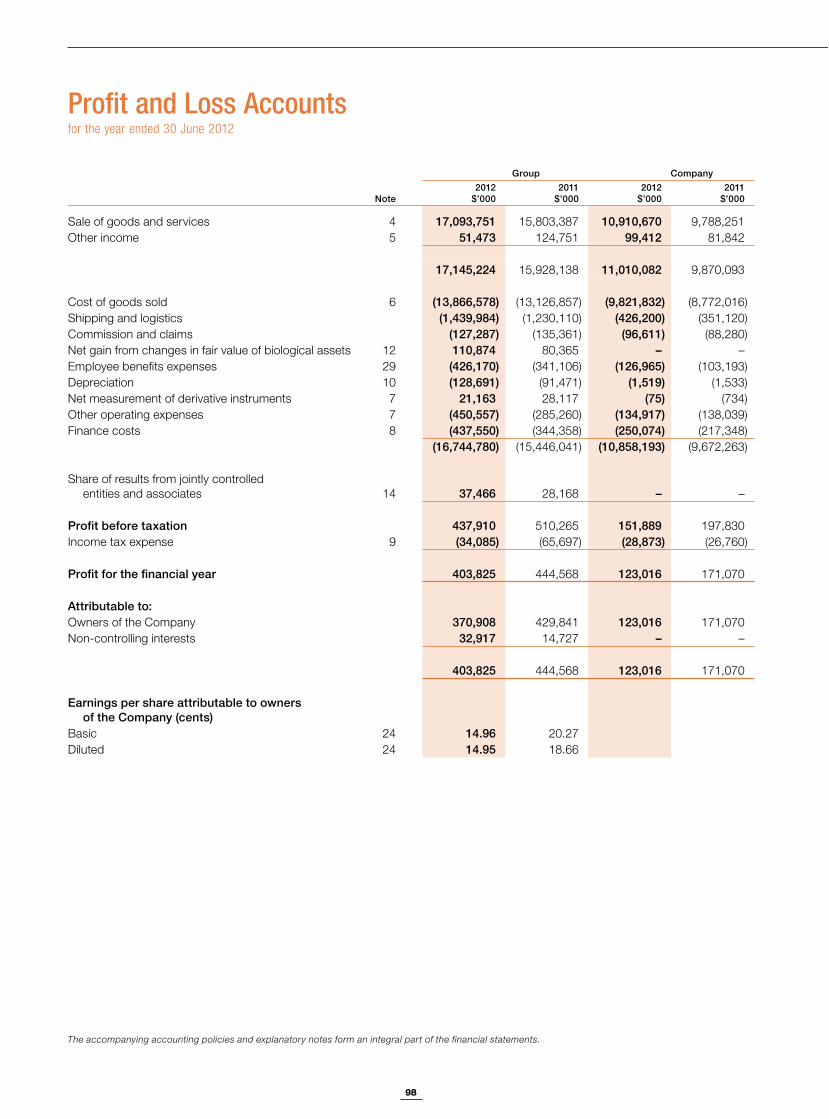
98
Profit and Loss Accountsfor the year ended 30 June 2012
The accompanying accounting policies and explanatory notes form an integral part of the financial statements.
Group Company
Note 2012 $’000
2011 $’000
2012 $’000
2011$’000
Sale of goods and services 4 17,093,751 15,803,387 10,910,670 9,788,251Other income 5 51,473 124,751 99,412 81,842
17,145,224 15,928,138 11,010,082 9,870,093
Cost of goods sold 6 (13,866,578) (13,126,857) (9,821,832) (8,772,016)Shipping and logistics (1,439,984) (1,230,110) (426,200) (351,120)Commission and claims (127,287) (135,361) (96,611) (88,280)Net gain from changes in fair value of biological assets 12 110,874 80,365 – –Employee benefits expenses 29 (426,170) (341,106) (126,965) (103,193)Depreciation 10 (128,691) (91,471) (1,519) (1,533)Net measurement of derivative instruments 7 21,163 28,117 (75) (734)Other operating expenses 7 (450,557) (285,260) (134,917) (138,039)Finance costs 8 (437,550) (344,358) (250,074) (217,348)
(16,744,780) (15,446,041) (10,858,193) (9,672,263)
Share of results from jointly controlled entities and associates 14 37,466 28,168 – –
Profit before taxation 437,910 510,265 151,889 197,830Income tax expense 9 (34,085) (65,697) (28,873) (26,760)
Profit for the financial year 403,825 444,568 123,016 171,070
Attributable to:Owners of the Company 370,908 429,841 123,016 171,070Non-controlling interests 32,917 14,727 – –
403,825 444,568 123,016 171,070
Earnings per share attributable to owners of the Company (cents)
Basic 24 14.96 20.27Diluted 24 14.95 18.66
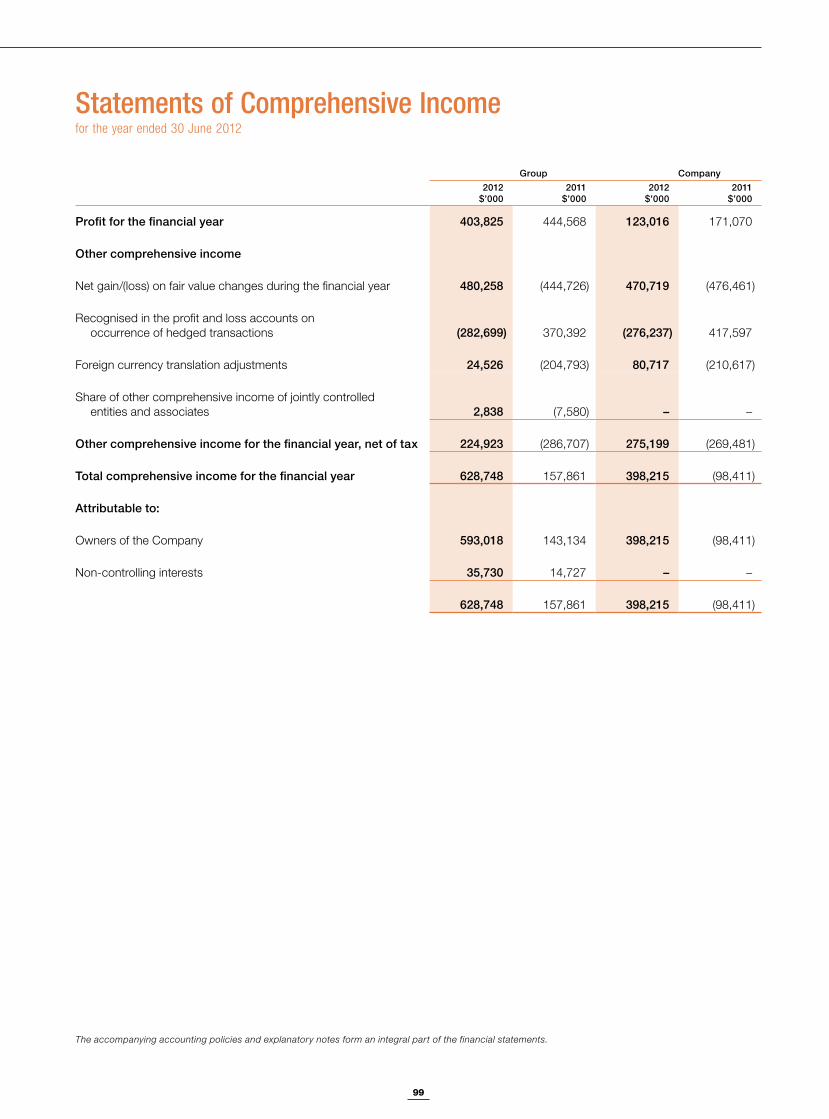
99
Statements of Comprehensive Income for the year ended 30 June 2012
The accompanying accounting policies and explanatory notes form an integral part of the financial statements.
Group Company 2012 $’000
2011 $’000
2012 $’000
2011$’000
Profit for the financial year 403,825 444,568 123,016 171,070
Other comprehensive income
Net gain/(loss) on fair value changes during the financial year 480,258 (444,726) 470,719 (476,461)
Recognised in the profit and loss accounts on occurrence of hedged transactions (282,699) 370,392 (276,237) 417,597
Foreign currency translation adjustments 24,526 (204,793) 80,717 (210,617)
Share of other comprehensive income of jointly controlled entities and associates 2,838 (7,580) – –
Other comprehensive income for the financial year, net of tax 224,923 (286,707) 275,199 (269,481)
Total comprehensive income for the financial year 628,748 157,861 398,215 (98,411)
Attributable to:
Owners of the Company 593,018 143,134 398,215 (98,411)
Non-controlling interests 35,730 14,727 – –
628,748 157,861 398,215 (98,411)
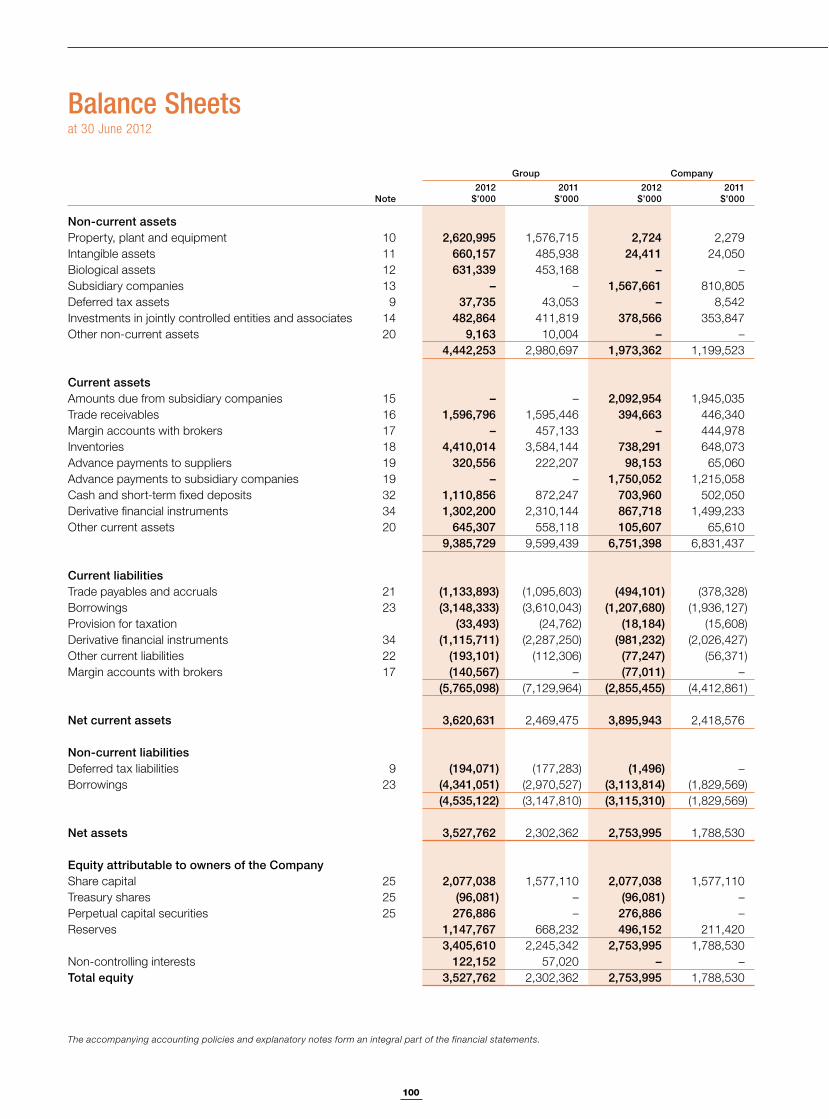
100
The accompanying accounting policies and explanatory notes form an integral part of the financial statements.
Group Company
Note 2012 $’000
2011 $’000
2012 $’000
2011$’000
Non-current assetsProperty, plant and equipment 10 2,620,995 1,576,715 2,724 2,279Intangible assets 11 660,157 485,938 24,411 24,050Biological assets 12 631,339 453,168 – –Subsidiary companies 13 – – 1,567,661 810,805Deferred tax assets 9 37,735 43,053 – 8,542Investments in jointly controlled entities and associates 14 482,864 411,819 378,566 353,847Other non-current assets 20 9,163 10,004 – –
4,442,253 2,980,697 1,973,362 1,199,523
Current assetsAmounts due from subsidiary companies 15 – – 2,092,954 1,945,035Trade receivables 16 1,596,796 1,595,446 394,663 446,340Margin accounts with brokers 17 – 457,133 – 444,978Inventories 18 4,410,014 3,584,144 738,291 648,073Advance payments to suppliers 19 320,556 222,207 98,153 65,060Advance payments to subsidiary companies 19 – – 1,750,052 1,215,058Cash and short-term fixed deposits 32 1,110,856 872,247 703,960 502,050Derivative financial instruments 34 1,302,200 2,310,144 867,718 1,499,233Other current assets 20 645,307 558,118 105,607 65,610
9,385,729 9,599,439 6,751,398 6,831,437
Current liabilitiesTrade payables and accruals 21 (1,133,893) (1,095,603) (494,101) (378,328)Borrowings 23 (3,148,333) (3,610,043) (1,207,680) (1,936,127)Provision for taxation (33,493) (24,762) (18,184) (15,608)Derivative financial instruments 34 (1,115,711) (2,287,250) (981,232) (2,026,427)Other current liabilities 22 (193,101) (112,306) (77,247) (56,371)Margin accounts with brokers 17 (140,567) – (77,011) –
(5,765,098) (7,129,964) (2,855,455) (4,412,861)
Net current assets 3,620,631 2,469,475 3,895,943 2,418,576
Non-current liabilitiesDeferred tax liabilities 9 (194,071) (177,283) (1,496) –Borrowings 23 (4,341,051) (2,970,527) (3,113,814) (1,829,569)
(4,535,122) (3,147,810) (3,115,310) (1,829,569)
Net assets 3,527,762 2,302,362 2,753,995 1,788,530
Equity attributable to owners of the CompanyShare capital 25 2,077,038 1,577,110 2,077,038 1,577,110Treasury shares 25 (96,081) – (96,081) –Perpetual capital securities 25 276,886 – 276,886 –Reserves 1,147,767 668,232 496,152 211,420
3,405,610 2,245,342 2,753,995 1,788,530Non-controlling interests 122,152 57,020 – –Total equity 3,527,762 2,302,362 2,753,995 1,788,530
Balance Sheetsat 30 June 2012
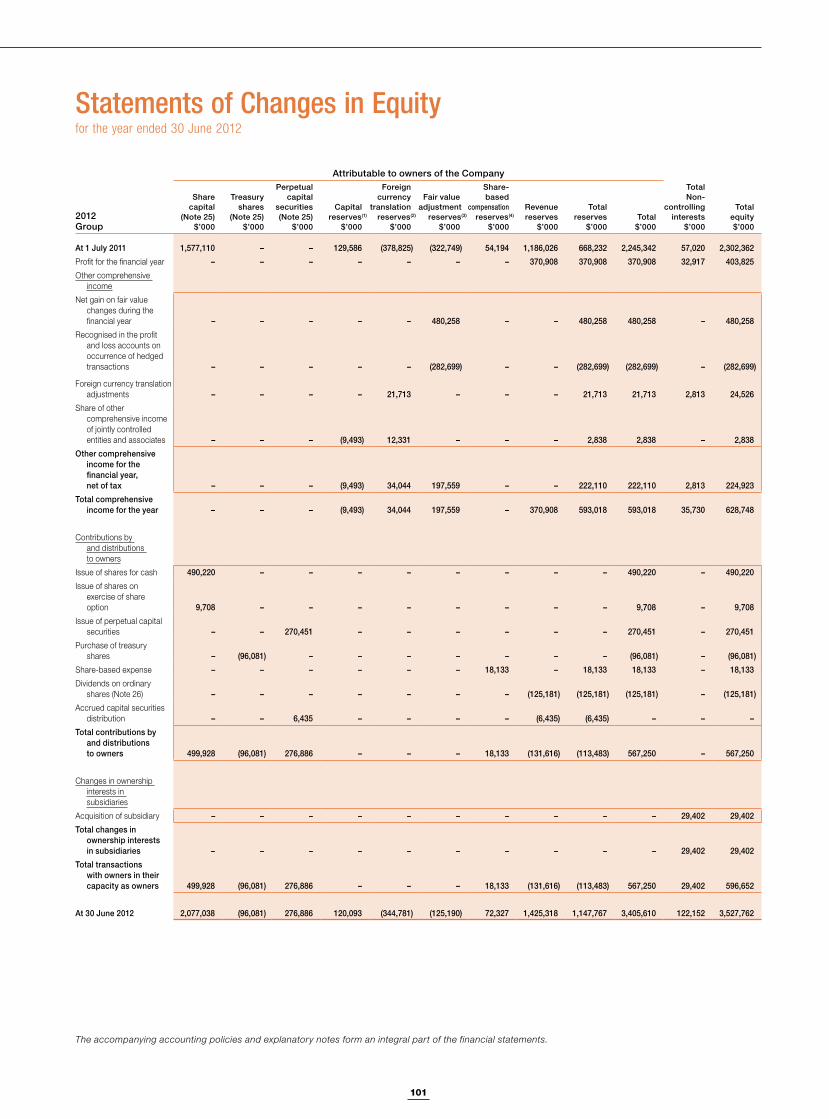
101
Attributable to owners of the Company
2012Group
Sharecapital
(Note 25)$’000
Treasuryshares
(Note 25)$’000
Perpetualcapital
securities(Note 25)
$’000
Capitalreserves(1)
$’000
Foreigncurrency
translation reserves(2)
$’000
Fair value adjustment
reserves(3)
$’000
Share-based
compensationreserves(4)
$’000
Revenue reserves
$’000
Totalreserves
$’000Total
$’000
TotalNon-
controlling interests
$’000
Totalequity$’000
At 1 July 2011 1,577,110 – – 129,586 (378,825) (322,749) 54,194 1,186,026 668,232 2,245,342 57,020 2,302,362
Profit for the financial year – – – – – – – 370,908 370,908 370,908 32,917 403,825
Other comprehensive income
Net gain on fair value changes during the financial year – – – – – 480,258 – – 480,258 480,258 – 480,258
Recognised in the profit and loss accounts on occurrence of hedged transactions – – – – – (282,699) – – (282,699) (282,699) – (282,699)
Foreign currency translation adjustments – – – – 21,713 – – – 21,713 21,713 2,813 24,526
Share of other comprehensive income of jointly controlled entities and associates – – – (9,493) 12,331 – – – 2,838 2,838 – 2,838
Other comprehensive income for the financial year, net of tax – – – (9,493) 34,044 197,559 – – 222,110 222,110 2,813 224,923
Total comprehensive income for the year – – – (9,493) 34,044 197,559 – 370,908 593,018 593,018 35,730 628,748
Contributions by and distributions to owners
Issue of shares for cash 490,220 – – – – – – – – 490,220 – 490,220
Issue of shares on exercise of share option 9,708 – – – – – – – – 9,708 – 9,708
Issue of perpetual capital securities – – 270,451 – – – – – – 270,451 – 270,451
Purchase of treasury shares – (96,081) – – – – – – – (96,081) – (96,081)
Share-based expense – – – – – – 18,133 – 18,133 18,133 – 18,133
Dividends on ordinary shares (Note 26) – – – – – – – (125,181) (125,181) (125,181) – (125,181)
Accrued capital securities distribution – – 6,435 – – – – (6,435) (6,435) – – –
Total contributions by and distributions to owners 499,928 (96,081) 276,886 – – – 18,133 (131,616) (113,483) 567,250 – 567,250
Changes in ownership interests in subsidiaries
Acquisition of subsidiary – – – – – – – – – – 29,402 29,402
Total changes in ownership interests in subsidiaries – – – – – – – – – – 29,402 29,402
Total transactions with owners in their capacity as owners 499,928 (96,081) 276,886 – – – 18,133 (131,616) (113,483) 567,250 29,402 596,652
At 30 June 2012 2,077,038 (96,081) 276,886 120,093 (344,781) (125,190) 72,327 1,425,318 1,147,767 3,405,610 122,152 3,527,762
The accompanying accounting policies and explanatory notes form an integral part of the financial statements.
Statements of Changes in Equityfor the year ended 30 June 2012
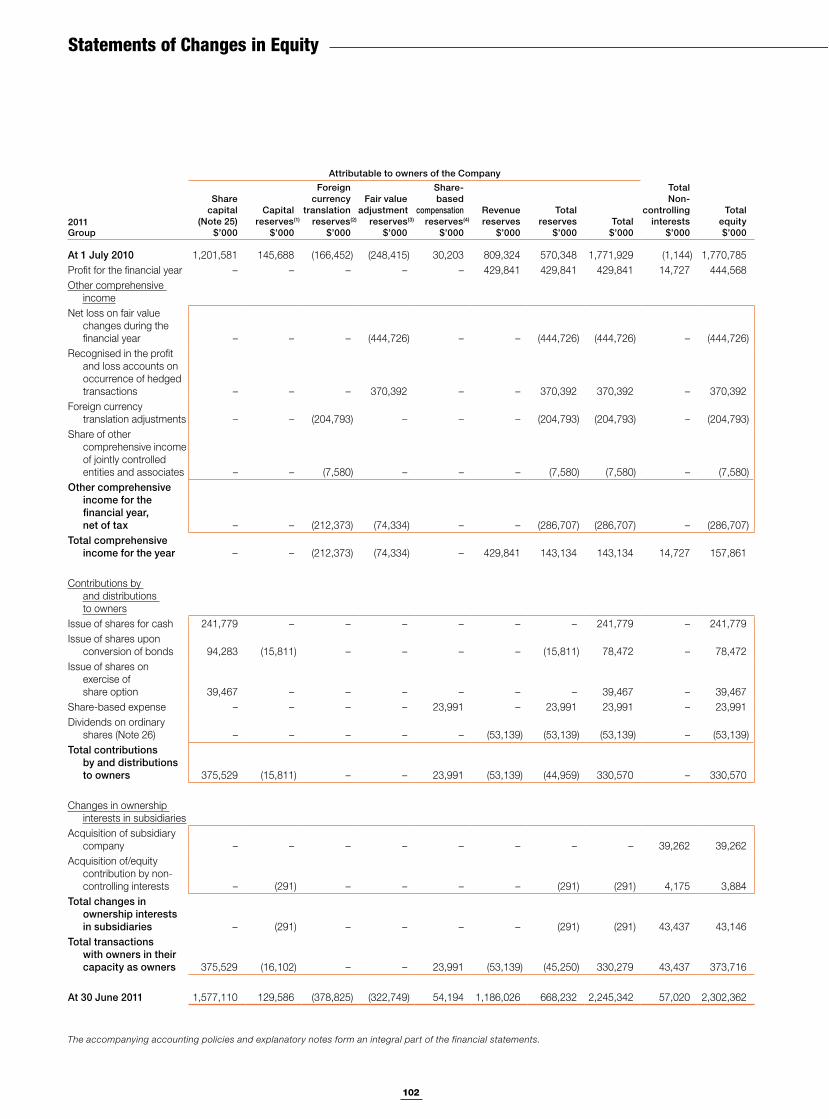
102
Attributable to owners of the Company
2011Group
Sharecapital
(Note 25)$’000
Capitalreserves(1)
$’000
Foreigncurrency
translationreserves(2)
$’000
Fair value adjustment reserves(3)
$’000
Share-based
compensationreserves(4)
$’000
Revenue reserves
$’000
Totalreserves
$’000Total
$’000
TotalNon-
controlling interests
$’000
Totalequity$’000
At 1 July 2010 1,201,581 145,688 (166,452) (248,415) 30,203 809,324 570,348 1,771,929 (1,144) 1,770,785Profit for the financial year – – – – – 429,841 429,841 429,841 14,727 444,568Other comprehensive
incomeNet loss on fair value
changes during the financial year – – – (444,726) – – (444,726) (444,726) – (444,726)
Recognised in the profit and loss accounts on occurrence of hedged transactions – – – 370,392 – – 370,392 370,392 – 370,392
Foreign currency translation adjustments – – (204,793) – – – (204,793) (204,793) – (204,793)
Share of other comprehensive income of jointly controlled entities and associates – – (7,580) – – – (7,580) (7,580) – (7,580)
Other comprehensive income for the financial year, net of tax – – (212,373) (74,334) – – (286,707) (286,707) – (286,707)
Total comprehensive income for the year – – (212,373) (74,334) – 429,841 143,134 143,134 14,727 157,861
Contributions by and distributions to owners
Issue of shares for cash 241,779 – – – – – – 241,779 – 241,779Issue of shares upon
conversion of bonds 94,283 (15,811) – – – – (15,811) 78,472 – 78,472Issue of shares on
exercise of share option 39,467 – – – – – – 39,467 – 39,467
Share-based expense – – – – 23,991 – 23,991 23,991 – 23,991Dividends on ordinary
shares (Note 26) – – – – – (53,139) (53,139) (53,139) – (53,139)Total contributions
by and distributions to owners 375,529 (15,811) – – 23,991 (53,139) (44,959) 330,570 – 330,570
Changes in ownership interests in subsidiaries
Acquisition of subsidiary company – – – – – – – – 39,262 39,262
Acquisition of/equity contribution by non-controlling interests – (291) – – – – (291) (291) 4,175 3,884
Total changes in ownership interests in subsidiaries – (291) – – – – (291) (291) 43,437 43,146
Total transactions with owners in their capacity as owners 375,529 (16,102) – – 23,991 (53,139) (45,250) 330,279 43,437 373,716
At 30 June 2011 1,577,110 129,586 (378,825) (322,749) 54,194 1,186,026 668,232 2,245,342 57,020 2,302,362
The accompanying accounting policies and explanatory notes form an integral part of the financial statements.
Statements of Changes in Equity
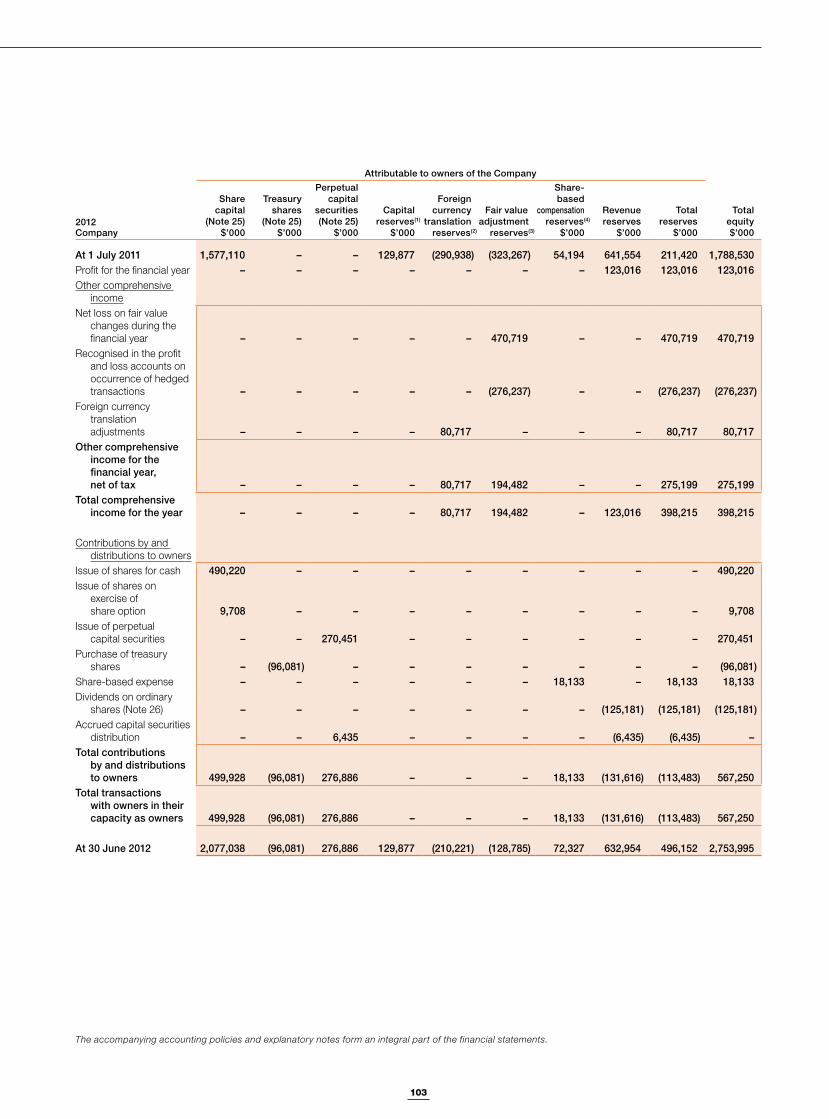
103
Attributable to owners of the Company
2012Company
Sharecapital
(Note 25)$’000
Treasuryshares
(Note 25)$’000
Perpetualcapital
securities(Note 25)
$’000
Capitalreserves(1)
$’000
Foreigncurrency
translation reserves(2)
Fair value adjustment
reserves(3)
Share-based
compensationreserves(4)
$’000
Revenue reserves
$’000
Total reserves
$’000
Total equity$’000
At 1 July 2011 1,577,110 – – 129,877 (290,938) (323,267) 54,194 641,554 211,420 1,788,530Profit for the financial year – – – – – – – 123,016 123,016 123,016Other comprehensive
incomeNet loss on fair value
changes during the financial year – – – – – 470,719 – – 470,719 470,719
Recognised in the profit and loss accounts on occurrence of hedged transactions – – – – – (276,237) – – (276,237) (276,237)
Foreign currency translation adjustments – – – – 80,717 – – – 80,717 80,717
Other comprehensive income for the financial year, net of tax – – – – 80,717 194,482 – – 275,199 275,199
Total comprehensive income for the year – – – – 80,717 194,482 – 123,016 398,215 398,215
Contributions by and distributions to owners
Issue of shares for cash 490,220 – – – – – – – – 490,220Issue of shares on
exercise of share option 9,708 – – – – – – – – 9,708
Issue of perpetual capital securities – – 270,451 – – – – – – 270,451
Purchase of treasury shares – (96,081) – – – – – – – (96,081)
Share-based expense – – – – – – 18,133 – 18,133 18,133Dividends on ordinary
shares (Note 26) – – – – – – – (125,181) (125,181) (125,181)Accrued capital securities
distribution – – 6,435 – – – – (6,435) (6,435) –Total contributions
by and distributions to owners 499,928 (96,081) 276,886 – – – 18,133 (131,616) (113,483) 567,250
Total transactions with owners in their capacity as owners 499,928 (96,081) 276,886 – – – 18,133 (131,616) (113,483) 567,250
At 30 June 2012 2,077,038 (96,081) 276,886 129,877 (210,221) (128,785) 72,327 632,954 496,152 2,753,995
The accompanying accounting policies and explanatory notes form an integral part of the financial statements.
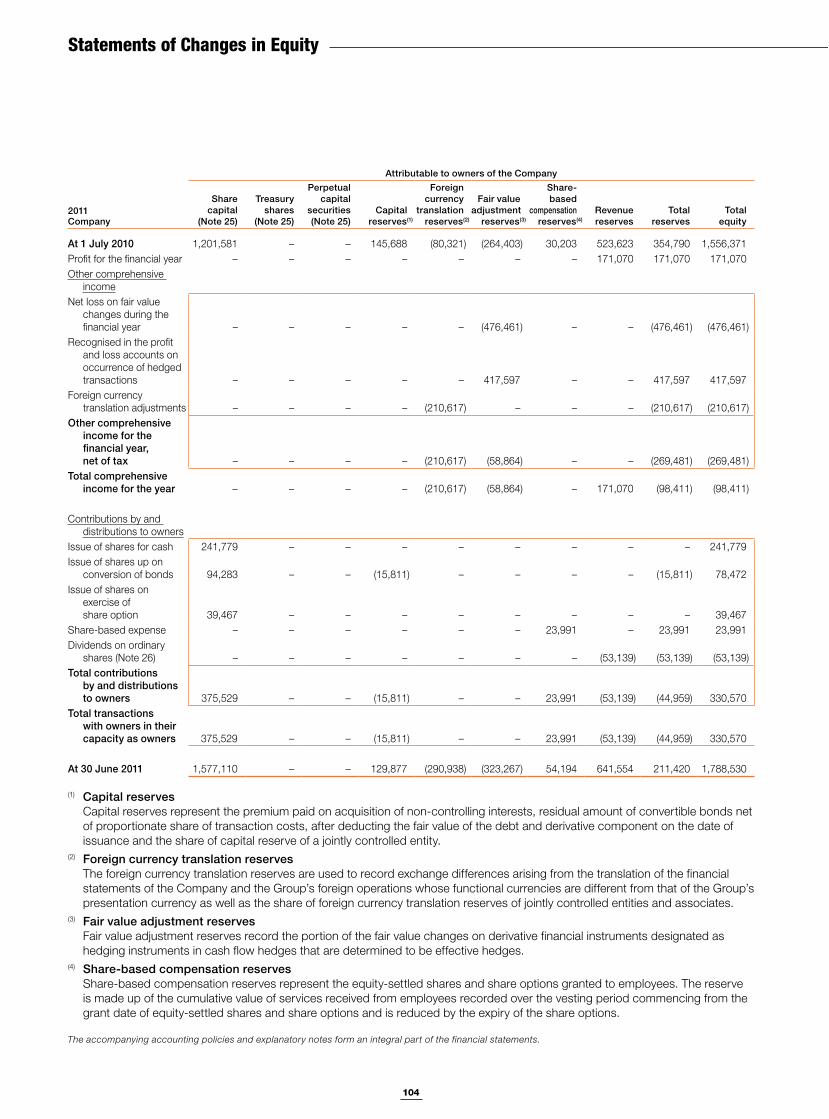
104
Attributable to owners of the Company
2011Company
Sharecapital
(Note 25)
Treasuryshares
(Note 25)
Perpetualcapital
securities(Note 25)
Capitalreserves(1)
Foreigncurrency
translation reserves(2)
Fair value adjustment
reserves(3)
Share-based
compensationreserves(4)
Revenue reserves
Total reserves
Total equity
At 1 July 2010 1,201,581 – – 145,688 (80,321) (264,403) 30,203 523,623 354,790 1,556,371Profit for the financial year – – – – – – – 171,070 171,070 171,070Other comprehensive
incomeNet loss on fair value
changes during the financial year – – – – – (476,461) – – (476,461) (476,461)
Recognised in the profit and loss accounts on occurrence of hedged transactions – – – – – 417,597 – – 417,597 417,597
Foreign currency translation adjustments – – – – (210,617) – – – (210,617) (210,617)
Other comprehensive income for the financial year, net of tax – – – – (210,617) (58,864) – – (269,481) (269,481)
Total comprehensive income for the year – – – – (210,617) (58,864) – 171,070 (98,411) (98,411)
Contributions by and distributions to owners
Issue of shares for cash 241,779 – – – – – – – – 241,779Issue of shares up on
conversion of bonds 94,283 – – (15,811) – – – – (15,811) 78,472Issue of shares on
exercise of share option 39,467 – – – – – – – – 39,467
Share-based expense – – – – – – 23,991 – 23,991 23,991Dividends on ordinary
shares (Note 26) – – – – – – – (53,139) (53,139) (53,139)Total contributions
by and distributions to owners 375,529 – – (15,811) – – 23,991 (53,139) (44,959) 330,570
Total transactions with owners in their capacity as owners 375,529 – – (15,811) – – 23,991 (53,139) (44,959) 330,570
At 30 June 2011 1,577,110 – – 129,877 (290,938) (323,267) 54,194 641,554 211,420 1,788,530
(1) Capital reserves Capital reserves represent the premium paid on acquisition of non-controlling interests, residual amount of convertible bonds net of proportionate share of transaction costs, after deducting the fair value of the debt and derivative component on the date of issuance and the share of capital reserve of a jointly controlled entity.
(2) Foreign currency translation reserves The foreign currency translation reserves are used to record exchange differences arising from the translation of the financial statements of the Company and the Group’s foreign operations whose functional currencies are different from that of the Group’s presentation currency as well as the share of foreign currency translation reserves of jointly controlled entities and associates.
(3) Fair value adjustment reserves Fair value adjustment reserves record the portion of the fair value changes on derivative financial instruments designated as hedging instruments in cash flow hedges that are determined to be effective hedges.
(4) Share-based compensation reserves Share-based compensation reserves represent the equity-settled shares and share options granted to employees. The reserve is made up of the cumulative value of services received from employees recorded over the vesting period commencing from the grant date of equity-settled shares and share options and is reduced by the expiry of the share options.
Statements of Changes in Equity
The accompanying accounting policies and explanatory notes form an integral part of the financial statements.
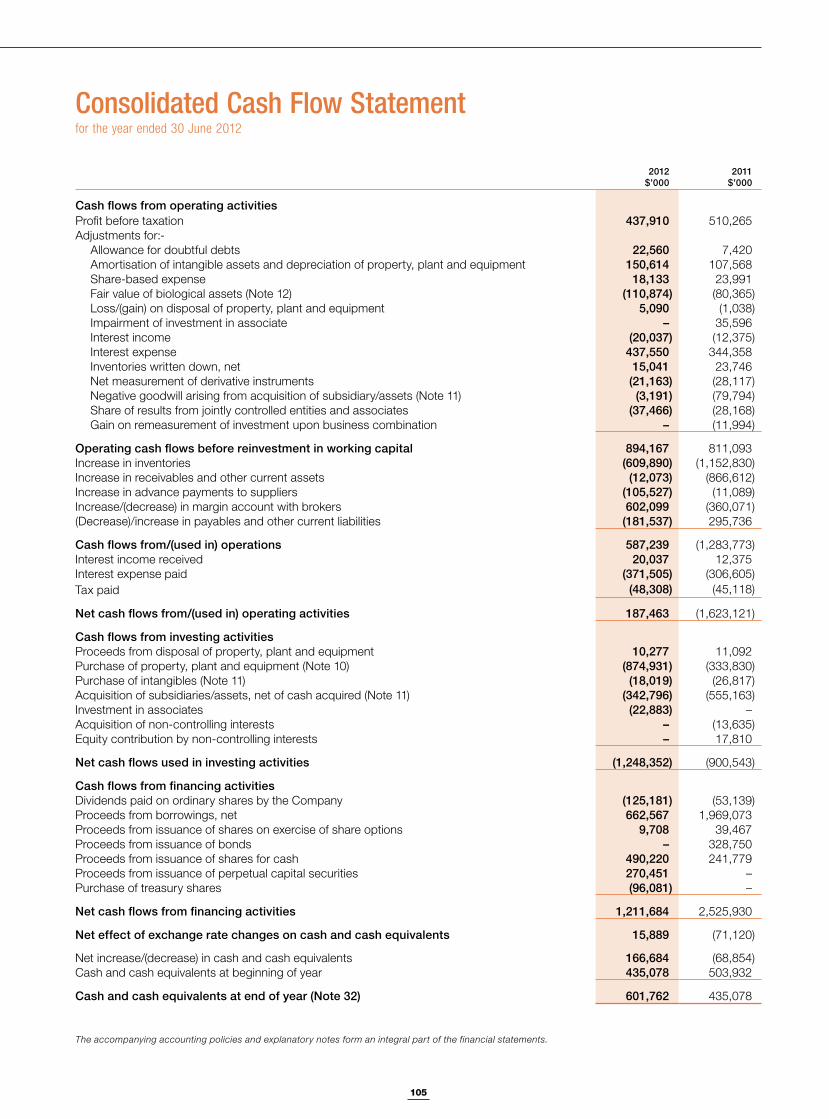
105
The accompanying accounting policies and explanatory notes form an integral part of the financial statements.
Consolidated Cash Flow Statement for the year ended 30 June 2012
2012$’000
2011$’000
Cash flows from operating activitiesProfit before taxation 437,910 510,265Adjustments for:-
Allowance for doubtful debts 22,560 7,420Amortisation of intangible assets and depreciation of property, plant and equipment 150,614 107,568Share-based expense 18,133 23,991Fair value of biological assets (Note 12) (110,874) (80,365)Loss/(gain) on disposal of property, plant and equipment 5,090 (1,038)Impairment of investment in associate – 35,596Interest income (20,037) (12,375)Interest expense 437,550 344,358Inventories written down, net 15,041 23,746Net measurement of derivative instruments (21,163) (28,117)Negative goodwill arising from acquisition of subsidiary/assets (Note 11) (3,191) (79,794)Share of results from jointly controlled entities and associates (37,466) (28,168)Gain on remeasurement of investment upon business combination – (11,994)
Operating cash flows before reinvestment in working capital 894,167 811,093Increase in inventories (609,890) (1,152,830)Increase in receivables and other current assets (12,073) (866,612)Increase in advance payments to suppliers (105,527) (11,089)Increase/(decrease) in margin account with brokers 602,099 (360,071)(Decrease)/increase in payables and other current liabilities (181,537) 295,736
Cash flows from/(used in) operations 587,239 (1,283,773)Interest income received 20,037 12,375Interest expense paid (371,505) (306,605)Tax paid (48,308) (45,118)
Net cash flows from/(used in) operating activities 187,463 (1,623,121)
Cash flows from investing activitiesProceeds from disposal of property, plant and equipment 10,277 11,092Purchase of property, plant and equipment (Note 10) (874,931) (333,830)Purchase of intangibles (Note 11) (18,019) (26,817)Acquisition of subsidiaries/assets, net of cash acquired (Note 11) (342,796) (555,163)Investment in associates (22,883) –Acquisition of non-controlling interests – (13,635)Equity contribution by non-controlling interests – 17,810
Net cash flows used in investing activities (1,248,352) (900,543)
Cash flows from financing activitiesDividends paid on ordinary shares by the Company (125,181) (53,139)Proceeds from borrowings, net 662,567 1,969,073Proceeds from issuance of shares on exercise of share options 9,708 39,467Proceeds from issuance of bonds – 328,750Proceeds from issuance of shares for cash 490,220 241,779Proceeds from issuance of perpetual capital securities 270,451 –Purchase of treasury shares (96,081) –
Net cash flows from financing activities 1,211,684 2,525,930
Net effect of exchange rate changes on cash and cash equivalents 15,889 (71,120)
Net increase/(decrease) in cash and cash equivalents 166,684 (68,854)Cash and cash equivalents at beginning of year 435,078 503,932
Cash and cash equivalents at end of year (Note 32) 601,762 435,078
106
Notes to the Financial Statements30 June 2012
1. Corporate informationOlam International Limited (“the Company”) is a limited liability company, which is domiciled and incorporated in Singapore. The Company is listed on the Singapore Exchange Securities Trading Limited (SGX-ST).
The principal activities of the Company are those of sourcing, processing, packaging and merchandising of agricultural products. The principal activities of the subsidiaries are disclosed in Note 13 to the financial statements.
The registered office of the Company is located at 50 Raffles Place, #32-01 Singapore Land Tower, Singapore 048623. The place of business of the Company is at 9 Temasek Boulevard, #11-02 Suntec Tower Two, Singapore 038989.
2. Summary of significant accounting policies2.1 Basis of preparation
The consolidated financial statements of the Group and the balance sheet, profit and loss account, statement of comprehensive income and statement of changes in equity of the Company have been prepared in accordance with Singapore Financial Reporting Standards (“FRS”).
The financial statements have been prepared on a historical cost basis except as disclosed in the accounting policies below.
The areas involving a higher degree of judgement or complexity, or areas where assumptions and estimates are significant to the financial statements are disclosed in Note 3.
The financial statements are presented in Singapore Dollars ($ or SGD) and all values in the tables are rounded to the nearest thousand ($’000) as indicated.
2.2 Changes in accounting policies
The accounting policies adopted are consistent with those of the previous financial year except in the current financial year, the Group has adopted all the new and revised standards and Interpretations of FRS (INT FRS) that are effective for annual periods beginning on or after 1 July 2011. The adoption of these standards and interpretations did not have any material effect on the financial performance or position of the Group and the Company.
2.3 Standards issued but not yet effective
The Group has not adopted the following standards and interpretations that have been issued but not yet effective:
DescriptionEffective for annual periods beginning on or after
Amendments to FRS 12 Deferred Tax: Recovery of Underlying Assets 1 January 2012Amendments to FRS 1 Presentation of Items of Other Comprehensive Income 1 July 2012Revised FRS 19 Employee Benefits 1 January 2013Revised FRS 27 Separate Financial Statements 1 January 2014Revised FRS 28 Investments in Associates and Joint Ventures 1 January 2014FRS 110 Consolidated Financial Statements 1 January 2014FRS 111 Joint Arrangements 1 January 2014FRS 112 Disclosure of Interests in Other Entities 1 January 2014FRS 113 Fair Value Measurements 1 January 2013Amendment to FRS 107 Offsetting of Financial Assets and Financial Liabilities 1 January 2013Amendment to FRS 32 Offsetting of Financial Assets and Financial Liabilities 1 January 2014INT FRS 120 Stripping Risks in the Production Phase of a Surface Mine 1 January 2013Improvements to FRSs 2012:– Amendments to FRS 1 Presentation of Financial Statements 1 January 2013– Amendments to FRS 16 Property, Plant and Equipment 1 January 2013– Amendments to FRS 32 Financial Instruments: Presentation 1 January 2013
107
2. Summary of significant accounting policies (cont’d) 2.3 Standards issued but not yet effective (cont’d)
Except for the Amendments to FRS 1, FRS 111 and revised FRS 28, FRS 112 and Amendment to FRS 107, the directors expect that the adoption of the standards and interpretations above will have no material impact on the financial statements in the period of initial application. The nature of the impending changes in accounting policy on adoption of the Amendments to FRS 1, FRS 111 and revised FRS 28, FRS 112 and Amendment to FRS 107 are described below.
Amendments to FRS 1 Presentation of Items of Other Comprehensive Income
The Amendments to FRS 1 Presentation of Items of Other Comprehensive Income (OCI) is effective for financial periods beginning on or after 1 July 2012.
The Amendments to FRS 1 changes the grouping of items presented in OCI. Items that could be reclassified to profit or loss at a future point in time would be presented separately from items which will never be reclassified. As the Amendments only affect the presentations of items that are already recognised in OCI, the Group does not expect any impact on its financial position or performance upon adoption of this standard.
FRS 111 Joint Arrangements and Revised FRS 28 Investments in Associates and Joint Ventures
FRS 111 and the revised FRS 28 are effective for financial periods beginning on or after 1 January 2014.
FRS 111 classifies joint arrangements either as joint operations or joint ventures. Joint operation is a joint arrangement whereby the parties that have joint control of the arrangement have rights to the assets and obligations for the liabilities relating to the arrangement whereas joint venture is a joint arrangement whereby the parties that have joint control of the arrangement have rights to the net assets of the arrangement. FRS 111 requires the determination of joint arrangement’s classification to be based on the parties’ rights and obligations under the arrangement, with the existence of a separate legal vehicle no longer being the key factor. FRS 111 disallows proportionate consolidation and requires joint ventures to be accounted for using the equity method. The revised FRS 28 was amended to describe the application of equity method to investments in joint ventures in addition to associates.
Currently, the Group’s investments in jointly controlled entities are accounted for using the equity method. Upon adoption of FRS 111, the Group does not expect any impact to the Group’s financial statements presentation.
FRS 112 Disclosure of Interests in Other Entities
FRS 112 is effective for financial periods beginning on or after 1 January 2014.
FRS 112 is a new and comprehensive standard on disclosure requirements for all forms of interests in other entities, including joint arrangements, associates, special purpose vehicles and other off balance sheet vehicles. FRS 112 requires an entity to disclose information that helps users of its financial statements to evaluate the nature and risks associated with its interests in other entities and the effects of those interests on its financial statements. The Group is currently determining the impact of the disclosure requirements. As this is a disclosure standard, it will have no impact to the financial position and financial performance of the Group upon adoption of this standard.
Amendment to FRS 107 Offsetting of Financial Assets and Financial Liabilities
Amendment to FRS 107 Offsetting of Financial Assets and Financial Liabilities is effective for financial periods beginning on or after 1 January 2013. The Amendments to FRS 107 provides disclosure requirements that are intended to help investors and other financial statement users better assess the effect or potential effect of offsetting arrangements on a company’s financial position. The new disclosures require information about the gross amount of financial assets and liabilities before offsetting and the amounts set off in accordance with offsetting model in FRS 32. As the Amendments only affect disclosures, it will not have any impact to the financial position or financial performance of the Group upon adoption.
108
Notes to the Financial Statements
2. Summary of significant accounting policies (cont’d) 2.4 Functional and foreign currency
The Group’s consolidated financial statements are presented in Singapore Dollars. Each entity in the Group determines its own functional currency and items included in the financial statements of each entity are measured using that functional currency.
The Company’s functional currency is the United States Dollar (“USD”), which reflects the economic substance of the underlying events and circumstances of the Company. Although the Company is domiciled in Singapore, most of the Company’s transactions are denominated in USD and the selling prices for the Company’s products are sensitive to movements in the foreign exchange rate with the USD.
(a) Transactions and balances
Transactions in foreign currencies are measured in the respective functional currencies of the Company and its subsidiaries and are recorded on initial recognition in the functional currencies at exchange rates approximating those ruling at the transaction dates. Monetary assets and liabilities denominated in foreign currencies are translated at the rate of exchange ruling at the balance sheet date. Non-monetary items that are measured in terms of historical cost in a foreign currency are translated using the exchange rates as at the dates of the initial transactions. Non-monetary items measured at fair value in a foreign currency are translated using the exchange rates at the date when the fair value was determined.
Exchange differences arising on the settlement of monetary items or on translating monetary items at the balance sheet date are recognised in profit or loss except for exchange differences arising on monetary items that form part of the Group’s net investment in foreign operations, which are recognised initially in other comprehensive income and accumulated under foreign currency translation reserve in equity. The foreign currency translation reserve is reclassified from equity to profit or loss of the Group on disposal of the foreign operation.
(b) Consolidated financial statements
For consolidation purpose, the assets and liabilities of foreign operations are translated into SGD at the rate of exchange ruling at the balance sheet date and their profit or loss are translated at the weighted average exchange rates for the year. The exchange differences arising on the translation are recognised in other comprehensive income. On disposal of a foreign operation, the component of other comprehensive income relating to that particular foreign operation is recognised in profit or loss.
In the case of a partial disposal without loss of control of a subsidiary that includes a foreign operation, the proportionate share of the cumulative amount of the exchange differences are re-attributed to non-controlling interest and are not recognised in profit or loss. For partial disposals of associates or jointly controlled entities that are foreign operations, the proportionate share of the accumulated exchange differences is reclassified to profit or loss.
(c) Translation to the presentation currency
The financial statements are presented in Singapore Dollar (“SGD”) as the Company’s principal place of business is in Singapore.
The financial statements are translated from USD to SGD as follows:-
sheet date;
which approximates the exchange rates at the dates of the transactions; and
109
Notes to the Financial Statements
2. Summary of significant accounting policies (cont’d)2.5 Subsidiary companies, basis of consolidation and business combinations
(a) Subsidiary companies
A subsidiary is an entity over which the Group has the power to govern the financial and operating policies so as to obtain benefits from its activities.
In the Company’s separate financial statements, investments in subsidiary companies are accounted for at cost less any impairment losses.
A list of the Group’s significant subsidiary companies is shown in Note 13.
(b) Basis of consolidation
The consolidated financial statements comprise the financial statements of the Company and its subsidiaries as at the end of the reporting period. The financial statements of the subsidiaries used in the preparation of the consolidated financial statements are prepared for the same reporting date as the Company. Consistent accounting policies are applied to like transactions and events in similar circumstances.
All intra-group balances, income and expenses and unrealised gains and losses resulting from intra-group transactions and dividends are eliminated in full.
Subsidiaries are consolidated from the date of acquisition, being the date on which the Group obtains control, and continue to be consolidated until the date that such control ceases.
Losses within a subsidiary are attributed to the non-controlling interest even if that results in a deficit balance.
A change in the ownership interest of a subsidiary, without a loss of control, is accounted for as an equity transaction. If the Group loses control over a subsidiary, it:
– De-recognises the assets (including goodwill) and liabilities of the subsidiary at their carrying amounts at the date when controls is lost;
– De-recognises the carrying amount of any non-controlling interest;
– De-recognises the cumulative translation differences recorded in equity;
– Recognises the fair value of the consideration received;
– Recognises the fair value of any investment retained;
– Recognises any surplus or deficit in profit or loss;
– Reclassifies the Group’s share of components previously recognised in other comprehensive income to profit or loss or retained earnings, as appropriate.
110
Notes to the Financial Statements
2. Summary of significant accounting policies (cont’d)2.5 Subsidiary companies, basis of consolidation and business combinations (cont’d)
(c) Business combinations
Business combinations are accounted for by applying the acquisition method. Identifiable assets acquired and liabilities assumed in a business combination are measured initially at their fair values at the acquisition date. Acquisition-related costs are recognised as expenses in the periods in which the costs are incurred and the services are received.
When the Group acquires a business, it assesses the financial assets and liabilities assumed for appropriate classification and designation in accordance with the contractual terms, economic circumstances and pertinent conditions as at the acquisition date. This includes the separation of embedded derivatives in host contracts by the acquiree.
Any contingent consideration to be transferred by the acquirer will be recognised at fair value at the acquisition date. Subsequent changes to the fair value of the contingent consideration which is deemed to be an asset or liability, will be recognised in accordance with FRS 39 either in profit or loss or as a change to other comprehensive income. If the contingent consideration is classified as equity, it is not re-measured until it is finally settled within equity.
In business combinations achieved in stages, previously held equity interests in the acquiree are remeasured to fair value at the acquisition date and any corresponding gain or loss is recognised in profit or loss.
The Group elects for each individual business combination, whether non-controlling interest in the acquiree (if any) is recognised on the acquisition date at fair value, or at the non-controlling interest’s proportionate share of the acquiree’s identifiable net assets.
Any excess of the sum of the fair value of the consideration transferred in the business combination, the amount of non-controlling interest in the acquiree (if any) and the fair value of the Group’s previously held equity interest in the acquiree (if any) over the net fair value of the acquiree’s identifiable assets and liabilities is recorded as goodwill. In instances where the latter amount exceeds the former, the excess is recognised as gain on bargain purchase in profit or loss on the acquisition date. The accounting policy for goodwill is set out in Note 2.10(a).
2.6 Transactions with non-controlling interests
Non-controlling interest represents the equity in subsidiaries not attributable, directly or indirectly, to owners of the Company, and are presented separately in the consolidated statement of comprehensive income and within equity in the consolidated balance sheet, separately from equity attributable to owners of the Company.
Changes in the Company owners’ ownership interest in a subsidiary that do not result in a loss of control are accounted for as equity transactions. In such circumstances, the carrying amounts of the controlling and non-controlling interests are adjusted to reflect the changes in their relative interests in the subsidiary. Any difference between the amount by which the non-controlling interest is adjusted and the fair value of the consideration paid or received is recognised directly in equity and attributed to owners of the Company.
2.7 Jointly controlled entities
The Group has interests in joint ventures that are jointly controlled entities. A joint venture is a contractual arrangement whereby two or more parties undertake an economic activity that is subject to joint control, and a jointly controlled entity is a joint venture that involves the establishment of a separate entity in which each venturer has an interest.
The consolidated financial statements include the Group’s share of the total recognised gains and losses of its jointly controlled entities on an equity accounted basis from the date that joint control commences until the date that joint control ceases. When the Group’s share of losses exceeds the carrying amount of the investment, the investment is reported as nil and recognition of losses is discontinued except to the extent of the Group’s commitment.
111
Notes to the Financial Statements
2. Summary of significant accounting policies (cont’d)2.7 Jointly controlled entities (cont’d)
In the Company’s separate financial statements, investments in jointly controlled entities are stated at cost less impairment loss. The carrying amounts of the jointly controlled entities are reviewed at each balance sheet date to determine whether there is any indication of impairment. If such indication exists, the recoverable amount is estimated and any impairment loss is recognised whenever the carrying amount exceeds the recoverable amount. The impairment loss is charged to profit or loss.
Upon loss of joint control, the Group measures and recognises any retained investment at its fair value. Any difference between the carrying amount of the former joint venture entity upon loss of joint venture control and the aggregate of the fair value of the retained investment and proceeds from disposal is recognised in profit or loss.
2.8 Associates
An associate is an entity, not being a subsidiary or a joint venture, in which the Group has significant influence. An associate is equity accounted for from the date the Group obtains significant influence until the date the Group ceases to have significant influence over the associate.
The Group’s investments in associates are accounted for using the equity method. Under the equity method, the investment in the associate is measured in the balance sheet at cost plus post-acquisition changes in the Group’s share of net assets of the associate. Goodwill relating to an associate is included in the carrying amount of the investment and is neither amortised nor tested individually for impairment. Any excess of the Group’s share of the net fair value of the associate’s identifiable assets, liabilities and contingent liabilities over the cost of the investment is included as income in the determination of the Group’s share of results of the associate in the period in which the investment is acquired.
The profit or loss reflects the share of the results of operations of the associates. Where there has been a change recognised in other comprehensive income by the associates, the Group recognises its share of such changes in other comprehensive income. Unrealised gains and losses resulting from transactions between the Group and the associate are eliminated to the extent of the interest in the associates.
The Group’s share of the profit or loss of its associates is shown on the face of profit or loss after tax and non-controlling interests in the subsidiaries of associates.
When the Group’s share of losses in an associate equals or exceeds its interest in the associate, the Group does not recognise further losses, unless it has incurred obligations or made payments on behalf of the associate.
After application of the equity method, the Group determines whether it is necessary to recognise an additional impairment loss on the Group’s investment in its associates. The Group determines at each balance sheet date whether there is any objective evidence that the investment in the associate is impaired. If this is the case, the Group calculates the amount of impairment as the difference between the recoverable amount of the associate and its carrying value and recognises the amount in the profit or loss.
The financial statements of the associates are prepared as of the same reporting date as the Company. Where necessary, adjustments are made to bring the accounting policies in line with those of the Group.
Upon loss of significant influence over the associate, the Group measures and recognises any retained investment at its fair value. Any difference between the carrying amount of the associate upon loss of significant influence and the fair value of the aggregate of the retained investment and proceeds from disposal is recognised in profit or loss.
112
Notes to the Financial Statements
2. Summary of significant accounting policies (cont’d)2.9 Property, plant and equipment
All items of property, plant and equipment are initially recorded at cost. Such cost includes the cost of replacing part of the property, plant and equipment and borrowing costs that are directly attributable to the acquisition, construction or production of a qualifying property, plant and equipment. The accounting policy for borrowing costs is set out in Note 2.19. The cost of an item of property, plant and equipment is recognised as an asset if, and only if, it is probable that future economic benefits associated with the item will flow to the Group and the cost of the item can be measured reliably.
Subsequent to recognition, all items of property, plant and equipment are stated at cost less accumulated depreciation and accumulated impairment losses. Freehold land has an unlimited useful life and therefore is not depreciated. Leasehold land and buildings are depreciable over the shorter of the estimated useful life of the asset or the lease period.
Depreciation of an asset begins when it is available for use and is computed on a straight line basis over the estimated useful life except for ginning assets of Queensland Cotton Holdings, which are depreciated using the units of use method. The estimated useful life of the assets is as follows:-
Leasehold land and buildings – 20 to 50 yearsPlant and machinery – 5 to 20 years; 30 years for ginning assets Motor vehicles – 3 to 5 years Furniture and fittings – 5 yearsOffice equipment – 5 yearsComputers – 3 years
Capital work-in-progress is not depreciated as these assets are not yet available for use.
The carrying values of property, plant and equipment are reviewed for impairment when events or changes in circumstances indicate that the carrying value may not be recoverable.
The residual values, useful life and depreciation method are reviewed at each financial year end, and adjusted prospectively, if appropriate.
An item of property, plant and equipment is derecognised upon disposal or when no future economic benefits are expected from its use or disposal. Any gain or loss on derecognition of the asset is included in the profit and loss account in the year the asset is derecognised.
2.10 Intangible assets
(a) Goodwill
Goodwill is initially measured at cost. Following initial recognition, goodwill is measured at cost less any accumulated impairment losses.
For the purpose of impairment testing, goodwill acquired in a business combination is, from the acquisition date, allocated to each of the Group’s cash-generating units that are expected to benefit from the synergies of the combination, irrespective of whether other assets or liabilities of the acquiree are assigned to those units.
The cash-generating unit to which goodwill has been allocated is tested for impairment annually and whenever there is an indication that the cash-generating unit may be impaired. Impairment is determined for goodwill by assessing the recoverable amount of each cash-generating unit (or group of cash-generating units) to which the goodwill relates. Where the recoverable amount of the cash-generating unit is less than the carrying amount, an impairment loss is recognised in the profit and loss account. Impairment losses recognised for goodwill are not reversed in subsequent periods.
113
Notes to the Financial Statements
2. Summary of significant accounting policies (cont’d)2.10 Intangible assets (cont’d)
(a) Goodwill (cont’d)
Where goodwill forms part of a cash-generating unit and part of the operation within that unit is disposed of, the goodwill associated with the operation disposed of is included in the carrying amount of the operation when determining the gain or loss of disposal of the operation. Goodwill disposed of in this circumstance is measured based on the relative fair values of the operations disposed of and the portion of the cash-generating unit retained.
Goodwill and fair value adjustments arising on the acquisition of foreign operations on or after 1 January 2005 are treated as assets and liabilities of the foreign operations and are recorded in the functional currency of the foreign operations and translated in accordance with the accounting policy set out in Note 2.4.
(b) Other intangible assets
Intangible assets acquired separately are measured initially at cost. The cost of intangible assets acquired in a business combination is their fair value as at the date of acquisition. Following initial acquisition, intangible assets are measured at cost less any accumulated amortisation and accumulated impairment losses.
The useful lives of intangible assets are assessed as either finite or indefinite.
Intangible assets with finite useful lives are amortised on a straight-line basis over the estimated useful lives and assessed for impairment whenever there is an indication that the intangible asset may be impaired. The amortisation period and the amortisation method are reviewed at least at each financial year-end. Changes in the expected useful life or the expected pattern of consumption of future economic benefits embodied in the asset is accounted for by changing the amortisation period or method, as appropriate, and are treated as changes in accounting estimates. The amortisation expense on intangible assets with finite lives is recognised in the profit or loss in the expense category consistent with the function of the intangible asset.
Intangible assets with indefinite useful lives or that are not yet available for use are not subject to amortisation and they are tested for impairment annually or more frequently if the events and circumstances indicate that the carrying value may be impaired either individually or at the cash-generating unit level. Such intangible assets are not amortised. The useful life of an intangible asset with an indefinite useful life is reviewed annually to determine whether the useful life assessment continues to be supportable. If not, the change in useful life from indefinite to finite is made on a prospective basis.
Gains or losses arising from derecognition of an intangible asset are measured as the difference between the net disposal proceeds and the carrying amount of the asset and are recognised in the profit or loss when the asset is derecognised.
2.11 Biological assets
Biological assets are stated at fair value less estimated point-of-sale costs, with any resultant gain or loss recognised in the profit or loss.
114
Notes to the Financial Statements
2. Summary of significant accounting policies (cont’d)2.12 Impairment of non-financial assets
The Group assesses at each reporting date whether there is an indication that an asset may be impaired. If any such indication exists, or when an annual impairment assessment for an asset is required, the Group makes an estimate of the asset’s recoverable amount.
An asset’s recoverable amount is the higher of an asset’s or cash-generating unit’s fair value less costs to sell and its value in use and is determined for an individual asset, unless the asset does not generate cash inflows that are largely independent of those from other assets or group of assets. Where the carrying amount of an asset or cash-generating unit exceeds its recoverable amount, the asset is considered impaired and is written down to its recoverable amount. In assessing value in use, the estimated future cash flows expected to be generated by the asset are discounted to their present value using a post-tax discount rate that reflects current market assessments of the time value of money and the risks specific to the asset. Where the carrying amount of an asset exceeds its recoverable amount, the asset is written down to its recoverable amount.
Impairment losses of continuing operations are recognised in profit or loss in those expense categories consistent with the function of the impaired asset, except for assets that are previously revalued where the revaluation was taken to other comprehensive income. In this case the impairment is also recognised in other comprehensive income up to the amount of any previous revaluation.
For assets excluding goodwill, an assessment is made at each reporting date as to whether there is any indication that previously recognised impairment losses may no longer exist or may have decreased. If such indication exists, the Group estimates the asset’s or cash-generating unit’s recoverable amount. A previously recognised impairment loss is reversed only if there has been a change in the estimates used to determine the asset’s recoverable amount since the last impairment loss was recognised. If that is the case, the carrying amount of the asset is increased to its recoverable amount. That increased amount cannot exceed the carrying amount that would have been determined, net of depreciation, had no impairment loss been recognised previously. Such reversal is recognised in the profit or loss unless the asset is measured at revalued amount, in which case the reversal is treated as a revaluation increase.
2.13 Financial assets
Initial recognition and measurement
Financial assets are recognised when, and only when, the Group becomes a party to the contractual provisions of the financial instrument. The Group determines the classification of its financial assets at initial recognition.
When financial assets are recognised initially, they are measured at fair value, plus, in the case of financial assets not at fair value through profit or loss, directly attributable transaction costs.
Subsequent measurement
The subsequent measurement of financial assets depends on their classification as follows:-
(a) Financial assets at fair value through profit or loss
Financial assets at fair value through profit or loss include financial assets held for trading and financial assets designated upon initial recognition at fair value through profit or loss. Financial assets are classified as held for trading if they are acquired for the purpose of selling or repurchasing in the near term. This category includes derivative financial instruments entered into by the Group that are not designated as hedging instruments in hedge relationships as defined by FRS 39. Derivatives, including separated embedded derivatives are also classified as held for trading unless they are designated as effective hedging instruments.
Subsequent to initial recognition, financial assets at fair value through profit or loss are measured at fair value. Any gains or losses arising from changes in fair value of the financial assets are recognised in profit or loss. Net gains or net losses on financial assets at fair value through profit or loss include exchange differences, interest and dividend income.
115
Notes to the Financial Statements
2. Summary of significant accounting policies (cont’d)2.13 Financial assets (cont’d)
Subsequent measurement (cont’d)
(a) Financial assets at fair value through profit or loss (cont’d)
Derivatives embedded in host contracts are accounted for as separate derivatives and recorded at fair value if their economic characteristics and risks are not closely related to those of the host contracts and the host contracts are not held for trading or designated at fair value through profit or loss. These embedded derivatives are measured at fair value with changes in fair value recognised in profit or loss. Reassessment only occurs if there is a change in the terms of the contract that significantly modifies the cash flows that would otherwise be required.
(b) Loans and receivables
Non-derivative financial assets with fixed or determinable payments that are not quoted in an active market are classified as loans and receivables. Subsequent to initial recognition, loans and receivables are measured at amortised cost using the effective interest method, less impairment. Gains and losses are recognised in profit or loss when the loans and receivables are derecognised or impaired, and through the amortisation process.
Derecognition
A financial asset is derecognised when the contractual right to receive cash flows from the asset has expired. On derecognition of a financial asset in its entirety, the difference between the carrying amount and the sum of the consideration received and any cumulative gain or loss that had been recognised in other comprehensive income is recognised in profit or loss.
All regular way purchases and sales of financial assets are recognised or derecognised on the trade date, i.e. the date that the Group commits to purchase or sell the asset. Regular way purchases or sales are purchases or sales of financial assets that require delivery of assets within the period generally established by regulation or convention in the marketplace concerned.
2.14 Financial liabilities
Initial recognition and measurement
Financial liabilities are recognised when, and only when, the Group becomes a party to the contractual provisions of the financial instrument. The Group determines the classification of its financial liabilities at initial recognition.
All financial liabilities are recognised initially at fair value plus, in the case of financial liabilities not at fair value through profit or loss, directly attributable transaction costs.
Subsequent measurement
The measurement of financial liabilities depends on their classification as follows:
Financial liabilities at fair value through profit or loss
Financial liabilities at fair value through profit or loss includes financial liabilities held for trading and financial liabilities designated upon initial recognition at fair value through profit or loss. Financial liabilities are classified as held for trading if they are acquired for the purpose of selling in the near term. This category includes derivative financial instruments entered into by the Group that are not designated as hedging instruments in hedge relationships. Separated embedded derivatives are also classified as held for trading unless they are designated as effective hedging instruments.
Subsequent to initial recognition, financial liabilities at fair value through profit or loss are measured at fair value. Any gains or losses arising from changes in fair value of the financial liabilities are recognised in profit or loss.
The Group has not designated any financial liabilities upon initial recognition at fair value through profit or loss.
116
Notes to the Financial Statements
2. Summary of significant accounting policies (cont’d)2.14 Financial liabilities (cont’d)
Other financial liabilities
After initial recognition, other financial liabilities are subsequently measured at amortised cost using the effective interest method. Gains and losses are recognised in profit or loss when the liabilities are derecognised, and through the amortisation process.
Derecognition
A financial liability is derecognised when the obligation under the liability is discharged or cancelled or expires. When an existing financial liability is replaced by another from the same lender on substantially different terms, or the terms of an existing liability are substantially modified, such an exchange or modification is treated as a derecognition of the original liability and the recognition of a new liability and the difference in the respective carrying amounts are recognised in profit or loss.
2.15 Cash and cash equivalents
Cash and cash equivalents comprise cash and bank balances and short-term fixed bank deposits that are subject to an insignificant risk of changes in value. These include bank overdrafts that form an integral part of the Group’s cash management.
Cash and cash equivalents carried in the balance sheets are classified and accounted for as loans and receivables under FRS 39. The accounting policy for this category of financial assets is stated in Note 2.13.
2.16 Receivables
Trade receivables, which are on trade terms, margin accounts with brokers as well as receivables from subsidiary companies, advance payments to suppliers and other current assets (excluding prepayments) and other non-current assets are classified and accounted for as loans and receivables under FRS 39. The accounting policy for this category of financial assets is stated in Note 2.13.
An allowance is made for doubtful debts when there is objective evidence that the Group will not be able to collect the debt. Bad debts are written off when identified. Further details on the accounting policy for impairment of financial assets are stated in Note 2.17 below.
2.17 Impairment of financial assets
The Group assesses at each balance sheet date whether there is any objective evidence that a financial asset or group of financial assets is impaired.
(a) Financial assets carried at amortised cost
For financial assets carried at amortised cost, the Group first assesses whether objective evidence of impairment exists individually for financial assets that are individually significant, or collectively for financial assets that are not individually significant. If the Group determines that no objective evidence of impairment exists for an individually assessed financial asset, whether significant or not, it includes the asset in a group of financial assets with similar credit risk characteristics and collectively assesses them for impairment. Assets that are individually assessed for impairment, and for which an impairment loss is or continues to be recognised, are not included in a collective assessment of impairment.
If there is objective evidence that an impairment loss on financial assets carried at amortised cost has incurred, the amount of the loss is measured as the difference between the asset’s carrying amount and the present value of estimated future cash flows discounted at the financial asset’s original effective interest rate. If a loan has a variable interest rate, the discount rate for measuring any impairment loss is the current effective interest rate. The carrying amount of the asset is reduced through the use of an allowance account. The impairment loss is recognised in profit or loss.
117
Notes to the Financial Statements
2. Summary of significant accounting policies (cont’d)2.17 Impairment of financial assets (cont’d)
(a) Financial assets carried at amortised cost (cont’d)
When the asset becomes uncollectible, the carrying amount of impaired financial assets is reduced directly or if an amount was charged to the allowance account, the amounts charged to the allowance account are written off against the carrying value of the financial asset.
To determine whether there is objective evidence that an impairment loss on financial assets has been incurred, the Group considers factors such as the probability of insolvency or significant financial difficulties of the debtor and default or significant delay in payments.
If in a subsequent period, the amount of the impairment loss decreases and the decrease can be related objectively to an event occurring after the impairment was recognised, the previously recognised impairment loss is reversed to the extent that the carrying amount of the asset does not exceed its amortised cost at the reversal date. The amount of reversal is recognised in the profit or loss.
(b) Financial assets carried at cost
If there is objective evidence (such as significant adverse changes in the business environment where the issuer operates, probability of insolvency or significant financial difficulties of the issuer) that an impairment loss on financial assets carried at cost has been incurred, the amount of the loss is measured as the difference between the asset’s carrying amount and the present value of estimated future cash flows discounted at the current market rate of return for a similar financial asset. Such impairment losses are not reversed in subsequent periods.
2.18 Inventories
Inventories principally comprise commodities held for trading and inventories that form part of the Group’s normal purchase, sale or usage requirements for its processing activities.
Inventories for commodity trading businesses are measured at fair value less costs to sell, with changes in fair value less costs to sell recognised in the profit or loss in the period of the change.
Other inventories are stated at the lower of cost and net realisable value. Inventories are valued on a first-in-first-out basis. Net realisable value represents the estimated selling price in the ordinary course of business, less anticipated cost of disposal and after making allowance for damages and slow-moving items.
For agricultural produce that is harvested, cost of inventory is stated at fair value less estimated point-of-sale costs at the time of harvest (the “initial cost”). Thereafter this inventory is carried at the lower of cost and net realisable value.
Where necessary, allowance is provided for damaged, obsolete and slow-moving items to adjust the carrying value of inventories to the lower of cost and net realisable value.
2.19 Borrowing costs
Borrowing costs are capitalised as part of the cost of a qualifying asset if they are directly attributable to the acquisition, construction or production of that asset. Capitalisation of borrowing costs commences when the activities to prepare the asset for its intended use or sale are in progress and the expenditures and borrowing costs are incurred. Borrowing costs are capitalised until the assets are substantially completed for their intended use or sale. All other borrowing costs are expensed in the period they occur. Borrowing costs consist of interest and other costs that an entity incurs in connection with the borrowing of funds.
118
Notes to the Financial Statements
2. Summary of significant accounting policies (cont’d)2.20 Financial guarantees
A financial guarantee contract is a contract that requires the issuer to make specified payments to reimburse the holder for a loss it incurs because a specified debtor fails to make payment when due in accordance with the terms of a debt instrument.
Financial guarantees are recognised initially as a liability at fair value, adjusted for transaction costs that are directly attributable to the issuance of the guarantee. Subsequent to initial recognition, financial guarantees are recognised as income in the profit or loss over the period of the guarantee. If it is probable that the liability will be higher than the amount initially recognised less amortisation, the liability is recorded at the higher amount with the difference charged to the profit or loss.
2.21 Provisions
Provisions are recognised when the Group has a present obligation (legal or constructive) as a result of a past event, it is probable that an outflow of resources embodying economic benefits will be required to settle the obligation and the amount of the obligation can be estimated reliably. Provisions are reviewed at each balance sheet date and adjusted to reflect the current best estimates. If it is no longer probable that an outflow of economic resources will be required to settle the obligation, the provision is reversed. If the effect of the time value of money is material, provisions are discounted using a current pre tax rate that reflects, where appropriate, the risks specific to the liability. When discounting is used, the increase in the provision due to the passage of time is recognised as a finance cost.
2.22 Employee benefits
(a) Defined contribution plan
The Group participates in the national pension schemes as defined by the laws of countries in which it has operations. In particular, the Singapore companies in the Group make contributions to the Central Provident Fund scheme in Singapore, a defined contribution pension scheme. Contributions to defined contribution pension schemes are recognised as an expense in the period in which the related service is performed.
(b) Employee leave entitlement
Employee entitlements to annual leave are recognised as a liability when they accrue to employees. A provision is made for the estimated liability for leave as a result of services rendered by employees up to the balance sheet date.
(c) Employee share subscription/options scheme
Employees (including senior executives) of the Group receive remuneration in the form of share-based payment for services rendered (“equity-settled transactions”).
The cost of these equity-settled transactions with employees is measured with reference to the fair value at the date on which the share subscriptions/options are granted. In valuing the share options, no account is taken of any performance conditions.
This cost is recognised in the profit or loss, with a corresponding increase in the share-based compensation reserve, over the vesting period. The cumulative expense recognised at each reporting date until the vesting date reflects the extent to which the vesting period has expired and the Group’s best estimate of the number of options that will ultimately vest. The charge or credit to the profit or loss for a period represents the movement in cumulative expense recognised as at the beginning and end of that period.
119
Notes to the Financial Statements
2. Summary of significant accounting policies (cont’d)2.22 Employee benefits (cont’d)
(c) Employee share subscription/options scheme (cont’d)
No expense is recognised for options that do not ultimately vest, except for options where vesting is conditional upon a market condition or non-vesting condition, which are treated as vested irrespective of whether or not the market condition or non-vesting condition is satisfied, provided that all other performance and/or service conditions are satisfied. In the case where the option does not vest as the result of a failure to meet a non-vesting condition that is within the control of the Group or the employee, it is accounted for as a cancellation. In such case, the amount of the compensation cost that otherwise would be recognised over the remainder of the vesting period is recognised immediately in profit or loss upon cancellation.
In situations where equity instruments are issued and some or all of the goods or services received by the entity as consideration cannot be specifically identified, the unidentified goods or services received (or to be received) are measured as the difference between the fair value of the share-based payment and the fair value of any identifiable goods or services received at the grant date. This is then capitalised or expensed as appropriate.
Where the terms of an equity-settled award are modified, an expense is recognised as if the terms had not been modified. In addition, an expense is recognised for a modification, which increases the total fair value of the share-based payment arrangement, or is otherwise beneficial to the employee as measured at the date of modification.
Where an equity-settled award is cancelled, it is treated as if it has vested on the date of cancellation, and any expense not yet recognised for the award is recognised immediately. However, if a new award is substituted for the cancelled award, and designated as a replacement award on the date that it is granted, the cancelled and new awards are treated as if they were a modification of the original award, as described in the previous paragraph.
2.23 Leases
The determination of whether an arrangement is, or contains a lease is based on the substance of the arrangement at the inception date: whether fulfilment of the arrangement is dependent on the use of a specific asset or assets or the arrangement conveys a right to use the asset, even if that right is not explicitly specified in an arrangement.
Operating lease
Operating lease payments are recognised as an expense in profit or loss on a straight-line basis over the lease term. The aggregate benefit of incentives provided by the lessor is recognised as a reduction of rental expense over the lease term on a straight-line basis.
Finance lease
Finance leases, which transfer to the Group substantially all the risks and rewards incidental to ownership of the leased item, are capitalised at the inception of the lease at the fair value of the leased asset or, if lower, at the present value of the minimum lease payments. Any initial direct costs are also added to the amount capitalised. Lease payments are apportioned between the finance charges and reduction of the lease liability so as to achieve a constant rate of interest on the remaining balance of the liability. Finance charges are charged to profit or loss.
120
Notes to the Financial Statements
2. Summary of significant accounting policies (cont’d)2.24 Revenue recognition
Revenue is recognised to the extent that it is probable that the economic benefits will flow to the Group and the revenue can be reliably measured, regardless of when the payment is made. Revenue is measured at the fair value of consideration received or receivable, excluding discounts, rebates and sales taxes or duty. The Group assesses its revenue arrangements to determine if it is acting as principal or agent. The Group has concluded that it is acting as a principal in all of its revenue arrangements. The following specific recognition criteria must be met before revenue is recognised:-
Sale of goods
Revenue from the sale of goods is recognised upon passage of title to the customer, which generally coincides with their delivery and acceptance.
Sale of services
Revenue from services rendered is recognised upon services performed.
Interest income
Interest income is recognised using the effective interest method.
2.25 Government grants, export incentives and subsidies
Government grants, export incentives and subsidies are recognised at their fair values where there is reasonable assurance that the grant will be received and all conditions attached to the grant will be complied with. When the grant relates to an expense item, it is recognised in the profit or loss over the period necessary to match them on a systematic basis to the costs that it is intended to compensate. When the grant relates to an asset, the fair value is recognised as deferred capital grant on the balance sheet and is amortised to the profit or loss over the expected useful life of the relevant asset by equal annual instalments.
2.26 Taxes
(a) Current income tax
Current income tax assets and liabilities for the current and prior periods are measured at the amount expected to be recovered from or paid to the taxation authorities. The tax rates and tax laws used to compute the amount are those that are enacted or substantively enacted by the end of the reporting period, in the countries where the Group operates and generates taxable income.
Current income taxes are recognised in profit or loss except to the extent that the tax relates to items recognised outside profit or loss, either in other comprehensive income or directly in equity. Management periodically evaluates positions taken in the tax returns with respect to situations in which applicable tax regulations are subject to interpretation and establishes provisions where appropriate.
(b) Deferred tax
Deferred tax is provided using the liability method on temporary differences at the balance sheet date between the tax bases of assets and liabilities and their carrying amounts for financial reporting purposes.
Deferred tax liabilities are recognised for all temporary differences, except:
transaction that is not a business combination and, at the time of the transaction, affects neither the accounting profit nor taxable profit or loss; and
in joint ventures, where the timing of the reversal of the temporary differences can be controlled and it is probable that the temporary differences will not reverse in the foreseeable future.
121
Notes to the Financial Statements
2. Summary of significant accounting policies (cont’d)2.26 Taxes (cont’d)
(b) Deferred tax (cont’d)
Deferred tax assets are recognised for all deductible temporary differences, carry forward of unused tax credits and unused tax losses, to the extent that it is probable that taxable profit will be available against which the deductible temporary differences, and the carry forward of unused tax credits and unused tax losses can be utilised except:
an asset or liability in a transaction that is not a business combination and, at the time of the transaction, affects neither the accounting profit nor taxable profit or loss; and
interests in joint ventures, deferred tax assets are recognised only to the extent that it is probable that the temporary differences will reverse in the foreseeable future and taxable profit will be available against which the temporary differences can be utilised.
The carrying amount of deferred tax asset is reviewed at each balance sheet date and reduced to the extent that it is no longer probable that sufficient taxable profit will be available to allow all or part of the deferred tax asset to be utilised. Unrecognised deferred tax assets are reassessed at each balance sheet date and are recognised to the extent that it has become probable that future taxable profit will allow the deferred tax asset to be utilised.
Deferred tax assets and liabilities are measured at the tax rates that are expected to apply to the year when the asset is realised or the liability is settled, based on tax rates and tax laws that have been enacted or substantively enacted at the balance sheet date.
Deferred tax relating to items recognised outside profit or loss is recognised outside profit or loss. Deferred tax items are recognised in correlation to the underlying transaction either in other comprehensive income or directly in equity and deferred tax arising from a business combination is adjusted against goodwill on acquisition.
Deferred tax assets and deferred tax liabilities are offset if a legally enforceable right exists to set off current income tax assets against current income tax liabilities and the deferred taxes relate to the same taxable entity and the same taxation authority.
Tax benefits acquired as part of a business combination, but not satisfying the criteria for separate recognition at that date, would be recognised subsequently if new information about facts and circumstances changed. The adjustment would either be treated as a reduction to goodwill (as long as it does not exceed goodwill) if it incurred during the measurement period or in profit or loss.
(c) Sales tax
Revenues, expenses and assets are recognised net of the amount of sales tax except:-
in which case the sales tax is recognised as part of the cost of acquisition of the assets or as part of the expense item as applicable; and
The net amount of sales tax recoverable from or payable to the taxation authority is included as part of receivables or payables in the balance sheet.
122
Notes to the Financial Statements
2. Summary of significant accounting policies (cont’d)2.27 Segment reporting
For management purposes, the Group is organised into operating segments based on their products and services, which are independently managed by the respective segment managers responsible for the performance of the respective segments under their charge.
The segment managers report directly to the management of the Company who regularly reviews the segment results in order to allocate resources to the segments and to assess the segment performance. Additional disclosures on each of these segments are shown in Note 37, including the factors used to identify the reportable segments and the measurement basis of segment information.
2.28 Share capital and share issue expenses
Proceeds from issuance of ordinary shares net of directly attributable expenses are recognised as share capital in equity.
2.29 Treasury shares
The Group’s own equity instruments, which are reacquired (treasury shares) are recognised at cost (including directly attributable expenses) and deducted from equity. No gain or loss is recognised in profit or loss on the purchase, sale, issue or cancellation of the Group’s own equity instruments. Any difference between the carrying amount of treasury shares and the consideration received, if reissued, is recognised directly in equity. Voting rights related to treasury shares are nullified for the Group and no dividends are allocated to them respectively.
2.30 Perpetual capital securities
The perpetual capital securities do not have a maturity date and the Company is able to elect to defer making a distribution subject to the term and conditions of the securities issue. Accordingly, the Company is not considered to have a contractual obligation to make principal repayments or distributions in respect of its perpetual capital securities issue and the perpetual capital securities are presented within equity. Distributions are treated as dividends which will be directly debited from equity. Incremental costs directly attributable to the issue of the perpetual capital securities are deducted against the proceeds from the issue.
2.31 Contingencies
A contingent liability is:-
(a) a possible obligation that arises from past events and whose existence will be confirmed only by the occurrence or non-occurrence of one or more uncertain future events not wholly within the control of the Group; or
(b) a present obligation that arises from past events but is not recognised because:
(i) It is not probable that an outflow of resources embodying economic benefits will be required to settle the obligation; or
(ii) The amount of the obligation cannot be measured with sufficient reliability.
A contingent asset is a possible asset that arises from past events and whose existence will be confirmed only by the occurrence or non-occurrence of one or more uncertain future events not wholly within the control of the Group.
Contingent liabilities and assets are not recognised on the balance sheet of the Group, except for contingent liabilities assumed in a business combination that are present obligations and for which the fair values can be reliably determined.
123
Notes to the Financial Statements
2. Summary of significant accounting policies (cont’d)2.32 Derivative financial instruments and hedging activities
Derivative financial instruments include forward currency contracts, commodity futures, options, over-the-counter (“OTC”) structured products, commodity physical forwards and interest rate contracts. These are used to manage the Group’s exposure to risks associated with foreign currency, commodity price and interest rate fluctuations. Certain derivatives are also used for trading purposes. Such derivative financial instruments are initially recognised at fair value on the date on which a derivative contract is entered into and are subsequently re-measured at fair value. Derivative financial instruments are carried as assets when the fair value is positive and as liabilities when the fair value is negative.
The fair value of forward currency contracts and interest rate derivatives are calculated by reference to current forward exchange rates and interest rates respectively for contracts with similar maturity profiles. The fair values of commodity futures, options, OTC structured products and physical forwards are determined by reference to available market information and market valuation methodology. Where the quoted market prices are not available, fair values are based on management’s best estimates, which are arrived at by reference to market prices.
Any gains or losses arising from changes in fair value on derivative financial instruments that are ineffective hedges or are held for trading are taken to the profit and loss account for the year.
At the inception of a hedge relationship, the Group formally designates and documents the hedge relationship to which the Group wishes to apply hedge accounting and the risk management objective and strategy for undertaking the hedge. The documentation includes identification of the hedging instrument, the hedged item or transaction, the nature of the risk being hedged and how the Group will assess the hedging instrument’s effectiveness in offsetting the exposure to changes in the hedged item’s fair value or cash flows attributable to the hedged risk. Such hedges are expected to be highly effective in achieving offsetting changes in fair value or cash flows and are assessed on an ongoing basis to determine that they actually have been highly effective throughout the financial reporting periods for which they were designated.
When the hedge accounting is applied, all hedges are classified as cash flow hedges because they are held for hedging the exposure to variability in cash flows that is attributable to highly probable risk exposure and could affect profit or loss.
For cash flow hedges that meet the criteria for hedge accounting, the effective portion of the gain or loss on the hedging instrument is recognised directly in the fair value adjustment reserves, while the ineffective portion is recognised in the profit and loss account.
Amounts taken to fair value adjustment reserves are transferred to the profit and loss account when the hedged transaction affects profit or loss, such as when a forecasted sale occurs, or when financial income or financial expense is recognised.
If the forecast transaction is no longer expected to occur, amounts previously recognised in fair value adjustment reserves are transferred to the profit and loss account. If the hedging instrument expires or is sold, terminated or exercised without replacement or rollover, or if its designation as a hedge is revoked, amounts previously recognised in fair value adjustment reserves remain in equity until the forecast transaction occurs. If the related transaction is not expected to occur, the amount is taken to the profit and loss account.
124
Notes to the Financial Statements
2. Summary of significant accounting policies (cont’d)2.33 Convertible bonds
When convertible bonds are issued, the total proceeds net of transaction costs are allocated to the debt component, the fair value of derivative financial instruments component and the equity component, which are separately presented on the balance sheet.
The debt component is recognised initially at its fair value, determined using a market interest rate for equivalent non-convertible bonds. It is subsequently carried at amortised cost using the effective interest method until the debt is extinguished on conversion or redemption of the bonds.
The derivative financial instruments component is determined by the fair value of the embedded derivatives on the date of issue. The fair value is reassessed at every balance sheet date and the difference is recognised in the profit and loss account.
The balance after reducing the debt component and the fair value of the embedded derivatives component from the net proceeds is presented as capital reserve under equity. The carrying amount of the equity component is not adjusted in subsequent periods. When the conversion option is exercised, the carrying amount of the equity component will be transferred to the share capital account. When the conversion option lapses, its carrying amount will be transferred to retained earnings.
2.34 Related parties
A related party is defined as follows:-
(a) A person or a close member of that person’s family is related to the Group and Company if that person:
(i) Has control or joint control over the Company;
(ii) Has significant influence over the Company; or
(iii) Is a member of the key management personnel of the Group or Company or of a parent of the Company.
(b) An entity is related to the Group and the Company if any of the following conditions applies:-
(i) The entity and the Company are members of the same group (which means that each parent, subsidiary and fellow subsidiary is related to the others).
(ii) One entity is an associate or joint venture of the other entity (or an associate or joint venture of a member of a group of which the other entity is a member).
(iii) Both entities are joint ventures of the same third party.
(iv) One entity is a joint venture of a third entity and the other entity is an associate of the third entity.
(v) The entity is a post-employment benefit plan for the benefit of employees of either the Company or an entity related to the Company. If the Company is itself such a plan, the sponsoring employers are also related to the Company.
(vi) The entity is controlled or jointly controlled by a person identified in (a).
(vii) A person identified in (a) (i) has significant influence over the entity or is a member of the key management personnel of the entity (or of a parent of the entity).
125
Notes to the Financial Statements
3. Significant accounting judgements and estimatesThe preparation of the Group’s financial statements requires management to make judgements, estimates and assumptions that affect the reported amounts of revenues, expenses, assets and liabilities, and the disclosure of contingent liabilities at the reporting date. However, uncertainty about these assumptions and estimates could result in outcomes that could require a material adjustment to the carrying amount of the asset or liability affected in the future.
3.1 Judgements made in applying accounting policies
In the process of applying the accounting policies, management has made the following judgements, apart from those involving estimations, which have the most significant effects on the amounts recognised in the financial statements:
(a) Determination of functional currency
The Group measures foreign currency transactions in the respective functional currencies of the Company and its subsidiaries. In determining the functional currencies of the entities in the Group, judgement is required to determine the currency that mainly influences sales prices for goods and services and of the country whose competitive forces and regulations mainly determine the sales prices of the goods and services. The functional currencies of the entities in the Group are determined based on management’s assessment of the economic environment in which the entities operate and the entities’ process of determining sales prices.
(b) Fair value of derivative financial instruments and debt components of convertible bonds
The Company assesses the fair value of derivative financial instruments and debt components of the convertible bonds that require judgement in determining the most appropriate valuation models and inputs including share volatility and interest yield rates.
(c) Income taxes
The Group has exposure to income taxes in numerous jurisdictions. A degree of judgement is involved in determining the Group-wide provision for income taxes. There are certain transactions and computations for which the ultimate tax determination is uncertain during the ordinary course of business. The Group recognises liabilities for expected tax issues based on estimates of whether additional taxes would be due. Where the final tax outcome of these matters is different from the amounts that were initially recognised, such differences will impact the income tax and deferred tax provisions in the period in which such determination is made.
3.2 Key sources of estimation uncertainty
The key assumptions concerning the future and other key sources of estimating uncertainty as at the balance sheet date, that have a significant risk of causing a material adjustment to the carrying amounts of assets and liabilities within the next financial year, are discussed below.
(a) Impairment of investments in subsidiary companies
The Company assesses at each reporting date whether there is an indication that the investments in subsidiaries may be impaired. This requires an estimation of the value in use of the cash generating units. Estimating the value in use requires the Company to make an estimate of the expected future cash flows from the cash generating units and also to choose a suitable discount rate in order to calculate the present value of those cash flows. The carrying amount of the Company’s investment in subsidiary companies at the balance sheet date is disclosed in Note 13 to the financial statements.
(b) Impairment of goodwill and intangible assets with indefinite useful life
On an annual basis, the Group determines whether goodwill and intangible asset with indefinite useful life is impaired. This requires an estimation of the value in use of the cash generating units to which the goodwill and intangible asset with indefinite useful life is allocated. Estimating the value in use requires the Group to make an estimate of the expected future cash flows from the cash generating units and also to choose a suitable discount rate in order to calculate the present value of those cash flows. The carrying amount of the Group’s goodwill and intangible assets with indefinite useful life at the balance sheet date is disclosed in Note 11 to the financial statements.
126
Notes to the Financial Statements
3. Significant accounting judgements and estimates (cont’d)3.2 Key sources of estimation uncertainty (cont’d)
(c) Impairment of property, plant and equipment
An impairment exists when the carrying value of an asset exceeds its recoverable amount, which is the higher of its fair value less costs to sell and its value in use. The fair value less costs to sell calculation is based on available data from binding sales transactions in an arm’s length transaction of similar assets or observable market prices less incremental costs for disposing the asset. The value in use calculation is based on a discounted cash flow model and requires the Group to make an estimate of the expected future cash flows from the cash generating units and also to choose a suitable discount rate in order to calculate the present value of those cash flows. The carrying amount of the Group’s property, plant and equipment at the balance sheet date is disclosed in Note 10 to the financial statements.
(d) Useful lives of plant and machinery
The cost of plant and machinery is depreciated on a straight-line basis over the plant and machinery’s estimated economic useful lives. Management estimates the useful lives of these plant and machinery to be within 5 to 20 years, with the exception of ginning assets, where the estimated useful lives of ginning assets are up to 30 years. These are common life expectancies applied in the agri-commodities industry. Changes in the expected level of usage and technological developments could impact the economic useful lives and the residual values of these assets, therefore, future depreciation charges could be revised. The carrying amount of the Group’s plant and machinery at the balance sheet date is disclosed in Note 10 to the financial statements.
(e) Employee share options
The Group measures the cost of equity-settled transactions with employees by reference to the fair value of the employee share options at the date on which they are granted. Judgement is required in determining the most appropriate valuation model for the share options granted, depending on the terms and conditions of the grant. Management is also required to use judgement in determining the most appropriate inputs to the valuation model including expected life of the option, volatility and dividend yield. The assumptions and model used are disclosed in Note 29.
(f) Biological assets
The Group’s biological assets (other than annual crops) are stated at fair value less point-of-sale costs. This is estimated by reference to the fair value of the biological assets assessed by an independent valuer. Changes in the conditions of the biological assets could impact the fair value of the assets. The carrying amount of the Group’s biological assets at the balance sheet date is disclosed in Note 12 to the financial statements.
(g) Impairment loss on investment in associates
Investment in associates mainly relates to dairy processing investment in Open Country Dairy Limited (“OCDL”) and high intensity natural sweetener investment in PureCircle Limited (“PCL”).
The value in use calculations were based on the discounted cash flow model. The cash flows were derived from the budget for the next five years. The recoverable amount is sensitive to estimates and assumptions on expected sales volume and future sale prices, expected future costs and expenses, weighted average cost of capital as well as terminal growth rates. Actual outcomes could differ from these estimates and assumptions. The aggregate carrying amount of the Group’s investment in OCDL and PCL as at 30 June 2012 was $218,524,000 (2011: $202,951,000).
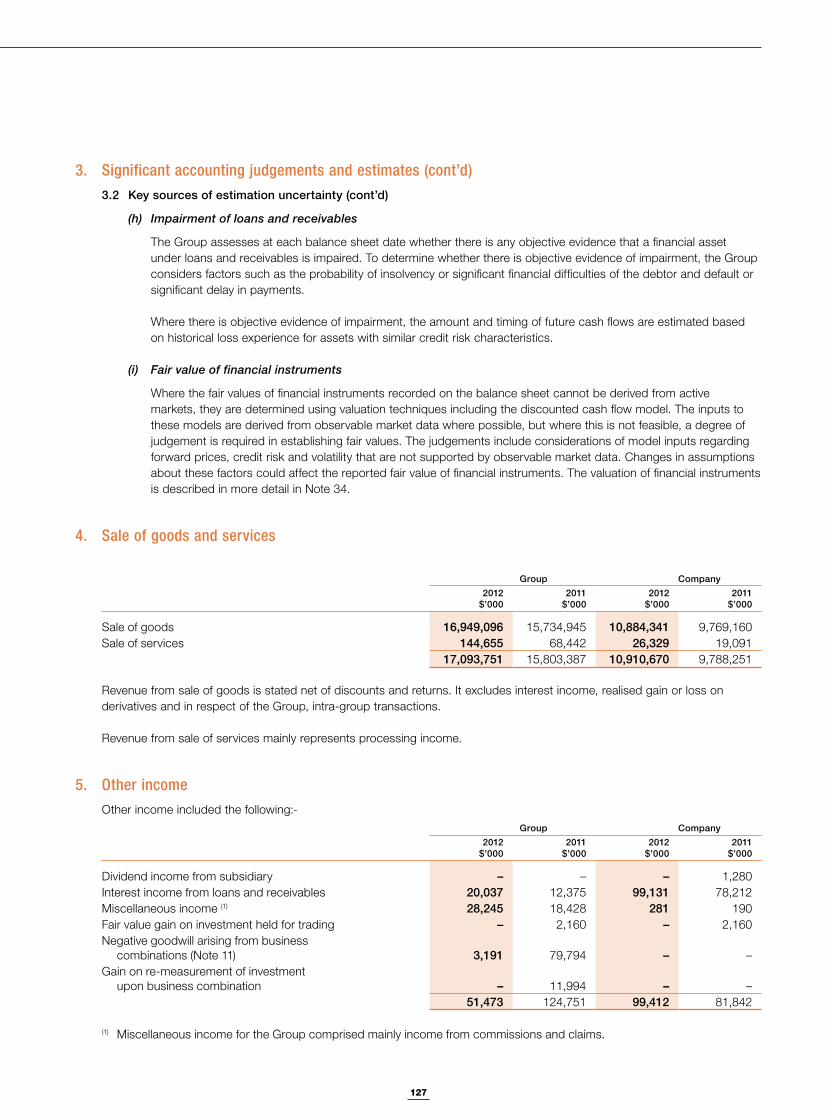
127
Notes to the Financial Statements
3. Significant accounting judgements and estimates (cont’d)3.2 Key sources of estimation uncertainty (cont’d)
(h) Impairment of loans and receivables
The Group assesses at each balance sheet date whether there is any objective evidence that a financial asset under loans and receivables is impaired. To determine whether there is objective evidence of impairment, the Group considers factors such as the probability of insolvency or significant financial difficulties of the debtor and default or significant delay in payments.
Where there is objective evidence of impairment, the amount and timing of future cash flows are estimated based on historical loss experience for assets with similar credit risk characteristics.
(i) Fair value of financial instruments
Where the fair values of financial instruments recorded on the balance sheet cannot be derived from active markets, they are determined using valuation techniques including the discounted cash flow model. The inputs to these models are derived from observable market data where possible, but where this is not feasible, a degree of judgement is required in establishing fair values. The judgements include considerations of model inputs regarding forward prices, credit risk and volatility that are not supported by observable market data. Changes in assumptions about these factors could affect the reported fair value of financial instruments. The valuation of financial instruments is described in more detail in Note 34.
4. Sale of goods and services
Group Company2012
$’0002011
$’0002012
$’0002011
$’000
Sale of goods 16,949,096 15,734,945 10,884,341 9,769,160Sale of services 144,655 68,442 26,329 19,091
17,093,751 15,803,387 10,910,670 9,788,251
Revenue from sale of goods is stated net of discounts and returns. It excludes interest income, realised gain or loss on derivatives and in respect of the Group, intra-group transactions.
Revenue from sale of services mainly represents processing income.
5. Other incomeOther income included the following:-
Group Company2012
$’0002011
$’0002012
$’0002011
$’000
Dividend income from subsidiary – – – 1,280Interest income from loans and receivables 20,037 12,375 99,131 78,212Miscellaneous income (1) 28,245 18,428 281 190Fair value gain on investment held for trading – 2,160 – 2,160Negative goodwill arising from business
combinations (Note 11) 3,191 79,794 – –Gain on re-measurement of investment
upon business combination – 11,994 – –51,473 124,751 99,412 81,842
(1) Miscellaneous income for the Group comprised mainly income from commissions and claims.
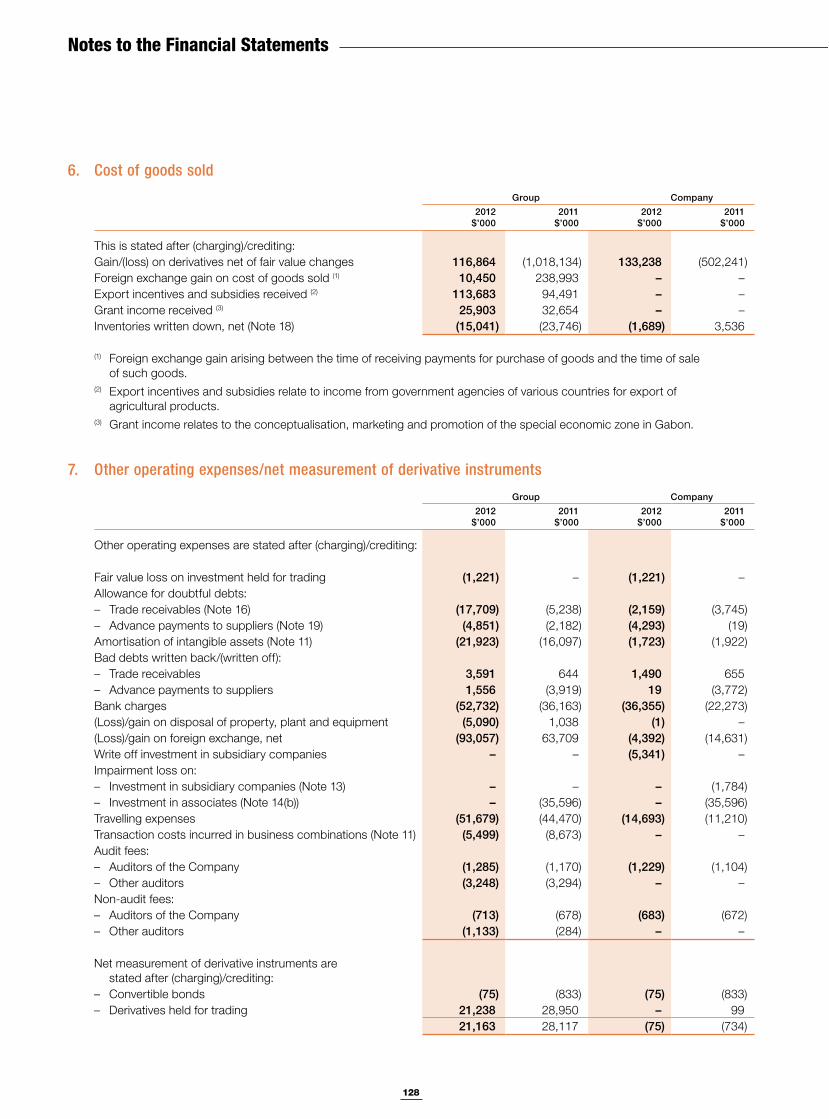
128
Notes to the Financial Statements
6. Cost of goods sold
Group Company2012
$’0002011
$’0002012
$’0002011
$’000
This is stated after (charging)/crediting:Gain/(loss) on derivatives net of fair value changes 116,864 (1,018,134) 133,238 (502,241)Foreign exchange gain on cost of goods sold (1) 10,450 238,993 – –Export incentives and subsidies received (2) 113,683 94,491 – –Grant income received (3) 25,903 32,654 – –Inventories written down, net (Note 18) (15,041) (23,746) (1,689) 3,536
(1) Foreign exchange gain arising between the time of receiving payments for purchase of goods and the time of sale of such goods.
(2) Export incentives and subsidies relate to income from government agencies of various countries for export of agricultural products.
(3) Grant income relates to the conceptualisation, marketing and promotion of the special economic zone in Gabon.
7. Other operating expenses/net measurement of derivative instruments
Group Company2012
$’0002011
$’0002012
$’0002011
$’000
Other operating expenses are stated after (charging)/crediting:
Fair value loss on investment held for trading (1,221) – (1,221) –Allowance for doubtful debts:– Trade receivables (Note 16) (17,709) (5,238) (2,159) (3,745)– Advance payments to suppliers (Note 19) (4,851) (2,182) (4,293) (19)Amortisation of intangible assets (Note 11) (21,923) (16,097) (1,723) (1,922)Bad debts written back/(written off):– Trade receivables 3,591 644 1,490 655– Advance payments to suppliers 1,556 (3,919) 19 (3,772)Bank charges (52,732) (36,163) (36,355) (22,273)(Loss)/gain on disposal of property, plant and equipment (5,090) 1,038 (1) –(Loss)/gain on foreign exchange, net (93,057) 63,709 (4,392) (14,631)Write off investment in subsidiary companies – – (5,341) –Impairment loss on:– Investment in subsidiary companies (Note 13) – – – (1,784)– Investment in associates (Note 14(b)) – (35,596) – (35,596)Travelling expenses (51,679) (44,470) (14,693) (11,210)Transaction costs incurred in business combinations (Note 11) (5,499) (8,673) – –Audit fees:– Auditors of the Company (1,285) (1,170) (1,229) (1,104)– Other auditors (3,248) (3,294) – –Non-audit fees:– Auditors of the Company (713) (678) (683) (672)– Other auditors (1,133) (284) – –
Net measurement of derivative instruments are stated after (charging)/crediting:
– Convertible bonds (75) (833) (75) (833)– Derivatives held for trading 21,238 28,950 – 99
21,163 28,117 (75) (734)
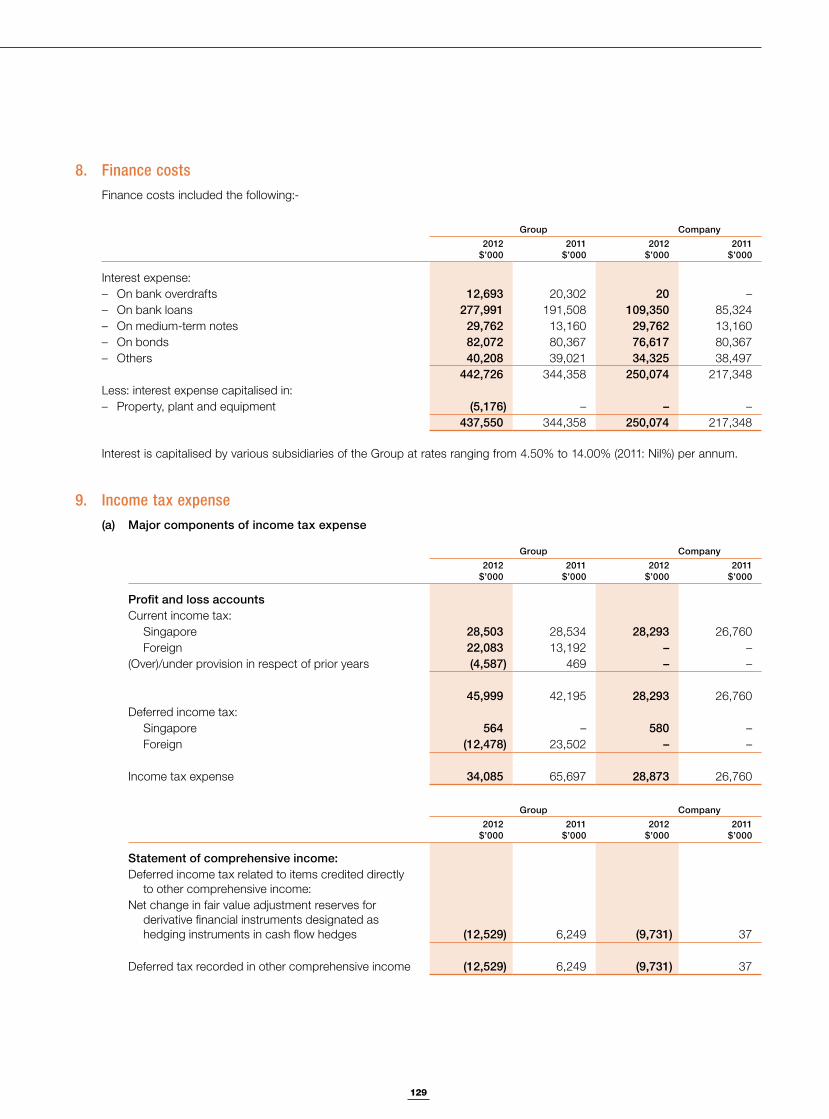
129
Notes to the Financial Statements
8. Finance costsFinance costs included the following:-
Group Company2012
$’0002011
$’0002012
$’0002011
$’000
Interest expense:– On bank overdrafts 12,693 20,302 20 –– On bank loans 277,991 191,508 109,350 85,324– On medium-term notes 29,762 13,160 29,762 13,160– On bonds 82,072 80,367 76,617 80,367– Others 40,208 39,021 34,325 38,497
442,726 344,358 250,074 217,348Less: interest expense capitalised in:– Property, plant and equipment (5,176) – – –
437,550 344,358 250,074 217,348
Interest is capitalised by various subsidiaries of the Group at rates ranging from 4.50% to 14.00% (2011: Nil%) per annum.
9. Income tax expense(a) Major components of income tax expense
Group Company2012
$’0002011
$’0002012
$’0002011
$’000
Profit and loss accountsCurrent income tax:
Singapore 28,503 28,534 28,293 26,760Foreign 22,083 13,192 – –
(Over)/under provision in respect of prior years (4,587) 469 – –
45,999 42,195 28,293 26,760Deferred income tax:
Singapore 564 – 580 –Foreign (12,478) 23,502 – –
Income tax expense 34,085 65,697 28,873 26,760
Group Company2012
$’0002011
$’0002012
$’0002011
$’000
Statement of comprehensive income:Deferred income tax related to items credited directly
to other comprehensive income: Net change in fair value adjustment reserves for
derivative financial instruments designated as hedging instruments in cash flow hedges (12,529) 6,249 (9,731) 37
Deferred tax recorded in other comprehensive income (12,529) 6,249 (9,731) 37
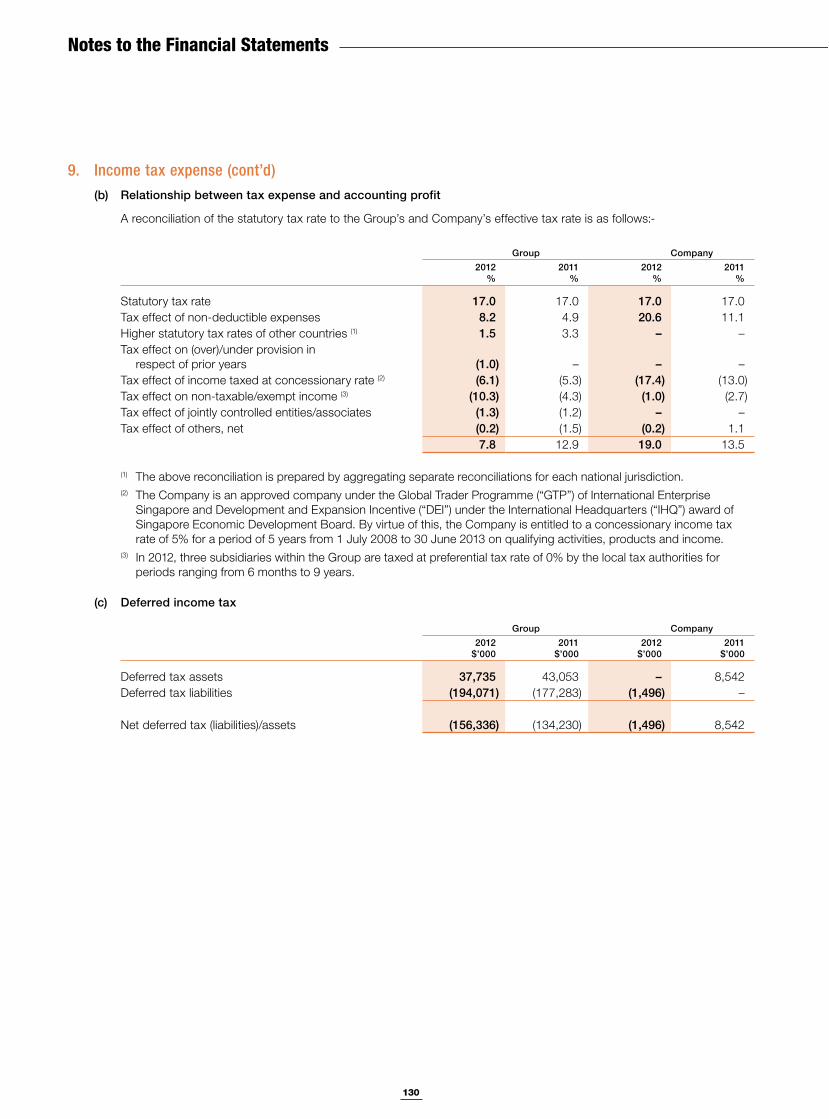
130
Notes to the Financial Statements
9. Income tax expense (cont’d)(b) Relationship between tax expense and accounting profit
A reconciliation of the statutory tax rate to the Group’s and Company’s effective tax rate is as follows:-
Group Company2012
%2011
%2012
%2011
%
Statutory tax rate 17.0 17.0 17.0 17.0Tax effect of non-deductible expenses 8.2 4.9 20.6 11.1Higher statutory tax rates of other countries (1) 1.5 3.3 – –Tax effect on (over)/under provision in
respect of prior years (1.0) – – –Tax effect of income taxed at concessionary rate (2) (6.1) (5.3) (17.4) (13.0)Tax effect on non-taxable/exempt income (3) (10.3) (4.3) (1.0) (2.7)Tax effect of jointly controlled entities/associates (1.3) (1.2) – –Tax effect of others, net (0.2) (1.5) (0.2) 1.1
7.8 12.9 19.0 13.5
(1) The above reconciliation is prepared by aggregating separate reconciliations for each national jurisdiction.(2) The Company is an approved company under the Global Trader Programme (“GTP”) of International Enterprise
Singapore and Development and Expansion Incentive (“DEI”) under the International Headquarters (“IHQ”) award of Singapore Economic Development Board. By virtue of this, the Company is entitled to a concessionary income tax rate of 5% for a period of 5 years from 1 July 2008 to 30!June 2013 on qualifying activities, products and income.
(3) In 2012, three subsidiaries within the Group are taxed at preferential tax rate of 0% by the local tax authorities for periods ranging from 6 months to 9 years.
(c) Deferred income tax
Group Company2012
$’0002011
$’0002012
$’0002011
$’000
Deferred tax assets 37,735 43,053 – 8,542Deferred tax liabilities (194,071) (177,283) (1,496) –
Net deferred tax (liabilities)/assets (156,336) (134,230) (1,496) 8,542
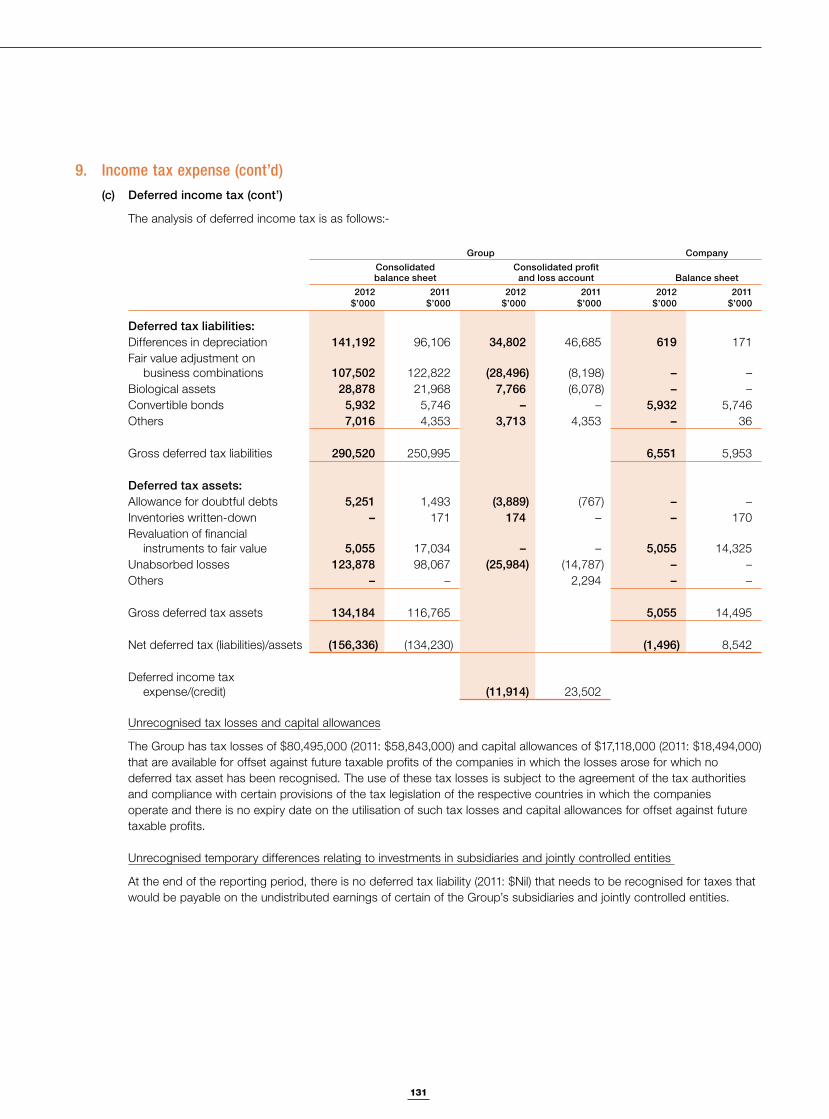
131
Notes to the Financial Statements
9. Income tax expense (cont’d)(c) Deferred income tax (cont’)
The analysis of deferred income tax is as follows:-
Group CompanyConsolidated balance sheet
Consolidated profit and loss account Balance sheet
2012$’000
2011$’000
2012$’000
2011$’000
2012$’000
2011$’000
Deferred tax liabilities:Differences in depreciation 141,192 96,106 34,802 46,685 619 171Fair value adjustment on
business combinations 107,502 122,822 (28,496) (8,198) – –Biological assets 28,878 21,968 7,766 (6,078) – –Convertible bonds 5,932 5,746 – – 5,932 5,746Others 7,016 4,353 3,713 4,353 – 36
Gross deferred tax liabilities 290,520 250,995 6,551 5,953
Deferred tax assets:Allowance for doubtful debts 5,251 1,493 (3,889) (767) – –Inventories written-down – 171 174 – – 170Revaluation of financial
instruments to fair value 5,055 17,034 – – 5,055 14,325Unabsorbed losses 123,878 98,067 (25,984) (14,787) – –Others – – 2,294 – –
Gross deferred tax assets 134,184 116,765 5,055 14,495
Net deferred tax (liabilities)/assets (156,336) (134,230) (1,496) 8,542
Deferred income tax expense/(credit) (11,914) 23,502
Unrecognised tax losses and capital allowances
The Group has tax losses of $80,495,000 (2011: $58,843,000) and capital allowances of $17,118,000 (2011: $18,494,000) that are available for offset against future taxable profits of the companies in which the losses arose for which no deferred tax asset has been recognised. The use of these tax losses is subject to the agreement of the tax authorities and compliance with certain provisions of the tax legislation of the respective countries in which the companies operate and there is no expiry date on the utilisation of such tax losses and capital allowances for offset against future taxable profits.
Unrecognised temporary differences relating to investments in subsidiaries and jointly controlled entities
At the end of the reporting period, there is no deferred tax liability (2011: $Nil) that needs to be recognised for taxes that would be payable on the undistributed earnings of certain of the Group’s subsidiaries and jointly controlled entities.
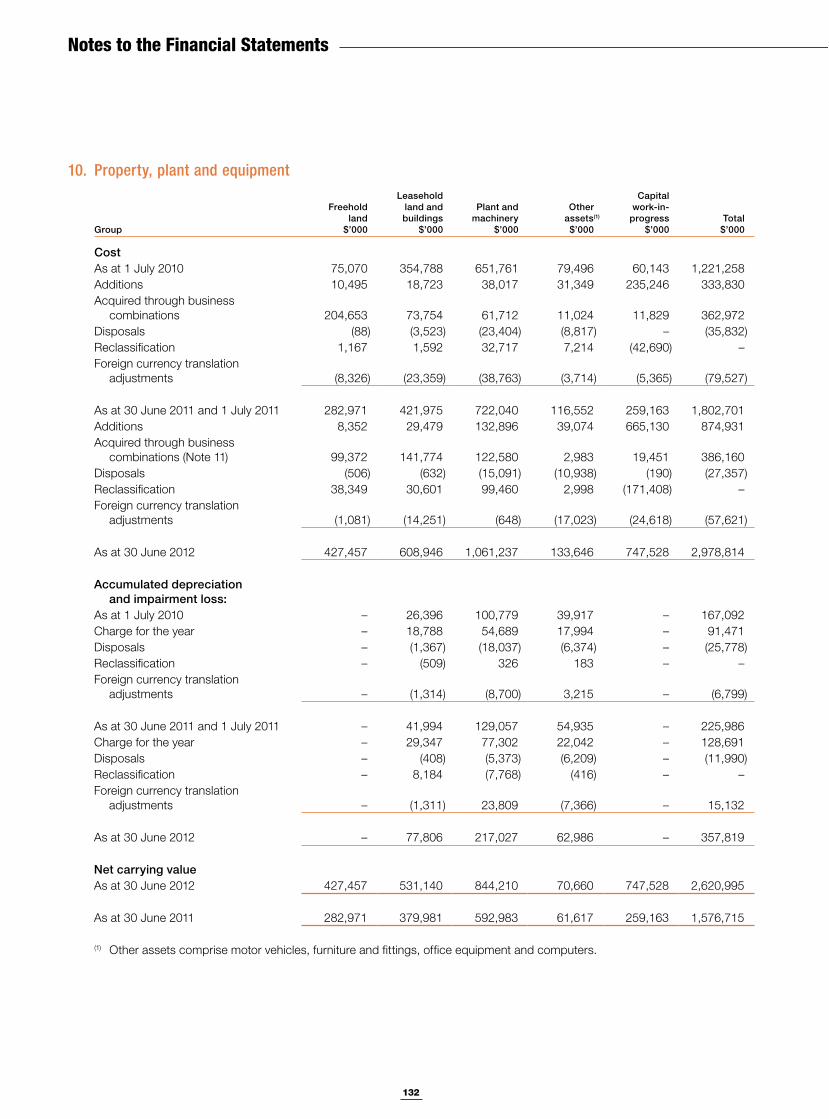
132
Notes to the Financial Statements
10. Property, plant and equipment
Group
Freeholdland
$’000
Leaseholdland and buildings
$’000
Plant and machinery
$’000
Otherassets(1)
$’000
Capital work-in-
progress$’000
Total$’000
CostAs at 1 July 2010 75,070 354,788 651,761 79,496 60,143 1,221,258Additions 10,495 18,723 38,017 31,349 235,246 333,830Acquired through business
combinations 204,653 73,754 61,712 11,024 11,829 362,972Disposals (88) (3,523) (23,404) (8,817) – (35,832)Reclassification 1,167 1,592 32,717 7,214 (42,690) –Foreign currency translation
adjustments (8,326) (23,359) (38,763) (3,714) (5,365) (79,527)
As at 30 June 2011 and 1 July 2011 282,971 421,975 722,040 116,552 259,163 1,802,701Additions 8,352 29,479 132,896 39,074 665,130 874,931Acquired through business
combinations (Note 11) 99,372 141,774 122,580 2,983 19,451 386,160Disposals (506) (632) (15,091) (10,938) (190) (27,357)Reclassification 38,349 30,601 99,460 2,998 (171,408) –Foreign currency translation
adjustments (1,081) (14,251) (648) (17,023) (24,618) (57,621)
As at 30 June 2012 427,457 608,946 1,061,237 133,646 747,528 2,978,814
Accumulated depreciation and impairment loss:
As at 1 July 2010 – 26,396 100,779 39,917 – 167,092Charge for the year – 18,788 54,689 17,994 – 91,471Disposals – (1,367) (18,037) (6,374) – (25,778)Reclassification – (509) 326 183 – –Foreign currency translation
adjustments – (1,314) (8,700) 3,215 – (6,799)
As at 30 June 2011 and 1 July 2011 – 41,994 129,057 54,935 – 225,986Charge for the year – 29,347 77,302 22,042 – 128,691Disposals – (408) (5,373) (6,209) – (11,990)Reclassification – 8,184 (7,768) (416) – –Foreign currency translation
adjustments – (1,311) 23,809 (7,366) – 15,132
As at 30 June 2012 – 77,806 217,027 62,986 – 357,819
Net carrying valueAs at 30 June 2012 427,457 531,140 844,210 70,660 747,528 2,620,995
As at 30 June 2011 282,971 379,981 592,983 61,617 259,163 1,576,715
(1) Other assets comprise motor vehicles, furniture and fittings, office equipment and computers.
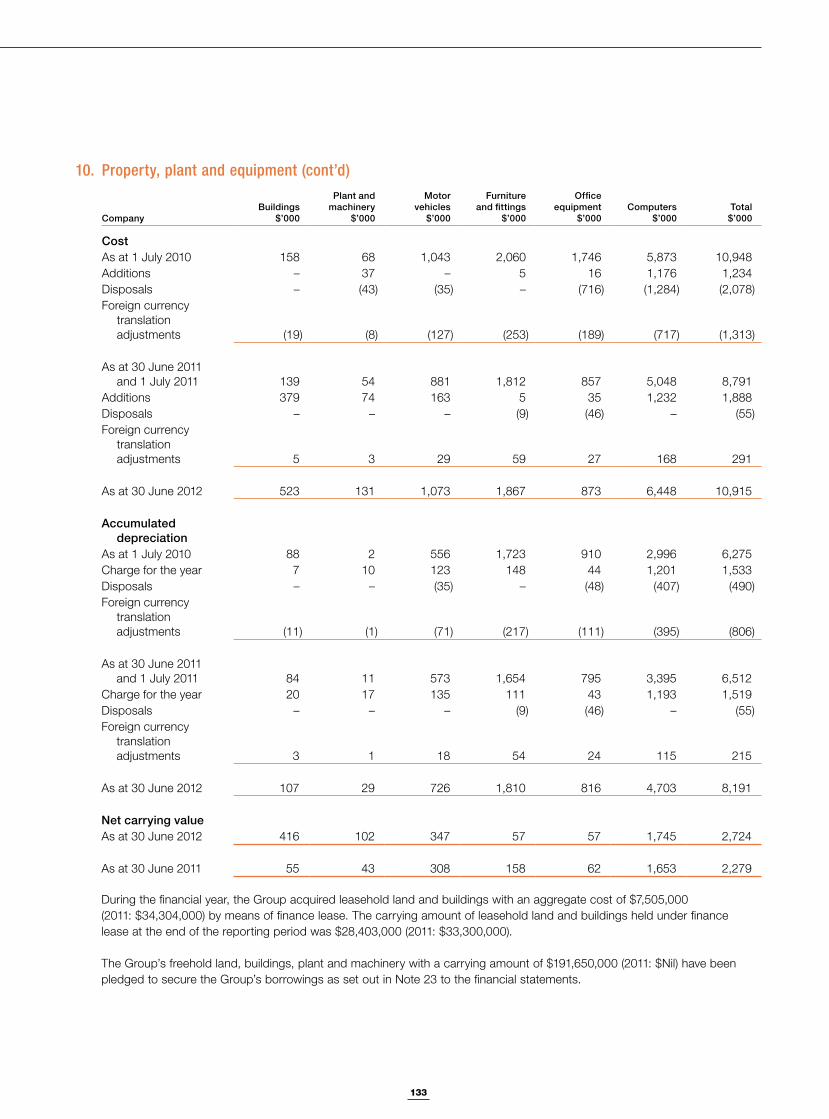
133
Notes to the Financial Statements
10. Property, plant and equipment (cont’d)
CompanyBuildings
$’000
Plant andmachinery
$’000
Motorvehicles
$’000
Furnitureand fittings
$’000
Officeequipment
$’000Computers
$’000Total
$’000
CostAs at 1 July 2010 158 68 1,043 2,060 1,746 5,873 10,948Additions – 37 – 5 16 1,176 1,234Disposals – (43) (35) – (716) (1,284) (2,078)Foreign currency
translation adjustments (19) (8) (127) (253) (189) (717) (1,313)
As at 30 June 2011 and 1 July 2011 139 54 881 1,812 857 5,048 8,791
Additions 379 74 163 5 35 1,232 1,888Disposals – – – (9) (46) – (55)Foreign currency
translation adjustments 5 3 29 59 27 168 291
As at 30 June 2012 523 131 1,073 1,867 873 6,448 10,915
Accumulated depreciation
As at 1 July 2010 88 2 556 1,723 910 2,996 6,275Charge for the year 7 10 123 148 44 1,201 1,533Disposals – – (35) – (48) (407) (490)Foreign currency
translation adjustments (11) (1) (71) (217) (111) (395) (806)
As at 30 June 2011 and 1 July 2011 84 11 573 1,654 795 3,395 6,512
Charge for the year 20 17 135 111 43 1,193 1,519Disposals – – – (9) (46) – (55)Foreign currency
translation adjustments 3 1 18 54 24 115 215
As at 30 June 2012 107 29 726 1,810 816 4,703 8,191
Net carrying valueAs at 30 June 2012 416 102 347 57 57 1,745 2,724
As at 30 June 2011 55 43 308 158 62 1,653 2,279
During the financial year, the Group acquired leasehold land and buildings with an aggregate cost of $7,505,000 (2011: $34,304,000) by means of finance lease. The carrying amount of leasehold land and buildings held under finance lease at the end of the reporting period was $28,403,000 (2011: $33,300,000).
The Group’s freehold land, buildings, plant and machinery with a carrying amount of $191,650,000 (2011: $Nil) have been pledged to secure the Group’s borrowings as set out in Note 23 to the financial statements.
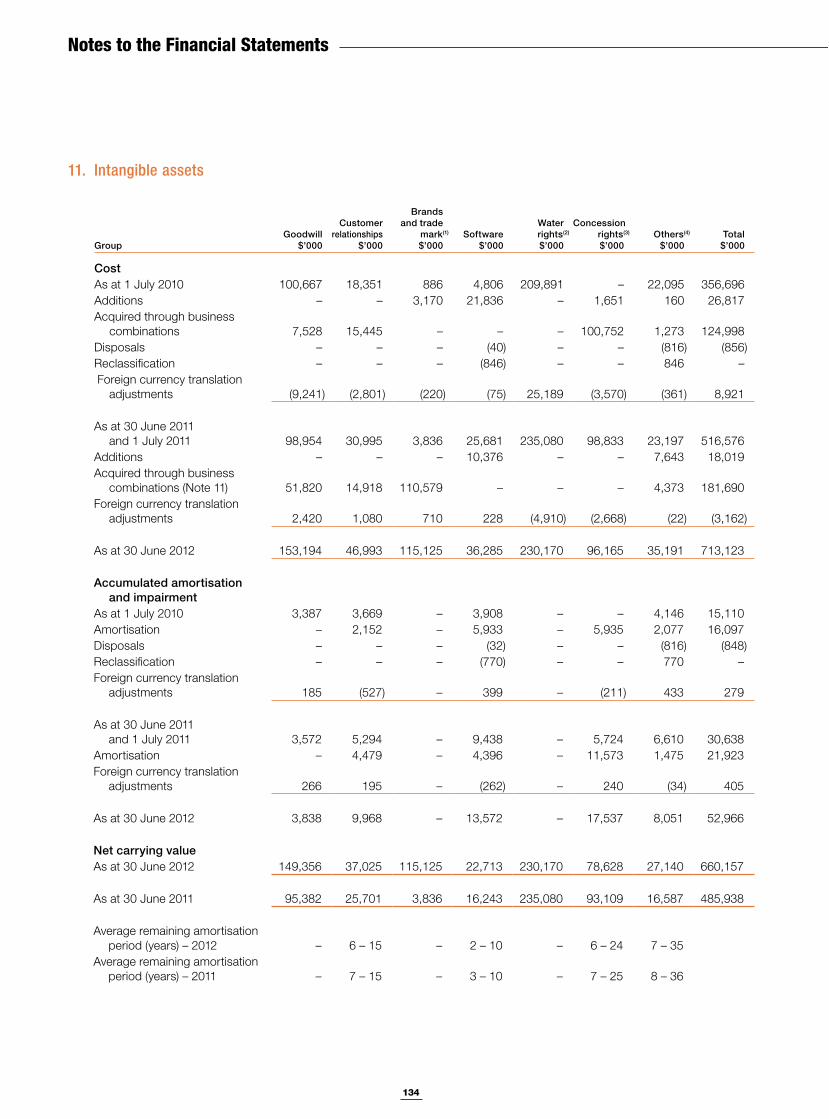
134
Notes to the Financial Statements
11. Intangible assets
GroupGoodwill
$’000
Customer relationships
$’000
Brands and trade
mark(1)
$’000Software
$’000
Waterrights(2)
$’000
Concessionrights(3)
$’000Others(4)
$’000Total
$’000
CostAs at 1 July 2010 100,667 18,351 886 4,806 209,891 – 22,095 356,696Additions – – 3,170 21,836 – 1,651 160 26,817Acquired through business
combinations 7,528 15,445 – – – 100,752 1,273 124,998Disposals – – – (40) – – (816) (856)Reclassification – – – (846) – – 846 – Foreign currency translation
adjustments (9,241) (2,801) (220) (75) 25,189 (3,570) (361) 8,921
As at 30 June 2011 and 1 July 2011 98,954 30,995 3,836 25,681 235,080 98,833 23,197 516,576
Additions – – – 10,376 – – 7,643 18,019Acquired through business
combinations (Note 11) 51,820 14,918 110,579 – – – 4,373 181,690Foreign currency translation
adjustments 2,420 1,080 710 228 (4,910) (2,668) (22) (3,162)
As at 30 June 2012 153,194 46,993 115,125 36,285 230,170 96,165 35,191 713,123
Accumulated amortisation and impairment
As at 1 July 2010 3,387 3,669 – 3,908 – – 4,146 15,110Amortisation – 2,152 – 5,933 – 5,935 2,077 16,097Disposals – – – (32) – – (816) (848)Reclassification – – – (770) – – 770 –Foreign currency translation
adjustments 185 (527) – 399 – (211) 433 279
As at 30 June 2011 and 1 July 2011 3,572 5,294 – 9,438 – 5,724 6,610 30,638
Amortisation – 4,479 – 4,396 – 11,573 1,475 21,923Foreign currency translation
adjustments 266 195 – (262) – 240 (34) 405
As at 30 June 2012 3,838 9,968 – 13,572 – 17,537 8,051 52,966
Net carrying valueAs at 30 June 2012 149,356 37,025 115,125 22,713 230,170 78,628 27,140 660,157
As at 30 June 2011 95,382 25,701 3,836 16,243 235,080 93,109 16,587 485,938
Average remaining amortisation period (years) – 2012 – 6 – 15 – 2 – 10 – 6 – 24 7 – 35
Average remaining amortisation period (years) – 2011 – 7 – 15 – 3 – 10 – 7 – 25 8 – 36
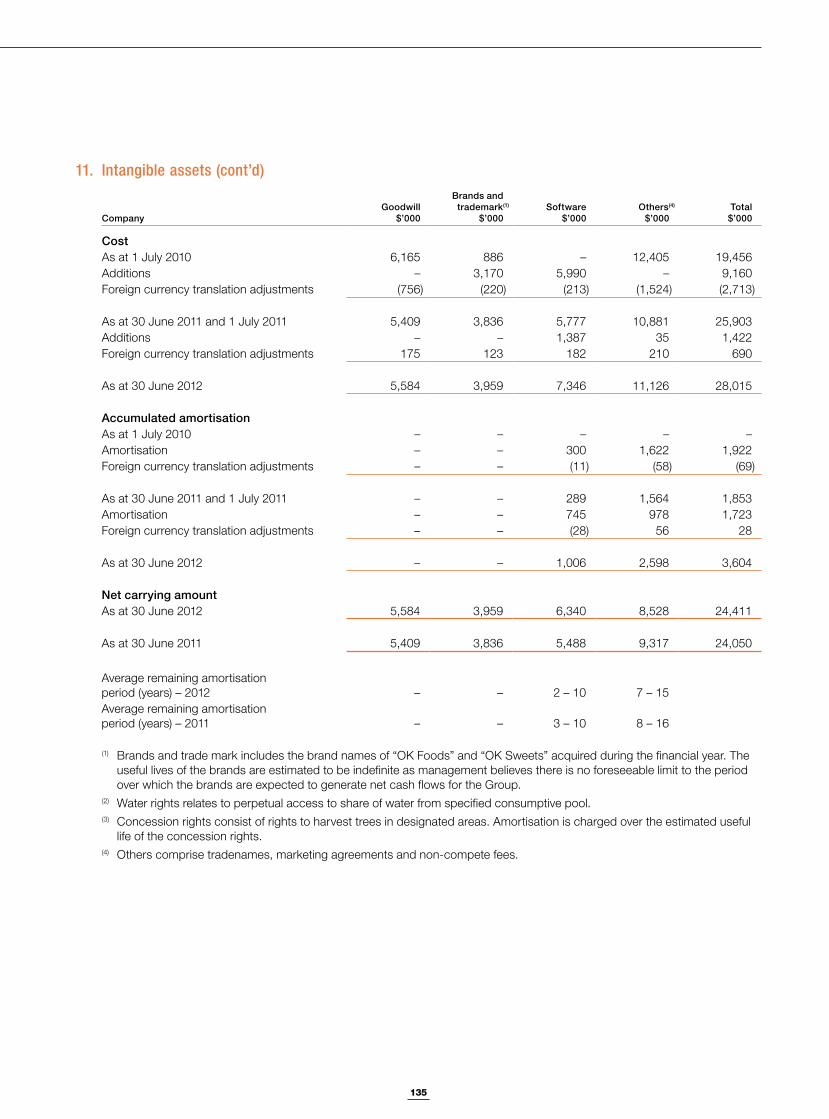
135
Notes to the Financial Statements
11. Intangible assets (cont’d)
CompanyGoodwill
$’000
Brands and trademark(1)
$’000Software
$’000Others(4)
$’000Total
$’000
CostAs at 1 July 2010 6,165 886 – 12,405 19,456Additions – 3,170 5,990 – 9,160Foreign currency translation adjustments (756) (220) (213) (1,524) (2,713)
As at 30 June 2011 and 1 July 2011 5,409 3,836 5,777 10,881 25,903Additions – – 1,387 35 1,422Foreign currency translation adjustments 175 123 182 210 690
As at 30 June 2012 5,584 3,959 7,346 11,126 28,015
Accumulated amortisationAs at 1 July 2010 – – – – –Amortisation – – 300 1,622 1,922Foreign currency translation adjustments – – (11) (58) (69)
As at 30 June 2011 and 1 July 2011 – – 289 1,564 1,853Amortisation – – 745 978 1,723Foreign currency translation adjustments – – (28) 56 28
As at 30 June 2012 – – 1,006 2,598 3,604
Net carrying amountAs at 30 June 2012 5,584 3,959 6,340 8,528 24,411
As at 30 June 2011 5,409 3,836 5,488 9,317 24,050
Average remaining amortisationperiod (years) – 2012 – – 2 – 10 7 – 15Average remaining amortisationperiod (years) – 2011 – – 3 – 10 8 – 16
(1) Brands and trade mark includes the brand names of “OK Foods” and “OK Sweets” acquired during the financial year. The useful lives of the brands are estimated to be indefinite as management believes there is no foreseeable limit to the period over which the brands are expected to generate net cash flows for the Group.
(2) Water rights relates to perpetual access to share of water from specified consumptive pool.(3) Concession rights consist of rights to harvest trees in designated areas. Amortisation is charged over the estimated useful
life of the concession rights.(4) Others comprise tradenames, marketing agreements and non-compete fees.
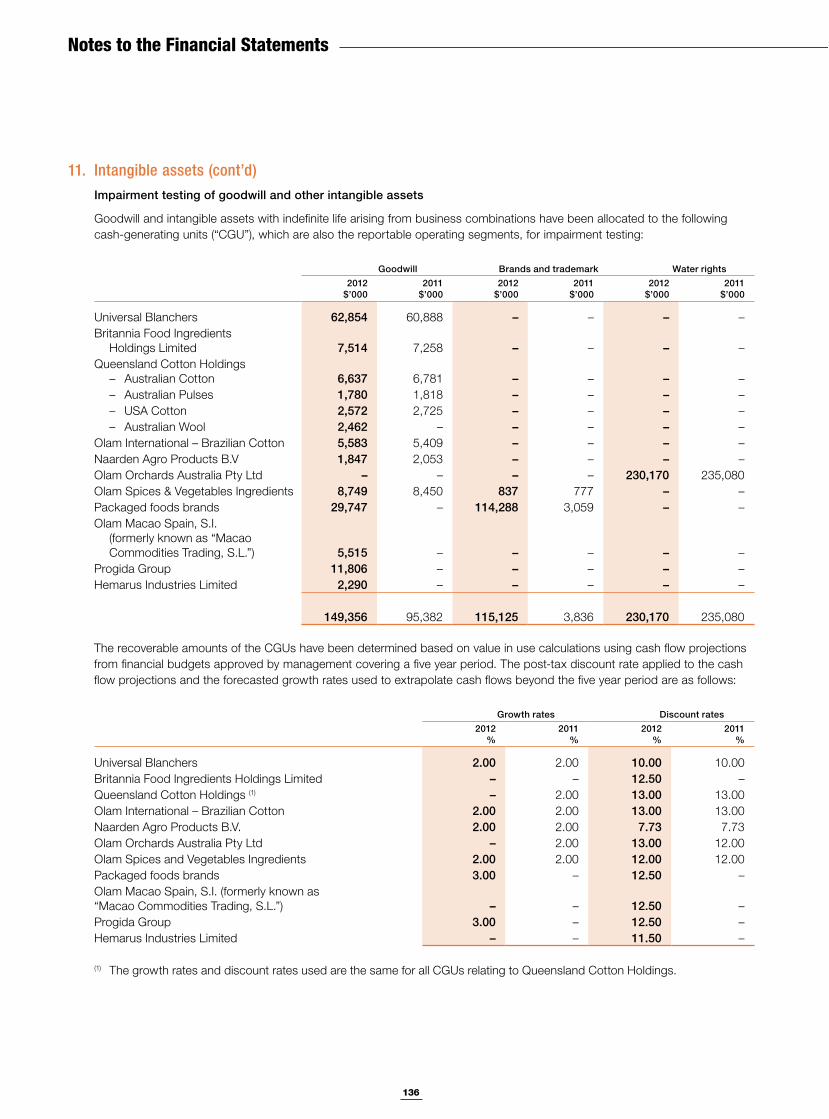
136
Notes to the Financial Statements
11. Intangible assets (cont’d)Impairment testing of goodwill and other intangible assets
Goodwill and intangible assets with indefinite life arising from business combinations have been allocated to the following cash-generating units (“CGU”), which are also the reportable operating segments, for impairment testing:
Goodwill Brands and trademark Water rights2012
$’0002011
$’0002012
$’0002011
$’0002012
$’0002011
$’000
Universal Blanchers 62,854 60,888 – – – –Britannia Food Ingredients
Holdings Limited 7,514 7,258 – – – –Queensland Cotton Holdings – Australian Cotton 6,637 6,781 – – – – – Australian Pulses 1,780 1,818 – – – – – USA Cotton 2,572 2,725 – – – – – Australian Wool 2,462 – – – – –Olam International – Brazilian Cotton 5,583 5,409 – – – –Naarden Agro Products B.V 1,847 2,053 – – – –Olam Orchards Australia Pty Ltd – – – – 230,170 235,080Olam Spices & Vegetables Ingredients 8,749 8,450 837 777 – –Packaged foods brands 29,747 – 114,288 3,059 – –Olam Macao Spain, S.I.
(formerly known as “Macao Commodities Trading, S.L.”) 5,515 – – – – –
Progida Group 11,806 – – – – –Hemarus Industries Limited 2,290 – – – – –
149,356 95,382 115,125 3,836 230,170 235,080
The recoverable amounts of the CGUs have been determined based on value in use calculations using cash flow projections from financial budgets approved by management covering a five year period. The post-tax discount rate applied to the cash flow projections and the forecasted growth rates used to extrapolate cash flows beyond the five year period are as follows:
Growth rates Discount rates2012
%2011
%2012
%2011
%
Universal Blanchers 2.00 2.00 10.00 10.00Britannia Food Ingredients Holdings Limited – – 12.50 –Queensland Cotton Holdings (1) – 2.00 13.00 13.00Olam International – Brazilian Cotton 2.00 2.00 13.00 13.00Naarden Agro Products B.V. 2.00 2.00 7.73 7.73Olam Orchards Australia Pty Ltd – 2.00 13.00 12.00Olam Spices and Vegetables Ingredients 2.00 2.00 12.00 12.00Packaged foods brands 3.00 – 12.50 –Olam Macao Spain, S.I. (formerly known as “Macao Commodities Trading, S.L.”) – – 12.50 –Progida Group 3.00 – 12.50 –Hemarus Industries Limited – – 11.50 –
(1) The growth rates and discount rates used are the same for all CGUs relating to Queensland Cotton Holdings.
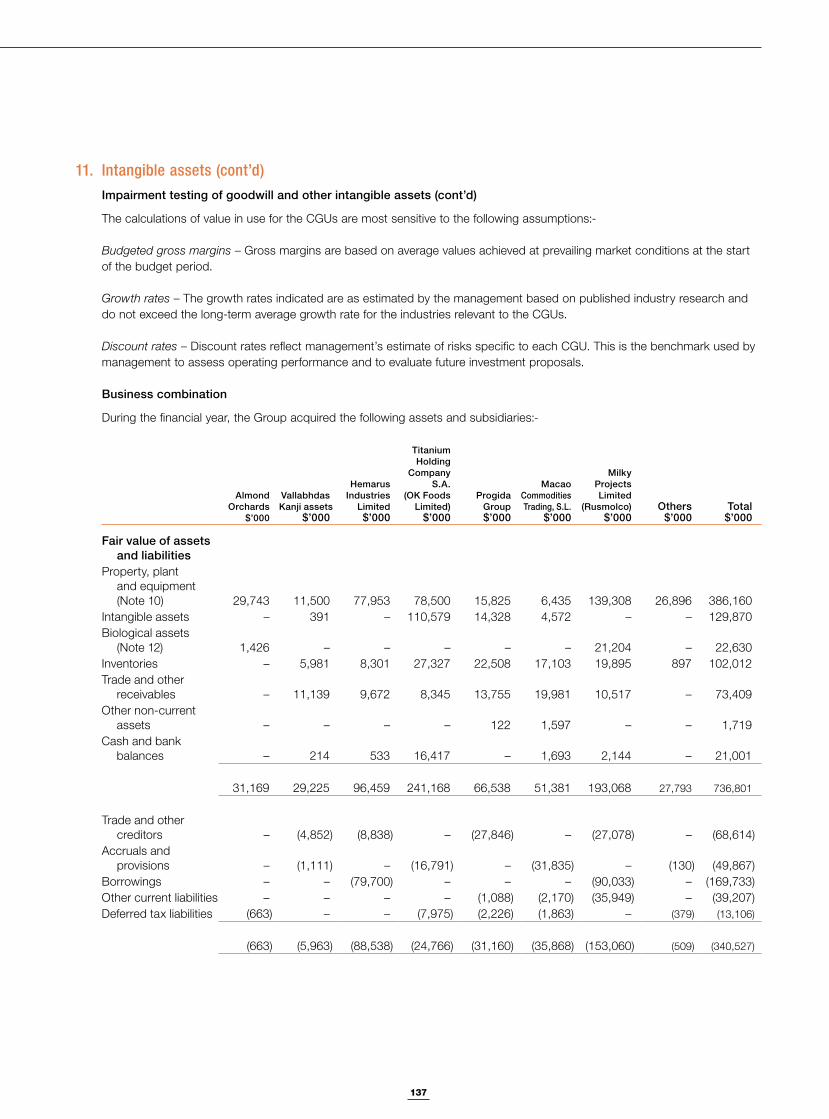
137
Notes to the Financial Statements
11. Intangible assets (cont’d)Impairment testing of goodwill and other intangible assets (cont’d)
The calculations of value in use for the CGUs are most sensitive to the following assumptions:-
Budgeted gross margins – Gross margins are based on average values achieved at prevailing market conditions at the start of the budget period.
Growth rates – The growth rates indicated are as estimated by the management based on published industry research and do not exceed the long-term average growth rate for the industries relevant to the CGUs.
Discount rates – Discount rates reflect management’s estimate of risks specific to each CGU. This is the benchmark used by management to assess operating performance and to evaluate future investment proposals.
Business combination
During the financial year, the Group acquired the following assets and subsidiaries:-
Almond Orchards
$’000
Vallabhdas Kanji assets
$’000
HemarusIndustries
Limited$’000
Titanium Holding
Company S.A.
(OK Foods Limited)
$’000
Progida Group$’000
Macao Commodities Trading, S.L.
$’000
Milky Projects Limited
(Rusmolco) $’000
Others$’000
Total$’000
Fair value of assets and liabilities
Property, plant and equipment (Note 10) 29,743 11,500 77,953 78,500 15,825 6,435 139,308 26,896 386,160
Intangible assets – 391 – 110,579 14,328 4,572 – – 129,870Biological assets
(Note 12) 1,426 – – – – – 21,204 – 22,630Inventories – 5,981 8,301 27,327 22,508 17,103 19,895 897 102,012Trade and other
receivables – 11,139 9,672 8,345 13,755 19,981 10,517 – 73,409Other non-current
assets – – – – 122 1,597 – – 1,719Cash and bank
balances – 214 533 16,417 – 1,693 2,144 – 21,001
31,169 29,225 96,459 241,168 66,538 51,381 193,068 27,793 736,801
Trade and other creditors – (4,852) (8,838) – (27,846) – (27,078) – (68,614)
Accruals and provisions – (1,111) – (16,791) – (31,835) – (130) (49,867)
Borrowings – – (79,700) – – – (90,033) – (169,733)Other current liabilities – – – – (1,088) (2,170) (35,949) – (39,207)Deferred tax liabilities (663) – – (7,975) (2,226) (1,863) – (379) (13,106)
(663) (5,963) (88,538) (24,766) (31,160) (35,868) (153,060) (509) (340,527)
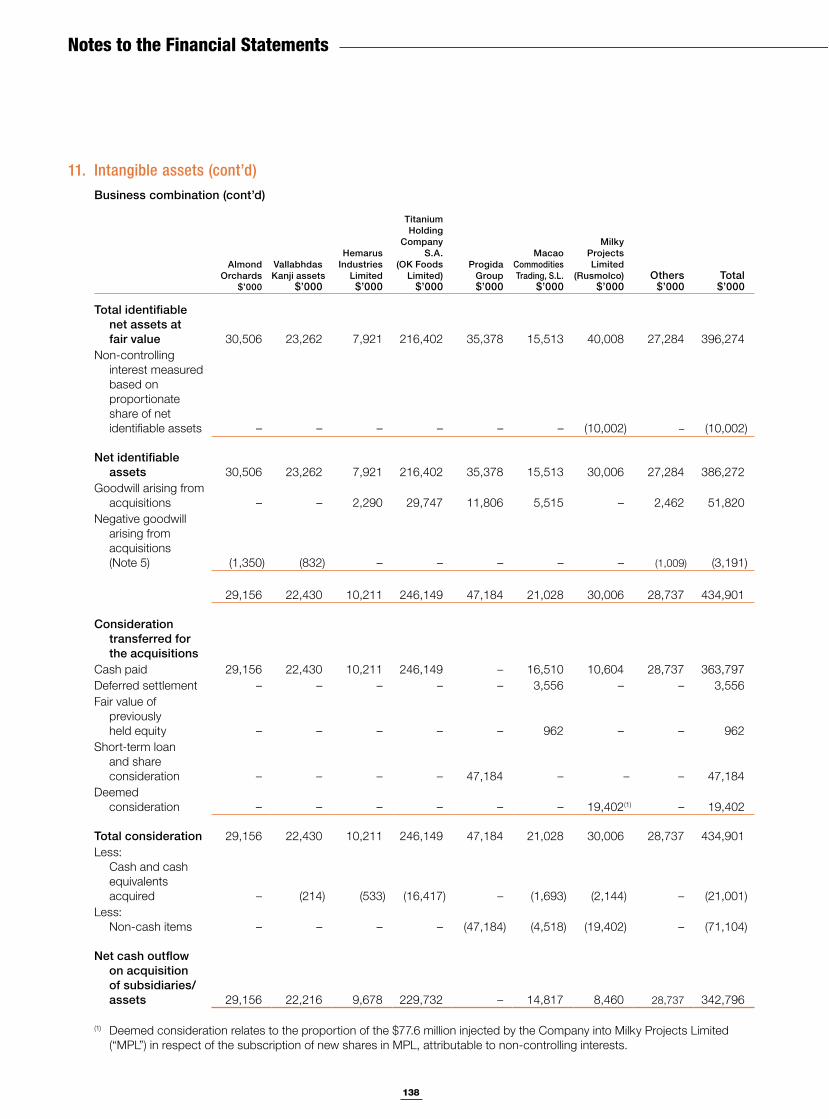
138
Notes to the Financial Statements
11. Intangible assets (cont’d)Business combination (cont’d)
Almond Orchards
$’000
Vallabhdas Kanji assets
$’000
HemarusIndustries
Limited$’000
Titanium Holding
Company S.A.
(OK Foods Limited)
$’000
Progida Group$’000
Macao Commodities Trading, S.L.
$’000
Milky Projects Limited
(Rusmolco) $’000
Others$’000
Total$’000
Total identifiable net assets at fair value 30,506 23,262 7,921 216,402 35,378 15,513 40,008 27,284 396,274
Non-controlling interest measured based on proportionate share of net identifiable assets – – – – – – (10,002) – (10,002)
Net identifiable assets 30,506 23,262 7,921 216,402 35,378 15,513 30,006 27,284 386,272
Goodwill arising from acquisitions – – 2,290 29,747 11,806 5,515 – 2,462 51,820
Negative goodwill arising from acquisitions (Note 5) (1,350) (832) – – – – – (1,009) (3,191)
29,156 22,430 10,211 246,149 47,184 21,028 30,006 28,737 434,901
Consideration transferred for the acquisitions
Cash paid 29,156 22,430 10,211 246,149 – 16,510 10,604 28,737 363,797Deferred settlement – – – – – 3,556 – – 3,556Fair value of
previously held equity – – – – – 962 – – 962
Short-term loan and share consideration – – – – 47,184 – – – 47,184
Deemed consideration – – – – – – 19,402(1) – 19,402
Total consideration 29,156 22,430 10,211 246,149 47,184 21,028 30,006 28,737 434,901Less:
Cash and cash equivalents acquired – (214) (533) (16,417) – (1,693) (2,144) – (21,001)
Less: Non-cash items – – – – (47,184) (4,518) (19,402) – (71,104)
Net cash outflow on acquisition of subsidiaries/assets 29,156 22,216 9,678 229,732 – 14,817 8,460 28,737 342,796
(1) Deemed consideration relates to the proportion of the $77.6 million injected by the Company into Milky Projects Limited (“MPL”) in respect of the subscription of new shares in MPL, attributable to non-controlling interests.
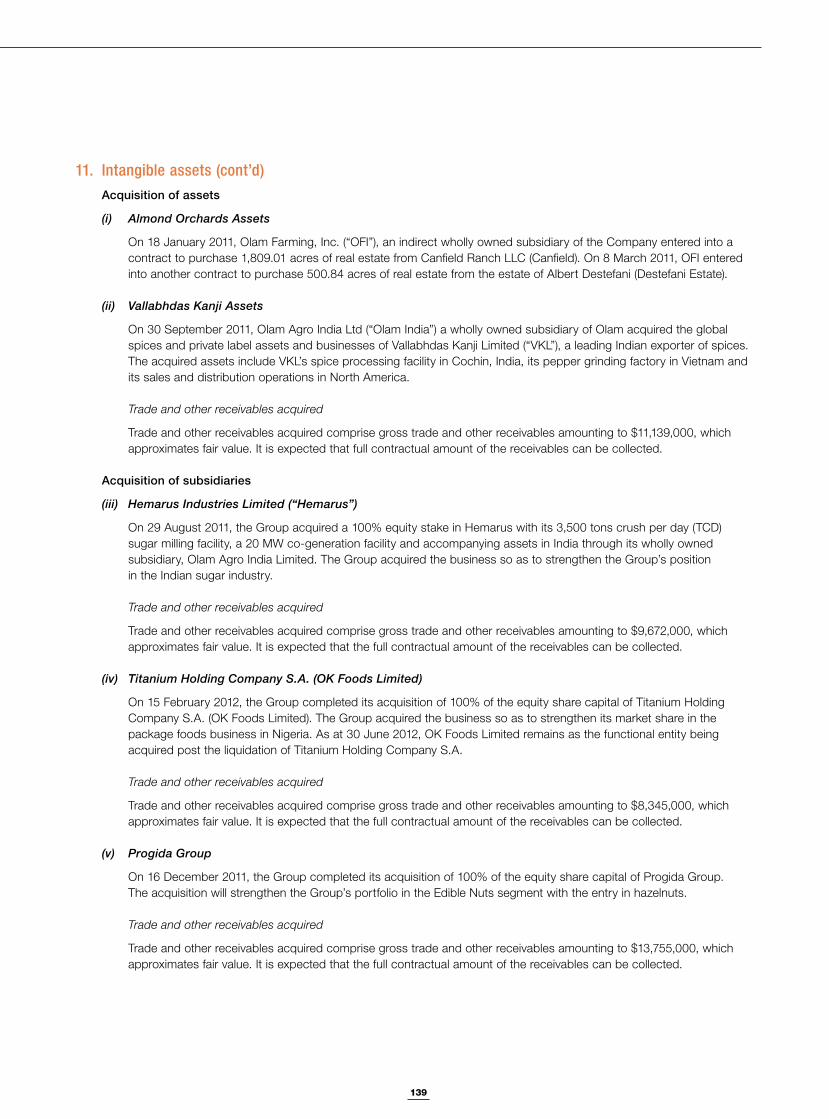
139
Notes to the Financial Statements
11. Intangible assets (cont’d)Acquisition of assets
(i) Almond Orchards Assets
On 18 January 2011, Olam Farming, Inc. (“OFI”), an indirect wholly owned subsidiary of the Company entered into a contract to purchase 1,809.01 acres of real estate from Canfield Ranch LLC (Canfield). On 8 March 2011, OFI entered into another contract to purchase 500.84 acres of real estate from the estate of Albert Destefani (Destefani Estate).
(ii) Vallabhdas Kanji Assets
On 30 September 2011, Olam Agro India Ltd (“Olam India”) a wholly owned subsidiary of Olam acquired the global spices and private label assets and businesses of Vallabhdas Kanji Limited (“VKL”), a leading Indian exporter of spices. The acquired assets include VKL’s spice processing facility in Cochin, India, its pepper grinding factory in Vietnam and its sales and distribution operations in North America.
Trade and other receivables acquired
Trade and other receivables acquired comprise gross trade and other receivables amounting to $11,139,000, which approximates fair value. It is expected that full contractual amount of the receivables can be collected.
Acquisition of subsidiaries
(iii) Hemarus Industries Limited (“Hemarus”)
On 29 August 2011, the Group acquired a 100% equity stake in Hemarus with its 3,500 tons crush per day (TCD) sugar milling facility, a 20 MW co-generation facility and accompanying assets in India through its wholly owned subsidiary, Olam Agro India Limited. The Group acquired the business so as to strengthen the Group’s position in the Indian sugar industry.
Trade and other receivables acquired
Trade and other receivables acquired comprise gross trade and other receivables amounting to $9,672,000, which approximates fair value. It is expected that the full contractual amount of the receivables can be collected.
(iv) Titanium Holding Company S.A. (OK Foods Limited)
On 15 February 2012, the Group completed its acquisition of 100% of the equity share capital of Titanium Holding Company S.A. (OK Foods Limited). The Group acquired the business so as to strengthen its market share in the package foods business in Nigeria. As at 30 June 2012, OK Foods Limited remains as the functional entity being acquired post the liquidation of Titanium Holding Company S.A.
Trade and other receivables acquired
Trade and other receivables acquired comprise gross trade and other receivables amounting to $8,345,000, which approximates fair value. It is expected that the full contractual amount of the receivables can be collected.
(v) Progida Group
On 16 December 2011, the Group completed its acquisition of 100% of the equity share capital of Progida Group. The acquisition will strengthen the Group’s portfolio in the Edible Nuts segment with the entry in hazelnuts.
Trade and other receivables acquired
Trade and other receivables acquired comprise gross trade and other receivables amounting to $13,755,000, which approximates fair value. It is expected that the full contractual amount of the receivables can be collected.
140
Notes to the Financial Statements
11. Intangible assets (cont’d)Acquisition of subsidiaries (cont’d)
(vi) Macao Commodities Trading, S.L. (“Macao”)
On 21 December 2011, the Company executed an agreement to acquire a 75.2% equity stake in Macao, including Macao’s 51% shareholding in the jointly controlled entity, Solimar Food Ingredients, S.L. (“Solimar”) with the Company holding the remaining 49%. Concurrently, the Company entered into a Call and Put option with the owners of Macao to acquire the remaining 24.8% equity stake in Macao at an agreed valuation.
The combination of the Call and Put option at an agreed valuation gives the Group deemed access to the benefits associated with ownership of the remaining 24.8%. As such, the Group is deemed to have acquired 100% interest in Macao on the date of acquisition.
The fair value of the pre-existing stake of 49% in Solimar is deemed to approximate the carrying value and there was no separate equity pricing allocated to Solimar. This acquisition provides an accelerated entry into the Spanish and larger Iberian market for the Group in the cocoa business.
Trade and other receivables acquired
Trade and other receivables acquired comprise gross trade and other receivables amounting to $19,981,000, which approximates fair value. It is expected that the full contractual amount of the receivables can be collected.
(vii) Milky Projects Limited
On 31 March 2012, the Company entered into a Share Purchase Agreement (“SPA”) and Subscription Agreement to acquire an effective control of 75% in LLC Milky Projects Limited (“MPL”). An amount equivalent to $10.6 million was paid in respect of the SPA and $77.6 million injected into MPL in respect of the subscription of new shares in MPL.
The acquisition is aligned with the Group’s dairy strategy of selectively investing in attractive value chain adjacencies in geographies that provide a potential for profitable growth for dairy farming.
Trade and other receivables acquired
Trade and other receivables acquired comprise gross trade and other receivables amounting to $10,517,000, which approximates fair value. It is expected that the full contractual amount of the receivables can be collected.
Other acquisitions
(viii) Acquisition of United Biscuits Limited (“UBL”) and Trusty Food Limited (“TFL”)
On 14 July 2011 and 21 October 2011, the Group acquired certain assets in United Biscuits Limited and Trusty Food Limited through its wholly owned subsidiary, Olam Ghana Limited. The Group acquired the business so as to strengthen its market share in the packaged food business in Ghana.
(ix) M&M Wools (Australia) Pty Ltd
On 2 November 2011, Olam Investment Australia Pty Ltd, a wholly owned subsidiary of the Company, acquired assets in M&M Wools (Australia) Pty Ltd as part of the Group’s continued growth in the wool sector in Australia.
141
Notes to the Financial Statements
11. Intangible assets (cont’d)Transaction costs
Total transaction costs related to all acquisitions of $5,499,000 (2011: $8,673,000) have been recognised in the “Other operating expenses” line item in the Group’s profit and loss account for the year ended 30 June 2012.
Goodwill arising from acquisitions
Goodwill of $51,820,000 is mainly due to the synergies expected to be achieved from integrating the value-added midstream processing business of the subsidiaries into the Group’s existing supply chain business. The goodwill recognised is not expected to be deductible for income tax purposes.
Negative goodwill arising from acquisitions
The negative goodwill amounting to $3,191,000 arising from the acquisitions is mainly related to purchase of distressed assets and is not expected to be taxable for income tax purposes.
Impact of the acquisitions on profit and loss
From acquisition date, subsidiaries acquired during the year have reduced the Group’s profit by less than 1% for the financial year and contributed less than 1% to the Group’s sales of goods and services for the year. If the business combinations had taken place at the beginning of the year, the sales of goods and services for the year would have increased by less than 3% and the Group’s profit for the financial year, net of tax would have decreased by less than 2%.
12. Biological assetsBiological assets consist of plantations, annual crops and livestock.
Group2012
$’0002011
$’000
As at 1 July 453,168 181,883Net additions (1) 46,754 95,097Business combinations (Note 11) 22,630 87,629Foreign currency translation adjustments (2,087) 8,194Net change in fair value less estimated costs to sell 110,874 80,365
As at 30 June 631,339 453,168
(1) These are mainly net additions to annual crops and livestock.
Analysis of biological assets
Plantations consist of almonds and coffee that are grown in order to sell to various domestic and international markets as part of normal business operations. The almond orchards and coffee plantations presently consist of trees aged between 1 to 24 years and 1 to 3 years respectively (2011: 3 to 20 years and 1 to 2 years respectively).
During the year ended 30 June 2012, the Group harvested approximately 33,252 metric tonnes (2011: 18,839 metric tonnes) of almonds, which had a fair value less estimated point-of-sale costs of approximately $212,700,000 (2011: $122,587,000). The fair value of almonds was determined with reference to the market prices at the date of harvest.
142
Notes to the Financial Statements
12. Biological assets (cont’d)Analysis of biological assets (cont’d)
Annual crops consist of seeds for various commodities (cotton, onions, tomatoes and other vegetables) that are given to farmers to sow and grow. Farmers take all the harvest risks and bear all the farming costs. On harvesting of the commodities, the Group has the first right to buy the produce from these farms.
At the end of the year, the Group’s total planted area of plantations and annual crops that is yielding is approximately 15,374 (2011: 14,710) hectares and 2,522 (2011: 4,504) hectares respectively excluding hectares for those commodities whose plantations are not managed by the Group.
Livestock relates mainly to dairy cattle in Uruguay and Russia. At the end of the year, the Group held 44,931 (2011: 43,640) cows, which are able to produce milk (mature assets) and 31,920 (2011: 14,862) heifers and calves, being raised to produce milk in the future (immature assets). The Group produced 160.0 million litres (2011: 105.0 million litres) of milk with a fair value less estimated point-of-sale costs of $78,701,000 (2011: $50,408,000) in the year ended 30 June 2012.
Fair value determination
The fair value of biological assets (other than annual crops and livestock) is estimated with reference to a professional valuation using the present value of expected net cash flows from the biological assets. The valuations are based on following significant assumptions:
(i) The average life of trees for plantations has been taken up to 15 to 25 years;(ii) Rates considered for discounting future cash flows range between 12% and 13% per annum;(iii) Annual rate of inflation ranging from 0% to 4% per annum;(iv) Location, soil type and infrastructure for determining estimated yield; and(v) Market price of the biological assets dependent on the prevailing market price of the products after harvest.
The annual crops have been valued using adjusted cost, which is the estimate of the yield and cost of the crop at harvest discounted for the remaining time to harvest, which approximates fair value.
The fair value of livestock is determined based on valuations by an independent professional valuer using market prices of livestock of similar age, breed and generic merit.
Financial risk management strategies related to agricultural activities
The Group is exposed to financial risk in respect of agricultural activity. The agricultural activity of the Group consists of the management of biological assets to produce marketable output. The primary financial risk associated with this activity occurs due to the length of time between expending cash on the purchase or planting and maintenance of biological assets and on harvesting and ultimately receiving cash from the sale of the marketable output. The Group plans for cash flow requirements for such activities and manages its debt and equity portfolio actively.
143
Notes to the Financial Statements
13. Subsidiary companies
Company2012
$’0002011
$’000
Quoted equity shares at cost 122,273 122,273Unquoted equity shares at cost 1,069,442 564,354Less: Impairment loss (6,739) (11,029)Foreign currency translation adjustments (32,070) (52,942)
1,152,906 622,656Loans to subsidiary companies 414,755 188,149
1,567,661 810,805
Market value of quoted shares 117,309 148,998
Loans to subsidiary companies denominated in foreign currencies at 30 June are as follows:-
Company2012
$’0002011
$’000
Australian Dollar 117,888 75,216Euro 62,429 12,997
The Company has provided impairment loss of $Nil (2011: $1,784,000) on the investment in the subsidiaries as the carrying amount exceeds the fair value based on the net asset value of the subsidiaries.
Loans to subsidiary companies are non-interest bearing, unsecured and are not repayable within the next 12 months except for amounts of $310,485,000 (2011: $157,487,000) which are unsecured and bear interest ranging from 2.0% to 9.0% (2011: 2.5% to 9.0%) per annum.
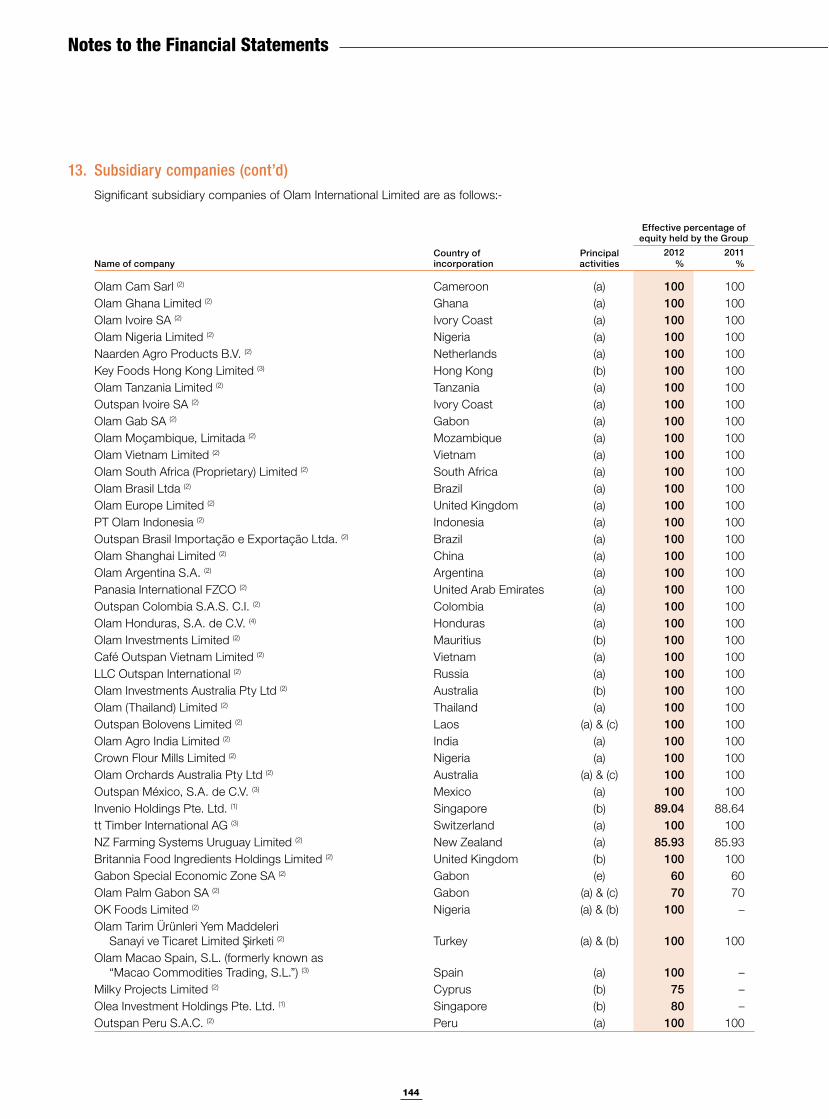
144
Notes to the Financial Statements
13. Subsidiary companies (cont’d)Significant subsidiary companies of Olam International Limited are as follows:-
Name of companyCountry of incorporation
Principalactivities
Effective percentage of equity held by the Group
2012%
2011%
Olam Cam Sarl (2) Cameroon (a) 100 100Olam Ghana Limited (2) Ghana (a) 100 100Olam Ivoire SA (2) Ivory Coast (a) 100 100Olam Nigeria Limited (2) Nigeria (a) 100 100Naarden Agro Products B.V. (2) Netherlands (a) 100 100Key Foods Hong Kong Limited (3) Hong Kong (b) 100 100Olam Tanzania Limited (2) Tanzania (a) 100 100Outspan Ivoire SA (2) Ivory Coast (a) 100 100Olam Gab SA (2) Gabon (a) 100 100Olam Moçambique, Limitada (2) Mozambique (a) 100 100Olam Vietnam Limited (2) Vietnam (a) 100 100Olam South Africa (Proprietary) Limited (2) South Africa (a) 100 100Olam Brasil Ltda (2) Brazil (a) 100 100Olam Europe Limited (2) United Kingdom (a) 100 100PT Olam Indonesia (2) Indonesia (a) 100 100Outspan Brasil Importação e Exportação Ltda. (2) Brazil (a) 100 100Olam Shanghai Limited (2) China (a) 100 100Olam Argentina S.A. (2) Argentina (a) 100 100Panasia International FZCO (2) United Arab Emirates (a) 100 100Outspan Colombia S.A.S. C.I. (2) Colombia (a) 100 100Olam Honduras, S.A. de C.V. (4) Honduras (a) 100 100Olam Investments Limited (2) Mauritius (b) 100 100Café Outspan Vietnam Limited (2) Vietnam (a) 100 100LLC Outspan International (2) Russia (a) 100 100Olam Investments Australia Pty Ltd (2) Australia (b) 100 100Olam (Thailand) Limited (2) Thailand (a) 100 100Outspan Bolovens Limited (2) Laos (a) & (c) 100 100Olam Agro India Limited (2) India (a) 100 100Crown Flour Mills Limited (2) Nigeria (a) 100 100Olam Orchards Australia Pty Ltd (2) Australia (a) & (c) 100 100Outspan México, S.A. de C.V. (3) Mexico (a) 100 100Invenio Holdings Pte. Ltd. (1) Singapore (b) 89.04 88.64tt Timber International AG (3) Switzerland (a) 100 100NZ Farming Systems Uruguay Limited (2) New Zealand (a) 85.93 85.93Britannia Food Ingredients Holdings Limited (2) United Kingdom (b) 100 100Gabon Special Economic Zone SA (2) Gabon (e) 60 60Olam Palm Gabon SA (2) Gabon (a) & (c) 70 70OK Foods Limited (2) Nigeria (a) & (b) 100 –Olam Tarim Ürünleri Yem Maddeleri
Sanayi ve Ticaret Limited irketi (2) Turkey (a) & (b) 100 100Olam Macao Spain, S.L. (formerly known as
“Macao Commodities Trading, S.L.”) (3) Spain (a) 100 –Milky Projects Limited (2) Cyprus (b) 75 –Olea Investment Holdings Pte. Ltd. (1) Singapore (b) 80 –Outspan Peru S.A.C. (2) Peru (a) 100 100
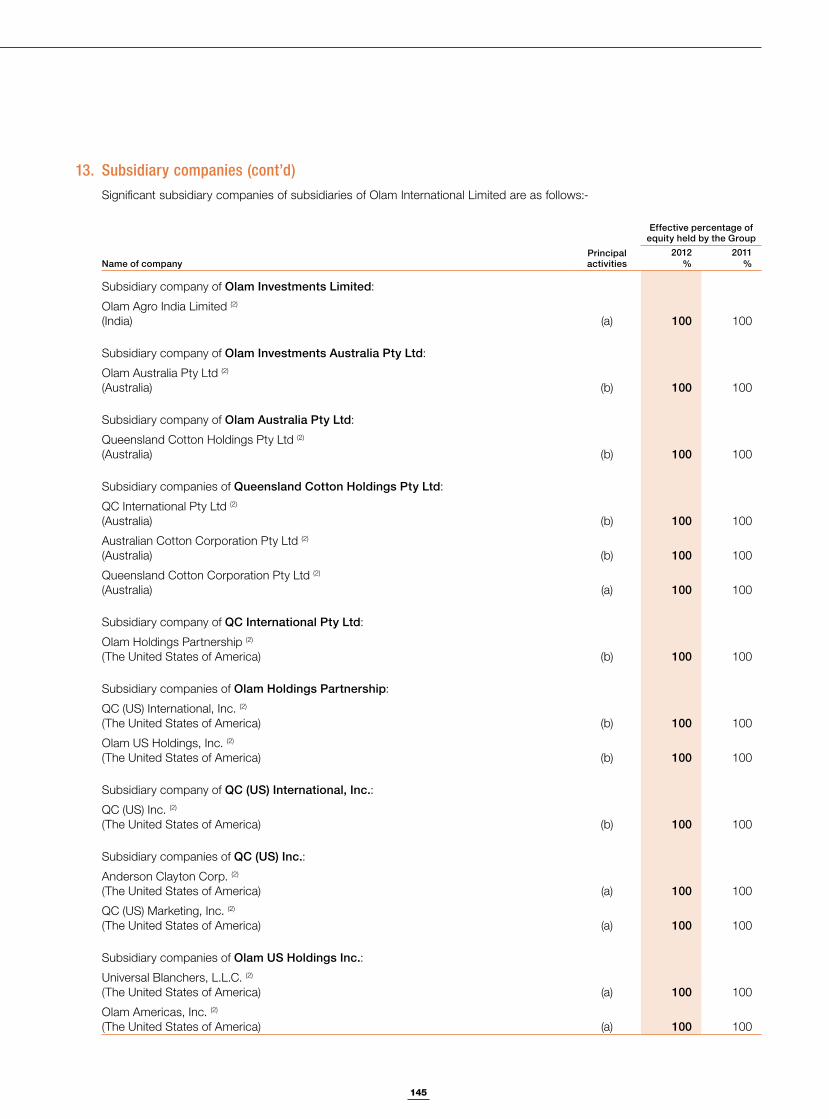
145
Notes to the Financial Statements
13. Subsidiary companies (cont’d)Significant subsidiary companies of subsidiaries of Olam International Limited are as follows:-
Name of companyPrincipalactivities
Effective percentage of equity held by the Group
2012%
2011%
Subsidiary company of Olam Investments Limited:
Olam Agro India Limited (2)
(India) (a) 100 100
Subsidiary company of Olam Investments Australia Pty Ltd:
Olam Australia Pty Ltd (2)
(Australia) (b) 100 100
Subsidiary company of Olam Australia Pty Ltd:
Queensland Cotton Holdings Pty Ltd (2)
(Australia) (b) 100 100
Subsidiary companies of Queensland Cotton Holdings Pty Ltd:
QC International Pty Ltd (2)
(Australia) (b) 100 100
Australian Cotton Corporation Pty Ltd (2)
(Australia) (b) 100 100
Queensland Cotton Corporation Pty Ltd (2)
(Australia) (a) 100 100
Subsidiary company of QC International Pty Ltd:
Olam Holdings Partnership (2)
(The United States of America) (b) 100 100
Subsidiary companies of Olam Holdings Partnership:
QC (US) International, Inc. (2)
(The United States of America) (b) 100 100
Olam US Holdings, Inc. (2)
(The United States of America) (b) 100 100
Subsidiary company of QC (US) International, Inc.:
QC (US) Inc. (2)
(The United States of America) (b) 100 100
Subsidiary companies of QC (US) Inc.:
Anderson Clayton Corp. (2)
(The United States of America) (a) 100 100
QC (US) Marketing, Inc. (2)
(The United States of America) (a) 100 100 Subsidiary companies of Olam US Holdings Inc.:
Universal Blanchers, L.L.C. (2)
(The United States of America) (a) 100 100
Olam Americas, Inc. (2)
(The United States of America) (a) 100 100
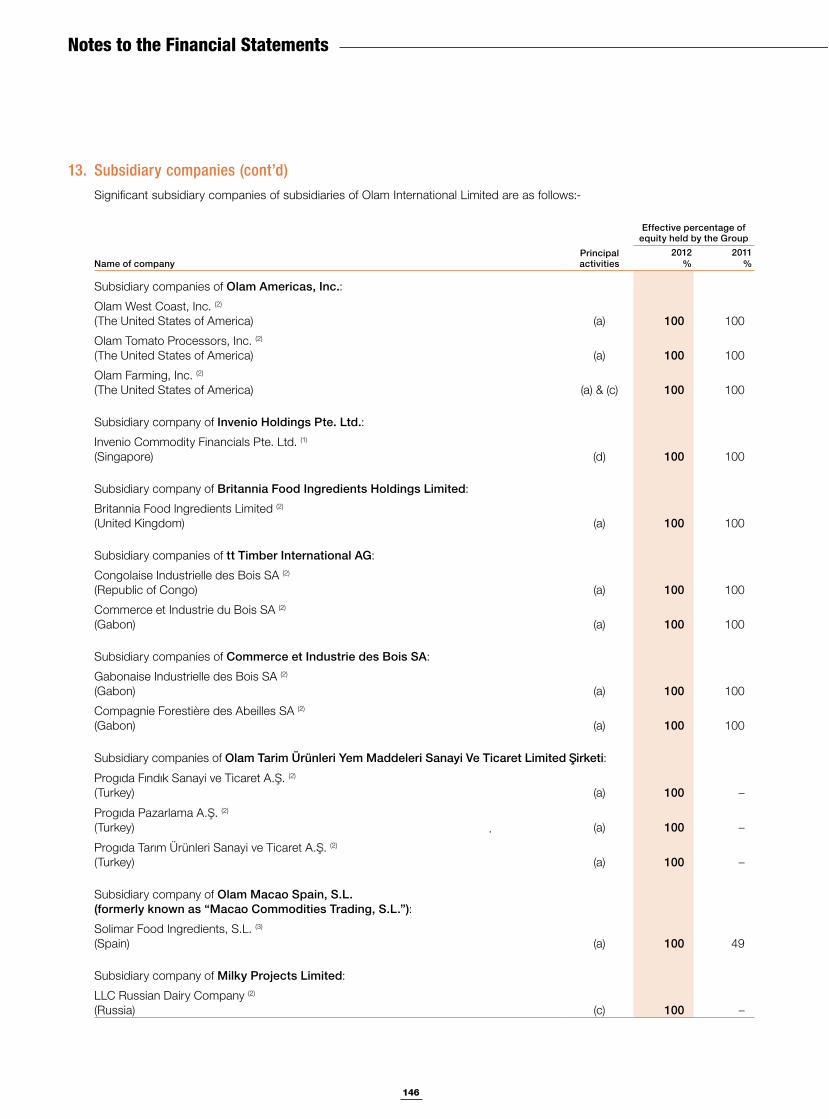
146
Notes to the Financial Statements
13. Subsidiary companies (cont’d)Significant subsidiary companies of subsidiaries of Olam International Limited are as follows:-
Name of companyPrincipalactivities
Effective percentage of equity held by the Group
2012%
2011%
Subsidiary companies of Olam Americas, Inc.:
Olam West Coast, Inc. (2)
(The United States of America) (a) 100 100
Olam Tomato Processors, Inc. (2)
(The United States of America) (a) 100 100
Olam Farming, Inc. (2)
(The United States of America) (a) & (c) 100 100
Subsidiary company of Invenio Holdings Pte. Ltd.:
Invenio Commodity Financials Pte. Ltd. (1)
(Singapore) (d) 100 100
Subsidiary company of Britannia Food Ingredients Holdings Limited:
Britannia Food Ingredients Limited (2)
(United Kingdom) (a) 100 100
Subsidiary companies of tt Timber International AG:
Congolaise Industrielle des Bois SA (2)
(Republic of Congo) (a) 100 100
Commerce et Industrie du Bois SA (2)
(Gabon) (a) 100 100
Subsidiary companies of Commerce et Industrie des Bois SA:
Gabonaise Industrielle des Bois SA (2)
(Gabon) (a) 100 100
Compagnie Forestière des Abeilles SA (2)
(Gabon) (a) 100 100
Subsidiary companies of Olam Tarim Ürünleri Yem Maddeleri Sanayi Ve Ticaret Limited irketi:
Progıda Fındık Sanayi ve Ticaret A. . (2)
(Turkey) (a) 100 –
Progıda Pazarlama A. . (2)
(Turkey) (a) 100 –
Progıda Tarım Ürünleri Sanayi ve Ticaret A. . (2)
(Turkey) (a) 100 –
Subsidiary company of Olam Macao Spain, S.L. (formerly known as “Macao Commodities Trading, S.L.”):
Solimar Food Ingredients, S.L. (3)
(Spain) (a) 100 49
Subsidiary company of Milky Projects Limited:
LLC Russian Dairy Company (2)
(Russia) (c) 100 –
.
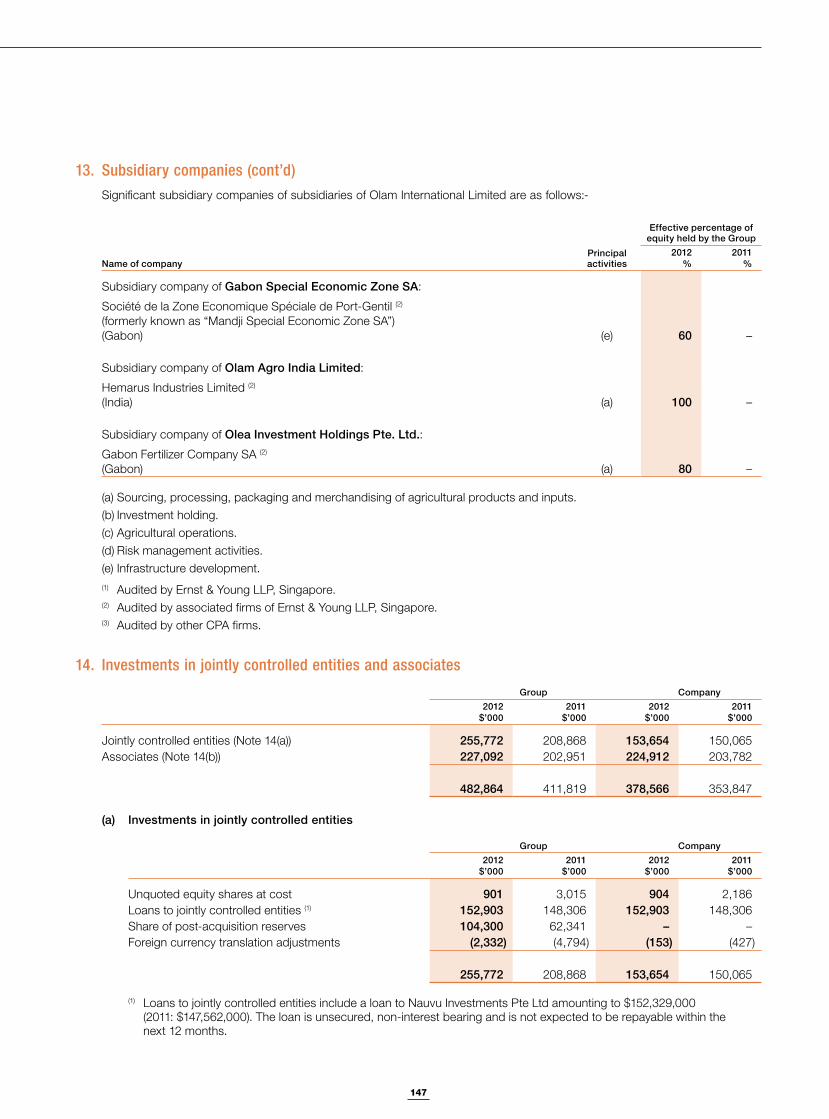
147
Notes to the Financial Statements
13. Subsidiary companies (cont’d)Significant subsidiary companies of subsidiaries of Olam International Limited are as follows:-
Name of companyPrincipalactivities
Effective percentage of equity held by the Group
2012%
2011%
Subsidiary company of Gabon Special Economic Zone SA:
Société de la Zone Economique Spéciale de Port-Gentil (2)
(formerly known as “Mandji Special Economic Zone SA”)(Gabon) (e) 60 –
Subsidiary company of Olam Agro India Limited:
Hemarus Industries Limited (2)
(India) (a) 100 –
Subsidiary company of Olea Investment Holdings Pte. Ltd.:
Gabon Fertilizer Company SA (2)
(Gabon) (a) 80 –
(a) Sourcing, processing, packaging and merchandising of agricultural products and inputs.(b) Investment holding.(c) Agricultural operations.(d) Risk management activities.(e) Infrastructure development.(1) Audited by Ernst & Young LLP, Singapore.(2) Audited by associated firms of Ernst & Young LLP, Singapore.(3) Audited by other CPA firms.
14. Investments in jointly controlled entities and associates
Group Company2012
$’0002011
$’0002012
$’0002011
$’000
Jointly controlled entities (Note 14(a)) 255,772 208,868 153,654 150,065Associates (Note 14(b)) 227,092 202,951 224,912 203,782
482,864 411,819 378,566 353,847
(a) Investments in jointly controlled entities
Group Company2012
$’0002011
$’0002012
$’0002011
$’000
Unquoted equity shares at cost 901 3,015 904 2,186Loans to jointly controlled entities (1) 152,903 148,306 152,903 148,306Share of post-acquisition reserves 104,300 62,341 – –Foreign currency translation adjustments (2,332) (4,794) (153) (427)
255,772 208,868 153,654 150,065
(1) Loans to jointly controlled entities include a loan to Nauvu Investments Pte Ltd amounting to $152,329,000 (2011: $147,562,000). The loan is unsecured, non-interest bearing and is not expected to be repayable within the next 12 months.
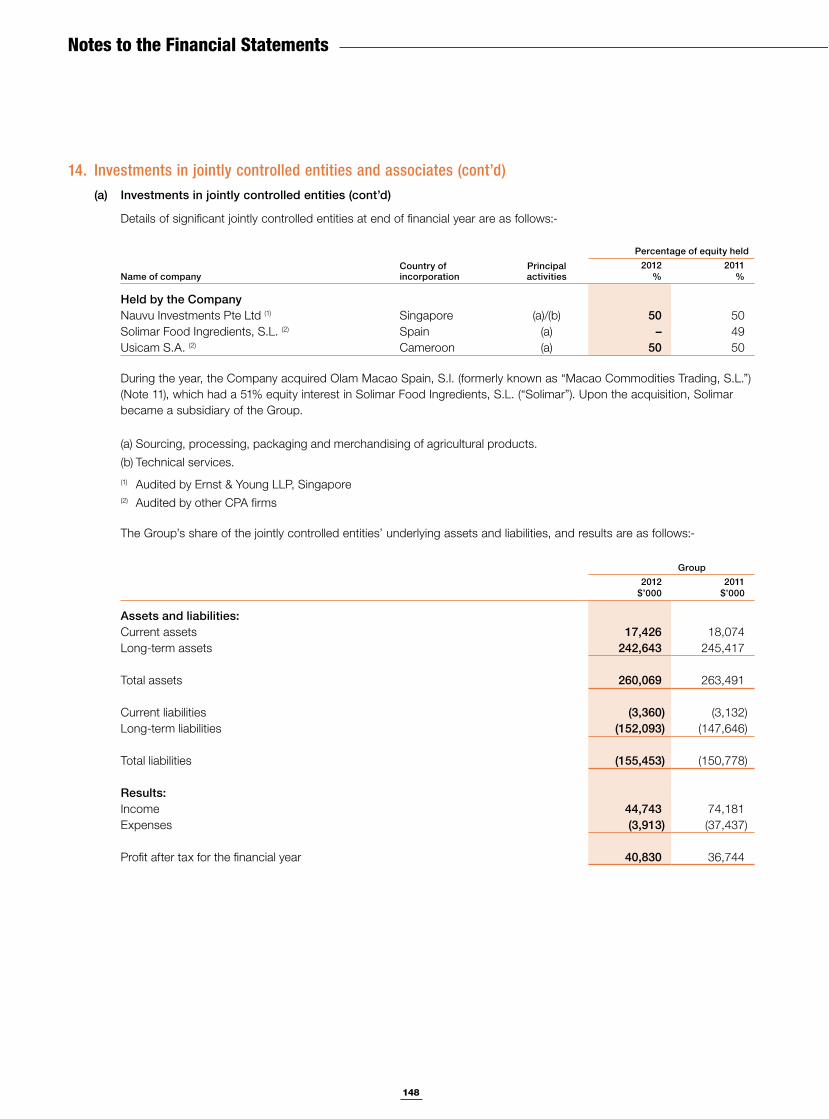
148
Notes to the Financial Statements
14. Investments in jointly controlled entities and associates (cont’d)(a) Investments in jointly controlled entities (cont’d)
Details of significant jointly controlled entities at end of financial year are as follows:-
Name of companyCountry of incorporation
Principalactivities
Percentage of equity held2012
%2011
%
Held by the CompanyNauvu Investments Pte Ltd (1) Singapore (a)/(b) 50 50Solimar Food Ingredients, S.L. (2) Spain (a) – 49Usicam S.A. (2) Cameroon (a) 50 50
During the year, the Company acquired Olam Macao Spain, S.I. (formerly known as “Macao Commodities Trading, S.L.”) (Note 11), which had a 51% equity interest in Solimar Food Ingredients, S.L. (“Solimar”). Upon the acquisition, Solimar became a subsidiary of the Group.
(a) Sourcing, processing, packaging and merchandising of agricultural products.(b) Technical services.(1) Audited by Ernst & Young LLP, Singapore(2) Audited by other CPA firms
The Group’s share of the jointly controlled entities’ underlying assets and liabilities, and results are as follows:-
Group2012
$’0002011
$’000
Assets and liabilities:Current assets 17,426 18,074Long-term assets 242,643 245,417
Total assets 260,069 263,491
Current liabilities (3,360) (3,132)Long-term liabilities (152,093) (147,646)
Total liabilities (155,453) (150,778)
Results:Income 44,743 74,181Expenses (3,913) (37,437)
Profit after tax for the financial year 40,830 36,744
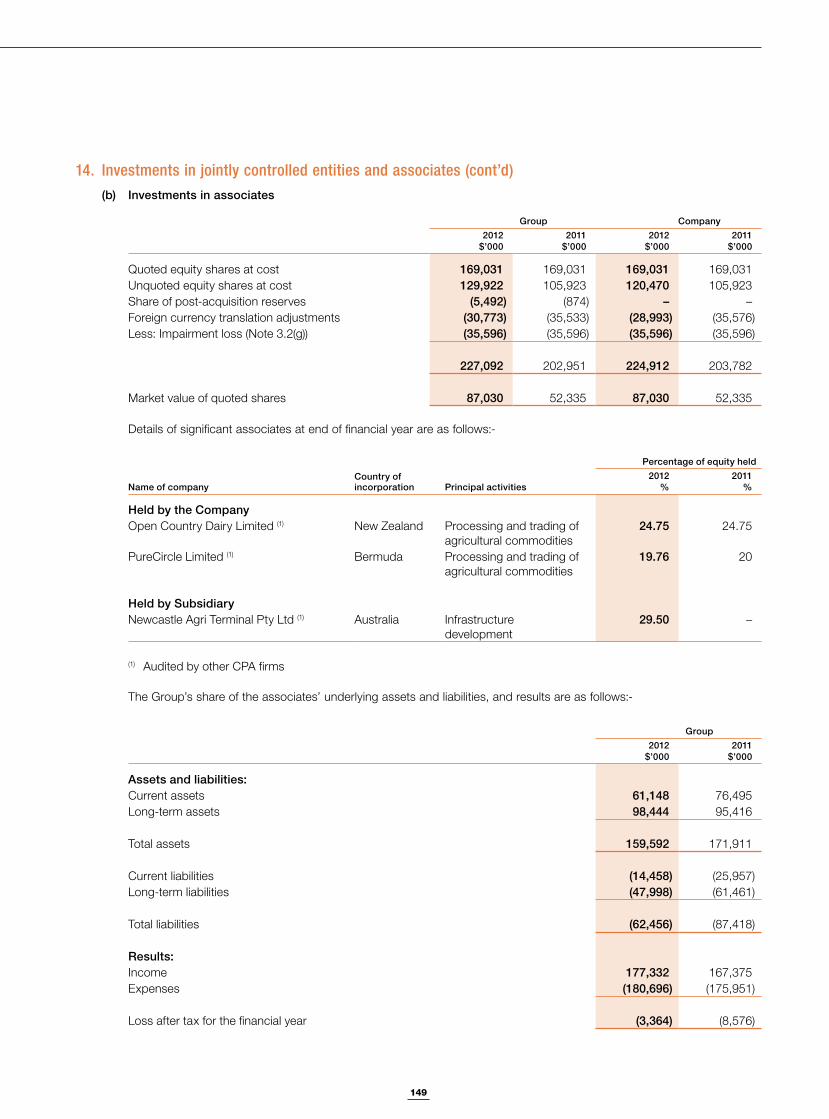
149
Notes to the Financial Statements
14. Investments in jointly controlled entities and associates (cont’d)(b) Investments in associates
Group Company2012
$’0002011
$’0002012
$’0002011
$’000
Quoted equity shares at cost 169,031 169,031 169,031 169,031Unquoted equity shares at cost 129,922 105,923 120,470 105,923Share of post-acquisition reserves (5,492) (874) – –Foreign currency translation adjustments (30,773) (35,533) (28,993) (35,576)Less: Impairment loss (Note 3.2(g)) (35,596) (35,596) (35,596) (35,596)
227,092 202,951 224,912 203,782
Market value of quoted shares 87,030 52,335 87,030 52,335
Details of significant associates at end of financial year are as follows:-
Name of companyCountry of incorporation Principal activities
Percentage of equity held2012
%2011
%
Held by the CompanyOpen Country Dairy Limited (1) New Zealand Processing and trading of
agricultural commodities24.75 24.75
PureCircle Limited (1) Bermuda Processing and trading of agricultural commodities
19.76 20
Held by SubsidiaryNewcastle Agri Terminal Pty Ltd (1) Australia Infrastructure
development29.50 –
(1) Audited by other CPA firms
The Group’s share of the associates’ underlying assets and liabilities, and results are as follows:-
Group2012
$’0002011
$’000
Assets and liabilities:Current assets 61,148 76,495Long-term assets 98,444 95,416
Total assets 159,592 171,911
Current liabilities (14,458) (25,957)Long-term liabilities (47,998) (61,461)
Total liabilities (62,456) (87,418)
Results:Income 177,332 167,375Expenses (180,696) (175,951)
Loss after tax for the financial year (3,364) (8,576)

150
Notes to the Financial Statements
15. Amounts due from subsidiary companies
Company2012
$’0002011
$’000
Trade receivables 729,572 658,493Loans to subsidiaries (1) 991,994 341,466Non-trade receivables (2) 371,388 945,076
2,092,954 1,945,035
(1) Loans to subsidiaries include amounts totalling $517,973,000 (2011: $246,404,000) which are unsecured and bear interest ranging from 5.97% to 8.09% (2011: 4.73% to 8.00%) per annum, repayable on demand and is to be settled in cash. The remaining amounts are non-interest bearing, unsecured, repayable on demand and are to be settled in cash.
(2) Non-trade receivables include amounts totalling $318,508,000 (2011: $Nil) which are unsecured and bear interest ranging from 5.97% to 6.34% (2011: Nil%) per annum, repayable on demand and is to be settled in cash. The remaining amounts are non-interest bearing, unsecured, repayable on demand and are to be settled in cash.
Loans to subsidiaries denominated in foreign currencies at 30 June are as follows:-
Company2012
$’0002011
$’000
Euro 595,616 467,673Australian Dollar 252,165 112,924Great Britain Pound 2,640 51,884Singapore Dollar 1,617 1,278
Amounts due from subsidiary companies are stated after deducting allowance for doubtful debts of
– Trade 1,903 1,843 – Non-trade 3,171 3,072
5,074 4,915
The movement of the allowance accounts is as follows:-
Movement in allowance accounts:- At 1 July 4,915 5,603 Foreign currency translation adjustments 159 (688)
At 30 June 5,074 4,915
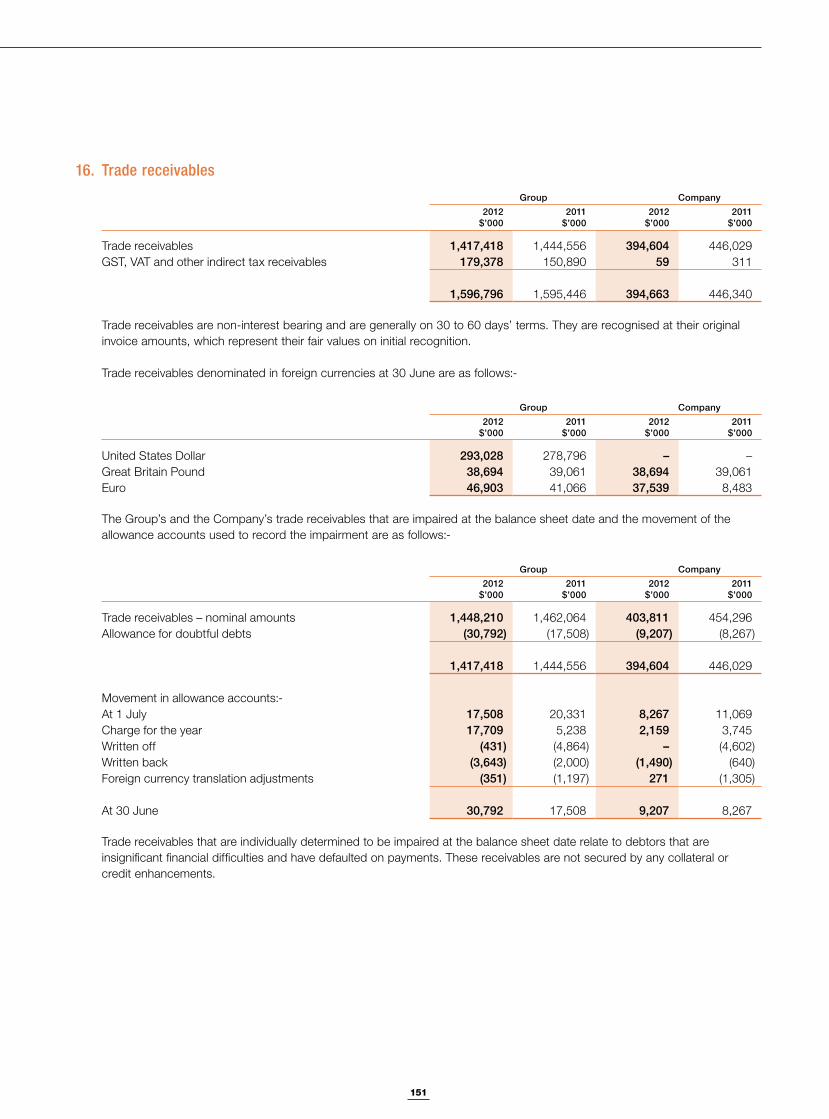
151
Notes to the Financial Statements
16. Trade receivables
Group Company2012
$’0002011
$’0002012
$’0002011
$’000
Trade receivables 1,417,418 1,444,556 394,604 446,029GST, VAT and other indirect tax receivables 179,378 150,890 59 311
1,596,796 1,595,446 394,663 446,340
Trade receivables are non-interest bearing and are generally on 30 to 60 days’ terms. They are recognised at their original invoice amounts, which represent their fair values on initial recognition.
Trade receivables denominated in foreign currencies at 30 June are as follows:-
Group Company2012
$’0002011
$’0002012
$’0002011
$’000
United States Dollar 293,028 278,796 – –Great Britain Pound 38,694 39,061 38,694 39,061Euro 46,903 41,066 37,539 8,483
The Group’s and the Company’s trade receivables that are impaired at the balance sheet date and the movement of the allowance accounts used to record the impairment are as follows:-
Group Company2012
$’0002011
$’0002012
$’0002011
$’000
Trade receivables – nominal amounts 1,448,210 1,462,064 403,811 454,296Allowance for doubtful debts (30,792) (17,508) (9,207) (8,267)
1,417,418 1,444,556 394,604 446,029
Movement in allowance accounts:-At 1 July 17,508 20,331 8,267 11,069Charge for the year 17,709 5,238 2,159 3,745Written off (431) (4,864) – (4,602)Written back (3,643) (2,000) (1,490) (640)Foreign currency translation adjustments (351) (1,197) 271 (1,305)
At 30 June 30,792 17,508 9,207 8,267
Trade receivables that are individually determined to be impaired at the balance sheet date relate to debtors that are insignificant financial difficulties and have defaulted on payments. These receivables are not secured by any collateral or credit enhancements.
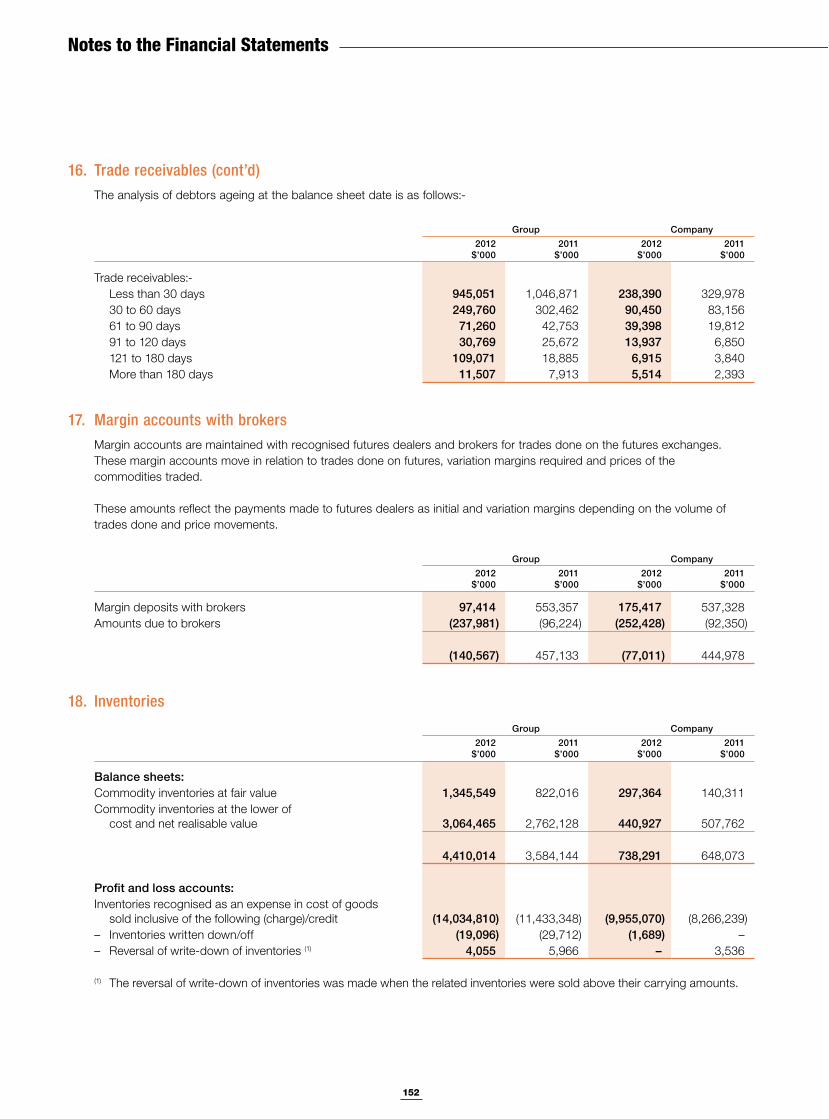
152
Notes to the Financial Statements
16. Trade receivables (cont’d)The analysis of debtors ageing at the balance sheet date is as follows:-
Group Company2012
$’0002011
$’0002012
$’0002011
$’000
Trade receivables:- Less than 30 days 945,051 1,046,871 238,390 329,978 30 to 60 days 249,760 302,462 90,450 83,156 61 to 90 days 71,260 42,753 39,398 19,812 91 to 120 days 30,769 25,672 13,937 6,850 121 to 180 days 109,071 18,885 6,915 3,840 More than 180 days 11,507 7,913 5,514 2,393
17. Margin accounts with brokersMargin accounts are maintained with recognised futures dealers and brokers for trades done on the futures exchanges. These margin accounts move in relation to trades done on futures, variation margins required and prices of the commodities traded.
These amounts reflect the payments made to futures dealers as initial and variation margins depending on the volume of trades done and price movements.
Group Company2012
$’0002011
$’0002012
$’0002011
$’000
Margin deposits with brokers 97,414 553,357 175,417 537,328Amounts due to brokers (237,981) (96,224) (252,428) (92,350)
(140,567) 457,133 (77,011) 444,978
18. Inventories
Group Company2012
$’0002011
$’0002012
$’0002011
$’000
Balance sheets:Commodity inventories at fair value 1,345,549 822,016 297,364 140,311Commodity inventories at the lower of
cost and net realisable value 3,064,465 2,762,128 440,927 507,762
4,410,014 3,584,144 738,291 648,073
Profit and loss accounts:Inventories recognised as an expense in cost of goods
sold inclusive of the following (charge)/credit (14,034,810) (11,433,348) (9,955,070) (8,266,239)– Inventories written down/off (19,096) (29,712) (1,689) –– Reversal of write-down of inventories (1) 4,055 5,966 – 3,536
(1) The reversal of write-down of inventories was made when the related inventories were sold above their carrying amounts.
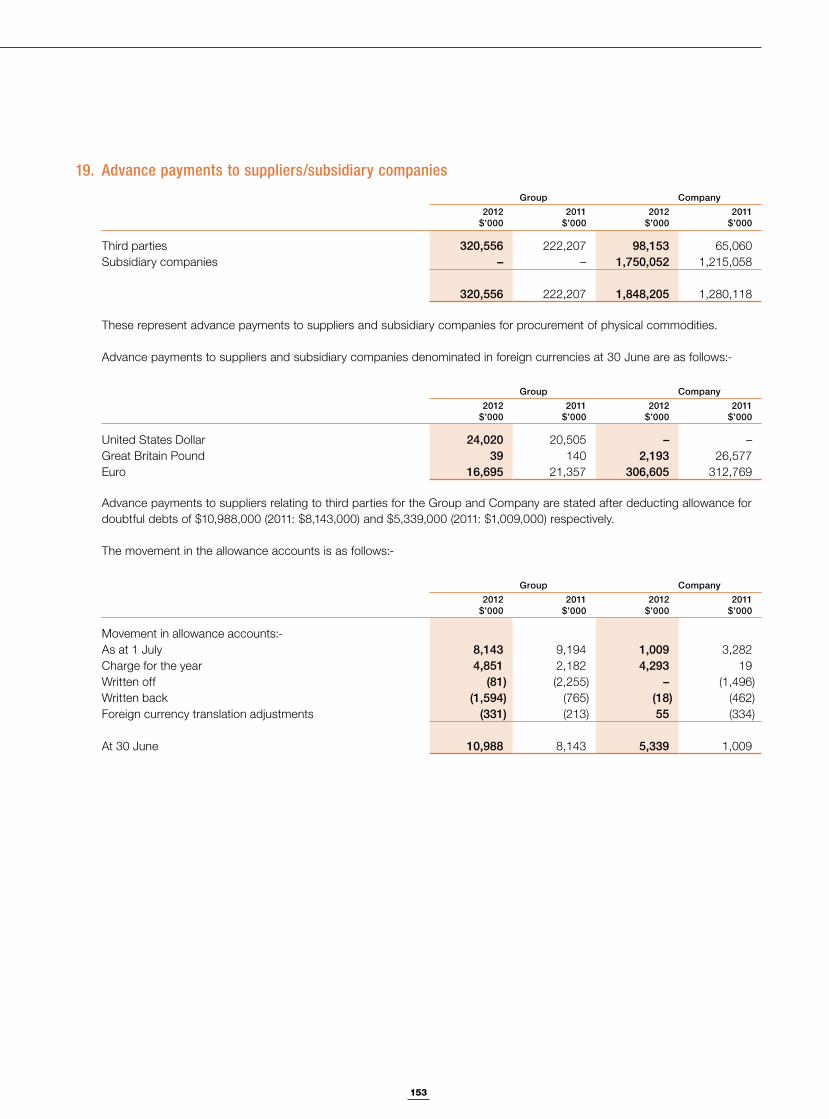
153
Notes to the Financial Statements
19. Advance payments to suppliers/subsidiary companies
Group Company2012
$’0002011
$’0002012
$’0002011
$’000
Third parties 320,556 222,207 98,153 65,060Subsidiary companies – – 1,750,052 1,215,058
320,556 222,207 1,848,205 1,280,118
These represent advance payments to suppliers and subsidiary companies for procurement of physical commodities.
Advance payments to suppliers and subsidiary companies denominated in foreign currencies at 30 June are as follows:-
Group Company2012
$’0002011
$’0002012
$’0002011
$’000
United States Dollar 24,020 20,505 – –Great Britain Pound 39 140 2,193 26,577Euro 16,695 21,357 306,605 312,769
Advance payments to suppliers relating to third parties for the Group and Company are stated after deducting allowance for doubtful debts of $10,988,000 (2011: $8,143,000) and $5,339,000 (2011: $1,009,000) respectively.
The movement in the allowance accounts is as follows:-
Group Company2012
$’0002011
$’0002012
$’0002011
$’000
Movement in allowance accounts:-As at 1 July 8,143 9,194 1,009 3,282Charge for the year 4,851 2,182 4,293 19Written off (81) (2,255) – (1,496)Written back (1,594) (765) (18) (462)Foreign currency translation adjustments (331) (213) 55 (334)
At 30 June 10,988 8,143 5,339 1,009
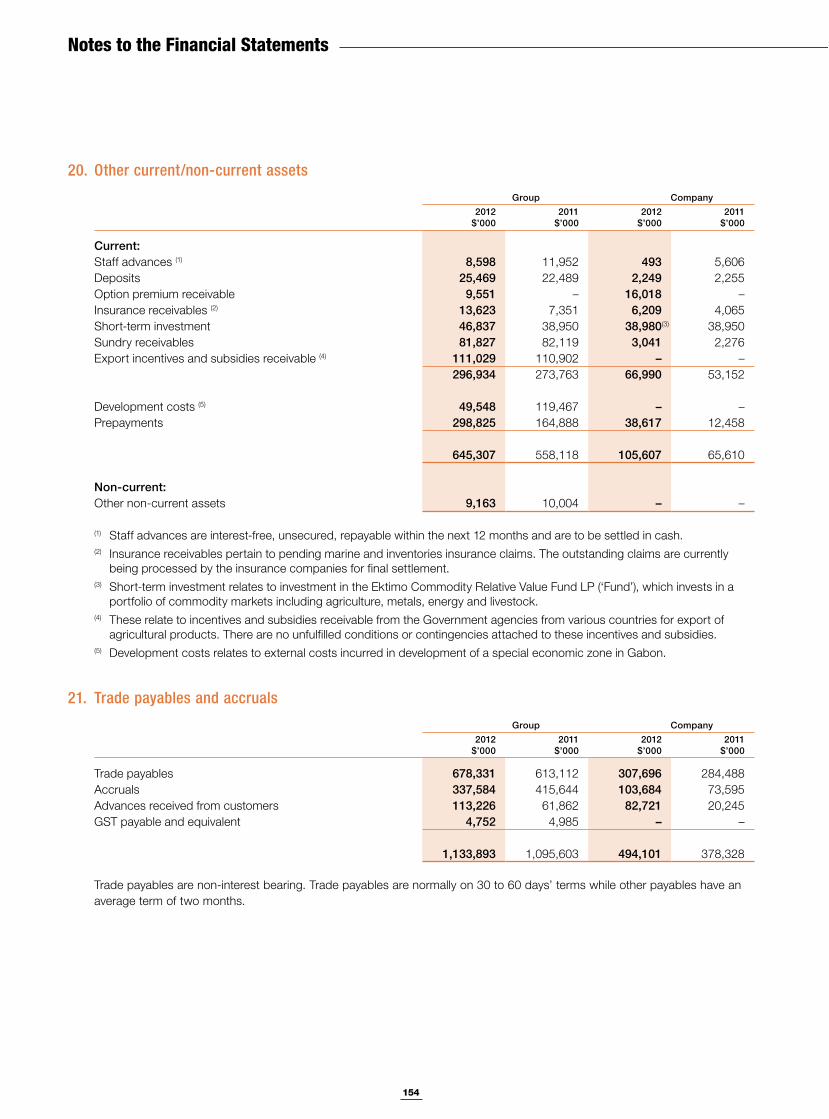
154
Notes to the Financial Statements
20. Other current/non-current assets
Group Company2012
$’0002011
$’0002012
$’0002011
$’000
Current:Staff advances (1) 8,598 11,952 493 5,606Deposits 25,469 22,489 2,249 2,255Option premium receivable 9,551 – 16,018 –Insurance receivables (2) 13,623 7,351 6,209 4,065Short-term investment 46,837 38,950 38,980(3) 38,950Sundry receivables 81,827 82,119 3,041 2,276Export incentives and subsidies receivable (4) 111,029 110,902 – –
296,934 273,763 66,990 53,152
Development costs (5) 49,548 119,467 – –Prepayments 298,825 164,888 38,617 12,458
645,307 558,118 105,607 65,610
Non-current: Other non-current assets 9,163 10,004 – –
(1) Staff advances are interest-free, unsecured, repayable within the next 12 months and are to be settled in cash.(2) Insurance receivables pertain to pending marine and inventories insurance claims. The outstanding claims are currently
being processed by the insurance companies for final settlement. (3) Short-term investment relates to investment in the Ektimo Commodity Relative Value Fund LP (‘Fund’), which invests in a
portfolio of commodity markets including agriculture, metals, energy and livestock.(4) These relate to incentives and subsidies receivable from the Government agencies from various countries for export of
agricultural products. There are no unfulfilled conditions or contingencies attached to these incentives and subsidies.(5) Development costs relates to external costs incurred in development of a special economic zone in Gabon.
21. Trade payables and accruals
Group Company2012
$’0002011
$’0002012
$’0002011
$’000
Trade payables 678,331 613,112 307,696 284,488Accruals 337,584 415,644 103,684 73,595Advances received from customers 113,226 61,862 82,721 20,245GST payable and equivalent 4,752 4,985 – –
1,133,893 1,095,603 494,101 378,328
Trade payables are non-interest bearing. Trade payables are normally on 30 to 60 days’ terms while other payables have an average term of two months.
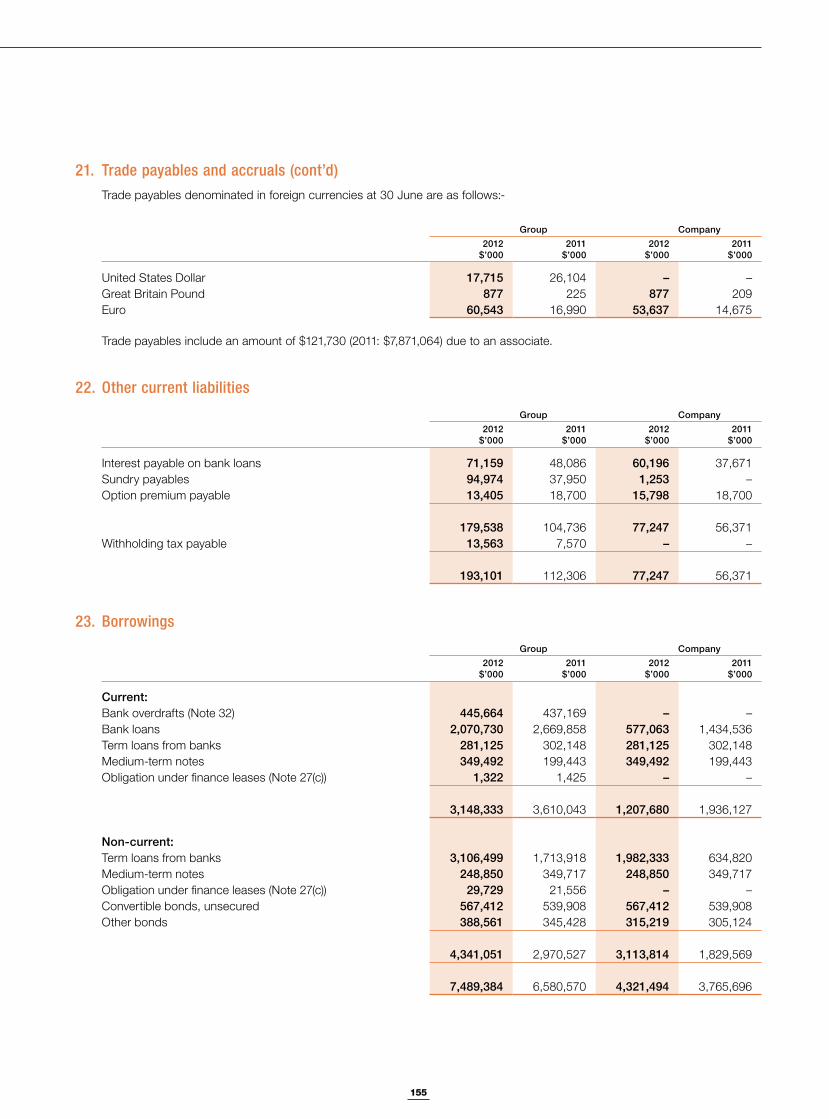
155
Notes to the Financial Statements
21. Trade payables and accruals (cont’d)Trade payables denominated in foreign currencies at 30 June are as follows:-
Group Company2012
$’0002011
$’0002012
$’0002011
$’000
United States Dollar 17,715 26,104 – –Great Britain Pound 877 225 877 209Euro 60,543 16,990 53,637 14,675
Trade payables include an amount of $121,730 (2011: $7,871,064) due to an associate.
22. Other current liabilities
Group Company2012
$’0002011
$’0002012
$’0002011
$’000
Interest payable on bank loans 71,159 48,086 60,196 37,671Sundry payables 94,974 37,950 1,253 –Option premium payable 13,405 18,700 15,798 18,700
179,538 104,736 77,247 56,371Withholding tax payable 13,563 7,570 – –
193,101 112,306 77,247 56,371
23. Borrowings
Group Company2012
$’0002011
$’0002012
$’0002011
$’000
Current:Bank overdrafts (Note 32) 445,664 437,169 – –Bank loans 2,070,730 2,669,858 577,063 1,434,536Term loans from banks 281,125 302,148 281,125 302,148Medium-term notes 349,492 199,443 349,492 199,443Obligation under finance leases (Note 27(c)) 1,322 1,425 – –
3,148,333 3,610,043 1,207,680 1,936,127
Non-current:Term loans from banks 3,106,499 1,713,918 1,982,333 634,820Medium-term notes 248,850 349,717 248,850 349,717Obligation under finance leases (Note 27(c)) 29,729 21,556 – –Convertible bonds, unsecured 567,412 539,908 567,412 539,908Other bonds 388,561 345,428 315,219 305,124
4,341,051 2,970,527 3,113,814 1,829,569
7,489,384 6,580,570 4,321,494 3,765,696
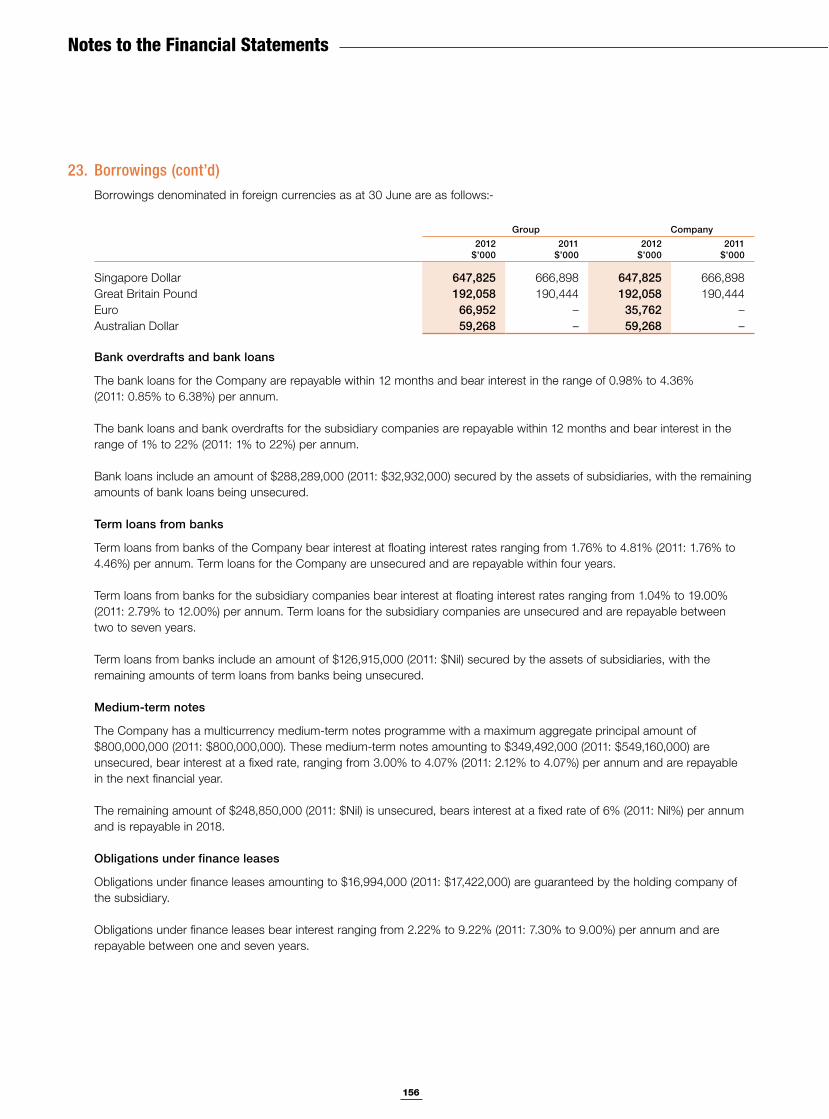
156
Notes to the Financial Statements
23. Borrowings (cont’d)Borrowings denominated in foreign currencies as at 30 June are as follows:-
Group Company2012
$’0002011
$’0002012
$’0002011
$’000
Singapore Dollar 647,825 666,898 647,825 666,898Great Britain Pound 192,058 190,444 192,058 190,444Euro 66,952 – 35,762 –Australian Dollar 59,268 – 59,268 –
Bank overdrafts and bank loans
The bank loans for the Company are repayable within 12 months and bear interest in the range of 0.98% to 4.36% (2011: 0.85% to 6.38%) per annum.
The bank loans and bank overdrafts for the subsidiary companies are repayable within 12 months and bear interest in the range of 1% to 22% (2011: 1% to 22%) per annum.
Bank loans include an amount of $288,289,000 (2011: $32,932,000) secured by the assets of subsidiaries, with the remaining amounts of bank loans being unsecured.
Term loans from banks
Term loans from banks of the Company bear interest at floating interest rates ranging from 1.76% to 4.81% (2011: 1.76% to 4.46%) per annum. Term loans for the Company are unsecured and are repayable within four years.
Term loans from banks for the subsidiary companies bear interest at floating interest rates ranging from 1.04% to 19.00% (2011: 2.79% to 12.00%) per annum. Term loans for the subsidiary companies are unsecured and are repayable between two to seven years.
Term loans from banks include an amount of $126,915,000 (2011: $Nil) secured by the assets of subsidiaries, with the remaining amounts of term loans from banks being unsecured.
Medium-term notes
The Company has a multicurrency medium-term notes programme with a maximum aggregate principal amount of $800,000,000 (2011: $800,000,000). These medium-term notes amounting to $349,492,000 (2011: $549,160,000) are unsecured, bear interest at a fixed rate, ranging from 3.00% to 4.07% (2011: 2.12% to 4.07%) per annum and are repayable in the next financial year.
The remaining amount of $248,850,000 (2011: $Nil) is unsecured, bears interest at a fixed rate of 6% (2011: Nil%) per annum and is repayable in 2018.
Obligations under finance leases
Obligations under finance leases amounting to $16,994,000 (2011: $17,422,000) are guaranteed by the holding company of the subsidiary.
Obligations under finance leases bear interest ranging from 2.22% to 9.22% (2011: 7.30% to 9.00%) per annum and are repayable between one and seven years.
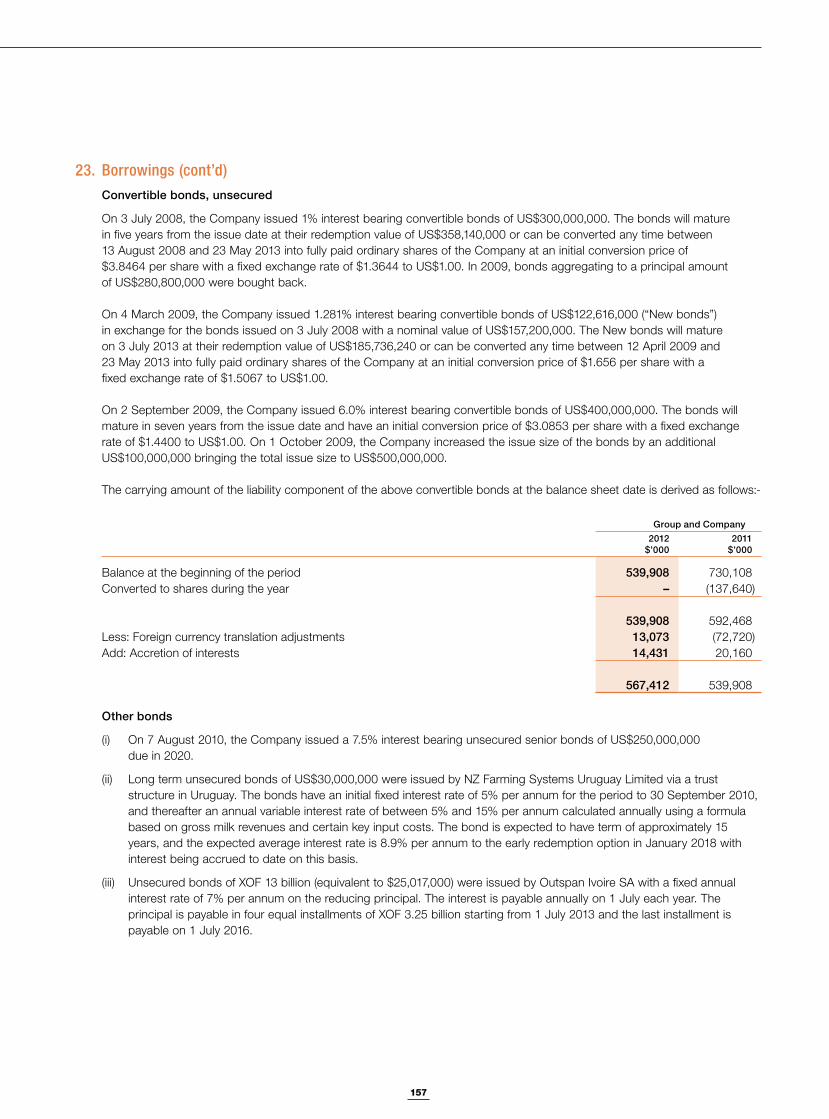
157
Notes to the Financial Statements
23. Borrowings (cont’d)Convertible bonds, unsecured
On 3 July 2008, the Company issued 1% interest bearing convertible bonds of US$300,000,000. The bonds will mature in five years from the issue date at their redemption value of US$358,140,000 or can be converted any time between 13 August 2008 and 23 May 2013 into fully paid ordinary shares of the Company at an initial conversion price of $3.8464 per share with a fixed exchange rate of $1.3644 to US$1.00. In 2009, bonds aggregating to a principal amount of US$280,800,000 were bought back.
On 4 March 2009, the Company issued 1.281% interest bearing convertible bonds of US$122,616,000 (“New bonds”) in exchange for the bonds issued on 3 July 2008 with a nominal value of US$157,200,000. The New bonds will mature on 3 July 2013 at their redemption value of US$185,736,240 or can be converted any time between 12 April 2009 and 23 May 2013 into fully paid ordinary shares of the Company at an initial conversion price of $1.656 per share with a fixed exchange rate of $1.5067 to US$1.00.
On 2 September 2009, the Company issued 6.0% interest bearing convertible bonds of US$400,000,000. The bonds will mature in seven years from the issue date and have an initial conversion price of $3.0853 per share with a fixed exchange rate of $1.4400 to US$1.00. On 1 October 2009, the Company increased the issue size of the bonds by an additional US$100,000,000 bringing the total issue size to US$500,000,000.
The carrying amount of the liability component of the above convertible bonds at the balance sheet date is derived as follows:-
Group and Company2012
$’0002011
$’000
Balance at the beginning of the period 539,908 730,108Converted to shares during the year – (137,640)
539,908 592,468Less: Foreign currency translation adjustments 13,073 (72,720)Add: Accretion of interests 14,431 20,160
567,412 539,908
Other bonds
(i) On 7 August 2010, the Company issued a 7.5% interest bearing unsecured senior bonds of US$250,000,000 due in 2020.
(ii) Long term unsecured bonds of US$30,000,000 were issued by NZ Farming Systems Uruguay Limited via a trust structure in Uruguay. The bonds have an initial fixed interest rate of 5% per annum for the period to 30 September 2010, and thereafter an annual variable interest rate of between 5% and 15% per annum calculated annually using a formula based on gross milk revenues and certain key input costs. The bond is expected to have term of approximately 15 years, and the expected average interest rate is 8.9% per annum to the early redemption option in January 2018 with interest being accrued to date on this basis.
(iii) Unsecured bonds of XOF 13 billion (equivalent to $25,017,000) were issued by Outspan Ivoire SA with a fixed annual interest rate of 7% per annum on the reducing principal. The interest is payable annually on 1 July each year. The principal is payable in four equal installments of XOF 3.25 billion starting from 1 July 2013 and the last installment is payable on 1 July 2016.
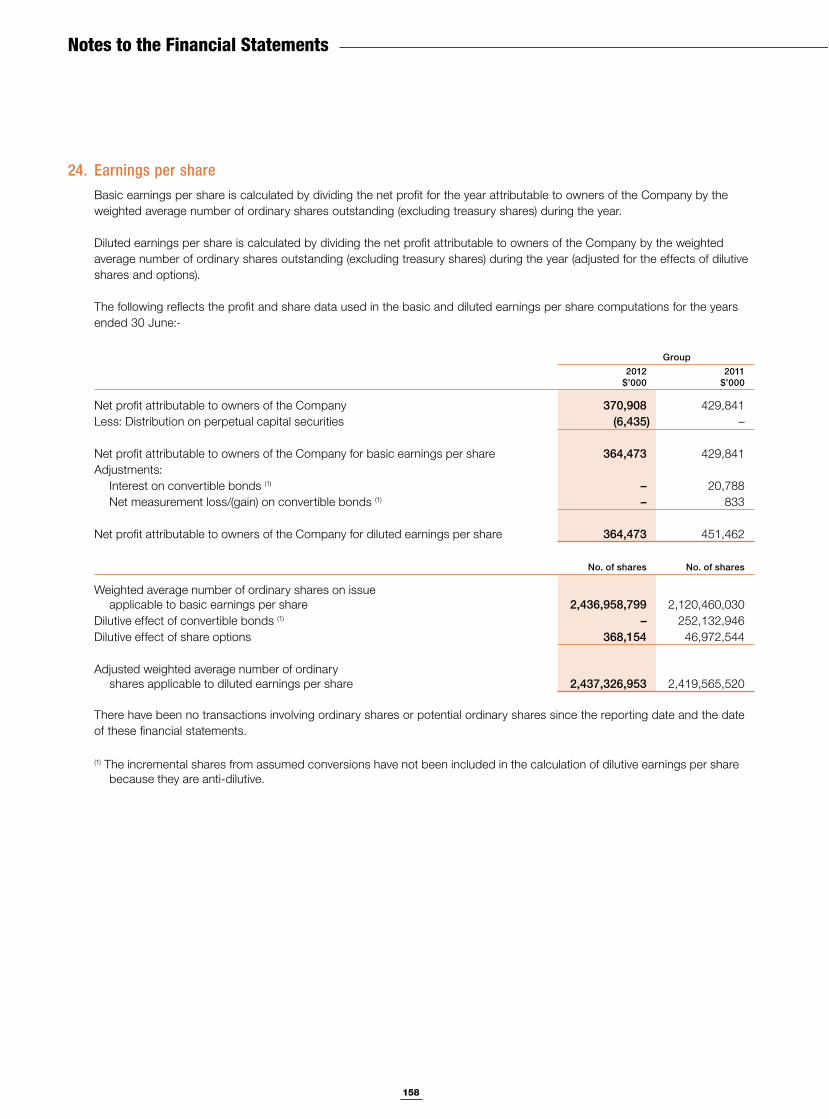
158
Notes to the Financial Statements
24. Earnings per shareBasic earnings per share is calculated by dividing the net profit for the year attributable to owners of the Company by the weighted average number of ordinary shares outstanding (excluding treasury shares) during the year.
Diluted earnings per share is calculated by dividing the net profit attributable to owners of the Company by the weighted average number of ordinary shares outstanding (excluding treasury shares) during the year (adjusted for the effects of dilutive shares and options).
The following reflects the profit and share data used in the basic and diluted earnings per share computations for the years ended 30 June:-
Group2012
$’0002011
$’000
Net profit attributable to owners of the Company 370,908 429,841Less: Distribution on perpetual capital securities (6,435) –
Net profit attributable to owners of the Company for basic earnings per share 364,473 429,841Adjustments: Interest on convertible bonds (1) – 20,788 Net measurement loss/(gain) on convertible bonds (1) – 833
Net profit attributable to owners of the Company for diluted earnings per share 364,473 451,462
No. of shares No. of shares
Weighted average number of ordinary shares on issue applicable to basic earnings per share 2,436,958,799 2,120,460,030
Dilutive effect of convertible bonds (1) – 252,132,946Dilutive effect of share options 368,154 46,972,544
Adjusted weighted average number of ordinary shares applicable to diluted earnings per share 2,437,326,953 2,419,565,520
There have been no transactions involving ordinary shares or potential ordinary shares since the reporting date and the date of these financial statements.
(1) The incremental shares from assumed conversions have not been included in the calculation of dilutive earnings per share because they are anti-dilutive.
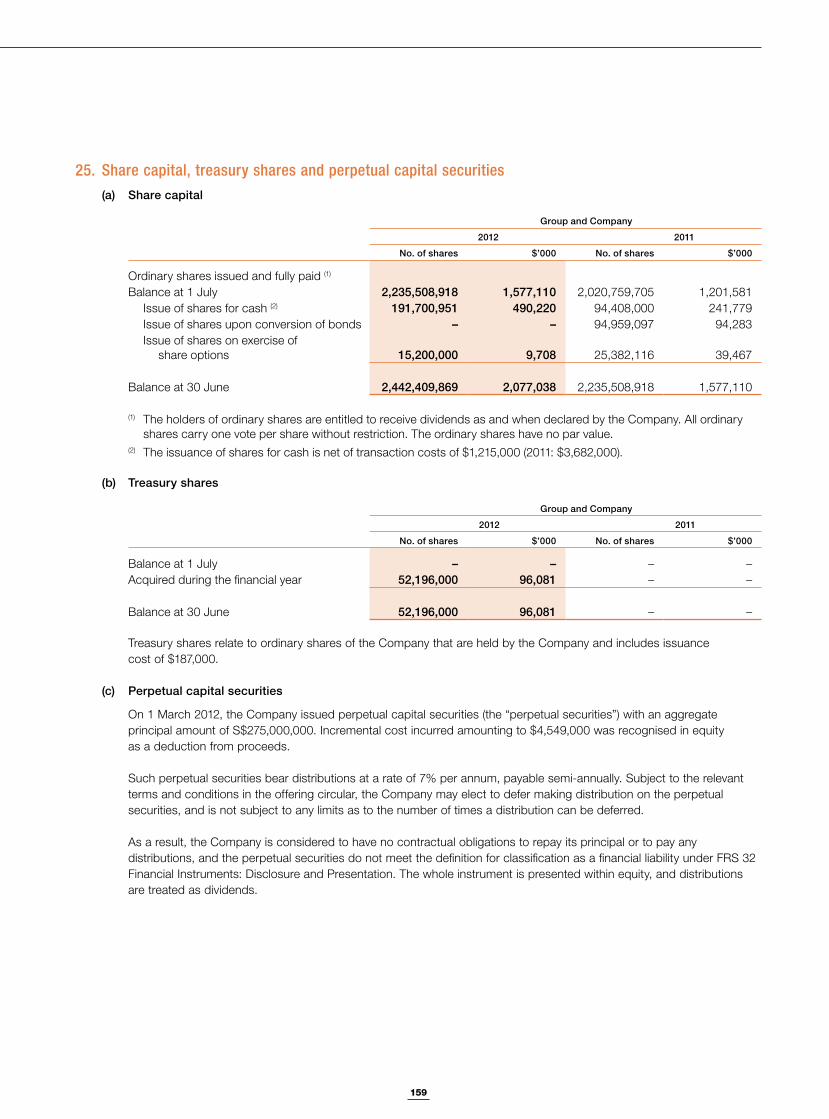
159
Notes to the Financial Statements
25. Share capital, treasury shares and perpetual capital securities(a) Share capital
Group and Company
2012 2011
No. of shares $’000 No. of shares $’000
Ordinary shares issued and fully paid (1)
Balance at 1 July 2,235,508,918 1,577,110 2,020,759,705 1,201,581 Issue of shares for cash (2) 191,700,951 490,220 94,408,000 241,779 Issue of shares upon conversion of bonds – – 94,959,097 94,283 Issue of shares on exercise of
share options 15,200,000 9,708 25,382,116 39,467
Balance at 30 June 2,442,409,869 2,077,038 2,235,508,918 1,577,110
(1) The holders of ordinary shares are entitled to receive dividends as and when declared by the Company. All ordinary shares carry one vote per share without restriction. The ordinary shares have no par value.
(2) The issuance of shares for cash is net of transaction costs of $1,215,000 (2011: $3,682,000).
(b) Treasury shares
Group and Company
2012 2011
No. of shares $’000 No. of shares $’000
Balance at 1 July – – – –Acquired during the financial year 52,196,000 96,081 – –
Balance at 30 June 52,196,000 96,081 – –
Treasury shares relate to ordinary shares of the Company that are held by the Company and includes issuance cost of $187,000.
(c) Perpetual capital securities
On 1 March 2012, the Company issued perpetual capital securities (the “perpetual securities”) with an aggregate principal amount of S$275,000,000. Incremental cost incurred amounting to $4,549,000 was recognised in equity as a deduction from proceeds.
Such perpetual securities bear distributions at a rate of 7% per annum, payable semi-annually. Subject to the relevant terms and conditions in the offering circular, the Company may elect to defer making distribution on the perpetual securities, and is not subject to any limits as to the number of times a distribution can be deferred.
As a result, the Company is considered to have no contractual obligations to repay its principal or to pay any distributions, and the perpetual securities do not meet the definition for classification as a financial liability under FRS 32 Financial Instruments: Disclosure and Presentation. The whole instrument is presented within equity, and distributions are treated as dividends.
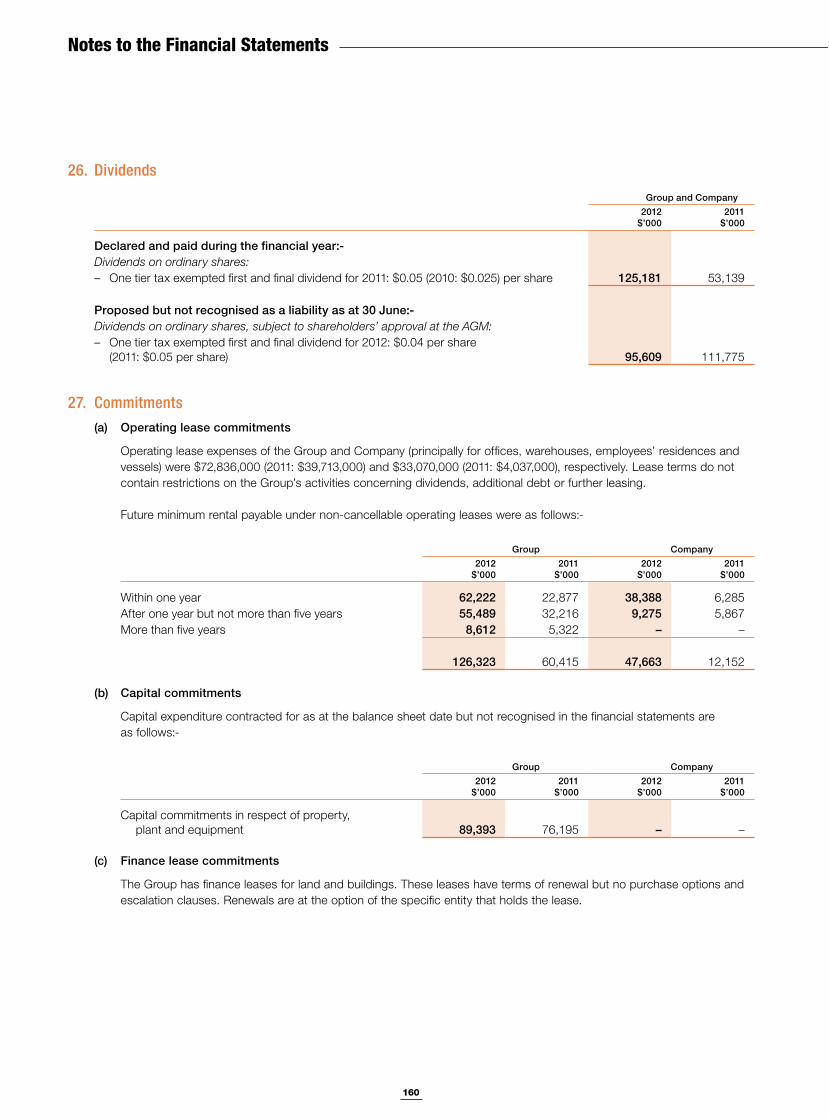
160
Notes to the Financial Statements
26. Dividends
Group and Company2012
$’0002011
$’000
Declared and paid during the financial year:-Dividends on ordinary shares: – One tier tax exempted first and final dividend for 2011: $0.05 (2010: $0.025) per share 125,181 53,139
Proposed but not recognised as a liability as at 30 June:-Dividends on ordinary shares, subject to shareholders’ approval at the AGM: – One tier tax exempted first and final dividend for 2012: $0.04 per share
(2011: $0.05 per share) 95,609 111,775
27. Commitments(a) Operating lease commitments
Operating lease expenses of the Group and Company (principally for offices, warehouses, employees’ residences and vessels) were $72,836,000 (2011: $39,713,000) and $33,070,000 (2011: $4,037,000), respectively. Lease terms do not contain restrictions on the Group’s activities concerning dividends, additional debt or further leasing.
Future minimum rental payable under non-cancellable operating leases were as follows:-
Group Company2012
$’0002011
$’0002012
$’0002011
$’000
Within one year 62,222 22,877 38,388 6,285After one year but not more than five years 55,489 32,216 9,275 5,867More than five years 8,612 5,322 – –
126,323 60,415 47,663 12,152
(b) Capital commitments
Capital expenditure contracted for as at the balance sheet date but not recognised in the financial statements are as follows:-
Group Company2012
$’0002011
$’0002012
$’0002011
$’000
Capital commitments in respect of property, plant and equipment 89,393 76,195 – –
(c) Finance lease commitments
The Group has finance leases for land and buildings. These leases have terms of renewal but no purchase options and escalation clauses. Renewals are at the option of the specific entity that holds the lease.
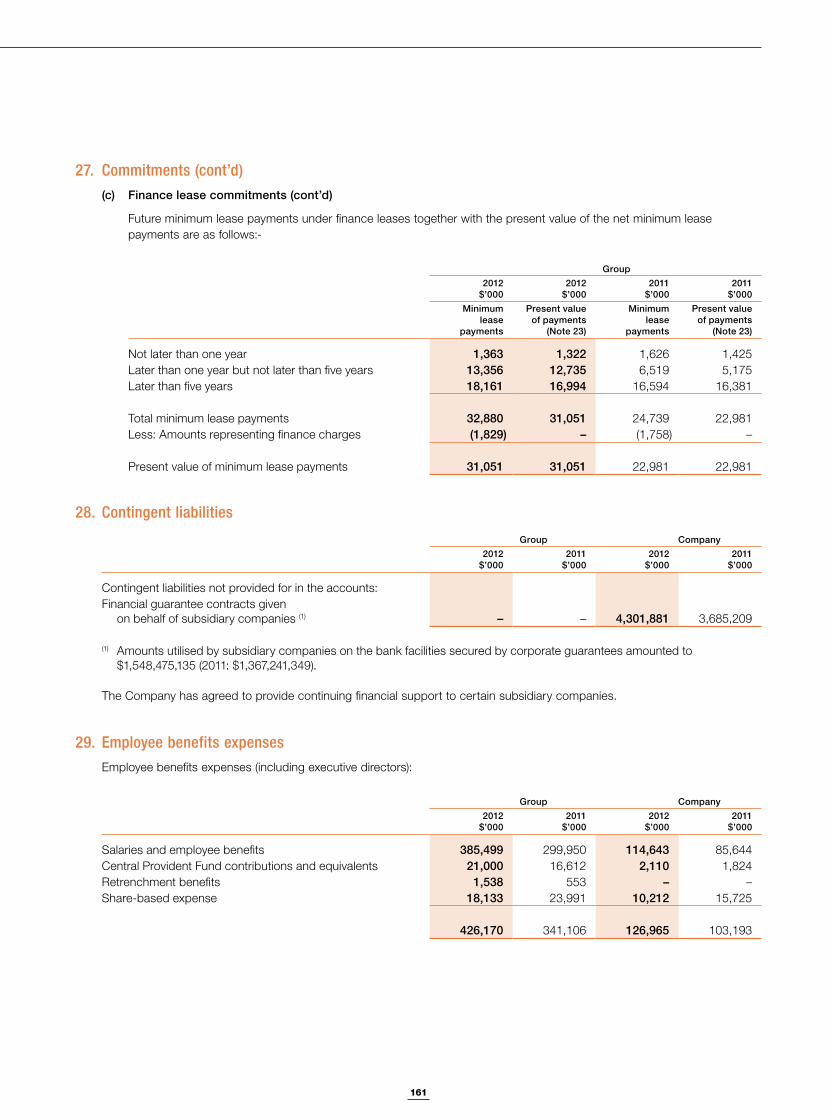
161
Notes to the Financial Statements
27. Commitments (cont’d)(c) Finance lease commitments (cont’d)
Future minimum lease payments under finance leases together with the present value of the net minimum lease payments are as follows:-
Group2012
$’0002012
$’0002011
$’0002011
$’000Minimum
lease payments
Present value of payments
(Note 23)
Minimum lease
payments
Present value of payments
(Note 23)
Not later than one year 1,363 1,322 1,626 1,425Later than one year but not later than five years 13,356 12,735 6,519 5,175Later than five years 18,161 16,994 16,594 16,381
Total minimum lease payments 32,880 31,051 24,739 22,981Less: Amounts representing finance charges (1,829) – (1,758) –
Present value of minimum lease payments 31,051 31,051 22,981 22,981
28. Contingent liabilities
Group Company2012
$’0002011
$’0002012
$’0002011
$’000
Contingent liabilities not provided for in the accounts:Financial guarantee contracts given
on behalf of subsidiary companies (1) – – 4,301,881 3,685,209
(1) Amounts utilised by subsidiary companies on the bank facilities secured by corporate guarantees amounted to $1,548,475,135 (2011: $1,367,241,349).
The Company has agreed to provide continuing financial support to certain subsidiary companies.
29. Employee benefits expensesEmployee benefits expenses (including executive directors):
Group Company2012
$’0002011
$’0002012
$’0002011
$’000
Salaries and employee benefits 385,499 299,950 114,643 85,644Central Provident Fund contributions and equivalents 21,000 16,612 2,110 1,824Retrenchment benefits 1,538 553 – –Share-based expense 18,133 23,991 10,212 15,725
426,170 341,106 126,965 103,193
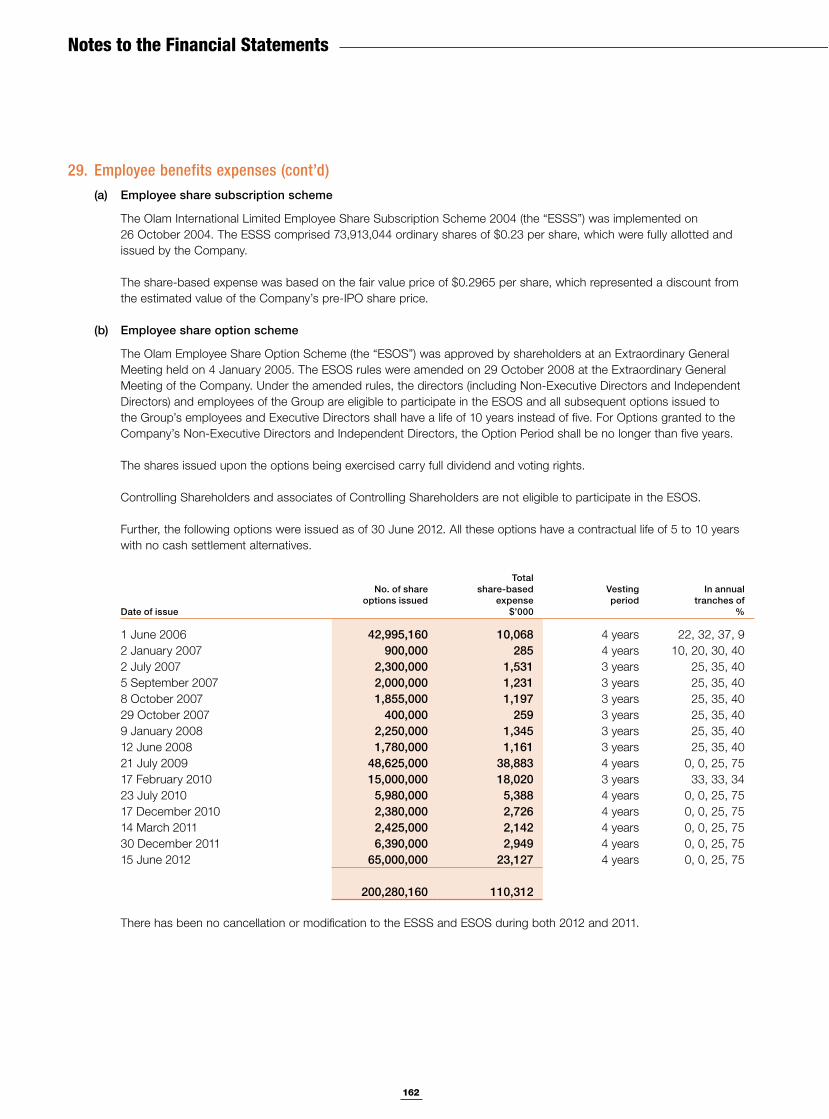
162
Notes to the Financial Statements
29. Employee benefits expenses (cont’d)(a) Employee share subscription scheme
The Olam International Limited Employee Share Subscription Scheme 2004 (the “ESSS”) was implemented on 26 October 2004. The ESSS comprised 73,913,044 ordinary shares of $0.23 per share, which were fully allotted and issued by the Company.
The share-based expense was based on the fair value price of $0.2965 per share, which represented a discount from the estimated value of the Company’s pre-IPO share price.
(b) Employee share option scheme
The Olam Employee Share Option Scheme (the “ESOS”) was approved by shareholders at an Extraordinary General Meeting held on 4 January 2005. The ESOS rules were amended on 29 October 2008 at the Extraordinary General Meeting of the Company. Under the amended rules, the directors (including Non-Executive Directors and Independent Directors) and employees of the Group are eligible to participate in the ESOS and all subsequent options issued to the Group’s employees and Executive Directors shall have a life of 10 years instead of five. For Options granted to the Company’s Non-Executive Directors and Independent Directors, the Option Period shall be no longer than five years.
The shares issued upon the options being exercised carry full dividend and voting rights.
Controlling Shareholders and associates of Controlling Shareholders are not eligible to participate in the ESOS.
Further, the following options were issued as of 30 June 2012. All these options have a contractual life of 5 to 10 years with no cash settlement alternatives.
Date of issue
No. of share options issued
Total share-based
expense$’000
Vesting period
In annual tranches of
%
1 June 2006 42,995,160 10,068 4 years 22, 32, 37, 92 January 2007 900,000 285 4 years 10, 20, 30, 402 July 2007 2,300,000 1,531 3 years 25, 35, 405 September 2007 2,000,000 1,231 3 years 25, 35, 408 October 2007 1,855,000 1,197 3 years 25, 35, 4029 October 2007 400,000 259 3 years 25, 35, 409 January 2008 2,250,000 1,345 3 years 25, 35, 4012 June 2008 1,780,000 1,161 3 years 25, 35, 4021 July 2009 48,625,000 38,883 4 years 0, 0, 25, 7517 February 2010 15,000,000 18,020 3 years 33, 33, 3423 July 2010 5,980,000 5,388 4 years 0, 0, 25, 7517 December 2010 2,380,000 2,726 4 years 0, 0, 25, 7514 March 2011 2,425,000 2,142 4 years 0, 0, 25, 7530 December 2011 6,390,000 2,949 4 years 0, 0, 25, 7515 June 2012 65,000,000 23,127 4 years 0, 0, 25, 75
200,280,160 110,312
There has been no cancellation or modification to the ESSS and ESOS during both 2012 and 2011.
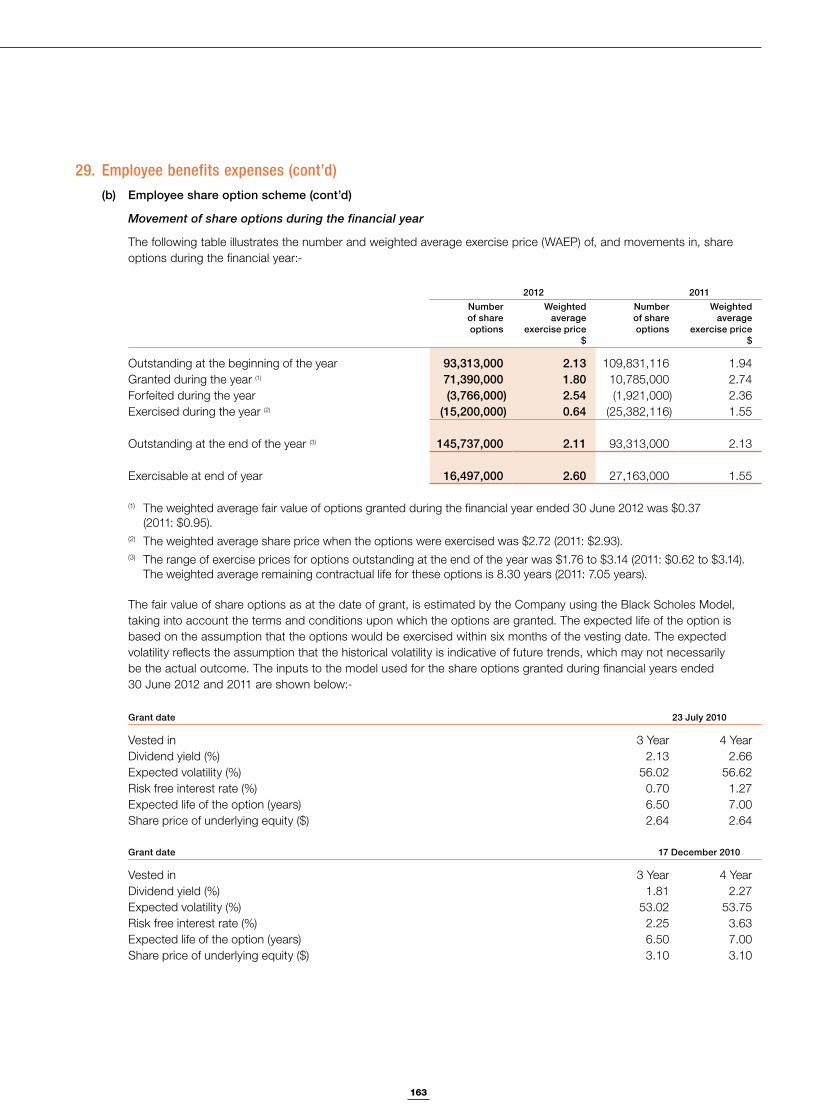
163
Notes to the Financial Statements
29. Employee benefits expenses (cont’d)(b) Employee share option scheme (cont’d)
Movement of share options during the financial year
The following table illustrates the number and weighted average exercise price (WAEP) of, and movements in, share options during the financial year:-
2012 2011Number of share options
Weightedaverage
exercise price$
Number of share options
Weightedaverage
exercise price$
Outstanding at the beginning of the year 93,313,000 2.13 109,831,116 1.94Granted during the year (1) 71,390,000 1.80 10,785,000 2.74Forfeited during the year (3,766,000) 2.54 (1,921,000) 2.36Exercised during the year (2) (15,200,000) 0.64 (25,382,116) 1.55
Outstanding at the end of the year (3) 145,737,000 2.11 93,313,000 2.13
Exercisable at end of year 16,497,000 2.60 27,163,000 1.55
(1) The weighted average fair value of options granted during the financial year ended 30 June 2012 was $0.37 (2011: $0.95).
(2) The weighted average share price when the options were exercised was $2.72 (2011: $2.93).(3) The range of exercise prices for options outstanding at the end of the year was $1.76 to $3.14 (2011: $0.62 to $3.14).
The weighted average remaining contractual life for these options is 8.30 years (2011: 7.05 years).
The fair value of share options as at the date of grant, is estimated by the Company using the Black Scholes Model, taking into account the terms and conditions upon which the options are granted. The expected life of the option is based on the assumption that the options would be exercised within six months of the vesting date. The expected volatility reflects the assumption that the historical volatility is indicative of future trends, which may not necessarily be the actual outcome. The inputs to the model used for the share options granted during financial years ended 30 June 2012 and 2011 are shown below:-
Grant date 23 July 2010
Vested in 3 Year 4 YearDividend yield (%) 2.13 2.66Expected volatility (%) 56.02 56.62Risk free interest rate (%) 0.70 1.27Expected life of the option (years) 6.50 7.00Share price of underlying equity ($) 2.64 2.64
Grant date 17 December 2010
Vested in 3 Year 4 YearDividend yield (%) 1.81 2.27Expected volatility (%) 53.02 53.75Risk free interest rate (%) 2.25 3.63Expected life of the option (years) 6.50 7.00Share price of underlying equity ($) 3.10 3.10
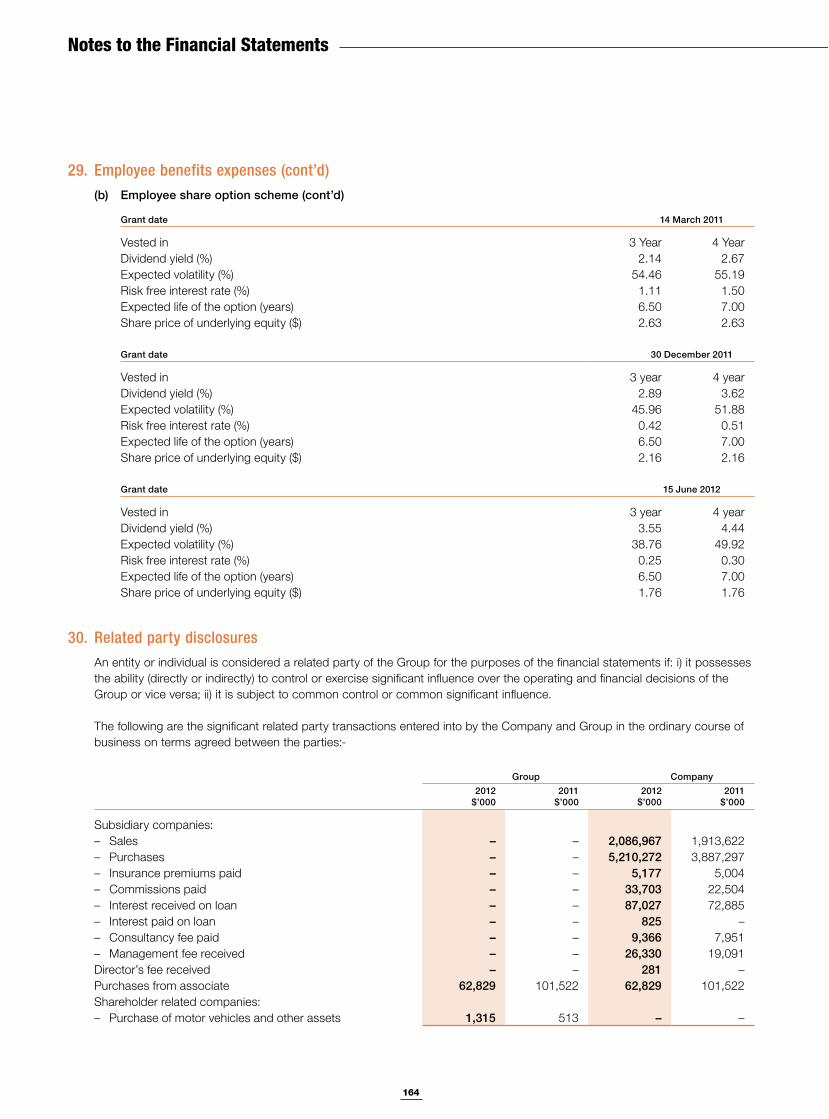
164
Notes to the Financial Statements
29. Employee benefits expenses (cont’d)(b) Employee share option scheme (cont’d)
Grant date 14 March 2011
Vested in 3 Year 4 YearDividend yield (%) 2.14 2.67Expected volatility (%) 54.46 55.19Risk free interest rate (%) 1.11 1.50Expected life of the option (years) 6.50 7.00Share price of underlying equity ($) 2.63 2.63
Grant date 30 December 2011
Vested in 3 year 4 yearDividend yield (%) 2.89 3.62Expected volatility (%) 45.96 51.88Risk free interest rate (%) 0.42 0.51Expected life of the option (years) 6.50 7.00Share price of underlying equity ($) 2.16 2.16
Grant date 15 June 2012
Vested in 3 year 4 yearDividend yield (%) 3.55 4.44Expected volatility (%) 38.76 49.92Risk free interest rate (%) 0.25 0.30Expected life of the option (years) 6.50 7.00Share price of underlying equity ($) 1.76 1.76
30. Related party disclosuresAn entity or individual is considered a related party of the Group for the purposes of the financial statements if: i) it possesses the ability (directly or indirectly) to control or exercise significant influence over the operating and financial decisions of the Group or vice versa; ii) it is subject to common control or common significant influence.
The following are the significant related party transactions entered into by the Company and Group in the ordinary course of business on terms agreed between the parties:-
Group Company2012
$’0002011
$’0002012
$’0002011
$’000
Subsidiary companies:– Sales – – 2,086,967 1,913,622– Purchases – – 5,210,272 3,887,297– Insurance premiums paid – – 5,177 5,004– Commissions paid – – 33,703 22,504– Interest received on loan – – 87,027 72,885– Interest paid on loan – – 825 –– Consultancy fee paid – – 9,366 7,951– Management fee received – – 26,330 19,091Director’s fee received – – 281 –Purchases from associate 62,829 101,522 62,829 101,522Shareholder related companies:– Purchase of motor vehicles and other assets 1,315 513 – –
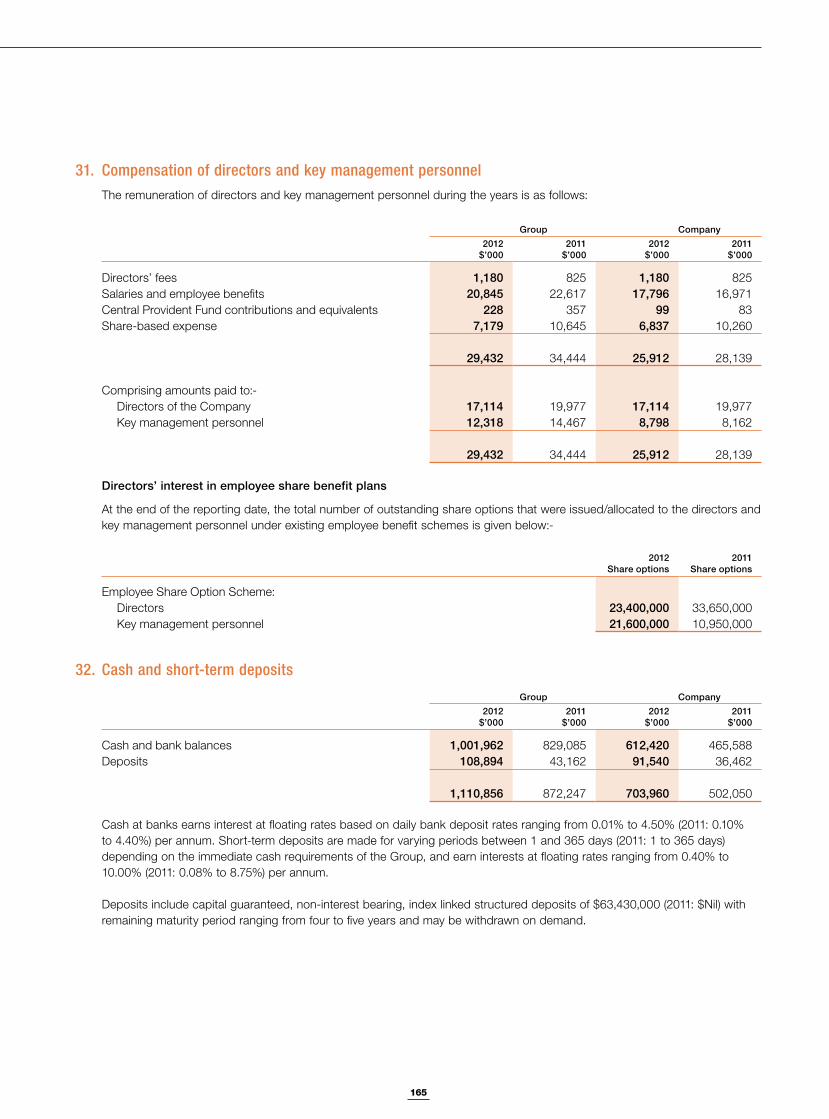
165
Notes to the Financial Statements
31. Compensation of directors and key management personnelThe remuneration of directors and key management personnel during the years is as follows:
Group Company2012
$’0002011
$’0002012
$’0002011
$’000
Directors’ fees 1,180 825 1,180 825Salaries and employee benefits 20,845 22,617 17,796 16,971Central Provident Fund contributions and equivalents 228 357 99 83Share-based expense 7,179 10,645 6,837 10,260
29,432 34,444 25,912 28,139
Comprising amounts paid to:- Directors of the Company 17,114 19,977 17,114 19,977 Key management personnel 12,318 14,467 8,798 8,162
29,432 34,444 25,912 28,139
Directors’ interest in employee share benefit plans
At the end of the reporting date, the total number of outstanding share options that were issued/allocated to the directors and key management personnel under existing employee benefit schemes is given below:-
2012Share options
2011Share options
Employee Share Option Scheme: Directors 23,400,000 33,650,000 Key management personnel 21,600,000 10,950,000
32. Cash and short-term deposits
Group Company2012
$’0002011
$’0002012
$’0002011
$’000
Cash and bank balances 1,001,962 829,085 612,420 465,588Deposits 108,894 43,162 91,540 36,462
1,110,856 872,247 703,960 502,050
Cash at banks earns interest at floating rates based on daily bank deposit rates ranging from 0.01% to 4.50% (2011: 0.10% to 4.40%) per annum. Short-term deposits are made for varying periods between 1 and 365 days (2011: 1 to 365 days) depending on the immediate cash requirements of the Group, and earn interests at floating rates ranging from 0.40% to 10.00% (2011: 0.08% to 8.75%) per annum.
Deposits include capital guaranteed, non-interest bearing, index linked structured deposits of $63,430,000 (2011: $Nil) with remaining maturity period ranging from four to five years and may be withdrawn on demand.
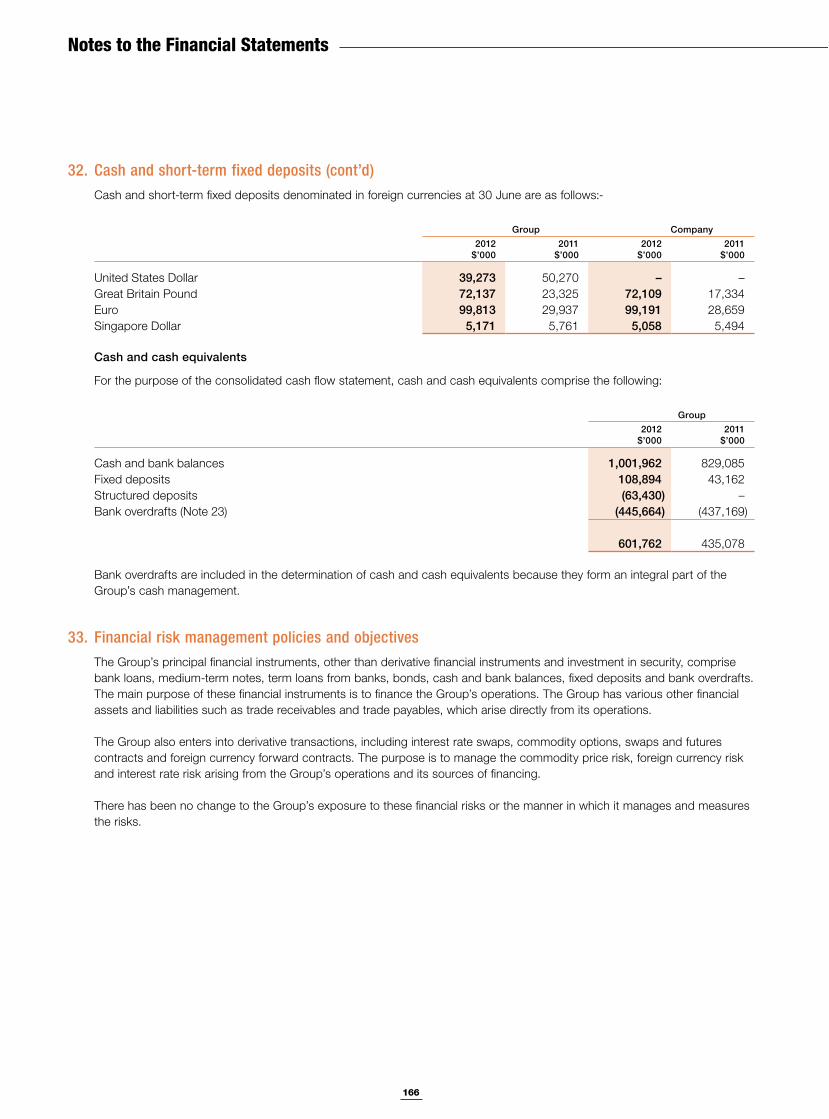
166
Notes to the Financial Statements
32. Cash and short-term fixed deposits (cont’d)Cash and short-term fixed deposits denominated in foreign currencies at 30 June are as follows:-
Group Company2012
$’0002011
$’0002012
$’0002011
$’000
United States Dollar 39,273 50,270 – –Great Britain Pound 72,137 23,325 72,109 17,334Euro 99,813 29,937 99,191 28,659Singapore Dollar 5,171 5,761 5,058 5,494
Cash and cash equivalents
For the purpose of the consolidated cash flow statement, cash and cash equivalents comprise the following:
Group2012
$’0002011
$’000
Cash and bank balances 1,001,962 829,085Fixed deposits 108,894 43,162Structured deposits (63,430) –Bank overdrafts (Note 23) (445,664) (437,169)
601,762 435,078
Bank overdrafts are included in the determination of cash and cash equivalents because they form an integral part of the Group’s cash management.
33. Financial risk management policies and objectivesThe Group’s principal financial instruments, other than derivative financial instruments and investment in security, comprise bank loans, medium-term notes, term loans from banks, bonds, cash and bank balances, fixed deposits and bank overdrafts. The main purpose of these financial instruments is to finance the Group’s operations. The Group has various other financial assets and liabilities such as trade receivables and trade payables, which arise directly from its operations.
The Group also enters into derivative transactions, including interest rate swaps, commodity options, swaps and futures contracts and foreign currency forward contracts. The purpose is to manage the commodity price risk, foreign currency risk and interest rate risk arising from the Group’s operations and its sources of financing.
There has been no change to the Group’s exposure to these financial risks or the manner in which it manages and measures the risks.
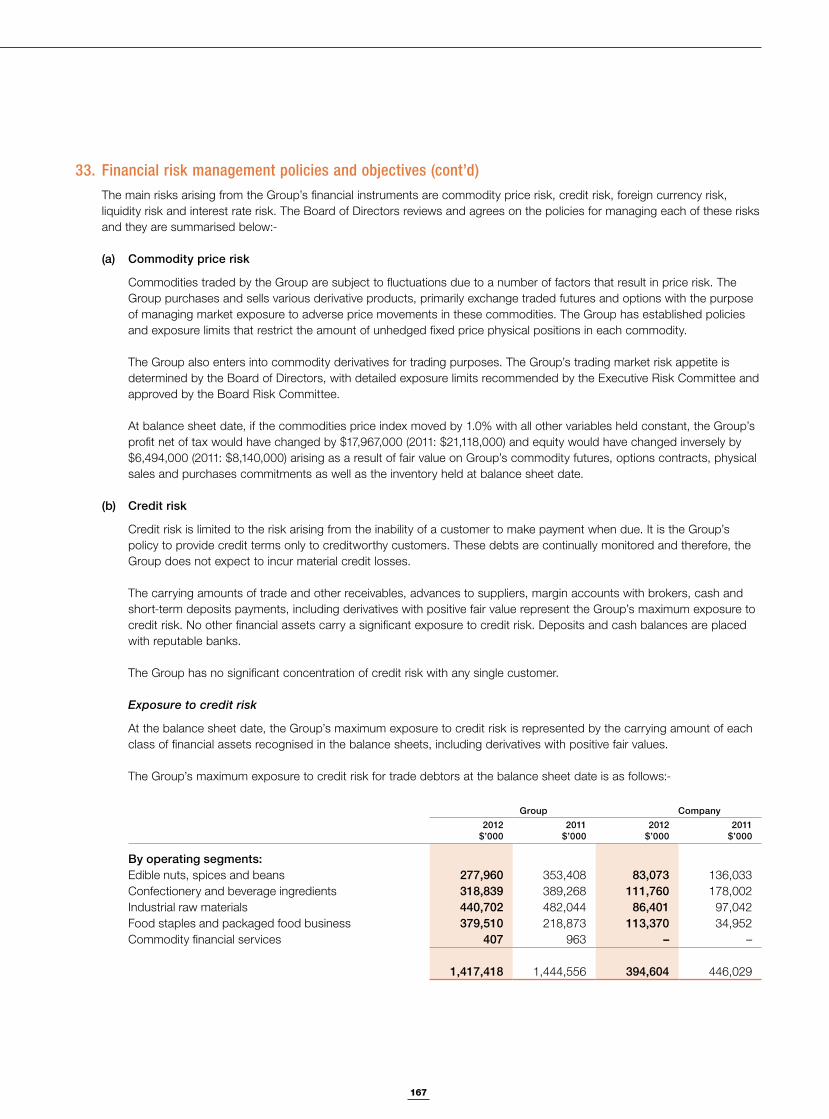
167
Notes to the Financial Statements
33. Financial risk management policies and objectives (cont’d)The main risks arising from the Group’s financial instruments are commodity price risk, credit risk, foreign currency risk, liquidity risk and interest rate risk. The Board of Directors reviews and agrees on the policies for managing each of these risks and they are summarised below:-
(a) Commodity price risk
Commodities traded by the Group are subject to fluctuations due to a number of factors that result in price risk. The Group purchases and sells various derivative products, primarily exchange traded futures and options with the purpose of managing market exposure to adverse price movements in these commodities. The Group has established policies and exposure limits that restrict the amount of unhedged fixed price physical positions in each commodity.
The Group also enters into commodity derivatives for trading purposes. The Group’s trading market risk appetite is determined by the Board of Directors, with detailed exposure limits recommended by the Executive Risk Committee and approved by the Board Risk Committee.
At balance sheet date, if the commodities price index moved by 1.0% with all other variables held constant, the Group’s profit net of tax would have changed by $17,967,000 (2011: $21,118,000) and equity would have changed inversely by $6,494,000 (2011: $8,140,000) arising as a result of fair value on Group’s commodity futures, options contracts, physical sales and purchases commitments as well as the inventory held at balance sheet date.
(b) Credit risk
Credit risk is limited to the risk arising from the inability of a customer to make payment when due. It is the Group’s policy to provide credit terms only to creditworthy customers. These debts are continually monitored and therefore, the Group does not expect to incur material credit losses.
The carrying amounts of trade and other receivables, advances to suppliers, margin accounts with brokers, cash and short-term deposits payments, including derivatives with positive fair value represent the Group’s maximum exposure to credit risk. No other financial assets carry a significant exposure to credit risk. Deposits and cash balances are placed with reputable banks.
The Group has no significant concentration of credit risk with any single customer.
Exposure to credit risk
At the balance sheet date, the Group’s maximum exposure to credit risk is represented by the carrying amount of each class of financial assets recognised in the balance sheets, including derivatives with positive fair values.
The Group’s maximum exposure to credit risk for trade debtors at the balance sheet date is as follows:-
Group Company2012
$’0002011
$’0002012
$’0002011
$’000
By operating segments:Edible nuts, spices and beans 277,960 353,408 83,073 136,033Confectionery and beverage ingredients 318,839 389,268 111,760 178,002Industrial raw materials 440,702 482,044 86,401 97,042Food staples and packaged food business 379,510 218,873 113,370 34,952Commodity financial services 407 963 – –
1,417,418 1,444,556 394,604 446,029
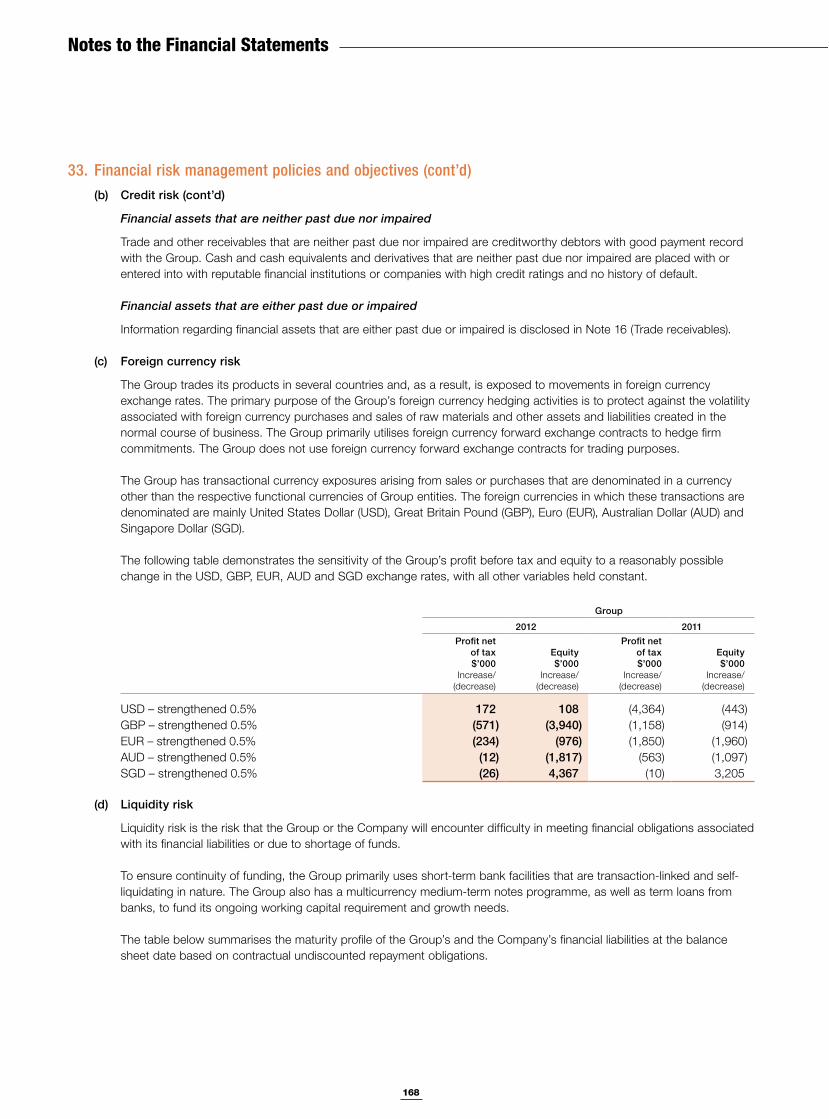
168
Notes to the Financial Statements
33. Financial risk management policies and objectives (cont’d)(b) Credit risk (cont’d)
Financial assets that are neither past due nor impaired
Trade and other receivables that are neither past due nor impaired are creditworthy debtors with good payment record with the Group. Cash and cash equivalents and derivatives that are neither past due nor impaired are placed with or entered into with reputable financial institutions or companies with high credit ratings and no history of default.
Financial assets that are either past due or impaired
Information regarding financial assets that are either past due or impaired is disclosed in Note 16 (Trade receivables).
(c) Foreign currency risk
The Group trades its products in several countries and, as a result, is exposed to movements in foreign currency exchange rates. The primary purpose of the Group’s foreign currency hedging activities is to protect against the volatility associated with foreign currency purchases and sales of raw materials and other assets and liabilities created in the normal course of business. The Group primarily utilises foreign currency forward exchange contracts to hedge firm commitments. The Group does not use foreign currency forward exchange contracts for trading purposes.
The Group has transactional currency exposures arising from sales or purchases that are denominated in a currency other than the respective functional currencies of Group entities. The foreign currencies in which these transactions are denominated are mainly United States Dollar (USD), Great Britain Pound (GBP), Euro (EUR), Australian Dollar (AUD) and Singapore Dollar (SGD).
The following table demonstrates the sensitivity of the Group’s profit before tax and equity to a reasonably possible change in the USD, GBP, EUR, AUD and SGD exchange rates, with all other variables held constant.
Group
2012 2011Profit net
of tax$’000
Increase/(decrease)
Equity$’000
Increase/(decrease)
Profit net of tax$’000
Increase/(decrease)
Equity$’000
Increase/(decrease)
USD – strengthened 0.5% 172 108 (4,364) (443)GBP – strengthened 0.5% (571) (3,940) (1,158) (914)EUR – strengthened 0.5% (234) (976) (1,850) (1,960)AUD – strengthened 0.5% (12) (1,817) (563) (1,097) SGD – strengthened 0.5% (26) 4,367 (10) 3,205
(d) Liquidity risk
Liquidity risk is the risk that the Group or the Company will encounter difficulty in meeting financial obligations associated with its financial liabilities or due to shortage of funds.
To ensure continuity of funding, the Group primarily uses short-term bank facilities that are transaction-linked and self-liquidating in nature. The Group also has a multicurrency medium-term notes programme, as well as term loans from banks, to fund its ongoing working capital requirement and growth needs.
The table below summarises the maturity profile of the Group’s and the Company’s financial liabilities at the balance sheet date based on contractual undiscounted repayment obligations.
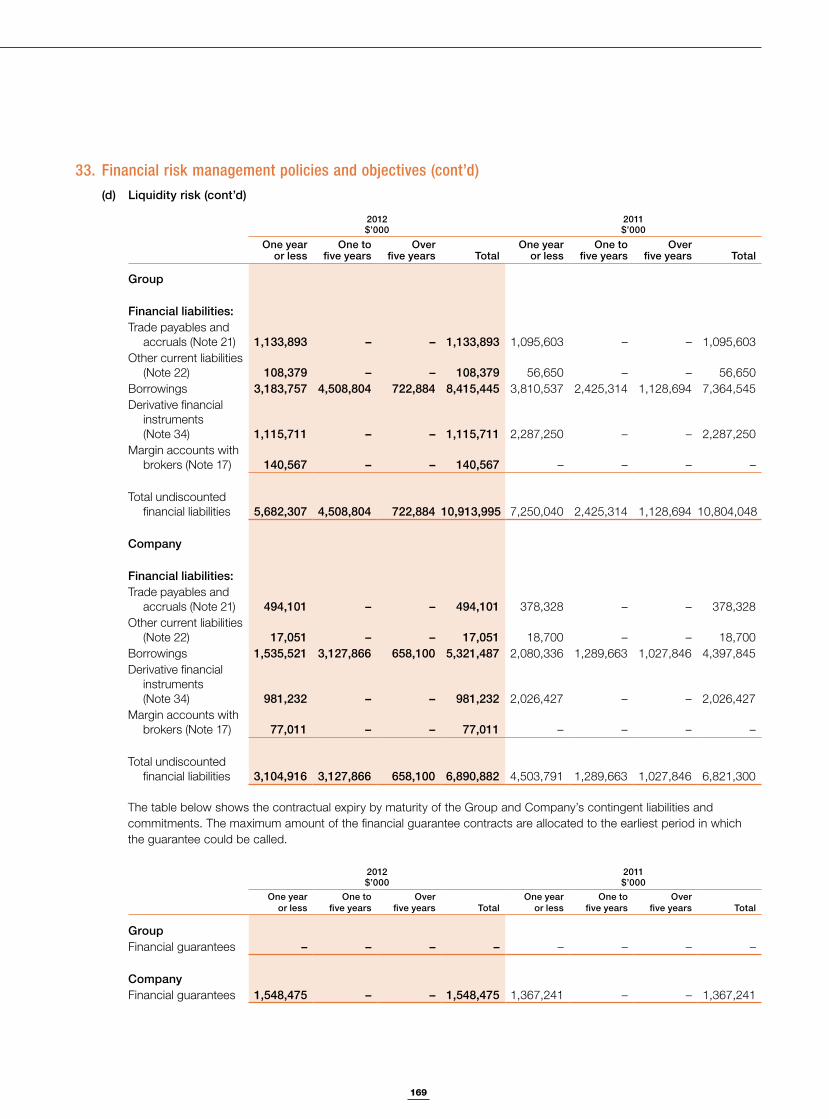
169
Notes to the Financial Statements
33. Financial risk management policies and objectives (cont’d)(d) Liquidity risk (cont’d)
2012$’000
2011$’000
One yearor less
One tofive years
Overfive years Total
One yearor less
One tofive years
Overfive years Total
Group
Financial liabilities:Trade payables and
accruals (Note 21) 1,133,893 – – 1,133,893 1,095,603 – – 1,095,603Other current liabilities
(Note 22) 108,379 – – 108,379 56,650 – – 56,650Borrowings 3,183,757 4,508,804 722,884 8,415,445 3,810,537 2,425,314 1,128,694 7,364,545Derivative financial
instruments (Note 34) 1,115,711 – – 1,115,711 2,287,250 – – 2,287,250
Margin accounts with brokers (Note 17) 140,567 – – 140,567 – – – –
Total undiscounted financial liabilities 5,682,307 4,508,804 722,884 10,913,995 7,250,040 2,425,314 1,128,694 10,804,048
Company
Financial liabilities:Trade payables and
accruals (Note 21) 494,101 – – 494,101 378,328 – – 378,328Other current liabilities
(Note 22) 17,051 – – 17,051 18,700 – – 18,700Borrowings 1,535,521 3,127,866 658,100 5,321,487 2,080,336 1,289,663 1,027,846 4,397,845Derivative financial
instruments (Note 34) 981,232 – – 981,232 2,026,427 – – 2,026,427
Margin accounts with brokers (Note 17) 77,011 – – 77,011 – – – –
Total undiscounted financial liabilities 3,104,916 3,127,866 658,100 6,890,882 4,503,791 1,289,663 1,027,846 6,821,300
The table below shows the contractual expiry by maturity of the Group and Company’s contingent liabilities and commitments. The maximum amount of the financial guarantee contracts are allocated to the earliest period in which the guarantee could be called.
2012$’000
2011$’000
One yearor less
One tofive years
Overfive years Total
One yearor less
One tofive years
Overfive years Total
GroupFinancial guarantees – – – – – – – –
CompanyFinancial guarantees 1,548,475 – – 1,548,475 1,367,241 – – 1,367,241
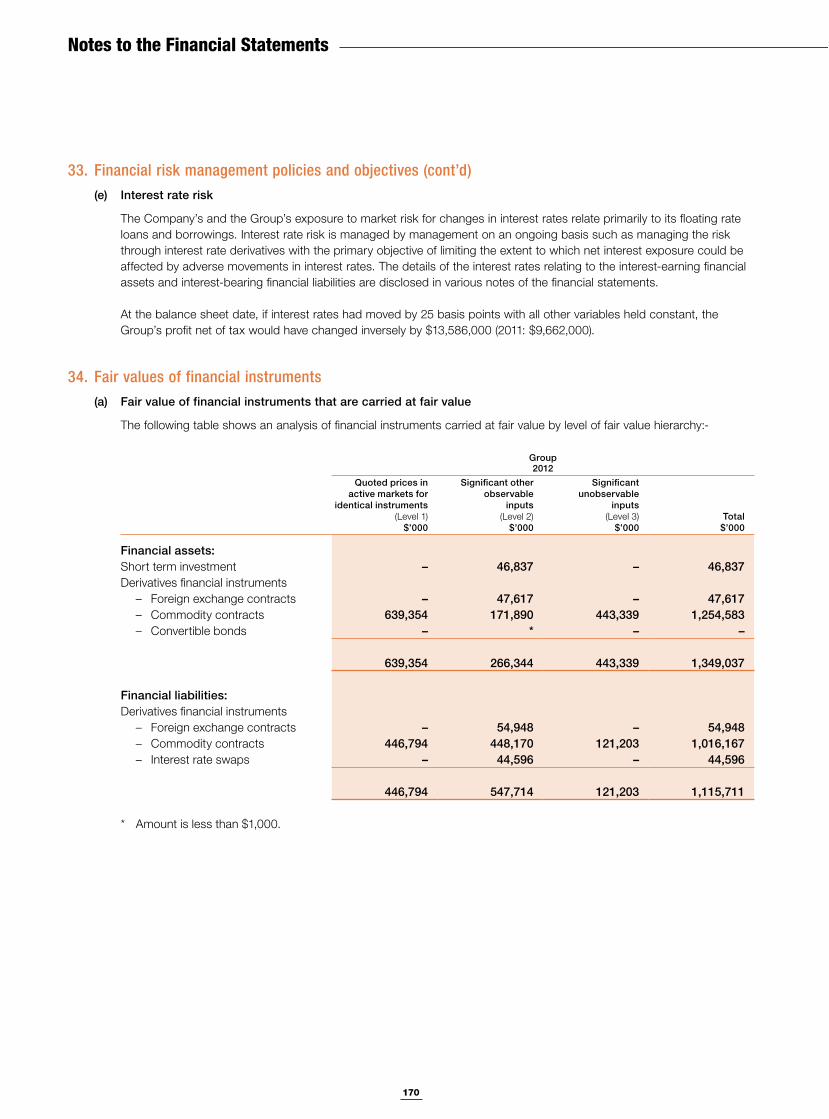
170
Notes to the Financial Statements
33. Financial risk management policies and objectives (cont’d)(e) Interest rate risk
The Company’s and the Group’s exposure to market risk for changes in interest rates relate primarily to its floating rate loans and borrowings. Interest rate risk is managed by management on an ongoing basis such as managing the risk through interest rate derivatives with the primary objective of limiting the extent to which net interest exposure could be affected by adverse movements in interest rates. The details of the interest rates relating to the interest-earning financial assets and interest-bearing financial liabilities are disclosed in various notes of the financial statements.
At the balance sheet date, if interest rates had moved by 25 basis points with all other variables held constant, the Group’s profit net of tax would have changed inversely by $13,586,000 (2011: $9,662,000).
34. Fair values of financial instruments(a) Fair value of financial instruments that are carried at fair value
The following table shows an analysis of financial instruments carried at fair value by level of fair value hierarchy:-
Group2012
Quoted prices in active markets for
identical instruments(Level 1)
$’000
Significant other observable
inputs(Level 2)
$’000
Significant unobservable
inputs(Level 3)
$’000Total
$’000
Financial assets:Short term investment – 46,837 – 46,837Derivatives financial instruments – Foreign exchange contracts – 47,617 – 47,617 – Commodity contracts 639,354 171,890 443,339 1,254,583 – Convertible bonds – * – –
639,354 266,344 443,339 1,349,037
Financial liabilities:Derivatives financial instruments – Foreign exchange contracts – 54,948 – 54,948 – Commodity contracts 446,794 448,170 121,203 1,016,167 – Interest rate swaps – 44,596 – 44,596
446,794 547,714 121,203 1,115,711
* Amount is less than $1,000.
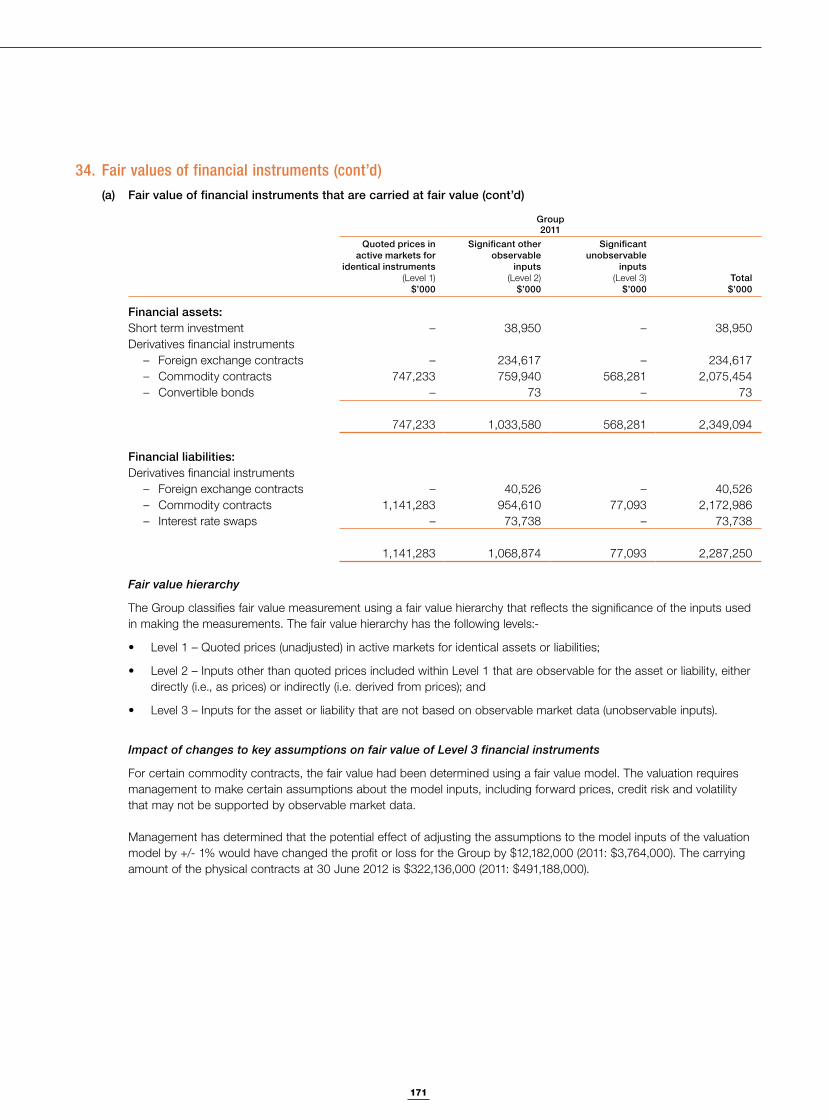
171
Notes to the Financial Statements
34. Fair values of financial instruments (cont’d)(a) Fair value of financial instruments that are carried at fair value (cont’d)
Group2011
Quoted prices in active markets for
identical instruments(Level 1)
$’000
Significant other observable
inputs(Level 2)
$’000
Significant unobservable
inputs(Level 3)
$’000Total
$’000
Financial assets:Short term investment – 38,950 – 38,950Derivatives financial instruments – Foreign exchange contracts – 234,617 – 234,617 – Commodity contracts 747,233 759,940 568,281 2,075,454 – Convertible bonds – 73 – 73
747,233 1,033,580 568,281 2,349,094
Financial liabilities:Derivatives financial instruments – Foreign exchange contracts – 40,526 – 40,526 – Commodity contracts 1,141,283 954,610 77,093 2,172,986 – Interest rate swaps – 73,738 – 73,738
1,141,283 1,068,874 77,093 2,287,250
Fair value hierarchy
The Group classifies fair value measurement using a fair value hierarchy that reflects the significance of the inputs used in making the measurements. The fair value hierarchy has the following levels:-
directly (i.e., as prices) or indirectly (i.e. derived from prices); and
Impact of changes to key assumptions on fair value of Level 3 financial instruments
For certain commodity contracts, the fair value had been determined using a fair value model. The valuation requires management to make certain assumptions about the model inputs, including forward prices, credit risk and volatility that may not be supported by observable market data.
Management has determined that the potential effect of adjusting the assumptions to the model inputs of the valuation model by +/- 1% would have changed the profit or loss for the Group by $12,182,000 (2011: $3,764,000). The carrying amount of the physical contracts at 30 June 2012 is $322,136,000 (2011: $491,188,000).
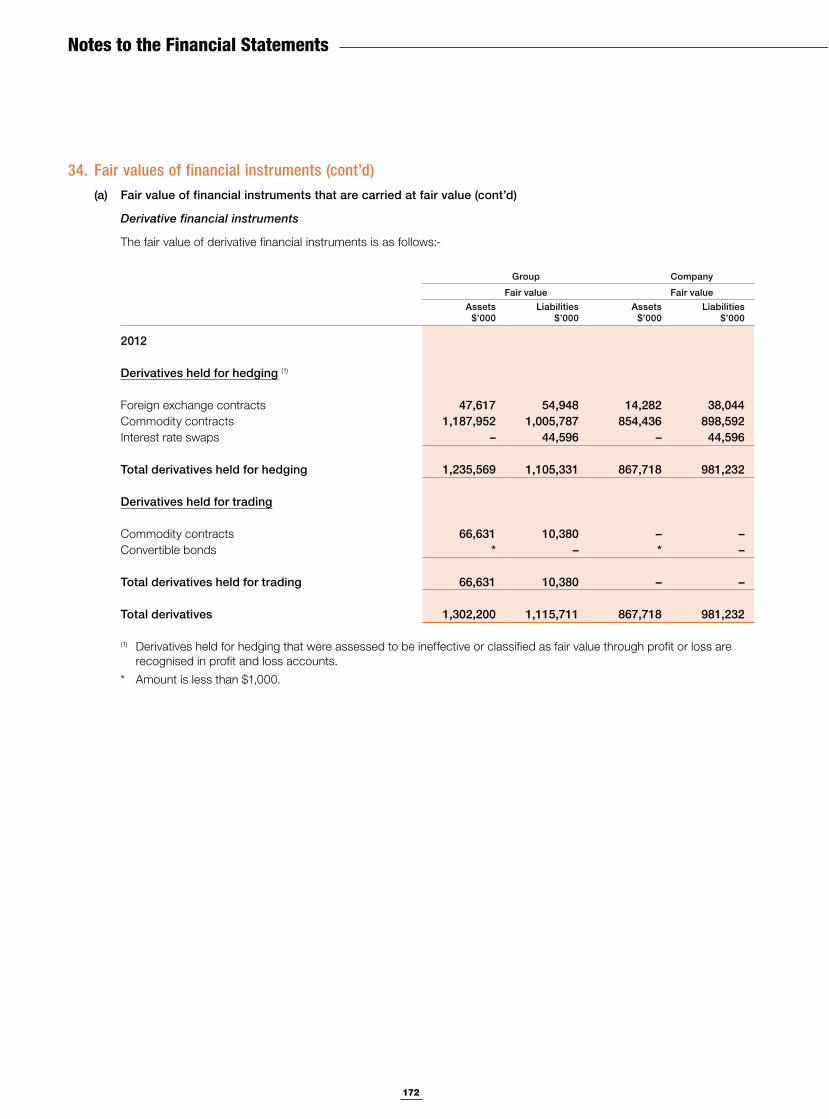
172
Notes to the Financial Statements
34. Fair values of financial instruments (cont’d)(a) Fair value of financial instruments that are carried at fair value (cont’d)
Derivative financial instruments
The fair value of derivative financial instruments is as follows:-
Group Company
Fair value Fair valueAssets
$’000Liabilities
$’000Assets
$’000Liabilities
$’000
2012
Derivatives held for hedging (1)
Foreign exchange contracts 47,617 54,948 14,282 38,044Commodity contracts 1,187,952 1,005,787 854,436 898,592Interest rate swaps – 44,596 – 44,596
Total derivatives held for hedging 1,235,569 1,105,331 867,718 981,232
Derivatives held for trading
Commodity contracts 66,631 10,380 – –Convertible bonds * – * –
Total derivatives held for trading 66,631 10,380 – –
Total derivatives 1,302,200 1,115,711 867,718 981,232
(1) Derivatives held for hedging that were assessed to be ineffective or classified as fair value through profit or loss are recognised in profit and loss accounts.
* Amount is less than $1,000.
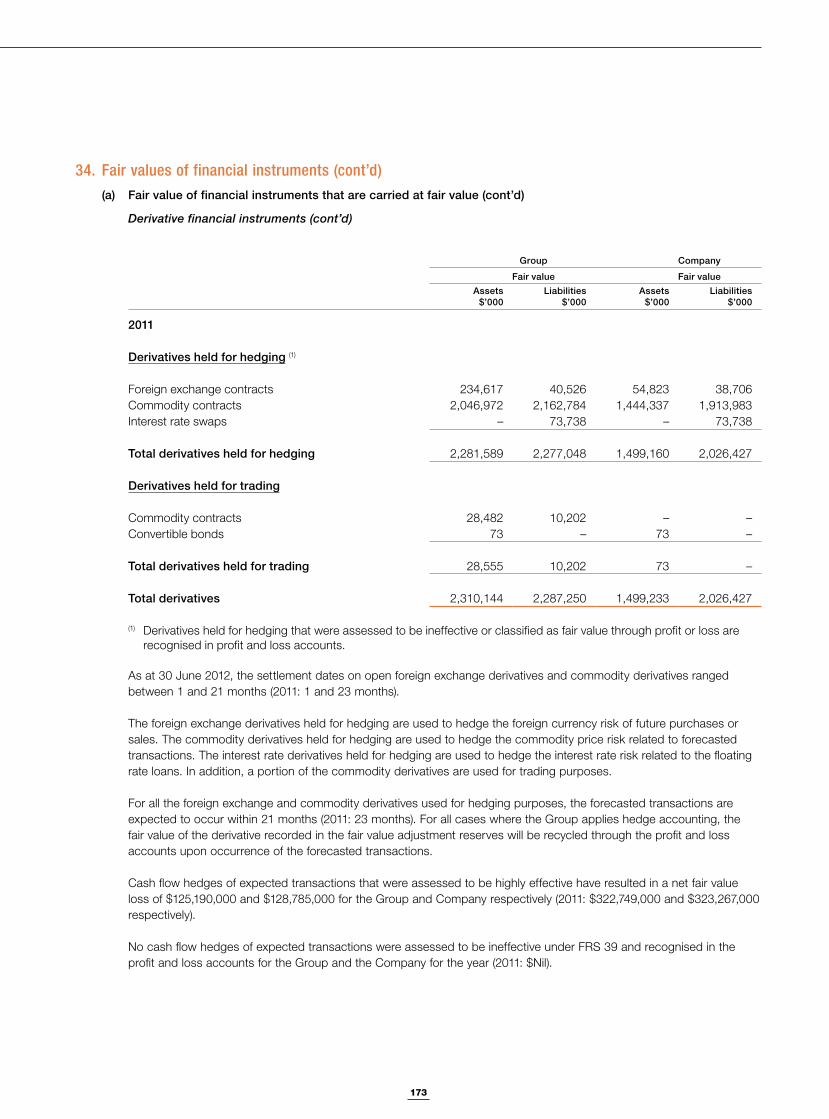
173
Notes to the Financial Statements
34. Fair values of financial instruments (cont’d)(a) Fair value of financial instruments that are carried at fair value (cont’d)
Derivative financial instruments (cont’d)
Group Company
Fair value Fair valueAssets
$’000Liabilities
$’000Assets
$’000Liabilities
$’000
2011
Derivatives held for hedging (1)
Foreign exchange contracts 234,617 40,526 54,823 38,706Commodity contracts 2,046,972 2,162,784 1,444,337 1,913,983Interest rate swaps – 73,738 – 73,738
Total derivatives held for hedging 2,281,589 2,277,048 1,499,160 2,026,427
Derivatives held for trading
Commodity contracts 28,482 10,202 – –Convertible bonds 73 – 73 –
Total derivatives held for trading 28,555 10,202 73 –
Total derivatives 2,310,144 2,287,250 1,499,233 2,026,427
(1) Derivatives held for hedging that were assessed to be ineffective or classified as fair value through profit or loss are recognised in profit and loss accounts.
As at 30 June 2012, the settlement dates on open foreign exchange derivatives and commodity derivatives ranged between 1 and 21 months (2011: 1 and 23 months).
The foreign exchange derivatives held for hedging are used to hedge the foreign currency risk of future purchases or sales. The commodity derivatives held for hedging are used to hedge the commodity price risk related to forecasted transactions. The interest rate derivatives held for hedging are used to hedge the interest rate risk related to the floating rate loans. In addition, a portion of the commodity derivatives are used for trading purposes.
For all the foreign exchange and commodity derivatives used for hedging purposes, the forecasted transactions are expected to occur within 21 months (2011: 23 months). For all cases where the Group applies hedge accounting, the fair value of the derivative recorded in the fair value adjustment reserves will be recycled through the profit and loss accounts upon occurrence of the forecasted transactions.
Cash flow hedges of expected transactions that were assessed to be highly effective have resulted in a net fair value loss of $125,190,000 and $128,785,000 for the Group and Company respectively (2011: $322,749,000 and $323,267,000 respectively).
No cash flow hedges of expected transactions were assessed to be ineffective under FRS 39 and recognised in the profit and loss accounts for the Group and the Company for the year (2011: $Nil).
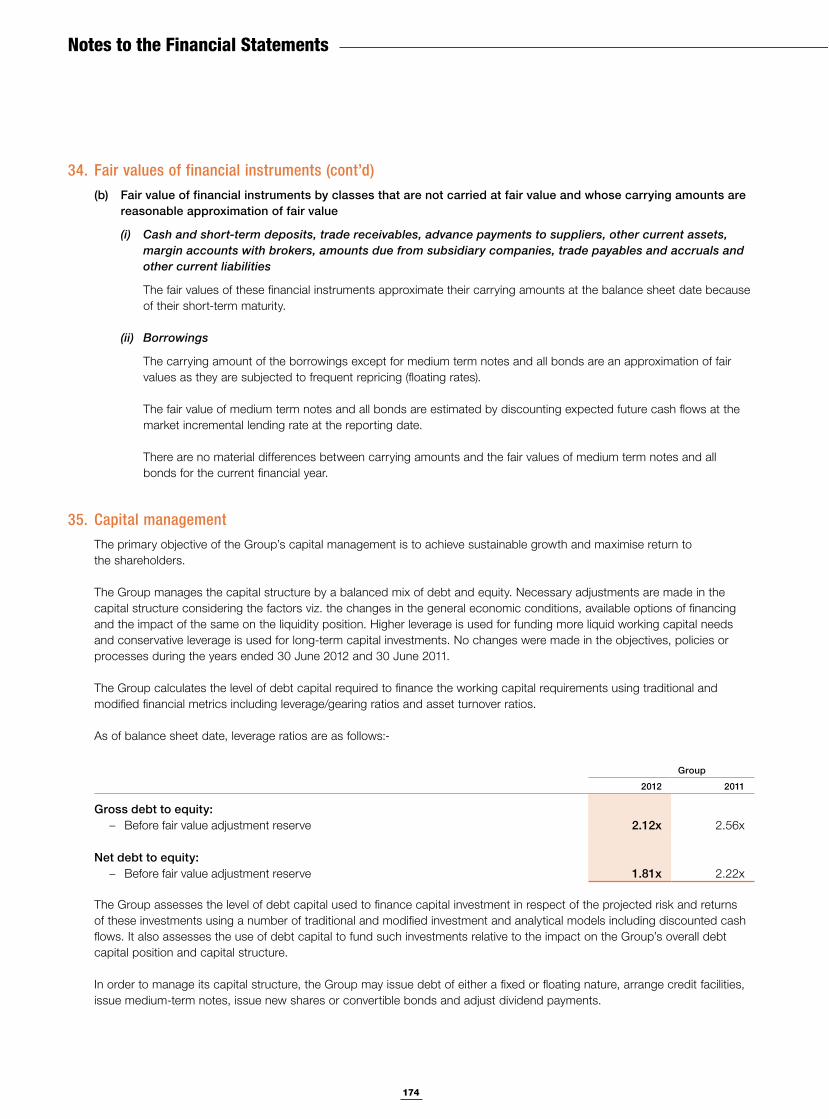
174
Notes to the Financial Statements
34. Fair values of financial instruments (cont’d)(b) Fair value of financial instruments by classes that are not carried at fair value and whose carrying amounts are
reasonable approximation of fair value
(i) Cash and short-term deposits, trade receivables, advance payments to suppliers, other current assets, margin accounts with brokers, amounts due from subsidiary companies, trade payables and accruals and other current liabilities
The fair values of these financial instruments approximate their carrying amounts at the balance sheet date because of their short-term maturity.
(ii) Borrowings
The carrying amount of the borrowings except for medium term notes and all bonds are an approximation of fair values as they are subjected to frequent repricing (floating rates).
The fair value of medium term notes and all bonds are estimated by discounting expected future cash flows at the market incremental lending rate at the reporting date.
There are no material differences between carrying amounts and the fair values of medium term notes and all bonds for the current financial year.
35. Capital managementThe primary objective of the Group’s capital management is to achieve sustainable growth and maximise return to the shareholders.
The Group manages the capital structure by a balanced mix of debt and equity. Necessary adjustments are made in the capital structure considering the factors viz. the changes in the general economic conditions, available options of financing and the impact of the same on the liquidity position. Higher leverage is used for funding more liquid working capital needs and conservative leverage is used for long-term capital investments. No changes were made in the objectives, policies or processes during the years ended 30 June 2012 and 30 June 2011.
The Group calculates the level of debt capital required to finance the working capital requirements using traditional and modified financial metrics including leverage/gearing ratios and asset turnover ratios.
As of balance sheet date, leverage ratios are as follows:-
Group
2012 2011
Gross debt to equity: – Before fair value adjustment reserve 2.12x 2.56x
Net debt to equity: – Before fair value adjustment reserve 1.81x 2.22x
The Group assesses the level of debt capital used to finance capital investment in respect of the projected risk and returns of these investments using a number of traditional and modified investment and analytical models including discounted cash flows. It also assesses the use of debt capital to fund such investments relative to the impact on the Group’s overall debt capital position and capital structure.
In order to manage its capital structure, the Group may issue debt of either a fixed or floating nature, arrange credit facilities, issue medium-term notes, issue new shares or convertible bonds and adjust dividend payments.
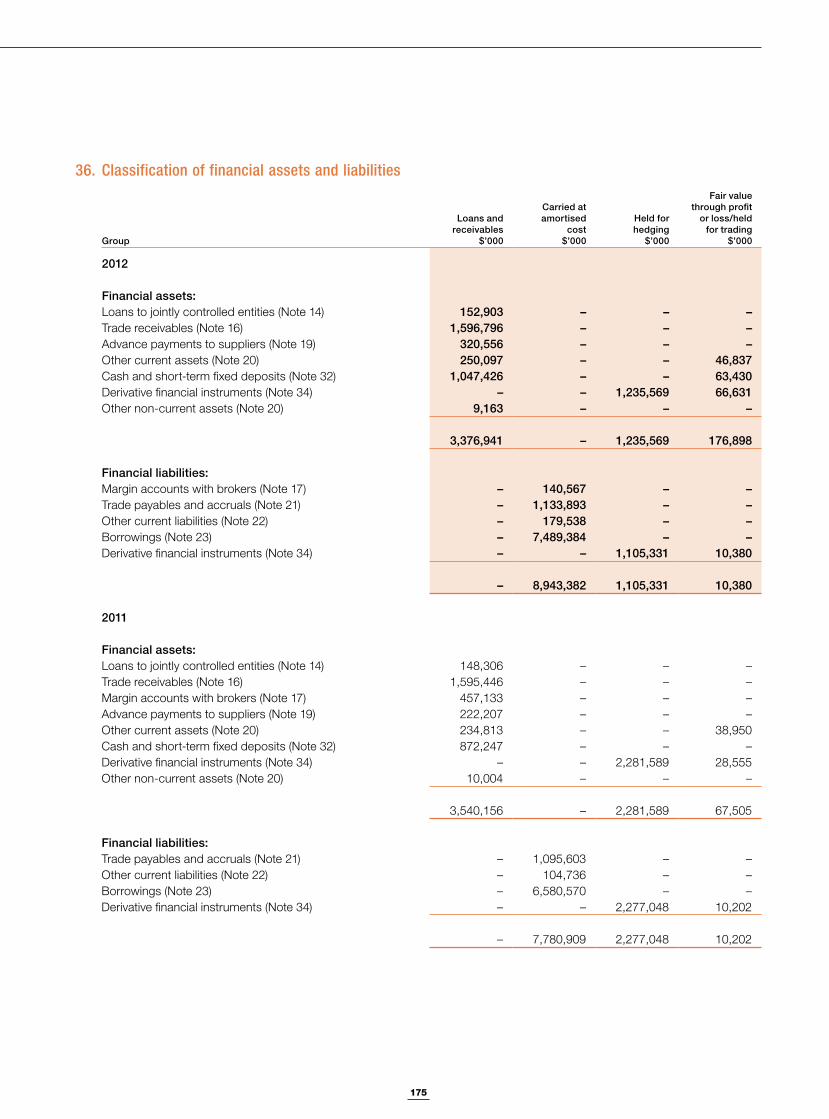
175
Notes to the Financial Statements
36. Classification of financial assets and liabilities
Group
Loans and receivables
$’000
Carried at amortised
cost$’000
Held for hedging
$’000
Fair value through profit
or loss/heldfor trading
$’000
2012
Financial assets:Loans to jointly controlled entities (Note 14) 152,903 – – –Trade receivables (Note 16) 1,596,796 – – –Advance payments to suppliers (Note 19) 320,556 – – –Other current assets (Note 20) 250,097 – – 46,837Cash and short-term fixed deposits (Note 32) 1,047,426 – – 63,430Derivative financial instruments (Note 34) – – 1,235,569 66,631Other non-current assets (Note 20) 9,163 – – –
3,376,941 – 1,235,569 176,898
Financial liabilities:Margin accounts with brokers (Note 17) – 140,567 – –Trade payables and accruals (Note 21) – 1,133,893 – –Other current liabilities (Note 22) – 179,538 – –Borrowings (Note 23) – 7,489,384 – –Derivative financial instruments (Note 34) – – 1,105,331 10,380
– 8,943,382 1,105,331 10,380
2011
Financial assets:Loans to jointly controlled entities (Note 14) 148,306 – – –Trade receivables (Note 16) 1,595,446 – – –Margin accounts with brokers (Note 17) 457,133 – – –Advance payments to suppliers (Note 19) 222,207 – – –Other current assets (Note 20) 234,813 – – 38,950Cash and short-term fixed deposits (Note 32) 872,247 – – –Derivative financial instruments (Note 34) – – 2,281,589 28,555Other non-current assets (Note 20) 10,004 – – –
3,540,156 – 2,281,589 67,505
Financial liabilities:Trade payables and accruals (Note 21) – 1,095,603 – –Other current liabilities (Note 22) – 104,736 – –Borrowings (Note 23) – 6,580,570 – –Derivative financial instruments (Note 34) – – 2,277,048 10,202
– 7,780,909 2,277,048 10,202
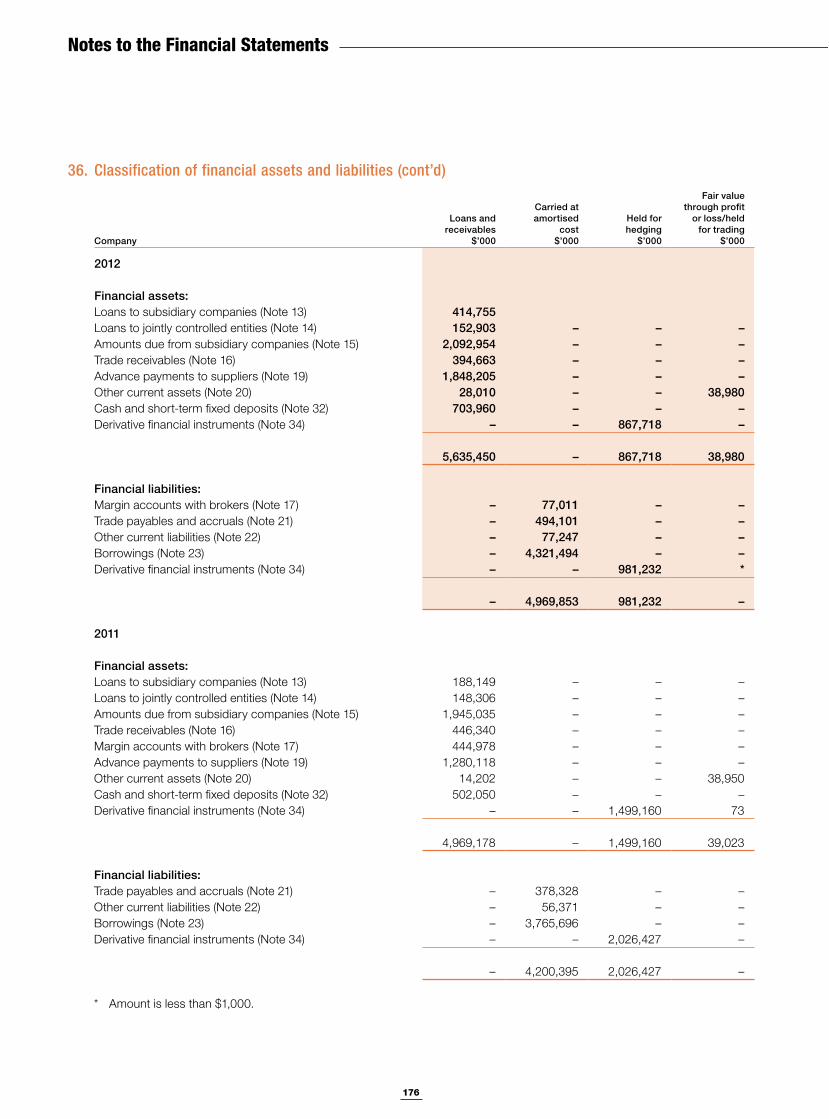
176
Notes to the Financial Statements
36. Classification of financial assets and liabilities (cont’d)
Company
Loans and receivables
$’000
Carried at amortised
cost$’000
Held for hedging
$’000
Fair value through profit
or loss/heldfor trading
$’000
2012
Financial assets:Loans to subsidiary companies (Note 13) 414,755Loans to jointly controlled entities (Note 14) 152,903 – – –Amounts due from subsidiary companies (Note 15) 2,092,954 – – –Trade receivables (Note 16) 394,663 – – –Advance payments to suppliers (Note 19) 1,848,205 – – –Other current assets (Note 20) 28,010 – – 38,980Cash and short-term fixed deposits (Note 32) 703,960 – – –Derivative financial instruments (Note 34) – – 867,718 –
5,635,450 – 867,718 38,980
Financial liabilities:Margin accounts with brokers (Note 17) – 77,011 – –Trade payables and accruals (Note 21) – 494,101 – –Other current liabilities (Note 22) – 77,247 – –Borrowings (Note 23) – 4,321,494 – –Derivative financial instruments (Note 34) – – 981,232 *
– 4,969,853 981,232 –
2011
Financial assets:Loans to subsidiary companies (Note 13) 188,149 – – –Loans to jointly controlled entities (Note 14) 148,306 – – –Amounts due from subsidiary companies (Note 15) 1,945,035 – – –Trade receivables (Note 16) 446,340 – – –Margin accounts with brokers (Note 17) 444,978 – – –Advance payments to suppliers (Note 19) 1,280,118 – – –Other current assets (Note 20) 14,202 – – 38,950Cash and short-term fixed deposits (Note 32) 502,050 – – –Derivative financial instruments (Note 34) – – 1,499,160 73
4,969,178 – 1,499,160 39,023
Financial liabilities:Trade payables and accruals (Note 21) – 378,328 – –Other current liabilities (Note 22) – 56,371 – –Borrowings (Note 23) – 3,765,696 – –Derivative financial instruments (Note 34) – – 2,026,427 –
– 4,200,395 2,026,427 –
* Amount is less than $1,000.
177
Notes to the Financial Statements
37. Segmental informationThe Group’s businesses are organised and managed as five broad segments grouped in relation to different types and nature of products traded. The Group’s supply chain activities of sourcing, processing and merchandising span across a broad range of agricultural products.
The segmentation of products has been done in the following manner:-
beans including pulses, lentils and peas.
products, dairy products and packaged foods.
Segment results, assets and liabilities include items directly attributable to a segment as well as those that can be allocated on a reasonable basis. Unallocated items mainly comprise corporate cash, fixed deposits, other receivables and corporate liabilities such as taxation, amounts due to bankers and medium-term notes. Assets which are unallocated are common and shared by segments and thus it is not practical to allocate them.
Management monitors the operating results of its business units separately for the purpose of making decisions about resource allocation and performance assessment. Segment performance is evaluated based on operating profit or loss which, in certain respects, as explained in the table below, is measured differently from operating profit or loss in the consolidated financial statements. Group financing (including finance cost), which is managed on group basis, and income tax which is evaluated on group basis are not allocated to operating segments.
The turnover by geographical segments is based on the location of customers regardless of where the goods are produced. The assets and capital expenditure are attributed to the location of those assets.
Segment accounting policies are the same as the policies of the Group as described in Note 2. The Group generally accounts for inter-segment sales and transfers as if the sales or transfers were to third parties at current market prices.
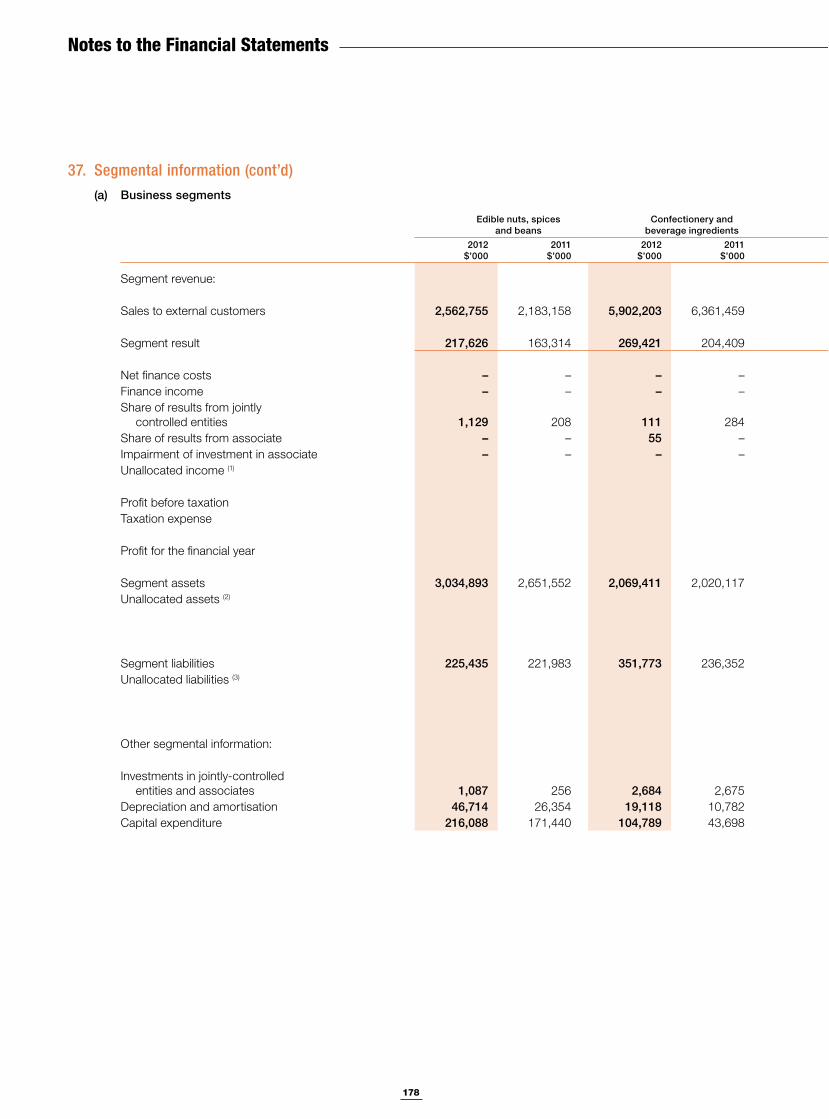
178
Notes to the Financial Statements
37. Segmental information (cont’d)(a) Business segments
Edible nuts, spices and beans
Confectionery and beverage ingredients
Industrial raw materials
Food staples and packaged foods
Commodity financial services Consolidated
2012$’000
2011$’000
2012$’000
2011$’000
2012$’000
2011$’000
2012$’000
2011$’000
2012$’000
2011$’000
2012$’000
2011$’000
Segment revenue:
Sales to external customers 2,562,755 2,183,158 5,902,203 6,361,459 4,040,810 3,790,018 4,586,435 3,466,623 1,548 2,129 17,093,751 15,803,387
Segment result 217,626 163,314 269,421 204,409 97,521 210,734 217,973 157,656 53 20,906 802,594 757,019
Net finance costs – – – – – – – – – – (437,550) (344,358)Finance income – – – – – – – – – – 20,037 12,375Share of results from jointly
controlled entities 1,129 208 111 284 12,866 (395) 26,724 36,647 – – 40,830 36,744Share of results from associate – – 55 – – – (3,419) (8,576) – – (3,364) (8,576)Impairment of investment in associate – – – – – – – (35,596) – – – (35,596)Unallocated income (1) 15,363 92,657
Profit before taxation 437,910 510,265Taxation expense (34,085) (65,697)
Profit for the financial year 403,825 444,568
Segment assets 3,034,893 2,651,552 2,069,411 2,020,117 3,217,128 4,224,826 3,645,354 2,184,514 67,686 15,632 12,034,472 11,096,641Unallocated assets (2) 1,793,510 1,483,495
13,827,982 12,580,136
Segment liabilities 225,435 221,983 351,773 236,352 1,199,748 2,395,711 559,615 460,016 22,409 13,753 2,358,980 3,327,815Unallocated liabilities (3) 7,941,240 6,949,959
10,300,220 10,277,774
Other segmental information:
Investments in jointly-controlled entities and associates 1,087 256 2,684 2,675 80,998 66,955 398,095 341,933 – – 482,864 411,819
Depreciation and amortisation 46,714 26,354 19,118 10,782 47,422 53,256 37,133 15,857 227 1,319 150,614 107,568Capital expenditure 216,088 171,440 104,789 43,698 274,220 78,090 665,857 403,025 137 549 1,261,091 696,802
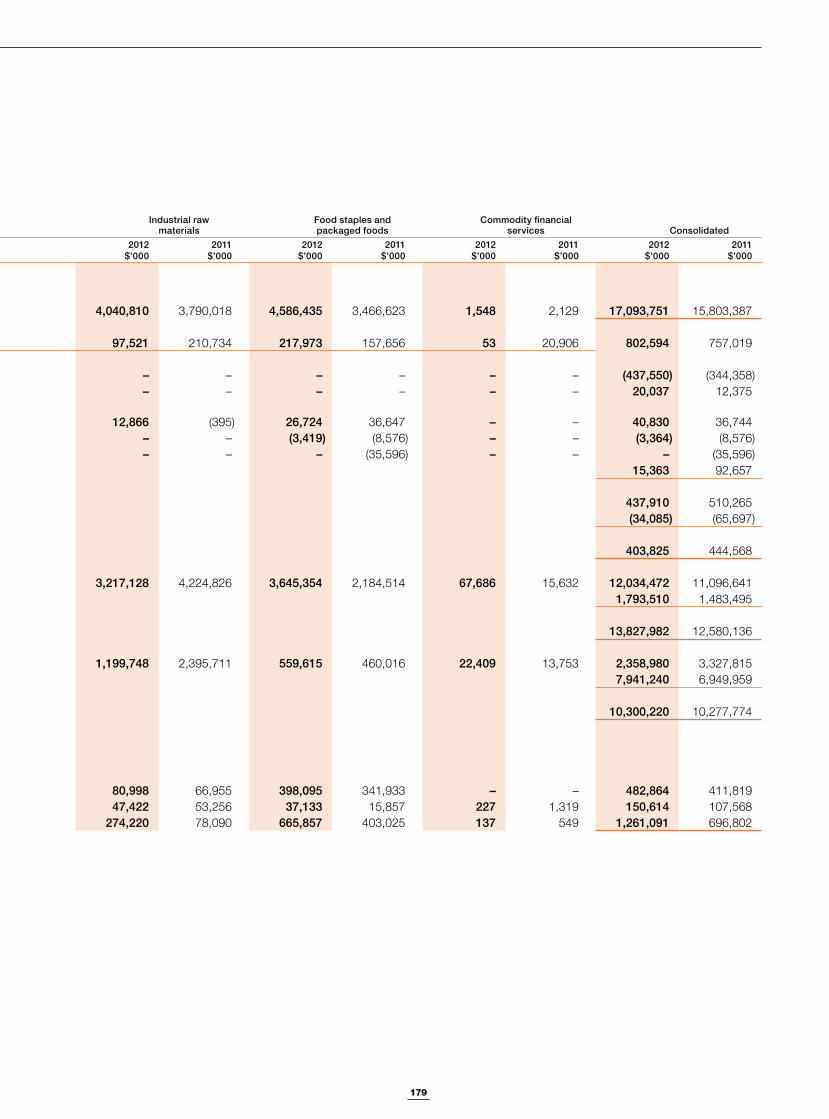
179
Notes to the Financial Statements
37. Segmental information (cont’d)(a) Business segments
Edible nuts, spices and beans
Confectionery and beverage ingredients
Industrial raw materials
Food staples and packaged foods
Commodity financial services Consolidated
2012$’000
2011$’000
2012$’000
2011$’000
2012$’000
2011$’000
2012$’000
2011$’000
2012$’000
2011$’000
2012$’000
2011$’000
Segment revenue:
Sales to external customers 2,562,755 2,183,158 5,902,203 6,361,459 4,040,810 3,790,018 4,586,435 3,466,623 1,548 2,129 17,093,751 15,803,387
Segment result 217,626 163,314 269,421 204,409 97,521 210,734 217,973 157,656 53 20,906 802,594 757,019
Net finance costs – – – – – – – – – – (437,550) (344,358)Finance income – – – – – – – – – – 20,037 12,375Share of results from jointly
controlled entities 1,129 208 111 284 12,866 (395) 26,724 36,647 – – 40,830 36,744Share of results from associate – – 55 – – – (3,419) (8,576) – – (3,364) (8,576)Impairment of investment in associate – – – – – – – (35,596) – – – (35,596)Unallocated income (1) 15,363 92,657
Profit before taxation 437,910 510,265Taxation expense (34,085) (65,697)
Profit for the financial year 403,825 444,568
Segment assets 3,034,893 2,651,552 2,069,411 2,020,117 3,217,128 4,224,826 3,645,354 2,184,514 67,686 15,632 12,034,472 11,096,641Unallocated assets (2) 1,793,510 1,483,495
13,827,982 12,580,136
Segment liabilities 225,435 221,983 351,773 236,352 1,199,748 2,395,711 559,615 460,016 22,409 13,753 2,358,980 3,327,815Unallocated liabilities (3) 7,941,240 6,949,959
10,300,220 10,277,774
Other segmental information:
Investments in jointly-controlled entities and associates 1,087 256 2,684 2,675 80,998 66,955 398,095 341,933 – – 482,864 411,819
Depreciation and amortisation 46,714 26,354 19,118 10,782 47,422 53,256 37,133 15,857 227 1,319 150,614 107,568Capital expenditure 216,088 171,440 104,789 43,698 274,220 78,090 665,857 403,025 137 549 1,261,091 696,802
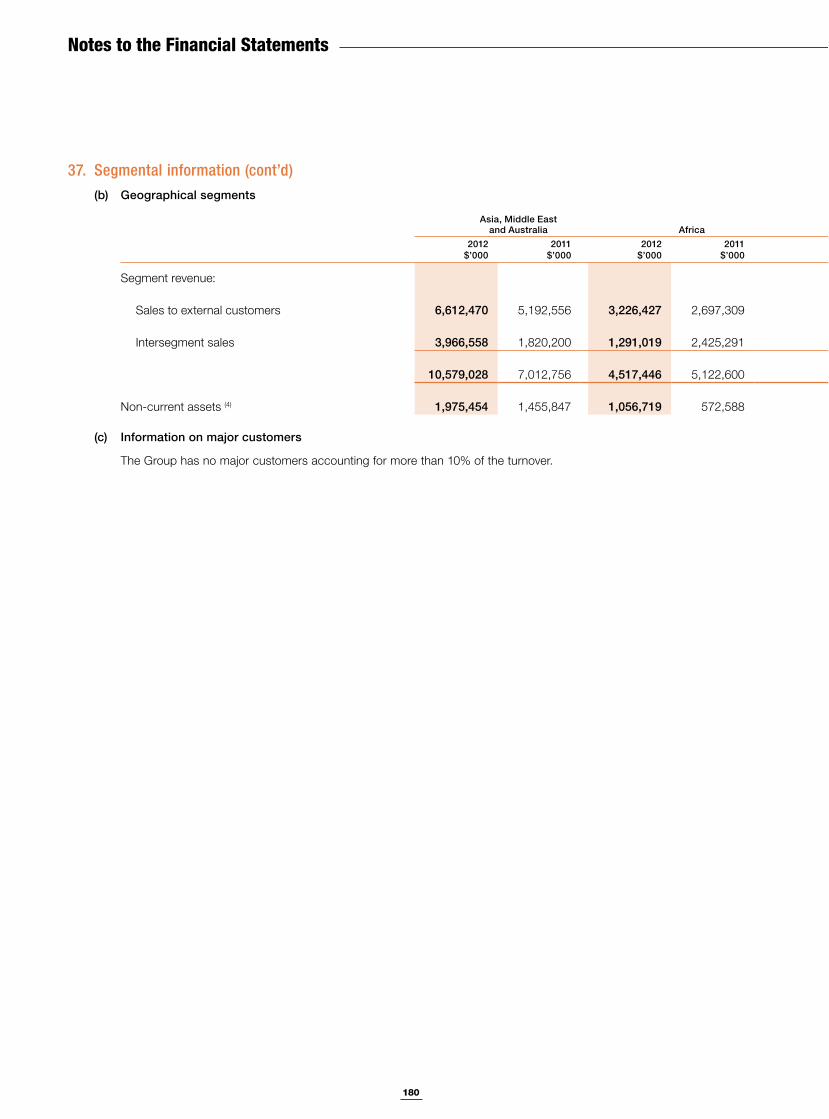
180
Notes to the Financial Statements
37. Segmental information (cont’d)(b) Geographical segments
Asia, Middle Eastand Australia Africa Europe Americas Eliminations Consolidated
2012$’000
2011$’000
2012$’000
2011$’000
2012$’000
2011$’000
2012$’000
2011$’000
2012$’000
2011$’000
2012$’000
2011$’000
Segment revenue:
Sales to external customers 6,612,470 5,192,556 3,226,427 2,697,309 3,937,374 3,711,250 3,317,480 4,202,272 – – 17,093,751 15,803,387
Intersegment sales 3,966,558 1,820,200 1,291,019 2,425,291 435,248 324,958 1,749,277 1,443,613 (7,442,102) (6,014,062) – –
10,579,028 7,012,756 4,517,446 5,122,600 4,372,622 4,036,208 5,066,757 5,645,885 (7,442,102) (6,014,062) 17,093,751 15,803,387
Non-current assets (4) 1,975,454 1,455,847 1,056,719 572,588 306,626 17,971 1,103,454 934,291 – – 4,442,253 2,980,697
(c) Information on major customers
The Group has no major customers accounting for more than 10% of the turnover.
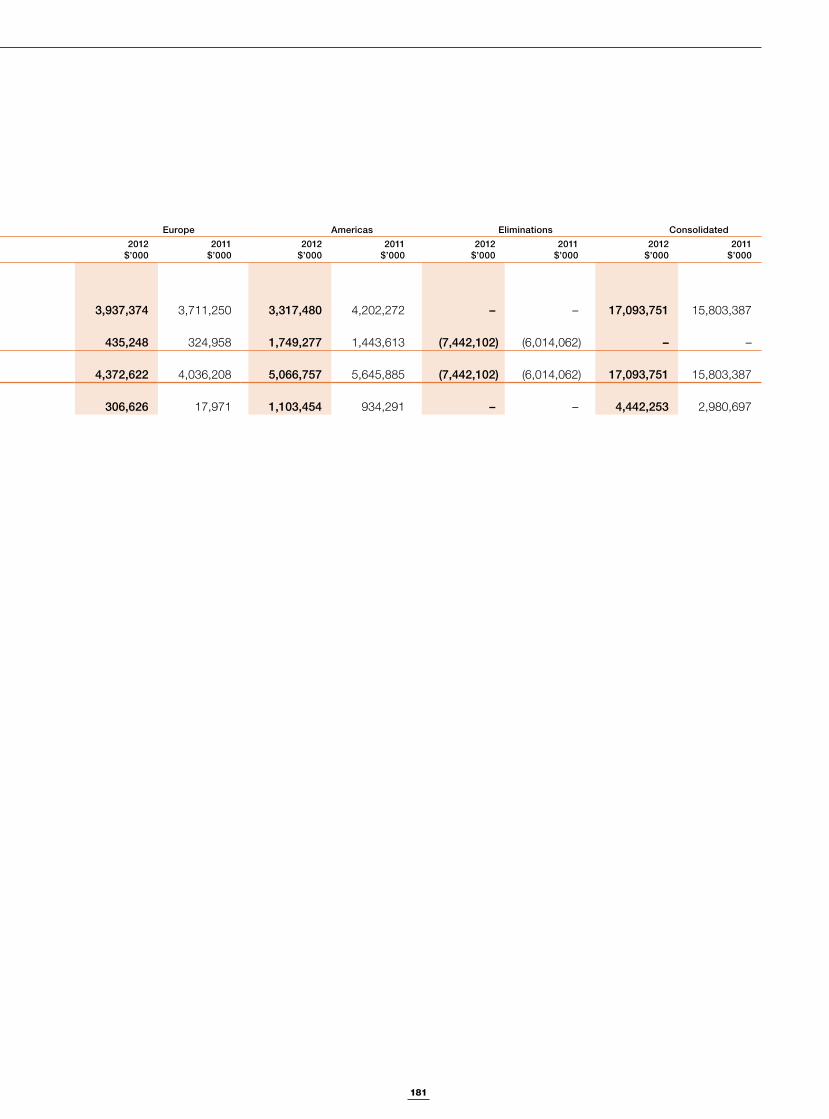
181
Notes to the Financial Statements
37. Segmental information (cont’d)(b) Geographical segments
Asia, Middle Eastand Australia Africa Europe Americas Eliminations Consolidated
2012$’000
2011$’000
2012$’000
2011$’000
2012$’000
2011$’000
2012$’000
2011$’000
2012$’000
2011$’000
2012$’000
2011$’000
Segment revenue:
Sales to external customers 6,612,470 5,192,556 3,226,427 2,697,309 3,937,374 3,711,250 3,317,480 4,202,272 – – 17,093,751 15,803,387
Intersegment sales 3,966,558 1,820,200 1,291,019 2,425,291 435,248 324,958 1,749,277 1,443,613 (7,442,102) (6,014,062) – –
10,579,028 7,012,756 4,517,446 5,122,600 4,372,622 4,036,208 5,066,757 5,645,885 (7,442,102) (6,014,062) 17,093,751 15,803,387
Non-current assets (4) 1,975,454 1,455,847 1,056,719 572,588 306,626 17,971 1,103,454 934,291 – – 4,442,253 2,980,697
(c) Information on major customers
The Group has no major customers accounting for more than 10% of the turnover.
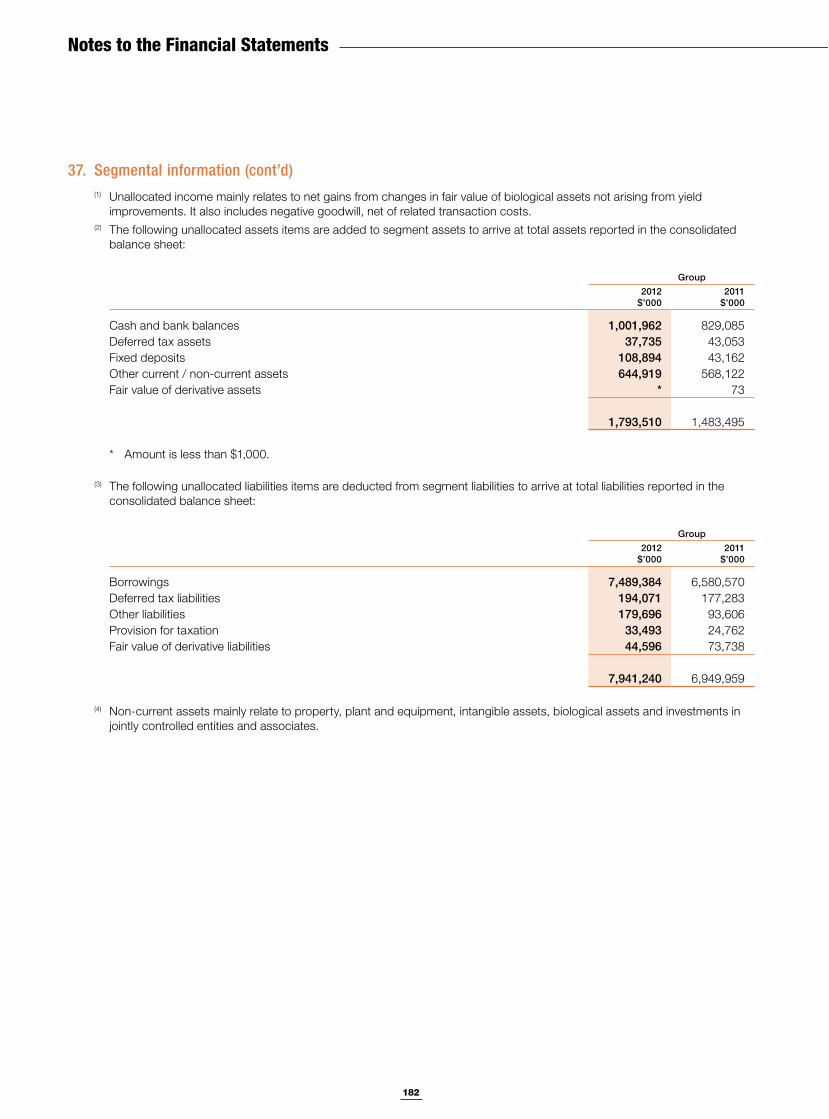
182
Notes to the Financial Statements
37. Segmental information (cont’d)(1) Unallocated income mainly relates to net gains from changes in fair value of biological assets not arising from yield
improvements. It also includes negative goodwill, net of related transaction costs.(2) The following unallocated assets items are added to segment assets to arrive at total assets reported in the consolidated
balance sheet:
Group2012
$’0002011
$’000
Cash and bank balances 1,001,962 829,085Deferred tax assets 37,735 43,053Fixed deposits 108,894 43,162Other current / non-current assets 644,919 568,122Fair value of derivative assets * 73
1,793,510 1,483,495
* Amount is less than $1,000.
(3) The following unallocated liabilities items are deducted from segment liabilities to arrive at total liabilities reported in the consolidated balance sheet:
Group2012
$’0002011
$’000
Borrowings 7,489,384 6,580,570Deferred tax liabilities 194,071 177,283Other liabilities 179,696 93,606Provision for taxation 33,493 24,762Fair value of derivative liabilities 44,596 73,738
7,941,240 6,949,959
(4) Non-current assets mainly relate to property, plant and equipment, intangible assets, biological assets and investments in jointly controlled entities and associates.
183
Notes to the Financial Statements
38. Events occurring after the reporting period(a) On 28 May 2012, the Company announced that it entered into an agreement to invest US$240 million in a sugar milling
asset in Brazil by acquiring Usina Açucareira Passos S.A. (“UAP”) for BRL 255 million (US$128.8 million). As at the date of this report, the acquisition has not been completed.
(b) On 7 June 2012, the Company announced its intention to acquire 100% equity interest in Kayass Enterprises S.A. (“Kayass”) for a price consideration of approximately US$66.5 million (subject to working capital adjustments at completion). Kayass is in the manufacturing and marketing of branded dairy products and beverages in Nigeria. As at the date of this report, the acquisition has been completed.
Disclosures required by the revised FRS 103 have not been made as this acquisition occurred close to the date of this report.
(c) On 6 July 2012, the Company announced that it has established a US$2,000,000,000 Euro Medium Term Note Programme (the “EMTN Programme”).
(i) On 10 July 2012, the Company announced the issuance of a $350 million 5.8% fixed rate notes due 2019 (the “Notes”) under the EMTN Programme. The Notes are expected to mature on 17 July 2019.
(ii) On 4 September 2012, the Company announced the issuance of a $250 million 2.5% fixed rate notes due 2013 (the “Notes”) under the EMTN Programme. The Notes are expected to mature on 6 September 2013.
(iii) On 20 September 2012, the Company announced the issuance of a US$500 million 5.75% fixed rate notes due 2017 (the “Notes”) under the EMTN Programme. The Notes are expected to mature on 20 September 2017.
The net proceeds from the issue of each tranche of Notes will be used by the Group for working capital purposes and general corporate purposes, including financing capital expenditure and potential acquisition opportunities that the Group may pursue in the future as part of its strategic objectives, or such other purposes as may be specified in the relevant pricing supplement.
(d) On 18 September 2012, the Company announced its acquisition of 100% shareholding of Northern Coffee Corporation Ltd for approximately US$6.2 million. A further US$40 million will be committed as capital expenditure and pre-operative expenditure to fully develop 2,000 hectares of Arabica coffee plantation in Zambia over the next five years.
40. Authorisation of financial statementsThe financial statements for the financial year ended 30 June 2012 were authorised for issue in accordance with a resolution of the directors on 28 September 2012.
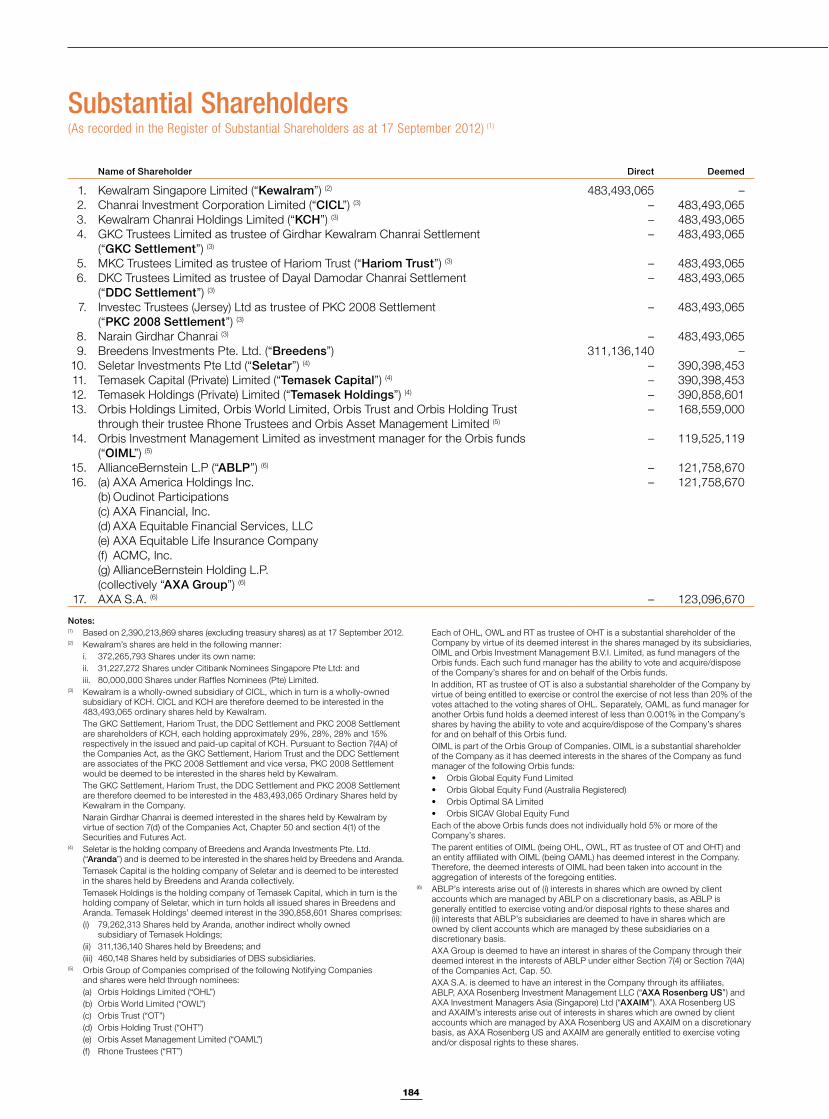
184
Substantial Shareholders(As recorded in the Register of Substantial Shareholders as at 17 September 2012) (1)
Name of Shareholder Direct Deemed
1. Kewalram Singapore Limited (“Kewalram”) (2) 483,493,065 –2. Chanrai Investment Corporation Limited (“CICL”) (3) – 483,493,0653. Kewalram Chanrai Holdings Limited (“KCH”) (3) – 483,493,0654. GKC Trustees Limited as trustee of Girdhar Kewalram Chanrai Settlement
(“GKC Settlement”) (3)– 483,493,065
5. MKC Trustees Limited as trustee of Hariom Trust (“Hariom Trust”) (3) – 483,493,0656. DKC Trustees Limited as trustee of Dayal Damodar Chanrai Settlement
(“DDC Settlement”) (3)– 483,493,065
7. Investec Trustees (Jersey) Ltd as trustee of PKC 2008 Settlement (“PKC 2008 Settlement”) (3)
– 483,493,065
8. Narain Girdhar Chanrai (3) – 483,493,0659. Breedens Investments Pte. Ltd. (“Breedens”) 311,136,140 –
10. Seletar Investments Pte Ltd (“Seletar”) (4) – 390,398,45311. Temasek Capital (Private) Limited (“Temasek Capital”) (4) – 390,398,45312. Temasek Holdings (Private) Limited (“Temasek Holdings”) (4) – 390,858,60113. Orbis Holdings Limited, Orbis World Limited, Orbis Trust and Orbis Holding Trust
through their trustee Rhone Trustees and Orbis Asset Management Limited (5)– 168,559,000
14. Orbis Investment Management Limited as investment manager for the Orbis funds (“OIML”) (5)
– 119,525,119
15. AllianceBernstein L.P (“ABLP”) (6) – 121,758,67016. (a) AXA America Holdings Inc.
(b) Oudinot Participations(c) AXA Financial, Inc.(d) AXA Equitable Financial Services, LLC(e) AXA Equitable Life Insurance Company(f) ACMC, Inc.(g) AllianceBernstein Holding L.P. (collectively “AXA Group”) (6)
– 121,758,670
17. AXA S.A. (6) – 123,096,670
Notes:(1) Based on 2,390,213,869 shares (excluding treasury shares) as at 17 September 2012.(2) Kewalram’s shares are held in the following manner: i. 372,265,793 Shares under its own name: ii. 31,227,272 Shares under Citibank Nominees Singapore Pte Ltd: and iii. 80,000,000 Shares under Raffles Nominees (Pte) Limited.(3) Kewalram is a wholly-owned subsidiary of CICL, which in turn is a wholly-owned
subsidiary of KCH. CICL and KCH are therefore deemed to be interested in the 483,493,065 ordinary shares held by Kewalram.
The GKC Settlement, Hariom Trust, the DDC Settlement and PKC 2008 Settlement are shareholders of KCH, each holding approximately 29%, 28%, 28% and 15% respectively in the issued and paid-up capital of KCH. Pursuant to Section 7(4A) of the Companies Act, as the GKC Settlement, Hariom Trust and the DDC Settlement are associates of the PKC 2008 Settlement and vice versa, PKC 2008 Settlement would be deemed to be interested in the shares held by Kewalram.
The GKC Settlement, Hariom Trust, the DDC Settlement and PKC 2008 Settlement are therefore deemed to be interested in the 483,493,065 Ordinary Shares held by Kewalram in the Company.
Narain Girdhar Chanrai is deemed interested in the shares held by Kewalram by virtue of section 7(d) of the Companies Act, Chapter 50 and section 4(1) of the Securities and Futures Act.
(4) Seletar is the holding company of Breedens and Aranda Investments Pte. Ltd. (“Aranda”) and is deemed to be interested in the shares held by Breedens and Aranda.
Temasek Capital is the holding company of Seletar and is deemed to be interested in the shares held by Breedens and Aranda collectively.
Temasek Holdings is the holding company of Temasek Capital, which in turn is the holding company of Seletar, which in turn holds all issued shares in Breedens and Aranda. Temasek Holdings’ deemed interest in the 390,858,601 Shares comprises:(i) 79,262,313 Shares held by Aranda, another indirect wholly owned
subsidiary of Temasek Holdings;(ii) 311,136,140 Shares held by Breedens; and(iii) 460,148 Shares held by subsidiaries of DBS subsidiaries.
(5) Orbis Group of Companies comprised of the following Notifying Companies and shares were held through nominees:
(a) Orbis Holdings Limited (“OHL”) (b) Orbis World Limited (“OWL”) (c) Orbis Trust (“OT”) (d) Orbis Holding Trust (“OHT”) (e) Orbis Asset Management Limited (“OAML”) (f) Rhone Trustees (“RT”)
Each of OHL, OWL and RT as trustee of OHT is a substantial shareholder of the
Company by virtue of its deemed interest in the shares managed by its subsidiaries, OIML and Orbis Investment Management B.V.I. Limited, as fund managers of the Orbis funds. Each such fund manager has the ability to vote and acquire/dispose of the Company’s shares for and on behalf of the Orbis funds.
In addition, RT as trustee of OT is also a substantial shareholder of the Company by virtue of being entitled to exercise or control the exercise of not less than 20% of the votes attached to the voting shares of OHL. Separately, OAML as fund manager for another Orbis fund holds a deemed interest of less than 0.001% in the Company’s shares by having the ability to vote and acquire/dispose of the Company’s shares for and on behalf of this Orbis fund.
OIML is part of the Orbis Group of Companies. OIML is a substantial shareholder of the Company as it has deemed interests in the shares of the Company as fund manager of the following Orbis funds:
Each of the above Orbis funds does not individually hold 5% or more of the Company’s shares.
The parent entities of OIML (being OHL, OWL, RT as trustee of OT and OHT) and an entity affiliated with OIML (being OAML) has deemed interest in the Company. Therefore, the deemed interests of OIML had been taken into account in the aggregation of interests of the foregoing entities.
(6) ABLP’s interests arise out of (i) interests in shares which are owned by client accounts which are managed by ABLP on a discretionary basis, as ABLP is generally entitled to exercise voting and/or disposal rights to these shares and (ii) interests that ABLP’s subsidiaries are deemed to have in shares which are owned by client accounts which are managed by these subsidiaries on a discretionary basis.
AXA Group is deemed to have an interest in shares of the Company through their deemed interest in the interests of ABLP under either Section 7(4) or Section 7(4A) of the Companies Act, Cap. 50.
AXA S.A. is deemed to have an interest in the Company through its affiliates, ABLP, AXA Rosenberg Investment Management LLC (“AXA Rosenberg US”) and AXA Investment Managers Asia (Singapore) Ltd (“AXAIM”). AXA Rosenberg US and AXAIM’s interests arise out of interests in shares which are owned by client accounts which are managed by AXA Rosenberg US and AXAIM on a discretionary basis, as AXA Rosenberg US and AXAIM are generally entitled to exercise voting and/or disposal rights to these shares.
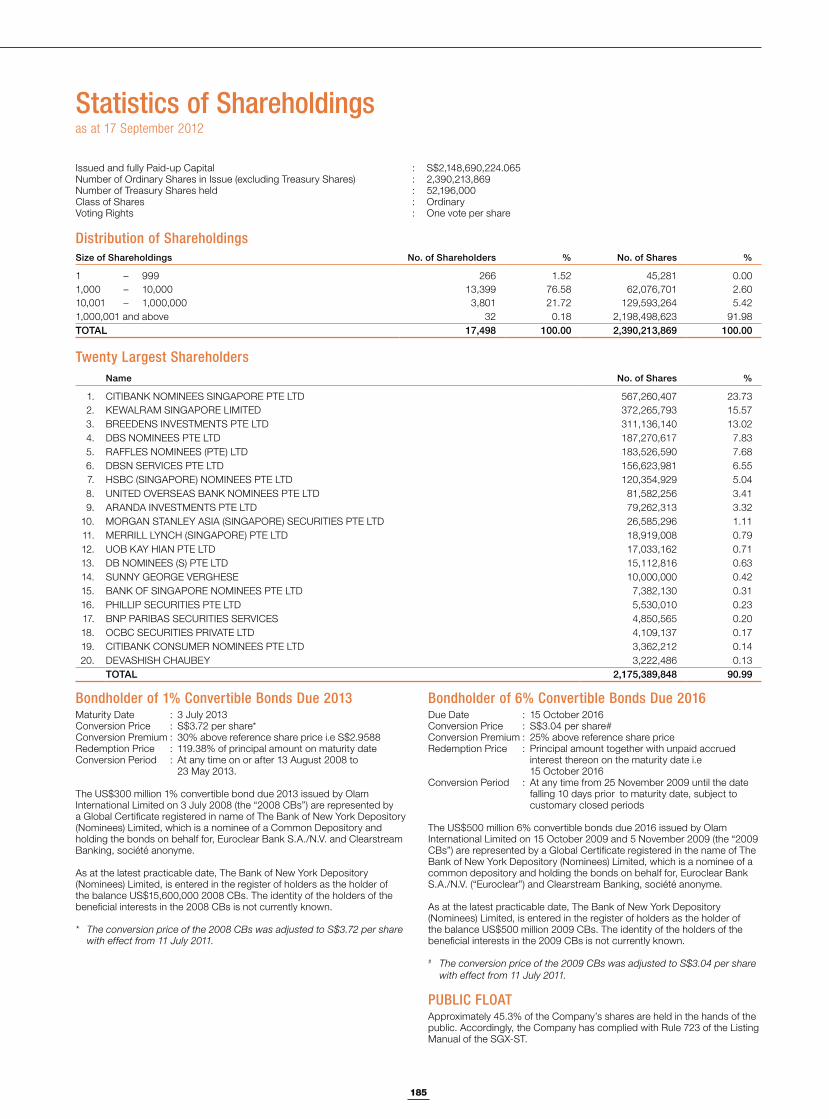
185
Statistics of Shareholdings as at 17 September 2012
Issued and fully Paid-up Capital : S$2,148,690,224.065Number of Ordinary Shares in Issue (excluding Treasury Shares) : 2,390,213,869Number of Treasury Shares held : 52,196,000Class of Shares : Ordinary Voting Rights : One vote per share
Distribution of ShareholdingsSize of Shareholdings No. of Shareholders % No. of Shares %
1 – 999 266 1.52 45,281 0.001,000 – 10,000 13,399 76.58 62,076,701 2.6010,001 – 1,000,000 3,801 21.72 129,593,264 5.421,000,001 and above 32 0.18 2,198,498,623 91.98TOTAL 17,498 100.00 2,390,213,869 100.00
Twenty Largest ShareholdersName No. of Shares %
1. CITIBANK NOMINEES SINGAPORE PTE LTD 567,260,407 23.732. KEWALRAM SINGAPORE LIMITED 372,265,793 15.573. BREEDENS INVESTMENTS PTE LTD 311,136,140 13.024. DBS NOMINEES PTE LTD 187,270,617 7.835. RAFFLES NOMINEES (PTE) LTD 183,526,590 7.686. DBSN SERVICES PTE LTD 156,623,981 6.557. HSBC (SINGAPORE) NOMINEES PTE LTD 120,354,929 5.048. UNITED OVERSEAS BANK NOMINEES PTE LTD 81,582,256 3.419. ARANDA INVESTMENTS PTE LTD 79,262,313 3.32
10. MORGAN STANLEY ASIA (SINGAPORE) SECURITIES PTE LTD 26,585,296 1.1111. MERRILL LYNCH (SINGAPORE) PTE LTD 18,919,008 0.7912. UOB KAY HIAN PTE LTD 17,033,162 0.7113. DB NOMINEES (S) PTE LTD 15,112,816 0.6314. SUNNY GEORGE VERGHESE 10,000,000 0.4215. BANK OF SINGAPORE NOMINEES PTE LTD 7,382,130 0.3116. PHILLIP SECURITIES PTE LTD 5,530,010 0.2317. BNP PARIBAS SECURITIES SERVICES 4,850,565 0.2018. OCBC SECURITIES PRIVATE LTD 4,109,137 0.1719. CITIBANK CONSUMER NOMINEES PTE LTD 3,362,212 0.1420. DEVASHISH CHAUBEY 3,222,486 0.13
TOTAL 2,175,389,848 90.99
Bondholder of 1% Convertible Bonds Due 2013Maturity Date : 3 July 2013Conversion Price : S$3.72 per share*Conversion Premium : 30% above reference share price i.e S$2.9588Redemption Price : 119.38% of principal amount on maturity dateConversion Period : At any time on or after 13 August 2008 to
23 May 2013.
The US$300 million 1% convertible bond due 2013 issued by Olam International Limited on 3 July 2008 (the “2008 CBs”) are represented by a Global Certificate registered in name of The Bank of New York Depository (Nominees) Limited, which is a nominee of a Common Depository and holding the bonds on behalf for, Euroclear Bank S.A./N.V. and Clearstream Banking, société anonyme.
As at the latest practicable date, The Bank of New York Depository (Nominees) Limited, is entered in the register of holders as the holder of the balance US$15,600,000 2008 CBs. The identity of the holders of the beneficial interests in the 2008 CBs is not currently known.
* The conversion price of the 2008 CBs was adjusted to S$3.72 per share with effect from 11 July 2011.
Bondholder of 6% Convertible Bonds Due 2016Due Date : 15 October 2016Conversion Price : S$3.04 per share# Conversion Premium : 25% above reference share price Redemption Price : Principal amount together with unpaid accrued
interest thereon on the maturity date i.e 15 October 2016
Conversion Period : At any time from 25 November 2009 until the date falling 10 days prior to maturity date, subject to customary closed periods
The US$500 million 6% convertible bonds due 2016 issued by Olam International Limited on 15 October 2009 and 5 November 2009 (the “2009 CBs”) are represented by a Global Certificate registered in the name of The Bank of New York Depository (Nominees) Limited, which is a nominee of a common depository and holding the bonds on behalf for, Euroclear Bank S.A./N.V. (“Euroclear”) and Clearstream Banking, société anonyme.
As at the latest practicable date, The Bank of New York Depository (Nominees) Limited, is entered in the register of holders as the holder of the balance US$500 million 2009 CBs. The identity of the holders of the beneficial interests in the 2009 CBs is not currently known.
# The conversion price of the 2009 CBs was adjusted to S$3.04 per share with effect from 11 July 2011.
PUBLIC FLOATApproximately 45.3% of the Company’s shares are held in the hands of the public. Accordingly, the Company has complied with Rule 723 of the Listing Manual of the SGX-ST.
186
NOTICE IS HEREBY GIVEN that the Eighteenth Annual General Meeting of Olam International Limited (“the Company”) will be held at Empress Ballroom 4, Level 2 Carlton Hotel Singapore, 76 Bras Basah Road, Singapore 189558 on 31 October 2012 at 2.00 p.m. for the following purposes:
AS ORDINARY BUSINESS1. To receive and adopt the Directors’ Report and the Audited Accounts of the Company for the year ended 30 June 2012
together with the Auditors’ Report thereon. (Resolution 1)
2. To declare a first and final dividend of 4 cents per share tax exempt (one-tier) for the year ended 30 June 2012. (FY2011: 5 cents) (Resolution 2)
3. To re-elect the following Directors of the Company retiring pursuant to Article 103 of the Articles of Association of the Company: -
Mr. Mark Haynes Daniell (Retiring under Article 103) (Resolution 3)Mr. Tse Po Shing Andy (Retiring under Article 103) (Resolution 4)Mr. Wong Heng Tew (Retiring under Article 103) (Resolution 5)Mr. Sridhar Krishnan (Retiring under Article 103) (Resolution 6)
[See Explanatory Note (i)]
4. To approve the payment of Directors’ fees of S$1,440,000 for the year ending 30 June 2013. (2012: S$1,440,000)
[See Explanatory Note (ii)] (Resolution 7)
5. To re-appoint Messrs Ernst & Young LLP as the Auditors of the Company and to authorise the Directors of the Company to fix their remuneration. (Resolution 8)
6. To transact any other ordinary business which may be properly transacted at an Annual General Meeting.
AS SPECIAL BUSINESSTo consider and if thought fit, to pass the following resolutions as Ordinary Resolutions, with or without any modifications:
7. Authority to issue shares
That pursuant to Section 161 of the Companies Act, Cap. 50 and Rule 806 of the Listing Manual of the Singapore Exchange Securities Trading Limited (“SGX-ST”), the Directors of the Company be authorised and empowered to:
(a) (i) issue shares in the Company (“shares”) whether by way of rights, bonus or otherwise; and/or
(ii) make or grant offers, agreements or options (collectively, “Instruments”) that might or would require shares to be issued, including but not limited to the creation and issue of (as well as adjustments to) options, warrants, debentures or other instruments convertible into shares,
at any time and upon such terms and conditions and for such purposes and to such persons as the Directors of the Company may in their absolute discretion deem fit; and
(b) (notwithstanding the authority conferred by this Resolution may have ceased to be in force) issue shares in pursuance of any Instruments made or granted by the Directors of the Company while this Resolution was in force,
Notice of Annual General MeetingOLAM INTERNATIONAL LIMITED(Company Registration No. 199504676H)(Incorporated in Singapore with limited liability)
187
provided that:
(1) the aggregate number of shares (including shares to be issued in pursuance of the Instruments, made or granted pursuant to this Resolution) to be issued pursuant to this Resolution shall not exceed fifty per centum (50%) of the total number of issued shares (excluding treasury shares) in the capital of the Company (as calculated in accordance with sub-paragraph (2) below), of which the aggregate number of shares to be issued other than on a pro rata basis to shareholders of the Company shall not exceed twenty per centum (20%) of the total number of issued shares (excluding treasury shares) in the capital of the Company (as calculated in accordance with sub-paragraph (2) below);
(2) (subject to such calculation as may be prescribed by the SGX-ST) for the purpose of determining the aggregate number of shares that may be issued under sub-paragraph (1) above, the total number of issued shares (excluding treasury shares) shall be based on the total number of issued shares (excluding treasury shares) in the capital of the Company at the time of the passing of this Resolution, after adjusting for:
(a) new shares arising from the conversion or exercise of any convertible securities;
(b) new shares arising from exercising share options or vesting of share awards which are outstanding or subsisting at the time of the passing of this Resolution; and
(c) any subsequent bonus issue, consolidation or subdivision of shares;
(3) in exercising the authority conferred by this Resolution, the Company shall comply with the provisions of the Listing Manual of the SGX-ST for the time being in force (unless such compliance has been waived by the SGX-ST) and the Articles of Association of the Company; and
(4) unless revoked or varied by the Company in a general meeting, such authority shall continue in force until the conclusion of the next Annual General Meeting of the Company or the date by which the next Annual General Meeting of the Company is required by law to be held, whichever is earlier.
[See Explanatory Note (iii)] (Resolution 9)
8. Authority to issue shares under the Olam Employee Share Option Scheme
That the Directors of the Company be authorised and empowered to offer and grant options under the Olam Employee Share Option Scheme (“the Scheme”) and to issue shares in the Company to all the holders of options granted by the Company under the Scheme, whether granted during the subsistence of this authority or otherwise, upon the exercise of such options and in accordance with the terms and conditions of the Scheme, provided always that the aggregate number of additional ordinary shares to be issued pursuant to the Scheme and any other share schemes which are in place shall not exceed fifteen per centum (15%) of the issued shares (excluding treasury shares) in the capital of the Company from time to time and that such authority shall, unless revoked or varied by the Company in a general meeting, continue in force until the conclusion of the Company’s next Annual General Meeting or the date by which the next Annual General Meeting of the Company is required by law to be held, whichever is earlier.
[See Explanatory Note (iv)] (Resolution 10)
9. Renewal of the Share Buyback Mandate
That:
(1) for the purposes of the Companies Act, Cap. 50 (the “Companies Act”), the exercise by the Directors of the Company of all the powers of the Company to purchase or otherwise acquire ordinary shares in the capital of the Company (the “Shares”) not exceeding in aggregate the Maximum Limit (as defined below), at such price(s) as may be determined by the Directors from time to time up to the Maximum Price (as defined below), whether by way of:
188
9. Renewal of the Share Buyback Mandate (cont’d)
(a) market purchase(s) (each a “Market Purchase”) on Singapore Exchange Securities Trading Limited (the “SGX-ST”); and/or
(b) off-market purchase(s) (each an “Off-Market Purchase”) in accordance with any equal access scheme(s) as may be determined or formulated by the Directors as they consider fit, which scheme(s) shall satisfy all the conditions prescribed by the Companies Act;
and otherwise in accordance with all other laws and regulations, including but not limited to, the provisions of the Companies Act and listing rules of the SGX-ST as may for the time being be applicable, be and is hereby authorised and approved generally and unconditionally (the “Share Buyback Mandate”);
(2) unless varied or revoked by the members of the Company in a general meeting, the authority conferred on the Directors pursuant to this Ordinary Resolution 11 may be exercised by the Directors at any time and from time to time during the period commencing from the date of the passing of this Ordinary Resolution 11 and expiring on the earlier of:
(a) the date on which the next annual general meeting of the Company (“AGM”) is held or required by law to be held; or
(b) the date on which the purchases or acquisitions of Shares by the Company pursuant to the Share Buyback Mandate are carried out to the full extent mandated,
whichever is the earlier; and
(3) in this Ordinary Resolution 11:
“Maximum Limit” means that number of issued Shares representing not more than 10% of the total number of issued Shares (excluding treasury shares) as at the date of the passing of this Ordinary Resolution 11, unless the Company has effected a reduction of the share capital of the Company in accordance with the applicable provisions of the Companies Act, at any time during the Relevant Period (as defined below), in which event the total number of issued Shares shall be taken to be the total number of issued Shares as altered (excluding any treasury shares that may be held by the Company from time to time).
“Relevant Period” means the period commencing from the date of passing of this Ordinary Resolution 11 and expiring on the date the next AGM is held or is required by law to be held, whichever is the earlier; and
“Maximum Price”, in relation to a Share to be purchased or acquired, means the purchase price (excluding brokerage, stamp duties, commission, applicable goods and services tax and other related expenses) which shall not exceed:
(a) in the case of a Market Purchase, 105% of the Average Closing Price; and
(b) in the case of an Off-Market Purchase pursuant to an equal access scheme, 120% of the Average Closing Price,
where:
“Average Closing Price” means the average of the closing market prices of the Shares over the last five Market Days (a “Market Day” being a day on which the SGX-ST is open for trading in securities), on which transactions in the Shares were recorded, before the day on which the purchase or acquisition of Shares was made, or as the case may be, the day of the making of the offer pursuant to the Off-Market Purchase, and deemed to be adjusted for any corporate action that occurs after the relevant five Market Days; and
“day of the making of the offer” means the day on which the Company announces its intention to make an offer for an Off-Market Purchase, stating therein the purchase price (which shall not be more than the Maximum Price for an Off-Market Purchase calculated on the foregoing basis) for each Share and the relevant terms of the equal access scheme for effecting the Off-Market Purchase; and
(4) the Directors of the Company and/or any of them be and are hereby authorised to complete and do all such acts and things (including executing such documents as may be required) as they and/or he may consider necessary, expedient, incidental or in the interests of the Company to give effect to the transactions contemplated and/or authorised by this Ordinary Resolution 11.
[See Explanatory Note (v)] (Resolution 11)
Notice of Annual General Meeting
189
10. Authority to issue shares under the Olam Scrip Dividend Scheme
That pursuant to Section 161 of the Companies Act, Cap. 50, the Directors of the Company be and are hereby authorised to allot and issue such number of ordinary shares in the capital of the Company as may be required to be allotted and issued from time to time pursuant to the Olam Scrip Dividend Scheme.
[See Explanatory Note (vi)] (Resolution 12)
By Order of the Board
Tan San-JuYoo Loo PingCompany SecretariesSingapore
Date: 16 October 2012
Explanatory Notes:
(i) Mr. Mark Haynes Daniell will, upon re-election as a Director of the Company, continue his office as non-executive and independent director and will remain as the Chairman of the Human Resource & Compensation Committee (“HRCC”), a member of the Audit & Compliance Committee (“ACC”), Governance & Nomination Committee (“GNC”) and Corporate Responsibility & Sustainability Committee (“CRSC”). He will be considered independent for the purpose of Rule 704(8) of the Listing Manual of the SGX-ST.
Mr. Tse Po Shing Andy will, upon re-election as a Director of the Company, continue his office as non-executive and independent director and will remain as the Chairman of the Risk Committee (“RC”) and a member of the Capital & Investment Committee. He will be considered independent for the purpose of Rule 704(8) of the Listing Manual of the SGX-ST.
Mr. Wong Heng Tew will, upon re-election as a Director of the Company, continue his office as non-executive and independent director and will remain as a member of the ACC, GNC and HRCC. He will be considered independent for the purpose of Rule 704(8) of the Listing Manual of the SGX-ST.
Mr. Sridhar Krishnan will, upon re-election as a Director of the Company, continue his office as executive director and will remain as a member of the RC and CRSC.
(ii) Ordinary Resolution 7 should be read in conjunction with the proposed compensation for non-executive directors for the year ending 30 June 2013 reported in the Corporate Governance Statement on page 60 of the Annual Report. Ordinary Resolution 7, if passed, will facilitate the payment of Directors’ fees during the financial year ending 30 June 2013 in which the fees are incurred. The amount of the Directors’ fees is computed based on the fees structure as reported in the Corporate Governance statement on page 66 of this Annual Report. The Directors’ fees proposed for payment also includes an additional 20 per centum (20%) to provide for unforeseen circumstances (such as the appointment of additional Director and/or the formation of additional Board Committees).
(iii) Ordinary Resolution 9, if passed, will empower the Directors of the Company, effective until the conclusion of the next Annual General Meeting of the Company, or the date by which the next Annual General Meeting of the Company is required by law to be held or such authority is varied or revoked by the Company in a general meeting, whichever is the earlier, to issue shares, make or grant instruments convertible into shares and to issue shares pursuant to such instruments, up to a number not exceeding, in total, 50% of the total number of issued shares in the capital of the Company, of which up to 20% may be issued other than on a pro-rata basis to shareholders.
For determining the aggregate number of shares that may be issued, the total number of issued shares will be calculated based on the total number of issued shares (excluding treasury shares) in the capital of the Company at the time this Ordinary Resolution is passed after adjusting for new shares arising from the conversion or exercise of any convertible securities or share options or vesting of share awards which are outstanding or subsisting at the time when this Ordinary Resolution is passed and any subsequent bonus issue, consolidation or subdivision of shares.
(iv) Ordinary Resolution 10, if passed, will empower the Directors of the Company, from the date of this Meeting until the next Annual General Meeting, or the date by which the next Annual General Meeting is required by law to be held or when varied or revoked by the Company in a general meeting, whichever is the earlier, to issue shares in the Company of up to a number not exceeding in total fifteen per centum (15%) of the issued shares in the capital of the Company from time to time pursuant to the exercise of the options under the Scheme.
190
(v) Ordinary Resolution 11, if passed, will empower the Directors of the Company from the date of the passing of this Ordinary Resolution until the earlier of the date of the next AGM, or the date by which the next AGM is required by law to be held, to purchase or otherwise acquire, by way of Market Purchases or Off-Market Purchases, up to 10% of the total number of issued Shares (excluding treasury shares) as at the date of the passing of this Ordinary Resolution 11 on the terms of the Share Buyback Mandate as set out in the letter to shareholders dated 16 October 2012 accompanying this Notice of AGM (the “Letter”), unless such authority is earlier revoked or varied by the shareholders of the Company in a general meeting.
The Company may use internal sources of funds or borrowings or a combination of both to finance the Company’s purchase or acquisition of Shares pursuant to the Share Buyback Mandate. The amount of financing required for the Company to purchase or acquire its Shares, and the impact on the Company’s financial position, cannot be ascertained as at the date of this Notice of AGM as these will depend on, inter alia, the aggregate number of Shares purchased, whether the purchase is made out of capital or profits, the purchase prices paid for such Shares, the amount (if any) borrowed by the Company to fund the purchases or acquisitions and whether the Shares purchased or acquired are cancelled or held as treasury shares. For illustrative purposes only, the financial effects of an assumed purchase or acquisition of 192,044,986 Shares, at a purchase price equivalent to the Maximum Price per Share, in the case of a Market Purchase and an Off-Market Purchase respectively, based on the audited financial statements of the Company and its subsidiaries for the financial year ended 30 June 2012 and certain assumptions, are set out in paragraph 2.4.6 of the Letter.
(vi) Ordinary Resolution 12, if passed, will empower the Directors of the Company to issue shares in the Company from time to time pursuant to the Olam Scrip Dividend Scheme to shareholders who, in respect of a qualifying dividend, have elected to receive shares in lieu of the cash amount of that qualifying dividend. Unless varied or revoked by the Company in a general meeting, such authority shall remain effective until the conclusion of the next Annual General Meeting of the Company or the date by which the next Annual General Meeting of the Company is required by law to be held, whichever is the earlier. Please refer to the circular to shareholders of the Company dated 7 October 2009 for the terms and conditions of the Olam Scrip Dividend Scheme.
Notes:
1. A Member entitled to attend and vote at the Annual General Meeting (the “Meeting”) is entitled to appoint a proxy to attend and vote in his/her stead. A proxy need not be a Member of the Company.
2. The instrument appointing a proxy must be deposited at the Registered Office of the Company at 50 Raffles Place, #32-01 Singapore Land Tower, Singapore 048623 not less than 48 hours before the time appointed for holding the Meeting.
Notice of Annual General Meeting
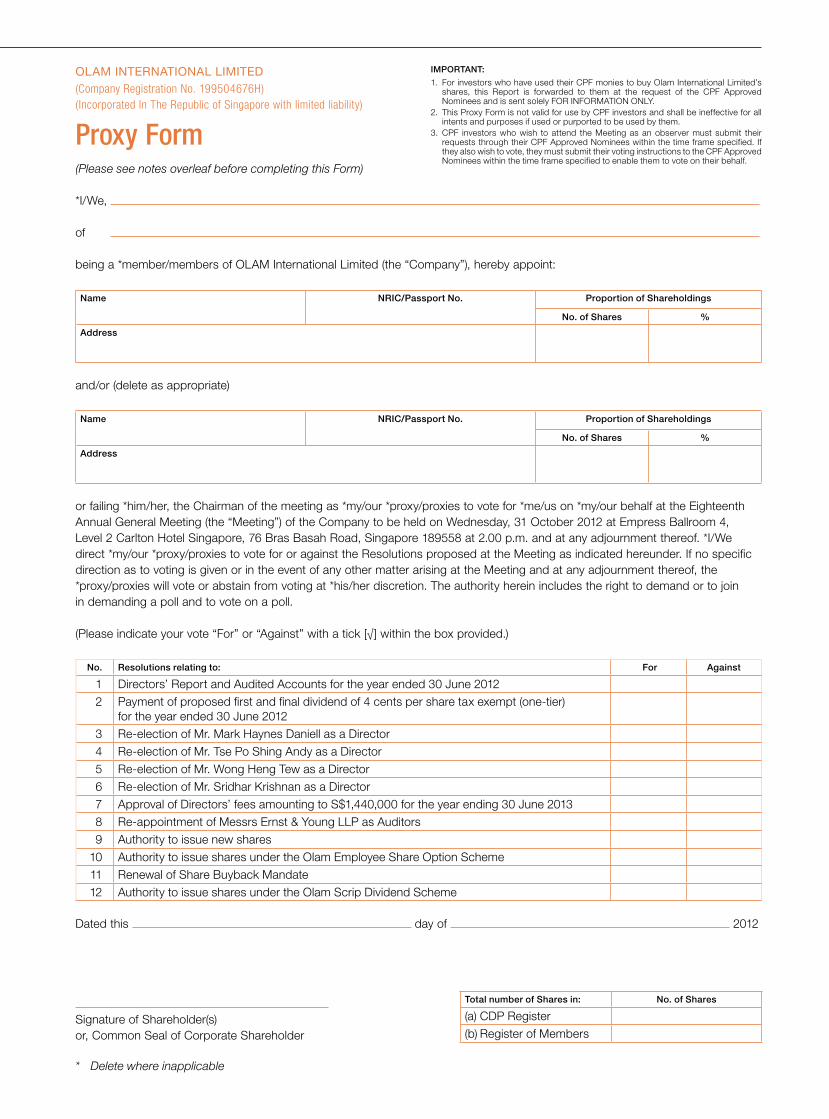
IMPORTANT:1. For investors who have used their CPF monies to buy Olam International Limited’s
shares, this Report is forwarded to them at the request of the CPF Approved Nominees and is sent solely FOR INFORMATION ONLY.
2. This Proxy Form is not valid for use by CPF investors and shall be ineffective for all intents and purposes if used or purported to be used by them.
3. CPF investors who wish to attend the Meeting as an observer must submit their requests through their CPF Approved Nominees within the time frame specified. If they also wish to vote, they must submit their voting instructions to the CPF Approved Nominees within the time frame specified to enable them to vote on their behalf.
OLAM INTERNATIONAL LIMITED(Company Registration No. 199504676H)(Incorporated In The Republic of Singapore with limited liability)
Proxy Form(Please see notes overleaf before completing this Form)
*I/We,
of
being a *member/members of OLAM International Limited (the “Company”), hereby appoint:
Name NRIC/Passport No. Proportion of Shareholdings
No. of Shares %
Address
and/or (delete as appropriate)
Name NRIC/Passport No. Proportion of Shareholdings
No. of Shares %
Address
or failing *him/her, the Chairman of the meeting as *my/our *proxy/proxies to vote for *me/us on *my/our behalf at the Eighteenth Annual General Meeting (the “Meeting”) of the Company to be held on Wednesday, 31 October 2012 at Empress Ballroom 4, Level 2 Carlton Hotel Singapore, 76 Bras Basah Road, Singapore 189558 at 2.00 p.m. and at any adjournment thereof. *I/We direct *my/our *proxy/proxies to vote for or against the Resolutions proposed at the Meeting as indicated hereunder. If no specific direction as to voting is given or in the event of any other matter arising at the Meeting and at any adjournment thereof, the *proxy/proxies will vote or abstain from voting at *his/her discretion. The authority herein includes the right to demand or to join in demanding a poll and to vote on a poll.
(Please indicate your vote “For” or “Against” with a tick ["] within the box provided.)
No. Resolutions relating to: For Against
1 Directors’ Report and Audited Accounts for the year ended 30 June 20122 Payment of proposed first and final dividend of 4 cents per share tax exempt (one-tier)
for the year ended 30 June 20123 Re-election of Mr. Mark Haynes Daniell as a Director4 Re-election of Mr. Tse Po Shing Andy as a Director5 Re-election of Mr. Wong Heng Tew as a Director6 Re-election of Mr. Sridhar Krishnan as a Director7 Approval of Directors’ fees amounting to S$1,440,000 for the year ending 30 June 20138 Re-appointment of Messrs Ernst & Young LLP as Auditors9 Authority to issue new shares
10 Authority to issue shares under the Olam Employee Share Option Scheme11 Renewal of Share Buyback Mandate12 Authority to issue shares under the Olam Scrip Dividend Scheme
Dated this day of 2012
Signature of Shareholder(s)or, Common Seal of Corporate Shareholder
* Delete where inapplicable
Total number of Shares in: No. of Shares
(a) CDP Register(b) Register of Members
Notes:
1. Please insert the total number of Shares held by you. If you have Shares entered against your name in the Depository Register (as defined in Section 130A of the Companies Act, Chapter 50 of Singapore), you should insert that number of Shares. If you have Shares registered in your name in the Register of Members, you should insert that number of Shares. If you have Shares entered against your name in the Depository Register and Shares registered in your name in the Register of Members, you should insert the aggregate number of Shares entered against your name in the Depository Register and registered in your name in the Register of Members. If no number is inserted, the instrument appointing a proxy or proxies shall be deemed to relate to all the Shares held by you.
2. A member of the Company entitled to attend and vote at a meeting of the Company is entitled to appoint one or two proxies to attend and vote instead of him/her. A proxy need not be a member of the Company.
3. Where a member appoints two proxies, the second named proxy shall be an alternate to the first named or at the Company’s option to treat the instrument of proxy as invalid unless he/she specifies the proportion of his/her shareholding (expressed as a percentage of the whole) to be represented by each proxy.
4. The instrument appointing a proxy or proxies must be deposited at the registered office of the Company at 50 Raffles Place, #32-01 Singapore Land Tower, Singapore 048623 not less than 48 hours before the time appointed for the Annual General Meeting.
5. (i) The instrument appointing a proxy or proxies must be under the hand of the appointor or of his attorney duly authorised in writing.
(ii) Where the instrument appointing a proxy or proxies is executed by a corporation, it must be executed either under its seal or under the hand of an officer or attorney duly authorised.
(iii) Where the instrument appointing a proxy is signed on behalf of the appointor by an attorney, the letter or the power of attorney or other authority, if any, or a duly certified true copy thereof shall (failing previous registration with the Company) if required by law, be duly stamped and be deposited at the Registered Office, not less than forty-eight hours before the time for holding the meeting or adjourned meeting at which the person named in the instrument proposes to vote and in default the instrument of proxy shall not be treated as valid.
6. A corporation which is a member may authorise by resolution of its directors or other governing body such person as it thinks fit to act as its representative at the Meeting, in accordance with Section 179 of the Companies Act, Chapter 50 of Singapore.
General:
The Company shall be entitled to reject the instrument appointing a proxy or proxies if it is incomplete, improperly completed or illegible or where the true intentions of the appointor are not ascertainable from the instructions of the appointor specified in the instrument appointing a proxy or proxies. In addition, in the case of Shares entered in the Depository Register, the Company shall reject any instrument appointing a proxy or proxies lodged if the member, being the appointor, is not shown to have Shares entered against his name in the Depository Register as at 48 hours before the time appointed for holding the Meeting, as certified by The Central Depository (Pte) Limited to the Company.

Shaping The Future - CEO and Executive Directors’ Dialogue Pg 14
Midstream - Addressing Global Needs Pg 42
Olam is helping shape the future of agri-commodities by partnering with farmers worldwide to bring new resources into play.
Olam is a custodian of our investors’ resources so we need to show how we are growing these resources responsibly, for profit and for the benefit of all our stakeholders
printer will replace
this cover
CR&S - Supporting Rural Livelihoods Pg 50
Our People - Growing Global Leaders Pg 54

Olam
International Limited
Annual R
eport 2012
Shaping the FutureHow Olam is driving sustainable growth while solving for risk
Seeing the Big Picture Addressing the global supply demand imbalance in the agri-complex
Empowering Our People Leveraging our strengths by developing global leaders
Growing Responsibly Improving small-scale farmer incomes & livelihoods
Olam International Limited9 Temasek Boulevard11-02 Suntec Tower TwoSingapore 038989
Telephone (65) 6339 4100Facsimile (65) 6339 9755www.olamonline.com C074416