strategy report - olam international
TRANSCRIPT
Strategy ReportAnnual Report 2016
ABOUT OLAMEstablished in 1989, Olam traded cashews from Nigeria to
India. Today Olam is a leading agri-business operating from
seed to shelf, supplying food and industrial raw materials
to over 22,900 customers worldwide. Our team of 69,8001
employees across 70 countries has built leadership positions
in several of our 18 platforms, including cocoa, coffee,
cashew, rice and cotton. We source from 4.33 million farmers
and their communities. We are listed on the Singapore
Exchange (SGX) and are among the top 30 companies
by market capitalisation.
OUR PURPOSEGrowing Responsibly describes how we do business.
We ensure profitable growth is achieved in an ethical,
socially responsible and environmentally sustainable manner.
This is integral to our business model.
OUR GOVERNING OBJECTIVETo maximise long-term intrinsic value for our
continuing shareholders.
OUR VISIONTo be the most differentiated and valuable global
agri-business by 2040.
Cover imageHarvesting wheat for our dairy herd, Russia.
These are available to download at olamgroup.com/investor-relations along with additional information or can be requested in print from [email protected].
Contents
1 Group CEO perspective
8 Highlights
14 Business model
16 Economic
38 Social
64 Environment
86 General information
About this reportThis Annual Report has 3 chapters. These can be read independently; however, for the purpose of compliance they are intended to be viewed as a single document.
Strategy Report
This chapter offers narrative about
our performance, strategy and
market factors. Information has
been grouped into 3 sections,
i) economic, ii) social and
iii) environment.
It can be read independently
as an Executive Summary
or as part of the full report.
Governance Report
Governance ReportAnnual Report 2016
Financial Report
Financial ReportAnnual Report 2016
Strategy ReportAnnual Report 2016
1 Employees includes full-time, seasonal, contract and temporary workers.
Introduction
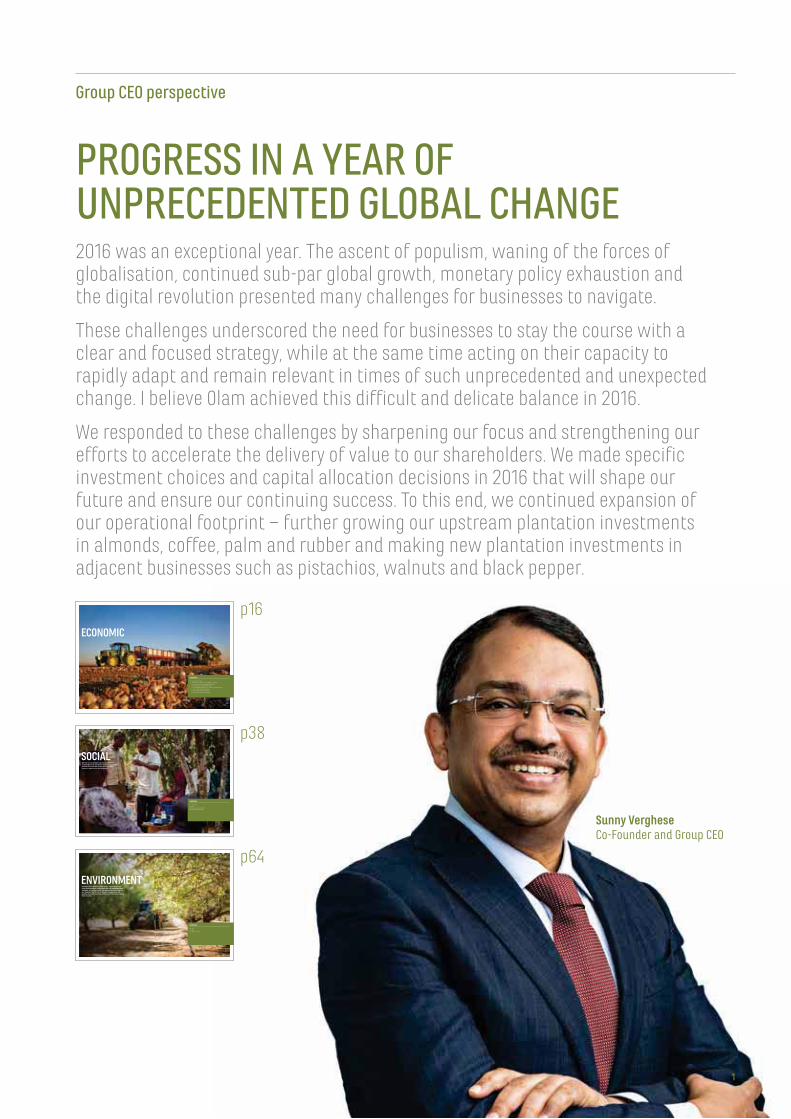
PROGRESS IN A YEAR OF UNPRECEDENTED GLOBAL CHANGE2016 was an exceptional year. The ascent of populism, waning of the forces of globalisation, continued sub-par global growth, monetary policy exhaustion and the digital revolution presented many challenges for businesses to navigate.
These challenges underscored the need for businesses to stay the course with a clear and focused strategy, while at the same time acting on their capacity to rapidly adapt and remain relevant in times of such unprecedented and unexpected change. I believe Olam achieved this difficult and delicate balance in 2016.
We responded to these challenges by sharpening our focus and strengthening our efforts to accelerate the delivery of value to our shareholders. We made specific investment choices and capital allocation decisions in 2016 that will shape our future and ensure our continuing success. To this end, we continued expansion of our operational footprint – further growing our upstream plantation investments in almonds, coffee, palm and rubber and making new plantation investments in adjacent businesses such as pistachios, walnuts and black pepper.
SOCIAL
CONTENTS:
42 Livelihoods
48 Labour
56 Food security and nutrition
60 Food safety and quality
We rely on our people to grow our business responsibly. Our operations impact communities around the world. We strive to ensure that impact is positive for the long-term.
ENVIRONMENTPerhaps more than any other sector, agriculture faces huge environmental challenges that are interlocked and complex. At a global scale, our operations and those of our suppliers are at risk of climate change, poor soil quality, and water scarcity, which in turn impact on global food security.
CONTENTS:
68 Land
74 Water
80 Climate change
CONTENTS:
18 Group COO’s review
24 Edible Nuts, Spices and Vegetable Ingredients
26 Confectionery and Beverage Ingredients
28 Food Staples and Packaged Foods
30 Industrial Raw Materials, Ag Logistics and Infrastructure
31 Commodity Financial Services
32 Value chain review and analysis
36 Principal risks and uncertainties
ECONOMIC
p16
p38
p64
Sunny VergheseCo-Founder and Group CEO
olamgroup.com 1
Group CEO perspective
We made a significant commitment
to enter the animal feeds business in
Africa. We successfully integrated
transformational and strategic
acquisitions such as the erstwhile
ADM Cocoa business, McCleskey Mills,
Brooks Peanut Company and the
wheat milling and pasta assets from
the BUA Group during the course of
the year. With this, we demonstrated
our ability to manage our business
in-line with our strategy and with these
wider global trends and challenges
shaping the world we all live in.
In many ways, this year’s Annual
Report is an extension of these trends,
representative of the need to provide
consistent transparency, while
engaging with and delivering
information and insight to an
ever-broadening and important
community of stakeholders.
This year our Annual Report narrative
combines all 3 aspects of our
economic performance, our people
and social impact, as well as our
environmental stewardship into 1
‘book’, providing insight into elements
of our business important to our
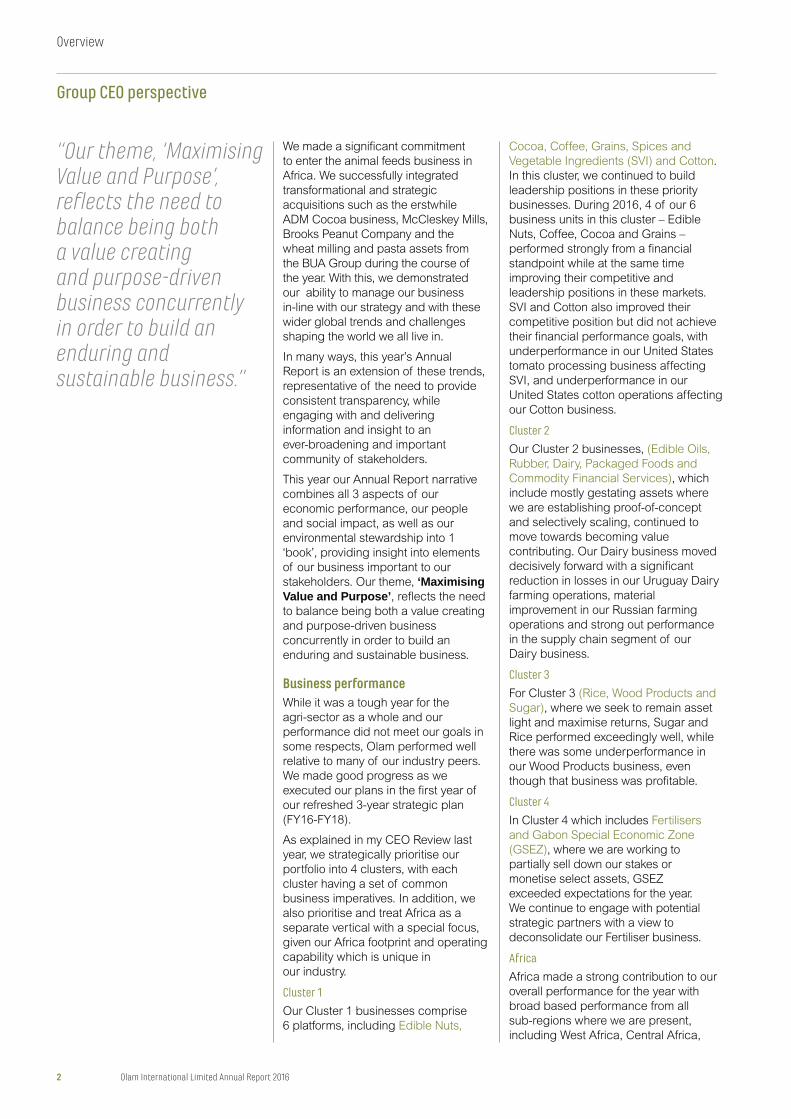
stakeholders. Our theme, ‘Maximising Value and Purpose’, reflects the need
to balance being both a value creating
and purpose-driven business
concurrently in order to build an
enduring and sustainable business.
Business performanceWhile it was a tough year for the
agri-sector as a whole and our
performance did not meet our goals in
some respects, Olam performed well
relative to many of our industry peers.
We made good progress as we
executed our plans in the first year of
our refreshed 3-year strategic plan
(FY16-FY18).
As explained in my CEO Review last
year, we strategically prioritise our
portfolio into 4 clusters, with each
cluster having a set of common
business imperatives. In addition, we
also prioritise and treat Africa as a
separate vertical with a special focus,
given our Africa footprint and operating
capability which is unique in
our industry.
Cluster 1
Our Cluster 1 businesses comprise
6 platforms, including Edible Nuts,
Cocoa, Coffee, Grains, Spices and
Vegetable Ingredients (SVI) and Cotton.
In this cluster, we continued to build
leadership positions in these priority
businesses. During 2016, 4 of our 6
business units in this cluster – Edible
Nuts, Coffee, Cocoa and Grains –
performed strongly from a financial
standpoint while at the same time
improving their competitive and
leadership positions in these markets.
SVI and Cotton also improved their
competitive position but did not achieve
their financial performance goals, with
underperformance in our United States
tomato processing business affecting
SVI, and underperformance in our
United States cotton operations affecting
our Cotton business.
Cluster 2
Our Cluster 2 businesses, (Edible Oils,
Rubber, Dairy, Packaged Foods and
Commodity Financial Services), which
include mostly gestating assets where
we are establishing proof-of-concept
and selectively scaling, continued to
move towards becoming value
contributing. Our Dairy business moved
decisively forward with a significant
reduction in losses in our Uruguay Dairy
farming operations, material
improvement in our Russian farming
operations and strong out performance
in the supply chain segment of our
Dairy business.
Cluster 3
For Cluster 3 (Rice, Wood Products and
Sugar), where we seek to remain asset
light and maximise returns, Sugar and
Rice performed exceedingly well, while
there was some underperformance in
our Wood Products business, even
though that business was profitable.
Cluster 4
In Cluster 4 which includes Fertilisers
and Gabon Special Economic Zone
(GSEZ), where we are working to
partially sell down our stakes or
monetise select assets, GSEZ
exceeded expectations for the year.
We continue to engage with potential
strategic partners with a view to
deconsolidate our Fertiliser business.
Africa
Africa made a strong contribution to our
overall performance for the year with
broad based performance from all
sub-regions where we are present,
including West Africa, Central Africa,
“Our theme, ‘Maximising Value and Purpose’, reflects the need to balance being both a value creating and purpose-driven business concurrently in order to build an enduring and sustainable business.”
2 Olam International Limited Annual Report 2016
Overview
Group CEO perspective
South and East Africa, as well as
Middle East and North Africa. Cocoa,
Coffee, Cotton, Edible Nuts and Grains
businesses in Africa all performed
better than plan in posting these record
results from the region. This vindicates
the special emphasis that we have
placed on Africa and reflects our
‘winability’ there.
A detailed performance review and analysis can be found on pages 18-35.
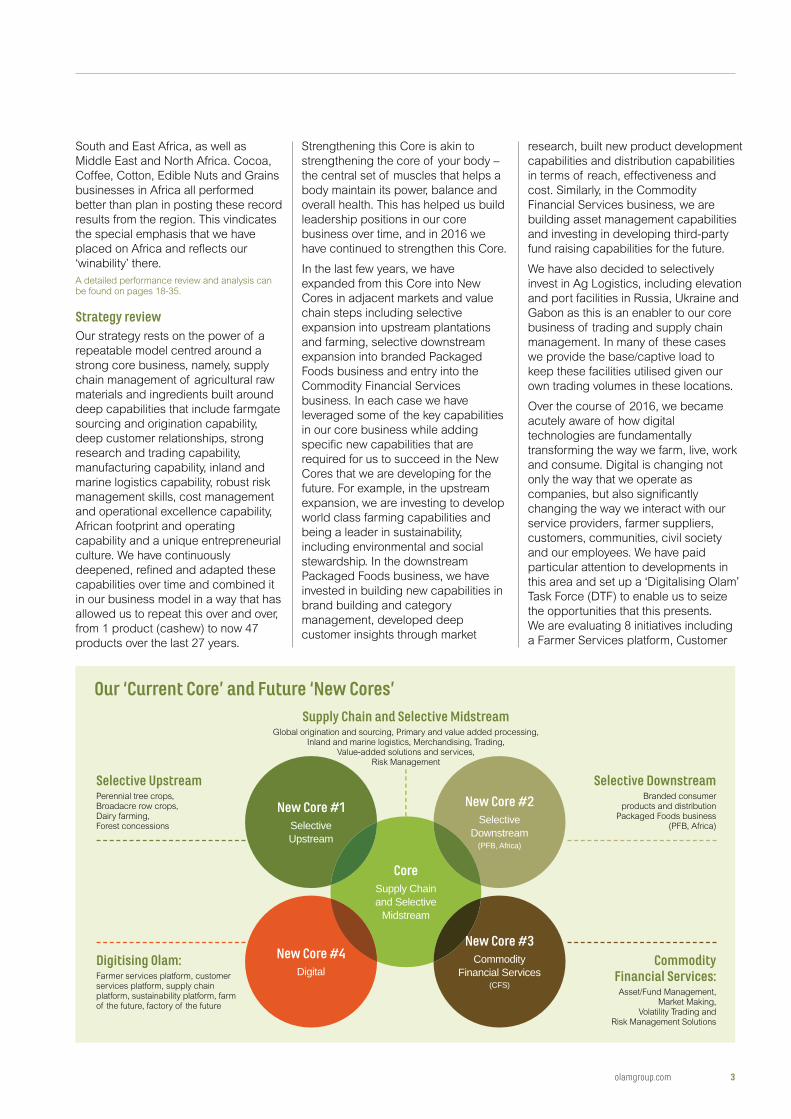
Strategy reviewOur strategy rests on the power of a
repeatable model centred around a
strong core business, namely, supply
chain management of agricultural raw
materials and ingredients built around
deep capabilities that include farmgate
sourcing and origination capability,
deep customer relationships, strong
research and trading capability,
manufacturing capability, inland and
marine logistics capability, robust risk
management skills, cost management
and operational excellence capability,
African footprint and operating
capability and a unique entrepreneurial
culture. We have continuously
deepened, refined and adapted these
capabilities over time and combined it
in our business model in a way that has
allowed us to repeat this over and over,
from 1 product (cashew) to now 47
products over the last 27 years.
Strengthening this Core is akin to
strengthening the core of your body –
the central set of muscles that helps a
body maintain its power, balance and
overall health. This has helped us build
leadership positions in our core
business over time, and in 2016 we
have continued to strengthen this Core.
In the last few years, we have
expanded from this Core into New
Cores in adjacent markets and value
chain steps including selective
expansion into upstream plantations
and farming, selective downstream
expansion into branded Packaged
Foods business and entry into the
Commodity Financial Services
business. In each case we have
leveraged some of the key capabilities
in our core business while adding
specific new capabilities that are
required for us to succeed in the New
Cores that we are developing for the
future. For example, in the upstream
expansion, we are investing to develop
world class farming capabilities and
being a leader in sustainability,
including environmental and social
stewardship. In the downstream
Packaged Foods business, we have
invested in building new capabilities in
brand building and category
management, developed deep
customer insights through market
research, built new product development
capabilities and distribution capabilities
in terms of reach, effectiveness and
cost. Similarly, in the Commodity
Financial Services business, we are
building asset management capabilities
and investing in developing third-party
fund raising capabilities for the future.
We have also decided to selectively
invest in Ag Logistics, including elevation
and port facilities in Russia, Ukraine and
Gabon as this is an enabler to our core
business of trading and supply chain
management. In many of these cases
we provide the base/captive load to
keep these facilities utilised given our
own trading volumes in these locations.
Over the course of 2016, we became
acutely aware of how digital
technologies are fundamentally
transforming the way we farm, live, work
and consume. Digital is changing not
only the way that we operate as
companies, but also significantly
changing the way we interact with our
service providers, farmer suppliers,
customers, communities, civil society
and our employees. We have paid
particular attention to developments in
this area and set up a ‘Digitalising Olam’
Task Force (DTF) to enable us to seize
the opportunities that this presents.
We are evaluating 8 initiatives including
a Farmer Services platform, Customer
Our ‘Current Core’ and Future ‘New Cores’
Selective UpstreamPerennial tree crops, Broadacre row crops, Dairy farming, Forest concessions
Supply Chain and Selective MidstreamGlobal origination and sourcing, Primary and value added processing,
Inland and marine logistics, Merchandising, Trading, Value-added solutions and services,
Risk Management
Digitising Olam:Farmer services platform, customer services platform, supply chain platform, sustainability platform, farm of the future, factory of the future
Selective DownstreamBranded consumer
products and distribution Packaged Foods business
(PFB, Africa)
Commodity Financial Services:Asset/Fund Management,
Market Making, Volatility Trading and
Risk Management Solutions
New Core #1Selective Upstream
New Core #2Selective
Downstream(PFB, Africa)
CoreSupply Chain and Selective
Midstream
New Core #4Digital
New Core #3Commodity
Financial Services(CFS)
olamgroup.com 3
Services platform, Supply Chain of the
Future, Farm of the Future, Factory of
the Future, Trading of the Future,
Sustainability platform and Farm
Management Services. Five prototypes
are under development and we are
excited with the opportunities that
these initiatives represent in
transforming our business and
potentially disrupting our industry.
Through these initiatives, we want to
create a ‘digital first’ culture in Olam.
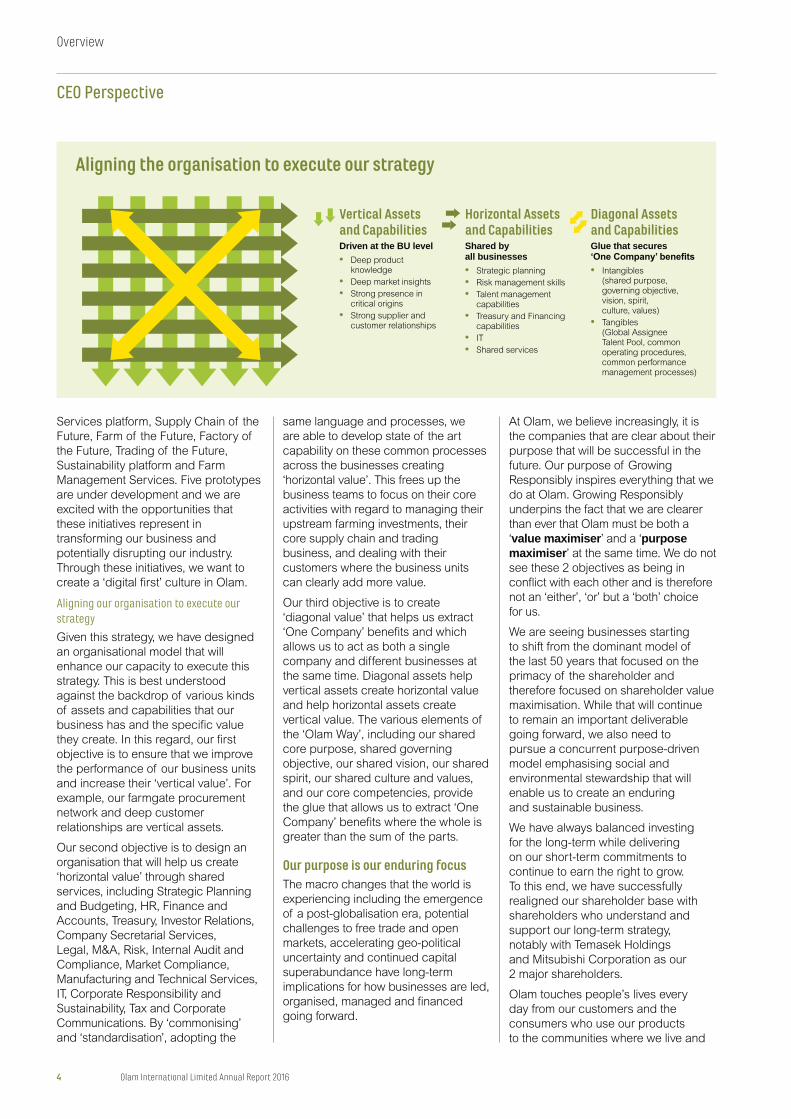
Aligning our organisation to execute our strategy
Given this strategy, we have designed
an organisational model that will
enhance our capacity to execute this
strategy. This is best understood
against the backdrop of various kinds
of assets and capabilities that our
business has and the specific value
they create. In this regard, our first
objective is to ensure that we improve
the performance of our business units
and increase their ‘vertical value’. For
example, our farmgate procurement
network and deep customer
relationships are vertical assets.
Our second objective is to design an
organisation that will help us create
‘horizontal value’ through shared
services, including Strategic Planning
and Budgeting, HR, Finance and
Accounts, Treasury, Investor Relations,
Company Secretarial Services,
Legal, M&A, Risk, Internal Audit and
Compliance, Market Compliance,
Manufacturing and Technical Services,
IT, Corporate Responsibility and
Sustainability, Tax and Corporate
Communications. By ‘commonising’
and ‘standardisation’, adopting the
same language and processes, we
are able to develop state of the art
capability on these common processes
across the businesses creating
‘horizontal value’. This frees up the
business teams to focus on their core
activities with regard to managing their
upstream farming investments, their
core supply chain and trading
business, and dealing with their
customers where the business units
can clearly add more value.
Our third objective is to create
‘diagonal value’ that helps us extract
‘One Company’ benefits and which
allows us to act as both a single
company and different businesses at
the same time. Diagonal assets help
vertical assets create horizontal value
and help horizontal assets create
vertical value. The various elements of
the ‘Olam Way’, including our shared
core purpose, shared governing
objective, our shared vision, our shared
spirit, our shared culture and values,
and our core competencies, provide
the glue that allows us to extract ‘One
Company’ benefits where the whole is
greater than the sum of the parts.
Our purpose is our enduring focusThe macro changes that the world is
experiencing including the emergence
of a post-globalisation era, potential
challenges to free trade and open
markets, accelerating geo-political
uncertainty and continued capital
superabundance have long-term
implications for how businesses are led,
organised, managed and financed
going forward.
At Olam, we believe increasingly, it is
the companies that are clear about their
purpose that will be successful in the
future. Our purpose of Growing
Responsibly inspires everything that we
do at Olam. Growing Responsibly
underpins the fact that we are clearer
than ever that Olam must be both a
‘value maximiser’ and a ‘purpose maximiser’ at the same time. We do not
see these 2 objectives as being in
conflict with each other and is therefore
not an ‘either’, ‘or’ but a ‘both’ choice
for us.
We are seeing businesses starting
to shift from the dominant model of
the last 50 years that focused on the
primacy of the shareholder and
therefore focused on shareholder value
maximisation. While that will continue
to remain an important deliverable
going forward, we also need to
pursue a concurrent purpose-driven
model emphasising social and
environmental stewardship that will
enable us to create an enduring
and sustainable business.
We have always balanced investing
for the long-term while delivering
on our short-term commitments to
continue to earn the right to grow.
To this end, we have successfully
realigned our shareholder base with
shareholders who understand and
support our long-term strategy,
notably with Temasek Holdings
and Mitsubishi Corporation as our
2 major shareholders.
Olam touches people’s lives every
day from our customers and the
consumers who use our products
to the communities where we live and
Aligning the organisation to execute our strategy
Vertical Assets and CapabilitiesDriven at the BU level• Deep product
knowledge
• Deep market insights
• Strong presence in critical origins
• Strong supplier and customer relationships
Horizontal Assets and CapabilitiesShared by all businesses• Strategic planning
• Risk management skills
• Talent management capabilities
• Treasury and Financing capabilities
• IT
• Shared services
Diagonal Assets and CapabilitiesGlue that secures
• Intangibles (shared purpose, governing objective, vision, spirit, culture, values)
• Tangibles (Global Assignee Talent Pool, common operating procedures, common performance management processes)
4 Olam International Limited Annual Report 2016
Overview
CEO Perspective
work, and the interface with the natural
environment as we produce or source
our various agricultural commodities.
For example, we believe that 1 in 3
chocolate bars that people consume
are made from cocoa beans handled
by Olam, the amount of peanuts
sourced and processed by Olam could
serve 7.6 billion peanut butter
sandwiches, we harvest and process
enough tomatoes to top 3.2 billion
pizzas annually, and the quantity of rice
supplied by Olam could feed each
person in the world with 3 servings.
Our carbon footprint, water footprint
and waste footprint in providing these
goods and services is something that
we are concerned about and we are
focused on improving their efficiency. In
this regard, our sustainability strategy
is fully aligned with the United Nations
Sustainable Development Goals
(SDGs) which set out a vision for
ending poverty, hunger, inequality and
protecting the earth’s natural
resources. These SDGs provide us with
a framework and guide our actions so
that we can participate in creating a
better world that we all aspire to.
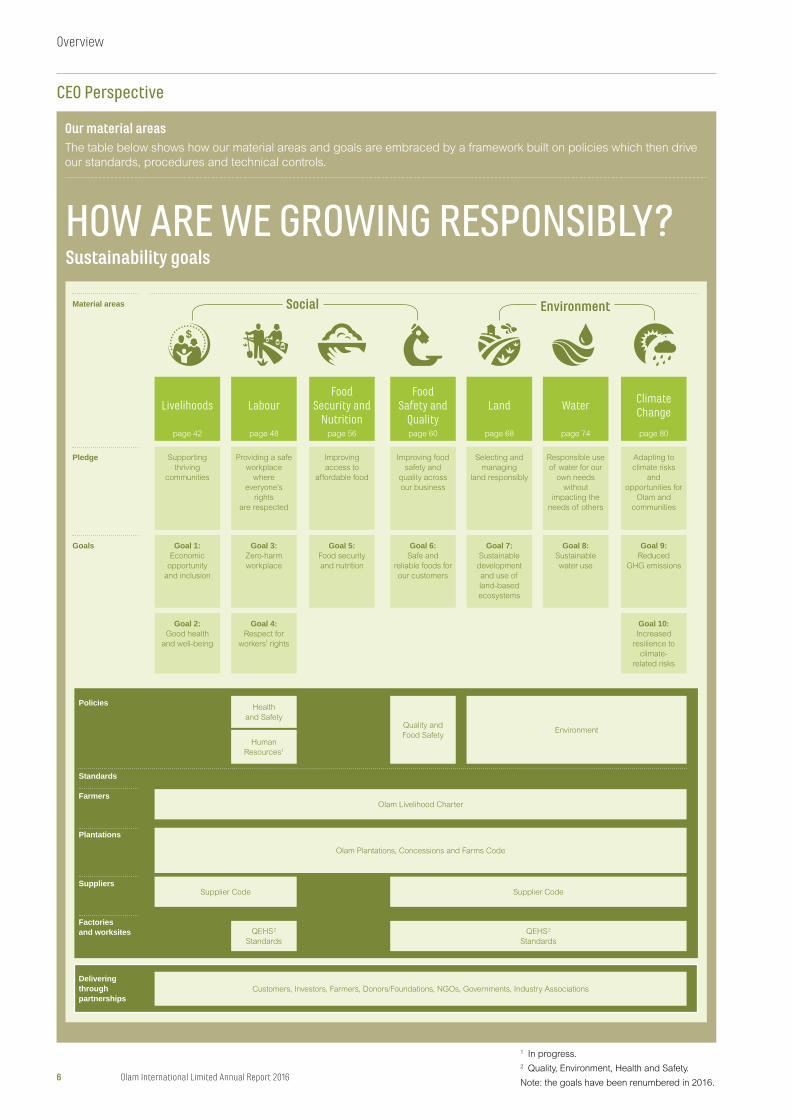
Focusing on issues that matter most
With this in mind, in 2016 we continued
to drive our approach to sustainability
by focusing on 7 material areas:
Livelihoods, Land, Water, Climate
Change, Labour, Food Security and
Food Safety (see page 6 for how these
relate to our goals and policies). These
are fundamental to our vision of
achieving end-to-end sustainable
supply chains by 2020, for which we
have laid out clear, time bound goals.
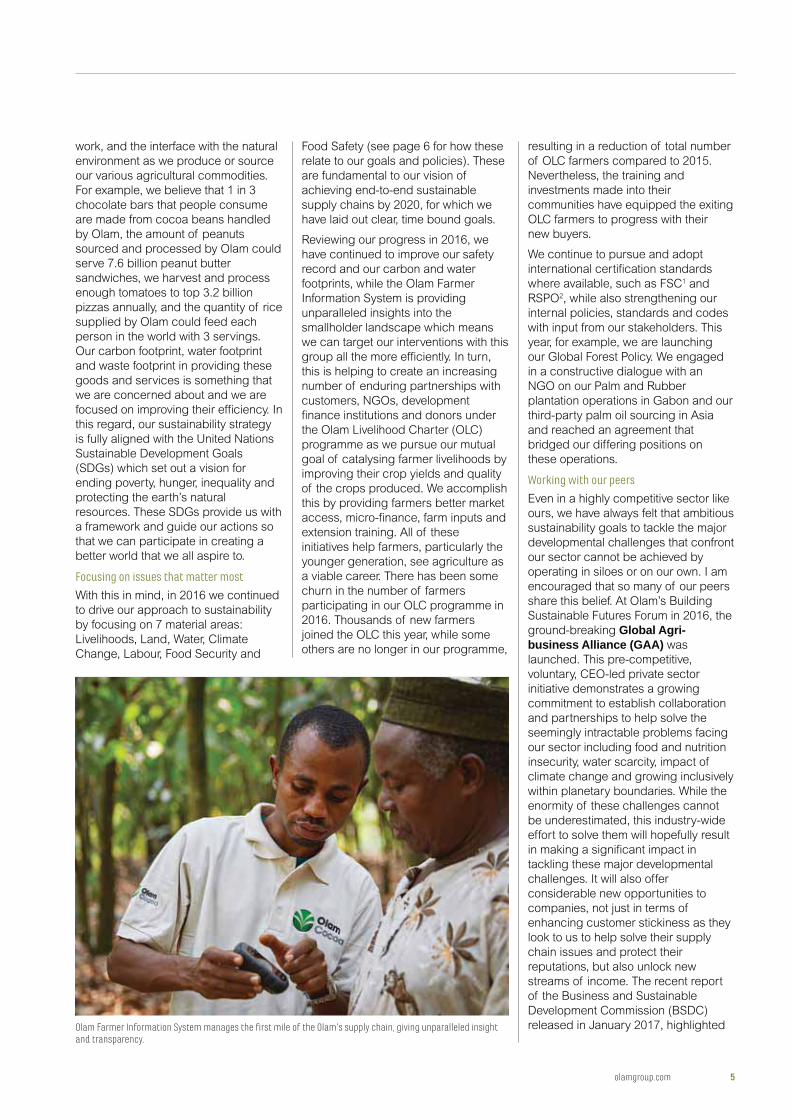
Reviewing our progress in 2016, we
have continued to improve our safety
record and our carbon and water
footprints, while the Olam Farmer
Information System is providing
unparalleled insights into the
smallholder landscape which means
we can target our interventions with this
group all the more efficiently. In turn,
this is helping to create an increasing
number of enduring partnerships with
customers, NGOs, development
finance institutions and donors under
the Olam Livelihood Charter (OLC)
programme as we pursue our mutual
goal of catalysing farmer livelihoods by
improving their crop yields and quality
of the crops produced. We accomplish
this by providing farmers better market
access, micro-finance, farm inputs and
extension training. All of these
initiatives help farmers, particularly the
younger generation, see agriculture as
a viable career. There has been some
churn in the number of farmers
participating in our OLC programme in
2016. Thousands of new farmers
joined the OLC this year, while some
others are no longer in our programme,
resulting in a reduction of total number
of OLC farmers compared to 2015.
Nevertheless, the training and
investments made into their
communities have equipped the exiting
OLC farmers to progress with their
new buyers.
We continue to pursue and adopt
international certification standards
where available, such as FSC1 and
RSPO2, while also strengthening our
internal policies, standards and codes
with input from our stakeholders. This
year, for example, we are launching
our Global Forest Policy. We engaged
in a constructive dialogue with an
NGO on our Palm and Rubber
plantation operations in Gabon and our
third-party palm oil sourcing in Asia
and reached an agreement that
bridged our differing positions on
these operations.
Working with our peers
Even in a highly competitive sector like
ours, we have always felt that ambitious
sustainability goals to tackle the major
developmental challenges that confront
our sector cannot be achieved by
operating in siloes or on our own. I am
encouraged that so many of our peers
share this belief. At Olam’s Building
Sustainable Futures Forum in 2016, the
ground-breaking Global Agri-business Alliance (GAA) was
launched. This pre-competitive,
voluntary, CEO-led private sector
initiative demonstrates a growing
commitment to establish collaboration
and partnerships to help solve the
seemingly intractable problems facing
our sector including food and nutrition
insecurity, water scarcity, impact of
climate change and growing inclusively
within planetary boundaries. While the
enormity of these challenges cannot
be underestimated, this industry-wide
effort to solve them will hopefully result
in making a significant impact in
tackling these major developmental
challenges. It will also offer
considerable new opportunities to
companies, not just in terms of
enhancing customer stickiness as they
look to us to help solve their supply
chain issues and protect their
reputations, but also unlock new
streams of income. The recent report
of the Business and Sustainable
Development Commission (BSDC)
released in January 2017, highlighted Olam Farmer Information System manages the first mile of the Olam’s supply chain, giving unparalleled insight and transparency.
olamgroup.com 5
Customers, Investors, Farmers, Donors/Foundations, NGOs, Governments, Industry Associations
Policies
Farmers
Plantations
Suppliers
Factories and worksites
Deliveringthroughpartnerships
Material areas
Standards
Sustainability goals
1 In progress.
2 Quality, Environment, Health and Safety.
Note: the goals have been renumbered in 2016.
Goals
Pledge
Climate Change
page 80
Goal 10: Increased
resilience to
climate-
related risks
Goal 9: Reduced
GHG emissions
Adapting to
climate risks
and
opportunities for
Olam and
communities
Quality and
Food Safety
Supplier Code
QEHS 2
Standards
Food Safety and
Qualitypage 60
Goal 6: Safe and
reliable foods for
our customers
Improving food
safety and
quality across
our business
Goal 5: Food security
and nutrition
Improving
access to
affordable food
QEHS 2
Standards
Health
and Safety
Human
Resources1
Food Security and
Nutritionpage 56
Labour
page 48
Goal 4: Respect for
workers’ rights
Goal 3: Zero-harm
workplace
Providing a safe
workplace
where
everyone’s
rights
are respected
Land
page 68
Goal 7: Sustainable
development
and use of
land-based
ecosystems
Selecting and
managing
land responsibly
Olam Livelihood Charter
Olam Plantations, Concessions and Farms Code
Supplier Code
Livelihoods
page 42
Goal 2: Good health
and well-being
Goal 1: Economic
opportunity
and inclusion
Supporting
thriving
communities
Water
page 74
Goal 8: Sustainable
water use
Responsible use
of water for our
own needs
without
impacting the
needs of others
Our material areasThe table below shows how our material areas and goals are embraced by a framework built on policies which then drive
our standards, procedures and technical controls.
HOW ARE WE GROWING RESPONSIBLY?
EnvironmentSocial
Environment
6 Olam International Limited Annual Report 2016
Overview
CEO Perspective
Sunny VergheseCo-Founder and Group CEO
that addressing these sustainability
challenges could potentially generate
significant economic opportunities for
enlightened businesses, possibly
adding as much as US$12 trillion to the
global economy.
People are our differentiatorThe year in review demonstrated again
that we have an extraordinary and
dedicated team at Olam, across the
breadth and depth of our businesses
around the world. Retaining and
attracting the best talent remains a
priority. Our talent development
programme and the introduction of our
Aspire performance management
system – saw us take the bold step of
removing employee ratings entirely to
focus on the appraisee’s development
by ensuring a rewarding and engaging
workplace – are helping us to build
essential skills across our teams. We
are focusing on managers having
‘continuing conversations’ that are
‘future focused’ with their team
members for developing their
capabilities and creating the basis for
their retention and long-term
career planning.
In 2016, we further strengthened the
functions that create the horizontal
value that help unify each of our
vertical businesses. The ‘Olam Way’,
our culture, values and purpose also
create ‘diagonal assets’ that bind these
vertical and horizontal assets together. I
firmly believe we are now at a point
where we can proudly say that we have
built a unique organisation that not only
supports but also enhances our
delivery of our business and
sustainability objectives.
The year aheadIn 2017 we will be entering the second
year of our 3-year strategic plan.
We continue to see significant
opportunities for profitable growth
in the agri-sector despite ongoing
volatility. The major themes and
priorities for our business will not
change significantly in the coming year.
We will continue to invest in building
leadership positions in our 6 prioritised
platforms in Cluster 1, establish
proof-of-concept and selectively scale
our Cluster 2 businesses, remain asset
light and maximise returns in our
Cluster 3 businesses and partially sell
“Addressing these sustainability challenges could potentially generate significant economic opportunities for enlightened businesses, possibly adding as much as US$12 trillion to the global economy.”
down our stakes in our Cluster 4
businesses while Africa will continue to
remain as a separate vertical focus.
We will continue to live and
demonstrate Olam’s 3 key brand values
of being an unrivalled expert, a change
agent and transformer, and finally a
trusted partner in our industry. We
believe focus on these elements
remains crucial to our success in a
world where change is a constant.
Chairman transitionMr Kwa Chong Seng stepped down
from Olam’s Board as its Non-Executive
Chairman and Independent Director on
31 December 2016. Chong Seng’s
tenure, first as Deputy Chairman from
October 2014, and then as Chairman
from October 2015 made a deep
impact on Olam’s strategy and
business. During this period, he played
a critical role in forging the strategic
partnership with Mitsubishi Corporation
which is expected to accelerate Olam’s
growth. He also oversaw several
organic and inorganic growth initiatives
that helped Olam to build market
leading positions in its prioritised
platforms. On behalf of Olam’s Board
and Management Team I would like
to express our deepest gratitude
to Chong Seng for his stewardship,
guidance and motivation of the Board
and the Management Team during
his tenure.
I am also pleased to welcome Mr Lim
Ah Doo as our new Non-Executive
Chairman and Independent Director
with effect from 1 January 2017.
Ah Doo has extensive experience
in banking, natural resources,
infrastructure development and
emerging markets from both a banker
and operator standpoints. His deep
knowledge, insights and proven
leadership will undoubtedly benefit
Olam. The Board and I are delighted to
have Ah Doo on board to lead Olam
through its next phase of growth.
1 FSC – Forest Stewardship Council
2 Roundtable on Sustainable Palm Oil
olamgroup.com 7
10.9%
11.5%
11.7%
65.9%
14,415.8(2015: 12,506.7)
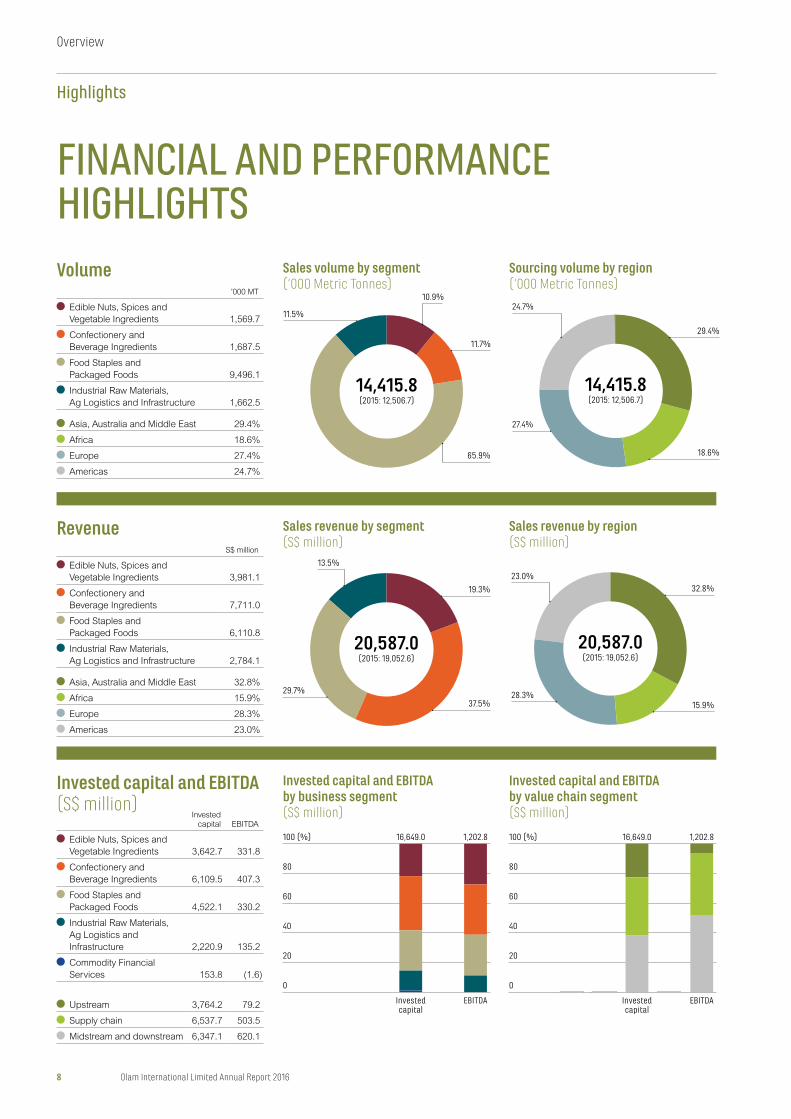
FINANCIAL AND PERFORMANCE HIGHLIGHTS
Invested capital EBITDA
Edible Nuts, Spices and
Vegetable Ingredients 3,642.7 331.8
Confectionery and
Beverage Ingredients 6,109.5 407.3
Food Staples and
Packaged Foods 4,522.1 330.2
Industrial Raw Materials,
Ag Logistics and
Infrastructure 2,220.9 135.2
Commodity Financial
Services 153.8 (1.6)
Upstream 3,764.2 79.2
Supply chain 6,537.7 503.5
Midstream and downstream 6,347.1 620.1
Volume
Revenue
Invested capital and EBITDA (S$ million)
Sales revenue by segment (S$ million)
Invested capital and EBITDA by business segment (S$ million)
Invested capital and EBITDA by value chain segment (S$ million)
Sales revenue by region (S$ million)
Sales volume by segment (‘000 Metric Tonnes)
Sourcing volume by region (‘000 Metric Tonnes)
’000 MT
Edible Nuts, Spices and
Vegetable Ingredients 1,569.7
Confectionery and
Beverage Ingredients 1,687.5
Food Staples and
Packaged Foods 9,496.1
Industrial Raw Materials,
Ag Logistics and Infrastructure 1,662.5
Asia, Australia and Middle East 29.4%
Africa 18.6%
Europe 27.4%
Americas 24.7%
S$ million
Edible Nuts, Spices and
Vegetable Ingredients 3,981.1
Confectionery and
Beverage Ingredients 7,711.0
Food Staples and
Packaged Foods 6,110.8
Industrial Raw Materials,
Ag Logistics and Infrastructure 2,784.1
Asia, Australia and Middle East 32.8%
Africa 15.9%
Europe 28.3%
Americas 23.0%
13.5%
29.7%
19.3%
37.5%
20,587.0(2015: 19,052.6)
24.7%
27.4%
29.4%
18.6%
14,415.8(2015: 12,506.7)
23.0%
28.3%
32.8%
15.9%
20,587.0(2015: 19,052.6)
16,649.0 1,202.8
0
20
40
60
80
100 (%)
Investedcapital
EBITDA
16,649.0 1,202.8
0
20
40
60
80
100 (%)
Investedcapital
EBITDA
8 Olam International Limited Annual Report 2016
Overview
Highlights
20162015
Restated % Change
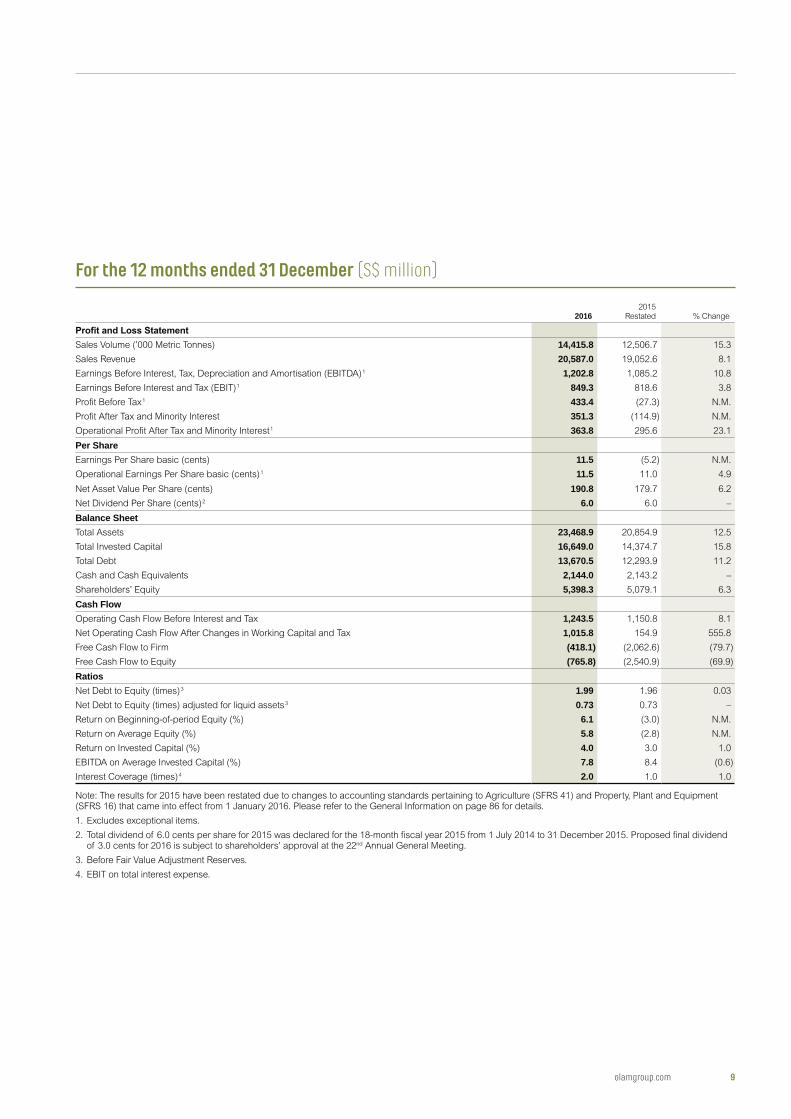
Sales Volume (’000 Metric Tonnes) 14,415.8 12,506.7 15.3
Sales Revenue 20,587.0 19,052.6 8.1
Earnings Before Interest, Tax, Depreciation and Amortisation (EBITDA) 1 1,202.8 1,085.2 10.8
Earnings Before Interest and Tax (EBIT) 1 849.3 818.6 3.8
Profit Before Tax 1 433.4 (27.3) N.M.
Profit After Tax and Minority Interest 351.3 (114.9) N.M.
Operational Profit After Tax and Minority Interest 1 363.8 295.6 23.1
Per Share Earnings Per Share basic (cents) 11.5 (5.2) N.M.
Operational Earnings Per Share basic (cents) 1 11.5 11.0 4.9
Net Asset Value Per Share (cents) 190.8 179.7 6.2
Net Dividend Per Share (cents) 2 6.0 6.0 –
Balance SheetTotal Assets 23,468.9 20,854.9 12.5
Total Invested Capital 16,649.0 14,374.7 15.8
Total Debt 13,670.5 12,293.9 11.2
Cash and Cash Equivalents 2,144.0 2,143.2 –
Shareholders’ Equity 5,398.3 5,079.1 6.3
Cash FlowOperating Cash Flow Before Interest and Tax 1,243.5 1,150.8 8.1
Net Operating Cash Flow After Changes in Working Capital and Tax 1,015.8 154.9 555.8
Free Cash Flow to Firm (418.1) (2,062.6) (79.7)
Free Cash Flow to Equity (765.8) (2,540.9) (69.9)
RatiosNet Debt to Equity (times) 3 1.99 1.96 0.03
Net Debt to Equity (times) adjusted for liquid assets 3 0.73 0.73 –
Return on Beginning-of-period Equity (%) 6.1 (3.0) N.M.
Return on Average Equity (%) 5.8 (2.8) N.M.
Return on Invested Capital (%) 4.0 3.0 1.0
EBITDA on Average Invested Capital (%) 7.8 8.4 (0.6)
Interest Coverage (times) 4 2.0 1.0 1.0
Note: The results for 2015 have been restated due to changes to accounting standards pertaining to Agriculture (SFRS 41) and Property, Plant and Equipment (SFRS 16) that came into effect from 1 January 2016. Please refer to the General Information on page 86 for details.
1. Excludes exceptional items.
2. Total dividend of 6.0 cents per share for 2015 was declared for the 18-month fiscal year 2015 from 1 July 2014 to 31 December 2015. Proposed final dividend of 3.0 cents for 2016 is subject to shareholders’ approval at the 22nd Annual General Meeting.
3. Before Fair Value Adjustment Reserves.
4. EBIT on total interest expense.
For the 12 months ended 31 December (S$ million)
olamgroup.com 9
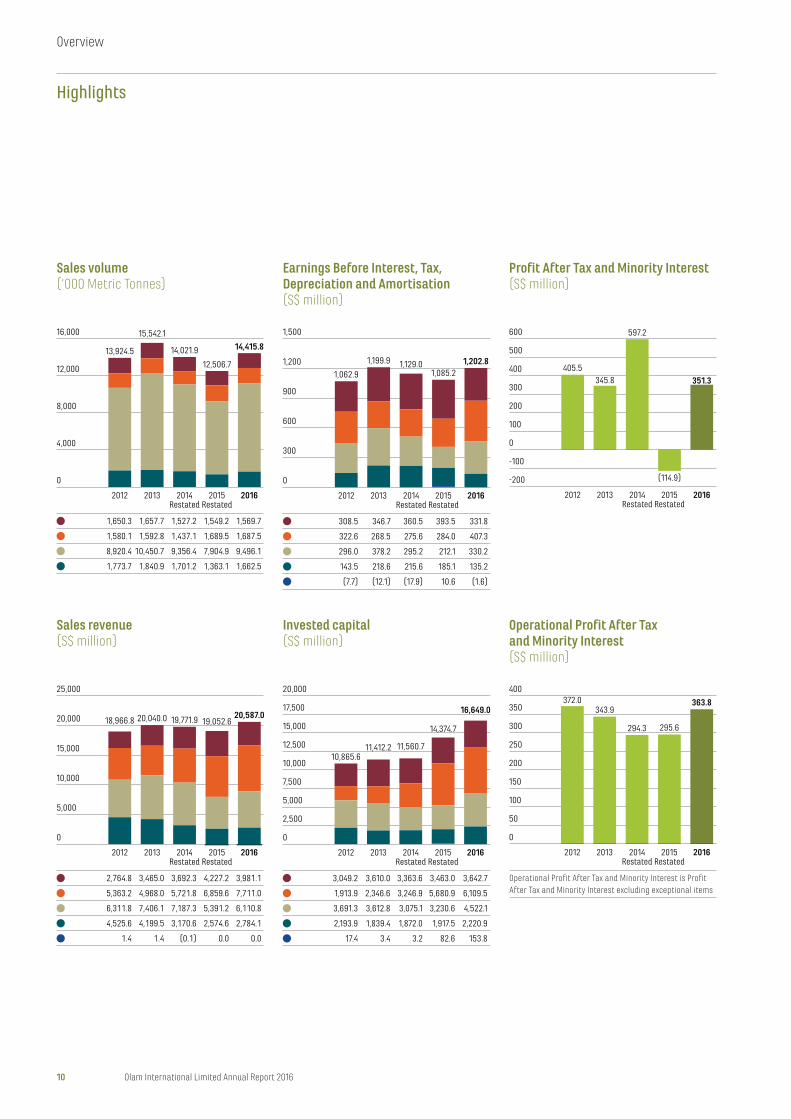
Sales revenue (S$ million)
Earnings Before Interest, Tax, Depreciation and Amortisation (S$ million)
Invested capital (S$ million)
Profit After Tax and Minority Interest (S$ million)
Operational Profit After Tax and Minority Interest (S$ million)
Sales volume (‘000 Metric Tonnes)
13,924.5 14,021.9
12,506.7
14,415.8
0
4,000
8,000
12,000
16,000
2012 2013 2016
1,650.3 1,657.7 1,527.2 1,549.2 1,569.7
1,580.1 1,592.8 1,437.1 1,689.5 1,687.5
8,920.4 10,450.7 9,356.4 7,904.9 9,496.1
1,773.7 1,840.9 1,701.2 1,363.1 1,662.5
15,542.1
2014Restated
2015Restated
0
5,000
10,000
15,000
20,000
25,000
20,040.0 19,771.9
2,764.8 3,465.0 3,692.3 4,227.2 3,981.1
5,363.2 4,968.0 5,721.8 6,859.6 7,711.0
6,311.8 7,406.1 7,187.3 5,391.2 6,110.8
4,525.6 4,199.5 3,170.6 2,574.6 2,784.1
1.4 1.4 (0.1) 0.0 0.0
19,052.618,966.820,587.0
2012 2013 20162014Restated
2015Restated
0
300
600
900
1,200
1,500
1,062.9
1,199.9
308.5 346.7 360.5 393.5 331.8
322.6 268.5 275.6 284.0 407.3
296.0 378.2 295.2 212.1 330.2
143.5 218.6 215.6 185.1 135.2
(7.7) (12.1) (17.9) 10.6 (1.6)
1,129.01,085.2
1,202.8
2012 2013 20162014Restated
2015Restated
3,049.2 3,610.0 3,363.6 3,463.0 3,642.7
1,913.9 2,346.6 3,246.9 5,680.9 6,109.5
3,691.3 3,612.8 3,075.1 3,230.6 4,522.1
2,193.9 1,839.4 1,872.0 1,917.5 2,220.9
17.4 3.4 3.2 82.6 153.8
0
2,500
5,000
7,500
10,000
12,500
15,000
17,500
20,000
11,412.2 11,560.710,865.6
14,374.7
16,649.0
2012 2013 20162014Restated
2015Restated
-200
-100
0
100
200
300
400
500
600
405.5345.8
(114.9)
351.3
597.2
2012 2013 20162014Restated
2015Restated
0
50
100
150
200
250
300
350
400
2012 2013 20162014Restated
2015Restated
Operational Profit After Tax and Minority Interest is Profit After Tax and Minority Interest excluding exceptional items
343.9
295.6
363.8
294.3
372.0
10 Olam International Limited Annual Report 2016
Overview
Highlights
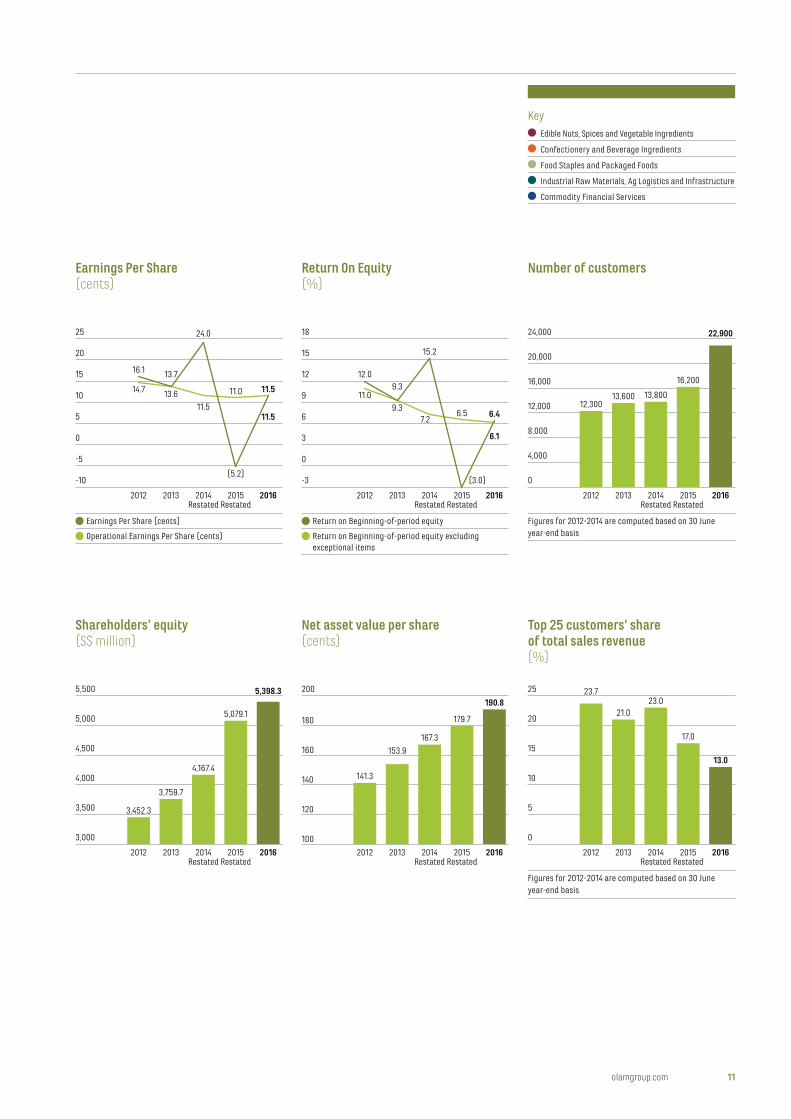
Earnings Per Share(cents)
Return On Equity(%)
Net asset value per share(cents)
Number of customers
Top 25 customers’ share of total sales revenue(%)
Shareholders’ equity(S$ million)
Key Edible Nuts, Spices and Vegetable Ingredients
Confectionery and Beverage Ingredients
Food Staples and Packaged Foods
Industrial Raw Materials, Ag Logistics and Infrastructure
Commodity Financial Services
3,452.3
3,759.7
4,167.4
5,079.1
3,000
3,500
4,000
4,500
5,000
5,500
2012 2013 2014Restated
2015Restated
2016
5,398.3
141.3
179.7
190.8
100
120
140
160
180
200
2012 2013 2014Restated
2015Restated
2016
153.9
167.3
21.023.0
17.0
13.0
0
5
10
15
20
25
2012 2013 2014Restated
2015Restated
2016
Figures for 2012-2014 are computed based on 30 June year-end basis
23.7
12,30013,600 13,800
16,200
0
4,000
8,000
12,000
16,000
20,000
24,000
2012 2013 2014Restated
2015Restated
2016
Figures for 2012-2014 are computed based on 30 June year-end basis
22,90024.0
11.0
16.1
14.7
13.7
13.6
(5.2)
2015Restated
11.5
-10
-5
0
5
10
15
20
25
2012 2013 2014Restated
2016
Earnings Per Share (cents)
Operational Earnings Per Share (cents)
11.511.5 7.2
12.09.3
9.3
15.2
6.5
(3.0)
2015Restated
6.1
-3
0
3
6
9
12
15
18
2012 2013 2014Restated
2016
Return on Beginning-of-period equity
Return on Beginning-of-period equity excludingexceptional items
6.4
11.0
olamgroup.com 11
Our Guiding Principles• Improve the livelihoods of farmers
and communities through initiatives
that enhance productivity
and returns.
• Unlock mutual value with all of our
stakeholders through collaboration.
• Understand and mitigate our
environmental footprint.
• Ensure a safe, healthy and
productive workplace for our people.
• Participate in professional
associations to further develop
our key goals.
Olam endeavours to generate economic prosperity, contribute positively to social welfare and manage our stewardship of the environment in a sustainable way, so as to assure the creation of real long-term value for all.
32,954 new farmers in 9 countries registered on Olam Farmer Information System to bring the total to more
than 65,000 farmers across 13 countries
Read more in the Livelihoods section of this report
2016 SOCIAL AND ENVIRONMENTAL HIGHLIGHTS
“For anyone investing in the agricultural
sector, understanding the social and
environmental aspects of the business
is fundamental – Olam’s activities
depend on the quality of soil, the
availability of water, and dedication of
people to grow, harvest and process
crops. How we strive to mitigate our
footprint on the environment is a matter
of keen interest on the part of many
stakeholder groups while also being a
direct reflection of how we conceive
our corporate responsibilities.
Combining sustainability reporting with
business performance in the Annual
Report is thus an important step. We
hope it will help all stakeholders
to obtain a holistic view of our
business, showing just how far the
Olam teams go to drive change and
grow responsibly.
“Our Corporate Responsibility and
Sustainability (CR&S) agenda is
organised around several major
themes, including land management,
labour and community development
issues. In 2016, Olam’s Board of
Directors visited Nigeria. This gave the
Board an excellent opportunity to see
how our objective of growing
responsibly is being translated on the
ground into specific initiatives designed
to transform communities and build
partnerships. The Board’s CR&S
Committee meets quarterly to review
how our thematic agenda is being
implemented across Business Units
around the world with the paramount
objective of developing a sustainable
business for investors and stakeholders
alike. We remain cognisant, however, of
operating in less than perfect social
and regulatory environments. Provision
of health and education services to
local populations is occasionally
lacking. In some places, the regulation
of access to public commodities, such
as water, remains deficient.
The challenge for Olam is to identify
ways to help mitigate these issues and
ensure the sustainability of our
business.”
Jean-Paul PinardChair of the CR&S Board Committee
12 Olam International Limited Annual Report 2016
Overview
Highlights
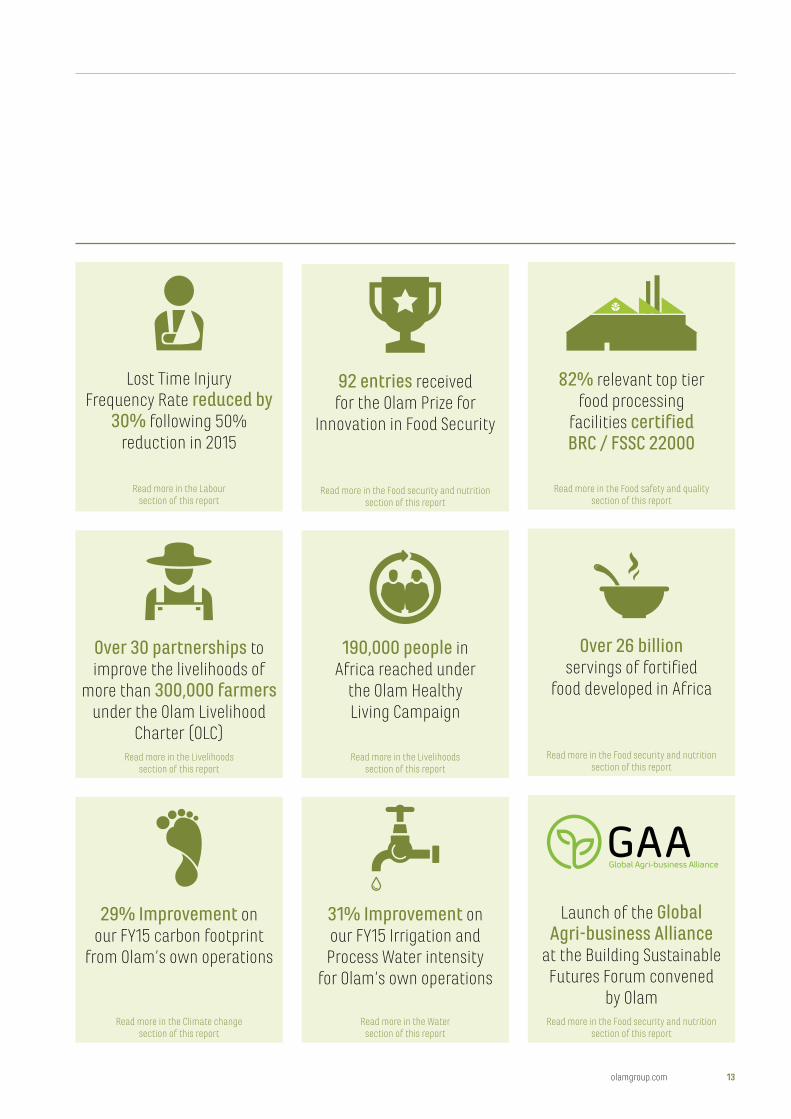
Lost Time Injury Frequency Rate reduced by
30% following 50% reduction in 2015
Read more in the Labour section of this report
Over 30 partnerships to improve the livelihoods of
more than 300,000 farmers under the Olam Livelihood
Charter (OLC)Read more in the Livelihoods
section of this report
92 entries received for the Olam Prize for
Innovation in Food Security
Read more in the Food security and nutrition section of this report
82% relevant top tier food processing
facilities certified BRC / FSSC 22000
Read more in the Food safety and quality section of this report
190,000 people in Africa reached under
the Olam Healthy Living Campaign
Read more in the Livelihoods section of this report
Over 26 billion servings of fortified
food developed in Africa
Read more in the Food security and nutrition section of this report
29% Improvement on our FY15 carbon footprint
from Olam’s own operations
Read more in the Climate change section of this report
31% Improvement on our FY15 Irrigation and Process Water intensity
for Olam’s own operations
Read more in the Water section of this report
Launch of the Global Agri-business Alliance
at the Building Sustainable Futures Forum convened
by OlamRead more in the Food security and nutrition
section of this report
olamgroup.com 13
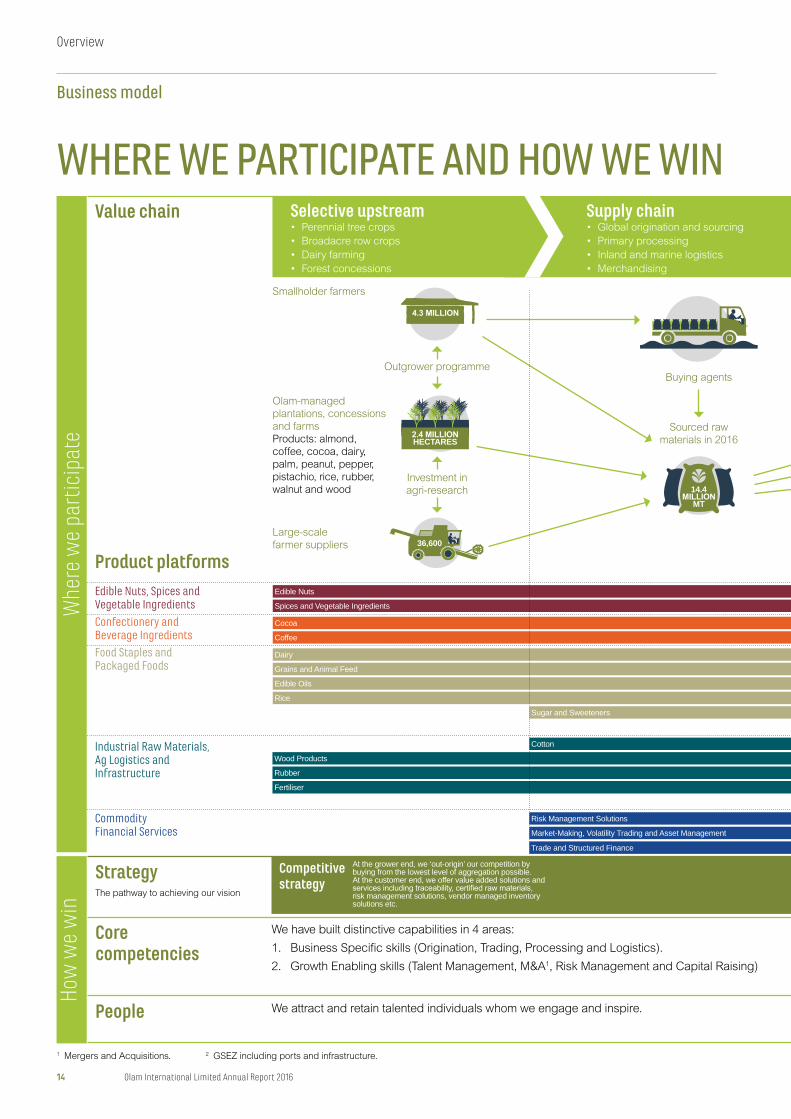
Competitive strategy
Sugar and Sweeteners
We have built distinctive capabilities in 4 areas:
1. Business Specific skills (Origination, Trading, Processing and Logistics).
2. Growth Enabling skills (Talent Management, M&A1, Risk Management and Capital Raising)
We attract and retain talented individuals whom we engage and inspire.
Spices and Vegetable Ingredients
Grains and Animal Feed
Cotton
Edible Nuts
Dairy
Cocoa
Edible Oils
Coffee
Rice
Risk Management Solutions
Market-Making, Volatility Trading and Asset Management
Supply chain• Global origination and sourcing
• Primary processing
• Inland and marine logistics
• Merchandising
Trade and Structured Finance
Whe
re w
e pa
rtic
ipat
eHo
w w
e w
in
People
StrategyThe pathway to achieving our vision
Core competencies
Product platforms
Value chain
Edible Nuts, Spices and Vegetable Ingredients
Confectionery and Beverage Ingredients
Food Staples and Packaged Foods
Industrial Raw Materials, Ag Logistics and Infrastructure
Commodity Financial Services
Wood Products
Fertiliser
Rubber
Smallholder farmers
Buying agents
Sourced raw materials in 2016
Olam-managed plantations, concessions and farms Products: almond, coffee, cocoa, dairy, palm, peanut, pepper, pistachio, rice, rubber, walnut and wood
Large-scale farmer suppliers
Outgrower programme
Investment in agri-research 14.4
MT
HECTARES
36,600
WHERE WE PARTICIPATE AND HOW WE WINSelective upstream• Perennial tree crops
• Broadacre row crops
• Dairy farming
• Forest concessions
1 Mergers and Acquisitions. 2 GSEZ including ports and infrastructure.
At the grower end, we ‘out-origin’ our competition by buying from the lowest level of aggregation possible. At the customer end, we offer value added solutions and
risk management solutions, vendor managed inventory solutions etc.
14 Olam International Limited Annual Report 2016
Business model
Overview
See
our
hig
hlig
hts
on
pag
es 8
to 13
Valu
e cr
eate
d
Portfolio strategy
Growth strategy
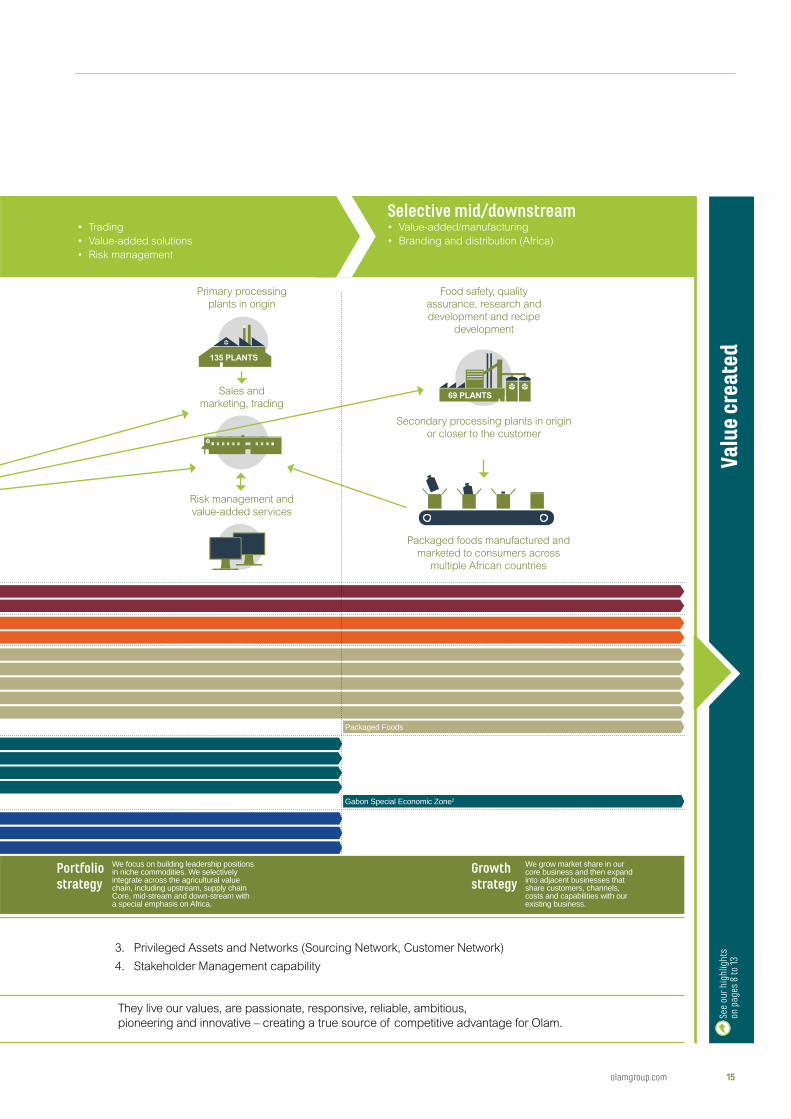
3. Privileged Assets and Networks (Sourcing Network, Customer Network)
4. Stakeholder Management capability
They live our values, are passionate, responsive, reliable, ambitious,
pioneering and innovative – creating a true source of competitive advantage for Olam.
Gabon Special Economic Zone2
Packaged Foods
Primary processing plants in origin
Risk management and value-added services
Sales and marketing, trading
Food safety, quality assurance, research and development and recipe
development
Secondary processing plants in origin or closer to the customer
Packaged foods manufactured and marketed to consumers across
multiple African countries
Selective mid/downstream• Value-added/manufacturing
• Branding and distribution (Africa)
• Trading
• Value-added solutions
• Risk management
We focus on building leadership positions in niche commodities. We selectively integrate across the agricultural value chain, including upstream, supply chain Core, mid-stream and down-stream with a special emphasis on Africa.
We grow market share in our core business and then expand into adjacent businesses that share customers, channels, costs and capabilities with our existing business.
olamgroup.com 15
ECONOMIC
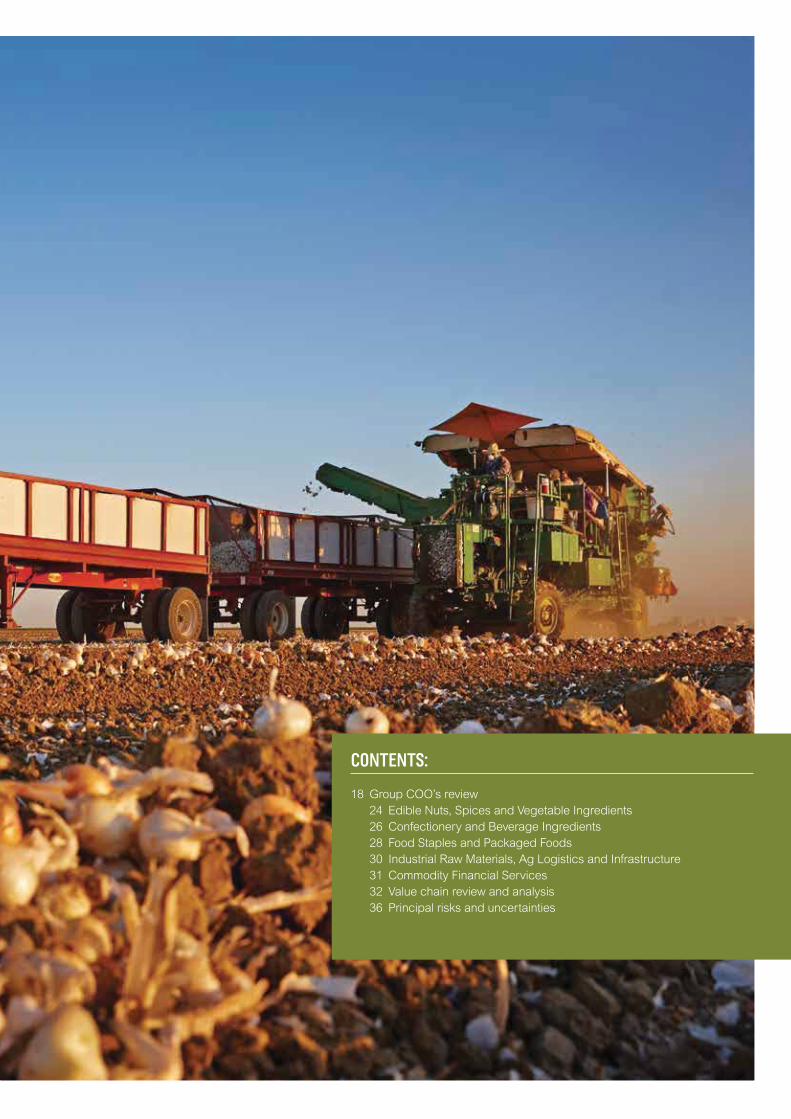
CONTENTS:
18 Group COO’s review
24 Edible Nuts, Spices and Vegetable Ingredients
26 Confectionery and Beverage Ingredients
28 Food Staples and Packaged Foods
30 Industrial Raw Materials, Ag Logistics and Infrastructure
31 Commodity Financial Services
32 Value chain review and analysis
36 Principal risks and uncertainties
Key highlights
Financial performanceIn 2016, Olam achieved a PATMI of
S$351.3 million as against a negative
S$114.9 million in the previous year,
primarily due to improved operational
performance and the absence of the
exceptional losses that we had in 2015.
The exceptional losses in 2015 had
come largely from fair value losses on
our equity investment in PureCircle,
which was due to a conservative
interpretation of an accounting
treatment, with no change to total
equity (including reserves) or cash flow.
The remaining portion of the
exceptional losses was a result of
deliberate actions to optimise
operations for future growth, including
the buy-back of higher cost debt and
restructuring cost for the Dairy
operations in Uruguay. The buy-back of
higher cost debt, which was part of our
debt optimisation efforts that continued
into 2016, resulted in a net exceptional
loss of S$12.5 million for this year.
Stripping out these exceptional items,
operational PATMI showed a strong
23.1% year-on-year growth to
S$363.8 million, compared with
S$295.6 million in 2015.
STEADY PROGRESS IN 2016 ON IMPROVED OPERATIONAL PERFORMANCE AND STRONG STRATEGY EXECUTION
A. Shekhar,Executive Director and Group COO
18 Olam International Limited Annual Report 2016
Group COO’s review
Economic
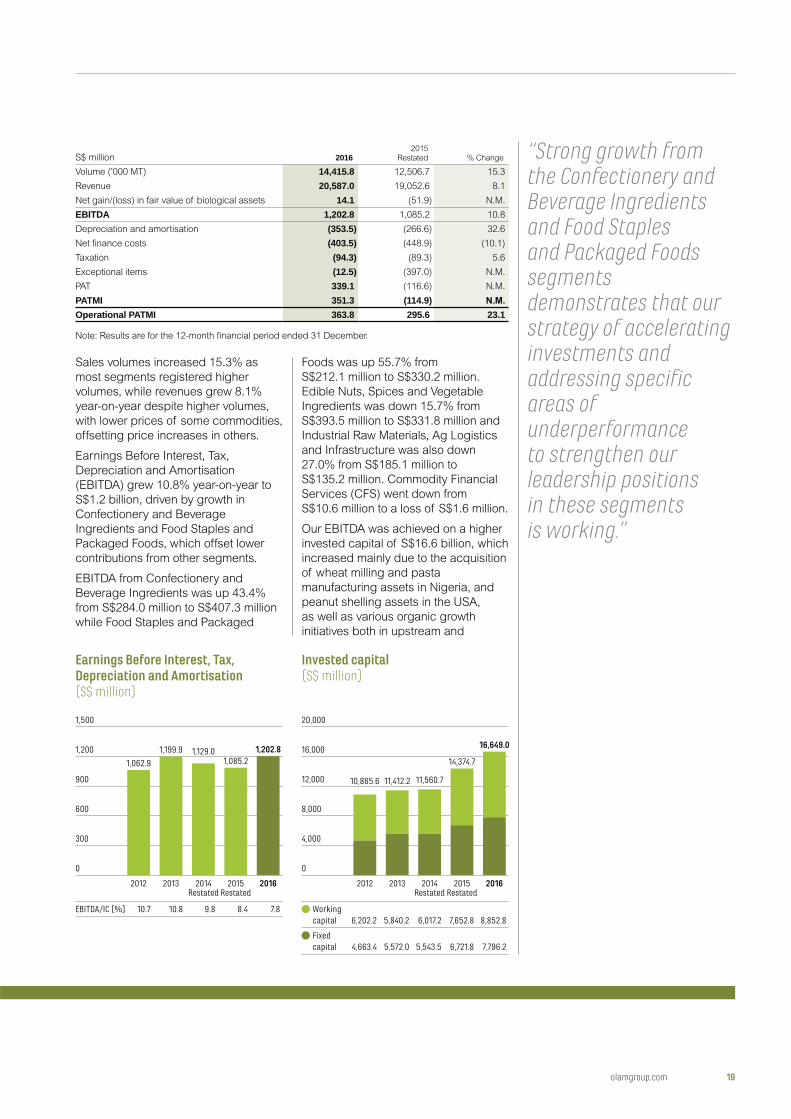
“Strong growth from the Confectionery and Beverage Ingredients and Food Staples and Packaged Foods segments demonstrates that our strategy of accelerating investments and addressing specific areas of underperformance to strengthen our leadership positions in these segments is working.”
S$ million 20162015
Restated % Change
Volume (’000 MT) 14,415.8 12,506.7 15.3
Revenue 20,587.0 19,052.6 8.1
Net gain/(loss) in fair value of biological assets 14.1 (51.9) N.M.
EBITDA 1,202.8 1,085.2 10.8
Depreciation and amortisation (353.5) (266.6) 32.6
Net finance costs (403.5) (448.9) (10.1)
Taxation (94.3) (89.3) 5.6
Exceptional items (12.5) (397.0) N.M.
PAT 339.1 (116.6) N.M.
PATMI 351.3 (114.9)Operational PATMI 363.8 295.6 23.1
Note: Results are for the 12-month financial period ended 31 December.
Sales volumes increased 15.3% as
most segments registered higher
volumes, while revenues grew 8.1%
year-on-year despite higher volumes,
with lower prices of some commodities,
offsetting price increases in others.
Earnings Before Interest, Tax,
Depreciation and Amortisation
(EBITDA) grew 10.8% year-on-year to
S$1.2 billion, driven by growth in
Confectionery and Beverage
Ingredients and Food Staples and
Packaged Foods, which offset lower
contributions from other segments.
EBITDA from Confectionery and
Beverage Ingredients was up 43.4%
from S$284.0 million to S$407.3 million
while Food Staples and Packaged
Foods was up 55.7% from
S$212.1 million to S$330.2 million.
Edible Nuts, Spices and Vegetable
Ingredients was down 15.7% from
S$393.5 million to S$331.8 million and
Industrial Raw Materials, Ag Logistics
and Infrastructure was also down
27.0% from S$185.1 million to
S$135.2 million. Commodity Financial
Services (CFS) went down from
S$10.6 million to a loss of S$1.6 million.
Our EBITDA was achieved on a higher
invested capital of S$16.6 billion, which
increased mainly due to the acquisition
of wheat milling and pasta
manufacturing assets in Nigeria, and
peanut shelling assets in the USA,
as well as various organic growth
initiatives both in upstream and
Earnings Before Interest, Tax, Depreciation and Amortisation (S$ million)
1,062.9
1,199.9
0
300
600
900
1,200
1,500
2012 2013 2014Restated
2015Restated
2016
EBITDA/IC (%) 10.7 10.8 9.8 8.4 7.8
1,129.01,085.2
1,202.8
Invested capital(S$ million)
14,374.7
16,649.0
0
4,000
8,000
12,000
16,000
20,000
2013 2014Restated
2015Restated
2016
Workingcapital 6,202.2 5,840.2 6,017.2 7,652.8 8,852.8
Fixedcapital 4,663.4 5,572.0 5,543.5 6,721.8 7,796.2
2012
11,412.2 11,560.710,865.6
olamgroup.com 19
midstream value chain integration.
Working capital has also increased on
account of our volume growth,
compounded by higher commodity
prices, especially in cocoa, coffee and
cotton during the year.
The EBITDA on average invested
capital ratio (EBITDA/IC) was 7.8%,
down from 8.4% in the year, after the
S$2.2 billion total increase in
invested capital.
Strategic partnership with Mitsubishi CorporationIn 2015, we entered into a strategic
partnership with Mitsubishi Corporation
(MC) to collaborate in mutually
beneficial business opportunities in
Japan and across the world. MC is also
our second largest shareholder with
20.3% interest in our company. In April
2016, we achieved our first partnership
milestone by forming a 30/70 joint
venture MC Agri Alliance (MCAA) to
import and distribute sustainable,
traceable agricultural products and
food ingredients, including coffee,
cocoa, sesame, edible nuts, spices,
vegetable ingredients and tomato
products, for the Japanese market.
MCAA commenced operations on
1 October 2016.
Olam and MC have also set up a
partnership committee to explore
initiatives across platforms and regions
in which we should collaborate. In
addition to the 2 new Directors
representing MC, Mr Katsuhiro Ito and
Mr Yutaka Kyoya, who joined our Board
in late 2015, we also have a few senior
managers from MC joining our global
management team as part of our
partnership agreement.
Executing on our strategic plan 2016-2018We continued to execute on our
refreshed strategic plan going into
2018 through targeted organic and
inorganic investments. During the year,
we announced that we will invest
US$150.0 million to set up 2
state-of-the-art animal feed mills,
poultry breeding farms and a hatchery
to produce day-old chicks in Nigeria.
The first mill is expected to be
commissioned in the second half
of 2017.
During the year, we completed
several acquisitions:
• 100.0% interest in Amber Foods,
which owns wheat milling and pasta
manufacturing assets in Nigeria,
for US$275.0 million;
• 100.0% interest in Brooks Peanut
Company at an enterprise value of
US$102.1 million (post working
capital adjustments on closing);
• palm and palm oil assets from SIAT
Gabon for approximately
US$24.6 million through Olam Palm
Gabon (OPG), the 60/40 joint venture
between Olam and the Republic
of Gabon;
• remaining 50.0% interest in Acacia
Investments (Acacia) from its joint
venture partner for US$24.0 million;
and
• 100.0% interest in East African coffee
specialist Schluter S.A. for
US$7.5 million.
Some of these investments will be
discussed in further detail in the
business segments that follow.
“We reduced our interest costs despite a higher asset base and will continue to optimise our capital structure as we focus on targeted investments in our prioritised platforms and ensure that our gestating assets reach their full potential.”
20 Olam International Limited Annual Report 2016
Group COO’s review
Economic
Use of funds(S$ million)
0
4,000
8,000
12,000
16,000
20,000
2015Restated
2016
Fixed capital 7,340.5 8,169.5
Working capital 8,295.6 8,517.7
Cash 2,143.1 2,144.0
Others (165.8) 473.5
17,613.6
19,304.7
Source of funds(S$ million)
0
4,000
8,000
12,000
16,000
20,000
2015Restated
2016
Long-term debt 6,781.7 7,687.5
Short-term debt 5,512.1 5,983.0
Non-controlling interests 240.5 235.9
Equity and reserves 5,187.0 5,797.1
Fair value reserve (107.9) (398.8)
17,613.6
19,304.7
Cash-to-cash cycle(Days)
149 150
140
142
144
146
148
150
2015Restated
2016
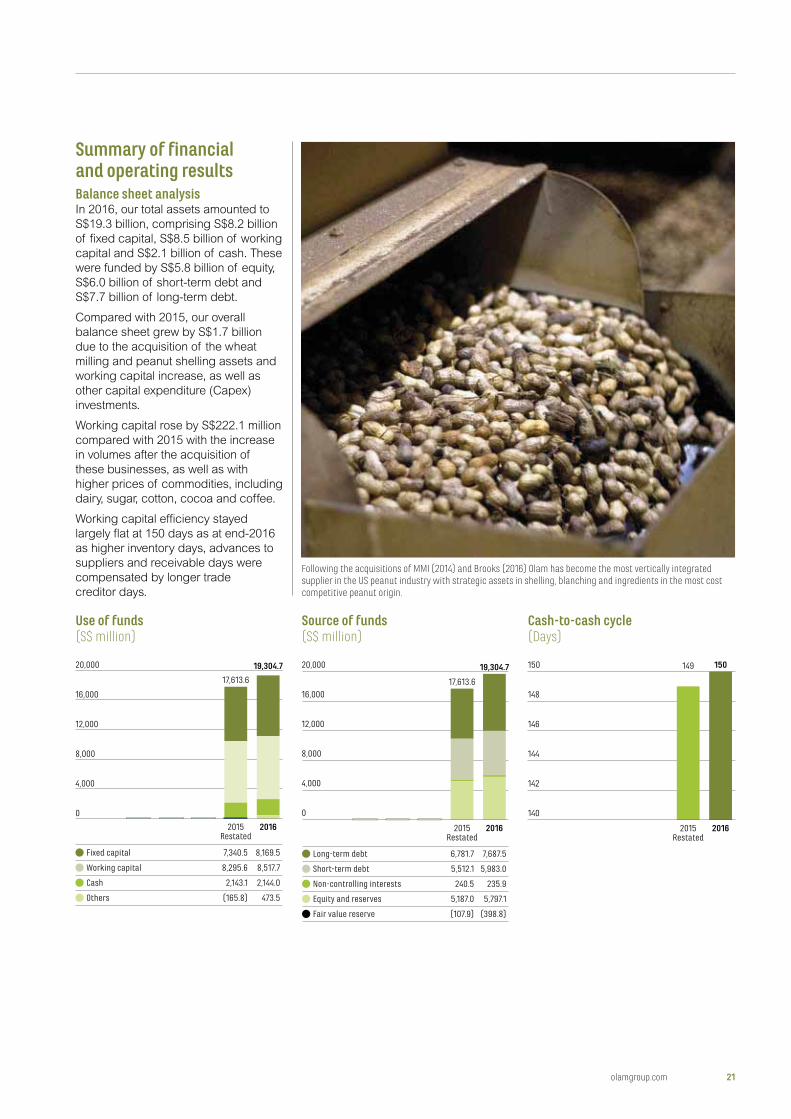
Summary of financial and operating resultsBalance sheet analysisIn 2016, our total assets amounted to
S$19.3 billion, comprising S$8.2 billion
of fixed capital, S$8.5 billion of working
capital and S$2.1 billion of cash. These
were funded by S$5.8 billion of equity,
S$6.0 billion of short-term debt and
S$7.7 billion of long-term debt.
Compared with 2015, our overall
balance sheet grew by S$1.7 billion
due to the acquisition of the wheat
milling and peanut shelling assets and
working capital increase, as well as
other capital expenditure (Capex)
investments.
Working capital rose by S$222.1 million
compared with 2015 with the increase
in volumes after the acquisition of
these businesses, as well as with
higher prices of commodities, including
dairy, sugar, cotton, cocoa and coffee.
Working capital efficiency stayed
largely flat at 150 days as at end-2016
as higher inventory days, advances to
suppliers and receivable days were
compensated by longer trade
creditor days.
Following the acquisitions of MMI (2014) and Brooks (2016) Olam has become the most vertically integrated supplier in the US peanut industry with strategic assets in shelling, blanching and ingredients in the most cost competitive peanut origin.
olamgroup.com 21
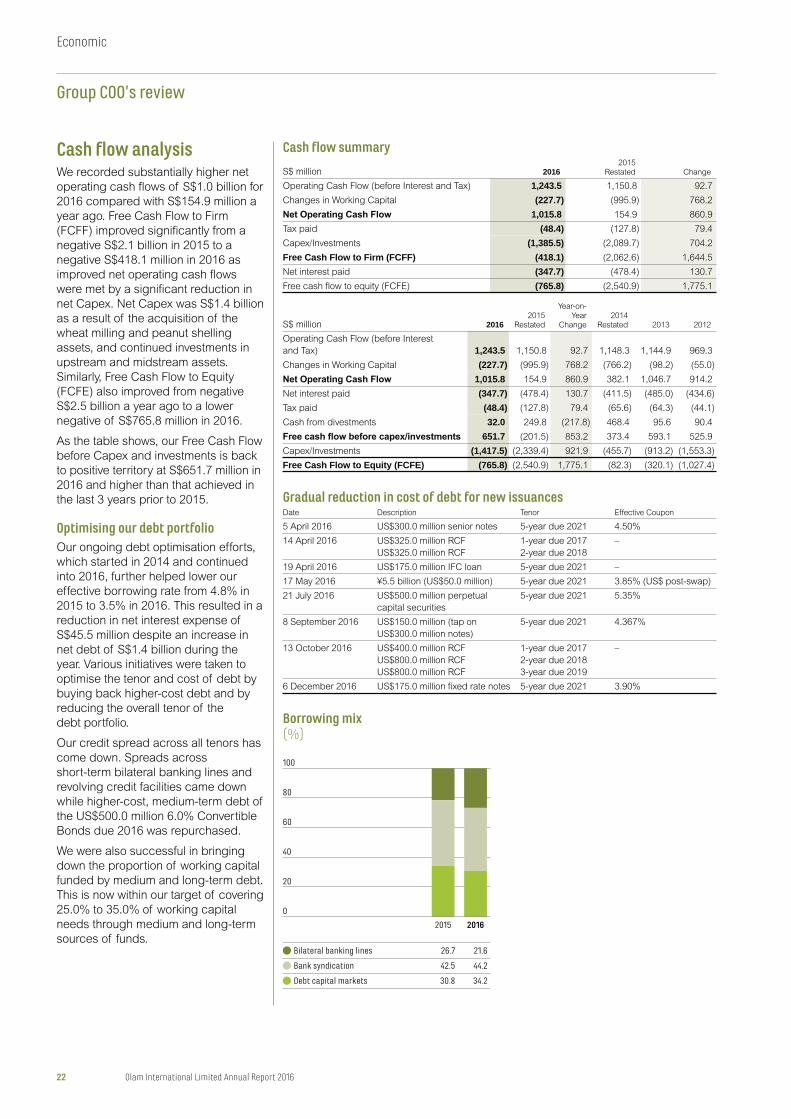
Cash flow summary
S$ million 20162015
Restated Change
Operating Cash Flow (before Interest and Tax) 1,243.5 1,150.8 92.7
Changes in Working Capital (227.7) (995.9) 768.2
1,015.8 154.9 860.9
Tax paid (48.4) (127.8) 79.4
Capex/Investments (1,385.5) (2,089.7) 704.2
Free Cash Flow to Firm (FCFF) (418.1) (2,062.6) 1,644.5
Net interest paid (347.7) (478.4) 130.7
Free cash flow to equity (FCFE) (765.8) (2,540.9) 1,775.1
S$ million 20162015
Restated
Year-on-Year
Change2014
Restated 2013 2012
Operating Cash Flow (before Interest
and Tax) 1,243.5 1,150.8 92.7 1,148.3 1,144.9 969.3
Changes in Working Capital (227.7) (995.9) 768.2 (766.2) (98.2) (55.0)
1,015.8 154.9 860.9 382.1 1,046.7 914.2
Net interest paid (347.7) (478.4) 130.7 (411.5) (485.0) (434.6)
Tax paid (48.4) (127.8) 79.4 (65.6) (64.3) (44.1)
Cash from divestments 32.0 249.8 (217.8) 468.4 95.6 90.4
651.7 (201.5) 853.2 373.4 593.1 525.9
Capex/Investments (1,417.5) (2,339.4) 921.9 (455.7) (913.2) (1,553.3)
Free Cash Flow to Equity (FCFE) (765.8) (2,540.9) 1,775.1 (82.3) (320.1) (1,027.4)
Gradual reduction in cost of debt for new issuancesDate Description Tenor Effective Coupon
5 April 2016 US$300.0 million senior notes 5-year due 2021 4.50%
14 April 2016 US$325.0 million RCF
US$325.0 million RCF
1-year due 2017
2-year due 2018
–
19 April 2016 US$175.0 million IFC loan 5-year due 2021 –
17 May 2016 ¥5.5 billion (US$50.0 million) 5-year due 2021 3.85% (US$ post-swap)
21 July 2016 US$500.0 million perpetual
capital securities
5-year due 2021 5.35%
8 September 2016 US$150.0 million (tap on
US$300.0 million notes)
5-year due 2021 4.367%
13 October 2016 US$400.0 million RCF
US$800.0 million RCF
US$800.0 million RCF
1-year due 2017
2-year due 2018
3-year due 2019
–
6 December 2016 US$175.0 million fixed rate notes 5-year due 2021 3.90%
Cash flow analysisWe recorded substantially higher net
operating cash flows of S$1.0 billion for
2016 compared with S$154.9 million a
year ago. Free Cash Flow to Firm
(FCFF) improved significantly from a
negative S$2.1 billion in 2015 to a
negative S$418.1 million in 2016 as
improved net operating cash flows
were met by a significant reduction in
net Capex. Net Capex was S$1.4 billion
as a result of the acquisition of the
wheat milling and peanut shelling
assets, and continued investments in
upstream and midstream assets.
Similarly, Free Cash Flow to Equity
(FCFE) also improved from negative
S$2.5 billion a year ago to a lower
negative of S$765.8 million in 2016.
As the table shows, our Free Cash Flow
before Capex and investments is back
to positive territory at S$651.7 million in
2016 and higher than that achieved in
the last 3 years prior to 2015.
Optimising our debt portfolioOur ongoing debt optimisation efforts,
which started in 2014 and continued
into 2016, further helped lower our
effective borrowing rate from 4.8% in
2015 to 3.5% in 2016. This resulted in a
reduction in net interest expense of
S$45.5 million despite an increase in
net debt of S$1.4 billion during the
year. Various initiatives were taken to
optimise the tenor and cost of debt by
buying back higher-cost debt and by
reducing the overall tenor of the
debt portfolio.
Our credit spread across all tenors has
come down. Spreads across
short-term bilateral banking lines and
revolving credit facilities came down
while higher-cost, medium-term debt of
the US$500.0 million 6.0% Convertible
Bonds due 2016 was repurchased.
We were also successful in bringing
down the proportion of working capital
funded by medium and long-term debt.
This is now within our target of covering
25.0% to 35.0% of working capital
needs through medium and long-term
sources of funds.
Borrowing mix(%)
2015 2016
Bilateral banking lines 26.7 21.6
Bank syndication 42.5 44.2
Debt capital markets 30.8 34.2
0
20
40
60
80
100
22 Olam International Limited Annual Report 2016
Group COO’s review
Economic
Segmental review and analysisSales Volume (’000 MT) Revenue EBITDA Invested Capital (IC) EBITDA/IC (%)
SegmentS$ million 2016
2015 Restated 2016
2015 Restated 2016
2015 Restated 2016
2015 Restated 2016
2015 Restated
Edible Nuts, Spices and
Vegetable Ingredients 1,569.7 1,549.2 3,981.1 4,227.2 331.8 393.5 3,642.7 3,463.0 9.3 11.5
Confectionery and
Beverage Ingredients 1,687.5 1,689.5 7,711.0 6,859.6 407.3 284.0 6,109.5 5,680.9 6.9 6.4
Food Staples and
Packaged Foods 9,496.1 7,904.9 6,110.8 5,391.2 330.2 212.1 4,522.1 3,230.6 8.5 6.7
Food Category 12,753.3 11,143.6 17,802.9 16,478.0 1,069.2 889.6 14,274.3 12,374.5 8.0 13.2
Industrial Raw Materials,
Ag Logistics
and Infrastructure 1,662.5 1,363.1 2,784.1 2,574.6 135.2 185.1 2,220.9 1,917.5 6.5 9.8
Commodity Financial
Services (CFS) N.A. – – (1.6) 10.6 153.8 82.6 (1.4) 24.7
1,662.5 1,363.1 2,784.1 2,574.6 133.6 195.7 2,374.7 2,000.1 6.1 18.3
Total 14,415.8 12,506.7 20,587.0 19,052.6 1,202.8 1,085.2 16,649.0 14,374.7 7.8 8.4
Note: IC excludes:
(a) Gabon Fertiliser Project (31 December 2016: S$224.8 million, 31 December 2015: S$209.8 million); and
(b) Long-term Investment (31 December 2016: S$148.4 million, 31 December 2015: S$269.2 million).
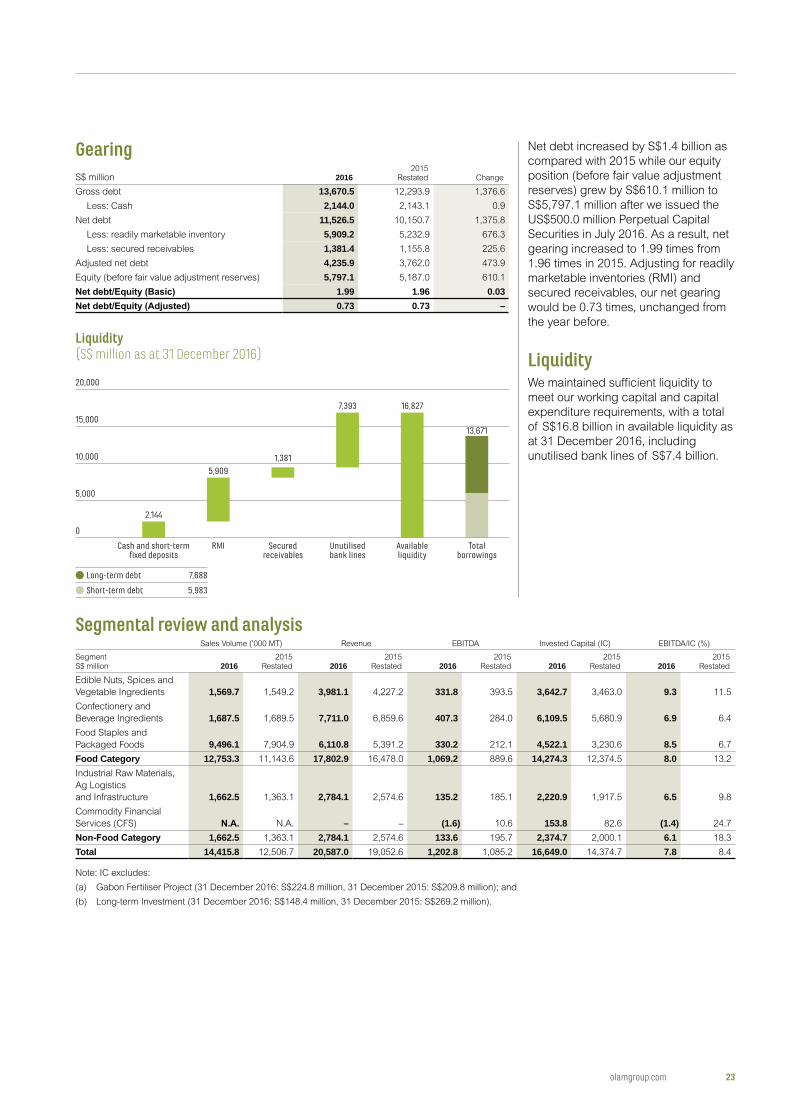
Net debt increased by S$1.4 billion as
compared with 2015 while our equity
position (before fair value adjustment
reserves) grew by S$610.1 million to
S$5,797.1 million after we issued the
US$500.0 million Perpetual Capital
Securities in July 2016. As a result, net
gearing increased to 1.99 times from
1.96 times in 2015. Adjusting for readily
marketable inventories (RMI) and
secured receivables, our net gearing
would be 0.73 times, unchanged from
the year before.
LiquidityWe maintained sufficient liquidity to
meet our working capital and capital
expenditure requirements, with a total
of S$16.8 billion in available liquidity as
at 31 December 2016, including
unutilised bank lines of S$7.4 billion.
GearingS$ million 2016
2015Restated Change
Gross debt 13,670.5 12,293.9 1,376.6
Less: Cash 2,144.0 2,143.1 0.9
Net debt 11,526.5 10,150.7 1,375.8
Less: readily marketable inventory 5,909.2 5,232.9 676.3
Less: secured receivables 1,381.4 1,155.8 225.6
Adjusted net debt 4,235.9 3,762.0 473.9
Equity (before fair value adjustment reserves) 5,797.1 5,187.0 610.1
1.99 1.96 0.030.73 0.73 –
Liquidity(S$ million as at 31 December 2016)
Long-term debt 7,688
Short-term debt 5,983
0
5,000
10,000
15,000
20,000
Cash and short-termfixed deposits
RMI Securedreceivables
Unutilisedbank lines
Availableliquidity
Totalborrowings
2,144
5,909
7,393 16,827
1,381
13,671
olamgroup.com 23
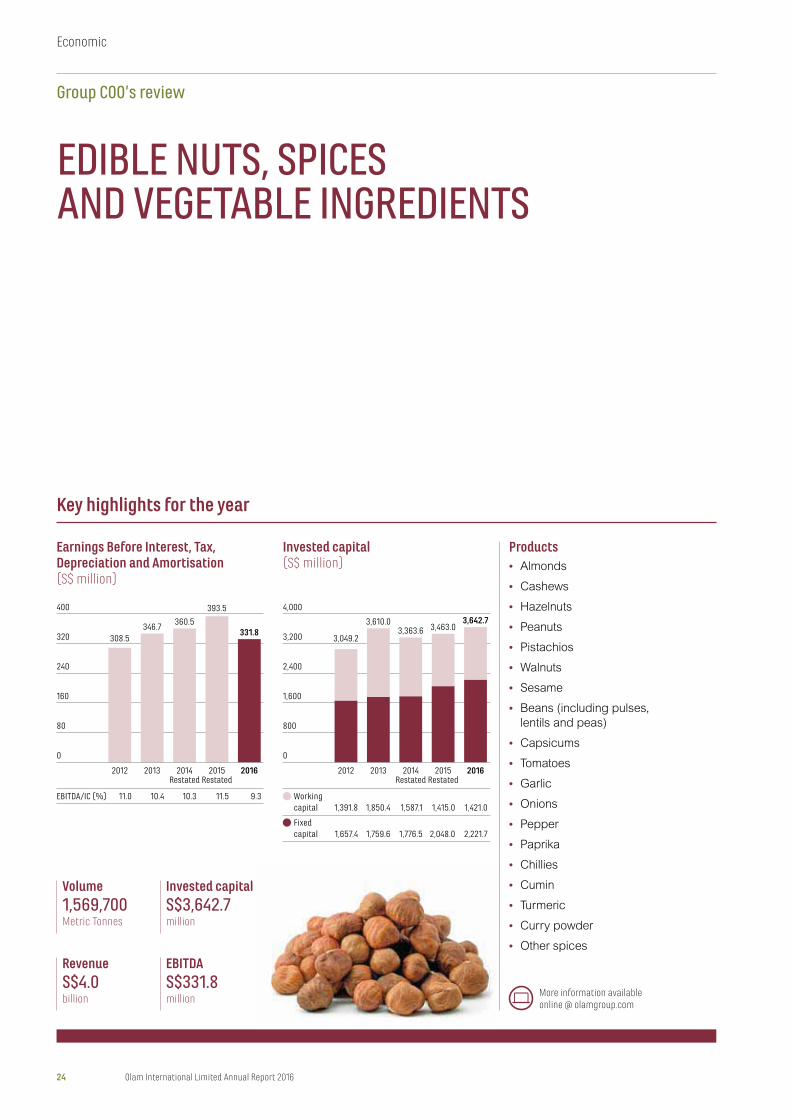
EDIBLE NUTS, SPICES AND VEGETABLE INGREDIENTS
EBITDAS$331.8million
RevenueS$4.0billion
Volume1,569,700Metric Tonnes
Invested capitalS$3,642.7million
Key highlights for the year
Earnings Before Interest, Tax, Depreciation and Amortisation(S$ million)
Invested capital(S$ million)
Products• Almonds
• Cashews
• Hazelnuts
• Peanuts
• Pistachios
• Walnuts
• Sesame
• Beans (including pulses,
lentils and peas)
• Capsicums
• Tomatoes
• Garlic
• Onions
• Pepper
• Paprika
• Chillies
• Cumin
• Turmeric
• Curry powder
• Other spices
More information available online @ olamgroup.com
346.7360.5
0
80
160
240
320
400
20132012 2014Restated
2015Restated
2016
EBITDA/IC (%) 11.0 10.4 10.3 11.5 9.3
308.5
393.5
331.83,610.0
3,363.6 3,463.03,642.7
0
800
1,600
2,400
3,200
4,000
20132012 2014Restated
2015Restated
2016
Workingcapital 1,391.8 1,850.4 1,587.1 1,415.0 1,421.0
Fixedcapital 1,657.4 1,759.6 1,776.5 2,048.0 2,221.7
3,049.2
24 Olam International Limited Annual Report 2016
Economic
Group COO’s review
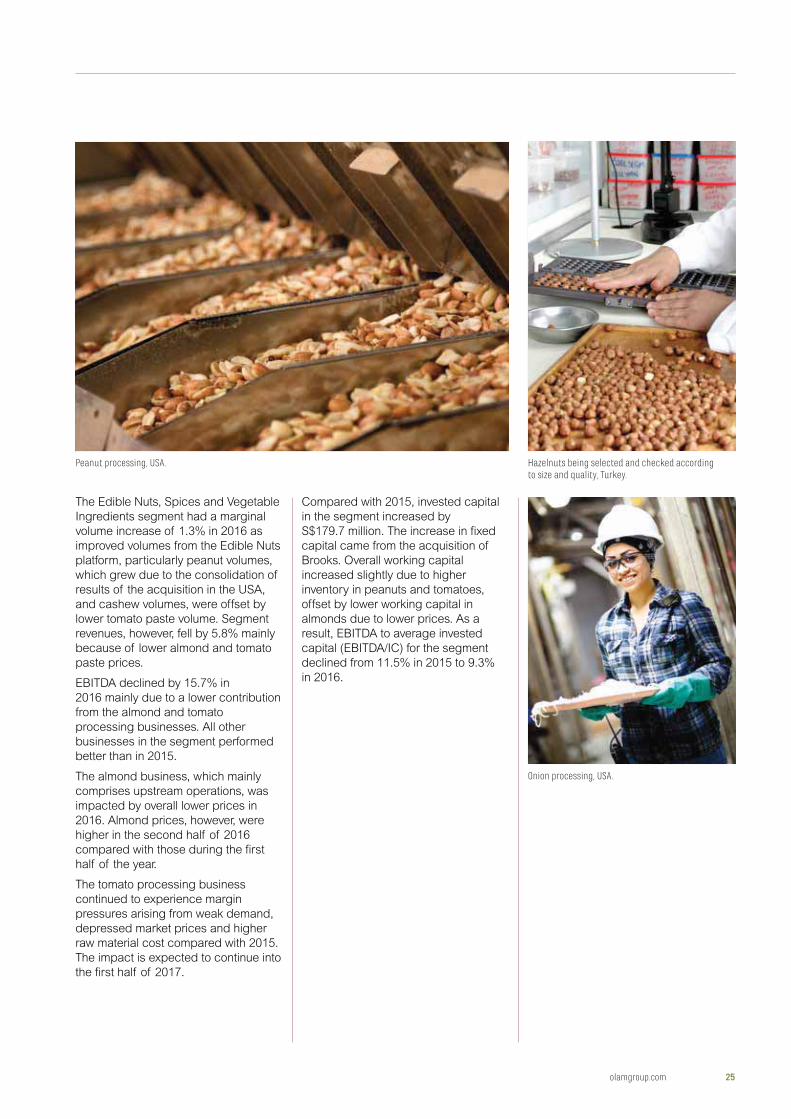
The Edible Nuts, Spices and Vegetable
Ingredients segment had a marginal
volume increase of 1.3% in 2016 as
improved volumes from the Edible Nuts
platform, particularly peanut volumes,
which grew due to the consolidation of
results of the acquisition in the USA,
and cashew volumes, were offset by
lower tomato paste volume. Segment
revenues, however, fell by 5.8% mainly
because of lower almond and tomato
paste prices.
EBITDA declined by 15.7% in
2016 mainly due to a lower contribution
from the almond and tomato
processing businesses. All other
businesses in the segment performed
better than in 2015.
The almond business, which mainly
comprises upstream operations, was
impacted by overall lower prices in
2016. Almond prices, however, were
higher in the second half of 2016
compared with those during the first
half of the year.
The tomato processing business
continued to experience margin
pressures arising from weak demand,
depressed market prices and higher
raw material cost compared with 2015.
The impact is expected to continue into
the first half of 2017.
Peanut processing, USA. Hazelnuts being selected and checked according to size and quality, Turkey.
Compared with 2015, invested capital
in the segment increased by
S$179.7 million. The increase in fixed
capital came from the acquisition of
Brooks. Overall working capital
increased slightly due to higher
inventory in peanuts and tomatoes,
offset by lower working capital in
almonds due to lower prices. As a
result, EBITDA to average invested
capital (EBITDA/IC) for the segment
declined from 11.5% in 2015 to 9.3%
in 2016.
Onion processing, USA.
olamgroup.com 25
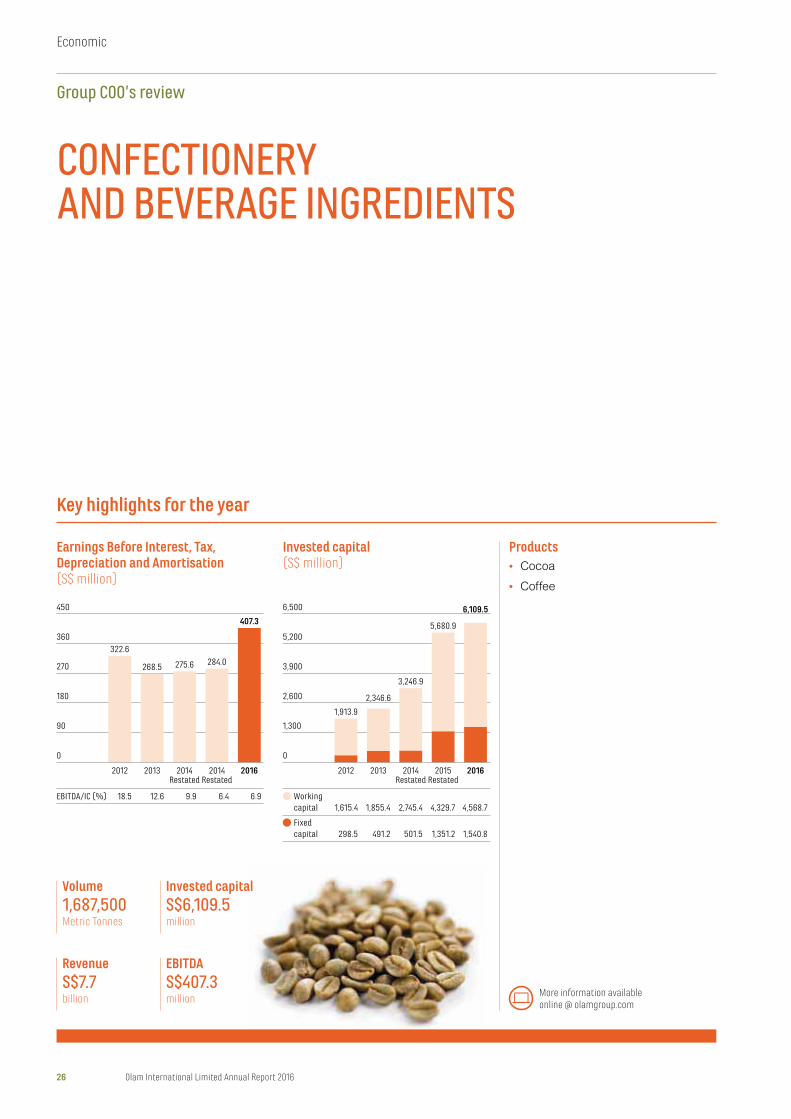
CONFECTIONERY AND BEVERAGE INGREDIENTS
EBITDAS$407.3million
RevenueS$7.7billion
Volume1,687,500Metric Tonnes
Invested capitalS$6,109.5million
Key highlights for the year
Earnings Before Interest, Tax, Depreciation and Amortisation(S$ million)
Invested capital(S$ million)
Products• Cocoa
• Coffee
More information available online @ olamgroup.com
275.6 284.0
407.3
0
90
180
270
360
450
2013 2014Restated
2014Restated
2016
EBITDA/IC (%) 18.5 12.6 9.9 6.4 6.9
322.6
2012
268.5
1,913.9
Workingcapital 1,615.4 1,855.4 2,745.4 4,329.7 4,568.7
Fixedcapital 298.5 491.2 501.5 1,351.2 1,540.8
0
1,300
2,600
3,900
5,200
6,500
20132012 2014Restated
2015Restated
2016
3,246.9
5,680.9
6,109.5
2,346.6
26 Olam International Limited Annual Report 2016
Economic
Group COO’s review
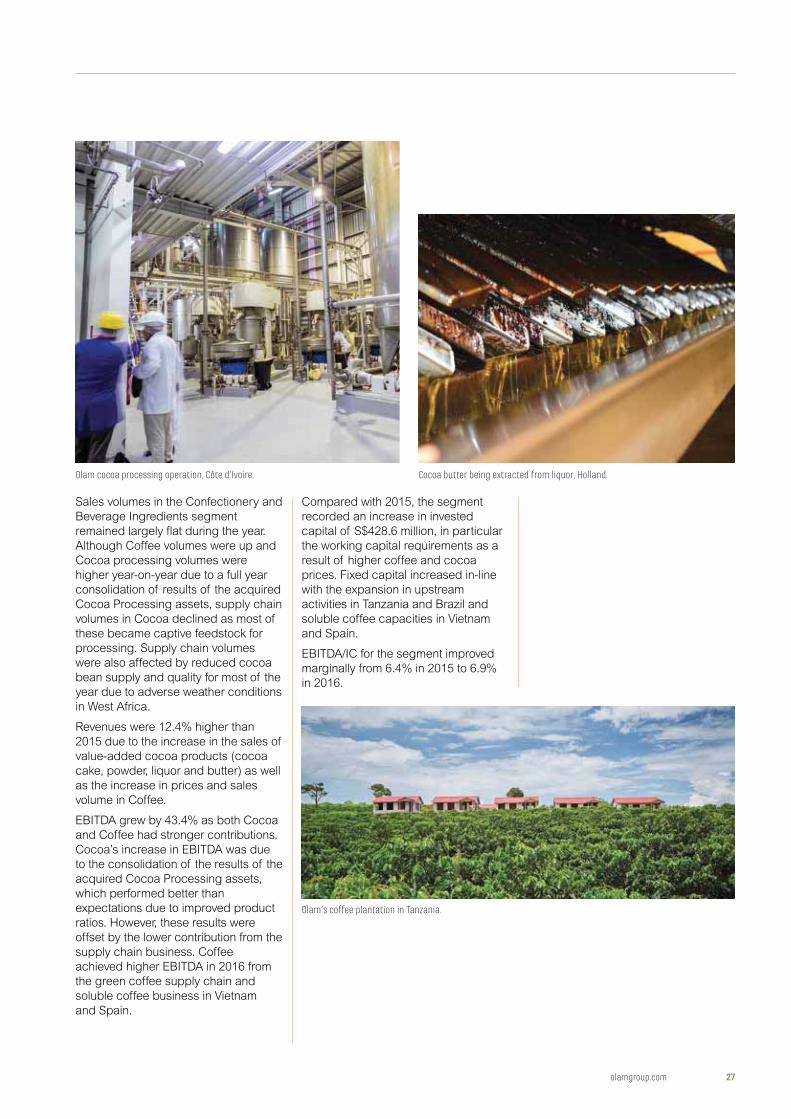
Olam cocoa processing operation, Côte d’Ivoire.
Olam’s coffee plantation in Tanzania.
Sales volumes in the Confectionery and
Beverage Ingredients segment
remained largely flat during the year.
Although Coffee volumes were up and
Cocoa processing volumes were
higher year-on-year due to a full year
consolidation of results of the acquired
Cocoa Processing assets, supply chain
volumes in Cocoa declined as most of
these became captive feedstock for
processing. Supply chain volumes
were also affected by reduced cocoa
bean supply and quality for most of the
year due to adverse weather conditions
in West Africa.
Revenues were 12.4% higher than
2015 due to the increase in the sales of
value-added cocoa products (cocoa
cake, powder, liquor and butter) as well
as the increase in prices and sales
volume in Coffee.
EBITDA grew by 43.4% as both Cocoa
and Coffee had stronger contributions.
Cocoa’s increase in EBITDA was due
to the consolidation of the results of the
acquired Cocoa Processing assets,
which performed better than
expectations due to improved product
ratios. However, these results were
offset by the lower contribution from the
supply chain business. Coffee
achieved higher EBITDA in 2016 from
the green coffee supply chain and
soluble coffee business in Vietnam
and Spain.
Compared with 2015, the segment
recorded an increase in invested
capital of S$428.6 million, in particular
the working capital requirements as a
result of higher coffee and cocoa
prices. Fixed capital increased in-line
with the expansion in upstream
activities in Tanzania and Brazil and
soluble coffee capacities in Vietnam
and Spain.
EBITDA/IC for the segment improved
marginally from 6.4% in 2015 to 6.9%
in 2016.
Cocoa butter being extracted from liquor, Holland.
olamgroup.com 27
FOOD STAPLES AND PACKAGED FOODS
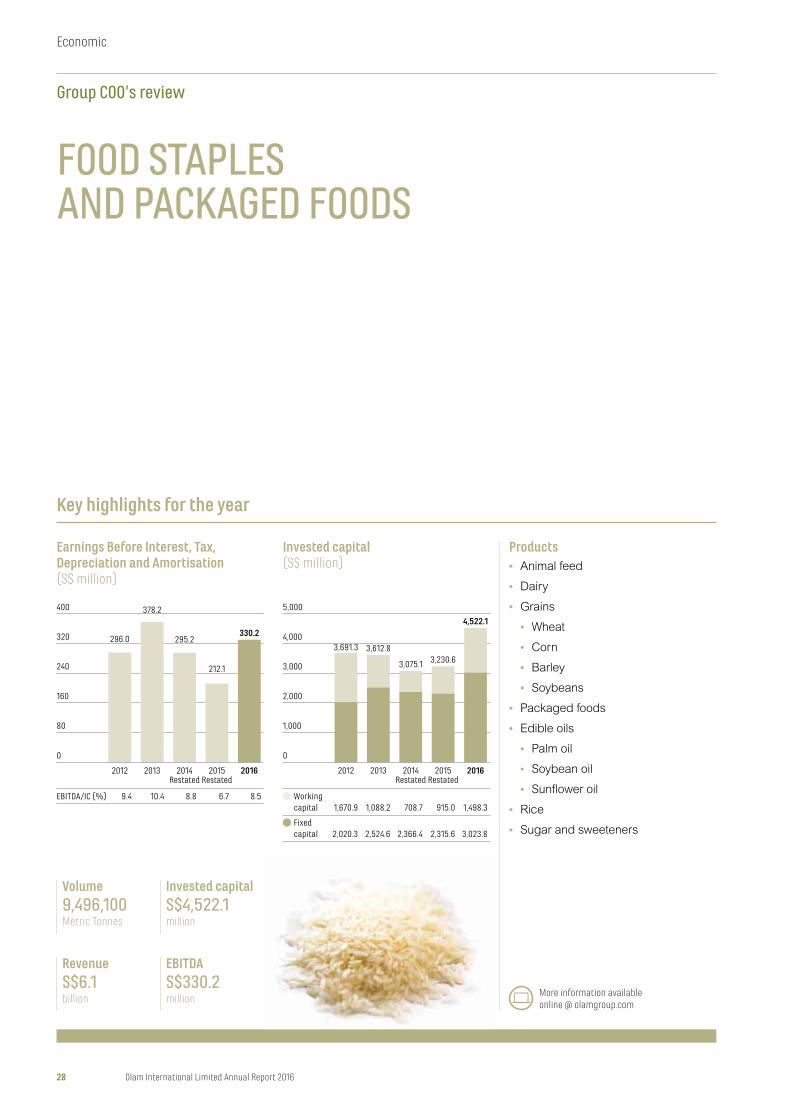
EBITDAS$330.2million
RevenueS$6.1billion
Volume9,496,100Metric Tonnes
Invested capitalS$4,522.1million
Key highlights for the year
Earnings Before Interest, Tax, Depreciation and Amortisation(S$ million)
Invested capital(S$ million)
Products• Animal feed
• Dairy
• Grains
• Wheat
• Corn
• Barley
• Soybeans
• Packaged foods
• Edible oils
• Palm oil
• Soybean oil
• Sunflower oil
• Rice
• Sugar and sweeteners
More information available online @ olamgroup.com
330.2
0
80
160
240
320
400
2013 2014Restated
2015Restated
2016
EBITDA/IC (%) 9.4 10.4 8.8 6.7 8.5
2012
296.0 295.2
378.2
212.1
3,612.83,230.6
4,522.1
0
1,000
2,000
3,000
4,000
5,000
2013 2014Restated
2015Restated
2016
Workingcapital 1,670.9 1,088.2 708.7 915.0 1,498.3
Fixedcapital 2,020.3 2,524.6 2,366.4 2,315.6 3,023.8
2012
3,075.1
3,691.3
28 Olam International Limited Annual Report 2016
Economic
Group COO’s review
Food Staples and Packaged Foods
segment volumes increased by 20.1%
mainly due to higher volumes from
Grains’ origination and export
operations as well as the wheat milling
operations post the acquisition of BUA
Group’s wheat milling assets in Nigeria.
The Rice, Sugar and Dairy businesses
also recorded an increase in volumes
as compared with the previous year.
Revenues grew by 13.3% in
2016 mainly due to volume growth and
higher dairy, rice and sugar prices, part
of which were offset by the adverse
currency impact on Packaged
Foods’ revenues.
The segment reported a robust 55.7%
growth in EBITDA as all platforms
recorded an improvement in EBITDA
over the prior year. Operations which
underperformed during the prior year
showed strong improvements in 2016.
The edible oil refining and distribution
operations in Mozambique including
those of Acacia performed better than
in 2015. Rusmolco was profitable for
the year while the dairy farming
operation in Uruguay recorded
significantly improved operating
metrics and hence better results
compared with 2015. Packaged Foods
posted improved performance despite
facing headwinds during the year from
currency volatility as well as the
disruption of dairy and beverage juices
production in Nigeria after a plant fire
in April 2016.
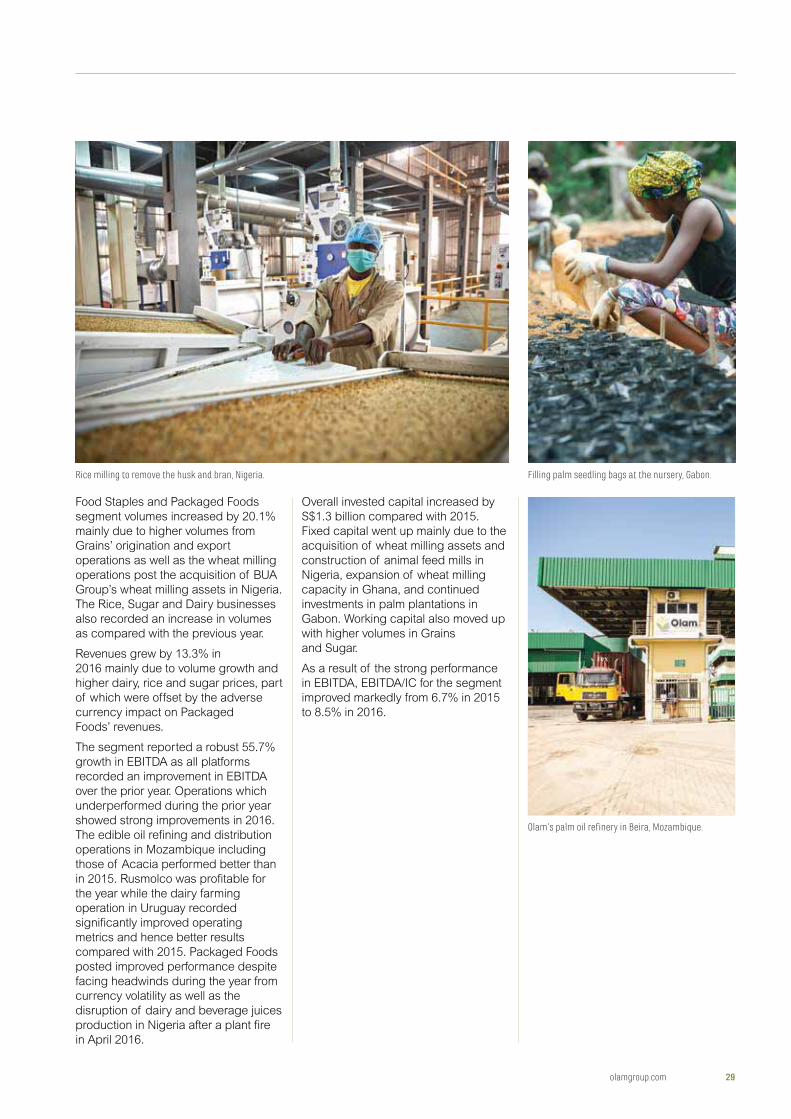
Rice milling to remove the husk and bran, Nigeria. Filling palm seedling bags at the nursery, Gabon.
Overall invested capital increased by
S$1.3 billion compared with 2015.
Fixed capital went up mainly due to the
acquisition of wheat milling assets and
construction of animal feed mills in
Nigeria, expansion of wheat milling
capacity in Ghana, and continued
investments in palm plantations in
Gabon. Working capital also moved up
with higher volumes in Grains
and Sugar.
As a result of the strong performance
in EBITDA, EBITDA/IC for the segment
improved markedly from 6.7% in 2015
to 8.5% in 2016.
Olam’s palm oil refinery in Beira, Mozambique.
olamgroup.com 29
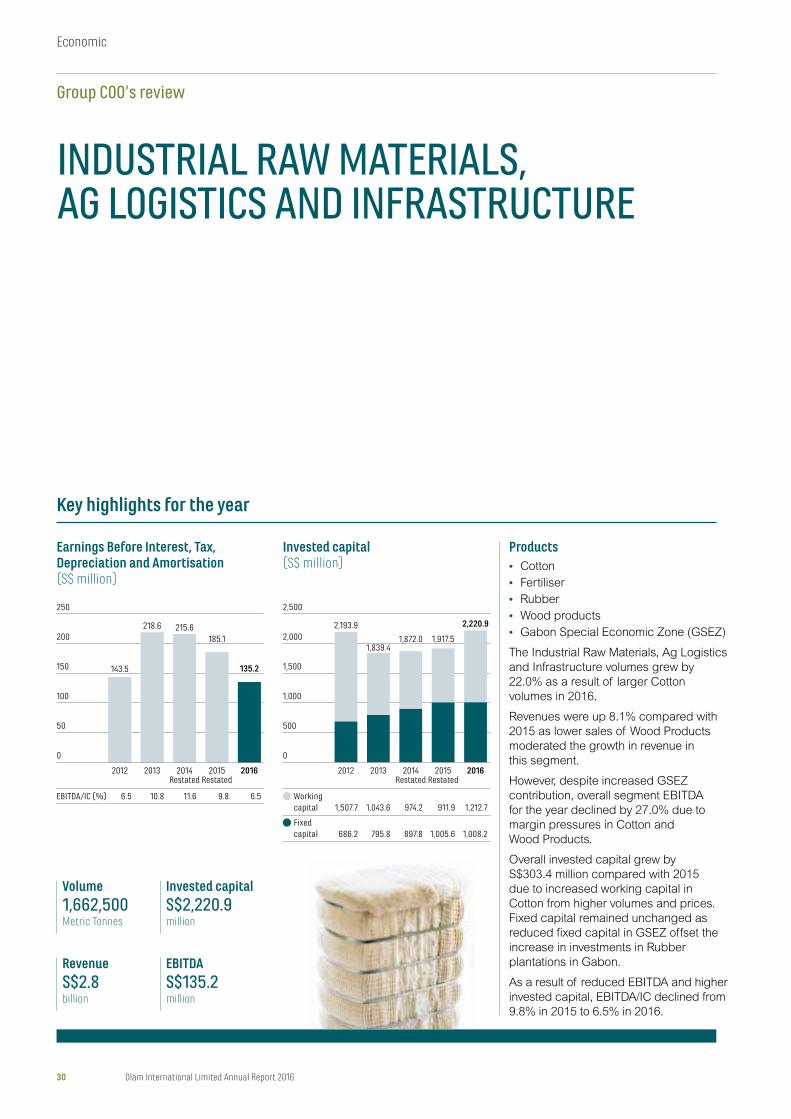
INDUSTRIAL RAW MATERIALS, AG LOGISTICS AND INFRASTRUCTURE
EBITDAS$135.2million
RevenueS$2.8billion
Volume1,662,500Metric Tonnes
Invested capitalS$2,220.9million
Key highlights for the year
Earnings Before Interest, Tax, Depreciation and Amortisation(S$ million)
Invested capital(S$ million)
Products• Cotton
• Fertiliser
• Rubber
• Wood products
• Gabon Special Economic Zone (GSEZ)
The Industrial Raw Materials, Ag Logistics
and Infrastructure volumes grew by
22.0% as a result of larger Cotton
volumes in 2016.
Revenues were up 8.1% compared with
2015 as lower sales of Wood Products
moderated the growth in revenue in
this segment.
However, despite increased GSEZ
contribution, overall segment EBITDA
for the year declined by 27.0% due to
margin pressures in Cotton and
Wood Products.
Overall invested capital grew by
S$303.4 million compared with 2015
due to increased working capital in
Cotton from higher volumes and prices.
Fixed capital remained unchanged as
reduced fixed capital in GSEZ offset the
increase in investments in Rubber
plantations in Gabon.
As a result of reduced EBITDA and higher
invested capital, EBITDA/IC declined from
9.8% in 2015 to 6.5% in 2016.
218.6
2012
215.6
0
50
100
150
200
250
2013 2014Restated
2015Restated
2016
EBITDA/IC (%) 6.5 10.8 11.6 9.8 6.5
143.5
185.1
135.2
2,220.9
0
500
1,000
1,500
2,000
2,500
2013 2014Restated
2015Restated
2016
2,193.9
2012
Workingcapital 1,507.7 1,043.6 974.2 911.9 1,212.7
Fixedcapital 686.2 795.8 897.8 1,005.6 1,008.2
1,872.0 1,917.51,839.4
30 Olam International Limited Annual Report 2016
Economic
Group COO’s review
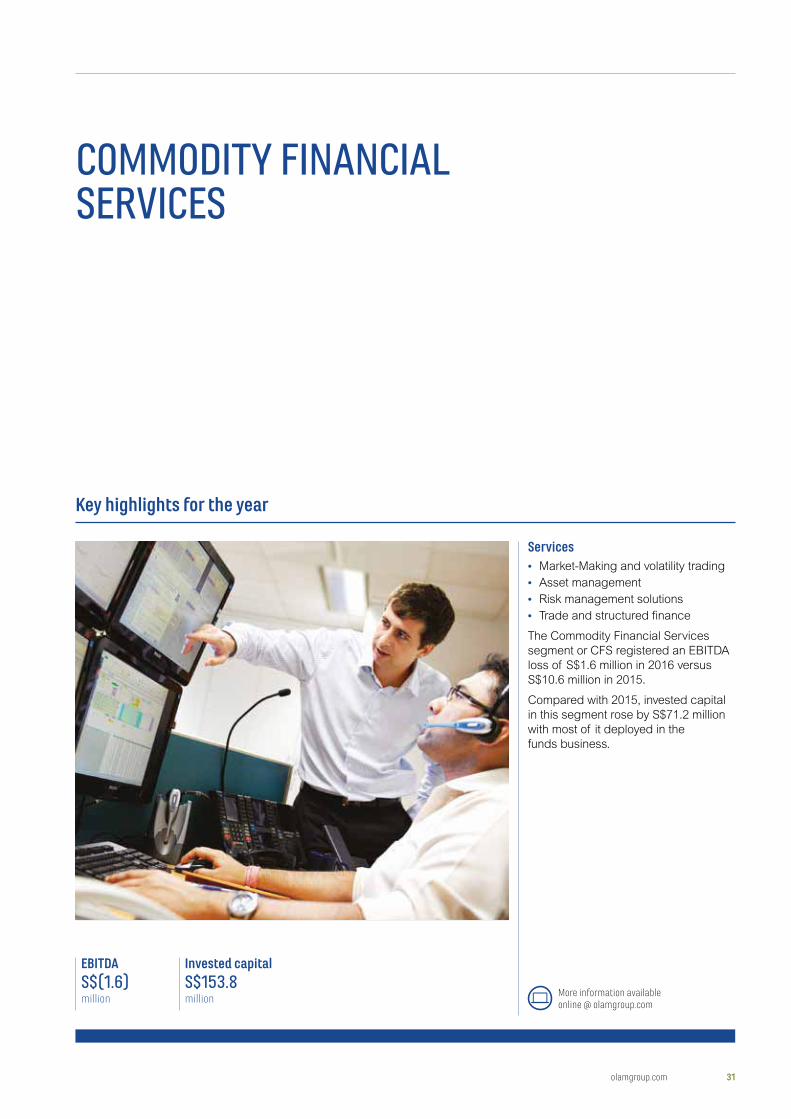
COMMODITY FINANCIAL SERVICES
EBITDAS$(1.6)million
Invested capitalS$153.8million
Key highlights for the year
Services• Market-Making and volatility trading
• Asset management
• Risk management solutions
• Trade and structured finance
The Commodity Financial Services
segment or CFS registered an EBITDA
loss of S$1.6 million in 2016 versus
S$10.6 million in 2015.
Compared with 2015, invested capital
in this segment rose by S$71.2 million
with most of it deployed in the
funds business.
More information available online @ olamgroup.com
olamgroup.com 31
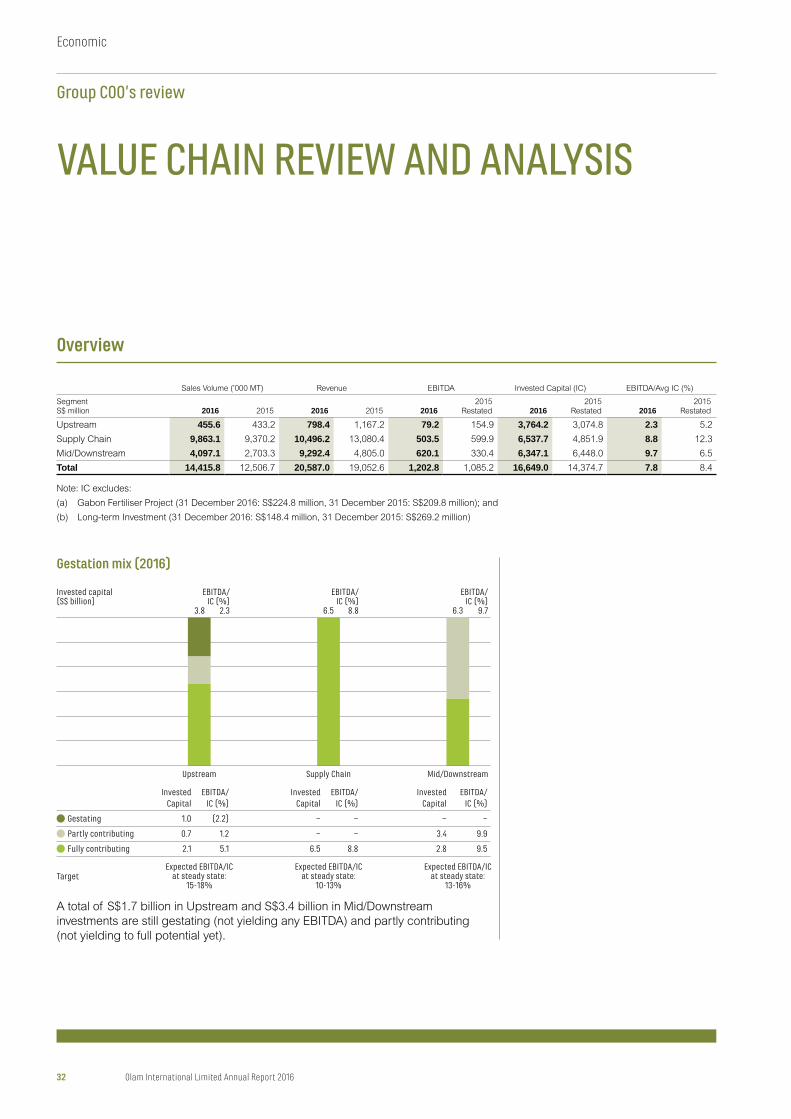
VALUE CHAIN REVIEW AND ANALYSIS
Sales Volume (’000 MT) Revenue EBITDA Invested Capital (IC) EBITDA/Avg IC (%)
SegmentS$ million 2016 2015 2016 2015 2016
2015 Restated 2016
2015 Restated 2016
2015 Restated
Upstream 455.6 433.2 798.4 1,167.2 79.2 154.9 3,764.2 3,074.8 2.3 5.2
Supply Chain 9,863.1 9,370.2 10,496.2 13,080.4 503.5 599.9 6,537.7 4,851.9 8.8 12.3
Mid/Downstream 4,097.1 2,703.3 9,292.4 4,805.0 620.1 330.4 6,347.1 6,448.0 9.7 6.5
Total 14,415.8 12,506.7 20,587.0 19,052.6 1,202.8 1,085.2 16,649.0 14,374.7 7.8 8.4
Note: IC excludes:
(a) Gabon Fertiliser Project (31 December 2016: S$224.8 million, 31 December 2015: S$209.8 million); and
(b) Long-term Investment (31 December 2016: S$148.4 million, 31 December 2015: S$269.2 million)
Upstream Supply Chain Mid/Downstream
Expected EBITDA/ICat steady state:
15-18%
Expected EBITDA/ICat steady state:
10-13%
Expected EBITDA/ICat steady state:
13-16%
Invested EBITDA/ Invested EBITDA/ Invested EBITDA/ Capital IC (%) Capital IC (%) Capital IC (%)
Gestating 1.0 (2.2) – – – –
Partly contributing 0.7 1.2 – – 3.4 9.9
Fully contributing 2.1 5.1 6.5 8.8 2.8 9.5
Target
3.8
EBITDA/IC (%)
8.86.5 6.3
EBITDA/IC (%)
9.7
EBITDA/IC (%)
2.3
Invested capital (S$ billion)
A total of S$1.7 billion in Upstream and S$3.4 billion in Mid/Downstream
investments are still gestating (not yielding any EBITDA) and partly contributing
(not yielding to full potential yet).
Gestation mix (2016)
Overview
32 Olam International Limited Annual Report 2016
Economic
Group COO’s review
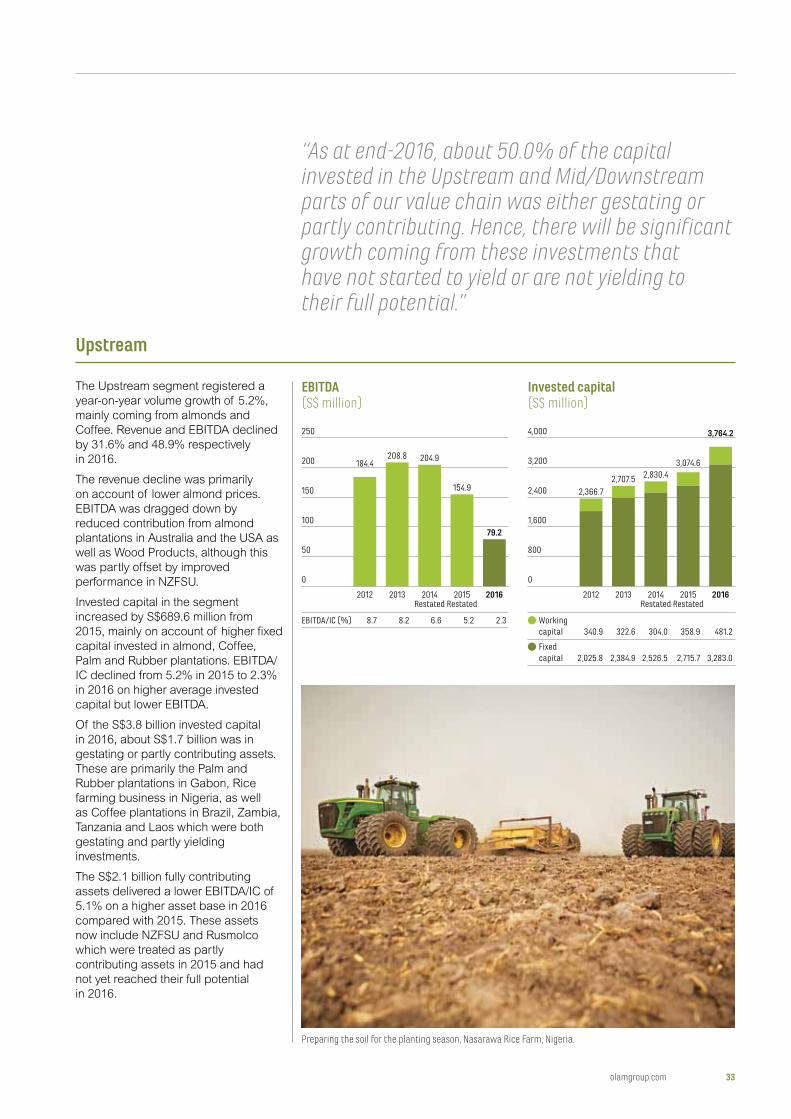
208.8
0
50
100
150
200
250
2012 2013 2014Restated
2015Restated
2016
EBITDA/IC (%) 8.7 8.2 6.6 5.2 2.3
204.9
154.9
79.2
184.4
0
800
1,600
2,400
3,200
4,000
2013 2014Restated
2015Restated
2016
Workingcapital 340.9 322.6 304.0 358.9 481.2
Fixedcapital 2,025.8 2,384.9 2,526.5 2,715.7 3,283.0
2012
2,707.5 2,830.4
2,366.7
3,074.6
3,764.2
The Upstream segment registered a
year-on-year volume growth of 5.2%,
mainly coming from almonds and
Coffee. Revenue and EBITDA declined
by 31.6% and 48.9% respectively
in 2016.
The revenue decline was primarily
on account of lower almond prices.
EBITDA was dragged down by
reduced contribution from almond
plantations in Australia and the USA as
well as Wood Products, although this
was partly offset by improved
performance in NZFSU.
Invested capital in the segment
increased by S$689.6 million from
2015, mainly on account of higher fixed
capital invested in almond, Coffee,
Palm and Rubber plantations. EBITDA/
IC declined from 5.2% in 2015 to 2.3%
in 2016 on higher average invested
capital but lower EBITDA.
Of the S$3.8 billion invested capital
in 2016, about S$1.7 billion was in
gestating or partly contributing assets.
These are primarily the Palm and
Rubber plantations in Gabon, Rice
farming business in Nigeria, as well
as Coffee plantations in Brazil, Zambia,
Tanzania and Laos which were both
gestating and partly yielding
investments.
The S$2.1 billion fully contributing
assets delivered a lower EBITDA/IC of
5.1% on a higher asset base in 2016
compared with 2015. These assets
now include NZFSU and Rusmolco
which were treated as partly
contributing assets in 2015 and had
not yet reached their full potential
in 2016.
Preparing the soil for the planting season, Nasarawa Rice Farm, Nigeria.
EBITDA (S$ million)
Invested capital(S$ million)
Upstream
“As at end-2016, about 50.0% of the capital invested in the Upstream and Mid/Downstream parts of our value chain was either gestating or partly contributing. Hence, there will be significant growth coming from these investments that have not started to yield or are not yielding to their full potential.”
olamgroup.com 33
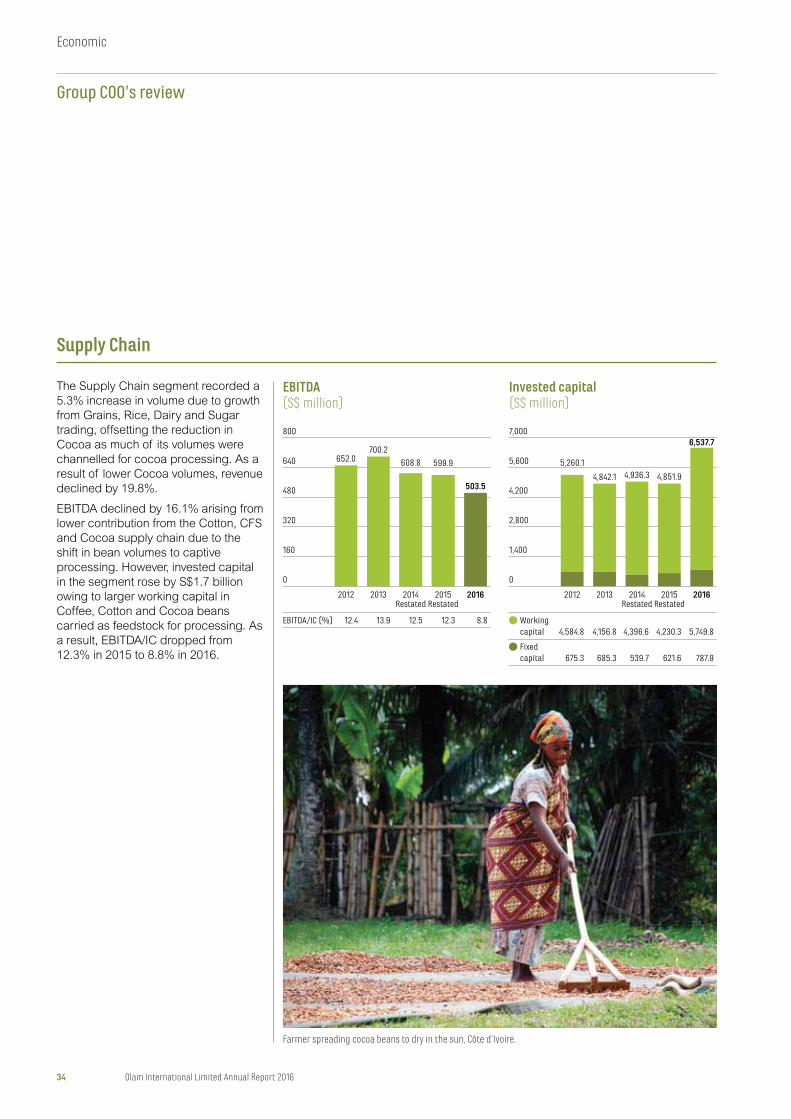
Farmer spreading cocoa beans to dry in the sun, Côte d’Ivoire.
The Supply Chain segment recorded a
5.3% increase in volume due to growth
from Grains, Rice, Dairy and Sugar
trading, offsetting the reduction in
Cocoa as much of its volumes were
channelled for cocoa processing. As a
result of lower Cocoa volumes, revenue
declined by 19.8%.
EBITDA declined by 16.1% arising from
lower contribution from the Cotton, CFS
and Cocoa supply chain due to the
shift in bean volumes to captive
processing. However, invested capital
in the segment rose by S$1.7 billion
owing to larger working capital in
Coffee, Cotton and Cocoa beans
carried as feedstock for processing. As
a result, EBITDA/IC dropped from
12.3% in 2015 to 8.8% in 2016.
652.0700.2
0
160
320
480
640
800
2012 2013 2014Restated
2015Restated
2016
EBITDA/IC (%) 12.4 13.9 12.5 12.3 8.8
503.5
608.8 599.9
4,851.9
0
1,400
2,800
4,200
5,600
7,000
2013 2014Restated
2015Restated
2016
Workingcapital 4,584.8 4,156.8 4,396.6 4,230.3 5,749.8
Fixedcapital 675.3 685.3 539.7 621.6 787.9
2012
4,842.1 4,936.35,260.1
6,537.7
EBITDA (S$ million)
Invested capital(S$ million)
Supply Chain
34 Olam International Limited Annual Report 2016
Economic
Group COO’s review
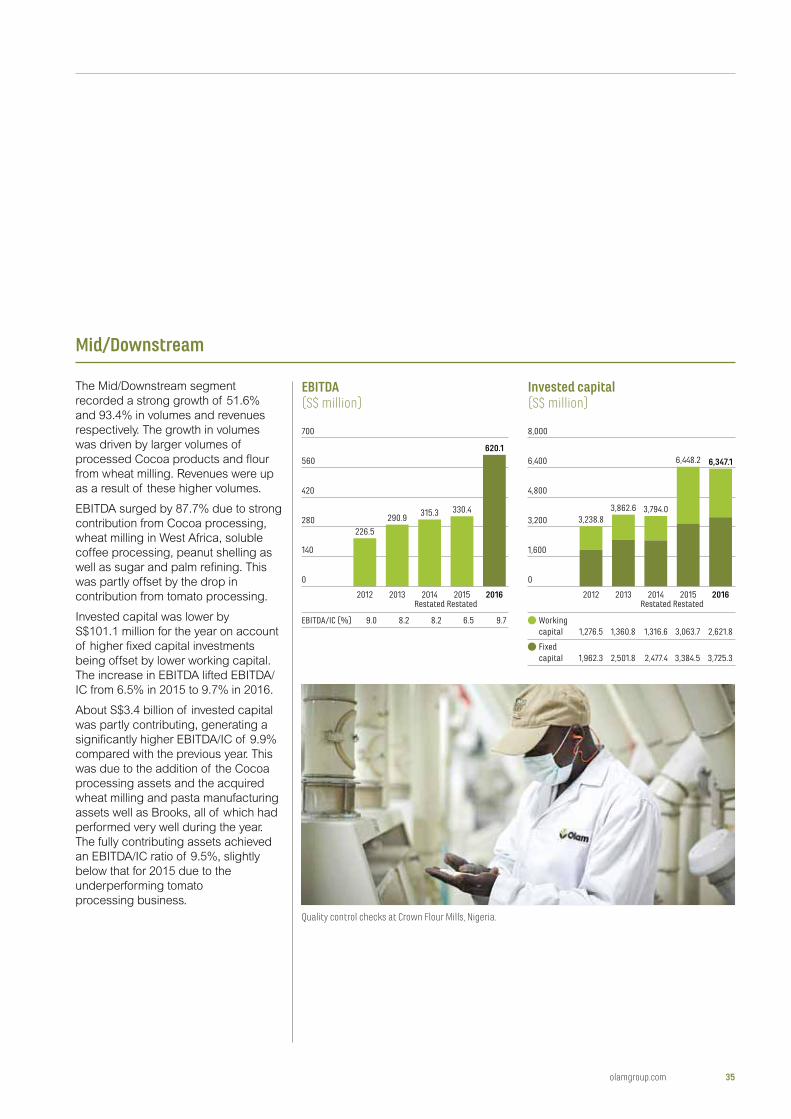
226.5
290.9
0
140
280
420
560
700
2012 2013 2014Restated
2015Restated
2016
EBITDA/IC (%) 9.0 8.2 8.2 6.5 9.7
315.3 330.4
620.16,448.2 6,347.1
0
1,600
3,200
4,800
6,400
8,000
2013 2014Restated
2015Restated
2016
Workingcapital 1,276.5 1,360.8 1,316.6 3,063.7 2,621.8
Fixedcapital 1,962.3 2,501.8 2,477.4 3,384.5 3,725.3
2012
3,862.6 3,794.03,238.8
The Mid/Downstream segment
recorded a strong growth of 51.6%
and 93.4% in volumes and revenues
respectively. The growth in volumes
was driven by larger volumes of
processed Cocoa products and flour
from wheat milling. Revenues were up
as a result of these higher volumes.
EBITDA surged by 87.7% due to strong
contribution from Cocoa processing,
wheat milling in West Africa, soluble
coffee processing, peanut shelling as
well as sugar and palm refining. This
was partly offset by the drop in
contribution from tomato processing.
Invested capital was lower by
S$101.1 million for the year on account
of higher fixed capital investments
being offset by lower working capital.
The increase in EBITDA lifted EBITDA/
IC from 6.5% in 2015 to 9.7% in 2016.
About S$3.4 billion of invested capital
was partly contributing, generating a
significantly higher EBITDA/IC of 9.9%
compared with the previous year. This
was due to the addition of the Cocoa
processing assets and the acquired
wheat milling and pasta manufacturing
assets well as Brooks, all of which had
performed very well during the year.
The fully contributing assets achieved
an EBITDA/IC ratio of 9.5%, slightly
below that for 2015 due to the
underperforming tomato
processing business.
EBITDA (S$ million)
Invested capital(S$ million)
Quality control checks at Crown Flour Mills, Nigeria.
Mid/Downstream
olamgroup.com 35
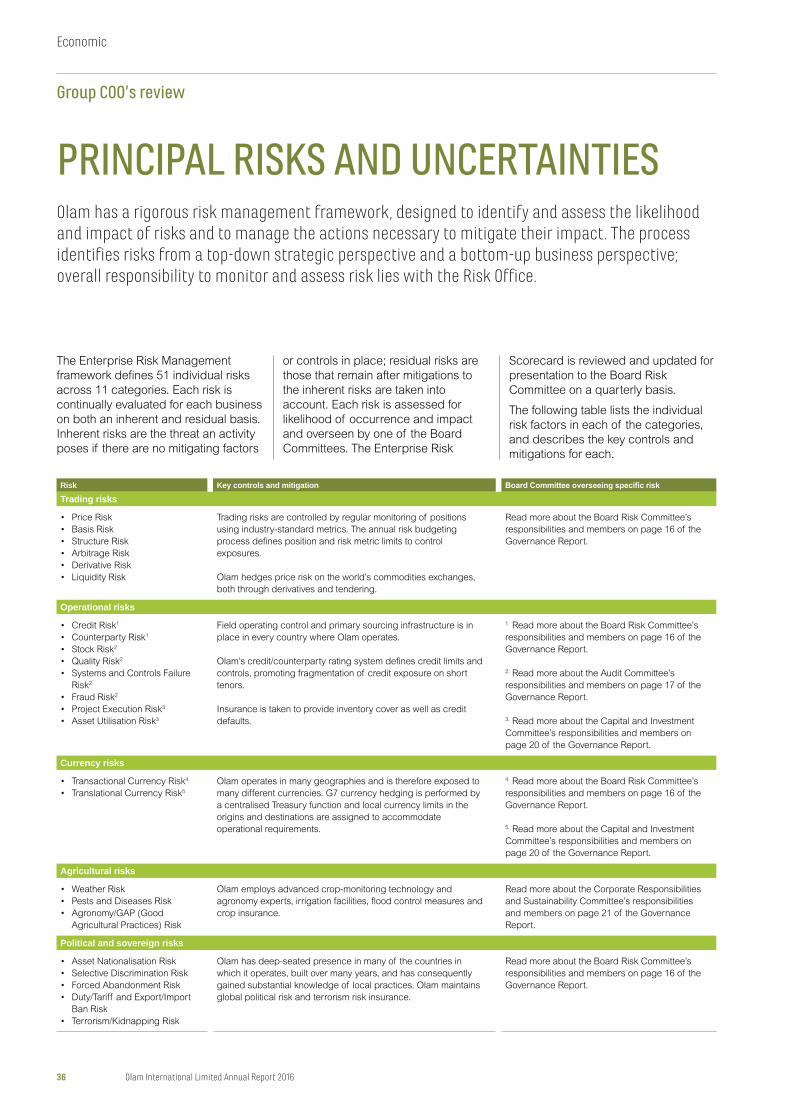
PRINCIPAL RISKS AND UNCERTAINTIESOlam has a rigorous risk management framework, designed to identify and assess the likelihood and impact of risks and to manage the actions necessary to mitigate their impact. The process identifies risks from a top-down strategic perspective and a bottom-up business perspective; overall responsibility to monitor and assess risk lies with the Risk Office.
Risk Key controls and mitigation
Trading risks
• Price Risk
• Basis Risk
• Structure Risk
• Arbitrage Risk
• Derivative Risk
• Liquidity Risk
Trading risks are controlled by regular monitoring of positions
using industry-standard metrics. The annual risk budgeting
process defines position and risk metric limits to control
exposures.
Olam hedges price risk on the world’s commodities exchanges,
both through derivatives and tendering.
Read more about the Board Risk Committee’s
responsibilities and members on page 16 of the
Governance Report.
Operational risks
• Credit Risk1
• Counterparty Risk1
• Stock Risk2
• Quality Risk2
• Systems and Controls Failure
Risk2
• Fraud Risk2
• Project Execution Risk3
• Asset Utilisation Risk3
Field operating control and primary sourcing infrastructure is in
place in every country where Olam operates.
Olam’s credit/counterparty rating system defines credit limits and
controls, promoting fragmentation of credit exposure on short
tenors.
Insurance is taken to provide inventory cover as well as credit
defaults.
1. Read more about the Board Risk Committee’s
responsibilities and members on page 16 of the
Governance Report.
2. Read more about the Audit Committee’s
responsibilities and members on page 17 of the
Governance Report.
3. Read more about the Capital and Investment
Committee’s responsibilities and members on
page 20 of the Governance Report.
Currency risks
• Transactional Currency Risk4
• Translational Currency Risk5
Olam operates in many geographies and is therefore exposed to
many different currencies. G7 currency hedging is performed by
a centralised Treasury function and local currency limits in the
origins and destinations are assigned to accommodate
operational requirements.
4. Read more about the Board Risk Committee’s
responsibilities and members on page 16 of the
Governance Report.
5. Read more about the Capital and Investment
Committee’s responsibilities and members on
page 20 of the Governance Report.
Agricultural risks
• Weather Risk
• Pests and Diseases Risk
• Agronomy/GAP (Good
Agricultural Practices) Risk
Olam employs advanced crop-monitoring technology and
agronomy experts, irrigation facilities, flood control measures and
crop insurance.
Read more about the Corporate Responsibilities
and Sustainability Committee’s responsibilities
and members on page 21 of the Governance
Report.
Political and sovereign risks
• Asset Nationalisation Risk
• Selective Discrimination Risk
• Forced Abandonment Risk
• Duty/Tariff and Export/Import
Ban Risk
• Terrorism/Kidnapping Risk
Olam has deep-seated presence in many of the countries in
which it operates, built over many years, and has consequently
gained substantial knowledge of local practices. Olam maintains
global political risk and terrorism risk insurance.
Read more about the Board Risk Committee’s
responsibilities and members on page 16 of the
Governance Report.
The Enterprise Risk Management
framework defines 51 individual risks
across 11 categories. Each risk is
continually evaluated for each business
on both an inherent and residual basis.
Inherent risks are the threat an activity
poses if there are no mitigating factors
or controls in place; residual risks are
those that remain after mitigations to
the inherent risks are taken into
account. Each risk is assessed for
likelihood of occurrence and impact
and overseen by one of the Board
Committees. The Enterprise Risk
Scorecard is reviewed and updated for
presentation to the Board Risk
Committee on a quarterly basis.
The following table lists the individual
risk factors in each of the categories,
and describes the key controls and
mitigations for each.
36 Olam International Limited Annual Report 2016
Economic
Group COO’s review
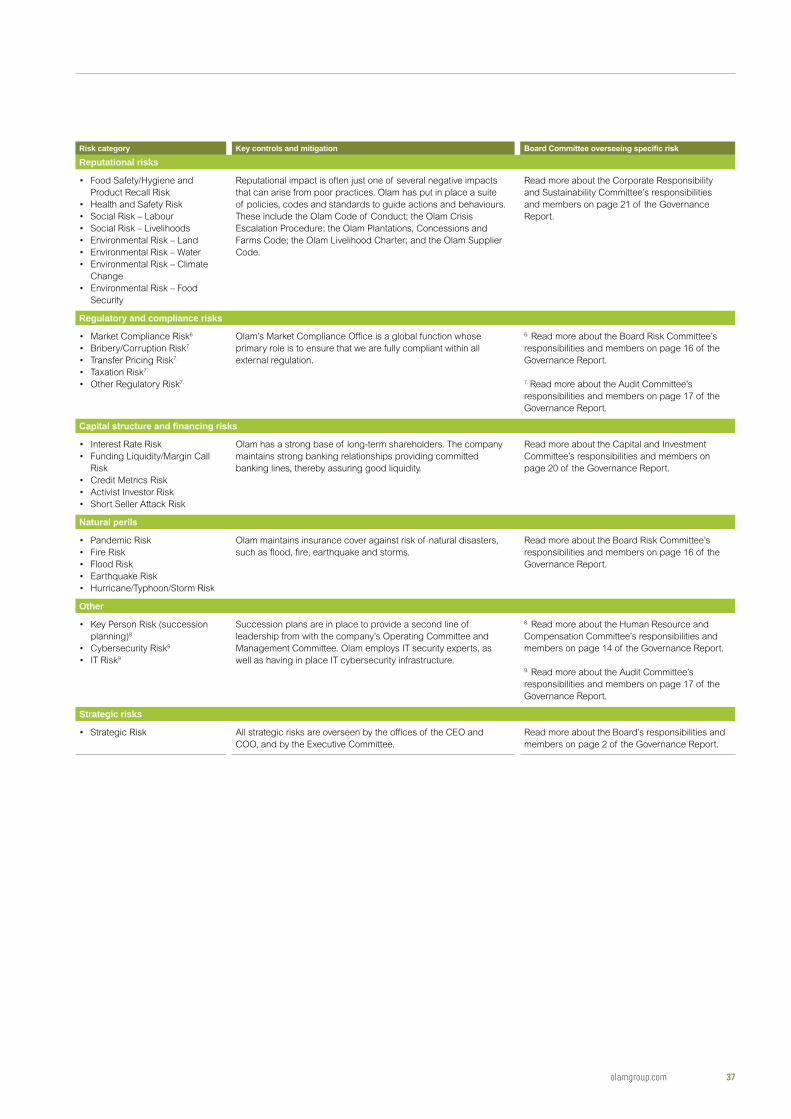
Risk category Key controls and mitigation
Reputational risks
• Food Safety/Hygiene and
Product Recall Risk
• Health and Safety Risk
• Social Risk – Labour
• Social Risk – Livelihoods
• Environmental Risk – Land
• Environmental Risk – Water
• Environmental Risk – Climate
Change
• Environmental Risk – Food
Security
Reputational impact is often just one of several negative impacts
that can arise from poor practices. Olam has put in place a suite
of policies, codes and standards to guide actions and behaviours.
These include the Olam Code of Conduct; the Olam Crisis
Escalation Procedure; the Olam Plantations, Concessions and
Farms Code; the Olam Livelihood Charter; and the Olam Supplier
Code.
Read more about the Corporate Responsibility
and Sustainability Committee’s responsibilities
and members on page 21 of the Governance
Report.
Regulatory and compliance risks
• Market Compliance Risk6
• Bribery/Corruption Risk7.
• Transfer Pricing Risk7.
• Taxation Risk7.
• Other Regulatory Risk7.
Olam’s Market Compliance Office is a global function whose
primary role is to ensure that we are fully compliant within all
external regulation.
6. Read more about the Board Risk Committee’s
responsibilities and members on page 16 of the
Governance Report.
7. Read more about the Audit Committee’s
responsibilities and members on page 17 of the
Governance Report.
• Interest Rate Risk
• Funding Liquidity/Margin Call
Risk
• Credit Metrics Risk
• Activist Investor Risk
• Short Seller Attack Risk
Olam has a strong base of long-term shareholders. The company
maintains strong banking relationships providing committed
banking lines, thereby assuring good liquidity.
Read more about the Capital and Investment
Committee’s responsibilities and members on
page 20 of the Governance Report.
• Pandemic Risk
• Fire Risk
• Flood Risk
• Earthquake Risk
• Hurricane/Typhoon/Storm Risk
Olam maintains insurance cover against risk of natural disasters,
such as flood, fire, earthquake and storms.
Read more about the Board Risk Committee’s
responsibilities and members on page 16 of the
Governance Report.
Other
• Key Person Risk (succession
planning)8
• Cybersecurity Risk9
• IT Risk9
Succession plans are in place to provide a second line of
leadership from with the company’s Operating Committee and
Management Committee. Olam employs IT security experts, as
well as having in place IT cybersecurity infrastructure.
8. Read more about the Human Resource and
Compensation Committee’s responsibilities and
members on page 14 of the Governance Report.
9. Read more about the Audit Committee’s
responsibilities and members on page 17 of the
Governance Report.
Strategic risks
• Strategic Risk All strategic risks are overseen by the offices of the CEO and
COO, and by the Executive Committee.
Read more about the Board’s responsibilities and
members on page 2 of the Governance Report.
olamgroup.com 37
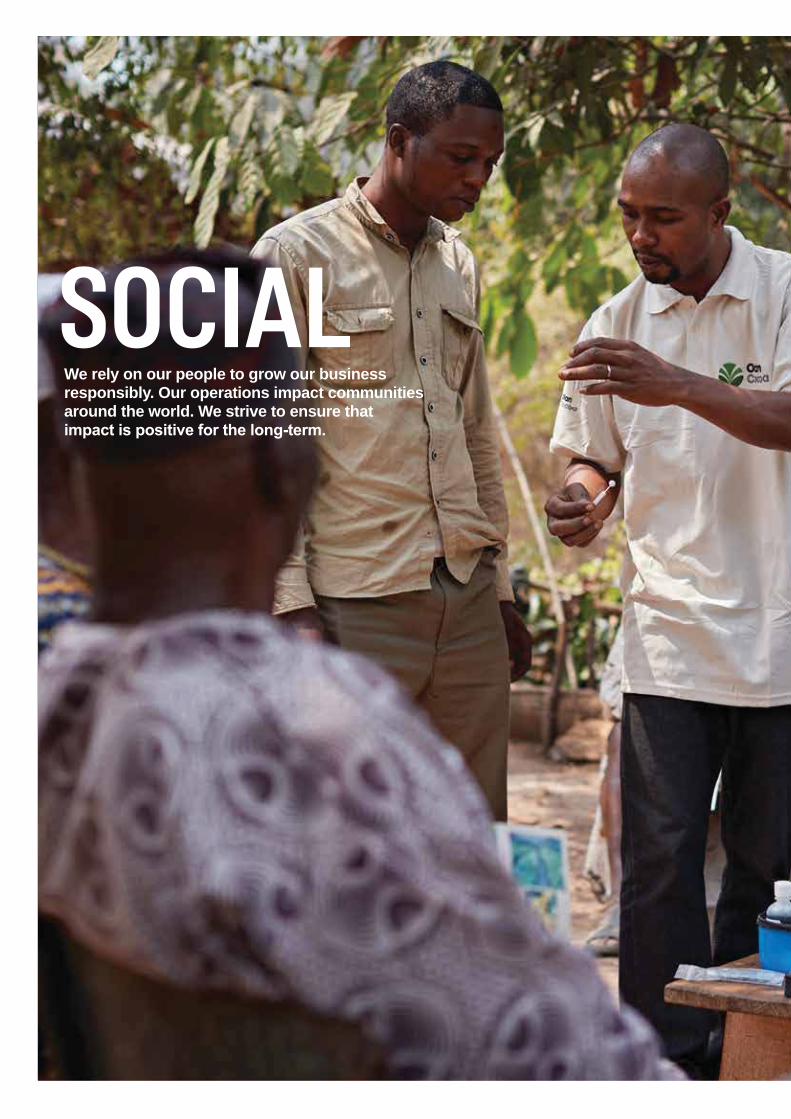
SOCIAL We rely on our people to grow our business responsibly. Our operations impact communities around the world. We strive to ensure that
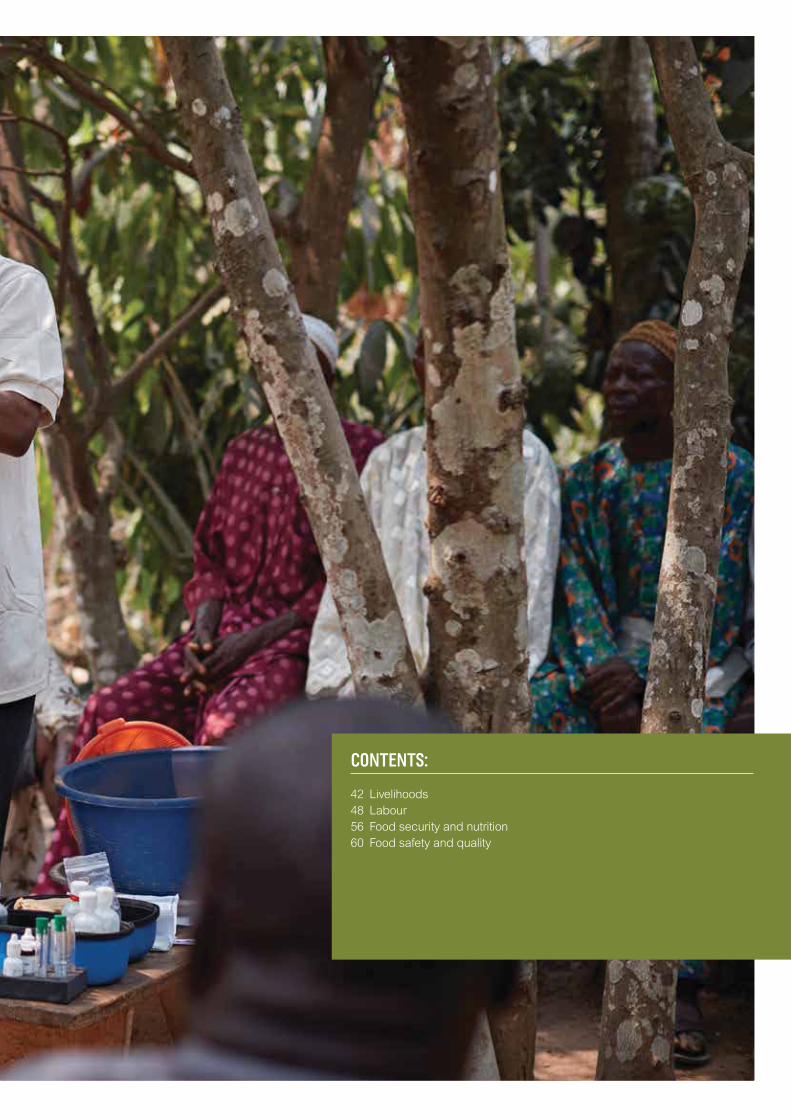
CONTENTS:
42 Livelihoods
48 Labour
56 Food security and nutrition
60 Food safety and quality
This section explores our achievements and challenges in 4 of our material areas which focus particularly on social impacts: livelihoods, labour, food security and nutrition, and food safety and quality.
Livelihoods42
Food security and nutrition
56
Labour48
Food safety and quality
60
40 Olam International Limited Annual Report 2016
Social
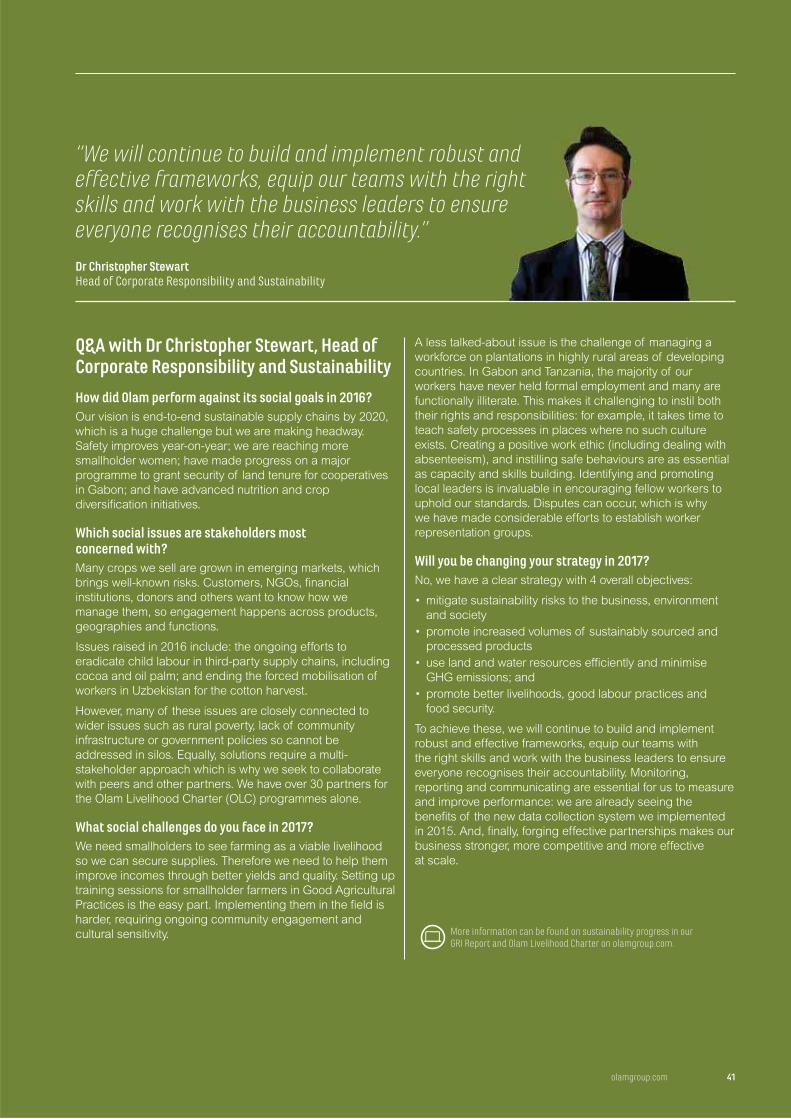
Q&A with Dr Christopher Stewart, Head of Corporate Responsibility and Sustainability
How did Olam perform against its social goals in 2016?Our vision is end-to-end sustainable supply chains by 2020,
which is a huge challenge but we are making headway.
Safety improves year-on-year; we are reaching more
smallholder women; have made progress on a major
programme to grant security of land tenure for cooperatives
in Gabon; and have advanced nutrition and crop
diversification initiatives.
Which social issues are stakeholders most concerned with?Many crops we sell are grown in emerging markets, which
brings well-known risks. Customers, NGOs, financial
institutions, donors and others want to know how we
manage them, so engagement happens across products,
geographies and functions.
Issues raised in 2016 include: the ongoing efforts to
eradicate child labour in third-party supply chains, including
cocoa and oil palm; and ending the forced mobilisation of
workers in Uzbekistan for the cotton harvest.
However, many of these issues are closely connected to
wider issues such as rural poverty, lack of community
infrastructure or government policies so cannot be
addressed in silos. Equally, solutions require a multi-
stakeholder approach which is why we seek to collaborate
with peers and other partners. We have over 30 partners for
the Olam Livelihood Charter (OLC) programmes alone.
What social challenges do you face in 2017?We need smallholders to see farming as a viable livelihood
so we can secure supplies. Therefore we need to help them
improve incomes through better yields and quality. Setting up
training sessions for smallholder farmers in Good Agricultural
Practices is the easy part. Implementing them in the field is
harder, requiring ongoing community engagement and
cultural sensitivity.
A less talked-about issue is the challenge of managing a
workforce on plantations in highly rural areas of developing
countries. In Gabon and Tanzania, the majority of our
workers have never held formal employment and many are
functionally illiterate. This makes it challenging to instil both
their rights and responsibilities: for example, it takes time to
teach safety processes in places where no such culture
exists. Creating a positive work ethic (including dealing with
absenteeism), and instilling safe behaviours are as essential
as capacity and skills building. Identifying and promoting
local leaders is invaluable in encouraging fellow workers to
uphold our standards. Disputes can occur, which is why
we have made considerable efforts to establish worker
representation groups.
Will you be changing your strategy in 2017?No, we have a clear strategy with 4 overall objectives:
• mitigate sustainability risks to the business, environment
and society
• promote increased volumes of sustainably sourced and
processed products
• use land and water resources efficiently and minimise
GHG emissions; and
• promote better livelihoods, good labour practices and
food security.
To achieve these, we will continue to build and implement
robust and effective frameworks, equip our teams with
the right skills and work with the business leaders to ensure
everyone recognises their accountability. Monitoring,
reporting and communicating are essential for us to measure
and improve performance: we are already seeing the
benefits of the new data collection system we implemented
in 2015. And, finally, forging effective partnerships makes our
business stronger, more competitive and more effective
at scale.
“We will continue to build and implement robust and effective frameworks, equip our teams with the right skills and work with the business leaders to ensure everyone recognises their accountability.”
Dr Christopher StewartHead of Corporate Responsibility and Sustainability
d ht
olamgroup.com 41
More information can be found on sustainability progress in our GRI Report and Olam Livelihood Charter on olamgroup.com.
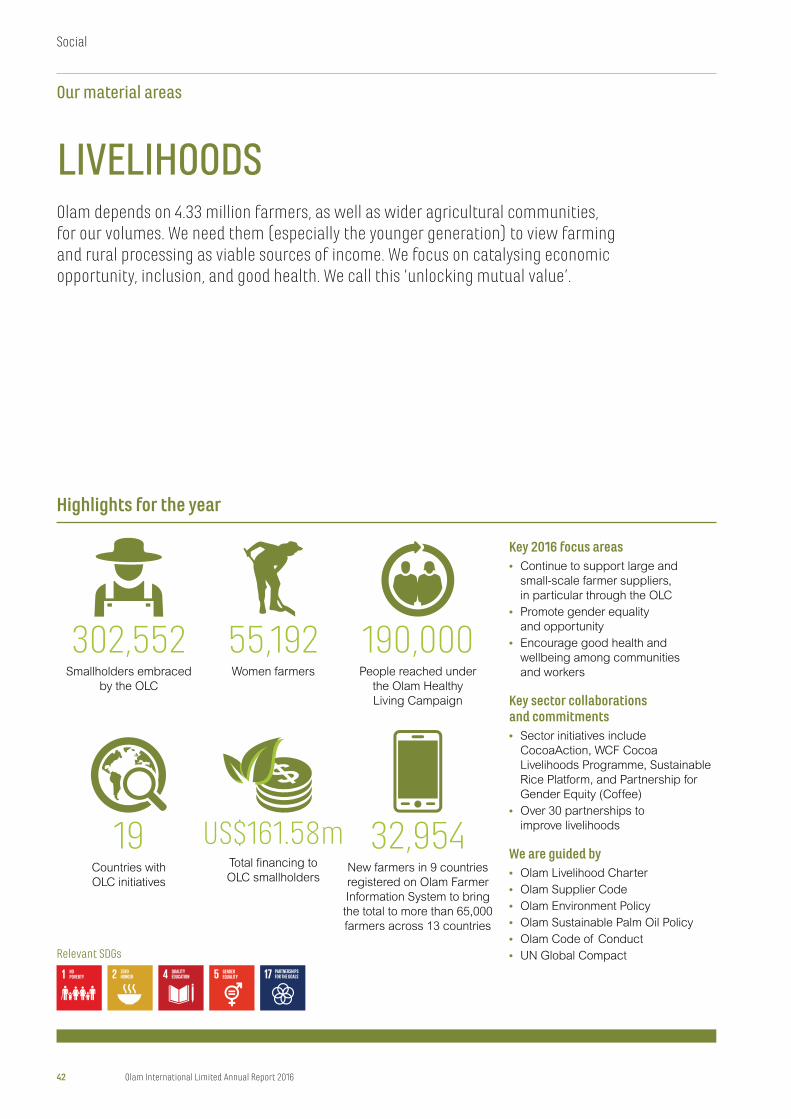
LIVELIHOODSOlam depends on 4.33 million farmers, as well as wider agricultural communities, for our volumes. We need them (especially the younger generation) to view farming and rural processing as viable sources of income. We focus on catalysing economic opportunity, inclusion, and good health. We call this ‘unlocking mutual value’.
Highlights for the year
Key 2016 focus areas• Continue to support large and
small-scale farmer suppliers,
in particular through the OLC
• Promote gender equality
and opportunity
• Encourage good health and
wellbeing among communities
and workers
Key sector collaborations and commitments• Sector initiatives include
CocoaAction, WCF Cocoa
Livelihoods Programme, Sustainable
Rice Platform, and Partnership for
Gender Equity (Coffee)
• Over 30 partnerships to
improve livelihoods
We are guided by• Olam Livelihood Charter
• Olam Supplier Code
• Olam Environment Policy
• Olam Sustainable Palm Oil Policy
• Olam Code of Conduct
• UN Global Compact
302,552Smallholders embraced
by the OLC
19Countries with
OLC initiatives
55,192Women farmers
US$161.58mTotal financing to
OLC smallholders
190,000People reached under
the Olam Healthy
Living Campaign
32,954New farmers in 9 countries
registered on Olam Farmer
Information System to bring
the total to more than 65,000
farmers across 13 countries
Relevant SDGs
42 Olam International Limited Annual Report 2016
Social
Our material areas
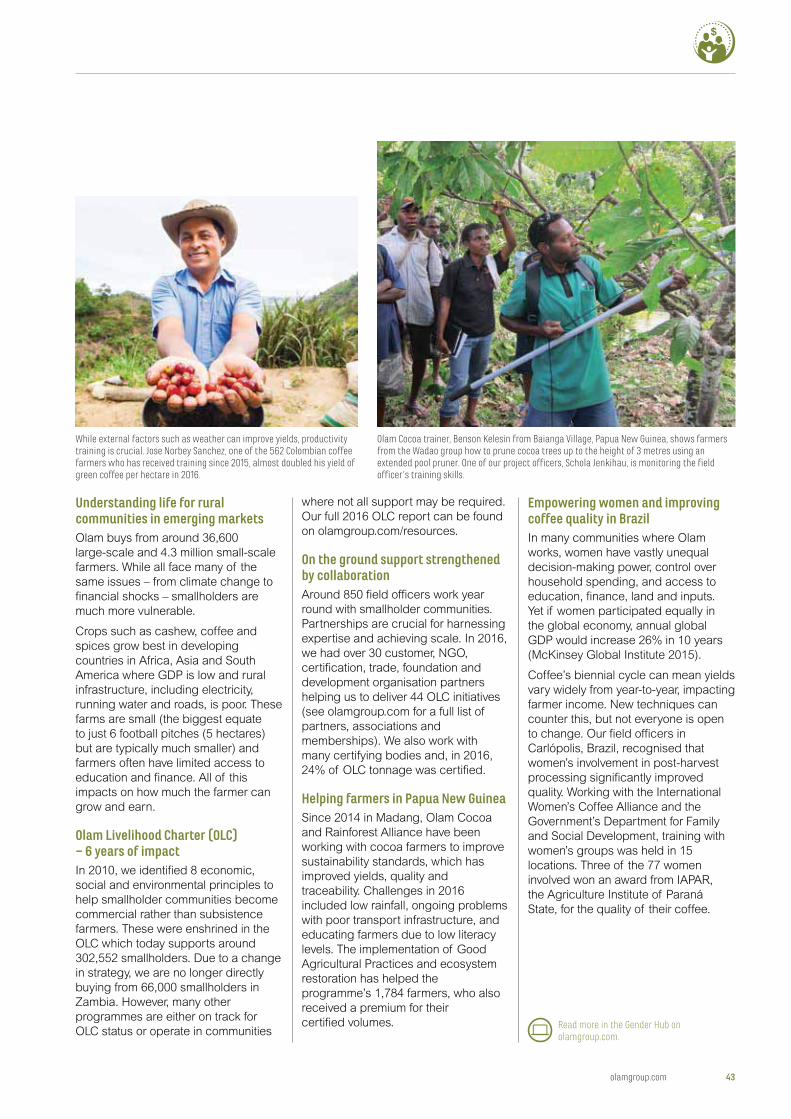
Empowering women and improving coffee quality in BrazilIn many communities where Olam
works, women have vastly unequal
decision-making power, control over
household spending, and access to
education, finance, land and inputs.
Yet if women participated equally in
the global economy, annual global
GDP would increase 26% in 10 years
(McKinsey Global Institute 2015).
Coffee’s biennial cycle can mean yields
vary widely from year-to-year, impacting
farmer income. New techniques can
counter this, but not everyone is open
to change. Our field officers in
Carlópolis, Brazil, recognised that
women’s involvement in post-harvest
processing significantly improved
quality. Working with the International
Women’s Coffee Alliance and the
Government’s Department for Family
and Social Development, training with
women’s groups was held in 15
locations. Three of the 77 women
involved won an award from IAPAR,
the Agriculture Institute of Paraná
State, for the quality of their coffee.
Understanding life for rural communities in emerging marketsOlam buys from around 36,600
large-scale and 4.3 million small-scale
farmers. While all face many of the
same issues – from climate change to
financial shocks – smallholders are
much more vulnerable.
Crops such as cashew, coffee and
spices grow best in developing
countries in Africa, Asia and South
America where GDP is low and rural
infrastructure, including electricity,
running water and roads, is poor. These
farms are small (the biggest equate
to just 6 football pitches (5 hectares)
but are typically much smaller) and
farmers often have limited access to
education and finance. All of this
impacts on how much the farmer can
grow and earn.
Olam Livelihood Charter (OLC) – 6 years of impactIn 2010, we identified 8 economic,
social and environmental principles to
help smallholder communities become
commercial rather than subsistence
farmers. These were enshrined in the
OLC which today supports around
302,552 smallholders. Due to a change
in strategy, we are no longer directly
buying from 66,000 smallholders in
Zambia. However, many other
programmes are either on track for
OLC status or operate in communities
where not all support may be required.
Our full 2016 OLC report can be found
on olamgroup.com/resources.
On the ground support strengthened by collaborationAround 850 field officers work year
round with smallholder communities.
Partnerships are crucial for harnessing
expertise and achieving scale. In 2016,
we had over 30 customer, NGO,
certification, trade, foundation and
development organisation partners
helping us to deliver 44 OLC initiatives
(see olamgroup.com for a full list of
partners, associations and
memberships). We also work with
many certifying bodies and, in 2016,
24% of OLC tonnage was certified.
Helping farmers in Papua New Guinea Since 2014 in Madang, Olam Cocoa
and Rainforest Alliance have been
working with cocoa farmers to improve
sustainability standards, which has
improved yields, quality and
traceability. Challenges in 2016
included low rainfall, ongoing problems
with poor transport infrastructure, and
educating farmers due to low literacy
levels. The implementation of Good
Agricultural Practices and ecosystem
restoration has helped the
programme’s 1,784 farmers, who also
received a premium for their
certified volumes.
While external factors such as weather can improve yields, productivity training is crucial. Jose Norbey Sanchez, one of the 562 Colombian coffee farmers who has received training since 2015, almost doubled his yield of green coffee per hectare in 2016.
Olam Cocoa trainer, Benson Kelesin from Baianga Village, Papua New Guinea, shows farmers from the Wadao group how to prune cocoa trees up to the height of 3 metres using an extended pool pruner. One of our project officers, Schola Jenkihau, is monitoring the field officer’s training skills.
Read more in the Gender Hub on olamgroup.com.
olamgroup.com 43
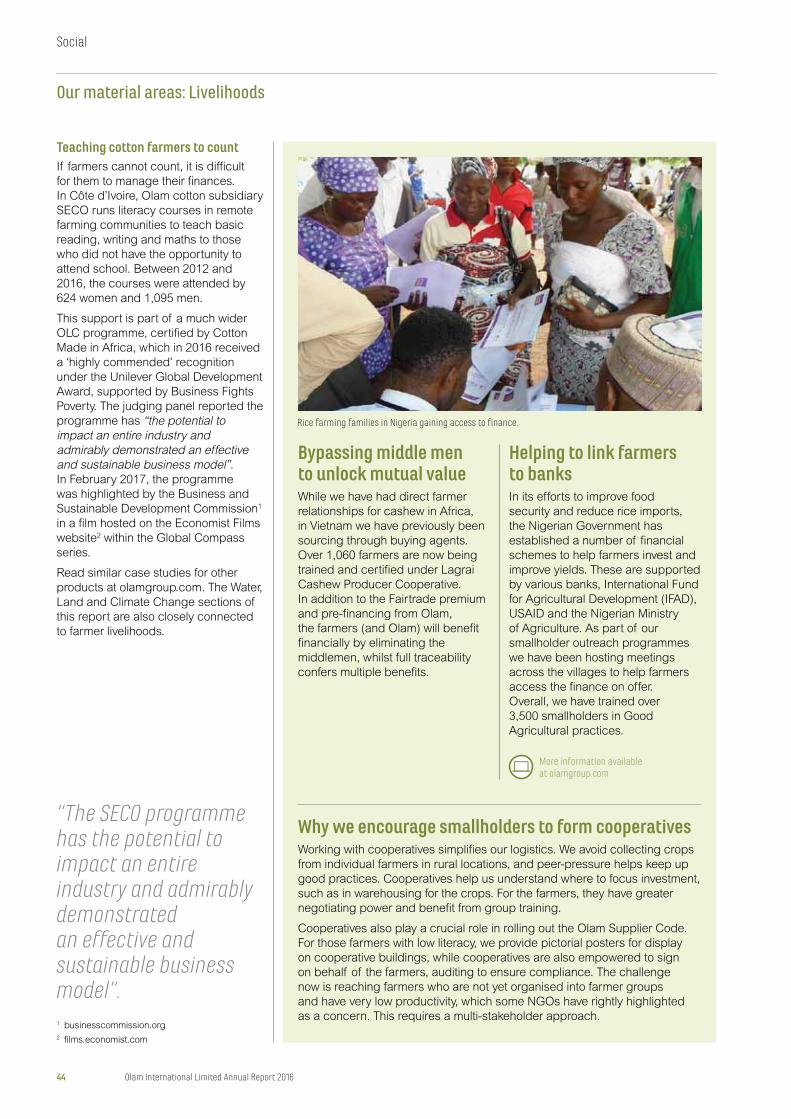
Teaching cotton farmers to count If farmers cannot count, it is difficult
for them to manage their finances.
In Côte d’Ivoire, Olam cotton subsidiary
SECO runs literacy courses in remote
farming communities to teach basic
reading, writing and maths to those
who did not have the opportunity to
attend school. Between 2012 and
2016, the courses were attended by
624 women and 1,095 men.
This support is part of a much wider
OLC programme, certified by Cotton
Made in Africa, which in 2016 received
a ‘highly commended’ recognition
under the Unilever Global Development
Award, supported by Business Fights
Poverty. The judging panel reported the
programme has “the potential to impact an entire industry and admirably demonstrated an effective and sustainable business model”. In February 2017, the programme
was highlighted by the Business and
Sustainable Development Commission1
in a film hosted on the Economist Films
website2 within the Global Compass
series.
Read similar case studies for other
products at olamgroup.com. The Water,
Land and Climate Change sections of
this report are also closely connected
to farmer livelihoods.
Why we encourage smallholders to form cooperatives Working with cooperatives simplifies our logistics. We avoid collecting crops
from individual farmers in rural locations, and peer-pressure helps keep up
good practices. Cooperatives help us understand where to focus investment,
such as in warehousing for the crops. For the farmers, they have greater
negotiating power and benefit from group training.
Cooperatives also play a crucial role in rolling out the Olam Supplier Code.
For those farmers with low literacy, we provide pictorial posters for display
on cooperative buildings, while cooperatives are also empowered to sign
on behalf of the farmers, auditing to ensure compliance. The challenge
now is reaching farmers who are not yet organised into farmer groups
and have very low productivity, which some NGOs have rightly highlighted
as a concern. This requires a multi-stakeholder approach.
Rice farming families in Nigeria gaining access to finance.
Bypassing middle men to unlock mutual value While we have had direct farmer
relationships for cashew in Africa,
in Vietnam we have previously been
sourcing through buying agents.
Over 1,060 farmers are now being
trained and certified under Lagrai
Cashew Producer Cooperative.
In addition to the Fairtrade premium
and pre-financing from Olam,
the farmers (and Olam) will benefit
financially by eliminating the
middlemen, whilst full traceability
confers multiple benefits.
Helping to link farmers to banksIn its efforts to improve food
security and reduce rice imports,
the Nigerian Government has
established a number of financial
schemes to help farmers invest and
improve yields. These are supported
by various banks, International Fund
for Agricultural Development (IFAD),
USAID and the Nigerian Ministry
of Agriculture. As part of our
smallholder outreach programmes
we have been hosting meetings
across the villages to help farmers
access the finance on offer.
Overall, we have trained over
3,500 smallholders in Good
Agricultural practices.
More information available at olamgroup.com
1 businesscommission.org
2 films.economist.com
“The SECO programme has the potential to impact an entire industry and admirably demonstrated an effective and sustainable business model”.
44 Olam International Limited Annual Report 2016
Social
Our material areas: Livelihoods
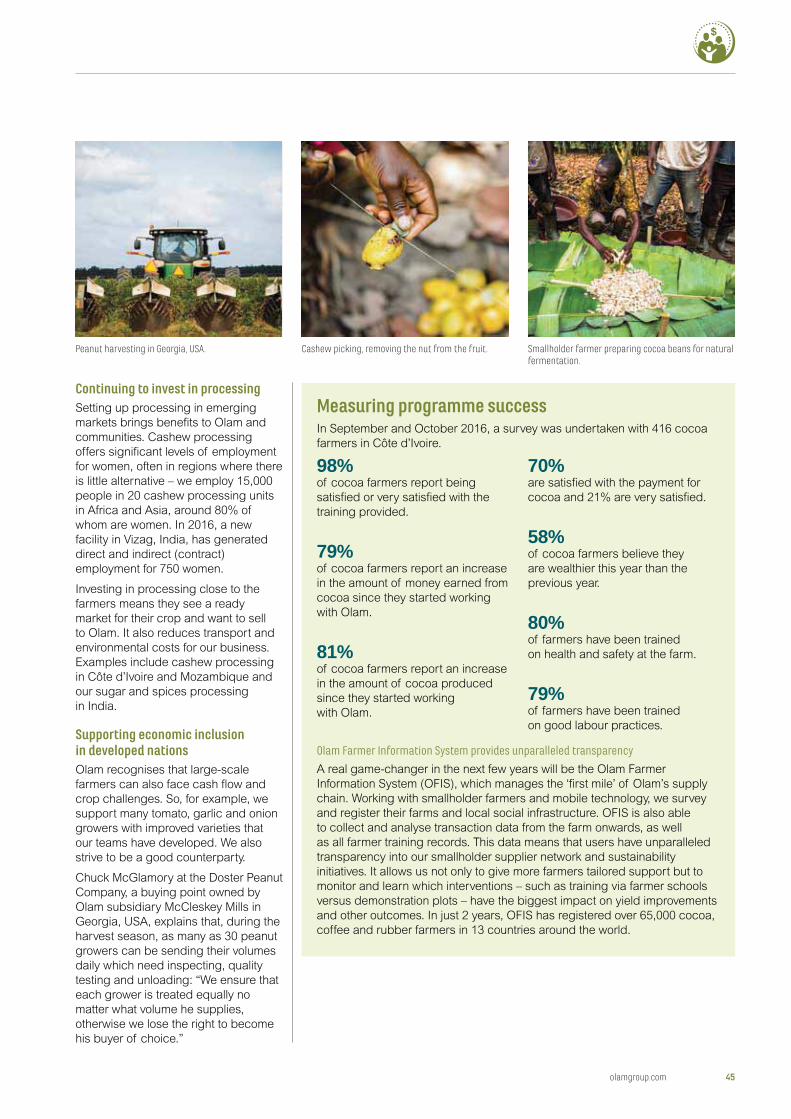
Measuring programme successIn September and October 2016, a survey was undertaken with 416 cocoa
farmers in Côte d’Ivoire.
Continuing to invest in processingSetting up processing in emerging
markets brings benefits to Olam and
communities. Cashew processing
offers significant levels of employment
for women, often in regions where there
is little alternative – we employ 15,000
people in 20 cashew processing units
in Africa and Asia, around 80% of
whom are women. In 2016, a new
facility in Vizag, India, has generated
direct and indirect (contract)
employment for 750 women.
Investing in processing close to the
farmers means they see a ready
market for their crop and want to sell
to Olam. It also reduces transport and
environmental costs for our business.
Examples include cashew processing
in Côte d’Ivoire and Mozambique and
our sugar and spices processing
in India.
Supporting economic inclusion in developed nations Olam recognises that large-scale
farmers can also face cash flow and
crop challenges. So, for example, we
support many tomato, garlic and onion
growers with improved varieties that
our teams have developed. We also
strive to be a good counterparty.
Chuck McGlamory at the Doster Peanut
Company, a buying point owned by
Olam subsidiary McCleskey Mills in
Georgia, USA, explains that, during the
harvest season, as many as 30 peanut
growers can be sending their volumes
daily which need inspecting, quality
testing and unloading: “We ensure that
each grower is treated equally no
matter what volume he supplies,
otherwise we lose the right to become
his buyer of choice.”
Peanut harvesting in Georgia, USA. Cashew picking, removing the nut from the fruit. Smallholder farmer preparing cocoa beans for natural fermentation.
98%of cocoa farmers report being
satisfied or very satisfied with the
training provided.
79%of cocoa farmers report an increase
in the amount of money earned from
cocoa since they started working
with Olam.
81%of cocoa farmers report an increase
in the amount of cocoa produced
since they started working
with Olam.
70%are satisfied with the payment for
cocoa and 21% are very satisfied.
58%of cocoa farmers believe they
are wealthier this year than the
previous year.
80%of farmers have been trained
on health and safety at the farm.
79%of farmers have been trained
on good labour practices.
Olam Farmer Information System provides unparalleled transparency
A real game-changer in the next few years will be the Olam Farmer
Information System (OFIS), which manages the ‘first mile’ of Olam’s supply
chain. Working with smallholder farmers and mobile technology, we survey
and register their farms and local social infrastructure. OFIS is also able
to collect and analyse transaction data from the farm onwards, as well
as all farmer training records. This data means that users have unparalleled
transparency into our smallholder supplier network and sustainability
initiatives. It allows us not only to give more farmers tailored support but to
monitor and learn which interventions – such as training via farmer schools
versus demonstration plots – have the biggest impact on yield improvements
and other outcomes. In just 2 years, OFIS has registered over 65,000 cocoa,
coffee and rubber farmers in 13 countries around the world.
olamgroup.com 45
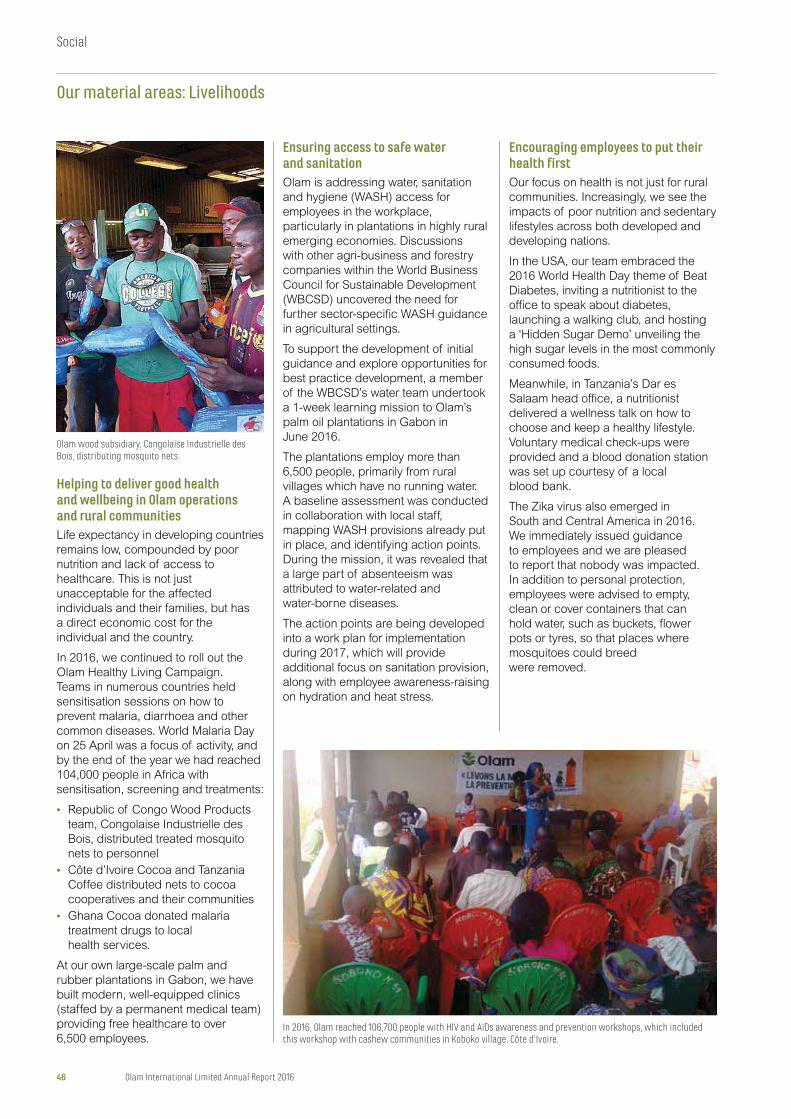
Helping to deliver good health and wellbeing in Olam operations and rural communitiesLife expectancy in developing countries
remains low, compounded by poor
nutrition and lack of access to
healthcare. This is not just
unacceptable for the affected
individuals and their families, but has
a direct economic cost for the
individual and the country.
In 2016, we continued to roll out the
Olam Healthy Living Campaign.
Teams in numerous countries held
sensitisation sessions on how to
prevent malaria, diarrhoea and other
common diseases. World Malaria Day
on 25 April was a focus of activity, and
by the end of the year we had reached
104,000 people in Africa with
sensitisation, screening and treatments:
• Republic of Congo Wood Products
team, Congolaise Industrielle des
Bois, distributed treated mosquito
nets to personnel
• Côte d’Ivoire Cocoa and Tanzania
Coffee distributed nets to cocoa
cooperatives and their communities
• Ghana Cocoa donated malaria
treatment drugs to local
health services.
At our own large-scale palm and
rubber plantations in Gabon, we have
built modern, well-equipped clinics
(staffed by a permanent medical team)
providing free healthcare to over
6,500 employees.
Ensuring access to safe water and sanitationOlam is addressing water, sanitation
and hygiene (WASH) access for
employees in the workplace,
particularly in plantations in highly rural
emerging economies. Discussions
with other agri-business and forestry
companies within the World Business
Council for Sustainable Development
(WBCSD) uncovered the need for
further sector-specific WASH guidance
in agricultural settings.
To support the development of initial
guidance and explore opportunities for
best practice development, a member
of the WBCSD’s water team undertook
a 1-week learning mission to Olam’s
palm oil plantations in Gabon in
June 2016.
The plantations employ more than
6,500 people, primarily from rural
villages which have no running water.
A baseline assessment was conducted
in collaboration with local staff,
mapping WASH provisions already put
in place, and identifying action points.
During the mission, it was revealed that
a large part of absenteeism was
attributed to water-related and
water-borne diseases.
The action points are being developed
into a work plan for implementation
during 2017, which will provide
additional focus on sanitation provision,
along with employee awareness-raising
on hydration and heat stress.
Encouraging employees to put their health firstOur focus on health is not just for rural
communities. Increasingly, we see the
impacts of poor nutrition and sedentary
lifestyles across both developed and
developing nations.
In the USA, our team embraced the
2016 World Health Day theme of Beat
Diabetes, inviting a nutritionist to the
office to speak about diabetes,
launching a walking club, and hosting
a ‘Hidden Sugar Demo’ unveiling the
high sugar levels in the most commonly
consumed foods.
Meanwhile, in Tanzania’s Dar es
Salaam head office, a nutritionist
delivered a wellness talk on how to
choose and keep a healthy lifestyle.
Voluntary medical check-ups were
provided and a blood donation station
was set up courtesy of a local
blood bank.
The Zika virus also emerged in
South and Central America in 2016.
We immediately issued guidance
to employees and we are pleased
to report that nobody was impacted.
In addition to personal protection,
employees were advised to empty,
clean or cover containers that can
hold water, such as buckets, flower
pots or tyres, so that places where
mosquitoes could breed
were removed.
Olam wood subsidiary, Congolaise Industrielle des Bois, distributing mosquito nets.
In 2016, Olam reached 106,700 people with HIV and AIDs awareness and prevention workshops, which included this workshop with cashew communities in Koboko village, Côte d’Ivoire.
46 Olam International Limited Annual Report 2016
Social
Our material areas: Livelihoods
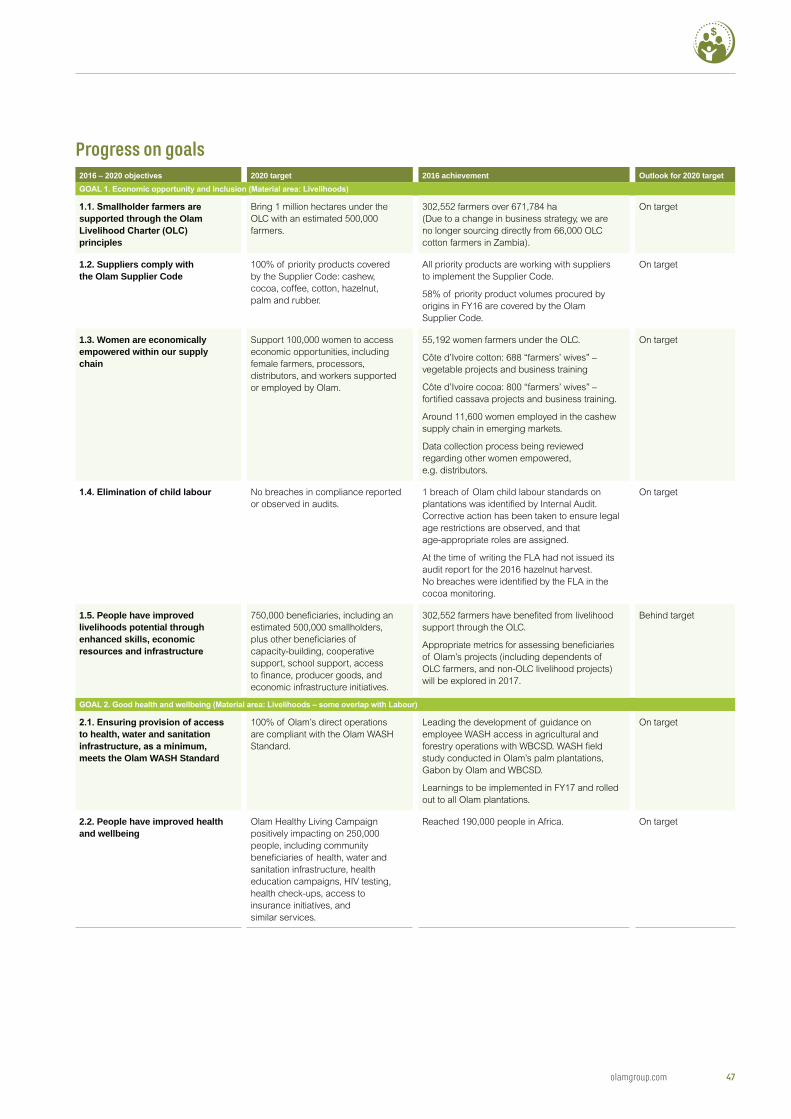
Progress on goals2020 target 2016 achievement
supported through the Olam
principles
Bring 1 million hectares under the
OLC with an estimated 500,000
farmers.
302,552 farmers over 671,784 ha
(Due to a change in business strategy, we are
no longer sourcing directly from 66,000 OLC
cotton farmers in Zambia).
On target
1.2. Suppliers comply with the Olam Supplier Code
100% of priority products covered
by the Supplier Code: cashew,
cocoa, coffee, cotton, hazelnut,
palm and rubber.
All priority products are working with suppliers
to implement the Supplier Code.
58% of priority product volumes procured by
origins in FY16 are covered by the Olam
Supplier Code.
On target
1.3. Women are economically empowered within our supply chain
Support 100,000 women to access
economic opportunities, including
female farmers, processors,
distributors, and workers supported
or employed by Olam.
55,192 women farmers under the OLC.
Côte d’Ivoire cotton: 688 “farmers’ wives” –
vegetable projects and business training
Côte d’Ivoire cocoa: 800 “farmers’ wives” –
fortified cassava projects and business training.
Around 11,600 women employed in the cashew
supply chain in emerging markets.
Data collection process being reviewed
regarding other women empowered,
e.g. distributors.
On target
No breaches in compliance reported
or observed in audits.
1 breach of Olam child labour standards on
plantations was identified by Internal Audit.
Corrective action has been taken to ensure legal
age restrictions are observed, and that
age-appropriate roles are assigned.
At the time of writing the FLA had not issued its
audit report for the 2016 hazelnut harvest.
No breaches were identified by the FLA in the
cocoa monitoring.
On target
1.5. People have improved livelihoods potential through enhanced skills, economic
750,000 beneficiaries, including an
estimated 500,000 smallholders,
plus other beneficiaries of
capacity-building, cooperative
support, school support, access
to finance, producer goods, and
economic infrastructure initiatives.
302,552 farmers have benefited from livelihood
support through the OLC.
Appropriate metrics for assessing beneficiaries
of Olam’s projects (including dependents of
OLC farmers, and non-OLC livelihood projects)
will be explored in 2017.
Behind target
to health, water and sanitation
meets the Olam WASH Standard
100% of Olam’s direct operations
are compliant with the Olam WASH
Standard.
Leading the development of guidance on
employee WASH access in agricultural and
forestry operations with WBCSD. WASH field
study conducted in Olam’s palm plantations,
Gabon by Olam and WBCSD.
Learnings to be implemented in FY17 and rolled
out to all Olam plantations.
On target
2.2. People have improved health and wellbeing
Olam Healthy Living Campaign
positively impacting on 250,000
people, including community
beneficiaries of health, water and
sanitation infrastructure, health
education campaigns, HIV testing,
health check-ups, access to
insurance initiatives, and
similar services.
Reached 190,000 people in Africa. On target
olamgroup.com 47
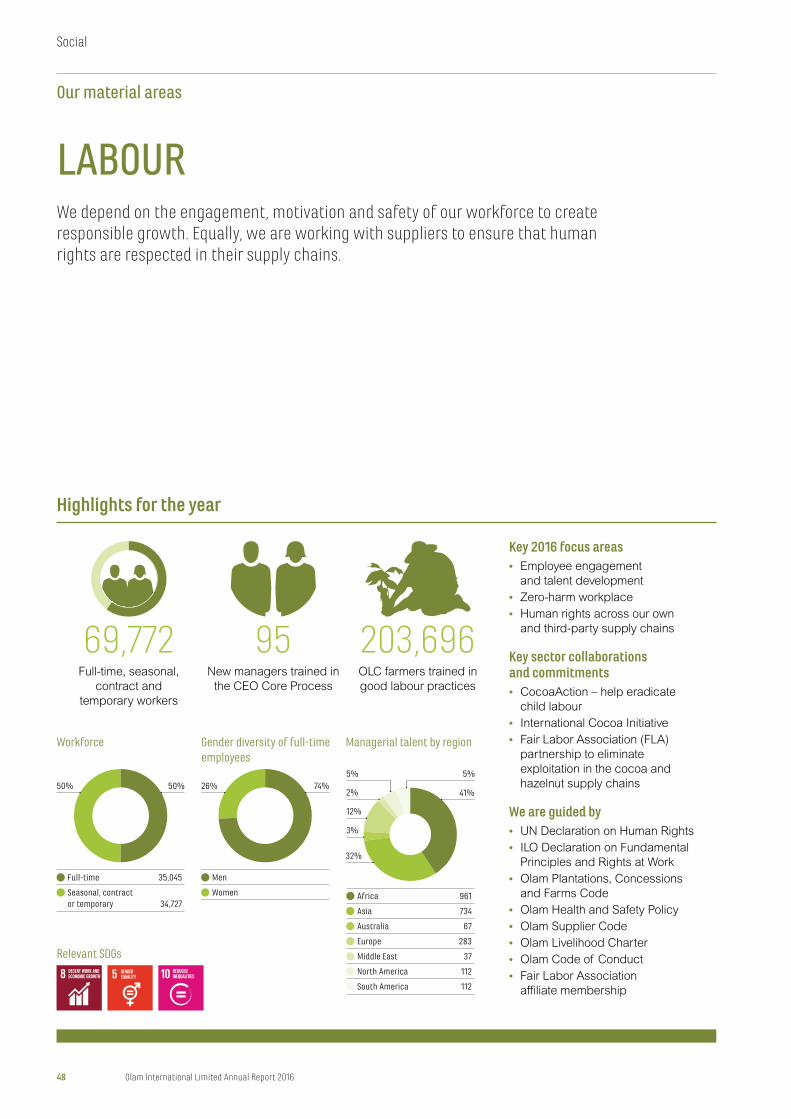
Gender diversity of full-time employees
26% 74%
Men
Women
69,772Full-time, seasonal,
contract and
temporary workers
LABOURWe depend on the engagement, motivation and safety of our workforce to create responsible growth. Equally, we are working with suppliers to ensure that human rights are respected in their supply chains.
Highlights for the year
Key 2016 focus areas• Employee engagement
and talent development
• Zero-harm workplace
• Human rights across our own
and third-party supply chains
Key sector collaborations and commitments• CocoaAction – help eradicate
child labour
• International Cocoa Initiative
• Fair Labor Association (FLA)
partnership to eliminate
exploitation in the cocoa and
hazelnut supply chains
We are guided by• UN Declaration on Human Rights
• ILO Declaration on Fundamental
Principles and Rights at Work
• Olam Plantations, Concessions
and Farms Code
• Olam Health and Safety Policy
• Olam Supplier Code
• Olam Livelihood Charter
• Olam Code of Conduct
• Fair Labor Association
affiliate membership
95New managers trained in
the CEO Core Process
203,696OLC farmers trained in
good labour practices
Workforce Managerial talent by region
50% 50%
Full-time 35,045
Seasonal, contractor temporary 34,727
Africa 961
Asia 734
Australia 67
Europe 283
Middle East 37
North America 112
South America 112
41%
32%
5%
12%
3%
5%
2%
Relevant SDGs
48 Olam International Limited Annual Report 2016
Social
Our material areas
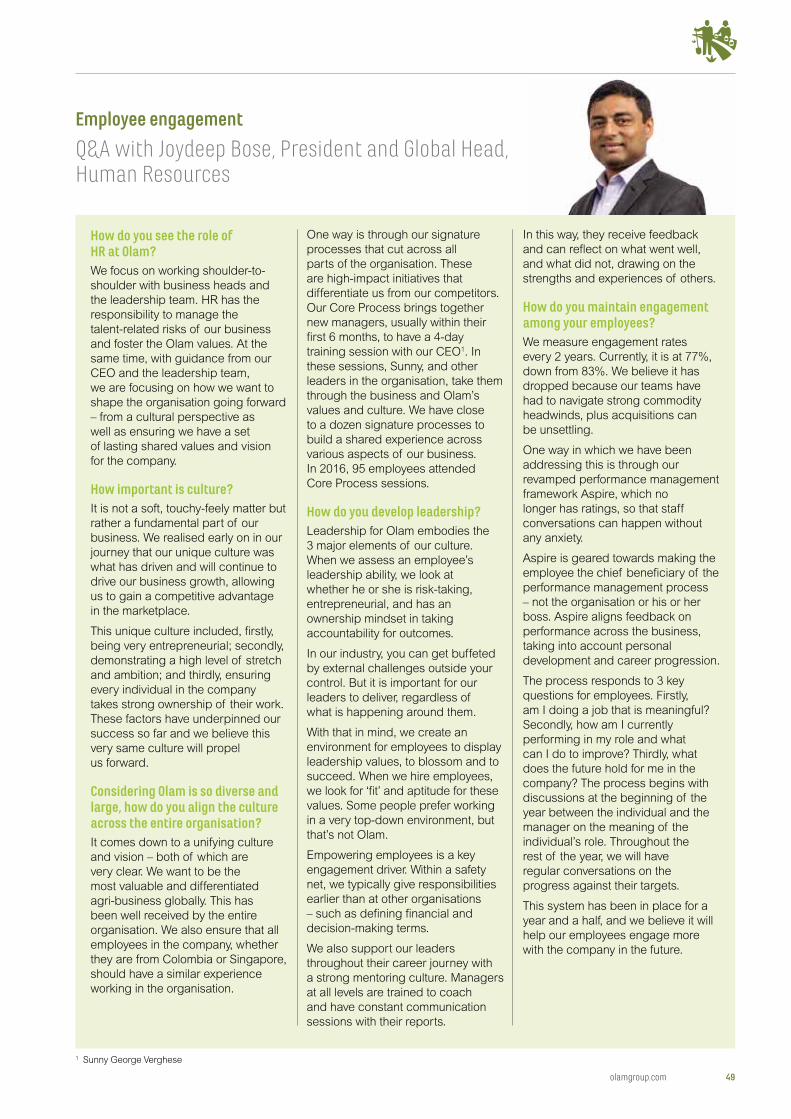
How do you see the role of HR at Olam?We focus on working shoulder-to-
shoulder with business heads and
the leadership team. HR has the
responsibility to manage the
talent-related risks of our business
and foster the Olam values. At the
same time, with guidance from our
CEO and the leadership team,
we are focusing on how we want to
shape the organisation going forward
– from a cultural perspective as
well as ensuring we have a set
of lasting shared values and vision
for the company.
How important is culture?It is not a soft, touchy-feely matter but
rather a fundamental part of our
business. We realised early on in our
journey that our unique culture was
what has driven and will continue to
drive our business growth, allowing
us to gain a competitive advantage
in the marketplace.
This unique culture included, firstly,
being very entrepreneurial; secondly,
demonstrating a high level of stretch
and ambition; and thirdly, ensuring
every individual in the company
takes strong ownership of their work.
These factors have underpinned our
success so far and we believe this
very same culture will propel
us forward.
Considering Olam is so diverse and large, how do you align the culture across the entire organisation?It comes down to a unifying culture
and vision – both of which are
very clear. We want to be the
most valuable and differentiated
agri-business globally. This has
been well received by the entire
organisation. We also ensure that all
employees in the company, whether
they are from Colombia or Singapore,
should have a similar experience
working in the organisation.
One way is through our signature
processes that cut across all
parts of the organisation. These
are high-impact initiatives that
differentiate us from our competitors.
Our Core Process brings together
new managers, usually within their
first 6 months, to have a 4-day
training session with our CEO1. In
these sessions, Sunny, and other
leaders in the organisation, take them
through the business and Olam’s
values and culture. We have close
to a dozen signature processes to
build a shared experience across
various aspects of our business.
In 2016, 95 employees attended
Core Process sessions.
How do you develop leadership?Leadership for Olam embodies the
3 major elements of our culture.
When we assess an employee’s
leadership ability, we look at
whether he or she is risk-taking,
entrepreneurial, and has an
ownership mindset in taking
accountability for outcomes.
In our industry, you can get buffeted
by external challenges outside your
control. But it is important for our
leaders to deliver, regardless of
what is happening around them.
With that in mind, we create an
environment for employees to display
leadership values, to blossom and to
succeed. When we hire employees,
we look for ‘fit’ and aptitude for these
values. Some people prefer working
in a very top-down environment, but
that’s not Olam.
Empowering employees is a key
engagement driver. Within a safety
net, we typically give responsibilities
earlier than at other organisations
– such as defining financial and
decision-making terms.
We also support our leaders
throughout their career journey with
a strong mentoring culture. Managers
at all levels are trained to coach
and have constant communication
sessions with their reports.
In this way, they receive feedback
and can reflect on what went well,
and what did not, drawing on the
strengths and experiences of others.
How do you maintain engagement among your employees?We measure engagement rates
every 2 years. Currently, it is at 77%,
down from 83%. We believe it has
dropped because our teams have
had to navigate strong commodity
headwinds, plus acquisitions can
be unsettling.
One way in which we have been
addressing this is through our
revamped performance management
framework Aspire, which no
longer has ratings, so that staff
conversations can happen without
any anxiety.
Aspire is geared towards making the
employee the chief beneficiary of the
performance management process
– not the organisation or his or her
boss. Aspire aligns feedback on
performance across the business,
taking into account personal
development and career progression.
The process responds to 3 key
questions for employees. Firstly,
am I doing a job that is meaningful?
Secondly, how am I currently
performing in my role and what
can I do to improve? Thirdly, what
does the future hold for me in the
company? The process begins with
discussions at the beginning of the
year between the individual and the
manager on the meaning of the
individual’s role. Throughout the
rest of the year, we will have
regular conversations on the
progress against their targets.
This system has been in place for a
year and a half, and we believe it will
help our employees engage more
with the company in the future.
Employee engagement
Q&A with Joydeep Bose, President and Global Head, Human Resources
1 Sunny George Verghese
olamgroup.com 49
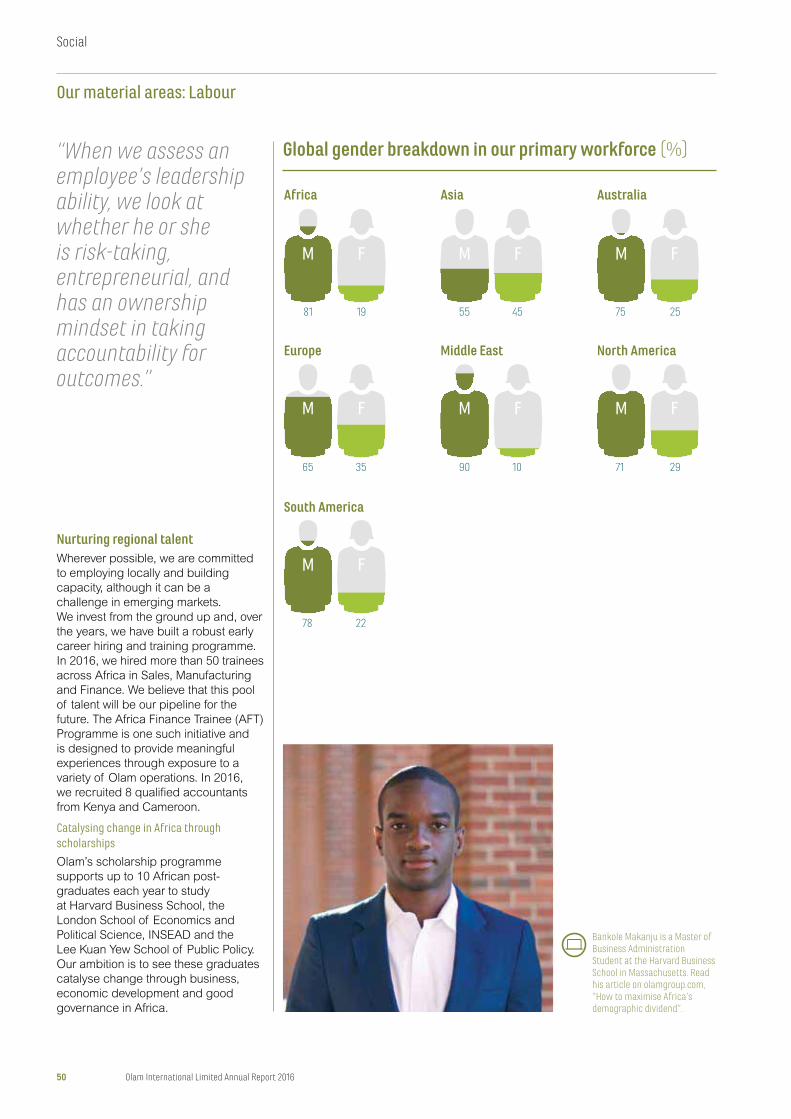
“When we assess an employee’s leadership ability, we look at whether he or she is risk-taking, entrepreneurial, and has an ownership mindset in taking accountability for outcomes.”
Global gender breakdown in our primary workforce (%)
Australia
North America
Africa
Europe
South America
Asia
Middle East
81
M
M
M
M
M
M
M
65
78
55
90
75
71
19
F
F
F
F
F
F
F
35
22
45
10
25
29
Bankole Makanju is a Master of Business Administration Student at the Harvard Business School in Massachusetts. Read his article on olamgroup.com, “How to maximise Africa’s demographic dividend”.
Nurturing regional talentWherever possible, we are committed
to employing locally and building
capacity, although it can be a
challenge in emerging markets.
We invest from the ground up and, over
the years, we have built a robust early
career hiring and training programme.
In 2016, we hired more than 50 trainees
across Africa in Sales, Manufacturing
and Finance. We believe that this pool
of talent will be our pipeline for the
future. The Africa Finance Trainee (AFT)
Programme is one such initiative and
is designed to provide meaningful
experiences through exposure to a
variety of Olam operations. In 2016,
we recruited 8 qualified accountants
from Kenya and Cameroon.
Catalysing change in Africa through scholarships
Olam’s scholarship programme
supports up to 10 African post-
graduates each year to study
at Harvard Business School, the
London School of Economics and
Political Science, INSEAD and the
Lee Kuan Yew School of Public Policy.
Our ambition is to see these graduates
catalyse change through business,
economic development and good
governance in Africa.
50 Olam International Limited Annual Report 2016
Social
Our material areas: Labour
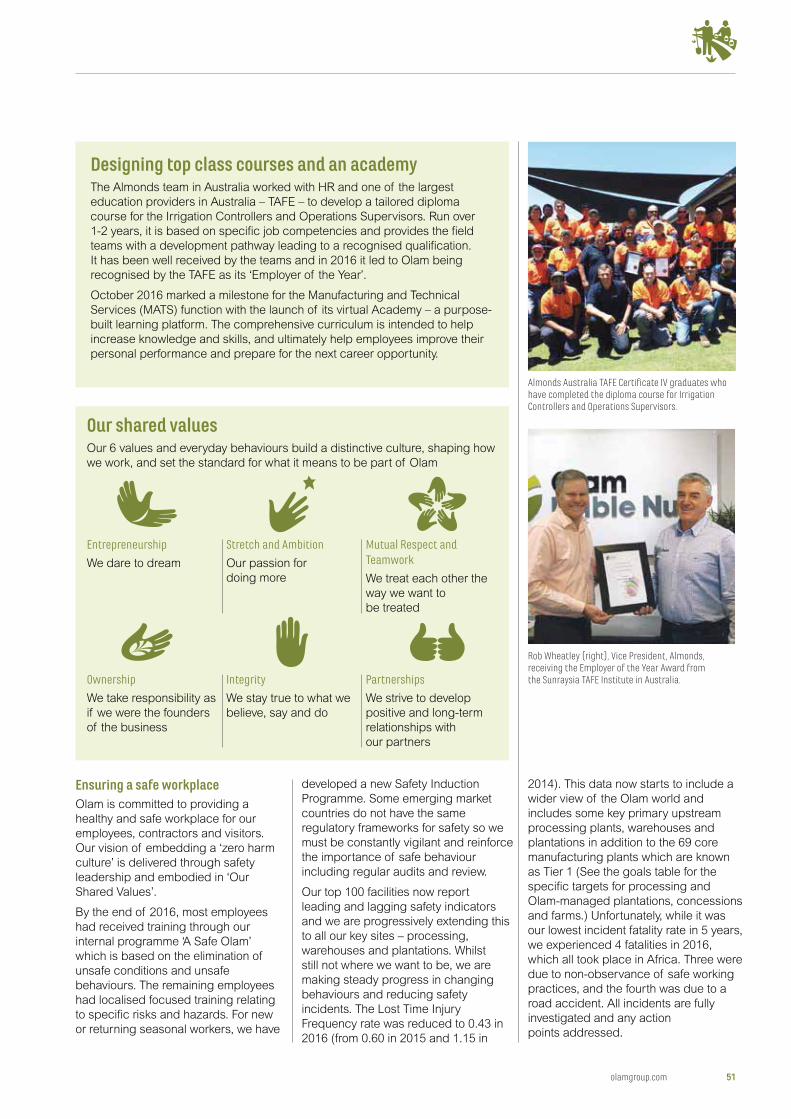
Ensuring a safe workplaceOlam is committed to providing a
healthy and safe workplace for our
employees, contractors and visitors.
Our vision of embedding a ‘zero harm
culture’ is delivered through safety
leadership and embodied in ‘Our
Shared Values’.
By the end of 2016, most employees
had received training through our
internal programme ‘A Safe Olam’
which is based on the elimination of
unsafe conditions and unsafe
behaviours. The remaining employees
had localised focused training relating
to specific risks and hazards. For new
or returning seasonal workers, we have
developed a new Safety Induction
Programme. Some emerging market
countries do not have the same
regulatory frameworks for safety so we
must be constantly vigilant and reinforce
the importance of safe behaviour
including regular audits and review.
Our top 100 facilities now report
leading and lagging safety indicators
and we are progressively extending this
to all our key sites – processing,
warehouses and plantations. Whilst
still not where we want to be, we are
making steady progress in changing
behaviours and reducing safety
incidents. The Lost Time Injury
Frequency rate was reduced to 0.43 in
2016 (from 0.60 in 2015 and 1.15 in
Designing top class courses and an academyThe Almonds team in Australia worked with HR and one of the largest
education providers in Australia – TAFE – to develop a tailored diploma
course for the Irrigation Controllers and Operations Supervisors. Run over
1-2 years, it is based on specific job competencies and provides the field
teams with a development pathway leading to a recognised qualification.
It has been well received by the teams and in 2016 it led to Olam being
recognised by the TAFE as its ‘Employer of the Year’.
October 2016 marked a milestone for the Manufacturing and Technical
Services (MATS) function with the launch of its virtual Academy – a purpose-
built learning platform. The comprehensive curriculum is intended to help
increase knowledge and skills, and ultimately help employees improve their
personal performance and prepare for the next career opportunity.
2014). This data now starts to include a
wider view of the Olam world and
includes some key primary upstream
processing plants, warehouses and
plantations in addition to the 69 core
manufacturing plants which are known
as Tier 1 (See the goals table for the
specific targets for processing and
Olam-managed plantations, concessions
and farms.) Unfortunately, while it was
our lowest incident fatality rate in 5 years,
we experienced 4 fatalities in 2016,
which all took place in Africa. Three were
due to non-observance of safe working
practices, and the fourth was due to a
road accident. All incidents are fully
investigated and any action
points addressed.
Almonds Australia TAFE Certificate IV graduates who have completed the diploma course for Irrigation Controllers and Operations Supervisors.
Rob Wheatley (right), Vice President, Almonds, receiving the Employer of the Year Award from the Sunraysia TAFE Institute in Australia.
Our shared valuesOur 6 values and everyday behaviours build a distinctive culture, shaping how
we work, and set the standard for what it means to be part of Olam
Entrepreneurship
We dare to dream
Stretch and Ambition
Our passion for
doing more
Mutual Respect and Teamwork
We treat each other the
way we want to
be treated
Ownership
We take responsibility as
if we were the founders
of the business
Integrity
We stay true to what we
believe, say and do
Partnerships
We strive to develop
positive and long-term
relationships with
our partners
olamgroup.com 51
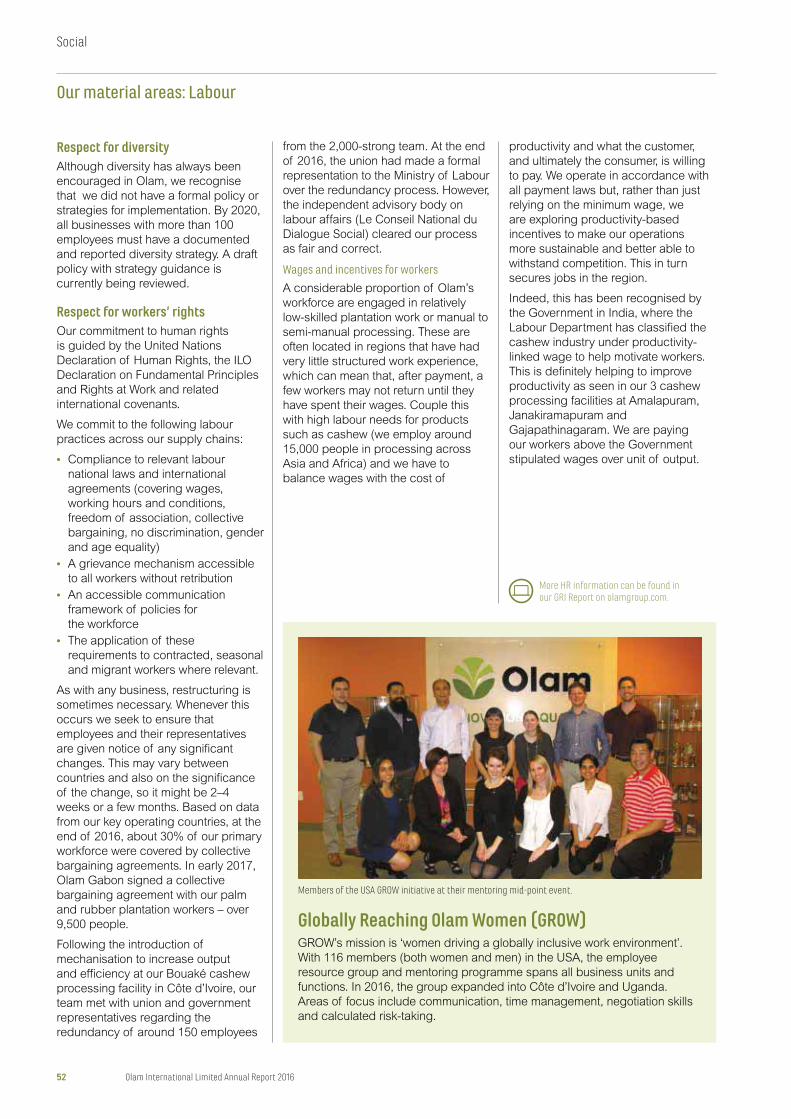
productivity and what the customer,
and ultimately the consumer, is willing
to pay. We operate in accordance with
all payment laws but, rather than just
relying on the minimum wage, we
are exploring productivity-based
incentives to make our operations
more sustainable and better able to
withstand competition. This in turn
secures jobs in the region.
Indeed, this has been recognised by
the Government in India, where the
Labour Department has classified the
cashew industry under productivity-
linked wage to help motivate workers.
This is definitely helping to improve
productivity as seen in our 3 cashew
processing facilities at Amalapuram,
Janakiramapuram and
Gajapathinagaram. We are paying
our workers above the Government
stipulated wages over unit of output.
Respect for diversityAlthough diversity has always been
encouraged in Olam, we recognise
that we did not have a formal policy or
strategies for implementation. By 2020,
all businesses with more than 100
employees must have a documented
and reported diversity strategy. A draft
policy with strategy guidance is
currently being reviewed.
Respect for workers’ rightsOur commitment to human rights
is guided by the United Nations
Declaration of Human Rights, the ILO
Declaration on Fundamental Principles
and Rights at Work and related
international covenants.
We commit to the following labour
practices across our supply chains:
• Compliance to relevant labour
national laws and international
agreements (covering wages,
working hours and conditions,
freedom of association, collective
bargaining, no discrimination, gender
and age equality)
• A grievance mechanism accessible
to all workers without retribution
• An accessible communication
framework of policies for
the workforce
• The application of these
requirements to contracted, seasonal
and migrant workers where relevant.
As with any business, restructuring is
sometimes necessary. Whenever this
occurs we seek to ensure that
employees and their representatives
are given notice of any significant
changes. This may vary between
countries and also on the significance
of the change, so it might be 2–4
weeks or a few months. Based on data
from our key operating countries, at the
end of 2016, about 30% of our primary
workforce were covered by collective
bargaining agreements. In early 2017,
Olam Gabon signed a collective
bargaining agreement with our palm
and rubber plantation workers – over
9,500 people.
Following the introduction of
mechanisation to increase output
and efficiency at our Bouaké cashew
processing facility in Côte d’Ivoire, our
team met with union and government
representatives regarding the
redundancy of around 150 employees
from the 2,000-strong team. At the end
of 2016, the union had made a formal
representation to the Ministry of Labour
over the redundancy process. However,
the independent advisory body on
labour affairs (Le Conseil National du
Dialogue Social) cleared our process
as fair and correct.
Wages and incentives for workers
A considerable proportion of Olam’s
workforce are engaged in relatively
low-skilled plantation work or manual to
semi-manual processing. These are
often located in regions that have had
very little structured work experience,
which can mean that, after payment, a
few workers may not return until they
have spent their wages. Couple this
with high labour needs for products
such as cashew (we employ around
15,000 people in processing across
Asia and Africa) and we have to
balance wages with the cost of
Members of the USA GROW initiative at their mentoring mid-point event.
More HR information can be found in our GRI Report on olamgroup.com.
Globally Reaching Olam Women (GROW)GROW’s mission is ‘women driving a globally inclusive work environment’.
With 116 members (both women and men) in the USA, the employee
resource group and mentoring programme spans all business units and
functions. In 2016, the group expanded into Côte d’Ivoire and Uganda.
Areas of focus include communication, time management, negotiation skills
and calculated risk-taking.
52 Olam International Limited Annual Report 2016
Social
Our material areas: Labour
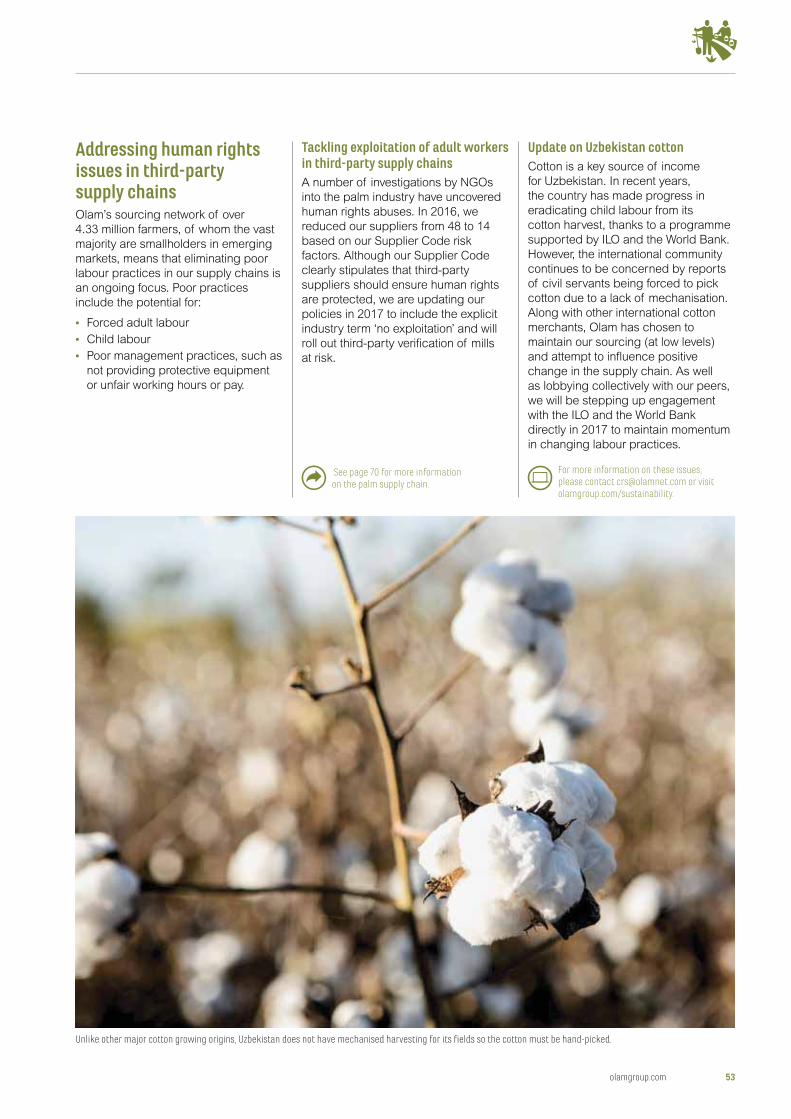
Addressing human rights issues in third-party supply chainsOlam’s sourcing network of over
4.33 million farmers, of whom the vast
majority are smallholders in emerging
markets, means that eliminating poor
labour practices in our supply chains is
an ongoing focus. Poor practices
include the potential for:
• Forced adult labour
• Child labour
• Poor management practices, such as
not providing protective equipment
or unfair working hours or pay.
Tackling exploitation of adult workers in third-party supply chainsA number of investigations by NGOs
into the palm industry have uncovered
human rights abuses. In 2016, we
reduced our suppliers from 48 to 14
based on our Supplier Code risk
factors. Although our Supplier Code
clearly stipulates that third-party
suppliers should ensure human rights
are protected, we are updating our
policies in 2017 to include the explicit
industry term ‘no exploitation’ and will
roll out third-party verification of mills
at risk.
Update on Uzbekistan cottonCotton is a key source of income
for Uzbekistan. In recent years,
the country has made progress in
eradicating child labour from its
cotton harvest, thanks to a programme
supported by ILO and the World Bank.
However, the international community
continues to be concerned by reports
of civil servants being forced to pick
cotton due to a lack of mechanisation.
Along with other international cotton
merchants, Olam has chosen to
maintain our sourcing (at low levels)
and attempt to influence positive
change in the supply chain. As well
as lobbying collectively with our peers,
we will be stepping up engagement
with the ILO and the World Bank
directly in 2017 to maintain momentum
in changing labour practices.
Unlike other major cotton growing origins, Uzbekistan does not have mechanised harvesting for its fields so the cotton must be hand-picked.
For more information on these issues, please contact [email protected] or visit olamgroup.com/sustainability.
See page 70 for more information on the palm supply chain.
olamgroup.com 53
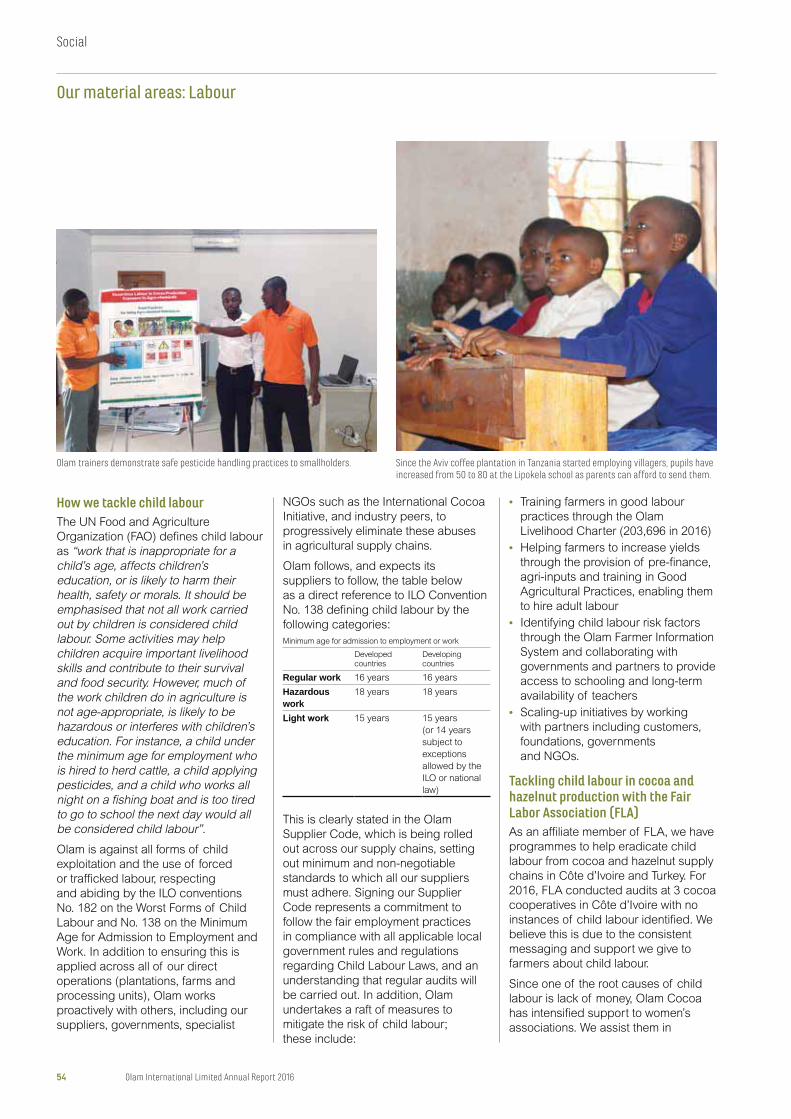
Since the Aviv coffee plantation in Tanzania started employing villagers, pupils have increased from 50 to 80 at the Lipokela school as parents can afford to send them.
NGOs such as the International Cocoa
Initiative, and industry peers, to
progressively eliminate these abuses
in agricultural supply chains.
Olam follows, and expects its
suppliers to follow, the table below
as a direct reference to ILO Convention
No. 138 defining child labour by the
following categories:
Minimum age for admission to employment or work
Developed countries
Developing countries
Regular work 16 years 16 years
Hazardous work
18 years 18 years
15 years 15 years
(or 14 years
subject to
exceptions
allowed by the
ILO or national
law)
This is clearly stated in the Olam
Supplier Code, which is being rolled
out across our supply chains, setting
out minimum and non-negotiable
standards to which all our suppliers
must adhere. Signing our Supplier
Code represents a commitment to
follow the fair employment practices
in compliance with all applicable local
government rules and regulations
regarding Child Labour Laws, and an
understanding that regular audits will
be carried out. In addition, Olam
undertakes a raft of measures to
mitigate the risk of child labour;
these include:
• Training farmers in good labour
practices through the Olam
Livelihood Charter (203,696 in 2016)
• Helping farmers to increase yields
through the provision of pre-finance,
agri-inputs and training in Good
Agricultural Practices, enabling them
to hire adult labour
• Identifying child labour risk factors
through the Olam Farmer Information
System and collaborating with
governments and partners to provide
access to schooling and long-term
availability of teachers
• Scaling-up initiatives by working
with partners including customers,
foundations, governments
and NGOs.
Tackling child labour in cocoa and hazelnut production with the Fair Labor Association (FLA) As an affiliate member of FLA, we have
programmes to help eradicate child
labour from cocoa and hazelnut supply
chains in Côte d’Ivoire and Turkey. For
2016, FLA conducted audits at 3 cocoa
cooperatives in Côte d’Ivoire with no
instances of child labour identified. We
believe this is due to the consistent
messaging and support we give to
farmers about child labour.
Since one of the root causes of child
labour is lack of money, Olam Cocoa
has intensified support to women’s
associations. We assist them in
How we tackle child labourThe UN Food and Agriculture
Organization (FAO) defines child labour
as “work that is inappropriate for a child’s age, affects children’s education, or is likely to harm their health, safety or morals. It should be emphasised that not all work carried out by children is considered child labour. Some activities may help children acquire important livelihood skills and contribute to their survival and food security. However, much of the work children do in agriculture is not age-appropriate, is likely to be hazardous or interferes with children’s education. For instance, a child under the minimum age for employment who is hired to herd cattle, a child applying pesticides, and a child who works all night on a fishing boat and is too tired to go to school the next day would all be considered child labour”.
Olam is against all forms of child
exploitation and the use of forced
or trafficked labour, respecting
and abiding by the ILO conventions
No. 182 on the Worst Forms of Child
Labour and No. 138 on the Minimum
Age for Admission to Employment and
Work. In addition to ensuring this is
applied across all of our direct
operations (plantations, farms and
processing units), Olam works
proactively with others, including our
suppliers, governments, specialist
Olam trainers demonstrate safe pesticide handling practices to smallholders.
54 Olam International Limited Annual Report 2016
Social
Our material areas: Labour
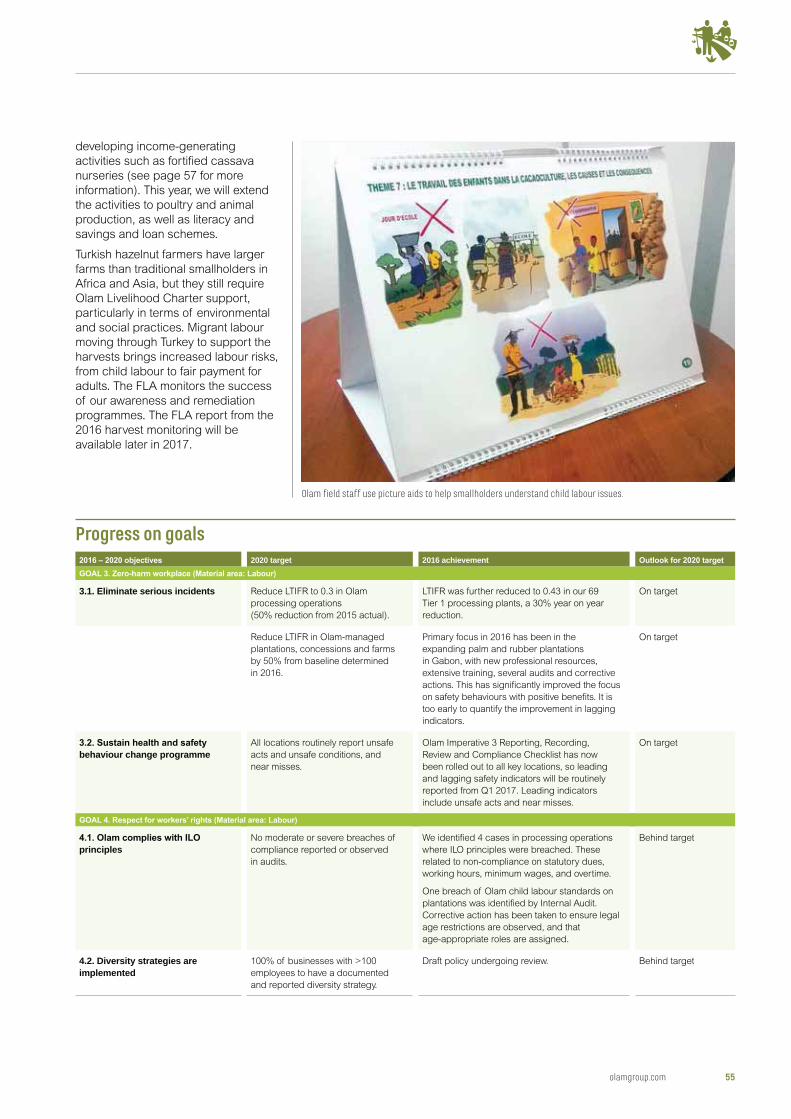
Progress on goals2020 target 2016 achievement
3.1. Eliminate serious incidents Reduce LTIFR to 0.3 in Olam
processing operations
(50% reduction from 2015 actual).
LTIFR was further reduced to 0.43 in our 69
Tier 1 processing plants, a 30% year on year
reduction.
On target
Reduce LTIFR in Olam-managed
plantations, concessions and farms
by 50% from baseline determined
in 2016.
Primary focus in 2016 has been in the
expanding palm and rubber plantations
in Gabon, with new professional resources,
extensive training, several audits and corrective
actions. This has significantly improved the focus
on safety behaviours with positive benefits. It is
too early to quantify the improvement in lagging
indicators.
On target
behaviour change programmeAll locations routinely report unsafe
acts and unsafe conditions, and
near misses.
Olam Imperative 3 Reporting, Recording,
Review and Compliance Checklist has now
been rolled out to all key locations, so leading
and lagging safety indicators will be routinely
reported from Q1 2017. Leading indicators
include unsafe acts and near misses.
On target
principlesNo moderate or severe breaches of
compliance reported or observed
in audits.
We identified 4 cases in processing operations
where ILO principles were breached. These
related to non-compliance on statutory dues,
working hours, minimum wages, and overtime.
One breach of Olam child labour standards on
plantations was identified by Internal Audit.
Corrective action has been taken to ensure legal
age restrictions are observed, and that
age-appropriate roles are assigned.
Behind target
4.2. Diversity strategies are implemented
100% of businesses with >100
employees to have a documented
and reported diversity strategy.
Draft policy undergoing review. Behind target
Olam field staff use picture aids to help smallholders understand child labour issues.
developing income-generating
activities such as fortified cassava
nurseries (see page 57 for more
information). This year, we will extend
the activities to poultry and animal
production, as well as literacy and
savings and loan schemes.
Turkish hazelnut farmers have larger
farms than traditional smallholders in
Africa and Asia, but they still require
Olam Livelihood Charter support,
particularly in terms of environmental
and social practices. Migrant labour
moving through Turkey to support the
harvests brings increased labour risks,
from child labour to fair payment for
adults. The FLA monitors the success
of our awareness and remediation
programmes. The FLA report from the
2016 harvest monitoring will be
available later in 2017.
olamgroup.com 55
FOOD SECURITY AND NUTRITIONOlam’s focus is on improving access to safe, affordable and nutritious food for our farmer suppliers and in the workplace, so that their dietary needs and preferences are met. This enables them to live an active and healthy life, which in turn supports productivity and livelihoods.
Highlights for the year
Key 2016 focus areas• Continue to support smallholders
with crop diversification for improved
income and food security
• Increase nutrition training for
communities through partnerships
• Increase fortification of food stuffs
in Africa
Key sector collaborations and commitments• Hosted the Building Sustainable
Futures Forum in Singapore
• Jointly launched the Global
Agri-business Alliance which
will focus in particular on SDG 2:
‘End hunger, achieve food security
and improved nutrition, and promote
sustainable agriculture’
• Member of Champions 12.3 on
food waste
We are guided by• Olam Livelihood Charter
• Commitment to continuous
engagement with communities
around our developments
to understand needs
(FPIC1 procedures)
Relevant SDGs
226,030Smallholders trained
in Good Agricultural
Practices (GAP)
26 billionServings of
micro-nutrient fortified
foods in Africa
92Entries received for the
2016/2017 Olam Prize
for Innovation in
Food Security
1 FPIC – Free, Prior and Informed Consent.
56 Olam International Limited Annual Report 2016
Social
Our material areas
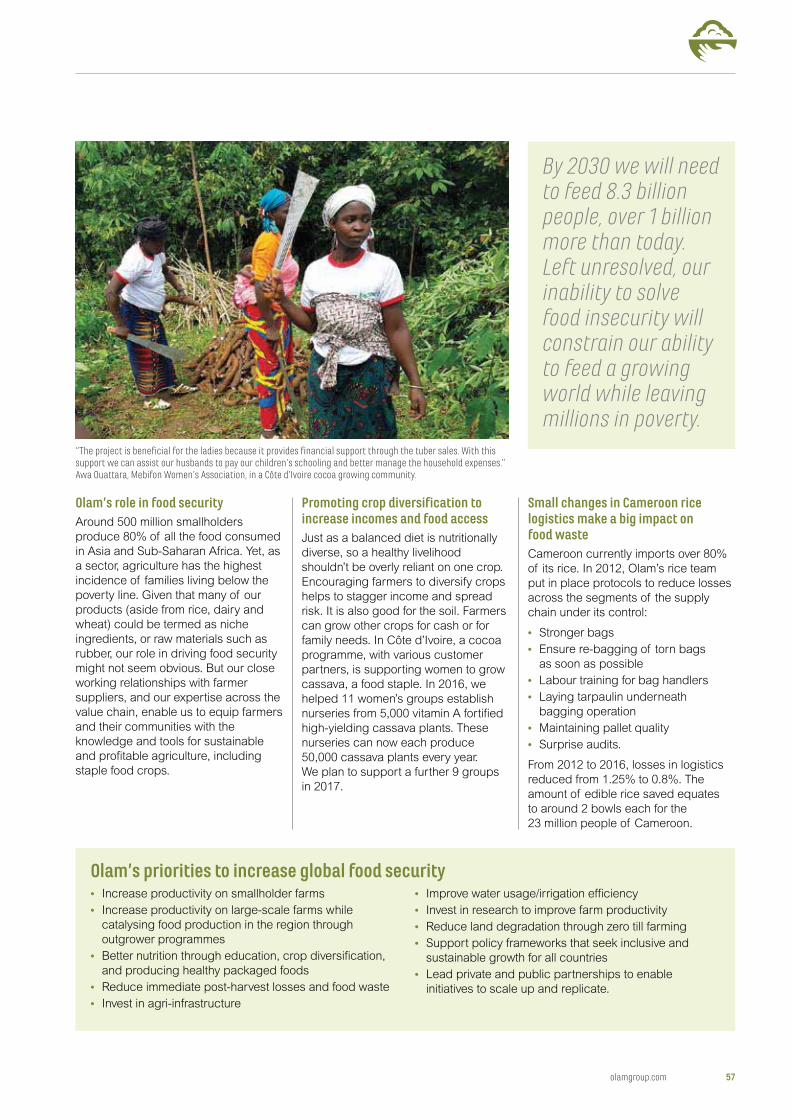
Olam’s role in food securityAround 500 million smallholders
produce 80% of all the food consumed
in Asia and Sub-Saharan Africa. Yet, as
a sector, agriculture has the highest
incidence of families living below the
poverty line. Given that many of our
products (aside from rice, dairy and
wheat) could be termed as niche
ingredients, or raw materials such as
rubber, our role in driving food security
might not seem obvious. But our close
working relationships with farmer
suppliers, and our expertise across the
value chain, enable us to equip farmers
and their communities with the
knowledge and tools for sustainable
and profitable agriculture, including
staple food crops.
Promoting crop diversification to increase incomes and food accessJust as a balanced diet is nutritionally
diverse, so a healthy livelihood
shouldn’t be overly reliant on one crop.
Encouraging farmers to diversify crops
helps to stagger income and spread
risk. It is also good for the soil. Farmers
can grow other crops for cash or for
family needs. In Côte d’Ivoire, a cocoa
programme, with various customer
partners, is supporting women to grow
cassava, a food staple. In 2016, we
helped 11 women’s groups establish
nurseries from 5,000 vitamin A fortified
high-yielding cassava plants. These
nurseries can now each produce
50,000 cassava plants every year.
We plan to support a further 9 groups
in 2017.
Small changes in Cameroon rice logistics make a big impact on food wasteCameroon currently imports over 80%
of its rice. In 2012, Olam’s rice team
put in place protocols to reduce losses
across the segments of the supply
chain under its control:
• Stronger bags
• Ensure re-bagging of torn bags
as soon as possible
• Labour training for bag handlers
• Laying tarpaulin underneath
bagging operation
• Maintaining pallet quality
• Surprise audits.
From 2012 to 2016, losses in logistics
reduced from 1.25% to 0.8%. The
amount of edible rice saved equates
to around 2 bowls each for the
23 million people of Cameroon.
“The project is beneficial for the ladies because it provides financial support through the tuber sales. With this support we can assist our husbands to pay our children’s schooling and better manage the household expenses.” Awa Ouattara, Mebifon Women’s Association, in a Côte d’Ivoire cocoa growing community.
Olam’s priorities to increase global food security• Increase productivity on smallholder farms
• Increase productivity on large-scale farms while
catalysing food production in the region through
outgrower programmes
• Better nutrition through education, crop diversification,
and producing healthy packaged foods
• Reduce immediate post-harvest losses and food waste
• Invest in agri-infrastructure
• Improve water usage/irrigation efficiency
• Invest in research to improve farm productivity
• Reduce land degradation through zero till farming
• Support policy frameworks that seek inclusive and
sustainable growth for all countries
• Lead private and public partnerships to enable
initiatives to scale up and replicate.
By 2030 we will need to feed 8.3 billion people, over 1 billion more than today. Left unresolved, our inability to solve food insecurity will constrain our ability to feed a growing world while leaving millions in poverty.
olamgroup.com 57
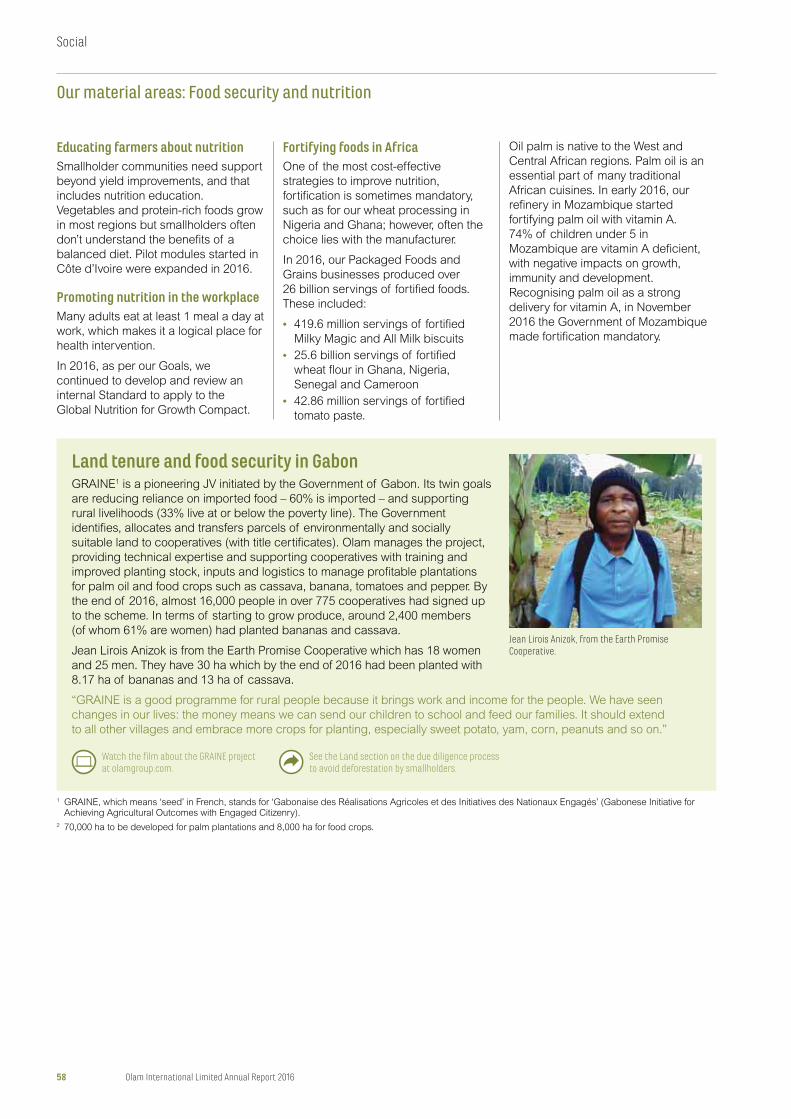
Land tenure and food security in GabonGRAINE1 is a pioneering JV initiated by the Government of Gabon. Its twin goals
are reducing reliance on imported food – 60% is imported – and supporting
rural livelihoods (33% live at or below the poverty line). The Government
identifies, allocates and transfers parcels of environmentally and socially
suitable land to cooperatives (with title certificates). Olam manages the project,
providing technical expertise and supporting cooperatives with training and
improved planting stock, inputs and logistics to manage profitable plantations
for palm oil and food crops such as cassava, banana, tomatoes and pepper. By
the end of 2016, almost 16,000 people in over 775 cooperatives had signed up
to the scheme. In terms of starting to grow produce, around 2,400 members
(of whom 61% are women) had planted bananas and cassava.
Jean Lirois Anizok is from the Earth Promise Cooperative which has 18 women
and 25 men. They have 30 ha which by the end of 2016 had been planted with
8.17 ha of bananas and 13 ha of cassava.
“GRAINE is a good programme for rural people because it brings work and income for the people. We have seen
changes in our lives: the money means we can send our children to school and feed our families. It should extend
to all other villages and embrace more crops for planting, especially sweet potato, yam, corn, peanuts and so on.”
Jean Lirois Anizok, from the Earth Promise Cooperative.
Fortifying foods in AfricaOne of the most cost-effective
strategies to improve nutrition,
fortification is sometimes mandatory,
such as for our wheat processing in
Nigeria and Ghana; however, often the
choice lies with the manufacturer.
In 2016, our Packaged Foods and
Grains businesses produced over
26 billion servings of fortified foods.
These included:
• 419.6 million servings of fortified
Milky Magic and All Milk biscuits
• 25.6 billion servings of fortified
wheat flour in Ghana, Nigeria,
Senegal and Cameroon
• 42.86 million servings of fortified
tomato paste.
Oil palm is native to the West and
Central African regions. Palm oil is an
essential part of many traditional
African cuisines. In early 2016, our
refinery in Mozambique started
fortifying palm oil with vitamin A.
74% of children under 5 in
Mozambique are vitamin A deficient,
with negative impacts on growth,
immunity and development.
Recognising palm oil as a strong
delivery for vitamin A, in November
2016 the Government of Mozambique
made fortification mandatory.
1 GRAINE, which means ‘seed’ in French, stands for ‘Gabonaise des Réalisations Agricoles et des Initiatives des Nationaux Engagés’ (Gabonese Initiative for Achieving Agricultural Outcomes with Engaged Citizenry).
2 70,000 ha to be developed for palm plantations and 8,000 ha for food crops.
Educating farmers about nutrition Smallholder communities need support
beyond yield improvements, and that
includes nutrition education.
Vegetables and protein-rich foods grow
in most regions but smallholders often
don’t understand the benefits of a
balanced diet. Pilot modules started in
Côte d’Ivoire were expanded in 2016.
Promoting nutrition in the workplaceMany adults eat at least 1 meal a day at
work, which makes it a logical place for
health intervention.
In 2016, as per our Goals, we
continued to develop and review an
internal Standard to apply to the
Global Nutrition for Growth Compact.
Watch the film about the GRAINE project at olamgroup.com.
See the Land section on the due diligence process to avoid deforestation by smallholders.
58 Olam International Limited Annual Report 2016
Our material areas: Food security and nutrition
Social
Creating the future we want – learning from experts and collaborating with peersIn September 2016, Olam convened
more than 300 delegates in Singapore
to attend the Building Sustainable
Futures Forum (BSFF). Our intent was
to gather our peers across the
agri-value chain to identify areas for
collaboration in alleviating global
hunger and nutrition as part of the
SDGs. We recognise that solving food
security without depleting natural
resources or impacting climate change
can only be achieved by harnessing
our collective strengths.
A key highlight of the BSFF was the
launch of the Global Agri-business
Alliance (GAA), also initiated by Olam.
Its aim is to collectively address
sustainability, social, labour and
environmental issues where the
agri-sector has a shared responsibility.
The first meeting of the GAA in
December 2016 initiated a series of
working groups which will tackle the
systemic issues identified by the sector.
Progress on goals2020 target 2016 achievement
5.1. Workers are educated on, and Conduct nutrition education or
access initiatives for the workplace
for 100% of target businesses, to be
determined in the Standard.
Olam Workplace Nutrition Guidelines drafted
and under final review.
Olam Healthy Living programme implemented in
19 businesses across Africa. This initiative
targets improved health and nutrition for workers
and communities.
Behind target
Produce 40 billion servings of
micronutrient fortified foods.
Over 26 billion servings of fortified biscuits, flour
and tomato paste (Africa).
On target
The second Olam Prize for Innovation in Food Security launchedSponsored with our international
scientific partner, Agropolis Fondation,
the US$50,000 prize rewards an
outstanding research project for its
potential impact on the availability,
affordability, accessibility or adequacy
of food. Over 90 applications have
been received and the winner will be
announced in 2017 on olamgroup.com.
The winner of the 2014/15 Prize SRI
International Network and Resources
Center (SRI-Rice) used the funds to
develop an international network of
System of Rice Intensification (SRI)
researchers in 45 countries.
The platform facilitates collaboration
across borders on the SRI
methodology that enhances rice
productivity, water conservation,
livelihoods, soil health, and crop
resilience to climate stress.
Marking the beginning of the Global Agri-business Alliance.
Watch the panel videos of the BSFF at olamgroup.com. For more on the GAA visit globalagribusinessalliance.com.
olamgroup.com 59
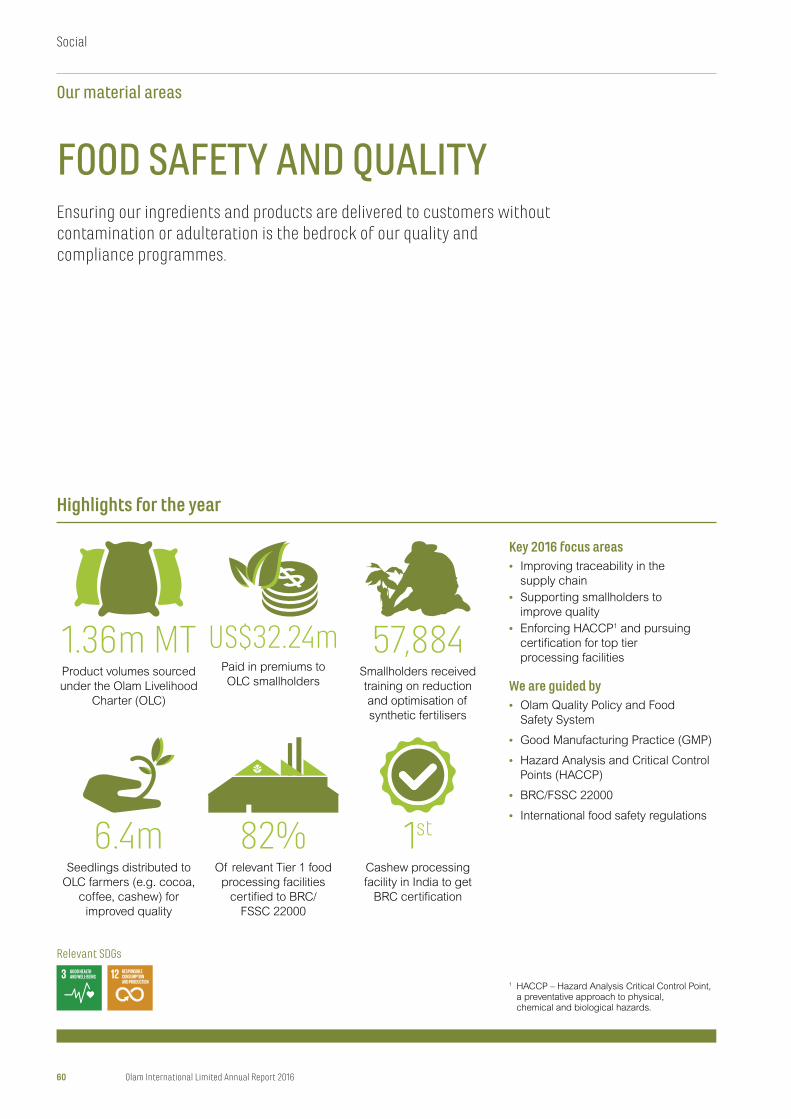
FOOD SAFETY AND QUALITYEnsuring our ingredients and products are delivered to customers without contamination or adulteration is the bedrock of our quality and compliance programmes.
Highlights for the year
Key 2016 focus areas• Improving traceability in the
supply chain
• Supporting smallholders to
improve quality
• Enforcing HACCP1 and pursuing
certification for top tier
processing facilities
We are guided by• Olam Quality Policy and Food
Safety System
• Good Manufacturing Practice (GMP)
• Hazard Analysis and Critical Control
Points (HACCP)
• BRC/FSSC 22000
• International food safety regulations
1 HACCP – Hazard Analysis Critical Control Point, a preventative approach to physical, chemical and biological hazards.
1.36m MTProduct volumes sourced
under the Olam Livelihood
Charter (OLC)
6.4mSeedlings distributed to
OLC farmers (e.g. cocoa,
coffee, cashew) for
improved quality
US$32.24mPaid in premiums to
OLC smallholders
82%Of relevant Tier 1 food
processing facilities
certified to BRC/
FSSC 22000
57,884Smallholders received
training on reduction
and optimisation of
synthetic fertilisers
1st
Cashew processing
facility in India to get
BRC certification
Relevant SDGs
60 Olam International Limited Annual Report 2016
Our material areas
Social
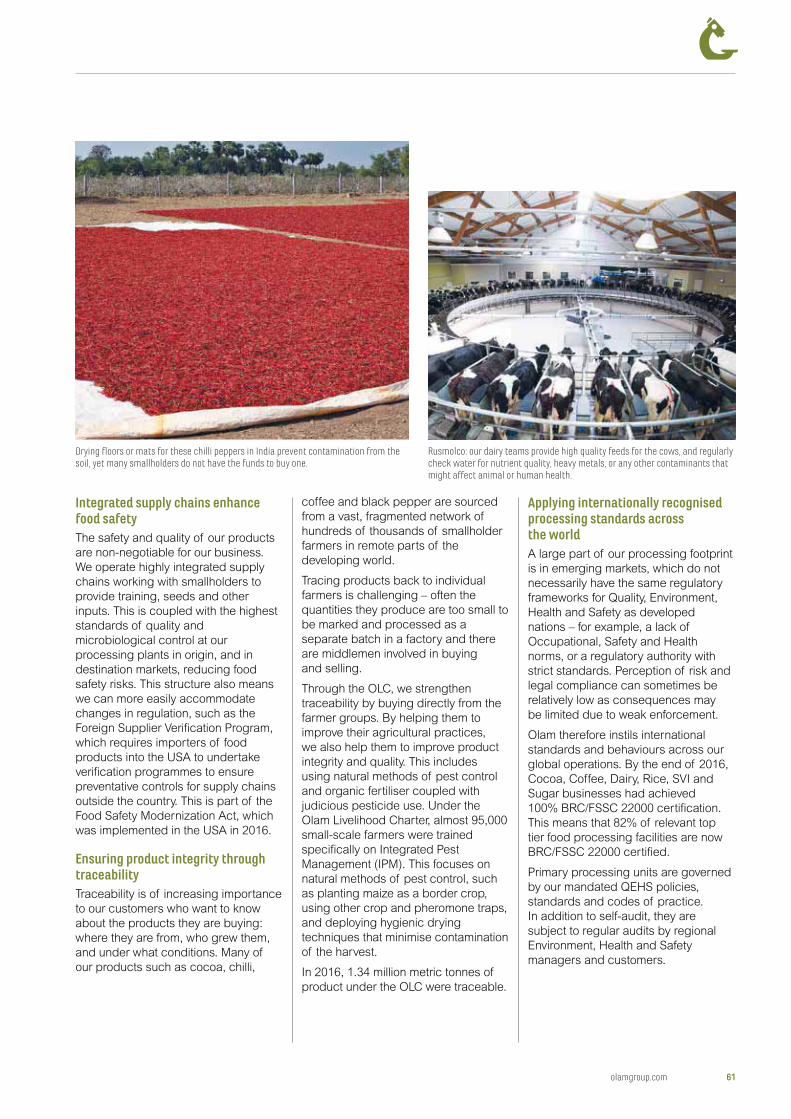
Integrated supply chains enhance food safetyThe safety and quality of our products
are non-negotiable for our business.
We operate highly integrated supply
chains working with smallholders to
provide training, seeds and other
inputs. This is coupled with the highest
standards of quality and
microbiological control at our
processing plants in origin, and in
destination markets, reducing food
safety risks. This structure also means
we can more easily accommodate
changes in regulation, such as the
Foreign Supplier Verification Program,
which requires importers of food
products into the USA to undertake
verification programmes to ensure
preventative controls for supply chains
outside the country. This is part of the
Food Safety Modernization Act, which
was implemented in the USA in 2016.
Ensuring product integrity through traceabilityTraceability is of increasing importance
to our customers who want to know
about the products they are buying:
where they are from, who grew them,
and under what conditions. Many of
our products such as cocoa, chilli,
coffee and black pepper are sourced
from a vast, fragmented network of
hundreds of thousands of smallholder
farmers in remote parts of the
developing world.
Tracing products back to individual
farmers is challenging – often the
quantities they produce are too small to
be marked and processed as a
separate batch in a factory and there
are middlemen involved in buying
and selling.
Through the OLC, we strengthen
traceability by buying directly from the
farmer groups. By helping them to
improve their agricultural practices,
we also help them to improve product
integrity and quality. This includes
using natural methods of pest control
and organic fertiliser coupled with
judicious pesticide use. Under the
Olam Livelihood Charter, almost 95,000
small-scale farmers were trained
specifically on Integrated Pest
Management (IPM). This focuses on
natural methods of pest control, such
as planting maize as a border crop,
using other crop and pheromone traps,
and deploying hygienic drying
techniques that minimise contamination
of the harvest.
In 2016, 1.34 million metric tonnes of
product under the OLC were traceable.
Drying floors or mats for these chilli peppers in India prevent contamination from the soil, yet many smallholders do not have the funds to buy one.
Applying internationally recognised processing standards across the worldA large part of our processing footprint
is in emerging markets, which do not
necessarily have the same regulatory
frameworks for Quality, Environment,
Health and Safety as developed
nations – for example, a lack of
Occupational, Safety and Health
norms, or a regulatory authority with
strict standards. Perception of risk and
legal compliance can sometimes be
relatively low as consequences may
be limited due to weak enforcement.
Olam therefore instils international
standards and behaviours across our
global operations. By the end of 2016,
Cocoa, Coffee, Dairy, Rice, SVI and
Sugar businesses had achieved
100% BRC/FSSC 22000 certification.
This means that 82% of relevant top
tier food processing facilities are now
BRC/FSSC 22000 certified.
Primary processing units are governed
by our mandated QEHS policies,
standards and codes of practice.
In addition to self-audit, they are
subject to regular audits by regional
Environment, Health and Safety
managers and customers.
Rusmolco: our dairy teams provide high quality feeds for the cows, and regularly check water for nutrient quality, heavy metals, or any other contaminants that might affect animal or human health.
olamgroup.com 61
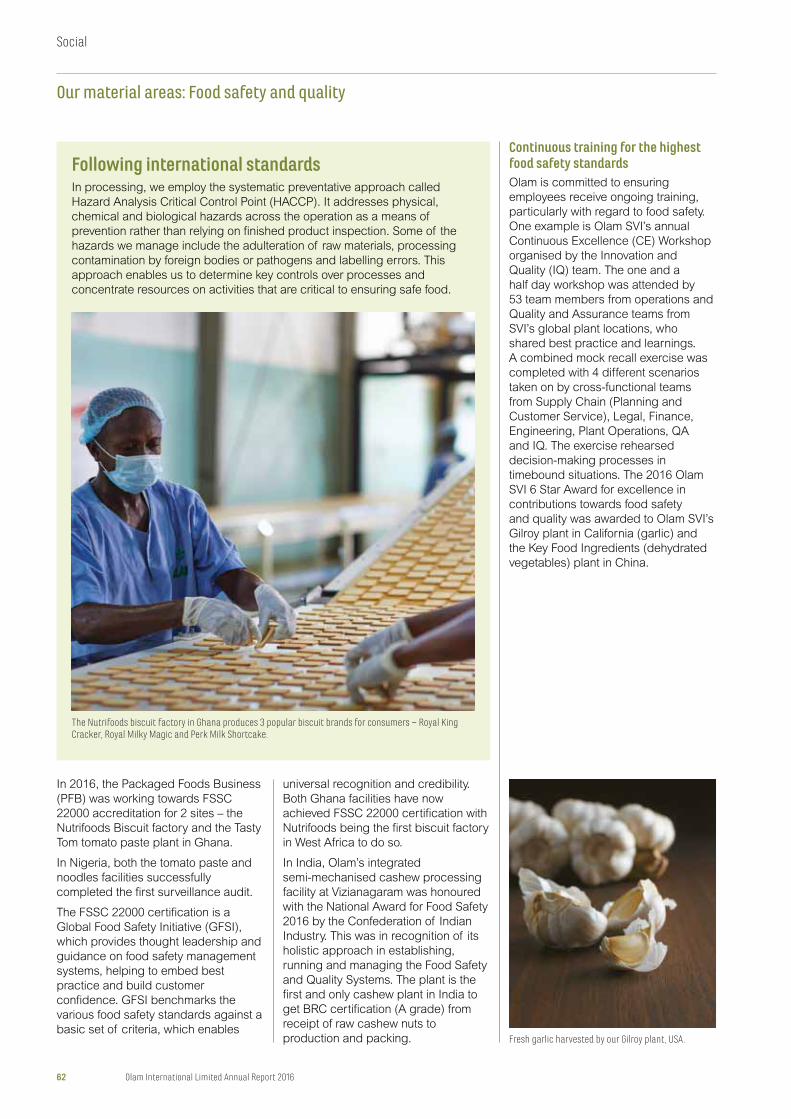
Following international standardsIn processing, we employ the systematic preventative approach called
Hazard Analysis Critical Control Point (HACCP). It addresses physical,
chemical and biological hazards across the operation as a means of
prevention rather than relying on finished product inspection. Some of the
hazards we manage include the adulteration of raw materials, processing
contamination by foreign bodies or pathogens and labelling errors. This
approach enables us to determine key controls over processes and
concentrate resources on activities that are critical to ensuring safe food.
Continuous training for the highest food safety standardsOlam is committed to ensuring
employees receive ongoing training,
particularly with regard to food safety.
One example is Olam SVI’s annual
Continuous Excellence (CE) Workshop
organised by the Innovation and
Quality (IQ) team. The one and a
half day workshop was attended by
53 team members from operations and
Quality and Assurance teams from
SVI’s global plant locations, who
shared best practice and learnings.
A combined mock recall exercise was
completed with 4 different scenarios
taken on by cross-functional teams
from Supply Chain (Planning and
Customer Service), Legal, Finance,
Engineering, Plant Operations, QA
and IQ. The exercise rehearsed
decision-making processes in
timebound situations. The 2016 Olam
SVI 6 Star Award for excellence in
contributions towards food safety
and quality was awarded to Olam SVI’s
Gilroy plant in California (garlic) and
the Key Food Ingredients (dehydrated
vegetables) plant in China.
In 2016, the Packaged Foods Business
(PFB) was working towards FSSC
22000 accreditation for 2 sites – the
Nutrifoods Biscuit factory and the Tasty
Tom tomato paste plant in Ghana.
In Nigeria, both the tomato paste and
noodles facilities successfully
completed the first surveillance audit.
The FSSC 22000 certification is a
Global Food Safety Initiative (GFSI),
which provides thought leadership and
guidance on food safety management
systems, helping to embed best
practice and build customer
confidence. GFSI benchmarks the
various food safety standards against a
basic set of criteria, which enables
universal recognition and credibility.
Both Ghana facilities have now
achieved FSSC 22000 certification with
Nutrifoods being the first biscuit factory
in West Africa to do so.
In India, Olam’s integrated
semi-mechanised cashew processing
facility at Vizianagaram was honoured
with the National Award for Food Safety
2016 by the Confederation of Indian
Industry. This was in recognition of its
holistic approach in establishing,
running and managing the Food Safety
and Quality Systems. The plant is the
first and only cashew plant in India to
get BRC certification (A grade) from
receipt of raw cashew nuts to
production and packing. Fresh garlic harvested by our Gilroy plant, USA.
The Nutrifoods biscuit factory in Ghana produces 3 popular biscuit brands for consumers – Royal King Cracker, Royal Milky Magic and Perk Milk Shortcake.
62 Olam International Limited Annual Report 2016
Our material areas: Food safety and quality
Social
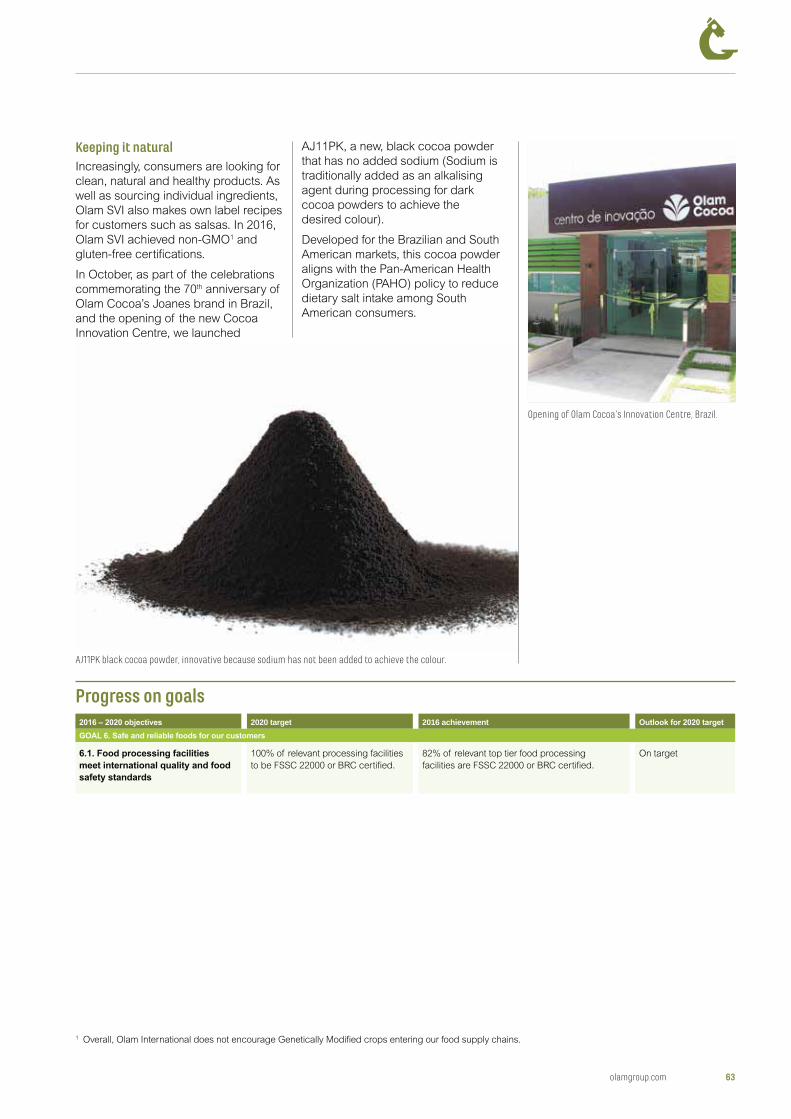
Keeping it naturalIncreasingly, consumers are looking for
clean, natural and healthy products. As
well as sourcing individual ingredients,
Olam SVI also makes own label recipes
for customers such as salsas. In 2016,
Olam SVI achieved non-GMO1 and
gluten-free certifications.
In October, as part of the celebrations
commemorating the 70th anniversary of
Olam Cocoa’s Joanes brand in Brazil,
and the opening of the new Cocoa
Innovation Centre, we launched
Opening of Olam Cocoa’s Innovation Centre, Brazil.
AJ11PK, a new, black cocoa powder
that has no added sodium (Sodium is
traditionally added as an alkalising
agent during processing for dark
cocoa powders to achieve the
desired colour).
Developed for the Brazilian and South
American markets, this cocoa powder
aligns with the Pan-American Health
Organization (PAHO) policy to reduce
dietary salt intake among South
American consumers.
Progress on goals2020 target 2016 achievement
100% of relevant processing facilities
to be FSSC 22000 or BRC certified.
82% of relevant top tier food processing
facilities are FSSC 22000 or BRC certified.
On target
1 Overall, Olam International does not encourage Genetically Modified crops entering our food supply chains.
AJ11PK black cocoa powder, innovative because sodium has not been added to achieve the colour.
olamgroup.com 63
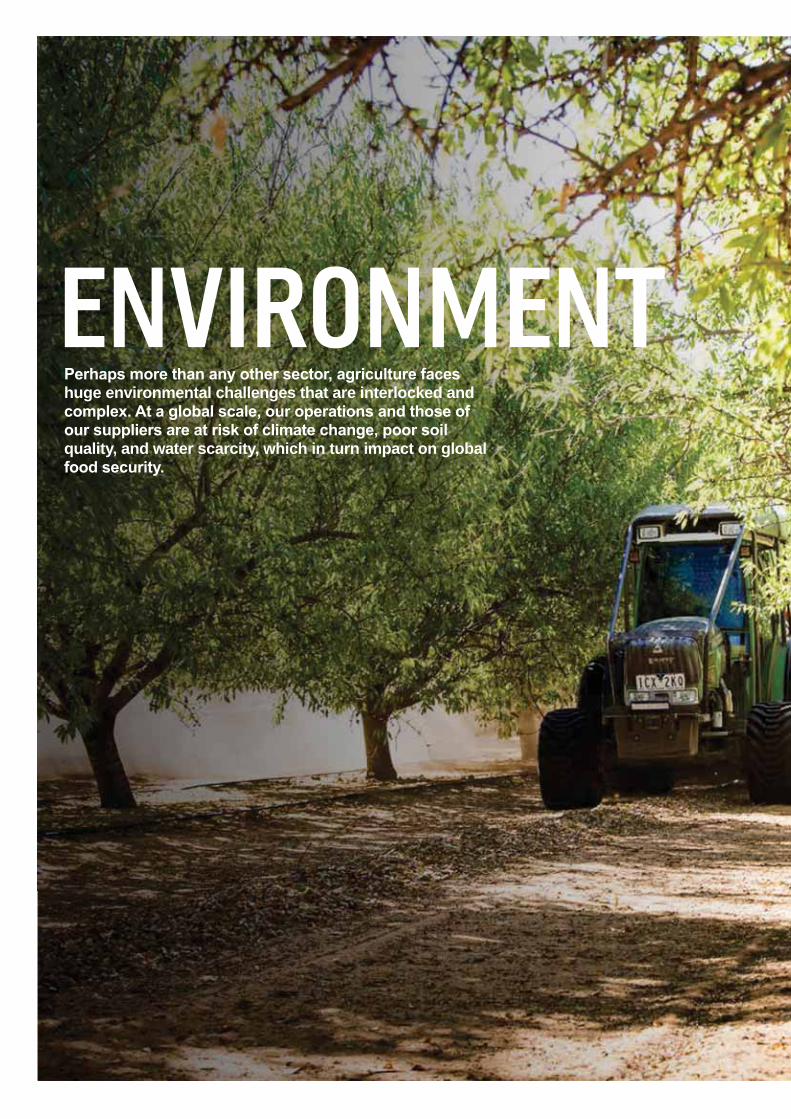
ENVIRONMENThuge environmental challenges that are interlocked and
quality, and water scarcity, which in turn impact on global
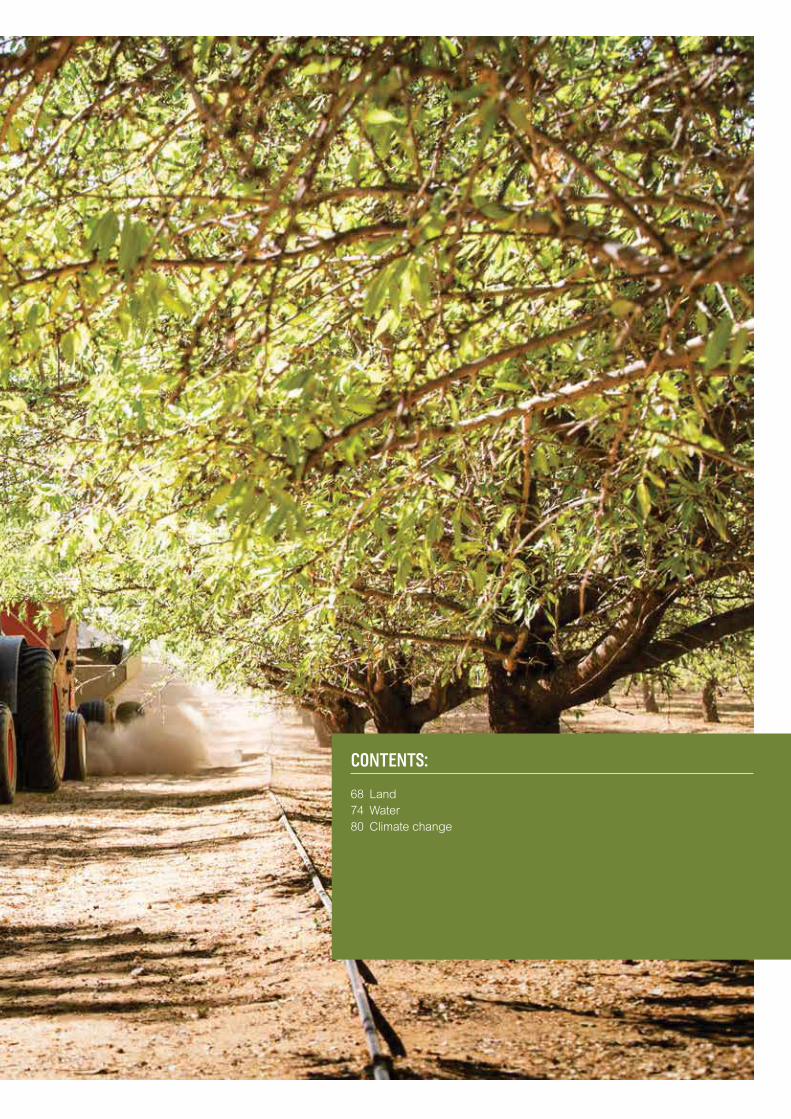
CONTENTS:
68 Land
74 Water
80 Climate change
This section explores our achievements and challenges in 3 of our material areas that focus on environmental impacts: land, water and climate change.
Land68
Water74
Climate change80
66 Olam International Limited Annual Report 2016
Environment
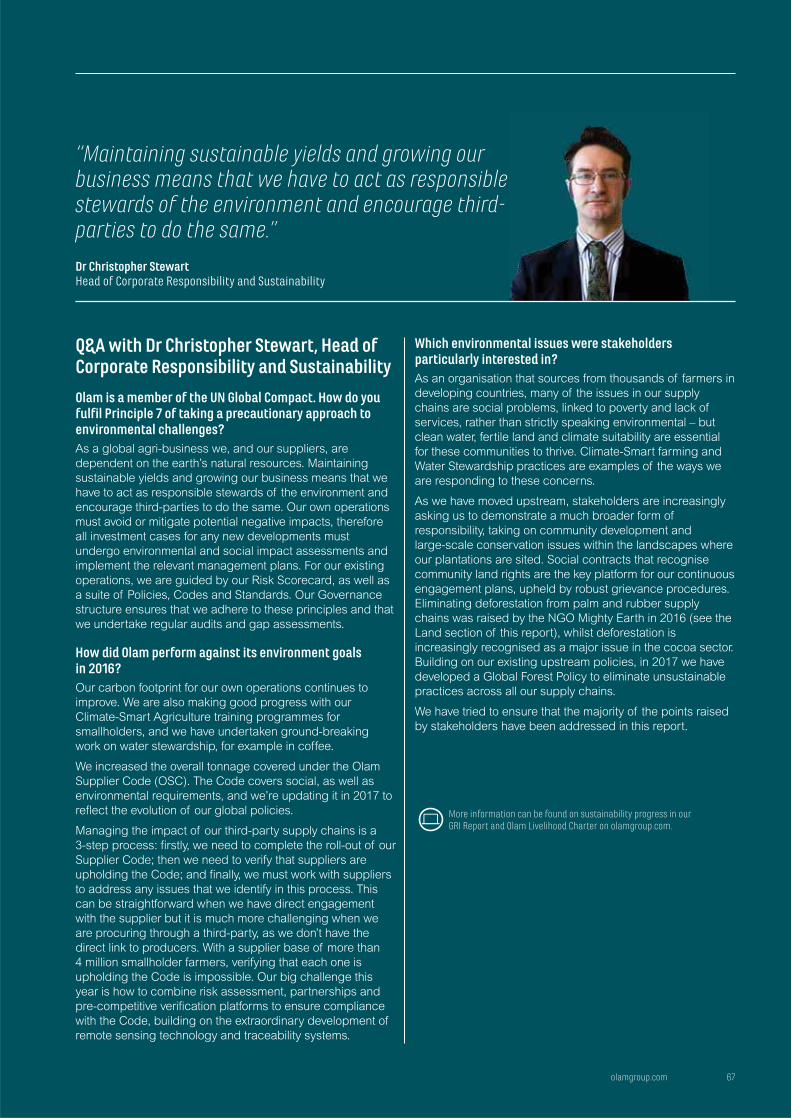
Q&A with Dr Christopher Stewart, Head of Corporate Responsibility and Sustainability
Olam is a member of the UN Global Compact. How do you fulfil Principle 7 of taking a precautionary approach to environmental challenges?As a global agri-business we, and our suppliers, are
dependent on the earth’s natural resources. Maintaining
sustainable yields and growing our business means that we
have to act as responsible stewards of the environment and
encourage third-parties to do the same. Our own operations
must avoid or mitigate potential negative impacts, therefore
all investment cases for any new developments must
undergo environmental and social impact assessments and
implement the relevant management plans. For our existing
operations, we are guided by our Risk Scorecard, as well as
a suite of Policies, Codes and Standards. Our Governance
structure ensures that we adhere to these principles and that
we undertake regular audits and gap assessments.
How did Olam perform against its environment goals in 2016?Our carbon footprint for our own operations continues to
improve. We are also making good progress with our
Climate-Smart Agriculture training programmes for
smallholders, and we have undertaken ground-breaking
work on water stewardship, for example in coffee.
We increased the overall tonnage covered under the Olam
Supplier Code (OSC). The Code covers social, as well as
environmental requirements, and we’re updating it in 2017 to
reflect the evolution of our global policies.
Managing the impact of our third-party supply chains is a
3-step process: firstly, we need to complete the roll-out of our
Supplier Code; then we need to verify that suppliers are
upholding the Code; and finally, we must work with suppliers
to address any issues that we identify in this process. This
can be straightforward when we have direct engagement
with the supplier but it is much more challenging when we
are procuring through a third-party, as we don’t have the
direct link to producers. With a supplier base of more than
4 million smallholder farmers, verifying that each one is
upholding the Code is impossible. Our big challenge this
year is how to combine risk assessment, partnerships and
pre-competitive verification platforms to ensure compliance
with the Code, building on the extraordinary development of
remote sensing technology and traceability systems.
Which environmental issues were stakeholders particularly interested in?As an organisation that sources from thousands of farmers in
developing countries, many of the issues in our supply
chains are social problems, linked to poverty and lack of
services, rather than strictly speaking environmental – but
clean water, fertile land and climate suitability are essential
for these communities to thrive. Climate-Smart farming and
Water Stewardship practices are examples of the ways we
are responding to these concerns.
As we have moved upstream, stakeholders are increasingly
asking us to demonstrate a much broader form of
responsibility, taking on community development and
large-scale conservation issues within the landscapes where
our plantations are sited. Social contracts that recognise
community land rights are the key platform for our continuous
engagement plans, upheld by robust grievance procedures.
Eliminating deforestation from palm and rubber supply
chains was raised by the NGO Mighty Earth in 2016 (see the
Land section of this report), whilst deforestation is
increasingly recognised as a major issue in the cocoa sector.
Building on our existing upstream policies, in 2017 we have
developed a Global Forest Policy to eliminate unsustainable
practices across all our supply chains.
We have tried to ensure that the majority of the points raised
by stakeholders have been addressed in this report.
More information can be found on sustainability progress in our GRI Report and Olam Livelihood Charter on olamgroup.com.
“Maintaining sustainable yields and growing our business means that we have to act as responsible stewards of the environment and encourage third-parties to do the same.”
Dr Christopher StewartHead of Corporate Responsibility and Sustainability
olamgroup.com 67
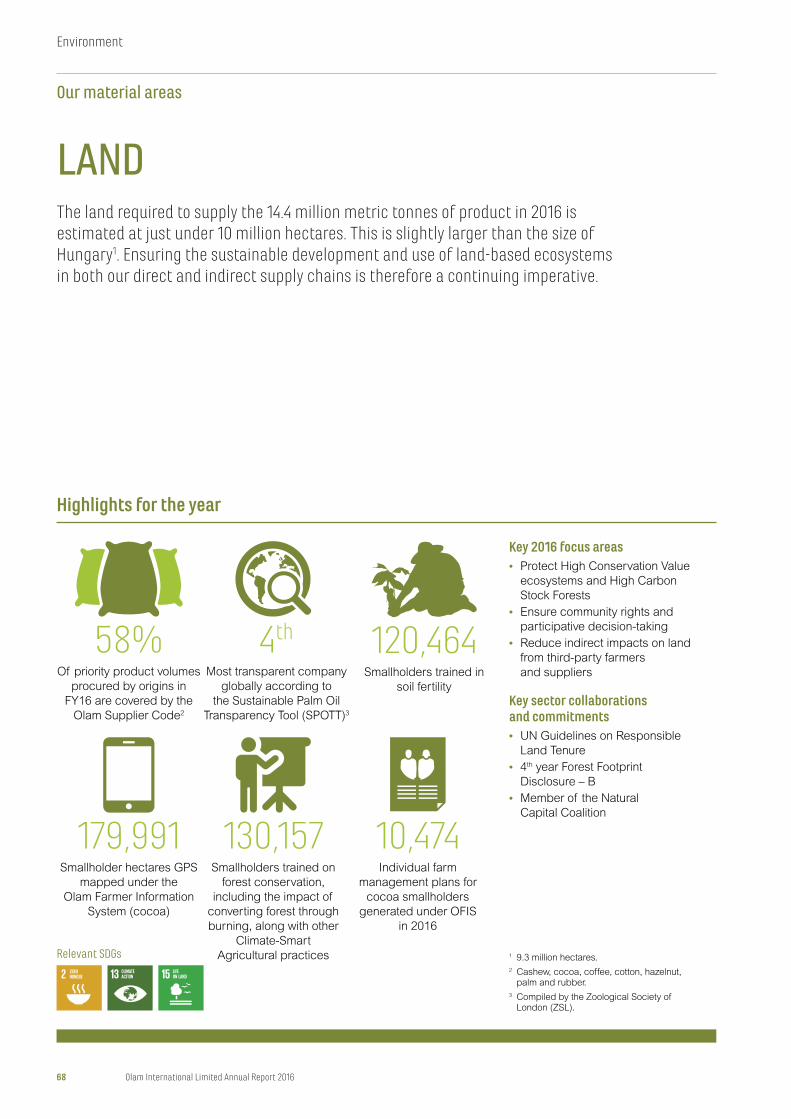
LANDThe land required to supply the 14.4 million metric tonnes of product in 2016 is estimated at just under 10 million hectares. This is slightly larger than the size of Hungary1. Ensuring the sustainable development and use of land-based ecosystems in both our direct and indirect supply chains is therefore a continuing imperative.
Highlights for the year
Key 2016 focus areas• Protect High Conservation Value
ecosystems and High Carbon
Stock Forests
• Ensure community rights and
participative decision-taking
• Reduce indirect impacts on land
from third-party farmers
and suppliers
Key sector collaborations and commitments• UN Guidelines on Responsible
Land Tenure
• 4th year Forest Footprint
Disclosure – B
• Member of the Natural
Capital Coalition
1 9.3 million hectares.
2 Cashew, cocoa, coffee, cotton, hazelnut, palm and rubber.
3 Compiled by the Zoological Society of London (ZSL).
58%Of priority product volumes
procured by origins in
FY16 are covered by the
Olam Supplier Code2
120,464 Smallholders trained in
soil fertility
10,474Individual farm
management plans for
cocoa smallholders
generated under OFIS
in 2016
130,157Smallholders trained on
forest conservation,
including the impact of
converting forest through
burning, along with other
Climate-Smart
Agricultural practices
4th
Most transparent company
globally according to
the Sustainable Palm Oil
Transparency Tool (SPOTT)3
179,991 Smallholder hectares GPS
mapped under the
Olam Farmer Information
System (cocoa)
Relevant SDGs
68 Olam International Limited Annual Report 2016
Environment
Our material areas
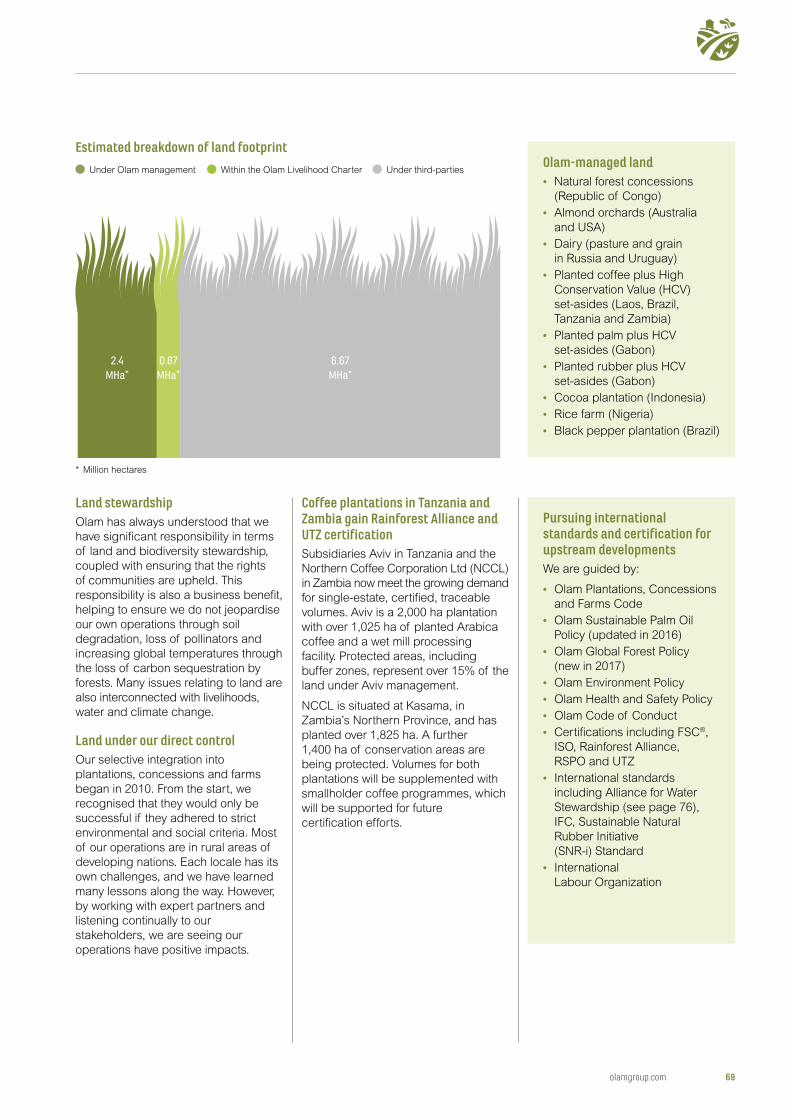
Land stewardshipOlam has always understood that we
have significant responsibility in terms
of land and biodiversity stewardship,
coupled with ensuring that the rights
of communities are upheld. This
responsibility is also a business benefit,
helping to ensure we do not jeopardise
our own operations through soil
degradation, loss of pollinators and
increasing global temperatures through
the loss of carbon sequestration by
forests. Many issues relating to land are
also interconnected with livelihoods,
water and climate change.
Land under our direct controlOur selective integration into
plantations, concessions and farms
began in 2010. From the start, we
recognised that they would only be
successful if they adhered to strict
environmental and social criteria. Most
of our operations are in rural areas of
developing nations. Each locale has its
own challenges, and we have learned
many lessons along the way. However,
by working with expert partners and
listening continually to our
stakeholders, we are seeing our
operations have positive impacts.
Coffee plantations in Tanzania and Zambia gain Rainforest Alliance and UTZ certificationSubsidiaries Aviv in Tanzania and the
Northern Coffee Corporation Ltd (NCCL)
in Zambia now meet the growing demand
for single-estate, certified, traceable
volumes. Aviv is a 2,000 ha plantation
with over 1,025 ha of planted Arabica
coffee and a wet mill processing
facility. Protected areas, including
buffer zones, represent over 15% of the
land under Aviv management.
NCCL is situated at Kasama, in
Zambia’s Northern Province, and has
planted over 1,825 ha. A further
1,400 ha of conservation areas are
being protected. Volumes for both
plantations will be supplemented with
smallholder coffee programmes, which
will be supported for future
certification efforts.
Estimated breakdown of land footprint
Under Olam management Within the Olam Livelihood Charter Under third-parties
2.4MHa*
0.67MHa*
6.67MHa*
Pursuing international standards and certification for upstream developmentsWe are guided by:
• Olam Plantations, Concessions
and Farms Code
• Olam Sustainable Palm Oil
Policy (updated in 2016)
• Olam Global Forest Policy
(new in 2017)
• Olam Environment Policy
• Olam Health and Safety Policy
• Olam Code of Conduct
• Certifications including FSC®,
ISO, Rainforest Alliance,
RSPO and UTZ
• International standards
including Alliance for Water
Stewardship (see page 76),
IFC, Sustainable Natural
Rubber Initiative
(SNR-i) Standard
• International
Labour Organization
Olam-managed land• Natural forest concessions
(Republic of Congo)
• Almond orchards (Australia
and USA)
• Dairy (pasture and grain
in Russia and Uruguay)
• Planted coffee plus High
Conservation Value (HCV)
set-asides (Laos, Brazil,
Tanzania and Zambia)
• Planted palm plus HCV
set-asides (Gabon)
• Planted rubber plus HCV
set-asides (Gabon)
• Cocoa plantation (Indonesia)
• Rice farm (Nigeria)
• Black pepper plantation (Brazil)
* Million hectares
olamgroup.com 69
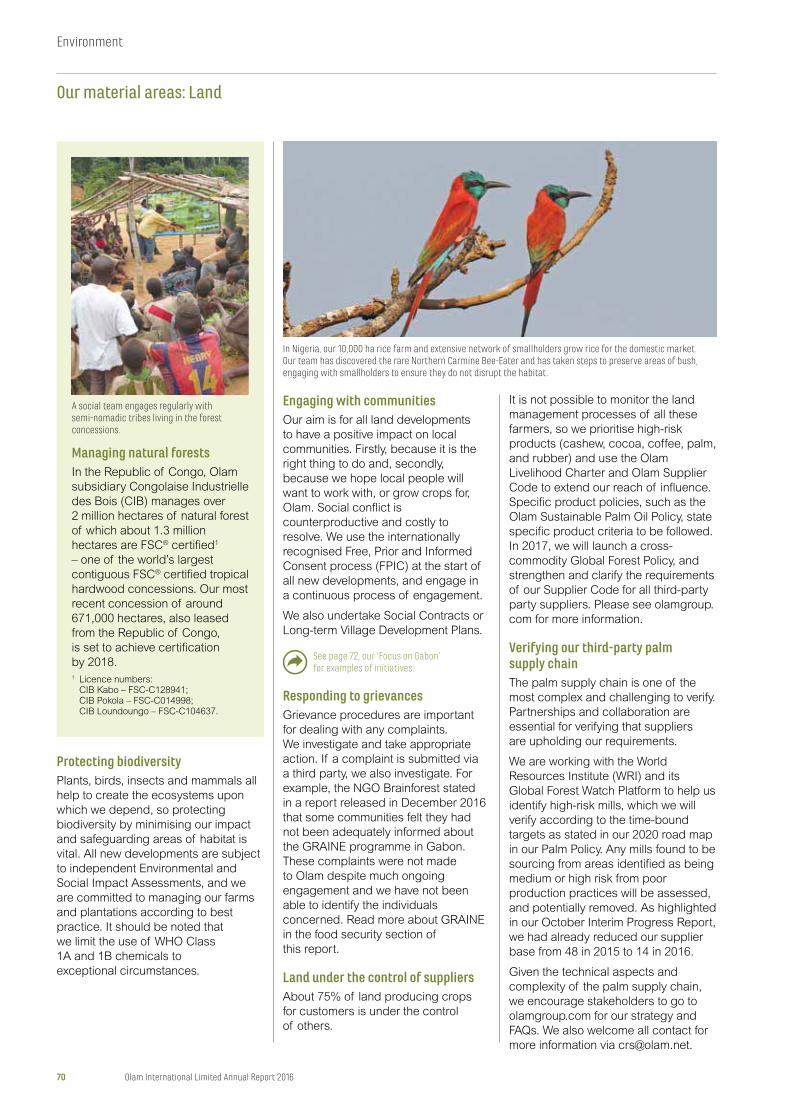
In Nigeria, our 10,000 ha rice farm and extensive network of smallholders grow rice for the domestic market. Our team has discovered the rare Northern Carmine Bee-Eater and has taken steps to preserve areas of bush, engaging with smallholders to ensure they do not disrupt the habitat.
Engaging with communitiesOur aim is for all land developments
to have a positive impact on local
communities. Firstly, because it is the
right thing to do and, secondly,
because we hope local people will
want to work with, or grow crops for,
Olam. Social conflict is
counterproductive and costly to
resolve. We use the internationally
recognised Free, Prior and Informed
Consent process (FPIC) at the start of
all new developments, and engage in
a continuous process of engagement.
We also undertake Social Contracts or
Long-term Village Development Plans.
See page 72, our ‘Focus on Gabon’ for examples of initiatives.
Responding to grievancesGrievance procedures are important
for dealing with any complaints.
We investigate and take appropriate
action. If a complaint is submitted via
a third party, we also investigate. For
example, the NGO Brainforest stated
in a report released in December 2016
that some communities felt they had
not been adequately informed about
the GRAINE programme in Gabon.
These complaints were not made
to Olam despite much ongoing
engagement and we have not been
able to identify the individuals
concerned. Read more about GRAINE
in the food security section of
this report.
Land under the control of suppliersAbout 75% of land producing crops
for customers is under the control
of others.
Managing natural forestsIn the Republic of Congo, Olam
subsidiary Congolaise Industrielle
des Bois (CIB) manages over
2 million hectares of natural forest
of which about 1.3 million
hectares are FSC® certified1
– one of the world’s largest
contiguous FSC® certified tropical
hardwood concessions. Our most
recent concession of around
671,000 hectares, also leased
from the Republic of Congo,
is set to achieve certification
by 2018.1 Licence numbers:
CIB Kabo – FSC-C128941; CIB Pokola – FSC-C014998; CIB Loundoungo – FSC-C104637.
A social team engages regularly with semi-nomadic tribes living in the forest concessions.
It is not possible to monitor the land
management processes of all these
farmers, so we prioritise high-risk
products (cashew, cocoa, coffee, palm,
and rubber) and use the Olam
Livelihood Charter and Olam Supplier
Code to extend our reach of influence.
Specific product policies, such as the
Olam Sustainable Palm Oil Policy, state
specific product criteria to be followed.
In 2017, we will launch a cross-
commodity Global Forest Policy, and
strengthen and clarify the requirements
of our Supplier Code for all third-party
party suppliers. Please see olamgroup.
com for more information.
Verifying our third-party palm supply chainThe palm supply chain is one of the
most complex and challenging to verify.
Partnerships and collaboration are
essential for verifying that suppliers
are upholding our requirements.
We are working with the World
Resources Institute (WRI) and its
Global Forest Watch Platform to help us
identify high-risk mills, which we will
verify according to the time-bound
targets as stated in our 2020 road map
in our Palm Policy. Any mills found to be
sourcing from areas identified as being
medium or high risk from poor
production practices will be assessed,
and potentially removed. As highlighted
in our October Interim Progress Report,
we had already reduced our supplier
base from 48 in 2015 to 14 in 2016.
Given the technical aspects and
complexity of the palm supply chain,
we encourage stakeholders to go to
olamgroup.com for our strategy and
FAQs. We also welcome all contact for
more information via [email protected].
Protecting biodiversityPlants, birds, insects and mammals all
help to create the ecosystems upon
which we depend, so protecting
biodiversity by minimising our impact
and safeguarding areas of habitat is
vital. All new developments are subject
to independent Environmental and
Social Impact Assessments, and we
are committed to managing our farms
and plantations according to best
practice. It should be noted that
we limit the use of WHO Class
1A and 1B chemicals to
exceptional circumstances.
70 Olam International Limited Annual Report 2016
Our material areas: Land
Environment
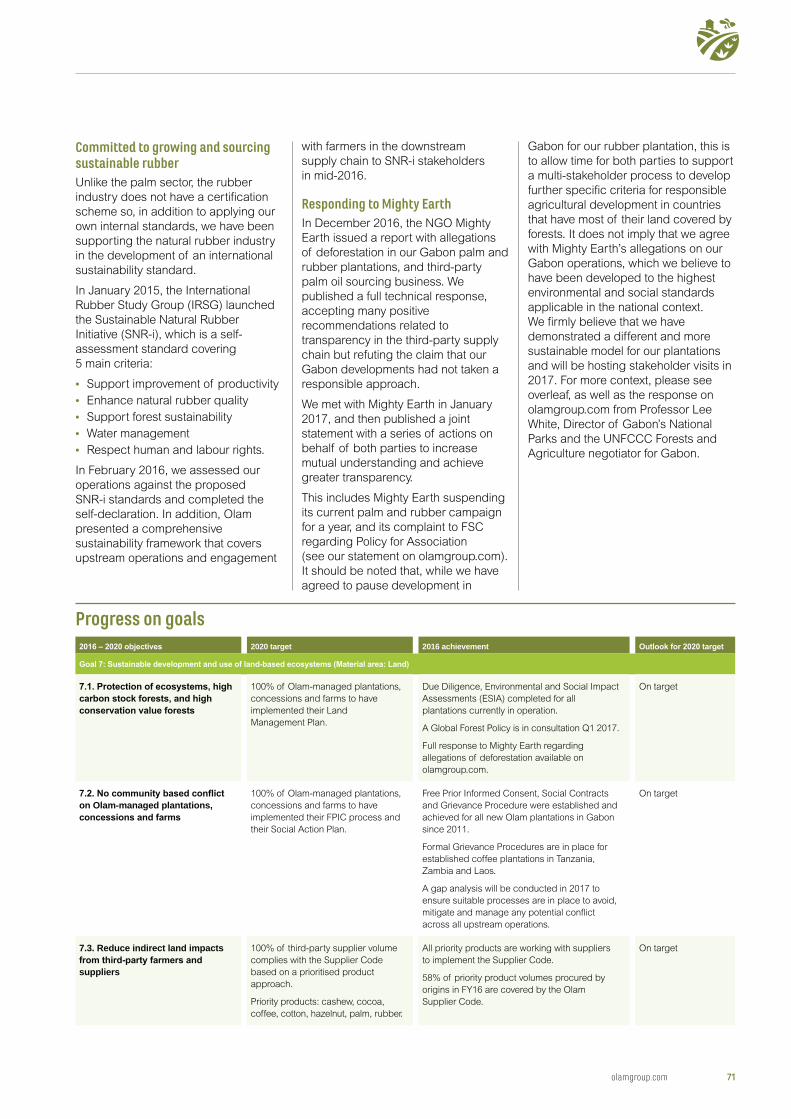
Committed to growing and sourcing sustainable rubberUnlike the palm sector, the rubber
industry does not have a certification
scheme so, in addition to applying our
own internal standards, we have been
supporting the natural rubber industry
in the development of an international
sustainability standard.
In January 2015, the International
Rubber Study Group (IRSG) launched
the Sustainable Natural Rubber
Initiative (SNR-i), which is a self-
assessment standard covering
5 main criteria:
• Support improvement of productivity
• Enhance natural rubber quality
• Support forest sustainability
• Water management
• Respect human and labour rights.
In February 2016, we assessed our
operations against the proposed
SNR-i standards and completed the
self-declaration. In addition, Olam
presented a comprehensive
sustainability framework that covers
upstream operations and engagement
Progress on goals2020 target 2016 achievement
100% of Olam-managed plantations,
concessions and farms to have
implemented their Land
Management Plan.
Due Diligence, Environmental and Social Impact
Assessments (ESIA) completed for all
plantations currently in operation.
A Global Forest Policy is in consultation Q1 2017.
Full response to Mighty Earth regarding
allegations of deforestation available on
olamgroup.com.
On target
on Olam-managed plantations, 100% of Olam-managed plantations,
concessions and farms to have
implemented their FPIC process and
their Social Action Plan.
Free Prior Informed Consent, Social Contracts
and Grievance Procedure were established and
achieved for all new Olam plantations in Gabon
since 2011.
Formal Grievance Procedures are in place for
established coffee plantations in Tanzania,
Zambia and Laos.
A gap analysis will be conducted in 2017 to
ensure suitable processes are in place to avoid,
mitigate and manage any potential conflict
across all upstream operations.
On target
7.3. Reduce indirect land impacts
suppliers
100% of third-party supplier volume
complies with the Supplier Code
based on a prioritised product
approach.
Priority products: cashew, cocoa,
coffee, cotton, hazelnut, palm, rubber.
All priority products are working with suppliers
to implement the Supplier Code.
58% of priority product volumes procured by
origins in FY16 are covered by the Olam
Supplier Code.
On target
with farmers in the downstream
supply chain to SNR-i stakeholders
in mid-2016.
Responding to Mighty EarthIn December 2016, the NGO Mighty
Earth issued a report with allegations
of deforestation in our Gabon palm and
rubber plantations, and third-party
palm oil sourcing business. We
published a full technical response,
accepting many positive
recommendations related to
transparency in the third-party supply
chain but refuting the claim that our
Gabon developments had not taken a
responsible approach.
We met with Mighty Earth in January
2017, and then published a joint
statement with a series of actions on
behalf of both parties to increase
mutual understanding and achieve
greater transparency.
This includes Mighty Earth suspending
its current palm and rubber campaign
for a year, and its complaint to FSC
regarding Policy for Association
(see our statement on olamgroup.com).
It should be noted that, while we have
agreed to pause development in
Gabon for our rubber plantation, this is
to allow time for both parties to support
a multi-stakeholder process to develop
further specific criteria for responsible
agricultural development in countries
that have most of their land covered by
forests. It does not imply that we agree
with Mighty Earth’s allegations on our
Gabon operations, which we believe to
have been developed to the highest
environmental and social standards
applicable in the national context.
We firmly believe that we have
demonstrated a different and more
sustainable model for our plantations
and will be hosting stakeholder visits in
2017. For more context, please see
overleaf, as well as the response on
olamgroup.com from Professor Lee
White, Director of Gabon’s National
Parks and the UNFCCC Forests and
Agriculture negotiator for Gabon.
olamgroup.com 71
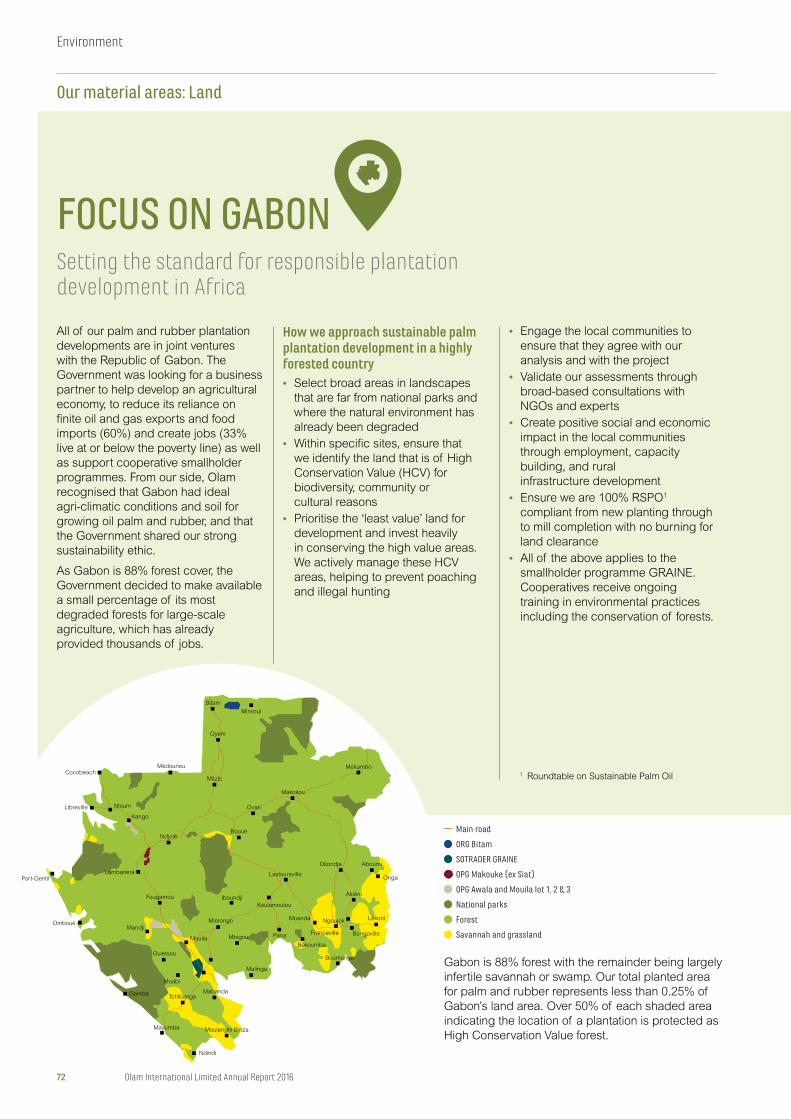
All of our palm and rubber plantation
developments are in joint ventures
with the Republic of Gabon. The
Government was looking for a business
partner to help develop an agricultural
economy, to reduce its reliance on
finite oil and gas exports and food
imports (60%) and create jobs (33%
live at or below the poverty line) as well
as support cooperative smallholder
programmes. From our side, Olam
recognised that Gabon had ideal
agri-climatic conditions and soil for
growing oil palm and rubber, and that
the Government shared our strong
sustainability ethic.
As Gabon is 88% forest cover, the
Government decided to make available
a small percentage of its most
degraded forests for large-scale
agriculture, which has already
provided thousands of jobs.
How we approach sustainable palm plantation development in a highly forested country• Select broad areas in landscapes
that are far from national parks and
where the natural environment has
already been degraded
• Within specific sites, ensure that
we identify the land that is of High
Conservation Value (HCV) for
biodiversity, community or
cultural reasons
• Prioritise the ‘least value’ land for
development and invest heavily
in conserving the high value areas.
We actively manage these HCV
areas, helping to prevent poaching
and illegal hunting
• Engage the local communities to
ensure that they agree with our
analysis and with the project
• Validate our assessments through
broad-based consultations with
NGOs and experts
• Create positive social and economic
impact in the local communities
through employment, capacity
building, and rural
infrastructure development
• Ensure we are 100% RSPO1
compliant from new planting through
to mill completion with no burning for
land clearance
• All of the above applies to the
smallholder programme GRAINE.
Cooperatives receive ongoing
training in environmental practices
including the conservation of forests.
Gabon is 88% forest with the remainder being largely
infertile savannah or swamp. Our total planted area
for palm and rubber represents less than 0.25% of
Gabon’s land area. Over 50% of each shaded area
indicating the location of a plantation is protected as
High Conservation Value forest.
FOCUS ON GABONSetting the standard for responsible plantation development in Africa
Mékambo
Okondja
Makokou
Mitzic
Oyem
Bitam
Minvoul
Aboumi
Onga
Booué
Ovan
Ndjolé
Médouneu
Akiéni
Malinga
Fougamou
Port-Gentil
Omboué
Lambaréné
Cocobeach
Libreville Ntoum
Kango
Mandji
Guietsou
Iboundji
Mimongo
MbigouMouila
Moanda Ngoujok
Bongoville
Lékoni
Boumango
Franceville
Bakoumba
Pana
Koulamoutou
Lastoursville
Mabanda
Moulenghi Binza
Tchibanga
Moabi
Mayumba
Ndindi
Gamba
ORG Bitam
SOTRADER GRAINE
OPG Makouke (ex Siat)
OPG Awala and Mouila lot 1, 2 & 3
National parks
Forest
OPG
OPG A
Natio
Main road
Savannah and grassland
1 Roundtable on Sustainable Palm Oil
72 Olam International Limited Annual Report 2016
Our material areas: Land
Environment
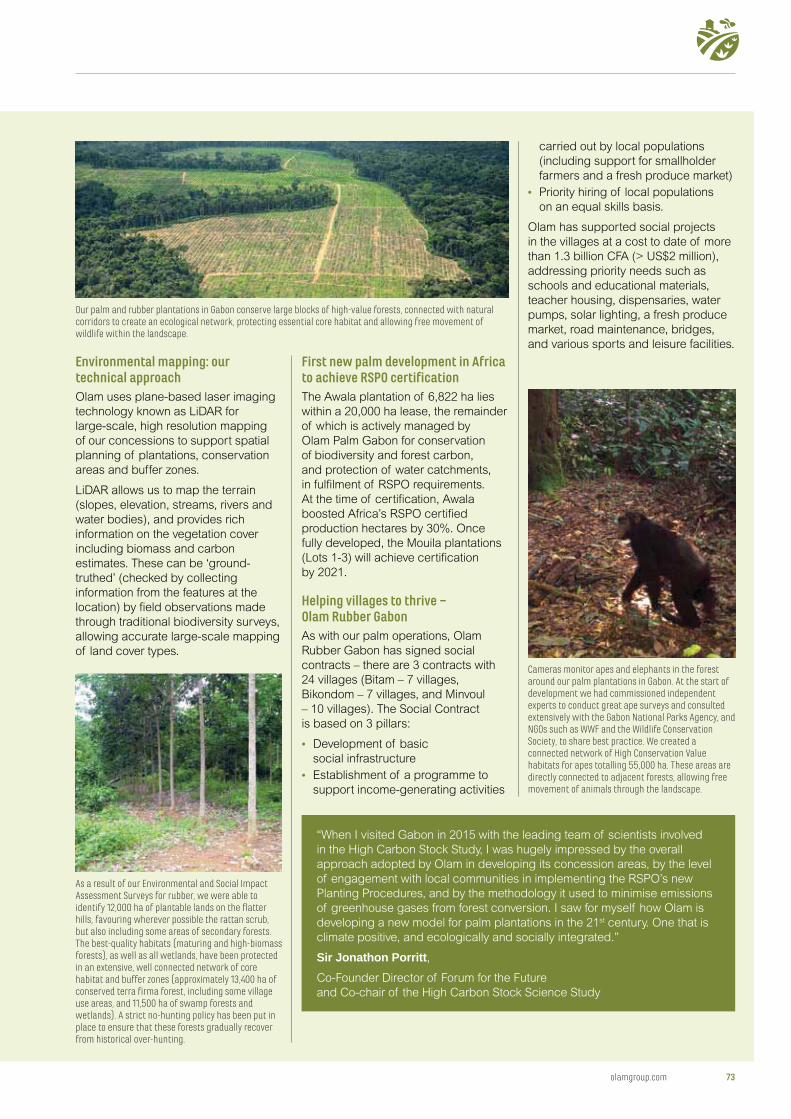
Environmental mapping: our technical approachOlam uses plane-based laser imaging
technology known as LiDAR for
large-scale, high resolution mapping
of our concessions to support spatial
planning of plantations, conservation
areas and buffer zones.
LiDAR allows us to map the terrain
(slopes, elevation, streams, rivers and
water bodies), and provides rich
information on the vegetation cover
including biomass and carbon
estimates. These can be ‘ground-
truthed’ (checked by collecting
information from the features at the
location) by field observations made
through traditional biodiversity surveys,
allowing accurate large-scale mapping
of land cover types.
First new palm development in Africa to achieve RSPO certificationThe Awala plantation of 6,822 ha lies
within a 20,000 ha lease, the remainder
of which is actively managed by
Olam Palm Gabon for conservation
of biodiversity and forest carbon,
and protection of water catchments,
in fulfilment of RSPO requirements.
At the time of certification, Awala
boosted Africa’s RSPO certified
production hectares by 30%. Once
fully developed, the Mouila plantations
(Lots 1-3) will achieve certification
by 2021.
Helping villages to thrive – Olam Rubber GabonAs with our palm operations, Olam
Rubber Gabon has signed social
contracts – there are 3 contracts with
24 villages (Bitam – 7 villages,
Bikondom – 7 villages, and Minvoul
– 10 villages). The Social Contract
is based on 3 pillars:
• Development of basic
social infrastructure
• Establishment of a programme to
support income-generating activities
carried out by local populations
(including support for smallholder
farmers and a fresh produce market)
• Priority hiring of local populations
on an equal skills basis.
Olam has supported social projects
in the villages at a cost to date of more
than 1.3 billion CFA (> US$2 million),
addressing priority needs such as
schools and educational materials,
teacher housing, dispensaries, water
pumps, solar lighting, a fresh produce
market, road maintenance, bridges,
and various sports and leisure facilities.
Cameras monitor apes and elephants in the forest around our palm plantations in Gabon. At the start of development we had commissioned independent experts to conduct great ape surveys and consulted extensively with the Gabon National Parks Agency, and NGOs such as WWF and the Wildlife Conservation Society, to share best practice. We created a connected network of High Conservation Value habitats for apes totalling 55,000 ha. These areas are directly connected to adjacent forests, allowing free movement of animals through the landscape.
Our palm and rubber plantations in Gabon conserve large blocks of high-value forests, connected with natural corridors to create an ecological network, protecting essential core habitat and allowing free movement of wildlife within the landscape.
As a result of our Environmental and Social Impact Assessment Surveys for rubber, we were able to identify 12,000 ha of plantable lands on the flatter hills, favouring wherever possible the rattan scrub, but also including some areas of secondary forests. The best-quality habitats (maturing and high-biomass forests), as well as all wetlands, have been protected in an extensive, well connected network of core habitat and buffer zones (approximately 13,400 ha of conserved terra firma forest, including some village use areas, and 11,500 ha of swamp forests and wetlands). A strict no-hunting policy has been put in place to ensure that these forests gradually recover from historical over-hunting.
“When I visited Gabon in 2015 with the leading team of scientists involved
in the High Carbon Stock Study, I was hugely impressed by the overall
approach adopted by Olam in developing its concession areas, by the level
of engagement with local communities in implementing the RSPO’s new
Planting Procedures, and by the methodology it used to minimise emissions
of greenhouse gases from forest conversion. I saw for myself how Olam is
developing a new model for palm plantations in the 21st century. One that is
climate positive, and ecologically and socially integrated.”
Sir Jonathon Porritt,Co-Founder Director of Forum for the Future
and Co-chair of the High Carbon Stock Science Study
olamgroup.com 73
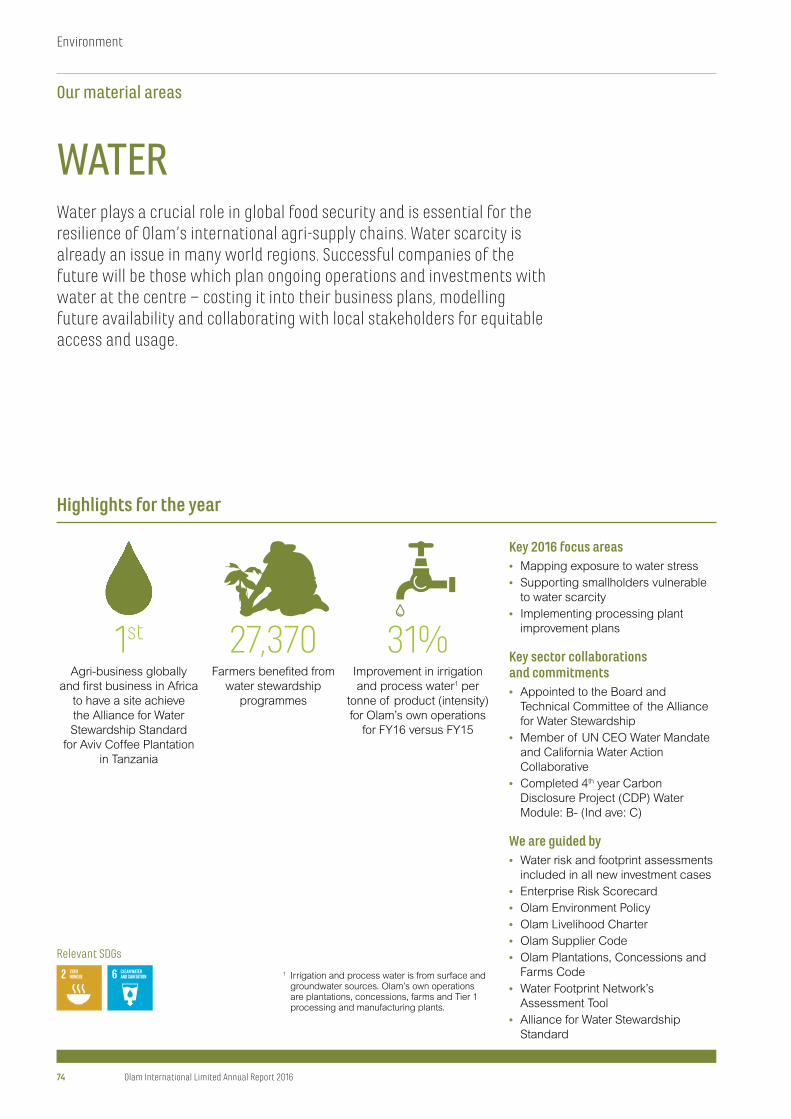
Highlights for the year
Key 2016 focus areas• Mapping exposure to water stress
• Supporting smallholders vulnerable
to water scarcity
• Implementing processing plant
improvement plans
Key sector collaborations and commitments• Appointed to the Board and
Technical Committee of the Alliance
for Water Stewardship
• Member of UN CEO Water Mandate
and California Water Action
Collaborative
• Completed 4th year Carbon
Disclosure Project (CDP) Water
Module: B- (Ind ave: C)
We are guided by• Water risk and footprint assessments
included in all new investment cases
• Enterprise Risk Scorecard
• Olam Environment Policy
• Olam Livelihood Charter
• Olam Supplier Code
• Olam Plantations, Concessions and
Farms Code
• Water Footprint Network’s
Assessment Tool
• Alliance for Water Stewardship
Standard
WATERWater plays a crucial role in global food security and is essential for the resilience of Olam’s international agri-supply chains. Water scarcity is already an issue in many world regions. Successful companies of the future will be those which plan ongoing operations and investments with water at the centre – costing it into their business plans, modelling future availability and collaborating with local stakeholders for equitable access and usage.
1 Irrigation and process water is from surface and groundwater sources. Olam’s own operations are plantations, concessions, farms and Tier 1 processing and manufacturing plants.
1st
Agri-business globally
and first business in Africa
to have a site achieve
the Alliance for Water
Stewardship Standard
for Aviv Coffee Plantation
in Tanzania
27,370Farmers benefited from
water stewardship
programmes
31%Improvement in irrigation
and process water1 per
tonne of product (intensity)
for Olam’s own operations
for FY16 versus FY15
Relevant SDGs
74 Olam International Limited Annual Report 2016
Our material areas
Environment
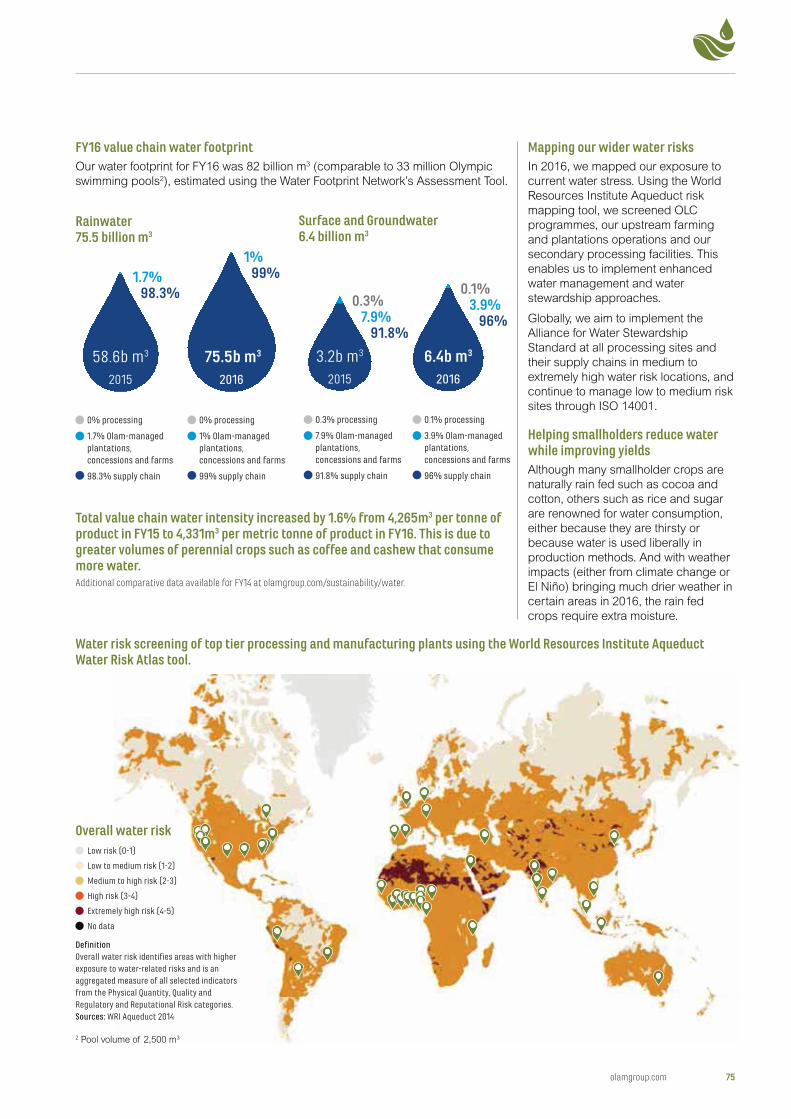
FY16 value chain water footprintOur water footprint for FY16 was 82 billion m3 (comparable to 33 million Olympic
swimming pools2), estimated using the Water Footprint Network’s Assessment Tool.
2 Pool volume of 2,500 m3
Low risk (0-1)
Low to medium risk (1-2)
Medium to high risk (2-3)
High risk (3-4)
Extremely high risk (4-5)
No data
DefinitionOverall water risk identifies areas with higher exposure to water-related risks and is an aggregated measure of all selected indicators from the Physical Quantity, Quality and Regulatory and Reputational Risk categories.Sources: WRI Aqueduct 2014
Overall water risk
Total value chain water intensity increased by 1.6% from 4,265m3 per tonne of product in FY15 to 4,331m3 per metric tonne of product in FY16. This is due to greater volumes of perennial crops such as coffee and cashew that consume more water.Additional comparative data available for FY14 at olamgroup.com/sustainability/water.
0% processing
1.7% Olam-managed plantations,concessions and farms
98.3% supply chain
0% processing
1% Olam-managed plantations,concessions and farms
99% supply chain
99%1%
98.3%1.7%
20162015
58.6b m3 75.5b m3
Mapping our wider water risksIn 2016, we mapped our exposure to
current water stress. Using the World
Resources Institute Aqueduct risk
mapping tool, we screened OLC
programmes, our upstream farming
and plantations operations and our
secondary processing facilities. This
enables us to implement enhanced
water management and water
stewardship approaches.
Globally, we aim to implement the
Alliance for Water Stewardship
Standard at all processing sites and
their supply chains in medium to
extremely high water risk locations, and
continue to manage low to medium risk
sites through ISO 14001.
Helping smallholders reduce water while improving yieldsAlthough many smallholder crops are
naturally rain fed such as cocoa and
cotton, others such as rice and sugar
are renowned for water consumption,
either because they are thirsty or
because water is used liberally in
production methods. And with weather
impacts (either from climate change or
El Niño) bringing much drier weather in
certain areas in 2016, the rain fed
crops require extra moisture.
Rainwater 75.5 billion m3
Surface and Groundwater 6.4 billion m3
0.3% processing
7.9% Olam-managed plantations,concessions and farms
91.8% supply chain
0.1% processing
3.9% Olam-managed plantations,concessions and farms
96% supply chain
96%
0.1%3.9%
3.2b m3 6.4b m3
20162015
7.9%0.3%
91.8%
Water risk screening of top tier processing and manufacturing plants using the World Resources Institute Aqueduct Water Risk Atlas tool.
olamgroup.com 75
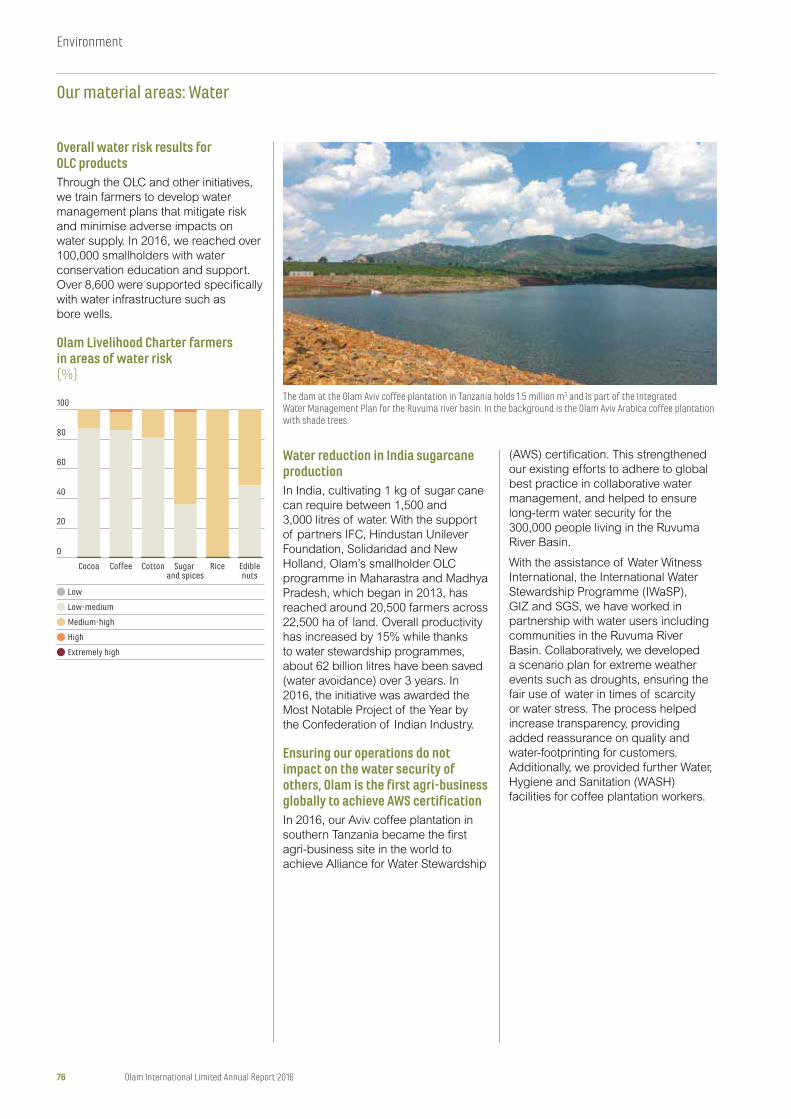
Water reduction in India sugarcane productionIn India, cultivating 1 kg of sugar cane
can require between 1,500 and
3,000 litres of water. With the support
of partners IFC, Hindustan Unilever
Foundation, Solidaridad and New
Holland, Olam’s smallholder OLC
programme in Maharastra and Madhya
Pradesh, which began in 2013, has
reached around 20,500 farmers across
22,500 ha of land. Overall productivity
has increased by 15% while thanks
to water stewardship programmes,
about 62 billion litres have been saved
(water avoidance) over 3 years. In
2016, the initiative was awarded the
Most Notable Project of the Year by
the Confederation of Indian Industry.
Ensuring our operations do not impact on the water security of others, Olam is the first agri-business globally to achieve AWS certificationIn 2016, our Aviv coffee plantation in
southern Tanzania became the first
agri-business site in the world to
achieve Alliance for Water Stewardship
The dam at the Olam Aviv coffee plantation in Tanzania holds 1.5 million m3 and is part of the Integrated Water Management Plan for the Ruvuma river basin. In the background is the Olam Aviv Arabica coffee plantation with shade trees.
0
20
40
60
80
100
CoffeeCocoa Cotton Sugar and spices
Rice Ediblenuts
Low
Low-medium
Medium-high
High
Extremely high
Olam Livelihood Charter farmers in areas of water risk(%)
Overall water risk results for OLC productsThrough the OLC and other initiatives,
we train farmers to develop water
management plans that mitigate risk
and minimise adverse impacts on
water supply. In 2016, we reached over
100,000 smallholders with water
conservation education and support.
Over 8,600 were supported specifically
with water infrastructure such as
bore wells.
(AWS) certification. This strengthened
our existing efforts to adhere to global
best practice in collaborative water
management, and helped to ensure
long-term water security for the
300,000 people living in the Ruvuma
River Basin.
With the assistance of Water Witness
International, the International Water
Stewardship Programme (IWaSP),
GIZ and SGS, we have worked in
partnership with water users including
communities in the Ruvuma River
Basin. Collaboratively, we developed
a scenario plan for extreme weather
events such as droughts, ensuring the
fair use of water in times of scarcity
or water stress. The process helped
increase transparency, providing
added reassurance on quality and
water-footprinting for customers.
Additionally, we provided further Water,
Hygiene and Sanitation (WASH)
facilities for coffee plantation workers.
76 Olam International Limited Annual Report 2016
Our material areas: Water
Environment
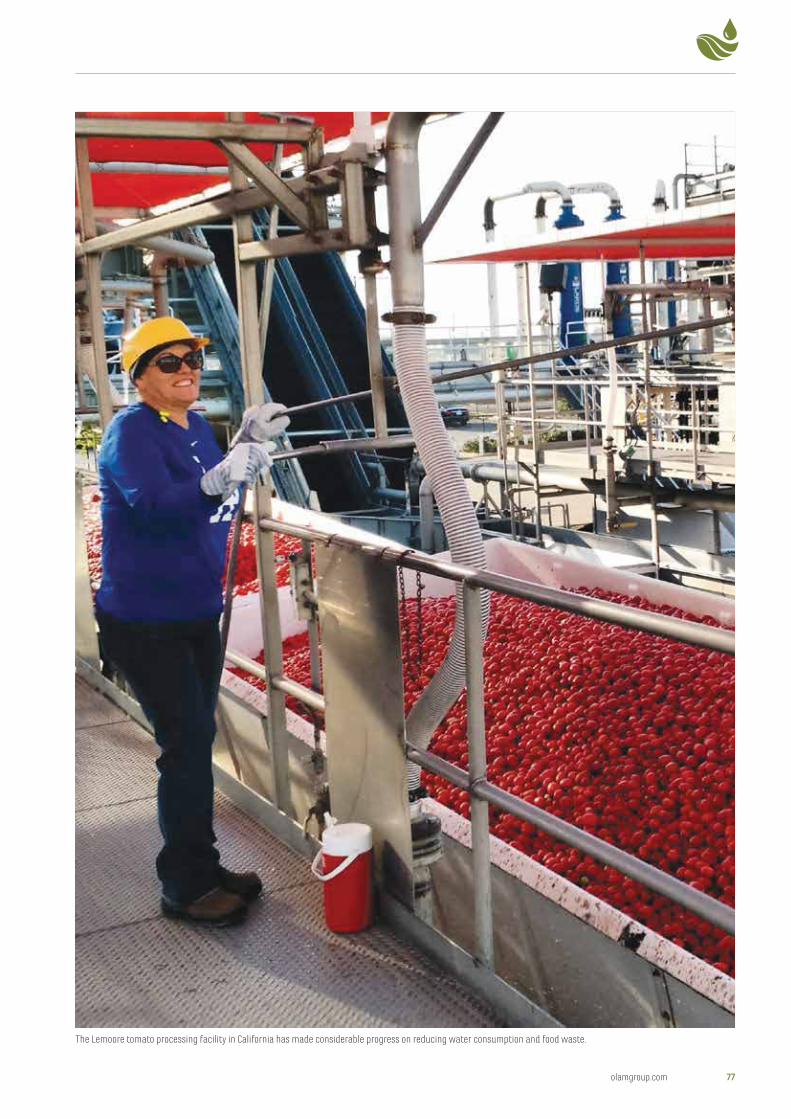
The Lemoore tomato processing facility in California has made considerable progress on reducing water consumption and food waste.
olamgroup.com 77
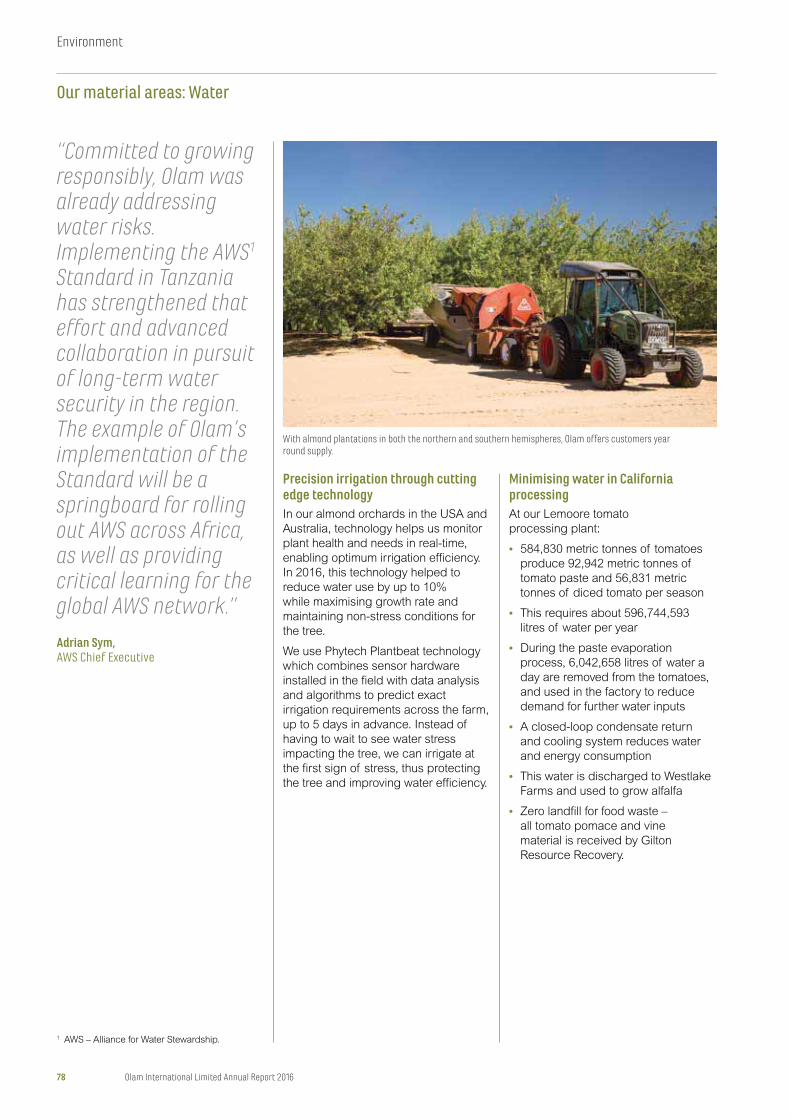
Precision irrigation through cutting edge technologyIn our almond orchards in the USA and
Australia, technology helps us monitor
plant health and needs in real-time,
enabling optimum irrigation efficiency.
In 2016, this technology helped to
reduce water use by up to 10%
while maximising growth rate and
maintaining non-stress conditions for
the tree.
We use Phytech Plantbeat technology
which combines sensor hardware
installed in the field with data analysis
and algorithms to predict exact
irrigation requirements across the farm,
up to 5 days in advance. Instead of
having to wait to see water stress
impacting the tree, we can irrigate at
the first sign of stress, thus protecting
the tree and improving water efficiency.
Minimising water in California processingAt our Lemoore tomato
processing plant:
• 584,830 metric tonnes of tomatoes
produce 92,942 metric tonnes of
tomato paste and 56,831 metric
tonnes of diced tomato per season
• This requires about 596,744,593
litres of water per year
• During the paste evaporation
process, 6,042,658 litres of water a
day are removed from the tomatoes,
and used in the factory to reduce
demand for further water inputs
• A closed-loop condensate return
and cooling system reduces water
and energy consumption
• This water is discharged to Westlake
Farms and used to grow alfalfa
• Zero landfill for food waste –
all tomato pomace and vine
material is received by Gilton
Resource Recovery.
With almond plantations in both the northern and southern hemispheres, Olam offers customers year round supply.
“Committed to growing responsibly, Olam was already addressing water risks. Implementing the AWS1 Standard in Tanzania has strengthened that effort and advanced collaboration in pursuit of long-term water security in the region. The example of Olam’s implementation of the Standard will be a springboard for rolling out AWS across Africa, as well as providing critical learning for the global AWS network.”
Adrian Sym,AWS Chief Executive
1 AWS – Alliance for Water Stewardship.
78 Olam International Limited Annual Report 2016
Our material areas: Water
Environment
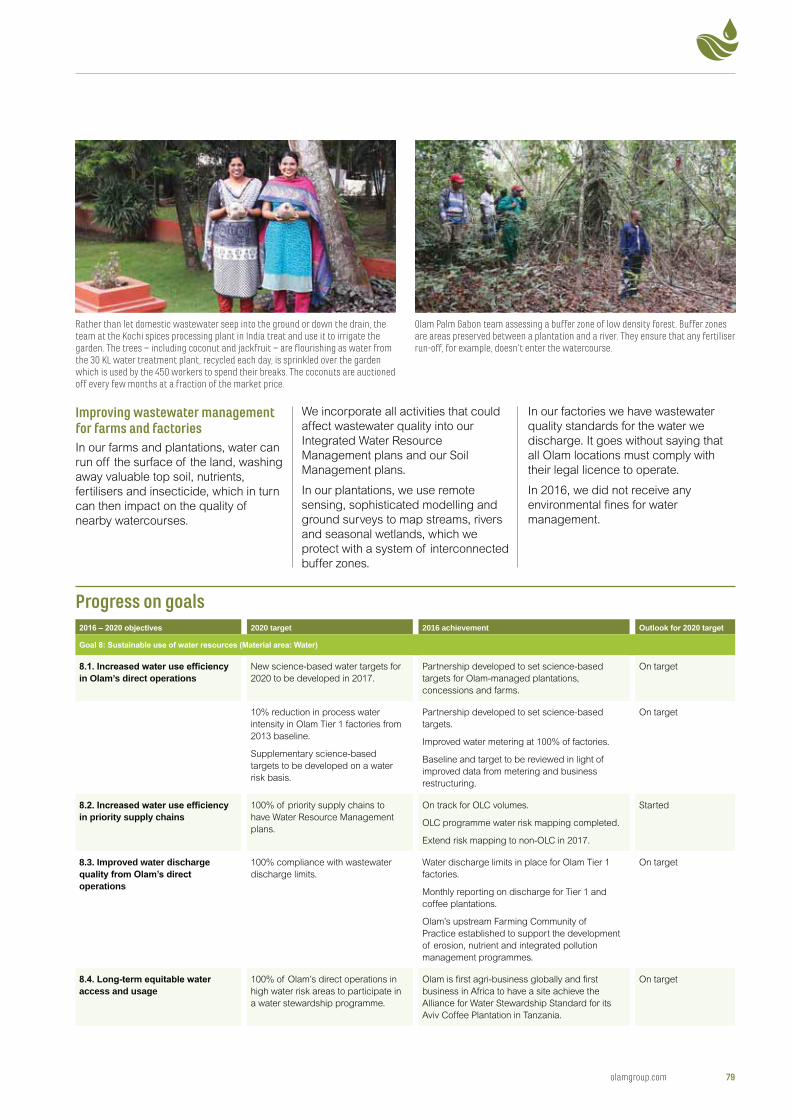
Improving wastewater management for farms and factoriesIn our farms and plantations, water can
run off the surface of the land, washing
away valuable top soil, nutrients,
fertilisers and insecticide, which in turn
can then impact on the quality of
nearby watercourses.
We incorporate all activities that could
affect wastewater quality into our
Integrated Water Resource
Management plans and our Soil
Management plans.
In our plantations, we use remote
sensing, sophisticated modelling and
ground surveys to map streams, rivers
and seasonal wetlands, which we
protect with a system of interconnected
buffer zones.
In our factories we have wastewater
quality standards for the water we
discharge. It goes without saying that
all Olam locations must comply with
their legal licence to operate.
In 2016, we did not receive any
environmental fines for water
management.
Rather than let domestic wastewater seep into the ground or down the drain, the team at the Kochi spices processing plant in India treat and use it to irrigate the garden. The trees – including coconut and jackfruit – are flourishing as water from the 30 KL water treatment plant, recycled each day, is sprinkled over the garden which is used by the 450 workers to spend their breaks. The coconuts are auctioned off every few months at a fraction of the market price.
Olam Palm Gabon team assessing a buffer zone of low density forest. Buffer zones are areas preserved between a plantation and a river. They ensure that any fertiliser run-off, for example, doesn’t enter the watercourse.
Progress on goals2020 target 2016 achievement
in Olam’s direct operationsNew science-based water targets for
2020 to be developed in 2017.
Partnership developed to set science-based
targets for Olam-managed plantations,
concessions and farms.
On target
10% reduction in process water
intensity in Olam Tier 1 factories from
2013 baseline.
Supplementary science-based
targets to be developed on a water
risk basis.
Partnership developed to set science-based
targets.
Improved water metering at 100% of factories.
Baseline and target to be reviewed in light of
improved data from metering and business
restructuring.
On target
in priority supply chains100% of priority supply chains to
have Water Resource Management
plans.
On track for OLC volumes.
OLC programme water risk mapping completed.
Extend risk mapping to non-OLC in 2017.
Started
8.3. Improved water discharge
operations
100% compliance with wastewater
discharge limits.
Water discharge limits in place for Olam Tier 1
factories.
Monthly reporting on discharge for Tier 1 and
coffee plantations.
Olam’s upstream Farming Community of
Practice established to support the development
of erosion, nutrient and integrated pollution
management programmes.
On target
access and usage100% of Olam’s direct operations in
high water risk areas to participate in
a water stewardship programme.
Olam is first agri-business globally and first
business in Africa to have a site achieve the
Alliance for Water Stewardship Standard for its
Aviv Coffee Plantation in Tanzania.
On target
olamgroup.com 79
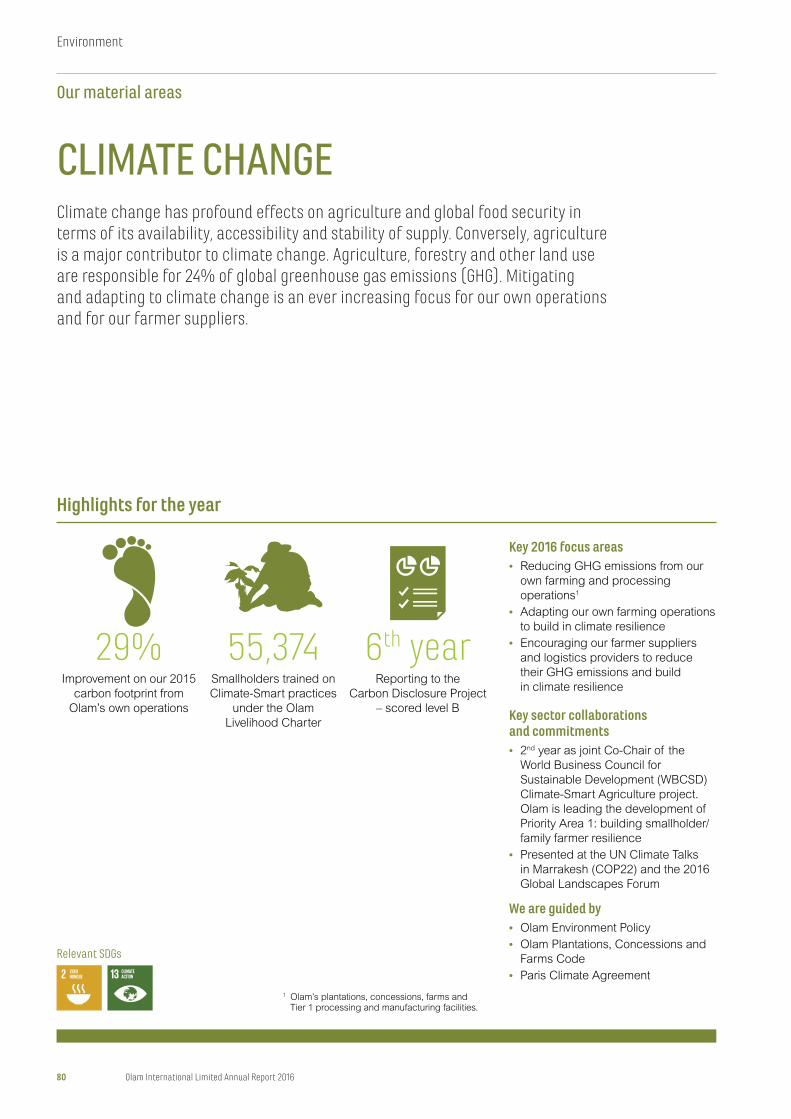
Highlights for the year
Key 2016 focus areas• Reducing GHG emissions from our
own farming and processing
operations1
• Adapting our own farming operations
to build in climate resilience
• Encouraging our farmer suppliers
and logistics providers to reduce
their GHG emissions and build
in climate resilience
Key sector collaborations and commitments• 2nd year as joint Co-Chair of the
World Business Council for
Sustainable Development (WBCSD)
Climate-Smart Agriculture project.
Olam is leading the development of
Priority Area 1: building smallholder/
family farmer resilience
• Presented at the UN Climate Talks
in Marrakesh (COP22) and the 2016
Global Landscapes Forum
We are guided by• Olam Environment Policy
• Olam Plantations, Concessions and
Farms Code
• Paris Climate Agreement
CLIMATE CHANGEClimate change has profound effects on agriculture and global food security in terms of its availability, accessibility and stability of supply. Conversely, agriculture is a major contributor to climate change. Agriculture, forestry and other land use are responsible for 24% of global greenhouse gas emissions (GHG). Mitigating and adapting to climate change is an ever increasing focus for our own operations and for our farmer suppliers.
29%Improvement on our 2015
carbon footprint from
Olam’s own operations
55,374Smallholders trained on
Climate-Smart practices
under the Olam
Livelihood Charter
6th yearReporting to the
Carbon Disclosure Project
– scored level B
1 Olam’s plantations, concessions, farms and Tier 1 processing and manufacturing facilities.
Relevant SDGs
80 Olam International Limited Annual Report 2016
Our material areas
Environment
“Olam is already actively undertaking valuation studies in collaboration with other companies and agencies to determine a viable carbon-pricing framework.”
Chris BrownVice President, Corporate Responsibility and Sustainability
Incentivising the transition to a low carbon economyIf something is free, we will use it
indiscriminately. And the global
community has.
Fossil-fuelled growth, and the
emission of greenhouse gases that
accompanies it, has led the world to
climate change that will have major
consequences for millions of people
and the natural world around us.
This is why we, despite being a
profit-driven company, have called
for a tax on carbon. Commercial
enterprises must be incentivised to
decouple growth from carbon – and
there must be a higher cost to doing
‘business as usual’ if companies are
unwilling to change.
Only then can we stimulate a
concerted effort to increase fossil-fuel
efficiency and, more crucially,
encourage innovation into alternative
energies and efficiency measures.
On our part, Olam is already actively
undertaking valuation studies in
collaboration with other companies
and agencies to determine a viable
carbon-pricing framework. Based on
our work so far, we believe it would be
fair to set an initial global tax of
US$35 – US$50 per tonne. This would
take into account the social costs
linked with impacts of greenhouse
gas emissions, such as subsidies for
crop failure or for health costs as a
result of pollution.
We are exploring 3 types of carbon
pricing: shadow pricing for our
investment cases and business
models to test planned projects under
a range of potential carbon prices;
internal pricing where a fixed price is
assigned to each metric tonne of
emissions which could then be
incorporated into profit-and-loss
statements; and finally internal taxes
which could be levied upon the
business units for their direct
operational emissions to support
investment in clean technologies.
We are already making good
progress, having consistently cut our
carbon footprint year-on-year, and we
will continue to limit our footprint even
as we grow to scale. But even with
this progress, we know more needs
to be done.
Energy efficiency on its own is not
sufficient to limit the global
temperature rise to 2ºC by 2100, as
described by the Paris Climate
Agreement at COP21 in 2015. It may
sound insignificant but given the
difference between today’s average
global temperature and the average
global temperature during the last Ice
Age is only about 5ºC, it really isn’t.
Carbon pricing is one way to
contribute to achievement of this
objective, but there are other options
that are not mutually exclusive. For
example, we’re also actively exploring
alternative energy, including biomass
and solar.
We have also called for incentives
including a greater backing for robust
and validated financial mechanisms,
such as REDD+1 carbon credits to
stimulate the reduction of emissions
from deforestation and forest
degradation.
This will foster conservation,
sustainable management of forests,
and enhancement of forest carbon
stocks, while ensuring that indigenous
communities and biodiversity are
not impacted.
Our Wood Products business in the
Republic of Congo has undertaken
such projects and while the process
is lengthy and complex, progress
is being made.
But incentives must also come into
play for the smallholder farmers. How
do we convince them to take up these
‘new methods’ called ‘Climate-Smart
Agriculture’ when their family has
been farming a certain way for
generations? Or help them
understand why they can’t expand
into the forest next door to grow more
cocoa when their yields are so low
after decades of under-investment?
Explaining these concepts to farmers
with little or no education can be very
challenging. Certification premiums
are one incentive but not every
customer wants to pay for
certification. We must therefore focus
continually on helping farmers to
increase yields and quality by
working directly with them, while
collaborating with peers, NGOs and
governments at a country and sector
level. For many farmers, there is no
short-term incentive, rather they are
putting their trust in our hands, which
is not always easy to carry when
disease or weather means a harvest
is not as abundant as hoped.
But it is clear that incentives, in their
many guises, are crucial if we are
to have any hope of preventing that
2ºC rise.
1 REDD+ Reducing Emissions from Deforestation and forest Degradation in developing countries’ scheme.
olamgroup.com 81
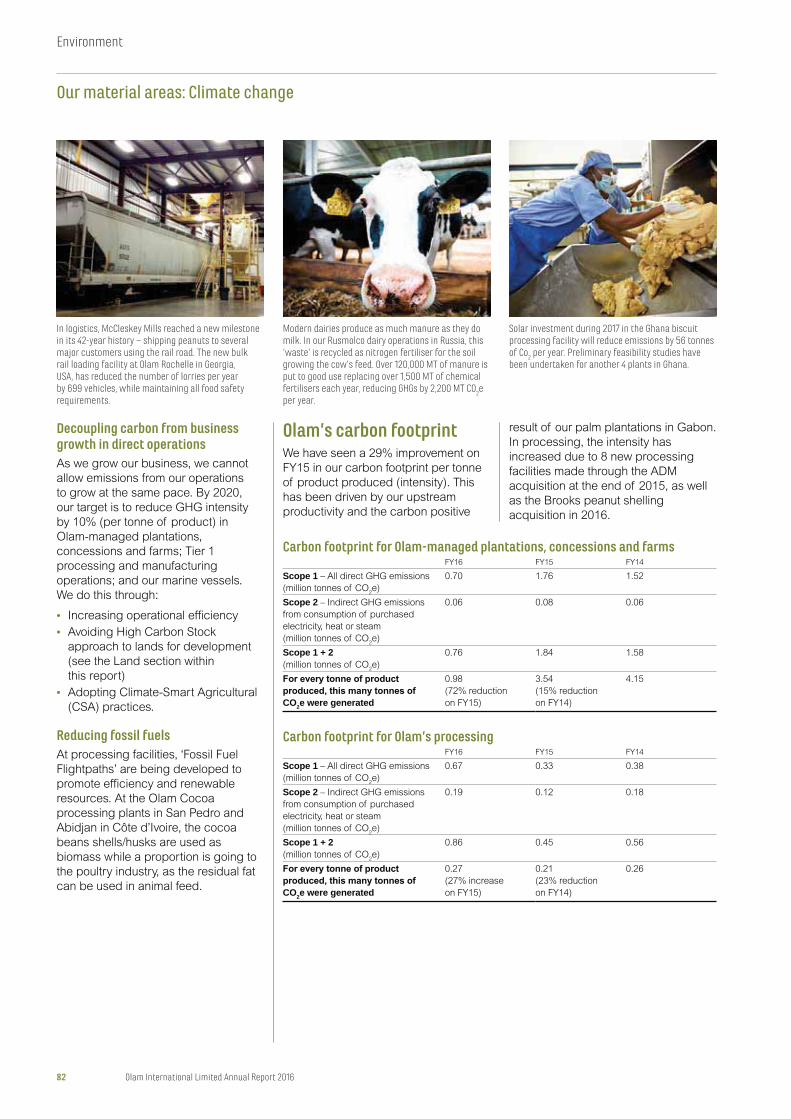
Decoupling carbon from business growth in direct operationsAs we grow our business, we cannot
allow emissions from our operations
to grow at the same pace. By 2020,
our target is to reduce GHG intensity
by 10% (per tonne of product) in
Olam-managed plantations,
concessions and farms; Tier 1
processing and manufacturing
operations; and our marine vessels.
We do this through:
• Increasing operational efficiency
• Avoiding High Carbon Stock
approach to lands for development
(see the Land section within
this report)
• Adopting Climate-Smart Agricultural
(CSA) practices.
Reducing fossil fuelsAt processing facilities, ‘Fossil Fuel
Flightpaths’ are being developed to
promote efficiency and renewable
resources. At the Olam Cocoa
processing plants in San Pedro and
Abidjan in Côte d’Ivoire, the cocoa
beans shells/husks are used as
biomass while a proportion is going to
the poultry industry, as the residual fat
can be used in animal feed.
In logistics, McCleskey Mills reached a new milestone in its 42-year history – shipping peanuts to several major customers using the rail road. The new bulk rail loading facility at Olam Rochelle in Georgia, USA, has reduced the number of lorries per year by 699 vehicles, while maintaining all food safety requirements.
Modern dairies produce as much manure as they do milk. In our Rusmolco dairy operations in Russia, this ‘waste’ is recycled as nitrogen fertiliser for the soil growing the cow’s feed. Over 120,000 MT of manure is put to good use replacing over 1,500 MT of chemical fertilisers each year, reducing GHGs by 2,200 MT CO
2e
per year.
Solar investment during 2017 in the Ghana biscuit processing facility will reduce emissions by 56 tonnes of Co
2 per year. Preliminary feasibility studies have
been undertaken for another 4 plants in Ghana.
Carbon footprint for Olam-managed plantations, concessions and farmsFY16 FY15 FY14
Scope 1 – All direct GHG emissions
(million tonnes of CO2e)
0.70 1.76 1.52
Scope 2 – Indirect GHG emissions
from consumption of purchased
electricity, heat or steam
(million tonnes of CO2e)
0.06 0.08 0.06
Scope 1 + 2(million tonnes of CO
2e)
0.76 1.84 1.58
CO2e were generated
0.98
(72% reduction
on FY15)
3.54
(15% reduction
on FY14)
4.15
Carbon footprint for Olam’s processingFY16 FY15 FY14
Scope 1 – All direct GHG emissions
(million tonnes of CO2e)
0.67 0.33 0.38
Scope 2 – Indirect GHG emissions
from consumption of purchased
electricity, heat or steam
(million tonnes of CO2e)
0.19 0.12 0.18
Scope 1 + 2(million tonnes of CO
2e)
0.86 0.45 0.56
CO2e were generated
0.27
(27% increase
on FY15)
0.21
(23% reduction
on FY14)
0.26
Olam’s carbon footprintWe have seen a 29% improvement on
FY15 in our carbon footprint per tonne
of product produced (intensity). This
has been driven by our upstream
productivity and the carbon positive
result of our palm plantations in Gabon.
In processing, the intensity has
increased due to 8 new processing
facilities made through the ADM
acquisition at the end of 2015, as well
as the Brooks peanut shelling
acquisition in 2016.
82 Olam International Limited Annual Report 2016
Our material areas: Climate change
Environment
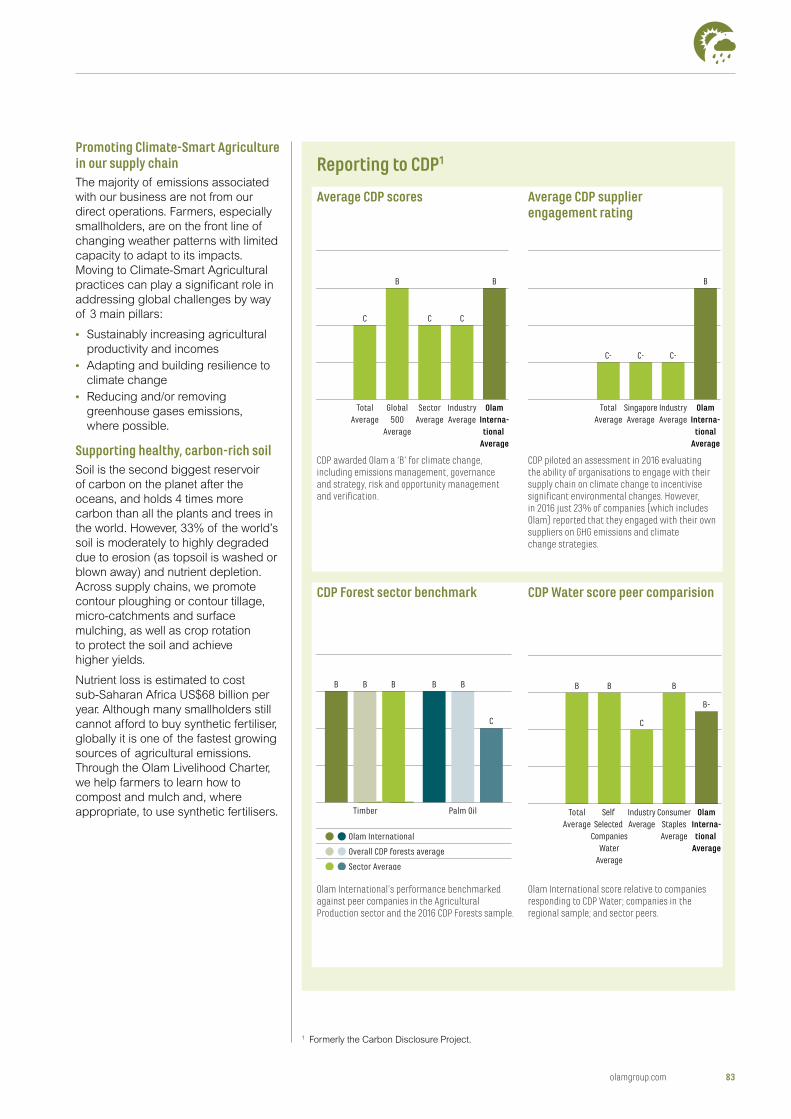
Reporting to CDP1
CDP awarded Olam a ‘B’ for climate change, including emissions management, governance and strategy, risk and opportunity management and verification.
Olam International’s performance benchmarked against peer companies in the Agricultural Production sector and the 2016 CDP Forests sample.
CDP piloted an assessment in 2016 evaluating the ability of organisations to engage with their supply chain on climate change to incentivise significant environmental changes. However, in 2016 just 23% of companies (which includes Olam) reported that they engaged with their own suppliers on GHG emissions and climate change strategies.
Olam International score relative to companies responding to CDP Water; companies in the regional sample; and sector peers.
Average CDP scores
CDP Forest sector benchmark
Average CDP supplier engagement rating
CDP Water score peer comparision
TotalAverage
Global500
Average
SectorAverage
IndustryAverage
OlamInterna-tional
Average
C
B B
C C
Olam International
Overall CDP forests average
Sector Average
BB
C
Timber Palm Oil
BBB
C-
B
C- C-
TotalAverage
SingaporeAverage
IndustryAverage
OlamInterna-
tionalAverage
TotalAverage
Self Selected
CompaniesWater
Average
IndustryAverage
ConsumerStaplesAverage
OlamInterna-tional
Average
B B
B-
C
B
Promoting Climate-Smart Agriculture in our supply chainThe majority of emissions associated
with our business are not from our
direct operations. Farmers, especially
smallholders, are on the front line of
changing weather patterns with limited
capacity to adapt to its impacts.
Moving to Climate-Smart Agricultural
practices can play a significant role in
addressing global challenges by way
of 3 main pillars:
• Sustainably increasing agricultural
productivity and incomes
• Adapting and building resilience to
climate change
• Reducing and/or removing
greenhouse gases emissions,
where possible.
Supporting healthy, carbon-rich soilSoil is the second biggest reservoir
of carbon on the planet after the
oceans, and holds 4 times more
carbon than all the plants and trees in
the world. However, 33% of the world’s
soil is moderately to highly degraded
due to erosion (as topsoil is washed or
blown away) and nutrient depletion.
Across supply chains, we promote
contour ploughing or contour tillage,
micro-catchments and surface
mulching, as well as crop rotation
to protect the soil and achieve
higher yields.
Nutrient loss is estimated to cost
sub-Saharan Africa US$68 billion per
year. Although many smallholders still
cannot afford to buy synthetic fertiliser,
globally it is one of the fastest growing
sources of agricultural emissions.
Through the Olam Livelihood Charter,
we help farmers to learn how to
compost and mulch and, where
appropriate, to use synthetic fertilisers.
1 Formerly the Carbon Disclosure Project.
olamgroup.com 83
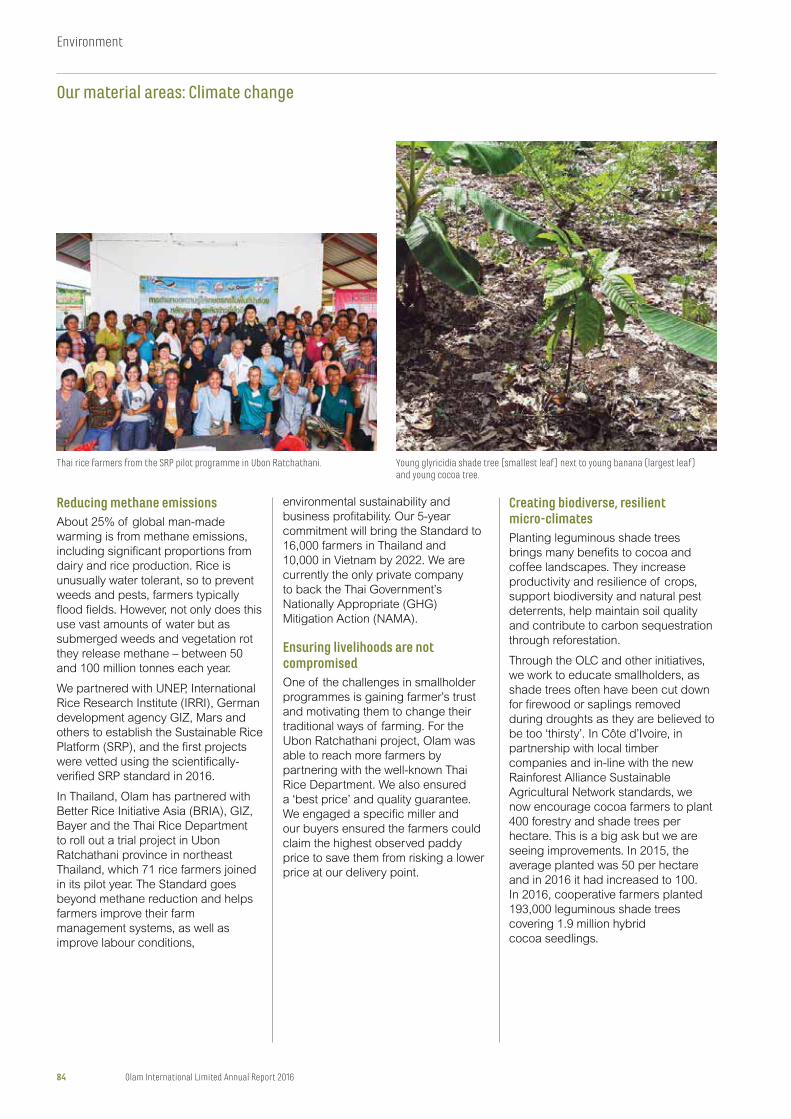
Reducing methane emissionsAbout 25% of global man-made
warming is from methane emissions,
including significant proportions from
dairy and rice production. Rice is
unusually water tolerant, so to prevent
weeds and pests, farmers typically
flood fields. However, not only does this
use vast amounts of water but as
submerged weeds and vegetation rot
they release methane – between 50
and 100 million tonnes each year.
We partnered with UNEP, International
Rice Research Institute (IRRI), German
development agency GIZ, Mars and
others to establish the Sustainable Rice
Platform (SRP), and the first projects
were vetted using the scientifically-
verified SRP standard in 2016.
In Thailand, Olam has partnered with
Better Rice Initiative Asia (BRIA), GIZ,
Bayer and the Thai Rice Department
to roll out a trial project in Ubon
Ratchathani province in northeast
Thailand, which 71 rice farmers joined
in its pilot year. The Standard goes
beyond methane reduction and helps
farmers improve their farm
management systems, as well as
improve labour conditions,
environmental sustainability and
business profitability. Our 5-year
commitment will bring the Standard to
16,000 farmers in Thailand and
10,000 in Vietnam by 2022. We are
currently the only private company
to back the Thai Government’s
Nationally Appropriate (GHG)
Mitigation Action (NAMA).
Ensuring livelihoods are not compromisedOne of the challenges in smallholder
programmes is gaining farmer’s trust
and motivating them to change their
traditional ways of farming. For the
Ubon Ratchathani project, Olam was
able to reach more farmers by
partnering with the well-known Thai
Rice Department. We also ensured
a ‘best price’ and quality guarantee.
We engaged a specific miller and
our buyers ensured the farmers could
claim the highest observed paddy
price to save them from risking a lower
price at our delivery point.
Thai rice farmers from the SRP pilot programme in Ubon Ratchathani.
Creating biodiverse, resilient micro-climatesPlanting leguminous shade trees
brings many benefits to cocoa and
coffee landscapes. They increase
productivity and resilience of crops,
support biodiversity and natural pest
deterrents, help maintain soil quality
and contribute to carbon sequestration
through reforestation.
Through the OLC and other initiatives,
we work to educate smallholders, as
shade trees often have been cut down
for firewood or saplings removed
during droughts as they are believed to
be too ‘thirsty’. In Côte d’Ivoire, in
partnership with local timber
companies and in-line with the new
Rainforest Alliance Sustainable
Agricultural Network standards, we
now encourage cocoa farmers to plant
400 forestry and shade trees per
hectare. This is a big ask but we are
seeing improvements. In 2015, the
average planted was 50 per hectare
and in 2016 it had increased to 100.
In 2016, cooperative farmers planted
193,000 leguminous shade trees
covering 1.9 million hybrid
cocoa seedlings.
Young glyricidia shade tree (smallest leaf) next to young banana (largest leaf) and young cocoa tree.
84 Olam International Limited Annual Report 2016
Our material areas: Climate change
Environment
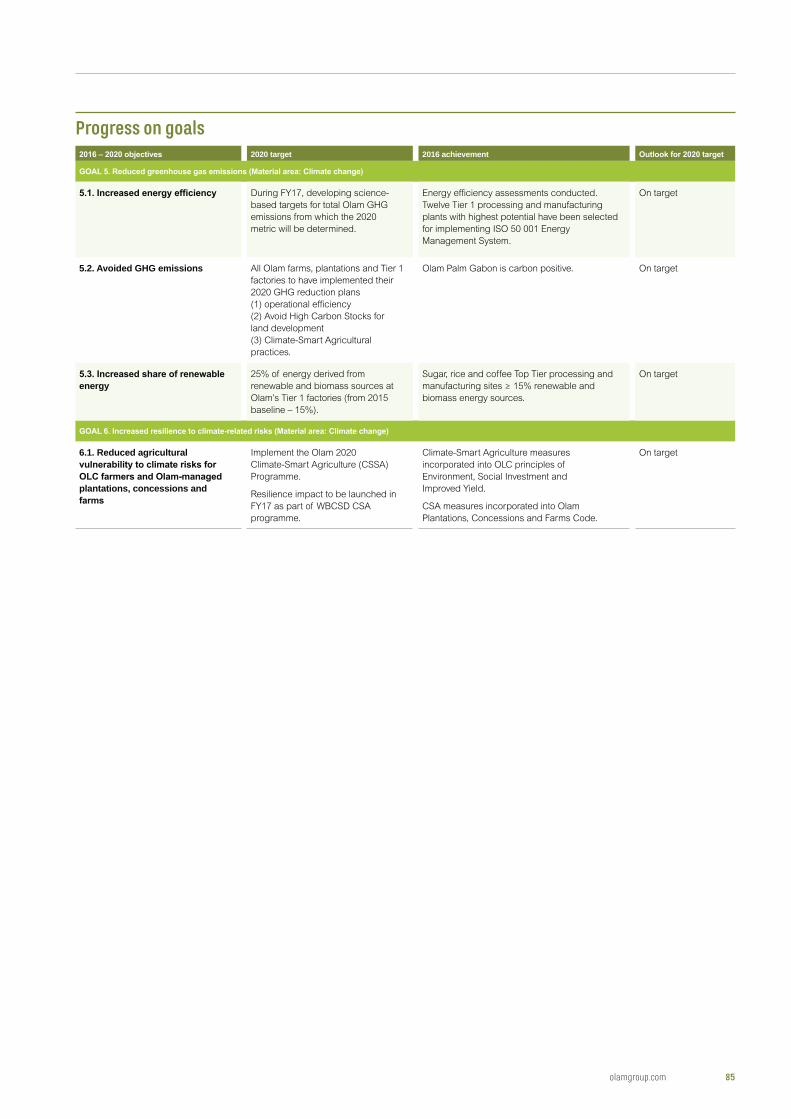
Progress on goals2020 target 2016 achievement
During FY17, developing science-
based targets for total Olam GHG
emissions from which the 2020
metric will be determined.
Energy efficiency assessments conducted.
Twelve Tier 1 processing and manufacturing
plants with highest potential have been selected
for implementing ISO 50 001 Energy
Management System.
On target
5.2. Avoided GHG emissions All Olam farms, plantations and Tier 1
factories to have implemented their
2020 GHG reduction plans
(1) operational efficiency
(2) Avoid High Carbon Stocks for
land development
(3) Climate-Smart Agricultural
practices.
Olam Palm Gabon is carbon positive. On target
energy25% of energy derived from
renewable and biomass sources at
Olam’s Tier 1 factories (from 2015
baseline – 15%).
Sugar, rice and coffee Top Tier processing and
manufacturing sites ≥ 15% renewable and
biomass energy sources.
On target
6.1. Reduced agricultural
plantations, concessions and
Implement the Olam 2020
Climate-Smart Agriculture (CSSA)
Programme.
Resilience impact to be launched in
FY17 as part of WBCSD CSA
programme.
Climate-Smart Agriculture measures
incorporated into OLC principles of
Environment, Social Investment and
Improved Yield.
CSA measures incorporated into Olam
Plantations, Concessions and Farms Code.
On target
olamgroup.com 85
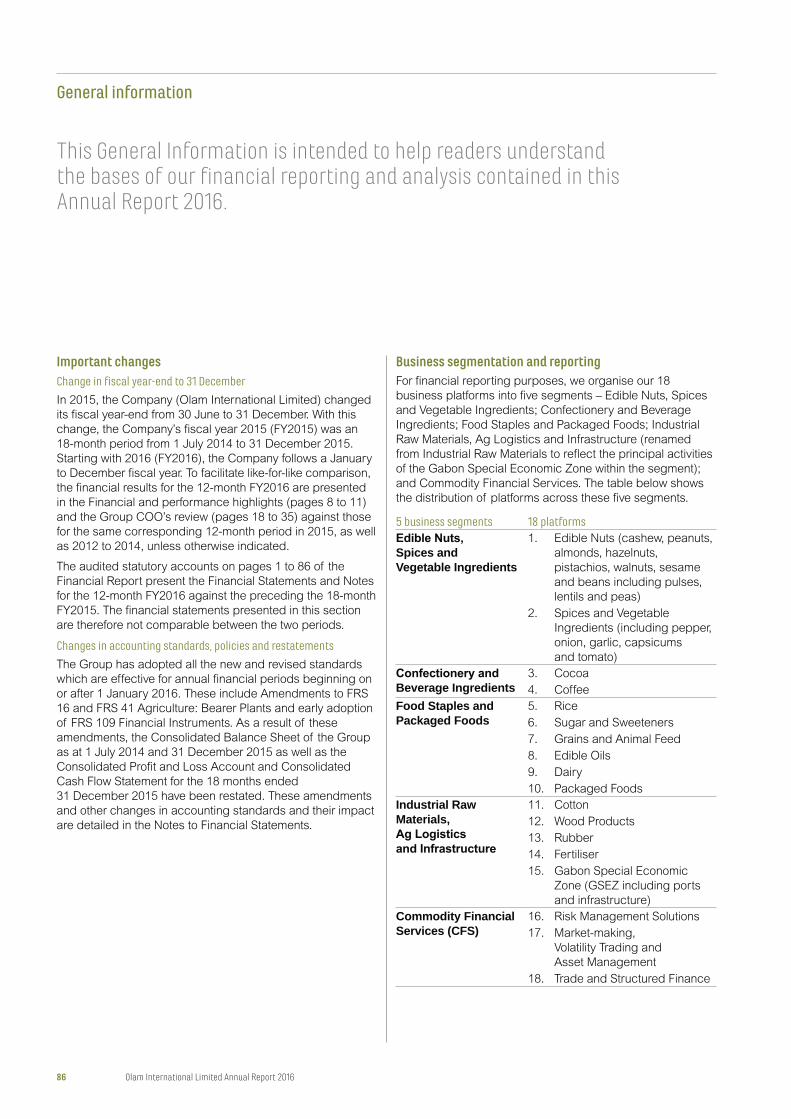
General information
This General Information is intended to help readers understand the bases of our financial reporting and analysis contained in this Annual Report 2016.
Important changesChange in fiscal year-end to 31 December
In 2015, the Company (Olam International Limited) changed
its fiscal year-end from 30 June to 31 December. With this
change, the Company’s fiscal year 2015 (FY2015) was an
18-month period from 1 July 2014 to 31 December 2015.
Starting with 2016 (FY2016), the Company follows a January
to December fiscal year. To facilitate like-for-like comparison,
the financial results for the 12-month FY2016 are presented
in the Financial and performance highlights (pages 8 to 11)
and the Group COO’s review (pages 18 to 35) against those
for the same corresponding 12-month period in 2015, as well
as 2012 to 2014, unless otherwise indicated.
The audited statutory accounts on pages 1 to 86 of the
Financial Report present the Financial Statements and Notes
for the 12-month FY2016 against the preceding the 18-month
FY2015. The financial statements presented in this section
are therefore not comparable between the two periods.
Changes in accounting standards, policies and restatements
The Group has adopted all the new and revised standards
which are effective for annual financial periods beginning on
or after 1 January 2016. These include Amendments to FRS
16 and FRS 41 Agriculture: Bearer Plants and early adoption
of FRS 109 Financial Instruments. As a result of these
amendments, the Consolidated Balance Sheet of the Group
as at 1 July 2014 and 31 December 2015 as well as the
Consolidated Profit and Loss Account and Consolidated
Cash Flow Statement for the 18 months ended
31 December 2015 have been restated. These amendments
and other changes in accounting standards and their impact
are detailed in the Notes to Financial Statements.
Business segmentation and reportingFor financial reporting purposes, we organise our 18
business platforms into five segments – Edible Nuts, Spices
and Vegetable Ingredients; Confectionery and Beverage
Ingredients; Food Staples and Packaged Foods; Industrial
Raw Materials, Ag Logistics and Infrastructure (renamed
from Industrial Raw Materials to reflect the principal activities
of the Gabon Special Economic Zone within the segment);
and Commodity Financial Services. The table below shows
the distribution of platforms across these five segments.
5 business segments 18 platforms
Spices and Vegetable Ingredients
1. Edible Nuts (cashew, peanuts,
almonds, hazelnuts,
pistachios, walnuts, sesame
and beans including pulses,
lentils and peas)
2. Spices and Vegetable
Ingredients (including pepper,
onion, garlic, capsicums
and tomato)
Beverage Ingredients3. Cocoa
4. Coffee
Food Staples and Packaged Foods
5. Rice
6. Sugar and Sweeteners
7. Grains and Animal Feed
8. Edible Oils
9. Dairy
10. Packaged Foods
Industrial Raw Materials,
11. Cotton
12. Wood Products
13. Rubber
14. Fertiliser
15. Gabon Special Economic
Zone (GSEZ including ports
and infrastructure)
Commodity Financial Services (CFS)
16. Risk Management Solutions
17. Market-making,
Volatility Trading and
Asset Management
18. Trade and Structured Finance
86 Olam International Limited Annual Report 2016
In addition, we report our financial performance on the
various value chain initiatives across three value chain
segments as follows:
3 value chain segments Value chain activityUpstream Includes all activities relating to
farming (annual row crops),
plantations (perennial tree crops),
Dairy farming and
forest concessions
Supply chain Includes all activities connected
with origination, sourcing, primary
processing, logistics, trading,
marketing (including value-added
services) and risk management of
agricultural products and the
CFS segment
Midstream and downstream
Includes all activities relating to
secondary processing, contract
manufacturing, branded
distribution, private label activities
and Ag Logistics and Infrastructure
Note: The 2012 – 2016 results for the CFS segment do not include those of Trade and Structured Finance.
Definitions of key financial metrics The definitions for the key financial metrics are as follows:
Sales Volume: Sale of goods in metric tonne equivalent.
There are no associated volumes for CFS and
GSEZ platforms
Revenue: Sale of goods and services
Other Income: Includes sale of scrap materials,
commissions and claims income and fair value gain on
investments held for trading. Negative goodwill, gain on sale
of assets and other non-recurring items which are part of
Other Income in the financial statements are treated as
Exceptional Items.
Cost of goods sold, shipping and logistics,
commissions and claims expenses and the net measurement
of derivative assets
Overhead Expenses: Employee benefit costs,
manufacturing overheads, travel expenses and other
direct expenses
Other Operating Expenses: Unrealised foreign exchange
gain/loss and other expenses
Records
changes in the fair value of agricultural produce growing on
bearer plants and livestock
Exceptional Items: One-off, non-recurring items, including
negative goodwill and related transaction costs, gain/loss
on sale of assets/business, gain/loss on buyback of bonds,
impairment loss, finance charges on pre-payment of loans
and non-recurring business restructuring expenses.
Tax expenses associated with these items are also
presented as Exceptional Items.
PAT: Net profit after tax
PATMI: PAT less minority interest
Operational PATMI: PATMI excluding Exceptional Items
EBITDA: Earnings Before Interest, Tax, Depreciation and
Amortisation which includes results of jointly controlled
entitles and associates, minority interest, and excludes
Exceptional Items
Invested Capital (IC): Excludes cash and bank balances,
deferred tax assets, fixed deposits, other current/non-current
assets (other than option premiums payable/receivable) and
fair value of derivative assets on bonds
EBITDA on average invested capital based
on beginning and end-of-period invested capital
Ratio of Net Debt (gross debt less cash)
to Equity (before fair value adjustment reserves)
Net gearing adjusted for readily
marketable inventories that are liquid, hedged and/or sold
forward, operating as near-cash assets on the balance
sheet, and secured receivables are supported by letters
of credit or documents through banks
Free Cash Flow to Firm (FCFF): Operating cash flow less
changes in working capital, cash taxes, capital expenditures
and investments
Free Cash Flow to Equity (FCFE): FCFF less net
interest paid
olamgroup.com 87
Disclaimer Certain sections of our Annual Report 2016 have been
audited. The sections that have been audited are set out
on pages 1 to 86 of the Financial Report. Readers should
note that legislation in Singapore governing the preparation
and dissemination of financial statements may differ from
legislation in other jurisdictions.
Except where you are a shareholder, this material is provided
for information only and is not, in particular, intended to
confer any legal rights on you. This Annual Report does not
constitute an invitation to invest in the Company’s shares. Any
decision you make relying on this information is solely your
responsibility. The information given is as of the dates
specified, is not updated and any forward-looking statement
is made subject to the reservation specified in the
following paragraph.
Cautionary statement This Annual Report may contain forward-looking statements.
Words such as ‘expect’, ‘anticipate’, ‘intend’ or the negative
use of these terms and other similar expressions of future
performance or results and their negatives are intended to
identify such forward-looking statements. These forward-
looking statements are based upon current expectations and
assumptions regarding anticipated developments and other
factors affecting the Group. They are not historical facts, nor
are they guarantees of future performance.
Because these forward-looking statements involve risks and
uncertainties, there are important factors that could cause
actual reports to differ materially from those expressed or
implied by these forward-looking statements, including
among others, competitive pricing and activity, demand
levels for the products that we supply, cost variances, the
ability to maintain and manage key supplier and customer
relationships, supply chain sources, currency values, interest
rates, the ability to integrate acquisitions and complete
planned divestitures, physical risks, environmental risks,
the ability to manage regulatory, tax and legal matters and
resolve pending matters within current estimates, legislative,
fiscal and regulatory developments, political, economic and
social conditions in the geographic markets where the Group
operates and new or changed priorities of the Company’s or
its subsidiaries’ Boards. Further details of potential risks and
uncertainties affecting the Group are updated in the Group’s
Offering Circular on its US$5.0 billion Euro Medium Term
Note Programme dated 23 November 2016.
These forward-looking statements speak only as of the date
of this Annual Report. Except as required by any applicable
law or regulation, the Group expressly disclaims any
obligation or undertaking to release publicly any updates or
revision to any forward-looking statements contained herein
to reflect any change in the Group’s expectations with regard
thereto or any change in events, conditions or circumstances
on which any such statement is based.
General information
88 Olam International Limited Annual Report 2016

STAY UP TO DATEolamgroup.com
@olam
Olam International Limited9 Temasek Boulevard#11-02 Suntec Tower TwoSingapore 038989Telephone (65) 6339 4100Facsimile (65) 6339 9755
olamgroup.com